/


Text
KIRK-OTHMER
ENCYCLOPEDIA OF
CHEMICAL
TECHNOLOGY
EbtTtW-6? WITCHER
VOLUME 1
FOURTH EDITION
A io
Alkaloids
CONTENT INDEX (vol 1)
(with hyperlinks)
Edited by http://www. watcherworld.narod.ru/
ABOUT KIRK-OTHMER ECT
APPENDIX
ABLATIVE MATERIALS 1
ABRASIVES 9
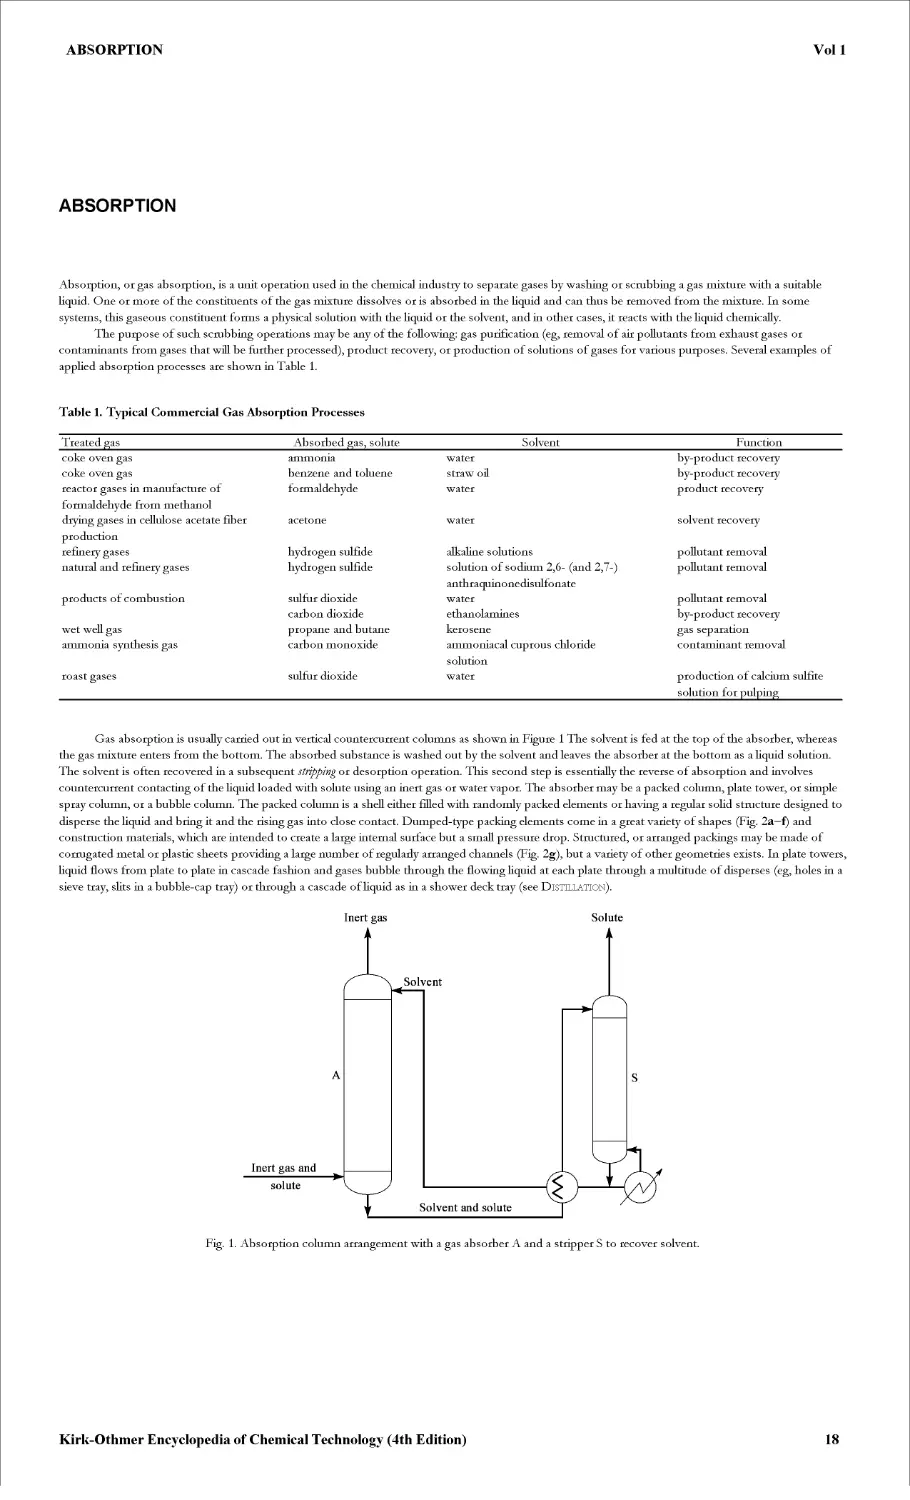
ABSORPTION 18
ACETALDEHYDE 48
ACETAL RESINS 56
ACETIC ACID AND DERIVATIVES 63
- ACETIC ACID 64
- ACETAMIDE 73
- ACETIC ANHYDRIDE 75
- ACETYL CHLORIDE 81
- DIMETHYLACETAMIDE 84
- HALOGENATED DERIVATIVES 87
ACETONE 92
ACETYLENE-DERIVED CHEMICALS 101
ACROLEIN AND DERIVATIVES 122
ACRYLAMIDE 132
ACRYLAMIDE POLYMERS 139
ACRYLIC ACID AND DERIVATIVES 148
ACRYLIC ESTER POLYMERS 161
- SURVEY 162
- 2-CYANOACRYLIC ESTER POLYMERS 176
ACRYLONITRILE 180
ACRYLONITRILE POLYMERS 190
- SURVEY AND SAN 191
- ABS RESINS 202
ACTINIDES AND TRANSACTINIDES 212
ADHESIVES 229
ADIPIC ACID 238
ADSORPTION 251
ADSORPTION, GAS SEPARATION 269
ADSORPTION, LIQUID SEPARATION 291
ADVANCED CERAMICS 307
- ELECTRONIC CERAMICS 308
- STRUCTURAL CERAMICS 317
AERATION 330
- BIOTECHNOLOGY 331
- WATER TREATMENT 339
AEROSOLS 344
AIR CONDITIONING 352
AIR POLLUTION 366
AIR POLLUTION CONTROL METHODS 384
ALCOHOL FUELS 420
ALCOHOLS, HIGHER ALIPHATIC 439
- SURVEY AND NATURAL ALCOHOLS MANUFACTURE 440
- SYNTHETIC PROCESSES 453
ALCOHOLS, POLYHYDRIC 463
ALDEHYDES 469
ALKALI AND CHLORINE PRODUCTS 476
- CHLORINE AND SODIUM HYDROXIDE 477
- SODIUM CARBONATE 522
ALKALOIDS 529
About Kirk-Othmer ECT
Overview of Kirk-Othmer Encyclopedia of Chemical Technology
Introduction
An unrivalled library of information for the chemical industry. The Fourth Edition is a complete revision of the previous edition and includes many new
subjects reflecting the growth and changes in chemical technology through the 1990s. It consists of 27 volumes. In addition to updating traditional
subjects, the new edition includes expanded coverage of biotechnology, materials science, computer technology, energy sources and conversion techniques,
and environmental issues such as pollution control, toxicology, and recycling technology. The Fourth Edition brings together over 1200 articles by
recognized experts in their areas of chemical technology, and deals with industrial products, natural materials, and processes in such fields as: agricultural
chemicals, biotechnology, chemical engineering, coatings and inks, composite materials, computers in chemical technology, cosmetics and pharmaceuticals,
dyes, pigments and brighteners, ecology and industrial hygiene, energy conservation and technology, fats and waxes, fermentation and enzyme technology,
fibres, textiles and leather, food and animal nutrition, fossil fuels and derivatives, glass, ceramics and cement, industrial inorganic chemicals, industrial
organic chemicals, metals, metallurgy and metal alloys, plastics and elastomers, semiconductors and electronic materials, surfactants, detergents and
emulsion technology, water supply, purification and reuse, wood, paper, and industrial carbohydrates. It also includes miscellaneous topics: instrumentation
and quality control, information retrieval, maintenance, market research, material allocation and supply, legal issues, process development and design,
product development and technical service, research and operations management (systems management, networks etc.), and transportation of chemical
products.
More Information about Kirk-Othmer Encyclopedia of Chemical Technology
Ordering the Printed Version of Kirk-Othmer Encyclopedia of Chemical Technology
For reprint requests for material contact:
Jacqueline Kroschwitz
Telephone:
Fax:
Email:
+ 1 (212) 850 6187
+ 1 (212) 850 6088
jkroschw@wiley.com
Statistics for Kirk-Othmer Encyclopedia of Chemical Technology
The Kirk-Othmer Encyclopedia of Chemical Technology contains over 1200 separate in-depth articles, over 16000 images, photos and illustrations,
approximately 6000 tables and more than 8,300 chemical and mathematical equations.
Copyrights and Trademarks
Kirk-Othmer Encyclopedia of Chemical Technology Fourth Edition copyright 1991-1998 John Wiley & Sons Inc. All rights reserved. Access to, use, and
reproduction of any data or material contained herein are permitted only pursuant to express license during the term of such license. No permission is
granted to store any information contained herein or to retransmit any information, data, or materials contained herein. No part of this product may be
reproduced or transmitted, in any form or by any means, electronic, mechanical, photocopying, recording, or otherwise, without the written permission of
the copyright owner. Great care was taken in the compilation and production of this product, but it should be made clear that NO WARRANTIES,
EXPRESS OR IMPLIED, INCLUDING, WITHOUT LIMITATION, WARRANTIES OF MERCHANTABILITY OR FITNESS FOR A
PARTICULAR PURPOSE, ARE GIVEN IN CONNECTION WITH THIS PUBLICATION. No claim of any kind, whether as to products or
information in this publication, and whether or not based on negligence, shall be greater in amount than the purchase price of this product or publication
in respect of which damages are claimed. THE REMEDY HEREBY PROVIDED SHALL BE THE EXCLUSIVE AND SOLE REMEDY OF
BUYER, AND IN NO EVENT SHALL EITHER PARTY BE LIABLE FOR SPECIAL, INDIRECT OR CONSEQUENTIAL DAMAGES
WHETHER OR NOT CAUSED BY OR RESULTING FROM THE NEGLIGENCE OF SUCH PARTY. Nothing contained in this publication shah
be construed as a grant of any right of manufacture, sale, use, or reproduction, in connection with any method, process, apparatus, product, composition,
or system, whether or not covered by letters patent, copyright, or trademark, and nothing contained in this book shall be construed as a defense against
any alleged infringement of letters patent, copyright, or trademark, or as a defense against liability for such infringement.
APPENDIX
NOTE ON CHEMICAL ABSTRACTS SERVICE REGISTRY NUMBERS AND NOMENCLATURE
Chemical Abstracts Service (CAS) Registry Numbers are unique numerical identifiers assigned to substances recorded in the CAS Registry System. They
appear in brackets in the Chemical Abstracts (CA) substance and formula indexes following the names of compounds. A single compound may have
synonyms in the chemical literature. A simple compound like phenethylamine can be named 3-phenylethylamine or, as in Chemical Abstracts,
benzeneethanamine. The usefulness of the Encyclopedia depends on accessibility through the most common correct name of a substance. Because of this
diversity in nomenclature careful attention has been given to the problem in order to assist the reader as much as possible, especially in locating the
systematic CA index name by means of the Registry Number. For this purpose, the reader may refer to the CAS Registry Handbook—Number Section
which lists in numerical order the Registry Number with the Chemical Abstracts index name and the molecular formula; eg, 458-88-8, Piperidine, 2-propyl-,
(S)-, CgH17N; in the Encyclopedia this compound would be found under its common name, coniine [458-88-8]. Alternatively, this information can be
retrieved electronically from CAS Online. In many cases molecular formulas have also been provided in the Encyclopedia text to facilitate electronic
searching. The Registry Number is a valuable link for the reader in retrieving additional published information on substances and also as a point of access
for on-line data bases.
In all cases, the CAS Registry Numbers have been given for tide compounds in articles and for all compounds in the index. All specific substances indexed
in Chemical Abstracts since 1965 are included in the CAS Registry System as are a large number of substances derived from a variety of reference works.
The CAS Registry System identifies a substance on the basis of an unambiguous computer-language description of its molecular structure including
stereochemical detail. The Registry Number is a machine-checkable number (like a Social Security number) assigned in sequential order to each substance as
it enters the registry system. The value of the number lies in the fact that it is a concise and unique means of substance identification, which is independent
of, and therefore bridges, many systems of chemical nomenclature. For polymers, one Registry Number may be used for the entire family; eg,
polyoxyethylene (20) sorbitan monolaurate has the same number as all of its polyoxyethylene homologues.
Cross-references are inserted in the index for many common names and for some systematic names. Trademark names appear in the index. Names that are
incorrect, misleading, or ambiguous are avoided. Formulas are given very frequendy in the text to help in identifying compounds. The spelling and form
used, even for industrial names, follow American chemical usage, but not always the usage of Chemical Abstracts (eg, coniine is used instead of
(S)-2-propylpiperidine, aniline instead of benzenamine, and acrylic acid instead of 2-propenoic acid).
There are variations in representation of rings in different disciplines. The dye industry does not designate aromaticity or double bonds in rings. All double
bonds and aromaticity are shown in the Encyclopedia as a matter of course. For example, tetralin has an aromatic ring and a saturated ring and its structure
appears in the Encyclopedia with its common name, Registry Number enclosed in brackets, and parenthetical CA index name, ie, tetralin [119-64-2]
(1,2,3,4-tetrahydronaphthalene). With names and structural formulas, and especially with CAS Registry Numbers, the aim is to help the reader have a
concise means of substance identification.
DERIVED UNITS AND OTHER ACCEPTABLE UNITS
These units are formed by combining base units, supplementary units, and other derived units (2—4). Those derived units having special names and
symbols are marked with an asterisk in the list below.
Quantity Unit Symbol Acceptable equivalent
*absorbed dose gray Gy J/kg
acceleration meter per second m/s2
*activity (of a squared becquerel Bq 1/s
radionuclide) area square kilometer km2
square hectometer hm2 ha (hectare)
concentration (of amount square meter mole per cubic meter 2 m mol / m3
of substance) current density ampere per square A//m2
density, mass density meter kilogram per cubic kg/m3 g/L;mg/cm3
dipole moment (quantity) meter coulomb meter Cm
*dose equivalent sievert Sv j/kg
*electric capacitance farad F c/v
*electric charge, quantity coulomb C А-s
of electricity electric charge density coulomb per cubic C/m3
*electric conductance meter siemens S A/V
electric field strength volt per meter V/m
electric flux density coulomb per square C/m2
*electric potential, meter volt V W/A
potential difference, electromotive force *electric resistance ohm Q V/A
*energy, work, quantity megajoule MJ
of heat kilojoule kJ
joule J N-m
energy density electronvolt^ kilowatt-hour^ joule per cubic meter eV kW-M j/m3
*force kilonewton kN
newton N kgm/ s2
* frequency megahertz MHz
hertz Hz l/s
heat capacity, entropy joule per kelvin J/K
heat capacity (specific), specific entropy joule per kilogram kelvin J/fe'K)
heat-transfer coefficient watt per square meter kelvin W/(m2-K)
*illuminance lux lx Im/m2
*inductance henry H Wb/A
linear density kilogram per meter kg/m
luminance candela per square meter cd/m2
*luminous flux lumen Im cd-sr
magnetic field strength ampere per meter A/m
*magnetic flux weber Wb V-s
*magnetic flux density tesla T Wb/m2
molar energy joule per mole j/mol
molar entropy, molar heat capacity joule per mole kelvin j/(mol'K)
moment of force, torque newton meter N-m
momentum kilogram meter per second kgm/ s
permeability henry per meter H/m
permittivity farad per meter F/m
*power, heat flow rate, kilowatt kW
radiant flux watt w j/s
power density, heat flux density, irradiance watt per square meter W/m2
*pressure, stress megapascal kilopascal MPa kPa
pascal Pa N/m2
sound level decibel dB
specific energy joule per kilogram J/kg
specific volume cubic meter per kilogram m3/kg
surface tension newton per meter N/m
thermal conductivity watt per meter kelvin W/(md<)
velocity meter per second kilometer per hour m/ s km/h
viscosity, dynamic pascal second millipascal second Pas mPa-s
viscosity, kinematic square meter per second square millimeter per second m2/s mm2/ s
volume cubic meter 3 m
cubic diameter dm3 L (liter) (5)
cubic centimeter cm3 mF
wave number 1 per meter 1 per centimeter m1 cm-1
tThis non-SI unit is recognized by the CIPM as having to be retained because of practical importance or use in specialized fields (1).
In addition, there are 16 prefixes used to indicate order of magnitude, as follows:
Multiplication Prefix Symbol Note
factor
l018 exa E
1015 peta P
1012 tera T
109 giga G
106 mega M
103 kilo к
102 hecto ha aAlthough hecto, deka, deci, and centi
10 deka daa are SI prefixes, their use should be
10-1 deci da avoided except for SI unit-multiples
10-2 centi ca for area and volume and nontech-
10-3 milli m nical use of centimeter, as for body
10-6 micro and clothing measurement.
10-9 nano n
10-12 pico p
10-15 femto f
10-18 atto a
For a complete description of SI and its use the reader is referred to ASTM E380 (4) and the article UNITS AND CONVERSION FACTORS which
appears in Vol.24.
A representative list of conversion factors from non-SI to SI units is presented herewith. Factors are given to four significant figures. Exact relationships
are followed by a dagger. A more complete list is given in the latest editions of ASTM E380 (4) and ANSI Z210.1 (6).
ABBREVIATIONS AND UNITS
A A ampere anion (eg, HA) AOAC Association of Official Analytical Chemists
A mass number AOCS American Oil Chemists'
a atto (prefix for 10-18) Society
AATCC American Association of Textile Chemists and APHA American Public Health Association
Colorists API American Petroleum
ABS acrylonitrile—butadiene— Institute
styrene aq aqueous
abs absolute Ar aryl
ac alternating current, n. ar- aromatic
a-c alternating current, adj. as- asymmetric (al)
ac- alicyclic ASHRAE American Society of
acac acetylacetonate Heating, Refrigerating,
ACGIH American Conference of Governmental Industrial and Air Conditioning Engineers
Hygienists ASM American Society for
ACS American Chemical Metals
Society ASME American Society of
AGA American Gas Association Mechanical Engineers
Ah ampere hour ASTM American Society for
AIChE American Institute of Testing and Materials
Chemical Engineers at no. atomic number
AIME American Institute of at wt atomic weight
Mining, Metallurgical, av(g) average
and Petroleum AWS American Welding Society
Engineers b bonding orbital
AIP American Institute of bbl barrel
Physics bcc body-centered cubic
AISI American Iron and Steel BCT body-centered tetragonal
Institute Bet Baumer
ale alcohol(ic) BET Brunauer- Emmett-Teller
Aik alkyl (adsorption equation)
alk alkaline (not alkali) bid twice daily
amt amount Boc t-butyloxycarbonyl
amu atomic mass unit BOD biochemical (biological)
ANSI American National oxygen demand
Standards Institute bp boiling point
AO atomic orbital Bq becquerel
C coulomb DIN Deutsche Industrie
°C degree Celsius Normen
C- denoting attachment to dl-; DL- racemic
carbon DMA dimethylacetamide
c centi (prefix for 10-2) DMF dimethylformamide
c critical DMG dimethyl glyoxime
ca circa (approximately) DMSO dimethyl sulfoxide
cd candela; current density; DOD Department of Defense
circular dichroism DOE Department of Energy
CFR Code of Federal DOT Department of
Regulations Transportation
cgs centimeter-gram-second DP degree of polymerization
CI Color Index dp dew point
cis- isomer in which DPH diamond pyramid
substituted groups are hardness
on same side of double dsd(d) dis till (ed)
bond between C atoms dta differential thermal
cl carload analysis
cm centimeter (E)- entgegen; opposed
cmil circular mil e dielectric constant
empd compound (unidess number)
CNS central nervous system e electron
CoA coenzyme A ECU electrochemical unit
COD chemical oxygen demand ed. edited, edition, editor
coml commercially) ED effective dose
cp chemically pure EDTA ethylenediaminetetra-
cph close-packed hexagonal acetic acid
CPSC Consumer Product Safety emf electromotive force
Commission emu electromagnetic unit
cryst crystalline en ethylene diamine
cub cubic eng engineering
D debye EPA Environmental Protection
D- denoting configurational Agency
relationship epr electron paramagnetic
d differential operator resonance
d day; deci (prefix for 10-1) eq. equation
d density esca electron spectroscopy for
d- dextro-, dextrorotatory chemical analysis
da deka (prefix for 101) esp especially
dB decibel esr electron-spin resonance
de direct current, n. est(d) estimate(d)
d-c direct current, adj. estn estimation
dec decompose esu electrostatic unit
detd determined exp experiment, experimental
detn determination ext(d) extracted)
Di didymium, a mixture of all F farad (capacitance)
lanthanons F faraday (96,487 C)
dia diameter f femto (prefix for 10-15)
dil dilute
FAO Food and Agriculture hyd hydrated, hydrous
fee Organization (United Nations) face-centered cubic hyg Hz 1 (e& Pi") hygroscopic hertz iso (eg, isopropyl)
FDA Food and Dmg i- inactive (eg, i-methionine)
FEA FHSA Administration Federal Energy Administration Federal Hazardous IACS ibp IC International Annealed Copper Standard initial boiling point integrated circuit
fob fp Substances Act free on board freezing point ICC ICT Interstate Commerce Commission International Critical
FPC FRB frz Federal Power Commission Federal Reserve Board freezing ID Ф Table inside diameter; infective dose intraperitoneal
G giga (prefix for 109) IPS iron pipe size
G gravitational constant = ii infrared
g (g) 6.67 x 10¹¹ N-m2/kg2 gram gas, only as in H2O(g) IRLG ISO Interagency Regulatory Liaison Group International Organization
g gc gravitational acceleration gas chromatography ITS-90 Standardization International Temperature
gem- glc geminal gas—liquid IU Scale (NIST) International Unit
g-mol wt; gmw GNP chromatography gram-molecular weight gross national product IUPAC IV International Union of Pure and Applied Chemistry iodine value
gPc gel-permeation iv intravenous
GRAS chromatography Generally Recognized as J К joule kelvin
grd Safe ground к Pg kilo (prefix for 103) kilogram
Gy gray L denoting configurational
H h henry hour; hecto (prefix for 102) L relationship liter (for fluids only) (5)
ha hectare 1- levo-, levorotatory
HB Brinell hardness number liquid, only as in NH3(1)
Hb hemoglobin LC50 cone lethal to 50% of the
hep hex hexagonal close-packed hexagonal LCAO animals tested linear combination of
HK hplc Knoop hardness number high performance liquid 1c atomic orbitals liquid chromatography
HRC chromatography Rockwell hardness LCD lei liquid crystal display less than carload lots
HV (C scale) Vickers hardness number LD5q dose lethal to 50% of the animals tested
LED light-emitting diode
liq liquid
Im lumen
In logarithm (natural)
LNG liquefied natural gas
log logarithm (common)
LOI limiting oxygen index
LPG liquefied petroleum gas
Id less than truckload lots
lx lux
N-
n (as Up)
n (as Bu11),
ii-
ii
n
na
denoting attachment to
nitrogen
index of refraction (for
20°C and sodium light)
normal (straight-chain
structure)
neutron
nano (prefix for 109)
not available
M M mega (prefix for 106); metal (as in MA) molar; actual mass NAS NASA National Academy of Sciences National Aeronautics and
weight-average mol wt Space Administration
Mn number-average mol wt nat natural
m meter; milli (prefix for 10-3) ndt neg nondestructive testing negative
m molal NF National Formulary
m- max meta maximum NIH National Institutes of Health
MCA MEK meq mfd mfg Chemical Manufacturers' Association (was Manufacturing Chemists Association) methyl ethyl ketone millie quivalent manufactured manufacturing NIOSH NIST National Institute of Occupational Safety and Health National Institute of Standards and Technology (formerly National Bureau of Standards)
mfr MIBC manufacturer methyl isobutyl carbinol nun nuclear magnetic resonance
MIBK MIC methyl isobutyl ketone minimum inhibiting concentration NND no. New and Nonofficial Drugs (AMA) number
min ml minute; minimum milliliter NOI-(BN) not otherwise indexed (by name)
MLD minimum lethal dose NOS not otherwise specified
MO mo molecular orbital month nqr nuclear quadruple resonance
mol mol wt mp mole molecular weight melting point NRC Nuclear Regulatory Commission; National Research Council
MR molar refraction NRI New Ring Index
ms MSDS mass spectrometry material safety data sheet NSF National Science Foundation
mxt mixture NTA nitrilotriacetic acid
N N micro (prefix for 10-6) newton (force) normal (concentration); NTP normal temperature and pressure (25°C and 101.3 kPa or 1 atm)
neutron number
NTSB National Transportation Safety Board qv R quod vide (which see) univalent hydrocarbon
O- denoting attachment to radical
oxygen (R)- rectus (clockwise
o- ortho configuration)
OD outside diameter r precision of data
OPEC Organization of Petroleum rad radian; radius
Exporting Countries RCRA Resource Conservation
o-plien o-phenanthridine and Recovery Act
OSHA Occupational Safety and rds rate-determining step
Health Administration ref. reference
owf on weight of fiber rf radio frequency, n.
Q ohm r-f radio frequency, adj.
P peta (prefix for 1015) rh relative humidity
P pico (prefix for 10-12) RI Ring Index
P- para rms root-mean square
P proton rpm rotations per minute
P- page rps revolutions per second
Pa pascal (pressure) RT room temperature
PEL personal exposure limit RTECS Registry of Toxic Effects of
based on an 8-h Chemical Substances
exposure = (eg, Bu=);
pd potential difference sec- secondary (eg, secondary
pH negative logarithm of the butyl)
effective hydrogen ion S siemens
concentration (S)- sinister (counterclockwise
phr parts per hundred of resin configuration)
(rubber) S- denoting attachment to
p-i-n p о sitive-intrinsic-negative sulfur
pmr proton magnetic resonance s- symmetric (al)
p-n p о sitive-negative s second
po per os (oral) (s) solid, only as in H2O(s)
POP polyoxypropylene SAE Society of Automotive
pos positive Engineers
pp. pages SAN styrene-acrylonitrile
ppb parts per billion (109) sat(d) saturate (d)
ppm parts per million (106) satn saturation
ppmv parts per million by SBS styrene—butadiene—
volume styrene
ppmwt parts per million by weight sc subcutaneous
PPO poly(phenyl oxide) SCF self-consistent field;
ppt(d) precipitate(d) standard cubic feet
pptn precipitation Sch Schultz number
Pt (no.) foreign prototype (number) sem scanning electron
pt point; part microscope(y)
PVC poly(vinyl chloride) SFs Saybolt Furol seconds
pwd powder si sol slightly soluble
РУ pyridine sol soluble
soln solution trans- isomer in which
soly solubility substituted groups are
sp specific; species on opposite sides of
sp gr specific gravity double bond between C
sr steradian atoms
std standard TSCA Toxic Substances Control
STP standard temperature and Act
pressure (0°C and 101.3 TWA time-weighted average
kPa) Twad Twaddell
sub sublime (s) UL Underwriters' Laboratory
SUs Saybolt Universal seconds USDA United States Department
syn synthetic of Agriculture
1 (eg, Ви‘), USP United States
t-, tert- tertiary (eg, tertiary Pharmacopeia
butyl) uv ultraviolet
T tera (prefix for 1012); tesla V volt (emf)
(magnetic flux density) var variable
t metric ton (tonne) vic- vicinal
t temperature vol volume (not volatile)
TAPPI Technical Association of vs versus
the Pulp and Paper V sol very soluble
Industry W watt
TCC Tagliabue closed cup Wb weber
tex tex (linear density) Wh watt hour
L glass-transition WHO Wodd Health
temperature Organization (United
tga thermogravimetric Nations)
analysis wk week
THF tetrahydrofuran yr year
de thin layer chromatography (Z)- zusammen; together;
TLV threshold limit value atomic number
BIBLIOGRAPHY
N.B. This appendix contains edited extracts from the preface to the printed volumes of the Encyclopedia
1. The International Bureau of Weights and Measures, BIPM (Parc de Saint-Cloud, France) is described in Appendix X2 of Ref 4. This bureau operates
under the exclusive supervision of the International Committee for Weights and Measures (CIPM).
2. Metric Editorial Guide (ANMC-78-1), latest ed., American National Metric Council, 5410 Grosvenor Lane, Bethesda, Md. 20814, 1981.
3. SI Units and Recommendations for the Use of Their Multiples and of Certain Other Units (ISO 1000-1981), American National Standards Institute,
1430 Broadway, New York, 10018, 1981.
4. Based on ASTM E380-89a (Standard Practice for Use of the International System of Units (SI)), American Society for Testing and Materials, 1916
Race Street, Philadelphia, Pa. 19103, 1989.
5. Fed. Reg., Dec. 10, 1976 (41 FR 36414).
6. For ANSI address, see Ref. 3.
R. P. LUKENS
ASTM Committee E-43 on SI Practice
ABLATIVE MATERIALS
Voll
ABACA FIBER.
See Fibers, vegetable.
ABHERENTS.
See Release agents.
ABIETIC ACID.
See Terpenoids.
ABLATIVE MATERIALS
The word ablation is derived from the suppletive past particle of the Latin auferre, which means to remove. It was originally used in the geologic sense to
describe the combined, predominandy thermal, processes by which a glacier wastes. The present use of the word maintains the thermal aspect and
describes the absorption, dissipation, and blockage of heat associated with high speed entry into the atmosphere. Thus ablative, thermal protection
materials are used to protect vehicles from damage during atmospheric reentry. The need for these materials was first realized during the development of
operational ballistic missiles in Pennemunde, Germany, when a large percentage of V-2s failed to reach their targets because of missile skin disintegration
caused by aerodynamic heating (1). Ablative materials are also used to protect rocket nozzles and ship hulls from propellant gas erosion, as protection from
laser beams, and to protect land-based structures from high heat environments.
The Ablation Environment
The functional requirements of the ablative heatshield must be well understood before selection of the proper material can occur. Ablative heatshield
materials not only protect a vehicle from excessive heating, they also act as an aerodynamic body and sometimes as a structural component (2,3). Intensity
and duration of heating, thermostructural requirements and shape slabilily (4,5), potential for particle erosion (6), weight limitations (7—10), and reusability
(11) are some of the factors which must be considered in selection of an ablative material.
Some typical ablative environments are shown in Figure 1. Each of the altitude—velocity profiles results in a specific heating rate and radiation
equilibrium temperature for a given material. When a vehicle decelerates at high altitudes under low pressure conditions, and the flight angle with respect to
the horizon is low, the heating rate is low but the heating time period is long, eg, the Apollo trajectory. In this situation, material insulating ability becomes
important. Conversely, a sharp atmospheric entry angle results in severe heating rates but for a shorter duration, eg, the ballistic missile trajectory, which
requires less emphasis on the insulating capability of the heatshield material.
S
120
100
80
60
40
20
3000
6000
9000
12,000
0
Velocity, m/s
5 10 15 20 30 40
Stagnation enthalpy, MJ/kg
J_____I
50 60
Fig. 1. Simulation facility capabilities and mission requirements: EH ROVERS arc and A 10-MW arc, Textron Defense Systems (IDS); И Interaction
Heating Facility and El Aero Heating Facility, NASA/Ames. Numbers on the curves indicate stagnation pressure P in MPa; —, ballistic entry;-----, lifting
entry. To convert MPa to psi multiply by 145. To convert MJ to kcal divide by 4.18 X 0 .
Several other factors must also be considered with respect to heating conditions. At the front end of a vehicle, ie, at the nosetip, the heating rate is
most severe, generally decreasing toward the aft end of the vehicle in instances of laminar flow. Because of this variation in heating conditions, the nosetip
Kirk-Othmer Encyclopedia of Chemical Technology (4th Edition)
1
ABLATIVE MATERIALS
Voll
material is usually different from the heatshield or aft end materials. Vehicle design is, of course, influential. Sharp, heavy ballistic vehicles having a high
mass-to-drag ratio drop in altitude at higher velocities than blunt, lightweight Apollo-type vehicles, resulting in much higher heating rates for the former.
Then also, efficient aerodynamic vehicles, such as long range glide vehicles, utilize sharp leading edges on the nose and wings at the expense of high local
heating. Moreover, the rate of heat transfer for a turbulent gas boundary results in higher heating conditions than a laminar gas stream. Thus to reduce or
delay the tendency for turbulent flow, smooth, uniform vehicle contours are preferred and, whenever possible, high density materials are avoided to
minimize the weight-to-drag ratio.
Heatshield thickness and weight requirements are determined using a thermal prediction model based on measured thermophysical properties. The
models typically include transient heat conduction, surface ablation, and charring in a heatshield having multiple sublayers such as bond, insulation, and
substructure. These models can then be employed for any specific heating environment to determine material thickness requirements and to identify the
lightest heatshield materials.
In a very simplified first-order analysis the ablative heatshield is considered to be of two components: the ablated thickness and the remaining
thickness, or the insulation. The ablated weight is determined by the total aerodynamic heat load divided by the heat of ablation, that is, the heat absorbed
per unit weight. The insulation weight is determined by the heat conduction parameter, p^/the product of density and conductivity, divided by the
specific heat, and the ratio of temperature rise at the back surface to that at the front. As shown in Figure 2, the ablated weight increases as the total heat
load increases. However, the insulation weight, which initially increases with increased heating, exhibits a maximum and then decreases. Thus at some level
ablation begins to dominate, temperature gradients become very steep, and the need for insulation decreases. As a result, the total heatshield weight
requirements may not monotonically reflect increases in heat load.
Fig. 2. A simplified material thermal performance analysis for a reentry vehicle thermal protection system where
Wabl = density x surface recession thickness = total aerodynamic heat/heat of ablation;
Wins = density x insulative layer thickness = f(pk/C , Tstructure , Tsurface ); and TVtot = unit weight of heatshield = density x thickness = Wabl + Wins.
The selection of a material having the right balance of ablation and insulation properties is needed to produce optimum heatshield performance.
This material selection is complicated because the higher density materials that usually offer better ablation performance also have higher thermal
conductivities and are therefore poor insulators. Properties of known materials are given in Table 1, whereas the desired trends in properties and
characteristics of thermal protection (TP) materials are summarized in Table 2 (12). In the high flux region most of the aerodynamic heating is absorbed by
ablation. The parameter p^/gives some indication of material performance when the rate at which heat is conducted into the shield is very small
compared to that at which the heat is radiated away from the surface; p^ alone is somewhat less indicative. j2 indicates material (and system) performance
in all regions because it is essentially a weight parameter including the interaction of all other variables. It must be calculated based on a knowledge of all
material properties and mission environment.
Table 1. Heat of Ablation and Relative Thermal Conductivity for Reentry Vehicle Materials Assuming Laminar Flow
Cold wall heat of ablation*, J/gb
Material Hs = 12,000 J/gb Hs = 24,000 J/gb Relative thermal =4800 m/s V„ =6,800 m/s conductivity
carb on—carb on carbon—phenolic silica—phenolic 32,000 39,500 high 24,000 29,600 13,000 19,000 ।
Teflon 6,650 10,350 low
Jf is the stagnation enthalpy at the surface of the leading edge; F/^ is the velocity of the airstream at the leading edge.
To convert J to cal divide by 4.184
Table 2. Summary of Criteria for Material Selection and Performance Evaluation*
Parameter Definition Desired trend Best region of application as a figure of merit
effective heat of 11- Ь -i- ablation , q* sensible heat + heat oi decomposition + mass transfer shielding + sheareffects uu High-flux region.
pk pk density x conductivity specific heat density x conductivity 0 0 Predominant parameter when no ablation occurs.
T 1A ablation temperature No general trend. Depends on interaction with other parameters and design criteria. None except as an indicator of whether or not ablation will occur.
T backface temperature Low or as prescribed. A design and comparative criterion for testing.
Kirk-Othmer Encyclopedia of Chemical Technology (4th Edition)
2
ABLATIVE MATERIALS
Voll
Q-eS
wt or pLt
aRef. 12
emissivity x (radiation
equilibrium temperature)4
total cold wall heat input
total required weight of
TP system for a given
backface temperature
total required weight of TP
system
e —» 1 depends on interaction
with other parameters and
design criteria.
Short duration, or when heat
leakage into system is minimized.
All regions.
All regions.
Also referred to by many other symbols with various heat fluxes as reference.
The thermostructural requirements of the heatshield are important to material selection and both aerodynamic and attachment load requirements
must be met. In the case of a charring ablator, surface char must be of sufficient strength to survive aerodynamic shear. Changes in the ablative material's
mechanical and thermal properties occur as a result of the thermal gradient through the depth of the material. Backface surface temperatures, the
temperatures on the inside surface of the heatshield, dictate attachment methods and materials. An excessive backface surface temperature caused by
inadequate insulation characteristics may weaken an adhesive bond to a substructure or even weaken a load-carrying substructure. In the event that the
heatshield also serves as the load-carrying structure, sufficient thickness must be provided for both ablation and insulation so that enough material remains
cold (uncharred). A mismatch in axial vs radial thermal expansion can result in severe thermal stresses and subsequent failure, as has been noted with the
use of thick sections of pyrolitic graphite [7782-42-5] (13,14). In reentry, erosion from rain or ice particles is also a consideration, particularly at the tip. In
addition, in rocket nozzles and on surfaces exposed to propellant gases, erosion resistance from solid particulates must also be considered.
The practice of employing reusable thermal protection systems for reentry is becoming more common. These are essentially ablative materials
exposed to environments where verylitde ablation actually occurs. Examples include the space shutde tiles and leading edges, exhaust nozzle flaps for
advanced engines, and the proposed structural surface skin for the National Aerospace plane.
Another environmental issue important to low earth orbit materials is atomic erosion. At an altitude of 300 km, absorption of solar radiation
produces atmospheric temperatures of 1150°C, and at these temperatures gas molecules decompose. Erosion of surface materials by oxygen atoms or
nitrogen—oxygen radicals is a serious issue for low altitude orbiting satellites. Experiments conducted on early shutde flights determined that organic
materials that would normally be found on a heatshield erode more rapidly than metallic ones (15). Thus, the effects of atomic erosion must be considered
for any vehicle that is subject to long term exposure at low earth altitudes.
A variety of test methods and facilities have been developed to address the process of ablation. These utilize lasers, chemical Eames, plasma arcs,
electric arc heaters, and other heat sources and sometimes include high velocity wind tunnel facilities that introduce particles to simulate high speed erosion.
Examples of ablation facilities used to simulate a variety of reentry conditions are shown in Figure 1. The IDS 10-MW arc facility simulates high speed,
high pressure (up to 2.5 MPa) ablation conditions for ballistic reentry. It is mainly used for examining the ablative performance of high velocity nosetip and
heatshield materials. The IDS ROVERS (radiation orbital vehicle reentry simulator) arc is a combined convection—radiative heating arc used to simulate
high altitude, low pressure reentry conditions. The Interaction Heating Facility and Aero Heating Facility at NASA/Ames are used to simulate a wide range
of pressures and enthalpies and have the capacity for much larger specimen sizes than the Textron facilities. A summary of simulation capabilities is given
in Table 3 and Figure 3. A listing of nationwide arc facilities and corresponding test capabilities is also available (16).
(a)
(b)
(c)
Fig. 3. Simulation parameters (a) splash onto cylindrical nosetip; (b) attached wedge (—> fixed;-----------, varied); and (c) detached wedge. See Table 3.
Table 3. Summary of Arc Simulation Capabilities
Parameter TDS 10-MW arc" TDS ROVERS arc" NASA/Ames Facilities^
simulation parameter splash detached attached splash detached Aero Interaction
wedge wedge wedge Heating Heating
cylindrical diameter, cm to 7.6 to 7.6 20.3 45.7
wedge cutout, cm 5.1 x 17.8 2.5 x 7.6 7.6 x 7.6 66 x 60 61 x 61
enthalpy, MJ /kgC 0.7-21.2 0.7-21.2 0.7-21.2 0.7-40.2 0.7-40.2 1-31.2 7-44.6
convective heat flux, 1.1-45.4 0.1-7.9 0.6-45.4 0.02-7.9 0.02-7.9 0.006-3.4 0.006-1.5
MW/m2
test time, max, s 20 25 25 continuous continuous
gas air air air air, N2, others air, N2, others air air
jet mach no. 1-2 0.5-2.0 1-2.5 2-3.5 2-3.5 2.5-12 5.5-7.5
model surface shear, kg/m2 4.9-97.6 24.4-488.0 0.2-2.4
particle erosion yes yes yes
programmed heating: yes yes yes yes yes
enthalpy variation
heat flux variation yes yes yes yes yes
model pressure, MPa 0.1-2.43 0.10-0.51 0.10-0.30 to 0.01 to 0.01 0.0005-0.2 10~5 -0.0015
jet diameter, cm to 5.1 3.2-5.7 2.5-6.4 to 7.6 to 7.6 7.6-106.7 to 104.1
See Figure 3 for illustration of simulation parameters.
These facilities can test larger specimens over a wide range of enthalpies and pressures.
C To convert MJ to kcal divide by 4.184 x IO-3 .
To convert MPa to psi multiply by 145.
Kirk-Othmer Encyclopedia of Chemical Technology (4th Edition)
3
ABLATIVE MATERIALS
Voll
The Ablation Process
Thermophysically, the ablation process can be described as the elimination of a large amount of thermal energy by sacrifice of surface material. Principles
operating during this highly efficient and orderly heat and mass transfer process are (7) phase changes such as melting, vaporization, and sublimation, (2)
conduction and storage of heat in the material substrate, (J) absorption of heat by gases as they are forced to the surface, (4) heat convection in a Equid
layer, (5) transpiration of gases and liquids and subsequent heat absorption from the surface into the boundary layer, (6) exothermic and endothermic
chemical reactions, and (7) radiation on the surface and in bulk (17).
The relationship between heat transfer and the boundary layer species distribution should be emphasized. As vaporization occurs, chemical species
are transported to the boundary layer and act to cool by transpiration. These gaseous products may undergo additional thermochemical reactions with the
boundary-layer gas, further impacting heat transfer. Thus species concentrations are needed for accurate calculation of transport properties, as well as for
calculations of convective heating and radiative transport.
Ablative Materials
Ablative materials are classified according to dominant ablation mechanism. There are three groups: subliming or melting ablators, charring ablators, and
intumescent ablators. Figure 4 shows the physical zones of each. Because of the basic thermal and physical differences, the classes of ablative materials are
used in different types of applications.
Charred region
Intumescent region
Charred region
Subliming or melting
region
Decomposition region
Decomposition region
Virgin material
Virgin material
Virgin material
(a) Subliming or melting
ablator
(b) Charring ablator (c) Intumescent ablator
Fig. 4. Physical zones of ablators. Typical time-integrated heat flux, J/m2, (a) 500, (b) 5000, (c) <50; maximum instantaneous heat flux, MW/m2, (a) 0.5,
(b) >1, (c) 0.1. To convert J to cal divide by 4.184.
Subliming and Melting Ablators. Subliming ablators act as heat sinks to the incident heat flux until the temperature on the surface reaches
the sublimation or melting temperature, also known as the reaction temperature in these cases. At this time the sublimation or melting action removes heat
from the insulation material. In the sublimation process the convective transfer of heat from the boundary layer to the material surface is also blocked by
the gas evolving from the ablative material, concurrendy thickening the boundary layer. This blocking action can reduce the net heating of the ablative
material by more than 50%.
Some of the early reentry vehicles utilized metallic heat sinks of copper [7440-50-8] or beryllium [7440-41-7] to absorb reentry heat. Other metallic
materials that have been evaluated for nosetip applications include tungsten [7440-33-7] and molybdenum [7439-98-7]. The melt layers of these materials
are believed to be very thin because of the high rate at which volatile oxide species are formed.
One of the first subliming ablative materials to be identified was polytetrafluoroethylene [9002-84-0]y Teflon, which offers light weight, good
insulating properties as a result of its decomposition temperature (about 500°C), and a high endothermic value for the depolymerization or ablative heat of
reaction. An added advantage is that Teflon ablates to form a volatile monomer without forming a conductive char, thereby maintaining the low dielectric
properties of the virgin material. A dielectric material without a conductive char is very useful for transmitting and receiving radio frequency signals during
reentry. For higher heat loads, Teflon and a high temperature dielectric fiber such as quartz can be mixed to reduce the necessary wall thickness and
improve overall thermostructural performance. Teflon was proposed as a heatshield for a Venus probe, using a reflective coating on the back end for
additional insulation (18). Reinforced Teflon has been suggested for use in high speed ablative missile radome applications (19).
Subliming ablators are used for vehicles subject to long term, low altitude exposure and subsequent atomic erosion. In experiments conducted on
early shutde flights, metallic materials exhibited a significandy greater atomic erosion resistance than organic-based materials with the exception of Teflon,
which does not react strongly with atomic oxygen. Very thin coatings of the erosion-resistant materials were found to protect the substrate from atomic
erosion. In addition, these coatings sublime cleanly upon reentry (20,21).
Graphite. Carbon [7440-44-0] has been identified as having the highest heat of ablation. This high ablation efficiency often identifies carbon or
carbon composites for use in high heating environments where a minimum of shape change is important, such as in missile nosetips and small radius
leading edges. Graphite [778242-5] sublimes at temperatures as high as 3900 К (22) (see Carbon, carbon and artificial graphite; Carbon, natural
graphie).
When monolithic graphite is used for ablation, the critical factors affecting performance include high uniform density and small uniform pore size.
Surface roughening of the graphite, however, caused by ablation down to subsurface porosity, can affect the surface heating as the flow is changed from
laminar to turbulent (23). Pyrolitic graphite, which is free of open porosity and very high in density compared to other forms (Table 4), has been shown to
be superior in resistance to laser penetration (24). However, pyrolitic graphite exhibits high thermal expansion anisotropy and is therefore subject to
thermal fracture. The other commercial forms of graphite are less susceptible to thermal fracture and have also been evaluated for reentry applications. ATJ
graphite was found to be an order of magnitude greater in resistance to laser penetration than reinforced charring ablators (25). However, monolithic
graphite has been used less in recent years because of the increased variety in forms of reinforced carbon or carbon-carbon composites that are available.
Table 4. Bulk Graphite Properties
% Thermal expansion from 300 to 2500 К
Material Specific gravity Radial, MB, Axial, C, direction direction
pyrolytic graphite 2.2 Union Carbide ATJ-S 1.83 0.5 6 0.9 1.2
Kirk-Othmer Encyclopedia of Chemical Technology (4th Edition)
4
ABLATIVE MATERIALS
Voll
Unocal Poco AXF-5Q
1.81
1.9
1.9
Carbon-Carbon Composites. Carbon—carbon composites are simply described as a carbon fiber reinforcement in one or many directions
using a carbon or graphite matrix material (see Composite materials).
Techniques available for densifying woven carbon fiber preforms into carbon-carbon composites include (7) high pressure impregnation of the
preform using molten coal tar or petroleum pitch, followed by pyrolysis and high temperature graphitization for multiple cycles, (2) low pressure
impregnation using high char yield resin matrices, followed by pyrolysis and graphitization for multiple cycles, and (5) carbon vapor deposition-infiltration
into the preform using a high strength graphitic structure. Processes are often combined to yield a high density composite (26). These materials exhibit
improved thermal stress performance over monolithic graphite.
For nosetip materials 3-directional-reinforced (3D) carbon preforms are formed using small cell sizes for uniform ablation and small pore size.
Figure 5 shows typical unit cell dimensions for two of the most common 3D nosetip materials. Carbon-carbon woven preforms have been made with a
variety of cell dimensions for different applications (27—33). Fibers common to these composites include rayon, polyacrylonitrile, and pitch precursor
carbon fibers. Strength of these fibers ranges from 1 to 5 GPa (145,000—725,000 psi) and modulus ranges from 300 to 800 GPa.
^4, % fiber spacing, mm
B, % fiber spacing, mm
C, % fiber size, mm
D, cell spacing, mm
Fig. 5. Unit cell dimensions for carbon-carbon nosetip materials, parameters are
______fine-weave pierced fabric
1.32
1.32
0.635 diameter
0.25
______3D orthogonal weave
0.76
0.76
0.38 x 0.38
0.86
Carbon—carbon composites for rocket nozzles or exit cones are usually made by weaving a 3D preform composed of radial, axial, and
circumferential carbon or graphite fibers to near net shape, followed by densification to high densities. Because of the high relative volume cost of the
process, looms have been designed for semiautomatic fabrication of parts, taking advantage of selective reinforcement placement for optimum thermal
performance.
Other forms of carbon-carbon composites have been or are being developed for space shuttle leading edges, nuclear fuel containers for satellites,
aircraft engine adjustable exhaust nozzles, and the main structure for the proposed National Aerospace plane (34). For reusable applications, a silicon
carbide [409-21 -2] based coating is added to retard oxidation (35,36), with a boron [7440-42-8[ based sublayer to seal any cracks that may form in the
coating.
Ceramic Ablators. Several types of subliming or melting ceramic ablators have been used or considered for use in dielectric applications;
particularly with quartz or boron nitride [10043-11 -5] fiber reinforcements to form a nonconductive char. Fused silica is available in both nonporous
(optically transparent) and porous (slip cast) forms. Ford Aerospace manufactures a 3D sifica-fiber-reinforced composite densified with colloidal silica (37).
The material, designated AS-3DX, demonstrates improved mechanical toughness compared to monolithic ceramics. Other dielectric ceramic composites
have been used with performance improvements over monolithic ceramics (see Composite materials, ceramic matrix).
Melting ablators such as nylon and quartz perform essentially as subliming ablators do, except that they melt. In general, melting ablators have heats
of reaction similar to subliming ablators but have much higher thermal conductivities. When compared to other types of ablative materials, there are very
few advantages to using melting ablators. However, they are often combined with charring ablative materials in a reinforcing fiber form to improve ablation
performance by transpirational cooling as the endothermic melt is forced to the surface (38). Some melting ablators have also found application as dielectric
ablators, when no electrically conductive residue is formed. Silicon carbide and silicon nitride [12033-89-5] have also been considered as effective ablators
for specific thermal protection applications (39).
Subliming ablators are being used in a variety of manufacturing applications. The exposure of some organic polymers to pulsed uv-laser radiation
results in spontaneous ablation by the sublimation of a controlled thickness of the material. This photoetching technique is utilized in the patterning of
polymer films (40,41) (see Photochemical technology).
The thermal protection system of the space shuttle is composed mainly of subliming or melting ablators that are used below their fusion or
vaporization reaction temperatures (42). In addition to the carbon-carbon systems discussed above, a flexible reusable surface insulation composed of
Nomex felt substrate, a Du Pont polyamide fiber material, is used on a large portion of the upper surface. High and low temperature reusable surface
insulation composed of silica-based low density tiles are used on the bottom surface of the vehicle, which sees a more severe reentry heating environment
than does the upper surface of the vehicle (43).
Charring Ablators. Charring ablators are used in a greater variety of thermal environments than either subliming or intumescent ablators
because of their ability to withstand a much higher heat flux. In the charring ablator, the ablative material acts as a heat sink, absorbing ah of the incident
heat flux and causing the surface temperature to increase quickly. At reaction temperature, endothermic chemical decomposition occurs: the organic matrix
pyrolizes into carbonized material and gaseous products. The passage of heat-absorbing gases through the charred surface provides further insulative
performance and thickens the boundary layer, reducing the convective heat transfer. The charring is a continuous process: as the charred surface is eroded
by the severe surface environment, more char forms to take its place.
Charring ablators are often used in combination with subliming or melting reinforcement materials. Melting reinforcements such as silica or nylon
provide transpirational cooling. Carbon-fiber-reinforced phenolic composites are commonly used as heatshields for high load reentry vehicles (44,45). This
material was also evaluated for survival of the severe heating environment anticipated with the Jovian probe Galileo (46). High strength, high temperature
subliming reinforcements such as carbon fibers provide substantial strength, both to withstand high shear environments and to act as a structural
heatshield material. A laminated carbon-phenolic composite is typically made by using an 8-hamess satin-weave fabric prepreg having fibers at 45° to the
wrapping direction (bias orientation) and then laying up on a cylinder or frustum so that the plane of tape makes an angle of 20° to the surface of the shell.
This type of configuration improves resistance to delamination, which can occur in a simple cylindrical or scroll wrap. Also, the fibers are at a low angle to
the ablating surface, thereby minimizing thermal conduction. In some instances the types of reinforcements are varied along the thickness of the material to
Kirk-Othmer Encyclopedia of Chemical Technology (4th Edition)
5
ABLATIVE MATERIALS
Voll
improve insulation (47) (see Composite materials, polymer matrix).
High density charring ablators such as carbon-phenolic contain high density reinforcements to improve shear resistance. In contrast, lower density
charring ablators as a rule are used for low shear environments. The Apollo mission reentry conditions are typical of a relatively low shear environment, so
low density ablators consisting of epoxy—novolac resin containing phenolic microballoons and silica fiber reinforcement have been used. In order to
improve the shear resistance and safety factor of the material for this mission, the ablator was injected into the cavities of a fiberglass-reinforced phenolic
honeycomb that was bonded to the substructure of the craft (48).
Elastomeric shield materials (ESM) have been developed as low density flexible ablators for low shear applications (49). General Electric's RTV 560
is a foamed silicone elastomer loaded with silicon dioxide [7631-86-9] and iron oxide [1317-61 -9] particles, which decomposes to a similar foam of SiO2,
SiC, and FeSiO3. Silicone resins are relatively resistant to thermal decomposition and the silicon dioxide forms a viscous Equid when molten (50) (see
Silicon compounds, silicones).
One indication of the performance of a charring ablator resin is the ability of the organic material to form a high density char. As shown in Figure 6,
silicone is quite resistant to decomposition, even after exposure to high temperatures. Phenolic is also shown to be a relatively high char yield material (50).
However, epoxy which has a higher decomposition rate, is commonly used because of ease of handling and processing. In addition, the char structure of
epoxy-based ablators can be improved by the addition of a variety of reinforcements (51). For example, a graphite-fiber-reinforced epoxy composite has
been found to be a cost-effective substitute for typical low density ablators in alow shear lifting environment (52).
Temperature, °C
Fig. 6. Decomposition of polymers
as a function of temperature during heating. A, polymethylene; B, polytetrafluoroethylene; C, silicone; D, phenolic resin;
E, epoxy resin.
Cork [61789-98-8] is an effective low cost charring ablator. In order to reduce moisture absorption and related poor performance, cork particles are
often blended in a silicone or phenolic resin. The result is a uniform ablative material in a sheet form that is easy to apply.
It should be noted that a number of low density ablators contain either glass or phenolic microballoons. Advantages include reduction of the total
unit weight of the heatshield and lower thermal conductivity of the base, resulting in improved insulative properties. A very light weight ablative material,
composed of glass and phenolic microballoons and cork particles in a silicone resin, has been shown to protect the fuel tank on the space shutde. A unique
gas-injection method was developed to mold the material to the proper configuration (53). Polyurethane foams have also been considered as fuel tank
ablative material (54).
Wood has been used as an effective low cost charring ablator. The Chinese successfully used white oak as the heatshield for their RRS FSW vehicle.
Wood was recommended as an alternative to more expensive heatshield materials for commercial reusable satellites. However, the safety factors for this
type of material should be very high, since there is no easy way to guarantee uniformity. Standard NDT techniques cannot distinguish between cracks and
naturally occurring growth rings of various sizes in thick wooden parts.
Intumescent Ablators
Additives in an intumescent ablator form a foamlike region on exposure to heat. This process causes the material thickness to increase significandy,
resulting in improved insulation performance. Intumescent ablators are sometimes classified as charring ablators because they form a surface char.
However, there are several basic differences between intumescent and charring ablators. The basic intumescent decomposition reaction is exothermic,
whereas the charring decomposition is endothermic. However, inorganic fillers are usually added to intumescent materials to produce a net endothermic
reaction (55). In addition, an intumescent reaction results in decreased thermal conductivity and increased specific heat as the material temperature
increases. Conversely, a charring reaction produces a net increase in thermal conductivity and a decrease in specific heat as the material temperature
increases. Thus as the net material temperature increases, the thermal diffusivity of an intumescent ablator decreases and that of a charring ablator
increases.
The low thermal diffusivity and high depth of penetration make intumescent ablators useful as insulators in transient heat conduction systems. A
typical application is as a protective coating for munitions stored on naval ships. In the event of a fire, the insulative properties of the intumescent ablator
should provide for more escape time before the munitions detonate from the heat. Intumescent ablators are also used to coat load-carrying beams for
bridges, oil rigs, and other structures. The insulative properties of the intumescent ablator should keep the temperatures of the load-carrying beams low,
thereby maintaining the high strength of the beam material and delaying the collapse of the structure.
Intumescent ablators are not generally used in severe thermal environments such as reentry, because these materials usually have higher densities
than charring ablators and the drastic shape changes they undergo would be detrimental to aerodynamic performance. Intumescent ablators usually possess
good mechanical strength, however, and the ablative coating is capable of adding strength to a structure at high temperatures. In some cases a metallic
mesh is incorporated to improve resistance of the char to erosive forces.
Several forms of intumescent materials are available from a number of suppliers (56). Some are available as rubberized sheets that can be bonded to
simple shaped structures. Others are supplied as a tape, paste, or spray-on coating. A typical example of an intumescent coating material is CHARTEK 59,
a high performance, lightweight, epoxy-based material from Textron that can be applied by either spray coating or troweling (57). It adheres well to steel
and is used heavily in the hydrocarbon processing industry where protection from high temperature fires is a serious design consideration for support
structures. Another example is Interam, a rubber-based intumescent material manufactured by the 3M Co. In one test, Interam was used as a wrap to
protect bags of howitzer propellant from heat generated by a nearby explosion. The material successfully prevented ignition of the howitzer propellant,
thereby enhancing survival of personnel on military vehicles in the event of a hit in the munitions area (58).
Kirk-Othmer Encyclopedia of Chemical Technology (4th Edition)
6
ABLATIVE MATERIALS
Voll
BIBLIOGRAPHY
"Ablation" in ECT 2nd ed., Vol. 1, pp. 11—21, by I. J. Gruntfest, General Electric Company; "Ablative Materials" in ECT 3rd ed., Vol. 1, pp. 10—26, by E.
R. Stover, P. W. Juneau, Jr., and J. P. Brazel, General Electric Company.
1. D. K. Huzel, Pennemunde to Canaveral, Prentice-Hall, Inc., Englewood Cliffs, N.J., 1962.
2. H. J. Allen, /. Aeronaut. Sci. 25, 217 (1958).
3. M. C. Adams, JetPropul. 29, 625 (1959).
4. A. M. Morrison,/. Spacecr. Pockets 12, 633 (1975).
5. P. J. Schneider and co-workers,/ Spacecr. Rockets 10, 592 (1973).
6. H. L. Moody and co-workers,/ Spacecr. Rockets 13, 746 (1976).
7. D. L. Schmidt in D. V. Rosato and R. T. Schwartz, eds., Environmental Effects on Polymeric Materials, Wiley-Interscience, New York, 1968, pp.
487-587.
8. D. L. Schmidt in G. F. D’ALelio and J. A. Parker, eds., Ablative Plastics, Marcel Dekker, Inc., New York, 1971, pp. 1—39 (a good reference book); J.
Macromol. Sci. Chem. 3, 327 (1969).
9. M. L. Minges in G. F. D'Alelio and J. A. Parker, As., Ablative Plastics, Marcel Dekker, Inc., New York, 1971, pp. 287—313.
10. H. K. Hurwicz, T. Munson, R. E. Mascola, and J. Cordero, Astronaut. Aerosp. Eng. 1(7), 64—73 (Aug. 1963).
11. H. N. Kelley and G. L. Webb, Assessment op Alternate Thermal Protection Systemsfor the Space Shuttle Orbiter (AIAA/ASME 3rd Joint Thermophysics,
Fluids, Plasma and Heat Transfer Conference, June 7—11, 1982, St. Louis, Mo., AIAA-82-0899, 1982.
12. Ref. 10, p. 65.
13. C. D. Pears, Characterisation of Several Typical Polygraphites with Some Convergence on Solid Billet ATJ-S (Proceeding of the Conference on Continuum
Aspects on Graphite Design, 1970), CONF-7001105, NTIS, Springfield, Va., 1972, pp. 115—136.
14. J. G. Baetz, Characterisation of Advanced Solid Rocket No^yle Materials (SAMSO-TR-75-301), Air Force Rocket Propulsion Laboratories, Edwards
AFB, Calif., Dec. 1975.
15. D. E. Hunton, Sci. Am. 261, 92-98 (Nov. 1989).
16. Arnold Engineering Development Center, TestFacility DataBase, Vol. 3: Aerothermal Test Facilities, Aeroballistic andlmpact Ranges, and Space
Environmental Chambers, Arnold Air Force Base, Tenn., Oct. 1988.
17. D. L. Schmidt in ref. 9, p. 5.
18. D. L. Peterson and W. E. Nicolet,/ Spacecr. Rockets 11, 382 (1974).
19. M. R. McHenry and B. Laub, Ablative Radome Materials Thermal-Ablation and Erosion Modelling (13th Intersociety Conf, on Environmental Systems,
San Francisco, Calif., July 11—13), 1983.
20. S. L. Koontz, K. Albyn, and L. Leger, Inst. Environ. Sci. 50—59 (March/April 1990).
21. R. R. Laher and L. R. Megill, Planet. Space Sci. 36, 1497-1508 (1988).
22. H. Hurwicz and J. E. Rogan, "Ablation," in W. M. Rohsenow and J. P. Harriett, eds., Handbook of Heat Transfer, McGraw-Hill Book Co., Inc., New
York, 1973, Sect. 16.
23. К. M. Kratsch and co-workers, AFML-TR-70-307, Vol. IV, ASD, Wright-Patterson AFB, Ohio, May, 1973.
24. J. H. Lundell, R. R. Dickey, and J. T. Howe, Simulation of Planetary Entry Radiative Heating With a CO2 Gasdynamic Easer (ASME Conference on
Environmental Systems, San Francisco, Calif., July 1975), American Society of Mechanical Engineers, New York, 1975.
25. P. D. Zavitsanos, J. A. Golden, and W. G. Browne, Study ofEaser Effects on Heatshield Materials (final report), General Electric Co., Philadelphia, Pa.,
Jan. 1979.
26. J. Delmonte, Technology of Carbon and Graphite Fiber Composites, Van Nostrand Reinhold Company, New York, 1981, p. 398.
27. A. R. Tavema and L. E. Mcallister in J. Buddey, A.,AdvancedMaterials, Composites and Carbon, American Ceramic Society, Columbus, Ohio, 1972,
pp. 203-211.
28. К. M. Kratsch, J. C. Schutzler, and D. A. Eitman, Carbon—Carbon 3D Orthogonal Material Behavior (AIAA Paper No. 72365, AIAA-ASME-SAE 13th
Structural Dynamics and Materials Conference, 1972), American Institute of Aeronautics and Astronautics, New York, 1972.
29. E. R. Stover and co-workers, 11th Biennial Conference on Carbon, CONF-730601, NTIS, Springfield, Va., 1973, pp. 277, 335—336.
30. J. L. Perry and D. F. Adams, Carbon 14, 61 (1976).
31. Product data, Textron Specialty Materials Division, Lowell, Mass., 1990.
32. Product data, Fiber Materials, Inc., Biddeford, Maine, Jan. 1975.
33. J. J. Gebhardt and co-workers, in M. L. Deviney and T. M. O'Grady, eds., Petroleum Derived Carbons (ACS Symposium Series No. 21), American
Chemical Society, Washington, D.C., 1976, pp. 212—217.
34. J. Brahney, Aerosp. Eng. 7(6) (June 1987).
35. J. M. Williams and R. J. Imprescia,/ Spacecr. Rockets 12, 151 (1975).
36. Materials, Office National d'Etudes et de Recherches Aerospatiales, France, 1985, pp. 18—19.
37. T. M. Place, Proceedings of the 12th Symposium on Electromagnetic Windows, Georgia Institute of Technology, Atlanta, Ga., 1974, pp. 47—51.
38. H. E. Goldstein in ref. 9, pp. 12, 323.
39. H. Shirai, K. Tabei, and S. Akiba,/5ME Int. J. 30(264) 945-949 (1987).
40. R. Srinivasan, Pofm. Degrad. Stab. 17(3), 193-203 (1987); Chem. Abstr. 107, 67818u (1987).
41. D. Dijkkamp and A. S. Gozdz, Phys. Rev. Lett. 58(20), 2142-2145 (1987); Chem. Abstr. 107, 40493x (1987).
42. C. D. Lutes, Nonlinear Modeling and Initial Condition Estimation for Identifying the Aerothermodynamic Environment of the Space Shuttle Orbiter, Masters thesis,
Air Force Institute of Technology, WPAFB, Ohio, Jan. 1984.
43. A NASA Spinoff Cools the Fire, NASA Tech Briefs, March, 1988, p. 12.
44. R. W. Farmer, Extended Heating Ablation of Carbon Phenolic and Silica Phenolic, AFML-TR-74-75, ASD, WPAFB, Ohio, Sept. 1974.
45. Ablative Materials Handbook, U.S. Polymeric, Inc., Santa Ana, Calif., 1964.
46. A. Balkrishnan, W. Nicolet, S. Sandhu, and J. Dodson, Galileo Probe Thermal Protection: Entry Heating Environments and Spallation Experiment Design,
Acurex Corp./Aerotherm, Mountain View, Calif., Nov. 1979.
47. J. I. Yuck and S. Y. Mo, Han'guk Somyu Ronghakhoechi 24(5), 444—452 (1987) (Korean); Chem. Abstr. 108, 132936t (1988).
48. E. P. Bartlett and L. W. Anderson,/ Spacecr. Rockets 8, 463 (1971).
49. T. F. McKeon in ref. 9, pp. 259—286.
50. P. W. Juneau, Jr., Third Annual Polymer Conference Series, Program Will, 1972, University of Detroit, Detroit, Mich., 1972.
51. U.S. Pat. 4,772,495 (Sept. 20, 1988), S. E. Headrick and R. L. Hill (to United Technologies Co.).
52. W. A. Sigur, SAMPEQ. 17(2), 25-33 (1986).
53. K. A. Seeler and L. Erwin, SAMPEQ. 17(3), 40-48 (1986).
54. C. Williams and L. Ronquillo, Thermal Protection System for the Space Shuttle External Tanks, 6th SPI Ind., Tech. /Mark. Conf., 1983, pp. 90—100.
55. U.S. Pat. 4,088,806 (May 9,1978), P. W. Sawko and S. R. Riccitiello (to NASA).
56. J. M. Leary, Characteristics of Various Types of Ablative Materials with Associated NavalApplications, Thesis, Massachusetts Institute of Technology,
Cambridge, Mass., 1983 (a very good reference paper).
Kirk-Othmer Encyclopedia of Chemical Technology (4th Edition)
7
ABLATIVE MATERIALS
Voll
57. Product Brochure, Textron Specialty Materials Division, Lowell, Mass., 1990.
58. C. Paone, Preventing Cook-Off with Intumescent Materials, Army RD&A Bulletin, Jan.—Feb. 1990.
Michael Favaloro
Textron Defense Systems
Kirk-Othmer Encyclopedia of Chemical Technology (4th Edition)
8
ABRASIVES
Voll
ABRASIVES
An abrasive is a substance used to abrade, smooth, or polish an object. If the object is soft, such as wood, then relatively soft abrasive materials may be
used. Usually, however, abrasive connotes very hard substances ranging from naturally occuring sands to the hardest material known, diamond.
The use of abrasive materials to shape, scour, and polish implements or weapons has roots deep in antiquity. Much of the history is lost but we
know abrasives were used over 2 million years ago to sharpen and shape weapons, other implements, and ornamental items. An archaeological find in
Egypt of an iron dagger accompanied by a sharpening sandstone is probably the earliest dated use of an abrasive for sharpening metal (1). These items
were dated to between 1550 and 1100 вс. Three thousand years later Leonardo da Vinci's notebooks (ca AD 1500) show three intricate grinding machines
utilizing either grinding wheels or grinding belts, including one designed to polish and sharpen needles (2). The use of diamonds as engraving tools dates
back to biblical times; bonded diamond abrasive wheels were in use as early as 1824 (3).
Abrasives have evolved into an essential component of modem industry. Sandstone, emery, and corundum were the abrasives of choice until the
late 1800s when artificial materials were developed. Today synthetic abrasives offer such improved performance that the natural ones have been largely
replaced except for jobs where cost is paramount. In 1987 U.S. statistics (4) showed natural abrasive production to be about $7 million while that of crude
manufactured abrasives was over $182 million. Total value of abrasives and abrasive products worldwide is estimated to be over 6 billion dollars.
There are three basic forms of abrasives: grit (loose, granular, or powdered particles); bonded materials (particles are bonded into wheels, segments,
or stick shapes); and coated materials (particles are bonded to paper, plastic, cloth, or metal).
Advances in grinding wheels, abrasive belts, and the grinding process have been controlled primarily by the development of abrasives and to a lesser
extent by advances in bonding and manufacturing methods. Without abrasives, modem industrial production would be impossible. The U.S. Government
alone has over 300,000 tons of abrasives in its strategic National Defense Stockpile (4).
Properties of Abrasive Materials
Hardness. Table 1 lists the various scales of hardness (qv) used for abrasives. The earliest scale was developed by the German mineralogist
Friedrich Mohs in 1820. It is based on the relative scratch hardness of one mineral compared to another ranging from talc, assigned a value of one, to
diamond, assigned a value of ten. Mohs' scale has two limitations; it is not linear and, because most modem abrasives fall between 9 and 10, there is
insufficient delineation. Ridgeway (5) modified Mohs' scale by giving garnet a hardness value of 10 (H = 10) and making diamond 15. Woodell (6)
extended the scale even further by using resistance to abrasion, where diamond equals 42.5. This method is dynamic and less affected by surface hardness
variations than the other methods which involve indentation.
Table 1. Scales of Hardness
Material CAS Registry Number Mohs' scale Ridgeway's scale Woodell'sb scale Knoop hardness , kN/m2<i
talc [14807-96-6] 1
gypsum [13397-24-5] 2
calcite [13397-26-7] 3
fluorite [7789-75-5] 4
apatite [1306-054] 5
orthoclase [12251444] 6 6
vitreous silica [60676-86-0] 7
quartz [14808-60-7] 7 8 7 8
topaz [1302-59-6] 8 9 13
garnet [1217841-5] 10 13
corundum [1302-74-5] 9 9 20
fused ZrO2 [1314-234] 11 11
fused ZrO2/Al2O3e 16
fused A12O3 [1344-28-1] 12 21f
SiC [409-21-2] 13 14 24f
boron carbide [12069-32-8] 14 27
cubic boron nitride [10043-11-5] 46f
diamond [778240-3J 10 15 42.5 78
aRef. 5.
b Ref. 6.
C At a 100-gload (K-100) average. Ref. 7.
dTo convert kN/m2 to kgf/mm2 divide by 0.00981.
e 39% ZrO2 (NZ Alundum).
fRef. 8.
Knoop developed an accepted method of measuring abrasive hardness using a diamond indenter of pyramidal shape and forcing it into the material
to be evaluated with a fixed, often 100-g, load. The depth of penetration is then determined from the length and width of the indentation produced. Unlike
Woodell's method, Knoop values are static and primarily measure resistance to plastic flow and surface deformation. Variables such as load, temperature,
and environment, which affect determination of hardness by the Knoop procedure, have been examined in detail (9).
A linear relationship exists between the cohesive energy density of an abrasive (10) and the Woodell wear resistance values occurring between
corundum (H = 9) and diamond (H = 42.5). The cohesive energy density is a measure of the lattice energy per unit volume.
Toughness. An abrasive's toughness is often measured and expressed as the degree of friability, the ability of an abrasive grit to withstand
impact without cracking, spalling, or shattering. Toughness is often considered a measure of resistance to fracture and given the symbol K . This value is
Kirk-Othmer Encyclopedia of Chemical Technology (4th Edition)
9
ABRASIVES
Voll
directly related to the load on an indenter required to initiate cracking and leads to a brittleness index defined as hardness/К (11).
A practical industry friability test (12) for abrasives involves careful sizing of subject grains to pass a given sieve size while being retained on the next
finer screen. A unit weight of this grain is then ball-milled using a standard steel ball load for a given time. The percentage of milled grain retained on the
original screen is a measure of toughness or lack of friability. Other methods of evaluating this property involve centrifugally impacting sized grits and then
evaluating the debris (13).
Refractoriness (Melting Temperature). Instantaneous grinding temperatures may exceed 3500°C at the interface between an abrasive and
the workpiece being ground (14). Hence melting temperature is an important property. Additionally, for alumina, silicon carbide, B4C, and many other
materials, hardness decreases rapidly with increasing temperature (7). Fortunately, ferrous metals also soften with increasing temperatures and do so even
more rapidly than abrasives (15).
Chemical Reactivity. Any chemical interaction between abrasive grains and the material being abraded affects the abrasion. Endurance
scratch tests made on polished glass and iron rolls using conical grains of aluminum oxide and silicon carbide (16) showed that silicon carbide produced a
long scratch path on the glass roll and a short path on the steel roll. Exactly the opposite was true for aluminum oxide. These effects are explained by the
reactivities of the two abrasives toward glass and steel. Silicon carbide resists attack by glass but readily dissolves in steel, whereas aluminum oxide is
attacked by glass and is inert to steel. The advent of boron carbide, harder than either fused aluminum oxide or silicon carbide, brought grand hopes for its
use in grinding wheels and belts. Boron carbide's ease of oxidation and its reactivity toward both metals and ceramics prevented these developments.
Thermal Conductivity. Abrasive materials may transfer heat from the cutting tip of the grain to the bond posts, retaining the heat in a
bonded wheel or coated belt. The cooler the cutting point, the harder it is. Fused zirconium oxide has a relatively low thermal conductivity compared to
other abrasive materials. It also has a lower hardness than aluminum oxide, yet it performs quite well on hard-to-grind materials. This is attributed to the
decreased heat flow from the grinding interface into the grain (whose hardness decreases as its temperature rises) and to the bond (subject to heat
degradation).
Fracture. Fracture characteristics of abrasive materials are important, as well as the resulting grain shapes. Equiaxed grains are generally
preferred for bonded abrasive products and sharp, acicular grains are preferred for coated ones. How the grains fracture in the grinding process determines
the wear resistance and self-sharpening characteristics of the wheel or belt.
Microstructure. Crystal size, porosity, and impurity phases play a major role in fixing the fracture characteristics and toughness of an abrasive
grain. As an example, rapidly cooled fused aluminum oxide has a microcrystalline structure promoting toughness for heavy-duty grinding applications,
whereas the same composition cooled slowly has a macrocrystalline structure more suitable for medium-duty grinding.
Natural Abrasives
Naturally occurring abrasives are still an important item of commerce, although synthetic abrasives now fill many of their former uses. In 1987 about 156
million metric tons of natural abrasives were produced in the United States. Production was up from 1986 because of increased nonabrasive uses and
increased use of garnet in sandblasting (4).
Diamond. Diamond [778240-3] is the hardest substance known (see Carbon, diamond, natural). It has a Knoop hardness of 78—80 kN/m2
(8000—8200 kgf/m2). The next hardest substance is cubic boron nitride with a Knoop value of 46 kN/m2, and its inventor, Wentorf, believes that no
manufactured material will ever exceed diamond's hardness (17). In 1987 the world production of natural industrial diamonds (4) was about 110 t
(1 g = 5 carats). It should be noted that whereas the United States was the leading consumer of industrial diamonds in 1987 (140 t) only 260 kg of natural
industrial diamonds were consumed; this is the lowest figure in 48 years (4), illustrating the impact that synthetic diamonds have made on the natural
diamond abrasive market.
Although all diamonds are carbon in a crystalline cubic structure, industrial diamonds occur as three types. Bort is diamond in single crystal
fragments which are off-color or otherwise unsatisfactory for gems. Ballas consists of spherical masses of minute, intergrown diamond crystals arranged
more or less concentrically. Carbonado, the toughest form of natural industrial diamond, is an impure form of diamond consisting of diamond, graphite,
and amorphous carbon. The latter two types are found mainly in Brazil, but bort, found mostly in Africa, makes up more than 90% of all natural industrial
diamond production.
Abrasive applications for industrial diamonds include their use in rock drilling, as tools for dressing and trueing abrasive wheels, in polishing and
cutting operations (as a loose powder), and as abrasive grits in bonded wheels and coated abrasive products.
Corundum. Corundum [1302-75-5] (see Aluminum compounds) is a naturally occurring massive crystalline mineral composed of aluminum
oxide. It is an impure form of the gems ruby and sapphire. Prior to 1900 corundum was an important abrasive for the production of grinding wheels.
Today it is mainly employed as a loose abrasive for grinding and polishing optical lenses. Almost all the world's supply of corundum now comes from
Africa, primarily from Zimbabwe.
Emery. Emery [57407-26-8] is a dark granular rock consisting of an intimate mixture of corundum (A12O3) and magnetite (Fe^^) or hematite
(Fe2O3) together with impurities of titania, magnesia, and silica. The best grades of emery for abrasive use are mined in Turkey and Greece. A small
quantity of emery is used in coated abrasive products, but its principal use in the United States is in nonskid, wear-resistant floors and pavements. High
tonnages are reportedly shipped to the Far East to be used in millstones for grinding rice (18). Turkey and Greece, the major world suppliers of emery,
produced about 17,500 tin 1987 (4).
Garnet. Garnet [1217841 -5] is the name given to a group of silicate minerals possessing similar physical properties and crystal forms but
differing in chemical composition. Seven species exist but the two most important are pyrope, a magnesium aluminum silicate, and almandine, an iron
aluminum silicate. The formula for garnet is (MO)3M'2O3(SiO2)3: The divalent element, M, can be calcium, magnesium, iron, or manganese; the trivalent,
M', is aluminum, iron, chromium, or titanium.
The United States produces 63% of the world's annual crop of garnet, followed by India, Australia, China, and the USSR (4). The largest U.S.
producer is Barton Mines Corporation in upper New York State. This mine has been in continuous operation since the 1880s and produces a high grade
abrasive quality garnet (18). U.S. production and use of garnet in 1987 totaled almost 38,350 t, valued at a record $4.35 million (4). Garnet usage has
increased in recent years because its use as a sandblast medium reduces the risk of silicosis. It is also increasingly used in water filtration.
Silica. Silica (qv) comes in various forms including quartz [14808-60-7]. It has found wide use as an abrasive in the past, particularly as an
inexpensive coated abrasive for woodworking. The term sandpaper is still used as a generic term for coated abrasives in many quarters although the use of
sand in coated abrasives has been almost entirely eliminated because of the hazard of silicosis to the user and its inferior grinding properties (especially for
metals).
Sandstone. Sandstone wheels were once quarried extensively for farm and industrial use, and special grades of stone for precision honing,
sharpening, and lapping are a small but important portion of today's abrasive industry. Production of honing and sharpening stones from deposits of
dense, fine grain sandstone in Arkansas account for 76% of the value (about $2 million in 1987) and 88% of the total quantity of such stones in the United
States (4).
Tripoli. Tripoli [1317-95-9] is a fine grained, porous, decomposed siliceous rock produced mainly in Arkansas, Illinois, and Oklahoma. It is
widely used for polishing and buffing metals, lacquer finishing, and plated products. Since tripoli particles are rounded, not sharp, it has a mild abrasive
action particularly suited for polishing. Tripoli is also used in toothpastes, in jewelry polishing, and as filler in paints, plastics, and rubber. Rottenstone and
amorphous silica are similar to tripoli and find the same uses. In 1987 the abrasive use of tripoli in the United States totaled 26.6 million tons and was
valued at about $3.1 million; however, the portion used as a filler totaled 71.1 million tons and had a value of almost $10 million (4).
Pumice and Pumicite. Pumice and pumicite are porous, glassy forms of lava, rich in silica. Both pumice, the massive form, and pumicite, the
powder or dust form, have been widely used as a mild abrasive for polishing operations. This use, however, has continued to decline. Currently, only about
1% of their production is for abrasives (18).
Miscellaneous Natural Abrasives. Powdered feldspar [68476-25-5] is used as a mild abrasive in cleansing powders, and clays are
sometimes used in polishing powders. Staurolite [12182-56-8] is a complex hydrated aluminosilicate of iron, of high density (3.74—3.83 g/mL) and a
hardness of 7 to 8 on Mohs' scale. It is primarily used as a sandblasting grit, but silicosis hazards had cut production in 1987 about 25% compared to that
Kirk-Othmer Encyclopedia of Chemical Technology (4th Edition)
10
ABRASIVES
Voll
of 1986 (4).
Manufactured Abrasives
The use of automatic machine tools, often computer controlled and programmable, requires abrasive elements which have performance and lifetime
reproductibility. Natural abrasives suffer on both counts: performance is limited and inconsistent quality leads to unpredictable lifetimes. Manufactured
abrasives have both superior performance and consistency; consequendy, they have largely replaced the natural ones.
Silicon Carbide.
The first artificial abrasive, silicon carbide [409-21-2]> SiC, was produced by Edward Acheson in 1891 (19). This invention led to the formation of the
Carborundum Company. The registered trademark, Carborundum, is essentially synonymous with silicon carbide.
Silicon carbide is produced from quartz sand and carbon in large electric furnaces in which the charge acts as the refractory container and thermal
insulator for the ingot being formed. Reaction temperatures range from 1800 to 2200°C, melting the quartz sand which then reacts with the solid carbon to
form crystalline silicon carbide. Both green SiC and black SiC are produced. Woodell’s (6) lapping tests indicate that they have the same hardness, although
others (18) state that the green is harder than the black. Green SiC is more expensive and is often preferred for tool grinding wheels because the tool is
more visible against a green background. Black SiC is preferred for grinding low tensile strength materials such as cast iron, chilled iron rolls, marble,
ceramics, and aluminum. It also is widely used as a wire-sawing abrasive in quarrying building stone.
In 1989 U.S. and Canadian plants produced 116,600 t of crude silicon carbide valued at $56.4 million (20). Abrasive uses accounted for 46% of the
total tonnage and 48% of the total value.
Fused Aluminum Oxide.
Fused aluminum oxide [1344-28-1] was the next manufactured abrasive to appear (19). By 1900 the first commercially successful fused alumina of
controlled friability was produced from bauxite [1318-16-7]. The Norton Company obtained the rights and patents in 1901 and constructed the first plant
to produce this material on a commercial basis. In 1904 the Higgins arc furnace, which used a water-cooled steel shell instead of a refractory lining, was first
used (21). A typical Higgins furnace is about 2 m in diameter by 2 m in height, producing an ingot of about 5S t. The fusion and slow cooling of a mixture
of bauxite, coke, and iron turnings gives a coarse crystalline product of about 95% alumina and 0.7% titania [13403-67-7]^ designated regular aluminum
oxide. By adding more coke to the charge, greater reduction is obtained and the percentage of residual titania is reduced, producing semifriable alumina
(about 97% alumina). As the name implies, this material is less tough than the regular alumina. After crushing, further heat treatment in rotary furnaces is
used to alter the valence state and solubility of titania, producing an exsolved disperse phase which affects the impact strength of the resulting product.
Some Higgins furnaces are still in use, but most aluminum oxide is now fused in tilting furnaces and poured into ingots of sizes suitable for the desired rate
of cooling and resulting crystal size. Small ingots cool rapidly and produce microcrystalline alumina, tougher and stronger than regular.
Bayer alumina (see Aluminum compounds), containing about 0.5% soda as its only significant impurity, is also the starting material for the production
of fused white aluminum oxide abrasive. During the fusion process much of the soda is volatilized, producing small bubbles and fissures in the final
product and giving a slightly less dense, much more friable abrasive than regular or semifriable aluminum oxide. This white abrasive is widely used in tool
grinding as well as in other applications requiring cool cutting, self-sharpening, or a damage-free workpiece.
Special pink or ruby variations of the white abrasive are produced by adding small amounts of chromium compounds to the melt. The color is
dependent on the amount of chromium added. A green alumina, developed by Simonds Abrasives, results from small additions of vanadia [11099-11-9].
Each was developed to improve on the suitability of white abrasive for tool and precision grinding.
A "single-crystal" fused alumina abrasive, produced by fusing bauxite in a sulfide matrix and then controlling the cooling and soHdification rate to
grow the required sizes of single crystals, has also been developed (22). This abrasive is even better than white abrasive for tool grinding and is particularly
effective for large area vertical spindle surface grinding. The process is not environment-friendly and it is difficult to change the output range of grit sizes
quickly to match the desires of the marketplace. An abrasive of this type formerly produced in Sweden was abandoned when customers would not
purchase the complete range of grit sizes produced.
In 1989, 164,200 t of regular fused alumina abrasive and 30,630 t of high purity fused alumina were produced in the United States and Canada,
valued at U.S. $62.3 and $19.4 million, respectively (20).
Sintered Aluminum Oxide. The first commercially successful sintered alumina abrasive was patented by Ueltz in 1963 (23). Powdered,
calcined bauxite was pressed into blocks, granulated to size, and fired at high temperature until sintered to maximum density. The impurities in the bauxite
act as sintering aids, producing a very strong product in which the crystals are quite small (less than 10 |lm). This abrasive, designated 75A, found
immediate use in heavy-duty snagging wheels used to condition the surfaces of stainless steel slabs and billets. It could condition from 5 to 10 times the
tonnage of steel as the fast-cooled microcrystalline fused alumina previously employed.
One advantage of sintering is the close control of size and shape of the abrasive particle. Extruded, cylindrically shaped, sintered abrasives of circular
cross section were produced from bauxite (24) and from calcined alumina (25). The Ueltz sintered bauxite was also later produced in extruded cylinder
form and designated as 76A. Extruded sintered abrasives of a wide variety of cross-sectional configurations, eg, square and triangular, were later patented
(26).
Sintered abrasives made from bauxite and calcined alumina are heavy-duty abrasives; they are much too strong and tough for precision grinding.
Sol—Gel Sintered Aluminum Oxide. A new and much more versatile sintered alumina abrasive is now produced from aluminum
monohydrate, with or without small additions of modifiers such as magnesia, by the sol—gel process (see Sol-gel technology). The first modified sol—gel
abrasive on the market, Cubitron, was patented (27) and produced by the 3M Corporation for products such as coated belts and disks. The success of this
material promoted intensive research into sol—gel abrasives.
A higher density sol—gel abrasive, produced by the introduction of seed crystallites formed by wet-milling with high alumina media or by
introduction of submicrometer CC-alumina particles, was patented (28) and designated Norton SG. The microstructure of this abrasive consists of
submicrometer CC-alumina crystals (Fig. 1) and its bulk density approaches that of fused alumina. Norton SG has proven to be an exceptional performer in
coated and bonded abrasive products; it was awarded the 1989 ASM Engineering Materials Achievement Award (29).
Kirk-Othmer Encyclopedia of Chemical Technology (4th Edition)
11
ABRASIVES
Voll
Fig. 1. SEM photomicrograph of polished and thermally etched section of Norton SG sol—gel alumina abrasive grain.
Another sol—gel abrasive, produced by seeding with (X-ferric oxide or its precursors, has been patented (30). A magnesium-modified version of this
abrasive, also called Cubitron, is being produced as a replacement for the earlier type. Yttria [1J /4-J6-9-modi±ied sol—gel abrasives have also been patented
(31), as well as rare earth oxide modified materials (32). These abrasives are all produced by 3M Corporation; they have performed very well in various
applications such as in coated abrasives for grinding stainless steel and exotic alloys.
Sol—gel abrasives proved to be exceptional performers in coated applications and in resin-bonded wheels for cut-off, flute-grinding, or other
operations. Initial attempts to form vitreous bonded wheels using these materials failed because the standard high temperature (1250°C) bonds reacted
with the abrasive to produce a soft, punky wheel. Firing at lower temperatures or using more viscous, less reactive, glass bonds (33) produces vitrified
wheels that are now finding wide application in precision grinding, particularly for difficult-to-grind alloys. They are also used where a minimum of grinding
heat is needed, such as in tool grinding and the shaping of aerospace parts. The quantity of metal removed per unit volume of grinding wheel (G-ratio) in
dry grinding applications can be increased by a factor of 10 compared to the best available fused alumina wheel.
Fused Zirconia—Alumina. Fused zirconia [1314-23-4] would be an excellent abrasive for heavy snagging of steel slabs and billets except for
its cost, density, and lack of toughness. Quick-cooled fusions of zirconia and alumina, however, are widely used in large resin-bonded snagging wheels for
heavy-duty conditioning of steel slabs and billets and for weld-bead removal in pipeline construction. These materials, called AZ abrasives, are also used
extensively in coated abrasive applications (34), but they are not used in vitrified bonded wheels because of thermal instability. There are two principal
varieties of zirconia-alumina abrasives: a near eutectic combination of 40% ZrO2 and 60% A12O3 (Fig. 2), and a less cosdy 25% ZrO2 and 75% A12O3.
Extremely rapid cooling of the melt achieved by casting into a bed of steel balls, between steel plates, or into thin sheets is required. Yearly production
figures are not available but production increased in both tonnage and value in 1987 (4).
Fig. 2. SEM photomicrograph of polished section of near eutectic alumina-zirconia abrasive grain showing white zirconia in dark alumina matrix.
Synthetic Diamond. In 1955 the General Electric Company announced the successful production of diamonds (see Carbon, diamond,
synthetic) from graphite under very high pressure and temperature in the presence of a metal catalyst. It was later reported that a Swedish company,
Allmana Svenska Electriska AB (ASEA), had succeeded in producing diamond in 1953 (35).
Today there are four producers of diamond in the United States, the largest consumer of industrial diamonds, in addition to producers in Ireland,
Sweden, USSR, and Japan. Manufactured diamond grit and powder have almost completely replaced natural diamond for abrasive work except for sizes
larger than 20 grit (4). Sintered diamond, or diamond compacts, while successfully competing with carbonado and finding new uses in tool bits and wear
resistant parts, is not an important diamond abrasive.
Cubic Boron Nitride. Cubic boron nitride [10043-11-5] (see Boron compounds), or CBN, is a synthetic mineral not found in nature. It was
first produced by the General Electric Company using the same equipment used for the production of synthetic diamond and is designated as Borazon.
CBN is nearly as hard as diamond, yet it does not perform as well in the usual diamond grinding applications such as abrading ceramics, rock, or cemented
tungsten carbide. However, CBN is an extremely efficient abrasive for grinding steel (17). Although its cost is comparable to that of synthetic diamond, it
successfully competes with the inexpensive fused aluminum oxide in grinding steel tools. CBN improves grinding wheel life by as much as 100 times over
that of alumina, thus increasing productivity, reducing downtime for wheel changes and dressing, and improving the quality of parts (36).
In 1985 world sales of CBN abrasive products totaled $41.4 million, 37% of which was in the Pacific area (primarily Japan), 34% in Europe, and
29% in the Americas (37).
Boron Carbide. Boron carbide [12069-32-8]B4C, is produced by the reaction of boron oxide and coke in an electric arc furnace (70% B4C) or
by that of carbon and boric anhydride in a carbon resistance furnace (80% B4C) (see Boron compounds, refractory boron compounds). It is primarily used
as a loose abrasive for grinding and lapping hard metals, gems, and optics (18). Although B4C is oxidation-prone, the slow speed of lapping does not
generate enough heat to oxidize the abrasive.
Kirk-Othmer Encyclopedia of Chemical Technology (4th Edition)
12
ABRASIVES
Voll
Slags. Slags from metals smelting and from coal-fired power plants find considerable use as blasting media for ships, offshore oil rigs, and other
ironwork. The silica content of most slags is quite high, but in this form is not a health hazard (18).
Steel Shot and Grit. Steel shot and grit are also widely used in grit blasting and abrasive finishing. In 1989, 220, 196 metric tons of metallic
abrasives were produced in the United States with a combined value of $89.55 million (20).
Miscellaneous Manufactured Abrasives. Steel wool is made from a variety of steels by shaving or scraping a continuously moving wire
with a fixed serrated cutting tool. It is used for finishing wood and soft metals and for scouring and cleaning. Brass wool and copper wool are used
primarily for domestic cleaning.
Many metal oxides and other compounds are precipitated chemically as very fine particles and used as polishing and lapping agents. Iron oxide (as
rouge) [8011-97-0]., cerium oxide [1306-38-3], and zirconia are widely used in polishing glass. Crocus [5124-00-1another form of iron oxide, is used for
finishing cudery and brass. Chromium oxide [120184)1 -8]manganese dioxide [1313-13-9]> and tin oxide [18282-10-5] are also used for special polishing
operations. Softer abrasives such as magnesia [1309-48-4] and calcium carbonate [471-34-1] are widely used in scouring and buffing compounds.
Sizing, Shaping, and Testing of Abrasive Grains
Sizing. Manufactured abrasives are produced in a variety of sizes that range from a pea-sized grit of 4 (5.2 mm) to submicrometer diameters. It
is almost impossible to produce an abrasive grit which will just pass through one sieve size yet be 100% retained on the next smaller sieve. Thus a standard
range was adopted in the United States which specifies a screen size through which 99.9% of the grit must pass, maximum oversize, minimum on-size,
maximum through-size, and fines. The original Bureau of Commerce size standards, although nonmetric, have been internationally recognized; even the
Russian GOST standards are an exact duplicate (38). The Bureau of Commerce standards have been updated byMNXT StandardB74.12-1982 in the United
States (39) and by FEPA Standard 42-GB-1984 in Europe (40). Table 2 shows the average diameter of grit sizes ranging from 4 to 1200. Designations for
the finest grit sizes vary in the United States, Europe, and Japan. Mizuho, a Japanese company lists 10,000 grit (0.5 |Tm) as available.
Table 2. Bonded Abrasive Grit Sizes
Grit Diameter, |lm Grit Diameter, |lm Grit Diameter, |lm
4 5200 24 775 120 115
5 4500 30 650 150 95
6 3650 36 550 180 80
7 3050 40 460 220 69
8 2550 46 388 240 58
10 2150 54 328 280 48
12 1850 60 275 320 35
14 1550 70 230 400 23
16 1300 80 195 500 16
18 1100 90 165 600 8
20 925 100 138 1200 3
The permissible variation in the openings of U.S. standard test sieves varies from 15% for the coarser sizes to 60% for the range of 200 to 400 grit.
To reduce this built-in error, the diamond industry has developed precision, electroformed test screens that are produced by a combination of
photoengraving and electroplating. These screens, in which the accuracy and uniformity of aperture size can be controlled to 2 pm, are too expensive for
routine testing; they are used instead to calibrate standard wire sieves (41). The sizing of diamond abrasive grains is much tighter than that of other
abrasives; details can be found in reference 42.
Shaping. Screening is a two-dimensional process and cannot give information about the shape of the abrasive particle. Desired shapes are
obtained by controlling the method of crushing and by impacting or mulling. Shape determinations are made optically and by measuring the loose-packed
density of the abrasive particles: cubical particles pack better than acicular. In general, cubical particles are preferred for grinding wheels, whereas high
aspect-ratio acicular particles are preferred for coated abrasive belts and disks.
Testing. Chemical analyses are done on all manufactured abrasives, as well as physical tests such as sieve analyses, specific gravity, impact
strength, and loose poured density (a rough measure of particle shape). Special abrasives such as sintered sol—gel aluminas require more sophisticated tests
such as electron microscope measurement of CC-alumina crystal size, and indentation microhardness.
Coated Abrasives
Coated abrasive products, once limited to sandpaper in woodworking shops, are versatile and efficient industrial tools. Machines ranging from portable
sanders to giant slab conditioners and roll grinders utilize coated abrasives. Abrasive belt machines now perform many of the operations that were once the
exclusive province of grinding wheels.
Wearable coated abrasive wheels of the radial-flap type can grind and polish contours that are almost impossible for bonded abrasive wheels.
Coated bands, sleeves, and cartridge rolls (coated abrasives wound around a spindle into a multilayered straight or tapered cartridge) add to the utility of
these wheels. Additionally, coated abrasive disks are widely used for a variety of grinders, including disk grinders employed in auto body finishing and
refinishing.
Coated abrasives consist of a flexible backing on which films of adhesive hold a coating of abrasive grains. The backing may be paper, cloth,
open-mesh cloth, vulcanized fiber (a specially treated cotton rag base paper), or any combination of these materials. The abrasives most generally used are
fused aluminum oxide, sol—gel alumina, alumina-zirconia, silicon carbide, garnet, emery, and flint.
The wear rates of alumina and alumina—zirconia abrasive belts have been compared (43). Alumina—zirconia was found to be much freer-cutting and
requires less energy to remove a given volume of metal. Under moderate grinding conditions the alumina—zirconia abrasive removed 10 times more metal
than the alumina abrasive and under severe conditions about 30% more. The newly developed sintered sol—gel alumina abrasives are more effective in
some applications than alumina—zirconia in increasing cut-rate, reducing power requirements, and increasing belt or disk life.
A new form of coated abrasive has been developed that consists of tiny aggregates of abrasive material in the form of hollow spheres. As these
spheres break down in use, fresh cutting grains are exposed; this maintains cut-rate and keeps power low (44).
Manufacture of Coated Abrasives. In the manufacture of coated abrasives, the first step is called the making process. A smooth film of
adhesive, either hide glue, phenolic resin, or synthetic varnish, or a combination of one of these and a mineral filler, is applied to the backing in a thickness
dependent on the size of grit to be applied. Each adhesive has advantages and disadvantages (see Adhesives): hide glue has high initial strength but
becomes soft in water and gummy in high humidity; phenolic resin is good for severe operations and where water resistance is required; varnish is limited
to paper production for wet sanding operations.
In the second step, the "make coat" of abrasive grit is deposited on the coated backing either mechanically or electrostatically. Electrostatic
deposition is particularly useful for coarse grit paper and cloth products because it gives a faster-cutting product. Each grain is drawn electrostatically to the
backing surface, the flat side to the backing and peak side up. Grit sizes range from 12 to 600, and spacing may be close (close-packed) or open (sparsely
populated). Although close coating is most often employed, open coating is used in applications on gummy materials that would clog close-spaced grits.
Open coatings cover only 50 to 70% of the backing with abrasive grit.
After drying, a second coating called the "size coat," usually the same composition as the first coat, is applied; this serves to anchor the abrasive
Kirk-Othmer Encyclopedia of Chemical Technology (4th Edition)
13
ABRASIVES
Voll
grits. Drying completes the operation and the product is then wound into large rolls and stored for later conversion. Resin-bonded products may require
additional curing at elevated temperatures in roll form. If loading or clogging is anticipated, a coating of antistick stearate can be applied over the abrasive
coating.
Further finishing treatment is required to convert the large rolls to consumer products such as belts, disks, and sheets. The first such operation is
usually "flexing," a controlled cracking of the adhesive layers to promote flexibility in the final product. Items such as garnet and SiC finishing papers do
not require flexing, but the majority of paper and cloth products are at least single-flexed by being pulled at a 90° angle over a steel bar. If more flexibility is
desired, the product may be flexed a second or third time and at different angles.
Coated abrasives are supplied in widths ranging from 3.175 mm to 2.2 m in standard 45.7-m rolls. They are also formed into sheets, disks, and
molded coils or rolls. Belts, regularly supplied in the widths mentioned, have been made up to 3 m wide.
Coated Abrasive Sales. There has been a steady rise in the sale of coated abrasives in the United States: in 1938 sales were about $12 million;
in 1988 sales exceeded $700 million. World sales of coated abrasives for 1988 were estimated at over $2 billion.
Bonded Abrasives
Grinding wheels are by far the most important bonded abrasive product both in production volume and utility. They are produced in grit sizes ranging
from 4, for steel mill snagging wheels, to 1200, for polishing the surface of rotogravure rolls. Wheel sizes vary in diameter from tiny mounted wheels for
internal bore grinding to 1.83-m wheels for cutting off steel billets. Bonded shapes other than wheels, such as segments, cylinders, blocks, and honing
stones, are also widely used.
Marking System. Grinding wheels and other bonded abrasive products are specified by a standard marking system which is used throughout
most of the world. This system allows the user to recognize the type of abrasive, the size and shaping of the abrasive grit, and the relative amount and type
of bonding material. The individual symbols chosen by each manufacturer may vary, but the relative position for each item in the marking system is
standard, as shown in Figure 3.
STANDARD MARKING SYSTEM CHART
Sequence 1 2
Prefix Abrasive Grain
type size
3 4
Grade Structure
Silicon carbide—C
Вогагоп—В
Coarse
10
12
14
16
20
24
Medium
30
36
46
54
60
36
MANUFACTURER'S
SYMBOL, INDICATES
EXACT KIND OF
ABRASIVE
(OPTIONAL)
Fine
Very
fine
Aluminum
oxide—A
70
80
90
100
120
150
180
220
240
280
320
400
500
600
5 6
Bond Manufacturer's
type racord
14
A3
2
3
4
5
6
7
8
MANUFACTURER'S
PRIVATE
MARKING TO
IDENTIFY
WHEEL
V—Vitrified
S—Silicate
R—Rubber
RF—Rubber
reinforced
B—Resinoid
BF—Resinoid
reinforced
E—Shellac
O—Oxychloride
Dense! to open
9
10
11
12
13
14
15
Etc
Zirconia
alumina—ZA
Diamond—D
Soft Medium Hard
ABCDEFGH
I J К L MN
OPQRSTUVW X Y Z
Grade Scale
Fig. 3. Standard wheel markings recommended and approved by the Standards Committee of The Grinding Wheel Institute.
Gram Size. The surface finish, or degree of roughness, produced by a grinding wheel on the workpiece being ground is roughly proportional to
the size of abrasive grains in the wheel.
Grade. The grade of a bonded abrasive product is represented alphabetically with A being the softest acting (least bond) and Z being the hardest
(most bond).
Structure. The structure designation may or may not be given. It is numeric: 0 represents the closest possible packing of abrasive grits, and
ascending numbers correspond to incrementally less abrasive per unit volume of wheel (wider spaced grits).
Bond Type. Most bonded abrasive products are produced with either a vitreous (glass or ceramic) or a resinoid (usually phenolic resin) bond.
Bonding agents such as rubber, shellac, sodium silicate, magnesium oxychloride, or metal are used for special applications.
Ceramic (Vitrified). The first successful vitrified-bonded grinding wheels were produced in 1869 by Sven Pulson in the Worcester,
Massachusetts, pottery shop of Franklin P. Norton. In 1884 the business was sold to a group founding the Norton Company, which today is the wodd's
largest producer of abrasive products. For many years alow melting slip clay was the leading vitreous bond. Natural variations in slip clay led to the
development of bonds of more controllable composition: glass for aluminum oxide wheels and porcelain for grinding wheels containing the more reactive
silicon carbide abrasive. Firing temperatures for vitreous bonded wheels vary widely, but they are commonly in the pyrometric cone-12 range (about
1250°C).
Resin (Resinoid). The resinoid bond, originally called Bakelite, was named for its inventor, Leo Baekeland (see Phenolic resins). Baekeland's
original patent was issued in 1909, but it was not until the 1920s that this type of bonding was perfected for use in abrasives. The resin consists basically of
phenol and formaldehyde. It is thermosetting in nature, making it particulady suitable for tough grinding and cutting-off operations at high speeds. Resin
bonds cure at temperatures of 150 to 200°C. Thus there are no problems with grain reactivity and fiberglass or metal reinforcements may be molded in to
make a much safer product for high speed grinding. Additionally, this low processing temperature allows the use of inert fillers to strengthen the bonded
product, or of "active" fillers to increase the efficiency of grinding. Active fillers include such materials as cryolite, pyrites, potassium fluoroborate, sodium
and potassium chloride, zinc sulfide, antimony sulfide, and tin powder. Such materials, alone or in combination, aid grinding by acting as extreme pressure
lubricants or as reactants for the metal being ground; this prevents rewelding of the chips being removed. Lead and lead compound fillers are still used in
Europe for some cut-off wheels (special marking required) but are not used in the United States for health reasons.
Resinoid-bonded wheels find wide use in heavy-duty snagging operations where large amounts of metal must be removed quickly, in cutting-off
operations, portable disk grinding (as for weld-beads), roll grinding, and vertical spindle disk grinding.
Kirk-Othmer Encyclopedia of Chemical Technology (4th Edition)
14
ABRASIVES
Voll
Rubber. Both natural and synthetic rubber are used as bonding agents for abrasive wheels. Rubber-bond wheels are ideal for thin cut-off and
slicing wheels and centerless grinding feed wheels. They are more flexible and more water-resistant than resinoid wheels.
In manufacture, the abrasive grain is mixed with crude rubber, sulfur, and other ingredients for curing, then passed through calender rolls to
produce a sheet of desired thickness. The wheels are stamped from this sheet and heated under pressure to vulcanize the rubber.
Shellac. Shellac wheels are limited to a few applications where extreme coolness of cut is required and wheel life is immaterial. They are
produced by mixing shellac [9000-59-3] and abrasive grain in a heated mixer, then rolling or shaping to the desired configuration.
Silicate. Once important, silicate-bonded wheels have faded almost to oblivion; increasing wheel speeds have made this inherendy weak bond
obsolete. Some wheels are produced, however, for old grinding equipment still in existence.
Magnesium Oxychloride. A mixture of abrasive grains, MgO, water, and MgCl2 placed in an appropriate mold will cold-set to form a
grinding wheel that is then cured for a long period of time in a moist atmosphere. This type of bond finds some use in disk grinding applications and
cutlery grinding. Like silicate wheels, however, these have been largely replaced by soft-acting resinoid bonds.
Methods of Manufacture
Bonded abrasive products are made as wheels, disks, cylinders, sticks, blocks, and segments, all of which are defined 1пЛ£А-В74.2-1974, "USA Standard
Specifications for Shapes and Sizes of Grinding Wheels." This bulletin is sponsored by the Grinding Wheel Institute; it is obtainable from most wheel
manufacturers.
The first step in the manufacture of both resin- and ceramic-bonded abrasives is the wetting of a weighed quantity of abrasive grain with a liquid
pick-up agent. This agent is usually water or a glue solution for ceramics and liquid resin or furfural for resins. A weighed quantity of the bonding material
is then mixed with the wetted grain until the bond is uniformly coated onto the abrasive. A weighed portion of this mixture is leveled into a mold and
pressed to a predetermined bulk density. All ceramic-bonded wheels are pressed cold, but some resin-bonded wheels are pressed hot to achieve almost
zero porosity. After pressing, the wheel has the calculated volume of abrasive, bond, and pores corresponding to the grade and structure desired.
Pressed wheels are heat-treated to fuse the ceramic bond or cure the resin bond. Ceramic-bonded wheels are fired to about 1250°C in continuous
tunnel or periodic kilns, and resin-bonded ones are baked in periodic ovens at 175 to 200°C. After firing or baking, the wheels are checked for proper
dimension, density, and modulus of elasticity, and sometimes for sandblast resistance to assure proper grade. These slightly oversize wheels are then
finished, ie, machined to final size. To achieve desired thickness, the wheel sides are rubbed under heavy pressure on large rotating steel tables charged with
steel shot. Diameter reduction is accomplished using rotating conical steel cutters mounted in a lathe post holder. Holes may be trued using conical cutters
or diamond tools but many times they are simply bushed with a plastic, lead, or sulfur compound by pouring or injection molding.
After finishing, the wheels are again checked for dimension and carefully balanced. All wheels over 15 cm in diameter are tested at rotation speeds
higher than their final operating speeds. Test and operating speeds, specification, and balance points for large wheels are marked on the wheel itself or on
wheel blotters. Blotters are thin disks of paper or fiber placed on the sides of wheels to equalize the clamping pressure of mounting flanges on a grinding
machine. Testing speeds and maximum safe operating speeds for the various sizes and types of wheels are given in "ANSI Safety Code for the Use, Care,
and Protection of Abrasive Wheels" (ALNTT B7.1-1978] This also maybe obtained from most wheel manufacturers. Both users and manufacturers are
required to adhere to this code to assure the personal safety of the grinding operator.
Special Forms of Bonded Abrasives
There are many specialized forms and uses of bonded abrasives, a detailed discussion of which is found in reference 45.
Honing and Superfinishing. Honing and superfinish stones are produced from large vitrified-bonded abrasive blocks that are diamond
sawed to smaller rectangular pieces suitable for mounting in metal or plastic holders. Honing stones, used to true engine and hydraulic cylinders, can vary in
grit size from 36 (0.55 mm) to 600 (8 pm); superfinish stones, used to polish the external diameters of machine and automotive parts, vary in grit size from
600 to 1200 (3 pm). Both types of stones are quite soft; steel ball indentation hardness and density are often used as a quality control to measure grade.
Pulpstone Wheels. Grinding wheels play an important role in the production of paper pulp (qv). Massive pulpstone wheels are made from
vitrified abrasive segments, bolted and cemented together around a reinforced concrete central body. They may be up to 1.80 m in diameter and have a
breadth of 1.70 m. In operation, debarked wood logs are fed into a machine and forced against the rotating pulpstone, which shreds the wood into fibers
under a torrent of water. The ground fibers are then screened and passed through subsequent operations to produce various types of paper.
Crush-Form Grinding Wheels. In crush-form grinding, a rotating, contoured crushing wheel is forced into the face of a revolving vitrified
wheel, crushing the face to the exact contour needed on the metal object to be ground. The contoured wheel is then placed in production and when wear
or dulling occurs, the face is again crushed to regain proper contour. Many parts formerly turned with metal-cutting tools and then surface ground are now
shaped and surface finished in one pass of a crush-formed wheel.
Creep Feed Wheels. Abrasive machining in which the grinding wheel does not merely finish the surface of a machine part but actually forms
it by removing a significant amount of metal is a relatively new grinding procedure called creep feed grinding. In this process, a shape is generated in the
face of an open-structure vitrified grinding wheel by diamond tooling or crush-form roller. The profiled wheel is then fed into the metal to be ground in a
deep cut, ranging from 1 to 10 mm, at a very slow rate under a flood of coolant. In normal grinding, cuts are shallow, from 0.025 to 0.13 mm, and formed
at a fast travel rate. Creep feed grinding finds its greatest use in the aerospace industry where hard-to-grind, heat-resistant alloy parts must be ground
without surface damage. The intricate "Christmas tree" shape at the base of a turbine blade can be ground in one pass using this process and there is less
wheel wear, better retention of form, and higher overall productivity than with other shaping methods. Reference 46 provides a complete treatment of the
creep feed grinding process.
Superabrasive Wheels
Diamond Wheels. Synthetic diamond has almost entirely replaced natural diamond in diamond grinding wheels except for the coarsest grit
sizes (4). Diamond grits, ranging from 16 to 1200, are embedded in resin, vitreous, or metal bonds in a thin rim on the periphery of the wheel body, which
may be of metal-filled plastic, steel, ceramic, or bronze. Both resin- and ceramic-bonded diamond wheels are widely used to shape and sharpen carbide
tooling and all kinds of ceramics. New heat-resistant, expensive resins, such as polyimides, are widely used in superabrasive bonded products to give
exceptional life and productivity. The majority of resin-bonded diamond wheels are produced using diamond grits that have been plated or coated with a
refractory metal such as nickel to provide increased resistance to pull-out and to serve as a heat sink in grinding.
Diamond wheel specifications show diamond concentration in the grinding rim: a concentration of 100 equals 25 vol % diamond. Most wheels have
diamond concentrations in the range of 50 to 200 and selection depends on use. Lower concentrations work best on wide contact surfaces; higher
concentrations work best on narrow edge widths (47).
The construction and quarrying industries make wide use of metal-bonded diamond cut-off wheels for road work, including expansion joints,
surface planning, and antiskid slotting, and for production of dimension stone of all kinds. Diamond wheels are not recommended for grinding or cutting
steel except for certain wear-resistant, high carbon, high vanadium content steels that contain hard vanadium carbide particles. Even for these steels, a
cubic boron nitride wheel is usually a better choice (48).
Cubic Boron Nitride (CBN) Wheels. Bonded CBN wheels were introduced to the world market in 1969 and initial reception was poor:
these wheels were even more expensive than diamond wheels, they were extremely difficult to true and dress, and they had not found suitable grinding
applications. Initially CBN was tried on such typical diamond applications as carbides and ceramics with very limited success. When it was tried on steel,
however, it was phenomenally successful. CBN's extremely low wheel wear and its ability to stay sharp lends itself to computer-aided manufacturing
(CAM) (see Computer-aided design and manufacturing (cad/cam)). Japanese engineers, especially, were quick to realize the production advantages in tool
grinding, bearings, and auto engine parts. By 1986 Japan consumed over 5 million carats (about one-third of the world production) of CBN (49). Like
diamond grit, most CBN intended for resin-bonded applications is coated with metal for increased grain retention.
Kirk-Othmer Encyclopedia of Chemical Technology (4th Edition)
15
ABRASIVES
Voll
Grinding Fluids
Grinding fluids or coolants are fluids employed in grinding to cool the work being ground, to act as a lubricant, and to act as a grinding aid. Water is still
the best Equid for removing heat from a workpiece but it has no lubricating properties. Soluble oil coolants in which petroleum oils are emulsified in water
have been developed to impart some lubricity along with rust-preventive properties. These coolants must be carefully controlled to prevent health and
dermatitis problems from bacterial growth and to avoid contamination with leaking "tramp" hydraulic oil. It should be noted that the wear rate of
aluminum oxide wheels is much higher when water or water-containing coolants are used than when the same wheel is used dry. Although this has been
attributed to the formation of iron spinel during the grinding process (50), the same effect has been observed in grinding iron-free refractory alloys and
may be attributed to the formation of aluminum hydrate at the cutting tip of the abrasive grains, where temperatures and pressures are extremely high. The
soft hydrate layer is removed on each pass through the work. This hypothesis is supported by the fact that dry and wet grinding G-ratios (volume of steel
removed/volume of wheel wear) are more nearly equal in vertical spindle surface grinding, where each grit enters the work and remains buried for a long
distance (protected from reaction with water) as opposed to horizontal spindle grinding, where cut-path is very short and reaction can occur at each wheel
revolution.
The highest G-ratios are obtained when grinding with straight oil coolants. Such oils reduce power, increase maximum depth of cut, and produce
smoother finishes. Disadvantages include inability to remove heat from the work, oil mist in the work area, fire hazard, and tendency to hold grinding
swarf (fine metal chips and abrasive particles produced in the grinding process) in suspension. Reference 51 is an excellent survey article for grinding
fluids.
Loose Abrasives
In addition to their use in bonded and coated products, both natural and manufactured abrasive grains are used loose in such operations as polishing,
buffing, lapping, pressure blasting, and barrel finishing. All of these operations are characterized by very low metal removal rates and are used to improve
the surface quality of the workpiece.
Jet Cutting. High pressure jet cutting with abrasive grit can be used on metals to produce bum-free cuts with no thermal or mechanical
distortion. It is also effective on ceramics and metal-ceramic composites (52). The speed with which jet cuts can be made is illustrated by a report (53) that
a suspension of 60-grit garnet in water forced through a tungsten carbide orifice pierced an armor plate 50 mm thick and cut a slot 254 mm long in 10 min
total time. Jet cutting will be even more effective when improved nozzle materials which permit the economical use of harder abrasives such as aluminum
oxide are developed (54).
Health and Safety
Except for silica and natural abrasives containing free silica, the abrasive materials used today are classified by NIOSH as nuisance dust materials and have
relatively high permissable dust levels (55). The OSHA TWA allowable total dust level for aluminum oxide, silicon carbide, boron carbide, ceria, and other
nuisance dusts is 10 mg/m3. Silica, in contrast, is quite toxic as a respirable dust: for cristobalite [14464-46-1] and tridymite [15468-32-3] the allowable TWA
level drops to 0.05 mg/m3 and the TWA for quartz [14808-60-7] is set at 0.1 mg/m3. Any abrasive that contains free silica in excess of 1% should be
treated as a potential health hazard if it is in the form of respirable dust. Dust masks are required for those exposed to such materials (see Industrial
hygene).
Economic Aspects
The world's leading manufacturers of abrasives and their locations are presented byproduct category and order of sales volume:
Abrasives as a Whole: Norton Company, U.S.; Washington Mills, U.S.; Treibacher, Austria; Pechiney, France; ESK, Germany; and Exolon-ESK, U.S.;
Superabrasives (Synthetic Diamond and CBN): General Electric, U.S.; De Beers, UK; and Tomei, Japan;
Coated Abrasives: 3M Corporation, U.S.; Norton Company, U.S.; Hermes, Germany; SIA, Switzerland; and VSM, Germany;
Bonded Abrasives: Norton Company, U.S.; Tyrolit, Austria; Noritake, Japan; American Industries, U.S.; and Naxos Union, Germany.
The abrasive industry is highly competitive and many small companies worldwide successfully compete by specializing in a particular segment of the
business, eg, disk wheels, mounted points, and rubber wheels. Costs in the fused abrasive industry are primarily in materials and electric power. Thus
manufacturers seek out plant sites having the lowest power costs. Costs for coated abrasive manufacturers are capital and labor intensive and they seek out
sources of low cost labor.
In the long term, the bonded abrasive industry for precision grinding will be impacted by the superior performance of CBN and sol—gel abrasives.
In Japan, MITI records show that precision-bonded abrasives increased only 0.47% from 1985 to 1989 but CBN usage in the same time period increased
18.24%.
BIBLIOGRAPHY
"Abrasives" in ECT 2nd ed., Vol. 1, pp. 22—43 by J. R. Gregor; in ECT 3rd ed., Vol. 1, pp. 26—52 by W. G. Pinkstone.
1. M. F. Collie, The Saga of the Abrasive Industry., Grinding Wheel Institute and Abrasive Grain Association, Cleveland, Ohio, 1951, p. 2.
2. R. S. Woodbury, Histoy of the Grinding Machine, The Technology Press, MIT, Cambridge, Mass., 1959, pp. 18—22.
3. S. Tolansky in J. Buds, ed., Science and Technology of Industrial Diamonds, Proceedings of the 1966 International Industrial Diamond Conference, Industrial
Diamonds Information Bureau, London, 1967, pp. 341—349.
4. G. T. Austin, "Abrasive Materials," in Minerals Yearbook 1987, Vol. 1, Metals andMinerals, U.S. Department of the Interior, 1987, pp. 71—84.
5. R. R. Ridgeway, A. H. Ballard, and B. L. Bailey, Trans. Electrochem. Soc. 63, 369 (1933).
6. С. E. Woodell, Trans. Electrochem. Soc. 68, 111—130 (1935).
7. L. Coes, fc., Abrasives, Springer-Vedag, New York, Vienna, 1971, p. 55.
8. P. D. St. Pierre, Conference on dtrahard Tool Materials, Carnegie-Mellon University, Pittsburgh, Pa., May 26,1970.
9. J. T. Czemuska and T. F. Page, Proc. Br. Ceram. Soc. 34, 145—156 (1984).
10. J. N. Plendl and P. J. Gielisse, Phys. Rev. 125, 828-832 (1962).
11. B. Lamy, Trib. Int. 17(1), 36-38 (1984).
12. "Procedure for Friability of Abrasive Grain," ANSI StandardB74.8-1987, American National Standards Institute, New York, 1987.
13. Ref. 7, pp. 152-153.
14. W. J. Sauer in M. C. Shaw, ed., New Developments in Grinding, Proceedings of the International Grinding Conference 1972, Carnegie Press, Carnegie-Mellon
University, Pittsburgh, Pa., 1972, pp. 391—411.
15. Ref. 7, pp. 155-156.
16. L. Coes, Jr., Ind. NEng. Chem. 47,2493 (1955).
17. R. H. Wentorf, Jr., 1986 Proceedings of the 24th Abrasive Engineering Society Conference, Abrasive Engineering Society, Pittsburgh, Pa., 1986, pp. 27—31.
18. 18. P. Harbin, Ind. Min. 49-73 (Nov. 1978).
19. H. F. G. Ueltz in M. C. Shaw, ed., New Developments in Grinding, Proceedings of the International Grinding Conference 1972, Carnegie Press,
Carnegie-Mellon University, Pittsburgh, Pa., 1972, pp. 1—52.
Kirk-Othmer Encyclopedia of Chemical Technology (4th Edition)
16
ABRASIVES
Voll
20.
21.
22.
23.
24.
25.
26.
27.
28.
29.
30.
31.
32.
33.
34.
35.
36.
37.
38.
39.
40.
41.
42.
43.
44.
45.
46.
47.
48.
49.
50.
51.
52.
53.
54.
55.
Mineral Industry Surveys (Fourth Quarter 1989), U.S. Department of Interior, Bureau of Mines, Washington, D.C., May 5, 1990.
U.S. Pat. 775,654 (Nov. 22,1904), A. C. Higgins (to Norton Company).
U.S. Pat. 2,003,867 (June 4,1935), R. R. Ridgeway (to Norton Company).
U.S. Pat. 3,079,243 (Feb. 26,1963), H. F. G. Ueltz (to Norton Company).
U.S. Pat. 3,387,957 (June 11, 1963), E. E. Howard (to Carborundum Company).
U.S. Pat. 3,183,071 (May 11, 1965), С. V. Rue, E. Fisher, and F. Heischman (to Wakefield Corporation and Electric Autolite Company).
U.S. Pat. 3,481,723 (Dec. 2,1969), S. S. Kistler and С. V. Rue (to ITT Corporation).
U.S. Pat. 4,314,827 (Feb. 1982), M. A. Leitheiser and co-workers (to 3M Corporation).
U.S. Pat. 4,623,364 (Nov. 18, 1986), T. E. Cottringer, R. H. van de Merwe, and R. Bauer (to Norton Company).
E. J. Kubel, Jr.,M5M№»'.f 4, 14 (Oct. 1989).
U.S. Pat. 4,744,802 (May 17,1988), M. G. Schwable (to 3M Corporation).
U.S. Pat. 4,770,671 (Sep. 13,1988), L. D. Monroe and W. P. Wood (to 3M Corporation).
U.S. Pat. 4,881,951 (Nov. 21,1989), W. P. Wood and co-workers (to 3M Corporation).
U.S. Pat. 4,543,107 (Sept. 24,1985), С. V. Rue (to Norton Company).
U.S. Pat. 3,893,826 (July 8, 1975), J. R. Quinan and J. E. Patchett (to Norton Company).
Ind. Mln., 45, 23 (1971).
Norton CBN Wheels, Form 4800 LPBXM 8—83, Company Bulletin, Norton Company, Worcester, Mass., p. 13.
H. Meyer, F. Klocke, and J. Sauren, 1986 Proceedings of the 24th Abrasive Engineering Society Conference, Abrasive Engineering Society, Pittsburgh, Pa.,
1986, pp. 62-92.
E. N. Masslow, Grundlagen der Theorie des Metallschleifens, Vedag Technik GmbH, Berlin, 1952, p. 42.
ANSI StandardB74.12-1982 (macro sizes) and ANSI S tandard B74.10-1977 (R1983) (micro sizes), American National Standards Institute, New
York, 1982 and 1977.
FEPA Standard42-GB-1984, British Abrasive Federation, London, 1984.
В. T. G. O'Carroll, 7W. DiamondRev. 4 129-131 (1973).
A Review ofDiamond Siring and Standards, IDA Bulletin, Industrial Diamond Association of America, Columbia, S.C., 1985.
R. G. Visser and R. C. Lokken, IFW65, 325-350 (1981).
U.S. Pat. 4,132,533 (Jan. 2, 1979), W. Lohmer and J. Schotten (to the Carborundum Company).
W. F. Schleicher, The Grinding Wheel, 3rd ed., The Grinding Wheel Institute, Cleveland, Ohio, 1976.
C. Andrew, T. D. Howes, and T. R. A. Pearce, Creep Feed Grinding, Industrial Press Inc., New York, 1985.
H. Reinhart in J. Buds, ed., Science and Technology of Industrial Diamonds, Proceedings of the 1966 International Industrial Diamond Conference, Industrial
Diamonds Information Bureau, London, 1967, pp. 341—349.
J. D. Bide in M. C. Shaw, ed., Nels' Developments in Grinding Proceedings of the International Grinding Conference 1972, Carnegie Press, Carnegie-Mellon
University, Pittsburgh, Pa., 1972, pp. 887—905.
T. Ishikawa, 1986 Proceedings of the 24th Abrasive Engineering Society Conference, Abrasive Engineering Society, Pittsburgh, Pa., 1986, pp. 32—51.
L. Coes, Jr., ref. 7, p. 158.
C. A. Sluhan, Eub. Eng, 352-374 (Oct. 1970).
G. Hamatani and M. Ramulu, PED (ASME) 35, 49—62 (1988).
J. G. Sylvia and T. J. Kim, 1985 Proceedings of the 23rd Abrasive Engineering Society Conference, Abrasive Engineering Society, Pittsburgh, Pa., 1985, pp.
83-90.
M. Hashish, Manuf. Rev. 2(2), 142—150 (June 1989).
Federal Register 52(12), 2418-2983 (Jan. 19, 1989).
Charles V. Rue
Norton Company
Kirk-Othmer Encyclopedia of Chemical Technology (4th Edition)
17
ABSORPTION
Vol 1
ABSORPTION
Absorption, or gas absorption, is a unit operation used in the chemical industry to separate gases by washing or scrubbing a gas mixture with a suitable
Equid. One or more of the constituents of the gas mixture dissolves or is absorbed in the Equid and can thus be removed from the mixture. In some
systems, this gaseous constituent forms a physical solution with the Equid or the solvent, and in other cases, it reacts with the Equid chemically.
The purpose of such scrubbing operations may be any of the following: gas purification (eg, removal of air pollutants from exhaust gases or
contaminants from gases that will be further processed), product recovery, or production of solutions of gases for various purposes. Several examples of
appEed absorption processes are shown in Table 1.
Table 1. Typical Commercial Gas Absorption Processes
Treated gas Absorbed gas, solute Solvent Function
coke oven gas ammonia water by-product recovery
coke oven gas benzene and toluene straw oil by-product recovery
reactor gases in manufacture of formaldehyde from methanol formaldehyde water product recovery
drying gases in cellulose acetate fiber production acetone water solvent recovery
refinery gases hydrogen sulfide alkaEne solutions pollutant removal
natural and refinery gases hydrogen sulfide solution of sodium 2,6- (and 2,7-) anthraquinonedisulfonate pollutant removal
products of combustion sulfur dioxide carbon dioxide water ethanolamines pollutant removal by-product recovery
wet well gas propane and butane kerosene gas separation
ammonia synthesis gas carbon monoxide ammoniacal cuprous chloride solution contaminant removal
roast gases sulfur dioxide water production of calcium sulfite solution for pulping
Gas absorption is usually carried out in vertical countercurrent columns as shown in Figure 1 The solvent is fed at the top of the absorber, whereas
the gas mixture enters from the bottom. The absorbed substance is washed out by the solvent and leaves the absorber at the bottom as a Equid solution.
The solvent is often recovered in a subsequent stripping or desorption operation. This second step is essentially the reverse of absorption and involves
countercurrent contacting of the Equid loaded with solute using an inert gas or water vapor. The absorber may be a packed column, plate tower, or simple
spray column, or a bubble column. The packed column is a shell either filled with randomly packed elements or having a regular soEd structure designed to
disperse the Equid and bring it and the rising gas into close contact. Dumped-type packing elements come in a great variety of shapes (Fig. 2a—f) and
construction materials, which are intended to create a large internal surface but a small pressure drop. Structured, or arranged packings may be made of
cormgated metal or plastic sheets providing a large number of regularly arranged channels (Fig. 2g), but a variety of other geometries exists. In plate towers,
Equid flows from plate to plate in cascade fashion and gases bubble through the flowing Equid at each plate through a multitude of disperses (eg, holes in a
sieve tray, sEts in a bubble-cap tray) or through a cascade of Equid as in a shower deck tray (see Distillation).
Fig. 1. Absorption column arrangement with a gas absorber A and a stripper S to recover solvent.
Kirk-Othmer Encyclopedia of Chemical Technology (4th Edition)
18
ABSORPTION
Voll
Raschig ring
(a)
Lessing ring
(b)
Berl saddle
Intalox saddle
Tellerette
(d) (e)
Pall ring
(f)
Fig. 2. Packing materials for packed columns, (a)—(f) Typical packing elements generally used for random packing; (g) example of structured packing.
(g) Courtesy of'SuI^erBros. S^4. Winterthur, Switzerland.
The advantages of packed columns include simple and, as long as the tower diameter is not too large, usually relatively cheaper construction. These
columns are preferred for corrosive gases because packing, but not plates, can be made from ceramic or plastic materials. Packed columns are also used in
vacuum applications because the pressure drop, especially for regularly structured packings, is usually less than through plate columns. Tray absorbers are
used in applications where tall columns are required, because tall, random-type packed towers are subject to channeling and maldistribution of the Equid
streams. Plate towers can be more easily cleaned. Plates are also preferred in applications having large heat effects since cooling coils are more easily
installed in plate towers and liquid can be withdrawn more easily from plates than from packings for external cooling. Bubble trays can also be designed for
large liquid holdup.
The fundamental physical principles underlying the process of gas absorption are the solubility of the absorbed gas and the rate of mass transfer.
Information on both must be available when sizing equipment for a given application. In addition to the fundamental design concepts based on solubility
and mass transfer, many practical details have to be considered during actual plant design and construction which may affect the performance of the
absorber significandy. These details have been described in reviews (1) and in some of the more comprehensive treatments of gas absorption and
absorbers (2-5) (see also Distillation; Heat exchange technology).
Gas Solubility
At equilibrium, a component of a gas in contact with a liquid has identical fugacities in both the gas and liquid phase. For ideal solutions Raoult's law
applies:
Ps
У A =
(1)
where jy is the mole fraction of A in the gas phase, P is the total pressure, P$ is the vapor pressure of pure A, and .\y is the mole fraction of A in the liquid.
For moderately soluble gases with relatively litde interaction between the gas and liquid molecules Henry's law is often applicable:
H
У A = ~jCXA
(2)
where H is Henry's constant. Usually H is dependent upon temperature, but relatively independent of pressure at moderate levels. In solutions containing
inorganic salts, H is also a function of the ionic strength. Henry's constants are tabulated for many of the common gases in water (6).
A more general way of expressing solubilities is through the vapor—liquid equilibrium constant m defined by
t/A = ™xa
(3)
The value of //?, also known as equilibrium /\ value, is widely employed to represent hydrocarbon vapor—liquid equilibria in absorption and distillation
Kirk-Othmer Encyclopedia of Chemical Technology (4th Edition)
19
ABSORPTION
Vol 1
calculations. When equation 1 or 2 is applicable at constant pressure and temperature (equivalent to constant m in eq. 3) a plot ofj' vs x for a given solute is
linear from the origin. In other cases, the y—x plot may be approximated by a linear relationship over limited regions. Generally, for nonideal solutions or
for nonisothermal conditions,jy is a curving function of x and must be determined from experimental data or more rigorous theoretical relationships. The
y—x plot, when applied to absorber design, is commonly called the equilibrium line.
Gas solubility has been treated extensively (7). Methods for the prediction of phase equilibria and actual solubility data have been given (8,9) and
correlations of the equilibrium lvalues of hydrocarbons have been developed and compiled (10). Several good sources for experimental information on
gas— and vapor—Equid equilibrium data of nonideal systems are also available (6,11,12).
Mass Transfer Concepts
Mass Transfer Coefficients and Driving Forces. In order to determine the size of the equipment necessary to absorb a given amount of
solvent per unit time, one must know not only the equilibrium solubility of the solute in the solvent, but also the rate at which the equilibrium is
established; ie, the rate at which the solute is transferred from the gas to the liquid phase must be determined. One of the first theoretical models describing
the process proposed an essentially stable gas—liquid interface (13). Large fluid motions are presumed to exist at a certain distance from this interface
distributing all material rapidly and equally in the bulk of the fluid so that no concentration gradients are developed. Closer to this interface, however, the
fluid motions are impaired and the slow process of molecular diffusion becomes more important as a mechanism of mass transfer. The rate-governing step
in gas absorption is therefore the transfer of solute through two thin gas and liquid films adjacent to the phase interface. Transfer of materials through the
interface itself is normally presumed to take place instantaneously so that equilibrium exists between these two films precisely at the interface. Although this
assumption has been confirmed in experiments utilizing many systems and different types of phase interface (14—18), interfacial resistances can develop in
some situations (19—24).
The resulting concentration profile is shown in Figure 3. With the passage of time in a nonflowing closed system, the profiles would become
straight horizontal lines as the bulk gas and bulk liquid reached equilibrium. In a flowing system, Figure 3 represents conditions at some countercurrent
flow point, eg, at a certain height in an absorption tower where, as gas and liquid pass each other, the bulk materials do not have sufficient contact time to
attain equilibrium. Solute is continuously transferred from the gas to the liquid and concentration gradients develop when this transfer proceeds at only a
finite rate.
Fig. 3. The two-film concept: jyA and x^ are the concentrations in the bulk of the phases; y _ and x^ are the actual interfacial concentrations at equilibrium;
Jk’A and .v’’A are the hypothetical equilibrium concentrations which would be in equilibrium with the bulk concentration of the other phase.
The experimentally observed rates of mass transfer are often proportional to the displacement from equilibrium and the rate equations for the gas
and liquid films are
Va = Mpa - Pai) = кар(.УА - Уа\)
(4)
N,
(5)
where t/A — yM and £Ai — xA are concentration driving forces, is the gas-phase mass transfer coefficient, and is the liquid-phase mass transfer
coefficient.
Mass transfer rates may also be expressed in terms of an overall gas-phase driving force by defining a hypothetical equilibrium mole fractiony*A as
the concentration which would be in equilibrium with the bulk liquid concentration (t/A = mxA):
(6)
The relationship of the overall gas-phase mass transfer coefficient to the individual film coefficients maybe found from equations 4 and 5, assuming a
straight equilibrium line:
na = кар(.УА - УА1) = къР~(УAi - У a)
and by comparison with equation 6,
1
1 mP
kG khP
0
Expressions similar to equations 6 and 7 may be derived in terms of an overall liquid-phase driving force. Equation 7 represents an addition of the
resistances to mass transfer in the gas and liquid films. The analogy of this process to the flow of electrical current through two resistances in series has
been analyzed (25).
A representation of the various concentrations and driving forces in ay—x diagram is shown in Figure 4. The point representing the interfacial
concentrations x^) must lie on the equilibrium curve since these concentrations are at equilibrium. The point representing the bulk concentrations (y
xA) maybe anywhere above the equilibrium line for absorption or below it for desorption. The slope of the tie line connecting the two points is given by
equations 4 and 5:
Kirk-Othmer Encyclopedia of Chemical Technology (4th Edition)
20
ABSORPTION
Vol 1
У A - УАл = къР
xa - xAi kap
(8)
In situations where the gas film resistance is predominant (gas film-controlled situation), UP is much smaller than and the tie line is very steep.y_
approachesjy* so that the overall gas-phase driving force and the gas-film driving force become approximately equal, whereas the liquid-film driving force
becomes negligible. From equation 7 it also follows that in such cases Aoa « kG . The reverse is true if the Equid film resistance is controlling. Since the
example depicted in Figure 4 involves a strongly curved equilibrium line, equation 7 is only valid if the slope of the dashed line between xA and x^ is
substituted for m. Overall mass transfer coefficients may vary considerably over a certain concentration range as a result of variations in m even if the
individual film constants stay essentially constant.
Fig. 4. The driving forces in the y—x diagram.
Film Theory. Many theories have been put forth to explain and correlate experimentally measured mass transfer coefficients. The classical
model has been the film theory (13,26) that proposes to approximate the real situation at the interface by hypothetical "effective" gas and liquid films. The
fluid is assumed to be essentially stagnant within these effective films making a sharp change to totally turbulent flow where the film is in contact with the
bulk of the fluid. As a result, mass is transferred through the effective films only by steady-state molecular diffusion and it is possible to compute the
concentration profile through the films by integrating Fick's law:
X- PAB dz
V)
where Ji is the flux of component A relative to the average molar flow of the whole mixture, is the diffusion coefficient of A in B, is the distance of
diffusion, and is the molar concentration of A at a given point in the film. The bulk concentrations are denoted y . .. and xAb in the following three
sections whereasjyA and .\y stand for the concentration at a particular point within the films.
Equimolar Counterdiffusion in Binary Cases. If the flux of A is balanced by an equal flux of В in the opposite direction (frequendy
encountered in binary distillation columns), there is no net flow through the film and IVA, like J"A, is directly given by Fick's law. In an ideal gas, where the
diffusivity can be shown to be independent of concentration, integration of Fick's law leads to a linear concentration profile through the film and to the
following expression where (P ' RT)jy is substituted for c^.
na = Dz^ (.Уаъ - VAi)
(10)
thus
(11)
where is labeled with a zero to indicate equimolar counterdiffusion and is the effective film thickness. This same treatment is usually adopted for
liquids, although the diffusion coefficients are customarily not completely independent of concentration. Substituting p IxA for t’_, the result is
>0 _ _£a
(12)
Equations 11 and 12 cannot be used to predict the mass transfer coefficients directly, because is usually not known. The theory, however, predicts a
linear dependence of the mass transfer coefficient on diffusivity.
Unidirectional Diffusion through a Stagnant Medium. An ideally simple gas absorption process involves diffusion of only one
component, either the inert gas or the solvent, through a nondiffusing medium. There exists a net flux of material through the film in this case, and
therefore the mixture as a whole is not at rest. The total flux of A is now the sum of the flux with respect to the average flow of the mixture, that is still
given by Fick's law of diffusion, plus the flux of A caused by the average bulk flow of the mixture itself:
NA = JA + Va^2Nj = y^NA
(13)
The derivation of this result may be found in various texts (27). Rearranging and integrating equation 13 yields
N^= zRT V (УАЪ ~ ^Ai)
УВМ
Kirk-Othmer Encyclopedia of Chemical Technology (4th Edition)
21
ABSORPTION
Vol 1
(14)
wherejyBM is the logarithmic mean of the stagnant gas concentration through the film:
= (! - Уаъ) - (!- г/Ai)
ln[(l-t/Ab)/(l-t/Ai)]
(15)
Therefore
у = dab
zo
(16)
For Equids,
(17)
where
= (1 - ^Ab) - (1 - ж Ai)
(18)
The values ofjyBM and xBM are near unity for dilute gases.
Multicomponent Diffusion. In multicomponent systems, the binary diffusion coefficient D^-q has to be replaced by an effective or mean
diffusivity D^. Although its rigorous computation from the binary coefficients is difficult, it may be estimated by one of several methods (27—29). Any
degree of counterdiffusion, including the two special cases "equimolar counterdiffusion" and "no counterdiffusion" treated above, may arise in
multicomponent gas absorption. The influence of bulk flow of material through the films is corrected for by the film factor concept (28). It is based on a
slightly different form of equation 13:
Va = Ja + Va^aNa
(19)
where
(20)
Applying the same derivation as for unidirectional diffusion through a stagnant medium, the results turn out to be
, = dab
° z:RTY{
(21)
(22)
where
у = (I-Ia^aJ - (1- *A^Ai)
f ~ ln(l- iA?/Ab)/(l- 1аУа1)
(23)
x = Ма^Аь) -(l-^A^Ai)
' ~ Hl-lA^Ab)/^- t^Ai)
(24)
Yf and are called the film factors. They are generalizedjyBM and xBM factors, respectively, and are reduced to them in the case of unidirectional diffusion
through a stagnant medium because tA = 1 in this case. The film factors Yf and correct the mass transfer coefficients for the effect of net flux through
the films. In situations having strong counterdiffusion giving rise to a net flow opposed to the diffusion of A, the film factor becomes larger than one and
therefore decreases the mass transfer coefficient and the flux of A. For weak or negative counterdiffusion producing a bulk flux parallel to the diffusion of
A, the film factor is smaller than unity and thus increases NA. In extreme situations, counterdiffusion may become large enough to reverse the direction of
transport of a given component and force it to diffuse against its own driving force. These situations are characterized by a negative film factor and hence a
negative kQ. If equimolar counterdiffusion prevails, tA becomes zero, the film factor is unity, irrespective of the concentration, and kG = kQG.
Rate Equations with Concentration-Independent Mass Transfer Coefficients. Except for equimolar counterdiffusion, the mass
transfer coefficients applicable to the various situations apparendy depend on concentration through thejyBM and Yf factors. Instead of the classical rate
equations 4 and 5, containing variable mass transfer coefficients, the rate of mass transfer can be expressed in terms of the constant coefficients for
equimolar counterdiffusion using the relationships
= k°G
(25)
— ^L^BM —
(26)
This leads to rate equations with constant mass transfer coefficients, whereas the effect of net transport through the film is reflected separately in thejyBM
and Y£ factors. For unidirectional mass transfer through a stagnant gas the rate equation becomes
Va = ^<з-Р(г/Аь ~ УAi)
Увм
(27)
For multicomponent diffusion,
Kirk-Othmer Encyclopedia of Chemical Technology (4th Edition)
22
ABSORPTION
Vol 1
Na — каР(.УАъ Уа\) v
(28)
Equation 28 and its liquid-phase equivalent are very general and valid in all situations. Similarly, the overall mass transfer coefficients may be made
independent of the effect of bulk flux through the films and thus nearly concentration independent for straight equilibrium lines:
Na = Коор(.Уаъ ~ Уа)~,
(29)
— Kqgp (Уаъ У a) Vi
(30)
where the logarithmic means injy*BM and Y*f must be taken between jyAb andjy*A.
Rate equations 28 and 30 combine the advantages of concentration-independent mass transfer coefficients, even in situations of multicomponent
diffusion, and a familiar mathematical form involving concentration driving forces. The main inconvenience is the use of an effective diffusivity which may
itself depend somewhat on the mixture composition and in certain cases even on the diffusion rates. This advantage can be eliminated by working with a
different form of the Maxwell-Stefan equation (30—32). One thus obtains a set of rate equations of an unconventional form having
concentration-independent mass transfer coefficients that are defined for each binary pair direcdy based on the Maxwell-Stefan diffusivities.
Other Models for Mass Transfer. In contrast to the film theory, other approaches assume that transfer of material does not occur by
steady-state diffusion. Rather there are large fluid motions which constancy bring fresh masses of bulk material into direct contact with the interface.
According to the penetration theory (33), diffusion proceeds from the interface into the particular element of fluid in contact with the interface. This is an
unsteady state, transient process where the rate decreases with time. After a while, the element is replaced by a fresh one brought to the interface by the
relative movements of gas and liquid, and the process is repeated. In order to evaluate IVA, a constant average contact time T for the individual fluid
elements is assumed (33). This leads to relations such as
If, on the other hand, it is assumed that contact times for the individual fluid elements vary at random, an exponential surface age distribution characterized
by a fractional rate of renewal j may be used (34). This approach is called surface renewal theory and results in
L
(32)
Neither the penetration nor the surface renewal theory can be used to predict mass transfer coefficients direcdy because T and j are not normally known.
Each suggests, however, that mass transfer coefficients should vary as the square root of the molecular diffusivity, as opposed to the first power suggested
by the film theory.
Another concept sometimes used as a basis for comparison and correlation of mass transfer data in columns is the Chilton-Colburn analogy (35).
This semi-empirical relationship was developed for correlating mass- and heat-transfer data in pipes and is based on the turbulent boundary layer model
and the close analogy between momentum and mass transfer. It must be considerably modified for gas-absorption columns, but it predicts that the mass
2
transfer coefficient varies with D raised to the “ power (4,36). A modem theory for surface rejuvenation has also been published and compared with earlier
models (37).
Absorption and Chemical Reaction. In instances where the solute gas is absorbed into a Equid or a solution where it is able to undergo
chemical reaction, the driving forces of absorption become far more complex. The solute not only diffuses through the liquid film at a rate determined by
the gradient of the concentration, but at the same time also reacts with the liquid at a rate determined by the concentrations of both the solute and the
solvent at the point of interest. Inclusion of a term for the chemical reaction in Fick's second law of diffusion, followed by integration of the expression,
allows the concentration profiles through the liquid film to be computed based on a particular mass transfer model. The calculations show that these
profiles are steeper and the rate of mass transfer higher than without chemical reaction. Thus the results are often expressed as an enhancement factor ф,
defined as the fractional increase of the liquid film mass transfer coefficient resulting from the chemical reaction (^L/The solutions that have been
developed in this manner based on the film, penetration, and surface renewal theories are quite similar for a given type of reaction (38,39). Solutions and
estimations of enhancement factors may be found in the literature (4,37—40).
Design of Packed Absorption Columns
Discussion of the concepts and procedures involved in designing packed gas absorption systems shall first be confined to simple gas absorption processes
without complications: isothermal absorption of a solute from a mixture containing an inert gas into a nonvolatile solvent without chemical reaction. Gas
and liquid are assumed to move through the packing in a plug-flow fashion. Deviations such as nonisothermal operation, multicomponent mass transfer
effects, and departure from plug flow are treated in later sections.
Standard Absorber Design Methods.
Operating Line. As a gas mixture travels up through a gas absorption tower, as shown in Figure 5, the solute A is transferred to the liquid
phase and thus gradually removed from the gas. The liquid accumulates solute on its way down through the column so x increases from the top to the
bottom of the column. The steady-state concentrations jy and x at any given point in the column are interrelated through a mass balance around either the
upper or lower part of the column (eq. 34), whereas the four concentrations in the streams entering and leaving the system are interrelated by the overall
material balance.
Kirk-Othmer Encyclopedia of Chemical Technology (4th Edition)
23
ABSORPTION
Vol 1
Fig. 5. Mass balance in gas absorption columns. The curved arrows indicate the travel path of the solute A. The upper broken curve delineates the envelope
for the material balance of equation 33.
Since the total gas and Equid flow rates per unit cross-sectional area vary throughout the tower (Fig. 5) rigorous material balances should be based
on the constant inert gas and solvent flow rates G'M and respectively, and expressed in terms of mole ratios Y and X. A balance around the upper
part of the tower yields
G'MY' + L'mX'2 = G'MYi + L'MX'
(33)
which may be rearranged to give
т'
V' _ M ( y' Y' । v'
У - “ AA,2 / + УА,2
(34)
where G'M> UM are in kg-mol/(h-m2) [lb-mol/(h-ft2)] and Y' = y/(l — y) and X' = x/(l — x). The overall material balance is obtained by substituting
Y' = У/ and X' = X[. For dilute gases the total molar gas and liquid flows may be assumed constant and a similar mass balance yields
У = - ^2 ) + У2
(35)
A plot of either equation 34 or 35 is called the operating line of the process as shown in Figure 6. As indicated by equation 35, the line for dilute gases is
straight, having a slope given by L^/GM. (This line is always straight when plotted in Y—X coordinates.) Together with the equilibrium line, the operating
line permits the evaluation of the driving forces for gas absorption along the column (Fig. 4). The farther apart the equilibrium and operating lines, the
larger the driving forces become and the faster absorption occurs, resulting in the need for a shorter column (Fig. 6).
Fig. 6. Operating lines for an absorption system: line A, high -L^/GM ratio; solid line, medium L^/GM ratio; line B, L^/GM ratio at theoretical minimum
Kirk-Othmer Encyclopedia of Chemical Technology (4th Edition)
24
ABSORPTION
Vol 1
necessary for the removal of the specified quantity of solute. Subscript 1 represents the bottom of tower, 2, the top of tower.
To place the operating line, the flows, composition of the entering gasj^, entering Equid x2, and desired degree of absorptionjy2, are usually
specified. The specification of the actual liquid rate used for a given gas flow (the E^/GM ratio) usually depends on an economic optimization because the
slope of the operating line may be seen to have a drastic effect on the driving force. For example, use of a very high Equid rate (line A in Fig. 6) results in a
short column and alow absorber cost, but at the expense of a high cost for solvent circulation and subsequent recovery of the solute from a relatively
dilute solution. On the other hand, a Equid rate near the theoretical minimum, which is the rate at which the operating line just touches the equiEbrium line
(line В in Fig. 6), requires a very tall tower because the driving force becomes very small at its bottom. Use of a Equid rate on the order of one and one-half
times the theoretical minimum is not unusual. In the absence of a detailed cost analysis, the PM/GM ratio is often specified at 1.4 times the slope of the
equiEbrium line (41).
Design Procedure. The packed height of the tower required to reduce the concentration of the solute in the gas stream from y . to an
acceptable residual level ofj^ таУ be calculated by combining point values of the mass transfer rate and a differential material balance for the absorbed
component. Referring to a sEce dh of the absorber (Fig. 5),
NAadh = -d(GMy) = -GMdy - ydGM
(36)
and
dGM = —NAadh
(37)
where a is the interfacial area present per unit volume of packing. Combining equations 36 and 37,
(38)
Substituting for IVA from equation 27 and integrating over the tower,
. _ ______fat dy
~ JУ, k°aaP (1 - у) (у - уг)
(39)
Equation 39 may be integrated numerically or graphically and its component terms evaluated at a series of points on the operating line, jy is found by
placing tie lines from each of these points; the slopes are given by equation 8. Thus equation 39 is a general expression determining the column height
required to effect a given reduction inj^.
Equation 39 can often be simplified by adopting the concept of a mass transfer unit. As explained in the film theory discussion eariier, the purpose
of selecting equation 27 as a rate equation is that UG is independent of concentration. This is also true for the G-^/$GaP term in equation 39. In many
practical instances, this expression is fairly independent of both pressure and GM: as GM increases through the tower, UG increases also, nearly
compensating for the variations in GM. Thus this term is often effectively constant and can be removed from the integral:
h — ( [V1 feM d-У
~ \kGaPJ t1 -У) (У- У\)
(Я
G^/kGciP has the dimension of length or height and is thus designated the gas-phase height of one transfer unit, H.-.. The integral is dimensionless and
indicates how many of these transfer units it takes to make up the whole tower. Consequendy, it is caked the number of gas-phase transfer units, NG.
Equation 40 may therefore be written as
h= (Ha){Na)
(41)
where
k%aP
(42)
and
Vi
У2
Увы dy
(1 ~ y)(y~ У\)
(43)
The same treatment for the Equid side yields
h= (X)(VL)
(44)
where
- _
L kl°-P
(45)
and
N = Г1 жвм dx
L G
(46)
A similar treatment is possible in terms of an overall gas-phase driving force by substituting equation 29 into equation 38:
k = (Hoa) (VOg)
(47)
Kirk-Othmer Encyclopedia of Chemical Technology (4th Edition)
25
ABSORPTION
Vol 1
where
~ KGGaP
(48)
and
Увм
(1 -y)ty- У*)
(49)
HOG and NqG are called the overall gas-phase height of a transfer unit and the number of overall gas-phase transfer units, respectively. In the case of a
straight equilibrium line, -K°OG is often nearly concentration-independent as explained earlier. In such cases, use of equation 47 is especially convenient
because NQG> as opposed to IVG, can be evaluated without solving for the interfacial concentrations. In all other cases, HOG must be retained under the
integral and its value calculated from PG and at different points of the equilibrium line as
fat т&М ЖВМ jr
^вм Увм
(50)
To use all of these equations, the heights of the transfer units or the mass transfer coefficients ^°G^ and must be known. Transfer data for packed
columns are often measured and reported direcdy in terms of HG and and correlated in this form against GM and LM.
Sometimes the height equivalent to a theoretical plate (HETP) is employed rather than HG and to characterize the performance of packed
towers. The number of heights equivalent to one theoretical plate required for a specified absorption job is equal to the number of theoretical plates,
It follows that
h = (HETP) (WTP)
(51)
which is similar in form to equation 47. HETP is a less fundamental variable than the heights of the transfer units, and it is more difficult to translate
HETPs from one situation to another. Only for linear operating and equilibrium lines can they be related analytically to PP_G as shown later by equation 81.
Simplified Design Procedures for Linear Operating and Equilibrium Lines.
Logarithmic-Mean Driving Force. As noted earlier, linear operating lines occur if all concentrations involved stay low. Where it is possible
to assume that the equilibrium line is linear, it can be shown that use of the logarithmic mean of the terminal driving forces is theoretically correct. When
the overall gas-film coefficient is used to express the rate of absorption, the calculation reduces to solution of the equation
= КоааРЦу- у*) av
(52)
where
/ ,ч _ (yi -y*i) - (У2 - У2)
y y*)/(y2-y*)]
(53)
In these cases, a quantitative significance can be given to the concept of a transfer unit. Because ffOG = GM /KGG aP, it follows from equations 52 and 47
that
Therefore, in this case, one transfer unit corresponds to the height of packing required to effect a composition change just equal to the average driving
force.
Number of Transfer Units. For relatively dilute systems the ratios involvingjBM,jy*BM, and 1 — у approach unity so that the computation of
HQG from equation 50 and -NqG from equation 49 may be simplified to
(54)
dy
У - У*
(55)
Equation 55 is a rigorous expression for the number of overall transfer units for equimolar counterdiffusion, in distillation columns, for instance.
For cases in which the equilibrium and operating lines may be assumed linear, having slopes L^/G,. and respectively, an algebraic expression for
the integral of equation 55 has been developed (41):
In
Vqg ~ Vt
mGM'
Pm ,
У1 - m^2
.У2 - mx2,
mGM~
Pm .
™GM
Pm
1 -
(56)
The required tower height may thus be easily calculated using equation 47, where HOG is given by equation 54 and -NqG by equation 56.
Rapid Approximate Design Procedure for Curved Operating and Equilibrium Lines. If the operating or the equilibrium line is
nonlinear, equation 56 is of litde use because mG^Iwill assume a range of values over the tower. The substitution of effective average values for m and
for LM/GM into equations 50 and 56 obviates lengthy graphical or numerical integrations and leads to a quick, approximate solution for the required tower
height (4).
The effective average values of m and LM/GM were determined in a computational study covering hundreds of hypothetical absorber designs for gas
streams containing up to 80 mol % of solute for recoveries from 81 to 99.9%. By numerical integration, precise values were obtained for -NqG and N^. By
solving equation 56 numerically for each of the design cases, average values of the slope of the equilibrium line m and average flow ratios LM /&М ~
were found which gave the same when substituted into equation 56 as the graphical or numerical integration.
It was found that the effective average LM/GM ratio, could be correlated satisfactorily as a function of the terminal values 1Ц and JL, of the
Kirk-Othmer Encyclopedia of Chemical Technology (4th Edition)
26
ABSORPTION
Vol 1
change in the mole fraction of the absorbed component over the tower, and of the fractional approach to equilibriumr'.y. between the concentrated gas
entering the tower and the Equid leaving. Figure 7 shows the resulting correlation for cases with LM /GM > 1. No correlation was obtained when this ratio
was less than unity. The effective average slope of the equilibrium line, was correlated as a function of the initial slope of the slope of the cord
connecting r'y .v. and f'’ . x2, and of various other parameters as shown in Figure 8. Figure 8a applies when the equilibrium line is concave upward, ie,
mc > m2; and Figure 8b applies when the curvature is concave downward, mc < m2
Fig. 7. Design chart for estimation of average-flow ratio in absorption (4). R2 = LM / GM at gas oudet; R^ = GM /LM at gas inlet;
y2 = mole fraction in outlet gas; уг = mole fraction in inlet gas; Rav effective averageLM /GM; f = y\ jyx = fractional approach to equilibrium.
Fig. 8. Correlation of the effective average slopes m of the equilibrium line (4). (a) Equilibrium line curved concave upward; (b) equilibrium line curved
concave downward.
The recommended design procedure uses the values of (L^/G^)av and m from Figures 7 and 8 in equation 56 and yields a very good estimation of
A- despite the curvature of the operating and the equilibrium lines. This value differs from -NqG obtained by equation 49 because of the t/gM /(1 — y) term
in the latter equation. A convenient approach for purposes of approximate design is to define a correction term ANQG which can be added to equation 55:
Vqg = Vt + Vqg
(57)
For cases in whichjy*BM may be represented by an arithmetic mean (42),
л 1, 1 - У2
^NOa - 2^-^
(58)
Kirk-Othmer Encyclopedia of Chemical Technology (4th Edition)
27
ABSORPTION
Vol 1
Equation 58 is sufficiently accurate for most situations.
The average slopes and m from Figures 7 and 8 may also be used in equation 54 to compute -HOG although equation 50, with some suitable
averages ofjy*BM and лгвм, should be preferred. Use of point values at an effective average liquid concentration given by equation 59 is suggested.
\Kav )
(59)
In many situations, however, especially when m > 1, the results using the simpler equation 54 are virtually the same. The required tower height is finally
calculated by means of equation 47.
Multicomponent Mass Transfer Effects.
Equimolar Counterdiffusion. Just as unidirectional diffusion through stagnant films represents the situation in an ideally simple gas
absorption process, equimolar counterdiffusion prevails as another special case in ideal distillation columns. In this case, the total molar flows and GM
are constant, and the mass balance is given by equation 35. As shown earlier, nojyBM factors have to be included in the derivation and the height of the
packing is
(60)
-Nqg is given by IVT:
dy
У - У*
(61)
and -HqG is rigorously defined by equation 54. It must, however, be retained under the integral because m usually changes over the tower:
Jy2 9 9
(62)
General Situation. Both unidirectional diffusion through stagnant media and equimolar diffusion are idealizations that are usually violated in
real processes. In gas absorption, slight solvent evaporation may provide some counterdiffusion, and in distillation counterdiffusion may not be equimolar
for a number of reasons. This is especially true for multicomponent operation.
A simple treatment is still possible if it may be assumed that the flux of the component of interest A through the interface stays in a constant
proportion to the total molar transfer through the interface over the entire tower:
ЕЕ EE
— /д constant —
(63)
where Ap^ = total moles of component j absorbed over the tower. It will generally suffice to compute /д from preliminary estimates of and AgA, the
total mass transfer of each component over the tower.
The mass balance for A is best represented as a straight line in hypothetical coordinates Y° and A':
r°
тлО __ M ( y® y0 \ । тлО
JA — 'кА ^А,2) JA,2
(64)
where УА = t/A/(l — tA t/A), XA = xA/(1 — fAzA), ~ GM (1 — С Ул)> an<^ = (1 — C xa)- an<^ are always constant, whereas GM and
are not. For unimolecular diffusion through stagnant gas (tA = 1), Y° and A' reduce to Y and X and GQM and reduce to GY and EM; equation
64 then becomes equation 34. For equimolar counterdiffusion tA = 0, and the variables reduce tojy, x, GM, and L^, respectively, and equation 64 becomes
equation 35. Using the film factor concept and rate equation 28, the tower height may be computed by
h _ Г1 и E dy
T k (г/А-г/Ai)
(65)
is found as usual through tie lines of the slope
У a ~ Evt _ Yf
XA ~ ^Ai HL Xf
(66)
where
G°M (1 — A^a)
(67)
It maybe noted that the above system of equations is very general and encompasses both the usual equations given for gas absorption and distillation as
well as situations with any degree of counterdiffusion. The exact derivations maybe found elsewhere (43).
Nonisothermal Gas Absorption.
Nonvolatile Solvents. In practice, some gases tend to liberate such large amounts of heat when they are absorbed into a solvent that the
operation cannot be assumed to be isothermal, as has been done thus far. The resulting temperature variations over the tower will displace the equilibrium
line on ajy-лг diagram considerably because the solubility usually depends strongly on temperature. Thus nonisothermal operation affects column
performance drastically.
The principles outlined so far may be used to calculate the tower height as long as it is possible to estimate the temperature as a function of liquid
concentration. The classical basis for such an estimate is the assumption that the heat of solution manifests itself entirely in the liquid stream. It is possible
to relate the temperature increase experienced by the liquid flowing down through the tower to the concentration increase through a simple enthalpy
balance, equation 68, and thus correct the equilibrium line in aj’—v diagram for the heat of solution as shown in Figure 9.
гр гр | (ЖА — жA2) ЯО8
ЖдС^а + (1 — я:А) CqB
Kirk-Othmer Encyclopedia of Chemical Technology (4th Edition)
28
ABSORPTION
Vol 1
where TL is the liquid temperature, °C; 7. is the temperature of the entering liquid, °C; C is the molar heat capacity of component j; И is the integral
mean heat of solution of solute. For each pair of values for .\y and TL obtained from equation 68 it is possible to evaluate T0), the concentration in
equilibrium with the bulk of the Equid phase, and to place the equiEbrium line for the overall driving force (line A in Fig. 9). The line connecting the actual
interfacial concentrations 0/, x), line В on Figure 9, does not coincide with line A unless there is no Equid mass transfer resistance. However, because the
interfacial temperature T and the bulk Equid temperature TL usually are virtually equal, the equiEbrium concentration^' and the actual interfacial
concentration^/ are connected by an isotherm. Line В on Figure 9 may therefore be constructed as shown on the basis of line A, tie lines, and isothermal
equiEbrium lines. Line В may be used in conjunction with equation 39 to compute the required depth of packing.
Fig. 9. Simple model of adiabatic gas absorption. A, nonisothermal equiEbrium line for overall gas-phase driving force: y* = B, nonisothermal
equiEbrium line for individual gas-film driving force: t/j = /(^).
General Case. The simple adiabatic model just discussed often represents an oversimplification, since the real situation impEes a multitude of
heat effects: (7) The heat of solution tends to increase the temperature and thus to reduce the solubiEty. (2) In the case of a volatile solvent, partial solvent
evaporation absorbs some of the heat. (This effect is particularly important when using water, the cheapest solvent.) (J) Heat is transferred from the Equid
to the gas phase and vice versa. (4) Heat is transferred from both phase streams to the sh.eE of the column and from the sheU to the outside or to cooling
coEs.
In the general case, the temperature profile is determined simultaneously by aE of the four heat effects. The temperature influences the transfer of
mass and heat to a large extent by changing the solubiEties. This turns the simple gas absorption process into a very complex one and aE factors exhibit a
high degree of interaction. Computer algorithms for solving the problem rigorously have been developed (43,44). Figure 10 depicts typical profiles through
an adiabatic packed gas absorber from one of these algorithms (43,45). The calculations were carried out to solve a design example calling for the removal
of 90% of the acetone vapors present in an ah stream by absorption into water at an LM/GM ratio of 2.5. The ah stream contained 6 mol % acetone and
was saturated with water; the ambient temperature was 15°C.
Fraction of packing length
Fig. 10. Computed rigorous profiles through an adiabatic packed absorber during the absorption of acetone into water (43).
It is a typical feature of such calculations that the shapes of the Equid temperature profiles are highly irregular and often exhibit maxima within the
column. Such internal temperature maxima have been observed experimentaEy in plate and packed absorbers (44,46,47), and the measured temperature
profiles can be shown to agree closely with rigorous computations. The temperature maximum occurs in part because the heat of solution causes the
entering Equid stream to be heated. In the lower part of the tower, however, the heat of absorption is smaEer than the opposite heat effects of solvent
evaporation and heat transfer to the cold entering gas, so that the net effect is a cooling of the Equid phase. These transfers are reversed in the upper part
of the column, as is obvious from Figure 10: the gas gives up heat to the Equid, is cooled, and some of the solvent condenses from the gas stream into the
Equid stream, which is heated much faster in this part of the column than would be the case with the absorption alone.Figure 11 shows the rigorously
Kirk-Othmer Encyclopedia of Chemical Technology (4th Edition)
29
ABSORPTION
Vol 1
computed)’-x diagram for the same example. The temperature maximum within, the column produces a region of reduced solubility reflecting itself in the
typical bulge in the middle of the rigorous equilibrium line D. Since less acetone is absorbed in this part of the equipment, the gas concentration curve
exhibits a slight plateau (Fig. 10). This example may also serve as a demonstration of the difficulty in estimating the required depth of packing using
simplifying assumptions (Table 2). The isothermal approximation failed completely in this case and yielded 1.95 m of required packing as opposed to the
rigorously determined value of 3.63 m. Neglecting the temperature increase completely, this model assumes a solubility which is much too large, reflected
by equilibrium line A, and thus underestimates the rigorous result by 90%.
Fig. ll.jz-x diagram for adiabatic absorption of acetone into water. A, isothermal equilibrium line at TL2; B, equilibrium line for simple model of adiabatic
gas absorption, gas-film driving force; C, equilibrium line for simple model of adiabatic gas absorption, overall gas-phase driving force; C, equilibrium line
for simple model of adiabatic gas absorption, overall gas-phase driving force; D, rigorously computed equilibrium line, gas-film driving force (43).
The standard way to correct for the heat of solution approximately is the simple adiabatic model described on the preceding pages, which yields
equilibrium line В if the gas-phase driving force is used and line C on the basis of the overall driving force. This model, however, is a poor representation of
the conditions prevailing in the absorber, as demonstrated by the deviation of its equilibrium line В from the rigorous line D. The approximation
underestimates the true packing depth value of 3.63 m by more than one-third yielding 2.4 m (Table 2).
Table 2. Comparison of Results of Different Design Calculations’*
Method used Nog Required depth of packing, m
rigorous calculation 5.56 3.63
isothermal approximation 3.30 1.96
simple adiabatic model 4.01 2.38
suggested short-cut design procedure
graphical integration 5.51 3.60
approximate analytical integration 5.56 3.73
aRef. 45.
Rapid Approximate Design Procedure. For purposes of quick, approximate design of adiabatic packed gas absorbers an empirical
correlation of Equid temperature profiles has been developed (45) which may be used in a way similar to equation 68 to compute the necessary tower
height. The liquid temperature profiles were rigorously computed for over 90 hypothetical design cases covering wide variations in system properties and
operating conditions. The factor was varied from maximum values given by pinchpoints between the equilibrium and the operating lines down to
values where heat effects were subdued by the heat capacity of the high solvent flow rate. The apparent Henry's law constants were varied from 0.0 to
186.6 kPa (1400 mm Hg) and heats of solution up to 58.6 kJ/mol (14.0 kcal/mol) were taken into account. The investigation was limited to gas
concentrations below 15 mol % and to recovery fractions ranging from 90 to 99%. Water was considered to be the most important solvent, but variations
in solvent properties have been included to a certain extent.
It was found that the rigorously computed liquid temperature profiles could be satisfactorily represented as a function of liquid concentration by the
empirical equation
TL = TL12 + (TL11 - TL12) VN + 74.34(^074 - 4114)ДГтах
(69)
where
(70)
TL i is the temperature of the liquid leaving the tower and may be calculated from an enthalpy balance around the whole tower based on an estimate of the
temperature of the leaving gas, TG 2. It was found that the rigorous values of TL г could be predicted rapidly within a standard deviation of 1.2°C if the
following semiempirical equations were used for estimating TG 2:
Tap — TL,2 +
(71)
Kirk-Othmer Encyclopedia of Chemical Technology (4th Edition)
30
ABSORPTION
Voll
-^M,2-^OS ^M,2^vmB,2
-^M,2
^M,2^P,2 ^M,2^vU XK,2 ) (^гав/^^ь)2
(72)
where HG Q = GM Cp /hG ay the gas-phase height of a heat transfer unit. This quantity may be estimated from H.p for the solute using the Chilton-Colburn
analogy; HOG A = HGG for the solute; -Hos is the integral heat of solution for solute; H is the latent heat of pure solvent; 2 is the "solubility" of solvent,
у*в/л;., at the top of the tower; (dmp{ dT)2 is the temperature coefficient of /'ла at the top of the tower; and Cp2 and 6% are mean molar heat capacities of
gas and Equid at the top of the towers, respectively.
ДТ in equation 69 is related to the internal temperature maximum and may be estimated from specified variables using the correlations shown in
Figure 12. All other quantities in equations 69 and 70 are usually known from design specifications. If applied to values of the liquid concentration, equation
69 yields corresponding temperature values which may serve to evaluate the equiEbrium gas concentration ^' as a function of the Equid concentration. This
procedure yields a good approximation of the rigorous equiEbrium line accounting for all heat effects. The required number of transfer units and the tower
height may then be computed on the basis of a conventional x—y diagram by graphical integration.
To obviate the tedious graphical integration, a simplified design procedure was developed on the basis of Colburn's analytical solution, equation 56.
Substitution of the -L^/GM ratio presents no problem because this ratio stays fairly constant in the tower at the low concentrations for which Figure 12 is
vaEd. The difficulty arises with m because of the unexpected shapes of nonisothermal equiEbrium lines.
Fig. 12. Correlation of The three lines represent the best fit of a mathematical expression obtained by multidimensional nonlinear regression
techniques for 99, 95, and 90% recovery; the points are for 99% recovery. = mean molar heat capacity of Equid mixture, average over tower;
ДУ = yA 1 — yA 2 ; mA = slope of equilibrium line for solute, to be taken at Equid feed temperature; mB = slope of equilibrium line for solvent,
yB /(1 — ), to be taken at Equid feed temperature; yB /yB = saturation of solvent in feed gas; HQG Q « HG Q ; the height of a gas phase heat transfer
unit. (The HqqS are computed from equation 54; the individual heights of a transfer unit for the solvent and for heat may be estimated from _HG A and -HLA
using the Chilton-Colburn analogy. The m in equation 54 is to be evaluated at the temperature of the Equid feed.) Reprinted by permission (45).
The equiEbrium line, as approximated by the synthetically correlated temperature profile, is cut into two parts at its inflection point as shown in
Figure 13. In each part the equiEbrium curve is replaced by a straight line with a slope m which, upon substitution into equation 56, yields the same number
of transfer units as the graphical integration based on the curved equiEbrium line. These effective average slopes m were calculated for an expanded set of
weE over 100 hypothetical design cases by performing the integration numerically and solving for m. They were correlated using a multidimensional,
nonlinear regression analysis and the initial slopes and the slopes of the cord of the equiEbrium line in the respective section (Fig. 13). The resulting
correlation for the dilute section of thejy-лг diagram, where the equiEbrium is curved concave upward, is shown in Figure 14, whereas Figure 15 represents
the correlation for the concentrated section where the curvature is concave downward.
Kirk-Othmer Encyclopedia of Chemical Technology (4th Edition)
31
ABSORPTION
Vol 1
Fig. 13. Definition of effective average slopes of equilibrium line (45).
Fig. 14. Correlation of effective average slope m of equilibrium line (dilute part of absorber); equilibrium line concave upward. Y : gas mole fraction at
inflection point (45).
Kirk-Othmer Encyclopedia of Chemical Technology (4th Edition)
32
ABSORPTION
Vol 1
Fig. 15. Correlation of effective average slope m of nonisothermal equilibrium line (concentrated part of absorber); equilibrium line concave downward. The
subscript ip indicates the inflection point (45).
The recommended rapid approximate design procedure for adiabatic packed gas absorbers consists of the following steps: (7) After the problem is
fully specified, the temperature of the leaving product is estimated (eqs. 71, 72) using an enthalpy balance around the tower. (2) The maximum temperature
ДТ of the convex portion of the Equid temperature profile is estimated on the basis of Figure 12. (Steps 1 and 2 determine the estimated temperature
profile completely (eq. 69).) (J) A special correlation (Fig. 16) may then be used to find the locus of the inflection point on the equilibrium curve on they—v
diagram without trial and error. (4) The equation for the estimated temperature profile (eq. 69) is then used to find the temperature as well as the slope of
the equilibrium line at the inflection point. Based on this information, the effective average slopes for the two sections may be read from Figures 14 and 15,
and used in equation 56 to determine the necessary number of transfer units. The overall height of a transfer unit is evaluated for each section substituting
the values for m from Figures 14 and 15 into equation 54.
Fig. 16. Correlation of the liquid concentration at which the inflection point of the nonisothermal equilibrium occurs (45).
The total number of transfer units and the total required depth of packing are obtained by adding the respective values for the two sections. Table 2
compares this design procedure, the isothermal and the simple adiabatic approximations, and the rigorous result with respect to the design example,
discussed previously, and clearly demonstrates the superior accuracy of the procedure. No serious temperature bulge will develop if
(TL 2 — TL j )/ATmax > 4.3. The simple model of adiabatic gas absorption may then be used to determine the required tower height. Figure 14 may, of
course, be used also in this case together with equations 47, 54, and 56 to circumvent the graphical integration and obtain the result rapidly without
significant loss of accuracy.
Axial Dispersion Effects.
Effect of Axial Dispersion on Column Performance. Another assumption underlying standard design methods is that the gas and the
Equid phases move in plug-flow fashion through the column. In reaEty, considerable departure from this ideal flow assumption exists (4) and different fluid
Kirk-Othmer Encyclopedia of Chemical Technology (4th Edition)
33
ABSORPTION
Vol 1
particles travel through the packing at varying velocities. The impact of this effect, which is usually referred to as axial dispersion, on the concentration
profiles is demonstrated in Figure 17. The effect counteracts the countercurrent contacting scheme for which the column is designed and thus lowers the
driving forces throughout the packed bed. Neglect of axial dispersion results in an overestimation of the driving forces and in an underestimation of the
number of transfer units needed. It may therefore lead to an unsafe design.
z, distance
(a) Concentration distribution
(b) Operating diagram
Fig. 17. Effect of axial dispersion in both phases on solute distribution through countercurrent mass transfer equipment. A, piston or plug flow; B, axial
dispersion in both streams (diagrammatic). Reprinted with permission (4).
Determination of separation efficiencies from pilot-plant data is also affected by axial dispersion. Neglecting it yields high HG or values.
Literature data for this parameter have usually not been corrected for this effect.
The extent of axial dispersion occurring in a gas absorber can be determined by measuring the residence time distribution of both gas and liquid.
Based on classical flow models of axial dispersion, the result is usually expressed in terms of two Peclet numbers (Pe), one for each phase. Peclet numbers
tending towards infinity indicate near-ideal plug flow, whereas vanishing values of Pe indicate axial dispersion to such an extent that the phase begins to
become well back-mixed. When designing packed columns, the Peclet numbers are usually estimated from literature correlations (48—50). Correlations for
predicting Peclet numbers in large scale gas—liquid contactors are quite scarce, but contributions have been made (51—55). Some of the available data have
been described (4) and a review of published correlations for liquid-phase Peclet numbers is also available (55). Figure 18 reproduces some data (51).
L, kg/(m2,s)
Fig. 18. Peclet numbers in large scale gas—liquid contactors using 2.54-cm Bed saddles (-------) or 2.54 cm (----) or 5.08 cm (-----) Raschig rings (51).
Numbers on lines represent G values = gas flow in kg/(m2 -s); dp = nominal packing size; Uav = superficial velocity. To convert kg/(m2 -s) to lb/(h-ft2)
multiply by 737.5. Reprinted with permission (4).
When designing packed towers, axial dispersion can be accounted for by incorporating terms for axial dispersion of the solute into the differential
mass balance equation 36. The integration of the resulting differential equations is best effected by computer. Analytical solutions for cases having linear
equilibrium and operating lines have been developed (56,57). They are, however, not explicit for the design case and are of such enormous complexity that
application for design also requires a computer.
Kirk-Othmer Encyclopedia of Chemical Technology (4th Edition)
34
ABSORPTION
Vol 1
Rapid Approximate Design Procedure. Several simplified approximations to the rigorous solutions have been developed over the years
(57—60), but they all remain too complicated for practical use. A simple method proposed in 1989 (61,62) uses a correction factor accounting for the effect
of axial dispersion, which is defined as (57)
NTUap
correction factor =-------—
NTU
(73)
NTU is the "exterior apparent" overall gas-phase number of transfer units calculated neglecting axial dispersion simply on the basis of equation 56,
whereas NTU stands for the higher real number of transfer units (NqG) which is actually required under the influence of axial dispersion. The correction
factor ratio can be represented as a function of those parameters that are actually known at the outset of the calculation
NTUap
NTU
= /(NTUap,
mG\
~L~ )
, Pe^, l'e„
(74)
Equation 74 is shown graphically in Figure 19a for a given set of conditions. Curves such as these cannot be direcdy used for design, however, because the
Peclet number contains the tower height h as a characteristic dimension. Therefore, new Peclet numbers are defined containing -HOG as the characteristic
length. These relate to the conventional Pe as
Ренти = “FT
h
(75a)
it—
Vo
(75b)
(a)
(b)
Fig. 19. Correction factor for axial dispersion as a function of NTU . Solid lines are rigorous calculations; broken lines, approximate formulas according to
literature (61). (a) Numbers on lines represent PeH--- values; Pe^ = 20; mGM /LM = 0.8. (b) For design calculations. Numbers onlines represent PeH---
values; PeHTU y = 1; mGM/LM = 0.8.
The correction factor (NTU) /NTU as a function of PeHTU rather than Pe is shown in Figure 19b. The correction factors given in Figures 19a and
19b can roughly be estimated as
NTUan NTUan
dp и dp
NTU ~ ~ Pe^Pe^
S - 1 + Pep + ST’e,
(76)
Kirk-Othmer Encyclopedia of Chemical Technology (4th Edition)
35
ABSORPTION
Vol 1
NTUap________________Ренти,^Ре HTU,t____________
NTU Ренти 1?/Ренти ,x + Ренти,а + ,<’PeHTU,z
(77)
In these equations S denotes the stripping factor, mG^/L^. Equation 77 is only valid for a sufficiendy high number of transfer units so that the correction
factor becomes independent of NTU .
-Г ap
In the original study (61), NTU /NTU was calculated for thousands of hypothetical design cases as a function of both Pe and PeHTU. The results
were correlated and empirical expressions were given that can be evaluated on a handheld calculator, just as equations 76 and 77, but which approximate
the computer calculation much better, to within about ±5%.
The recommended rapid design procedure consists of the following steps: (7) The apparent A-G is calculated using equation 56. (2) The extent of
axial dispersion is estimated from literature correlations for each phase in terms of Pe numbers and transformed into PeHTU values. (J) The correction
factor NTUap/NTU is estimated on the basis of the correlation given in the literature (61). A reasonable, conservative estimate may also be obtained using
equation 77, provided NTUap > 5. When the apparent number of transfer units is divided by this correction factor, the value of A-G actually required
under the influence of axial dispersion is obtained. (4) The packed tower height is found by multiplying A/g by the true _HOG. In order to obtain values for
the latter, pilot-plant data has to be corrected for the influence of axial dispersion. This correction may be made in a manner similar to that described
above, but equation 76 would be used to estimate the correction factor rather than equation 77.
Experimental Mass Transfer Coefficients. Hundreds of papers have been published reporting mass transfer coefficients in packed
columns. For some simple systems which have been studied quite extensively, mass transfer data may be obtained direcdy from the literature (6). The
situation with respect to the prediction of mass transfer coefficients for new systems is still poor. Despite the wealth of experimental and theoretical
studies, no comprehensive theory has been developed, and most generalizations are based on empirical or semiempirical equations.
Liquid-Phase Transfer. It is difficult to measure transfer coefficients separately from the effective interfacial area; thus data is usually
correlated in a lumped form, eg, as k^a or as H^. These parameters are measured for the liquid film by absorption or desorption of sparingly soluble gases
such as O2 or CO2 in water. The liquid film resistance is completely controlling in such cases, and k^a may be estimated as К-О1а since « x* (Fig. 4). This
is a prerequisite because the interfacial concentrations would not be known otherwise and hence the driving force through the liquid film could not be
evaluated.
The resulting correlations fall into several categories. Some are essentially empirical in nature. Examples include (63)
(78)
The values of CC and n are given in Table 3; typical values for can be found in Table 4. The exponent of 0.5 on the Schmidt number (ft^/supports
the penetration theory. Further examples of empirical correlations provide partial experimental confirmation of equation 78 (3,64—68). The correlation
reflecting what is probably the most comprehensive experimental basis, the Monsanto Model, also falls in this category (68,69). It is based on 545
observations from 13 different sources and may be summarized as
/ 7 \ 0.15
HL = ф°я (об) SC°L5
(79)
The packing parameter ф (m) reflects the influence of the liquid flow rate as shown in Figure 20. С/ reflects the influence of the gas flow rate, staying at
unity below 50% of the flooding rate but beginning to decrease above this point. At 75% of the flooding velocity, = 0.6. ScL is the Schmidt number of
the Equid.
Table 3. Values of Constants for Equation 78
Packing Size, cm X b a n
Raschig rings 0.95 3120 550 0.46
1.3 1390 280 0.35
2.5 430 100 0.22
3.8 380 90 0.22
5.1 340 80 0.22
Bed saddles 1.3 685 150 0.28
2.5 780 170 0.28
3.8 730 160 0.28
Valid for units kg, s, m.
Valid for units lb, h, ft.
Table 4. Diffusion Coefficients for Dilute Solutions of Gases in Liquids at 20°C
Gas Liquid Dl, m2/s x 10-°
co2 water 1.78
ci2 water 1.61
H2 water 5.22
HC1 water 0.61
H2s water 1.64
n2 water 1.92
n2o water 1.75
NH3 water 1.83
°2 water 2.08
acetone water 1.61
benzene kerosene 1.41
Kirk-Othmer Encyclopedia of Chemical Technology (4th Edition)
36
ABSORPTION
Vol 1
0.1
0.05
0.01
0.005
0.1
0.05
0.01
0.005
0.1
0.05
0.01
0.005
0.1
0.05
0.01
0.005
100
Mass velocity, L, kg/(m2-s)
Fig. 20. Improved packing parameters ф for liquid mass transfer: (a) ceramic Rascliig rings; (b) metal Rascliig rings; (c) ceramic Bed saddles; (d) metal Pall
rings (69). Reprinted with permission (70).
Other correlations based partially on theoretical considerations but made to fit existing data also exist (71—75). A number of researchers have also
attempted to separate from a by measuring the latter, sometimes in terms of the wetted area (76—78). Finally, a number of correlations for the mass
transfer coefficient itself exist. These are based on a more fundamental theory of mass transfer in packed columns (79—82). Although certain predictions
were verified by experimental evidence, these models often cannot serve as design basis because the equations contain the interfacial area г? as an
independent variable.
Gas-Phase Transfer. The height of a gas-phase mass transfer unit, or k^a, is normally measured either by vaporization experiments of pure
liquids, in which no liquid mass transfer resistance exists, or using extremely soluble gases. In the latter case, m is so small that the liquid-film resistance in
equation 7 is negligible and the gas-film mass transfer coefficient can be observed as A// Л. a and 1/j ~ 1/*. The experiments are difficult because they
have to be carried out in very shallow beds. Otherwise, all of the highly soluble gas is absorbed and the driving force cannot be evaluated. The resulting end
effects are probably the main reason for the substantial disagreement of the published data, which have been reported to vary some threefold for the same
packing and flow rates (83). Furthermore, the effective interfacial areas seem to differ for absorption and vaporization (84). During the absorption
experiments, the many stagnant or semistagnant pockets of liquid which exist in a packing tend to become saturated and thus ineffective. This is not the
case in vaporization experiments where the total effective interfacial area consists of the surface area of moving liquid plus the semistagnant liquid pockets.
The correlation of based on the most extensive experimental basis is again the Monsanto Model (69):
(3.28d() m (/i/3.05) 1,3
Sc°a5
(80)
where d' is the lesser of 0.61 or column diameter, m; = (Ml/Mw)016; = (pJPw) 125 ; Л = (т,/0») °'8;Sca = Schmidt number of the gas. The
packing parameter \|/, in m, depends on the gas flow rate as shown in Figure 21. Values of the diffusivity of various solutes in air and typical Schmidt
numbers for use in equation 80 are found in Table 5. The exponents m and n adopt the values of 1.24 and 0.6, respectively, for rings as packing materials,
and 1.11 and 0.5, for saddles.
Kirk-Othmer Encyclopedia of Chemical Technology (4th Edition)
37
ABSORPTION
Vol 1
Fig. 21. Improved packing parameters \|7 for gas mass transfer: (a) ceramic Raschig rings; (b) metal Rashig rings; (c) ceramic Bed saddles; (d) metal Pall
rings (69). Reprinted with permission.
Table 5. Values of the Diffusion Coefficient DA and of M-G/T^ApG for Various Gases in Air at 0°C and at Atmospheric Pressure*1
Gas CAS Registry Number Da, m2/s x 10 5 Hg
Calculated Experiment PX
acetic acid [64-19-7] 1.05 1.26
acetone [67-64-1] 0.83 1.60
ammonia [766441-7] 1.62 2.17 0.61
benzene [7143-2] 0.72 0.78 1.71
bromobenzene [108-86-1] 0.67 1.71
butane [106-97-8] 0.75 1.77
я-butyl alcohol [71-36-3] 0.69 1.88
carbon dioxide [124-38-9] 1.19 1.39 0.96
carbon disulfide [75-15-0] 278.00 1.48
carbon tetrachloride [56-23-5] 0.61 2.13
chlorine [7782-50-5] 0.92 1.42
chlorobenzene [108-90-7] 0.61 2.13
chloropicrin [76-06-2] 0.61 2.13
2,2,-dichloroethyl sulfide (mustard gas) [505-60-2] 0.56 2.44
ethane [74-84-0] 1.08 1.22
ethyl acetate [141-78-6] 0.67 0.72 1.84
ethyl alcohol [64-17-5] 0.94 1.03 1.30
ethyl ether [60-29-7] 0.69 0.78 1.70
ethylene dibromide [106-934] 0.67 1.97
hydrogen [1333-74-0] 5.61 0.22
methane [74-82-8] 1.58 0.84
methyl acetate [79-20-9] 0.94 1.57
methyl alcohol [67-56-1] 1.22 1.33 1.00
naphthalene [91-20-3] 0.50 2.57
nitrogen [7727-37-9] 1.33 0.98
я-octane [111-65-9] 0.50 2.57
oxygen [778244-7] 1.64 1.78 0.74
pentane [109-66-0] 0.67 1.97
phosgene [7544-5] 0.81 1.65
propane [74-98-6] 0.89 1.51
я-propyl acetate [109-604] 0.67 0.67 1.97
я-propyl alcohol [71-23-8] 0.81 0.86 1.55
sulfur dioxide [7446-09-5] 1.03 1.28
toluene [108-88-3] 0.64 0.72 1.86
water [7732-18-5] 1.89 2.19 0.60
The value of pG/pG is that for pure air, 1.33 x 10 5 m2/s. Diffusion coefficients may be corrected for other conditions by assuming them proportional to
T23 and inversely proportional to P. The Schmidt numbers depend only weakly on temperature (113).
Another type of experiment to measure separately from other factors consists of saturating packings made from porous materials using a volatile
Equid and subsequendy drying it by passing a stream of inert gas through the packing (85—88). Since the surface of the packing is normally known in these
experiments, can be computed. AppEcation of these kinds of data to gas absorption design is difficult, however, because of the different, unknown
effective interfacial areas when two phases are flowing through the packing. A similar approach was used by evaporating naphthalene from a packing made
from this material (78,84). The mass transfer coefficient measured in this manner was then combined with k.-л! data (89) to determine the effective area,
which was found to be fairiy independent of gas rate up to the loading point. The data bank undedying the Monsanto Model and Eterature correlations for
and (78,84) have also been used (90) to develop a new correlation for packed distillation columns.
Height Equivalent to a Theoretical Plate. Provided both the equiEbrium and operating lines are straight, HETP values maybe estimated
by combining the _HG and JJL values predicted by the above correlations and by translating the resulting -HOG into HETP by combining equations 47, 51,
and 56 with equation 85, which is discussed under bubble tray absorption columns:
HETP =
\n(mGM/LM)
(mGM/Lu) — 1
Kirk-Othmer Encyclopedia of Chemical Technology (4th Edition)
38
ABSORPTION
Vol 1
(81)
HETP values obtained in this way have been compared to measured values in data banks (69) and statistical analysis reveals that the agreement is better
when equations 79 and 80 are used to predict FF and than with the other models tested. Even so, a design at 95% confidence level would require a
safety factor of 1.7 to account for scatter.
The situation is very much poorer for structured rather than random packings, in that hardly any data on FF and Hp have been published. Based on
a mechanistic model for mass transfer, a way to estimate HETP values for structured packings in distillation columns has been proposed (91), yet there is a
clear need for more experimental data in this area.
Capacity Limitations. Thus far the discussion has been confined to factors affecting the tower height required to perform a specific
absorption job. The necessary tower diameter, on the other hand, depends primarily on the total amount of gas and liquid that must be handled. At a given
set of flow rates, the diameter of the packing can only be decreased at the expense of a large pressure drop, which in turn generates higher operating costs
because more power is needed to blow the gas through the packing. The reason for this is the fact that handling a given total gas flow rate in a smaller
tower diameter increases the superficial velocity at which the gas has to be pushed through the packing.
The relationship between the pressure drop per unit of packed height and the superficial gas velocity given in terms of the gas flow rate is shown
schematically in Figure 22. In a dry packing, AP increases almost as the square of the gas velocity, which is in accord with the turbulent nature of the flow.
At low liquid flow rates, the curves are somewhat shifted upwards because the presence of liquid films restricts the free section available for gas flow and
thus increases the linear gas velocity somewhat. Because the liquid hold-up remains independent of G, the slope of the curve in this log-log plot remains
close to 2. At higher pressure drops, however, the upflowing gas impairs the downflow of liquid and excess liquid starts to accumulate in the packing,
thereby increasing the hold-up. In this operating region, called the loading zone, the increasing liquid hold-up restricts the free section available for the gas
flow further as G becomes larger. Hence the linear gas velocities increase faster than G and the power dependence of AP on G starts to rise above 2. The G
value at which the curve begins to deviate from the straight line has been defined as the loading point.
Fig. 22. Schematic representation of typical pressure drop as a function of superficial gas velocity, expressed in terms of G = pG na, in packed columns. O,
Dry packing; •, low liquid flow rate; H, higher liquid flow rate. The points do not correspond to actual experimental data, but represent examples.
If the tower diameter is made too small for a given total gas flow rate, that is, if and G are increased above a certain critical value, AP becomes so
great that the liquid cannot flow downward anymore over the packing, but is blown out the top of the packing. The vertical asymptotes on Figure 22
indicate the gas rates at which this condition, called flooding, occurs. This gas flow rate at flooding, GF, determines the theoretical minimum diameter at
which the tower is operable, and knowledge of it is therefore very important. Flooding rates have been correlated (92—94).
Both the pressure drop per unit length of packed tower and the gas flooding rate have been correlated for random packings as shown in Figure 23
(95). Such correlations enable predicting the gas flow rate G that will flood the packing at a given L/G ratio. In practice, the tower has to be operated at
flow rates considerably less than the flooding rates for safety reasons. It is generally accepted that 50 to 80% of the flooding flow rates can be permitted.
The curves plotted on Figure 23 thus also enable prediction of the pressure drop at any chosen operating value of G. The diameter of the column must
then be evaluated by comparing this value to the total quantity of gas that the tower is supposed to handle. The correlation shown in Figure 23 can be
applied to predict the hydraulic performance of many different packings owing to an adjustable parameter known as the packing factor Fp. Values for Fp
have been compiled (96); a few examples are listed in Table 6. Similar flooding rate correlations are available for arranged packings. Figure 24 reports results
for four examples of Mellapak types (97). Comparison of Figures 24 and 23 reveals higher capacity limits in structured than in many of the dumped
packings. At similar loads, structured packings tend generally to give rise to less pressure drop.
Table 6. Characteristics of Dumped Tower Packings*
Packing type Nominal size, mm Surface area, m2/m3 Packing factor, Fp, m 1
Raschig rings, ceramic 6 710 5250
13 370 2000
25 190 510
50 92 215
Raschig rings, steel 25 185 450
50 95 187
Bed. saddles, ceramic 6 900 2950
13 465 790
25 250 360
50 105 150
Pall rings, metal 25 205 157
50 115 66
Pall rings, polypropylene 25 205 170
50 100 82
aRef. 96.
Kirk-Othmer Encyclopedia of Chemical Technology (4th Edition)
39
ABSORPTION
Vol 1
L
G d
Fig. 23. Pressure drop and flooding correlation for various random packings (95). ф = q> /pL>g (standard acceleration of free fall) = 9.81 m/s2,
p = liquid viscosity in mPa-s; numbers on lines represent pressure drop, mm H2O /m of packed height; to convert to in. H2O /ft multiply by 0.012. Packing
factors for various packings have been published (96) and are produced in part in Table 6.
Fig. 24. Souders load diagram for capacity limit determination for four structured packings of the Sulzer-Mellapak type. The solid lines represent the
capacity limits of the respective packings as defined by a pressure drop of 1.2 kPa/т: (A) 125У; (B) 250У; (C) 350У; (D) 500 Y. Flooding rates are about
5% higher. Reprinted with permission (97).
Bubble Tray Absorption Columns
General Design Procedure. Bubble tray absorbers may be designed graphically based on a so-called McCabe-Thiele diagram. An operating
line and an equilibrium line are plotted in y—.v, V—A'7, or У —A' coordinates using the principles for packed adsorbers outlined above (see Fig. 25). The
minimum number of plates required for a specified recovery may be computed by assuming that equilibrium is reached between the two phases on each
bubble tray. Thus the gas and the Equid leaving a tray are at equilibrium and a hypothetical tray capable of equilibrating the phase streams is termed a
theoretical plate. Starting the calculation at the bottom of the tower, where the concentrations are yN+1 and xN (see Fig. 26), the concentration leaving the
lowest theoretical plate may be found on the design diagram (Fig. 25a) by moving from the operating line vertically to the equilibrium line, because is
at equilibrium with x^. Since the concentrations between two plates are always related by the operating line, xN_ x may be found fromj^ by moving
horizontally to the operating line. By repeating this sequence of steps until the desired residual gas concentration^ is reached, the number of theoretical
plates can be counted.
The required number of actual plates, A7., is larger than the number of theoretical plates, .Njp, because it would take an infinite contacting time at
each stage to establish equilibrium. The ratio AT^-Np is called the overall column efficiency. This parameter is difficult to predict from theoretical
considerations, however, or to correct for new systems and operating conditions. It is therefore customary to characterize the single plate by the so-called
Murphree vapor plate efficiency, (98):
^MV
Уп - Уп + l
Kirk-Othmer Encyclopedia of Chemical Technology (4th Edition)
40
ABSORPTION
Vol 1
(82)
which indicates the fractional approach to equiEbrium achieved by the plate. An efficiency of 80% means that the reduction in solute gas concentration
effected by the plate is 80% of the reduction obtained from a theoretical plate. Corresponding actual plates may therefore be stepped off by moving from
the operating line vertically only 80% of the distance between operating and equiEbrium line (Fig. 25b). In some special cases having negligible resistance in
the gas phase, E—— values may become unreasonably small. It is then more logical to define a Murphree Equid plate efficiency, -E^, simply by reversing the
role of Equid and gas and by focusing on the change in Equid composition across the plate with respect to an equiEbrium given by the leaving vapor.
Fig. 25. McCabe-Thiele diagram, (a) Number of theoretical plates, 5; (b) number of actual plates, 8.
Fig. 26. Numbering plates and concentrations in a bubble tray column.
Simplified Design Procedure for Linear Equilibrium and Operating Lines. A straight operating line occurs when the
concentrations are low such that L^ and GM remain essentially constant. (The material balance is obtained from equation 35.) In cases where the
equiEbrium К value does not depend too much on concentration, the use of absorption and stripping factors (99—101) allows rapid calculations for
absorption design. One of the simplifying assumptions made in the development of this so-called Kremser-Brown method involves the use of the
absorption factor M. The following algebraic expression describes the Equid and vapor flows from the plate (102):
Д-------hn___ nr 4------------^av___
Лп кг or к c
11 n 11 av ^av
(83)
where Л.. is the absorption factor for each plate n and L and Gn are the Equid and vapor flows from the plate. The fractional absorption of any component
by an absorber of N plates is expressed in a form similar to the Kremser equation (100,101,103).
У^+х-Ух
Kxv+x - KXq Ajv+1 - 1
(84)
where YN+1 = moles of absorbed component entering the column per mole of entering vapor and Y-_ = moles of absorbed component leaving the column
per mole of entering vapor. The calculation of plate efficiency (100) is quite sensitive to the choice of equiEbrium constants (4,104).
For linear equiEbrium and operating lines, an expEcit expression for the number of theoretical plates required for reducing the solute mole fraction
Kirk-Othmer Encyclopedia of Chemical Technology (4th Edition)
41
ABSORPTION
Vol 1
from i/jv+i toAi has been derived (41):
TVtp
т^м\ ( Ум+i таа:о\ mGM
\ Vi ~ таа:о )____LM
L
G
(85)
This is the one case where the overall column efficiency can be related analytically to the Murphree plate efficiency, so that the actual number of plates is
calculable by dividing the number of theoretical plates through equation 86:
In
1 । p (mGM \
J- + “mv г -И
.______\ )
Xx™Gm
(86)
Nonisothermal Gas Absorption. The computation of nonisothermal gas absorption processes is difficult because of all the interactions
involved as described for packed columns. A computer is normally required for the enormous number of plate calculations necessary to establish the
correct concentration and temperature profiles through the tower. Suitable algorithms have been developed (46,105) and nonisothermal gas absorption in
plate columns has been studied experimentally and the measured profiles compared to the calculated results (47,106). Figure 27 shows a typical Equid
temperature profile observed in an adiabatic bubble plate absorber (107). The close agreement between the calculated and observed profiles was obtained
without adjusting parameters. The plate efficiencies required for the calculations were measured independendy on a single exact copy of the bubble cap
plates installed in the five-tray absorber.
Fig. 27. Computed and experimental liquid temperature profiles in an ammonia absorber with 5 bubble cap trays (107). Water was used as a solvent.
t/jV+1 =0.123; уг = 0.0242; L'M /G'M = 1.757 ; A measured; □, calculated.
A general, approximate, short-cut design procedure for adiabatic bubble tray absorbers has not been developed, although work has been done in the
field of nonisothermal and multicomponent hydrocarbon absorbers. An analytical expression which will predict the recovery of each component provided
the stripping factor, ie, the group mG^/T^ is known for each component on each tray of the column has been developed (102). This requires knowledge
of the temperature and total flow (GM and L^) profiles through the tower. There are many suggestions about how to estimate these profiles (102, 103,
108). A realistic estimate of the temperature profile for theoretical plates can probably be obtained by the short-cut method developed on the basis of
rigorous computer solutions for about 40 different hypothetical designs (108) which closely resemble those of Figure 27.
Plate Efficiency Estimation.
Rate of Mass Transfer in Bubble Plates. The Murphree vapor efficiency, much like the height of a transfer unit in packed absorbers,
characterizes the rate of mass transfer in the equipment. The value of the efficiency depends on a large number of parameters not normally known, and its
prediction is therefore difficult and involved. Correlations have led to widely used empirical relationships, which can be used for rough estimates (109,110).
The most fundamental approach for tray efficiency estimation, however, summarizing intensive research on this topic, may be found in reference 111.
In large plates 0.61 m or more in diameter, the efficiency of the tray as a whole may differ from the efficiency observed at some particular point of
the tray because the liquid is not uniformly mixed in the direction of the flow on the whole tray. The point value of the efficiency called EQG is thus more
closely related to interphase diffusion than As the gas passes upward through the liquid covering a small area of the plate, mass transfer from gas to
liquid occurs in a manner similar to a packed tower of height ^B, the depth of the bubbling area. Under the assumption that the liquid is completely mixed
in the vertical direction, and that the gas travels through that minicolumn in a plug-flow-like fashion, the number of transfer units of the bubbling area may
be calculated in terms of the gas concentrations above and below the area under consideration by applying the definition of NOG, equation 55. This
equation may be integrated by takings* as constant and equal tojy*^ because of the well-mixed nature of the liquid phase. By comparing the result with the
definition of the plate efficiency, equation 82, formulated for a single point on the plate, the following relationship between the point efficiency and the
number of transfer units arises:
Eog = 1 - e-N°-
(87)
If resistance to transfer is present in both phases, NOG may be expressed as an addition of resistances using equations 54, 47, 41, and 44:
1 1 mGM 1
UU=Tr+WTK
(88)
Hence the point efficiency may be computed if both \ . and \ in the bubbling area are known. These parameters are determined by the prevailing
Kirk-Othmer Encyclopedia of Chemical Technology (4th Edition)
42
ABSORPTION
Vol 1
transfer coefficients, the interfacial area, and by/% NG = kGaPhB /GM and NL = kLaphB /LM .
To estimate the number of transfer units for design, the following empirical correlations which were derived from efficiency measurements
employing a variety of trays and operating conditions under the aforementioned assumptions are recommended (111):
Na = (0.776 + 4.63/iw - 0.238.F + 0.0712L') Sc~0'5
(89)
where h is the weir height in m; F = in m/s [(kg/111 i |j L' is the liquid flow rate per average width of stream in m3 /(s-m); and
VL = 3050/Z\ (68/iw + 1) tL
(90)
where tL = hLzL / L' is the Equid residence time in s. The recommended correlation for is
/>L = 0.0419 + 0.19/iw - 0.0135T + 2A6L'
(91)
Effect ofDifferent Degrees of Mixing. Once -EOG is evaluated on the basis of IVG and IVL using equation 87, it has to be translated into
by considering the degree of mixing on the tray. It is obvious that for a small plate with completely backmixed liquid,
^MV — ^OG
(92)
If, on the other hand, the liquid flows in a plug-flow-like manner over the tray, but the vapor may be assumed to mix between the trays so that it enters
each tray in uniform composition, the result maybe calculated according to (112).
(93)
In the case of unmixed vapors between the plates, the equations, being implicit in -E^y, have also been solved numerically (112). The results depend on the
arrangement of the downcomers and are not too different numerically from equation 93. In reality, however, the liquid is neither completely backmixed nor
can the tray be considered as a plug-flow device.
Many theories have been put forth to handle partial liquid backmixing on plates. Eady calculations (113—115) used the so-called tanks-in-series
model. Recycle models have been derived by assuming partial or complete backmixing of the liquid, or the vapor, or both (116—118). The suggested
procedure (111) is based on the eddy diffusion model when the parameter characterizing the degree of liquid backmixing is the dimensionless group known
as the Peclet number:
(94)
The eddy dispersion coefficient I?E has been measured and correlated empirically as
у/D^ = 0.00378 + 0.0179wg + 3.69L' + 0.18^w
(95)
The nomenclature is the same as that used in equations 89 and 90.
The relationship between E—EOG, and Pe has been calculated according to the recommended formulas (110) and presented in tabular form (4). A
plot of this data is shown in Figure 28. Complete backmixing is characterized by Pe = 0 (DE = oo) where EMV = Eoa . In larger columns, in which the
Equid is not completely mixed horizontally, E—— can be seen from Figure 28 to become larger than the point efficiency and may thus even exceed 100%
(119). Entrainment, as weE as by-passing, are always detrimental to the plate efficiency. Analytical expressions to correct for entrainment and by-passing
have been developed (120,121).
Fig. 28. Relationship between EOG and E-T at different degrees of Equid backmixing (4). Curves represent different Peclet numbers. From top to bottom
Pe = oo, +; Pe = 100, Q; Pe = 50, A; Pe = 20, ▲; Pe = 10, □; Pe = 5, ; Pe = 3, 0; Pe = 2, □; Pe = 1, ♦; Pe = 0.5, •.
Capacity Limitations. The fluid flow capacity of a bubble tray may be limited by any of three principal factors.
Flooding, often the most restrictive of the limitations, occurs when the clear Equid height in the downcomer, Ffd , exceeds a certain fraction of the
tray spacing. During operation, the Equid level in the downcomer builds up as a result of the head necessary to overcome the various resistances to Equid
flow, including the friction in the downcomer itself and the hydrauflc gradient across the plate. A significant portion in the Equid backup is caused by the
need for the Equid to overcome the difference in pressure between the inside and the outside of the downcomer, which in turn is caused by the pressure
drop of the vapors through the next higher plate. If the diameter of the column is made too small for a given flow, the vapor pressure drop and thus the
Equid backup in the downcomers will increase to the point where some Equid spills onto the next higher tray, and flooding sets in. In principle, the
condition may be corrected by increasing the diameter or the tray spacing. A conservative design requires a clear Equid head in the downcomer of no more
Kirk-Othmer Encyclopedia of Chemical Technology (4th Edition)
43
ABSORPTION
Vol 1
than half the tray spacing to allow for froth entrapped in the downcomer. The maximum allowable superficial velocity based on the column cross section
may be roughly estimated for different tray spacings (6,122,123). A more reHable design would consider each pressure drop contributing to hfd
separately.
2. Entrainment occurs when spray or froth formed on one tray enters the gas passages in the tray above. In moderate amounts, entrainment will
impair the countercurrent action and hence drastically decrease the efficiency. If it happens in excessive amounts, the condition is called priming and will
eventually flood the downcomers.
3. At high Equid flow, the hydraulic gradient may become so large that the caps near the Equid feed point will stop bubbling, and the efficiency will
suffer.
NOMENCLATURE
Symbol Definition Units
A E^/absorption factor
a effective interfacial area per packed volume 2 / 3 m/m
cAl concentration of solute at interface mol/m3 ormol/L
Cp specific heat of gas mixture kJ/(mol-K)
specific heat of Equid mixture kJ/(mol-K)
Г) axial dispersion coefficient m2/s
diffusion coefficient of A in В m2/s
G effective diffusion coefficient of A in a mixture m2/s
D-e eddy dispersion (or diffusion) coefficient on a tray m2/s
D diffusion coefficient of component j m2/s
dl Equid diffusion coefficient m2/s
p -^MV Murphree vapor plate efficiency, see equation 82
p OG point value of plate efficiency
F ^q/Pg", E-factor for bubble tray gas load kgi/2/(mi/2 ,s)
&, moles of component j mol
gas flow rate kmol/(m2-s)
G'm flow rate of inert gas kmol/(m2-s)
G°« generalized molar gas flow rate, see equation 64
H Henry's constant Pa
HETP height equivalent to a theoretical plate m
11 height of a gas-phase transfer unit, see equation 42 m
height of a Equid-phase transfer unit, see equation 45 m
H-OG overall gas-phase height of a transfer unit, see equation 48 m
-Уэз integral heat of solution for the solute kJ / mol
H latent heat of pure solvent kJ / mol
h total height of packing m
G clear height of Equid on a tray m
G wek height m
G height of bubble layer on a tray m
7a flux of component A due to diffusion mol/(m2-s)
К partition coefficient for gas—Equid equiEbrium
Gog overall gas-phase mass transfer coefficient mol/(s-m2-Pa)
gas-phase mass transfer coefficient mol/(s-m2-Pa)
G Equid-phase mass transfer coefficient m/s
G. mass transfer coefficient including effect of chemical reaction m/s
k° mass transfer coefficient for equimolar counterdiffusion m/s
k' mass transfer coefficient for unidirectional molecular diffusion through a stagnant gas m/s
k mass transfer coefficient for general multicomponent diffusion situation m/s
L mass flow rate of Equid kg/(s-m2)
Equid flow rate kmol/(s-m2)
J0 M generalized Equid flow rate, see equation 64 kmol/(s-m2)
L'm flow rate of solute-free solvent kmol/(s-m2)
L' Equid flow rate on a plate per width of stream m3/(s-m)
m slope of equiEbrium line
G,2 "solubiEty" of solventjjUgZ-G’g at the top of the tower
Na flux of solute A through phase interface mol/(s-m2)
ng number of gas phase transfer units, see equation 43
N flux of component у through phase interface mol/(s-m2)
4 number of Equid-phase transfer units, see equation 46
Gog number of overall gas-phase transfer units, see equation 49
Np number of actual plates in the column
NT NqG for equimolar counterdiffusion, see equation 57
Npp number of theoretical plates
NTU ap NqG calculated by equation 56, see also equation 73
NTU actual value of EJOG under the influence of axial dispersion, see equation 74
P pressure Pa
Pa partial pressure of A Pa
Pa, partial pressure of A at the interface Pa
P s vapor pressure of a pure component Pa
Pe uhfD , dimensionless Peclet number
Kirk-Othmer Encyclopedia of Chemical Technology (4th Edition)
44
ABSORPTION
Vol 1
Pe Ренти Ренти,< R Peclet number specifically defined for phase i, i = x orjy uH^ID , dimensionless HTU Peclet number, see equation 75 Peclet number specifically defined for phase i, i = x orjy, see equation 77 flow latio surface renewal rate, equation 32 s
Sc T C u p/pD, the dimensionless Schmidt number temperature °C or L . , parameter indicating the degree of counterdiffusion residence time of liquid on plate, see equation 90 s superficial velocity of gas or liquid phase m/s
film factor, see equation 24 xA /(1 — tA xA), generalized liquid concentration, see equation 64
X'a xA /(1 — xA), liquid mole ratio
xA liquid mole fraction of solute
XAb XA1OIX1 mole fraction in bulk of the liquid phase liquid mole fraction of solute at the phase interface
XBM logarithmic mean of solvent concentration between the phase interface and the bulk of the liquid, see equation 18
Y Y u Yf Уа Аь Jaj oiA Am moles absorbed component per mole of entering vapor, equation 84 y/f — y), mole ratio Ya/(1 — tA yA), generalized gas concentration, see equation 64 film factor, see equation 23 mx^, concentration in equilibrium with bulk liquid concentration mole fraction in bulk of gas phase gas mole fraction of solute at phase interface logarithmic mean of inert gas concentration between the phase interface and the bulk of the gas phase, see equation 15
Y* BM [(1 — yA )(1 — yA )]/ln [(1 — УА )/(l — Sm )], logarithmic mean of inert gas concentration between the equilibrium concentration and the bulk of the gas phase
Y*f [(1 — tA yA) — (1 — tA yA )]/ln [(1 — tA t/A)/(l — tAyA)], overall gas-phase film factor, see equation 30
A AT^ length of liquid travel on tray m total amount of component j absorbed kmol/(s-m2) temperature associated with internal temperature maximum °C or
Ц pl p a Ф V viscosity mPa-s(=cP) mean density of liquid phase mol/m3, mol/L, or g/cm3 density ofliquid mol/m3 surface tension N/m packing parameter for equation 79 m packing parameter for equation 80 m Subscripts
av A В G L i b average component A, solute component B, usually nondiffusing gas liquid at gas—liquid interface in the bulk; this symbol is normally omitted liquid feed for plate columns pertaining to liquid phase
J M n 1 2 pertaining to gas phase molar quantity referring to stream leaving the /rth tray bottom of a packed column top of a packed column
BIBLIOGRAPHY
"Absorption" in ECT 1st ed., Vol. 1, pp. 14—32, by E. G. Scheibel, Hoffmann-La Roche, Inc.; in ECT 2nd ed., Vol. 1, pp. 44—77, by F. A. Zenz, Squires
International, Inc.; in ECT 3rd ed., Vol. 1, pp. 53—96, by C. W. Wilke and Urs von Stockar, University of California, Berkeley.
1. F. A. Zenz, Chem. Eng. 1972, 120 (Nov. 13, 1972).
2. R. E. Treybal, Mass Transfer Operations, 3rd ed., McGraw-Hill Book Co., Inc., New York, 1980.
3. W. S. Norman, Absorption, Distillation and Cooling Towers., Longmans, Green & Co., Ltd. (Wiley) New York, 1962.
4. T. K. Sherwood, R. L. Pigford, and C. R. Wilke, Mass Transfer, McGraw-Hill Book Co., Inc., New York, 1975.
5. A. Mersmann, H. Hofer, and J. Stichlmair, Ger Chem. Eng. 2, 249—258 (1979).
6. R. H. Perry and D. Green, eds., Perry's Chemical Engineer's Handbook, 6th ed., McGraw-Hill Book Co., Inc., New York, 1984.
7. J. H. Hildebrand and R. L. Scott, Tegular S olutions, Prentice-Hall, Inc., Englewood Cliffs, N.J., 1962.
8. R. C. Reid, J. M. Prausnitz, and В. E. Poling, The Properties of Gases and Eiquids, 4th ed., McGraw-Hill Book Co., New York, 1988.
9. A. S. Kertes and co-workers, Solubility Data Series, Pergamon Press, Oxford, UK, 1979.
10. W. C. ETraister, Applied Hydrocarbon Thermodynamics, Gulf Publishing Co., Houston, Tex., 1961.
11. N. B. Vargaftik, Tables on the Thermophysical Properties of Eiquids and Gases, John Wiley & Sons, Inc., New York, 1975.
12. J. Gmehling and U. Onken, Vapor-EiquidEquilibrium Data Collection, Chemistry Data Series, Dechema, Frankfurt, 1977 ff
13. W. G. Whitman, Chem. Metall Eng. 29, 147 (1923).
Kirk-Othmer Encyclopedia of Chemical Technology (4th Edition)
45
ABSORPTION
Vol 1
14.
15.
16.
17.
18.
19.
20.
21.
22.
23.
24.
25.
26.
27.
28.
29.
30.
31.
32.
33.
34.
35.
36.
37.
38.
39.
40.
41.
42.
43.
44.
45.
46.
47.
48.
49.
50.
51.
52.
53.
54.
55.
56.
57.
58.
59.
60.
61.
62.
63.
64.
65.
66.
67.
68.
69.
70.
71.
72.
73.
74.
75.
76.
77.
78.
79.
80.
81.
82.
83.
84.
85.
86.
87.
A. F. Ward and L. H. Brooks, Trans. Faraday Soc. 48, 1124 (1952).
E. J. Cullen and J. F. Davidson, Trans. Faraday Soc. 53, 113 (1957).
W. J. Ward and J. A. Quinn, AIChE J. 11, 1005 (1965).
J. L. Duda and J. S. Vrentas, AIChE J. 14, 286 (1968).
S. Lynn, J. R. Straatemeier, andH. Kramers, Chem, Eng, Sci. 4, 49, 58, 63 (1955).
R. W. Schrage, Al Theoretical Study of Interface Mass Transfer, Columbia University, New York, 1953.
B. Paul,/. Am. Rocket Soc. 1321 (Sept. 1962).
L. V. Delaney and L. C. Eagleton, AIChE J. 8, 418 (1962).
R. Cartier, D. Pindzola, and P. E. Bruins, Ind. Eng. Chem. 51, 1409 (1959).
N. A. Clontz, R. T. Johnson, W. L. McCabe, and R. W. Rousseau, Ind. Eng. Chem. Fundam. 11, 368 (1972).
J. T. Davies and E. K. Rideal, Adv. Chem. Eng. 4, 1 (1963).
C. J. King, AIChE J. 10, 671 (1964).
W. K. Lewis and W. G. Whitman, Ind, Eng. Chem. 16, 1215 (1924).
R. B. Bird, W. E. Stewart, and E. N. Lightfoot, Transport Phenomena, John Wiley & Sons, Inc., New York, 1960.
C. R. Wilke, Chem, Eng, Prog. 46, 95 (1950).
R. E. Treybal, Ind. Eng. Chem. 61, 36 (1969).
R. Krishna and R. Taylor in N. P. Chemerisinoff, ed., Elandbook for Eleat and Mass Transfer Operations, Vol. 2, Gulf Publishing Corporation, Houston,
Tex., 1986.
J. A. Wesselingh and R. Krishna, Elements of Mass Transfer, Technical University Delft, Delft, the Nethedands, 1989.
R. Krishna and R. Taylor, Multicomponent Mass Transfer, John Wiley & Sons, Inc., New York, 1991.
R. Higbie, Trans. Am Inst, Chem, Eng. 31, 365 (1935).
P. V. Danckwerts, Ind. Eng. Chem. 43, 1460 (1951).
T. H. Chilton and A. P. Colburn, Ind. Eng. Chem. 26, 1183 (1934).
G. F. Froment in Chemical Reaction Engineering (Advances in Chemistry Series 109), American Chemical Society, Washington, D.C., 1972, p. 19.
K. F. Loughlin, M. A. Abul-Hamayel, and L. C. Thomas, AIChE 31, 1614 (1985).
P. V. Danckwerts, Gas-Eiquid Reactions, McGraw-Hill Book Co., Inc., New York, 1970.
D. W. van Krevelen and P. J. Hoftijzer, Rec. Trav. Chim. 67, 563 (1948).
G. Astarita, Mass Transfer with ChemicalReaction, Elsevier, Amsterdam, 1966.
A. P. Colburn, Trans. Am. Inst. Chem. Eng. 35, 211 (1939).
J. H. Wiegand, Trans. Am. Inst. Chem. Eng. 36, 679 (1940).
C. R. Wilke and U. v. Stockar, Ind. Eng. Chem. Fundam. 16(2), 88 (1977).
J. D. Raal and M. K. Khurana, Can, J. Chem, Eng. 51, 162 (1973).
C. R. Wilke and U. v. Stockar, Ind. Eng. Chem. Fundam. 16(2), 94 (1977).
J. Stichlmair, Chem. Ind. Technol. 44, 411 (1972).
J. R. Bourne, U. v. Stockar, and G. C. Coggan, Ind, Eng, Chem, Process Des. Dev. 13, 124 (1974).
I. A. Furzer, Ind. Eng. Chem. Fundam. 23, 159 (1984).
N. Kolev and Kr. Semkov, Chem. Eng. Prog. 19, 175 (1985).
N. Kolev and Kr. Semkov, Vt Verfahrenstechnik 17, 474 (1983).
W. E. Dunn, T. Vermeulen, C. R. Wilke, and T. T. Word, Report UCRL 10394 (1962), Univ, of California Radiation Laboratory as cited in
reference 4.
W. E. Dunn, T. Vermeulen, C. R. Wilke, and T. T. Word, Ind. Eng. Chem. Fundam. 16, 116 (1977).
E. T. Woodbum, AIChE J. 20, 1003 (1974).
M. Richter, Chem, Tech. 30, 294 (1978).
U. von Stockar and P. F. Cevey, Ind, Eng, Chem, Process Rer. Dev. 23, 717 (1984).
T. Miyauchi and T. Vermeulen, Ind. Eng. Chem, Fundam. 2, 113 (1963).
C. A. Sleicher, AIChE J. 5, 145 (1959).
S. Stemerding and F. J. Zuiderweg, Chem. Engr. CE 156—CE 159 (May 1963).
J. C. MecHenburgh and S. Hardand, The Theory of Backmixing, Wiley-Interscience, New York, 1975, Chapt. 10.
J. S. Watson and H. D. Cochran, Ind. Eng. Chem. Process Rat. Dev. 10, 83—85 (1971).
U. von Stockar and Xiao-Ping Lu, Al Simple and Accurate Short-cut Procedure to Accountfor Axial Dispersion in Counter-current S eparation Columns, Ind. Eng.
Chem, Research, 1991, in press.
U. von Stockar, ACHEMASL4, 1989 (International Meeting on Chemical Engineering & Biotechnology, Beijing, China), Dechema & Ciesc, 1989,
p. 43.
T. K. Sherwood and F. A. L. Holloway, Trans. Inst. Am. Chem, Eng. 36, 39 (1940).
F. F. Rixon, Trans, Instn. Chem, Engrs. 26, 119 (1948).
H. A. Koch, L. F. Stutzman, H. A. Blum, and L. E. Hutchings, Chem. Eng. Prog. 45, 677 (1949).
E. L. Knoedler and C. F. Bonilla, Chem. Eng. Prog. 50, 125 (1954).
J. E. Vivian and C. J. King, AIChE J. 120, 221 (1964).
D. Cornell, W. G. Knapp, and J. R. Fair, Chem. Eng. Prog. 56(7), 68 (1960).
W. L. Holies and J. R. Fair, Chem. Eng. 89(July 12), 109 (1982).
P. H. Au-Yeung and A. B. Ponter, Can. J. Chem. Eng. 61, 481 (1983).
D. M. Mohunta, A. S. Vaidyanathan, and G. S. Laddha, Ind. Chem. Eng. 11, 73 (1969).
J. B. Zech and A. B. Mersmann, I. Chem. E. Symp. Ser. 56, 39 (1979).
R. Mangers and A. B. Ponter, Ind, Eng, Chem, Process Des. Dev. 19, 530 (1980).
Mei Geng Shi and A. B. Mersmann, Ger. Chem, Eng. 8, 87 (1985).
R. Billet and M. Schultes, Paper given at AIChE Annual Meeting, Washington, D.C. (1988).
D. W. van Krevelen and P. J. Hoftijzer, Rec. Trav. Chim, Pays-Bas 66, 49 (1947).
K. Onda, H. Takeuchi, and Y. Okumoto,/. Chem. Eng, Jpn. 1, 56 (1968).
H. L. Schulman, C. F. Ulrich, A. Z. Proulx, and J. O. Zimmerman, AIChE J. 1, 253 (1955).
J. F. Davidson, Trans. Instn, Chem, Engrs. 37, 131 (1959).
J. Bridgewater and A. M. Scott, Trans. Instn, Chem, Engrs. 52, 317 (1974).
A. B. Ponter and P. H. Au-Yeung, Can. J. Chem. Eng. 60, 94 (1982).
R. Echarte, H. Campana, and E. A. Brignole, Ind. Eng. Chem, Process Des. Dev. 23, 349 (1984).
E. J. Lynch and C. R. Wilke, AIChE J. 1, 9 (1955).
H. L. Shulman, C. F. Ullrich, andN. Wells, AIChE J.l, 247 (1955).
B. W. Gamson, G. Thodos, and O. A. Hougen, Trans. Am. Inst. Chem. Eng. 39, 1 (1943).
R. G. Eckert and O. A. Hougen, Chem. Eng. Prog. 45, 188 (1949).
C. R. Wilke and O. A. Hougen, Trans. Am. Inst. Chem, Eng. 41, 445 (1945).
Kirk-Othmer Encyclopedia of Chemical Technology (4th Edition)
46
ABSORPTION
Vol 1
88. M. Hobson and G. Thodos, Chem, Eng. Prog. 47, 370 (1951).
89. L. Fellinger, Dissertation, Massachusetts Institute of Technology, 1941; see also reference 113.
90. J. L. Bravo and J. R. Fair, Ind. Eng. Chem, Process Des. Dev. 21, 162 (1982).
91. J. R. Hufton, J. L. Bravo, and J. R. Fair, Ind. Eng. Chem. R/j. 27, 2096 (1988).
92. T. K. Sherwood, G. H. Shipley, and F. A. L. Holloway, Ind. Eng. Chem. 30, 765 (1938).
93. W. E. Lobo, L. Friend, F. Hashmall, and F. Zenz, Trans.Am. Inst. Chem. Eng. 41, 693 (1945).
94. F. A. Zenz and R. A. Eckert, Pet. Refiner. 40, 130 (1961).
95. R. A. Eckert, Chem. Eng. Prog. 66(3), 39 (1970).
96. J. R. Fair, D. E. Steinmeyer, W. R. Penney, and В. B. Crocker, in ref. 6, pp. 18—23.
97. L. Spiegel and W. Meier, Chem, Eng. Symp. Ser. 104, A203 (1987).
98. E. V. Murphree, Ind. Eng. Chem. Yl, 474 (1925).
99. A. Kremser, Nat. Pet. News 22(21), 42 (1930).
100. G. G. Brown and M. Souders, Oil Gas J. 31(5), 34 (1932).
101. M. Souders and G. G. Brown, Ind. Eng. Chem. 24, 519 (1932).
102. G. Horton and W. B. Franklin, Ind, Eng. Chem. 32, 1384 (1940).
103. W. C. Edmister, Ind. Eng. Chem. 35, 837 (1943).
104. G. G. Brown and M. Souders, The Science of Petroleum, Vol. 2, Oxford University Press, New York, 1938, Sect. 25, p. 1557.
105. J. R. Bourne, U. v. Stockar, and G. C. Coggan, Ind, Eng, Chem. Process Des. Dev. 13, 115 (1974).
106. J. Stichlmair and A. Mersmann, Chem. Ing. Technol 43, 17 (1971).
107. U. von Stockar, Gasabsorption mit Wdrmeeffekten, Diss. Nr 4917, ETH-Zurich, 1973.
108. W. R. Owens and R. N. Maddox, Ind. Eng. Chem. 60(12), 14 (1968).
109. H. G. Drickamer and J. R. Bradford, Trans. Am. Inst. Chem. Eng. 39, 319 (1943).
110. A. E. O'Connell, Trans. Am. Inst. Chem, Eng. 42, 741 (1946).
111. Research Committee, Rubble Tray Design Manual, American Institute of Chemical Engineers, New York, 1958.
112. W. K. Lewis, Ind. Eng. Chem. 28, 399 (1936).
113. T. K. Sherwood and R. L. Pigford, Absorption and Extraction, McGraw-Hill Book Co., Inc., New York, 1952.
114. M. Nord, Trans, Am, Inst, Chem. Eng. 42, 863 (1946).
115. M. F. Gautreaux andH. E. O'Connell, Chem. Eng. Prog. 51, 232 (1955).
116. E. D. Oliver and С. C. Watson, AIChE J. 2, 18 (1956).
117. L. A. Warzel, Dissertation, University of Michigan, Ann Arbor, Mich., 1955.
118. V. M. Ramm,A^(?^» of Gases, Israel Program for Scientific Translations, Jerusalem, 1968, Chapt. 3.
119. G. G. Brown, M. Souders, H. V. Nyland, and W. H. Hessler, Ind. Eng. Chem. 27, 383 (1935).
120. A. P. Colburn, Ind. Eng. Chem. 28, 526 (1936).
121. С. P. Strand, Chem. Eng. Prog. 59, 58 (1963).
122. M. Souders and G. G. Brown, Ind. Eng. Chem. 26, 98 (1934).
123. J. R. Fair, Petro/ChemEng. 33(10), 45 (Sept. 1961).
General references
References 2, 3, 4, and 113 are general references.
A. H. P. Shetland, DiffusionalMass Transfer, John Wiley & Sons, Inc., New York, 1974.
Urs von Stockar
Hcole Polytechnique Fiidiirale, Lausanne
Charles R. Wilke
University of California, Berkeley
Kirk-Othmer Encyclopedia of Chemical Technology (4th Edition)
47
ACETALDEHYDE
Vol 1
ACARICIDES.
See Insect control technology.
ACACIA.
See Diuretic agents; Gums.
ACAROID, ACCROIDES.
See Resins, natural.
ACETALDEHYDE
Acetaldehyde [75-07-0] (ethanal), СНОСНО, was first prepared by Scheele in 1774, by the action of manganese dioxide [1313-13-9] and sulfuric acid
[7664-93-9] on ethanol [64-17-5]. The structure of acetaldehyde was established in 1835 by Liebig from a pure sample prepared by oxidizing ethyl alcohol
with chromic acid. Liebig named the compound "aldehyde" from the Latin words translated as al(cohol) dehyd(rogenated). The formation of acetaldehyde
by the addition of water [7732-18-5] to acetylene [74-86-2] was observed by Kutscherow] in 1881.
Acetaldehyde, first used extensively during World War I as a starting material for making acetone [67-64-1] from acetic acid [64-19-7], is currendy an
important intermediate in the production of acetic acid, acetic anhydride [108-24-7], ethyl acetate [141-78-6], peracetic acid [79-21 -0], pentaerythritol
[115-77-5], chloral [302-17-0], glyoxal [107-22-2], alkylamines, and pyridines. Commercial processes for acetaldehyde production include the oxidation or
dehydrogenation of ethanol, the addition of water to acetylene, the partial oxidation of hydrocarbons, and the direct oxidation of ethylene [74-85-1]. In
1989, it was estimated that 28 companies having more than 98% of the world's 2.5 megaton per year plant capacity used the Wacker-Hoechst processes for
the direct oxidation of ethylene.
Acetaldehyde is a product of most hydrocarbon oxidations. It is an intermediate product in the respiration of higher plants and occurs in trace
amounts in all ripe fruits that have a tart taste before ripening. The aldehyde content of volatiles has been suggested as a chemical index of ripening during
cold storage of apples. Acetaldehyde is also an intermediate product of fermentation (qv), but it is reduced almost immediately to ethanol. It may form in
wine (qv) and other alcoholic beverages after exposure to air, imparting an unpleasant taste; the aldehyde reacts to form diethyl acetal [105-57-7] and ethyl
acetate [141-78-6]. Acetaldehyde is an intermediate product in the decomposition of sugars in the body and hence occurs in trace quantities in blood.
Physical Properties
Acetaldehyde is a colorless, mobile liquid having a pungent, suffocating odor that is somewhat fruity and quite pleasant in dilute concentrations. Its physical
properties are given in Table 1; the vapor pressure of acetaldehyde and its aqueous solutions appear in Tables 2 and 3, respectively; and the solubilities of
acetylene, carbon dioxide [124-38-9], and nitrogen [7727-37-9] in liquid acetaldehyde are given in Table 4. Acetaldehyde is miscible in all proportions with
water and most common organic solvents, eg, acetone, benzene [71-43-2], ethyl alcohol, ethyl ether [60-29-7], gasoline, paraldehyde [123-63-7], toluene
[108-88-3], xylenes [1330-20-7], turpentine, and acetic acid.
Table 1. Physical Properties of Acetaldehyde
Properties Values
formula weight melting point, °C boiling point at 101.3 kPa* (1 atm), °C density, g/mL A coefficient of expansion per °C (0—30°C) refractive index, #20D vapor density (air = 1) surface tension at 20°C, mN/m (=dyn/cm) absolute viscosity at 15°C, mPa-s (=cP) specific heat at 0°C, J/(g-K)b 44.053 -123.5 20.16 0.8045 0.7901 0.7846 0.7780 0.00169 1.33113 1.52 21.2 0.02456
15°C 25°C a = Cp /Cv at 30°C and 101.3 kPa (1 atm) latent heat of fusion, kJ /mol latent heat of vaporization, kJ /mol heat of solution in water, kJ/mol 2.18 1.41 1.145 3.24 25.71
Kirk-Othmer Encyclopedia of Chemical Technology (4th Edition)
48
ACETALDEHYDE
Vol 1
at 0°C
at 25°C
heat of combustion of liquid at constant pressure, kJ / mol
heat of formation at 273 K, kJ /mol
free energy of formation at 273 K, kJ /mol
critical temperature, °C
critical pressure, MPa
dipole moment, C m
ionization potential, eV
dissociation constant at 0°C, Ka
flash point, closed cup, °C
ignition temperature in air, °C
explosive limits of mixtures with air, vol % acetaldehyde
aTo convert kPa to psi, multiply by 0.14503.
To convert J to cal, divide by 4.187.
To convert MPa to psi, multiply by 145.
d To convert C-m to debyes, multiply by 2.998 x 1029 .
-8.20
-6.82
12867.9
-165.48
-136.40
181.5
6.40
8.97 x 10“30
10.50
0.7 x 1СГ14
-38
165
4.5-60.5
Table 2. Vapor Pressure of Acetaldehyde
Temperature, °C Vapor pressure, kPa Temperature, °C Vapor pressure, kPaa
—MJ 2.5 20 100.6
-20 16.4 20.16 101.3
0 44.0 30 145.2
5 54.8 50 279.4
10 67.7 70 492.6
15 82.9 100 1,014
To convert kPa to mm Hg, multiply by 7.5.
Table 3. Vapor Pressure of Aqueous Solutions of Acetaldehyde
Temperature, °C Mol% Total vapor pressure, kPaa
10 4.9 9.9
10 10.5 18.6
10 46.6 48.4
20 5.4 16.7
20 12.9 39.3
20 21.8 57.7
To convert kPa to mm Hg, multiply by 7.5.
Table 4. Solubility of Gases in Liquid Acetaldehyde at Atmospheric Pressure
Temperature, °C Volume of gas (STP) dissolved in 1 volume acetaldehyde
Acetylene Carbon dioxide Nitrogen
-16 54
-6 27 11
0 17 6.6
12 7.3 14.5 0.15
16 5 1.5
20 3
The freezing points of aqueous solutions of acetaldehyde are 4.8 wt%, —2.5°C; 13.5 wt %, — 7.8° C; and 31.0 wt %, 23.0° C.
Given in the literature are vapor pressure data for acetaldehyde and its aqueous solutions (1—3); vapor—liquid equilibria data for
acetaldehyde—ethylene oxide [75-21-8] (1), acetaldehyde—methanol [67-56-1] (4), sulfur dioxide [7446-09-5]— acetaldehyde—water (5),
acetaldehyde—water—methanol (6); the azeotropes of acetaldehyde—butane [106-97-8] and acetaldehyde—ethyl ether (7); solubility data for
acetaldehyde—water—methane [74-82-8] (8), acetaldehyde—methane (9); densities and refractive indexes of acetaldehyde for temperatures 0—20°C (2);
compressibility and viscosity at high pressure (10); thermodynamic data (11—13); pressure—enthalpy diagram for acetaldehyde (14); specific gravities of
acetaldehyde—paraldehyde and acetaldehyde—acetaldol mixtures at 20/20°C vs composition (7); boiling point vs composition of acetaldehyde—water at
101.3 kPa (1 atm) and integral heat of solution of acetaldehyde in water at 11°C (7).
Chemical Properties
The limits and products of the various combustion zones for acetaldehyde—oxygen and acetaldehyde—air have been described (15—18); the effect of
pressure on the explosive limits of acetaldehyde—air mixtures has been investigated (19). In a study of the spontaneous ignition of fuels injected into hot air
streams, it was found that acetaldehyde was the least ignitable of the aldehydes examined (20,21). The influence of surfaces on the ignition and detonation
of fuels containing acetaldehyde has been reported (22,23). Ignition data have been published for the systems acetaldehyde—oxygen—peroxyacetic
acid—acetic acid (24), acetaldehyde—oxygen—peroxyacetic acid (25), and ethylene oxide—air—acetaldehyde (26).
Kirk-Othmer Encyclopedia of Chemical Technology (4th Edition)
49
ACETALDEHYDE
Vol 1
Acetaldehyde is a highly reactive compound exhibiting the general reactivity of aldehydes (qv). Acetaldehyde undergoes numerous condensation,
addition, and polymerization reactions; under suitable conditions, the oxygen or any of the hydrogens can be replaced.
Decomposition. Acetaldehyde decomposes at temperatures above 400°C, forming principally methane and carbon monoxide [630-08-0]. The
activation energy of the pyrolysis reaction is 97.7 kJ/mol (408.8 kcal/mol) (27). There have been many investigations of the photolytic and radical-induced
decomposition of acetaldehyde and deuterated acetaldehyde (28—30).
The Hydrate and Enol Form. In aqueous solutions, acetaldehyde exists in equilibrium with the acetaldehyde hydrate [4433-56-1J,
(CH3CH(OH)2). The degree of hydration can be computed from an equation derived by Bell and Clunie (31). Hydration, the mean heat of which is
—21.34 kJ/mol (—89.29 kcal/mol), has been attributed to hyperconjugation (32). The enol form, vinyl alcohol [557-75-5] (CH2=CHOH) exists in
equilibrium with acetaldehyde to the extent of approximately 1 molecule per 30,000. Acetaldehyde enol has been acetylated with ketene [463-51-4] to form
vinyl acetate [108-05-4] (33).
Oxidation. Acetaldehyde is readily oxidized with oxygen or air to acetic acid, acetic anhydride, and peracetic acid (see Acetic acid and
derivatives). The principal product depends on the reaction conditions. Acetic acid [64-19-7] may be produced commercially by the liquid-phase oxidation
of acetaldehyde at 65°C using cobalt or manganese acetate dissolved in acetic acid as a catalyst (34). Liquid-phase oxidation in the presence of mixed
acetates of copper and cobalt yields acetic anhydride [108-24-7] (35). Peroxyacetic acid or a perester is believed to be the precursor in both syntheses. There
are two commercial processes for the production of peracetic acid [79-21 -0]. Low temperature oxidation of acetaldehyde in the presence of metal salts,
ultraviolet irradiation, or ozone yields acetaldehyde monoperacetate, which can be decomposed to peracetic acid and acetaldehyde (36). Peracetic acid can
also be formed direcdy by liquid-phase oxidation at 5—50° C with a cobalt salt catalyst (37) (see Peroxidesand peroxy compounds). Nitric acid oxidation of
acetaldehyde yields glyoxal [107-22-2] (38,39). Oxidations of p-xylene to terephthalic acid [100-21-0] and of ethanol to acetic acid are activated by
acetaldehyde (40,41).
Reduction. Acetaldehyde is readily reduced to ethanol (qv). Suitable catalysts for vapor-phase hydrogenation of acetaldehyde are supported
nickel (42) and copper oxide (43). The kinetics of the hydrogenation of acetaldehyde over a commercial nickel catalyst have been studied (44).
Polymerization. Paraldehyde, 2,4,6-trimethyl-l,3-5-trioxane [123-63-7]\ a cyclic trimer of acetaldehyde, is formed when a mineral acid, such as
sulfuric, phosphoric, or hydrochloric acid, is added to acetaldehyde (45). Paraldehyde can also be formed continuously by feeding liquid acetaldehyde at
15—20°C over an acid ion-exchange resin (46). Depolymerization of paraldehyde occurs in the presence of acid catalysts (47); after neutralization with
sodium acetate, acetaldehyde and paraldehyde are recovered by distillation. Paraldehyde is a colorless liquid, boiling at 125.35°C at 101 kPa (1 atm).
paraldehyde
metaldehyde
Metaldehyde [9002-91 -9]y a cyclic tetramer of acetaldehyde, is formed at temperatures below 0°C in the presence of dry hydrogen chloride or
pyridine—hydrogen bromide. The metaldehyde crystallizes from solution and is separated from the paraldehyde by filtration (48). Metaldehyde melts in a
sealed tube at 246.2°C and sublimes at 115°C with partial depolymerization.
Polyacetaldehyde, a rubbery polymer with an acetal structure, was first discovered in 1936 (49,50). More recendy, it has been shown that a white,
nontacky, and highly elastic polymer can be formed by cationic polymerization using BF3 in liquid ethylene (51). At temperatures below —75° C using
anionic initiators, such as metal alkyls in a hydrocarbon solvent, a crystalline, isotactic polymer is obtained (52). This polymer also has an acetal
fpoly(oxymethylene)] structure. Molecular weights in the range of 800,000—3,000,000 have been reported. Polyacetaldehyde is unstable and depolymerizes in
a few days to acetaldehyde. The methods used for stabilizing polyformaldehyde have not been successful with polyacetaldehyde and the polymer has no
practical significance (see Acetal resins).
Reactions with Aldehydes and Ketones. The base-catalyzed self-addition of acetaldehyde leads to formation of the dimer, acetaldol
[107-89-1J, which can be hydrogenated to form 1,3-butanediol [107-88-0] or dehydrated to form crotonaldehyde [4170-30-3]. Crotonaldehyde can also be
made direcdy by the vapor-phase condensation of acetaldehyde over a catalyst (53).
Acetaldehyde forms aldols with other carbonyl compounds containing active hydrogen atoms. Kinetic studies of the aldol condensation of
acetaldehyde and deuterated acetaldehydes have shown that only the hydrogen atoms bound to the carbon adjacent to the CHO group take part in the
condensation reactions and hydrogen exchange (54,55). A hexyl alcohol, 2-ethyl-l-butanol [97-95-0]\ is produced industrially by the condensation of
acetaldehyde and butyraldehyde in dilute caustic solution followed by hydrogenation of the enal intermediate (see Alcohols, higher aliphatic).
Condensation of acetaldehyde in the presence of dimethylamine hydrochloride yields polyenals which can be hydrogenated to a mixture of alcohols
containing from 4 to 22 carbon atoms (56).
The base-catalyzed reaction of acetaldehyde with excess formaldehyde [50-00-0] is the commercial route to pentaerythritol [115-77-5]. The aldol
condensation of three moles of formaldehyde with one mole of acetaldehyde is followed by a crossed Cannizzaro reaction between pentaerythrose, the
intermediate product, and formaldehyde to give pentaerythritol (57). The process proceeds to completion without isolation of the intermediate.
Pentaerythrose [3818-32-4] has also been made by condensing acetaldehyde and formaldehyde at 45°C using magnesium oxide as a catalyst (58). The
vapor-phase reaction of acetaldehyde and formaldehyde at 475°C over a catalyst composed of lanthanum oxide on silica gel gives acrolein [107-02-8] (59).
Ethyl acetate [141-78-6] is produced commercially by the Tischenko condensation of acetaldehyde using an aluminum ethoxide catalyst (60). The
Tischenko reaction of acetaldehyde with isobutyraldehyde [78-84-2] yields a mixture of ethyl acetate, isobutyl acetate [110-19-0]\ and isobutyl isobutyrate
[97-85-8] (61).
Reactions with Ammonia and Amines. Acetaldehyde readily adds ammonia to form acetaldehyde—ammonia. Diethylamine [109-87-7] is
obtained when acetaldehyde is added to a saturated aqueous or alcoholic solution of ammonia and the mixture is heated to 50—75°C in the presence of a
nickel catalyst and hydrogen at 1.2 MPa (12 atm). Pyridine [110-86-1] and pyridine derivatives are made from paraldehyde and aqueous ammonia in the
presence of a catalyst at elevated temperatures (62); acetaldehyde may also be used but the yields of pyridine are generally lower than when paraldehyde is
the starting material. The vapor-phase reaction of formaldehyde, acetaldehyde, and ammonia at 360°C over oxide catalyst was studied; a 49% yield of
pyridine and picolines was obtained using an activated silica— alumina catalyst (63). Brown polymers result when acetaldehyde reacts with ammonia or
amines at a pH of 6—7 and temperature of 3—25°C (64). Primary amines and acetaldehyde condense to give Schiff bases: CH3CH=NR. The Schiff base
reverts to the starting materials in the presence of acids.
Reactions with Alcohols, Mercaptans, and Phenols. Alcohols add readily to acetaldehyde in the presence of trace quantities of mineral
acid to form acetals; eg, ethanol and acetaldehyde form diethyl acetal [105-57-7] (65). Similarly, cyclic acetals are formed by reactions with glycols and other
polyhydroxy compounds; eg, ethylene glycol [107-21-1] and acetaldehyde give 2-methyl-l,3-dioxolane [497-26-7] (66):
Kirk-Othmer Encyclopedia of Chemical Technology (4th Edition)
50
ACETALDEHYDE
Vol 1
O. ,0
CH3 H
Mercaptals, CH3CH(SR)2, are formed in. a like manner by the addition of mercaptans. The formation of acetals by noncatalytic vapor-phase
reactions of acetaldehyde and various alcohols at 35°C has been reported (67). Butadiene [106-99-0] can be made by the reaction of acetaldehyde and ethyl
alcohol at temperatures above 300°C over a tantala—silica catalyst (68). Aldol and crotonaldehyde are believed to be intermediates. Butyl acetate [123-86-4]
has been prepared by the catalytic reaction of acetaldehyde with 1-butanol [71-36-3] at 300°C (69).
Reaction of one mole of acetaldehyde and excess phenol in the presence of a mineral acid catalyst gives l,l-bis(Z)-hydroxyphenyl)ethane [2081-08-5]',
acid catalysts, acetaldehyde, and three moles or less of phenol yield soluble resins. Hardenable resins are difficult to produce by alkaline condensation of
acetaldehyde and phenol because the acetaldehyde tends to undergo aldol condensation and self-resinification (see Phenolic resins).
Reactions with Halogens and Halogen Compounds. Halogens readily replace the hydrogen atoms of the acetaldehyde's methyl group:
chlorine reacts with acetaldehyde or paraldehyde at room temperature to give chloroacetaldehyde [107-20-0]', increasing the temperature to 70—80°C gives
dichloroacetaldehyde [79-02-7]', and at a temperature of 80—90°C chloral [302-17-0] is formed (70). Catalytic chlorination using antimony powder or
aluminum chloride—ferric chloride has also been described (71). Bromal [115-17-3] is formed by an analogous series of reactions (72). It has been
postulated that acetyl bromide ?506-%-7 is an intermediate in the bromination of acetaldehyde in aqueous ethanol (73). Acetyl chloride [75-36-5] has been
prepared by the gas-phase reaction of acetaldehyde and chlorine (74).
Acetaldehyde reacts with phosphorus pentachloride to produce 1,1-dichloroethane [75-34-3] and with hypochlorite and hypoiodite to yield
chloroform [67-66-3] and iodoform [75-47-8], respectively. Phosgene [75-44-5] is produced by the reaction of carbon tetrachloride with acetaldehyde in the
presence of anhydrous aluminum chloride (75). Chloroform reacts with acetaldehyde in the presence of potassium hydroxide and sodium amide to form
l,l,l-trichloro-2-propanol [7789-89-1] (76).
Miscellaneous Reactions. Sodium bisulfite adds to acetaldehyde to form a white crystalline addition compound, insoluble in ethyl alcohol
and ether. This bisulfite addition compound is frequendy used to isolate and purify acetaldehyde, which may be regenerated with dilute acid. Hydrocyanic
acid adds to acetaldehyde in the presence of an alkali catalyst to form cyanohydrin; the cyanohydrin may also be prepared from sodium cyanide and the
bisulfite addition compound. Acrylonitrile [107-13-1] (qv) can be made from acetaldehyde and hydrocyanic acid by heating the cyanohydrin that is formed
to 600—700°C (77). Alanine [302-72-7] can be prepared by the reaction of an ammonium salt and an alkali metal cyanide with acetaldehyde; this is a general
method for the preparation of CC-amino acids called the Strecker amino acids synthesis. Grignard reagents add readily to acetaldehyde, the final product
being a secondary alcohol. Thio acetaldehyde [2765-04-0] is formed by reaction of acetaldehyde with hydrogen sulfide; thio acetaldehyde polymerizes readily
to the trimer.
Acetic anhydride adds to acetaldehyde in the presence of dilute acid to form ethylidene diacetate [542-10-9]', boron fluoride also catalyzes the
reaction (78). Ethylidene diacetate decomposes to the anhydride and aldehyde at temperatures of 220—268°C and initial pressures of 14.6—21.3 kPa
(110—160 mm Hg) (79), or upon heating to 150°C in the presence of a zinc chloride catalyst (80). Acetone (qv) [67-64-1] has been prepared in 90% yield by
heating an aqueous solution of acetaldehyde to 410°C in the presence of a catalyst (81). Active methylene groups condense acetaldehyde. The reaction of
isobutylene/715-11-7] and aqueous solutions of acetaldehyde in the presence of 1—2% sulfuric acid yields alkyl-z^-dioxanes; 2,4,4,6-tetramethyl-z^-dioxane
[5182-37-6] is produced in yields up to 90% (82).
Manufacture
Since 1960, the liquid-phase oxidation of ethylene has been the process of choice for the manufacture of acetaldehyde. There is, however, still some
commercial production by the partial oxidation of ethyl alcohol and hydration of acetylene. The economics of the various processes are strongly dependent
on the prices of the feedstocks. Acetaldehyde is also formed as a coproduct in the high temperature oxidation of butane. A more recently developed
rhodium catalyzed process produces acetaldehyde from synthesis gas as a coproduct with ethyl alcohol and acetic acid (83—94).
Oxidation of Ethylene. In 1894 F. C. Phillips observed the reaction of ethylene [74-85-1J in an aqueous palladium(II) chloride solution to
form acetaldehyde.
C2H4 + PdCl2 + H2O CH3CHO + Pd + 2 HC1
The direct liquid phase oxidation of ethylene was developed in 1957—1959 by Wacker-Chemie and Farbwerke Hoechst in which the catalyst is an aqueous
solution of PdCl2 and CuC^ (86).
Studies of the reaction mechanism of the catalytic oxidation suggest that a %-hydroxyethylene—palladium 7t-complex is formed initially, followed by
an intramolecular exchange of hydrogen and palladium to give a ^t7/7-hydroxyethylpalladium species that leads to acetaldehyde and metallic palladium
(88-90).
The metallic palladium is reoxidized to PdCl2 by the CuCl2 and the resultant cuprous chloride is then reoxidized by oxygen or air as shown.
Pd + 2 CuCl2 PdCl2 + 2 CuCl
2 CuCl + |o2 + 2 HC1 2 CuCl2 + H2O
Thus ethylene is oxidized continuously through a series of oxidation—reduction reactions (87,88). The overall reaction is
C2H4 7 °. • CH3CHO ДЯ = 427 kJ (102 kcal)
There are two variations for this commercial production route: the two-stage process developed by Wacker-Chemie and the one-stage process
developed by Farbwerke Hoechst (91—92). In the two-stage process shown in Figure 1, ethylene is almost completely oxidized by air to acetaldehyde in one
pass in a tubular plug-flow reactor made of titanium (93,94). The reaction is conducted at 125—130°C and 1.13 MPa (150 psig) using the palladium and
cupric chloride catalysts. Acetaldehyde produced in the first reactor is removed from the reaction loop by adiabatic flashing in a tower. The flash step also
removes the heat of reaction. The catalyst solution is recycled from the flash-tower base to the second stage (or oxidation reactor) where the cuprous salt is
oxidized to the cupric state with air. The high pressure off-gas from the oxidation reactor, mostly nitrogen, is separated from the liquid catalyst solution
and scrubbed to remove acetaldehyde before venting. A small portion of the catalyst stream is heated in the catalyst regenerator to destroy any undesirable
copper oxalate. The flasher overhead is fed to a distillation system where water is removed for recycle to the reactor system and organic impurities,
including chlorinated aldehydes, are separated from the purified acetaldehyde product. Synthesis techniques purported to reduce the quantity of chlorinated
by-products generated have been patented (95).
Kirk-Othmer Encyclopedia of Chemical Technology (4th Edition)
51
ACETALDEHYDE
Vol 1
Air
Acetaldehyde
Ethylene
Reaction
С-Ay aa
*****
Oxidation
distiHatfon Degassing
(*V
Steam
Final distillation
Fig. 1. The two-stage acetaldehyde process.
In the one-stage process (Fig. 2), ethylene, oxygen, and recycle gas are directed to a vertical reactor for contact with the catalyst solution under slight
pressure. The water evaporated during the reaction absorbs the heat evolved, and make-up water is fed as necessary to maintain the desired catalyst
concentration. The gases are water-scrubbed and the resulting acetaldehyde solution is fed to a distillation column. The tail-gas from the scrubber is
recycled to the reactor. Inert materials are eliminated from the recycle gas in a bleed-stream which flows to an auxiliary reactor for additional ethylene
conversion.
Fig. 2. The one-stage acetaldehyde process.
This oxidation process for olefins has been exploited commercially principally for the production of acetaldehyde, but the reaction can also be
applied to the production of acetone from propylene and methyl ethyl ketone [78-93-3] from butenes (87,88). Careful control of the potential of the catalyst
with the oxygen stream in the regenerator minimizes the formation of chloroketones (94). Vinyl acetate can also be produced commercially by a variation
of this reaction (96,97).
From Ethyl Alcohol. Some acetaldehyde is produced commercially by the catalytic oxidation of ethyl alcohol. The oxidation is carried out by
passing alcohol vapors and preheated air over a silver catalyst at 480°C (98).
CH3CH2OH - () • CHoCHO + H20 ДЯ = -242 kJ/mol (-57.84 kcal/mol)
о 2 1 q 2 о '2 / \ / /
With a multitubular reactor, conversions of 74—82% per pass can be obtained while generating steam to be used elsewhere in the process (99).
From Acetylene. Although acetaldehyde has been produced commercially by the hydration of acetylene since 1916, this procedure has been
almost completely replaced by the direct oxidation of ethylene. In the hydration process, high purity acetylene under a pressure of 103.4 kPa (15 psi) is
passed into a vertical reactor containing a mercury catalyst dissolved in 18—25% sulfuric acid at 70—90°C (see Acetylene-derived chemicals).
№CH + H2O --------------------SO4 (70—90° c) CH3CHO
Fresh catalyst is fed to the reactor periodically; the catalyst may be added in the mercurous form but the catalytic species has been shown to be a
mercuric ion complex (100). The excess acetylene sweeps out the dissolved acetaldehyde, which is condensed by water and refrigerated brine and then
scrubbed with water; this crude acetaldehyde is purified by distillation; the unreacted acetylene is recycled. The catalytic mercuric ion is reduced to
catalytically inactive mercurous sulfate and metallic mercury. Sludge, consisting of reduced catalyst and tars, is drained from the reactor at intervals and
resulfated. The rate of catalyst depletion can be reduced by adding ferric or other suitable ions to the reaction solution. These ions reoxidize the mercurous
ion to the mercuric ion; consequendy, the quantity of sludge which must be recovered is reduced (80,101). In one variation, acetylene is completely hydrated
with water in a single operation at 68—73°C using the mercuric—iron salt catalyst. The acetaldehyde is partially removed by vacuum distillation and the
mother liquor recycled to the reactor. The aldehyde vapors are cooled to about 35°C, compressed to 253 kPa (2.5 atm), and condensed. It is claimed that
this combination of vacuum and pressure operations substantially reduces heating and refrigeration costs (102).
From Synthesis Gas. A rhodium-catalyzed process capable of converting synthesis gas directly into acetaldehyde in a single step has been
reported (83,84).
CO + H2 CH3CHO + other products
Kirk-Othmer Encyclopedia of Chemical Technology (4th Edition)
52
ACETALDEHYDE
Vol 1
This process comprises passing synthesis gas over 5% rhodium on SiO2 at 300°C and 2.0 MPa (20 atm). Principal coproducts are acetaldehyde, 24%; acetic
acid, 20%; and ethanol, 16%. Although interest in new routes to acetaldehyde has fallen as a result of the reduced demand for this chemical, one possible
new route to both acetaldehyde and ethanol is the reductive carbonylation of methanol (85).
CH3OH + CO + H2 CH3CHO + H2O
The catalyst of choice is cobalt iodide with various promotors from Group 15 elements. The process is run at 140—200°C, 28—41 MPa (4,000—6,000 psi),
and gives an 88% conversion with 90% selectively to acetaldehyde. Neither of these acetaldehyde syntheses have been commercialized.
Specifications, Analytical and Test Methods
Commercial acetaldehyde has the following typical specifications: assay, 99% min; color, water-white; acidity, 0.5% max (acetic acid); specific gravity, 0.790
at 20°C; bp, 20.8°C at 101.3 kPa (1 atm). It is shipped in steel drums and tank cars bearing the ICC red label. In the liquid state, it is noncorrosive to most
metals; however, acetaldehyde oxidizes readily, particularly in the vapor state, to acetic acid. Precautions to be observed in the handling of acetaldehyde
have been published (103).
Analytical methods based on many of the reactions common to aldehydes have been developed for acetaldehyde determination. In the absence of
other aldehydes, it can be detected by the formation of a mirror from an alkaline silver nitrate solution (Tollens' reagent) and by the reduction of Fehling's
solution. It can be determined quantitatively by fuchsin—sulfur dioxide solution (Schiff s reagent), or by reaction with sodium bisulfite, the excess bisulfite
being estimated iodometrically. Acetaldehyde present in mixtures with other carbonyl compounds, such as organic acids, can be determined by paper
chromatography of 2,4-dinitrophenylhydrazones (104), polarographic analysis either of the untreated mixture (105) or of the semicarbazones (106), the
color reaction with thymol blue on silica gel (detector tube method) (107), mercurimetric oxidation (108), argentometric titration (109), microscopic (110)
and spectrophotometric methods (111), and gas—liquid chromatographic analysis (112). However, gas—liquid chromatographic techniques have superseded
most chemical tests for routine analyses.
Acetaldehyde can be isolated and identified by the characteristic melting points of the crystalline compounds formed with hydrazines,
semicarbazides, etc; these derivatives of aldehydes can be separated by paper and column chromatography (104,113). Acetaldehyde has been separated
quantitatively from other carbonyl compounds on an ion-exchange resin in the bisulfite form; the aldehyde is then eluted from the column with a solution
of sodium chloride (114). In larger quantities, acetaldehyde may be isolated by passing the vapor into ether, then saturating with dry ammonia;
acetaldehyde—ammonia crystallizes from the solution. Reactions with bisulfite, hydrazines, oximes, semicarbazides, and 5,5-dimethyl-l,3-cyclohexanedione
[126-81 -8] (dimedone) have also been used to isolate acetaldehyde from various solutions.
Health and Safety Factors
Acetaldehyde appears to paralyze respiratory muscles, causing panic. It has a general narcotic action which prevents coughing, causes irritation of the eyes
and mucous membranes, and accelerates heart action. When breathed in high concentration, it causes headache and sore throat. Carbon dioxide solutions
in acetaldehyde are particularly pernicious because the acetaldehyde odor is weakened by the carbon dioxide. Prolonged exposure causes a decrease of both
red and white blood cells; there is also a sustained rise in blood pressure (115—117). The threshold limit value (TLV) of acetaldehyde in air is 100 ppm (118).
In normal industrial operations there is no health hazard in handling acetaldehyde provided normal precautions are taken. Mixtures of acetaldehyde vapor
and air are flammable; they are explosive if the concentrations of aldehyde and oxygen rise above 4 and 9%, respectively. Reference 103 discusses handling
precautions.
Economic Aspects and Uses
The production pattern for acetaldehyde has undergone significant changes since the principal industrial routes to acetaldehyde were hydration of acetylene
and oxidation of ethyl alcohol. First, increasing acetylene costs made this feedstock economically unattractive. Then the two aldehyde Wacker-Hoechst
GmbH processes for the liquid-phase oxidation of ethylene to acetaldehyde began commercial operation. By 1968 more acetaldehyde was produced by the
direct oxidation of ethylene using the Wacker process than from ethanol. Union Carbide discontinued its annual production of 90,700 t of acetaldehyde
from ethanol in late 1977 (119). The percentage of ethanol consumed for acetaldehyde in the United States dropped from 20% in 1971 to zero in 1984.
Figure 3 shows the production of acetaldehyde in the years 1969 through 1987 as well as an estimate of 1989—1995 production. The year 1969 was a
peak year for acetaldehyde with a reported production of 748,000 t. Acetaldehyde production is linked with the demand for acetic acid, acetic anhydride,
cellulose acetate, vinyl acetate resins, acetate esters, pentaerythritol, synthetic pyridine derivatives, terephthalic acid, and peracetic acid. In 1976 acetic acid
production represented 60% of the acetaldehyde demand. That demand has diminished as a result of the rising cost of ethylene as feedstock and methanol
carbonylation as the preferred route to acetic acid (qv).
Year
Fig. 3. Fig. 3. U.S. acetaldehyde production.
The nameplate capacities for acetaldehyde production for the United States in 1989 are shown in Table 5 (120). Synthetic pyridine derivatives,
peracetic acid, acetate esters by the Tischenko route, and pentaerythritol account for 40% of acetaldehyde demand. This sector may show strong growth in
some products but all of these materials maybe prepared from alternative processes.
Kirk-Othmer Encyclopedia of Chemical Technology (4th Edition)
53
ACETALDEHYDE
Voll
Table 5. United States Acetaldehyde Producers, 1989
Producer, location Capacity, 103 t/yr
Hoechst-Celanese, Bay City, Tex. 217
Texas Eastman Co., Longview, Tex. 226
The price of acetaldehyde during the period 1950 to 1973 ranged from $0.20 to 0.22/kg. Increased prices for hydrocarbon cracking feedstocks
beginning in late 1973 resulted in higher costs for ethylene and concurrent higher costs for acetaldehyde. The posted prices for acetaldehyde were $0.26/kg
in 1974, $0.78/kg in 1985, and $0.92/kg in 1988. The future of acetaldehyde growth appears to depend on the development of a lower cost production
process based on synthesis gas and an increase in demand for processes based on acetaldehyde activation techniques and peracetic acid.
BIBLIOGRAPHY
"Acetaldehyde" in ECT 1st ed., Vol. 1, pp. 32—43, by M. S. W. Small, Shawinigan Chemicals Limited; in ECT 2nd ed., Vol. 1, pp. 77—95, by E. R. Hayes,
Shawinigan Chemicals Limited (1963); in ECT 3rd ed., Vol. 1, pp. 97—112, by H. J. Hagemeyer, Jr., Texas Eastman Company (1978).
1. K. F. Coles and F. Popper, Ind. Eng. Chem. 42, 1434 (1950).
2. T. E. Smith and R. F. Bonner, Ind. Eng. Chem. 43, 1169 (1951).
3. A. A. Dobrinskaya, V. C. Markovich, and M. B. Neiman, I^y. Akad. Nauk SSR Ser. Khim. 434, (1953); Chem. Abstr. 48, 4378 (1955).
4. R. P. Kirsanova and S. Sh. Byk, Eh. Prikl Khim. Eeningrad 31, 1610 (1958).
5. A. E. Rabe, University Microfilm, Ann Arbor, Mich., L. C. Card Mic. 58—1920.
6. D. S. Tsiklis and A. M. Kofman, Zh. Fi%. Khim. 31, 100 (1957).
7. W. H. Horsley, Adv. Chem. Ser. 35, 27 (1962).
8. 8. D. S. Tsiklis, Zh. Fi% Khim. 32, 1367 (1958).
9. D. S. Tsiklis and Ya. D. Shvarts, Zh. Fi%. Khim. 31, 2302 (1957).
10. P. M. Chaudhuri and co-workers,/. Chem. Eng. Data 13, 9 (1968).
11. C. F. Coleman andT. DeVries,/ Am. Chem. Soc. 71, 2839 (1949).
12. K. A. Kobe and H. R. Crawford, Pet. Refiner KI (ty), 125 (1958).
13. K. S. Pitzer and W. Weltner, Jr.,/ Am. Chem. Soc. 71, 2842 (1949).
14. L. D. Christensen and J. M. Smith, Ind. Eng. Chem. 42, 2128 (1950).
15. D. M. Newitt, L. M. Baxt, and V. V. Kelkar,/ Chem. Soc. T1K3, 1711 (1939).
16. J. H. Burgoyne and R. F. Neale, Fuel 32, 5 (1953).
17. J. Chamboux and M. Lucquin, Compt. Rend. 246, 2489 (1958).
18. A. G. White and E. Jones,/ Soc. Chem. Ind. Eondon 69, 2006, 209 (1950).
19. F. C. Mitchell and H. C. Vernon, Chem. Metall Eng. 44, 733 (1937).
20. В. P. Mullins, Fuel32, 481 (1953).
21. S. S. Penner and В. P. Mullins, Explosions, Detonations, Flammability and Ignition, Pergamon Press, Inc., New York, 1959, pp. 199—203.
22. R. O. King, S. Sandler, and R. Strom, Can. J. Technol. KI, 103 (1954).
23. S. Ono, Rev. Phys. Chem.Jpn. 1946, 42; Chem. Abstr. 44, 4661 (1950).
24. N. M. Emanuel, Dokl. Akad. Nauk SSSR 59, 1137 (1948); Chem. Abstr. 42, 7142 (1948).
25. T. E. Pavlovskaya and N. M. Emanuel, Dokl. Akad. Nauk SSSR 58, 1693 (1947); Chem. Abstr. 46, 4231 (1952).
26. E. M. Wilson, / Am. Rocket Soc. 23, (1953).
27. H. Nilsen, Tidsskr. KjemiBergves. Metall Yl, 149 (1957); Chem. Abstr. 53, 10916 (1959).
28. F. P. Lossing, Can. J. Chem. 35, 305 (1957).
29. R. K. Brinton and D. H. Volman,/ Chem. Phys. 20, 1053,1054 (1952).
30. P. D. Zemany and M. Burton,/ Am. Chem. Soc. 73, 499, 500 (1951).
31. R. P. Bell and J. C. Clunie, Trans. Faraday Soc. 48, 439 (1952).
32. R. P. Bell andM. Rand, BullSoc. Chim. Fr. 115 (1955).
33. H. J. Hagemeyer, Jr., Ind. Eng. Chem. 41, 766 (1949).
34. A. F. Cadenhead, Can. Chem. Process. 39(7), 78 (1955).
35. G. Benson, Chem. NIetall. Eng. 47, 150,151 (1940).
36. B. Phillips, F. C. Frostick, Jr., and P. S. Starcher,/ Am. Chem. Soc. 79, 5982 (1957).
37. U.S. Pat. 2,8309,080 (reissued RE-25057) (Apr. 8, 1958), H. B. Stevens (to Shawinigan Chemicals Ltd.).
38. U.S. Pat. 3,290,378 (Dec. 6, 1966), K. Tsunemitsu and Y. Tsujino.
39. Ger. Pat. 573,721 (Apr. 5, 1933), M. Mugdam and J. Sixt (to Consortium fbr electrochemische Industrie G.m.b.H.).
40. U.S. Pat. 3,240,803 (Mar. 15, 1966), B. Thompson and S. D. Neeley (to Eastman Kodak Co.).
41. U.S. Pat. 2,287,803 (June 30,1943), D. C. Hull (to Eastman Kodak Co.).
42. T. Sas a,/. Soc. Ovg. Syn. Chem.Jpn. 12, 60 (1954); Chem. Abstr. 51, 2780 (1957).
43. Fr. Pat. 973,322 (Feb. 9,1951), H. M. Guinot (to Usines de Melle).
44. С. C. Oldenburg and H. F. Rase, Am. Inst. Chem. Eng. J. 3, 462 (1957).
45. U.S. Pat. 2,318,341 (May 1943), B. Thompson (to Eastman Kodak Co.).
46. U.S. Pat. 2,479,559 (Aug. 1949), A. A. Dolnick and co-workers (to Publicker Ind. Inc.).
47. T. Kawaguchi and S. Hasegawa, Tokyo Gakugei Daigaku Kiyo Dai 4 Bu 21, 64 (1969).
48. U.S. Pat. 2,426,961 (Sept. 2,1947), R. S. Wilder (to Publicker Ind. Inc.).
49. M. W. Travers, Trans. Faraday Soc. 32, 246 (1936).
50. M. Letort, Compt. Rend. 202, 767 (1936).
51. O. Vogl,/ Poly. Sci. A 2, 4591 (1964).
52. J. T. Furukawa, hPacromol Chem. KI, 149 (1969).
53. U.S. Pat. 2,810,6 (Oct. 22, 1957), J. F. Gabbet, Jr. (to Escambia Chemical Corp.).
54. Y. Pocker, Chem. Ind. 1959, 599 (1959).
55. R. P. Bell andM. J. Smith,/ Chem. Soc. 1691 (1958).
56. W. Langenbeck, J. Alm, and K. W. Knitsch,/ Prakt. Chem. 8, 112 (1959).
57. E. Beriow, R. H. Barth, and J. E. Snow, The Pentaerythritols, Reinhold Publishing Corporation, New York, 1959, pp. 4—24.
58. Fr. Pat. 962,381 (June 8, 1950) (to Etablissements Kuhlmann).
59. U.S. Pat. 3,701,798 (Oct. 31, 1972), T. C. Snapp, A. E. Blood, andH. J. Hagemeyer, Jr. (to Eastman Kodak Co.).
60. A. S. Hester and K. Himmler, Ind. Eng. Chem. 51, 1428 (1959).
Kirk-Othmer Encyclopedia of Chemical Technology (4th Edition)
54
ACETALDEHYDE
Vol 1
61. U.S. Pat. 3,714,236 (Jan. 30, 1973), H. N. Wright and H. J. Hagemeyer, Jr. (to Eastman Kodak Co.).
62. M. S. Asde, Industrial Organic Nitrogen Compounds, Reinhold Publishing Corporation, New York, 1961, pp. 134—136.
63. S. L. Levy and D. F. Othmer, Ind. Eng. Chem. 47, 789 (1955).
64. J. F. Carson and H. S. Olcott,/. Am. Chem. Soc. 76, 2257 (1954).
65. J. Deschamps, M. Paty, and P. Pineau, Compt. Eend. 238, 911 (1954).
66. Neth. Pat. Appl. 6,510,968 (Feb. 21,1966) (to Lummus Co.); W. G. Lloyd,/ Org. Chem. 34, 3949 (1969).
67. U.S. Pat. 2,691,684 (Oct. 12, 1954), L. K. Frevel and J. W. Hedelund (to The Dow Chemical Company).
68. В. B. Corson and co-workers, Ind. Eng. Chem. 42, 359 (1950).
69. S. L. Lelchuk, Khim. Prom. 1946(9), 16 (1946); Chem. Abstr. 41, 3756 (1947).
70. W. T. Cave, Ind. Eng. Chem. 45, 1854 (1953).
71. Jpn. Pat* 4713 (Nov. 14, 1952), J. Imamura (to Bureau of Industrial Technics); Chem. Abstr. 47, 11224 (1953).
72. M. N. Shchukina, Eh. Obshch. Khim. 18, 1653 (1948); Chem. Abstr. 43, 2575 (1949).
73. N. N. Lichton and F. Granchelli,/. Am. Chem. Soc. 76, 3729 (1954).
74. Jpn. Pat. 153,599 (Nov. 2,1942), Y. Kato; Chem. Abstr. 43, 3027 (1949).
75. G. Ulari, Gayy. Chim. Ital. 81, 439 (1951); Chem. Abstr. 46, 5532 (1952).
76. R. Lombard and R. Boesch, Bull. Soc. Chim. Er. 1953(10), C23 (1953).
77. K. Sennewald and К. H. Steil, Chem. Ing. Tech. 30, 440 (1958).
78. E. H. Man, J. J. Sanderson, and C. R. Hauser, / Am. Chem. Soc. 72, 847 (1950).
79. С. C. Coffin, Can. J. Res. 5, 639 (1931).
80. P. W. Sherwood, Pet. Refiner 34(3), 203 (1955).
81. St. Grzelczyk, Pryem. Chem. 12(35), 696 (1956); Chem. Abstr. 52, 12753 (1958).
82. M. I. Farberov and K. A. Machtina, Uch. Eap. Yarosl. Tekhnol Inst. 2, 5 (1957); Chem. Abstr. 53, 18041 (1959).
83. W. Ger. Offen. 2,503,204 (Jan. 28,1974), M. M. Bhasin (to Union Carbide Co.).
84. Belg. Pat. 824,822 (July 28,1975) (to Union Carbide Co.).
85. U.S. Pat. 4,337,365 (June 29,1982), W. E. Walder (to Union Carbide Co.).
86. R. Jira and W. Freiesleben, Organomet. React. 3, 22 (1972).
87. J. Smidt and co-workers, Angew. Chem. 71, 176 (1959).
88. J. Smidt, Chem. Ind. Eondon 1962(2), 54 (1962).
89. R. Jira,J. Sedlmeier, andj. Smidt,JustusEiebigsAnn. Chem. 6993, 99 (1966).
90. R. Jira, W. Blan, and D. Grimm, Hydrocarbon Process. 55(3), 97 (1976).
91. Can. Pat. 625,430 (Aug. 8, 1961), J. Smidt and co-workers (to Consortium fur elektrochemische Industrie (G.m.b.H.).
92. Pet. Refiner 40(11), 206 (1961).
93. R. P. Lowry, Hydrocarbon Process. 53(11), 105 (1974).
94. R. Jira, in S. A. Miller, ed., Ethylene and Its Industrial Derivatives, Ernest Benn Ltd., London, 1969, pp. 639—553.
95. U.S. Pat. 4,720,474 (Sept. 24, 1985), J. Vasilevskis and co-workers (to Catalytica Associates).
96. Brit. Pat. 1,109,483 (Apr. 10, 1968), H. J. Hagemeyer, Jr., and co-workers (to Eastman Kodak Co.).
97. K. R. Bedell and H. A. Rainbird, Hydrocarbon Process. 51(11), 141 (1972).
98. W. L. Faith, D. B. Keyes, and R. L. Clark, Industrial Chemicals, 2nd ed., John Wiley & Sons, Inc., New York, 1957, pp. 2—3.
99. U.S. Pat. 3,284,170 (Nov. 8, 1966), S. D. Neeley (to Eastman Kodak Co.).
100. K. Schwabe and J. Voigt, Z Phys. Chem. Ееfig 203, 383 (1954).
101. Pet. Refiner 40(11), 207 (1961).
102. D. F. Othmer, K. Kon, andT. Igarashi, Ind. Eng. Chem. 48, 1258 (1956).
103. Chemical Safety Data Sheet SD-43, Properties and Essential Information for Safe Handling and Use of Acetaldehyde, Manufacturing Chemists Association,
Inc., Washington, D.C., 1952.
104. R. Ellis, A. M. Gaddis, and G. T. Currie, Anal. Chem. 30, 475 (1958).
105. S. Sandler and Y. H. Chung, Anal. Chem. 30, 1252 (1958).
106. D. M. Coulson, Anal. Chim. Acta. 19, 284 (1958).
107. Y. Kobayashi, Yuki Gosei Kagaku Kyokai Shi 16, 625 (1958); Chem. Abstr. 53, 984 (1959).
108. J. E. Ruch and J. B. Johnson, Anal. Chem. 28, 69 (1956).
109. H. Siegel and F. T. Weiss, Anal. Chem. 26, 917 (1954).
110. R. E. Dunbar and A. E. Aaland, Microchem. J. 2, 113 (1954).
111. J. H. Ross, Anal. Chem. 25, 1288 (1953).
112. R. Stevens, Anal. Chem. 33, 1126 (1961).
113. L. Nebbia and F. Guerrieri, Chim. Ind. Milan 39, 749 (1957).
114. G. Gabrielson and O. Samuelson, Sven. Km. Tidskr. 64, 150 (1952) (in English); Chem. Abstr. 46, 9018 (1952).
115. E. W. Page and R. Reed, Am. J. Physiol. 143, 122 (1945).
116. E. Skog, Acta Pharmacol. Toxicol. 6, 299 (1950).
117. H. F. Smyth, Jr., С. P. Carpenter, and C. S. Weil,/ Ind. Hyg. Toxicol. 31, 60 (1949).
118. H. I. Sax, Dangerous Properties of Industrial Materials, Van Nostrand-Reinhold Publishing Corp., New York, 1989, p. 6.
119. Chem. Mark. Rep. 3 (Dec. 27, 1976).
120. "Acetaldehyde, 601.500H," Chemical Economics Handbook, SRI International, Menlo Park, Calif., 1989.
H.J. Hagemeyer
Texas Eastman Company
Kirk-Othmer Encyclopedia of Chemical Technology (4th Edition)
55
ACETAL RESINS
Vol 1
ACETAL RESINS
The term "acetal resins" commonly denotes the family of homopolymers and copolymers whose main chains are completely or essentially composed of
repeating oxymethylene units (—CH2—О—) . The polymers are derived chiefly from formaldehyde or methanal 50-00-00]either direcdy or through its
cyclic trimer, trioxane or 1,3,5-trioxacyclohexane [110-88-3].
Formaldehyde polymers have been known for some time (1) and eady investigations of formaldehyde polymerization contributed significandy to
the development of several basic concepts of polymer science (2). Polymers of higher aliphatic homologues of formaldehyde are also well known (3) and
frequendy referred to as aldehyde polymers (4). Some have curious properties, but none are commercially important.
Formaldehyde homopolymer is composed exclusively of repeating oxymethylene units and is described by the term polyoxymethylene (POM)
[9002-81-7]. Commercially significant copolymers, for example [95327-43-8]^ have a minor fraction (typically less than 5 mol %) of alkylidene or other units,
derived from cyclic ethers or cyclic formats, distributed along the polymer chain. The occasional break in the oxymethylene sequences has significant
ramifications for polymer stabilization.
Acetal resins were first commercialized by Du Pont in 1960 under the tradename Delrin (registered trademark of E. I. du Pont de Nemours and Co.,
Inc.) Introduction of the then new engineering plastics followed development of suitable processes for the preparation of high molecular weight
formaldehyde homopolymer (5) and for the requisite conversion of the homopolymer's unstable end groups by a procedure known as end-capping (6).
Development and commercialization of copolymers of trioxane with cyclic ethers (eg, ethylene oxide) by Celanese (7) quickly followed in 1962. The
copolymers did not require end-capping. Rather, good polymer stability could be achieved by ablation of unstable polymer fractions by a suitable process
(8). Today there are ten producers of acetal resins, mosdy copolymers.
Throughout the remainder of this article the term homopolymer refers to Delrin acetal resin manufactured and sold by Du Pont; the term
copolymer refers to Celcon acetal copolymer resins (registered trademark of Hoechst Celanese Corporation).
Structure and Properties
The many commercially attractive properties of acetal resins are due in large part to the inherent high crystallinity of the base polymers. Values reported for
percentage crystallinity (x ray, density) range from 60 to 77%. The lower values are typical of copolymer. Polyoxymethylene most commonly crystallizes in a
hexagonal unit cell (9) with the polymer chains in a 9/5 helix (10,11). An orthorhombic unit cell has also been reported (9). The oxyethylene units in
copolymers of trioxane and ethylene oxide can be incorporated in the crystal lattice (12). The nominal value of the melting point of homopolymer is 175°C,
that of the copolymer is 165°C. Other thermal properties, which depend substantially on the crystallization or melting of the polymer, are listed in Table 1.
See also reference 13.
Table 1. Thermal Characteristics of Acetal Resins
Property ASTM test method Homopolymer Copolymer
heat deflection temperature, °C D648
at 1.82 MPa’ 136 110
at 0.45 MPa 172 158
coefficient of linear thermal expansion xlO6 per °C, —40 to 30°C D696 75 84
thermal conductivity, W/(m-K) 0.2307 0.2307
specific heat, J/(kg-K)b 1465 1465
melting point, °C 175 165
flow temperature, °C D569 184 174
To convert MPa to psi, multiply by 145.
To convert J to cal, divide by 4.184.
The high crystallinity of acetal resins contributes significandy to their excellent resistance to most chemicals, including many organic solvents. Acetal
resins retain their properties after exposure to a wide range of chemicals and environments. More detailed data are available (14).
The polymers dissolve in l,l,l,3,3,3-hexafluoro-2-propanoI [920-66-1hot phenols, and NA-dimethylformamide [68-12-2] near its boiling point.
The excellent solvent resistance notwithstanding, solvents suitable for measurement of intrinsic viscosity, useful for estimation of molecular weight, are
known (13,15).
Mechanical Properties. Stiffness, resistance to deformation under constant applied load (creep resistance), resistance to damage by cyclical
loading (fatigue resistance), and excellent lubricity are mechanical properties for which acetal resins are perhaps best known and which have contributed
significandy to their excellent commercial success. General purpose acetal resins are substantially stiffer than general purpose polyamides (nylon-6 or -6,6
types) when the latter have reached equilibrium water content. The creep and fatigue properties are known and predictable and very valuable to the design
engineer.
Typical values of important properties of general purpose acetal resins (homopolymer and copolymer) are collected in Table 2. Properties in the
table were determined on specimens subjected only to the conditioning required by the ASTM procedure. In this case, values measured for homopolymer
are characteristically higher than those for copolymer.
Table 2. Mechanical Properties of Acetal Resin
Property ASTM test method Homopolymer Copolymer
tensile strength, yield, \1 Pa , 23°C D638 68.9 60.6
elongation, break, % D638 25-75 40-75
tensile modulus, MPaa, 23°C D638 3100 2825
Kirk-Othmer Encyclopedia of Chemical Technology (4th Edition)
56
ACETAL RESINS
Vol 1
flexural strength, MPaa, 23°C D790 97.1 89.6
flexural modulus, MPa/ 23°C D790 2830 2584
compressive stress, MPa , 23°C D695 35.8 31
1% deflection 35.8 31
10% deflection 124 110
shear strength, MPa/ 23°C D732 65 53
Izod impact strength, notched, 3.175 mm,J/m , D256
23°C 69-122 53-80
-40° C 53-95 43-64
water absorption, % 24-h immersion D570 0.25 0.22
equilibrium, 50% rh, 23°C 0.22 0.16
equilibrium, immersion 0.9 0.80
Rockwell hardness, M scale D785 94 80
coefficient of friction, dynamic steel D1894 0.1-0.3 0.15
aluminum, brass 0.15
acetal resin 0.35
specific gravity D792 1.42 1.41
To convert MPa to psi, multiply by 145.
b To convert J/m to ftlb/in., divide by 53.39.
Electrical Properties.
Electrical properties of acetal resin are collected in Table 3. The dielectric constant is constant over the temperature range of most interest (—40 to 50°C).
Table 3. Electrical Properties of Acetal Resins
Property ASTM test method Homopolymer Copolymer
dielectric constant, 102—106Hz D150 3.7 3.7
dissipation factor D150
102 Hz 0.0010
103 Hz 0.0010
104 Hz 0.0015
106 Hz 0.0048 0.006
dielectric strength, kV/mm, short time, 2.29-mm D149 20 20
sheet
surface resistivity, ohm D257 1 x 10¹⁵ 1.3 x 10¹⁶
volume resistivity, ohm-cm D257 1 x 10¹⁵ 1 x 10¹⁴
Chemical Structure and Properties. Homopolymer consists exclusively of repeating oxymethylene units. The copolymer contains
alkylidene units (eg, ethylidene —CH2—CH2—) randomly distributed along the chain. A variety of end groups may be present in the polymers. Both
homopolymer and copolymer may have alkoxy, especially methoxy (CH3 О—), or formate (HCOO—} end groups. Copolymer made with ethylene oxide has
2-hydroxyethoxy end groups. Homopolymer generally has acetate end groups.
The number-average molecular weight of most commercially available acetal resins is between 20,000 and 90,000. Weight-average molecular weight
may be estimated from solution viscosities.
The details of the commercial preparation of acetal homo- and copolymers are discussed later. One aspect of the polymerization so pervades the
chemistry of the resulting polymers that familiarity with it is a prerequisite for understanding the chemistry of the polymers, the often subde differences
between homo- and copolymers, and the difficulties which had to be overcome to make the polymers commercially useful. The ionic polymerizations of
formaldehyde and trioxane are equilibrium reactions. Unless suitable measures are taken, polymer will begin to revert to monomeric formaldehyde at
processing temperatures by depolymerization (called unzipping) which begins at chain ends.
The intrinsic stability of the polymer can be substantially improved by converting unstable hemiacetal end groups to more stable acetate esters in a
process, referred to as endcapping, which is routinely practiced with homopolymer. In copolymers, depolymerization proceeds only until a comonomer
unit (eg, —CH2 CH2—) is encountered and unzipping stops. Any chemical process which leads to cleavage of the polymer chain or to formation of
unstable end groups presages complete destruction of a homopolymer chain. In copolymers, the comonomer units (eg, —CH2CH2—) add further stability
by acting as chain blockers. That is, once a chain is cleaved, the effective length of chain that can unzip is smaller for copolymer. In addition, the greater
prevalence of ester end groups in homopolymer reduces their stability in alkaline environments compared to copolymer.
Acetal resins are generally stable in mildly alkaline environments. However, bases can catalyze hydrolysis of ester end groups, resulting in less
thermally stable polymer.
Properly end-capped acetal resins, substantially free of ionic impurities, are relatively thermally stable. However, the methylene groups in the polymer
backbone are sites for peroxidation or hydroperoxidation reactions which ultimately lead to scission and depolymerization. Thus antioxidants (qv),
especially hindered phenols, are included in most commercially available acetal resins for optimal thermal oxidative stability.
Like most other engineering thermoplastics, acetal resins are susceptible to photooxidation by oxidative radical chain reactions. Carbon—hydrogen
bonds in the methylene groups are principal sites for initial attack. Photooxidative degradation is typically first manifested as chalking on the surfaces of
parts.
Other aspects of stabilization of acetal resins are briefly discussed under processing and fabrication. Reference 15 provides a more detailed
discussion of the mechanism of polymer degradation.
When ignited, nonfilled acetal resins bum in air with a characteristic dull blue flame.
Testing. Melt index or melt flow rate at 190°C, according to ASTM D1238, is the test most frequendy applied to the characterization of
commercial acetal resins. The materials are typically grouped or differentiated according to their melt flow rate. Several other ASTM tests are commonly
used for the characterization and specification of acetal resins.
The weight average molecular weight of acetal copolymers may be estimated from their melt index (MI, expressed in g/10 min) according to the
relation
Kirk-Othmer Encyclopedia of Chemical Technology (4th Edition)
57
ACETAL RESINS
Vol 1
MI = 3.30 x 10ls MJ3'55
The comonomer content of copolymers may be estimated by nmr or by controlled solvolysis of the copolymer followed by quantitative
chromatographic analysis of the residues.
Manufacturing
Although there is a substantial body of information in the public domain concerning the preparation of polyacetals, the details of processes for
manufacturing acetal resins are kept highly confidential by the companies that practice them. Nevertheless, enough information is available that reasonably
accurate overviews can be surmised. Manufacture of both homopolymer and copolymer involves critical monomer purification operations, discussion of
which is outside the scope of this article (see Formaldehyde). Homopolymer and copolymer are manufactured by substantially different processes for
accomplishing substantially different polymerization chemistries.
Homopolymer. Formaldehyde polymerizes by both anionic and cationic mechanisms. Strong acids are needed to initiate cationic
polymerization. Anionic polymerization, which can be initiated by relatively weak bases (eg, pyridine), can be represented by the following
equations: Initiation
vi11; + н2с=о в—сн2—о vi1
Propagation
в—CH2—О VI 1 + (n + 1) H2C=O B—CH2—O(CH2—O)n—CH2—О VI 1
The exact structure of M + and В - depends on solvent, the initiator used, and incidental impurities (eg, water).
The anionic polymerization of formaldehyde is free of most spontaneous termination reactions common to free-radical chain growth
polymerization of vinyl monomers. Chain transfer to monomer is an intrinsic molecular-weight-regulating reaction and results in one formate and one
methoxy end group. Molecular-weight-regulating agents, especially alcohols, are customarily used for optimum control of molecular weight. If an alcohol is
used, an alkoxy end group results.
In production, anhydrous formaldehyde is continuously fed to a reactor containing well-agitated inert solvent, especially a hydrocarbon, in which
monomer is sparingly soluble. Initiator, especially amine, and chain-transfer agent are also fed to the reactor (5,16,17). The reaction is quite exothermic and
polymerization temperature is maintained below 75°C (typically near 40°C) by evaporation of the solvent. Polymer is not soluble in the solvent and
precipitates early in the reaction.
Polyoxymethylene is obtained as a finely divided solid. The bulk density of the product, which is very important for ease of handling in subsequent
manufacturing steps, is influenced by many reaction variables, including solvent type, polymerization temperature, and agitation.
Polymer is separated from the polymerization slurry and slurried with acetic anhydride and sodium acetate catalyst. Acetylation of polymer end
groups is carried out in a series of stirred tank reactors at temperatures up to 140°C. End-capped polymer is separated by filtration and washed at least
twice, once with acetone and then with water. Polymer is made ready for extrusion compounding and other finishing steps by drying in a steam-tube drier.
Copolymer.
Copolymerization of trioxane with cyclic ethers or formats is accomplished with cationic initiators. Boron trifluoride dibutyl etherate is used in one process.
In this case, the actual initiating species is formed by reaction with water (18). Polymerization by ring opening of the 6-membered ring to form high
molecular weight polymer does not commence immediately upon mixing monomer and initiator. Rather, an induction period is observed during which an
equiEbrium concentration of formaldehyde is produced (18,19).
I+ + No—CH2ip I—OCH2—OCH2—0“CH2 I—OCH2—0“CH2 + CH2O
When the equiEbrium formaldehyde concentration is reached, polymer begins to precipitate. Further polymerization takes place in trioxane solution and,
more importandy, at the surface of precipitated polymer.
Comonomer is exhausted at relatively low conversion (20), but a random copolymer is nevertheless obtained. This is because a very facile
transacetalization reaction allows for essentially random redistribution of the comonomer units (18) and also results in a polydispersity index near 2.0 (21).
Transfer reactions, analogous to those discussed for homopolymer, also occur during the copolymerization reaction and result in formate end
groups.
The enthalpy of the copolymerization of trioxane is such that bulk polymerization is feasible. For production, molten trioxane, initiator, and
comonomer are fed to the reactor; a chain-transfer agent is in eluded if deshed. Polymerization proceeds in bulk with precipitation of polymer and the
reactor must supply enough shearing to continually break up the polymer bed, reduce particle size, and provide good heat transfer. The mixing
requirements for the bulk polymerization of trioxane have been reviewed (22). Raw copolymer is obtained as fine crumb or flake containing imbibed
formaldehyde and trioxane which are substantially removed in subsequent treatments which may be combined with removal of unstable end groups.
Acetal copolymer may be end-capped in a process completely analogous to that used for homopolymer. However, the presence of comonomer
units (eg, —О—CH2—CH2—О—) in the backbone and the relative instabiEty to base of hemiacetal end groups allow for another convenient route to
polymer with stable end groups. The hemiacetal end groups may be subjected to base catalyzed (especially amine) hydrolysis in the melt (23,24) or in
solution (25) or suspension (26) and the chain segments between the end group and the nearest comonomer unit deEberately depolymerized until the
depropagating chain encounters the "zipper-jamming" comonomer unit. If ethylene oxide or dioxolane is used as comonomer, a stable hydroxyethyl ether
end group results (—О—CH2CH2—OH). Some formate end groups, which are intermediate in thermal stabiEty between hemiacetal and ether end groups,
may also be removed by this process.
Product from melt or suspension treatment is obtained (Erectly as crumb or powder. Polymer recovered from solution treatment is obtained by
precipitative cooling or spray drying. Polymer with now stable end groups may be washed and dried to remove impurities, especially acids or then
precursors, prior to finishing operations.
Processing and Fabrication
Finishing. All acetal resins contain various stabilizers introduced by the suppEer in a finishing extrusion (compounding) step. The particular
stabilizers used and the exact method of then incorporation are generally not revealed. Thermal oxidative and photooxidative stabilizers have already been
mentioned. These must be carefully chosen and tested so that they do not aggravate more degradation (eg, by acidolysis) than they mitigate.
Traces of formaldehyde, present in neat end-capped polymer or produced by processing polymer under abusive conditions, detract from polymer
stabiEty. Commercial resins typically contain formaldehyde scavengers. Nitrogen compounds, especially amines and amides, epoxies, and polyhydroxy
compounds, are particularly efficacious scavengers.
A variety of other additives may be incorporated during finishing extrusion to produce acetal resins especially formulated to enhance certain
characteristics for specific appEcations.
Fabrication. Acetal resins are most commonly fabricated by injection molding. A homogeneous melt is essential for optimum appearance and
for performance of injection molded parts. A screw compression ratio of no less than 3:1 is advised and the size of the injection molded shot should be 50
to 75% of the rated capacity (based on polystyrene) of the barrel.
Kirk-Othmer Encyclopedia of Chemical Technology (4th Edition)
58
ACETAL RESINS
Vol 1
Acetal resins may also be fabricated into rod, slab, and other shapes by profile extrusion. Extruded shapes are frequendy further machined. Parts
fabricated by molding or extrusion are ammenable to all typical postforming processes.
Reference 27 gives a concise overview of the processing and fabrication of acetal resins.
Scrap and Recycle. Acetal resins can be processed with very little waste. Sprues, runners, and out-of-tolerance parts can, in general, be ground
and the resins reused. Up to about 25% of regrind can usually be safely recycled into virgin resin. However, the amount of regrind that can be used in a
particular circumstance varies. The appropriate literature from the supplier should be consulted.
Acetal resins are one of several plastic materials specifically targeted for recycle in at least one soon-to-be-constructed recycling facility (28).
Resin Grades. Nonfilled and unmodified (except for stabilizers) grades of acetal resin are generally differentiated on the basis of melt index.
Table 4 gives the nominal melt index of various grades of nonfilled Celcon acetal copolymer from Hoechst Celanese. Where possible, the grade of Delrin
or Ultraform (registered trademark of the BASF Corporation) that has the most similar nominal melt index is listed. Similarity in MI does not a priori imply
that particular resin grades are interchangeable. Standard grades are generally available in a wide variety of colors.
Table 4. Nonfilled Acetal Resins, General Purpose
Nominal Ml/ g/10 min Hoechst Celanese Celcon Du Pont Delrin BASF Ultraform
2.5 M25 100
9.0b M90 500 H2320
27.0 M270 900 H2330
45.0 M450 1700
a MI = melt index according to ASTM.
This is perhaps the most commonly encountered melt index.
Grades of acetal resins specifically designed to enhance the excellent lubricity of the material, without sacrifice in other properties, are known. These
include Delrin AF, Ultraform N2311, and Celcon LW materials. Antistatic grades, particularly useful in electronic applications, have been developed. At
least one recendy introduced new grade, Celcon SR90, claims good scuff resistance.
Development of toughened acetals has recently flourished. One such grade, Delrin 100ST, boasts a notched-impact strength of 900 J/m
(16.86 ft-lb/in.) at 23°C, substantially higher than that of nonmodified, general purpose grades (Table 2).
Glass-fiber-reinforced (increased stiffness and tensile strength) and mineral filled (reduced shrink and warp) grades also have been developed.
Economic Aspects
Supply and demand statistics for 1988 for all regions of the world as compiled by SRI International are given in Table 5. The world producers of acetal
resins and their annual capacities are listed in Table 6 (29). Hoechst Celanese and Ultraform Corporation (a joint venture of Degussa and BASF) have
announced capacity expansions in the United States to 77,000 t and 16,000 t, respectively; both were due in place in 1990. Part of general capacity
expansion plans, announced by Du Pont for completion in 1991, are believed to apply to acetal resins.
Table 5. World Supply/Demand for Polyacetal Resins for 1988a,b
United States Western Europe Japan О the/ Total
capacity 125 116 127 21 389
production 118 100 110 11 339
imports 3 17 4 56-60 80-84
exports 36-41 16 24 79-84
apparent consumption 80-84 101 87 67-71 335-343
a Ref. 29. Courtesy of SRI International.
As of October 1989 in thousands of tons.
Includes Mexico, USSR, and Poland.
Table 6. World Producers of Polyacetal Resins*
Company and plant location______________________________________________________________________________Annual capacity, 103 t
North America
United States
E.I. du Pont de Nemours & Company, Inc. 45
Hoechst Celanese Corporation 68
Ultraform Company
Mexico
Du Pont, S.A de C.V. 1.4
Western Europe
Germany, Federal Republic of
Ticona Polymerwerke GmbH 45
Ultraform GmbH 25
Netherlands
Du Pont de Nemours (Nederland) BV 45
Asia
Japan
Asahi Chemical Industry Co., Ltd 30
Mitsubishi Gas Chemical Co., Ltd. 20
Polyplastics Co., Ltd.d 77
Korea, Republic of
Korea Engineering Plasticsd Ю
Kirk-Othmer Encyclopedia of Chemical Technology (4th Edition)
59
ACETAL RESINS
Vol 1
State Complexes
Total
Tastem Титоре
>10
388
a Ref. 29. Courtesy of SRI International as of October 1, 1989.
Joint venture, BASF and Degussa
Joint venture, Hoechst Celanese and Hoechst AG.
Joint venture, Mitsubishi Gas Chemical and Tongyoung Nylon
Plants are believed to be located in the USSR and Poland.
Specifications and Standards
ASTM D4181 calls out standard specifications for acetal molding and extrusion materials. Homopolymer and copolymer are treated separately. Within each
class of resin, materials are graded according to melt flow rate. The International Standards Organization (ISO) is expected to issue a specification for
acetal resins before 1992.
Many grades of acetal resins are listed in Underwriters' Taboratories (UL) Recognised Component Directory. UL assigns temperature index ratings indicating
expected continuous-use retention of mechanical and electrical properties. UL also classifies materials on the basis of flammability characteristics;
homopolymer and copolymer are both classified 94HB.
Many grades of acetal are accepted under the component acceptance program of the Canadian Standards Association (CSA) and are listed in the
GSM Tlastics Directory.
The U.S. Food and Drug Administration regulates acetal resins intended for repeated contact with food. The FDA regulation for homopolymer is
21CFR 177.2480 and that for copolymer is 21CFR 177.2470. The U.S. Department of Agriculture regulates the use of acetal resins in contact with meat and
poultry.
The National Sanitation Foundation publishes a list of acetal resins which they find acceptable for use in potable water applications.
Acetal resins are typically supplied in 25-kg multiwall bags and 500-kg Gaylords (rigid containers). Precompounded custom colors are available from
manufacturers or the customer may use color concentrates.
Health and Safety
When processed and used according to manufacturer's recommendations, acetal resins present no extraordinary health risks. Before the use of any plastic
material, including acetal, the Material Safety Data Sheet (MSDS) applicable to the grade in question should be consulted.
If acetal resins are processed at temperatures substantially above those recommended for the particular grade, minor amounts of formaldehyde may
be liberated. Formaldehyde (qv) is a colorless, lacrimatory gas with a pungent odor and is intensely irritating to mucous membranes. The human nose is
sensitive to concentrations in the range of 0.1 to 0.5 ppm. The current threshold limit value for formaldehyde is 1 ppm.
Uses
The mechanical strength, friction and wear characteristics, predictable long and short term properties, and generally excellent solvent resistance of acetal
resins make them ideal candidates for industrial applications. Conveying devices and gears are excellent examples of this type of application. Information
on the design of such devices is available from suppliers (30). Optimization of design and molding of gears from acetal resins has been discussed in the
technical literature (31). Acetal resins compete effectively with nylons and thermoplastic polyester among other resins in many industrial applications.
Molding of parts for a wide variety of plumbing and irriga tion applications consumes as much acetal resin as the industrial applications. Rod and
slab stock can be machined into components for precision flow control devices.
Acetal resins are also used extensively in transportation, especially automotive. Handles and internal components (gears, gear racks, cables) for
window lifts and other similar devices are examples. Most of the applications which do not involve painting or plating are below the window line. Many
common consumer items are manufactured essentially entirely from acetal resin (eg, disposable lighters) or have critical components molded from acetal
resin (eg, hubs and platforms for videocassettes). The properties that make acetal resins useful in industrial applications make them useful for internal
components, especially mechanical drive systems, of many household appliances.
BIBLIOGRAPHY
"Acetal Resins" in TCT 2nd ed., Vol. 1, pp. 95—107, by С. E. Schweitzer, E. I. du Pont de Nemours & Co., Inc.; in TCT3rd ed., Vol. 1, pp. 112—123, by K.
J. Persak and L. M. Blair, E. I. du Pont de Nemours & Co., Inc.
1. A. M. Butlerov, Ann. 3, 242 (1859).
2. H. Staudinger, Die Aochmokkularen organische Verbindungen Tautschuk und Cellolose, Sp ringer-Vedag, Berlin, 1932.
3. I. Negulescu and O. Vogl, J. Pofm. Sci., Polym. Chem. Td. 14, 2415 (1976).
4. O. Vogl, J. Macromol. Sci. Chem. 1(2), 203 (1967).
5. U.S. Pat. 2,768,994 (Oct. 1956), R. N. MacDonald (to E.I. du Pont de Nemours & Co., Inc.).
6. С. E. Schweitzer, R. N. MacDonald, and I. O. Pundersson,/ Appl. Polym. Sci. 1, 158 (1959).
7. U.S. Pat. 3,027,352 (Mar. 1962), C. Walling, F. Brown, and K. Bartz (to Celanese Corp.).
8. U.S. Pat. 3,103,499 (Sept. 1963), T. J. Dolce and F. M. BerardineHi (to Celanese Corp.).
9. G. A. Carazzilo andM. MammiJ. Polym. Sci. Part A 1, 965 (1963).
10. M. L. Huggins,/. Chem. Phys. 3, 37 (1945).
11. H. Tadokoro and co-workers,/ Polym. Sci. 44, 266 (1960).
12. M. Droscher and G. Wegner, Ind. Tng. Chem. Prod. R/j. Dev. 18, 275 (1979).
13. J. Brandrup and E. H. Immergut, PolymerAandbook, 3rd ed., John Wiley & Sons, Inc. New York, 1989, pp. V-87—V-97.
14. T. Dolce and J. Grates, in J. I. Kroschwitz, ed., Tnyclopedia of Polymer Science andTngineering, 2nd ed., Wiley-Interscience, New York, 1985, Vol. 1, p.
42.
15. D. J. Cadsson and D. M. Wiles, in J. I. Kroschwitz, ed., Tnyclopedia of Polymer Science andTngineering, 2nd ed., Wiley-Interscience, New York, 1985,
Vol. 4, p. 361.
16. U.S. Pat. 3,172,736 (Mar. 1965), R. E. Gee (to E.I. du Pont de Nemours & Co., Inc.).
17. R. N. MacDonald, Macromolecular Synthesis, Vol. 3, John Wiley & Sons, Inc., New York, 1968.
18. W. Kem and V. Jaacks,/ Polym. Sci. 48, 399 (1960).
19. L. Leese and W. Bauber, Pofmer6, 269 (1965).
20. G. L. Collins and co-workers, / Pofm. Sci., Pofm. Chem. Td. 19, 1597 (1981).
21. K. Weissermel, E. Fischer, and K. Gutweiler, Kunstojfe 54, 410 (1964).
Kirk-Othmer Encyclopedia of Chemical Technology (4th Edition)
60
ACETAL RESINS
Vol 1
22. D. B. Todd, Polymn.—Plast. Technol. Eng. 28, 123 (1989).
23. U.S. Pat. 3,152,343 (Dec. 1963), T. J. Dolce and F. M. Berardinelli (to Celanese Corp.).
24. U.S. Pat. 4,301,273 (Nov. 1981), A. Sugio and co-workers (to Mitsubishi Gas Chemical Company, Ltd.).
25. U.S. Pat. 3,174,948 (Mar. 1965), J. E. Wall, E. T. Smith, and G. F. Fishcer (to Celanese Corp.).
26. U.S. Pat. 3,318,848 (May 1967), С. M. Clarke (to Celanese Corp.).
27. A. Serie in J. M. Margolis, ed., Engineering Thermoplastics, Marcel Dekker, New York, 1985, p. 151.
28. J. of Comm. 7 (Aug. 25, 1989).
29. K. Wheeler with W. Cox and Y. Sakuma, Chemical Economics Handbook, SRI International, Menlo Park, Calif., December 1989, 580.0930 A—G.
30. Pulletins CS-03 and PIE-04, Hoechst Celanese Engineering Plastics Company, 1985.
31. H. Кдикег and A. Burr, Kunststoffe 73, 11 (1983).
General References
References 14 and 27 are good general references.
M. Sittig, Poly acetal Resins, Gulf Publishing Co., Houston, Tex., 1963.
John B. Starr
Hoechst Celanese Corporation
Kirk-Othmer Encyclopedia of Chemical Technology (4th Edition)
61
Vol 1
ACETAMIDE.
See Acetic acid and derivatives.
ACETANILIDE.
See Amines—Aromatic amines, aniline and its derivatives.
ACETARSONE.
See Antiparasitic agents—Antiprotozoals; Arsenic compounds.
ACETATE AND TRIACETATE FIBERS.
See Fibers, cellulose esters.
Kirk-Othmer Encyclopedia of Chemical Technology (4th Edition)
62
ACETIC ACID AND DERIVATIVES
Voll
ACETIC ACID AND DERIVATIVES
Acetic acid,
Acetamide,
Acetic anhydride,
Acetyl chloride,
Dimethylacetamide,
Halogenated derivatives,
Kirk-Othmer Encyclopedia of Chemical Technology (4th Edition)
63
ACETIC ACID
Voll
ACETIC ACID
Acetic acid [64-19-7]\ CH3COOH, is a corrosive organic acid having a sharp odor, burning taste, and pernicious blistering properties. It is found in ocean
water, oilfield brines, rain, and at trace concentrations in many plant and animal Equids. It is central to all biological energy pathways. Fermentation of fruit
and vegetable juices yields 2—12% acetic acid solutions, usually called vinegar (qv). Any sugar-containing sap or juice can be transformed by bacterial or
fungal processes to dilute acetic acid.
Theophrastos (272—287 вс) studied the utilization of acetic acid to make white lead and verdigris [52503-64-7]. Acetic acid was also well-known to
alchemists of the Renaissance. Andreas Libavius (ad 1540—1600) distinguished the properties of vinegar from those of icelike (glacial) acetic acid obtained
by dry distillation of copper acetate or similar heavy metal acetates. Numerous attempts to prepare glacial acetic acid by distillation of vinegar proved to be
in vain, however.
Lavoisier believed he could distinguish acetic acid from acetous acid, the hypothetical acid of vinegar, which he thought was converted into acetic
acid by oxidation. Following Lavoisier's demise, Adet proved the essential identity of acetic acid and acetous acid, the latter being the monohydrate, and in
1847, Kolbe finally prepared acetic acid from the elements.
Most of the acetic acid is produced in the United States, Germany, Great Britain, Japan, France, Canada, and Mexico. Total annual production in
these countries is close to four million tons. Uses include the manufacture of vinyl acetate [108-05-4] and acetic anhydride [108-24-7]. Vinyl acetate is used
to make latex emulsion resins for paints, adhesives, paper coatings, and textile finishing agents. Acetic anhydride is used in making cellulose acetate fibers,
cigarette filter tow, and cellulosic plastics.
Physical Properties
Acetic acid, fp 16.635°C ((1), bp 117.87°C at 101.3 kPa (2), is a clear, colorless liquid. Water is the chief impurity in acetic acid although other materials such
as acetaldehyde, acetic anhydride, formic acid, biacetyl, methyl acetate, ethyl acetoacetate, iron, and mercury are also sometimes found. Water significandy
lowers the freezing point of glacial acetic acid as do acetic anhydride and methyl acetate (3). The presence of acetaldehyde [75-07-0] or formic acid [64-18-6]
is commonly revealed by permanganate tests; biacetyl [431-03-8] and iron are indicated by color. Ethyl acetoacetate [141-97-9] may cause slight color in
acetic acid and is often mistaken for formic acid because it reduces mercuric chloride to calomel. Traces of mercury provoke catastrophic corrosion of
aluminum metal, often employed in shipping the acid.
The vapor density of acetic acid suggests a molecular weight much higher than the formula weight, 60.06. Indeed, the acid normally exists as a dimer
(4), both in the vapor phase (5) and in solution (6). This vapor density anomaly has important consequences in engineering computations, particularly in
distillations.
Acetic acid containing less than 1% water is called glacial. It is hygroscopic and the freezing point is a convenient way to determine purity (7). Water
is nearly always present in far greater quantities than any other impurity. Table 1 shows the freezing points for acetic acid-water mixtures.
Table 1. Acetic Acid—Water Freezing Points
Acetic acid, wt % Freezing point, °C
100 16.635
99.95 16.50
99.70 16.06
99.60 15.84
99.2 15.12
98.8 14.49
98.4 13.86
98.0 13.25
97.6 12.66
97.2 12.09
96.8 11.48
96.4 10.83
96.0 10.17
The Antoine equation for acetic acid has recendy been revised (2)
ln(F) = 15.19234 + (-3654.622) /Т + (-45.392)
The pressure P is measured in kPa and the temperature T in K. The vapor pressure of pure acetic acid is tabulated in Table 2. Precise liquid density
measurements are significant for determining the mass of tank car quantities of acid. Liquid density data (8) as a function of temperature are given in Table
3.
Table 2. Acetic Acid Vapor Pressure
Temperature, °C Pressure, kPa Temperature, °C Pressure, kPa
0 4.7 110 776.7
10 8.5 118.2 1013
20 15.7 130 1386.5
30 26.5 140 1841.1
40 45.3 150 2461.1
50 74.9 160 3160
60 117.7 170 4041
70 182.8 180 5091
80 269.4 190 6333
Kirk-Othmer Encyclopedia of Chemical Technology (4th Edition)
64
ACETIC ACID
Vol 1
90
100
To convert kPa to psi, multiply by 0.145.
390.4
555.3
200
210
7813
9612
Table 3. Density of Acetic Acid (Liquid)
Temperature, °C Density, kg/m3
20 1049.55
25 1043.92
30 1038.25
47 1019.19
67 996.46
87 973.42
107 949.90
127 925.60
147 900.27
167 873.56
187 845.04
197 829.88
207 814.07
217 797.44
Acetic acid forms a monohydrate containing about 23% water; thus the density of acetic acid-water mixtures goes through a maximum between
77—80 wt % acid at 15°C. When water is mixed with acetic acid at 15—18°C, heat is given off. At greater acetic acid concentrations, heat is taken up. The
measured heat of mixing is consistent with dimer formation in the pure acid. The monohydrate, sometimes called acetous acid, was formerly the main
article of commerce. Data on solidification points of aqueous acetic acid mixtures have been tabulated, and the eutectic formation mapped (9). The
aqueous eutectic temperature is about —26° C. A procedure for concentrating acetic acid by freezing, hampered by eutectic formation, has been sought for
some time. The eutectic can be decomposed through adding a substance to form a compound with acetic acid, eg, urea or potassium acetate. Glacial acetic
acid can then be distilled. The densities of acetic acid-water mixtures at 15°C are given in Table 4.
Table 4. Density of Aqueous Acetic Acid
Acetic acid, wt % Density, g/cm3
1 1.007
5 1.0067
10 1.0142
15 1.0214
20 1.0284
30 1.0412
40 1.0523
50 1.0615
60 1.0685
70 1.0733
80 1.0748
90 1.0713
95 1.0660
100 1.0550
A summary of the physical properties of glacial acetic acid is given in Table 5.
Table 5. Properties of Glacial Acetic Acid
Property Value Reference
freezing point, °C 16.635 1
boiling point, °C 117.87 4
density, g/mL at 20°C 1.0495 8
refractive index, #25D 1.36965 10
heat of vaporization AH^J/g at bp 394.5 11
specific heat (vapor), J/(g-K)a at 124°C 5.029 11
critical temperature, К 592.71 2
critical pressure, MPa 4.53 2
enthalpy of formation, kJ/mol at 25°C
Equid -484.50 12
gas -432.25 12
normal entropy, J/(mol-K) at 25°C
liquid 159.8 13
gas 282.5 13
liquid viscosity, mPa (=cP)
20°C 11.83 14
40°C 8.18 14
surface tension, mN/m (=dyn/cm) at 20.1°C 27.57 15
flammability limits, vol % in air 4.0 to 16.0 15
autoignition temperature, °C 465
Kirk-Othmer Encyclopedia of Chemical Technology (4th Edition)
65
ACETIC ACID
Vol 1
flash point, °C
closed cup
open cup
To convert J to cal, divide by 4.184.
To convert MPa to psi, multiply by 145.
16
43
57
Chemical Properties
Decomposition Reactions. Minute traces of acetic anhydride are formed when very dry acetic acid is distilled. Without a catalyst, equilibrium
is reached after about 7 h of boiling, but a trace of acid catalyst produces equilibrium in 20 min. At equilibrium, about 4.2 mmol of anhydride is present per
liter of acetic acid, even at temperatures as low as 80°C (17). Thermolysis of acetic acid occurs at 442°C and 101.3 kPa (1 atm), leading by parallel pathways
to methane [72-82-8] and carbon dioxide [124-38-9], and to ketene [463-51-4] and water (18). Both reactions have great industrial significance.
Single pulse, shock tube decomposition of acetic acid in argon involves the same pair of homogeneous, molecular first-order reactions as
thermolysis (19). Platinum on graphite catalyzes the decomposition at 500—800 К at low pressures (20). Ketene, methane, carbon oxides, and a variety of
minor products are obtained. Photochemical decomposition yields methane and carbon dioxide and a number of free radicals, which have complicated
pathways (21). Electron impact and gamma rays appear to generate these same products (22). Electron cyclotron resonance plasma made from acetic acid
deposits a diamond [7782-40-3] film on suitable surfaces (23). The film, having a polycrystalline structure, is a useful electrical insulator (24) and widespread
industrial exploitation of diamond films appears to be on the horizon (25).
Acid—Base Chemistry. Acetic acid dissociates in water, p.Ka = 4.76 at 25°C. It is a mild acid which can be used for analysis of bases too weak
to detect in water (26). It readily neutralizes the ordinary hydroxides of the alkali metals and the alkaline earths to form the corresponding acetates. When
the crude material pyroligneous acid is neutralized with limestone or magnesia the commercial acetate of lime or acetate of magnesia is obtained (7). Acetic
acid accepts protons only from the strongest acids such as nitric acid and sulfuric acid. Other acids exhibit very powerful, superacid properties in acetic acid
solutions and are thus useful catalysts for esterifications of olefins and alcohols (27). Nitrations conducted in acetic acid solvent are effected because of the
formation of the nitronium ion, NCA . Hexamethylenetetramine [100-97-0] may be nitrated in acetic acid solvent to yield the explosive
cyclotrimethylenetrinitramine [121 -82-4], also known as cyclonit or RDX.
Acetylation Reactions. Alcohols maybe acetylated without catalysts by using a large excess of acetic acid.
CHgCOOH + ROH ch3coor + h2o
The reaction rate is increased by using an entraining agent such as hexane, benzene, toluene, or cyclohexane, depending on the reactant alcohol, to remove
the water formed. The concentration of water in the reaction medium can be measured, either by means of the Karl-Fischer reagent, or automatically by
specific conductance and used as a control of the rate. The specific electrical conductance of acetic acid containing small amounts of water is given in Table
6.
Table 6. Specific Conductance of Aqueous Acetic Acid
Acetic acid, wt % Specific conductance K, S/cm x 107
100 0.060
99.9515 0.065
99.746 0.103
99.320 0.261
98.84 0.531
97.66 2.19
96.68 5.45
94.82 20.1
92.50 59.9
90.75 111
82.30 688
Nearly all commercial acetylations are realized using acid catalysts. Catalytic acetylation of alcohols can be carried out using mineral acids, eg,
perchloric acid [7601-90-3], phosphoric acid [7664-38-2], sulfuric acid 7664-93-9], benzenesulfonic acid [98-11-3], or methanesulfonic acid 75-75-2], as the
catalyst. Certain acid-reacting ion-exchange resins may also be used, but these tend to decompose in hot acetic acid. Mordenite [12445-20-4], a decationized
Y-zeolite, is a useful acetylation catalyst (28) and aluminum chloride [7446-70-0], AL C L , catalyzes ^-butanol [71-36-3] acetylation (29).
Olefins add anhydrous acetic acid to give esters, usually of secondary or tertiary alcohols: propylene [115-07-1] yields isopropyl acetate [108-21-4]',
isobutylene [115-11-7] gives /^-butyl acetate [540-88-5]. Minute amounts of water inhibit the reaction. Unsaturated esters can be prepared by a combined
oxidative esterification over a platinum group metal catalyst. For example, ethylene-air-acetic acid passed over a palladium—lithium acetate catalyst yields
vinyl acetate.
Acetylation of acetaldehyde to ethylidene diacetate [542-10-9], a precursor of vinyl acetate, has long been known (7), but the condensation of
formaldehyde [50-00-0] and acetic acid vapors to furnish acrylic acid [97-10-7] is more recent (30). These reactions consume relatively more energy than
other routes for manufacturing vinyl acetate or acrylic acid, and thus are not likely to be further developed. Vapor-phase methanol—methyl acetate oxidation
using simultaneous condensation to yield methyl acrylate is still being developed (28). A vanadium—titania phosphate catalyst is employed in that process.
Industrial Manufacture
Commercial production of acetic acid has been revolutionized in the decade 1978—1988. Butane—naphtha liquid-phase catalytic oxidation has declined
precipitously as methanol [67-56-1] or methyl acetate [79-20-9] carbonylation has become the technology of choice in the world market. By-product acetic
acid recovery in other hydrocarbon oxidations, eg, in xylene oxidation to terephthalic acid and propylene conversion to acrylic acid, has also grown.
Production from synthesis gas is increasing and the development of alternative raw materials is under serious consideration following widespread
dislocations in the cost of raw material (see Chemurgy).
Ethanol fermentation is still used in vinegar production. Research on fermentative routes to glacial acetic acid is also being pursued. Thermophilic,
anaerobic microbial fermentations of carbohydrates can be realized at high rates, if practical schemes can be developed for removing acetic acid as fast as it
is formed. Under usual conditions, about 5% acid brings the anaerobic reactions to a halt, but continuous separation produces high yields at high
production rates. Heat for the reaction is provided by the metabolic activity of the microorganisms. Fermentative condensation of CO2 is another possible
route to acetic acid.
Currendy, almost all acetic acid produced commercially comes from acetaldehyde oxidation, methanol or methyl acetate carbonylation, or light
hydrocarbon liquid-phase oxidation. Comparatively small amounts are generated by butane liquid-phase oxidation, direct ethanol oxidation, and synthesis
gas. Large amounts of acetic acid are recycled industrially in the production of cellulose acetate, poly(vinyl alcohol), and aspirin and in a broad array of other
Kirk-Othmer Encyclopedia of Chemical Technology (4th Edition)
66
ACETIC ACID
Voll
proprietary processes. (These recycling processes are not regarded as production and are not discussed herein.)
Acetaldehyde Oxidation. Ethanol [64-17-5] is easily dehydrogenated oxidatively to acetaldehyde (qv) using silver, brass, or bronze catalysts.
Acetaldehyde can then be oxidized in the Equid phase in the presence of cobalt or manganese salts to yield acetic acid. Peracetic acid [79-21-0] formation is
prevented by the transition metal catalysts (7). (Most transition metal salts decompose any peroxides that form, but manganese is uniquely effective.)
Kinetic system models are useful for visualizing the industrial operation (31,32). Stirred-tank and sparger reactor rates have been compared for this reaction
and both are so high that they are negligible in the reaction's mathematical description.
Figure 1 is a typical flow sheet for acetaldehyde oxidation. The reactor is an upright vessel, fitted with baffles to redistribute and redirect the air
bubbles. Oxygen is fully depleted by the time a bubble reaches the first baffle and bubbles above the first baffle serve mainly for liquid agitation. Such
mechanical contacting decomposes transitory intermediates and stabilizes the reactor solution. Even though the oxidizer-reactor operates under mild
pressure, sufficient aldehyde boils away to require an off-gas scrubber. Oxidate is passed into a column operated under a positive nitrogen pressure, thence
to an acetaldehyde recovery column where unreacted aldehyde is recycled. More importandy, many dangerous peroxides are decomposed in this column,
some into acetic acid, while traces of ethanol are esterified to ethyl acetate. Crude acid is taken off at the bottom and led to a column for stripping off the
low boiling constituents other than aldehyde.
First-stage Second—stage Air treatment Oxidation
air compressor air compressor column reactor
Acetaldehyde
recovery column
Methyl acetate Acetic acid Glacial acetic Ethyl acetate
column finishing column acid storage recovery column
Fig. 1. A typical acetaldehyde oxidation flow sheet.
Crude oxidate is passed to a still where any remaining unreacted acetaldehyde and low-boiling by-products, eg, methyl acetate and acetone [67-64-1
are removed as are CO, CO2, and N2. High concentration aqueous acetic acid is obtained. The main impurities are ethyl acetate, formaldehyde, and formic
acid although sometimes traces of a powerful oxidizing agent, possibly diacetyl peroxide, are present. If the acetaldehyde contains ethylene oxide, then
ethylene glycol diacetate is present as an impurity. Formic acid can be entrained using hexane or heptane, ethyl acetate, or a similar azeotroping agent. Often
the total contaminant mass is low enough to permit destruction by chemical oxidation. The oxidizing agent, such as sodium dichromate, is fed down the
finishing column as a concentrated solution. Potassium permanganate solution is also effective, but it often clogs the plates of the distillation tower.
Final purification is effected by distillation giving high purity acid. Some designs add ethyl acetate to entrain water and formic acid overhead in the
finishing column. The acid product is removed as a sidestream. Potassium permanganate has been employed to oxidize formaldehyde and formic acid
because the finished acid must pass a permanganate test. The quantity of water in the chemical oxidizer solution is important for regulating the corrosion
rate of the finishing column: acetic acid having a purity of 99.90—100% corrodes stainless steel SS-316 or SS-320. Lowering the acid concentration to
99.75—99.80% with distilled water in the permanganate solution diminishes the corrosion rate dramatically. Residues containing manganese acetate or
chromium acetate are washed with a two-phase mixture of water—butyl acetate or water—toluene. The organic solvent removes high boiling materials, tars
and residual acid, and the metallic acetates remain in the water layer (33).
Alternative purification treatments for acetic acid from acetaldehyde have been explored but have no industrial application. Nitric acid or sodium
nitrate causes the oxidation of formic acid and formaldehyde, but provokes serious corrosion problems. Schemes have been devised to reduce rather than
oxidize the impurities; for example, injecting a current of hydrogen and passing the acid over a metallic catalyst such as nickel or copper turnings. Since
reduction occurs at 110—120°C, the reaction can be run in the final column. The risk of an explosion from the hydrogen passing through the column and
venting at the top probably discourages the use of this treatment. Certain simple salts, eg, FeSO4 or MnSO4, maybe introduced in the same way as the
permanganate or dichromate discussed earlier. These serve to eliminate most of the quality-damaging impurities.
Conversion of acetaldehyde is typically more than 90% and the selectivity to acetic acid is higher than 95%. Stainless steel must be used in
constructing the plant. This is an established process and most of the engineering is well-understood. The problems that exist are related to more
extensively automating control of the system, notably at start-up and shutdown, although even these matters have been largely solved. This route is the
most reliable of acetic acid processes.
Methanol Carbonylation. Several processes were patented in the 1920s for adding carbon monoxide to methanol to produce acetic acid (34).
The earliest reaction systems used phosphoric acid at 300—400°C under high CO pressures. Copper phosphate, hydrated tungstic oxide, iodides, and other
materials were tried as catalysts or promoters. Nickel iodide proved to be particularly valuable. At that time only gold and graphite were recognized as
adequate to resist temperatures of 300—320°C and pressures of 20 MPa (2900 psi). In 1945—1946, when German work was disclosed by capture of the
Central Research Files at Badische Anilin, a virtually complete plant design became public. Although this high pressure methanol carbonylation system
suffered many of the difficulties experienced in earlier processes, eg, loss of iodine, corrosive conditions, and dangerously high pressures, new alloys such as
Hastelloy C permitted the containment of nearly all the practical problems. Experimental and pilot-plant units were operated successfully and by 1963
BASF opened a large plant at Ludwigshafen, Germany providing license to Borden Chemical Company for a similar unit in Louisiana in 1966.
In 1968 a new methanol carbonylation process using rhodium promoted with iodide as catalyst was introduced by a modest letter (35). This catalyst
possessed remarkable activity and selectivity for conversion to acetic acid. Nearly quantitative yields based on methanol were obtained at atmospheric
pressure and a plant was built and operated in 1970 at Texas City, Tex. The effect on the world market has been exceptional (36).
Low pressure methanol carbonylation transformed the market because of lower cost raw materials, gender, lower cost operating conditions, and
higher yields. Reaction temperatures are 150—200°C and the reaction is conducted at 3.3—6.6 MPa (33—65 atm). The chief efficiency loss is conversion of
carbon monoxide to CO2 and H2 through a water-gas shift as shown.
Kirk-Othmer Encyclopedia of Chemical Technology (4th Edition)
67
ACETIC ACID
Vol 1
CO + H2O CO2 + H2
The subject has been reviewed (37,38). Water may be added to the feed to suppress methyl acetate formation, but is probably not when operating on an
industrial scale. Water increase methanol conversion, but it is involved in the unavoidable loss of carbon monoxide. A typical methanol carbonylation flow
sheet is given in Figure 2.
Methenol
Carbonylation Low-pressure Reactor
reactor separator surge tank
Carbon monoxide High-pressure Off-gas Light ends Catalyst recovery Dehydration
compressor separator scrubber column column column
Acetic acid
column
Acetic acid Heavy ends
rtorige column
Fig. 2. A typical methanol carbonylation flow sheet.
Low boiling substances are removed from the chilled reactor product by distilling up to a cut point of 80°C. These low boilers are gaseous dimethyl
ether, methyl acetate, acetaldehyde, butyraldehyde, and ethyl acetate. The bottoms are flash-distilled to recover the rhodium catalyst. Flash distilled acid is
azeotropically dehydrated. In the final distillation, glacial acid is obtained. Traces of iodine that may remain in the finished acid may be removed by
fractional crystalliza tion or by addition of a trace of methanol followed by distillation of the methyl iodide that forms. Somewhere in the carbonylation
reaction, a minute amount of propionic acid seems to be made. It typically is found in the residues of the acetic acid finishing system and can be removed
by purging the finishing column bottoms.
Vapor-phase methanol carbonylation over a supported metal catalyst has been described (39,40). Methanol itself is obtained from synthesis gas, so
the possibility of making acetic acid direcdy without isolating methanol has been explored (41) in both vapor and liquid phases. Alcohols are generated
from CO and H2 using halide promoted ruthenium, but acetic acid can be produced by addition of Ru3(CO)12 (42). A complex metallic catalyst containing
rhodium, manganese, iridium, and lithium supported on silica has been used to provide selective synthesis (43). Ruthenium melt catalyst has been patented
(44). Catalysts can be improved by running them in by stages to the optimum operating temperature over prolonged time periods, eg, 100—1000 h (45). A
rhodium—nickel—silver catalyst for this reaction has been developed (46).
Synthesis gas is obtained either from methane reforming or from coal gasification (see Coal conversion processes). Telescoping the methanol
carbonylation into an esterification scheme furnishes methyl acetate direcdy. Thermal decomposition of methyl acetate yields carbon and acetic anhydride,
2СН3СОСН3 (СН3СО) 2O + C(soot)
but a pyrolytic route is not attractive because of excessive energy consumption. Methyl acetate carbonylation yields both anhydride and acetic acid,
controllable in part by the conditions. A plant based on this process was put in operation in October 1983 (47).
Butane-Naphtha Catalytic Liquid-Phase Oxidation. Direct liquid-phase oxidation ofbutane and/or naphtha [8030-30-6] was once
the most favored woddwide route to acetic acid because of the low cost of these hydrocarbons. Butane [106-97-8]\ in the presence of metallic ions, eg,
cobalt, chromium, or manganese, undergoes simple air oxidation in acetic acid solvent (48). The peroxidic intermediates are decomposed by high
temperature, by mechanical agitation, and by action of the metallic catalysts, to form acetic acid and a comparatively small suite of other compounds (49).
Ethyl acetate and butanone are produced, and the process can be altered to provide larger quantities of these valuable materials. Ethanol is thought to be an
important intermediate (50); acetone forms through a minor pathway from isobutane present in the hydrocarbon feed. Formic acid, propionic acid, and
minor quantities of butyric acid are also formed.
The theoretical explanation of the butane reaction mechanism is as fully developed as is that of acetaldehyde oxidation (51). The theory of the
naphtha oxidation reaction is more troublesome, however, and less well understood. This is largely because of a back-biting reaction which leads to cyclic
products (52).
Liquid-phase butane oxidation is realized in a sparged column, fabricated of high alloy stainless steel. Cobalt, chromium, and manganese acetate
catalyst is dissolved in acetic acid and introduced with the butane—acetic acid solution. Air or O2-enriched air may be used. The temperature is kept just
below the critical temperature ofbutane, 152°C. Pressure is about 5.6 MPa (812 psi) (53). The reactor product is cooled and the pressure slowly lowered. In
stripping the low boiling constituents away from the reactor product, the first obtained is unreacted butane, which is often led through an expansion
turbine that powers air compressors for the reactor and cools the product. The butane is then recycled to the reactor. After cooling, the reactor oxidate
appears as two phases: a hydrocarbon-rich phase and a denser aqueous phase. The former is decanted and led back into the reactor; the latter is distilled to
obtain the boiling oxygenates. Butanone [78-93-3] and ethyl acetate [141-78-6] are the chief constituents of the aqueous layer, but there are traces of methyl
vinyl ketone (an unpleasant lacrimator), aldehydes, and esters. Formic acid, also present, forms a maximum-boiling azeotrope that boils higher than either
of the chief constituents.
Although acetic acid and water are not believed to form an azeotrope, acetic acid is hard to separate from aqueous mixtures. Because a number of
common hydrocarbons such as heptane or isooctane form azeotropes with formic acid, one of these hydrocarbons can be added to the reactor oxidate
permitting separation of formic acid. Water is decanted in a separator from the condensate. Much greater quantities of formic acid are produced from
naphtha than from butane, hence formic acid recovery is more extensive in such plants. Through judicious recycling of the less desirable oxygenates, nearly
all major impurities can be oxidized to acetic acid. Final acetic acid purification follows much the same treatments as are used in acetaldehyde oxidation.
Acid quality equivalent to the best analytical grade can be produced in tank car quantities without difficulties.
Two explosions, on November 14, 1987, at the largest butane liquid-phase oxidation plant resulted in 3 deaths and 37 people injured (54). The plant,
Kirk-Othmer Encyclopedia of Chemical Technology (4th Edition)
68
ACETIC ACID
Vol 1
which had operated since December 1952 free of such disasters, was rebuilt (55).
Prospective Processes. There has been much effort invested in examining routes to acetic acid by olefin oxidation or from ethylene, butenes,
or jw-butyl acetate. No product from these sources is known to have reached the world market; the cost of the raw materials is generally prohibitive.
Recovery of acid from wood distillate has long been viewed as a desirable prospect. Nearly all common lumber woods can be destructively distilled
to furnish pyroligneous acid containing about 5—8% acetic acid. Coupled with azeotropic or extractive distillation, good quality glacial acetic acid could be
prepared (56,57). Indeed, glacial acetic acid used to be prepared from gray acetate of lime, formed by the reaction of pyroligneous acid and limestone, by
reaction of the acetate with bicarbonate followed by sulfuric acid:
Ca(CH3COO) 2 + Na2CO3 2 Na(CH3COO) + CaCO3
NaOOCCH3 + H2SO4 NaHSO4 + CH3COOH
The acetic acid was distilled to give soda acetic acid and upon further purification, it was often used for food or pharmaceutical applications.
Mixtures of trioctjdamine and 2-ethylhexanol have been employed to extract 1—9% by volume acetic acid from its aqueous solutions. Reverse
osmosis for acid separation has been patented and solvent membranes for concentrating acetic acid have been described (58,59). Decalin and
trioctylphosphine were selected as solvents (60). Liquid—Equid interfacial kinetics is an especially significant factor in such extractions (61).
The fermentative fixing of CO2 and water to acetic acid by a species of acetobacterium has been patented; acetyl coenzyme A is the primary
reduction product (62). Different species of clostridia have also been used. Pseudomonads (63) have been patented for the fermentation of certain C .
compounds and their derivatives, eg, methyl formate. These methods have been reviewed (64). The manufacture of acetic acid from CO2 and its
dewatering and refining to glacial acid has been discussed (65,66).
The autotropic pathway for acetate synthesis among the acetogenic bacteria has been examined (67). Quantitative fermentation of one mole of
glucose [50-99-7], C6H12O6, yields three moles of acetic acid, while two moles of xylose [58-86-6], C5H1QO5, yields five moles. The glucose reaction is
C6H12O6 + 2 H2o 2 CH3COOH + 2 CO2 S II S c
2 CO2 S || s c CH3COOH + 2 H2O
Simply by passing gaseous H2—CO2 through an aqueous sugar mixture, the carbon dioxide is fixed into acetic acid:
2 CO2 - 4H2 - CH3COOH + 2 H2O
Using carbon monoxide, the reaction becomes
4 CO + 2H2O CH3COOH + 2 CO2
A number of C . compounds act as surrogates for reduction.
The possibility of using fermentation to generate a safe, noncorrosive road deicing composition has been studied (68). Calcium magnesium acetate
[76123-46-1] is readily prepared from low concentration acetic acid produced from glucose or other inexpensive sugars. The U.S. Federal Highway
Administration has financed development of anaerobic, thermophilic bacteria in an industrial process to manufacture calcium magnesium acetate from
hydrolyzed com starch and dolime [50933-69-2]. Economic evaluation shows the product can be made for about $0.11/kg, marginally competitive with
acid from methanol carbonylation (69). It is equally possible to utilize methanol—CO2 or H2—CO2 mixtures. These fermentative processes lead to dilute
acid, often no more than 5 wt %, so that a concentration procedure is essential to recovery. Another new method for acetic acid production is
electrodialytic conversion of dilute sodium acetate into concentrated acid (70). Electrodialytic fermentation systems have been subjected to computerized
control and the energy cost for recovery is rapidly being diminished.
Economic Aspects
Acetic acid has a place in organic processes comparable to sulfuric acid in the mineral chemical industries and its movements mirror the industry. Growth
of synthetic acetic acid production in the United States was gready affected by the dislocations in fuel resources of the 1970s. The growth rate for 1988 was
1.5%.
About half of the world production comes from methanol carbonylation and about one-third from acetaldehyde oxidation. Another tenth of the
world capacity can be attributed to butane—naphtha liquid-phase oxidation. Appreciable quantities of acetic acid are recovered from reactions involving
peracetic acid. Precise statistics on acetic acid production are complicated by recycling of acid from cellulose acetate and poly(vinyl alcohol) production.
Acetic acid that is by-product from peracetic acid [79-21-0] is normally designated as virgin acid, yet acid from hydrolysis of cellulose acetate or poly(vinyl
acetate) is designated recycle acid. Indeterminate quantities of acetic acid are coproduced with acetic anhydride from coal-based carbon monoxide and
unknown amounts are bartered or exchanged between corporations as a device to lessen transport costs.
Production Routes. The capacity for manufacturing acetic acid through methanol carbonylation grew from almost nothing in 1969 to 80% of
actual plant operational capacity in 1988 for the United States. Almost all new plants use the low pressure carbonylation route. In 1989, Eastman
Chemical's plant at Kingsport, Tenn., had the ability to coproduce acetic acid in excess of 68 t/yr. The plant produces both acid and anhydride from coal
by carbonylation of methyl acetate (51). American production of acetic acid from butane liquid-phase oxidation at the Hoechst-Celanese plant at Pampa,
Tex., is at a nominal 1989 capacity of 250 kg/yr. Favorable prices for the butane raw material and high efficiency of the plant design favor this production
method. Acetaldehyde oxidation is extensively employed in Europe where acetaldehyde is produced from the palladium—copper-catalyzed oxidation of
ethylene. Process yields for acetic acid on the order of 90% may be obtained. Sophisticated engineering and design gives the acetaldehyde route much of its
c omp etitivene s s.
By-product acetic acid is obtained chiefly from partial hydrolysis of cellulose acetate [9004-35-7]. Lesser amounts are obtained through the reaction
of acetic anhydride and cellulose. Acetylation of salicylic acid [69-72-7] produces one mole of acetic acid per mole of product and the oxidation of allyl
alcohol using peracetic acid to yield glycerol furnishes by-product acid, but the net yield is low.
Transportation
Acetic acid, providing the concentration is greater than about 99%, may be stored and shipped in aluminum. Aluminum slowly corrodes forming a layer of
basic aluminum acetate that prevents further corrosion. Some of this basic oxide coating is suspended in the acid and the heels of tank cars often have a
white or gray, cloudy appearance. Water increases the corrosion rate significandy; hence every effort must be devoted to maintaining a high acid
concentration. Mercury in minute quantities catalyzes corrosion of aluminum by acetic acid so that a single broken thermometer can provoke catastrophic
and dangerous corrosion in 99.6—99.7% glacial acid. Mercurial thermometers are often absolutely prohibited near aluminium tank cars or barrels. Acid can
also be stored and shipped in stainless steel, glass carboys, and polyethylene drums.
Because glacial acetic acid freezes at about 16°C, exceptional care must be taken for melting the product in cool weather. Electrical or steam heaters
may be employed. Tank cars or tank wagons must be fitted with heating coils, which can be attached to a steam line and trap. Tank vents must be traced
with electrical or steam lines to prevent crystallization. Acetic acid sublimes so that a single, large crystal can appear and completely fill an otherwise
adequate vent.
According to the U.S. DOT regulations, acetic acid is a corrosive material (71). It may be shipped in metal or plastic packaging when no more than
Kirk-Othmer Encyclopedia of Chemical Technology (4th Edition)
69
ACETIC ACID
Voll
0.45 kg is involved. Greater quantities may be shipped in boxed glass carboys, kegs or plywood drums, wooden barrels lined with asphalt or paraffin,
earthenware containers in protective boxes, or plastic drums. It may not be shipped in plastic bags. Steel drums having polyethylene liners or polyethylene
drums having steel overpacks are acceptable. Polyethylene drums do not appear to cause trace contamination after 12 months storage. Nonretumable
containers ought to be emptied and rinsed with fresh water. No other chemical ought to be shipped or stored in acetic acid containers.
Tank wagons are used for acetic acid deliveries in amounts intermediate between drum and tank car shipments, or to destinations not served by
railways. Tank wagons are usually fabricated of stainless steel or aluminum alloy. Most shipments are carried in railway tank cars with nominal capacities of
38—76 m3 (10,000—20,000 gal). For bookkeeping, capacities are determined by weight instead of volume measurements. Some tank cars are unloaded by
suction, others by applying a positive nitrogen pressure and then siphoning the acetic acid into an education tube. Siphoning is frequendy required by local
laws.
Acetic acid is also transported in barges, sometimes in amounts of 1500 to 1750 tons. Acetic acid is not as hygroscopic as some other anhydrous
organic substances, but barge shipments occasionally have specification problems because of wave splashing into the tanks or other careless handling.
Specifications and Analysis
Most specifications and analytical methods have been given (72). Most of the standards have remained unchanged for the past half-century. They were
designed for acid recovered from wood tar condensates. All acid of commerce easily passes these tests.
Acetic acid made by methanol carbonylation sometimes has traces of iodine or bromine if the acid comes from the high pressure route.
Qualitatively, these may be quickly detected by the Beilstein test for halogens: a copper wire is heated in a gas burner until no color can be seen and the coil
plunged into the acetic acid, then brought into the gas flame again. Any trace of green or blue-green flame shows the presence of halogen. The lower
identification threshold is about 0.7 ppm for chloride, about 0.65 ppm for bromide, and about 0.55 for iodide.
Super-pure acid is often specified by performance tests. Acetic acid to be used for Wijs Reagent must be very highly purified, otherwise the reagent
deteriorates quickly. The dichromate—sulfuric acid test, made by dissolving potassium dichromate in concentrated H2SO4, and then mixing with an equal
volume of acetic acid, is a sensitive test for minute quantities of certain oxidizing agents. These substances can be removed only by such special treatments
as refluxing the acid with dichromate or permanganate, followed by redistillation. In commercial practice, instrumental methods are used to monitor quality
but these methods are seldom given officially as standards. Gas chromatographic and mass spectrometric methods are capable of very high sensitivity.
Glacial acetic acid is considered to be 99.50 wt % or higher. A different grade has a minimum concentration of 99.70 wt %. Specialty users require
water solutions of 86% and 36%. Such grades are prepared on special order. Only minor quantities of these grades are marketed, and their use is vanishing.
Health and Safety
Acetic acid has a sharp odor and the glacial acid has a fiery taste and will penetrate unbroken skin to make blisters. Prolonged exposure to air containing
5—10 mg/m3 does not seem to be seriously harmful, but there are pronounced, undesirable effects from constant exposure to as high as 26 mg/m3 over a
10-day period (8).
Humans exude about 90 mg/day of volatile fatty acids in exhaled breath and perspiration, 80% of which is acetic acid (73). In a confined
environment, as much as 15—20 mg/m3 can accumulate and such concentrations can become serious in submarines or space capsules.
Concentrated aqueous or organic solutions can be strongly damaging to skin. Any solution containing more than 50% acetic acid should be
considered a corrosive acid. Acetic acid can irreparably scar delicate tissues of the eyes, nose, or mouth. The acid penetrates the mucosa of the tongue
which is near the pK of the acid (74). The action of acetic acid is insidious. There is no quick burning sensation when applied to the unbroken skin. Blisters
appear within 30 min to 4 h. Litde or no pain is experienced at first but when sensory nerve receptors are attacked, severe and unremitting pain results.
Once blistering occurs, washing with water or bicarbonate seldom relieves the pain. Medical care should be sought immediately.
Care ought to be taken in handling acetic acid to avoid spillage or otherwise breathing vapors. Wash any exposed areas with large amounts of water.
Once the odor of acetic acid vapors is noticeable, the area should be abandoned immediately. The U.S. threshold limit value for acetic acid is 10 ppm (25
mg/m3). Similar values prevail in Germany (75).
Glacial acetic acid is dangerous, but its precise toxic dose is not known for humans. The LD5Q for rats is said to be 3310 mg/kg, and for rabbits
1200 mg/kg (76). Ingestion of 80—90 g must be considered extraordinarily dangerous for humans. Vinegar, on the other hand, which is dilute acetic acid,
has been used in foods and beverages since the most ancient of times. Although vinegar is subject to excise taxation in many countries of the world other
than the United States, acetic acid for nonfood applications is commonly exempted (77).
Industrial plants for acetic acid production sometimes have waste streams containing formic acid and acetic acid. The quantity of acids in these
streams is not significant to the overall plant efficiency, but from a safety viewpoint such material must either be recycled, treated with alkaline substances,
or consumed microbially. Recycling is probably the most expensive route because the cost of processing is not repaid by an increase in efficiency. In
Europe these streams must be neutralized or degraded biologically. In Germany, no more than 3 kg/h may be emitted in vent gases, with a maximum of
150 mg/m3 (76). The acid must be removed from the vent gas by scrubbing or chilling.
BIBLIOGRAPHY
"Acetic Acid" in ECT 1st ed., Vol. 1, pp. 56—74, by W. F. Schurig, The College of the City of New York; "Ethanoic Acid" in ECT 2nd ed., Vol. 8, pp.
386—404, by E. Le Monnier, Celanese Corporation of America; "Acetic Acid" in ECT 3rd ed., Vol. 1, pp. 124—147, by F. S. Wagner, Jr., Celanese Chemical
Company.
1. K. Hess and H. Haber, Ber. Dtsh. Chem. Ges. 70, 2205 (1937).
2. D. Ambrose andN. B. Ghiassee,/ Chem. Thermodyn. 19, 505—519 (1987).
3. D. D. Perrin and co-workers, Purification ofEaboratoy Chemicals^ Pergamon Press, New York, 1966, p. 56.
4. I. Malijevska, Collect. Cyech. Chem. Commun. 48(8), 2147—2155 (1983); О. K. Mikhailova and N. P. Markuzin, Eh. Obshch. Khim. 52(10), 2164—2166
(1982); Zh. Obshch. Khim. 53(4), 713-716 (1983).
5. R. Buettner and G. Maurer, Ber. Bunsenges. Phys. Chem. 87(10), 877—882 (1983).
6. Y. Fujii, H. Yamada, andM. Mizuta,/ Phys. Chem. 92, 6768—6772 (1988).
7. J. F. Thorpe and M. A. Whiteley, Thorpe's Dictionary of Applied Chemistry^ 4th ed., Longmans, Green & Co., London, 1937, Vol. 1, p. 51.
8. J. L. Hales, H. A. Gundry, and J. H. Ellender,/ Chem. Thermodyn. 15, 211—215 (1983).
9. R. S. Barr and D. M. T. Newsham, Chem. Eng. J. (Eausanne) 33(2), 79—86 (1986).
10. K. S. Howard,/. Phys. Chem. 62, 1597 (1958).
11. W. Weltner,/ Am. Chem. Soc. 77, 3941 (1955).
12. R. J. W. LeFiivre, Trans. Faraday Soc. 34, 1127 (1938).
13. D. D. Wagman and co-workers,/ Phys. Chem. Kef Data 11, Suppl. 2.
14. S. P. Miskidzh'yan andN. A. Trifonov, Zh. Obshch. Khim. 17, 1033 (1947).
15. A. I. Vogel,/ Chem. Soc. 1948, 1814 (1948).
16. N. I. Sax, Dangerous Properties of Industrial Materialsy 5th ed., Van Nostrand-Reinhold, New York, 1979, p. 333.
17. L. W. Hessel and E. C. Kooyman, Pharm. Weekbl 104, 687 (1969).
18. P. G. Blake and G. E. Jackson,/ Chem. Soc. 1968B, 1153-1155 (1968); 1969B, 94-96 (1969).
Kirk-Othmer Encyclopedia of Chemical Technology (4th Edition)
70
ACETIC ACID
Vol 1
19.
20.
21.
22.
23.
24.
25.
26.
27.
28.
29.
30.
31.
32.
33.
34.
35.
36.
37.
38.
39.
40.
41.
42.
43.
44.
45.
46.
47.
48.
49.
50.
51.
52.
53.
54.
55.
56.
57.
58.
59.
60.
61.
62.
63.
64.
65.
66.
67.
68.
69.
70.
71.
72.
73.
74.
75.
76.
77.
J. C. Mackie and K. R. Doolan, Int. J. Chem. Kinet. 16(5), 525—4 (1984).
J. J. Vajo, Y. K. Sun, and W. H. Winberg, J. Phys. Chem. 91, 1153-1158 (1987).
J. G. Calvert and J. N. Pitts, Photochemistry, 428—431 (1966).
A. S. Newton,/. Chem. Phys. 26, 1764—1765 (1957).
Jpn. Pat. JP 62-96,397 (May 2, 1987), S. Kawaclii and K. Nakamura (to Ashai Chemical Industries).
Jpn. Pat. JP 62-113,797 (May 2, 1987), S. Kawaclii and K. Katsuyuki (Asahi Chemical Industries).
25. Y. Hirose, Hyomen, 25(12), 734—743 (1987); Chem. Abstr. 108, 189283g. Y. Hirose, Seimitsu Rogaku Kaishi 53(10), 1507—1510 (1987); Chem. Abstr.
108, 61009e. N. Koshino, M. Kawarada, and K. Kurihara, Denshi 7.air\o 27(1), 49—54 (1988); Chem. Abstr. 109, 16121c. H. Kawarada, J. Suzuki, and
A. Hiraki, Ragaku Kogyo 39(9), 784—790 (1988); Chem. Abstr. 110, 41327v. Y. Hirose and F. Akatsuka, Ibid. 39(8), 673—681, 693 (1988); Chem. Abstr.
110, 10257t. Y. Namba, Ibid. 39(8), 666—672, 689 (1988); Chem. Abstr. 110:10258u. F. Akatsuka, Y. Hirose, and K. Komaki,/*». J. Appl. Phys. Pt 2
27(9), L1600-L1602 (1988).
A. Popoff, "Anhydrous Acetic Acid as a Nonaqueous Solvent", in J. J. Lagowski, ed., Chemistry of Nonaqueous Solvents, Vol. 3, Academic Press, 1970.
"Kohlenstoff," in K. von Baczko, ed., GmelinsHandbuch derAnorganischen Chemie, 8th ed., Teil C4, Frankfurt, 1975, pp. 141—197.
M. AiJ. Catal. 112(1), 194-200 (1988).
P. S. T. Sai, Reg. J. Energy, Heat Mass Transfer 10(2), 181—189 (1988).
J. F. Vitcha and V. A. Sims, Ind. Eng. Chem. Prod. Rc<. Dev. 5, 50 (1966).
H. Hartig, Chem. Ing. Tech. 45, 467 (1973).
A. Y. Yau, A. Manielec, and A. I. Johnson, in E. Rhodes and D. S. Scott, eds., Proceedings of International Symposium on Research in Cocurrent Gas-Eiquid
Plow, Plenum Press, New York, 1969, pp. 607—632.
Ger. Pat. 2,153,767 (May 3,1973), H. Schaum and H. Goessell (to Farbwerke Hoechst A. G.).
F. J. Weymouth and A. F. Millidge, Chem. Ind. (Eondon) 1966, 887—893 (May 28, 1966).
F. E. Paulik and J. F. Roth, Chem. Commun. 1968, 1578 (1968).
Chem. Eng. News, 24 (Feb. 13, 1984); U.S. Pat. 4,690,912 (Sept. 1,1987), F. E. Paulik, A. Hershman, W. R. Knox, and J. F. Roth (to Monsanto
Company).
F. E. Paulik, Catal. Rev. 6, 49 (1972).
R. S. Dickson, Homogeneous Catalysis with Compounds of Rhodium andlridium, Reidel, Dordrecht, The Nethedands, 1985.
K. Omata and co-workers, Stud. Suf. Sci. Catal. 86, 245—249 (1988); Chem. Abstr. 109, 8355J (1988).
K. Fujimoto and co-workers, Ind. Eng. Chem. Prod. Rar. Dev. 22, 436—439 (1983).
A. F. Borowski, IPiad Chem. 39(10-12), 667-687 (1985); J. Ogonowski, Chernik, 40(2), 38-42; 40(3), 67-71; 40(7), 199-201 (1987).
H. Ono and co-workers, J. Organomet. Chem. 331, 387—395 (1987).
T. Nakajo, K. Sano, S. Matsuhira, andH. Arakawa, Chem. Commun. (Eondon) 1987(9), 647—649 (1987).
U.S. Pats. 4,440,570 (Apr. 3,1984), 4,442,304 (Apr. 10,1984), 4,557,760 (Dec. 10,1985), H. Erpenbach and co-workers (to Hoechst A. G.).
J. F. Knifton, Platinum Met. Rev. 29(2), 63—72 (1985); Jpn. Pat. Kokai Tokkyo Koho JP 59—25340 (Feb. 9,1984) (to Agency of Industrial Sciences
and Technology).
U.S. Pat. 4,351,908 (Sept. 28,1984), H. J. Schmidt and E. I. Leupold (to Hoechst A. G.).
V. H. Agreda, CHEM-TECH 18(4), 250-253 (1988); Chem. Eng. News 30-32 (May 21, 1990).
F. Broich, Chem. Ing. Tech. 36(5), 417—422 (1964).
H. Httfermann, Chem. Ing. Tech. 36(5), 422—429 (1964).
С. C. Hobbs and co-workers, Ind. Eng. Chem. Prod. Rc<. Dev. 9, 497 (1970); 11, 220 (1972); Ind. Eng. Chem. Process Des. Dev. 59 (1972).
J. B. Saunby and B. W. Kiff, Hydrocarbon Process, 55(11), 247 (1976).
R. K. Jensen and co-workers, J. Am. Chem. Soc. 101, 7574 (1979).
N. M. Emanuel, E. T. Denisov, and Z. K. Maizus, Eiquid Phase Oxidation of Hydrocarbons, Plenum Press, New York, 1967.
New York Times Sect. I, 15 (Nov. 16, 1987).
M. S. Reisch, Chem. Eng. News 65 (Nov. 23,1987); 66, 9-11 (Feb. 8, 1988); 66, 5 (May 23, 1988).
D. F. Othmer, DECHEMA Monogr. 33, 9—22 (1959).
D. F. Othmer, R. E. White, and E. Trueger, Ind. Eng. Chem. 33, 1240—1248 (1941).
Jpn. Pat. Kokai Tokkyo Koho, JP 61-176,552 (Aug. 8, 1986), M. Tanaka, N. Kawada, and T. Morinaga (to Agency of Industrial Sciences and
Technology).
Y. Kuo and H. P. Gregor, Sepn. Sci. Technol. 18(5), 421—440 (1983).
U.S. Pat. 3,980,701 (Apr. 21,1975), R. R. Grinstead (to The Dow Chemical Company); R. W. HeHsell, Chem. Eng. Prog. 73, 55—59 (May 1977).
G. J. Hanna and R. D. Noble, Chem. Rev. 85, 583-598 (1985).
T. Morinaga, Hakko to Kogyo 43(11), 1015—1023 (1985); Jpn. Pat. JP 63-84,495 (Apr. 15,1988), T. Morinaga (to Agency of Industrial and Scientific
Technology).
Jpn. Pat. Kokai Tokkyo Koho JP 59-179,089 (Oct. 11,1984) (to Agency of Industrial Sciences and Technology).
H. Wood, H. L. Drake, and S. Hu in E. E. Snell, ed., Some Historical and Modem Aspects of Amino Acid, Permentations, andNucleic Acids, (symposium:
June 3,1981, St. Louis, Mo.), Annual Reviews Inc., Palo Alto, Calif., 1982, pp. 29—56.
J. G. Zeikus, R. Kerby, and J. A. Krzycki, Science 227(4691), 1167—1173 (1985).
L. G. Ljungdahl, Ann. Rev. Microbiol. 40, 415—450 (1986).
L. G. Ljungdahl and co-workers, biotechnology and Bioengineering Symp. No. 15, pp. 207—223 (1985).
L. G. Ljungdahl and co-workers, CMA Manufacture (II) Improved Bacterial Strain for Acetate Production, Final Report, FHWA/RD-86/117, U.S. Dept,
of Transportation, Washington, D.C.
J. Kassotis and co-workers, J. Electrochem. Soc. 131, 2810—2814 (Dec. 1984).
Y. Nomura and co-workers, Appl. Environ. Microbiol. 54, 137—142 (1988).
Code ofFederalRegulations, Tide 49, 173.244—173.245, U.S. Dept, of Transportation, Washington, D.C.
E. F. Joy and A. J. Barnard, Jr., Encyclopedia of Industrial Chemical Analysis, Vol. 4, John Wiley & Sons, Inc., New York, 1967,pp. 93—101.
H. S. Christensen and T. Luginbyl, eds., Registry of Toxic Effects of Chemical Substances, U.S. Dept, of Health, Education, Welfare, Rockville, Md., 1975.
V. P. Savina and В. V. Anisimov, Kosm. Biol. Aviakosmicheskaya. Med. 22(1), 57—61 (1988).
I. A. Siegel, Arch. OralBiol. 29(1), 13-16 (1988).
American Conference Governmental Industrial Hygienists, ThresholdEimit \ alues, Cincinnati, Ohio, 1982; cf. Deutsche Forschungsgemeinschaft,
MaximaleArbeitsplafkonyentrationen, 1983, Vedag Chemie, Weinheim, 1983, p. 15.
Vinegar Tax, Bundesrepublik Deutschland, (April 25, 1972).
Frank S. Wagner, Jr.
Nandina Corporation
Kirk-Othmer Encyclopedia of Chemical Technology (4th Edition)
71
ACETIC ACID
Vol 1
Kirk-Othmer Encyclopedia of Chemical Technology (4th Edition)
72
ACETAMIDE
Vol 1
ACETAMIDE
Acetamide [60-35-5]\ C2H5NO, mol wt 59.07, is a white, odorless, hygroscopic solid derived from acetic acid and ammonia. The stable crystalline habit is
trigonal; the metastable is orthorhombic. The melt is a solvent for organic substances; it is used in electrochemistry and organic synthesis. Pure acetamide
has a bitter taste. Unknown impurities, possibly derived from acetonitrile, cause its mousy odor (1). It is found in coal mine waste dumps (2).
Physical and Chemical Properties
Table 1 lists many of acetamide's important physical properties. Acetamide, CH3CONH2, dissolves easily in water, exhibiting amphoteric behavior. It is
slow to hydrolyze unless an acid or base is present. The autodissociation constant is about 3.2 x 10⁻¹¹ at 94°C. It combines with acids, eg, HBr, HC1,
HNO3, to form solid complexes. The chemistry of metal salts in acetamide melts has been researched with a view to developing electroplating methods.
The literature of acetamide melts and complexes, their electrochemistry and spectroscopy, has been critically reviewed (9).
Table 1. Physical Properties of Acetamide
Property Value Reference
melting point (trigonal), °C 80.0-80.1 3
triple point, К 353.33 4
heat of melting, AH^, kJ /kga 264 5
dielectric constant 59 6
dipole moment, C m 12.41 x 10~3° 3
density equation 1.357 - 0.0012T + 0.64 x lO^6 T2 6
melt density at 85°C, g/mL 0.9986 7
vapor pressure at Tin K, kPa 8
272 10
278 20
281 30
284 40
285 50
287 60
288 70
290 80
291 90
292 100
a To convert kJ to kcal, divide by 4.184.
b To convert C-m to debyes, multiply by 2.998 x 1029 .
Kelvin temperature.
To convert kPa to mm Hg, multiply by 7.50.
Preparation and Manufacture
Most commercial routes for the production of acetamide involve dehydration of ammonium acetate [631-31-8]'.
NH4OOCCH3 H2O + CH3CONH2
Industrial production is often based on transformation of this laboratory method into a continuous process (10). Another route is acetonitrile [75-05-8]
hydration:
ch3cn + h2o CH3CONH2
Because huge quantities of by-product acetonitrile are generated by ammoxidation of propylene, the nitrile may be a low cost raw material for acetamide
production. Copper-catalyzed hydration gives conversions up to 83% (11), and certain bacteria can effect the same reaction at near room temperature (12).
Health and Safety
Acetamide has been used experimentally as a source of nonprotein nitrogen for sheep and dairy catde (13). It does not appear to be toxic in amounts of
about 2—3% of ration. Buffering the diet with dibasic acids serves to allow higher levels of intake because the ammonia liberated in the digestive process is
then scavenged.
Economic Aspects
Heico Chemicals is the only producer of acetamide in the United States. Small amounts are imported from Europe and Asia. It is shipped in 32-L (35-gal)
drums weighing about 80 kg. Acetamide appears to have a wide spectrum of applications. It suppresses acid buildup in printing inks, lacquers, explosives,
and perfumes. It is a mild moisturizer and is used as a softener for leather, textiles, paper, and certain plastics. It finds some applications in the synthesis of
pharmaceuticals, pesticides, and antioxidants for plastics.
BIBLIOGRAPHY
Kirk-Othmer Encyclopedia of Chemical Technology (4th Edition)
73
ACETAMIDE
Voll
"Acetamide," in ECT 1st ed., Vol. 1, pp. 45—48 by S. J. Cohen, Hardesty Chemical Co., Inc.; in ECT 2nd ed., Vol. 1, pp. 142—145 by A. P. Lurie, Eastman
Kodak Company; in ECT 3rd ed., Vol. 1, pp. 148—151 by T. A. Moretti, American Hoechst Corporation.
1. N. V. Sidgwick, The Organic Chemistry of Nitrogen, Oxford University Press, New York, 1966, p. 228.
2. В. I. Srebrodol'ski, Zap. Vses. Mineral. O.-va, 104(3), 326—328 (1975); Chem. Abstr 83, 166946b (1975).
3. W. D. Kumler and C. W. Porter J. Am. Chem. Soc. 56, 2549-2554 (1934); E. C. Wagner J. Chem. Educ. 7, 1135-1137 (1930).
4. H. G. M. De Wit and co-workers,/. Chem. Thermodyn. 15, 891—902 (1983).
5. H. H. Emons and co-workers, Thermochim. Acta 104, 127 (1986).
6. L. Vogel and H. Schuberth, Viss. Z. Martin-Euther-Vni., ELalle-Wittenberg, Math.-Naturwiss. Reihe 34(3), 79—80 (1985).
7. W. E. S. Turner and E. W. Merry,/ Chem. Soc. Eondon, 97, 2069—2083 (1910).
8. H. G. M. De Wit and coworkers,/ Chem. Thermodyn. 15, 651—663 (1983).
9. D. H. Kerridge, Chem. Soc. Rev. 17, 181-227 (1988).
10. G. H. Coleman and A. M. Alvarado, Org. Synth. Coll. Vol. 1, 3, 4 (1941).
11. M. Ravindranatha, N. Kalyanam and S. Sivaram,/ Org. Chem. 47, 4812, 4813 (1982).
12. Eur. Pat. 204,555 (Dec. 10, 1986), K. Kawakami, T. Tanabe, and O. Nagano (to Asahi Chemical Industries Co. Ltd.); Chem. Abstr. 106, 212584a
(1987).
13. Eur. Pat. 317,092 (May 24,1989), J. M. Moxley and K. R. Zone (to OMI International Corp.); Chem. Abstr. Ill, 107394u (1989); Can. J. Anim. Sci.
64 suppl., 37, 38 (1984).
Frank S. Wagner, Jr.
Nandina Corporation
Kirk-Othmer Encyclopedia of Chemical Technology (4th Edition)
74
ACETIC ANHYDRIDE
Voll
ACETIC ANHYDRIDE
Acetic anhydride [108-24-7]> (CH3CO)2O, is a mobile, colorless liquid that has an acrid odor and is a more piercing lacrimator than acetic acid [64-19-7]. It
is the largest commercially produced carboxylic acid anhydride: U.S. production capacity is over 900,000 t yearly. Its chief industrial application is for
acetylation reactions; it is also used in many other applications in organic synthesis, and it has some utility as a solvent in chemical analysis.
First prepared by C. F. Gerhardt from benzoyl chloride and carefully dried potassium acetate (1), acetic anhydride is a symmetrical intermolecular
anhydride of acetic acid; the intramolecular anhydride is ketene [463-51-4]. Benzoic acetic anhydride [2819-08-1] undergoes exchange upon distillation to
yield benzoic anhydride [93-97-0] and acetic anhydride.
Physical and Chemical Properties
No dimerization of acetic anhydride has been observed in either the Equid or solid state. Decomposition, accelerated by heat and catalysts such as mineral
acids, leads slowly to acetic acid (2). Acetic anhydride is soluble in many common solvents, including cold water. As much as 10.7 wt % of anhydride will
dissolve in water. The unbuffered hydrolysis rate constant k at 20°C is 0.107 min- and at 40°C is 0.248 min- . The corresponding activation energy is
about 31.8 kJ/mol (7.6 kcal/mol) (3). Although aqueous solutions are initially neutral to litmus, they show acid properties once hydrolysis appreciably
progresses. Acetic anhydride ionizes to acetylium, CH3CO+, and acetate, CH3CO/, ions in the presence of salts or acids (4). Acetate ions promote
anhydride hydrolysis. A summary of acetic anhydride's physical properties is given in Table 1.
Table 1. Physical Properties of Acetic Anhydride
Property Value Reference
freezing point, °C —73.13 5
boiling point, °C at 101.3 kPaa 139.5 5
density, Ay, g/cm3 1.0820 5
refractive index, #20D 1.39038 6
, x 14.6497-3467.76
vapor pressure (Antoine equation), 1J in kPa and 1 in К ln(p)= T — 67.0
heat of vaporization, AH, at bp, J/g 406.6 5
specific heat, J/kgC at 20°C 1817 8
surface tension, mN/m (=dyn/cm)
25°C 32.16 9
40°C 30.20 9
viscosity, mPa-s (=cP)
15°C 0.971 10
30°C 0.783 10
heat conductivity, mW/(m-K) at 30°C 136 11
electric conductivity, S /cm 2.3 x 10⁻⁸ 12
To convert kPa to mm Hg, multiply by 7.5.
b To convert J/g to Btu/lb, multiply by 0.4302.
To convert J to cal, divide by 4.184.
dTo convert mW/(m-K) to (Btuft)/(hft2oF), multiply by 578.
Acetic anhydride acetylates free hydroxyl groups without a catalyst, but esterification is smoother and more complete in the presence of acids. For
example, in the presence ofp-toluenesulfonic acid [104-15-4]> the heat of reaction for ethanol and acetic anhydride is —60.17 kJ/mol (—14.38 kcal/mol)
(13):
ROH + (CH3CO)2O CH3COOR+ CH3COOH
Amines undergo an analogous reaction to yield acetamides, the more basic amines having the greater activity:
RNH2 + (CH3CO)2O CH3CONHR+ CH3COOH
Potassium acetate, rubidium acetate, and cesium acetate are very soluble in anhydride in contrast to the only slighdy soluble sodium salt. Barium
forms the only soluble alkaline earth acetate. Heavy metal acetates are poorly soluble.
Triacetylboron [4887-24-5]., C^H^BO^, is generated when boric acid is added to acetic anhydride and warmed. Although explosions have resulted
from carrying out this reaction, slowly adding the boric acid to a zinc chloride solution in acetic anhydride, and maintaining a temperature below 60°C,
gives a good yield (14). Acetic acid is also formed
H3BO3 + 3 (CH3CO)2O (CH3CO)3BO3 + 3 CH3COOH
Heating triacetylboron at temperatures above its melting point, 123°C, causes a rearrangement to B2O(OCCH3)4 (15). An explosive hazard is also
generated by dissolving BF3 in anhydride (see Boron compounds).
Hydrogen peroxide undergoes two reactions with anhydride:
(CH3CO) 2O + H2O2 CH3COOOH + CH3COOH + H2O
(CH3CO) 2O -2H2O2 -2 CH3COOOH + H2O
Peroxyacetic acid [79-21-0] is used in many epoxidations (16) where ion-exchange resins, eg, Amberlite IR-1180M, serve as catalysts. Pinene is epoxidized
Kirk-Othmer Encyclopedia of Chemical Technology (4th Edition)
75
ACETIC ANHYDRIDE
Voll
to sobrerol [498-71-5], С10Н18О2, using peroxyacetic acid at —5 to —10° C (17). Care must be taken, however, to avoid formation of the highly explosive
diacetyl peroxide [110-22-5]-.
(CH3CO)2O + CHgCOOOH CH3CO—00—COCH3 + CH3COOH
Acetic anhydride can be used to synthesize methyl ketones in Friedel-Crafts reactions. For example, benzene [71-43-2] can be acetylated to furnish
acetophenone [98-86-2]. Ketones can be converted to their enol acetates and aldehydes to their alkylidene diacetates. Acetaldehyde reacts with acetic
anhydride to yield ethylidene diacetate [542-10-9] (18):
CH3CHO+ (CH3CO)2O CH3CH(O2CCH3)2
Isopropenyl acetate [108-22-5]> which forms upon reaction of acetone [67-64-1] with anhydride, rearranges to acetylacetone [123-54-6] in the presence of
BF3 (19):
О о
BF3 II И
CH3COOC=CH2 —^СНзС—сн2—с=сн3
сн3
Unsaturated aldehydes undergo a similar reaction in the presence of strongly acid ion-exchange resins to produce alkenyEdene diacetates. Thus acrolein
[107-02-8] or methacrolein [78-85-3] react with equimolar amounts of anhydride at — 10°C to give high yields of the^t7/7-diacetates from acetic anhydride,
useful for soap fragrances.
Acids react with acetic anhydride to furnish higher anhydrides (20). An acid which has a higher boiling point than acetic acid is refluxed with acetic
anhydride until an equilibrium is established. The low boiling acetic acid is distilled off and the anhydride of the higher acid is left. Adipic polyanhydride is
obtained in this manner (21).
Manufacture
The Acetic Acid Process. Prior to the energy crisis of the 1970s, acetic anhydride was manufactured by thermal decomposition of acetic acid
at pressures of 15—20 kPa (2.2—2.9 psi) (22), beginning with the first step:
CH3COOH CH2=C=O + H2O
The heat of reaction is approximately 147 kJ /mol (35.1 kcal/mol) (23). Optimum yields of ketene [463-51-4] require a temperature of about 730—750°C.
Low pressure increases the yield, but not the efficiency of the process. Competitive reactions are
CH3COOH CH4 + CO2 (endothermic)
CH3COOH 2 CO + 2 H2 (exothermic)
2 CH2=C=O CH4 + C + 2 CO (exothermic)
2 CH2=C=O CH2=CH2 + 2 CO (exothermic)
The second step is the liquid-phase ketene and acetic acid reaction
CH2=C=O + CH3COOH (CH3CO)2O (exothermic)
Triethyl phosphate is commonly used as dehydration catalyst for the water formed in the first step. It is neutralized in the exit gases with ammonia.
Aqueous 30% ammonia is employed as solvent in the second step because water facilitates the reaction, and the small amount of water introduced is not
significant overall. Compression of ketene using the liquid-ring pump substantially improves the formation of anhydride. Nickel-free alloys, eg,
ferrochrome alloy, chrome—aluminum steel, are needed for the acetic acid pyrolysis tubes, because nickel promotes the formation of soot and coke, and
reacts with carbon monoxide yielding a highly toxic metal carbonyl. Coke formation is a serious efficiency loss. Conventional operating conditions furnish
85—88% conversion, selectivity to ketene 90—95 mol %. High petroleum energy costs make these routes only marginally economic.
Acetone cracks to ketene, and may then be converted to anhydride by reaction with acetic acid. This process consumes somewhat less energy and is
a popular subject for chemical engineering problems (24,25). The cost of acetone works against widespread application of this process, however.
The Acetaldehyde Oxidation Process. Liquid-phase catalytic oxidation of acetaldehyde (qv) can be directed by appropriate catalysts, such
as transition metal salts of cobalt or manganese, to produce anhydride (26). Either ethyl acetate or acetic acid may be used as reaction solvent. The reaction
proceeds according to the sequence
CH3CHO + O2 CH3COOOH
CH3COOOH + CH3CHO CH3COOOCH(OH) CH3
CH3COOOCH(OH) CH3 (CH3CO)2O + H2O
CH3COOOCH(OH) CH3 CH3COOH + CH3COOH
Acetaldehyde oxidation generates peroxyacetic acid which then reacts with more acetaldehyde to yield acetaldehyde monoperoxyacetate [7416-48-0]y the
Loesch ester (26). Subsequendy, parallel reactions lead to formation of acetic acid and anhydride plus water.
Under sufficient pressure to permit a liquid phase at 55—56°C, the acetaldehyde monoperoxyacetate decomposes nearly quantitatively into anhydride
and water in the presence of copper. Anhydride hydrolysis is unavoidable, however, because of the presence of water. When the product is removed as a
vapor, an equiEbrium concentration of anhydride higher than that of acetic acid remains in the reactor. Water is normally quite low. Air entrains the acetic
anhydride and water as soon as they form.
High purity acetaldehyde is desirable for oxidation. The aldehyde is diluted with solvent to moderate oxidation and to permit safer operation. In the
Equid take-off process, acetaldehyde is maintained at 30—40 wt % and when a vapor product is taken, no more than 6 wt % aldehyde is in the reactor
solvent. A considerable recycle stream is returned to the oxidation reactor to increase selectivity. Recycle air, chiefly nitrogen, is added to the air introducted
to the reactor at 4000—4500 times the reactor volume per hour. The customary catalyst is a mixture of three parts copper acetate to one part cobalt acetate
by weight. Either salt alone is less effective than the mixture. Copper acetate may be as high as 2 wt % in the reaction solvent, but cobalt acetate ought not
rise above 0.5 wt %. The reaction is carried out at 45—60°C under 100—300 kPa (15—44 psi). The reaction solvent is far above the boiling point of
acetaldehyde, but the reaction is so fast that Etde escapes unoxidized. This temperature helps oxygen absorption, reduces acetaldehyde losses, and inhibits
anhydride hydrolysis.
Product refining is quite facile, following the same general pattern for acetic acid (qv) recovery from acetaldehyde Equid-phase oxidation. Low
Kirk-Othmer Encyclopedia of Chemical Technology (4th Edition)
76
ACETIC ANHYDRIDE
Voll
boilers are stripped off using ethyl acetate or acetic acid, then anhydride is distilled. Residues, largely ethylidene diacetate and certain higher condensation
products with the catalyst salts, can be recycled (27).
Methyl Acetate Carbonylation. Anhydride can be made by carbonylation of methyl acetate [79-20-9] (28) in a manner analogous to
methanol carbonylation to acetic acid. Methanol acetylation is an essential first step in anhydride manufacture by carbonylation. See Figure 1. The reactions
are
CHgCOOH + CH3OH CH3COOCH3 + H20 -4.89 kJ/mol (-1.2 kcal/mol)
CH3COOCH3 + CO (CH3CO)2O —94.8 kJ/mol (-22.7 kcal/mol)
70 tray
azeot roper
25 tray
ester col.
50 tray
finishing col.
Fig. 1. Flow sheet for methyl acetate manufacture. To convert kPa to psi multiply by 0.145.
Surprisingly, there is limited nonproprietary experimental data on methanol esterification with acetic acid (29). Studies have been confined to liquid-phase
systems distant from equilibrium (30), in regions where hydrolysis is unimportant. A physical study of the ternary methanol—methyl acetate—water system is
usefill for design work (31). Methyl acetate and methanol form an azeotrope which boils at 53.8°C and contains 18.7% alcohol. An apparent
methanol—water azeotrope exists, boiling at 64.4°C and containing about 2.9% water. These azeotropes seriously complicate methyl acetate recovery.
Methyl acetate is quite soluble in water, and very soluble in water—methanol mixtures, hence two liquid phases suitable for decanting are seldom found.
The reaction mechanism and rates of methyl acetate carbonylation are not fully understood. In the nickel-catalyzed reaction, rate constants for
formation of methyl acetate from methanol, formation of dimethyl ether, and carbonylation of dimethyl ether have been reported, as well as their
sensitivity to partial pressure of the reactants (32). For the rhodium chloride [10049-07-7] catalyzed reaction, methyl acetate carbonylation is considered to
go through formation of ethylidene diacetate (33):
2 CH3COOCH3 + 2 CO 2 (CH3CO)2O
2 (CH3CO)2O + H2 CH3CH(OOCCH3)2 + CH3COOH
The role of iodides, especially methyl iodide, is not known. The reaction occurs scarcely at all without iodides. Impurities and co-products are poorly
reported in the patent literature on the process.
The catalyst system for the modem methyl acetate carbonylation process involves rhodium chloride trihydrate [13569-65-8]^ methyl iodide [74-88-4]\
chromium metal powder, and an alumina support or a nickel carbonyl complex with triphenylphosphine, methyl iodide, and chromium hexacarbonyl (34).
The use of nitrogen-heterocyclic complexes and rhodium chloride is disclosed in one European patent (35). In another, the alumina catalyst support is
treated with an organosilicon compound having either a terminal organophosphine or similar ligands and rhodium or a similar noble metal (36). Such a
catalyst enabled methyl acetate carbonylation at 200°C under about 20 MPa (2900 psi) carbon monoxide, with a space-time yield of 140 g anhydride per g
rhodium per hour. Conversion was 42.8% with 97.5% selectivity. A homogeneous catalyst system for methyl acetate carbonylation has also been disclosed
(37). A description of another synthesis is given where anhydride conversion is about 30%, with 95% selectivity. The reaction occurs at 445 К under 11
MPa partial pressure of carbon monoxide (37). A process based on a montmorillonite support with nickel chloride coordinated with imidazole has been
developed (38). Other related processes for carbonylation to yield anhydride are also available (39,40).
The first anhydride plant in actual operation using methyl acetate carbonylation was at Kingsport, Tennessee (41). A general description has been
given (42) indicating that about 900 tons of coal are processed daily in Texaco gasifiers. Carbon monoxide is used to make 227,000 t/yr of anhydride from
177,000 t/yr of methyl acetate; 166,000 t/yr of methanol is generated. Infrared spectroscopy has been used to follow the apparent reaction mechanism (43).
The unit has virtually the same flow sheet (see Fig. 2) as that of methanol carbonylation to acetic acid (qv). Any water present in the methyl acetate
feed is destroyed by recycle anhydride. Water impairs the catalyst. Carbonylation occurs in a sparged reactor, fitted with baffles to diminish entrainment of
the catalyst-rich liquid. Carbon monoxide is introduced at about 15—18 MPa from centrifugal, multistage compressors. Gaseous dimethyl ether from the
reactor is recycled with the CO and occasional injections of methyl iodide and methyl acetate may be introduced. Near the end of the life of a catalyst
charge, additional rhodium chloride, with or without a ligand, can be put into the system to increase anhydride production based on net noble metal
introduced. The reaction is exothermic, thus no heat need be added and surplus heat can be recovered as low pressure steam.
Kirk-Othmer Encyclopedia of Chemical Technology (4th Edition)
77
ACETIC ANHYDRIDE
Voll
Catalyst
Methyl acetate
Recycle
Acetic acid
Co-compressors Carbonylation
reactor
Acid recycle
60 tray
acid column
Fig. 2. Flow sheet for methyl acetate carbonylation to anhydride. To convert kPa to psi multiply by 0.145.
Catalyst recovery is a major operational problem because rhodium is a cosdy noble metal and every trace must be recovered for an economic
process. Several methods have been patented (44—46). The catalyst is often reactivated by heating in the presence of an alcohol. In another technique, water
is added to the homogeneous catalyst solution so that the rhodium compounds precipitate. Another way to separate rhodium involves a two-phase Equid
such as the immiscible mixture of octane or cyclohexane and aliphatic alcohols having 4—8 carbon atoms. In a typical instance, the carbonylation reactor is
operated so the desired products and other low boiling materials are flash-distilled. The reacting mixture itself may be boiled, or a sidestream can be
distilled, returning the heavy ends to the reactor. In either case, the heavier materials tend to accumulate. A part of these materials is separated, then
concentrated to leave only the heaviest residues, and treated with the immiscible liquid pair. The rhodium precipitates and is taken up in anhydride for
recycling.
By-products remain unmentioned in most patents. Possibly there are none other than methyl acetate, acetic acid, and ethylidene diacetate, which are
all precursors of anhydride.
In anhydride purification, iodide removal is of considerable significance; potassium acetate has been suggested for this procedure (47). Because of
the presence of iodide in the reaction system, titanium is the most suitable material of construction. Conventional stainless steel, SS-316, can be used for
the acetylation of methanol, but it is unsuited for any part of the plant where halogen is likely to be present. Although such materials of construction add
substantially to the capital cost of the plant, savings in energy consumed are expected to compensate. No authentic data on process efficiency has been
published, but a rough estimate suggests a steam consumption of 1.9—2.0 kg/kg product anhydride.
Prospective Routes to Acetic Anhydride. Methyl acetate—dimethyl ether carbonylation seems to be the leading new route to acetic
anhydride production. The high energy costs of older routes proceeding through ketene preclude their reintroduction. Thermolysis of acetone, methyl
acetate, and ethylidene diacetate suffers from the same cosdy energy consumption. Acetic acid cracking, under vacuum and at atmospheric pressure,
continues to be used for anhydride manufacture in spite of the clear obsolescence of the processes. The plants have high capital investment, and
dismantling them demands a large economic advantage from any supplanting process.
Acetaldehyde oxidation to anhydride does not consume great amounts of energy. The strongly exothermic reaction actually furnishes energy and the
process is widely used in Europe. Acetaldehyde must be prepared from either acetylene or ethylene. Unfortunately, use of these raw materials cancels the
other advantages of this route. Further development of more efficient acetaldehyde oxidation as well as less expensive materials of construction would
make that process more favorable.
Copper acetate, ferrous acetate, silver acetate [563-63-3]., basic aluminum acetate, nickel acetate [373-02-4]., cobalt acetate, and other acetate salts have
been reported to furnish anhydride when heated. In principle, these acetates could be obtained from low concentration acetic acid. Complications of solids
processing and the scarcity of knowledge about these thermolyses make industrial development of this process expensive. In the early 1930s, Soviet
investigators discovered the reaction of dinitrogen tetroxide [10544-72-6] and sodium acetate [127-09-3] to form anhydride:
2NaOOCCH3 + 2N2O4 (CH3CO)2O + 2 NaN03 + N2O3
Yields of the order of 85% were secured in the dry reaction (48). (Propionic anhydride and butyric anhydride can be obtained similarly from their sodium
salts.) Inasmuch as dinitrogen tetroxide can be regenerated, the economic prospects of this novel way of making anhydride are feasible.
Sodium acetate reacts with carbon dioxide in aqueous solution to produce acetic anhydride and sodium bicarbonate (49). Under suitable conditions,
the sodium bicarbonate precipitates and can be removed by centrifugal separation. Presumably, the cold water solution can be extracted with an organic
solvent, eg, chloroform or ethyl acetate, to furnish acetic anhydride. The half-life of aqueous acetic anhydride at 19°C is said to be no more than 1 h (2) and
some other data suggests a 6 min half-life at 20°C (50). The free energy of acetic anhydride hydrolysis is given as —65.7 kJ/mol (—15.7 kcal/mol) (51) in
water. In wet chloroform, an extractant for anhydride, the free energy of hydrolysis is strangely much lower, —50.0 kJ/mol (—12.0 kcal/mol) (51). Half-life
of anhydride in moist chloroform maybe as much as 120 min. Ethyl acetate, chloroform, isooctane, and ^-octane may have promise for extraction of acetic
anhydride. Benzene extracts acetic anhydride from acetic acid—water solutions (52).
Ketene can be obtained by reaction of carbon oxides with ethylene (53). Because ketene combines readily with acetic acid, forming anhydride, this
route may have practical applications. Litde is known about the engineering possibilities of these reactions.
Kirk-Othmer Encyclopedia of Chemical Technology (4th Edition)
78
ACETIC ANHYDRIDE
Voll
Economic Aspects
Acetic anhydride is a mature commodity chemical in the United States and its growth rate in the 1970s and 1980s was negative until 1988 when foreign
demand nearly doubled the exports of 1986. This increase in exports was almost certainly attributable to the decline in the value of the U.S. dollar. Over
four-fifths of all anhydride production is utilized in cellulose acetate [9004-35-7] manufacture (see Cellulose esters). Many anhydride plants are integrated
with cellulose acetate production and thus employ the acetic acid pyrolysis route. About 1.25 kg acetic acid is pyrolyzed to produce 1.0 kg anhydride.
(Methyl acetate carbonylation demands only 0.59 kg acetic acid per kg anhydride manufactured.)
Anhydride has been used for the illegal manufacture of heroin [561-27-3] (acetylmorphine) and certain other addictive drugs. Regulations on acetic
anhydride commerce have long been a feature of European practice. After passage in 1988 of the Chemical Diversion and Trafficking Act, there is also U.S.
control. Orders for as much as 1,023 kg acetic anhydride, for either domestic sale or export, require a report to the Department of Justice, Drug
Enforcement Administration (54).
Acetic anhydride is used in acetylation processes. There has been some diversification of anhydride usage in recent years. Acetylation of salicylic acid
[69-72-7] using anhydride to furnish acetyls alicyclic acid [50-78-2] (aspirin) is a mature process, although A- acetyl-/- aminophenol (acetaminophen) is
currendy making inroads on the aspirin market. Acetic anhydride is used to acetylate various fragrance alcohols to transform them into esters having much
higher unit value and vitamins are metabolically enhanced by acetylation. Anhydride is also extensively employed in metallography, etching, and polishing of
metals, and in semiconductor manufacture. Starch acetylation furnishes textile sizing agents.
Acetic anhydride is a useful solvent in certain nitrations, acetylation of amines and organosulfur compounds for rubber processing, and in pesticides.
Though acetic acid is unexceptional as a fungicide, small percentages of anhydride in acetic acid, or in cold water solutions are powerful fungicides and
bactericides. There are no reports of this application in commerce. It is possible that anhydride may replace formaldehyde for certain mycocidal
applications.
Analysis and Specifications
Analytical and control methods for acetic anhydride are fully discussed in reference 55. Performance tests are customarily used where the quality of the
product is crucial, as in food or pharmaceutical products. Typical specifications are:
assay
specific gravity21^
color, Pt—Co
KMnO4 time
trace ions
heavy metals
nitrates
99.0 wt % as anhydride
1.080 to 1.085
10 max
5 min needed to reduce 2 mL having no more than 0.1 mL of 0.1 IV KMnO4.
less than 1 ppm Al, Cl, PO|- , SO^- , and Fe.
none
none
A technical quality anhydride, assay about 97% maximum, often contains color bodies, heavy metals, phosphorus, and sulfur compounds.
Anhydride manufactured by acetic acid pyrolysis sometimes contains ketene polymers, eg, acetylacetone, diketene, dehydroacetic acid, and particulate
carbon, or soot, is occasionally encountered. Polymers of allene, or its equilibrium mixture, methylacetylene—allene, are reactive and refractory impurities,
which if exposed to air, slowly autoxidize to dangerous peroxidic compounds.
Health and Safety
Acetic anhydride penetrates the skin quickly and painfully forming bums and blisters that are slow to heal. Anhydride is especially dangerous to the delicate
tissues of the eyes, ears, nose, and mouth. The odor threshold is 0.49 mg/m3, but the eyes are affected by as litde as 0.36 mg/m3 and electroencephalogram
patterns are altered by only 0.18 mg/m3. When handling acetic anhydride, rubber gloves that are free of pinholes are recommended for the hands, as well as
plastic goggles for the eyes, and face-masks to cover the face and ears.
Acetic anhydride is dangerous in combination with various oxidizing substances and strong acids. Chromium trioxide [1333-82-0] and anhydride
react violendy to bum (56); mixtures containing nitric acid [7692-37-2] are said to be more sensitive than nitroglycerin (57). Thermal decomposition of nitric
acid in acetic acid solutions is accelerated by the presence of anhydride (58). The critical detonation diameter for a nitric acid—acetic anhydride mixture has
been subject to much study in the Soviet Union (59). The greatest explosion involving anhydride took place when a mixture of 568 L perchloric acid
[7601-90-3] were admixed with 227 L of acetic anhydride. The mixture detonated, killing 17 people and destroying 116 buildings over several city blocks
(60). The plant was an illegal metal-treating facility where the mixture was used to finish aluminum surfaces. Acetyl perchlorate is probably present in such
solutions. These perchloric acid solutions are useful in metal finishing, but the risks in using them must be recognized. Such solutions are used commonly
in metallography.
BIBLIOGRAPHY
"Acetic Anhydride" in ECT 1st ed., Vol. 1, pp. 78—86, by Gwynn Benson, Shawinigan Chemicals Limited; in ECT 2nd ed., Vol. 8, pp. 405—414, by Ernest
Le Monnier, Celanese Corporation of America; in ECT 3rd ed., Vol. 1, pp. 151—161, by Frank S. Wagner, Jr., Celanese Chemical Corporation.
1. C. F. Gerhardt, Ann. Chim. Phys. 37(3), 285 (1852).
2. A. Lumier'e, L. Lumier'e, and H. Barbier, Pull Soc. Chim. 33, [iii], 783 (1905).
3. M. S. Sytilin, A. I. Morozov, and I. A. Makolkin, ZA Fz^. Khim. 46, 2266 (1972).
4. H. Schmidt, I. Wittkopf, and G. Jander, Z Anorg. Chem. 256, 113 (1948).
5. R. A. McDonald, S. A. Shrader, and D. R. Stull,/. Chem. Eng. Data 4, 311 (1959).
6. Luck and co-workers,/ Am. Chem. Soc. 81, 2784—2786 (1959).
7. D. Ambrose andN. B. Ghiassee,/ Chem. Thermodyn. 19, 911 (1987).
8. F. J. Wright,/ Chem. Eng. Data 6, 454 (1961).
9. K. N. Kovalenko and co-workers, ZA Obshch. Khim. 26, 403—407 (1956).
10. T. V. Malkova, Zh. Obshch. Khim. 24, 1157 (1954).
11. N. V. Tsederberg, The Thermal Conductivity of Gases and Eiquids., Massachusetts Institute of Technology Press, Cambridge, Mass., 1965.
12. G. Jander and H. Surawski, Z Elektrochem. 65, 469 (1961).
13. Eur. Pat. 170,173 (Feb. 12, 1986), G. W. Stockton, D. H. Chidester, and S. J. Ehrlich (to American Cyanamid Company).
14. L. M. Lemer, Chem. Eng. Neu’s 51(34), 42 (1973).
15. I. G. Ryss and V. N. Plakhotnik, Ukr. Khim. Zh. (Russ, ed.) 36, 423 (1970).
16. Ger. Pat. 3,447,864 (July 10, 1986), K. Eckwert and co-workers (to Henkel K.-G.a.A.).
17. Span. Pat. 548,516 (Dec. 1,1986), J. L. Diez Amez; Chem. Abstr. 108, 2210711 (1988).
18. N. Rizkalla and A. Goliaszewski in D. A. Fahey, ed., Industrial Chemicals via C1 Processes (ACS Symposium Series, 328), American Chemical Society,
Kirk-Othmer Encyclopedia of Chemical Technology (4th Edition)
79
ACETIC ANHYDRIDE
Voll
Washington, D.C., 1987, PP. 136-153.
19. Ger. Pat. 1,904,141 (Sept. 11, 1969), W. Gay, A. F. VeUturo, and D. Sheehan.
20. Ger. Offen. 3,510,035 (Sept. 25,1986), K. Bott and co-workers (to BASF A.G.); Jpn. Pats. JP 61-151,152 and JP 61-151,153 (July 9,1986) and JP
61-161,241 (Jan. 8, 1985), K. Inoue, H. Takeda, and M. Kobayashi (to Mitsubishi Rayon Co. Ltd.); Ger. Pat. 3,644,222 (July 30, 1987), M.
Hinenoya andM. Endo (to Daicel Chemical Industries Ltd.).
21. V. Zvonar, Coll. Cyech. Chem. Communs. 38(8), 2187 (1973).
22. Ger. Pat. 1,076,090 (Feb. 25, 1960), corresponding to U.S. 3,111,548 (Nov. 19, 1963), T. Altemschoepfer, H. Spes, and L. Vomehm (to
Wacker-Chemie); H. Spes, Chem. Ing. Tech. 38, 963 (1966).
23. W. Hunter, BIOS Field Report 1050, # 22, Feb. 1, 1947; reissued as PB 68,123, U.S. Dept, of Commerce, Washington, D.C.
24. G. V. Jeffreys, The Manufacture of Acetic Anhydride, 2nd ed., The Institution of Chemical Engineers, London, 1964.
25. "Acetic Anhydride Design Problem" in J. J. McKetta and W. A. Cunningham, eds., Encyclopedia of Chemical Processing and Design, Marcel Dekker, Inc.,
New York, Vol. 1, p. 271.
26. Ger. Pats. 699,709 (Nov. 7,1940) and 708,822 (June 19,1941), J. Loesch and co-workers (to A. G. fbr Stickstoffdbnger); Chem. Abstr. 35, 5133
(1941); 36, 1955 (1942).
27. Fr. Pat. 1,346,360 (Dec. 20, 1963), G. Sitaud and P. Biarais (to Les Usines de Melle).
28. U.S. Pat. 2,730,546 (April 16,1957), W. Reppe (to BASF A.G.).
29. H. Goldschmidt and co-workers, Z Physik. Chem. 60, 728 (1907); Z Physik. Chem. 81,30 (1912); Z Physik. Chem. 143, 139 (1929); Z Physik. Chem.
143, 278 (1929); A. T. Williamson and co-workers, Trans. Faraday Soc. 34, 1145—1149 (1934); H. A. Smith,/. Am. Chem. Soc. 61(1), 254—260 (1939).
30. A. G. Crawford and co-workers,/ Chem. Soc. 1949, 1054—1058 (1949).
31. Ger. Pat. 1,070,165 (Dec. 3, 1959), K. Kummede (to Farbwerke Hoechst); Br. Pat. 2,033,385 (May 21, 1980), C. G. Wan (to Halcon).
32. K. Fujimoto and co-workers, Am. Chem. Soc. Div. Pet. Chem., Prepr., 31(1), 85—90, 91—96 (1986).
33. E. Drent, Am. Chem. Soc. Div. Pet. Chem. Prepr. 31(1), 97—103 (1986).
34. U.S. Pats. 4,002,678 and 4,002,677 (Jan. 11, 1977), A. N. Naglieri and co-workers (to Halcon International).
35. Eur. Pat. 8396 (March 5, 1980), H. Erpenbach and co-workers (to Hoechst).
36. Eur. Pat. 180,802 (Oct. 10,1986), G. Luft and G. Ritter (to Hoechst A.G.).
37. G. Ritter and G. Luft, Chem. Ing. Tech. 59(6), 485-486 (1987); 58(8), 668-669 (1986).
38. Jpn. Pat* 62-135,445 (June 16, 1987), N. Okada and O. Takahashi (to Idemitsu Ko san K.K.).
39. U.S. Pat. 4,690,912 (Sept. 1, 1987), F. E. Paulik, A. Hershman, W. R. Knox, and J. F. Roth (to Monsanto Company).
40. Jpn. Pat* 62-226,940 (Oct. 5, 1987), H. Koyama, N. Noda, and H. Kojima (to Daicel Chemical Industry K.K.).
41. V. H. Agreda, CHEMTECH 250-253 (April 1988).
42. T. H. Larkins, Jr., Am. Chem. Soc. Div. Pet. Chem. Prepr. 31(1), 74—78 (1986); G. G. Mayfield and V. H. Agreda, Energy Progress 6(4), 214—218 (Dec.
1986); Chem. Eng. News, 30—32 (May 21, 1990).
43. S. W. Pohchnowski,/ Chem. Educ. 63(3), 206—209 (1986).
44. U.S. Pat. 4,605,541 (Aug. 12, 1986), J. Pugach (to The Halcon SD Group, Inc.).
45. U.S. Pat. 4,650,649 (Mar. 17, 1987) and U.S. Pat. 4,578,368 (Mar. 25, 1986), J. R. Zoeller (to Eastman Kodak Company).
46. U.S. Pat. 4,440,570 (April 3,1984), U.S. Pat. 4,442,304 (April 10, 1984), U.S. Pat. 4,557,760 (Dec. 1985), H. Erpenbach and co-workers (to
Hoechst A.G.).
47. Brit. Pat. 2,033,385 (May 21, 1980), P. L. Szecsi (to Halcon Research & Development).
48. V. M. Rodionov, A. I. Smarin, and T. A. Obletzove, Chem. Abstr. 30, 1740, 4149 (1936); V. M. Rodionov and T. A. Oblitseva, Chem. Zentr,
1938(11), 4054; Chem. Abstr. 34,6572 (1940).
49. Fr. Pat. 47,873 addn. to Fr. Pat. 809,731 (Aug. 14, 1937), A. Consalvo; Brit. Pat. 480,953 (Feb. 28,1938); Brit. Pat. 486,964, addn. to 480,953
(June 14,1938).
50. W. P. Jencks and co-workers,/. Am. Chem. Soc. 88, 4464—4467 (1966).
51. R. Wolfenden and R. Williams,/. Am. Chem. Soc. 107, 4345—4346 (1985).
52. Jpn. Pat* 60-204,738 (Oct. 16, 1985), M. Ichino and co-workers (to Daicel Chemical Industries Ltd.).
53. Fr. Pat. 973,160 (Feb. 8,1951), G. H. van Hoek; Fr. Pat. 1,040,934 (Oct. 20, 1953), J. Francon.
54. D. Hanson, Chem. Eng. News, 17 (Feb. 27, 1989).
55. E. F. Joy and A. J. Barnard, Jr. in F. D. Snell and C. L. Hilton, eds., Encyclopedia of Industrial Chemical Analysis, Vol. 4, John Wiley & Sons Inc., New
York, 1967, pp. 102-107.
56. G. A. P. Tuey, Chem. Ind. Eondon, 1948, 766 (1948); D. A. Peak, Chem. Ind. Eondon 1949, 14 (1949).
57. J. Dubar and J. Calzia, C.R. Acad. Sci., Ser. C. 266, 1114 (1968).
58. V. I. Semenikhim and co-workers, Tr. Mosks. Khim. Tekhnol. Inst. im. D. I. Mendeleeva 112, 43—47 (1980); Chem. Abstr. 97, 99151n (1982).
59. V. M. Raikova, Tr. Mosks. Khim. Tekhnol. Inst. 112, 97—102 (1980); Chem. Abstr. 98, 5958b (1983).
60. J. H. Kuney, Chem. Eng. News 25, 1658 (1947).
Frank S. Wagner, Jr.
Nandina Corporation
Kirk-Othmer Encyclopedia of Chemical Technology (4th Edition)
80
ACETYL CHLORIDE
Voll
ACETYL CHLORIDE
Acetyl chloride [75-36-5]\ C2H3OC1, mol wt 78.50, is a colorless, corrosive, irritating liquid that fumes in air. It has a stifling odor and reacts very rapidly
with water, readily hydrolyzing to acetic acid and hydrochloric acid. As litde as 0.5 parts per million activate the flow of tears, and often provoke a burning
sensation in the eyes, nose, and throat. Acetyl chloride is toxic. Its high reactivity with hydroxyl, sulfhydryl, and amine groups leads to modifications that
block the action of many important enzymes needed by living tissue.
Physical and Chemical Properties
The common physical properties of acetyl chloride are given in Table 1. The vapor pressure has been measured (2,7), but the experimental difficulties are
considerable. An equation has been worked out to represent the heat capacity (8), and the thermodynamic ideal gas properties have been conveniendy
organized (9).
Table 1. Physical Properties of Acetyl Chloride
Property Value Reference
freezing point, °C 1
boiling point, °C at 101.3 kPaa 50.2 2
density, g/mL 3
4°C 1.1358 4
20°C 1.1051 3
25°C 1.0982 4
heat of formation, AH, kJ /mol -243.93 5
heat of vaporization at bp, AH^, kj/g 0.36459 6
refractive index, #20D 1.38976 3
To convert kPa to atm, divide by 101.3.
To convert kJ to kcal, divide by 4.184.
The important chemical properties of acetyl chloride, CH3COC1, were described in the 1850s (10). Acetyl chloride was prepared by distilling a
mixture of anhydrous sodium acetate [127-09-3]> C2H3O2Na, and phosphorous oxychloride [10025-87-3]y POC13, and used it to interact with acetic acid
yielding acetic anhydride. Acetyl chloride's violent reaction with water has been used to model liquid-phase reactions.
CHgCOCl + H2O CH3COOH + HC1
A fixed-bed reactor for this hydrolysis that uses feed-forward control has been described (11); the reaction, which is first order in both reactants, has also
been studied kinetically (12—14). Hydrogen peroxide interacts with acetyl chloride to yield both peroxyacetic acid [79-21 -0]> C2H4O3, and acetyl peroxide
[110-22-5]\ C4H6O4 (15). The latter is a very dangerous explosive.
Reactions of acetyl chloride that are formally analogous to hydrolysis occur with alcohols, mercaptans, and amines: primary or secondary
compounds form corresponding acetates or amides; tertiary alcohols generally yield the tertiary alkyl chlorides. Acetyl chloride can split the ether linkages of
many ordinary ethers and acetals. It equilibrates with fatty acids to provide measureable amounts of the mixed acetic—alkylcarboxylic anhydride or acyl
chloride, either of which may be employed in esterifications. For example, lauric acid [143-07-7]> C12H24O2, and acetyl chloride undergo the reactions
CH3(CH2)10COOH+ CH3COCI CH3(CH2) 10COC1+ CH3COOH
CH3(CH2) 10COC1 + CH3 (CH2) 10COOH (CH3 (CH2) 10co)2o + HC1
Acetyl chloride reacts with aromatic hydrocarbons and olefins in suitably inert solvents, such as carbon disulfide or petroleum ether, to furnish
ketones (16). These reactions are catalyzed by anhydrous aluminum chloride and by other inorganic chlorides (17). The order of catalytic activity increases
in the order
ZnCl2 < BiCl3 < TeCl4 < TiCl4 < SnCl4 < TeCl2 < FeCl3 < SbCl5 < A1C13
Acetyl chloride is reduced by various organometallic compounds, eg, LiAlH4 (18). /^-Butyl alcohol lessens the activity of LiAlH4 to form lithium
tri-/-butoxyalumium hydride [17476-04-9]y C. 2Hg AlO?Li, which can convert acetyl chloride to acetaldehyde [75-07-0] (19). Triphenyltin hydride also
reduces acetyl chloride (20). Acetyl chloride in the presence of Pt(II) or Rh(I) complexes, can cleave tetrahydrofuran [109-99-9]\ C4HgO, to form
chlorobutyl acetate [13398-04-4] in about 72% yield (21). Although catalytic hydrogenation of acetyl chloride in the Rosenmund reaction is not very
satisfactory, it is catalytically possible to reduce acetic anhydride to ethylidene diacetate [542-10-9] in the presence of acetyl chloride over palladium
complexes (22). Rhodium trichloride, methyl iodide, and triphenylphosphine combine into a complex that is active in reducing acetyl chloride (23).
Manufacture
Acetyl chloride is manufactured commercially in Europe and the Far East. Some acetyl chloride is produced in the United States for captive applications
such as acetylation of pharmaceuticals.
Acetyl chloride was formerly manufactured by the action of thionyl chloride [7719-09-7]y C12OS, on gray acetate of lime, but this route has been
largely supplanted by the reaction of sodium acetate or acetic acid and phosphorus trichloride [7719-12-2] (24). A similar route apparently is still being used
in the Soviet Union (25). Both pathways are inherently costly.
Patents on the carbonylation of methyl chloride [74-87-3] using carbon monoxide [630-08-0] in the presence of rhodium, palladium, and ridium
complexes, iodo compounds, and phosphonium iodides or phosphine oxides have been obtained (26). In one example the reaction was conducted for 35
Kirk-Othmer Encyclopedia of Chemical Technology (4th Edition)
81
ACETYL CHLORIDE
Voll
min at 453 К and 8360 kPa (82.5 atm) to furnish a 56% conversion to acetyl chloride. Reactions of this kind are now possible because of improved
corrosion-resistant alloys (27,28). It is not known whether these methods are practiced industrially.
Other acetyl chloride preparations include the reaction of acetic acid and chlorinated ethylenes in the presence of ferric chloride [7705-08-0] (29); a
combination of benzyl chloride [100-44-7] and acetic acid at 85% yield (30); conversion of ethylidene dichloride, in 91% yield (31); and decomposition of
ethyl acetate [141-78-6] by the action of phosgene [75-44-5]., producing also ethyl chloride [75-00-3] (32). The expense of raw material and capital cost of
plant probably make this last route prohibitive. Chlorination of acetic acid to monochloroacetic acid [79-11-8] also generates acetyl chloride as a by-product
(33). Because acetyl chloride is cosdy to recover, it is usually recycled to be converted into monochloroacetic acid. A salvage method in which the mixture
of HC1 and acetyl chloride is scrubbed with H2SO4 to form acetyl sulfate has been patented (33).
Analysis and Quality Control
Acetyl chloride frequendy contains 1—2% by weight of acetic acid or hydrochloric acid. Phosphorus or sulfur-containing acids may also be present in the
commercial material. A simple test for purity involves addition of a few drops of Crystal Violet solution in CHC13. Pure acetyl chloride will retain the color
for as long as 10 min, but hydrochloric, sulfuric, or acetic acid will cause the solution to become first green, then yellow (34).
Economic Aspects and Shipping
Little is known of the market for acetyl chloride. The production and sales are believed to be small, but may have potential for very large scale-up. The total
U.S. market may amount to only 500 t annually. Acetyl chloride must be shipped in polyethylene-lined drums having capacities of only 220 L; it must be
labeled as a corrosive substance. Acetyl chloride generated captively from purchased raw materials probably has a unit value of no more than
$0.92—0.95/kg. Shipping costs and other factors set the price at about $3/kg for the commercial trade.
Health and Safety
Acetyl chloride has stifling fumes and an irritating odor. It is highly poisonous. Because of acetyl chloride's combustibility and its high reactivity toward
water and many alkalies, extreme caution must be exercised in handling. Provisions must be made for drawing the vapors away from people, and handlers
should wear impervious, protective clothing. The large containers ought to be stored in cool, dry areas that are separate from noncorrosive, flammable
chemicals.
Uses
A small amount of acetyl chloride is consumed in the start-up of acetic acid chlorination to monochloroacetic acid. After initiation, the acetyl chloride
by-product provides sufficient catalysis. Acetyl chloride is a powerful acetylating agent. It is used in the manufacture of aspirin, acetaminophen, acetanilide,
and acetophenone. Liquid crystal compositions for optical display and memory devices frequendy require acetyl chloride. Reactions which are difficult or
lethargic using acetylation agents such as acetic anhydride or acetic acid become facile using acetyl chloride (35,36). Polymers made by reactions involving
acetyl chloride can chelate with metal ions, such as copper, and may be prepared with superior electrical and magnetic properties (37).
Anthralin [1143-38-0] is acetylated using acetyl chloride in toluene and a pyridine catalyst to furnish l,8-dihydroxy-10-acetylanthrone [3022-61-5], an
intermediate in the preparation of medications used in treating skin disorders, such as warts, psoriasis, and acne (38). Sugar esters can be similarly prepared
from acetyl chloride under anhydrous conditions (39).
Although acetyl chloride is a convenient reagent for determination of hydroxyl groups, spectroscopic methods have largely replaced this application
in organic chemical analysis. Acetyl chloride does form derivatives of phenols, uncomplicated by the presence of strong acid catalysts, however, and it finds
some use in acetylating primary and secondary amines.
Acetyl chloride can be used as a substitute for acetic anhydride in many reactions. Whereas the anhydride requires a mineral acid catalyst for
acetylation, acetyl chloride does not. Acetyl chloride is utilized in a wide range of reactions wherein its comparatively high price is offset by convenience.
Should its nominal cost be lowered, acetyl chloride would be a powerful competitor for acetic anhydride in large scale manufacturing.
BIBLIOGRAPHY
"Acetyl Chloride" in ECT 1st ed., Vol. 1, pp. 98—100, by M S. W. Small, Shawinigan Chemicals Limited; in ECT 2nd ed., Vol. 1, pp. 138—142, by A. P.
Laurie, Eastman Kodak Company; in ECT 3rd ed., Vol. 1, pp. 162—165, by Theresa A. Moretti, American Hoechst Corporation.
1. J. Timmermans and Th. J. F. Mattaar, Bull. Soc. Chim. Belg. 30, 213—219 (1921).
2. J. A. Devore and H. E. O'Neal,/ Phys. Chem. 73, 2644-2648 (1969).
3. P. Walden, Z Phys. Chem. Eeipyigbb, 212-222 (1909); 70, 569-619 (1910).
4. J. A. Justus Eiebigs Ann. Chem. 203, 11 (1880).
5. R. A. McDonald, S. A. Shrader, and D. R. Stull,/. Chem. Eng. Data 4, 311—313 (1959).
6. J. H. Matthews and P. R. Fehlandt, J. Am. Chem. Soc. 53, 3212—3217 (1931).
7. C. L. Yaws, H. M. Ni, and P. Y. Chiang, Chem. Eng. New York 98, 91—98 (May 9, 1988).
8. C. L. Yaws and P. Y. Chiang, Chem Eng. New York 98, 81—88 (Sept. 26, 1988).
9. D. R. Stull, E. F. Westrum, Jr., and G. C. Sinke, The Chemical Thermodynamics of Organic Compounds, John Wiley & Sons, Inc., New York, 1969, pp.
536—537; cf. S. G. Frankiss and W. Kynaston, Spectrochim.ActaPartA 31 A, 661—678 (1975).
10. C. Gerhardt, Compt. Rend. 34, 755-902 (1852).
11. J. D. Tinker and D. E. Lamb, Chem. Eng. Prog. Symp. Ser. 61(55), 155—167 (1965).
12. C. G. Swain and С. B. Scott, / Am. Chem. Soc. 75, 246—248 (1953).
13. V. Macho and M. Rusina, Petrochemia 25(5—6), 127—136 (1985); Chem. Abstr. 107, 22761d (1987).
14. V. Gold and J. Hilton,/ Chem. Soc. Eondon 1955, 838—842 (1955).
15. J. D'Ans and W. Friederich, Z Anorg. Chem. 73, 355 (1912).
16. S. Krapiwin, Bull. Soc. Imp. Nat. Sloscou 1908, 1—38; cf. C. Friedel and J. M. Crafts, Ann. Chim. (Paris) [6], 1, 507.
17. О. C. Dernier, D. M. Wilson, F. M. Johnson, and V. H. Denner,/. Am. Chem. Soc. 63, 2881—2883 (1941); О. C. Dernier and R. A. Billmaier,/ Am.
Chem. Soc. 64, 464-465 (1942).
18. С. E. Sroog and H. M. Woodbum, Org. Syn. 32, 46—48 (1952).
19. H. C. Brown and В. C. Subba Rao,/ Am. Chem. Soc. 80, 5377—5380 (1958).
20. H. Patin and R. Dabard, Bull. Soc. Chim. Fr. 1973(9-10, part 2), 2760-2764 (1973).
21. J. W. Fitch, W. G. Payne, andD. Westmoreland,/ O/g. Chem. 48, 751—753 (1983).
22. Ger. Offen. DE 3,140,214 (May 19, 1982), J. W. Brockington, W. R. Koch, and С. M. Bartish (to Air Products & Chemicals, Inc.); Chem. Abstr. 97,
25526s (1982).
23. Eur. Pat. EP-58,442 (Aug. 25, 1982), В. V. Maatschappij (to Shell Internationale Research); Chem. Abstr. 97, 215584g (1982).
24. Hun. Pat. 30,692 (Mar. 28, 1984), J. Besan (to Nehezvegyipari Kutato Intezet Nitrokemia Ipartelepek); Chem. Abstr. 101, 72287a (1984).
25. G. Ya. Gordon, N. N. Davydova, and S. U. Kreigol'd, Tr. IREA 48, 129—133 (1986); Chem. Abstr. Ill, 16943f (1989).
Kirk-Othmer Encyclopedia of Chemical Technology (4th Edition)
82
ACETYL CHLORIDE
Voll
26. Ger. Offen. 3,016,900 (Nov. 5,1981), H. Erpenbach and co-workers (to Hoechst A.G.); Chem. Abstr 96, 19680a (1982).
27. Ger. Offen. 3,248,468 (July 12,1984), H. Erpenbach and co-workers (to Hoechst A.G.); Chem. Abstr. 101, 191160p (1984).
28. Eur. Pat. 48,335 (Mar. 31,1982), H. Erpenbach and co-workers (to Hoechst A.G.); Chem. Abstr. 97, 109563g (1982).
29. Ger. Offen. 2,059,597 (June 9,1971), J. C. Strini (to Produits Chimigues Pechiney-Saint Gobain); Chem. Abstr. 75, 109879t (1971).
30. H. C. Brown J. Am. Chem. Soc. 60, 1325-1328 (1938).
31. U.S. Pat. 2,778,852 (Jan. 22, 1957) (corresponding to Brit. Pat. 743,557), K. Adam and H. G. Trieschmann (to Badische Anilin und Soda-Fabrik
AG.); Chem. Abstr. 51, 5819h (1957).
32. Jpn. Pat* 60-65701 [85-65,701] (Apr. 15, 1985) (to Daicel Chemical Industries Ltd.); Chem. Abstr. 104, 70666m (1986).
33. Jpn. Pat* 63-50303 [88-50303] (Mar. 3, 1988), T. Myazaki and K. Murata (to Daicel Chemical Industries Ltd.); Chem. Abstr. 108, 223885s (1988).
34. J. Singh, R. C. Paul, and S. S. Sandhu,/. Chem. Soc. 1959, 845—847 (1959); R. C. Paul, S. P. Narula, P. Meyer, and S. K. Gondal,/ Sci. Ind. R/j. 21B,
552-554 (1962).
35. PCT Int. Appl. WO-88-05,803 (Aug. 11,1988), I. C. Sage, S. J. Lewis, and D. Chaplin (to Merck Patent G.m.b.H); Chem. Abstr. 109, 240837г
(1988).
36. Jpn. Pat* 63-281,830 [87-281-830] (Dec. 7, 1987), S. Tatsuki, T. Ikeda, and K. Tachibana (to Daicel Chemical Industries Ltd.); Chem. Abstr. 109,
45862t (1988).
37. Eur. Pat. 242,278 (Oct. 21,1987), S. I. Stupp and J. S. Moore (to University of Illinois); Chem. Abstr. 108, 159,114k (1988).
38. Ger. Offen. 3,523,231 (Jan. 9,1986), B. Shroot, G. Lang, and J. Maignan (to Centre International de Recherches Dermatologiques); Chem. Abstr.
105, 6323r (1986).
39. Br. Pat. 2,163,425 (Feb. 26, 1986), S. Kea and С. E. Walker (to Nebraska Department of Economic Development); Chem. Abstr. 105, 224,935h
(1986).
Frank S. Wagner, Jr.
Nandina Corporation
Kirk-Othmer Encyclopedia of Chemical Technology (4th Edition)
83
DIMETHYLACETAMIDE
Voll
DIMETHYLACETAMIDE
Dimethylacetamide [127-19-5]> DMAC, mol wt 87.12, CH3CON(CH3)2, is a colorless, high boiling polar solvent. DMAC is a good solvent for a wide range
of organic and inorganic compounds and it is miscible with water, ethers, esters, ketones, and aromatic compounds. Unsaturated aliphatics are highly
soluble, but saturated aliphatics have limited solubility in DMAC. The polar nature of DMAC enables it to act as a combined solvent and reaction catalyst,
in many instances producing high yields and pure product in short time periods.
The rate of hydrolysis of DMAC is very low, but increases somewhat in the presence of acids or bases. DMAC is a stable compound, but is mildly
hygroscopic and desiccation and/or dry nitrogen blanketing of storage vessels are sometimes used to reduce water pick-up. In the absence of water, acids,
or bases, DMAC is stable at temperatures up to its boiling point at atmospheric pressure. Its greater stability enables more economical recovery by
distillation relative to that of other similar solvents.
Physical Properties
Selected physical properties of DMAC are: boiling point, 166.1°C; melting point, — 20° C; vapor pressure at 25°C, 0.27 kPa (2 mm Hg); density at 15.6°C,
0.945 g/mL; viscosity at 25°C, 0.92 mPa-s (=cP); surface tension at 30°C, 32.43 mN/m (=dyn/cm); refractive index n25D, 1.4356; heat of vaporization at
166°C, 43.1 kJ/mol (10.3 kcal/mol); heat of combustion, 2544 kJ/mol (608 kcal/mol); thermal conductivity at 22.2°C,
0.1835 W/(m-K) (0.1579 kcal/(m-h-°C)); flash point (Tag closed cup), 63°C; ignition temperature, 490°C; flammability limits in air, 1.8 vol % LEL (lower
explosive limit) (100°C), 8.6 wt % UL (upper limit) (120°C); critical temperature, 385°C; critical pressure, 4.02 MPa (39.7 atm); dielectric constant at 25°C,
10 kHz, 37.8; dipole moment at 20°C, 1.64 x 10 29 C-m (4.6 Debye units); solubility parameter, 10.8; hydrogen bonding index, 6.6; DMAC-acetic acid
azeotrope at 170.8°C and 101.3 kPa (1 atm), 84.1 and 15.9 wt % (78.5 and 21.5 mol %), respectively (1).
Chemical Properties
The chemical reactions of DMAC are typical of those of disubstituted amides. Under suitable conditions, DMAC will react as follows:
Hydrolysis in the Presence of Strong Heids
CH3CON(CH3)2 +H2o +HC1 CH3COOH+ (CH3)2NH-HC1
Saponification in the Presence of Strong Bases
CH3CON(CH3)2 + NaOH CH3COONa+ (CH3)2NH
Alcoholysis in the Presence of Hydrogen Ions
CH3CON(CH3)2 + ROH CH3COOR+ (CH3)2NH
Manufacturing Processes
Dimethylacetamide can be produced by the reaction of acetic acid [64-19-7] and dimethylamine [124-40-3]'.
CH3COOH+ (CH3)2NH^ CH3CON(CH3)2 + H2O
The product of this reaction can be removed as an azeotrope (84.1% amide, 15.9% acetic acid) which boils at 170.8—170.9°C. Acid present in the
azeotrope can be removed by the addition of solid caustic soda [1310-73-2] followed by distillation (2). The reaction can also take place in a solution having
a DMAC-acetic acid ratio higher than the azeotropic composition, so that an azeotrope does not form. For this purpose, dimethylamine is added in excess
of the stoichiometric proportion (3). If a substantial excess of dimethylamine reacts with acetic acid under conditions of elevated temperature and pressure,
a reduced amount of azeotrope is formed. Optimum temperatures are between 250—325°C, and pressures in excess of 6200 kPa (900 psi) are required (4).
DMAC can also be made by the reaction of acetic anhydride [108-24-7] and dimethylamine:
(CH3CO)2O + 2 (CH3)2NH 2 CH3CON(CH3)2 +H2o
Dimethylamine is added somewhat in excess of the stoichiometric proportion in this synthesis. Another method employs the reaction of methyl acetate
[79-20-9] and dimethylamine:
CH3CO2CH3 + (CH3)2NH ----------XOCHj CH3CON(CH3)2 + CH3OH
Dimethylamine also reacts with the azeotrope of methyl acetate and methanol to give DMAC in 45% yield (5).
Shipping and Storage
Dimethylacetamide is available in drums with a capacity of 0.208 m3 (55 gal), 186 kg net, and in tank cars or trucks. Although the DOT classifies DMAC as
a combustible liquid, no DOT label is required.
Mild steel is a suitable material of construction for storage and handling of DMAC at ambient temperatures. Aluminum or stainless steel is
recommended for cases involving very stringent color or iron contamination requirements. Mild steel is not recommended for high temperature service or
handling aqueous solutions of less than 50 mol % (82.86 wt %) DMAC.
DMAC is a good solvent for many resins; therefore, flange gaskets and pump and valve packing should be limited to Teflon fluorocarbon resins.
Analytical Methods
Determination of Water in DMAC. DMAC is hygroscopic and precautions must be taken to minimize exposure to the atmosphere. Trace
amounts of water can be determined by the Kad-Fischer method.
Determination of DMAC in Air. DMAC can be measured in air by passing a known amount of sample through water in a gas-scrubbing
vessel and then analyzing the solution either chemically or by gas chromatography.
Health and Safety Factors
DMAC is capable of producing systemic injury when repeatedly inhaled or absorbed through the skin. Symptoms of overexposure are nausea, headache,
Kirk-Othmer Encyclopedia of Chemical Technology (4th Edition)
84
DIMETHYLACETAMIDE
Voll
and weakness. The principal effect is cumulative damage to the Ever and kidney. DMAC has a low order of acute toxicity when swallowed or upon brief
contact of the liquid vapor with the eyes or skin. Although DMAC is not a skin sensitizer, it is irritating to the skin and eyes. The LD5Q (oral, rats) for
DMAC is greater than 2250 mg/kg (6).
In laboratory tests, application of DMAC to the skin of pregnant rats has caused fetal deaths when the dosages were close to the lethal dose level
for the mother. Embryonal malformations have been observed at dose levels 20% of the lethal dose and higher. However, when male and female rats were
exposed to mean DMAC concentrations of 31,101, and 291 ppm for 6 h per day over several weeks, no reproductive effects were observed (6).
It is important to note that DMAC can rapidly penetrate the skin, leading to overexposure. Contact of DMAC liquid or mixtures containing DMAC
with the eyes, skin, and clothing should be avoided. If contact is unavoidable, appropriate personal protective equipment, including chemical splash
goggles, butyl rubber gloves, or an impervious butyl chemical suit having breathing air supply should be worn.
The U.S. Department of Labor (OSHA) has ruled that an employee's exposure to dimethylacetamide in any 8-h work shift of a 40-h work week
shall not exceed a time-weighted average of 10 ppm DMAC vapor in air by volume or 35 mg/m3 in air by weight (7). If there is significant potential for
skin contact with DMAC, biological monitoring should be carried out to measure the level of DMAC metabolites in urine specimens collected at the end
of the shift. One industrial limit is 40 ppm DMAC metabolites, expressed as Y-methylacetamide [79-16-3], for individuals, and 20 ppm metabolite average
for workers on the job (8).
Uses
The uses of dimethylacetamide are very similar to those for dimethylformamide [68-12-2] (see Formic acid). DMAC is employed most often where higher
temperatures are needed for solution of resins or activation of chemical reactions.
Resin and Polymer Solvent. Dimethylacetamide is an excellent solvent for synthetic and natural resins. It readily dissolves vinyl polymers,
acrylates, cellulose derivatives, styrene polymers, and linear polyesters. Because of its high polarity, DMAC has been found particularly useful as a solvent
for polyacrylonitrile, its copolymers, and interpolymers. Copolymers containing at least 85% acrylonitrile dissolve in DMAC to form solutions suitable for
the production of films and yams (9). DMAC is reportedly an excellent solvent for the copolymers of acrylonitrile and vinyl formate (10), vinylpyridine (11),
or allyl glycidyl ether (12).
Polyimides for use in molded products and high temperature films can be produced by the reaction of pyromellitic dianhydride [89-32-7] and
4,4,-diaminodiphenyl ether [13174-32-8] in DMAC to form a polyamide that can be converted into a polyimide (13). DMAC can also be used as a spinning
solvent for polyimides. Additionally, polymers containing over 50% vinylidene chloride are soluble up to 20% at elevated temperatures in DMAC. Such
solutions are useful in preparing fibers (14).
DMAC and nonpolar solvents form synergistic mixtures which dissolve high molecular weight vinyl chloride homopolymers. For example, a
mixture of DMAC with an equal volume of carbon disulfide [75-15-0], a nonsolvent, dissolves 14 wt % of Geon 101 vinyl chloride homopolymer at room
temperature, whereas the solubility of Geon 101 in DMAC alone is about 5 wt % (15).
Crystallization and Purification Solvent. Dimethylacetamide is useful in the purification by crystallization of aromatic dicarboxylic acids
such as terephthalic acid [100-21-0] and/-carboxyphenylacetic acid [501-89-3]. These acids are not soluble in the more common solvents. DMAC and
dibasic acids form crystalline complexes containing two moles of the solvent for each mole of acid (16). Microcrystalline hydrocortisone acetate [50-03-3]
having low settling rate is prepared by crystallization from an aqueous DMAC solution (17).
Electrolytic Solvent. The use of DMAC as a nonaqueous electrolytic solvent is promising because salts are modesdy soluble in DMAC and
appear to be completely dissociated in dilute solutions (18).
Complexes. In common with other dialkylamides, highly polar DMAC forms numerous crystalline solvates and complexes. The HCN—DMAC
complex has been cited as an advantage in using DMAC as a reaction medium for hydrocyanations. The complexes have vapor pressures lower than
predicted and permit lower reaction pressures (19).
Complexes of DMAC and many inorganic halides have been reported (20). These complexes are of interest because they catalyze a number of
organic reactions. Complexes of DMAC and such heavy metal salts as NiBr2 exert a greater catalytic activity than the simple salts (21). The crystalline
complex of SO3 and dimethylacetamide has been suggested for moderating the reaction conditions in sulfation of leuco vat dyestuffs (22).
Chemical Reaction Medium and Catalyst. DMAC, as well as other alkyl carboxylic amides, has the ability to serve as a reaction catalyst,
often increasing yields, improving product quality and reducing reaction time. DMAC is a highly polar solvent of high dielectric properties and is capable of
converting many organic and inorganic molecules into reactive forms by solvation. Types of reactions improved by the use of DMAC are elimination
reactions (23), halogenation (24), cyclization (25), alkylations (26), nitrile formation (27), formation of organic isocyanates (28), interesterification (29),
phthaloylation (30), and formation of sulfonyl chlorides (31).
BIBLIOGRAPHY
"Acetic Acid Derivatives (Dimethylacetamide)" in ECT 2nd ed., Vol. 1, pp. 145—148, by D. C. Hubinger, E.I. du Pont de Nemours and Co., Inc.; in ECT
3rd ed., Vol, pp. 167—171, byj. C. Siegle, E.I. du Pont de Nemours and Co., Inc.
1. J. R. Ruhoff and E. E. Reid,/. Ада. Chem. Soc. 59, 401 (1937).
2. U.S. Pat. 2,667,511 (Jan. 26, 1954), C. Downing (to Chemstrand Corp.).
3. U.S. Pat. 3,006,956 (Oct. 31, 1961), A. W. Campbell (to Commercial Solvents Corp.).
4. S. Collis, The Development and Evaluation of Paint Remover Used bp the U.S. .Air Force, Air Force Technical Report 5714, Suppl. 1, Jan. 1955.
5. Ger. Offen. 2,437,702 (Feb. 13, 1975), W. B. Pearson (to Imperial Chemical Industries Ltd.).
6. G. L. Kennedy, CRC Crit. Rev. Toxicol. 17, 129 (1986).
7. Code of Federal Regulations, Title 29, Section 1910.1000 (Sept. 1989).
8. Dimethylacetamide, Material Safety Data Sheet, E.I. du Pont de Nemours and Co., Inc., Wilmington, Del., 1988.
9. U.S. Pat. 2,649,427 (Aug. 18,1953), C. S. Marvel (to E.I. du Pont de Nemours and Co., Inc.); U.S. Pat. 2,531,407 (Nov. 28,1950), G. F. D'Alelio
(to Industrial Rayon Corp.).
10. U.S. Pat. 2,558,793 (July 3, 1951), E. Stanin and J. B. Dickey (to Eastman Kodak Co.).
11. U.S. Pat. 2,676,952 (Apr. 27,1954), E. Ham (to Chemstrand Corp.).
12. U.S. Pat. 2,650,151 (Aug. 25, 1953), E. Ham (to Chemstrand Corp.).
13. Belg. Pat. 627,628 (July 25, 1963), W. M. Edwards and A. L. Endrey (to E.I. du Pont de Nermous and Co., Inc.).
14. U.S. Pat. 2,531,406 (Nov. 28, 1950), G. F. D'Alelio (to Industrial Rayon Corp.).
15. R. L. Adelman and I. M. Klein, / Polym. Sci. 31, 77 (1958).
16. U.S. Pat. 2,811,548 (Oct. 29, 1957), G. E. Ham and A. B. Beindorff (to Chemstrand Corp.).
17. U.S. Pat. 2,805,232 (Sept. 3, 1957), W. H. Baade and T. J. Macek (to Merck & Co., Inc.).
18. G. R. Lester, T. A. Grover, and P. G. Sears, / Phys. Chem. 60, 1076 (1956).
19. U.S. Pat. 2,698,337 (Dec. 28, 1954), R. L. Heider andH. M. Walker (to Monsanto Chemical Co.).
20. W. Gerrard, M. F. Lappert, and J. W. Wallis,/ Chem. Soc. 1960, 2141 (1960); C. L. Rollinson and R. C. White, Inotg. Chem. 1, 281 (1962); W. E. Bull,
S. K. Madan, and J. E. Willis, Inotg. Chem. 2, 203 (1963).
21. U.S. Pat. 2,854,458 (Sept. 30, 1958), W. Reppe, H. Friederick, and H. Liantenschlager (to Badische Anilin- and Soda-Fabrik A.G.).
22. U.S. Pat. 2,506,580 (May 9, 1950), S. Coffey, G. W. Driver, D. A. Whyte, and F. Irving (to Imperial Chemical Industries, Ltd.).
23. U.S. Pat. 2,833,790 (May 6, 1958), J. M. Chemerda, E. M. Chamberlin, and E. W. Tristam (to Merck & Co., Inc.).
Kirk-Othmer Encyclopedia of Chemical Technology (4th Edition)
85
DIMETHYLACETAMIDE
Voll
24. U.S. Pat. 2,823,232 (Feb. 11,1958), H. F. Wilson (to Rohm and Haas Co.).
25. U.S. Pat. 2,872,447 (Feb. 3, 1959), H. F. Oehlschlaeger (to Emery Industries, Inc.).
26. U.S. Pat. 2,846,491 (Aug. 5, 1958), T. F. Rudedge (to Air Reduction Co., Inc.).
27. U.S. Pat. 2,715,137 (Aug. 9, 1955), H. B. Copelin (to E.I. du Pont de Nemours and Co., Inc.).
28. U.S. Pat. 2,866,801 (Dec. 30,1958), С. M. Himel and L. M. Richards (to Ethyl Corp.).
29. U.S. Pat. 2,831,854 (Apr. 22, 1958), N. B. Tucker andj. B. Martin (to Procter & Gamble Co.).
30. U.S. Pat. 2,783,245 (Feb. 26, 1957), J. F. Weidenheimer, L. Ritter, and F. J. Richter (to American Cyanamid Co.).
31. U.S. Pat. 2,888,486 (May 26, 1959), W. A. Gregory (to E.I. du Pont de Nemours and Co., Inc.).
J. C. Watts
P. A. Larson
E.I. du Pont de Nemours and Co., Inc.
Kirk-Othmer Encyclopedia of Chemical Technology (4th Edition)
86
HALOGENATED DERIVATIVES
Voll
HALOGENATED DERIVATIVES
The most important of the halogenated derivatives of acetic acid is chloroacetic acid. Fluorine, chlorine, bromine, and iodine derivatives are all known, as
are mixed halogenated acids. For a discussion of the fluorine derivatives see Fluorine compounds, organic.
Chloroacetic acid
Physical Properties. Pure chloroacetic acid [79-11-8] (C1CH2COOH), mol wt 94.50, C2H3C1O2, is a colorless, white deliquescent solid. It has
been isolated in three crystal modifications: Ct, mp 63°C, P, mp 56.2°C, and y, mp 52.5°C. Commercial chloroacetic acid consists of the CC form. Physical
properties are given in Table 1.
Table 1. Physical Properties of Chloroacetic Acid
Property Value
boiling point, °C density, at 25°C, g/mL dielectric constant at 60°C free energy of formation, at 100°C, AG, kJ/mol heat capacity, J/(mol-k)b at 100°C heat of formation, at 100°C, AH, kJ /mol heat of sublimation, at 25°C, AH, kJ/mol vapor pressure, kPa , at 25°C at 100°C viscosity, at 100°C, mPa-s (=cP) refractive index at 55°C surface tension, at 100°C, mN/m (=dyn/cm) dissociation constant К solubility (g/100 g solvent) water acetone methylene chloride benzene carbon tetrachloride 189.1 1.4043 12.3 -368.7 181.0 -490.1 88.1 8.68 x 10~3 3.24 1.29 1.435 35.17 1.4 x 10~3 614 257 51 26 2.75
To convert kj/mol tokcal/mol, divide by 4.184.
b To convert J/(mol-K) to cal/(mol-K), divide by 4.184.
To convert kPa to mm Hg, multiply by 7.5.
Chloroacetic acid forms azeotropes with a number of organic compounds. It can be recrystallized from chlorinated hydrocarbons such as
trichloroethylene, perchloroethylene, and carbon tetrachloride. The freezing point of aqueous chloroacetic acid is shown in Figure 1.
Kirk-Othmer Encyclopedia of Chemical Technology (4th Edition)
87
HALOGENATED DERIVATIVES
Voll
Fig. 1. The freezing point of monochloroacetic acid (MCAA)—water mixtures. For wt % acid >75%: fp(°C) = 2.17 x (wt % MCAA) — 156.5. Data courtesy
of the Dow Chemical Company.
Chemical Properties and Industrial Uses. Chloroacetic acid has wide applications as an industrial chemical intermediate. Both the
carboxylic acid group and the CC-chlorine are very reactive. It readily forms esters and amides, and can undergo a variety of CC-chlorine substitutions.
Electron withdrawing effects of the CC-chlorine give chloroacetic acid a higher dissociation constant than that of acetic acid.
Major industrial uses for chloroacetic acid are in the manufacture of cellulose ethers (mainly carboxymethylcellulose, CMC), herbicides, and
thioglycolic acid. Other industrial uses include manufacture of glycine, amphoteric surfactants, and cyanoacetic acid.
The reaction of chloroacetic acid with alkaline cellulose yields carboxymethylcellulose which is used as a thickener and viscosity control agent (1) (see
Cellulose ethers). Sodium chloroacetate reacts readily with phenols and cresols. 2,4,-Dichlorophenol and 4-chloro-2-cresol react with chloroacetic acid to
give the herbicides 2,4-D and MCPA (2-methyl-4-chlorophenoxy acetic acid), respectively (2,3) (see Herbicides). Thioglycolic acid [68-11-1C2H4O2S, is
prepared commercially by treating chloroacetic acid with sodium hydrosulfide. Sodium and ammonium salts of thioglycolic acid (qv) have been used for
cold-waving human hair; the calcium salt is used as a depilating agent (see Cosmetics). Thioglycolic acid derivatives are also used as stabilizers in poly(vinyl
chloride) products.
Chloroacetic acid can be esterified and aminated to provide useful chemical intermediates. Amphoteric agents suitable as shampoos have been
synthesized by reaction of sodium chloroacetate with fatty amines (4,5). Reactions with amines (6) such as ammonia, methylamine, and trimethylamine
yield glycine [56-40-6] y sarcosine [107-97-1and carboxymethyltrimethylammonium chloride, respectively. Reaction with aniline forms A-phenylglycine
[103-01 -5]\ a starting point for the synthesis of indigo (7).
Reaction of chloroacetic acid with cyanide ion yields cyanoacetic acid [372-09-8]> C3H3NO2, (8) which is used in the formation of coumarin, malonic
acid and esters, and barbiturates. Reaction of chloroacetic acid with hydroxide results in the formation of glycolic acid [79-14-1].
Manufacture. Most chloroacetic acid is produced by the chlorination of acetic acid using a suitable catalyst such as acetic anhydride (9—12). The
remainder is produced by the hydrolysis of trichloroethylene with sulfuric acid (13,14) or by reaction of chloroacetyl chloride with water.
A major disadvantage of the chlorination process is residual acetic acid and overchlorination to dichloroacetic acid. Although various inhibitors have
been tried to reduce dichloroacetic acid formation, chloroacetic acid is usually purified by crystallization (15—17). Dichloroacetic acid can be selectively
dechlorinated to chloroacetic acid with hydrogen and a catalyst such as palladium (18—20). Extractive distillation (21) and reaction with ketene (22) have
also been suggested for removing dichloroacetic acid. Whereas the hydrolysis of trichloroethylene with sulfuric acid yields high purity chloroacetic acid, free
of dichloracetic acid, it has the disadvantage of utilizing a relatively more expensive starting material and producing a sulfur containing waste stream.
Corrosive conditions of the chlorination process necessitate the use of glass-lined or lead-lined steel vessels in the manufacture of chloroacetic acid.
Process piping and valves also are either glass-lined, or steel lined with a suitable polymer, eg, polytetrafluoroethylene (PTFE). Pumps, heat exchangers, and
other process equipment can be fabricated from ceramic, graphite composite, tantalum, titanium, or certain high performance stainless steels. Chloroacetic
acid can be stored as a molten liquid in glass-lined tanks for a short period of time, but develops color on aging. For long-term storage, the solid, flaked
form of the acid is held in a polyethylene-lined fiber drum. The drum is constructed so that no chloroacetic acid vapors contact the fiber or metallic
portions. Stainless steels are acceptable for the shipment of 80% solutions of chloroacetic acid provided the temperature is maintained below 50°C.
However, long-term or continuous storage of the 80% solution results in significant pickup of iron from stainless steel.
Gas chromatography or liquid chromatography (23) are commonly used to measure impurities such as acetic, dichloroacetic, and trichloroacetic
acids. High purity 99+% chloroacetic acid will contain less than 0.5% of either acetic acid or dichloroacetic acid. Other impurities that may be present in
small amounts are water and hydrochloric acid.
Economic Aspects. Figures on U.S. production, imports, and projected demand of chloroacetic acid are listed in Table 2 (24). The majority of
imported chloroacetic acid is produced in Germany. Western European capacity for chloroacetic acid is in excess of 225,000 metric tons per year. In 1990
the price was $1.25 to $1.36/kg (24,25).
Table 2. Production and Demand for Chloroacetic Acid
Year U.S. production, 1031 Imports, 103 t
1980 33 17.3
1981 35 16.7
1982 38 13.5
1983 43 8.6
1984 48 3.7
1985 36 9.6
1986 22 14.2
1987 15-19 15.9
Demand
1988 38.6
1989 39.5
1993b 43.5
aRef. 25.
Projected.
Toxicity and Handling. Chloroacetic acid is extremely corrosive and will cause serious chemical bums. It also is readily absorbed through the
skin in toxic amounts. Contamination of 5 to 10% of the skin area is usually fatal (26). The symptoms are often delayed for several hours. Single exposure
to accidental spillage on the skin has caused human fatalities. The toxic mechanism appears to be blocking of metabolic cycles. Chloroacetic acid is 30—40
times more toxic than acetic, ichloroacetic, or trichloroacetic acid (27). When handling chloroacetic acid and its derivatives, rubber gloves, boots, and
protective clothing must be worn. In case of skin exposure, the area should immediately be washed with large amounts of water and medical help should
be obtained at once. Oral LD5Q for chloroacetic acid is 76 mg/kg in rats (28).
Sodium Chloroacetate Sodium chloroacetate [3926-62-3]mol wt 116.5, C2H2ClO2Na, is produced by reaction of chloroacetic acid with
sodium hydroxide or sodium carbonate. In many applications chloroacetic acid or the sodium salt can be used interchangeably. As an industrial
intermediate, sodium chloroacetate may be purchased or formed in situ from free acid. The sodium salt is quite stable in dry solid form, but is hydrolyzed to
glycolic acid in aqueous solutions. The hydrolysis rate is a function of pH and temperature (29).
Dichloroacetic Acid
Dichloroacetic acid [79-43-6] (C12CHCOOH), mol wt 128.94, C2H2C12O2, is a reactive intermediate in organic synthesis. Physical properties are mp 13.9°C,
bp 194°C, density 1.5634 g/mL, and refractive index 1.4658, both at 20°C. The liquid is totally miscible in water, ethyl alcohol, and ether. Dichloroacetic
acid (Ka =5.14 X 10 2 ) is a stronger acid than chloroacetic acid. Most chemical reactions are similar to those of chloroacetic acid, although both chlorine
Kirk-Othmer Encyclopedia of Chemical Technology (4th Edition)
88
HALOGENATED DERIVATIVES
Voll
atoms are susceptible to reaction. An example is the reaction with phenol to form diphenoxyacetic acid (30). Dichloroacetic acid is much more stable to
hydrolysis than chloroacetic acid.
Dichloroacetic acid is produced in the laboratory by the reaction of chloral hydrate [302-17-0] with sodium cyanide (31). It has been manufactured
by the chlorination of acetic and chloroacetic acids (32), reduction of trichloroacetic acid (33), hydrolysis of pentachloroethane [76-01-7] (34), and hydrolysis
of dichloroacetyl chloride. Due to similar boiling points, the separation of dichloroacetic acid from chloroacetic acid is not practical by conventional
distillation. However, this separation has been accomplished by the addition of azeotropeforming hydrocarbons such as bromobenzene (35) or by
distillation of the methyl or ethyl ester.
Dichloroacetic acid is used in the synthesis of chloramphenicol [56-75-7] and allantoin [97-59-6]. Dichloroacetic acid has virucidal and fungicidal
activity. It was found to be active against several staphylococci (36). The oral toxicity is low: the LD5Q in rats is 4.48 g/kg. It can, however, cause caustic
bums of the skin and eyes and the vapors are very irritating and injurious (28).
Trichloroacetic Acid
Trichloroacetic acid [76-03-9] (C13CCOOH), mol wt 163.39, C2HC13O2, forms white deliquescent crystals and has a characteristic odor. Physical properties
are given in Table 3.
Table 3. Physical Properties of Trichloroacetic Acid
Property Value
melting point, °C 59
boiling point, °C 197.5
density, at 64°C, g/mL 1.6218
refractive index at 61°C 1.4603
heat of combustion, kj/g 3.05
solubility, at 25°C, g/100 g solvent
water 1306
methanol 2143
ethyl ether 617
acetone 850
benzene 201
o- xylene 110
To convert kj/g tokcal/g, divide by 4.184.
Trichloroacetic acid (Ka = 0.2159) is as strong an acid as hydrochloric acid. Esters and amides are readily formed. Trichloroacetic acid undergoes
decarboxylation when heated with caustic or amines to yield chloroform. The decomposition of trichloroacetic acid in acetone with a variety of aliphatic
and aromatic amines has been studied (37). As with dichloroacetic acid, trichloroacetic acid can be converted to chloroacetic acid by the action of hydrogen
and palladium on carbon (17).
Trichloroacetic acid is manufactured in the United States by the exhaustive chlorination of acetic acid (38). The patent literature suggests two
alternative methods of synthesis: hydrogen peroxide oxidation of chloral (39) and hydrolytic oxidation of tetrachloroethene (40).
Sodium trichloroacetate [650-51-1C2Cl3O2Na, is used as a herbicide for various grasses and cattails (2). The free acid has been used as an
astringent, antiseptic, and polymerization catalyst. The esters have antimicrobial activity. The oral toxicity of sodium trichloroacetate is quite low (LD5Q rats,
5.0 g/kg). Although very corrosive to skin, trichloroacetic acid does not have the skin absorption toxicity found with chloroacetic acid (28).
Chloroacetyl Chloride
Chloroacetyl chloride [79-04-9] (C1CH2COC1) is the corresponding acid chloride of chloroacetic acid (see Acetyl chloride). Physical properties include mol
wt 112.94, C2H2C12O, mp — 21.8° C, bp 106°C, vapor pressure 3.3 kPa (25 mm Hg) at 25°C, 12 kPa (90 mm Hg) at 50°C, and density 1.4202 g/mL and
refractive index 1.4530, both at 20°C. Chloroacetyl chloride has a sharp, pungent, irritating odor. It is miscible with acetone and benzene and is initially
insoluble in water. A slow reaction at the water—chloroactyl chloride interface, however, produces chloroacetic acid. When sufficient acid is formed to
solubilize the two phases, a violent reaction forming chloroacetic acid and HC1 occurs.
Since chloroacetyl chloride can react with water in the skin or eyes to form chloroacetic acid, its toxicity parallels that of the parent acid. Chloroacetyl
chloride can be absorbed through the skin in lethal amounts. The oral LD5Q for rats is between 120 and 250 mg/kg. Inhalation of 4 ppm causes respiratory
distress. ATLV of 0.05 ppm is recommended (28,41).
Chloroacetyl chloride is manufactured by reaction of chloroacetic acid with chlorinating agents such as phosphorus oxychloride, phosphorus
trichloride, sulfuryl chloride, or phosgene (42—44). Various catalysts have been used to promote the reaction. Chloroacetyl chloride is also produced by
chlorination of acetyl chloride (45—47), the oxidation of 1,1-dichloroethene (48,49), and the addition of chlorine to ketene (50,51). Dichloroacetyl and
trichloroacetyl chloride are produced by oxidation of trichloroethylene or tetrachloroethylene, respectively.
Much of the chloroacetyl chloride produced is used captively as a reactive intermediate. It is useful in many acylation reactions and in the production
of adrenalin [51 -43-4]\ diazepam [439-15-5]y chloroacetophenone [532-27-4]., chloroacetate esters, and chloroacetic anhydride [541-88-8]. A major use is in
the production of chloroacetamide herbicides (3) such as alachlor [15972-60-8].
Chloroacetate Esters
Two chloroacetate esters of industrial importance are methyl chloroacetate [96-34-4]> C3H5C1O2, and ethyl chloroacetate [105-39-5]C4H7C1O2. Their
properties are given in Table 4.
Table 4. Physical Properties of Chloroacetate Esters
Property Methyl ester Ethyl ester
molecular weight 108.52 122.55
melting point, °C -32.1 -26
boiling point, °C 129.8 143.3
density, at 20°C, g/mL 1.2337 1.159
flash point, °C 57 66
vapor pressure, kPaa
Kirk-Othmer Encyclopedia of Chemical Technology (4th Edition)
89
HALOGENATED DERIVATIVES
Voll
at 25°C
at 50°C
structural formula
To convert kPa to mm Hg, multiply by 7.5.
0.96
4.3
cich2cooch3
0.61
2.6
cich2cooc2h5
Both esters have a sweet pungent odor and present a vapor inhalation hazard. They are rapidly absorbed through the skin and hydrolyzed to
chloroacetic acid. The oral LD5Q for ethyl chloroacetate is between 50 and 100 mg/kg (52).
Chloroacetate esters are usually made by removing water from a mixture of chloroacetic acid and the corresponding alcohol. Reaction of alcohol
with chloroacetyl chloride is an anhydrous process which liberates HC1. Chloroacetic acid will react with olefins in the presence of a catalyst to yield
chloroacetate esters. Dichloroacetic and trichloroacetic acid esters are also known. These esters are useful in synthesis. They are more reactive than the
parent acids. Ethyl chloroacetate can be converted to sodium fluoroacetate by reaction with potassium fluoride (see Fluorine compounds, organic). Both
methyl and ethyl chloroacetate are used as agricultural and pharmaceutical intermediates, specialty solvents, flavors, and fragrances. Methyl chloroacetate
and Р-ionone undergo a Darzens reaction to form an intermediate in the synthesis of Vitamin A. Reaction of methyl chloroacetate with ammonia produces
chloroacetamide [79-07-2], C2H4C1NO (53).
Bromoacetic Acid
Bromoacetic acid [79-08-3] (BrCH2COOH), mol wt 138.96, C2H3BrO2, occurs as hexagonal or rhomboidal hygroscopic crystals, mp 49°C, bp 208°C,
1.9335, Y°D 1.4804. It is soluble in water, methanol, and ethyl ether. Bromoacetic acid undergoes many of the same reactions as chloroacetic acid under
milder conditions, but is not often used because of its greater cost. Bromoacetic acid must be protected from air and moisture, since it is readily hydrolyzed
to glycolic acid. The simple derivatives such as the acid chloride, amides, and esters are well known. Esters of bromoacetic acid are the reagents of choice in
the Reformatsky reaction which is used to prepare JB-hydroxy acids or CC,P-unsaturated acids. Similar reactions with chloroacetate esters proceed slowly or
not at all (54).
Bromoacetic acid can be prepared by the bromination of acetic acid in the presence of acetic anhydride and a trace of pyridine (55), by the
Hell-Volhard-Zelinsky bromination catalyzed by phosphorus, and by direct bromination of acetic acid at high temperatures or with hydrogen chloride as
catalyst. Other methods of preparation include treatment of chloroacetic acid with hydrobromic acid at elevated temperatures (56), oxidation of ethylene
bromide with fuming nitric acid, hydrolysis of dibromovinyl ether, and air oxidation of bromo acetylene in ethanol.
Dibromoacetic Acid
Dibromoacetic acid [631-64-1] (Br2CHCOOH), mol wt 217.8, C^Bi^, mp 48°C, bp 232—234°C (decomposition), is soluble in water and ethyl alcohol.
It is prepared by adding bromine to boiling acetic acid, or by oxidizing tribromoethene [598-16-3] with peracetic acid.
Tribromoacetic Acid
Tribromoacetic acid [75-96-7] (Br3CCOOH), mol wt 296.74, C2HBr3O2, mp 135°C bp 245°C (decomposition), is soluble in water, ethyl alcohol, and
diethyl ether. This acid is relatively unstable to hydrolytic conditions and can be decomposed to bromoform in boiling water. Tribromoacetic acid can be
prepared by the oxidation of bromal [115-17-3] or perbromoethene [79-28-7] with fuming nitric acid and by treating an aqueous solution of malonic acid
with bromine.
lodoacetic Acid
lodoacetic acid [64-69-7] (ICH2COOH), mol wt 185.95, C2H3IO2, is commercially available. The colorless, white crystals (mp 83°C) are unstable upon
heating. It has a Ka of 7.1 x 10⁻⁴ . lodoacetic acid is soluble in hot water and alcohol, and slighdy soluble in ethyl ether. lodoacetic acid can be reduced with
hydroiodic acid at 85°C to give acetic acid and iodine (57). lodoacetic acid cannot be prepared by the direct iodination of acetic acid (58), but has been
prepared by iodination of acetic anhydride in the presence of sulfuric or nitric acid (59). lodoacetic acid can also be prepared by reaction of chloroacetic or
bromoacetic acid with sodium or potassium iodide (60).
Diiodoacetic Acid
Diiodoacetic acid [598-89-0] (I2CHCOOH), mol wt 311.85, C2H2I2O2, mp 110°C, occurs as white needles and is soluble in water, ethyl alcohol, and
benzene. It has been prepared by heating diiodomaleic acid with water (61) and by treating malonic acid with iodic acid in a boiling water solution (62).
Triiodoacetic Acid
Triiodoacetic acid [594-68-3] (I3CCOOH), mol wt 437.74, C2HO2I3, mp 150°C (decomposition), is soluble in water, ethyl alcohol, and ethyl ether. It has
been prepared by heating iodic acid and malonic acid in boiling water (63). Solutions of triiodoacetic acid are unstable as evidenced by the formation of
iodine. Triiodoacetic acid decomposes when heated above room temperature to give iodine, iodoform, and carbon dioxide. The sodium and lead salts have
been prepared.
BIBLIOGRAPHY
"Acetic Acid Derivatives" under "Acetic Acid," in ECT 1st ed., Vol. 1, pp. 74—78, by L. F. Berhenke, F. C. Amstutz, and U. A. Stenger, The Dow Chemical
Company; "Ethanoic Acid (Halogenated)" in ECT, 2nd ed., Vol. 8, pp. 415—422, by A. P. Lurie, Eastman Kodak Company; "Acetic Acid Derivatives
(Halogenated)" in ECT 3rd ed., Vol. 1, pp. 171—178, by E. R. Freiter, The Dow Chemical Company.
1. E. Ott, Cellulose and Cellulose Derivatives, 2nd ed., Wiley-Interscience, New York, 1955.
2. Herbicide Handbook, 5th ed., Weed Science Society of America, Champaign, HL, 1983, p. 128.
3. M. Sittig, ed., Pesticide Manufacturing and Toxic Materials Control Encyclopedia, Noyes Data Corp., Park Ridge, N.J., 1980.
4. U.S. Pat. 2,961,451 (Nov. 22, 1960), A. Keough (to Johnson & Johnson Co., Inc.).
5. Jpn. Pat* 70/23,925 (Aug. 11,1970), H. Marushige (to Lion Fat & Oil Co.); Chem. Abstr. 74, 12622v, 1971.
6. N. D. Cheronis and К. H. Spitzmueller, J. Org. Chem. 6, 349 (1941).
7. K. Venkataraman, The Chemistry of Synthetic Dyes, Vol. 2, Academic Press, Inc., New York, 1952, p. 1013.
8. L. Baker, Otg. Synth. Coll. Vol. 1, 181 (1941).
9. G. Koenig, E. Lohmar, and N. Rupprich, "Chloroacetic Acids," in Vllman's Encyclopedia of Industrial Chemistry, Vol. A6, VCH Publishers, New York,
1986.
10. U.S. Pat. 2,503,334 (Apr. 11, 1950), A. Hammond (to Celanese Corporation); Chem. Abstr. 44, 5901g (1950).
Kirk-Othmer Encyclopedia of Chemical Technology (4th Edition)
90
HALOGENATED DERIVATIVES
Voll
11.
12.
13.
14.
15.
16.
17.
18.
19.
20.
21.
22.
23.
24.
25.
26.
27.
28.
29.
30.
31.
32.
33.
34.
35.
36.
37.
38.
39.
40.
41.
42.
43.
44.
45.
46.
47.
48.
49.
50.
51.
52.
53.
54.
55.
56.
57.
58.
59.
60.
61.
62.
63.
U.S. Pat. 2,539,238 (Jan. 23, 1951), C. Eaker (to Monsanto Corporation); Chem. Abstr. 45, 4739i (1951).
G. Sioli, Hydrocarbon Process. 58 (part 2), 111—113 (1979).
U.S. Pat. 1,304,108 (May 20,1919), J. Simon; Chem. Abstr. 13, 2039 (1919).
Eur. Pat. Appl. 4,496 (Oct. 3,1979), Y. Correia (to КЬфпе-РоЫепс); Chem. Abstr. 92, 58239a (1980).
U.S. Pat. 3,365,493 (Jan. 23,1968); D. D. De Line (to The Dow Chemical Company); Chem. Abstr. 66, 46104c (1967).
Brit. Pat. 949,393 (Feb. 12, 1964) (to Uddeholms Aktiebolag); Chem. Abstr. 60, 1573911 (1964).
Eur. Pat. Appl. EP 32,816 (July 29,1981), R. Sugamiya (to Tsukishima Kikai); Chem. Abstr. 96, 34575p (1982).
Neth. Pat. 109,768 (Oct. 15,1964), G. vanMessel (to N. V. Koninklijke Nededandse Zoutindustrie); Chem. Abstr. 62, 7643e (1965).
Ger. Offen. 2,240,466 (Feb. 21, 1974), A. Ohorodnik (to Knapsack Company); Chem. Abstr. 80, 132809 (1974).
Can. Pat. 757,667 (Apr. 25,1967), A. B. Foster (to Shawinigan Chemicals); Chem. Abstr. 67, 53692s (1967).
U.S. Pat. 4,246,074 (Jan. 20,1981), E. Fumaux (to Lonza Company); Chem. Abstr. 94, 139253u (1981).
Ger. Offen. 2,640,658 (Feb. 9,1978), E. Greth (to Lonza Company); Chem. Abstr. 88, 152045y (1978).
B. De Spiegeleer,/. Eiq. Chromatogra. 11, 863 (1988).
ChemicalEconomics Handbook, SRI International, Menlo Park, Calif., Dec. 1988, p. 676.1000D.
"Chemical Profile," Chem. Mark. Rep. (May 8, 1989).
"Chloroacetic Acid—Toxicity Profile," The British Industrial Biological Research Association (BIBRA), Surrey, England, 1988.
G. Woodward,/. Ind. Hyg. Toxicol. 23, 78 (1941).
G. Weiss, ed., Hazardous Chemicals Data Book, Noyes Data Corp., Park Ridge, N.J., 1980, pp. 245, 424, 628.
L. F. Berhenke and E. C. Britton, Ind. Eng. Chem. 38, 544 (1946).
J. van Alphen, Rec. Tran. Chim. 46, 144 (1927); Chem. Abstr. 21, 1641 (1927).
A. C. Cope, J. R. Clark, andR. Connor, Org. Synth. Coll. Vol. 2, 181—183 (1950).
U.S. Pat. 1,921,717 (Aug. 8,1933), F. C. Amstutz (to The Dow Chemical Company); Chem. Abstr. 27, 5084 (1933).
Ger. Pat. 246,661 (Apr. 27,1911), K. Brand; Chem. Abstr. 6, 2496 (1912).
Fr. Pat. 773,623 (Nov. 22, 1934), Alias, Froges, and Camargue (to Compagnie de Produits Chimiques et Electrometalluriques); Chem. Abstr. 29,
1437 (1935).
U.S. Pat 3,772,157 (Nov. 13,1973), L. H. Horsley (to The Dow Chemical Company); Chem. Abstr. 80, 36713a (1974).
Jpn. Kokai 74/109,525 (Oct. 18, 1974), Y. Momotari (to Hardness Chemical Industries Ltd.); Chem. Abstr. 82, 165885y (1975).
T. Jasinkski and Z. Pawlak, Z.esx Xauk. Wyysy. Syk. Pedagog. Gdansk». Mat. Fiy. Chem. 8, 131 (1968); Chem. Abstr. 71, 12355s (1969).
U.S. Pat. 2,613,220 (Oct. 7,1952), С. M. Eaker (to Monsanto Company); Chem. Abstr. 47, 8773c (1953).
Jpn. Kokai I'll42,619 (Dec. 16, 1972), H. Miyamori (to Mitsubishi Edogawa Chemical Co.); Chem. Abstr. 74, 8383311 (1973).
В. G. Yasnitskii, E. B. Dolberg, and С. I. Kovelenka, Metody Poluch. Tdiim. Reakt. Prep. 21, 106 (1970); Chem. Abstr. 76, 85321x (1972).
Threshold Eimit Values and Biological Exposure Indicies, 5th ed., American Conference of Government Industrial Hygienists, Cincinnati, Ohio, 1986, p.
122.
Ger. Offen. 2,943,433 (May 7, 1981), G. Rauchschwalbe (to Bayer A.G./FRG); Chem. Abstr. 95, 61533j (1981).
Ger. Offen. 2,943,432 (May 21, 1981), W. Heykamp (to Bayer A.G./FRG); Chem. Abstr. 95, 80511s (1981).
Brit. Pat. 1,361,018 (July 24,1974), O. Hertel (to Bayer A.G./FRG); Chem. Abstr. 77, 74841m (1972).
Eur. Pat. Appl. 22,185 (J an. 14, 1981), A. Ohorodnik (to Hoechst Corporation); Chem. Abstr. 94, 174374f (1981).
U.S. Pat. 3,880,923 (Apr. 29,1975), U. Bressel (to BASF A.G./FRG); Chem. Abstr 81, 120007b (1974).
U.S. Pat. 4,169,847 (Oct. 2, 1979), G. Degisher (to Saeurefabrik Schweizerhall); Chem. Abstr. 88, 104701n (1978).
U.S. Pat. 3,674,664 (July 4, 1972), E. R. Larson (to The Dow Chemical Company).
K. Shinoda, ICagaku Kaishi, 1973, p. 527; Chem. Abstr. 79, 4644s, 4649x, 4650r (1973).
U.S. Pat. 3,883,589 (May 13, 1975), V. W. Gash (to Monsanto Company). Also see related earlier patents by the same author: 3,758,569;
3,758,571; 3,794,679; 3,812,183.
F. B. Erickson and E. J. Prill,/. Org. Chem. 23, 141 (1958).
G. D. Clayton and F. E. Clayton, Patty's Industrial Hygiene andPoxicology, 3rd ed., Wiley-Interscience, New York, 1981, p. 2391.
U.S. Pat. 2,321,278 (June 8, 1941), E. C. Britton (to The Dow Chemical Company); Chem. Abstr. 37, 6677 (1943).
E. E. Royals, Advanced Organic Chemistry, Prentice-Hall, Englewood Cliffs, N.J., 1954, p. 706.
S. Natelson and C. Gottfried, Org. Synth. Coll. Vol. 3, 381—384 (1955).
Ger. Offen. 2,151,565 (Apr. 19, 1973), H. Jenker and R. Karsten (to Chemische Fabrik Kalk); Chem. Abstr. 79, 18121f (1973).
K. Ichikawa and E. Miura,/ Chem. Soc. Jpn. 74, 798 (1953).
F. Fieser and M. Fieser, Organic Chemistry, 3rd. ed., D. C. Heath & Co., Lexington, Mass., 1958, p. 171.
USSR Pat. 213,014 (Mar. 12,1968), A. N. Novikou (to Tomsk Polytechnic Institute); Chem. Abstr. 69, 51528k (1968).
Czech. Pat. 152,947 (Apr. 15,1974). E. Prochaszka; Chem. Abstr. 81, 135465y (1974).
L. Clarke and E. K. Bolton,/ Am. Chem. Soc. 36, 1899 (1914).
R. A. Fairclough,/ Chem. Soc. 1938, 1186 (1938).
R. L. Cobb,/ Org. Chem. 23, 1368 (1958).
Earl D. Morris
John C. Bost
The Dow Chemical company
Kirk-Othmer Encyclopedia of Chemical Technology (4th Edition)
91
ACETONE
Vol 1
ACETIC ACID—TRIALKYLACETIC ACID.
See Carboxylic acids.
ACETIC ANHYDRIDE.
See Acetic acid and derivatives.
ACETINS (ACETATES OF GLYCEROL).
See Glycerol.
ACETOACETIC ACID AND ESTER.
See Ketenes, ketene dimers, and related substances.
ACETONE
Acetone [67-64-1] (2-propanone, dimethyl ketone, CH3COCH3), molecular weight 58.08 (C3H3O), is the simplest and most important of the ketones. It is
a colorless, mobile, flammable liquid with a mildly pungent, somewhat aromatic odor, and is miscible in all proportions with water and most organic
solvents. Acetone is an excellent solvent for a wide range of gums, waxes, resins, fats, greases, oils, dyestuffs, and cellulosics. It is used as a carrier for
acetylene, in the manufacture of a variety of coatings and plastics, and as a raw material for the chemical synthesis of a wide range of products such as
ketene, methyl methacrylate, bisphenol A, diacetone alcohol, methyl isobutyl ketone, hexylene glycol (2-methyl-2,4-pentanediol), and isophorone. World
production of acetone in 1990 was about 3 million metric tons per year, of which about 1 million are made in the United States. Most of the world's
manufactured acetone is obtained as a coproduct in the process for phenol from cumene and most of the remainder from the dehydrogenation of
isopropyl alcohol. Numerous natural sources of acetone make it a normal constituent of the environment. It is readily biodegradable.
Physical and Thermodynamic Properties
Selected physical properties are given in Table 1 and some thermodynamic properties in Table 2. Vapor pressure (P) and enthalpy of vaporization (H) over
the temperature range 178.45 to 508.2 К can be calculated with an error of less than 3% from the following equations wherein the units are P, kPa; H,
mJ/mol; T, K; and Tr = reduced temperature, T/T (1):
log(P) = 70.72 - 5685/T - 7.3511n(T) + 0.0000063T2
log(K) = log(49170000) + (1.036 - 1.2947; + 0.6727;2) log(l - Tr)
Spectral characterization data are given in Table 3 (2).
Table 1. Physical Properties*
Property_______________________________________________________________________________________________________Value
melting point, °C —У4.6
boiling point at 101.3 kPab, °C 56.29
refractive index, »D
at 20°C 1.3588
at 25°C 1.35596
electrical conductivity at 298.15 K, S/cm 5.5 x 1CT!
critical temperature, °C 235.05
critical pressure, kPa 4701
critical volume, L/mol 0.209
critical compressibility 0.233
triple point temperature, °C -94.7
• 1 • t-> ь tnple point pressure, Pa 2.59375
acentric factor 0.306416
solubility parameter at 298.15 K, (J/m3)1/20 19773.5
dipole moment, C m 9.61 x 10-‘
molar volume at 298.15 K, L/mol 0.0739
molar density, mol/L
solid at — 99° C 16.677
liquid at 298.15 К 13.506
Kirk-Othmer Encyclopedia of Chemical Technology (4th Edition)
92
ACETONE
Vol 1
Selected physical properties as a function of temperature
temperature, °C 0 20 40
surface tension, mN/т (=dyn/cm) 26.2 23.7 21.2
vapor pressure, kPa 9.3 24.7 54.6
specific gravity at 20°C 0.807 0.783 0.759
viscosity, mPa-s (=cP) 0.40 0.32 0.27
Extensive tables and equations are given in ref. 1 for viscosity, surface tension, thermal« conductivity, molar density, vap or pres sure, and second virial
coefficient as functions of temperature.
To convert kPa to mm Hg, multiply by 7.501.
CTo convert (J/m3)1/2 to (cal/т3)1^2, divide by 2.045.
d To convert C-m to debyes, divide by 3.336 x 10“30
Table 2. Thermodynamic Propertiesa,b’
Property Value
specific heat ofliquid at 20°C, J/g 2.6
specific heat of vapor at 102°C, J/(mol-K) 92.1
heat of vaporization at 56.1°C, kJ /mol 29.1
enthalpy of vaporization, kJ /mol 30.836
enthalpy of fusion at melting point, J /mol 5691.22
heat of combustion of liquid, kJ /mol 1787
enthalpy of combustion, kJ /mol -1659.17
entropy of liquid, J / (mol-K) 200.1
entropy of ideal gas, J / (mol-K) 295.349
Gibbs energy of formation, kJ/mol -152.716
enthalpy of formation, kJ /mol
ideal gas -217.15
-216.5
gas
liquid -248
Extensive tables and equations are given in ref. 1 for enthalpy of vaporization and heat capacity at constant pressure.
At 298.15 К unless otherwise noted.
To convert J to cal, divide by 4.184.
Table 3. Spectral Parameters for Acetone*
Method
infrared: SADG 77
Raman: SAD 162
ultraviolet: SAD 89
гН nmr: SAD 9228
13C nmr: JJ 28 FT
mass spec: Wiley 30_______________________
aRef. 2.
___________________________________________Property________________________________
Absorptionpeaks, cm-1
3000, 1715,1420, 1360,1220, 1090, 900, 790, 530
3010, 2930, 2850, 2700,1740, 1710,1430, 1360,1220, 1060, 900, 790, 520, 490,
390
Absorption peaks, nm
270 (in methanol)
Chemical shift, ppm
2.1 (CDC13)
30.6, 206.0 (CDC13)
m[ e (relative abundance)
43(100), 58(42), 15(14), 42(6), 27(4), 39(3), 26(3), 29(2) molecular ion = 58.04
Chemical Properties
The closed cup flash point of acetone is —18° C and open cup —9° C. The auto ignition temperature is 538°C, and the flammability limits are 2.6 to 12.8 vol
% in air at 25°C (3).
Acetone shows the typical reactions of saturated aliphatic ketones. It forms crystalline compounds such as acetone sodium bisulfite [540-92-1
(CH3)2C(OH)SO3Na, with alkali bisulfites. The highly reactive compound ketene [463-51-4], CH2=C=O, results from the pyrolysis of acetone. Reducing
agents convert acetone to pinacol [76-09-5], isopropyl alcohol [67-63-0], or propane [74-98-6]. Reductive ammonolysis produces isopropyl amines. Acetone
is stable to many of the usual oxidants such as Fehling's solution, silver nitrate, cold nitric acid, and neutral potassium permanganate, but it can be oxidized
with some of the stronger oxidants such as alkaline permanganate, chromic acid, and hot nitric acid. Metal hypohalite, or halogen in the presence of a base,
oxidizes acetone to the metal acetate and a haloform, eg, iodoform. Halogens alone substitute for the H atoms, yielding haloacetones. Acetone is a
metabolic product in humans and some other mammals and is a normal constituent of their blood and urine. In diabetics it is present in relatively large
amounts.
Compounds with active hydrogen add to the carbonyl group of acetone, often followed by the condensation of another molecule of the addend or
loss of water. Hydrogen sulfide forms hexamethyl-1,3,5-trithiane probably through the transitory intermediate thioacetone which readily trimerizes.
Hydrogen cyanide forms acetone cyanohydrin [75-86-5] (CH3)2C(OH)CN, which is further processed to methacrylates. Ammonia and hydrogen cyanide
give (CH3)2C(NH2)CN [19355-69-2] from which the widely used polymerization initiator, azobisisobutyronitrile [78-67-1] is made (4).
Primary amines form Schiff bases, (CH3 )2 C=NR. Ammonia induces an aldol condensation followed by 1,4-addition of ammonia to produce
diacetone amine (from mesityl oxide), 4-amino-4-methyl-2-pentanone [625-04-7], (CH3)2C(NH2)CH2COCH3, and triacetone amine (from phorone),
2,2,6,6-tetramethyl-4-piperidinone [826-36-8]. Hydroxylamine forms the oxime and hydrazine compounds (RNHNH2) form hydrazones
(RNHN=C(CH3 )2). Acetone and nitrous acid give the isonitroso compound which is the monoxime of pyruvaldehyde [306-44-5], CH3COCH=NOH.
Kirk-Othmer Encyclopedia of Chemical Technology (4th Edition)
93
ACETONE
Vol 1
Mercaptans form hemimercaptols by addition and mercaptols, (CH3)2C(SR)2, by substitution following the addition.
With aldehydes, primary alcohols readily form acetals, RCH(OR')2. Acetone also forms acetals (often called ketals), (CH3)2C(OR)2, in an exothermic
reaction, but the equilibrium concentration is small at ambient temperature. However, the methyl acetal of acetone, 2,2-dimethoxypropane [77-76-9], was
once made commercially by reaction with methanol at low temperature for use as a gasoline additive (5). Isopropenyl methyl ether [116-11-0]., useful as a
hydroxyl blocking agent in urethane and epoxy polymer chemistry (6), is obtained in good yield by thermal pyrolysis of 2,2-dimethoxypropane. With other
primary, secondary, and tertiary alcohols, the equilibrium is progressively less favorable to the formation of ketals, in that order. However, acetals of
acetone with other primary and secondary alcohols, and of other ketones, can be made from 2,2-dimethoxypropane by transacetalation procedures (7,8).
Because they hydrolyze extensively, ketals of primary and especially secondary alcohols are effective water scavengers.
Acetone has long been used as an agent to block the reactivity of hydroxyl groups in 1,2 and 1,3-diols, especially in carbohydrate chemistry. The
equilibrium for the formation of acetals with hydroxyls in these compounds is more favorable because the products are five- and six-membered ring
compounds, 1,3-dioxolanes and dioxanes, respectively. With glycerol the equilibrium constant for formation of the dioxolane is about 0.50 at 23°C and
0.29 at 48°C in a mixture resulting from acidification of equal volumes of acetone and glycerol at ambient temperature. The equilibrium can be displaced
toward acetal formation by the use of a water scavenger, eg, an anhydrous metal salt such as copper sulfate.
Acetone undergoes aldol additions,
О о
,, II , II
R1R2CH—С—R3+ CH3 —С—CH3
, , / /СНз
--► R1R2C—
I СН3
ОН
R = Н or alkyl
and further reacts with the products, forming aldol chemicals, diacetone alcohol (4-hydroxy-4-methyl-2-pentanone /725-42-2/)), mesityl oxide
(4-methyl-3-penten-2-one [141-79-7]), isophorone (3,5,5-trimethyl-2-cyclohexenone [78-59-1']), phorone (2,6-dimethyl-2,5-heptadien-4-one [504-20-1']), and
mesitylene (1,3,5-trimethylbenzene [108-67-8]}. From these are produced the industrial solvents methyl isobutyl ketone (MIBK, 4-methyl-2-pentanone
[108-10-1]), methylisobutylcarbinol (MIBC, 4-methyl-2-pentanol [108-11-2]), hexylene glycol (2-methyl-2,4-pentanediol [107-41-5]), and others. Acetone
enters the typical nucleophilic addition and condensation reactions of ketones both at its carbonyl group and at its methyl groups, with aldehydes, other
ketones, and esters. The Claisen reaction with ethyl acetate gives acetylacetone (2,4-pentanedione [123-54-6])', Mannich reaction with secondary amines
gives R2NCH2-substituted acetones; and the Reformatzky reaction gives (B-hydroxy esters. Glycidic esters (esters with a 2-epoxy group) can be made by
condensation of acetone and chloroacetic esters with a metal alkoxide.
The para and ortho positions of phenols condense at the carbonyl group of acetone to make bisphenols, eg, bisphenol A,
4,4'-(l-methylethylidene)bisphenol [80-05-07]). If the H atom is activated, C1CH— compounds add to the carbonyl group in the presence of strong base;
chloroform gives chloretone (l,l,l-trichloro-2-methyl-2-propanol [57-15-8]).
Manufacture
Acetone was originally observed about 1595 as a product of the distillation of sugar of lead (lead acetate). In the nineteenth century it was obtained by the
destructive distillation of metal acetates, wood, and carbohydrates with lime, and pyrolysis of citric acid. Its composition was determined by Liebig and
Dumas in 1832.
Until World War I acetone was manufactured commercially by the dry distillation of calcium acetate from lime and pyroligneous acid (wood
distillate) (9). During the war processes for acetic acid from acetylene and by fermentation supplanted the pyroligneous acid (10). In turn these methods
were displaced by the process developed for the bacterial fermentation of carbohydrates (cornstarch and molasses) to acetone and alcohols (11). At one
time Publicker Industries, Commercial Solvents, and National Distillers had combined biofermentation capacity of 22,700 metric tons of acetone per year.
Biofermentation became noncompetitive around 1960 because of the economics of scale of the isopropyl alcohol dehydrogenation and cumene
hydroperoxide processes.
Production of acetone by dehydrogenation of isopropyl alcohol began in the early 1920s and remained the dominant production method through
the 1960s. In the mid-1960s virtually all United States acetone was produced from propylene. A process for direct oxidation of propylene to acetone was
developed by Wacker Chemie (12), but is not believed to have been used in the United States. However, by the mid-1970s 60% of United States acetone
capacity was based on cumene hydroperoxide [80-15-9], which accounted for about 65% of the acetone produced.
Acetone was a coproduct of the Shell process for glycerol [56-8-5]. Propylene was hydrated to isopropyl alcohol. Some of the alcohol was
catalytically oxidized to acrolein and some was oxidized to give hydrogen peroxide and acetone. Some more of the isopropyl alcohol and the acrolein
reacted to give allyl alcohol and acetone. The allyl alcohol was then treated with the peroxide to give glycerol. About 1.26 kg of acetone resulted per
kilogram of glycerol. In 1974 23,000 to 32,000 t of acetone may have been produced by this method.
Direct oxidation of hydrocarbons and catalytic oxidation of isopropyl alcohol have also been used for commercial production of acetone.
Most of the world's acetone is now obtained as a coproduct of phenol by the cumene process, which is used by 21 of 31 producing companies in
North America, Western Europe, and Japan. Cumene is oxidized to the hydroperoxide and cleaved to acetone and phenol. The yield of acetone is believed
to average about 94%, and about 0.60—0.62 unit weight of acetone is obtained per unit of phenol (13).
Dehydrogenation of isopropyl alcohol accounts for most of the acetone production not obtained from cumene. The vapor is passed over a brass,
copper, or other catalyst at 400—500°C, and a yield of about 95% is achieved (1.09 unit weight of alcohol per unit of acetone) (13).
Almost 95% of the acetone produced in the United States in 1987 and 1988 was made from cumene and 4% from isopropyl alcohol (13).
Minor amounts of acetone are made by other processes. Until mid-1980 Shell Chemical Company obtained acetone and hydrogen peroxide as
coproducts of noncatalytic oxidation of isopropyl alcohol with oxygen in the liquid phase. Yield to acetone was about 90%. Acetone is a coproduct of
propylene oxide in the ARCO Chemical Company process, but is hydrogenated to isopropyl alcohol. In a process analogous to the cumene process,
Eastman Chemical Products, Inc., and The Goodyear Tire & Rubber Company produce hydroquinone and acetone from diisopropylbenzene [25321-09-9]
in the United States. Similarly, Sumitomo Chemical Co., Ltd., and Mitsui Petrochemical Industries, Ltd., in Japan produce co-product acetone with cresol
from cymene [25755-15-1]. Wacker process oxidation of propylene [115-07-1] is used by Kyowa Yuka Company and Mitsubishi Kasei Corporation in
Japan. BP Chemicals, Ltd., in the United Kingdom recovers by-product acetone from the manufacture of acetic acid by the oxidation of light petroleum
distillate. Usina Victor Sence SA in Brazil may be operating a fermentation process for acetone and butyl alcohol (13).
Producers of acetone in the United States and their capacities and feedstocks are given in Table 4 (14). Data on world production and processes by
regions are shown in Tables 5 and 6 (15).
Table 4. U.S. Producers of Acetone
Company
Location
Allied Signal Corporation
Aristech Chemical Corporation
BTL Specialty Resins Corporation
Cumenefeedstock
Frankford, Pa.
Haverhill, Ohio
Blue Island, Hl.
Annual capacity, 103 t
221
172
24
Kirk-Othmer Encyclopedia of Chemical Technology (4th Edition)
94
ACETONE
Voll
Dow Chemical U.S.A. Oyster Creek, Tex. 152
General Electric Company Mount Vemon, Ind. 177
Georgia Gulf Corporation Plaquemine, La. 109
Shell Oil Company Deer Park, Tex. 166
Texaco Corporation El Dorado, Kans. 25
Isopropyl alcohol feedstock
Shell Oil Company Deer Park, Tex. 45
Union Carbide Corporation Institute, W.Va. 77
Diisopropylben^enefeedstock
Eastman Kodak Company Kingsport, Tenn. C
The Goodyear Tire and Rubber Company, Chemical Bayport, Tex. C
Division
a As of January 1, 1990.
b _ .
Currently not active.
C Small amounts, in manufacture of hydroquinone.
Table 5. World Acetone Production Data by Regions Other Than the United States, 1987
Canada Mexico Western Europe Japan
producing companies 2 2 14 6
capacity (year end), 103 t 44 94 988 324
percentage of capacity from
isopropyl alcohol 61 77 26
cumene 39 23 69 70
other 5 30
production, 103 t 41 47 867 260
imports, 103 t 0.6 8
exports, 103 t 18 1.4 31
net imports, 103 t 35
consumption, 103 t 23 47 877 247
solvent applications 15 28b 337
ACH/MMAc 11 268 88
aldol chemicals 8 78
bisphenol A 1 74 25
other 7 120 . _ _d 134
production/capacity ratio 0.93 0.5 0.88 0.8
Other feedstocks are propylene and cymene.
Includes use initiation in the manufacture of other solvents.
C ACH = acetone cyanohydrin; MMA = methyl methacrylate.
Includes solvent uses.
Table 6. Acetone Capacities in Western Europe, 1031, 1989
Capacity from
Country No. of companies 2-Propanol Cumene Other
Finland 1 45
France 2 65 72
West Germany 14 36 250
Italy 220
Netherlands 1 100
Spain 2 9 52
United Kingdom 3 45 50 50
Cumene Hydroperoxide Process for Phenol and Acetone. Benzene is alkylated to cumene, which is oxidized to cumene
hydroperoxide, which in turn is cleaved to phenol and acetone.
OOH
air or J acid
C6H5CH(CH3)2 oxygen- C6H5C(CH3)2 C6H5OH + (CH3)2C =o
One kilogram of phenol production results in about 0.6 kg of acetone or about 0.40—0.45 kg of acetone per kilogram of cumene used.
There are many variations of the basic process and the patent literature is extensive. Several key patents describe the technology (16). The process
steps are oxidation of cumene to a concentrated hydroperoxide, cleavage of the hydroperoxide, neutralization of the cleaved products, and distillation to
recover acetone.
In the first step cumene is oxidized to cumene hydroperoxide with atmospheric air or air enriched with oxygen in one or a series of oxidizers. The
temperature is generally between 80 and 130°C and pressure and promoters, such as sodium hydroxide, may be used (17). A typical process involves the
use of three or four oxidation reactors in series. Feed to the first reactor is fresh cumene and cumene recycled from the concentrator and other reactors.
Each reactor is partitioned. At the bottom there may be a layer of fresh 2—3% sodium hydroxide if a promoter (stabilizer) is used. Cumene enters the side
of the reactor, overflows the partition to the other side, and then goes on to the next reactor. The air (oxygen) is bubbled in at the bottom and leaves at the
top of each reactor.
The temperatures decline from a high of 115°C in the first reactor to 90°C in the last. The oxygen ratio as a function of consumable oxygen is also
Kirk-Othmer Encyclopedia of Chemical Technology (4th Edition)
95
ACETONE
Vol 1
higher in. the later reactors. In this way the rate of reaction is maintained as high as possible, while minimizing the temperature-promoted decomposition of
the hydroperoxide.
This procedure may result in a concentration of cumene hydroperoxide of 9—12% in the first reactor, 15—20% in the second, 24—29% in the third,
and 32—39% in the fourth. Yields of cumene hydroperoxide may be in the range of 90—95% (18). The total residence time in each reactor is likely to be in
the range of 3—6 h. The product is then concentrated by evaporation to 75—85% cumene hydroperoxide. The hydroperoxide is cleaved under acid
conditions with agitation in a vessel at 60—100°C. A large number of nonoxidizing inorganic acids are useful for this reaction, eg, sulfur dioxide (19).
After cleavage the reaction mass is a mixture of phenol, acetone, and a variety of other products such as cumylphenols, acetophenone,
dimethyl-phenylcarbinol, CC-methylstyrene, and hydroxyacetone. It may be neutralized with a sodium phenoxide solution (20) or other suitable base or
ion-exchange resins. Process water may be added to facilitate removal of any inorganic salts. The product may then go through a separation and a wash
stage, or go direcdy to a distillation tower.
A crude acetone product is recovered by distillation from the reaction mass. One or two additional distillation columns may be required to obtain
the desired purity. If two columns are used, the first tower removes impurities such as acetaldehyde and propionaldehyde. The second tower removes
undesired heavies, the major component being water.
The yield of acetone from the cumene/phenol process is believed to average 94%. By-products include significant amounts of CC-methylstyrene
[98-83-9] and acetophenone [98-86-2] as well as small amounts of hydroxyacetone [116-09-6] and mesityl oxide [141-79-7]. By-product yields vary with the
producer. The CC-methylstyrene may be hydrogenated to cumene for recycle or recovered for monomer use. Yields of phenol and acetone decline by
3.5—5.5% when the CC-methylstyrene is not recycled (21).
Dehydrogenation of Isopropyl Alcohol. In the United States about 4% of the acetone is made by this process, and in Western Europe
about 19% (22). Isopropyl alcohol is dehydrogenated in an endothermic reaction.
CH3CHOHCH3 + 66.5 kJ/mol (at 327°C) CH3COCH3 + H2
The equilibrium is more favorable to acetone at higher temperatures. At 325°C 97% conversion is theoretically possible. The kinetics of the reaction
has been studied (23). A large number of catalysts have been investigated, including copper, silver, platinum, and palladium metals, as well as sulfides of
transition metals of groups 4, 5, and 6 of the periodic table. These catalysts are made with inert supports and are used at 400—600°C (24). Lower
temperature reactions (315—482°C) have been successfully conducted using zinc oxide-zirconium oxide combinations (25), and combinations of
copper-chromium oxide and of copper and silicon dioxide (26).
It is usual practice to raise the temperature of the reactor as time progresses to compensate for the loss of catalyst activity. When brass spelter is
used as a catalyst, the catalyst must be removed at intervals of 500—1000 h and treated with a mineral acid to regenerate catalytically active surface (27).
When 6—12% zirconium oxide is added to a zinc oxide catalyst and the reaction temperatures are not excessive, the catalyst life is said to be a minimum of
3 months (25). The dehydrogenation is carried out in a tubular reactor. Conversions are in the range of 75—95 mol %. A process described by Shell
International Research (24) is a useful two-stage reaction to attain high conversion, with lower energy cost and lower capital cost. The first stage uses a
tubular reactor at 420—550°C to convert up to 70% of the alcohol to acetone. The second stage employs an unheated fixed-bed reactor with the same
catalyst used in the tube reaction to complete the conversion at about 85%.
Although the selectivity of isopropyl alcohol to acetone via vapor-phase dehydrogenation is high, there are a number of by-products that must be
removed from the acetone. The hot reactor effluent contains acetone, unconverted isopropyl alcohol, and hydrogen, and may also contain propylene,
polypropylene, mesityl oxide, diisopropyl ether, acetaldehyde, propionaldehyde, and many other hydrocarbons and carbon oxides (25,28).
The mixture is cooled and noncondensable gases are scrubbed with water. Some of the resultant gas stream, mainly hydrogen, may be recycled to
control catalyst fouling. The liquids are fractionally distilled, taking acetone overhead and a mixture of isopropyl alcohol and water as bottoms. A caustic
treatment maybe used to remove minor aldehyde contaminants prior to this distillation (29). In another fractionating column, the aqueous isopropyl
alcohol is concentrated to about 88% for recycle to the reactor.
A yield of about 95% of theoretical is achieved using this process (1.09 units of isopropyl alcohol per unit of acetone produced). Depending on the
process technology and catalyst system, such coproducts as methyl isobutyl ketone and diisobutyl ketone can be produced with acetone (30).
Production and Shipment
Acetone is produced in large quantities and usually shipped by producers to consumers and distributors in drums and larger containers. Distributors
repackage the acetone into containers ranging in size from small botdes to drums or even tank trucks. Specialty processors make available various grades
and forms of acetone such as high purity, specially analyzed, analytical reagent grade, chromatography and spectrophotometric grades, and isotopically
labeled forms, and ship them in ampoules, vials, bottles, or other containers convenient for the buyers.
The Department of Transportation (DOT) hazard classification for acetone is Flammable Liquid, identification number UN1090. DOT regulations
concerning the containers, packaging, marking, and transportation for overland shipment of acetone are published in the Federal Register (31). Regulations
and information for transportation by water in the United States are published in the Federal Register (32) and by the U.S. Coast Guard (33). Rules and
regulations for ocean shipping have been published by the International Maritime Organization (IMO), a United Nations convention of nations with
shipping interests, in the IMOBCH Code (34). The IMO identification number is 3.1. Because additions and changes to the regulations appear
occasionally, the latest issue of the regulations should be consulted.
Small containers up to 4—5 L (about 1 gal) are usually glass. Acetone is also shipped by suppliers of small quantities in steel pails of 18 L. Depending
on the size of the container, small amounts are shipped by parcel delivery services or truck freight. Quantities that can be accepted by some carriers are
limited bylaw and special "over-pack" outer packaging may be required. Usual materials for larger containers are carbon steel for 55-gal (0.21 m3) drums,
stainless steel or aluminum for tank trucks, and carbon steel, lined steel, or aluminum for rail tank cars. The types of tank cars and trucks that can be used
are specified by law, and shippers may have particular preferences. Barges and ships are usually steel, but may have special inner or deck-mounted tanks.
Increasing in use, especially for international shipments, are intermodal (IM) portable containers, tanks suspended in frameworks suitable for interchanging
among truck, rail, and ship modes of transportation.
Containers less than bulk must bear the red diamond-shaped "FLAMMABLE LIQUID" label. Bulk containers must display the red
"FLAMMABLE" placard in association with the UN1090 identification. Fire is the main hazard in emergencies resulting from spills. Some manufacturers
provide transportation emergency response information. A listing of properties and hazard response information for acetone is published by the U.S.
Coast Guard in its CHRIS manual (35). Two books on transportation emergencies are available (36). Immediate information can be obtained from
CHEMTREC (37). Interested parties may contact their suppliers for more detailed information on transportation and transportation emergencies.
Tank cars contain up to 10, 20, or 30 thousand gal (10, 000 gal = 38 m3 ) of material, tank trucks 6000 gal (22.7 m3), and barges 438,000 gal (about
1270 tons). International shipments by sea are typically about 2000 tons.
Economic Aspects
The economics of acetone production and its consequent market position are unusual. Traditional laws of supply and demand cannot be applied because
supply depends on the production of phenol and demand is controlled by the uses of acetone. Therefore, coproduct acetone from the cumene to phenol
process will continue to dominate market supply. Deliberate production of acetone from isopropyl alcohol accommodates demand in excess of that
supplied by the phenol process. More than 75% of world and 90% of U.S. production comes from the cumene to phenol process.
World Capacity, Production, and Consumption. Current and future world capacity, based on announced new plants and expansions,
and 1987 production and consumption data are shown in Table 7 (38). Consumption of acetone is expected to grow at a rate of about 2% annually until
Kirk-Othmer Encyclopedia of Chemical Technology (4th Edition)
96
ACETONE
Vol 1
1992, but phenol demand and consequent coproduct acetone production are expected to grow at a rate of 2.5—3%, thus resulting in excess supplies. The
fastest growing oudet for acetone is for bisphenol A, mainly for growth in polycarbonate. Although bisphenol A production consumes one mole of
acetone, it yields a net amount of one mole of acetone production because two moles of acetone accompany the production of the required phenol.
Production of "on-purpose" acetone will probably decline as supplies of by-product acetone increase.
Table 7. World Capacity, Production, and Consumption for Acetone, 103 t
Capacity Production 1987 Imports 1987 Exports 1987 Consumption 1987
1/1/1989 1/1/1994
North America Canada 44 87 41 18 23
Mexico 94 96 47 0.5 1.4 47
United States 1084 1345 950 75 118 908
Western Europe 994 1062 867 35c 877
Japan 324 324 260 8 31 247
Other 857d 1046 833 429 439 777
Total 3397 3960 2998 548 607 2879
Current and projected future capacity based on announced new plants and expansions.
Actual consumption; the difference between actual and apparent consumption is primarily due to inventory changes. U.S. datum is apparent
consumption.
Net imports.
Includes Africa, Asia, Eastern Europe (460,000 t), Australia, and South America.
World consumption data by end use in 1987 are shown in Table 8 (39). Solvent applications account for the largest use of acetone worldwide,
followed by production of acetone cyanohydrin for conversion to methacrylates. Aldol chemicals are derivatives of acetone used mainly as solvents (40).
Table 8. World Demand for Acetone by Use in 1987
Use Consumption by region, percentage
Canada Mexico United States Western Europe Japan
solvent applications 65 60a 21 38 b
acetone cyanohydrin and methyl 23 41 31 36
methacrylate
bisphenol A 2 14 8 10
aldol chemicals 35 a 12 9
other 15 12 14 54b
Use both as a solvent and in production of aldol chemicals used as solvents.
Other for Japan includes solvent applications.
U.S. Capacity, Production, and Consumption. U.S. acetone capacity in 1989 was about 32% of world capacity. Planned additions that
have been announced will increase U.S. capacity to 1.34 x 106 t by 1992, if all are attained (41). Historically, the percentage of U.S. capacity from cumene
has steadily increased from 1970 (37%) to 1989 (87%), except for a slight dip in the early 1980s. During the same period the percentage from isopropyl
alcohol steadily declined from 60 to 11%, except for a compensating slight rise in the early 1980s. Total capacity ranged from 887,000 t in 1970 to
1.66 x 10⁶ t in 1982 to 1.09 x 10⁶ t in 1989 (42).
Production of acetone from isopropyl alcohol ranged from about 250,000 to 300,000 t/yr from 1970 to 1981 with the exception of three of those
years when it was higher. Then production dropped sharply to the 30,000—50,000 t range for 1984 to 1988. From 1970 to 1988 production of acetone from
cumene had three periods of growth and two periods of decline which roughly paralleled fluctuations in the U.S. economy. The amount produced ranged
from 300,000 t in 1970 to about 900,000 t in 1988, with an average growth rate of 26,800 t/yr, or about 4.4% per annum. Total annual acetone production
during the period 1970—1987 has been in the range of 0.7-1 x 10⁶ t except for a peak of about 1.15 x 10⁶ t in 1979, with a trend slightly upward. Average
total production for the period was 880,000 t (43).
U.S. list prices for acetone were around $100 per metric ton from 1970 to 1973, rose sharply in 1974, and then slowly for the next five years to
around $300, rose sharply again to a peak of nearly $750 in 1982, and then declined to the $600 range. The lowest annual list prices from 1982 to 1989 were
in the $500 range, but tended toward the highest prices during the decade. Unit sales prices (negotiated for very large quantities) were closely parallel to but
a litde lower than list prices until 1980 when they diverged sharply and remained about $200 per metric ton lower than the highest list prices for the rest of
the decade (44). Current pricing is strongly tied to acetone supply and demand and only loosely to raw material costs.
The United States was a net exporter in the 1980s except for 1984—1986 when it was a net importer. This reversal resulted from a number of
conditions including the global recession, foreign relationships, new overseas capacity especially in Japan and South Africa (which in 1988 was the largest
exporter to the United States), and the increase in other countries of the ratio of phenol production to acetone demand (45).
Trends in acetone consumption by uses are shown in Table 9 (46). The amount of acetone going to acetone cyanohydrin has increased rather
steadily at an average rate of about 10,600 t/yr (4% annual rate), with minor dips in 1975 and 1982. Acetone to bisphenol A followed a similar curve with
growth of about 5,600 t/yr (9%). Total acetone consumption fluctuated a bit more but was otherwise similar, with average annual growth for 1970—1988 of
about 5,600 t/yr (0.7%). Except for 1982, solvent uses were within about 10% of 200,000 t/yr. Amounts for other uses generally declined as indicated in
the table, with some fluctuations. Litde or no growth in the solvents market is expected because acetone is classified as a volatile organic compound.
Eleven large volume consumers in the United States and their products from acetone are listed in Table 10 (47). The largest distributors are Ashland
Chemical Company, Unocal Chemicals, ChemCentral, Van Waters & Rogers, andJLM Industries (47).
Table 9. U.S. Consumption of Acetone by Uses, 1031
Use
1970
1980
1988
acetone cyanohydrin
bisphenol A
176
26
298
67
406
137
Kirk-Othmer Encyclopedia of Chemical Technology (4th Edition)
97
ACETONE
Voll
aldol chemicals
methyl isobutyl ketone 113 95 63
methylisobutylcarbinol 25 20 17
other aldol chemicals 66 55 33
solvent uses 194 222
other uses 342a 103 73
Includes solvent uses.
Table 10. Large Volume Consumers of Acetone for Derivatives in the United States
Derivative product Consumer
acetone cyanohydrin B, Cy, Du, R
methyl isobutyl ketone E, S, U
methylisobutylcarbinol S, U
other aldol chemicals E, S, U, Ce
bisphenol A A, Do, G, S
a A = Aristech Chemical В = BP Chemicals Ce = Celanese Cy = CYRO Industries Do = Dow Chemical Du = Du Pont E = Eastman Chemical
G = General Electric R = Rohm&Haas S = Shell Chemical U = Union Carbide
Specifications, Standards, and Quality Control
The ASTM "Standard Specification for ACETONE," D329, requires 99. 5% grade acetone to conform to the following: apparent specific gravity 20/20°C,
0.7905 to 0.7930; 25/25°C, 0.7860 to 0.7885 (ASTM D891); color, not more than No. 5 on the platinum—cobalt scale (ASTM D1209); distillation range,
1.0°C which shall include 56.1°C (ASTM D1078); nonvolatile matter, not more than 5 mg/100 mL (D1353); odor, characteristic, nonresidual (ASTM
D1296); water, not more than 0.5 wt % (ASTM D1364); acidity (as free acetic acid), not more than 0.002 wt %, equivalent to 0.019 mg of KOH per gram
of sample (ASTM D1613); water miscibility, no turbidity or cloudiness at 1:10 dilution with water (ASTM D1722); alkalinity (as ammonia), not more than
0.001 wt % (ASTM D1614); and permanganate time, color of added KMnO4 must be retained at least 30 min at 25°C in the dark (ASTM D1363).
Higher or lower quality at more or less cost will meet the needs of some consumers. Acetone is often produced under contract to meet customer
specifications which are different from those of ASTM D329. Some specialty grades are analyzed reagent, isotopically labeled, clean room, Equid
chromatography, spectroscopic, ACS reagent (48), semiconductor (low metals), and Federal Specification O-A-51G.
Specification tests are performed on plant streams once or twice per worker shift, or even more often if necessary, to assure the continuing quality
of the product. The tests are also performed on a sample from an outgoing shipment, and a sample of the shipment is usually retained for checking on
possible subsequent contamination. Tests on specialty types of acetone may require sophisticated instruments, eg, mass spectrometry for isotopically
labeled acetone.
Analytical and Test Methods, Storage
In current industrial practice gas chromatographic analysis (glc) is used for quality control. The impurities, mainly a small amount of water (by Kad-Fischer)
and some organic trace constituents (by glc), are determined quantitatively, and the balance to 100% is taken as the acetone content. CompEance to
specified ranges of individual impurities can also be assured by this analysis. The gas chromatographic method is accurately correlated to any other tests
specified for the assay of acetone in the product. Contract specification tests are performed on product to be shipped. Typical wet methods for the
determination of acetone are acidimetry (49), titration of the Eberated hydrochloric acid after treating the acetone with hydroxylamine hydrochloride; and
iodimetry (50), titrating the excess of iodine after treating the acetone with iodine and base (iodoform reaction).
Carbon steel tanks of welded construction, as specified in the American Petroleum Institute Standard 650 (51), are recommended for acetone
storage. Gaskets should be ethylene—propylene rubber or Viton rubber. An inert gas pad should be used. Provisions should be made to prevent static
charge buildup during filling. Design considerations of the National Fire Prevention Association Code 30 and local fire codes should be foEowed. Tank
venting systems should comply with local vapor emission standards and conform with National Fire Prevention Association recommendations. Where the
purity of the acetone is to be optimized, an inorganic zinc lining is recommended (52). One such lining is Carbozinc 11, metallic zinc in an ethyl siEcate
binder, available from Carboline Co., St. Louis, Missouri.
Health and Safety
Acetone is among the solvents of comparatively low acute and chronic toxicity. High vapor concentrations produce anesthesia, and such levels may be
kritating to the eyes, nose, and throat, and the odor may be disagreeable. Acetone does not have sufficient warning properties to prevent repeated
exposures to concentrations which may cause adverse effects. In industry no injurious effects have been reported other than skin kritation resulting from
its defatting action, or headache from prolonged inhalation (53). Direct contact with the eyes may produce irritation and transient corneal injury.
Material Safety Data Sheets (MSDS) issued by suppEers of acetone are required to be revised within 90 days to include new permissible exposure
limits (PEL). Current OSHA PEL (54) and ACGIH threshold limit values (TLV) (55) are the same, 750 ppm TWA and 1000 ppm STEL. For comparison,
the ACGIH TWA values for the common rubbing alcohols are ethyl, 1000, and isopropyl, 400 ppm. A report on human experience (56) concluded that
exposure to 1000 ppm for an 8-h day produced no effects other than slight, transient irritation of the eyes, nose, and throat.
There are many natural sources of acetone including forest fires, volcanoes, and the normal metaboEsm of vegetation, insects, and higher animals
(57). Acetone is a normal constituent of human blood, and it occurs in much higher concentrations in diabetics. Its toxicity appears to be low to most
organisms. Acetone is ubiquitous in the environment, but is not environmentally persistent because it is readily biodegraded. In general acetone is an
environmentally benign compound, widely detected but in concentrations that are orders of magnitude below toxicity thresholds.
Acetone can be handled safely if common sense precautions are taken. It should be used in a well-ventilated area, and because of its low flash point,
ignition sources should be absent. Flame will travel from an ignition source along vapor flows on floors or bench tops to the point of use. Sinks should be
rinsed with water while acetone is being used to clean glassware, to prevent the accumulation of vapors. If prolonged or repeated skin contact with acetone
could occur, impermeable protective equipment such as gloves and aprons should be worn.
CompatibiEty of acetone with other materials should be carefully considered, especially in disposal of wastes. It reacts with chlorinating substances
to form toxic chloroketones, and potentially explosively with some peroxy compounds and a number of oxidizing mixtures. Mixed with chloroform,
acetone will react violently in the presence of bases. Other incompatibiEties are Ested in the Sax handbook (53).
Vapor flammabiEty range in ah (2.6—12.8 vol %) and low flash point (—18° C, 0°F) make fire the major hazard of acetone. Quantities larger than
laboratory hand bottles should be stored in closed metal containers. Gallon glass bottles should be protected against impacts. Areas where acetone is in
contact with the ambient ah should be free of ignition sources (flames, sparks, static charges, and hot surfaces above the autoignition temperature, about
Kirk-Othmer Encyclopedia of Chemical Technology (4th Edition)
98
ACETONE
Vol 1
500—600°C depending on the reference consulted). Fires may be controlled with carbon dioxide or dry chemical extinguishers. Recommended methods of
handling, loading, unloading, and storage can be obtained from Material Safety Data Sheets and inquiries directed to suppliers of acetone.
Uses
Acetone is used as a solvent and as a reaction intermediate for the production of other compounds which are mainly used as solvents and/or intermediates
for consumer products.
Direct Solvent Use. A large volume, direct solvent use of acetone is in formulations for surface coatings and related washes and thinners,
mainly for acrylic and nitrocellulose lacquers and paints. It is used as a solvent in the manufacture of pharmaceuticals and cosmetics (about 7000 metric
tons in nail polish removers), in spinning cellulose acetate fibers, in gas cylinders to store acetylene safely, in adhesives and contact cements, in various
extraction processes, and in the manufacture of smokeless powder. It is a wash solvent in fiberglass boat manufacturing, a cleaning solvent in the
electronics industry, and a solvent for degreasing wool and degumming silk.
Acrylics. Acetone is converted via the intermediate acetone cyanohydrin to the monomer methyl methacrylate (MMA) [80-62-6]. The MMA is
polymerized to poly(methyl methacrylate) (PMMA) to make the familiar clear acrylic sheet. PMMA is also used in molding and extrusion powders.
Hydrolysis of acetone cyanohydrin gives methacrylic acid (MAA), a monomer which goes direcdy into acrylic latexes, carboxylated styrene—butadiene
polymers, or ethylene—MAA ionomers. As part of the methacrylic structure, acetone is found in the following major end use products: acrylic sheet
molding resins, impact modifiers and processing aids, acrylic film, ABS and polyester resin modifiers, surface coatings, acrylic lacquers, emulsion polymers,
petroleum chemicals, and various copolymers (see Methacrylic acid and derivatives; Methacrylic polymers).
Bisphenol A. One mole of acetone condenses with two moles of phenol to form bisphenol A [80-05-07]', which is used mainly in the
production of polycarbonate and epoxy resins. Polycarbonates (qv) are high strength plastics used widely in automotive applications and appliances,
multilayer containers, and housing applications. Epoxy resins (qv) are used in fiber-reinforced laminates, for encapsulating electronic components, and in
advanced composites for aircraft—aerospace and automotive applications. Bisphenol A is also used for the production of corrosion- and chemical-resistant
polyester resins, polysulfone resins, polyetherimide resins, and polyarylate resins.
Aldol Chemicals. The aldol condensation of acetone molecules leads to the group of aldol chemicals which are themselves used mainly as
solvents. The initial condensation product is diacetone alcohol (DAA) which is dehydrated to mesityl oxide. Because of its toxicity effects, mesityl oxide is
no longer produced for sale, but is used captively to make methyl isobutyl ketone (MIBK) and methylisobutylcarbinol (MIBC) by hydrogenation. DAA is
hydrogenated to hexylene glycol. Three molecules of acetone give isophorone and phorone which is hydrogenated to diisobutyl ketone (DIBK) [108-83-8]
and diisobutylcarbinol (DIBC) [108-82-7].
MIBK is a coatings solvent for nitrocellulose lacquers and vinyl and acrylic polymer coatings, an intermediate for rubber antioxidants and specialty
surfactants, and a solvent for the extraction of antibiotics. MIBC is used mainly for the production of zinc dialkyl dithiophosphates which are used as
lubricating oil additives. It is a flotation agent for minerals and a solvent for coatings. Besides its use as a chemical intermediate, DAA is used as a solvent
for nitrocellulose, cellulose acetate, oils, resins, and waxes, and in metal cleaning compounds. Hexylene glycol is a component in brake fluids and printing
inks. Isophorone is a solvent for industrial coatings and enamels. DIBK is used in coatings and leather finishes.
Other Uses. More than 70 thousand metric tons of acetone is used in small volume applications some of which are to make functional
compounds such as antioxidants, herbicides, higher ketones, condensates with formaldehyde or diphenylamine, and vitamin intermediates.
Further information on uses, current volumes, and estimates of growth is available in reference 58.
BIBLIOGRAPHY
"Acetone" in ECT 1st ed., Vol. 1, pp. 88—95, by C. L. Gabriel and A. A. Dolnick, Publicker Industries; in ECT 2nd ed., Vol. 1, pp. 159—167, by R. J. Miller,
California Research Corporation; in ECT 3rd ed., Vol. 1, pp. 179—191, by D. L. Nelson and В. P. Webb, The Dow Chemical Company.
1. American Institute of Chemical Engineers, Design Institute for Physical Property Data., (DIPPR File), University Park, Pa., 1989. For other listings of
properties, see Beilsteins Handbuch derOrganischen Chemie, Springer-Vedag, Bedin, Vol. 1 and supplement; and J. A. Riddick, W. B. Bunger, andT. K.
Sakano, "Organic Solvents, Physical Properties, and Methods of Purification," in Techniques of Organic Chemistry, Vol. 2, John Wiley & Sons, Inc.,
New York, 1986.
2. R. C. Weast and J. G. GrasseHi, eds., Handbook of Data on Organic Compounds, 2nd ed., Vol. 6, CRC Press, Inc., Boca Raton, Fla., Compound no.
21433, p. 3731.
3. Eire Hazard Properties ofF’lammable Eiquids, Gases, and Volatile Solids, Report 325M-1984, NationalFire Codes, Vol. 8, National Fire Protection
Association, Batterymarch Park, Quincy, Mass.
4. R. A. Smiley, "Nitriles" in M. Grayson, ed., Eark-OthmerEnyclopedia of Chemical Technology, 3rd ed., Vol. 15, Wiley-Interscience, New York, 1981, p.
901.
5. U.S. Pat. 2,827,494 (Mar. 18,1958), J. H. Brown, Jr., and N. B. Lorette (to The Dow Chemical Company); Chem. Abstr. 52, 146551 (1958). U.S.
Pat. 2,827,495 (March 18, 1958), G. C. Bond and L. A. Klar (to The Dow Chemical Company); Chem. Abstr. 52, 14656a (1958). N. B. Lorette, W.
L. Howard, and J. H. Brown, Jr.,/. Org. Chem. 24, 1731 (1959); Chem. Abstr. 55, 12275g (1961).
6. U.S. Pat. 3,804,795 (Apr. 16, 1974), W. O. Perry, M. W. Sorenson, and T. J. Hairston, (to The Dow Chemical Company); Chem. Abstr. 81, 65384v
(1974). Ger. Offen. 2,424,522 (Dec. 12,1974) and U.S. Pat. 3,923,744 (Dec. 2,1975), M. V. Sorenson, R. C. Whiteside, and R. A. Hickner (to
The Dow Chemical Company); Chem. Abstr. 82, 141725v (1975).
7. N. B. Lorette and W. L. Howard,/ Org. Chem. 25, 521 (1960); Chem. Abstr. 54, 19531c (1960). W. L. Howard andN. B. Lorette,/ Org. Chem. 25,
525 (1960); Chem. Abstr. 54, 19528f (1960).
8. U.S. Pat. 3,127,450 (March 31, 1964), W. L. Howard and N. B. Lorette (to The Dow Chemical Company); Chem. Abstr. 60, 15737f (1964). U.S.
Pat. 3,166,600 (January 19, 1965), N. B. Lorette and W. L. Howard (to The Dow Chemical Company); Chem. Abstr. 62, 7656i (1965).
9. E. G. R. Ardah, A. D. Barbour, G. E. McClellan, and E. W. McBride, Ind. Eng. Chem. 16, 1133 (1924).
10. J. M. Weiss, Chem. Eng. News 36, 70 (June 9, 1958).
11. U.S. Pat. 1,329,214 (Jan. 27,1920), C. Weizmann and A. Hamlyn; Chem. Abstr. 14, 998 (1920).
12. Brit. Pat. 876,025 (Aug. 30, 1961) and Ger. Pat. 1,080,994 (to Consortium Fuer Elektrochemische Industrie G.m.b.H.). Brit. Pat. 884,962 (Dec.
20,1961) (to Consortium Fuer Elektrochemische Industrie G.m.b.H.); Chem. Abstr. 59, 5024h (1963). Brit. Pat. 892,158 (Mar. 21,1962) (to
Consortium Fuer Elektrochemische Industrie G.m.b.H.); Chem. Abstr. 59, 13826d (1963).
13. C. S. Read with T. Gibson and Z. Sedaghat-Pour, "Acetone" in Chemical Economics Handbook, SRI International, Menlo Park, Calif., 1989, p.
604.5000 H.
14. K. D. McCracken, "The Dow Chemical Company, private communication, Feb. 1990.
15. Ref. 13, p. 604.5001 О to W.
16. Brit. Pat. 1,257,595 (Dec. 22,1971) and Fr. Pat. 2,050,175, R. L. Feder and co-workers (to Allied Chemical); Chem. Abstr. 76, 3548q (1972). U.S.
Pat. 2,632,774 (Mar. 24, 1953), J. C. Conner, Jr., and A. D. Lohr (to Hercules, Inc.). U.S. Pat. 2,744,143 (Sept. 2, 1953), L. J. Filar (to Hercules,
Inc.). U.S. Pat. 3,365,375 (Jan. 23,1968) and Brit. Pat. 1,193,119, J. R. Nixon, Jr. (to Hercules, Inc.). Brit. Pat. 999,441 (July 28,1965) (to Allied
Chemical); Chem. Abstr. 63, 14764g (1965).
17. Brit. Pat. 1,257,595 of ref. 16. U.S. Pat. 2,799,711 (July 16,1957), E. Beati and F. Severini (to Montecatini). Brit. Pat. 895,622 (May 2,1962) (to
Societa Italiana Resine); Chem. Abstr. 57, 1110811 (1962).
18. Brit. Pat. 1,257,595 of ref. 16.
19. Brit. Pat. 970,945 (Sept. 23,1964) (to Societa Italiana Resine); Chem. Abstr. 61, 14586a (1964). U.S. Pat. 2,757,209 (July 31,1956), G. C. Joris (to
Kirk-Othmer Encyclopedia of Chemical Technology (4th Edition)
99
ACETONE
Vol 1
Allied Chemical).
20. U.S. Pat. 2,632,774 of ref. 16.
21. Ref. 13, p. 604.5000 F. Detailed process information is available in Phenol, Report No. 22B, Process Economics Program, SRI International, Menlo
Park, Calif., December 1977.
22. Ref. 13, p. 604.5001 T.
23. C. Sheely, Jr., Kinetics of Catalytic Dehydrogenation of Isopropanol, University Microfilms, Ann Arbor, Michigan, 1953, p. 3.
24. Brit. Pat. 938,854 (Oct. 9, 1953) and Belg. Pat. 617965, J. B. Anderson, К. B. Cofer, and G. E. Coury (to Shell Chemical); Chem. Abstr. 59, 13826a
(1963).
25. Brit. Pat. 665,376 (Jan. 23, 1952), H. O. Mottem (to Standard Oil Development Co.); Chem. Abstr. 46, 614211 (1952); this work is also U.S. Pat.
2,549,844; Chem. Abstr. 46, 524c (1952).
26. Brit. Pat. 804,132 (Nov. 5,1958) (to Knapsack-Griesheim Aktiengesellschaft); Chem. Abstr. 53, 7990c (1959).
27. Brit. Pat. 817,622 (Aug. 6, 1959), W. Edyvean (to Shell Research Limited); Chem. Abstr. 54, 7562e (1960).
28. Brit. Pat. 1,097,819 (Jan. 3,1968) (to Les Usines DeMelle); Chem. Abstr. 68, 63105n (1968). Brit. Pat. 610,397 (Oct. 14,1948) (to Universal Oil
Products); Chem. Abstr. 43, 4287f (1949).
29. Brit. Pat. 742,496 (Dec. 30, 1955), W. G. Emerson, Jr., and J. R. Quelly (to Esso Research & Engineering Co.); Chem. Abstr. 50, 8710a (1956); this
work is also U.S. Pat. 2,662,848; Chem. Abstr. 48, 8815a (1954).
30. Acetone, MethylEthyl Ketone, and Methyl Isobutyl Ketone, Report No. 77, May 1972, Process Economics Program, SRI CEH, SRI International, Menlo
Park, Calif, p. 604.5000 F. Contains detailed process information.
31. "Code of Federal Regulations, Title 49, pt. 100 to 177," Federal Register, Washington, D.C., October 1, 1988, paragraphs 173.118, 173.119, 173.32C,
and 172.101. Because of occasional changes, the latest issue of Federal Register should be consulted.
32. "Code of Federal Regulations, Tides 33 and 46," FederalRegister, Washington, D.C. See also ref. 31.
33. Chemical Data Guide for Bulk Shipment by Water, United States Coast Guard, Washington, D.C.
34. Code for Construction and Equipment of Ships Carrying Dangerous Chemicals in Bulk, International Maritime Organization, Publications Section, London,
England.
35. Chemical Hazard Response Information System, Commandant Instruction M. 16465.12A, U.S. Coast Guard, U.S. Department of Transportation,
Washington, D.C.
36. Guidebook for Initial Response to Hazardous Materials Incidents, DOT P 5800.4, U.S. Department of Transportation, Washington, D.C., 1987. Emergency
Handling ofHazardous Materials in Suface Transportation, Bureau of Explosives, Association of American Railroads, Washington, D.C., 1981.
37. Chemical Transportation Emergency Center, a public service of the Chemical Manufacturers' Association, 2501 M Street, N.W., Washington, D.C.
20037-1303.
38. Ref. 13, pp. 604.5000 C,D.
39. Ref. 13, p. 604.5000 E.
40. Ref. 13, pp. 604.5000 D,E.
41. Ref. 13, p. 604.5000 H.
42. Ref. 13, pp. 604.5000 H,S.
43. Ref. 13, pp. 604.5000 U,V.
44. Ref. 13, pp. 604.5001 1,J.
45. Ref. 13, p. 604.5001 M.
46. Ref. 13, p. 604.5000 Z.
47. Ref. 13, p. 604.5000 T.
48. J. A. Riddick, W. B. Bunger, and T. K. Sakano, "Organic Solvents, Physical Properties, and Methods of Purification," in Techniques of Organic
Chemistry, Vol. 2, John Wiley & Sons, Inc., New York, 1986, p. 954.
49. M. Morosco, Ind. Eng. Chem. 18, 701 (1926).
50. L. F. Goodwin,/. Am. Chem. Soc. 42, 39 (1920).
51. American Petroleum Institute Standard 650,1977 ed., American Petroleum Institute, Washington, D.C., paragraphs 3.5.2el, 3.5.2e3.
52. Acetone, Form No. 115-598-84, product bulletin of The Dow Chemical Company, Midland, Mich., 1984.
53. N. I. Sax and R. J. Lewis, Sr., Dangerous Properties of Industrial Materials, 7th ed., Vol. 2, Van Nostrand Reinhold, New York, 1989.
54. Federal Register 54(12), 2332 (1989).
55. Threshold Eimit Values and Biological Exposure Indices for 1987—1988, American Conference of Government Industrial Hygienists, Cincinnati, Ohio.
56. W. J. Krasavage,J. L. O'Donoghue, and G. D. Divincenzo, "Ketones" in G. D. Clayton andF. E. Clayton, eAs.,Patty'sIndustrial Hygiene and
Toxicology, 3rd rev. ed., Vol. 2C, Toxicology, John Wiley & Sons, Inc., 1982, p. 4724. Several human experience case histories are cited.
57. . E. Graedel, D. T. Hawkins, and L. D. Claxton, Atmospheric Chemical Compounds, Academic Press, Orlando, Fla., 1986, p. 263, cited in Hazardous
Substances Data Bank, Acetone from Toxicology Data Network (TOXNET), National Library of Medicine, Bethesda, Md., Jan. 1990, NATS section
in the review.
58. Ref. 13, pp. 604.5000T to 604.5001Z.
General Reference
C. S. Read with T. Gibson and Z. Sedaghat-Pour, "Acetone" in Chemical Economics Handbook, SRI International, Menlo Park, Calif., 1989. An excellent
information source.
William L. Howard
The Dow Chemical Company
Kirk-Othmer Encyclopedia of Chemical Technology (4th Edition)
100
ACETYLENE-DERIVED CHEMICALS
Voll
ACETONITRILE.
See Nitriles.
ACETONYLACETONE.
See Ketones.
ACETOPHENETIDIN.
See Analgesics, antipyretics, and anti-inflammatory agents.
ACETOPHENONE.
See Ketones.
ACETYL CHLORIDE.
See Acetic acid and derivatives.
ACETYLCHOLINE.
See Choline; Enzyme, inhibitors.
ACETYLENE.
See Hydrocarbons, acetylene.
ACETYLENE BLACK.
See Carbon, carbon and artificial graphite.
ACETYLENE-DERIVED CHEMICALS
Acetylene [74-86-2]y C2H2, is an extremely reactive hydrocarbon, principally used as a chemical intermediate (see Hydrocarbons, acetylene). Because of its
thermodynamic instability, it cannot easily or economically be transported for long distances. To avoid large free volumes or high pressures, acetylene
cylinders contain a porous solid packing and an organic solvent. Acetylene pipelines are severely restricted in size and must be used at relatively low
pressures. Hence, for large-scale operations, the acetylene consumer must be near the place of acetylene manufacture.
Historically, the use of acetylene as raw material for chemical synthesis has depended strongly upon the availability of alternative raw materials. The
United States, which until recendy appeared to have limitless stocks of hydrocarbon feeds, has never depended upon acetylene to the same extent as
Germany, which had more limited access to hydrocarbons (1). During World War I the first manufacture of a synthetic rubber was undertaken in Germany
to replace imported natural rubber, which was no longer accessible. Acetylene derived from calcium carbide was used for preparation of
2,3-dimethyl-l,3-butadiene by the following steps:
acetylene acetaldehyde acetic acid acetone
2, 3-dimethyl-2, 3-butanediol 2, 3-dimethyl-l, 3-butadiene
Methyl rubber, obtained by polymerization of this monomer, was expensive and had inferior properties, and its manufacture was discontinued at the end
of World War I. By the time World War II again shut off access to natural rubber, Germany had developed better synthetic rubbers based upon butadiene
[106-99-0] (see Elasto^rs, synthetic).
In the United States butadiene was prepared initially from ethanol and later by cracking four-carbon hydrocarbon streams (see Butadiene). In
Germany butadiene was prepared from acetylene via the following steps: acetylene —» acetaldehyde — 3-hydroxybutyraldehyde — 1,3-butanediol —
1,3-butadiene.
Toward the end of the war, an alternative German route to butadiene was introduced which required much less acetylene:
Kirk-Othmer Encyclopedia of Chemical Technology (4th Edition)
101
ACETYLENE-DERIVED CHEMICALS
Voll
lie ('ll 2 CH2O - IKX'II K' ('('11,011 -
acetylene formaldehyde 1,4 —butynediol
HOCH2CH2CH2CH2OH CH2=CHCH=CH2
1,4 —butanediol 1,3 —butadiene
Because of its relatively high price, there have been continuing efforts to replace acetylene in its major applications with cheaper raw materials. Such
efforts have been successful, particularly in the United States, where ethylene has displaced acetylene as raw material for acetaldehyde, acetic acid, vinyl
acetate, and chlorinated solvents. Only a few percent of U.S. vinyl chloride production is still based on acetylene. Propylene has replaced acetylene as feed
for acrylates and acrylonitrile. Even some recent production of traditional Reppe acetylene chemicals, such as butanediol and butyrolactone, is based on
new raw materials.
Reaction Products
Acetaldehyde. Acetaldehyde [75-07-0], C2H4O, (qv) was formerly manufactured principally by hydration of acetylene.
HC=CH + H20 CH3CHO
Many catalytic systems have been described; acidic solutions of mercuric salts are the most generally used. This process has long been superseded by more
economical routes involving oxidation of ethylene or other hydrocarbons.
Acrylic Acid, Acrylates, and Acrylonitrile. Acrylic acid [79-10-7], C3H4O2, and acrylates were once prepared by reaction of acetylene and
carbon monoxide with water or an alcohol, using nickel carbonyl as catalyst. In recent years this process has been completely superseded in the United
States by newer processes involving oxidation of propylene (2). In western Europe, however, acetylene is still important in acrylate manufacture (see
Acrylic acid and derivatives; Acrylic ester polyp^rs).
In the presence of such catalysts as a solution of cuprous and ammonium chlorides, hydrogen cyanide adds to acetylene to give acrylonitrile
[107-13-1], C3H3N (qv).
HC=CH + HCN ch2=chcn
Since the early 1970s this process has been completely replaced by processes involving ammoxidation of propylene (3).
Chlorinated Solvents. Originally, successive chlorination and dehydro-chlorination of acetylene was the route to trichloroethylene [79-01-6],
C2HC13, and perchloroethylene [127-18-4], C2C14.
HC=CH + 2C12 CHC12CHC12 CHC1=CC12 + HC1
CHC1=CC12 + Cl2 CHC12CC13 CC12=CC12 + HC1
This route has been completely displaced, first by chlorination and dehydro-chlorination of ethylene or vinyl chloride, and more recendy by oxychlorination
of two-carbon raw materials (2) (see Chlorocarbons and chlorohydrocarbons).
Cyclooctatetraene (COT). Tetramerization of acetylene to cyclooctatetraene [629-20-9], CgHg, although interesting, does not seem to have
been used commercially. Nickel salts serve as catalysts. Other catalysts give benzene. The mechanism of this cyclotetramerization has been studied (4).
Ethylene. During World War II the Germans manufactured more than 60,000 t/yr of ethylene [74-85-1], C2H4, by hydrogenation of acetylene,
using palladium on silica gel as catalyst. Subsequently, cracking of hydrocarbons displaced this process. However, it is still utilized for purification of
ethylene containing small amounts of acetylene as contaminant (5) (see Ethylene).
Vinyl Acetate. Vinyl acetate [108-05-04], C4H6O2, used to be manufactured by addition of acetic acid to acetylene.
HC=CH + CH3COOH CH2=CHOOCCH3
Liquid- and vapor-phase processes have been described; the latter appear to be advantageous. Supported cadmium, zinc, or mercury salts are used as
catalysts. In 1963 it was estimated that 85% of U.S. vinyl acetate capacity was based on acetylene, but it has been completely replaced since about 1982 by
newer technology using oxidative addition of acetic acid to ethylene (2) (see Vinyl polymers). In western Europe production of vinyl acetate from acetylene
still remains a significant commercial route.
Vinylacetylene and Chloroprene. In the presence of cuprous salt solutions, acetylene dimerizes to vinylacetylene [689-97-4], C4H4. Yields of
87% monovinylacetylene, together with 10% of divinylacetylene, have been described (6).
2 HC=CH HC=CCH=CH2
Using cuprous chloride as catalyst, hydrogen chloride adds to acetylene, giving 2-chloro-l,3-butadiene [126-99-8], chloroprene, C4H5C1, the monomer for
neoprene rubber.
HC=CCH=CH2 + HC1 CH2=CC1CH=CH2
Manufacture via this process has been completely replaced by chlorination of butadiene (3) (see Chlorocarbons and chlorohydrocarbons, chloroprene;
Elastop^rs, synthetic, polychloroprene).
Vinyl Chloride and Vinylidene Chloride. In the presence of mercuric salts, hydrogen chloride adds to acetylene giving vinyl chloride
[75-01-4], C2H3C1.
HC=CH + HC1 CH2=CHC1
Once the principal route to vinyl chloride, in all but a few percent of current U.S. capacity this has been replaced by dehydrochlorination of ethylene
dichloride. A combined process in which hydrogen chloride cracked from ethylene dichloride was added to acetylene was advantageous but it is rarely used
because processes to oxidize hydrogen chloride to chlorine with air or oxygen are cheaper (7) (see Vinyl polymers).
In similar fashion, vinylidene chloride [75-35-4], C2H2C12, has been prepared by successive chlorination and dehydrochlorination of vinyl chloride
(see Vinylidene cwdride monop^rand polyt^rs).
CH2=CHC1 + Cl2 CH2C1CHC12
CH2C1CHC12 CH2=CC12 + HC1
Vinyl Fluoride. Vinyl fluoride [75-02-5], C2H3F, the monomer for poly(vinyl fluoride), is manufactured by addition of hydrogen fluoride to
acetylene (see Fluorine compounds, organic, poly(vinyl fluoride)).
HC=CH + HF CH2=CHF
Ethynylation Reaction Products
Kirk-Othmer Encyclopedia of Chemical Technology (4th Edition)
102
ACETYLENE-DERIVED CHEMICALS
Voll
The name ethynylation was coined by Reppe to describe the addition of acetylene to carbonyl compounds (8).
HC=CH + RCOR' HC=CC(OH) RR'
Although stoichiometric ethynylation of carbonyl compounds with metal acetylides was known as early as 1899 (9), Reppe's contribution was the
development of catalytic ethynylation. Heavy metal acetylides, particularly cuprous acetylide, were found to catalyze the addition of acetylene to aldehydes.
Although ethynylation of many aldehydes has been described (10), only formaldehyde has been catalytically ethynylated on a commercial scale. Copper
acetylide is not effective as catalyst for ethynylation of ketones. For these, and for higher aldehydes, alkaline promoters have been used.
The following series of reactions illustrates the manufacture of the principal Reppe acetylene chemicals.
HC=CH + 1 or 2 HCHO HC=CCH2OH + HOCH2C=CCH2OH
propargyl alcohol 2 —butyne —1,4 —diol
IIOOI/' ('('11,01111, • IIO('II,('II=CHCH2OH
2 —butene —1,4—diol
11 O<' 11, ('('(' 11,011 + 2 H2 -I IO<' 11,(' 11,( 'I l,(' 11,011
1,4 —butanediol
,OS
HOCH2CH2CH2CH2OH ---- < C=O + 2 H2
g-butyrolactone
О + RNH2
+ H2O
2-pyrrolidinone (R = H)
1-methyl-2-pyrrolidinone (R = CH3)
H
I
CH=CH2
:=О + НС ^CH
A/-vinyl-2-pyrrolidinone
Except for the pyrrolidinones (see Pyrrole and pyrrole derivatives), these products are discussed in the following.
Propargyl Alcohol. Propargyl alcohol [107-19-7]\ 2-propyn-l-ol, C3H4O, is the only commercially available acetylenic primary alcohol. A
colorless, volatile liquid, with an unpleasant odor that has been described as "mild geranium," it was first prepared in 1872 from P-bromoallyl alcohol (11).
Propargyl alcohol is miscible with water and with many organic solvents. Physical properties are listed in Table 1.
Table 1. Physical Properties of Propargyl Alcohol
Property Value
melting point, °C -62
boiling point, °C 114
specific gravity, 0.948
refractive index, #20D 1.4310
viscosity at 20°C, mPa-s (=cP) 1.65
dielectric constant, 8 24.5
specific heat, C20^, J/(g-K)a 2.577
heat of combustion at constant vol, kJ /mol 1731
heat of vaporization at 112°C, kJ/mol 42.09
flash point, Tagliabue open cup, °C 36
Vapor pressure data
Temperature, °C Vapor pressure, kPa Temperature, °C Vapor pressure, kPa
20 1.55 80 29.7
30 2.80 90 43.6
40 4.80 100 63.3
50 7.87 110 88.7
60 12.8 114 101.3
70 19.9
Azeotropes
Other component Other component, mol% bp, °C
water 79.8 97
benzene 87.2 78
To convert J / (g-K) to cal/(g-°C) divide by 4.184.
To convert kJ /mol to kcal/mol divide by 4.184.
To convert kPa to mm Hg (torr) multiply by 7.5.
Reactions. Propargyl alcohol has three reactive sites—a primary hydroxyl group, a triple bond, and an acetylenic hydrogen—making it an
extremely versatile chemical intermediate.
The hydroxyl group can be esterified with acid chlorides, anhydrides, or carboxylic acids and it reacts with aldehydes (12) or vinyl ethers (13) in the
presence of an acid catalyst to form acetals.
Kirk-Othmer Encyclopedia of Chemical Technology (4th Edition)
103
ACETYLENE-DERIVED CHEMICALS
Voll
RCHO 2 IK' ('('II ,011 R('II(O('II,(' ('IIR +H20
ch2=chor + hc =cch2oh —► CH3CHOCH2C =CH
OR
At low temperatures, oxidation with chromic acid gives propynal [624-67-9]> C3H2O (14), or propynoic acid [471-25-0]) C3H2O2 (15), which can also be
prepared in high yields by anodic oxidation (16).
HC=CCH2OH HC=CCHO
HC=CCH2OH HC=CCOOH
Various halogenating agents have been used to replace hydroxyl with chlorine or bromine. Phosphorus trihalides, especially in the presence of
pyridine, are particularly suitable (17,18). Propargyl iodide is easily prepared from propargyl bromide by halogen exchange (19).
Hydrogenation gives allyl alcohol [107-18-6]) C3H6O, its isomer propanal [123-38-6] (20), or propanol, C3HgO [71-23-8] (21). With acidic mercuric
salt catalysts, water adds to give acetol, hydroxyacetone, C3H6O2 [116-09-6] (22).
HC=CCH20H + H20 CH3COCH2OH
Using alcohols instead of water under similar conditions gives cyclic ketals (23), which can be hydrolyzed to acetol.
H3C p— H2c /OR
2 HC=CCH2OH+ 2 ROH -Д Д
RO7 CH2—О CH3
Halogens add stepwise, giving almost exclusively dihaloallyl alcohols (24,25).
HC=CCH2OH + X2 CHX=CXCH2OH
A second mole of halogen adds with greater difficulty; oxidative side reactions can be minimized by halogenating an ester instead of the free alcohol (26).
(HC=CCH2O)3PO +6 Br2 (HCBr2CBr2CH2O)3PO
With mercuric salt catalysts, hydrogen chloride adds to give 2-chloroallyl alcohol, 2-chloroprop-2-en-l-ol [5976-47-6] (2T).
HC=CCH20H + HC1 CH2=CC1CH2OH
In the presence of suitable nickel or cobalt complexes, propargyl alcohol trimerizes to a mixture of 1,3,5-benzenetrimethanol [4464-18-0] and
1,2,4-trimethanol [25147-76-6] benzene (28).
3 HC=CCH2OH
Cyclization with various nickel complex catalysts gives up to 97% selectivity to a mixture of cyclooctatetraene derivatives, with only 3% of benzene
derivatives. The principal isomer is the symmetrical l,3,5,7-cyclooctatetraene-l,3,5,7-tetramethanol (29).
4 HC=CCH2OH
CHoOH
HOH2C
CH2OH
CH2OH
Nickel halide complexes with amines give mixtures of linear polymer and cyclic trimers (30). Nickel chelates give up to 40% of linear polymer (31).
When heated with ammonia over cadmium calcium phosphate catalysts, propargyl alcohol gives a mixture of pyridines (32).
In the presence of copper acetylide catalysts, propargyl alcohol and aldehydes give acetylenic glycols (33). When dialkylamines are also present,
dialkylaminobutynols are formed (34).
OH
I
HC=CCH2OH + RCHO —► rchc=cch2oh
11 ('('(' 11,011 + HCHO + R2NH li ,.\( 'I I K ' ('('11,011 + H20
With two equivalents of an organomagnesium halide, a Grignard reagent is formed, capable of use in further syntheses (35,36). Cuprous salts
catalyze oxidative dimerization of propargyl alcohol to 2,4-hexadiyne-l,6-diol [3031-68-3] (37).
2 11 ('('(' 11,011 ) (0 ' I Ю< 'I I K '('('('('I I ,Ol I + H20
Manufacture. Propargyl alcohol is a by-product of butynediol manufacture. The original high pressure butynediol processes gave about 5% of
the by-product; newer lower pressure processes give much less. Processes have been described that give much higher proportions of propargyl alcohol
(38,39).
Shipment, Storage, and Price. Propargyl alcohol is available in tank cars, tank trailers, and drums. It is usually shipped in unlined steel
containers and transferred through standard steel pipes or braided steel hoses; rubber is not recommended. Clean, rust-free steel is acceptable for
short-term storage. For longer storage, stainless steel (types 304 and 316), glass lining, or phenolic linings (Lithcote LC-19 and LC-24, Unichrome B-124,
and Heresite) are suitable. Aluminum, epoxies, and epoxy-phenolics should be avoided.
The 1991 U.S. bulk price for propargyl alcohol was about $5.64/kg.
Specifications and Analytical Methods. The commercial material is specified as 97% minimum purity, determined by gas
chromatography or acetylation. Moisture is specified at 0.05% maximum (Kad-Fischer titration). Formaldehyde content is determined by bisulfite titration.
Kirk-Othmer Encyclopedia of Chemical Technology (4th Edition)
104
ACETYLENE-DERIVED CHEMICALS
Voll
Health and Safety Factors. Although propargyl alcohol is stable, violent reactions can occur in the presence of contaminants, particularly at
elevated temperatures. Heating in undiluted form with bases or strong acids should be avoided. Weak acids have been used to stabilize propargyl alcohol
prior to distillation. Since its flash point is low, the usual precautions against ignition of vapors should be observed.
Propargyl alcohol is a primary skin irritant and a severe eye irritant and is toxic by all means of ingestion; all necessary precautions must be taken to
avoid contact with liquid or vapors. The LD50 is 0.07 mL/kg for white rats and 0.06 mL/kg for guinea pigs.
Uses. Propargyl alcohol is a component of oil-well acidizing compositions, inhibiting the attack of mineral acids on steel (see Corrosion and
corrosion control). It is also employed in the pickling and plating of metals.
It is used as an intermediate in preparation of the miticide Omite [2312-3 5-8]> 2-(4,-^/T‘-butylphenoxy)cyclohexyl 2-propynyl sulfite (40); sulfadiazine
[68-35-9] (41); and halogenated propargyl carbonate fungicides (42).
Butynediol. Butynediol, 2-butyne-l,4-diol, [110-65-6] was first synthesized in 1906 by reaction of acetylene bis(magnesium bromide) with
paraformaldehyde (43). It is available commercially as a crystalline solid or a 35% aqueous solution manufactured by ethynylation of formaldehyde. Physical
properties are listed in Table 2.
Table 2. Physical Properties of Butynediol, Butenediol, and Butanediol
Property Butynediol Butenediol Butanediol
molecular formula C4H6O2 C4HgO2 C4H10O2
CAS Registry Number [110-65-6] [110-64-5] [110-63^4]
melting point, °C 58 11.8 20.2
boiling point, °C at kPaa
0.133 101 84 86
1.33 141 122 123
13.3 194 176 171
101.3 248 234 228
specific gravity < = 1.114 d?I = 1.070 < = 1.017
refractive index #25D a = 1.4bU A U.UU2 1.4770 1.4445
/3 = 1.528 ± 0.002
heat of combustion, kJ /mol 2204
flash point, Tagliabue open cup, °C 152 128 121
viscosity at 20°C, mPa-s (=cP) 22 84.9
at 38°C 10.8
at 99°C 2.5
surface tension at 20°C, mN/m (=dyn cm) 44.6
dielectric constant at 20°C, 8 31.5
solubility, g/100 mL solvent at 25°C
water (0°C) 2
water 374 miscible
ethanol 83 miscible
acetone 70 miscible
ether 2.6 3.1
benzene 0.04 0.3
hexane <0.1
To convert kPa, to mm Hg, multiply by 7.5.
At constant volume.
To convert kJ to kcal, divide by 4.184.
Reactions. Butynediol undergoes the usual reactions of primary alcohols. Because of its rigid, linear structure, many reactions forming cyclic
products from butanediol or tvTbutenediol give only polymers with butynediol.
Both hydroxyl groups can be esterified normally (44). The monoesters are readily prepared as mixtures with diesters and unesterified butynediol, but
care must be taken in separating them because the monoesters disproportionate easily (45).
The hydroxyl groups can be alkylated with the usual alkylating agents. To obtain aryl ethers a reverse treatment is used, such as treatment of
butynediol toluenesulfonate or dibromobutyne with a phenol (44). Alkylene oxides give ether alcohols (46).
In the presence of acid catalysts, butynediol and aldehydes (47) or acetals (48) give polymeric acetals, useful intermediates for acetylenic
polyurethanes suitable for high energy solid propellants.
HOCH2C=CCH2OH + CH2O HO(CH2C=CCH2OCH2O) H
2 2'2 \ 2 2 2 / n
Electrolytic oxidation gives acetylene dicarboxylic acid [142-45-0] (2-butynedioic acid) in good yields (49); chromic acid oxidation gives poor yields
(50). Oxidation with peroxyacetic acid gives malonic acid [141-82-2] (qv) (51).
Butynediol can be hydrogenated partway to butenediol or completely to butanediol.
HOCH2C=CCH2OH HOCH2CH=CHCH2OH HOCH2CH2CH2CH2OH
Dichlorobutyne [821-10-3] and dibromobutyne [2219-66-1] are readily prepared by treatment with thionyl or phosphorus halides. The less-stable
diiodobutyne is prepared by treatment of dichloro- or dibromobutyne with an iodide salt (52).
Addition of halogens proceeds stepwise, sometimes accompanied by oxidation. Iodine forms 2,3-diiodo-2-butene-l,4-diol (53). Depending on
conditions, bromine gives 2,3-dibromo-2-butene-l,4-diol, 2,2,3,3-tetrabromobutane-l,4-diol, mucobromic acid, or
2-hydroxy-3,3,4,4-tetrabromotetrahydrofuran (54). Addition of chlorine is attended by more oxidation (55—57), which can be lessened by esterification of
the hydroxyl groups.
Uncatalyzed addition of hydrochloric acid is accompanied by replacement of one hydroxyl group, giving high yields of 2,4-dichloro-2-buten-l-ol
(58); with mercuric or cupric salt catalysts, addition occurs without substitution (59,60).
HOCH2C=CCH2OH + 2 HC1 C1CH2CH=CC1CH2OH + H2O
HOCH2C=CCH2OH ----> “lyst HOCH2CC1=CHCH2OH --Catalyst HOCH2CC12CH2CH2OH
When aqueous solutions of sodium bisulfite are heated with butynediol, one or two moles add to the triple bond, forming sodium salts of sulfonic
acids (61).
Kirk-Othmer Encyclopedia of Chemical Technology (4th Edition)
105
ACETYLENE-DERIVED CHEMICALS
Voll
In the presence of mercuric salts, butynediol rapidly isomerizes to l-hydroxy-3-buten-2-one (62).
HOCH2C =CCH2OH —*CH2=CHCCH2OH
This adds compounds with active hydrogen such as water, alcohols, and carboxylic acids (63), to give l,4-dihydroxy-2-butanone or its derivatives.
О о
II II
CH2=CHCCH2OH + H2O ------- НОСН2СН2ССН2ОН
Butynediol is more difficult to polymerize than propargyl alcohol, but it cyclotrimerizes to hexamethylolbenzene [2715-91 -5] (benzenehexamethanol)
with a nickel carbonyl—phosphine catalyst (64); with a rhodium chloride—arsine catalyst a yield of 70% is claimed (65).
When heated with acidic oxide catalysts, mixtures of butynediol with ammonia or amines give pyrroles (66) (see Pyrrole and pyrrole derivatives).
HOCH2C =CCH2OH + rnh2 --► |l J
N
I
R
Manufacture. All manufacturers of butynediol use formaldehyde ethynylation processes. The earliest entrant was BASF, which, as successor to
I. G. Farben, continued operations at Ludwigshafen, FRG, after World War II. Later BASF also set up a U.S. plant at Geismar, La. The first company to
manufacture in the United States was GAF in 1956 at Calvert City, Ky., and later at Texas City, Tex., and Seadrift, Tex. The most recent U.S. manufacturer
is Du Pont, which went on stream at La Porte, Tex., about 1969. Joint ventures of GAF and Hbls in Mad, Germany, and of Du Pont and Idemitsu in
Chiba, Japan, are the newest producers.
At the end of Wodd War II the butynediol plant and process at Ludwigshafen were studied extensively (67,68). Variations of the original high
pressure, fixed-bed process, which is described below, are still in use. However, all of the recent plants use low pressures and suspended catalysts (69—75).
The hazards of handling acetylene under pressure must be considered in plant design and construction. Although means of completely preventing
acetylene decomposition have not been found, techniques have been developed that prevent acetylene decompositions from becoming explosive. The
original German plant was designed for pressures up to 20.26 MPa (200 atm), considered adequate for deflagration (nonexplosive decomposition), which
could increase pressures approximately 10-fold. It was not practical to design for control of a detonation (explosive decomposition), which could increase
pressure nearly 200-fold (76).
The reactors were thick-walled stainless steel towers packed with a catalyst containing copper and bismuth oxides on a siliceous carrier. This was
activated by formaldehyde and acetylene to give the copper acetylide complex that functioned as the true catalyst. Acetylene and an aqueous solution of
formaldehyde were passed together through one or more reactors at about 90—100°C and an acetylene partial pressure of about 500—600 kPa (5—6 atm)
with recycling as required. Yields of butynediol were over 90%, in addition to 4—5% propargyl alcohol.
Shipment, Storage, and Price. Butynediol, 35% solution, is available in tank cars, tank trailers, and drums. Stainless steel, nickel, aluminum,
glass, and various plastic and epoxy or phenolic liners have all been found satisfactory. Rubber hose is suitable for transferring. The solution is
nonflammable and freezes at about — 5°C.
Butynediol solid flakes are packed in polyethylene bags inside drums. The product is hygroscopic and must be protected from moisture.
In 1991, U.S. prices were about $4.63/kg for solid butynediol and about $1.40/kg for the 35% aqueous solution.
Specifications and Analytical Methods. The commercial aqueous solution is specified as 34% minimum butynediol, as determined by
bromination or refractive index. Propargyl alcohol is limited to 0.2% and formaldehyde to 0.7%.
The commercial flake is specified as 96.0% minimum butynediol content, with a maximum of 2.0% moisture. Purity is calculated from the freezing
point (at least 52°C).
Health and Safety Factors. Although butynediol is stable, violent reactions can take place in the presence of certain contaminants,
particularly at elevated temperatures. In the presence of certain heavy metal salts, such as mercuric chloride, dry butynediol can decompose violendy.
Heating with strongly alkaline materials should be avoided.
Butynediol is a primary skin irritant and sensitizer, requiring appropriate precautions. Acute oral toxicity is relatively high: LD^ is 0.06 g/kg for white
rats.
Uses. Most butynediol produced is consumed by the manufacturers in manufacture of butanediol and butenediol. Small amounts are converted
to ethers with ethylene oxide.
Butynediol is principally used in pickling and plating baths. Small amounts are used in the manufacture of brominated derivatives, useful as flame
retardants. Itwas formerly used in awild oat herbicide, Carbyne (Barban), 4-chloro-2-butynyl-IV-(3-chlorophenyl)carbamate [101 -27-9]> C11H9C12NO2 (77).
Butenediol. 2-Butene-l,4-diol [110-64-5] is the only commercially available olefinic diol with primary hydroxyl groups. The commercial product
consists almost entirely of the cis isomer.
/n7/w-2-Butene-l,4-diol diacetate was prepared from l,4-dibromo-2-butene in 1893 (78) and hydrolyzed to the diol in 1926 (79). The original
preparation of the cis diol utilized the present commercial route, partial hydrogenation of butynediol.
Physical properties are listed in Table 2. Butenediol is very soluble in water, lower alcohols, and acetone. It is nearly insoluble in aliphatic or aromatic
hydrocarbons.
Reactions. In addition to the usual reactions of primary hydroxyl groups and of double bonds, rit-butenediol undergoes a number of
cyclization reactions.
The hydroxyl groups can be esterified normally: the interesting diacrylate monomer (80) and the biologically active haloacetates (81) have been
prepared in this manner. Reactions with dibasic acids have given polymers capable of being cross-linked (82) or suitable for use as soft segments in
polyurethanes (83). Polycarbamic esters are obtained by treatment with a diisocyanate (84) or via the bischloroformate (85).
HOCH2CH =CHCH2OH + R(NCO)2 —► H(OC4H6OC —NHRNHC —)nOC4H6OH
HOCH2CH =CHCH2OH + COCI2 —CIOCH2CH =CHCH2OCCI+
о о
II II
H2NRNH(COC4H6OCNHRNH)n H
The hydroxyl groups can be alkylated in the usual manner. Hydroxyalkyl ethers may be prepared with alkylene oxides and chloromethyl ethers by
reaction with formaldehyde and hydrogen chloride (86). The terminal chlorides can be easily converted to additional ether groups.
Kirk-Othmer Encyclopedia of Chemical Technology (4th Edition)
106
ACETYLENE-DERIVED CHEMICALS
Voll
HOCH2CH=CHCH2OH + HCHO + HC1
C1CH2OCH2CH=CHCH2OCH2C1 ------->NaOR ROCH2OCH2CH=CHCH2OCH2OR
ш-Butenediol reacts readily with aldehydes (87), vinyl ethers (88), or dialkoxyalkanes (89) in the presence of acidic catalysts to give seven-membered
cyclic acetals (4,7-dihydro-l,3-dioxepins).
HOCH2CH =CHCH2OH + RCHO —RCHOCH2CH =CHCH26 + H2O
HOCH2CH =CHCH2OH + ROCH =CH2 ---* CH3CHOCH2CH =CHCH26 + ROH
HOCH2CH =CHCH2OH + RR'C(OR")2 —RR'COCH2CH =CHCH2O + R"OH
The hydroxyl groups of butenediol are replaced by halogens by treatment with thionyl chloride or phosphorus tribromide (90,91); by stopping short
of total halogenation, mixtures can be obtained containing 4-halobutanols as the major constituent (92). The hydroxyl groups undergo typical allylic
reactions such as being replaced by cyanide with cuprous cyanide as catalyst (93).
With a palladium chloride catalyst, butenediol is carbonylated by carbon monoxide, giving 3-hexenedioic acid [4436-74-2], C6HgO4 (94).
HOCH2CH=CHCH2OH + 2 CO HOOCCH2CH=CHCH2COOH
An early attempt to hydroformylate butenediol using a cobalt carbonyl catalyst gave tetrahydro-2-furanmethanol (95), presumably by allylic rearrangement
to 3-butene-l,2-diol before hydroformylation. Later, hydroformylation of butenediol diacetate with a rhodium complex as catalyst gave the acetate of
3-formyl-3-buten-l-ol (96). Hydrogenation in such a system gave 2-methyl-l,4-butanediol (97).
Heating with cuprous chloride in aqueous hydrochloric acid isomerizes 2-butene-l,4-diol to 3-butene-l,2-diol (98)] Various hydrogen-transfer
catalysts isomerize it to 4-hydroxybutyraldehyde [25714-71 -0], C4HgO2 (99), acetals of which are found as impurities in commercial butanediol and
butenediol.
HOCH2CH=CHCH2OH HOCH2CH2CH2CHO
Treatment with acidic catalysts dehydrates V'-butenediol to 2,5-dihydrofuran [1708-29-8]', CALO (100). Cupric (101) or mercuric (102) salts give
2,5-divinyl-l,4-dioxane [21485-51-8], presumably via 3-butene-l,2-diol.
HOCH2CH =CHCH2OH
2 HOCH2CH =CHCH2OH
CH=CH2
Mixtures of butenediol and ammonia or amines cyclize to pyrrolines when heated with acidic catalysts (66).
HOCH2CH =CHCH2OH + rnh2
Halogens add to butenediol, giving 2,3-dihalo-l,4-butanediol (90,91). In a reaction typical of allylic alcohols, hydrogen halides cause substitution of
halogen for hydroxyl (103).
When butenediol is treated with acidic dichromate solution, dehydration and oxidation combine to give a high yield of furan [110-00-9], C4H4O2
(104) (see Furan derivatives).
Treatment with hydrogen peroxide converts butenediol to 2,3-epoxy-l,4-butanediol (105) or gives hydroxylation to erythritol [149-32-6], C4H1QO4
(106). Under strongly acidic conditions, tetrahydro-3,4-furanediol is the principal product (107).
о
HOCH2CH —CHCH2OH
HOCH2CH =CHCH2OH
--* HOCH2CHOHCHOHCH2OH
ъ
HOZ OH
Butenediol is a weak dienophile in Diels-Alder reactions. Adducts have been described with anthracene (108) and with hexachlorocyclopentadiene
(109).
Butenediol does not undergo free-radical polymerization. A copolymer with vinyl acetate can be prepared with a low proportion of butenediol (110).
Manufacture. Butenediol is manufactured by partial hydrogenation of butynediol. Although suitable conditions can lead to either cis or trans
isomers (111), the commercial product contains almost exclusively rif-2-butene-l,4-diol Trans isomer, available at one time by hydrolysis of
l,4-dichloro-2-butene, is unsuitable for the major uses of butenediol involving Diels-Alder reactions. The liquid-phase heat of hydrogenation of butynediol
to butenediol is 156 kJ/mol (37.28 kcal/mol) (112).
The original German process used either carbonyl iron or electrolytic iron as hydrogenation catalyst (113). The fixed-bed reactor was maintained at
50—100°C and 20.26 MPa (200 atm) of hydrogen pressure, giving a product containing substantial amounts of both butynediol and butanediol. Newer,
more selective processes use more active catalysts at lower pressures. In particular, supported palladium, alone (49) or with promoters (114,115), has been
found useful.
Shipment, Storage, and Price. Butenediol is available in unlined steel tank cars, tank trailers, and various sized drums. Because of its
relatively high freezing point, tank cars are fitted with heating coils. The 1991 U.S. bulk price of technical grade butenediol was about $5.36 /kg.
Specifications and Analytical Methods. Purity is determined by gas chromatography. Technical grade butenediol, specified at 95%
Kirk-Othmer Encyclopedia of Chemical Technology (4th Edition)
107
ACETYLENE-DERIVED CHEMICALS
Voll
minimum, is typically 96—98% butenediol. The cis isomer is the predominant constituent; 2—4% is trans.
Principal impurities are butynediol (specified as 2.0% maximum, typically less than 1%), butanediol, and the 4-hydroxybutyraldehyde acetal of
butenediol. Moisture is specified at 0.75% maximum (Kad-Fischer titration). Typical technical grade butenediol freezes at about 8°C.
Health and Safety Factors. Butenediol is noncorrosive and stable under normal handling conditions. It is a primary skin irritant but not a
sensitizer; contact with skin and eyes should be avoided. It is much less toxic than butynediol. The LD50 is 1.25 mL/kg for white rats and 1.25—1.5 mL/kg
for guinea pigs.
Uses. Butanediol is used to manufacture the insecticide Endosulfan, other agricultural chemicals, and pyridoxine (vitamin B6) (see Vitamins)
(116). Small amounts are consumed as a diol by the polymer industry.
Butanediol. 1,4-Butanediol [110-63-4]., tetramethylene glycol, 1,4-butylene glycol, was first prepared in 1890 by acid hydrolysis of
-dinitro-l,4-butanediamine (117). Other early preparations were by reduction of succinaldehyde (118) or succinic esters (119) and by saponification of
the diacetate prepared from 1,4-dihalobutanes (120). Catalytic hydrogenation of butynediol, now the principal commercial route, was first described in 1910
(121). Other processes used for commercial manufacture are described in the section on Manufacture. Physical properties of butanediol are listed in Table
2.
Reactions. The chemistry of butanediol is determined by the two primary hydroxyls. Esterification is normal. It is advisable to use nonacidic
catalysts for esterification and transesterification (122) to avoid cyclic dehydration. When carbonate esters are prepared at high dilutions, some cyclic ester is
formed; more concentrated solutions give a polymeric product (123). With excess phosgene the useful bischloroformate can be prepared (124).
HO(CH2)4OH + COCI2
+ H[O(CH2)4OC]nOH
о о
II II
HO(CH2)4OH + 2 COCI2 ------ CICO(CH2)4OCCI
Ethers are formed in the usual way (125). The bischloromethyl ether is obtained using formaldehyde and hydrogen chloride (86).
HO(CH2)4OH + 2HCHO + 2HC1 C1CH2O(CH2)4OCH2C1 + 2H2O
With aldehydes or their derivatives, butanediol forms acetals, either 7-membered rings (1,3-dioxepanes) or linear polyacetals; the rings and chains are
easily intraconverted (126,127).
HO(CH2)4OH + RCHO
+ H[O(CH2)4OCHR]nOH
Heating butanediol with acetylene in the presence of an acidic mercuric salt gives the cyclic acetal expected from butanediol and acetaldehyde (128).
A commercially important reaction is with diisocyanates to form polyurethanes (129) (see Urethane polymers).
О о
II II
HO(CH2)4OH + R(NCO)2 ----- H[O(CH2)4OCNHRNHC]nO(CH2)4OH
Thionyl chloride readily converts butanediol to 1,4-dichlorobutane [110-56-5] (130) and hydrogen bromide gives 1,4-dibromobutane [110-52-1]
(131). A procedure using 48% HBr with a Dean-Stark water trap gives good yields of 4-bromobutanol [33036-62-3]^ free of diol and dibromo compound
(132).
With various catalysts, butanediol adds carbon monoxide to form adipic acid. Heating with acidic catalysts dehydrates butanediol to tetrahydrofuran
[109-99-9]\ C4HgO (see Furan derivatives). With dehydrogenation catalysts, such as copper chromite, butanediol forms butyrolactone (133). With certain
cobalt catalysts both dehydration and dehydrogenation occur, giving 2,3-dihydrofuran (134).
HO(CH2)4OH
-H2o
HO(CH2)4OH
-H9O, +H2 S'
HO(CH2)4OH > \ //
Heating butanediol or tetrahydrofuran with ammonia or an amine in the presence of an acidic heterogeneous catalyst gives pyrrolidines (135,136).
With a dehydrogenation catalyst, one or both of the hydroxyl groups are replaced by amino groups (137).
HO(CH2) 4 OH + R2NH -^mixture of R2N(CH2) 4OH and R2N(CH2)4NR2
With an acidic catalyst, butanediol and hydrogen sulfide give tetrahydrothiophene [110-01 -0]> CATS (138).
HO(CH2)4OH + H2S —► \]
Vapor-phase oxidation over a promoted vanadium pentoxide catalyst gives a 90% yield of maleic anhydride [108-31-6] (139). Liquid-phase oxidation
with a supported palladium catalyst gives 55% of succinic acid [110-15-6] (140).
Manufacture. Most butanediol is manufactured in Reppe plants via hydrogenation of butynediol. Recendy an alternative route involving
acetoxylation of butadiene has come on stream and, more recently, a route based upon hydroformylation of allyl alcohol. Worldwide butanediol capacity
has climbed steadily for many years. In 1990 it was estimated to be 428,000 metric tons (141), as compared to a little more than 70,000 metric tons in 1975
Kirk-Othmer Encyclopedia of Chemical Technology (4th Edition)
108
ACETYLENE-DERIVED CHEMICALS
Voll
(142,143). Table 3 lists the manufacturers of butanediol, their locations, and the processes used.
Table 3. Butanediol Manufacturers
Manufacturer Location(s) Manufacturing process
BASF Germany and U.S. Reppe
Du Pont U.S. Reppe
GAF U.S. Reppe
GAF-Hbls Germany Reppe
Du Pont—Idemitsu Japan Reppe
Mitsubishi Kasei Japan acetoxylation
ARCO U.S. hydroformylation
Another process, involving chlorination of butadiene, hydrolysis of the dichlorobutene, and hydrogenation of the resulting butenediol, was practiced
by Toyo Soda in Japan until the mid-1980s (144).
Reppe Process
lie ('ll + 2HCH0 IIO('II,(' ('('11,011 IIO('II ,('II ,(Ш2СШ20Н
Acetoycylatlon Process
Acetoxylation Process
o2
H2C =CHCH =CH2 + 2 СНзСООН
О О
Л1 . 1Л. . л hydrogenation hydrolysis , 1ЛЛ1 , Л1 , Л1 , . Л1 ,
СНзСОСН2СН —СНСН2ОССНз + Н20 -----------------------►----------** НОСН2СН2СН2СН2ОН
Hydroformylation Process
Acetoxylation Process
o2
H2C =CHCH =CH2 + 2 СНзСООН
О О
Л1 . 1Л. . . . . х^ hydrogenation hydrolysis , 1ЛЛ1 , Л1 , Л1 , ,
СНзСОСН2СН —СНСН2ОССНз + Н20 -----------------------*---------** НОСН2СН2СН2СН2ОН
Shipment, Storage, and Price. Tank cars and tank trailers, selected to prevent color formation, are of aluminum or stainless steel, or lined
with epoxy or phenolic resins; drums are lined with phenolic resins. Flexible stainless steel hose is used for transfer. Because of butanediol's high freezing
point (about 20°C) tank car coil heaters are provided. The U.S. list price for bulk quantities in 1991 was about $2.18/kg, but heavy discounting was
prevalent for large contracts.
Specifications and Analytical Methods. Butanediol is specified as 99.5% minimum pure, determined by gas chromatography (gc),
solidifying at 19.6°C minimum. Moisture is 0.04% maximum, determined by Kad-Fischer analysis (direcdy or of a toluene azeotrope). The color is APHA 5
maximum, and the Hardy color (polyester test) is APHA 200 maximum. The carbonyl number is 0.5 mg KOH/g maximum; the acetal content can also be
measured direcdy by gc.
Health and Safety Factors. Butanediol is much less toxic than its unsaturated analogs. It is neither a primary skin irritant nor a sensitizer.
Because of its low vapor pressure, there is ordinarily no inhalation problem. As with all chemicals, unnecessary exposure should be avoided. The LD50 for
white rats is 1.55 g/kg.
Uses. The largest uses of butanediol are internal consumption in manufacture of tetrahydrofuran and butyrolactone (145). The largest merchant
uses are for poly(butylene terephthalate) resins (see Polyesters,thermoplastic) and in polyurethanes, both as a chain extender and as an ingredient in a
hydroxyl-terminated polyester used as a macroglycol. Butanediol is also used as a solvent, as a monomer for various condensation polymers, and as an
intermediate in the manufacture of other chemicals.
Butyrolactone. y-Butyrolactone [96-48-0], dihydro-2(3H)-furanone, was first synthesized in 1884 via internal esterification of 4-hydroxybutync
acid (146). In 1991 the principal commercial source of this material is dehydrogenation of butanediol. Manufacture by hydrogenation of maleic anhydride
(147) was discontinued in the early 1980s and resumed in the late 1980s. Physical properties are listed in Table 4.
Table 4. Physical Properties of Butyrolactone
Property Value
freezing point, °C -44
boiling point, °C at kP:i 0.133 1.33 13.3 101.3 specific gravity, A4 refractive index, #20D n2b n D viscosity at 25°C, mPa-s (=cP) dielectric constant at 20°C, 8 heat capacity at 20°C, J/(g-K)b critical temperature, °C critical pressure, MPa flash point, Tagliabue open cup, °C 35 77 134 204 1.129 1.125 1.4362 1.4348 1.75 39.1 1.60 436 3.43 98
Kirk-Othmer Encyclopedia of Chemical Technology (4th Edition)
109
ACETYLENE-DERIVED CHEMICALS
Voll
a To convert kPa to mm Hg multiply by 7.5.
To convert J to cal divide by 4.184.
To convert MPa to atm divide by 0.1013.
Butyrolactone is completely miscible with water and most organic solvents. It is only slightly soluble in aliphatic hydrocarbons. It is a good solvent
for many gases, for most organic compounds, and for a wide variety of polymers.
Reactions. Butyrolactone undergoes the reactions typical of y-lactones. Particularly characteristic are ring openings and reactions in which ring
oxygen is replaced by another heteroatom. There is also marked reactivity of the hydrogen atoms alpha to the carbonyl group.
Hydrolysis in neutral aqueous solutions proceeds slowly at room temperature and more rapidly at acidic conditions and elevated temperatures. The
hydrolysis—esterification reaction is reversible. Under alkaline conditions hydrolysis is rapid and irreversible. Heating the alkaline hydrolysis product at
200—250°C gives 4,4'-oxydibutyric acid [7423-25-8] after acidification (148).
+ NaOH
---► HO(CH2)3COONa
heat
O(CH2CH2CH2COOH)2
With acid catalysts, butyrolactone reacts with alcohols rapidly even at room temperature, giving equilibrium mixtures consisting of esters of
4-hydroxybutyric acid [591-81-1] with unchanged butyrolactone as the main component. Attempts to distill such mixtures ordinarily result in complete
reversal to butyrolactone and alcohol. The esters can be separated by a quick flash distillation at high vacuum (149).
+ ROH HO(CH2)4COOR
When butyrolactone and alcohols are heated for long times and at high temperatures in the presence of acidic catalysts, 4-alkoxybutyric esters are
formed. With sodium alkoxides, sodium 4-alkoxybutyrates are formed (150).
О
+ 2 ROH
---- RO(CH2)3COOR + H2O
+ NaOR
---► RO(CH2)3COONa
Butyrolactone and hydrogen sulfide heated over an alumina catalyst result in replacement of ring oxygen by sulfur (151).
Heating butyrolactone with bromine at 160—170°C gives a 70% yield of CC-bromobutyrolactone (152). With phosphorus tribromide as catalyst,
bromination is accelerated, giving 2,4-dibromobutyric acid, which dehydrobrominates to CC-bromobutyrolactone when distilled (153). Chlorination gives
CC-position monochlorination at 110—130°C and a-dichlorination at 190—200°C (154).
О
BrCH2CH2CHBrCOOH
-HBr
dist.
The CC-methylene group of butyrolactone condenses easily with a number of different types of carbonyl compounds; eg, sodium alkoxides catalyze
self-condensation to CC-dibutyrolactone (155), benzaldehyde gives CC-benzylidenebutyrolactone (156), and ethyl acetate gives CC-acetobutyrolactone (157).
XC4
C6H5CH =c о
.qXC=O + CH3COOC2H5
—|—c—CH3
o'c=o
The Ct-acetobutyrolactone, with or without isolation, can be used in the preparation of various 5-substituted 2-butanone derivatives, presumably by
decarboxylation of the acetoacetic acid obtained by ring hydrolysis. Simple hydrolysis gives 5-hydroxybutan-2-one (158) and acidolysis with hydrochloric
acid gives 5-chlorobutan-2-one in good yields (159).
Kirk-Othmer Encyclopedia of Chemical Technology (4th Edition)
110
ACETYLENE-DERIVED CHEMICALS
Voll
The CC-methylene groups also add to double bonds; eg, 1-decene at 160°C gives up to 80% of CC-decylbutyrolactone (160). With photochemical
initiation similar additions take place at room temperature (161).
I---1 I--1—CH2CH2R
LqxC=O + CH2 =CHR --- kQ^C=O
With Friedel-Crafts catalysts, butyrolactone reacts with aromatic hydrocarbons. With benzene, depending on experimental conditions, either
phenylbutyric acid or 1-tetralone can be prepared (162).
Carbonylation of butyrolactone using nickel or cobalt catalysts gives high yields of glutaric acid [110-94-1J (163).
---HOOC(CH2)3COOH
Frequendy unique and synthetically useful are a series of ring-opening reactions. Butyrolactone and anhydrous hydrogen halides give high yields of
4-halobutyric acids (164). In the presence of alcohols, esters are formed.
---X(CH2)3COOH,
X = CI, Br, or I
Phosgene (165) or thionyl chloride in the presence of an acid catalyst (166) gives good yields of 4-chlorobutyryl chloride. Heating butyrolactone and thionyl
chloride in an alcohol gives good yields of 4-chlorobutyric esters (167).
Butyrolactone with sodium sulfide or hydrosulfide forms 4,4,-thiodibutyric acid (168); with sodium disulfide, the product is 4,4,-dithiodibutyric acid
(169).
---- Sx(CH2CH2CH2COONa),
x= 1 or 2
Salts of thiols (170) or of sulfinic acids (171) react like the alkoxides, giving 4-alkylthio- or 4-alkylsulfono-substituted butyrates. \I ka I i cyanides give
4-cyanobutyrates (172), hydroxylamine gives a hydroxamic acid (173), and hydrazine a hydrazide (174).
О
+ NaCN
---- NC(CH2)3COONa
+ HONH2
---► HO(CH2)3CONHOH
---- HO(CH2)3CONHNH2
Butyrolactone reacts rapidly and reversibly with ammonia or an amine forming 4-hydroxybutyramides (175), which dissociate to the starting
materials when heated. At high temperatures and pressures the hydroxybutyramides slowly and irreversibly dehydrate to pyrrolidinones (176). A
copper-exchanged Y-zeolite (177) or magnesium silicalc (178) is said to accelerate this dehydration.
,CX
О + RNH2 HO(CH2)3CONHR
—R + H2O
Manufacture. Butyrolactone is manufactured by dehydrogenation of butanediol. The butyrolactone plant and process in Germany, as
described after World War II (179), approximates the processes presendy used. The dehydrogenation was carried out with preheated butanediol vapor in a
hydrogen carrier over a supported copper catalyst at 230—250°C. The yield of butyrolactone after purification by distillation was about 90%.
Shipment, Storage, and Price. Butyrolactone is shipped in unlined steel tank cars and plain steel drums. Plain steel, stainless steel,
aluminum, and nickel are suitable for storage and handling; rubber, phenolics, and epoxy resins are not suitable. Butyrolactone is hygroscopic and should
be protected from moisture. Because of its low freezing point (—44° C), no provision for heating storage vessels is needed.
The U.S. bulk price in 1991 was about $3.31/kg.
Specifications and Analytical Methods. Purity is specified as 99.5% minimum, by gc area percentage, with a maximum of 0.1% moisture
by Karl-Fischer titration. Color, as delivered, is 40 APHA maximum; samples may darken on long storage.
Health and Safety Factors. Butyrolactone is neither a skin irritant nor a sensitizer; however, it is judged to be a severe eye irritant in white
rabbits. The acute oral LD50 is 1.5 mL/kg for white rats or guinea pigs. Subacute oral feeding studies were carried out with rats and with dogs. At levels up
Kirk-Othmer Encyclopedia of Chemical Technology (4th Edition)
111
ACETYLENE-DERIVED CHEMICALS
Voll
to 0.8% of butyrolactone in the diet there were no toxicologic or pathologic effects in the three months of the test.
Because of its high boiling point (204°C), it does not ordinarily represent a vapor hazard.
Uses. Butyrolactone is principally consumed by the manufacturers by reaction with methylamine or ammonia to produce
A-methri-2-pyrrolidinone [872-50-4] and 2-pyrrolidinone [616-45-5]> C4H7NO, respectively. Considerable amounts are used as a solvent for agricultural
chemicals and polymers, in dyeing and printing, and as an intermediate for various chemical syntheses.
Other Alcohols and Diols
Secondary acetylenic alcohols are prepared by ethynylation of aldehydes higher than formaldehyde. Although copper acetylide complexes will catalyze this
reaction, the rates are slow and the equilibria unfavorable. The commercial products are prepared with alkaline catalysts, usually used in stoichiometric
amounts.
Ethynylation of ketones is not catalyzed by copper acetylide, but potassium hydroxide has been found to be effective (180). In general, alcohols are
obtained at lower temperatures and glycols at higher temperatures. Most processes use stoichiometric amounts of alkali, but true catalytic processes for
manufacture of the alcohols have been described; the glycols appear to be products of stoichiometric ethynylation only.
Table 5 lists the principal commercially available acetylenic alcohols and glycols; Tables 6 and 7 list the physical properties of acetylenic alcohols and
glycols, respectively.
Table 5. Commercial Secondary and Tertiary Acetylenic Alcohols and Glycols
Alcohol or glycol Molecular formula CAS Registry No. Starting material
l-hexyn-3-ol C6H10O [105-31-7] butyraldehyde
4-e thyl-1 - oc tyn-3 - ol CicftgO [5877-42-9] 2-ethylhexanal
2-methyl-3-butyn-2-ol C5H8O [115-19-5] acetone
3 -me thyl-1 -p entyn- 3 - ol C6H10O [77-75-8] methyl ethyl ketone
2,5- dimethyl- 3 -hexyne- 2,5 - diol CgH14O2 [142-30-3] acetone
3,6 - dimethyl-4-о ctyne-3,6 - diol CioH1802 [78-66-0] methyl ethyl ketone
2,4,7,9-tetramethyl-5-decvne-4,7-diola C14H26O2 [126-86-3] methyl isobutyl ketone
These glycols are commercially available as mixtures of diastereoisomers.
Table 6. Physical Properties of Acetylenic Alcohols
Property Hexynol Ethyl-octynol Methyl-butynol Methyl-pentyn ol
molecular weight 98 154 84 98
freezing point, °C -80 -45 2.6 -30.6
boiling point, °C 142 197.2 103.6 121.4
specific gravity, ^°2o 0.882 0.873 0.8672 0.8721
refractive index, #20D 1.4350 1.4502 1.4211 1.4318
viscosity at 20°C, mPa-s (=cP) 3.79 2.65a
flash point, Tagliabue open cup, °C 83 25 38
water solubility (20°C), wt % 3.8 <0.1 miscible 9.9
aAt31°C.
Table 7. Physical Properties of Acetylenic Glycols
Property Dimethyl-hexyned iol Dimethyl- octyn ediol Tetramethyl-decynedi ol
molecular weight 142 170 226
melting point, °C 96-97 49-51 37-38
boiling point, °C 206 222 260
surface tension, mN/m (=dyn cm) 0.1% in water at 25°C 60.9 55.3 31.6
water solubility (20°C), wt % 27.0 10.5 0.12
Methylbutynol. 2-Methyl-3-butyn-2-ol [115-19-5]y prepared by ethynylation of acetone, is the simplest of the tertiary ethynols, and serves as a
prototype to illustrate their versatile reactions. There are three reactive sites, ie, hydroxyl group, triple bond, and acetylenic hydrogen. Although the triple
bonds and acetylenic hydrogens behave similarly in methylbutynol and in propargyl alcohol, the reactivity of the hydroxyl groups is very different.
Reactions. As with other tertiary alcohols, esterification with carboxylic acids is difficult and esters are prepared with anhydrides (181), acid
chlorides (182), or ketene (183). Carbamic esters may be prepared by treatment with an isocyanate (184) or with phosgene followed by ammonia or an
amine (185).
The labile hydroxyl group is easily replaced by treatment with thionyl chloride, phosphorous chlorides, or even aqueous hydrogen halides. At low
temperatures aqueous hydrochloric (186) or hydrobromic (187) acids give good yields of 3-halo-3-methyl-l-butynes. At higher temperatures these
rearrange, first to l-halo-3-methyl-l,2-butadienes, then to the corresponding 1,3-butadienes (188,189).
HC^CC(CH3)2 - HC^CC(CH3)2 ---- XCH=C=C(CH3)2 - XCH=CH—C=CH2
CH3
With acid catalysts in the liquid (190) or vapor (191) phase, methylbutynol is dehydrated to isopropenylacetylene.
Kirk-Othmer Encyclopedia of Chemical Technology (4th Edition)
112
ACETYLENE-DERIVED CHEMICALS
Voll
OH CH3
I I
HC=CC(CH3)2 ------ HC=CC=CH2
Hydrogenation of methylbutynol gives 2-methyl-3-buten-2-ol and then 2-methylbutan-2-ol in stepwise fashion (192).
HC=CC(OH) (CH3)2 CH2=CHC(OH) (CH3)2 CH3CH2C(OH) (CH3)2
Acidic mercury salts catalyze hydration to form a ketone (193).
ОН о
I II
HC=CC(CH3)2 + H20 —► CH2C— C(CH3)2
OH
Bromination in polar solvents usually gives //?7/w-3,4-dibromo-2-methyl-3-buten-2-ol; in nonpolar solvents, with incandescent light, the cis isomer is
the principal product (194). Chlorine adds readily up to the tetrachloro stage, but yields are low because of side reactions (195).
OH OH OH
HC=CC(CH3)2 ---------► CHX=CXC(CH3)2 ---------► CHX2CX2C(CH3)2
Upon treatment with suitable cobalt complexes, methylbutynol cyclizes to a 1,2,4-substituted benzene. Nickel complexes give the 1,3,5-isomer (196),
sometimes accompanied by linear polymer (25) or a mixture of tetrasubstituted cyclooctatetraenes (26).
OH
I
3 HC=CC(CH3)2
OH
I
4 HC=CC(CH3)2
R = a-hydroxyisopropyl
When bis(7t-allyl)nickel is used, only small amounts of cyclic product are obtained and the principal product is formed by addition of one triple bond to
another (197).
OH OH OH
I I I
2 HC=CC(CH3)2 ------- (CH3)2CCH=CHC=CC(CH3)2
With a nickel carbonyl catalyst, hydrochloric acid, and an alcohol the initially formed allenic ester cyclizes on distillation (198).
OH
(CH3)2CC=CH ------► (CH3)2C=C=CHCOOR -------► H3c
H3C °
With palladium chloride catalyst, carbon monoxide, and an alcohol the labile hydroxyl is alkylated during carbonylation (199).
OH OR
I I
(CH3)2CC=CH ------► (CH3)2CCH =CHCOOR
Copper salts catalyze oxidative dimerization to conjugated diynediols in high yields (200).
OH OH OH
I I I
2 (CH3)2CC=CH ------- (CH3)2CC=CC=CC(CH3)2
Glycols are obtained by treatment with a ketone using alkali as catalyst or with an aldehyde using alkali or copper acetylide as catalyst (201,202).
OH OH OH
I . II,
(CH3)2CC =CH + RCOR -------- (CH3)2CC =CCRR
Hypohalites replace the acetylenic hydrogen with chlorine, bromine, or iodine (203).
OH OH
I I
(CH3)2CC =CH + NaOX ------- (CH3)2CC =CX
Ethynyl carbinols rearrange to conjugated unsaturated aldehydes. Copper or silver salts catalyze isomerization of the acetate to an allenic acetate,
which can be hydrolyzed to an unsaturated aldehyde (204).
OOCCH3
(СН3)2СС=СН Ад2СОз> (CH3)2C=C=CHOOCCH3
Manufacture. In general, manufacture is carried out in batch reactors at close to atmospheric pressure. A moderate excess of finely divided
potassium hydroxide is suspended in a solvent such as 1,2-dimethoxyethane. The carbonyl compound is added, followed by acetylene. The reaction is rapid
and exothermic. At temperatures below 5°C the product is almost exclusively the alcohol. At 25—30°C the glycol predominates. Such synthesis also
Kirk-Othmer Encyclopedia of Chemical Technology (4th Edition)
113
ACETYLENE-DERIVED CHEMICALS
Voll
proceeds well with non-complexing solvents such as aromatic hydrocarbons, although the conversion is usually lower (205).
Continuous processes have been developed for the alcohols, operating under pressure with Equid ammonia as solvent. Potassium hydroxide (206)
or anion exchange resins (207) are suitable catalysts. However, the relatively small manufacturing volumes militate against continuous production. For a
while a continuous catalytic plant operated in Ravenna, Italy, designed to produce about 40,000 t/yr of methylbutynol for conversion to isoprene (208,209).
Economic Aspects. A number of secondary and tertiary acetylenic alcohols and glycols are manufactured by Air Products and Chemicals Co.
In 1990, U.S. bulk prices of ethyloctynol, methylbutynol, and tetramethyldecynediol were about $8.35/kg, $3.95/kg, and $8.00/kg, respectively.
Health and Safety Factors. Under normal conditions acetylenic alcohols are stable and free of decomposition hazard. The more volatile
alcohols present a fire hazard.
The alcohols are toxic orally, through skin absorption, and through inhalation. The secondary alcohols are more toxic than the tertiary. The glycols
are relatively low in toxicity.
Compound
hexynol
ethyloctynol
methylbutynol
methylpentynol
tetramethyldecynediol
LD50, mL/kg (mice)
0.175
2.1
2.2
0.7
4.6
Uses. The secondary acetylenic alcohols hexynol and ethyloctynol are used as corrosion inhibitors in oil-well acidizing compositions (see
Corrosion and corrosion control). The tertiary alcohols methylbutynol and methyl-pentynol are used as chemical intermediates, for manufacture of
Vitamin A and other products, and in metal plating and pickling operations. Dimethylhexynediol can be used in manufacture of fragrance chemicals and
peroxide catalysts. Higher acetylenic glycols and ethoxylated acetylene glycols are useful as surfactants and electroplating additives.
Vinylation Reaction Products
Unlike ethynylation, in which acetylene adds across a carbonyl group and the triple bond is retained, in vinylation a labile hydrogen compound adds to
acetylene, forming a double bond.
In early work, vinyl chloride had been heated with stoichiometric amounts of alkali alkoxides in excess alcohol as solvent, giving vinyl ethers as
products (210). Supposedly this involved a Williamson ether synthesis, where alkali alkoxide and organic halide gave an ether and alkali halide. However, it
was observed that small amounts of acetylene were formed by dehydrohalogenation of vinyl chloride, and that this acetylene was consumed as the reaction
proceeded. Hence acetylene was substituted for vinyl chloride and only catalytic amounts of alkali were used. Vinylation proceeded readily with high yields
(211).
Catalytic vinylation has been applied to a wide range of alcohols, phenols, thiols, carboxylic acids, and certain amines and amides. Vinyl acetate is no
longer prepared this way in the United States, although some minor vinyl esters such as stearates may still be prepared this way. However, the manufacture
of vinyl-pyrrolidinone and vinyl ethers still depends on acetylene.
TWinylcarbaZole. Vinylation of carbazole proceeds in high yields with alkaline catalysts (212,213). The product, 9-ethenylcarbazole, C^H^N
[1484-13-5], forms rigid high-melting polymers with outstanding electrical properties.
н CH2=CH2
Neurine. Neurine is trimethylvinylammonium hydroxide, C5H13NO [463-88-7]. Tertiary amines and their salts vinylate readily at low
temperatures with catalysis by free tertiary amines.
(CH3)3N + HC=CH + H2o [(CH3)3NCH=CH2]+[OHL
Above about 50°C tetramethylammonium hydroxide is formed as a by-product; it is the sole product above 100°C (214).
TV-Vinyl-2-pyrrolidinone. l-Ethenyl-2-pyrrolidinone [88-12-0], C6H9NO, A-vinylpyrrolidinone, was developed by Reppe's laboratory in
Germany at the beginning of World War II and patented in 1940 (215).
The major use of vinylpyrrolidinone is as a monomer in manufacture of poly(vinylpyrrolidinone) (PVP) homopolymer and in various copolymers,
where it frequendy imparts hydrophilic properties. When PVP was first produced, its principal use was as a blood plasma substitute and extender, a use no
longer sanctioned. These polymers are used in pharmaceutical and cosmetic applications, soft contact lenses, and viscosity index improvers. The monomer
serves as a component in radiation-cured polymer compositions, serving as a reactive diluent that reduces viscosity and increases cross-linking rates (see
Vinyl polymers, N-vinylamidepolya^rs).
Vinyl Ethers. The principal commercial vinyl ethers are methyl vinyl ether (methoxyethene, C?H:O) [107-25-5]', ethyl vinyl ether (ethoxyethene,
C4HgO) [104-92-2]', and butyl vinyl ether (1-ethenyloxybutane, C6H12O) [111-34-2]. (See Table 8 for physical properties.) Others such as the isopropyl,
isobutyl, hydroxybutyl, decyl, hexadecyl, and octadecyl ethers, as well as the divinyl ethers of butanediol and of triethylene glycol, have been offered as
development chemicals (see Ethers).
Table 8. Physical Properties of Vinyl Ethers*
Property Methyl Ethyl Butyl
molecular weight 58 72 100
freezing point, °C -122.8 -115.4 -91.9
boiling point, °C 5.5 35.7 93.5
vapor pressure at 20°C, kPa 156.7 57 5.6
specific gravity, 0.7511 0.7541 0.7792
refractive index, #20D 1.3730 1.3767 1.4020
(0°C)
flash point, °C -56 <-18 -1
water solubility at 20°C, wt % 1.5 0.9 0.2
Lower vinyl ethers are miscible with nearly all organic solvents.
To convert kPa to mm Hg, multiply by 7.5.
Kirk-Othmer Encyclopedia of Chemical Technology (4th Edition)
114
ACETYLENE-DERIVED CHEMICALS
Voll
Ethyl vinyl ether was the first to be prepared, in 1878, by treatment of diethyl chloroacetal with sodium (216). Methyl vinyl ether was first listed in
Reppe patents on vinylation in 1929 and 1930 (210,211).
Reactions. Vinyl ethers undergo all of the expected reactions of olefinic compounds plus a number of reactions that are both useful and
unusual.
With a suitable catalyst, usually a Lewis acid, many labile hydrogen compounds add across the vinyl ether double bond in the Markovnikov direction.
Alcohols give acetals. This reaction has been frequendy used to provide blocking groups in organic synthesis. The acetals are stable under neutral or
alkaline conditions and are easily hydrolyzed with dilute acid after other desired reactions have occurred (217,218). Water gives acetaldehyde and the
corresponding alcohol, presumably via disproportionation of the hemiacetal (219). Carboxylic acids give 1-alkoxyethyl esters (220). Thiols give thioacetals
(221).
or’
ch2=chor + r'oh
CH3CHOR
OH
I
CH2 =CHOR + H2O [CH3CHOR] CH3CH0 + ROH
OOCR'
I
CH2=CHOR + RCOOH ► CH3CHOR
pHydrogen halides react vigorously to give 1-haloethyl ethers, which are reactive intermediates for further synthesis (222). Conditions must be
carefully selected to avoid polymerization of the vinyl ether. Hydrogen cyanide adds at high temperature to give a 2-alkoxypropionitrile (223).
X
I
CH2=CHOR+HX ---► CH3CHOR (X = Cl or Br)
CN
I
CH2 =CHOR + HCN --- CH3CHOR
Chlorine and bromine add vigorously, giving, with proper control, high yields of 1,2-dihaloethyl ethers (224). In the presence of an alcohol, halogens
add as hypohalites, which give 2-haloacetals (225,226). With methanol and iodine this is used as a method of quantitative analysis, titrating unconsumed
iodine with standard thiosulfate solution (227).
X
I
ch2=chor + x2 —►xch2chor
ch2=chor + x2 + r'oh —►xch2chor
OR'
With Lewis acids as catalysts, compounds containing more than one alkoxy group on a carbon atom add across vinyl ether double bonds. Acetals
give 3-alkoxyacetals; since the products are also acetals, they can react further with excess vinyl ether to give oligomers (228—230). Orthoformic esters give
diacetals of malonaldehyde (231). With Lewis acids and mercuric salts as catalysts, vinyl ethers add in similar fashion to give acetals of 3-butenal (232,233).
OR" OR"
,11
CH2 =CHOR + RCH(OR )2 -- RCHCH2CHOR
OR'
I
CH2 =CHOR + CH(OR)3 --► CH(OR)2CH2CHOR
2 ('ll, OlOli - CH2=CHCH2CH(OR)2
Vinyl ethers and CC,P-unsaturated carbonyl compounds cyclize in a hetero-Diels-Alder reaction when heated together in an autoclave with small
amounts of hydroquinone added to inhibit polymerization. Acrolein gives 3,4-dihydro-2-methoxy-2H-pyran (234,235), which can easily be hydrolyzed to
glutaraldehyde (236) or hydrogenated to 1,5-pentanediol (237). With 2-methylene-l,3-dicarbonyl compounds the reaction is nearly quantitative (238).
^CH2
CH
I
XOR
О
II
C6H5C J3H2
c
I
c
h3c A
о
II
С6и-Г
Vinyl ethers cyclize with ketenes to cyclobutanones (239).
XOCH3
Kirk-Othmer Encyclopedia of Chemical Technology (4th Edition)
115
ACETYLENE-DERIVED CHEMICALS
Voll
RO^
ch2=chor + ch2 =c=o-►
%
Vinyl ethers serve as a source of vinyl groups for transvinylation of such compounds as 2-pyrrolidinone or caprolactam (240,241).
Compounds such as carbon tetrachloride (242) or trinitromethane (243) can add across the double bond.
ch2=chor + CC14 ROCHC1CH2CC13
ch2=chor + CH(NO2)3 ROCH2CH2C(NO2)3
With thionyl chloride as catalyst, hydrogen peroxide adds to vinyl ethers in anti-Markovnikov fashion, as do monothioglycols with amine catalysts
(244).
2 ch2=chor + HOOH ROCH2CH2OOCH2CH2OR
ch2=chor + HSCH2CH2OH ROCH2CH2SCH2CH2OH
Substances that form carbanions, such as nitro compounds, hydrocyanic acid, malonic acid, or acetylacetone, react with vinyl ethers in the presence
of water, replacing the alkyl group under mild conditions (245).
OH
I
CH2 =CHOR + CH3NO2 + H2O ------ CH3CHCH2NO2 + ROH
OH
I
CH2 =CHOR + HCN + H2O ----- CH3CHCN + ROH
The reaction of a vinyl ether with carbon dioxide and a secondary amine gives a carbamic ester (246).
OR
I
CH2=CHOR+CO2 + (CH3)2NH -------- (CH3)2NCOOCHCH3
Manufacture. The principal manufacturers of vinyl ethers are BASF, GAF, and Union Carbide. The first two utilize vinylation of alcohols,
whereas the last reportedly uses cracking of acetals.
German vinyl ether plants were described in detail at the end of World War II and variations of these processes are still in use. Vinylation of alcohols
from methyl to butyl was carried out under pressure: typically 2—2.3 MPa (20—22 atm) and 160—165°C for methyl, and 0.4—0.5 MPa (4—5 atm) and
150—155°C for isobutyl. An unpacked tower, operating continuously, produced about 300 t/month, with yields of 90—95% (247).
High boiling alcohols were vinylated at atmospheric pressure. The Germans used a tower packed with Raschig rings and filled with an alcohol
containing 1—5% of KOH at 160—180°C. Acetylene was recycled continuously up through the tower. The heat of reaction, about 125 kJ/mol (30
kcal/mol), was removed by cooling coils. Fresh alcohol and catalyst were added continuously at the top and withdrawn at the bottom. Yields of purified,
distilled product were described as quantitative (248).
Shipment, Storage, and Prices. Methyl vinyl ether is available in tank cars or cylinders, while the other vinyl ethers are available in tank cars,
tank wagons, or drums. Mild steel, stainless steel, and phenolic-coated steel are suitable for shipment and storage. If protected from air, moisture, and
acidic contamination, vinyl ethers are stable for years. United States bulk prices in 1991 for methyl vinyl ether, ethyl vinyl ether, and butyl vinyl ether were
listed as about $5.78/kg, $6.28/kg, and $6.08/kg, respectively.
Specifications and Analytical Methods. Vinyl ethers are usually specified as 98% minimum purity, as determined by gas chromatography.
The principal impurities are the parent alcohols, limited to 1.0% maximum for methyl vinyl ether and 0.5% maximum for ethyl vinyl ether. Water (by
Karl-Fischer titration) ranges from 0.1% maximum for methyl vinyl ether to 0.5% maximum for ethyl vinyl ether. Acetaldehyde ranges from 0.1%
maximum in ethyl vinyl ether to 0.5% maximum in butyl vinyl ether.
Health and Safety Factors. Because of their high vapor pressures (methyl vinyl ether is a gas at ambient conditions), the lower vinyl ethers
represent a severe fire hazard and must be handled accordingly. Contact with acids can initiate violent polymerization and must be avoided. Although vinyl
ethers form peroxides more slowly than saturated ethers, distillation residues must be handled with caution.
Inhalation should be avoided. A group of six rats that were exposed to 64,000 ppm of methyl vinyl ether in air for 4 h were anesthetized. All
recovered and appeared normal after 72 h. One died after 96 h. The others survived the 2-week observation period without noticeable effect.
The lower vinyl ethers do not appear to be skin irritants or sensitizers.
Oral toxicity is very low: isobutyl vinyl ether has LD50 of 17 mL/kg for white rats.
Uses. Union Carbide consumes its vinyl ether production in the manufacture of glutaraldehyde [111-30-8]. BASF and GAF consume most of
their production as monomers (see Vinyl polymers). In addition to the homopolymers, the copolymer of methyl vinyl ether with maleic anhydride is of
particular interest.
BIBLIOGRAPHY
"Acetylene-Derived Chemicals" in ECT 3rd ed., Vol. 1, pp. 244—276, by Eugene V. Hort, GAF Corporation.
1. S. A. Miller, Acetylene, Its Properties, Manufacture and Uses, Vol. 1, Academic Press, Inc., New York, 1965, pp. 24—28, 42—44.
2. M. J. Haley with T. Ball and S. Yoshikawa, Acetylene, CEH Product Review, Chemical Economics Handbook, SRI International, Menlo Park, Calif.,
Oct. 1988, p. 300.5000x.
3. Ibid.,?. 300.5000y.
4. R. E. Colbom and К. P. C. Vollhardt,/. Am. Chem. Soc. 108, 5470 (1986).
5. U.S. Pat. 4,241,230 (Dec. 23,1980), В. M. Drinkard (to Mobil Oil Corp.).
6. Jpn. Kokai 78 59,605 (May 29,1978), Y. Nambu and C. Fujii (to Denki Kaguku Kogyo K.K.).
7. Ref. 2,p. 300.5000s.
8. W. Reppe and co-workers, Ann. 596, 2 (1955).
9. J. V. Nef, Ann. 308, 277 (1899).
10. Ref. 8, p. 29.
11. L. Henry, Ber. 5, 449 (1872).
12. U.S. Pat. 2,563,325 (Aug. 7,1951), F. Fahnoe (to GAF Corp.).
Kirk-Othmer Encyclopedia of Chemical Technology (4th Edition)
116
ACETYLENE-DERIVED CHEMICALS
Voll
13.
14.
15.
16.
17.
18.
19.
20.
21.
22.
23.
24.
25.
26.
27.
28.
29.
30.
31.
32.
33.
34.
35.
36.
37.
38.
39.
40.
41.
42.
43.
44.
45.
46.
47.
48.
49.
50.
51.
52.
53.
54.
55.
56.
57.
58.
59.
60.
61.
62.
63.
64.
65.
66.
67.
68.
69.
70.
71.
72.
73.
74.
75.
76.
77.
78.
79.
80.
81.
82.
83.
84.
85.
86.
87.
88.
U.S. Pat. 2,641,615 (June 9, 1953), R. F. Kleinschmidt (to GAF Corp.).
J. C. Sauer, Org. Synth. Coll. Vol. 4, 813 (1963).
V. Wolf, Chem. Ber. 86, 735 (1953).
V. Wolf, Chem. Ber. 87, 668 (1954).
L. Henry, Ber. 6, 728 (1873); 8, 398 (1875).
A. Kirrmann, Bull. Soc. Chim. Fr. 39(4), 698 (1926).
L. Henry, Ber. 17,1132 (1884).
Ref. 8, pp. 57-59.
F. J. McQuillin and W. O. Ord,/. Chem. Soc., 2906 (1959).
Ref. 8, p. 61.
G. F. Hennion and W. S. Murray,/.Am. Chem. Soc. 64, 1220 (1942).
U.S. Pat. 3,637,813 (Jan. 25,1972), G. F. DAllelio.
E. Cherbuliez, M. Gowhari, and J. Rabinowitz, Heir. Chim. Acta 47, 2098 (1964).
U.S. Pat. 3,783,016 (Jan. 1,1974), D. I. Randall and C. Vogel (to GAF Corp.).
Ref. 8, p. 69.
P. Chini, A. Santambrogio, and N. Palladino,/ Chem. Soc. C, 830 (1967).
W. Schulz, U. Rosenthal, D. Braun, and D. Walther, Z. Chem. 27, 264 (1987).
W. E. Daniels,/ Org. Chem. 29, 2936 (1964).
L. A. Akopyan and co-workers, Polym. Sci. USSR (in English) 17(5), 1231 (1975).
M. G. Akhmerov, D. Usupov, and A. Kuchkarov, Upb. Khim. Zh. 1979(4), 59 (1979); Chem. Abstr. 92, 58871 (1980).
U.S. Pat. 2,238,471 (Apr. 15,1941), E. Keyssner and E. Eichler (to GAF Corp.).
R. L. Salvador and D. Simon, Can. J. Chem. 44(21), 2570 (1966).
R. Lespieau and P. L. Viguier, C. RAcad. Sci. 146, 294 (1908).
I. G. Ali-Zade and co-workers, Dokl. Akad. \auk. A’A’A’R 173, 89 (1967); Chem. Abstr. 67, 32723 (1967).
L. Brandsma, Preparative Acetylenic Chemistry, Elsevier, Amsterdam, the Nethedands, 1971, pp. 166—168.
U.S. Pat. 3,257,465 (June 21, 1966), M. W. Leeds and H. L. Komarowski (to Cumberland Chemical Corp.).
Brit. Pat. 968,928 (Sept. 9,1964), M. E. Chiddix and O. F. Hecht (to GAF Corp.).
U.S. Pat. 3,272,854 (Sept. 13, 1966), R. A. Covey, A. E. Smith, and W. L. Hubbard (to Uniroyal Corp.).
U.S. Pat. 2,778,830 (Jan. 22,1957), H. Pasedach and M. Seefelder (to BASF A.G.).
U.S. Pat. 3,923,870 (Dec. 2,1975), W. Singer (to Troy Chemical Corp.).
G. Y. Yositsch, Zh. Russ. Fip. Khim. Ova. 38, 252 (1906).
A. W. Johnson,/ Chem. Soc., 1009 (1946).
G. Dupont, R. Dulou, and G. Lefebvre, Bull. Soc. Chim. Fr, 816 (1954).
Ref. 8, p. 56.
U.S. Pat. 3,083,235 (Mar. 26,1963), D. J. Mann, D. D. Perry, and R. M. Dudak (to Thiokol Chemical Corp.).
U.S. Pat. 2,941,010 (June 14, 1960), D. J. Mann, D. D. Perry, and R. M. Dudak (to Thiokol Chemical Corp.).
V. Wolf, Chem. Ber. 88, 717 (1955).
I. Heilbron, E. R. Jones and F. Sondheimer,/ Chem. Soc., 604 (1949).
V. Franzen, Ann. 587, 131 (1954).
A. W. Johnson,/ Chem. Soc., 1011 (1946).
A. W. Johnson,/ Chem. Soc., 1014 (1946).
U.S. Pat. 3,746,726 (July 17,1973), F. Reicheneder and K. Duty (to BASF A.G.).
U.S. Pat. 3,054,739 (Sept. 18,1962), F. Reicheneder and K. Duty (to BASF A.G.).
K. Duty, Angew. Chem. 72, 864 (1960).
H. Kleinert and H. Fuerst,/ Pract. Chem. 36, 252 (1967).
L. H. Smith, SyntheticFiberDevelopments in Germany, Textile Research Institute, New York, 1946, pp. 534—541.
Ger. Pat. 1,074,569 (Feb. 4,1960), H. Pasedach and D. Ludsteck (to BASF A.G.).
Ger. Pat. 32,828 (May 15, 1965), H. Kleinert; Chem. Abstr. 63, 17901 (1965).
Ref. 8, p. 51.
Ref. 8, pp. 45-47.
Y. K. Yur'ev, I. K. Korobitsyna, and E. G. Brige, Dokl. Akad. \auk SSSR 62, 625 (1948); Chem. Abstr. 43, 5003 (1949).
U.S. Pat. 2,542,417 (Feb. 20,1951), R. F. Kleinschmidt (to GAF Corp.).
Ger. Pat. 229,689 (Nov. 13,1985), H. Drevs and R. S. Koemig; Chem. Abstr. 104, 225336 (1986).
U.S. Pat. 2,421,650 (June 3,1947), W. Reppe, C. Schuster, and E. Weiss (to GAF Corp.).
C. J. S. Appleyard and J. F. C. Gartshore, "Manufacture of 1,4-Butynediol at I. G. Ludwigshafen," BIOS Report 367, Item 22; OTS Report PB 28556,
U.S. Department of Commerce.
D. L. Fuller, A. O. Zoss, and H. M. Weir, "The Manufacture of Butynediol from Acetylene and Formaldehyde," FIAT Report No. 926; OTS Report
PB 80334, U.S. Department of Commerce, 1946.
U.S. Pat. 3,560,576 (Feb. 2, 1971), J. R. Kirschner to E.I. du Pont de Nemours & Co., Inc).
Ger. Offen. 2,357,751 (Aug. 7,1975), K. Baer and co-workers (to BASF A.G.)
Ger. Offen. 2,314,693 (Oct. 10,1974), W. Reiss and co-workers (to BASF A.G.).
Ger. Offen. 2,240,401 (Mar. 7,1974), H. Pasedach and H. Kroesche (to BASF A.G.).
U.S. Pat. 3,920,759 (Nov. 18,1975), E. V. Hort (to GAF Corp.).
U.S. Pat. 4,117,248 (Sept. 26,1978), J. L. Prater and R. L. Hedworth (to GAF Corp.).
U.S. Pat. 4,119,790 (Oct. 10,1978), E. V. Hort (to GAF Corp.).
Ref. 1, pp. 476-542.
U.S. Pat. 2,906,614 (Sept. 29, 1959), T. R. Hopkins and J. W. Pullen (to Spencer Chemical Co.).
G. Griner, C. RAcad. Sci. 116, 723 (1893).
C. Prevost, C. RAcad. Sci. 183, 1292 (1926).
U.S. Pat. 2,877,205 (Mar. 10,1959), J. Lal (to Justi and Son, Inc.).
U.S. Pat. 2,840,598 (June 24,1958), H. Schwartz (to Vineland Chemical Co.).
U.S. Pat. 2,980,649 (Apr. 18,1961), J. R. Caldwell and R. Gilkey (to Eastman Kodak Co.).
O. Bayer and co-workers, Anges'. Chem. 62, 61 (1950).
C. S. Marvel and С. H. Young,/ Am. Chem. Soc. 73, 1066 (1951).
Jpn. Pat. 3164 (Apr. 25,1958), T. Haya, M. Sato, and M. Yoshida (to Mitsubishi Co.); Chem. Abstr. 53, 6083 (1959).
G. Lefebvre, G. Dupont, and R. Dulou, C. RAcad. Sci. 229, 222 (1949).
К. C. Brannock and G. R. Lappin,/ Org. Chem. 21, 1366 (1956).
Ger. Pat. 855,864 (Nov. 17,1952), A. Seib (to BASF A.G.).
Kirk-Othmer Encyclopedia of Chemical Technology (4th Edition)
117
ACETYLENE-DERIVED CHEMICALS
Voll
89. U.S. Pat. 3,240,702 (Mar. 15, 1966), R. F. Monroe (to The Dow Chemical Company).
90. J. M. Bobbit, L. H. Amundsen, and R. I. Steiner,/. O/g. Chem. 25, 2230 (1960).
91. A. Valette, Ann. Chim. 3(12), 644 (1948).
92. Ger. Pat. 857,369 (Nov. 27,1952), H. Krzikalla and E. Woldan (to BASF A.G.).
93. P. Kurtz, Ann. 572, 49, 69 (1951).
94. U.S. Pat. 4,633,015 (Dec. 30, 1986), A. S. C. Chan and D. E. Morris (to Monsanto Co.).
95. L. E. Craig, R. M. Elofson, and I. J. Ressa, J. Am. Chem. Soc. 72, 3277 (1960).
96. U.S. Pat. 3,661,980 (May 9,1972), W. Himmele, W. Qulla, and R. Prinz (to BASF A.G.).
97. U.S. Pat. 3,859,369 (Jan. 7, 1975), H. B. Copelin (to E. I. du Pont de Nemours & Co., Inc.).
98. Ger. Offen. 3,334,589 (Apr. 4, 1985), R. Schalenbach and H. Waldmann (to Bayer A.G.).
99. M. F. Abidova, A. S. Sultanov, and N. A. Savel'eva, Katal Pererab. Uglevodorodnogo. Syr'ya 1971(5), 175 (1971); Chem. Abstr. 79, 125755 (1973).
100. N. O. Brace, / Am. Chem. Soc. 77, 4157 (1955).
101. Ger. Pat. 961,353 (Apr. 4,1957), H. Friederich (to BASF A.G.).
102. U.S. Pat. 2,912,439 (Nov. 10, 1959), R. H. Hasek andj. E. Hardwicke (to Eastman Kodak Co.).
103. Ger. Pat. 1,094,732 (Dec. 15,1960), H. Frensch (to Hoechst A.G.).
104. N. Clauson-Kaas, Acta Chem. Scand. 15, 177 (1961); Chem. Abstr. 57, 4619 (1962).
105. U.S. Pat. 2,833,787 (May 6,1958), G. J. Cadson and co-workers (to Shell Oil Co.).
106. U.S. Pat. 3,284,419 (Nov. 8,1966), F. G. Helfferich (to Shell Oil Co.).
107. Ger. Pat. 833,963 (Mar. 13,1952), E. Bauer (to BASF A.G.).
108. Ref. 8, p. 142.
109. U.S. Pat. 2,779,700 (Jan. 29, 1957), P. Robitschek and С. T. Bean (to Hooker Chemical Co.).
110. U.S. Pat. 2,740,771 (Apr. 3, 1958), R. I. Longley, Jr., E. C. Chapin, and R. F. Smith (to Monsanto Chemical Co.).
111. F. J. McQuillin and W. O. Ord,/ Chem. Soc., 2906 (1959).
112. I. A. Makolkin and co-workers, Tr. Mosk. Inst. Mar. Kho^. 1968(46), 3 (1968); Chem. Abstr. 71, 54383 (1969).
113. J. W. Copenhaver and M. H. Bigelow, Acetylene and Carbon Monoxide Chemistry, Reinhold, New York, 1949, pp. 131—133.
114. P. W. Feit, Chem. Ber. 93, 116 (1960).
115. U.S. Pat. 2,961,471 (Nov. 22,1960), E. V. Hort (to GAF Corp.).
116. H. Tieckelmann in R. A. Abromovitch, ed., Pyridine and Its Derivatives, Suppl. Part III, John Wiley & Sons, Inc., New York, 1974, pp. 670—673.
117. P. J. Dekkers, Reel Trav. Chim. Pcys-Bas 9, 92 (1890).
118. C. Harries, Ber. 35, 1187 (1902).
119. J. Baeseken, Reel Trav. Chim. Pcys-Bas 34, 100 (1915).
120. J. Hamonet, C. R Acad. Sci. 132, 632 (1905).
121. R. Lespieau, C. RAcad. Sci. 150, 1761 (1910).
122. W. Griehl and G. Schnock, Faserforsch. Textiltech. 8, 408 (1957); Chem. Abstr. 52, 11781 (1958).
123. S. Sarel, L. A. Pohoryles, and R. Ben-Shoshan,/ Org. Chem. 24, 1873 (1959).
124. Ger. Pat. 800,662 (Nov. 27,1950), H. Krzikalla and K. Merkel (to BASF A.G.).
125. R. Riemschneider and W. M. Schneider, Monatsh. Chem. 90, 510 (1959).
126. J. W. Hill and W. H. Carothers,/ Am. Chem. Soc. 57, 925 (1935).
127. U.S. Pat. 2,870,097 (Jan. 20, 1959), D. B. Pattison (to E. I. du Pont de Nemours & Co., Inc.).
128. Ger. Pat. 800,398 (Nov. 2,1950), B. Christ (to BASF A.G.).
129. V. V. Korshak and I. A. Gribova, lyv. Akad. Nauk SSSR Otd. Tekh. Nauk, 670 (1954); Chem. Abstr. 49, 10893 (1955).
130. U.S. Pat. 2,222,302 (Nov. 19,1940), W. Schmidt and F. Manchen (to GAF Corp.).
131. A. Muller and W. Vane, Ber. 77B, 669 (1944).
132. S. K. Kang, W. S. Kim, and В. H. Moon, Synthesis 1985(12), 1161 (1985).
133. Ref. 8, p. 178.
134. I. Geiman and co-workers, Khim GeterotsicklSoedin. 1981(4), 448 (1981); Chem. Abstr. 95, 80604 (1981).
135. G. A. Kliger and co-workers, Otkrytiyal^obret. 1988(23), 106 (1988); Chem. Abstr. 109, 212804 (1988).
136. R. E. Walkup and S. Seades, Jr., Tetrahedron 41(1), 101 (1985).
137. Ger. Offen. 2,824,908 (Dec. 20,1979), W. Mesch (to BASF A.G.).
138. Y. K. Yur'ev and N. G. Medovshchikov,/ Gen. Chem. USSR 9, 628 (1939); Chem. Abstr. 33, 7779 (1939).
139. Chem. Eng. 82(7), 55 (1975).
140. Chem. Mark. Rep. 207(11), 5 (1975).
141. M. J. Haley with W. E. Cox and S. Yoshikawa, 1,4-Butanediol, CEH Product Review, Chemical Economics Handbook, SRI International, Menlo
Park, Calif., Oct. 1988, p. 621.5030c.
142. Chem. Eng. News 53(7), 8 (1975).
143. Chem. Eng. News 54(9), 11 (1976).
144. Ref. 141, pp. 621.5030f,g.
145. Ref. 141, p. 621.50301.
146. R. Fittig and M. B. Chanlaroff, Ber. 226, 331 (1884).
147. S. Minoda and M. Miyajima, Hydrocarbon Process. 49(11), 176 (1970).
148. K. Saotome and K. Sato, Bull Chem. Soc. Jpn. 39(3), 485 (1966).
149. H. C. Brown and K. A. Keblys,/ Org. Chem. 31(2), 485 (1966).
150. Ref. 8, pp. 191-194.
151. Y. K. Yur'ev, E. G. Vendel'shtein, and L. A. Zinov'eva, Zhur Obshch. Khim. 22, 509 (1952); Chem. Abstr. 47, 2747 (1953).
152. Swiss Pat. 264,598 (Jan. 16,1950), G. Bischoff; Chem. Abstr. 45, 1622 (1951).
153. J. E. Livak and co-workers, / Am. Chem. Soc. 67, 2218 (1945).
154. Ger. Pat. 810,025 (Aug. 6,1951), C. Schuster and A. Simon (to BASF A.G.).
155. H. Hart and О. E. Curtis, Jr.,/ Am. Chem. Soc. 78, 112 (1956).
156. U.S. Pats. 2,993,891 (July 25,1961), 3,030,361 (Apr. 17,1962), 3,031,446 (Apr. 24,1962), H. W. Zimmer and J. M. Holbert (to Chattanooga
Medicine Co.).
157. Jpn. Pat* 8,271 (Sept. 24,1956), M. Ohta (to Mitsubishi Co.,); Chem. Abstr. 52, 11904 (1958).
158. V. M. Markovich and co-workers, Khim. Farm. Zh. 16, 1491 (1982); Chem. Abstr. 98, 125367 (1983).
159. Indian Pat. 160,027 (June 20, 1987), A. Prakosh and R. S. Prasad (to Reckitt and Colman of India Ltd.).
160. G. I. Nikishin and co-workers, Eyy. Akad. Mauk SSSR Otd. Tekh. Mauk, 146 (1962); Chem. Abstr. 57, 16390 (1962).
161. D. Elad and R. D. Youssefyeh, Chem. Commun. 1965(1), 7 (1965).
162. W. E. Truce and С. E. Olson, / Am. Chem. Soc. 74, 4721 (1952).
163. Ger. Pat. 1,026,297 (Mar. 20,1958), N. von Kutepow (to BASF A.G.); Chem. Abstr. 54, 9768 (1960).
164. D. J. Cram and H. Steinberg, / Am. Chem. Soc. 76, 3630 (1954).
Kirk-Othmer Encyclopedia of Chemical Technology (4th Edition)
118
ACETYLENE-DERIVED CHEMICALS
Voll
165. U.S. Pat. 2,778,852 (Jan. 22,1957), K. Adam and H. G. Trieschmann (to BASF A.G.).
166. Ger. Pat. 804,567 (Apr. 26,1951), H. Kaltschmitt and A. Tartter (to BASF A.G.).
167. V. Y. Kortun, Z. M. Kol’tsova, and V. G. Yashunskii, ZA Prikl. Khim. (Leningrad) 51, 1919 (1978); Chem. Abstr. 89, 196931 (1978).
168. U.S. Pat. 2,819,304 Jan. 7,1958), W. Reppe, H. Friederich, and H. Laib (to BASF A.G.).
169. Ger. Pat. 917,665 (Oct. 14, 1954), H. Haussmann and G. Grafinger (to BASF A.G.).
170. H. Plieninger, Chem. Ber. 83, 265 (1950).
171. U.S. Pat. 2,603,658 July 15,1952), F. Hanusch (to BASF A.G.).
172. W. Reppe and co-workers, Ann. 596, 198 (1955).
173. T. C. Bruice and J. J. Bruno,/. Am. Chem. Soc. 83, 3494 (1961).
174. A. L. Dounce, R. H. Wardlow, and R. Connor,/ Am. Chem. Soc. 57, 2556 (1935).
175. S. M. McElvain and J. F. Vozza,/. Am. Chem. Soc. 71, 896 (1949).
176. E. Spath and J. Lintner, Ber. 69, 2727 (1936).
177. K. Hatada and Y. Ono, Bull. Chem. Soc. Jpn. 50, 2517—2521 (1977) (in English).
178. U.S. Pat. 4,824,967 (Apr. 25,1989), К. C. Liu and P. D. Taylor (to GAF Corp.).
179. A. O. Zoss and D. L. Fuller, "The Manufacture of y-Butyrolactone," PB 60902, U.S. Department of Commerce Office of Technical Services, Oct.
1946.
180. A. E. Favorskii and M. Skossarewsky, ZA R/ш. Fz^. Khim. Ova. 32, 652 (1900); Bull. Soc. Chim. Fr. 26, 284 (1901).
181. G. F. Hennion and co-workers,/ Otg. Chem. 21, 1142 (1956).
182. U.S. Pat. 2,882,287 (Apr. 14, 1959), D. C. Rowlands and W. H. Gillen (to Air Reduction Co.).
183. C. D. Hurd and W. D. McPhee,/ Am. Chem. Soc. 71, 398 (1949).
184. U.S. Pat. 2,798,885 July 9, 1957), H. Ensslin and K. Meier (to Ciba Pharmaceutical Products Inc.).
185. I. N. Nazarov and G. A. Schvekhgeimer, ZA Obshch. Khim. 29, 463 (1959); Chem. Abstr. 53, 21661 (1959).
186. G. F. Hennion and K. W. Nelson,/ Am. Chem. Soc. 79, 2142 (1957).
187. Y. Pasternak, Bull. Soc. Chim. Fr. 1963(8-9), 1719 (1963).
188. T. A. Favorskaya,/ Gen. Chem. USSR*), 386 (1939); Chem. Abstr. 33, 9281 (1939).
189. T. A. Favorskaya,/ Gen. Chem. USSR 10, 461 (1940); Chem. Abstr. 34, 7845 (1940).
190. U.S. Pat. 2,250,558 July 29, 1941), T. H. Vaughn (to Union Carbide Corp.).
191. U.S. Pat. 3,388,181 June 11,1968), H. D. Anspon (to GAF Corp.).
192. R. J. Tedeschi and G. Clark, Jr.,/ Org. Chem. 27, 4323 (1962).
193. N. C. Rose,/ Chem. Educ. 43(6), 324 (1966).
194. I. N. Nazarov and L. D. Bergel'son, ZA Obshch. Khim. 27, 1540 (1957); Chem. Abstr. 52, 3660 (1958).
195. G. F. Hennion and G. M. Wolf, J. Am. Chem. Soc. 62, 1368 (1940).
196. Ger. Offen. 3,633,033 (Apr. 7,1988), G. Thelen and H. W. Voges (to Huels A.G.).
197. G. A. Chukhadzhyan and co-workers, ZA Org. Khim. 8(3), 476 (1972); Chem. Abstr. 77, 4739 (1972).
198. E. R. H. Jones, G. H. Whitham, and M. C. Whiting,/ Chem. Soc., 4628 (1957).
199. T. Nogi andj. Tsuji, Tetrahedron 25(17), 4099 (1969).
200. H. A. Stansbury and W. R. Proops,/ Org. Chem. 27, 320 (1962).
201. S. S. Dehmlow and E. V. Ю Justus Eiebigs Ann. Chem. 10, 1753 (1973).
202. Ref. 8, p. 36.
203. R.-R. Lii and S. I. Miller,/ Am. Chem. Soc. 95(5), 1602 (1973).
204. G. Saucy and co-workers, Helv. Chim. Acta 42, 1945 (1959).
205. A. V. Shchelkunov, A. Ashirbekova, and V. M. Rofrnan, DepositedDoc. 1980, 5311 (1980).
206. U.S. Pat. 3,082,260 (Mar. 19, 1963), R. J. Tedeschi, A. W. Casey, and J. P. Russell (to Air Reduction Co.).
207. M. A. Dzhragatspanyan, A. G. Mirzkhanyan, and L. A. Ustynyuk, Arm. Khim. Zh. 36, 476, 547 (1983); Chem. Abstr. 100, 22301, 22302 (1984).
208. U.S. Pat. 3,283,014 (Nov. 1, 1966), A. Balducci and M. de Malde (to SNAM S.p.A).
209. A. Heath, Chem. Eng. 80(22), 48 (1973).
210. U.S. Pat. 1,941,108 J3ec. 26,1923), W. Reppe (to I. G. Farbenind. A.G.).
211. U.S. Pat. 1,959,927 (May 22,1934), W. Reppe (to I.G. Farbenind. A.G.).
212. O. Solomon, C. lonescu, and I. Ciuta, Chem. Tech. Leipzig*), 202 (1957); Chem. Abstr. 51, 15493 (1957).
213. Shansi University, Uua Hsueh TungPao, 21 (1977); Chem. Abstr. 87, 134899 (1977).
214. C. Gardner and co-workers,/ Chem. Soc., 789 (1949).
215. Fr. Pat. 865,354 (May 3, 1940), H. Weese, G. Hecht, and W. Reppe (to I. G. Farbenind. A.G.).
216. J. Wislicenus, Ann. 192, 106 (1878).
217. I. W. J. Still, J. N. Reed, and K. Turnbull, Tetrahedron Eett. 17, 1481 (1979).
218. A. Franke, F. F. Frickel, R. Schlecker, and P. C. Theime, Synthesis, 712 (1979).
219. A. Skrabal and R. Skrabal, Z Phys. Chem. A 181, 449 (1938).
220. E. Levas, C. R Acad. Sci. 228, 1443 (1949).
221. F. Kipnis, H. Solonay, and J. Omfelt, J. Am. Chem. Soc. 73, 1783 (1951).
222. U.S. Pat. 2,061,946 (Nov. 24,1936), E. Kuehn and H. Hopff (to I. G. Farbenind. A.G.).
223. W. Reppe and co-workers, Ann. 601, 109 (1956).
224. L. Summers, Chem. Rev. 55, 317 (1955).
225. U.S. Pat. 2,433,890 Jan. 6, 1948), O. W. Cass (to E. I. du Pont de Nemours & Co., Inc.).
226. U.S. Pat. 4,489,011 J3ec. 18, 1984), S. S. M. Wang (to Merrell Dow Pharm., Inc.).
227. S. Siggia and R. L. Edsberg, Anal. Chem. 20, 762 (1948).
228. U.S. Pat. 2,165,962 July 1, 1939), M. Mueller-Conradi and K. Pieroh (to I. G. Farbenind. A.G.).
229. U.S. Pats. 2,487,525 (Apr. 8,1949) and 2,502,433 (Apr. 4,1950), J. W. Copenhaver (to GAF Corp.).
230. R. I. Hoaglin and D. H. Hirsch,/ Am. Chem. Soc. 71, 3468 (1949).
231. U.S. Pat. 2,527,533 (Oct. 31,1950), J. W. Copenhaver (to GAF Corp.).
232. R. I. Hoaglin, D. G. Kubler, and A. E. Montagna,/ Am. Chem. Soc. 80, 5460 (1958).
233. M. S. Nieuwenhuizen, A. P. G. Kieboom, and H. Van Bekkum, Synthesis, 712 (1981).
234. R. I. Longley, Jr., and W. S. Emerson, / Am. Chem. Soc. 72, 3079 (1950).
235. Jpn. Kokai Tokkyo Koho 59,108,734 June 23,1984) (to Daicel Ind., Ltd.).
236. U.S. Pat. 2,546,018 (Mar. 20, 1951), C. W. Smith and co-workers (to Shell Development Co.).
237. U.S. Pat. 2,546,019 (Mar. 20, 1951), C. W. Smith and co-workers (to Shell Development Co.).
238. M. Yamauchi, S. Katayama, O. Baba, and T. Watanabe,/ Chem. Soc. Chem. Commun., 281 (1983).
239. R. W. Aben and H. W. Scheeren,/ Chem. Soc. Perkin Trans. 1, 3132 (1979).
240. U.S. Pat. 3,019,231 Jan. 30, 1962), W. J. Peppel and J. D. Watkins (to Jefferson Chemical Co.).
241. W. H. Watanabe and L. E. Conlon,/ Am. Chem. Soc. 79, 2828 (1957).
Kirk-Othmer Encyclopedia of Chemical Technology (4th Edition)
119
ACETYLENE-DERIVED CHEMICALS
Voll
242. U.S. Pat. 2,560,219 (July 10,1951), S. A. Glickman (to GAF Corp.).
243. U.S. Pat. 3,050,565 (Aug. 21, 1962), P. O. Tawney (to Uniroyal Corp.).
244. U.S. Pat. 2,768,975 (Oct. 30, 1956), R. S. Scliiefelbein (to Jefferson Chemical Co.).
245. U.S. Pat. 2,736,743 (Feb. 28, 1956), C. J. Schmidle and R. C. Mansfield (to Rohm and Haas Corp.).
246. Y. Yoshida and S. Inoue, Chem. Lett. 11, 1375 (1977).
247. S. A. Miller, Acetylene, Its Properties, Manufacture and Uses, Vol. 2, Academic Press, Inc., New York, 1965, pp. 199—202.
248. J. W. Copenhaver and M. H. Bigelow, Acetylene and Carbon Monoxide Chemistry, Reinhold Publishing Corp., New York, 1949, pp. 37—38.
Eugene V. Hort
Paul Taylor
GAF Corporation
Kirk-Othmer Encyclopedia of Chemical Technology (4th Edition)
120
Vol 1
ACETYLENE DICHLORIDE (1,2-DICHLOROETHYLENE).
See Cir.orocarbons and cir.orohydrocarbons.
ACETYLENE TETRABROMIDE (1,1,2,2-TETRABROMOETHANE).
See Bromine compounds.
ACETYLENE TETRACHLORIDE (1,1,2,2-TETRACHLOROETHANE).
See CIR.OROCARBONS AND CIR.OROHYDROCARBONS.
ACETYLENIC ALCOHOLS.
See Acetylene-derived chemicads.
ACETYLENIC GLYCOLS.
See Acetylene-derived chemicads.
ACETYLENIC POLYMERS.
See Eleciricadly conductive polymers.
ACETYL FLUORIDE.
See Fluorine compounds, organic.
ACETYLIDES.
See Hydrocarbons, acetylene; Carbides.
ACETYL PEROXIDE.
See Peroxides and peroxy compounds, organic peroxides.
ACETYLSALICYLIC ACID.
See Analgesics, antipyretics, and antiinflammatory agents; Salicylic acid and related compounds.
ACID RAIN.
See Airpollution; Atmospheric modeling; Environmental impact.
ACIDS, CARBOXYLIC.
See Carboxylic acids.
ACONITIC ACID.
See Citric acid.
Kirk-Othmer Encyclopedia of Chemical Technology (4th Edition)
121
ACROLEIN AND DERIVATIVES
Voll
ACQUIRED IMMUNODEFICIENCY SYNDROME, AIDS.
See Antiviral agents; Immunotherapeutic agents.
ACRIDINE.
See Pyridine and pyridine derivatives.
ACRIDINE DYES.
See Dyhs and dyh intermediates.
ACROLEIN AND DERIVATIVES
Acrolein. (2-propenal [107-02-08])> C3H4O, is the simplest unsaturated aldehyde (CH2=CHCHO). The primary characteristic of acrolein is its high reactivity
due to conjugation of the carbonyl group with a vinyl group. Controlling this reactivity to give the desired derivative is the key to its usefulness. Acrolein
now finds commercial utility in several major products as well as a number of smaller volume products. More than 80% of the refined acrolein that is
produced today goes into the synthesis of methionine. Much larger quantities of crude acrolein are produced as an intermediate in the production of acrylic
acid. More than 85% of the acrylic acid produced worldwide is by the captive oxidation of acrolein. Several review articles (1—5) and a book (6) have been
published on the preparation, reactions, and uses of acrolein.
Acrolein is a highly toxic material with extreme lacrimatory properties. At room temperature acrolein is a liquid with volatility and flammability
somewhat similar to acetone; but unlike acetone, its solubility in water is limited. Commercially, acrolein is always stored with hydroquinone and acetic acid
as inhibitors. Special care in handling is required because of the flammability, reactivity, and toxicity of acrolein.
The physical and chemical properties of acrolein are given in Table 1.
Table 1. Properties of Acrolein
Property Value
Physicalproperties
molecular formula C3H4O
molecular weight 56.06
specific gravity at 20/20°C 0.8427
coefficient of expansion at 20°C, vol/°C 0.00140
boiling point, °C
at 101.3 kPa" 52.69
-36
at 1.33 kPa"
vapor pressure at 20°C, kPa 29.3
heat of vaporization at 101.3 kPa , kJ /kg 93
critical temperature, °C 233
critical pressure, MPa 5.07
critical volume, mL/mol 189
freezing point, °C -87.0
solubility at 20°C, % by wt
in water 20.6
water in 6.8
refractive index, #20D 1.4013
viscosity at 20°C, mPa-s (=cP) 0.35
heat capacity (specific), kJ/(kg-K)b
liquid (17-44°C) 0.396
gas (27°C) 0.221
liquid density at 20°C, kg/Ld 0.8412
Chemicalproperties
flash point, open cup -18° C
closed cup -26° C
flammability limits in air, vol %
upper 31
lower 2.8
autoignition temperature in air, °C 234
heat of combustion of 25°C, kJ /kg 5383
heat of polymerization (vinyl), kJ /mol 71-80
heat of condensation (aldol), kJ /mol 42
To convert kPa to mm Hg, multiply by 7.5.
Kirk-Othmer Encyclopedia of Chemical Technology (4th Edition)
122
ACROLEIN AND DERIVATIVES
Voll
To convert kJ to kcal, divide by 4.184.
To convert MPa to psi, multiply by 145.
To convert kg/L to lb/gal, multiply by 8.345.
Manufacture
The Reaction. Acrolein has been produced commercially since 1938. The first commercial processes were based on the vapor-phase
condensation of acetaldehyde and formaldehyde (1). In the 1940s a series of catalyst developments based on cuprous oxide and cupric selenites led to a
vapor-phase propylene oxidation route to acrolein (7,8). In 1959 Shell was the first to commercialize this propylene oxidation to acrolein process. These
early propylene oxidation catalysts were capable of only low per pass propylene conversions (ca 15%) and therefore required significant recycle of unreacted
propylene (9—11).
In 1957 Standard Oil of Ohio (Sohio) discovered bismuth molybdate catalysts capable of producing high yields of acrolein at high propylene
conversions (>90%) and at low pressures (12). Over the next 30 years much industrial and academic research and development was devoted to improving
these catalysts, which are used in the production processes for acrolein, acrylic acid, and acrylonitrile. All commercial acrolein manufacturing processes
known today are based on propylene oxidation and use bismuth molybdate based catalysts.
Many key improvements and enhancements to the bismuth molybdate based propylene oxidation catalysts have occurred over the past thirty years.
These are outlined in the following tabulation.
Year Catalyst Company Refs.
1957 BiMo Sohio 1959 BiMoFe Knapsack 1964 BiMoFeNiCo Nippon Kayaku 1965 BiMoFeNiCoP Nippon Kayaku 1970 BiMoFeNiCoP К Nippon Kayaku 1970 BiMoFeCo W Si К Nippon Shokubai 12 13 14,15 16 17 18,19
Today the most efficient catalysts are complex mixed metal oxides that consist of Bi, Mo, Fe, Ni, and/or Co, K, and either P, B, W, or Sb. Many
additional combinations of metals have been patented, along with specific catalyst preparation methods. Most catalysts used commercially today are
extruded neat metal oxides as opposed to supported impregnated metal oxides. Propylene conversions are generally better than 93%. Acrolein selectivities
of 80 to 90% are typical.
With the maturing of the propylene oxidation catalyst area, attention in the 1980s was more focused on reaction process related improvements.
The catalytic vapor-phase oxidation of propylene is generally carried out in a fixed-bed multitube reactor at near atmospheric pressures and elevated
temperatures (ca 350°C); molten salt is used for temperature control. Air is commonly used as the oxygen source and steam is added to suppress the
formation of flammable gas mixtures. Operation can be single pass or a recycle stream may be employed. Recent interest has focused on improving process
efficiency and minimizing process wastes by defining process improvements that use recycle of process gas streams and/or use of new reaction diluents
(20-24).
The reaction is very exothermic. The heat of reaction of propylene oxidation to acrolein is 340.8 kJ /mol (81.5 kcal/mol); the overall reactions
generate approximately 837 kJ/mol (200 kcal/mol). The principal side reactions produce acrylic acid, acetaldehyde, acetic acid, carbon monoxide, and
carbon dioxide. A variety of other aldehydes and acids are also formed in small amounts. Proprietary processes for acrolein manufacture have been
described (25,26).
Product Recovery. The reactor effluent gases are cooled to condense and separate the acrolein from unreacted propylene, oxygen, and other
low-boiling components (predominandy nitrogen). This is commonly accomplished in two absorption steps where (7) aqueous acrylic acid is condensed
from the reaction effluent and absorbed in a water-based stream, and (2) acrolein is condensed and absorbed in water to separate it from the propylene,
nitrogen, oxygen, and carbon oxides. Acrylic acid may be recovered from the aqueous product stream if desired. Subsequent distillation refining steps
separate water and acetaldehyde from the crude acrolein. In another distillation column, refined acrolein is recovered as an azeotrope with water. A typical
process flow diagram is given in Figure 1.
Fig. 1. A typical process flowsheet for acrolein manufacture. A, Fixed-bed or fluid-bed reactor; B, quench cooler; C, absorber; D, stripper; E and F,
fractionation stills.
Economic Aspects
Presently, worldwide refined acrolein nameplate capacity is about 113,000 t/yr. Degussa has announced a capacity expansion in the United States by
Kirk-Othmer Encyclopedia of Chemical Technology (4th Edition)
123
ACROLEIN AND DERIVATIVES
Voll
building a 36,000 t/yr acrolein plant in Theodore, Ala. to support their methionine business (27). The key producers of refined acrolein are as noted in
Table 2.
Table 2. Refined Acrolein Producers
Producer Annual nameplate capacity, 103 t/yr
United States Union Carbide Western Europe Degussa (Germany) Atochem (France) Japan 36 30 30
Daicel Ohita Chem. Sumitomo 10 4.5 2.3
a Estimated (5).
Of these producers, Atochem, Degussa, and Daicel are reported to be in the merchant acrolein business. Union Carbide supplies only the acrolein
derivative markets. Ш1фпе-Рои1епс also produces acrolein, primarily as a nonisolated intermediate to make methionine. A number of other small scale
plants are located worldwide which also produce acrolein as an intermediate to make methionine.
The significance of industrial acrolein production may be clearer if one considers the two major uses of acrolein—direct oxidation to acrylic acid and
reaction to produce methionine via 3-methylmercaptopropionaldehyde. In acrylic acid production, acrolein is not isolated from the intermediate production
stream. The 1990 acrylic acid production demand in the United States alone accounted for more than 450,000 t/yr (28), with worldwide capacity
approaching 1,470,000 t/yr (29). Approximately 0.75 kg of acrolein is required to produce one kilogram of acrylic acid. The methionine production process
involves the reaction of acrolein with methyl mercaptan. Worldwide methionine production was estimated at about 170,000 t/yr in 1990 (30). (See Acrylic
ACID AND DERIVATIVES; AMINO ACIDS, SURVEY.)
Specifications and Analysis
Acrolein is produced according to the specifications in Table 3. Acetaldehyde and acetone are the principal carbonyl impurities in freshly distilled acrolein.
Acrolein dimer accumulates at 0.50% in 30 days at 25°C. Analysis by two gas chromatographic methods with thermal conductivity detectors can determine
all significant impurities in acrolein. The analysis with Porapak Q, 175—300 |lm (50—80 mesh), programmed from 60 to 250°C at 10°C/min, does not
separate acetone, propionaldehyde, and propylene oxide from acrolein. These separations are made with 20% Tergitol E-35 on 250—350 |lm (45—60 mesh)
Chromosorb W, kept at 40°C until acrolein elutes and then programmed rapidly to 190°C to elute the remaining components.
Table 3. Specifications for Acrolein
Requirement_____________________________________________
acrolein, wt %, min
total carbonyl compounds other than acrolein, wt %, max
hydroquinone, wt %
water, wt %, max
specific gravity, 20°/20°C
pH of 10% solution in water at 25°C, max
Limit
95A
1.5
0.10-0.25
3.0
0.842-0.846
6.0
Alternatively a bonded poly(ethylene glycol) capillary column held at 35°C for 5 min and programmed to 190°C at 8°C/min may be employed to
determine all components but water. The Karl-Fischer method for water gives inaccurate results.
Hydroquinone can be determined spectrophotometrically at 292 nm in methanol after a sample is evaporated to dryness to remove the interference
of acrolein. An alternative method is high performance liquid chromatography on 10-|lm LiChrosorb RP-2 at ambient temperature with 2.0 mL/min of
20%(v/v) 2,2,4-trimethylpentane, 79.20% chloroform, and 0.80 % methanol with uv detection at 292 nm.
Reactions and Derivatives
Acrolein is a highly reactive compound because both the double bond and aldehydic moieties participate in a variety of reactions.
Oxidation. Acrolein is readily oxidized to acrylic acid, C3H4O2 [79-10-7] y by passing a gaseous mixture of acrolein, air, and steam over a catalyst
composed primarily of molybdenum and vanadium oxides (see Acrylic acid and derivatives). This process has been reviewed in a number of articles
(31-33).
CH2=CH—CHO --------->cat' CH2=CHCOOH
Virtually all of the acrylic acid produced in the United States is made by the oxidation of propylene via the intermediacy of acrolein.
Reduction. Because of a lack of discrimination between the double bond and carbonyl moieties, direct hydrogenation of acrolein leads to the
production of mixtures containing propyl alcohol, C3HgO [71 -28-8]> propionaldehyde, C3H3O [123-38-6]., and allyl alcohol, C3H3O [107-18-16]. Both the
carbonyl (34—40) and olefin (41—45) moieties maybe selectively reduced (35,43,46—65).
CH2=CH—CHO CH2=CH-CH2OH
CH2=CH—CHO CH3CH2CHO
The vapor-phase reduction of acrolein with isopropyl alcohol in the presence of a mixed metal oxide catalyst yields allyl alcohol in a one-pass yield of
90.4%, with a selectivity (60) to the alcohol of 96.4%. Acrolein may also be selectively reduced to yield propionaldehyde by treatment with a variety of
reducing reagents.
Reactions with Alcohols. The addition of alcohols to acrolein may be catalyzed by acids or bases. By the judicious choice of reaction
conditions the regioselectivity of the addition maybe controlled and alkoxy propionaldehydes, acrolein acetals, or alkoxypropionaldehyde acetals produced
in high yields (66).
Kirk-Othmer Encyclopedia of Chemical Technology (4th Edition)
124
ACROLEIN AND DERIVATIVES
Voll
/OR'
CH2=CH—CH
4OR'
ROH + CH2 =CH—CHO
ROCH2CH2CHO
/OR'
R'OCH2CH2CH
XOR'
Table 4 lists a variety of alkoxypropionaldehydes and certain of their properties (67). Alcohols up to я-butyl have been added to acrolein in this fashion.
Methyl, ethyl, and allyl alcohols react with ease, while the addition of hexyl or octyl alcohol proceeds in low yields. Although the alkoxypropionaldehydes
have found only limited industrial utility, it is anticipated that they will find use as replacements for more toxic solvents. Furthermore, the
alkoxypropionaldehydes may readily be reduced to the corresponding alkoxypropanols, which may also have desirable properties as solvents.
Table 4. Alkoxypropionaldehydes from Acrolein
Compound added Product
Structure CAS Registry Number Molecular formula bp, °C Pressure at bp, kPaa
ch3oh CH3OCH2CH2CHO [2806-84-0] C4HgO2 49 6.7
C2H5OH C2H5OCH2CH2CHO [2806-85-1] ^5^10^2 57 5.3
fl-CIIOIl »-C3H7OCH2CH2CHO [19790-53-5] РД12О2 88 12
iso-C3H7OH iso-C3H7OCH2CH2CHO [39563-51 ^1] РД12О2 45 2
fl-CIIOIl »-C4H9OCH2CH2CHO [13159-34-2] C7H14O2 60 2
CH2=CHCH2OH CH2=CHCH2OCH2CH2CHO [44768-60-7] РД10О2 55 1.9
C1CH2CH2OH C1CH2CH2OCH2CH2CHO [5422-33-3] C5H9C1O2 75.5 0.67
CH2=C(CH3)CH2OH CH2=C(CH3)CH2OCH2CH2CHO [76618-56-9] C7H12O2 62 1.2
a To convert kPa to mm Hg, multiply by 7.5.
Acrolein acetals have also been prepared in high yields (66). The formation of the acetal requires the careful control of reaction conditions to avoid
additions to the double bond. Table 5 lists a variety of acrolein acetals that have been prepared and their boiling points (68).
Table 5. Acrolein Acetals
Compound added Product
Structure CAS Registry Number Molecular formula Ър, °с Pressure at bp, kPaa
C2H5OH CH=CHCH(OC2H5)2 [3054-95-3] C7H14O2 63 12.1
CH3OH CH2=CHCH(OCH3)2 [6044-68^-] C5H10O2 40 16
xCIIOII CH2=CHCH(OC3H7)2 [20615-55-8] СдН18О2 87.5-88
iso-C3H7OH CH2=CHCH(Oiso-C3H7)2 [14091-80-6] СдН18О2 54 1.6
xCII.OII CH2=CHCH(OC4H9)2 [45094-50-6] СцН22О2 39 1.6
CJLOLOH 6 5 2 CH2=CHCH(OCH2C6H5)2 [40575-57-3] C17H18O2 120 6.7 x 10~4
CH2=CHCH2OH CH2=CHCH(OCH2CH=CH2)2 [3783-83-3] С9Н14О2 75 3.7
To convert kPa to mm Hg multiply by 7.5.
The addition of certain glycols and polyols to acrolein leads to the production of cyclic acetal derivatives.
CH2=CH—CHO +
OH
I
CH ZR
i 4CH
I
OH
CH2=CH—CH J
b^R
Cyclic acrolein acetals are, in general, easily formed, stable compounds and have been considered as components in a variety of polymer systems.
Table 6 lists a variety of previously prepared cyclic acrolein acetals and their boiling points (69).
Table 6. Acrolein Cyclic Acetals
Product
Compound added Structure CAS Molecular bp, °C Pressure at Registry formula bp, kP:f Number
HOCH2CH2OH [3984-22-3] C5H8O2 115.5-116.5 CH2=CH—( J O-J
HOCH2CH(OH)CH2OH [4313-32-0] c6H10O3 80 0.4 CH2=CH—( ] o-"x CH2OH
Kirk-Othmer Encyclopedia of Chemical Technology (4th Edition)
125
ACROLEIN AND DERIVATIVES
Voll
C(CH2OH)4
[78-19-3]
сн2=сн—< Y 2—ch=ch2
^11^16^4 142—143 m.p.
41-42
C16H24°5 198-199
(CH2OH)2
(CH2OH)2
HOCH2CH2CH2OH
[5935-25-1]
^6^10^2 65—66
To convert kPa to mm Hg, multiply by 7.5.
No CAS Registry Number has been assigned.
Reactions of acrolein with alcohols producing high yields of alkoxypropionaldehyde acetals are also known. Examples of these are displayed in Table
7 (70). The alkoxypropionaldehyde acetals may be useful as solvents or as intermediates in the synthesis of other useful compounds.
Table 7. Alkoxypropionaldehyde Acetals
Product
Compound added Structure CAS Registry Molecular bp, °c Pressure at
Number formula bp, kPa’
C2H5OH C2H5OCH2CH2CH(OC2H5)2 [7789-92-6] C9H20O3 69-70 1.3
CH3OH CH3OCH2CH2CH(OCH3)2 [14315-97-0] ^6^14^3 94-95 18.9
s-CIIOII C3H7OCH2CH2CH(OC3H7)2 [53963-14-7] C12H26O3 109 1.6
iso-C3H7OH C3H7OCH2CH2CH(Oiso-C3H7)2 [89769-16^1] C12H26O3 89 1.5
CJLOLOH 6 5 2 C.HXH,OCH,CH,CH(OCH,C.HA, 6b 2 2 2 n 2 6 5' 2 b C I l ( ) 243-246 0.07
CH2=CHCH2OH CH2=CHCH2OCH2CH2CH(OCH2CH=C h2)2 [8431-07-1] 113-114 1.3
s-CII.OII C4H9OCH2CH2CH(OC4H9)2 [53963-15-8] C15H32O3 143-144 1.3
»-C5HuOH C5H11OCH2CH2CH(OC5H11)2 [53963-17-6] TT <"18r-L38<A 153-155 0.13
C1CH2CH2OH C1CH2CH2OCH2CH2CH(OCH2CH2C1)2 [688-78-8] C9H17C13 o3 160-162 0.7
C2H5SH C2H5SCH2CH2CH(SC2H5)2 [19157-17-6] C9H20S3 143 1.3
C2H5SH + HC1 C1CH2CH2CH(SC2H5)2 [19157-16-5] C7H15C1S2 115-117 1.5
CH2=CHCH2OCH2CH2CHO + CH2=CHCH2OCH2CH2CH(OC2H5)2 [107023-55-2 ^10^20^3 86 1.7
C2H5OH ]
C2H5OH + HC1 C1CH2CH2CH(OC2H5)2 [35573-93^1] C7H15C1O 58-62 1.1
CH3OH + HC1 C1CH2CH2CH(OCH3)2 [35502-06-8] C5H11C1O 45 1.6
C2H5OH + HBr BrCH2CH2CH(OC2H5)2 [59067-07-1] C7H15BrO 80-90 2.7
i-CIIOII + HC1 C1CH2CH2CH(OC3H7)2 [35502-07-9] C9H19C1O 87 2.7
iso-C4H9OH + HC1 ClCH2CH2CH(Oiso-C4H9)2 [35502-09-1] CnH23Cl °2 105 0.6
To convert kPa to mm Hg, multiply by 7.5.
b No CAS Registry Number has been assigned.
Addition of Mercaptans. One of the largest uses of acrolein is the production of 3-methylmercaptopropionaldehyde [3268-49-3], which is an
intermediate in the synthesis of D,L-methionine [59-51 -8], an important chicken feed supplement.
CH2=CH—CHO + CH3SH CH3SCH2CH2CHO
3-Methylmercaptopropionaldehyde is also used to make the methionine hydroxy analog CH3SCH2CH2CH(OH)COOH [583-91 -5], which is used
commercially as an effective source of methionine activity (71). AU commercial syntheses of methionine and methionine hydroxy analog are based on the
use of acrolein as a raw material. More than 170,000 tons of this amino acid are produced yeady (30) (see Amino acids). One method for the preparation of
methionine from acrolein via 3-methylmercaptopropionaldehyde is as follows.
XS. .CH2 XS. .CH2 ON
CH3 CH2 CHO ----------- CH3 CH2 CH
OH
1. NH3
2. hydrolysis
ZS ZCH2 ZCOOH
сн3 он2 xch
nh2
Kirk-Othmer Encyclopedia of Chemical Technology (4th Edition)
126
ACROLEIN AND DERIVATIVES
Voll
Methyl mercaptan adds to acrolein in nearly quantitative yields in the presence of a variety of basic catalysts (72,73). Other
alkyhnercaptopropionaldehydes produced by the reaction of acrolein with a mercaptan are known. Table 8 lists a variety of these and their boiling points
(74).
Table 8. Alkylmercaptopropionaldehydes from Addition of Mercaptans to the Acrolein Double Bond
Compound added Product
Structure CAS Registry Number Molecular formula bp, °c Pressure at bp, kPaa
ch3sh CH3SCH2CH2CHO [3268-49-3] C4H8OS 54-56 1.5
C2H5SH C2H5SCH2CH2CHO [5454.45.5] C5H10OS 63-65 1.5
»-C3H7SH »-C3H7SCH2CH2CHO [44768-66-3] C6H12OS 75 0.86
CIICIISII 6 b 2 CII.CIISCIICIICIIO 6 5 2 2 2 [16979-569-3] C1QH12OS 142.3 0.8
CH3C(O)SH CH3C(O)SCH2CH2CHO [53943-93^1] C5H8O2S 89 1.5
CF3SH cf3sch2ch2cho [586919-54-6] c4f3h5os 46.5 2.7
To convert kPa to mm Hg, multiply by 7.5.
Reaction with Ammonia. Although the liquid-phase reaction of acrolein with ammonia produces polymers of litde interest, the vapor-phase
reaction, in the presence of a dehydration catalyst, produces high yields of |3-picoline [108-99-6] and pyridine [110-86-4] in a ratio of approximately 2/1.
CH2
2 || + NH3
CH
XCHO
д
catalyst
|3-Picoline may serve as an important source of nicotinic acid [59-67-6] for dietary supplements. A variety of substituted pyridines may be prepared from
acrolein (75—83).
Diels-Alder Reactions. Acrolein may participate in Diels-Alder reactions as the dieneophile or as the diene (84—89).
Acrolein as Dienophile. The participation of acrolein as the dienophile in Diels-Alder reactions is, in general, an exothermic process. Dienes
such as cyclopentadiene and 1-diethylamino-l,3-butadiene react rapidly with acrolein at room temperature.
Several Diels-Alder reactions in which acrolein participates as the dienophile are of industrial significance. These reactions involve butadiene or
substituted butadienes and yield the corresponding 1,2,5,6-tetrahydrobenzaldehyde derivative (THBA); examples are given in Table 9 (90). These products
have found use in the epoxy and perfume/fragrance industries.
Table 9. Products of Dienes Added to Acrolein*
THBA Product5 CAS Registry Number Time, h bp, °C Pressure at bp, kPa'
THBA [16)69-569-5] 1 51-52 1.7
2,5-tw/r>-iiietlivleiie-TI IBA [5453-869-5] several 70-72 2.7
4-methyl-THBA [75669-64-7] 3 70-71 1.9
2,5-twA-etlivleiie-TI IBA [4695769-95^] 8 84-85 1.6
a Reaction at 100°C unless otherwise noted; yields are 90—95%.
THBA from butadiene; 2,5-t.wA'-iiiethyleiie from 1,3-cyclopentadiene; 4-methyl-THBA from 2-methylbutadiene; 2,5-^6fo-ethylene from
1,3-cyclohexadiene.
To convert kPa to mm Hg, multiply by 7.5.
dAt25°C.
Many other acrolein derivatives produced via Diels-Alder reactions are classified as flavors and fragrances. Among those of commercial interest are
lyral, C13H22O2, (1) [31906-04-4] (91,92) andmyrac aldehyde, C13H2QO, (2) [80450-04-0] (92,93).
CH3 CH3
'с /СНг
нох CH2 4CH2
CHO
CH3
CH3—/
CH
Acrolein as Diene. An industrially useful reaction in which acrolein participates as the diene is that with methyl vinyl ether. The product,
methoxy dihydropyran, is an intermediate in the synthesis of glutaraldehyde [111 -30-8]
Kirk-Othmer Encyclopedia of Chemical Technology (4th Edition)
127
ACROLEIN AND DERIVATIVES
Voll
^CH2
CH
I
A
H CH2
zc<2
H2C CH2
OHC CHO
+ CH3OH
In addition to its principal use in biocide formulations (94), glutaraldehyde has been used in the film development and leather tanning industries (95). It
may be converted to 1,5-pentanediol [111 -29-5] or glutaric acid [110-94-1].
Production of Acrolein Dimer. Acting as both the diene and dienophile, acrolein undergoes a Diels-Alder reaction with itself to produce
acrolein dimer, 3,4-dihydro-2-formyl-2H-pyran, C6HgO2 [100-73-2]. At room temperature the rate of dimerization is very slow. However, at elevated
temperatures and pressures the dimer may be produced in single-pass yields of 33% with selectivities greater than 95%.
^CH2
CH CH2
I + II
A
H CH2 CHO
Acrolein dimer may be easily hydrated to CC-hydroxyadipaldeliyde, C f I О , [141 -31 -1] which may then be reduced to 1,2,6-hexanetriol [106-69-4].
1,2,6-Hexanetriol, C6H14O3, is used in a variety of pharmaceutical and cosmetics industry applications and is currendy viewed as an alternative to glycerol as
a humectant.
H+, H20
CH2
H2C 'CH2
OHC .CH
HO 'CHO
CH2
H2 H2C 'CH2
cat HOCH2 CH
H0Z 'CHO
Polymerization. In the absence of inhibitors, acrolein polymerizes readily in the presence of anionic, cationic, or free-radical agents. The
resulting polymer is an insoluble, highly cross-linked solid with no known commercial use.
Copolymers, including one obtained by the oxidative copolymerization of acrolein with acrylic acid, a product of commercial interest, are known.
There is a great variety of potential acrolein copolymers; however, significant commercial uses have not been developed. The possible application of
polyacroleins or copolymers as polymeric reagents, polymeric complexing agents, and polymeric carriers has been recognized. Several articles give
preparative methods as well as properties of the homopolymers and copolymers of acrolein (4).
Direct Uses of Acrolein
Because of its antimicrobial activity, acrolein has found use as an agent to control the growth of microbes in process feed lines, thereby controlling the rates
of plugging and corrosion (see Wastes, industrial).
Acrolein at a concentration of <500 ppm is also used to protect liquid fuels against microorganisms. The dialkyl acetals of acrolein are also useful in
this application. In addition, the growth of algae, aquatic weeds, and mollusks in recirculating process water systems is also controlled by acrolein.
Currendy, acrolein is used to control the growth of algae in oil fields and has also been used as an H2S scavenger (96). The ability to use acrolein safely in
these direct applications is a prime concern and is a deterrent to more widespread use.
Health and Safety
Toxicity The most frequendy encountered hazards of acrolein are acute toxicity from inhalation and ocular irritation (97). Because of its high
volatility, even a small spill can lead to a dangerous situation. Acrolein is highly irritating and a potent lacrimator. The odor threshold (50%), 0.23 mg/m3
[0.09 ppm (v/v)], is close to the OSHA permissible exposure limit (PEL) and ACGIH TLV-TWA8, 0.25 mg/m3 (0.1 ppm). The odor threshold for 100%
recognition, 0.5 mg/m3 (0.2 ppm), is above the TLV (98) but the OSHA and ACGIH short-term exposure limit (STEL) is 0.8 mg/m3 (0.3 ppm), so
perception of acrolein will generally provide adequate warning.
Concentrations of acrolein vapor as low as 0.6 mg/m3 (0.25 ppm) may irritate the respiratory tract, causing coughing, nasal discharge, chest
discomfort or pain, and difficulty with breathing (99). A concentration of 5—10 mg/m3 (2—4 ppm) is intolerable to most individuals in a minute or two (97)
and is close to the concentration considered immediately dangerous to life and health (100). At higher concentrations there may be lung injury from inhaled
acrolein, and prolonged exposure may be fatal. In a short time, exposure to 25 mg/m3 (10 ppm) or more is lethal to humans (101).
Acrolein vapor is highly irritating to the eyes, causing pain or discomfort in the eye, profuse lacrimation, involuntary blinking, and marked reddening
of the conjunctiva. Splashes of liquid acrolein will produce a severe injury to the eyelids and conjunctiva and chemical bums of the cornea.
A small amount of acrolein may be fatal if swallowed. It produces bums of the mouth, throat, esophagus, and stomach. Signs and symptoms of
poisoning may include severe pain in the mouth, throat, chest, and abdomen; nausea; vomiting, which may contain blood; diarrhea; weakness and
dizziness; and collapse and coma (99).
Acrolein is highly toxic by skin absorption. Brief contact may result in the absorption of harmful and possibly fatal amounts of material. Skin
contact causes severe local irritation and chemical bums. Poly(vinyl chloride) coated protective gloves should be used (99).
There is no specific antidote for acrolein exposure. Treatment of exposure should be directed at the control of symptoms and the clinical condition.
Most of the harmful effects of acrolein result from its highly irritating and corrosive properties.
Chronic Exposures Chronic human exposure is unlikely due to the lack of tolerance to acrolein. There is no evidence that acrolein is a human
carcinogen (102), and inadequate animal data preclude any evaluation of its carcinogenicity (103). Acrolein has shown low, borderline, or moderate
mutagenicity in bioassays, depending on the test system and frame of reference (104,105). Animal studies that gave litde indication of teratogenicity of
acrolein are insufficient for determining whether acrolein is a teratogen (106). Some embryotoxicity over a narrow dose range with acrolein administered by
injection indicates that acrolein is quite embryotoxic (106).
Flammability Acrolein is very flammable; its flash point is <0° C, but a toxic vapor cloud will develop before a flammable one. The flammable
limits in air are 2.8% and 31.0% lower and upper explosive limits, respectively by volume. Acrolein is only partly soluble in water and will cause a floating
fire, so alcohol type foam should be used in firefighting. The vapors are heavier than air and can travel along the ground and flash back from an ignition
source.
Reactivity Acrolein is a highly reactive chemical, and contamination of all types must be avoided. Violent polymerization may occur by
contamination with either alkaline materials or strong mineral acids. Contamination by low molecular weight amines and pyridines such as CC-picoline is
especially hazardous because there is an induction period that may conceal the onset of an incident and allow a contaminant to accumulate unnoticed. After
the onset of polymerization the temperature can rise precipitously within minutes.
Acrolein reacts slowly in water to form 3-hydroxypropionaldehyde and then other condensation products from aldol and Michael reactions. Water
dissolved in acrolein does not present a hazard. The reaction of acrolein with water is exothermic and the reaction proceeds slowly in dilute aqueous
solution. This will be hazardous in a two-phase adiabatic system in which acrolein is supplied from the upper layer to replenish that consumed in the lower,
aqueous, layer. The rate at which these reactions occur will depend on the nature of the impurities in the water, the volume of the water layer, and the rate
Kirk-Othmer Encyclopedia of Chemical Technology (4th Edition)
128
ACROLEIN AND DERIVATIVES
Voll
of heat removal. Thus a water layer must be avoided in. stored acrolein.
Dimerization of acrolein is very slow at ambient temperatures but it can become a runaway reaction at elevated temperature (ca 90°C), a
consideration in developing protection against fire exposure of stored acrolein.
Storage and Handling
The following cautions should be observed: Do not destroy or remove inhibitor. Do not contaminate with alkaline or strongly acidic materials. Do not
store in the presence of a water layer. In the event of spillage or misuse that cause a release of product vapor to the atmosphere, thoroughly ventilate the
area, especially near floor levels where vapors will collect.
Acrolein produced in the United States is stabilized against free-radical polymerization by 1000—2500 ppm of hydroquinone and is protected
somewhat against base-catalyzed polymerization by about 100 ppm of acetic acid. To ensure stability, the pH of a 10% v/v solution of acrolein in water
should be below 6.
Since the principal hazard of contamination of acrolein is base-catalyzed polymerization, a "buffer" solution to shortstop such a polymerization is
often employed for emergency addition to a reacting tank. A typical composition of this solution is 78% acetic acid, 15% water, and 7% hydroquinone. The
acetic acid is the primary active ingredient. Water is added to depress the freezing point and to increase the solubility of hydroquinone. Hydroquinone (HQ)
prevents free-radical polymerization. Such polymerization is not expected to be a safety hazard, but there is no reason to exclude HQ from the formulation.
Sodium acetate may be included as well to stop polymerization by very strong acids. There is, however, a temperature rise when it is added to acrolein due
to catalysis of the acetic acid-acrolein addition reaction.
Materials of Construction Suitable materials of construction are steel, stainless steel, and aluminum 3003. Galvanized steel should not be
used. Plastic tanks and lines are not recommended.
Storage tanks should have temperature monitoring with alarms to detect the onset of reactions. The design should comply with all applicable
industry, federal, and local codes for a class IB flammable liquid. The storage temperature should be below 37.8°C. Storage should be under an atmosphere
of dry nitrogen and should vent vapors from the tank to a scrubber or flare.
Spill Disposal In treatment of spills or wastes the suppression of vapors is the first concern and the aquatic toxicity to plants, fish, and
microorganisms is the second. Normal procedures for flammable Equids should also be carried out.
Even small spills and leaks (<0.45 kg) require extreme caution. Unless the spill is contained in a fume hood, do not remain in or enter the area unless
equipped with full protective equipment and clothing. Self-contained breathing apparatus should be used if the odor of acrolein or eye irritation is sensed.
Small spills may be covered with absorbant, treated with aqueous alkalies, and flushed with water.
Acrolein is very highly toxic to fish and to the microorganisms in a biological wastewater treatment plant. Avoid drainage to sewers or to natural
waters. Safe, practical methods have been devised to handle contained spills of liquid acrolein. These entail covering the acrolein with 15 cm of ЗМ АТС
foam to suppress evaporation followed by either Q) removing some of the foam and igniting the vapors to destroy most of the acrolein under controlled
burning conditions, or (/») polymerizing the acrolein by the addition of a dilute (5 to 10%) aqueous sodium carbonate solution. In situations where the foam
covering and controlled burning are not feasible, the acrolein spill may be covered uniformly with dry sodium carbonate amounting to 60—120 kg/m3
(0.5—1 lb /gal) of acrolein, followed by dilution with 5 to 10 volumes of water per volume of acrolein. This procedure effectively destroys the acrolein by
polymerization but leaves water-insoluble residue. More water (ca 20 volumes) is needed to get a solution or fine suspension of polymer. Other alkalies,
such as dilute aqueous sodium hydroxide, will serve the same purpose but the polymerization is more violent than when the sodium carbonate is used.
Government Regulations
The Comprehensive Environmental Response, Compensation, and Liability Act of 1980 (CERCLA) requires notification to the National Response Center
of releases of quantities of hazardous substances equal to or greater than the reportable quantity (RQ) in 40 CFR 302.4, which is one pound (0.454 kg).
The Superfund Amendments and Reauthorization Act of 1986 (SARA) Tide III requires emergency planning based on threshold planning quantities
(TPQ) and release reporting based on RQs in 40 CFR part 355 (used for SARA 302, 303, and 304). The TPQ for acrolein is 500 lb (227 kg), and its RQ is 1
lb (0.454 kg). SARA also requires submission of annual reports of release of toxic chemicals that appear on the list in 40 CFR 372.65 (for SARA 313).
Acrolein appears on that list. This information must be included in all MSDSs that are copied and distributed for acrolein.
Acrolein is a DOT Flammable Liquid having subsidiary DOT hazard classifications of Poison В and Corrosive Material. It is also an inhalation
hazard that falls under the special packaging requirements of 49 CFR 173.3a.
BIBLIOGRAPHY
"Acrolein" in ECT 1st ed., Vol. 1, pp. 173—175, by R. L. Hasche, Tennessee Eastman Corporation; in ECT 1st ed; Suppl. 1, pp. 1—18, by H. R. Guest and
H. A. Stansbury, Jr., Union Carbide Chemicals Company; "Acrolein and Derivatives" in ECT 2nd ed., Vol. 1, pp. 255—274, by H. R. Guest, B. W. Kiff, and
H. A. Stansbury, Jr., Union Carbide Chemicals Company; in ECT 3rd ed., Vol. 1, pp. 277—297, by L. G. Hess, A. N. Kurtz, and D. B. Stanton, Union
Carbide Corporation.
1. H. Schulz and H. Wagner, Angew. Chem. 62, 105—118 (1950).
2. S. A. Ballard, H. de ViFinch, В. P. Geyer, G. W. Heame, C. W. Smith, and R. R. Whetstone, World Petroleum Congress Proceedings of the 4th Congress,
Pome, 1955., Sect. 4, Part C, pp. 141—154.
3. W. M. Weigert andH. Haschke, Chem. Ztg. 98, 61—69 (1974).
4. R. C. Schulz in J. I. Kroschwitz, ed., Encyclopedia ofPolymer Science and Engineering, 2nd ed., Vol. 1, Wiley-Interscience, New York, 1985, pp. 160—169.
5. T. Ohara, T. Sato, N. Shimizu, G. Prescher, H. Schwind, and O. Weiberg, Ullman's Encyclopedia of Industrial Chemistry, 5th ed., Vol. Al, 1985, pp.
149-160.
6. C. W. Smith, ed., Acrolein, John Wiley & Sons, Inc., New York, 1962.
7. U.S. Pat. 2,383,711 (Aug. 28, 1945), A. Clark and R. S. Shutt (to Battelle Memorial Institute).
8. U.S. Pat. 2,593,437 (Apr. 22, 1952), E. P. Goodings and D. J. Hadley (to Distillers Co., Ltd.).
9. U.S. Pat. 2,451,485 (Oct. 19, 1948), G. W. Heame andM. L. Adams (to Shell Development Co.).
10. U.S. Pat. 2,486,842 (Nov. 1, 1949), G. W. Heame andM. L. Adams (to Shell Development Co.).
11. U.S. Pat. 2,606,932 (Aug. 12, 1952), R. M. Cole, C. L. Cunn, and G. J. Pierotti (to Shell Development Co.).
12. U.S. Pat. 2,941,007 (June 14, 1960), J. L. Callahan, R. W. Foreman, and F. Veatch (to Standard Oil Co., Ohio).
13. U.S. Pat. 3,171,859 (Mar. 2, 1965), K. Sennewald, K. Gehramann, W. Vogt, and S. Schaefer (to Knapsack-Griesheim, A.G.).
14. U.S. Pat. 3,454,630 (July 8, 1969), G. Yamaguchi and S. Takenaka (to Nippon Kayaku Co., Ltd.).
15. U.S. Pat. 3,576,764 (Apr. 27, 1971), G. Yamaguchi and S. Takenaka (to Nippon Kayaku Co., Ltd.).
16. U.S. Pat. 3,522,299 (July 28, 1970), S. Takenaka and G. Yamaguchi (to Nippon Kayaku Co., Ltd.).
17. U.S. Pat. 3,959,384 (May 25, 1976), S. Takenaka, Y. Kido, T. Shimabara, and M. Ogawa (to Nippon Kayaku Co., Ltd.).
18. U.S. Pat. 3,825,600 (July 23, 1974), T. Ohara, M. Ueshima, and I. Yanagisawa (to Nippon Shokubai K.K.).
19. U.S. Pat. 3,907,712 (Sept. 23, 1975), T. Ohara, M. Ueshima, and I. Yanagisawa (to Nippon Shokubai K.K.).
20. U.S. Pat. 4,147,885 (Apr. 3, 1979), N. Shimizu, I. Yanagisawa, M. Takata, and T. Sato (to Nippon Shokubai K.K.).
21. U.S. Pat. 4,031,135 (June 21, 1977), H. Engelbach and co-workers (to BASF Aktiegesellschaft).
22. Eur. Pat. Appl. 253,409 (July 17, 1987), W. Etzkom and G. Harkreader (to Union Carbide Corp.).
Kirk-Othmer Encyclopedia of Chemical Technology (4th Edition)
129
ACROLEIN AND DERIVATIVES
Voll
23.
24.
25.
26.
27.
28.
29.
30.
31.
32.
33.
34.
35.
36.
37.
38.
39.
40.
41.
42.
43.
44.
45.
46.
47.
48.
49.
50.
51.
52.
53.
54.
55.
56.
57.
58.
59.
60.
61.
62.
63.
64.
65.
66.
67.
68.
69.
70.
71.
72.
73.
74.
75.
76.
77.
78.
79.
80.
81.
82.
83.
84.
85.
86.
87.
88.
89.
90.
91.
92.
93.
94.
95.
96.
Eur. Pat. Appl. 257,565 (Aug. 20,1987), W. Etzkom and G. Harkreader (to Union Carbide Corp.).
Eur. Pat. Appl. 293,224 (May 27,1988), M. Takata, M. Takamura, S. Ucliida, and M. Sasaki (to Nippon Shokubai K.K.).
G. E. Schaal, Hydrocarbon Process. 52, 218 (1973).
W. Weigert, Chem. Eng. 80, 68 (1973).
Chem. Eng. News 19 (Feb. 15, 1988).
Chem. Mark. Refl. 54 (Nov. 12, 1990).
Chem. Mark. Rep. 22 (Mar. 12, 1990).
Chem. Mark. Rep. 20 (June 25, 1990).
Jpn. Kokai Tokkyo Koho JP 63/146841 AZ [88/146841] (June 18,1988), K. Sarumaru and T. Shibano (to Mitsubishi Petrochemical Co. Ltd.).
J. B. Black, J. D. Scott, E. M. Serwicka, and J. B. Goodenough,/. Catal. 106, 16—22 (1987).
E. M. Serwicka, J. B. Black, and J. B. Goodenough,/. Catal. 106, 23—37 (1987).
V. Kijenski, M. Glinski, and J. Reinhercs, Stud. Surf. Sci. Catal. 41, 231—240 (1988).
Y. Nagase and K. Wada, Ibaraki Daigaku Kogakubu Kenkyu Shuho 33, 223—228 (1985).
Y. Nagase, H. Hattori, and K. Tanabe, Chem. Eett. 10, 1615—1618 (1983).
T. H. Vanderspurt, Ann. N.Y. Acad. Sci. 333, 155—164 (1980).
U.S. Pat. 4,127,508 (Nov. 28,1978), T. H. Vanderspurt (to Celanese Corp.).
Ger. Offen. DE2734811 (Feb. 9,1978), T. H. Vanderspurt (to Celanese Corp.).
T. Nakano, S. Umano, Y. Kino, and Y. M. Ishii,/. Org. Chem. 53, 3752—3757 (1988).
M. A. Aramendia, V. Borau, and co-workers, React. Kinet. Catl. Eett. 36, 251—256 (1988).
L. M. Ryzhenko and A. D. Shebaldova, Khim. Tekhnol. Elementoorg. Soedin. Polim. 14—19 (1984).
D. L. Reger, M. M. Habib, and D. V. RmRyVetrahedron Eett. 115—116 (1979).
M. Terassawa, K. Kaneda, T. Imanaka, and S. Tern,/. Catal. 51, 406—421 (1978).
J. A. Cabello, J. M. Campello, A. Garcia, D. Luna, and co-workers, Bull. Soc. Chim. Belg. 93, 857—862 (1984).
K.-J. Yang and C. S. Chein, Inorg. Chem. 26, 2732-2733 (1987).
Z. Poltarzewski, S. Galvagno, R. Pietropaolo, and P. Slaili, /. Catal. 102, 190—198 (1986).
M. Funakoshi, H. Komiyama, and H. Inoue, Chem. Eett. 245—248 (1985).
A. D. Shabaldova, V. N. Kravtsova, N. M. Sorokina, and co-workers, in Nukleojil'nye Reacts. Karbonil'nykh Soedin. (conference proceedings, Saratov,
USSR) 87-89 (1982).
G. P. Pez and R. A. Grey, Fund. Rat. Homogenous Catal. 4, 97—116 (1984).
J. M. Campello, A. Garcia, D. Luna, and J. M. Marinas, React. Kinet. Catal. Eett. 21, 209—212 (1982).
Jpn. Pat. Jp 57/91743 AZ [82/917343] (June 8, 1982) (to Agency of Ind. Sci. & Tech.).
G. V. Kudryavtsev, A. Yu Stakheev, and G. V. Lisichkin, Zh. Vses. Khim. Ova. 27, 232—233 (1982).
J. M. Campello, A. Garcia, D. Luna, and J. M. Marinas, Bull. Soc. Chim. Belg. 91, 131—142 (1982).
R. A. Grey, G. P. Pez, and A. WalloJ. Am. Chem. Soc. 103, 7536-7542 (1981).
K. Murata, A. Matsuda, Bull. Chem. Soc. Jap. 54, 1989—1900 (1981).
K. Kaneda, M. Terasawa, T. Imanaka, and co-workers, Fund. Rar. Homogenous Catal. 3, 671—690 (1979).
Y. Nagase, Ibaraki Daigaku Kogakubu Kenkyu Shuho 33, 217—221 (1985).
Eur. Pat. Appl. EP 183225 Al (June 4, 1986), Y. Shimasaki, Y. Hino, and M. Ueshima (to Nippon Shokubai Kagaku Kogyo Co., Ltd.).
A. Alba, M. A. Aramendia, V. Borau, C. Jimenez, and co-workers, React. Kinet. Catal. Eett. 25, 45—50 (1984).
V. P. Kukolev, N. A. Balyushima, and G. H. Chukhadzhyan, Arm. Khim. Zh. 35, 688—690 (1982).
G. Horanyi and K. Torkos, J. Electroanal. Chem. InterfacialElectrochem. 136, 301 (1982).
U.S. Pat. 4,292,452A (Sept. 29,1981), R. J. Lee, D. H. Meyer, and D. M. Senneke (to Standard Oil Co.).
R. W. Hoffman andT. Herold, Chem. Ber. 114, 375—383 (1981).
Y. Nagse and T. Washiyama, Ibaraki Daigaku Kogakubu Kenkyu Shuho 27, 171—178 (1979).
G. V. Kryshtal, D. Dvorak, Z. Arnold, and L. A. Yanovskaya, Isv. Akad. Nauk. l.L'R, Ser. Khim. 4, 921—923 (1986).
Ref. 6, p. 140 and references therein.
Ref. 6, p. 122 and references therein.
Ref. 6, pp. 124—125 and references therein.
Ref. 6, p. 130 and references therein.
U.S. Pat. 4,353,924 (Oct. 12,1982), J. W. Beher, D. L. Mansfield, and D. J. Weinkauff (to Monsanto Company).
Rom. Pat. RO 85095B (Oct. 30, 1984), A. M. Pavlouschi, L. Levinta, and G. H. Gross (to Combinatul Petrochimic, Pitesti).
Jpn. Kokai Tokkyo Koho JP 55/16135 [80/16135] (Apr. 30,1980), (to Anahi Chemical Industry Co., Ltd.).
Ref. 6, p. 118 and references therein.
J. Viala and M. Santelli, Synthesis 395—397 (1988).
Eur. Pat. Appl. EP 299362 Al (Jan. 18, 1989), K. Nagao (to Osaka Soda Co., Ltd.).
Ger. Offen. DE 3634259 Al (Apr. 21,1988), W. Hoelderich, N. Goetz, and G. Fouquet (to BASF A.G.).
Ger. Offen. DE 3634975 Al (Apr. 30,1987), R. J. Doehner, Jr. (to American Cyanamid Co.).
Ger. Offen. DE 3337569 Al (Apr. 25,1985), T. Dockner, H. Hagen, and H. Krug (to BASF A.G.).
J. I. Grayson and R. Dinkel, Heir. Chim. Acta 67, 2100—2110 (1984).
C. Wang and Y. Li, Yiyao Gongye 6, 1—6 (1984).
Eur. Pat. Appl. EP75727 A2 (Apr. 6,1983), J. I. Grayson and R. Dinkel (to Lonza A.G.).
A. T. Soldatenkov and co-workers, Zh. Org. Khim. 16, 188—194 (1980).
R. Baker and M. J. Crimniiii,/. Chem. Soc. Perkin Trans. 1, 1264—1267 (1979).
Eur. Pat. Appl. EP43507 A2 (Jan. 13, 1982), K. Bruns and T. N. Dang (to Henkel K.-G. A. A.).
G. A. Trofimov, V. I. Lavrov, and L. N. Parshina, Zh. Org. Khim. 17, 1716—1720 (1981).
Jpn. Kokai Tokkyo Koho JP 61/161241 AZ [86/161241] (July 21, 1986), K. Inoue, H. Takeda, and M. Kobayashi (to Mitsubishi Rayon Co.,
Ltd.).
Jpn. Kokai Tokkyo Koho JP 62/141097 AZ [87/141097] (June 24,1987), N. Tanaka, H. Takada, M. Oku, and A. Kimura (to Koa Corp.).
K. G. Akopyan, A. P. Sayadyan, A. G. Dzhomardyan, and co-workers, Prom-st. Strait. Arkhit. Arm. 34—35 (1988).
Ref. 6, pp. 216—219 and references therein.
U.S. Pat. 4,007,137 (Feb. 8, 1977), J. M. Sanders, W. L. Schreiber, and J. B. Hall (to International Flavors & Fragrances, Inc.).
U.S. Pat. 4,107,217 (Aug. 15, 1978), W. L. Schreiber and A. O. Pittet (to International Flavors and Fragrances, Inc.).
Ger. Offen., DE2,643,062 (Apr. 14, 1977), J. M. Sanders and co-workers (to International Flavors and Fragrances, Inc.).
U.S. Pat. 4,244,876 (Jan. 13,1981), G. H. Warner, L. F. Theiling, andM. G. Freid (to Union Carbide Corp.).
U.S. Pat. 2,941,859 (June 21,1960), M. L. Fein and E. M. Filachione (to Union Carbide Corp.).
Brit. Pat. Appl. GB 2023123 (Dec. 28,1979), C. L. Kissel and F. F. Caserio (to Magna Corp.).
Kirk-Othmer Encyclopedia of Chemical Technology (4th Edition)
130
ACROLEIN AND DERIVATIVES
Voll
97. R. O. Beauchamp, D. A. Andjelkovich, A. D. Kligerman, К. T. Morgan, and H. d’A. Heck, CRC Grit. Rev. Toxicol 14, 309—380 (1985).
98. B. L. Carson, С. M. Beall, H. V. Ellis, L. H. Baker, and B. L. Herndon, Acrolein Health Effects, \T1S PB82-161282; ЕРА-460/3-81-034, Gov. Rep.
Announce. Index 12, 9—12 (1981). [A 121-page review of health effects literature primarily related to inhalation exposure.]
99. Acrolein, Material Safety Data Sheet, Union Carbide Chemicals and Plastics Company Inc., Specialty Chemicals Division, August 15,1989.
100. Ref. 97, p. 339.
101. Syracuse Research Corporation, Information Profiles on Potential OccupationalHa^ards, Vol. 1, Single Chemicals Acrolein, NTIS PB81-147951, U.S.
Department of Commerce, Springfield, Va., 1979, p. 11.
102. Ref. 97, p. 342.
103. Acrolein, in IARC Monographs on the Evaluation of Carcinogenic Risk of Chemicals to Humans. Some Monomers, Plastics and Synthetic Elastomers and Acrolein,
Vol. 19, International Agency for Research on Cancer, Lyon, France, 1979, pp. 479—494.
104. Ref. 101, p. 9.
105. Ref. 98, p. 2.
106. Ref. 97, pp. 334-345, 338-339.
W. G. Etzkom
J. J. Kurland
W. D. Neilsen
Union Carbide Chemicals & Plastics Company Inc.
Kirk-Othmer Encyclopedia of Chemical Technology (4th Edition)
131
ACRYLAMIDE
Voll
ACRYLAMIDE
Acrylamide [79-06-1] (NIOSH No: A533250) has been commercially available since the mid-1950s and has shown steady growth since that time, but is still
considered a small volume commodity. Its formula, H2C=CHCONH2 (2-propeneamide), indicates a simple chemical, but it is by far the most important
member of the series of acrylic and methacrylic amides. Water soluble polyacrylamides (1) represent the most important applications, including potentially
large uses in enhanced oil recovery as mobility control agents in water flooding, additives for oil well drilling fluids, and aids in fracturing, acidifying, and
other operations. Other uses include flocculants for waste water treatment, the mining industry and various other process industries, soil stabilization,
paper-making aids, and thickeners. Smaller but none the less important uses include dye acceptors; polymers for promoting adhesion; additives for textiles,
paints, and cement; increasing the softening point and solvent resistance of resins; components of photopolymerizable systems; and cross-linking agents in
vinyl polymers.
Physical Properties
Acrylamide is a white crystalline solid that is quite stable at ambient conditions, and, even at temperatures as high as its melting point (for 1 day in the
absence of light), no significant polymer formation is observed. Above its melting point, however, liquid acrylamide may polymerize rapidly with significant
heat evolution. Precautions should be taken when handling even small quantities of molten material. In addition to the solid form, a 50% aqueous solution
of acrylamide is a popular commercial product today. This solution is stabilized by small amounts of cupric ion (25—30 ppm based on monomer) and
soluble oxygen. Several other stabilizers are also available for the aqueous monomer solution, such as ethylenediaminetetraacetic acid (EDTA) [60-00-4] (2),
ferric ion (3), and nitrite (4,5). The only effect of oxygen is to increase the induction period for polymerization (6). Iron complexes of cyanogen or
thiocyanogen have proven to be useful stabilizers for salt-containing acrylamide solutions (7). The physical properties of solid acrylamide monomer are
summarized in Table 1. Solubilities of acrylamide in various solvents are given in Table 2, and typical physical properties of a 50% solution in water appear
in Table 3.
Table 1. Physical Properties of Solid Acrylamide Monomer1
Property Value
molecular weight 71.08
melting point, °C vapor pressure, Pa 84.5 ± 0.3
25°C 0.9
40°C 4.4
50°C boiling point, °C 9.3
0.27 kPab 87
0.67 kPab 103
1.4 kPab 116.5
3.3 kPab 136 -82.8
heat of polymerization, kJ /mol
density, g/mL at 30°C 1.122
equilibrium moisture content, particle size 355 |lm , at 22.8°C, 50% rh 1.7 g of water/kg of dry acrylamide
crystal system monoclinic or triclinic
crystal habit refractive indexes thin tabular to laminar
% 1.460 (calcd)
n 1.550 ±0.003
У 1.581 ± 0.003
optic axial angles 2E 98°, 2V 58°
optic sign О
aRef. 5.
To convert kPa to mm Hg, multiply by 7.5.
To convert kJ/mol to kcal/mol, divided by 4.184.
45 mesh.
Table 2. Solubilities of Acrylamide in Various Solvents at 30°C
Solvent
acetonitrile
acetone
benzene
ethylene glycol monobutyl ether
chloroform
1,2-dichloroethane
dime thylfo rm amide
dimethyl sulfoxide
dioxane
g/100 mL_________
39.6
63.1
0.346
31
2.66
1.50
119
124
30
Kirk-Othmer Encyclopedia of Chemical Technology (4th Edition)
132
ACRYLAMIDE
Voll
ethanol
ethyl acetate
^-heptane
methanol
pyridine
water
carbon tetrachloride
86.2
12.6
0.0068
155
61.9
215.5
0.038
Table 3. Physical Properties of 50% Aqueous Acrylamide Solution*
Property Value
pH refractive index range, 25 °C (48—52%) viscosity, mPa (= cP) at 25°C specific gravity, at 25°C density, 25/4°C crystallization point, °C partial phase diagram eutectic temperature, °C eutectic composition, wt % boiling point at 101.3 kPab, °C vapor pressure at 23°C, kPab at 70°C, kPab specific heat (20—50°C), J/(g-K)c heat of dilution to 20 wt %, J/g solnC heat of polymerization, kJ /mol heat of melting (solution), melting range —17.3 to +19.7°C,J/g flammability 5.0-6.5 1.4085-1.4148 2.71 1.0412 1.038 8-13 -8.9 31.2 99-104 2.407 27.93 3.47 -4.6 -85.4 247.7 nonflammable
aRef. 5.
To convert kPa to mm Hg, multiply by 7.5.
To convert J to cal, divide by 4.184.
Chemical Properties
Acrylamide, C^H^NO, is an interesting difunctional monomer containing a reactive electron-deficient double bond and an amide group, and it undergoes
reactions typical of those two functionalities. It exhibits both weak acidic and basic properties. The electron withdrawing carboxamide group activates the
double bond, which consequendy reacts readily with nucleophilic reagents, eg, by addition.
Nuc : H + CH2=CHCONH2 NucCH2CH2CONH2
Many of these reactions are reversible, and for the stronger nucleophiles they usually proceed the fastest. Typical examples are the addition of
ammonia, amines, phosphines, and bisulfite. Alkaline conditions permit the addition of mercaptans, sulfides, ketones, nitroalkanes, and alcohols to
acrylamide. Good examples of alcohol reactions are those involving polymeric alcohols such as poly(vinyl alcohol), cellulose, and starch. The alkaline
conditions employed with these reactions result in partial hydrolysis of the amide, yielding mixed carbamoylethyl and carboxyethyl products.
Some specific examples include the noncatalytic reaction of acrylamide with primary amines to produce a mono or bis product (5).
rnh2 + CH2=CHCONH2 RNHCH2CH2CONH2 RN(CH2CH2CONH2)2
Secondary amines give only a monosubstituted product. Both of these reactions are thermally reversible. The product with ammonia
(3,3\3Anitrilotrispropionaniide [2664-61-1C9HlgN4O3) (5) is frequency found in crystalline acrylamide as a minor impurity and affects the free-radical
polymerization. An extensive study (8) has determined the structural requirements of the amines to form thermally reversible products. Unsymmetrical
dialkyl hydrazines add through the unsubstituted nitrogen in basic medium and through the substituted nitrogen in acidic medium (9)).
Monoalkylhydroxylamine hydrochlorides react with preservation of the hydroxylamine structure (10). Primary nitramines combine in such a way as to keep
the nitramine structure intact.
The reaction with sodium sulfite or bisulfite (5,11) to yield sodium-P-sulfopropionamide [19298-89-6] (C3H7NO4S-Na) is very useful since it can be
used as a scavenger for acrylamide monomer. The reaction proceeds very rapidly even at room temperature, and the product has low toxicity. Reactions
with phosphines and phosphine oxides have been studied (12), and the products are potentially useful because of their fire retardant properties. Reactions
with sulfide and dithiocarbamates proceed readily but have no applications (5). However, the reaction with mercaptide ions has been used for analytical
purposes (13)). Water reacts with the amide group (5) to form hydrolysis products, and other hydroxy compounds, such as alcohols and phenols, react
readily to form ether compounds. Primary aliphatic alcohols are the most reactive and the reactions are complicated by partial hydrolysis of the amide
groups by any water present.
Activated ketones react with acrylamide to yield adducts that frequency cyclize to lactams (14). The lactams can be hydrolyzed to yield substituted
propionic acids. Chlorine and bromine react with acrylamide in aqueous solution to yield CC,P-dihalopropionamide (5). Under acidic conditions, sizable
quantities of acrylamide can be removed from water by chlorination (15). Hydrochloric and hydrobromic acids add to give P-halopropionamides. These
adducts are also thermally reversible. A patent describes a procedure to prepare АГ-substituted acrylamide by direct trans amidation of acrylamide (16).
Dienes react with acrylamide to form Diels-Alder type adducts (17,18). Improved yields in the aza-annelation of cyclic ketones by the use of enamines and
imines have been reported (19—21). Palladium reduced with borohydride (22), nickel boride (23), or rhodium carbonyl (24) reduces the double bond of
acrylamide to yield propionamide, and acrylamide can be oxidized to a glycol with sodium hypochlorite using osmium tetroxide as a catalyst (25). In
contrast, if osmium is not present, the attack occurs at the nitrogen to yield. A-vinyl-A7-acryloylurea [19396-55-5[ [CUA\CL) (26). When treated with a
strong base in an aprotic solvent, acrylamide forms a head-to-tail dimer, 3-acrylamidopropionamide [21963-06-4] (C6H10N2O2) (27). Electrolytic reductive
dimerization of acrylamide proceeds through tail-to-tail addition to yield adipamide [628-94-4]> C6H12N2O2 (28).
The most important reactions of acrylamide are those that produce vinyl addition polymers (see Acrylamide polymers). The initiation and
Kirk-Othmer Encyclopedia of Chemical Technology (4th Edition)
133
ACRYLAMIDE
Voll
termination mechanisms depend on the catalyst system, but the reaction can be started by any free-radical source. In practice, redox couples such as
sodium persulfate and sodium bisulfite are commonly used, and the highest molecular weight polymers are obtained in aqueous solution, with molecular
weights of several million prepared routinely. Acrylamide is remarkable for the very large value of 1.8 X 10⁴/(1.45 x 107)1/2 , which is a measure of
chain length in the polymerization. However, it may be necessary to remove the inhibitor (cupric ions) from aqueous acrylamide solutions to obtain the
desired polymerization results. Copolymers with acrylamide are also prepared with ease, although the molecular weights are consistendy lower than that of
polyacrylamide prepared under similar conditions. Acrylamide copolymerizes readily by a free-radical mechanism with other acrylates, methacrylates, and
styrene. Acrylamide may be polymerized by a hydrogen transfer mechanism catalyzed by strong base in basic or aprotic solvents. The product is
poly(P~alanine) or nylon-3 (29), which has properties similar to natural silk. This polymer, on hydrolysis, yields P-aminopropionic acid. A hydrogen transfer
copolymer with acrolein has also been reported (30). A biocatalytic method of removing residual monomer from polymers that could become very
important to acrylamide polymer users has been described (31).
The amide group is readily hydrolyzed to acrylic acid, and this reaction is kinetically faster in base than in acid solutions (5,32,33). However,
hydrolysis of N-alkyl derivatives proceeds at slower rates. The presence of an electron-with-drawing group on nitrogen not only facilitates hydrolysis but
also affects the polymerization behavior of these derivatives (34,35). With concentrated sulfuric acid, acrylamide forms acrylamide sulfate salt, the
intermediate of the former sulfuric acid process for producing acrylamide commercially. Further reaction of the salt with alcohols produces acrylate esters
(5). In strongly alkaline anhydrous solutions a potassium salt can be formed by reaction with potassium /^-butoxide in /^-butyl alcohol at room
temperature (36).
Several other interesting reactions include acrylamide transition metal complexes (37—40), complexes with nucleosides (41) in dimethyl sulfoxide
solution, and also complexes with several inorganic salts (42—44). Dehydration of acrylamide by treatment with fused manganese dioxide (45) at 500°C or
with phosphorus pentoxide (46) yields acrylonitrile. Aldehydes such as formaldehyde, glyoxal, and chloral hydrate react with acrylamide under neutral and
alkaline conditions, producing the corresponding A-methylolacrylamide [924-42-5] (47,48). Under acidic conditions, N,A-metlrdenebisacrylamide
[110-26-9] ((H2C=CHCONH)2 CH2) is produced from formaldehyde and acrylamide (49). Under acidic conditions, methoylol ethers are formed from
hydroxyl compounds and A-methylolacrylamide (50). Condensation products derived from A-methylolacrylamide and polyphenols have also been
reported (51). Using^-toluene-sulfonic acid as the catalyst in dioxane or ethyl acetate solvent, N,N-oxydimethylenebisacrylamide [16958-71 -7]
(C8H12O3N2) has been obtained (52). These difunctional products have similar copolymerization parameters to acrylamide and are useful as cross-linking
agents. Alcohols can be used to cap the methylol compound to provide the less reactive methylol ethers. Methanol is commonly employed, but, where
increased compatibility with oleophilic systems is desired, one of the butanols is the preferred alcohol; oxalic acid is an example of a suitable catalyst (50).
This reaction also occurs with cellulosic hydroxyls. Provided the system is not basic, the methylol derivative may also be condensed with carbamate esters
(53), secondary amines (54), or phosphines (12) without involving the double bond. Acrylamido-A-glycolic acid and diacrylamidoacetic acid can be
obtained from acrylamide and glyoxylic acid (55—58). AT-acylacrylamides are of minor interest industrially. One member of the series, diacrylamide
[20602-80-6] (C6H?NO2), is a suspected side-reaction product in the sulfuric acid process of manufacture. It may be prepared by the reaction of acrylamide
with acrylic anhydride or acryloyl chloride. A specific preparation for AT-acetylacrylamide [1432-45-7] (C5H?NO2) is the addition of ketene to acrylamide
(59).
Analysis
The analysis of acrylamide monomer in water solutions containing at least 0.5% monomer is carried out by bromination (5). If the concentration is fairly
high, in the 2—55% monomer range, then a refractive index method is easier (11,60,61). Polarography (62) and gas chromatography (63) can also be used to
determine trace amounts of acrylamide monomer in other organic materials. For detecting small concentrations of polymer in aqueous acrylamide
solutions, я-butanol addition will produce turbidity, which can then be compared to standards (5,61). Cupric ion inhibitor and other impurities in
acrylamide samples can be determined by standard techniques (11,61,64). Other methods can also be employed to analyze the polyacrylamide content of
monomer solutions, including turbidimetric (Hach) and colorimetric (Klett) methods (11,61). A summary of various analytical techniques for assaying
acrylamide monomer are listed in Table 4.
Table 4. Acrylamide Assay Techniques*
Method Approximate ... b sensitivity, ppm Application Interference Ref.
refractive index 50,000 quality control anything affecting refractive index 11,61
bromate—bromide 1,000 assay product unsaturated compounds 5
flame ionization 40 monomer in polymer 66
d-c polarization 10 assay product alkali cations, acrylic esters 64
differential pulse polarography >1 environment alkali cations, acrylic esters, vinyl 62
spectrophotometry 0.1 concerns urinalysis cyanide aldehydes, ketones, pyrroles, indoles, 64, 65
hplc 0.1 wipe and air hydrazine, aromatic amines 67
electron capture, gc 0.1 ppb river water 63
aRef. 65.
Unless otherwise noted.
Manufacture
The current routes to acrylamide are based on the hydration of inexpensive and readily available acrylonitrile [107-13-1] (C3H3N, 2-propenenitrile, vinyl
cyanide, VCN, or cyanoethene) (see Acrylonitrile). For many years the principal process for making acrylamide was a reaction of acrylonitrile with
H2SO4 H2O followed by separation of the product from its sulfate salt using a base neutralization or an ion exclusion column (68).
ch2=chcn + H2SO4-H2O CH2=CHCONH2-H2SO4
This process yields satisfactory monomer, either as crystals or in solution, but it also produces unwanted sulfates and waste streams. The reaction was
usually run in glass-lined equipment at 90—100°C with a residence time of 1 h. Long residence time and high reaction temperatures increase the selectivity
to impurities, especially polymers and acrylic acid, which controls the properties of subsequent polymer products.
The ratio of reactants had to be controlled very closely to suppress these impurities. Recovery of the acrylamide product from the acid process was
the most expensive and difficult part of the process. Large scale production depended on two different methods. If solid crystalline monomer was desired,
the acrylamide sulfate was neutralized with ammonia to yield ammonium sulfate. The acrylamide crystallized on cooling, leaving ammonium sulfate, which
had to be disposed of in some way. The second method of purification involved ion exclusion (68), which utilized a sulfonic acid ion-exchange resin and
produced a dilute solution of acrylamide in water. A dilute sulfuric acid waste stream was again produced, and, in either case, the waste stream represented a
Kirk-Othmer Encyclopedia of Chemical Technology (4th Edition)
134
ACRYLAMIDE
Voll
problem as well as an increased production cost. As far as can be determined, no commercial acrylamide is produced today via this process.
Even in 1960 a catalytic route was considered the answer to the pollution problem and the by-product sulfate, but nearly ten years elapsed before a
process was developed that could be used commercially. Some of the earlier attempts included hydrolysis of acrylonitrile on a sulfonic acid ion-exchange
resin (69). Manganese dioxide showed some catalytic activity (70), and copper ions present in two different valence states were described as catalytically
active (71), but copper metal by itself was not active. A variety of catalysts, such as Urushibara or Ullmann copper and nickel, were used for the hydrolysis
of aromatic nitriles, but aliphatic nitriles did not react using these catalysts (72). Beginning in 1971 a series of patents were issued to The Dow Chemical
Company (73) describing the use of copper metal catalysis. Full-scale production was achieved the same year. A solution of acrylonitrile in water was passed
over a fixed bed of copper catalyst at 85°C, which produced a solution of acrylamide in water with very high conversions and selectivities to acrylamide.
The heat of hydration is approximately —70 kJ /mol (—17 kcal/mol). This process usually produces no waste streams, but if the acrylonitrile feed contains
other nitrile impurities, they will be converted to the corresponding amides. Another reaction that is prone to take place is the hydrolysis of acrylamide to
acrylic acid and ammonia. However, this impurity can usually be kept at very low concentrations. American Cyanamid uses a similar process in both the
United States and Europe, which provides for their own needs and for sales to the merchant market.
Mitsui Toatsu Chemical, Inc. disclosed a similar process using Raney copper (74) shordy after the discovery at Dow, and BASF came out with a
variation of the copper catalyst in 1974 (75). Since 1971 several hundred patents have shown modifications and improvements to this technology, both
homogeneous and heterogeneous, and reviews of these processes have been published (76). Nalco Chemical Company has patented a process based
essentially on Raney copper catalyst (77) in both slurry and fixed-bed reactors and produces acrylamide monomer mainly for internal uses. Other producers
in Europe, besides Dow and American Cyanamid, include Allied Colloids and Stockhausen, who are believed to use processes similar to the Raney copper
technology of Mitsui Toatsu, and all have captive uses. Acrylamide is also produced in large quantities in Japan. Mitsui Toatsu and Mitsubishi are the largest
producers, and both are believed to use Raney copper catalysts in a fixed bed reactor and to sell into the merchant market.
In 1985 Nitto Chemical Industry started using microorganisms for making acrylamide from acrylonitrile using an enzymatic hydration process
(77,78). The reaction is catalyzed by nitrile hydratase, a nitrilasically active enzyme produced by organisms such as Corynebacterium N-774 strain, Bacillus^,
BacteridiumMicrococcus, Nocardia^ and Pseudomonas. This is one of the initial uses of biocatalysis in the manufacture of commodity chemicals in the
petrochemical industry. There are certainly other bioprocesses in use for fine chemicals in the amino acid area, as well as fermentation processes. Improved
bacterial strains and cells immobilized in acrylamide gels as well as methods of concentrating the dilute product solutions are subjects of more recent
patents (79—81). The most recent release indicates a switch to Bhodococcus rhodochrous bacteria, which will increase their capacity from 6,000 to 20,000t/yr
(82). The reaction is run at 0—15°C and a pH of 7—9 and gives almost complete conversions with very small amounts of by-products such as acrylic acid.
Acrylamide and its derivatives have been prepared by many other routes (4). The reactions of acryloyl chloride and acrylic anhydride with ammonia
are classical methods. Primary and secondary amines may be used in place of ammonia to obtain N-substituted derivatives. Acryloyl isocyanate has been
hydrolyzed to acrylamide but yields are poor. Exhaustive amination of methyl acrylate with ammonia yields 3,3\3Anitrilotrispropionamide [2664-61-1]
(C9H18N4O3). This compound can be thermally decomposed to acrylamide by heating to 208—230°C at 2 kPa (15 mm Hg). Similarly, Michael-type addition
products of alkylamines or aliphatic alcohols and methyl acrylate react with ammonia to give the corresponding (B-substituted propionamides. These
compounds may also be thermally decomposed to yield acrylamide. The Michael-type addition products of methyl acrylate and aliphatic amines may react
further to give N-alkyl or N,N-dialkyl propionamide derivatives that can be thermally decomposed to mono- or dialkylsubstituted acrylamides, respectively.
N-Substituted acrylamides may also be prepared from acetylene, carbon monoxide, and an amine using an iron or nickel carbonyl catalyst. However, the
best route to mono-N-alkylsubstituted acrylamides is the Ritter reaction. This reaction is used to prepare diacetoneacrylamide [2873-97-4[ ((/H15NO2),
2-acrylamido-2-methylpropanesulfonic acid [15214-89-8] ((/H^NC/S), N-isopropylacrylamide [2210-25-5] (CM I \O), .\-Л7У-Ьи1у1асгу1апн(1(‘ [107-58-4]
(C?H13NO), and other N-alkyl acrylamides in which the carbon attached to the nitrogen is usually tertiary (83,84).
Specifications
The 50% aqueous acrylamide is the preferred form because it eliminates the handling of solids and because its cost is lower. This is a result of the new
manufacturing method put into effect in 1971. The aqueous form is applicable to nearly all the end uses of acrylamide when volume is taken into account.
Aqueous acrylamide is shipped in tank trucks, rail cars, or drums, but small samples can also be obtained. The solution should be kept in stainless steel or
in tanks coated with plastic resin (phenolic, epoxy, or polypropylene). All containers, including tank trucks and rail cars, must be rinsed prior to disposal or
return. When shipping costs are an important consideration, solid acrylamide may be the desired form. Acrylamide should be stored in a well ventilated
area away from sunlight. The temperature should be under 30°C, and under these conditions no change of quality should be noticed for at least 3 months.
Typical specifications for the 50% aqueous solution are shown in Table 5 and for the solid monomer in Table 6.
Table 5. Typical Specifications for 50% Aqueous Solutions*
Property Limit
assay, wt % pH polymer, ppm, max (BOM) Cu2+ inhibitor, ppm, max (BOM)b color 48-52 5.0-6.5 100 25 water clear
aRefs. 11, 61.
Based on monomer.
Table 6. Typical Specifications for Crystalline Acrylamide Monomer
appearance
assay, %, min
water, %, max
iron, as Fe°, ppm, max
color, 20% soln, max, APHA
water insoluble, %, max
butanol insoluble, %, max
white, free flowing crystal
98
0.8
15
50
0.2
1.5
Health and Safety Considerations
Contact with acrylamide can be hazardous and should be avoided. The most serious toxicological effect of exposure to acrylamide monomer is as a
Kirk-Othmer Encyclopedia of Chemical Technology (4th Edition)
135
ACRYLAMIDE
Voll
neurotoxin. In contrast, polymers of acrylamide exhibit very low toxicity. Since the solid form sublimes, the solid or powder form of acrylamide is more
likely to be a problem than the aqueous form because of possible exposure to dusts and vapors. An important characteristic of the toxicity of acrylamide
monomer is that the signs and symptoms of exposure to toxic levels may be slow in developing and can occur after ingestion of small amounts over a
period of several days or weeks. It is therefore important that people who have been exposed to acrylamide be monitored by a qualified physician. Signs
and symptoms include increased sweating of hands and feet, numbness or tingling of the extremities, or even paralysis of the arms and legs. Acrylamide is
readily absorbed through unbroken skin, and the signs are the same as with ingestion. Acute dermal LD50 is 2250 mg/kg for rabbit (85). Eye contact can
produce conjunctival irritation and slight corneal injury and can lead to systemic exposure if contact is prolonged and/or repeated. Inhalation of vapors,
dusts, and/or mists can result in serious injury to the nervous system, but again, symptoms may be slow in developing. Since the symptoms for minor
repeated exposures over a long period of time are similar to those for gross human exposure, the development of such symptoms can be a signal that
severe damage has already occurred. There are no reHable "early warning" signals of damaging exposure to toxic levels of acrylamide monomer, so it is
imperative that all handling procedures be designed to prevent human contact. In a long-term study, rats that received relatively low concentrations of
acrylamide monomer in the drinking water showed an increase in several types of malignant tumors (86). Suitable respirators and clothing that consists of a
head covering, long-sleeved coverall, impervious gloves, and rubber footwear are recommended to avoid contact (61).
A large number of research studies have been published, many of which were released by government agencies (87—94). A threshold limit value
(TLV) of 0.03 mg/m3 (skin) has been set by the American Conference of Governmental Industrial Hygienists (ACGIH). ACGIH also categorizes
acrylamide as A2 (suspect human carcinogen). Several studies demonstrate that acrylamide is biodegradable (95), and the hydrolysis of acrylamide proceeds
readily both in rivers and in soils (96,97). Bioconcentration of acrylamide probably will not occur because of the ease of biodegradation and the high water
solubility of this material. Acrylamide shows low acute toxicity to fish (61,98). Other derivatives, such as N-methylolacrylamide, are neurotoxins in their
own right, but the LD4 is much higher than for acrylamide. Toxicity data for acrylamide and several derivatives are Hsted in Table 7.
Table 7. Toxicity of Acrylamide and Derivatives
Compound CAS Registry Number Molecular formula Animal Oral LD50, gkg Ref.
acrylamide [79-06-1] c3h5no mouse 0.17 85
A-methylolacryl amide [924-42-5] c4h7no2 mouse 0.42 99
N,N-me thylenebis acrylamide [110-26-9] CtHjqNjOj rat 0.39 100
N-isobutoxymethylacnl amide [16669-59-3] CgH15NO2 rat 1.0 101
N,N- dimethylacrylamide [2680-03-7] c5h9no rat 0.316 102
2- acrylamido-2-methylprop ane- sulfonic acid [15214-89-8] c7h13no4s rat 1.41 103
Handling of dry acrylamide is hazardous primarily from its dust and vapor, and this is a significant problem, especially in the course of emptying
bags and drums. This operation should be carried out in an exhaust hood with the operator wearing respiratory and dermal protection. Waste air from the
above mentioned ventilation should be treated by a wet scrubber before purging to the open air, and the waste water should be fed to an activated sludge
plant or chemical treatment facility. Solid acrylamide may polymerize violendy when melted or brought into contact with oxidizing agents. Storage areas for
solid acrylamide monomer should be clean and dry and the temperature maintained at 10—25°C, with a maximum of 30°C.
The 50% aqueous product is the most desirable where water can be tolerated in the process. Employees should not be permitted to work with
acrylamide until thoroughly instructed and until they can practice the required precautions and safety procedures. Anyone handling acrylamide should
practice strict personal cleanliness and strict housekeeping at all times. This should include wearing a complete set of clean work clothes each day and the
removal of contaminated clothing immediately. If contact is made, the affected skin area should be washed thoroughly with soap and water and
contaminated clothing should be replaced. When contact can occur, such as in maintenance and repair operations or connection and disconnection during
transport, protective equipment should be used. This should include impervious gloves and footwear to protect the skin, and suitable eye protection such
as chemical worker's goggles. If exposure to the face is possible, a face shield should be used in addition to the goggles. Food, candy, tobacco, and
beverages should be banned from areas where acrylamide is being handled, and workers should wash hands and face thoroughly with soap and water
before eating or drinking. The need for good personal hygiene and housekeeping to prevent exposure cannot be overemphasized.
Aqueous solutions of 50% acrylamide should be kept between 15.5 and 38°C with a maximum of 49°C. Below 14.5°C acrylamide crystallizes from
solution and separates from the inhibitor. Above 50°C the rate of polymer buildup becomes significant. Suitable materials of construction for containers
include stainless steel (304 and 316) and steel lined with plastic resin (polypropylene, phenolic, or epoxy). Avoid contact with copper, aluminum, their alloys,
or ordinary iron and steel.
Disposal of small amounts of acrylamide may be done by biodegradation in a conventional secondary sewage treatment plant, but any significant
amounts should be avoided. Such waste material should not be allowed to get into a municipal waste treatment or landfill operation unless all appropriate
precautions have been taken. When the disposal of large quantities is necessary, the supplier should be contacted. Containers that have been used for
acrylamide should be thoroughly rinsed and then disposed of in an appropriate manner. In any disposal of waste materials, all of the applicable federal,
state, and local statutes, rules, and regulations should be followed. Persons contemplating large-scale use of acrylamide monomer should consult the
manufacturers at an early stage in the planning to ensure that their facilities and operations are adequate. Many companies refuse to supply to operations
that, in their opinion, are unsafe.
Economic Aspects
The largest production of acrylamide is in Japan; the United States and Europe also have large production facilities. Some production is carried out in the
Eastern Bloc countries, but details concerning quantities or processes are difficult to obtain. The principal producers in North America are The Dow
Chemical Company, American Cyanamid Company, and Nalco Chemical Company (internal use); Dow sells only aqueous product and American
Cyanamid sells both Equid and solid monomer. In Europe, Chemische Fabrik Stockhausen & Cie, AUied Colloids, The Dow Chemical Company, and
Cyanamid BV are producers; Dow and American Cyanamid are the only suppliers to the merchant market, and crystalline monomer is available from
American Cyanamid. For Japan, producers are Mitsubishi Chemical Industries, Mitsui Toatsu, and Nitto Chemical Industries Company (captive market).
Crystals and solutions are available from Mitsui Toatsu and Mitsubishi, whereas only solution monomer is available from Nitto.
Estimated production capacity for the Japanese producers is 77,000 t/yr; for the American producers, about 70,000 t/yr; and for the European
producers about 50,000 t/yr (104). The list prices for the monomer have increased dramatically over the past 15 years, according to the Chemical Marketing
Reporter (105). In 1975 the price for 50% solution was $0.903/kg, compared to $1.68/kg in December 1990 (100% basis, FOB plant). The soHd crystalline
monomer always demands a premium price because of the added cost of production, and sold in December 1990 for $2.27/kg compared to $1.09/kg in
1975. There are at least 35 suppliers of acrylamide monomer; most of them obviously are repackagers.
BIBLIOGRAPHY
Kirk-Othmer Encyclopedia of Chemical Technology (4th Edition)
136
ACRYLAMIDE
Voll
"Acrylamide" in. ECT 2nd ed., Vol. 1, pp. 274—284, by Norbert M. Bikales and Edwin R. Kolodny, American Cyanamid Company; in ECT 3rd ed., Vol. 1,
pp. 298—311, byD. C. MacWilliams, Dow Chemical U.S.A.
1. D. C. MacWilliams, in R. H. Yocum and E. B. Nyquist, eds., FunctionalMonomers, Vol. 1, Marcel Dekker, Inc., New York, 1973, pp. 1—197.
2. U.S. Pat. 2,917,477 (Dec. 15, 1959), T. J. Suen and R. L. Webb (to American Cyanamid Co.).
3. E. Collinson and F. S. Dainton, Nature 177, 1224 (1956).
4. U.S. Pat. 2,758,135 (Aug. 7, 1956), M. L. Miller (to American Cyanamid Co.).
5. Chemistry of Acrylamide, Bulletin PRC 109, Process Chemicals Department, American Cyanamid Co., Wayne, N.J., 1969.
6. J. P. Friend and A. E. Alexander,/. Polym. Sci. PartA-1 6, 1833 (1968).
7. Ger. Pat. 1,030,826 (May 29,1958), H. Wilhelm (to BASF A.G.).
8. A. LeBerre and A. Delaroix, Bull. Soc. Chim. Fr. 11(2), 2639 (1974); Chem. Abstr. 82, 97302 (1975); earlier paper in Bull. Soc. Chim. Fr. 2(2), 640 (1973)
is very significant.
9. A. LeBerre and C. Porte, Bull. Soc. Chim. Fr. 7—8(2), 1627 (1975); Chem. Abstr. 84, 58149 (1976).
10. U.S. Pat. 3,778,464 (Dec. 11,1973), P. Klemchuck.
11. Aqueous Acrylamide, Forms 260-951-88, Analytical Method PAA 46, Chemicals and Metals Department, The Dow Chemical Company, Midland,
Mich., 1976.
12. U.S. Pat. 3,699,192 (Oct. 17,1972), P. Moretti (to U.S. Oil Company, Inc.).
13. The Dow Chemical Company, unpublished results.
14. D. Elad and D. Ginsberg,/ Chem. Soc. 4137 (1953).
15. В. T. Croll, G. M. Srkell, and R. P. J. Hodge, Water R^. 8, 989 (1974).
16. Ger. Offen. 3,128,574 (Jan. 27, 1983), K. Laping, O. Petersen, К. H. Heinemann, H. Humbert, and F. Henn (to Deutsche Texaco A.G.).
17. J. S. Meek, R. T. Memow, D. E. Ramey, and S. J. Cristol,/ Am. Chem. Soc. 73, 5563 (1951).
18. A. I. Naimushin and V. V. Simonov, ZA Obshch. Khim. 47, 862 (1977); Chem. Abstr. 87, 38678m (1977).
19. G. Stork, Pure Appl. Chem. 17, 383 (1968).
20. I. Ninomiya, T. Naito, S. Higuchi, and T. Mori,/ Chem. Soc. D 9, 457 (1971).
21. U.S. Pat. 4,198,415 (Apr. 15,1980), N. J. Bach and E. C. Komfeld (to Eh Lilly and Co.).
22. T. W. Russell and D. M. Duncan,/ Chem. 39, 3050 (1974).
23. T. W. Russell, R. C. Hoy, and J. E. Cornelius,/. Chem. 37, 3552 (1972).
24. T. Kitamura, N. Sakamoto, and T. Joh, Chem. Eett. 2(4), 379 (1973).
25. U.S. Pat. 3,846,478 (Nov. 5,1974), R. W. Cummins (to FMC Corp.).
26. U.S. Pat. 3,332,923 (July 25, 1967), L. D. Moore and R. P. Brown (to Nalco Chemical Co.).
27. A. Leoni and S. Franco, Macromol. Synth. 4, 125 (1972).
28. U.S. Pats. 3,193,476 and 3,193,483 (July 6, 1965), M. M. Baizer (to Monsanto Co.).
29. D. S. Breslow, G. E. Hulse, and A. S. Matlack,/ Am. Chem. Soc. 79, 3760 (1957).
30. N. Yamashita, M. Yoshihara, and T. Maeshima,/ Polym. Sci. Part В 10, 643 (1972).
31. Eur. Pat. Appl. 272025 A2 (June 22,1988), D. Byrom and M. A. Carver; Eur. Pat. Appl. EP 272026 A2 (June 22,1988), M. A. Carver and J.
Hinton (to Imperial Chemical Ind.).
32. Jpn. Kokai 76 86412 (July 29, 1976), F. Matsuda and T. Takazo (to Mitsui Toatsu Chem. Co.).
33. G. A. Chubarov, S. M. Danov, and V. I. Logutov, Zh. Prikl Khim. Eeningrad 52, 2564 (1979); Chem. Abstr. 92, 163293m (1980).
34. A. Conix, G. Smets, and J. Moens, Ric. Sci. Suppl. 25, 200 (1954); Chem. Abstr. 54, 11545e (1960).
35. T. Azuma and N. Ogata, / Polym. Sci. Polym. Chem. Ed. 13, 1959 (1975).
36. U.S. Pat. 3,084,191 (Apr. 2, 1963), J. R. Stephens (to American Cyanamid Co.).
37. M. F. Farona, W. T. Ayers, B. G. Ramsey, and J. G. Grasselli, Inorg. Chim. Acta 3, 503 (1969).
38. J. Reedijk, Inorg. Chim. Acta 5, 687 (1971).
39. A. Samantaray, P. K. Panda, and В. K. Mohapatra,/ Indian Chem. Soc. 57, 430 (1980).
40. M. S. Barvinok and L. V. Mashkov, Zh. Neorg. Khim. 25, 2846 (1980).
41. V. I. Bruskov and V. N. Bushuev, Bioflyika 22(1), 26 (1977); Chem. Abstr. 87, 39783d (1977).
42. T. O. Osmanov, V. F. Gromov, P. M. Khomikovskii, and A. D. Abkin, Polym. Sci. USSR 22, 739 (1980); 21, 1948 (1979).
43. T. Asakara and N. Yoda,/ Polym. Sci. PartA-1 6, 2477 (1968).
44. T. Asakara, K. Ikeda, andN. Yoda,/ Polym. Sci. PartA-1 6, 2489 (1968).
45. U.S. Pat. 2,373,190 (Apr. 10,1945), F. E. King (to B. F. Goodrich Co.).
46. C. Moureau, Bull. Soc. Chim. Fr. 9, 417 (1973).
47. U.S. Pat. 3,064,050 (Nov. 13, 1962), K. W. Saunders and L. L. Lento, Jr. (to American Cyanamid Co.).
48. H. Fener and V. E. Lynch, / Am. Chem. Soc. 75, 5027 (1953).
49. U.S. Pat. 2,475,846 (July 12, 1949), L. A. Lindberg (to American Cyanamid Co.).
50. Ger. Offen. 2,310,516 (Sept. 19,1974), K. Fischer and H. Petersen (to BASF A.G.).
51. T. Araki, C. Terunuma, K. Tanigawa, and N. Ando, Kobunshi Ronbunshu 31, 309 (1974).
52. Jpn. Kokai 75 82008 (July 3,1975), K. Yamamoto and co-workers (to Mitsui Toatsu Chemicals, Inc.).
53. Jpn. Kokai 74 26235 (Mar. 8,1974), S. Kumi and co-workers (to Dainippon Ink and Chemicals, Inc.).
54. E. Mueller, K. Dinges, and W. Ganlich, Makromol Chem. 57, 27 (1962).
55. U.S. Pat. 3,185,539 (May 25, 1965), R. K. Madison and W. J. Van Loo, Jr. (to American Cyanamid Co.).
56. Jpn. Pat* 15,816 (Aug. 5, 1964), T. Oshima and M. Suzuki (to Sumitomo Chemical Co., Ltd.).
57. U.S. Pat. 3,422,139 (Jan. 14,1969), P. Talet and R. Behar (to NobeLBozel).
58. Fr. Pat. 1,406,594 (July 23, 1965), P. Talet and R. Behar (to NobeLBozel).
59. R. E. Dunbar and G. C. White,/ Org. Chem. 23, 915 (1958).
60. Acrylamide-50 Handling and Storage Procedures, PRC 22B, American Cyanamid Co., Wayne, N.J., 1980.
61. Aqueous Acrylamide, Forms 260-951-88, Analytical Method PAA 44, Chemical and Metals Department, The Dow Chemical Company, Midland, Mich.,
1976.
62. S. R. Betso and J. D. McLean, Anal. Chem. 48, 766 (1976).
63. В. T. Croll and G. M. Simkins, Analyst 97, 281 (1972).
64. M. V. Norris, in F. D. Snell and C. L. Hilton, eds., Encyclopedia of Industrial Chemical Analysis, Vol. 4, Wiley-Interscience, New York, 1967, pp.
160-168.
65. D. C. MacWilliams, D. C. Kaufman, and B. F. Waling, Anal. Chem. 37, 1546 (1965); A. R. Mattocks, Anal. Chem. 40, 1347 (1968).
66. В. T. Croll, Analyst (Eondon) 96, 67 (1971).
67. HPEC Determinations of Acrylamide in Water and Air Samples, Analytical Method PAA 58,61 in Forms 260-951-88, Chemicals and Metals Department,
The Dow Chemical Company, Midland, Mich., 1981.
68. U.S. Pat. 2,734,915 (Feb. 14, 1956), G. D. Jones (to The Dow Chemical Company).
69. U.S. Pat. 3,041,375 (June 26, 1962), S. N. Heiny (to The Dow Chemical Company).
70. M. J. Sook, E. J. Forbes, and G. M. Khan, Chem. Commun. (5), 121 (1966).
Kirk-Othmer Encyclopedia of Chemical Technology (4th Edition)
137
ACRYLAMIDE
Voll
71. U.S. Pat. 3,381,034 (Apr. 30, 1968), J. L. Greene andM. Godfrey (to Standard Oil Co., Ohio).
72. K. Watanabe, Bull Chem. Soc. Jap. 37, 1325 (1964); Chem. Abstr. 62, 2735b (1965).
73. U.S. Pat. 3,597,481 (Aug. 3, 1971), B. A. Tefertiller and С. E. Habermann (to The Dow Chemical Company); U.S. Pat. 3,631,104 (Dec. 28, 1971),
С. E. Habermann and B. A. Tefertiller (to The Dow Chemical Company); U.S. Pat. 3,642,894 (Feb. 15, 1972), С. E. Habermann, R. E. Friedrich,
and B. A. Tefertiller (to The Dow Chemical Company); U.S. Pat. 3,642,643 (Feb. 15, 1972), С. E. Habermann (to The Dow Chemical Company);
U.S. Pat. 3,642,913 (Mar. 7, 1972), С. E. Habermann (to The Dow Chemical Company); U.S. Pat. 3,696,152 (Oct. 3, 1972), С. E. Habermann
and M. R. Thomas (to The Dow Chemical Company); U.S. Pat. 3,758,578 (Sept. 11, 1973), С. E. Habermann and B. A. Tefertiller (to The Dow
Chemical Company); U.S. Pat. 3,767,706 (Oct. 23, 1972), С. E. Habermann and B. A. Tefertiller (to The Dow Chemical Company).
74. Brit. Pat. 1,324,509 (July 25, 1973) (to Mitsui Toatsu Chemicals, Inc.).
75. Ger. Offen. 2,320,060 (Nov. 7,1974), T. Dockner and R. Platz (to BASF A.G.).
76. E. Otsuka and co-workers, Chem. Econ. Eng. Rev. 7(4), 29 (1975).
77. Brit. Pat. 2,018,240 (Oct. 17,1979), I. Watanabe (to Nitto Chemical).
78. U.S. Pat. 4,343,900 (Aug. 10, 1982), I. Watanabe (to Nitto Chemical).
79. Fr. Demande 2,488,908 (Feb. 26, 1982), I. Watanabe and co-workers (to Nitto Chemical).
80. U.S. Pat. 4,390,631 (June 28, 1983), I. Watanabe and co-workers (to Nitto Chemical).
81. U.S. Pat. 4,414,331 (Nov. 8, 1983), I. Watanabe and co-workers (to Nitto Chemical).
82. Chem. Eng. 97(7), 19-21 (July 1990).
83. J. J. Ritter and P. P. Minieri,/Am. Chem. Soc. 70, 4045 (1948).
84. H. Plant and J. J. Ritter,/.Am. Chem. Soc. 73, 4076 (1951).
85. Aqueous Acrylamide, Form No. 192-466-76, Chemicals and Metals Department, The Dow Chemical Company, Midland, Mich., 1976.
86. K. A. Johnson, S. J. Gorzinski, К. M. Bodner, R. A. Campbell, С. H. Wolf, M. A. Friedman, and R. W. Mast, Toxicol. Appl. Pharmacol. 85, 154—168
(1986).
87. L. N. Davis, P. R. Durkin, P. H. Howard, andj. Saxena, Investigation ofSelected Potential Environmental Contaminants; Acrylamides, EPA Report No.
560/2-76-008,1976.
88. Criteriafor Recommended Standard Occupational Exposure to Acrylamide, U.S. Department of Health, Education, and Welfare, Washington, D.C., 1976.
89. Environmental and Health Aspects of Acrylamide, A Comprehensive Bibliography ofPublishedEiterature 1930 to April 1980, EPA Report No. 560/7-81-006,
1981.
90. Assessment ofTesting Needs; Acylamide, EPA ReportNo. 560/11-80-016,1980.
91. J. Going and K. Thomas, Sampling and Analysis of SelectedToxic Substances; Task I Acylamide, EPA ReportNo. 560/13-79-013,1979.
92. E. J. Conway, R. J. Petersen, R. F. Colingsworth, J. G. Craca, and J. W. Carter, Assessment of the Need for a Character of Eimitations on Acrylamide and Its
Components, EPAMRI Project No. 4308-N, 1979.
93. H. A. Tilson, Neurobehav. Toxicol. Tetratol. 3, 445 (1981).
94. P. M. Edwards, Br. J. Ind. Med. 32, 31 (1975).
95. В. T. Croll, G. M. Arkell, and R. P. J. Hodge, Water Res. 8, 989 (1974).
96. M. J. Hynes and J. A. Pateman,/ Gen. Microbiol. 63, 317 (1970).
97. H. M. Abdelmagid andM. A. Tabatabai, J. Environ. Qual. 11, 701 (1982).
98. Krautter and co-workers, Environ. Toxicol. Chem. 5, 373—377 (1986).
99. N-Methylolacrylamide, PRC 14, Process Chemicals Department, American Cyanamid Co., Wayne, N.J., 1972.
100. N,N'-Methylenebisacrylamide, PRT47A, American Cyanamid Co., Wayne, NJ., 1978.
101. N-(iso-Buto>ymethyl)acrylamide, PRT 126, Process Chemicals Department, American Cyanamid Co., Wayne, N.J., 1977.
102. N,N-T)imethylacrylamide, TechnicalBulletin, Alcolac, Inc., Baltimore, Md., 1977.
103. MMPS Monomer, Lubrizol Corp., Wickliffe, Ohio, 1981.
104. Directoy of Chemical Producers, SRI International, Menlo Park, Calif., 1988.
105. Chem. Mark. Rep. 238(23), 36 (1990).
С. E. Habermann
Dow Chemical, USA
Kirk-Othmer Encyclopedia of Chemical Technology (4th Edition)
138
ACRYLAMIDE POLYMERS
Voll
ACRYLAMIDE POLYMERS
a i ч (CH2=CHC—NH2)
Acrylamide [/9-06- 1J v z *'
polymerizes in. the presence of free-radical initiators to form polyacrylamide [9003-05-8] chains with the
structure
(—CH2—CH—)
V z | 'n
conh2
In this article the term acrylamide polymer refers to all polymers which contain acrylamide as a major constituent. Consequently, acrylamide
polymers include functionalized polymers prepared from polyacrylamide by postreaction and copolymers prepared by polymerizing acrylamide
(2-propenamide, C^H^NO) with one or more comonomers.
Since the 1960s the industrial use of nonionic, anionic, cationic, and amphoteric acrylamide polymers has increased steadily because of their unique
chemical and physical properties, low relative toxicity, and low cost. The primary market areas for these polymers are water treatment, papermaking,
mineral processing, enhanced oil recovery, and superabsorbents. Enhanced oil recovery represents a large potential market, but low oil prices limited the
growth of this market during the 1980s. In 1990 oil prices increased and are expected to continue increasing during the decade. Environmental concerns
have contributed to a rapid growth in the use of polyacrylamide flocculants in effluent treatment and sludge dewatering. High molecular weight cationic
polyacrylamides have begun to play a prominent role in these applications. Improvements in characterization techniques such as infrared spectroscopy, nmr
spectroscopy, gel-permeation chromatography, and sedimentation field flow fractionation have led to a better understanding of the influence of chain
microstructure and molecular weight distribution on performance.
Manufacturing processes have been improved by use of on-line computer control and statistical process control leading to more uniform final
products. Production methods now include inverse (water-in-oil) suspension polymerization, inverse emulsion polymerization, and continuous aqueous
solution polymerization on moving belts. Conventional azo, peroxy, redox, and gamma-ray initiators are used in batch and continuous processes. Recent
patents describe processes for preparing transparent and stable microlatexes by inverse microemulsion polymerization. New methods have also been
described for reducing residual acrylamide monomer in finished products.
Physical Properties.
Solid Polymer. Completely dry polyacrylamide is a brittle white solid. Commercially available dry polyacrylamide powders are typically dried
under mild conditions and usually contain 5—15% water. The powders are hygroscopic, and generally become increasingly hygroscopic as the ionic
character of the polymer increases. Cationic polymers are particularly hygroscopic.
The physical properties of nonionic polyacrylamide are listed in Table 1. Many values of the glass-transition temperature (Ip have been published.
The measured value is highly sensitive to water, and is also dependent on the presence of functionality along the backbone. The tacticity and linearity of the
polymer is claimed to be dependent on the polymerization temperature. Syndiotacticity is favored at low temperatures (13). Linear polymer chains are
obtained below 50°C, but branching begins to occur as temperature is increased above this level (14). Weight loss on heating in helium or nitrogen occurs
with loss of water up to 250°C (15). Above this temperature, weight loss occurs primarily with ammonia gas evolution (16).
Table 1. Physical Properties of Solid Polyacrylamide
Property Value Reference
density, g/cm3 1.302 1
glass-transition temp, °C 188 2
critical surface tension, mN /m (=dyn/cm) 35-40 3
chain structure 4
5
mainly heterotactic linear or branched, some head-to-head addition 6,7
crystallinity amorphous (high mol wt) 8
solvents water, ethylene glycol, formamide 9
nonsolvents ketones, hydrocarbons, ethers, alcohol 10
fractionation solvents water—methanol 11
gases evolved on combustion in air H2, CO, CO2, NH? nitrogen oxides 12
Dry polyacrylamides are commercially available as nondusting powders and as spherical beads. Products can contain small amounts of additives
which aid in both the stability and dissolution of the polymers in water. Most polyacrylamide powders will develop full viscosity in water with mild
agitation. The length of time is dependent on the polymer molecular weight and the hardness of the water. The high shear sensitivity of high molecular
weight polymer solutions can result in polymer degradation.
Polymers in Solution. Polyacrylamide is soluble in water at all concentrations, temperatures, and pH values. An extrapolated theta
temperature in water is approximately —40° C (17). Insoluble gel fractions are sometimes obtained owing to cross-link formation between chains or to the
formation of imide groups along the polymer chains (18). In very dilute solution, polyacrylamide exists as unassociated coils which can have an ellipsoidal
or beanlike structure (19). Large aggregates of polymer chains have been observed in hydrolyzed polyacrylamides (20) and in copolymers containing a small
amount of hydrophobic groups (21).
In general nonionic polyacrylamides do not interact strongly with neutral inorganic salts. Certain salts can, however, alter the hydrogen bonding
between primary amide groups and water in individual chains. For example, potassium iodide [7681-11-0] causes a slight increase in solution viscosity,
indicating coil expansion and an increase in hydrodynamic volume (22). Anionic polyacrylamides possessing carboxyl groups have complex interactions
with many divalent cations, such as calcium and magnesium found in hard water and in the injection water used in enhanced oil recovery (23,24).
Interactions with trivalent ions such as Al3+ or Cr3+ are very strong and can cause anionic polyacrylamides to gel. Usually increased water hardness reduces
Kirk-Othmer Encyclopedia of Chemical Technology (4th Edition)
139
ACRYLAMIDE POLYMERS
Voll
the observed viscosity of an anionic polyacrylamide at a given polymer concentration.
Flow Properties. In water, high molecular weight polyacrylamide forms viscous homogeneous solutions. The measured viscosities increase
slowly with increasing polymer concentration and then increase very rapidly after a critical concentration is reached, at which point the polymer chains start
to overlap and interpenetrate. The critical concentration decreases with increasing shear rate because the linear and flexible entangled molecules stretch in
the direction of shear stress. Normal stresses, in the direction perpendicular to flow, are observed for high molecular weight polyacrylamide solutions.
These normal stresses are more pronounced for polymers with a very broad molecular weight distribution. Viscosities and viscoelastic behavior decrease
with increasing temperature. In some cases a marked viscosity decrease with time is observed in solutions stored at constant temperature and zero shear.
The decrease may be due to changes in polymer conformation. The rheological behavior of pure polyacrylamides over wide concentration ranges has been
reviewed (5).
At concentrations well below the critical concentration for chain overlap, linear, high molecular weight polyacrylamides can reduce resistance to flow.
Introduction of ionic groups into the polymer chain increases the effective polymer chain length and increases the efficiency of drag reduction. The high
molecular weight portion of the molecular weight distribution is the most efficient in reducing friction. Drag reduction effects are not affected by salts if
nonionic polyacrylamide is employed. If the polymer possesses carboxyl groups, however, the effectiveness decreases with increasing salt concentration. A
recent review describes the desirable flow enhancing properties of polyacrylamides and other polymers (19).
In packed beds of particles possessing small pores, dilute aqueous solutions of hydrolyzed polyacrylamide will sometimes exhibit dilatant behavior
instead of the usual shear thinning behavior seen in simple shear or Couette flow. In elongational flow, such as flow through porous sandstone, flow
resistance can increase with flow rate due to increases in elongational viscosity and normal stress differences. The increase in normal stress differences with
shear rate is typical of isotropic polymer solutions. Normal stress differences of anisotropic polymers, such as xanthan in water, are shear rate independent
(25,26).
Interest in polyacrylamides exhibiting associative thickening behavior has increased recendy due to the ability of these hydrophobically modified
polymers to develop desirable flow properties and performance (27—29). Hydrophobically modified polyacrylamides produce a very small increase in
pressure drop with increasing shear rate in flow through narrow tubes. These polymers are often of low molecular weight and possess 1.0 mol % or less
hydrophobic groups along the polymer backbone. Shear degradation is usually minimized because of the low molecular weight. The hydrophobic groups
dissociate at high shear rates, and then associate again at low shear rates.
Chemical Properties
The preparation of polyacrylamides and postpolymerization reactions on polyacrylamides are usually conducted in water. Reactions on the amide groups of
polyacrylamides are often more complicated than reactions of simple amides because of neighboring group effects. Reaction rates, for example, can differ
considerably.
Postreactions of polyacrylamide to introduce anionic, cationic, or other functional groups are often attractive from a cost standpoint. This approach
can suffer, however, from side reactions resulting in cross-linking or the introduction of unwanted functionality, such as carboxyl groups from hydrolysis.
In addition, postreaction on high molecular weight polyacrylamides can be difficult because of the high viscosity of even fairly dilute aqueous
polyacrylamide solutions.
Hydrolysis. Polyacrylamide hydrolyzes rapidly under alkaline conditions at relatively low temperatures. Generally, higher temperatures are
required to hydrolyze polyacrylamide under neutral or acidic conditions. The structure of the hydrolyzed polyacrylamide can vary considerably and depends
on the conditions employed. 13C-nmr studies (30—32) have shown that the sequence distributions of carboxyl and amide groups differ depending on both
the pH of the hydrolysis reaction and the concentration of electrolyte. These more recent nmr studies corroborate previous studies (33—35) which indicated
that hydrolysis at low pH results in blocks of carboxyl groups, while hydrolysis at high pH results in a more random distribution of carboxyl groups. Under
neutral conditions, a mixture of the two distributions is obtained (32).
Alkaline hydrolysis of polyacrylamide can be expressed in terms of three rate constants, and where the subscript indicates the number of
neighboring carboxyl groups next to the amide group undergoing hydrolysis. The rate constant is larger than which in turn is much larger than A
negatively charged carboxyl group produces a retardation effect on the hydrolysis of a neighboring amide group. Two neighboring negatively charged
carboxyl groups severely retard hydrolysis of an amide. Consequendy, hydrolysis of about 70% can be obtained in the presence of excess hydroxide ion,
leaving the remainder of the amides surrounded by two carboxyl groups. Lower levels of carboxyl groups are often desirable in many commercial
applications. A convenient way to prepare a polyacrylamide with about 30 mol % hydrolysis is to heat an aqueous polyacrylamide solution containing excess
sodium carbonate (36).
Hydrolysis of cationic polyacrylamides prepared from copolymerization of acrylamide and cationic ester monomer can occur under very mild
conditions. A substantial loss in cationicity can cause a significant loss in performance in many applications. Copolymers [69418-26-4] of acrylamide and
acryloxyethyltrimethylammonium chloride [44992-01 -0], CgH16NO2(Cl), for instance, lose cationicity rapidly at alkaline pH (37).
—(-CH2—CH—CH2 —CH-)^-
CONH2 СООСН2СН2М(СНз)з)С|-
/СН2
—(CH2— CH XCHV
/<4
О N 4)
I
H
The reaction rate increases with pH. 13C-nmr spectra indicate the presence of imide structures in the degraded product (38). The degree of cationicity loss is
dependent on the number of cationic units having neighboring amide groups along the polymer chain (39). The percentage of esters cleaved increases as
the number of esters with neighboring amides increases. Esters with no neighboring amides, such as those found in homopolymers of
acryloxyethyltrimethylammonium chloride, are difficult to hydrolyze.
Mannich Reaction. Aminomethylation of polyacrylamide with formaldehyde [50-00-0] and a secondary amine to produce a Mannich
polyacrylamide has been extensively studied (40).
—(CH2—CH^- + R2NH + CH2 =0 —- —(CH2—CH^- + H2O
c=o c=o
I I
nh2 nh
ch2nr2
The yields of this reaction are typically 40—80%. 13C-nmr studies (41) indicate that the reaction is a second-order process between polyacrylamide and
dimethylaminomethanol, which is one of the equilibrium products formed in the reaction between formaldehyde and dimethylamine [124-40-3]\ C2H7N.
The Mannich reaction is reversible. Extensive dialysis of Mannich polyacrylamides removes all of the dimethylaminomethyl substituents (42).
High molecular weight Mannich polyacrylamides are sold as aqueous solutions containing approximately 7% polymer or less, because of the high
viscosity of their aqueous solutions and their tendency to cross-link on standing. The cross-linking reaction can be controlled by addition of formaldehyde
scavengers such as guanidine nitrate [506-93-4] and urea [57-13-6].
Mannich polyacrylamides can react with alkylating agents such as methyl chloride [74-87-3]\ CH3C1, methyl bromide [74-83-9]y CH3Br, and dimethyl
Kirk-Othmer Encyclopedia of Chemical Technology (4th Edition)
140
ACRYLAMIDE POLYMERS
Voll
sulfate [77-78-1J, C2H6SO4, to produce quaternary ammonium bases which retain cationic charge at alkaline pH (40,42,43).
Sulfomethylation. The reaction of formaldehyde and sodium bisulfite [7631-90-5] with polyacrylamide under alkaline conditions to produce
sulfomethylated polyacrylamides has been known for many years (44—46). A more recent publication (47) suggests, however, that the expected sulfomethyl
substitution is not obtained under the previously described strongly alkaline conditions of pH 10—12. This 13C-nmr study indicates that hydrolysis of
polyacrylamide occurs and the resulting ammonia reacts with the NaHSO3 and formaldehyde. A recent patent claims a new high pressure, high temperature
process at slightly acid pH for preparation of sulfomethylated polyacrylamide (48).
Methylol Formation. Polyacrylamide reacts with formaldehyde to form an A-methylol derivative. The reaction is conducted at pH 7—8.8 to
avoid cross-linking, which will occur at lower pH. The copolymer can also be prepared by copolymerizing acrylamide with commercially available
%-methylolacrylamide [924-42-5]., C4H?NO2. These derivatives are useful in several mining applications (49,50). They are also useful as chemical grouts.
Reaction with Other Aldehydes. Polyacrylamide reacts with glyoxal [107-22-2]C2H2O2, under mild alkaline conditions to yield a polymer
with pendant aldehyde functionality.
—(ch2—сн-hr +0—c—c—°------~ —(ch2—CH-hr
C=O H H c=o
I I
NH2 NHCH—CHO
OH
This reaction can be controlled by varying the pH and reaction temperature. Cross-linking is a competing reaction. In a typical preparation a 10% aqueous
solution of a low molecular weight polyacrylamide reacts with glyoxal at pH 8—9 at room temperature. As the reaction proceeds, solution viscosity increases
slowly and then more rapidly as the level of functionalization and cross-linking increases. When the desired extent of reaction is achieved, the reaction is
acidified to a pH below 6 to slow the reaction down to a negligible rate. These glyoxalated polyacrylamides are used as paper additives for improvement of
wet strength (51,52).
A similar reaction occurs when polyacrylamide is mixed with glyoxilic acid [298-12-4]y C2H2O3, at pH about 8. This reaction produces a polymer
with the CONHCH(OH)COOH functionality, which has found application in phosphate ore processing (53).
Transamidation. Polyacrylamide reacts with primary amines such as hydrazine [302-01-2]> N2H4, (54) and hydroxylamine [7803-49-8]. NH3O,
(55—57) to form substituted amides with loss of ammonia.
—(CH2—СН-Ьй- + m NH2NH2 —► —(CH2—CH^- + m NH3
C=O C=O
I I
nh2 nhnh2
This reaction, conducted in alkaline solution, also produces carboxyl groups by hydrolysis of the amide (54). Recent work on the reaction of polyacrylamide
with hydroxylamine indicates that maximum conversion to the hydroxamate functionality (—CONHOH) takes place at a pH > 12 (57). Apparendy, this
reaction of hydroxylamine at high pH, where it is a free base, is faster than the hydrolysis of the amide by hydroxide ion. Previous studies on the reaction of
hydroxylamine with low molecular weight amides indicated that a pH about 6.5 was optimum (55).
Hoffman Degradation. Polyacrylamide reacts with alkaline sodium hypochlorite [7681-52-9]., NaOCl, or calcium hypochlorite 7778-54-3].,
Ca(OCl)2, to form a polymer with primary amine groups (58). Optimum conditions for the reaction include a slight molar excess of sodium hypochlorite, a
large excess of sodium hydroxide, and low temperature (59). Cross-linking sometimes occurs if the polymer concentration is high. High temperatures can
result in chain scission.
Reaction with Chlorine. Polyacrylamide reacts with chlorine under acid conditions to form reasonably stable IV-chloroamides. The polymers
are water soluble and can provide good wet strength and wet web strength in paper (60).
Commercial Polymerization and Processing
Polyacrylamides are manufactured by free-radical polymerization of acrylamide to form chains of the structure shown, where n can range from several up to
400,000.
c=o
I
nh2
Suitable initiators include azo compounds, organic peroxides, redox systems, light with sensitizers, x rays or gamma rays, persulfates, and electroinitiation
(5,61). The heat evolved during polymerization is 82.8 kJ /mol (19.8 kcal/mol) (62). The rate of polymerization is typically proportional to the square root
of the initiator concentration (63). The rate is proportional to the monomer concentration to the power 1.2—1.5 (63). The rate constant at 25°C and pH 1
for propagation is (1.7 A 0.3) X 104 L/(mol-s). The ratio k / A^is almost always independent of pH and is equal to 4.2 A 0.2 (64). This number is very
high and explains why very high molecular weights are possible.
Termination is primarily by disproportionation (65). Additives such as inorganic salts, detergents, complexing agents, and organic solvents can either
increase or decrease the rate of polymerization and alter the polymerization kinetics (66,67). Molecular weights of 4 x 10⁷ can be obtained if polymerization
occurs at low temperature and very low initiator concentrations. For most industrial applications, somewhat lower molecular weights are sufficient.
Chain-transfer agents can be added to control molecular weight and prevent cross-linking. Table 2 lists chain-transfer constants for polymerization of
acrylamide in water. 2-Propanol is commonly used for molecular weight control.
Table 2. Chain-Transfer Constants for Polymerization of Acrylamide in Water
Transfer species Temperature, °C Cham-transier constant x 104 Reference
monomer 25 U.U786 ± U.U1U7 68
monomer 40 0.120 ± 0.0388 68
monomer 60 0.6 69
polymer <50 near zero 68
(CH3)2CHOH 50 19 70
hso; 75 1700 71
h2o2 25 5 72
KjSjOg 40 26.3 ± 7.08 68
Kirk-Othmer Encyclopedia of Chemical Technology (4th Edition)
141
ACRYLAMIDE POLYMERS
Voll
iron(III) salts
copper(II) salts
H2O
25
25
25
very high
very high
near zero
73
68
Acrylamide copolymerizes with many vinyl comonomers readily. The copolymerization parameters in the Alfrey-Price scheme are Q = 0.23 and
e = 0.54 (74). The effect of temperature on reactivity ratios is small (75). Solvents can produce apparent reactivity ratio differences in copolymerizations of
acrylamide with polar monomers (76). Copolymers obtained from acrylamide and weak acids such as acrylic acid have compositions that are sensitive to
polymerization pH. Reactivity ratios for acrylamide and many comonomers can be found in reference 77. Reactivity ratios of acrylamide with commercially
important cationic monomers are given in Table 3.
Table 3. Acrylamide Monomer (Mt) Reactivity Ratios*
Comonomer M2 CAS Registry Number Molecular formula q r2 Reference
[44992-01-0] C8H16NO2 'Cl 0.64 0.48 78
acryloyloxyethyltrimethylammonium chloride 0.33 ± 0.09 0.40 ±0.11 79
MA -diallyldimethylammonium chloride [7398-69-8] C8H16N 'Cl 6.7 0.58 78
6.4±0.4b 0.06 ± 0.03b 79
AA-dniiethylaminoethyl methacrylate [2867-47-2] c8h15no2 0.26 1.66 78
N,N- dimethylaminopropylacrylaniide [3845-76-9] c8h16n2o 0.47 0.95 78
AA-dimethylaminopropyl methacrylate [20602-77-1] C9H1?NO2 0.47 1.10 78
methacnlolyloxyethAtrimethylammonium [5039-78-1] c,h18no2 'Cl 0.27 1.71 78
chloride
methacrjdamidopropjdtrimethylammonium [51410-72-1] CWH91N9O C 0.57 1.13 78
chloride 1
At 40°C unless otherwise noted.
b At 60°C.
Copolymers of acrylamide and acryloyloxyethyltrimethylammonium chloride have become increasingly preferred due to the favorable reactivity
ratios between these two monomers, which result in copolymers with a uniform composition.
Solution Polymerization. Plant scale polymerizations in water are conducted either adiabatically or isothermally. Molecular weight control,
exotherm control, and reduction of residual monomer are factors which limit the types of initiators employed. Commercially available high molecular
weight solution polyacrylamides are usually manufactured and sold at about 5% solids so that the viscosities permit the final product to be pumped easily.
In a typical adiabatic polymerization, approximately 20 wt % aqueous acrylamide is charged into a stainless steel reactor equipped with agitation,
condenser, and cooling jacket or coils. To initiate the polymerization, an aqueous solution of sodium bisulfite [7631-90-5] is added, followed by the addition
of a solution of ammonium persulfate [7727-54-0]y N2HgS2Og. As the polymerization proceeds, the temperature rises to about 90°C, and then begins to fall
at the end of the polymerization. The molecular weight obtained depends primarily on the initiator concentration employed.
Isothermal polymerizations are carried out in thin films so that heat removal is efficient. In a typical isothermal polymerization, aqueous acrylamide
is sparged with nitrogen for 1 h at 25°C and EDTA (C1QH16N2Og) is then added to complex the copper inhibitor. Polymerization can then be initiated as
above with the ammonium persulfate—sodium bisulfite redox couple. The batch temperature is allowed to rise slowly to 40°C and is then cooled to
maintain the temperature at 40°C. The polymerization is complete after several hours, at which time additional sodium bisulfite is added to reduce residual
acrylamide.
Solution polyacrylamides can also be prepared at high polymer solids by radiation processes (80,81). Polyacrylamides with molecular weights up to
20 million can be prepared by irradiation of acrylamide and comonomers in a polyethylene bag with cobalt-60 gamma radiation at dose rates of
120-200 J/kg-h. The total dose of radiation is controlled to avoid cross-linking.
Polymerization on Moving Belts. Dry polyacrylamides are sometimes preferred, particularly when transportation distances are long. Care
must be taken during drying to avoid forming insoluble polymer and to prevent molecular weight decreases (82). A continuous process has been developed
for preparing dry polyacrylamides which consists of polymerizing aqueous acrylamide on a moving belt and drying the resulting polymer (82—86). In one
such process (82) an aqueous solution of acrylamide and azobisisobutyronitrile [78-67-1CgH12N4, is pumped onto a concave, moving belt along with an
aqueous solution containing a redox initiator system. The polymerization proceeds as the solution moves along the belt, reaching temperatures up to about
95°C. The belt speed is controlled so that the polymerization is complete when the polymer reaches the end of the belt. At the end of the belt the polymer
gel is sliced into small granules and dried in an oven. The dried polymer is then passed through a grinder to produce the optimum particle size for handling
and use.
Several recent patents describe improvements in the basic belt process. In one case a higher solids polymerization is achieved by cooling the starting
monomer until some monomer crystallizes and then introducing the resulting monomer slurry onto the belt as above. The latent heat of fusion of the
monomer crystals absorbs some of the heat of polymerization, which otherwise limits the solids content of the polymerization (87). In another patent a
concave belt is described which becomes flat near the end. This change leads to improved release of polymer (88).
Another method used commercially is to grind the gel and extract the water (and residual monomer) with methanol. The methanol is dried and
recycled. The dry polymer is ground and screened.
Dry Bead Process. Dry polyacrylamides can also be prepared in the form of dry beads with particle sizes ranging from about 100 to 2000
micrometers (89). These free-flowing beads are formed by azeotropically distilling water from inverse suspension polyacrylamides, collecting the particles
by filtration, and further drying the particles in a fluid bed drier for short times. The resulting particles can be dissolved readily in water in the same manner
as other dry polyacrylamides. The size and shape of the particles prepared in the suspension polymerization process are a function of the types and
amounts of surfactants and additives employed. Typically, 0.03 to 0.2 wt % (based on water plus polymer) of an oil-soluble polymeric surfactant is used to
obtain the desired particle size. Greater amounts of surfactants lead to smaller particles, which are more useful in the inverse suspension form than in the
dry form because of dusting problems inherent in small-particle-size dry powders. Certain water soluble ionic organic compounds have been found to be
effective in improving the stability of the particles and providing a narrower particle size distribution when used in conjunction with the polymeric
stabilizers. In the absence of the stabilizer, irregularly shaped, unstable particles can result. The choice of the stabilizer is dependent on the charge of the
polyacrylamide being produced.
Inverse Emulsion Process. A method of avoiding the high solution viscosities of water-soluble polymers comprises emulsifying the aqueous
monomer solution in oil containing surfactants, homogenizing the mixture to form a water-in-oil emulsion and then polymerizing the monomers in the
emulsion. For use, the emulsion is inverted in water, releasing the polymer. The original patent (90) illustrated a process for production of dry solid
polymers. Considerable attention has been given to processes where the inverse emulsion polymerization produces finely divided particles which are small
enough to resist settling and can be sold as is (91). Molecular weights can be over 2 million and are frequency as high as 20 million. A typical process for
production of an anionic polyacrylamide follows (92). To a stirred tank are added, with cooling, 50% aqueous acrylamide, acrylic acid, and deionized water
Kirk-Othmer Encyclopedia of Chemical Technology (4th Edition)
142
ACRYLAMIDE POLYMERS
Voll
to give monomer concentration of 40% by weight. Ammonia is added to the monomer mixture while the temperature is maintained at 25°C. When the pH
reaches 6, this mixture is pumped into another tank containing an oil and a sorbitan oleate surfactant. The resulting mixture is homogenized, oxygen
removed by nitrogen sparging, polymerization initiated with a redox initiator, and the batch temperature controlled by cooling and the rate of initiator
addition. At the end of the polymerization, an additional surfactant is added which enables the emulsion to invert rapidly into water.
Recent patents and publications describe process improvements. Conversions can be followed by on-line hplc (93). The enzyme amidase can be
used to reduce residual monomers (94—96). A hydrogenation process for reduction of acrylamide in emulsions containing more that 5% residual monomer
has been patented (95). Biodegradable oils have been developed (97).
Microemulsion Polymerization. Polyacrylamide microemulsions are low viscosity, nonsettling, clear, thermodynamically stable water-in-oil
emulsions with particle sizes less than about 100 nm (98—100). They were developed to try to overcome the inherent settling problems of the larger particle
size, conventional inverse emulsion polyacrylamides. To achieve the smaller microemulsion particle size, increased surfactant levels are required, making this
system more expensive than inverse emulsions. Acrylamide microemulsions form spontaneously when the correct combinations and types of oils,
surfactants, and aqueous monomer solutions are combined. Consequendy, no homogenization is required. Polymerization of acrylamide microemulsions is
conducted similarly to conventional acrylamide inverse emulsions. To date, polyacrylamide microemulsions have not been commercialized, although work
has continued in an effort to exploit the unique features of this technology (100).
Uses
Polyacrylamides are classified according to weight-average molecular weight (Af ) as follows:
high 15 X 106
low 2 x 10⁵
very low 2 x 10³
Most uses for high molecular weight polyacrylamides in water treating, mineral processing, and paper manufacture are based on the ability of these
polymers to flocculate small suspended particles by charge neutralization and bridging (101). Low molecular weight polymers are employed as dispersants
(qv), crystal growth modifiers, or selective mineral depressants. In oil recovery, polyacrylamides adjust the rheology of injected water so that the polymer
solution moves uniformly through the rock pores sweeping the oil ahead of it. Other applications such as superabsorbents and soil modification rely on the
very hydrophilic character of polyacrylamides.
Water Treating. Municipal sludge plants and industrial waste treatment plants produce sludge which can be dewatered very efficiently by
acrylamide polymers. Polyacrylamide flocculants can provide clean filtrates, higher filter cake solids and reduced sludge volume, and improve incineration
and composting efficiency. Many municipal sludge treatment plants use pressure filtration for better water removal. These sludges are very hydrophilic, are
negatively charged, and are difficult to dewater. Cationic polyacrylamides are being used to an increasingly greater extent in these applications, particularly,
acrylamide—acryloxyethyltrimethylammonium chloride copolymers [69418-26-4]. Anionic polyacrylamides are also used extensively, alone or in combination
with cationic polymers.
Paper mill effluents contain large amounts of degraded lignins, other colored material, and a high BOD. Cationic polyacrylamides are now being
used to clarify these effluents. Sources of drinking water may contain trihalomethane precursors. These are refractory organic matter such as lignins, which
in the presence of chlorine will form trihalomethanes which are suspected carcinogens. Highly cationic polymers in the presence of alum [17927-65-0]
Al2 (SO4)3-£H2O, are found to be effective in removing these precursors.
Anionic and nonionic polyacrylamides effectively remove suspended solids such as silt and clay from potable water. Suppliers provide special grades
which meet EPA/FDA regulations for residual acrylamides. A recent publication (102) states that hydrolyzed polyacrylamides with narrow interchain
charge distributions provide better performance in flocculation of clay. These polymers were prepared by alkaline hydrolysis. (See Flocculating agents.)
Industrial plants are lowering discharges by recycling process streams. Low molecular weight polyacrylates and anionic polyacrylamides are used as
dispersants to inhibit scale formation on metal surfaces by calcium carbonate [471-34-1CaCO3; gypsum [7778-18-9]CaSO4-2H2O; silica magnesium
compounds; and other substances (103—105). The polymers alter the structures of the crystals during crystal growth and/or affect the rate of crystallization.
The amount of scale formation on metal surfaces is strongly affected by the polymer molecular weight and the functional groups present on the polymer
chains (106).
Mineral Processing. Both synthetic and natural hydrophilic polymers are used in the mineral processing industry as flocculants and flotation
modifiers. Most synthetic polymers in use are based on acrylamide alone or with anionic or cationic comonomers. Nonionic polymers are effective as
flocculants for the insoluble gangue minerals in the acid leaching of copper and uranium (107,108), for thickening of iron ore slimes (109), and for
thickening of gold flotation tailings (110). In some uranium leach operations, alow molecular weight cationic polymer with a relatively low charge density is
used along with the nonionic polymer to improve supernatant clarity. Anionic polymers are extensively used in the industry. They are used as flocculants
for insoluble residues formed in cyanide leaching of gold (111). Acrylamide—acrylic acid copolymers are used for thickening of copper, lead, and zinc
concentrates in flotation of sulfide ores. These copolymers, containing from 50—100% carboxylate groups, are used to flocculate fine iron oxide particles in
the manufacture of alumina from bauxite at high pH (112). Hydroxamated polyacrylamides, prepared from nonionic polyacrylamide and hydroxylamine
salts, are also effective in this Bayer process (113). Copolymers [40623-73-2] of acrylamide and acrylamido-2-methylpropanesulfonic acid [15214-89-8] have
been patented as phosphate slime dewatering aids (114).
Low molecular weight polyacrylamide derivatives with mineral specific functionalities have been developed as highly selective depressants. The
depressants have certain ecological advantages over natural depressants such as starches and guar gums. The depressants provide efficient mineral recovery
without flocculation. Partially hydrolyzed polyacrylamides with molecular weights of 7,000 to 85,000 can be used in sylvanite (KC1) recovery (115). Polymers
having the functionality —CONHCN2OH are efficient modifiers in hematite—silica separations (116). Polymers containing the —CONHCH(OH)COOH
functionality provide excellent selectivity in separation of apatite from siliceous gangue in phosphate benefication. Valuable sulfide minerals containing
copper and nickel can be separated effectively from gangue sulfide minerals such as pyrite in froth flotation processes when acrylamide—allylthiourea
copolymers are added to depress the pyrite (117).
Acrylamide copolymers are effective iron ore pellet binders (118). When the ore slurry in water has a pH above 8, anionic polymers are effective. If
the ore is acid washed to remove manganese, then a cationic polymer is effective.
Paper Manufacture. Polyacrylamides are used as wet-end additives to promote drainage of water from the cellulose web, to retain white
pigments and clay fillers in the sheet, to promote sheet uniformity, and to provide dry tensile strength improvements (119). Cationic polyacrylamides which
have reacted with glyoxal are used to promote wet strength (120). These wet-strength resins have been used in paper towels. Recendy, these glyoxalated
polymers have been modified so that they can be used in toilet tissue. These polymers provide an initial high wet tensile strength with rapid tensile strength
decay in water so that sewers may not become clogged. Anionic polyacrylamides have been used with alum to increase dry strength (121). Primary amide
functionality promotes strong interfiber bonds between cellulose fibers. Sometimes paper mills use dry-strength additives so that recycled fiber,
groundwood, thermomechanical pulp, and other low cost fiber can be used to produce liner board and other paper grades which must meet ICC
requirements for Mullen burst strength and Concorra crush strength. Details on paper manufacture can be found in reference 122. All additives used for
manufacture of food grade papers are subject to FDA regulations, and are listed in the Code of Federal Regulations, paragraphs 176.170, 176.180,178.3400, and
178.3650 (1988).
Enhanced Oil Recovery. Polymer flooding is a potentially important use for anionic polyacrylamides having molecular weights greater than 5
million and carboxyl contents of about 30%. The ionic groups provide the proper viscosity and mobility ratio for efficient displacement. The anionic charge
prevents excessive adsorption onto negatively charged pores in reservoir rock. Viscosity loss is observed in brines particularly when calcium ion is present.
A primary advantage of anionic polyacrylamides is low cost (123). Profile modification is a process where flooding water is diverted from zones with high
Kirk-Othmer Encyclopedia of Chemical Technology (4th Edition)
143
ACRYLAMIDE POLYMERS
Voll
permeability to other zones of lower permeability containing oil. For this, polymeric hydrogels are used (21). Metals such as chromium and aluminum can
be injected with anionic polyacrylamides to cross-link the polymers in more permeable reservoir zones prior to the water flood (124—126).
Polyacrylamides are used in many other oilfield applications. These include cement additives for fluid loss control in well cementing operations
(127), viscosity control additives for drilling muds (128), and fracturing fluids (129). Copolymers [40623-73-2] of acrylamide and
acrylamidomethylpropanesulfonic acid do not degrade with the high concentrations of acids used in acid fracturing.
Hydrophobically Associating Polymers. Extensive research in the 1980s focused on acrylamide copolymers containing small amounts of
hydrophobic side chains. At zero or low shear rates, the apparent viscosity can be very large because of association of the hydrophobic groups between
chains. In oil reservoir conditions, the polymers tolerate high salt concentrations while providing proper viscosifying properties (130). These associative
thickeners are also used in coatings (131) and in oil spill clean-up (132). Reference 133 gives more information about associative polymers.
Superabsorbents. Water-swellable polymers are used extensively in consumer articles and for industrial applications. Most of these polymers
are cross-linked acrylic copolymers of metal salts of acrylic acid and acrylamide or other monomers such as 2-acrylamido-2-methylpropanesulfonic acid.
These hydrogel forming systems can have high gel strength as measured by the shear modulus (134). Sometimes inorganic water-insoluble powder is
blended with the polymer to increase gel strength (135). Patents describe processes for making cross-linked polyurethane foams which contain
superabsorbent polymers (136,137).
Other Applications. Polyacrylamides are used in many additional applications including soil modification (138), dust control (139,140),
humidity control (141), protein purification (142), removal of barium from wastewater (143), and removal of arsenic from hydrocarbons (144).
Polyacrylamides have been used for many years in sugar manufacture and textile treatment.
Analytical Methods
A survey of characterization methods for linear and branched nonionic polyacrylamides is given in reference 5. Gel-permeation chromatography, diffusion
and sedimentation, intrinsic viscosity, and light scattering are discussed emphasizing some difficulties encountered in obtaining consistent data.
Characterization of anionic polyacrylamides used in oil recovery by ir spectroscopy, 13C-nmr, tga, and x-ray diffraction is described in reference 8.
Characterization of molecular weight is difficult. New methods for characterizing anionic polyacrylamides include band sedimentation and low angle
light scattering (145), hydrodynamic chromatography (146), field flow fractionation (147), and packed bed chromatography (148,149). Cationic
polyacrylamides are difficult to analyze by size-exclusion chromatography because they adsorb irreversibly to column packings. Cationic functionalized silica
beads have been used to overcome this problem (150).
Two-dimensional nmr spectroscopy has led to a much better understanding of biopolymers and their function (151). This technique has been
applied to polyacrylamide for absolute assignments of proton and carbon spectra at the tetrad level (152).
Specifications, Shipping and Storage
Before polyacrylamides are sold, the amount of residual acrylamide is determined. In one method, the monomer is extracted from the polymer and the
acrylamide content is determined by hplc (153). A second method is based on analysis by cationic exchange chromatography (154). For dry products the
particle size distribution can be quickly determined by use of a shaker and a series of test sieves. Batches with small particles can present a dust hazard. The
percentage of insoluble material is determined in both dry and emulsion products.
Polyacrylamide powders are typically shipped in moisture-resistant bags or fiber packs. Emulsion and solution polymers are sold in drums, tote bins,
tank trucks, and tank cars. The transportation of dry and solution products is not regulated in the United States by the Department of Transportation, but
emulsions require a DOT NA 1693 label.
Under normal conditions, dry polymers are stable for 1 year or more. The emulsion and solution products have somewhat shorter shelf Eves.
Safety and Health
Dry anionic and nonionic polyacrylamides have acute oral (rat) and dermal (rabbit) LD50 values of greater than 2.5 and greater than 10.0 g/kg, respectively.
Dry cationic polyacrylamides have acute oral (rat) and dermal (rabbit) LD50 values of greater than 5.0 and greater than 2.0 g/kg, respectively. Emulsion
nonionic, anionic, and cationic polyacrylamides have both acute oral (rat) and dermal (rabbit) LD50 values of greater than 10 g/kg. Dry nonionic and
cationic material caused no skin and minimal eye irritation during primary irritation studies with rabbits. Dry anionic polyacrylamide did not produce any
eye or skin irritation in laboratory animals. Emulsion nonionic polyacrylamide produced severe eye irritation in rabbits, while anionic and cationic material
produced minimal eye irritation in rabbits. Emulsion nonionic, anionic, and cationic polyacrylamide produced severe, irreversible skin irritation when tested
in rabbits which had the test material held in skin contact by a bandage for 24 h. This represents an exaggeration of spilling the product in a boot for
several hours. When emulsion nonionic, cationic, and anionic polyacrylamides were tested under conditions representing spilling of product on clothing,
only mild skin irritation was noted. Polyacrylamides are used safely for numerous indirect food packaging applications, potable water, and direct food
applications.
Economic Aspects
Worldwide, there are many sellers of polyacrylamides. Some of these are repackagers. Suppliers are listed in Table 4. Selling prices for polyacrylamides vary
considerably depending on the product form (solution, emulsion, dry), type (anionic, nonionic, cationic), and other factors. Prices can range from as low as
about $2/kg for simple dry nonionic polyacrylamides to $10/kg and more for highly charged cationic polymers. In many applications, such as sludge
dewatering in waste treatment, the need for increased performance has lead to increased functionalization (eg, higher cationicity) and increased cost. In
Western Europe it was estimated for 1988 that 47 x 106 kg of polyacrylamides were used, with the primary oudets being water treating and paper
manufacture (155). Probably a large amount was exported to Africa for mining. In Japan the major consumption has been in paper manufacture and water
treatment. Table 5 gives an estimated breakdown of acrylamide consumption for polymerization to anionic, nonionic, and cationic polyacrylamides. The
majority of polymer for EOR was exported (155).
Table 4. Suppliers of Polyacrylamide
Region____________________________________________Companies_______________________________________________________________________________
United States Allied Colloids, Inc.
American Cyanamid Company
Aqua Ben Corporation
Betz Laboratories, Inc.
Calgon Corporation (Merck & Co.)
Chemtall, Inc. (SNF Floerger)
Dearborn Chemical Company (W. R. Grace & Company)
The Dow Chemical Company
Drew Chemical Corporation (Ashland Chemical, Inc.)
Exxon Chemical Company
Hercules, Inc.
Nalco Chemical Company
Kirk-Othmer Encyclopedia of Chemical Technology (4th Edition)
144
ACRYLAMIDE POLYMERS
Voll
Europe
Japan
Polypure, Inc.
Secodyne, Inc.
Stockhausen, Inc.
Allied Colloids, Ltd.
American Cyanamid Company
BASF AG
Chemische Fabrik Stockhausen & Cie
The Dow Chemical Company
SNF Floerger (France)
Kemira Oy (Finland)
Rohm GmbH
Н1фпе-Рои1епс Specialties Chimiques (France)
Dai-Ichi Kogyo Seiyaku Company, Ltd.
Kurita Water Industries, Ltd.
Kyoritsu Yuki Company, Ltd.
Mitsubishi Chemical Industries Company, Ltd.
Mitsui-Cyanamid, Ltd.
Sankyo Kasei Company, Ltd.
Sanyo Chemical Industries, Ltd.
Takenaka Komuten Company, Ltd.
Toa Gosei Chemical Industry Company, Ltd.
Table 5. Consumption of Acrylamide for Polyacrylamides, 103 t
Year Paper Water treatment Mining EOR Other Total
1979 4 1 Western Europe 8.5 3.5 4 21
1985 3.5 9 6 1 3.5 23
1988 6 17 12 1 11 47
1987 28 20 Japan 2 5 55
1988 28 22 2 5 57
1989 29 24 3 5 61
BIBLIOGRAPHY
'Acrylamide Polymers" in ECT 3rd ed., Vol. 1, pp. 312—330, byj. D. Morris and R. J. Penzenstadler, The Dow Chemical Company.
1. O. G. Lewis, Physical Constants of Einear Homopolymers, Springer-Vedag, New York, 1968, p. 23.
2. J. Klein and R. Hietzmann, Makromol. Chem. 179, 1895 (1978).
3. J. Brandrup and E. H. Immergut, eds., PolymerHandbook, 2nd ed., John Wiley & Sons, Inc., New York, 1975, p. III-222.
4. J. E. Lancaster and M. N. O'Connor,/. Polym. Sci. Polym. Eett. Ed 20, 547 (1982).
5. W. M. Kulicke, R. Kniewske, andj. Klein, Prog. Potym. Sci. 8, 376 (1982).
6. S. Sawant and H. Morawetz, J. Potym. Sci. Potym. Eett. Ed. 20, 385—388 (1982).
7. S. Sawant and H. Morawetz, Macromolecules 17, 2427—2431 (1984).
8. S. J. Guerrero, P. Boldarino, and J. A. Zurimendi, J. Appl. Polym. Sci. 30, 962 (1985).
9. Ref. 5, p. 383.
10. Ref. 3,p. IV-245.
11. Ref. 3, p. IV-183.
12. MAGNIFEOC 905N Flocculant, Material Safety Data, American Cyanamid Company, Wayne, NJ., 1989.
13. F. A. Bovey, High Resolution NMR of Macromolecules, Academic Press, New York, 1972, p. 147.
14. Ref. 5, p. 379.
15. E. H. Gleason, M. L. Miller, and G. F. Sheats, J. Polym. Sci. 38, 133 (1959).
16. Ref. 8, p. 960.
17. A. Silberberg, J. Eliassaf, and A. Katchalsky, J. Potym. Sci. 23, 259 (1957).
18. J. J. Kozakiewicz, American Cyanamid Company, Stamford, Conn., unpublished results, 1987.
19. W. M. Kulicke, M. Koetter, and H. Graeger, Advances in Polymer Science 89, Springer-Vedag Berlin, Heidelberg, 1989, p. 32.
20. W. P. Shyluk and F. S. Stow, Jr., J. Appl Polym. Sci. 13, 1023 (1969).
21. U.S. Pat. 4,861,499 (Aug. 29, 1989), R. G. Ryles and R. E. Neff (to American Cyanamid Company).
22. M. Leca, Polym. Bull. 16, 537-543 (1986).
23. G. Muller, J. P. Laine, and J. C. Fenyo, J. Potym. Sci. Chem. 17, 659—672 (1979).
24. F. Schwartz and J. Francois, Makromol. Chem. 182, 2775 (1981).
25. W. M. Kulicke, PolymerPreprints 30, 379 (1989).
26. W. M. Kulicke, N. Boese, and M. Bouldin in D. N. Schulz and G. A. Stahl, eds., Water-Soluble Polymers forPetroleum Recovery, Plenum Publishing
Corp., New York, 1988, pp. 1-18.
27. U.S. Pat. 4,730,028 (Mar. 8, 1988), J. Bock and P. L. Valint (to Exxon Research and Engineering Co.).
28. J. K. Borchardt in J. K. Borchardt and T. F. Yen, eds., Enhanced Oil Recovery and Production Simulation (ACS Symposium Ser. Vol. 396), American
Chemical Society, Washington, D.C., 1989.
29. S. Evani and G. D. Rose, Potym. Mater. Sci. Eng. 57, 477—481 (1987).
30. F. Halverson, J. E. Lancaster, and M. N. O'Connor, Macromolecules 18, 1139 (1985).
31. N. D. Truong, J. C. Galin, J. Francois, and Q. T. Pham, PolymerM, 459 (1986).
32. K. Ysuda, K. Okajima, and K. Kamide, PolymerJournallSf 1101 (1988).
33. H. Kheradmand, J. Francois, and V. Plazanet, PolymerlSf 860 (1988).
34. J. Moens and G. Smets, J. Potym. Sci. 23, 931 (1957).
35. G. Smets and A. M. Hesbain, J. Potym. Sci. 40, 217 (1959).
Kirk-Othmer Encyclopedia of Chemical Technology (4th Edition)
145
ACRYLAMIDE POLYMERS
Voll
36.
37.
38.
39.
40.
41.
42.
43.
44.
45.
46.
47.
48.
49.
50.
51.
52.
53.
54.
55.
56.
57.
58.
59.
60.
61.
62.
63.
64.
65.
66.
67.
68.
69.
70.
71.
72.
73.
74.
75.
76.
77.
78.
79.
80.
81.
82.
83.
84.
85.
86.
87.
88.
89.
90.
91.
92.
93.
94.
95.
96.
97.
98.
99.
100.
101.
102.
103.
104.
105.
106.
107.
108.
109.
110.
U.S. Pat. 3,022,279 (Feb. 20,1962), A. C. Profitt (to The Dow Chemical Company).
R. Aksberg and L. Wagberg,/ Appl. Polym. Sci. 38, 297 (1989).
F. Lafuma and G. Durand, Polym. Bull. 21, 315 (1989).
D. R. Draney, S. Y. Huang, J. J. Kozakiewicz, and D. W. Lipp, American Chemical Society Polymer Preprints 31, 500 (1990).
M. Tramonti, L. Angolini, and N. Ghedini, Polymeric, 775 (1980).
C. J. McDonald and R. M. Beaver, Macromolecules 12, 203 (1979).
R. H. Pelton,/. Polym. Sci. Polym. Chem. Ed. 22, 3955 (1984).
U.S. Pat. 4,137,165 (Jan. 20, 1979), A. T. Coscia and N. D. O'Connor (to American Cyanamid Company).
U.S. Pat. 3,332,927 (July 25,1967), M. F. Hoover (to Calgon Corporation).
A. M. Schiller and T. J. Suen, Ind. Eng. Chem. 48, 2132 (1956).
U.S. Pat. 3,979,348 (Sept. 7,1976), E. G. Ballweber and K. G. Phillips (to Nalco Chemical Company).
D. P. Bakalik and D. J. Kowalski, Polym. Mater. Sci. Eng. 57, 845 (1987).
U.S. Pat. 4,762,894 (Aug. 9,1988), D. W. Fong and D. J. Kowalski (to Nalco Chemical Company).
U.S. Pat. 4,282,087 (Aug. 4, 1989), R. M. Goodman and H. P. Panzer (to American Cyanamid Company).
U.S. Pat. 4,360,425 (Nov. 23, 1982), S. K. Lim and R. M. Goodman (to American Cyanamid Company).
U.S. Pat. 4,605,702 (Aug. 12, 1986), G. J. Guerro, R. J. Proverb, and R. F. Tarvin (to American Cyanamid Company).
U.S. Pat. 4,603,176 (July 29, 1986), D. W. Bjorkquist and W. M. Schmitt (to The Proctor and Gamble Company).
D. R. Nagaraj, A. S. Rothenberg, D. W. Lipp, and H. P. Panzer, Int. J. of Miner. Process. 20, 291 (1987).
S. Machida, Tappi52, 1734 (1969).
U.S. Pat. 4,587,306 (May 6, 1986), L. Vio and G. Meunier (to Societe Nationale Elf Aquitaine).
A. J. Domb, E. G. Cravalho, and R. Langer,/. Poly. Sci. Polym. Chem. Ed. 26,2623 (1988).
World Pat. 88/06602 (Sept. 7, 1988), A. J. Domb and co-workers (to Massachusetts Institute of Technology).
H. Tanaka and R. Senju, Bull. Chem. Soc. Jpn. 49(10), 2821 (1976).
H. Tanaka,/ Polym. Sci. Polym. Chem. Ed. 17, 1239 (1979).
Eur. Pat. Appl. 289,823 (May 5, 1987), Y. L. Fu, S. Y. Huang, and R. W. Dexter (to American Cyanamid Company).
G. S. Misra and U. D. N. Bajpai, Prog. Polym. Sci. 8(1—2), 61—131 (1982).
F. S. Dainton, K. Irvin, and D. A. G. Wamsley, Trans. Faraday Soc. 56, 1784 (1960).
T. J. Suen, Y. Jen, and J. V. Lockwood,/ Polym. Sci. 31, 481 (1958).
D. J. Currie, F. S. Dainton, and W. S. Watt, Polymer(, 451 (1965).
T. J. Suen, A. M. Schiller, and W. N. Russel,/ Appl. Polym. Sci. 3, 126 (1960).
V. F. Kurenkov and V. A. Myagchenkov, Eur. Polym. J. 16, 1229 (1980).
J. Barton, V. Juranicova, and V. Vaskova, Makromol. Chem. 186, 1935 (1985).
S. M. Shawki and A. E. Hamielec,/ Appl. Polym. Sci. 23, 3341 (1979).
Ref. 3, p. 11-59.
T. J. Suen, A. M. Schiller, and W. N. Russell, in Polymerisation andPolycondensation Processes (Adv. Chem. Ser. 34), American Chemical Society,
Washington, D.C., 1963, p. 217.
Ref. 63, p. 493.
F. S. Dainton andM. Tordoff, Trans. Faraday Soc. 53, 499 (1957).
E. A. S. Cavell and I. T. Gilson,/ Polym. Sci. PartA-1 4, 541 (1966).
R. Z. Greenley,/ Macromol. Sci. Chem. 14, 427, 445 (1980).
S. M. Shawki and A. E. Hamielec,/ Appl. Polym. Sci. 23, 3155 (1979).
S. Plochocka,/ Macromol. Sci. Ren. Macromol. Chem. 20(1), 67 (1979).
W. M. Thomas and D. W. Wang in J. I. Kroschwitz, ed., Encyclopedia of Polymer S cience and Engineering 2nd. ed., Vol. 1, Wiley-Interscience, New
York, 1985, p. 182.
H. Tanaka,/ Polym. Sci. Polym. Chem. Ed. 24, 29—36 (1986).
W. Baade, D. Hunkier, and A. E. Hamielec,/ Appl. Polym. Sci. 38, 185 (1989).
U.S. Pat. 4,024,040 (May 17,1977), C. J. Phalangas, A. J. Restaino, and H. B. Yun (to Hercules, Inc.).
U.S. Pat. 4,115,339 (Sept. 19,1978), A. J. Restaino (to Hercules, Inc.).
U.S. Pat. 4,138,839 (Feb. 6, 1979), P. H. Landolt and L. N. Allen (to American Cyanamid Company).
U.S. Pat. 4,132,844 (Jan. 2,1979), M. W. CoviHe (to American Cyanamid Company).
Fr. Pats. 2,428,053 and 2,428,054 (June 9,1978), J. Boutin and J. Neel (to КЬфпе-РоЫепс Industries).
U.S. Pat. 4,762,862 (Aug. 9,1988), A. Yada and co-workers (to Dai-ichi Kogyo Seiyaku Co.).
Ger. Pat. DE 3,621,429 (Jan. 8,1987), J. M. Lucas and A. C. Pericone (to Milchem, Inc.); Chem. Abstr. 106, 138949e (1987).
Aust. Pat. AU8818380 (Jan. 5, 1989), W. B. Davies (to American Cyanamid Company).
U.S. Pat. 4,857,610 (Aug. 15, 1989), M. Chemlir and J. Pauen (to Chemische Fabrik Stockhausen GmbH).
Eur. Pat. EP 102,760 (Aug. 9,1982), P. Flesher and A. S. Allen (to Allied Colloids, Ltd.).
U.S. Pat. 3,284,393 (Nov. 8, 1966), J. W. Vanderhoff and R. M. Wiley (to The Dow Chemical Company).
U.S. Pat. 3,826,771 (July 30, 1974), D. R. Anderson and A. J. Frisque (to Nalco Chemical Company).
U.S. Pat. 4,439,332 (Mar. 27, 1984), S. Frank, A. T. Coscia, and J. M. Schmitt (to American Cyanamid Company).
Ref. 79, p. 187.
U.S. Pat. 4,742,114 (May 3, 1988), R. L. Wetgrove and R. W. Kaesler (to Nalco Chemical Company).
U.S. Pat. 4,427,821 (Nov. 22,1982), D. W. Fong and R. J. AUain (to Nalco Chemical Company).
Eur. Pat. EP 272,026 (Apr. 12, 1987), M. A. Carver and J. Hinton (to Imperial Chemical Industries).
U.S. Pat. 4,824,894 (Apr. 25,1987), R. Schnee, A. S. Cordialo, and J. Masanek (to Rohm GmbH Chemische Fabrik).
U.S. Pat. 4,021,364 (May 3, 1977), P. Speiser and G. Birrenbach (to Prof. Dr. Peter Speiser, Fotsch. Switzerland).
F. Candau, in M. A. El-Nokaly, ed., Polymer Association Structures: Microemulsions andEiquid Crystals (ACS Symposium Ser. 384), American Chemical
Society, Washington, D.C., 1989, pp. 47—61.
World Pat. WO 10274 (June 17,1988), F. Candau and P. Buchert (to Norsolor).
F. Mabire, R. Audebert, and C. Quivoron,/ Colloidlnteface Sci. 97, 120 (1984).
K. Takada and J. Ryugo, Kobunshi Ronbunshu 46(3), 145 (1989); Chem. Abstr. 111(2), 8178v (1989).
U.S. Pat. 4,499,022 (Feb. 12,1985), W. F. Massler III and Z. Amjad (to the B.F. Goodrich Company).
Fr. Pat. 2,604,712 (Apr. 8,1988), C. Roque and A. Ribba (to Institut Francois du Petrole).
Jpn. Pat. J61/107997 (May 26,1986) (Kurita Water Industries, Ltd.); Chem. Abstr. 105, 232,183b (1986).
Z. Amjad,/ Colloidlnteface Sci. 123, 523—536 (1988).
J. M. W. Mackenzie, Eng. Min. J. 80-87 (Oct. 1980).
J. P. MacDonald, P. L. Mattison, and J. M. W. MacKenzie,/.y. Afr. Inst. Min. Metall. 81, 303 (1981).
Supefloc 16 PlusFlocculant, American Cyanamid Company, Wayne, N.J., 1986.
Mining Chemicals Handbook, Rev. ed., American Cyanamid Company, Wayne, N.J., 1986.
Kirk-Othmer Encyclopedia of Chemical Technology (4th Edition)
146
ACRYLAMIDE POLYMERS
Voll
111.
112.
113.
114.
115.
116.
117.
118.
119.
120.
121.
122.
123.
124.
125.
126.
127.
128.
129.
130.
131.
132.
133.
134.
135.
136.
137.
138.
139.
140.
141.
142.
143.
144.
145.
146.
147.
148.
149.
150.
151.
152.
153.
154.
155.
D. L. Dauplaise and M. F. Wemeke, Proceedings of the Consolidation and Dewatering of Fine Particles Conference, University of Alabama, Tuscaloosa, Ala.,
1982, PP. 90-113.
H. I. Heitner, T. Foster, and H. P. Panzer in J. I. Kroschwitz, ed., Encyclopedia of Polymer S cience and Engineering 2nd ed., Vol. 9, Wiley-Interscience,
New York, 1987, p. 830.
U.S. Pat. 4,767,540 (Aug. 30,1988), D. P. Spitzer and W. S. Yen (to American Cyanamid Company).
U.S. Pat. 4,342,653 (Aug. 3, 1982), F. Halverson (to American Cyanamid Company).
U.S. Pat. 4,533,465 (Aug. 6, 1985), R. M. Goodman and S. K. Lim (to American Cyanamid Company).
Ref. 53, p. 293.
U.S. Pat. 4,866,150 (Sept. 12, 1989), D. W. Lipp and D. R. Nagaraj (to American Cyanamid Company).
Eur. Pat. EP 288,150 (Mar. 27,1987), A. Aken (to Allied Colloids, Ltd.).
U.S. Pat. 4,824,523 (June 1, 1987), L. Wagberg andT. Linndstrum (to Svenska Traforskningsinstitutet).
U.S. Pat. 3,556,932 (Jan. 19, 1971), A. T. Coscia and L. Williams (to American Cyanamid Company).
W. F. Reynolds and R. B. Wasser in J. P. Casey, ed., Pulp andPaper Chemistry and ChemicalTechnology,]o\m Wiley & Sons, Inc., New York, 1981, pp.
1447-1470.
J. P. Casey, ed., Pulp andPaper Chemistry and ChemicalTechnology, 4 vols., John Wiley & Sons, Inc., New York, 1987, pp. 1—2609.
J. K. Borchardt, "Oil Field Applications," in J. I. Kroschwitz, ed., Encyclopedia of Polymer S cience and Engineering 2nd ed., Vol. 10, Wiley-Interscience,
New York, 1987, p. 350.
U.S. Pat. 4,744,419 (May 17,1988), R. Sydansk and P. Argabright (to Marathon Oil Company).
U.S. Pat. 4,783,492 (Nov. 8,1988), H. Dovan and R. Hutchins (to Union Oil Company of Calif.).
U.S. Pat. 4,606,407 (Aug. 8,1986), P. Shu (to Mobil Oil Corp.).
U.S. Pat. 4,806,164 (Feb. 21,1989), L. Brothers (to Halliburton Co.).
U.S. Pat. 4,423,199 (Dec. 27,1983), C. J. Chang and T. E. Stevens (to Rohm and Haas Co.).
U.S. Pat. 4,417,989 (Nov. 29,1983), W. D. Hunter (to Texaco Development Corp.).
J. Bock and co-workers, "Hydrophobically Associating Polymers," in G. A. Stahl and D. N. Schulz, eds., Water-Soluble Polymers forPetroleum Recovery,
Plenum Press, New York, 1988, pp. 147—160.
U.S. Pat. 4,722,962 (Feb. 2,1988), G. D. Shay (to DeSoto, Inc.).
U.S. Pat. 4,734,205 (Mar. 29, 1988), D. F. Jacques and J. Bock (to Exxon Research and Engineering Co.).
A. Karunasena, R. G. Brown, and J. E. Glass, in J. E. Glass, ed., Polymers in Aqueous Media: Performance Through Association (Adv. Chem. Ser. 223),
American Chemical Society, Washington, D.C., 1989.
U.S. Pat. 4,654,039 USRE 32649 (Apr. 19,1988), K. Brandt, T. Inglin, and S. Goldman (to The Proctor and Gamble Co.).
U.S. Pat. 4,500,670 (Feb. 19, 1985), M. J. McKinley and D. P. Sheridan (to The Dow Chemical Company).
U.S. Pat. 4,725,628 (Feb. 16,1988), C. Garvey, J. Pazos, and G. Ring (to Kimbedy Clark Corp.).
U.S. Pat. 4,725,629 (Feb. 16,1988), C. Garvey and J. Pazos (to Kimberly Clark Corp.).
U.S. Pat. 4,797,145 (Jan. 10,1989), G. A. Wallace and A. Wallace.
U.S. Pat. 4,417,992 (Nov. 29,1983), B. R. Bhattacharyya andW. J. Roe (to Nalco Chemical Co.).
U.S. Pat. 4,801,635 (J an. 31, 1989), J. K. Zinkan and L. U. Koenig, Jr. (to Zinkan Enterprises).
U.S. Pat. 4,683,258 (July 28, 1987), H. Itch and co-workers (to Mitsui Toatsu Chemical Company, Inc.).
U.S. Pat. 4,716,219 (Dec. 29, 1987), B. Eggiman, E. Hochuli, and A. Schacher (to Hoffman-LaRoche, Inc.).
U.S. Pat. 4,491,523 (Jan. 1, 1985), R. W. Foreman (to Park Chemical Co.).
U.S. Pat. 4,541,918 (Sept. 17,1985), P. R. Stapp (to Phillips Petroleum Co.).
G. Holzwarth, L. Soni, and D. N. Schulz, Macromolecules 19, 422 (1986).
D. A. Hoagland, K. A. Larson, and R. K. Prud'homme, in H. G. Barth, eds., Modem Methods of Particle Si%e Analyses,Wiley & Sons, Inc., New
York, 1984.
J. J. Kirkland and W. W. Yau,/. Chromatogr. 353, 95—107 (1986).
D. A. Hoagland and R. K. Prud'homme,/ Appl Polym. Sci. 36, 935 (1988).
U.S. Pat. 4,532,043 (July 30, 1985), R. K. Prud'homme, F. W. Stanley, Jr., and Martin A. Langhorst (to The Dow Chemical Company).
M. Stickler and F. Eisenbeiss, Eur. Polym. J. 20, 849 (1984).
H. Kessler, M. Gehrke, and C. Griesinger, Angew. Chem., Int. Ed. Engl. 27, 490—536 (1988).
K. Hikichi, M. Ikura, and M. Yosuda, Pofm.J. 29, 851 (1988).
Methods Exam. Waters Assoc. Matl. 1988, United Kingdom Dept, of the Environment; Chem. Abstr. 108, 197583v (1988).
G. Schmoetzer, Chromatographia^^ 391—395 (1971); Chem. Abstr. 76, 25744c (1972).
Chemical Economics Handbook, CEH 80 Database, SRI International, Menlo Park, Calif., Oct. 10, 1989.
David Lipp
Joseph Kozakiewicz
American Cyanamid Company
Kirk-Othmer Encyclopedia of Chemical Technology (4th Edition)
147
ACRYLIC ACID AND DERIVATIVES
Voll
ACRYLIC ACID AND DERIVATIVES
The term acrylates includes derivatives of both acrylic (CH2=CHCOOH) and methacrylic acids (CH 2=C( CH3)COOH). This article discusses the
preparation, properties, and reactions of acrylic acid monomers only (see Methacrylic acid and derivatives). Acrylic acid (propenoic acid) was first
prepared in 1847 by air oxidation of acrolein (1). Interestingly, after use of several other routes over the past half century, it is this route, using acrolein from
the catalytic oxidation of propylene, that is currendy the most favored industrial process. Polymerization of acrylic esters has been known for just over a
century (2). However, it was not until 1930 that the technical difficulties of their manufacture and polymerization were overcome (3). The rate of
consumption of acrylates grew between 10 and 20% annually during the late 1970s. Growth fluctuated with the economy in the early 1980s with some
announced capacity increases being delayed until later in the decade. Although growth in the ester markets has dropped appreciably, new applications for
polymers of acrylic acid in the superabsorbent and detergent fields surged in the late 1980s. Current annual growth is ^3-5%; nonester markets contribute
more than the more mature ester area. Manufacture continues to be concentrated in the United States, Europe, and Japan. Worldwide capacity for acrylic
acid in the early 1990s will reach about 1.8 x 10⁹ kg per year if all currendy announced expansions are completed.
Area
United States
Europe
Far East
Capacity, 103t
682
636
500
Far East capacity is primarily in Japan but includes Taiwan, Korea, and China.
Acrylates are primarily used to prepare emulsion and solution polymers. The emulsion polymerization process provides high yields of polymers in a
form suitable for a variety of applications. Acrylate polymer emulsions were first used as coatings for leather in the early 1930s and have found wide utility
as coatings, finishes, and binders for leather, textiles, and paper. Acrylate emulsions are used in the preparation of both interior and exterior paints, floor
polishes, and adhesives. Solution polymers of acrylates, frequently with minor concentrations of other monomers, are employed in the preparation of
industrial coatings. Polymers of acrylic acid can be used as superabsorbents in disposable diapers, as well as in formulation of superior,
reduced-phosphate-level detergents.
The polymeric products can be made to vary widely in physical properties through controlled variation in the ratios of monomers employed in their
preparation, cross-linking, and control of molecular weight. They share common qualities of high resistance to chemical and environmental attack, excellent
clarity, and attractive strength properties (see Acrylic ester polymers). In addition to acrylic acid itself, methyl, ethyl, butyl, isobutyl, and 2-ethylhexyl
acrylates are manufactured on a large scale and are available in better than 98—99% purity (4). They usually contain 10—200 ppm of hydroquinone
monomethyl ether as polymerization inhibitor.
Physical Properties
Physical properties of acrylic acid and representative derivatives appear in Table 1. Table 2 gives selected properties of commercially important acrylate
esters, and Table 3 lists the physical properties of many acrylic esters.
Table 1. Physical Properties of Acrylic Acid Derivatives
Property Acrylic acid Acrolein Acrylic anhydride Acryloyl chloride Acrylamide
molecular formula C3H4O2 C3H4O C.H.O, 6 6 3 C3H3OC1 c3h5on
CAS Registry Number [79-10-7] [107-02-8] [2051-76-5] [814-68-6] [79-06-1]
melting point, °C 13.5 -88 84.5
boiling pointa, °C 141 52.5 38b 75 125е
r i d retractive index , 1.4185е 1.4017 1.4487 1.4337
flash point, Cleveland open cup, °C 68
density , g/mL 1.045е 0.838 1.113 1.122f
At 101.3 kPa = 1 atm unless otherwise noted.
b At 0.27 kPa.
CAt 16.6 kPa.
At 20°C, unless otherwise noted.
eAt 25°C.
f At 30°C.
Table 2. Properties of Commercially Important Acrylate Esters*
Property Methyl Ethyl я-Butyl Isobutyl 2-Ethylhexvl
solubility at 23°C, parts per 100 of solvent
in water 5 1.5 0.2 0.2 0.01
of water in ester 2.5 1.5 0.7 0.6 0.15
heat of vaporization, kj/g 0.39 0.35 0.19 0.30 0.25
specific heat, J/g-C 2.00 1.97 1.93 1.93 1.93
boiling points0 of azeotropes
Kirk-Othmer Encyclopedia of Chemical Technology (4th Edition)
148
ACRYLIC ACID AND DERIVATIVES
Voll
with water, °C 71 81.1 94.5
water content, % 7.2 15 40
with methanol, °C 62.5 64.5
methanol content, % 54 84.4
with ethanol, °C 73.5 77.5
ethanol content, % 42.4 72.7
with «-butanol, °C 119
butanol content, % 89
heat of polymerization, kJ /mol 78.7 77.8 77.4
aRefs. 4-5.
To convert J to cal, divide by 4.184.
C At 101.3 kPa = 1 atm.
Table 3. Physical Properties of Acrylic Estersa, CH2=CHCC)C)R
Compound Molecular formula CAS Registry Number Boiling point Refractive index «20d Density </°4
°C kPab
n-Alkyl esters methyl C4H6O2 [96-33-3] 80 101 1.4040 0.9535
ethyl C5H8O2 [140-88-5] 43 13.7 1.4068 0.9234
propyl ^6^10^2 [925-60-0] 44 5.3 1.4130 0.9078
butyl C7H12O2 [141-32-2] 35 1.1 1.4190 0.8998
pentyl CgH14O2 [2998-23^-] 48 0.9 1.4240 0.8920
hexyl [2499-95-8] 40 0.15 1.4280 0.8882
heptyl CioH1802 [2499-58-3] 57 0.13 1.4311 0.8846
octyl С41Н20О2 [2499-59^-] 57 0.007 1.4350 0.8810
nonyl с12н22о2 [2664-55-3] 76 0.03 1.4375 0.8785
decyl C13H24O2 [2156-96-9] 12 0.67 1.4400 0.8781
0
dodecyl C15H28O2 [2156-97-0] 12 0.11 1.4440 0.8727
0
tetradecyl c17h32o2 [21643-42-5] 13 0.05 1.4468 0.8700
8
hexadecyl C19H36O2 [13402-02-3] 17 0.20 1.4470 (30°C) 0.8620 (30°C)
0
Secondary and branched-chain alkyl esters' isopropyl ^6^10^2 [689-12-3] 52 13.7 1.4060 0.8932
isobutyl C7H12O2 [106-62-8] 62 6.7 1.4150 0.8896
jw-butyl C7H12O2 [2998-08-5] 60 6.7 1.4140 0.8914
2-ethylhexyl С41Н20О2 [103-11-7] 85 1.07 1.4365 0.8852
Esters of olefinic alcohols allyl ’ [999-55-3] 47 5.33 1.4320 0.9441
2-methylallyl Aminoalkyl esters C7H10O2 [818-67-7] 68 6.67 1.4372 0.9285
2- (dimethylamino)ethyl C7H13O2 [2439-35-2] 61 1.47 0.9434 1.4375
N
2- (diethylamino)ethyl C9H17°2 [2426-54-2] 70 0.67 0.9251 1.4425
N
Esters of ether alcohols 2-methoxyethyl ^6^10^3 [3121-67-7] 59 1.60 1.4272 1.0131
2-ethoxylethyl Cycloalkyl esters^ C8H12O3 [106-74-1] 78 3.07 1.4282 0.9819
cyclohexyl C9H14O2 [3066-71-5] 75 1.47 1.4600 0.9796
4-methylcyclohexyl Esters of halogenated alcohols' V16®2 [16491-65-9] 55 0.27 1.4550 0.9537
2-bromoethyl C5H7Br [4823-47-6] 53 5 1.4770 1.4774
2-chloroethyl C5H7C1 [2206-89-5] 74 29 1.4477
Glycol diacrylates ethylene glycol (monoester) C5HgO3 [818-61-1] 40 0.001 1.4482 (25°C)
ethylene glycol [2274-11-5] 70 0.13 1.4529
propylene glycol C9H12O4 [999-61-1] 63 0.04 1.4470
1,3-propanediol C9H12O4 [25151-33-1] 65 <0.13 1.4529
1,4-butanediol CHO [31442-13-4] 83 0.04 1.4538
diethylene glycol C10H14O5 [4074-88-8] 94 0.03 1.4572
1,5 -p entane diol Cf 1 О [36840-85^1] 94 0.04 1.4551
1,10-decanediol Clio [13048-45-5] 14 0.01
5
a In most cases, the references include additional examples of the class alcohols. Nitroalkyl esters are known (6—7).
Kirk-Othmer Encyclopedia of Chemical Technology (4th Edition)
149
ACRYLIC ACID AND DERIVATIVES
Voll
To convert kPa to mm Hg, multiply by 7.5.
C Ref. 8
d Ref. 9.
' Ref. 10.
fRef. 11.
£Ref. 12.
h Refs. 13-15.
i Ref. 5.
Acrylic acid is a moderately strong carboxylic acid. Its dissociation constant is 5.5 x 10 5 . Vapor pressure as a function of temperature is given in
Table 4 for acrylic acid and four important esters (4,16—18). The lower esters form azeotropes both with water and with their corresponding alcohols.
a b
Table 4. Vapor Pressures of Acrylic Acid and Important Esters , kPa
Temperature, °C Acrylic acid Methyl acrylate Ethyl acrylate Butyl acrylate 2-Ethylhexyl acrylate
-2U 0.85 0.31
-10 1.72 0.61
0 3.12 1.16 0.15
10 5.40 2.20 0.28
20 9.09 3.93 0.53
30 0.8 14.5 6.73 0.97
40 1.4 22.7 10.9 1.71
50 2.4 34.0 16.8 2.84 0.13
60 4.0 49.6 25.3 4.53 0.25
70 6.6 70.7 37.3 7.13 0.44
80 10 53.3 10.9 0.75
90 16 74.7 16.0 1.23
100 24 23.06 1.97
110 35 32.8 3.06
120 49 45.6 4.62
130 69 61.9 6.79
140 99 82.3 10.1
150 14.4
160 20.0
170 28.0
180 37.3
190 50.0
200 65.6
210 85.3
aRef. 4.
To convert kPa to mm Hg, multiply by 7.5.
Reactions
Acrylic acid and its esters may be viewed as derivatives of ethylene, in which one of the hydrogen atoms has been replaced by a carboxyl or carboalkoxyl
group. This functional group may display electron-withdrawing ability through inductive effects of the electron-deficient carbonyl carbon atom, and
electron-releasing effects by resonance involving the electrons of the carbon—oxygen double bond. Therefore, these compounds react readily with
electrophilic, free-radical, and nucleophilic agents.
Carboxylic Acid Functional Group Reactions. Polymerization is avoided by conducting the desired reaction under mild conditions and
in the presence of polymerization inhibitors. Acrylic acid undergoes the reactions of carboxylic acids and can be easily converted to salts, acrylic anhydride,
acryloyl chloride, and esters (16—17).
Salts are made by reaction of acrylic acid with an appropriate base in aqueous medium. They can serve as monomers and comonomers in
water-soluble or water-dispersible polymers for floor polishes and flocculants.
Acrylic anhydride is formed by treatment of the acid with acetic anhydride or by reaction of acrylate salts with acryloyl chloride. Acryloyl chloride is made
by reaction of acrylic acid with phosphorous oxychloride, or benzoyl or thionyl chloride. Neither the anhydride nor the acid chloride is of commercial
interest.
Esters. Most acrylic acid is used in the form of its methyl, ethyl, and butyl esters. Specialty monomeric esters with a hydroxyl, amino, or other
functional group are used to provide adhesion, latent cross-linking capability, or different solubility characteristics. The principal routes to esters are direct
esterification with alcohols in the presence of a strong acid catalyst such as sulfuric acid, a soluble sulfonic acid, or sulfonic acid resins; addition to alkylene
oxides to give hydroxyalkyl acrylic esters; and addition to the double bond of olefins in the presence of strong acid catalyst (19,20) to give ethyl or
secondary alkyl acrylates.
CH2=CHCOOH + KOI I •" ch2=chcoor + h2o
/°\
CH2=CHCOOH + CH2 —CH2 -- CH2=CHCOOCH2CH2OH
CH2=CHCOOH + ('II, ('II, •" CH2=CHCOOCH2CH3
Acrylic esters may be saponified, converted to other esters (particularly of higher alcohols by acid catalyzed alcohol interchange), or converted to amides by
aminolysis. Transesterification is complicated by the azeotropic behavior of lower acrylates and alcohols but is useful in preparation of higher alkyl
acrylates.
Amides. Reaction of acrylic acid with ammonia or primary or secondary amines forms amides. However, acrylamide (qv) is better prepared by
Kirk-Othmer Encyclopedia of Chemical Technology (4th Edition)
150
ACRYLIC ACID AND DERIVATIVES
Voll
controlled hydrolysis of acrylonitrile (qv). Esters can be obtained by carrying out the nitrile hydrolysis in the presence of alcohol.
О
H9SO4 + H20 II
CH2=CHC=N o > CH2=CHCONH3HSO4- roh h+ > CH2=CHCOH(R)
Unsaturated Group Reactions. In addition to a comprehensive review of these reactions (16), there are excellent texts (17,18).
Free-radical-initiated polymerization of the double bond is the most common reaction and presents one of the more troublesome aspects of monomer
manufacture and purification.
Substituted ring compounds are formed readily by Diels-Alder reactions.
ch2=chcoor + ch2 =CH—CH=CH2
COOR
Additions. Halogens, hydrogen halides, and hydrogen cyanide readily add to acrylic acid to give the 2,3-dihalopropionate, 3-halopropionate, and
3-cyanopropionate, respectively (21).
On storage or at elevated temperatures, acrylic acid dimerizes to give 3-acryloxypropionic acid [24615-84-7]> C6HgO4.
2 CH2=CHCOOH CH2=CHCOOCH2CH2COOH
Although the reaction is second order in acrylic acid concentration, the rate of dimer formation for neat acrylic acid available commercially is quite
adequately expressed by
rate = 3.58 x 10¹⁷exp(-10,500/T)
over the first several percent conversion (5), where rate is in ppm/day and T is the Kelvin temperature. Since this rate is approximately 100 ppm/day at
20°C, significant dimer can build up on prolonged storage. The reaction is accelerated by addition of strong acids, bases, or large amounts of water (several
wt %). However, water at concentrations as low as 0.1—0.2 wt %, present in commercially available acrylic acid, has negligible effect on dimer formation
(5,22). Continuation of this reaction leads to a distribution of polyester oligomers formed by successive additions across the double bond (5). Acrylic acid
can be regenerated by thermal or acid catalyzed cracking of these oligomers (23). Cracking of the corresponding esters gives acrylic acid and acrylic ester.
CH2=CHCOOCH2CH2COOR CH2=CHCOOH + ch2=chcoor
Michael condensations are catalyzed by alkali alkoxides, tertiary amines, and quaternary bases and salts. Active methylene compounds and aliphatic
nitro compounds add to form P-substituted propionates. These addition reactions are frequendy reversible at high temperatures. Exceptions are the
tertiary nitro adducts which are converted to olefins at elevated temperatures (24).
CH3
CH3CHNO2CH3 + CH2 =CHCOOC2H5 ► CH3—CHCH2CH2COOC2H5
no2
CH3
CH3 —CHCH2CH2COOC2H5
no2
CH3
--► CH2=CCH2CH2COOC2H5 + hno2
The addition of alcohols to form the 3-alkoxypropionates is readily carried out with strongly basic catalyst (25). If the alcohol groups are different,
ester interchange gives a mixture of products. Anionic polymerization to oligomeric acrylate esters can be obtained with appropriate control of reaction
conditions. The 3-alkoxypropionates can be cleaved in the presence of acid catalysts to generate acrylates (26). Development of transition-metal catalysts
for carbonylation of olefins provides routes to both 3-alkoxypropionates and 3-acryl-oxypropionates (27,28). Hence these are potential intermediates to
acrylates from ethylene and carbon monoxide.
Additions of mercaptans with alkaline catalysts give 3-alkylthiopropionates (29). In the case of hydrogen sulfide, the initially formed
3-mercaptopropionate reacts with a second molecule of acrylate to give a 3,3,-thiodipropionate (30,31).
H2S + 2 CH2=CHCOOR S(CH2CH2COOR) 2
Polythiodipropionic acids and their esters are prepared from acrylic acid or an acrylate with sulfur, hydrogen sulfide, and ammonium polysulfide (32). These
polythio compounds are converted to the dithio analogs by reaction with an inorganic sulfite or cyanide.
2 CH2=CHCOOCH3 + + H2S ---> (NH<)A
S3,(CH2CH2COOCH3)2 ->NaGN CH3OOCCH2CH2SSCH2CH2COOCH3
Ammonia and amines add to acrylates to form P-aminopropionates, which add easily to excess acrylate to give tertiary amines. The reactions are
reversible (33).
NH3 + CH2=CHCOOR -x H2NCH2CH2COOR -------------> ch2=chcoor
HN(CH2CH2COOR)2 -----------^h^chcoor N(CH2CH2COOR)3
Aqueous ammonia and acrylic esters give tertiary amino esters, which form the corresponding amide upon ammonolysis (34). Modem methods of
molecular quantum modelling have been applied to the reaction pathway and energetics for several nucleophiles in these Michael additions (35,36).
Acrylic esters dimerize to give the 2-methylene glutaric acid esters catalyzed by tertiary organic phosphines (37) or organic phosphorous triamides,
phosphonous diamides, or phosphinous amides (38). Yields of 75—80% dimer, together with 15—20% trimer, are obtained. Reaction conditions can be
varied to obtain high yields of trimer, tetramer, and other polymers.
Manufacture Various methods for the manufacture of acrylates are summarized in Figure 1, showing their dependence on specific raw
materials. For a route to be commercially attractive, the raw material costs and utilization must be low, plant investment and operating costs not excessive,
and waste disposal charges minimal.
Kirk-Othmer Encyclopedia of Chemical Technology (4th Edition)
151
ACRYLIC ACID AND DERIVATIVES
Voll
| Methane |—>| Synthesis gas |—>| CO [
| MethanoQ
| Formaldehyde | | Acetic acid~]—] Ketene |—>] Propiolactone |_52!1
Г”л г ТП ROH
-------------------------------------------Acrylic acid I—1------
| Acetylene]
CO Water Ni(CO)4
CO ROH Ni(CO)4
| Ethylene ]
CO H2 —-----------------тя "H2
--------—>| Propionic acid |--------
CO O2 Pd
ROH
Acrylate
esters
] Acrylic acid]
CO ROH Pd
| Glucose ]
| Propylene
Acrolein |—
Acrylonitrile"]
] Lactic acid]-
ROH Acid catalyst
] Acrylic acid |
] Acrylic acid"] R(~)H
Fig. 1. Acrylate manufacturing technologies.
After development of a new process scheme at laboratory scale, construction and operation of pilot-plant facilities to confirm scale-up information
often require two or three years. An additional two to three years is commonly required for final design, fabrication of special equipment, and construction
of the plant. Thus, projections of raw material costs and availability five to ten years into the future become important in adopting any new process
significandy different from the current technology.
In the 1980s cost and availability of acetylene have made it an unattractive raw material for acrylate manufacture as compared to propylene, which
has been readily available at attractive cost (see Acetylene-derived chemicals). As a consequence, essentially all commercial units based on acetylene, with
the exception of BASF's plant at Ludwigshafen, have been shut down. All new capacity recendy brought on stream or announced for construction uses the
propylene route. Rohm and Haas Co. has developed an alternative method based on alkoxycarbonylation of ethylene, but has not commercialized it
because of the more favorable economics of the propylene route.
Propylene requirements for acrylates remain small compared to other chemical uses (polypropylene, acrylonitrile, propylene oxide, 2-propanol, and
cumene for acetone and phenol). Hence, cost and availability are expected to remain attractive and new acrylate capacity should continue to be
propylene-based until after the turn of the century.
Propylene Oxidation. The propylene oxidation process is attractive because of the availability of highly active and selective catalysts and the
relatively low cost of propylene. The process proceeds in two stages giving first acrolein and then acrylic acid (39) (see Acrolein and derivatives).
ch2=chch3 + O2 CH2=CHCHO + H2O
CH2=CHCHO ) O, - CH2=CHCOOH
Single-reaction-step processes have been studied. However, higher selectivity is possible by optimizing catalyst composition and reaction conditions for
each of these two steps (40,41). This more efficient utilization of raw material has led to two separate oxidation stages in all commercial facilities. A
two-step continuous process without isolation of the intermediate acrolein was first described by the Toyo Soda Company (42). A mixture of propylene,
air, and steam is converted to acrolein in the first reactor. The effluent from the first reactor is then passed direcdy to the second reactor where the acrolein
is oxidized to acrylic acid. The products are absorbed in water to give about 30—60% aqueous acrylic acid in about 80—85% yield based on propylene.
Japan Catalytic Chemical Co. (43) and Mitsubishi Petrochemical Co. (44) offer licenses to their acrylate manufacturing technology (including high
quality catalysts). Thus, although most manufacturers have also developed their own catalyst and process technologies, many have also taken licenses from
these companies and either constructed entire plants based on those disclosures or combined that technology with their own developments for their
operating plants.
Catalysts. Catalyst performance is the most important factor in the economics of an oxidation process. It is measured by activity (conversion of
reactant), selectivity (conversion of reactant to desired product), rate of production (production of desired product per unit of reactor volume per unit of
time), and catalyst life (effective time on-stream before significant loss of activity or selectivity).
Eady catalysts for acrolein synthesis were based on cuprous oxide and other heavy metal oxides deposited on inert silica or alumina supports (39).
Later, catalysts more selective for the oxidation of propylene to acrolein and acrolein to acrylic acid were prepared from bismuth, cobalt, iron, nickel, tin
salts, and molybdic, molybdic phosphoric, and molybdic silicic acids. Preferred second-stage catalysts generally are complex oxides containing molybdenum
and vanadium. Other components, such as tungsten, copper, tellurium, and arsenic oxides, have been incorporated to increase low temperature activity and
productivity (39,45,46).
Catalyst performance depends on composition, the method of preparation, support, and calcination conditions. Other key properties include, in
addition to chemical performance requirements, surface area, porosity, density, pore size distribution, hardness, strength, and resistance to mechanical
attrition.
Patents claiming specific catalysts and processes for their use in each of the two reactions have been assigned to Japan Catalytic (45,47—49), Sohio
(50), Toyo Soda (51), Rohm and Haas (52), Sumitomo (53), BASF (54), Mitsubishi Petrochemical (56,57), Celanese (55), and others. The catalysts used for
these reactions remain based on bismuth molybdate for the first stage and molybdenum vanadium oxides for the second stage, but improvements in minor
component composition and catalyst preparation have resulted in yields that can reach the 85—90% range and lifetimes of several years under optimum
conditions. Since plants operate under more productive conditions than those optimum for yield and life, the economically most attractive yields and
productive lifetimes maybe somewhat lower.
Oxidation Step. A review of mechanistic studies of partial oxidation of propylene has appeared (58). The oxidation process flow sheet (Fig. 2)
shows equipment and typical operating conditions. The reactors are of the fixed-bed shell-and-tube type (about 3—5 mlong and 2.5 cm in diameter) with a
molten salt coolant on the shell side. The tubes are packed with catalyst, a small amount of inert material at the top serving as a preheater section for the
feed gases. Vaporized propylene is mixed with steam and air and fed to the first-stage reactor. The feed composition is typically 5—7% propylene, 10—30%
Kirk-Othmer Encyclopedia of Chemical Technology (4th Edition)
152
ACRYLIC ACID AND DERIVATIVES
Voll
steam, and the remainder air (or a mixture of air and absorber off-gas) (56,57,59,60).
Fig. 2. Oxidation process. To convert kPa to mm Hg, multiply by 7.5.
The preheated gases react exothermically over the first-stage catalyst with the peak temperature in the range of 330—430°C, depending on conditions
and catalyst selectivity. The conversion of propylene to waste gas (carbon dioxide and carbon monoxide) is more exothermic than its conversion to
acrolein. At the end of the catalyst bed the temperature of the mixture drops toward that of the molten salt coolant.
If necessary, first-stage reactor effluent maybe further cooled to 200—250°C by an interstage cooler to prevent homogeneous and unselective
oxidation of acrolein taking place in the pipes leading to the second-stage reactor (56,59).
The acrolein-rich gaseous mixture containing some acrylic acid is then passed to the second-stage reactor, which is similar to the first-stage reactor,
but packed with a catalyst designed for selective conversion of acrolein to acrylic acid. Here, the temperature peaks in the range of 280—360°C, again
depending on conditions. The temperature of the effluent from the second-stage reactor again approximates that of the salt coolant. The heat of reaction is
recovered as steam in external waste-heat boilers.
The process is operated at the lowest temperature consistent with high conversion. Conversion increases with temperature; the selectivity generally
decreases only with large increases in temperature. Catalyst life also decreases with increasing temperatures. Catalysts are designed to give high performance
over a range of operating conditions permitting gradual increase of salt temperature over the operating life of the catalysts to maintain productivity and
selectivity near the initial levels, thus compensating for gradual loss of catalyst activity.
The gaseous reactor effluent from the second-stage oxidation is fed to the bottom of the aqueous absorber and cooled from about 250°C to less
than 80°C by contact with aqueous acrylic acid. The gas passes through the absorber to complete the recovery of product. The water is fed to the top of
the absorber at about 30—60°C to minimize acrylic acid losses and the absorber off-gas is sent to a flare or to a furnace to convert all residual organic
material to waste gas. Some of the absorber off-gas maybe recycled to the first-stage reactor feed to allow achievement of optimum oxygen-to-propylene
ratio at reduced steam levels (59). If the resulting oxygen level is too low for best performance in the second-stage oxidation, an interstage feed of
supplemental air (or air plus steam) may be introduced (56). The aqueous effluent from the bottom of the absorber is 30—60% acrylic acid depending on
whether off-gas recycle with low steam feed or air feed with higher steam level is chosen. This is sent to the separations section for recovery. The overall
yield of acrylic acid in the oxidation reaction steps is in the range of 75—86%, depending on the catalysts, conditions, and age of catalyst employed.
Acrylic Acid Recovery. The process flow sheet (Fig. 3) shows equipment and conditions for the separations step. The acrylic acid is extracted
from the absorber effluent with a solvent, such as butyl acetate, xylene, diisobutyl ketone, or mixtures, chosen for high selectivity for acrylic acid and low
solubility for water and by-products. The extraction is performed using 5—10 theoretical stages in a tower or centrifugal extractor (46,61—65).
98’
Bottoms
stnpper
A«K
acid
column
Distilled
Acetic
acid
Fig. 3. Separations process.
Foreruns
column
Organic
waste
Kirk-Othmer Encyclopedia of Chemical Technology (4th Edition)
153
ACRYLIC ACID AND DERIVATIVES
Voll
The extract is vacuum-dis tilled in. the solvent recovery column, which is operated at low bottom temperatures to minimize the formation of polymer
and dimer and is designed to provide acrylic acid-free overheads for recycle as the extraction solvent. A small aqueous phase in the overheads is mixed with
the raffinate from the extraction step. This aqueous material is stripped before disposal both to recover extraction solvent values and minimize waste
organic disposal loads.
It is possible to dispense with the extraction step if the oxidation section is operated at high propylene concentrations and low steam levels to give a
concentrated absorber effluent. In this case, the solvent recovery column operates at total organic reflux to effect azeotropic dehydration of the
concentrated aqueous acrylic acid. This results in a reduction of aqueous waste at the cost of somewhat higher energy usage.
The bottoms from the solvent recovery (or azeotropic dehydration column) are fed to the foreruns column where acetic acid, some acrylic acid, and
final traces of water are removed overhead. The overhead mixture is sent to an acetic acid purification column where a technical grade of acetic acid suitable
for ester manufacture is recovered as a by-product. The bottoms from the acetic acid recovery column are recycled to the reflux to the foreruns column.
The bottoms from the foreruns column are fed to the product column where the glacial acrylic acid of commerce is taken overhead. Bottoms from the
product column are stripped to recover acrylic acid values and the high boilers are burned. The principal losses of acrylic acid in this process are to the
aqueous raffinate and to the aqueous layer from the dehydration column and to dimerization of acrylic acid to 3-acryloxypropionic acid. If necessary, the
product column bottoms stripper may include provision for a short-contact-time cracker to crack this dimer back to acrylic acid (60).
In any case, mild conditions and short residence times to minimize dimer formation are maintained throughout the separations section. In addition,
free-radical polymerization inhibitors are fed to each unit to prevent polymer formation and resulting equipment failure. The glacial acrylic acid produced at
this stage of the process is typically better than 99.5% pure, with the principal contaminants being water and acetic acid at about 0.1—0.2 wt %, acetic acid at
about 0.1 wt %, and acrylic acid dimer at 0.1—0.5 wt % depending on storage time after distillation. Propionic acid is present at 0.02—0.04 wt %. The
monomethyl ether of hydroquinone is added as storage and shipping stabilizer at 0.02 wt % (200 ppm). Low concentrations of aldehydes, primarily
furfuraldehyde, but including acetaldehyde, acrolein, and benzaldehyde, may be present in commercial glacial acrylic acid. These impurities may have an
adverse effect in achievement of very high molecular weight polymers. Further distillation or chemical treatment prior to final distillation is employed to
remove carbonyl impurities. Effective agents include hydrazine, amino acids, and alkyl or aryl amines (66—68).
Esterification. The process flow sheet (Fig. 4) outlines the process and equipment of the esterification step in the manufacture of the lower
acrylic esters (methyl, ethyl, or butyl). For typical art, see References 69—74. The part of the flow sheet containing the dotted lines is appropriate only for
butyl acrylate, since the lower alcohols, methanol and ethanol, are removed in the wash column. Since the butanol is not removed by a water or dilute
caustic wash, it is removed in the azeotrope column as the butyl acrylate azeotrope; this material is recycled to the reactor.
Fig. 4. Esterification process. To convert kPa to mm Hg, multiply by 7.5.
Acrylic acid, alcohol, and the catalyst, eg, sulfuric acid, together with the recycle streams are fed to the glass-lined ester reactor fitted with an external
reboiler and a distillation column. Acrylate ester, excess alcohol, and water of esterification are taken overhead from the distillation column. The process is
operated to give only traces of acrylic acid in the distillate. The bulk of the organic distillate is sent to the wash column for removal of alcohol and acrylic
acid; a portion is returned to the top of the distillation column. If required, some base may be added during the washing operation to remove traces of
acrylic acid.
A continuous bleed is taken from the reactor to remove high boilers. Values contained in this bleed are recovered in the bleed stripper and the
distillate from this operation is recycled to the esterification reactor. The bleed stripper residue is a mixture of high boiling organic material and sulfuric
acid, which is recovered for recycle in a waste sulfuric acid plant.
If a waste sulfuric acid regeneration plant is not available, eg, as part of a joint acrylate—methacrylate manufacturing complex, the preferred catalyst
for esterification is a sulfonic acid type ion-exchange resin. In this case the residue from the ester reactor bleed stripper can be disposed of by combustion
to recover energy value as steam.
The wet ester is distilled in the dehydration column using high reflux to remove a water phase overhead. The dried bottoms are distilled in the
product column to provide high purity acrylate. The bottoms from the product column are stripped to recover values and the final residue incinerated.
Alternatively, the bottoms maybe recycled to the ester reactor or to the bleed stripper.
Conventional polymerization inhibitors are fed to each of the distillation columns. The columns are operated under reduced pressure to give low
bottom temperatures and minimize polymerization.
The aqueous layer from the ester column distillate, the raffinate from washing the ester, and the aqueous phase from the dehydration step are
combined and distilled in the alcohol stripper. The wet alcohol distillate containing a low level of acrylate is recycled to the esterification reactor. The
aqueous column bottoms are incinerated or sent to biological treatment. Biological treatment is common.
Process conditions for methyl acrylate are similar to those employed for ethyl acrylate. However, in the preparation of butyl acrylate the excess
butanol is removed as the butanol—butyl acrylate azeotrope in the azeotrope column.
The esters are produced in minimum purity of 99.5%. The yield, based on acrylic acid, is in the range of about 95—98% depending on the ester and
reaction conditions. Monomethyl ether of hydroquinone (10—100 ppm) is added as polymerization inhibitor and the esters are used in this form in most
Kirk-Othmer Encyclopedia of Chemical Technology (4th Edition)
154
ACRYLIC ACID AND DERIVATIVES
Voll
industrial polymerizations.
Acetylene-Based Routes. Walter Reppe, the father of modem acetylene chemistry, discovered the reaction of nickel carbonyl with acetylene
and water or alcohols to give acrylic acid or esters (75,76). This discovery led to several processes which have been in commercial use. The original Reppe
reaction requires a stoichiometric ratio of nickel carbonyl to acetylene. The Rohm and Haas modified or semicatalytic process provides 60—80% of the
carbon monoxide from a separate carbon monoxide feed and the remainder from nickel carbonyl (77—78). The reactions for the synthesis of ethyl acrylate
are
4 C2H2 + 4 C2H5OH + Ni(CO) 4 + 2 HC1 4 CH2=CHCOOC2H5 + H2 + NiCl2
C2H2 + C2H5OH + 0.05 Ni(CO)4 + 0.8 CO + 0.1 HC1
CH2=CHCOOC2H5 + 0.05 NiCl2 + 0.05 H2
The stoichiometric and the catalytic reactions occur simultaneously, but the catalytic reaction predominates. The process is started with
stoichiometric amounts, but afterward, carbon monoxide, acetylene, and excess alcohol give most of the acrylate ester by the catalytic reaction. The nickel
chloride is recovered and recycled to the nickel carbonyl synthesis step. The main by-product is ethyl propionate, which is difficult to separate from ethyl
acrylate. However, by proper control of the feeds and reaction conditions, it is possible to keep the ethyl propionate content below 1%. Even so, this is
significandy higher than the propionate content of the esters from the propylene oxidation route.
Other by-products formed are relatively easy to separate, including esters of higher unsaturated monobasic acids (alkyl 3-pentenoate and
3,5-heptadienoate) (5) and esters of multiply-unsaturated dibasic acids, eg, suberates.
The reaction is initiated with nickel carbonyl. The feeds are adjusted to give the bulk of the carbonyl from carbon monoxide. The reaction takes
place continuously in an agitated reactor with a liquid recirculation loop. The reaction is run at about atmospheric pressure and at about 40°C with an
acetylene:carbon monoxide mole ratio of 1.1:1 in the presence of 20% excess alcohol. The reactor effluent is washed with nickel chloride brine to remove
excess alcohol and nickel salts and the brine—alcohol mixture is stripped to recover alcohol for recycle. The stripped brine is again used as extractant, but
with a bleed stream returned to the nickel carbonyl conversion unit. The neutralized crude monomer is purified by a series of continuous, low pressure
distillations.
The modified Reppe process was installed by Rohm and Haas at their Houston plant in 1948 and later expanded to a capacity of about
182 x 106 kg/yr. Rohm and Haas started up a propylene oxidation plant at the Houston site in late 1976. The combination of attractive economics and
improved product purity from the propylene route led to a shutdown of the acetylene-based route within a year.
Reppe's work also resulted in the high pressure route which was established by BASF at Ludwigshafen in 1956. In this process, acetylene, carbon
monoxide, water, and a nickel catalyst react at about 200°C and 13.9 MPa (2016 psi) to give acrylic acid. Safety problems caused by handling of acetylene
are alleviated by the use of tetrahydrofuran as an inert solvent. In this process, the catalyst is a mixture of nickel bromide with a cupric bromide promotor.
The liquid reactor effluent is degassed and extracted. The acrylic acid is obtained by distillation of the extract and subsequendy esterified to the desired
acrylic ester. The BASF process gives acrylic acid, whereas the Rohm and Haas process provides the esters directly.
The BASF plant has a capacity of about 91 million kg/yr and is still in operation. However, they have constructed several plants in Germany and in
the United States during the late 1970s and late 1980s, all of which are based on propylene oxidation. They have shut down a smaller Reppe unit in the
United States, and it is expected that, as they bring on new propylene-based capacity in Germany during the early 1990s, the acetylene process will be
phased out.
Nickel carbonyl is volatile, has little odor, and is extremely toxic. Symptoms of dangerous exposure may not appear for several days. Effective
medical treatment should be started immediately. The plant should be designed to ensure containment of nickel carbonyl and to prevent operator contact.
All other organic waste-process and vent streams are burned in a flare, in an incinerator, or in a furnace where fuel value is recovered. Wastewater
streams are handled in the plant biological treatment area.
Although some very minor manufacturers of acrylic acid may still use hydrolysis of acrylonitrile (see below), essentially all other plants worldwide use
the propylene oxidation process.
Acrylonitrile Route. This process, based on the hydrolysis of acrylonitrile (79), is also a propylene route since acrylonitrile (qv) is produced by
the catalytic vapor-phase ammoxidation of propylene.
CH2=CHCH3 + NH3 | (,2 • ch2=chcn + 3 h2o
The yield of acrylonitrile based on propylene is generally lower than the yield of acrylic acid based on the direct oxidation of propylene. Hence, for
the large volume manufacture of acrylates, the acrylonitrile route is not attractive since additional processing steps are involved and the ultimate yield of
acrylate based on propylene is much lower. Hydrolysis of acrylonitrile can be controlled to provide acrylamide rather than acrylic acid, but acrylic acid is a
by-product in such a process (80).
The sulfuric acid hydrolysis may be performed as a batch or continuous operation. Acrylonitrile is converted to acrylamide sulfate by treatment with
a small excess of 85% sulfuric acid at 80—100°C. A hold-time of about 1 h provides complete conversion of the acrylonitrile. The reaction mixture may be
hydrolyzed and the aqueous acrylic acid recovered by extraction and purified as described under the propylene oxidation process prior to esterification.
Alternatively, after reaction with excess alcohol, a mixture of acrylic ester and alcohol is distilled and excess alcohol is recovered by aqueous extractive
distillation. The ester in both cases is purified by distillation.
Important side reactions are the formation of ether and addition of alcohol to the acrylate to give 3-alkoxypropionates. In addition to high raw
material costs, this route is unattractive because of large amounts of sulfuric acid—ammonium sulfate wastes.
Ketene Process. The ketene process based on acetic acid or acetone as the raw material was developed by B. F. Goodrich (81) and Celanese
(82). It is no longer used commercially because the intermediate JB-propioIactone is suspected to be a carcinogen (83). In addition, it cannot compete with
the improved propylene oxidation process (see Ketenes, ketene dimers, and related substances).
Ethylene Cyanohydrin Process. This process, the first for the manufacture of acrylic acid and esters, has been replaced by more economical
ones. During World War I, the need for ethylene as an important raw material for the synthesis of aliphatic chemicals led to development of this process
(16) in both Germany, in 1927, and the United States, in 1931.
In the early versions, ethylene cyanohydrin was obtained from ethylene chlorohydrin and sodium cyanide. In later versions, ethylene oxide (from the
direct catalytic oxidation of ethylene) reacted with hydrogen cyanide in the presence of a base catalyst to give ethylene cyanohydrin. This was hydrolyzed
and converted to acrylic acid and by-product ammonium acid sulfate by treatment with about 85% sulfuric acid.
Losses by polymer formation kept the yield of acrylic acid to 60—70%. Preferably, esters were prepared direcdy by a simultaneous
dehydration—esterification process.
The process has historic interest. It was replaced at the Rohm and Haas Company by the acetylene-based process in 1954, and in 1970 at Union
Carbide by the propylene oxidation process.
Other Syntheses. Acrylic acid and other unsaturated compounds can also be made by a number of classical elimination reactions. Acrylates
have been obtained from the thermal dehydration of hydracrylic acid (3-hydroxypropanoic acid [503-66-2]) (84), from the dehydrohalogenation of
3-halopropionic acid derivatives (85), and from the reduction of dihalopropionates (2). These studies, together with the related characterization and
chemical investigations, contributed significandy to the development of commercial organic chemistry.
Vapor-Phase Condensations of Acetic Acid or Esters with Formaldehyde. Addition of a methylol group to the a-carbon of acetic
acid or esters, followed by dehydration, gives the acrylates.
CH3COOH(R) + CH2O CH2=CHCOOH(R) + H2O
Kirk-Othmer Encyclopedia of Chemical Technology (4th Edition)
155
ACRYLIC ACID AND DERIVATIVES
Voll
The reaction is generally carried out at atmospheric pressure and at 350—400°C. A variety of catalysts, eg, bases and metal salts and oxides on silica
or alumina—silicates, have been patented (86—91). Conversions are in the 30—70% range and selectivities in the 60—90% range, depending on the catalyst
and the ratio of formaldehyde to acetate.
The procedure is technically feasible, but high recovery of unconverted raw materials is required for the route to be practical. Its development
depends on the improvement of catalysts and separation methods and on the availability of low cost acetic acid and formaldehyde. Both raw materials are
dependent on ample supply of low cost methanol.
Although the rapid cost increases and shortages of petroleum-based feedstocks forecast a decade ago have yet to materialize, shift to natural gas or
coal may become necessary in the new century. Under such conditions, it is possible that acrylate manufacture via acetylene, as described above, could again
become attractive. It appears that condensation of formaldehyde with acetic acid might be preferred. A coal gasification complex readily provides all of the
necessary intermediates for manufacture of acrylates (92).
Oxidative Carbonylation of Ethylene—Elimination of Alcohol from /З-Alkoxypropionates. Spectacular progress in the 1970s
led to the rapid development of organotransition-metal chemistry, particularly to catalyze olefin reactions (93,94). A number of patents have been issued
(28,95—97) for the oxidative carbonylation of ethylene to provide acrylic acid and esters. The procedure is based on the palladium catalyzed carbonylation of
ethylene in the Equid phase at temperatures of 50—200°C. Esters are formed when alcohols are included. Anhydrous conditions are desirable to minimize
the formation of by-products including acetaldehyde and carbon dioxide (see Acetaldehyde).
During the reaction, the palladium catalyst is reduced. It is reoxidized by a co-catalyst system such as cupric chloride and oxygen. The products are
acrylic acid in a carboxylic acid-anhydride mixture or acrylic esters in an alcoholic solvent. Reaction products also include significant amounts of
3-acryloxypropionic acid [24615-84-7] and alkyl 3-alkoxypropionates, which can be converted thermally to the corresponding acrylates (23,98). The overall
reaction may be represented by:
CH2=CH2 + co + hor + |o2 CH2=CHCOOR + H2O
It is preferrable to carry out the reactions to give an intermediate P-alkoxypropionate. When the reaction is carried out in ethanolic ethyl
P-ethoxypropionate as solvent, and a trace of mercury(II) is included in the catalyst system, the yield of intermediate ethyl P-ethoxypropionate rises to
95—97%; the principal by-product is the corresponding P-chloropropionate ester. Acid-catalyzed thermal cracking of the mixture at 120—150°C gives very
high yields of ethyl acrylate (26). Although yields are excellent, the reaction medium is extremely corrosive, so high cost materials of construction are
necessary. In addition, the high cost of catalyst and potential toxicity of mercury require that the inorganic materials be recovered quantitatively from any
waste stream. Hence, high capital investment, together with continued favorable costs for propylene, have prevented commercialization of this route.
The elimination of alcohol from P-alkoxypropionates can also be carried out by passing the alkyl P-alkoxypropionate at 200—400°C over metal
phosphates, silicates, metal oxide catalysts (99), or base-treated zeolites (98). In addition to the route via oxidative carbonylation of ethylene, alkyl
P-alkoxypropionates can be prepared by reaction of dialkoxy methane and ketene (100).
Dehydrogenation of Propionates. Oxidative dehydrogenation of propionates to acrylates employing vapor-phase reactions at high
temperatures (400—700°C) and short contact times is possible. Although selective catalysts for the oxidative dehydrogenation of isobutyric acid to
methacrylic acid have been developed in recent years (see Methacrylic acid and derivatives) and a route to methacrylic acid from propylene to isobutyric
acid is under pilot-plant development in Europe, this route to acrylates is not presendy of commercial interest because of the combination of low
selectivity, high raw material costs, and purification difficulties.
Liquid-Phase Oxidation of Acrolein. As discussed before, the most attractive process for the manufacture of acrylates is based on the
two-stage, vapor-phase oxidation of propylene. The second stage involves the oxidation of acrolein. Considerable art on the liquid-phase oxidation of
acrolein (17) is available, but this route cannot compete with the vapor-phase technology.
Specialty Acrylic Esters
Higher alkyl acrylates and alkyl-functional esters are important in copolymer products, in conventional emulsion applications for coatings and adhesives,
and as reactants in radiation-cured coatings and inks. In general, they are produced in direct or transesterification batch processes (17,101,102) because of
their relatively low volume.
Direct, acid catalyzed esterification of acrylic acid is the main route for the manufacture of higher alkyl esters. The most important higher alkyl
acrylate is 2-ethylhexyl acrylate prepared from the available oxo alcohol 2-ethyl-l-hexanol (see Alcohols, higher aliphatic). The most common catalysts are
sulfuric or toluenesulfonic acid and sulfonic acid functional cation-exchange resins. Solvents are used as entraining agents for the removal of water of
reaction. The product is washed with base to remove unreacted acrylic acid and catalyst and then purified by distillation. The esters are obtained in 80—90%
yield and in excellent purity.
Transesterification of a lower acrylate ester and a higher alcohol (102,103) can be performed using a variety of catalysts and conditions chosen to
provide acceptable reaction rates and to minimize by-product formation and polymerization.
CH2=CHCOOR + li'OI I -11 CH2=CHCOOR' + ROH
Pure dry reactants are needed to prevent catalyst deactivation; effective inhibitor systems are also desirable as well as high reaction rates, since many of the
specialty monomers are less stable than the lower alkyl acrylates. The alcohol—ester azeotrope (8) should be removed rapidly from the reaction mixture and
an efficient column used to minimize reactant loss to the distillate. After the reaction is completed, the catalyst may be removed and the mixture distilled to
obtain the ester. The method is particularly useful for the preparation of functional monomers which cannot be prepared by direct esterification.
Dialkylaminoethyl acrylic esters are readily prepared by transesterification of the corresponding dialkylaminoethanol (102,103). Catalysts include strong
acids and tetraalkyl titanates for higher alkyl esters; and titanates, sodium phenoxides, magnesium alkoxides, and dialkyltin oxides, as well as titanium and
zirconium chelates, for the preparation of functional esters. Because of loss of catalyst activity during the reaction, incremental or continuous additions may
be required to maintain an adequate reaction rate.
Hydroxyethyl and 2-hydroxypropyl acrylates are prepared by the addition of ethylene oxide or propylene oxide to acrylic acid (104,105).
The reactions are catalyzed by tertiary amines, quaternary ammonium salts, metal salts, and basic ion-exchange resins. The products are difficult to
purify and generally contain low concentrations of acrylic acid and some diester which should be kept to a minimum since its presence leads to product
instability and to polymer cross-linking.
Analytical Methods
Chemical assay is preferably performed by gas—liquid chromatography (glc) or by the conventional methods for determination of unsaturation such as
bromination or addition of mercaptan, sodium bisulfite, or mercuric acetate.
Acidity is determined by glc or titration, and the dimer content of acrylic acid by glc or a saponification procedure. The total acidity is corrected for
the dimer acid content to give the value for acrylic acid.
Storage and Handling
Acrylic acid and esters are stabilized with minimum amounts of inhibitors consistent with stabiEty and safety. The acryEc monomers must be stable and
there should be no polymer formation for prolonged periods with normal storage and shipping (4,106). The monomethyl ether of hydroquinone (MEHQ)
is frequendy used as inhibitor and low inhibitor grades of the acrylate monomers are available for bulk handling. MEHQ at 10—15 ppm is generally
Kirk-Othmer Encyclopedia of Chemical Technology (4th Edition)
156
ACRYLIC ACID AND DERIVATIVES
Voll
adequate for the esters, but a higher concentration (200 ppm) is needed for acrylic acid.
The effectiveness of phenolic inhibitors is dependent on the presence of oxygen and the monomers must be stored under air rather than an inert
atmosphere. Temperatures must be kept low to minimize formation of peroxides and other products. Moisture may cause rust-initiated polymerization.
Acrylic acid has a relatively high freezing point (13°C) and the inhibitor may not be distributed uniformly between phases when frozen acid is
partially thawed. If the Equid phase is inadequately inhibited, it could polymerize and initiate violent polymerization of the entire mass. Provisions should be
made to maintain the acid as a liquid. High temperatures should be avoided because of dimer formation. If freezing should occur, melting should take place
at room temperature (25°C); material should not be withdrawn until the total is thawed and well-mixed to provide good distribution of the inhibitor and
dissolved oxygen. No part of the mass should be subjected to elevated temperatures during the melting process.
Dimer formation, which is favored by increasing temperature, generally does not reduce the quality of acrylic acid for most applications. The term
dimer includes higher oligomers formed by further addition reactions and present in low concentrations relative to the amount of dimer
(3-acryloxypropionic acid). Glacial acrylic acid should be stored at 16—29°C to maintain high quality.
The acrylic esters may be stored in mild or stainless steel, or aluminum. However, acrylic acid is corrosive to many metals and can be stored only in
glass, stainless steel, aluminum, or polyethylene-lined equipment. Stainless steel types 316 and 304 are preferred materials for acrylic acid.
For most applications, the phenolic inhibitors do not have to be removed. The low-inhibitor grades of acrylic monomers are particularly suitable for
the manufacture of polymer without pretreatment. Removal of inhibitor from ester is best done by adsorption with ion-exchange resins or other
adsorbents. Phenolic inhibitors maybe removed from esters with an alkaline brine wash, generally a solution containing 5% caustic and 20% salt. Vigorous
agitation during washing should be avoided to prevent the formation of emulsions. The washed monomers may be used without drying in emulsion
processes. Washed uninhibited monomers are less stable and should be used prompdy. They should be stored under refrigeration, but should not be
permitted to freeze because of the danger of explosive polymerization during thawing. The heat of polymerization is approximately 75 kJ/mol (18
kcal/mol).
The relatively low flash points of some acrylates create a fire hazard. Also, the ease of polymerization must be bome in mind in all operations. The
lower and upper explosive Emits for methyl acrylate are 2.8 and 25 vol %, respectively. Corresponding Emits for ethyl acrylate are 1.8 vol % and saturation,
respectively. AU possible sources of ignition of monomers must be eliminated.
Health and Safety Factors
The toxicity of common acrylic monomers has been characterized in animal studies using a variety of exposure routes. Toxicity varies with level, frequency,
duration, and route of exposure. The simple higher esters of acrylic acid are usually less absorbed and less toxic than lower esters. In general, acrylates are
more toxic than methacrylates. Data appear in Table 5.
Table 5. Acute Toxicity of Acrylic Acid and Esters
Monomer Methyl acrylate Ethyl acrylate Butyl acrylate AcryEc acid
rat oral LD50, g/kg 0.3 0.8-1.8 3.7-8.1 0.3-2.5
rabbit dermal LD50, g/kg 1.3 1.2-3.0 1.7-5.7 0.3-1.6
rat inhalation LC50, ppm 750-1350 2180 2370 1200-4000
rabbit eye hritation severe to corrosive severe to corrosive slight to moderate corrosive
rabbit skin hritator severe hritation severe hritation moderate corrosive
odor threshold, ppb 2.3-4.8 0.5 35a 94b
TLV/TWaY mg/m3 35 20 52 5.9
ppm 10, skin 5 10 2, skin
STEL , mg m3 100
ppm 25
A—2 suspect human carcinogen
May have delayed eye Eritation.
Vapor exposure can cause hreversible eye damage.
C Ref. 107.
d Ref. 83.
With respect to acute toxicity, based on lethaEty in rats or rabbits, acrylic monomers are slightly to moderately toxic. Mucous membranes of the
eyes, nose, throat, and gastrointestinal tract are particularly sensitive to hritation. Acrylates can produce a range of eye and skin hritations from slight to
corrosive depending on the monomer.
Full eye protection should be worn whenever handling acrylic monomers; contact lenses must never be worn. Prolonged exposure to Equid or vapor
can result in permanent eye damage or blindness. Excessive exposure to vapors causes nose and throat hritation, headaches, nausea, vomiting, and
dizziness or drowsiness (solvent narcosis). Overexposure may cause central nervous system depression. Both proper resphatory protection and good
ventilation are necessary wherever the possibiEty of high vapor concentration arises.
Swallowing acrylic monomers may produce severe hritation of the mouth, throat, esophagus, and stomach, and cause discomfort, vomiting,
diarrhea, dizziness, and possible coEapse.
Skin redness and from slight to corrosive hritation is caused by direct contact. Acrylic acid is more corrosive than esters. The monomers not only
hritate the skin, but may also be absorbed through the skin. Therefore, gloves and protective clothing and shoes or boots should be used in addition to eye
(or hill face) protective equipment. Upon contact, the skin should be flushed with copious amounts of water; follow-up medical attention should be
sought. Medical attention should also be obtained if any of the earlier mentioned symptoms appear.
Repeated exposures to acrylic monomers can produce allergic dermatitis (or skin sensitization) resulting in rash, itching, or swelling. After exposure
to one monomer, this dermatitis may arise upon subsequent exposure to the same or even a different acrylic monomer.
Repeated exposures of animals to high (near-lethal) concentrations of vapors result in inflammation of the resphatory tract, as well as degenerative
changes in the Ever, kidneys, and heart muscle. These effects arise at concentrations far above those causing hritation. Such effects have not been reported
in humans. The low odor threshold and hritating properties of acrylates cause humans to leave a contaminated area rather than tolerate the hritation.
Current TLV/TWA values are provided in MaterialSafety Data Sheets provided by manufacturers upon request. Values for 1989 (83,107) appear in
Table 5.
Acrolein, acrylamide, hydroxyalkyl acrylates, and other functional derivatives can be more hazardous from a health standpoint than acrylic acid and
its simple alkyl esters. Furthermore, some derivatives, such as the alkyl 2-chloroacrylates, are powerful vesicants and can cause serious eye injuries. Thus,
although the hazards of acrylic acid and the normal alkyl acrylates are moderate and they can be handled safely with ordinary care to industrial hygiene, this
should not be assumed to be the case for compounds with chemically different functional groups (see Industrial hygiene; Plant safety; Toxicology).
In 1983 the National Toxicology Program (NTP) reported that ethyl acrylate produced tumors in the rodent forestomach after gavage (forced
Kirk-Othmer Encyclopedia of Chemical Technology (4th Edition)
157
ACRYLIC ACID AND DERIVATIVES
Voll
feeding via stomach tube) for 2 yr. The response occurred only at the site of contact afterlifetime exposure to levels that were both irritating and ulcerating
to that tissue. Based on this study, both the NTP and the International Agency for Research on Cancer (IARC) concluded that there was sufficient
evidence for carcinogenicity of ethyl acrylate in experimental animals and by extension classified ethyl acrylate as possibly carcinogenic in humans. Several
other studies of simple acrylate esters using alternate exposure methods failed to show evidence of oncogenic response.
BIBLIOGRAPHY
"Acrylic and Methacrylic Acids" in ECT 1st ed., Vol. 1, pp. 176—179, by F. J. Glavis, Rohm & Haas Company; "Acrylic Resins and Plastics" in ECT 1st ed.,
Vol. 1, pp. 180—184, by E. H. Kroeker, Rohm & Haas Company; "Acrylic Acid and Derivatives" in ECT 2nd ed., Vol. 1, pp. 285—313, by F. J. Glavis and E.
H. Specht, Rohm & Haas Company; "Acrylic Acid and Derivatives" in ECT 3rd ed., Vol. 1, pp. 330—354, by J. W. Nemec and W. Bauer, Jr., Rohm and
Haas Company.
1. J. Redtenbacher, Ann. 47, 125 (1843).
2. W. Caspary and B. Tollens, Ann. 167, 240 (1873).
3. S. Hochheiser, Rohm and Haas, University of Pennsylvania Press, Philadelphia, 1986, pp. 31ff
4. Storage and Handling of Acrylic and Methacrylic Esters and Acids, Pulletin 84C7, Rohm and Haas Co., Philadelphia, Pa., 1987; Acrylic and Methacrylic
Monomers—Specifications andTypical Properties, Pulletin 84C2, Rohm and Haas Co., Philadelphia, Pa., 1986; Rocryl Specialty Monomers—Specifications and
Typical Properties, Pulletin 77S 2, Rohm and Haas Co., Philadelphia, Pa., 1989.
5. Rohm and Haas Company, Philadelphia, Pa.
6. N. S. Marans and R. P. Zelinski,/ Am. Chem. Soc. 72, 2125 (1950).
7. U.S. Pat. 2,967,195 (Jan. 3, 1961), M. H. Gold (to Aerojet-General Corp.).
8. С. E. Rehberg and С. H. Fisher,/. Am. Chem. Soc. 66, 1203 (1944); Ind. Eng. Chem. 40, 1429 (1948).
9. С. E. Rehberg, W. A. Faucette, and С. H. Fisher,/ Am. Chem. Soc. 66, 1723 (1944).
10. С. E. Rehberg and С. H. Fisher,/ Org. Chem. 12, 226 (1947).
11. С. E. Rehberg and W. A. Faucette,/ Am. Chem. Soc. 71, 3164 (1949).
12. С. E. Rehberg and W. A. Faucette,/ Org. Chem. 14, 1094 (1949).
13. С. E. Rehberg, M. B. Dixon, and W. A. Faucette,/ Am. Chem. Soc. 72, 5199 (1950).
14. D. W. Coddington, T. S. Reid, A. H. Ahlbrecht, С. H. Smith, Jr., and D. R. Usted,/ Polym. Sci. 15, 515 (1955).
15. W. Postelnek, L. E. Coleman, and A. M. Lovelace, Portschr. Hochpolym. Porsch. 1, 75 (1958).
16. E. H. Riddle, Monomeric Acrylic Esters, Reinhold Publishing Co., New York, 1954.
17. H. Rauch-Puntigam and T. Volker, Acryl- undMethacrylverbindungen, Springer-Vedag, Berlin, 1967.
18. M. Sittig, VinylMonomers andPolymers, Noyes Development Corp., Park Ridge, N.J., 1966.
19. U.S. Pat. 3,703,539 (Nov. 21,1962), B. A. Di Liddo (to B. F. Goodrich Co.).
20. U.S. Pat. 4,490,553 (Dec. 25, 1984), J. D. Chase and W. W. Wilkison (to Celanese Corporation).
21. R. Mozingo and L. A. Patterson, Org. Synth. Coll. Vol. 3, 576 (1955).
22. F. M. Wampler III, Plant/ Operations Progress 1(3), 183—189 (1988).
23. U.S. Pat. 3,888,912 (June 10, 1975), M. D. Burguette (to Minnesota Mining and Manufacturing Co.).
24. U.S. Pat. 3,642,843 (Feb. 15,1972), J. W. Nemec (to Rohm and Haas Co.).
25. С. E. Rehberg, M. B. Dixon, and С. H. Fisher,/ Am. Chem. Soc. 68, 544 (1946); 69, 2966 (1947); С. E. Rehberg and M. B. Dixon,/ Am. Chem. Soc.
72, 2205 (1950).
26. U.S. Pat. 3,227,746 (Jan. 4, 1966), F. Knorr and A. Spes (to Wacker-Chemie G.m.b.H.).
27. D. M. Fenton and K. L. Olivier, Chem. Technol. 220 (Apr. 1972).
28. U.S. Pat. 3,987,089 (Oct. 19,1976), F. L. Slejko and J. S. Clovis (to Rohm and Haas Co.).
29. C. D. Hurd and L. L. Gershbein,/ Am. Chem. Soc. 69, 2328 (1947).
30. L. L. Gershbein and C. D. Hurd,/ Am. Chem. Soc. 69, 241 (1947).
31. E. A. Fehnel andM. Carmack, Org. Syn. 30, 65 (1950).
32. U.S. Pat. 3,769,315 (Oct. 30, 1973), R. L. Keener andH. Raterink (to Rohm and Haas Co.).
33. S. M. McElvain and G. Stork, / Am. Chem. Soc. 68, 1049 (1946).
34. U.S. Pat. 2,580,832 (Jan. 1,1952), E. W. Pietrusza (to Allied Chemical Co.).
35. С. B. Frederick and С. H. Reynolds, Toxicol. Eett. 47, 241—247 (1989).
36. R. Osman, K. Namboodiri, H. Weinstein, and J. R. Rabinowitz,/ Am. Chem. Soc. 110, 1701—1707 (1988).
37. U.S. Pat. 3,074,999 (Jan. 22, 1963), M. B. Rauhut andH. Currier (to American Cyanamid Co.).
38. U.S. Pats. 3,342,853 and 3,342,854 (Sept. 19, 1967), J. W. Nemec and co-workers (to Rohm and Haas Co.).
39. C. R. Adams, Chem. Ind. 26, 1644 (1970).
40. S. Sakuyama, T. O'Hara, N. Shimizu, and K. Kubota, Chem. Technol. 350 (June 1973).
41. T. O'Hara and co-workers, "Acrylic Acid and Derivatives" in Vllmanns Encyclopedia ofilndustrial Chemistry, 5th ed., Vol. Al, VCH, Vedagsgesellschaft
mbH, Weinheim 1985, pp. 161—176.
42. Hydrocarbon Process. 48(11), 145 (1969).
43. Hydrocarbon Process. 60(11), 124 (1981).
44. Hydrocarbon Process. 68(11), 91 (1989).
45. U.S. Pat. 3,475,488 (Oct. 28, 1969), N. Kurata, T. Ohara, and K. Oda (to Nippon Shokubai Kagaku Kogyo Co., Ltd.).
46. Brit. Pats. 915,799 and 915,800 (Jan. 16, 1963), D. J. Hadley and R. H. Jenkins (to Distillers Co., Ltd.).
47. U.S. Pats. 4,203,906 (May 20, 1980) 4,256,753 (Mar. 17, 1981), M. Takada, H. Uhara, and T. Sato (to Nippon Shokobai Kogaku Kogyo Co.,
Ltd.).
48. U.S. Pat. 4,537,874 (Aug. 27, 1985), T. Sato, M. Takata, M. Ueshima, and I. Nagai (to Nippon Shokubai Kogaku Co., Ltd.).
49. U.S. Pat. 4,438,217 (Mar. 20, 1984), M. Takata, R. Aoki, and T. Sato (to Nippon Shokubai Kogaku Co., Ltd.).
50. U.S. Pats. 2,881,212 (Apr. 7,1959) and 3,087,964 (Apr. 30,1963), J. D. Idol, J. L. Callahan, and R. W. Foreman (to Standard Oil Co., Ohio).
51. Jpn. Pat* 43-13609 (June 8,1968), M. Izawa and co-workers (to Toyo Soda Manufacturing Co.).
52. U.S. Pats. 3,441,613 (Apr. 29,1969) and 3,527,716 (Sept. 8,1970), J. W. Nemec and F. W. Schlaefer (to Rohm and Haas Co.).
53. U.S. Pat. 4,092,354 (May 30, 1978), T. Shiraishi, T. Kechiwada, and Y. Nagaoka (to Sumitomo Chemical Co., Ltd.).
54. U.S. Pat. 3,527,797 (Sept. 8, 1970), R. Krabetz, H. Engelbach, and H. Zinke-Allmang (to Badische Anilin- und Soda-Fabrik A.G.).
55. U.S. Pats. 3,939,096 (Feb. 17, 1976) and 3,962,322 (June 8, 1976), P. C. Richardson (to Celanese Corp.).
56. U.S. Pat. 4,365,087 (Dec. 21, 1982), K. Kadowacki, K. Sarumaw, andT. Shibano (to Mitsubishi Petrochemical Co., Ltd.).
57. U.S. Pat. 4,356,114 (Oct. 26, 1982), K. Kadowacki, K. Sarumaw, and Y. Tanaka (to Mitsubishi Petrochemical Co., Ltd.).
58. T. P. Snyder and C. G. Hill, Jr., Catal. Review—Sci. Eng. 31, 43—95 (1989). A current review with leading references to much of the literature of
1975—1990 in partial oxidation of propylene.
59. U.S. Pat. 4,147,885 (Apr. 3, 1979), N. Shimezur, I. Yonagisawa, M. Takata, and T. Sato (to Nippon Shokubai Kogaku Kogyo Co., Ltd.).
60. U.S. Pat. 4,317,926 (Mar. 2, 1982), T. Sato, M. Baba, and M. Okane (to Nippon Shokubai Kogaku Co., Ltd.).
Kirk-Othmer Encyclopedia of Chemical Technology (4th Edition)
158
ACRYLIC ACID AND DERIVATIVES
Voll
61.
62.
63.
64.
65.
66.
67.
68.
69.
70.
71.
72.
73.
74.
75.
76.
77.
78.
79.
80.
81.
82.
83.
84.
85.
86.
87.
88.
89.
90.
91.
92.
93.
94.
95.
96.
97.
98.
99.
100.
101.
102.
103.
104.
105.
106.
107.
Brit. Pat. 997,325 (July 7, 1965), F. C. Newman (to Distillers Co., Ltd.).
Jpn. Pat. 49-18728 (June 4,1971) (to Toa Gosei Chemical Industry).
W. Krolikowski, Soc. Hast. Eng. J. 1031 (Sept. 1964).
U.S. Pat. 3,968,153 (July 6, 1976), T. Ohrui, T. Sakahibara, Y. Aono, M. Kato, H. Takao, and M. Ayano (to Sumitomo Chemical Co.).
U.S. Pat. 3,962,074 (June 8,1976), W. K. Schropp (to Badische Amlin- und Soda-Fabrik A.G.).
U.S. Pat. 3,725,208 (Apr. 3, 1973), S. Maezawa, H. Yoshikawa, K. Sakamoto, J. Fugii, and M. Hashimoto (to Nippon Kayaku Co.).
U.S. Pat. 3,893,895 (July 8, 1975), J. Dehnert, A. Kleeman, T. Lussling, E. Noll, H. Schaefer, and G. Schreyer (to Deutsche Gold und Silber
S cheide ans t alt).
U.S. Pat. 4,358,347 (Nov. 9,1982), B. Mettetal and R. Kolonko (to The Dow Chemical Company).
U.S. Pat. 3,914,290 (Oct. 21,1975), S. Otsuki and I. Miyanohara (to Rohm and Haas Co.).
U.S. Pat. 2,916,512 (Dec. 8, 1959), G. J. Fischer and A. F. McLean (to Celanese Corp.).
U.S. Pat. 3,087,962 (Apr. 30,1963), N. M. Bortnick (to Rohm and Haas Co.).
U.S. Pat. 3,882,167 (May 6, 1975), E. Lohmar, A. Ohorodnik, K. Gehrman, and P. Stutzke (to Hoechst A.G.).
U.S. Pat. 2,947,779 (Aug. 2,1960), J. D. Idol, R. W. Foreman, and F. Veach (to Standard Oil Co. Ohio).
Brit. Pat. 923,595 (Apr. 18,1963), F. J. Bellringer, C. J. Brown, and P. B. Brindley (to Distillers Co. Ltd.).
W. Reppe, Justus Eiebigs Ann. Chem. 582, 1 (1953).
U.S. Pat. 3,023,327 (Feb. 27,1962), W. Reppe and R. Stadler (to Badische Amlin- und Soda Fabrik A.G.).
U.S. Pats. 2,582,911 (Jan. 15,1952) and 2,613,222 (Oct. 7,1952) and 2,773,063 (Dec. 4, 1956), H. T. Neher, E. H. Specht, and A. Neuman (to
Rohm and Haas Co.).
M. Salkind, E. H. Riddle, and R. W. Keefer, Ind. Eng. Chem. 51, 1232, 1328 (1959).
Hydrocarbon Process. 44(11), 169 (1965).
U.S. Pat. 2,734,915 (Feb. 14,1956), G. D. Jones (to The Dow Chemical Company).
U.S. Pats. 2,356,459 (Aug. 22,1944) and 2,361,036 (Oct. 24,1944), E. F. King, and U.S. Pat. 3,002,017 (Sept. 26,1961), N. Wearsch and A. J. De
Paola (to B. F. Goodrich Co.).
U.S. Pat. 3,069,433 (Dec. 18,1962), K. A. Dunn (to Celanese Corp.).
Threshold Eimit Values and Biological Exposure Indices for 1989—1990, American Conference of Governmental Industrial Hygienists, Cincinnati, Ohio,
1989.
F. K. Beilstein, Ann. Chem. 122, 372 (1862).
W. von Schneider and E. Edenmeyer, Ber. 3, 340 (1870).
U.S. Pat. 2,821,543 (Jan. 28, 1958), R. W. Etherington (to Celanese Corp, of America).
U.S. Pat. 3,014,958 (Dec. 26, 1961), T. A. Koch and I. M. Robinson (to E. I. du Pont de Nemours & Co., Inc.).
U.S. Pats. 3,578,702 (May 11,1971) and 3,574,703 (Apr. 13,1971), T. C. Snapp, Jr., A. E. Blood, and H. J. Hagemeyer, Jr. (to Eastman Kodak
Co.).
U.S. Pats. 3,840,587 and 3,840,588 (Oct. 8,1974), A. J. C. Pearson (to Monsanto Co.).
U.S. Pat. 3,933,888 (Jan. 20,1976), F. W. Schlaefer (to Rohm and Haas Co.).
U.S. Pat. 4,490,476 (Dec. 25,1984), R. J. Piccolini and M. J. Smith (to Rohm and Haas Co.).
J. Haggin, Chem. Eng. Nenes, 7—13 (May 19, 1986).
R. F. Heck, Organotransition Metal Chemistry, Academic Press, Inc., New York, 1974, Chapt. IX.
E. I. Becker and M. Tsutsui, eds., Organometallic Reactions, Vol. 3, Wiley-Inter-science, New York, 1972.
U.S. Pats. 3,346,625 (Oct. 10,1967), D. M. Fenton and K. L. Olivier; 3,397,225 (Aug. 13,1968), D. M. Fenton; 3,349,119 (Oct. 24,1967); and
3,381,030 (Apr. 30, 1968), D. M. Fenton and K. L. Olivier (to Union Oil Co. of California).
U.S. Pats. 3,920,736 (Nov. 18,1975) and 3,876,694 (Apr. 8, 1975), W. Gaenzler (to Rohm G.m.b.H. Chemische Fabrik).
U.S. 3,579,568 (May 18,1971), R. F. Heck and P. M. Henry (to Hercules Inc.).
U.S. Pat. 4,814,492 (Mar. 21,1989), E. C. Nelson (to Texaco, Inc.).
U.S. Pat. 3,022,339 (Feb. 20,1962), E. Enk and F. Knoerr (to Wacker Chemie G.m.b.H.).
U.S. Pat. 4,827,021 (May 2,1989), G. C. Jones, W. D. Nottingham, and P. W. Raynolds (to Eastman Kodak Co.).
U.S. Pat. 2,917,538 (Dec. 15, 1959), R. L. Carlyle (to The Dow Chemical Company).
P. L. De Beneville, L. S. Luskin, and H. J. Sims,/. Org. Chem. 23, 1355 (1958).
U.S. Pat. 4,777,265 (Oct. 11,1988), F. Merger and co-workers (to BASF AG).
U.S. Pat. 2,484,487 (Oct. 11,1949), J. R. Caldwell (to Eastman Kodak Co.).
U.S. Pat. 3,059,024 (Oct. 16, 1962), A. Goldberg, J. Fertig, and H. Stanley (to National Starch and Chemical Corp.).
L. S. Kirch, J. A. Kargol, J. W. Magee and W. S. Stuper, Plant/ Operations Progress 1(4) 270—274 (1988).
"Air Contaminants—Permissible Exposure Limit," Title 29 Code of Federal Regulations Part CFR 1910.1000, OSHA, 1989, p. 3112.
William Bauer, Jr.
Rohm and Haas Company
Kirk-Othmer Encyclopedia of Chemical Technology (4th Edition)
159
Vol 1
ACRYLIC AND MODACRYLIC FIBERS.
See Fibers, acrylic.
Kirk-Othmer Encyclopedia of Chemical Technology (4th Edition)
160
ACRYLIC ESTER POLYMERS
Voll
ACRYLIC ESTER POLYMERS
Survey,
2-Cyano acrylic ester polymers,
Kirk-Othmer Encyclopedia of Chemical Technology (4th Edition)
161
SURVEY
Voll
SURVEY
Acrylic esters are represented by the generic formula
H H
zc=c\
H COOR
The nature of the R group determines the properties of each ester and the polymers it forms. Polymers of this class are amorphous and distinguished by
their water-clear color and their stability on aging. Acrylic monomers are extremely versatile building blocks. They are relatively moderate to high boiling
Equids that readily polymerize or copolymerize with a variety of other monomers. Copolymers with methacrylates, vinyl acetate, styrene, and acrylonitrile
are commercially significant. Polymers designed to fit specific application requirements ranging from soft, tacky adhesives to hard plastics can be tailored
from these versatile monomers. Although the acrylics have been higher in cost than many other common monomers, they find use in high quality products
where their unique characteristics and efficiency offset the higher cost.
Historically, the development of the acrylates proceeded slowly; they first received serious attention from Otto Rohm. Acrylic acid (propenoic acid)
was first prepared by the air oxidation of acrolein in 1843 (1,2). Methyl and ethyl acrylate were prepared in 1873, but were not observed to polymerize at
that time (3). In 1880 poly(methyl acrylate) was reported by G. W. A. Kahlbaum, who noted that on dry distillation up to 320°C the polymer did not
depolymerize (4). Rohm observed the remarkable properties of acrylic polymers while preparing for his doctoral dissertation in 1901; however, a quarter of
a century elapsed before he was able to translate his observations into commercial reality. He obtained a U.S. patent on the sulfur vulcanization of acrylates
in 1912 (5). Based on the continuing work in Rohm's laboratory, the first limited production of acrylates began in 1927 by the Rohm and Haas Company in
Darmstadt, Germany (6). Use of this class of compounds has grown from that time to a total U.S. consumption in 1989 of approximately 400,000 metric
tons. Total worldwide consumption is probably twice that.
Physical Properties
To a large extent, the properties of acrylic ester polymers depend on the nature of the alcohol radical and the molecular weight of the polymer. As is typical
of polymeric systems, the mechanical properties of acrylic polymers improve as molecular weight is increased; however, beyond a critical molecular weight,
which often is about 100,000 to 200,000 for amorphous polymers, the improvement is slight and levels off asymptotically.
Glass Transition. The glass-transition temperature T reflects the mechanical properties of polymers over a specified temperature range.
Below T polymers are stiff, hard, brittle, and glass-like; above T, if the molecular weight is high enough, they are relatively soft, limp, stretchable, and can
be somewhat elastic. At even higher temperatures they flow and are tacky. Methods used to determine glass-transition temperatures and the reported
values for a large number of polymers may be found in References 7—9. Values for the T of common acrylate homopolymers are found in Table 1.
Table 1. Physical Properties of Acrylic Polymers
Polymer Monomer molecular formula CAS Registry Number T, °ca Density, / 3b g/cm Refractive index,
methyl acrylate C4H6O2 [9003-21-8] 6 1.22 1.479
ethyl acrylate C5H8O2 [9003-32-1] -24 1.12 1.464
propyl acrylate ^6^10^2 [24979-82-6] -45
isopropyl acrylate ^6^10^2 [26124-32-3] -3 1.08
я-butyl acrylate C7H12O2 [900349-0] -50 1.08 1.474
jw-butyl acrylate C7H12O2 [30347-354] -20
isobutyl acrylate C7H12O2 [26335-74-0] -43
/^-butyl acrylate C7H12O2 [25232-27-3] 43
hexyl acrylate [2710347-5] -57
heptyl acrylate CioH1802 [29500-72-9] -60
2-heptyl acrylate CioH1802 [61634-83-1] -38
2-ethylhexyl acrylate С41Н20О2 [9003-774] -65
2-ethylbutyl acrylate ЦД1бО2 [39979-32-3] -50
dodecyl acrylate C15H2gO2 [26246-924] -30
hexadecyl acrylate C19H36O2 [25986-78-1] 35
2-ethoxyethyl acrylate C7H12O3 [26677-77-0] -50
isobomyl acrylate <"13Г1’20<>2 [30323-87-6] 94
cyclohexyl acrylate C9H14O2 [27458-65-7] 16
a Refs. 7 and 10.
b Ref. 11.
The glass transition, unlike a true thermodynamic transition, takes place over a temperature range of several degrees and is dependent on both the
experimental method and the time scale used for its determination. Below the transition temperature the majority of the polymer chains have a relatively
fixed configuration, and litde translation or rotation of polymer chains takes place. Above the glass-transition temperature the polymer chain has sufficient
thermal energy for rotational motion or considerable torsional oscillation; thus the glass-transition temperature marks the onset of segmental mobility.
During the transition there is no significant absorption of latent heat, but for most polymers there is an increase in the specific volume, coefficient of
expansion, compressibility, specific heat, and refractive index. The transition is not sharp and T is taken as the midpoint of the temperature interval over
Kirk-Othmer Encyclopedia of Chemical Technology (4th Edition)
162
SURVEY
Vol 1
which the discontinuity occurs. The physical properties of amorphous acrylic polymers, which are dependent on the segmental relaxation rate, evidence a
principal change in the glass-transition region. Chemical reactivity, mechanical and dielectric relaxation, viscous flow, load-bearing capacity, hardness, tack,
heat capacity, refractive index, thermal expansivity, creep, crystallization, and diffusion differ markedly below and above the transition region.
The T of a polymer can be altered by the copolymerization of two or more monomers. The approximate T value for copolymers can be calculated
from a knowledge of the weight fraction If7 of each monomer type and the T (in degees kelvin) of each homopolymer (12).
1
Tg
Tgi Tg? Tg3
T
gn
Table 1 shows that most acrylics have low glass-transition temperatures. Therefore, in copolymers they tend to soften and flexibilize the overall
composition. Plasticizers also lower the transition temperature. However, unlike incorporated acrylic comonomers, they can be lost through volatilization
or extraction.
Much more information can be obtained by examining the mechanical properties of a viscoelastic material over an extensive temperature range. A
convenient nondestructive method is the measurement of torsional modulus. A number of instruments are available (13—18). More details on use and
interpretation of these measurements may be found in references 8 and 19—25. An increase in modulus value means an increase in polymer hardness or
stiffness. The various regions of elastic behavior are shown in Figure 1. Curve A of Figure 1 is that of a soft polymer, curve В of a hard polymer. To a close
approximation both are transpositions of each other on the temperature scale. A copolymer curve would fall between those of the homopolymers, with the
displacement depending on the amount of hard monomer in the copolymer (26—28).
Fig. 1. Modulus—temperature curve of amorphous and cross-linked acrylic polymers. To convert MPa to kg /cm2, multiply by 10.
Cross-linking of a polymer elevates and extends the rubbery plateau; little effect on T is noted until extensive cross-linking has been introduced
(23,25,28). A cross-link joins more than two primary polymer chains together. In practice, cross-linking of acrylic polymers is used to decrease
thermoplasticity and solubility and increase resilience. In some instances cross-linking moieties are used in reactions of a polymer with a substrate (20). The
chemistry of cross-linking is described in references 11 and 29—38.
Molecular Weight. The values of the mechanical properties of polymers increase as the molecular weight increases. However, beyond some
critical molecular weight, often about 100,000 to 200,000 for amorphous polymers, the increase in property values is slight and levels off asymptotically. As
an example, the glass-transition temperature of a polymer usually follows the relationship
Tg = Tgi - k/Mn
where is the glass-transition temperature at infinite molecular weight and Л/ the number-average molecular weight. The value of k for acrylate polymers
is about 2 x 10⁵ (39). A detailed discussion of the effect of molecular weight on the properties of a polymer may be found in reference 40.
Mechanical and Thermal Properties. The first member of the acrylate series, poly(methyl acrylate), has litde or no tack at room
temperature; it is a tough, rubbery, and moderately hard polymer. Poly(ethyl acrylate) is more rubberlike, considerably softer, and more extensible.
Poly(butyl acrylate) is softer still, and much tackier. This information is quantitatively summarized in Table 2 (41). In the n-alkyl acrylate series, the softness
increases through я-octyl acrylate. As the chain length is increased beyond я-octyl, side-chain crystallization occurs and the materials become britde (42);
poly^-hexadecyl acrylate) is hard and waxlike at room temperature but is soft and tacky above its softening point.
Table 2. Mechanical Properties of Acrylic Polymers
Polyacnlate Elongation, % Tensile strength, kPa
methyl 750 ethyl 1800 butyl 2000 6895 228 21
To convert kPa to psi, multiply by 0.145.
Kirk-Othmer Encyclopedia of Chemical Technology (4th Edition)
163
SURVEY
Voll
Unless subjected to extreme conditions, acrylic polymers are durable and degrade slowly. In contrast to methacrylate polymers, which depolymerize
on strong heating, poly(methyl acrylate) when pyrolyzed in vacuo from 292 to 399°C yields only a small quantity of monomer (43—44). Oxidative
degradation of acrylic polymers can occur by the combination of oxygen with free radicals generated in the polymer to form hydroperoxides. The rate of
oxidation is quite slow unless extreme conditions with oxygen under high pressure and high temperatures are employed (45—47).
Solution Properties. Typically, if a polymer is soluble in a solvent, it is soluble in all proportions. As solvent evaporates from the solution, no
phase separation or precipitation occurs. The solution viscosity increases continually until a coherent film is formed. The film is held together by molecular
entanglements and secondary bonding forces. The solubility of the acrylate polymers is affected by the nature of the side group. Polymers that contain
short side chains are relatively polar and are soluble in polar solvents such as ketones, esters, or ether alcohols. As the side chain increases in length the
polymers are less polar and dissolve in relatively nonpolar solvents, such as aromatic or aliphatic hydrocarbons.
The quantitative treatment of solubility is based on the familiar free energy equation governing mutual miscibility:
ди = ДЯт - TAS,,,
Solubility occurs when the free energy of mixing is negative. On solution there is more movement of polymer chains; therefore, entropy increases as a
polymer dissolves. Because the entropy term is always positive and large, the sign and magnitude of the heat term is the deciding factor in determining the
sign of the free energy change. When the difference between the solubility parameters of two substances is small, the heat of mixing must be small; the free
energy tends to be negative and solubility should occur. A polymer dissolves in a solvent or is compatible with another polymer if the solubility parameters
and polarities are similar (38,48—53). Representative solubility parameter values are given in Table 3.
Table 3. Solubility Parameters of Acrylic Homopolymers Calculated by Small’s Method*
Polymer
methyl acrylate
ethyl acrylate
я-butyl acrylate
Refs. 23 and 53.
b To convert (J/cm3)1/2 to (cal/cm3)1^2, divide by 2.05.
([/cm3)132"
4.7
4.5
4.3
Polymer solution viscosity is dependent on the concentration of the solvent, the molecular weight of the polymer, the polymer composition, the
solvent composition, and the temperature. More extensive information on the properties of polymer solutions may be found in references 9 and 54—56.
Chemical Properties
Under conditions of extreme acidity or alkalinity, acrylic ester polymers can be made to hydrolyze to poly(acrylic acid) or an acid salt and the corresponding
alcohol. However, acrylic polymers and copolymers have a greater resistance to both acidic and alkaline hydrolysis than competitive poly(vinyl acetate) and
vinyl acetate copolymers. Even poly(methyl acrylate), the most readily hydrolyzed polymer of the series, is more resistant to alkali than poly(vinyl acetate)
(57). Butyl acrylate copolymers are more hydrolytically stable than ethyl acrylate copolymers (58).
Acrylic polymers are fairly insensitive to normal uv degradation since the primary uv absorption of acrylics occurs below the solar spectrum (59).
The incorporation of absorbers, such as <9-hydroxybenzophenone [117-99-7]y further improves the uv stabiEty (59). Under normal use conditions acrylic
polymers have superior resistance to degradation and show remarkable retention of their original properties.
Both side-chain and main-chain scission products are observed when polyacrylates are irradiated with gamma radiation (60). The nature of the alkyl
side group affects the observed ratio of these two processes (61,62).
Acrylic Ester Monomers
The physical properties of the principal commercial acrylic esters are given in Table 4. A more comprehensive Esting of physical properties, including other
less common acrylates, is provided in the article Acrylic acid and derivatives.
Table 4. Physical Properties of Acrylic Monomers
Acrylate CAS Registry Number Molecular weight bp, °ca g/cm3 Flash point, °cb Water solubiEty, g/ioogH2o Heat of evaporation, .T/g Specific heat, j/g-Kc
methyl /96-55-5/ 86 79-81 0.950 10 5 385 2.01
ethyl [140-88-5] 100 99-100 0.917 10 1.5 347 1.97
я-butyl [141-32-2] 128 144-149 0.894 39 0.2 192 1.92
isobutyl [106-63-8] 128 61-63d 0.884 42 0.2 297 1.92
/-butyl [1663-39-4] 128 120 0.879 19 0.2
2-ethylhexyl [103-11-7] 184 214-220 0.880 90е 0.01 255 1.92
At 101.3 kPa unless otherwise noted.
Tag open cup unless otherwise noted.
To convert J to cal, divide by 4.184.
d At 6.7 kPa = 50 mm Hg.
Cleveland open cup.
There are currendy two principal processes used for the manufacture of monomeric acryEc esters: the semicatalytic Reppe process and the propylene
oxidation process. The newer propylene oxidation process is preferred because of economy and safety. In this process acrolein [107-02-8] is first formed by
the catalytic oxidation of propylene vapor at high temperature in the presence of steam. The acrolein is then oxidized to acryEc acid [79-10-7].
CH2=CHCH3 + O2 --.catalyst CH2=CHCHO + H2O
2 CH2=CHCHO + O2 ->catalyst 2 CH2=CHCOOH
Both one-step and two-step oxidation processes are known. A number of catalyst systems are known; most use a molybdenum compound as the main
component. The acryEc acid is esterified with alcohol to the desired acryEc ester in a separate process (63—66).
Kirk-Othmer Encyclopedia of Chemical Technology (4th Edition)
164
SURVEY
Vol 1
In normal practice, inhibitors such as hydroquinone (HQ) [123-31-9[ or the monomethyl ether of hydroquinone (MEHQ) [150-76-5] are added to
acrylic monomers to stabilize them during shipment and storage. Uninhibited acrylic monomers should be used prompdy or stored at 10°C or below for
no longer than a few weeks. Improperly inhibited monomers have the potential for violent polymerizations. HQ and MEHQ require the presence of
oxygen to be effective inhibitors; therefore, these monomers should be stored in contact with air and not under inert atmosphere. Because of the low
concentration of inhibitors present in most commercial grades of acrylic monomers (generally less than 100 ppm), removal before use is not normally
required. However, procedures for removal of inhibitors are available (67).
The common acrylic ester monomers are combustible liquids. Commercially, acrylic monomers are shipped with DOT red labels in bulk quantities,
tank cars, or tank trucks. Mild steel is the usual material of choice for the construction of bulk storage facilities for acrylic monomers. Moisture must be
excluded to avoid rusting of the tanks and contamination of the monomers. Copper or copper alloys must not be allowed to contact acrylic monomers
intended for use in polymerization because copper is an inhibitor (67).
Numerous methods for the determination of monomer purity, including procedures for the determination of saponification equivalent and bromine
number, specific gravity, refractive index, and color, are available from manufacturers (68—70). Concentrations of minor components are determined by
iodimetry or colorimetry for HQ or MEHQ, by the Kad-Fisher method for water, and by turbidity measurements for trace amounts of polymer.
Gas—liquid chromatography is widely used both for a direct determination of monomer quality and for identification and determination of minor
components.
The toxicities of acrylic monomers range from moderate to slight. In general, they can be handled safely and without difficulty by trained personnel
following established safety practices. Table 5 summarizes investigations of the toxicity of the common acrylic monomers in animals under acute toxicity
conditions (67).
Table 5. Toxicities of Acrylic Monomers
Inhalation
Monomer Acute oral LD50, rats, mg/kg Acute precutaneous LD50, rabbits, LC50, rats, mg/L TLV, ppm mg/kg
methyl acrylate 300 ethyl acrylate 760 butyl acrylate 3730 1235 3.8 10 1800 7.4 25 3000 5.3
Liquid methyl and ethyl acrylate are moderately toxic when taken internally, brought into contact with the eyes, or absorbed through the skin. Eye
contact is the most serious hazard. Vapors of methyl and ethyl acrylate are moderately lacrimatory and irritating to the respiratory membranes. Threshold
limit values (TLV) have been adopted by OSHA, restricting prolonged low level exposures to vapors of methyl and ethyl acrylate in industrial situations
(Table 5). Repeated exposure of animals to the vapors of methyl or ethyl acrylate at lethal or near lethal concentrations produces degenerative changes in
the liver, kidneys, and heart muscle. However, their obvious odors and irritating effects reduce the likelihood of significant exposure. The higher acrylates
have similar but more moderate toxicities. Certain individuals have specific allergic reactions to acrylic monomers, including eye irritation, headache, or skin
eruptions. Ethyl acrylate appears on the California Safe Drinking Water and Toxic Enforcement Act of 1986 (Proposition 65) as a known carcinogen (71).
In normal practice, good ventilation to reduce exposure to vapors, splash-proof goggles to avoid eye contact, and protective clothing to avoid skin
contact are required for the safe handling of acrylic monomers. A more extensive discussion of these factors should be consulted before handling these
monomers (67).
Radical Polymerization
Usually, free-radical initiators such as azo compounds or peroxides are used to initiate the polymerization of acrylic monomers. Photochemical (72—74) and
radiation-initiated (75) polymerizations are also well known. At a constant temperature, the initial rate of the bulk or solution radical polymerization of
acrylic monomers is first order with respect to monomer concentration and one-half order with respect to the initiator concentration. Rate data for
polymerization of several common acrylic monomers initiated with 2,2,-azobisisobutyronitrile (AIBN) [78-67-1] have been determined and are shown in
Table 6. The table also includes heats of polymerization and volume percent shrinkage data.
Table 6. Polymerization Data for Acrylic Ester Monomers in Solution*
Acrylate Concentration, solvent k , L/mol-hb sp’ 1 Heat, kJ / mof Shrinkage, vol %
methyl 3 M, methyl propionate 250 78.7 24.8
ethyl 3 M, benzene 313 77.8 20.6
butyl 1.5 M, toluene 324 77.4 15.7
aRef. 76.
b At44.1°C.
To convert kJ to kcal divide by 4.184.
Acrylate and methacrylate polymerizations are accompanied by the liberation of a considerable amount of heat and a substantial decrease in volume.
Both of these factors strongly influence most manufacturing processes. Excess heat must be dissipated to avoid uncontrolled exothermic polymerizations.
In general, the percentage of shrinkage decreases as the size of the alcohol substituent increases; on a molar basis, the shrinkage is relatively constant (77).
The free-radical polymerization of acrylic monomers follows a classical chain mechanism in which the chain-propagation step entails the head-to-tail
growth of the polymeric free radical by attack on the double bond of the monomer.
R'—CH2CH- +CH2 =CH —- R'—CH2CH—CH2—CH-
COOR COOR COOR COOR
Chain termination can occur by either combination or disproportionation, depending on the conditions of the process (78,79).
Some details of the chain-initiation step have been elucidated. With an oxygen radical-initiator such as the /-butoxyl radical, both double bond
addition and hydrogen abstraction are observed. Hydrogen abstraction is observed at the ester alkyl group of methyl acrylate. Double bond addition occurs
in both a head-to-head and a head-to-tail manner (80).
Acrylate polymerizations are markedly inhibited by oxygen; therefore, considerable care is taken to exclude air during the polymerization stages of
manufacturing. This inhibitory effect has been shown to be caused by copolymerization of oxygen with monomer, forming an alternating copolymer
(81,82).
Kirk-Othmer Encyclopedia of Chemical Technology (4th Edition)
165
SURVEY
Voll
R'—CH2CH- + O2 R—CH2CHOO —CH2CHOO'
COOR COOR COOR
In the presence of any substantial amount of oxygen this reaction is extremely rapid, but the terminal peroxy radical formed reacts slowly with monomer
and has a relatively rapid termination rate.
R'--CH2CHOO —CH2CHOO- + CH2 =CH R'—CH2CHOO —CH2CH-
COOR COOR COOR COOR COOR
The overall effect, aside from the change in the polymer composition, is a decrease in the rate of monomer reaction, the kinetic chain length, and the
polymer molecular weight (83).
The vast majority of all commercially prepared acrylic polymers are copolymers of an acrylic ester monomer with one or more different monomers.
Copolymerization gready increases the range of available polymer properties and has led to the development of many different resins suitable for a broad
variety of applications. Several review articles are available (84,85).
In general, acrylic ester monomers copolymerize readily with each other or with most other types of vinyl monomers by free-radical processes. The
relative ease of copolymerization for 1:1 mixtures of acrylate monomers with other common monomers is presented in Table 7. Values above 25 indicate
that good copolymerization is expected. Low values can often be offset by a suitable adjustment in the proportion of comonomers or in the method of
their introduction into the polymerization reaction (86).
Table 7. Relative Ease of Copolvmer Formation for 1:1 Ratios of Acrylic and Other Monomers, rtsma^e^) x ^qq
1 J J r( larger)
Monomer 1
Monomer 2 Methyl acrylate Ethyl acrylate Butyl acrylate
acrylonitrile [107-13-1] 53 46 74
butadiene [106-99-0] 66 4.7 8.1
methyl methacrylate [80-62-6] 50.3 30.6 14.6
styrene [100-42-5] 21 16 26
vinyl chloride [75-01-4] 2.7 2.1 1.6
vinylidene chloride [75-35-4] 100 52 55
vinylacetate [108-05-4] 1.1 0.7 0.6
The /(smaller)//(larger) values listed in Table 7 correspond to the reactivity ratios for monomer 1, and monomer 2, r^. These are defined as
ri = ^11/^12
r2 = ^22/^21
For a growing radical chain that has monomer 1 at its radical end, its rate constant for combination with monomer 1 is designated and with monomer
2, A^. Similarly, for a chain with monomer 2 at its growing end, the rate constant for combination with monomer 2 is and with monomer 1, The
reactivity ratios may be calculated from Price-Alfreyj9 and e values, which are given in Table 8 for the more important acrylic esters (87). The sequence
distributions of numerous acrylic copolymers have been determined experimentally utilizing nmr techniques (88,89). Several review articles discuss
copolymerization (84,85).
Table 8. Q and e Values for Acrylic Monomers*
Monomer
methyl acrylate
ethyl acrylate
butyl acrylate
isobutyl acrylate
2-ethylhexyl acrylate
aRef. 88.
2.
0.44 4U.6U
0.41 +0.46
0.30 +0.74
0.41 +0.34
0.14 +0.90
Small amounts of specially functionalized monomers are often copolymerized with acrylic monomers in order to modify or improve the properties
of the polymer. These functional monomers can bring about improvements either direcdy or by providing sites for further reaction with metal ions,
cross-linkers, or other compounds and resins. Table 9 lists some of the more common functional monomers used in the preparation of acrylic copolymers.
Table 9. Functional Monomers for Copolymerization with Acrylic Monomers
Monomer Structure CAS Registry Number Molecular formula
Carbonyl methacrylic acid CH2=CCOOH 1 [79414] C4H6O2
CH3
acrylic acid CH2=CHCOOH [79-10-7] C3H4O2
itaconic acid CH2COOH 1 [97-654] C5H6°4
CH2=CCOOH
Amino
Kirk-Othmer Encyclopedia of Chemical Technology (4th Edition)
166
SURVEY
Voll
/-butylaminoethyl methacrylate CH3 CH2 =CCOO(CH2)2NHC(CH3)3 [24171-27-5] c10h19no
dimethylaminoethyl methacrylate СНз CH2 =CCOO(CH2)2N(CH3)2 [286747-2] c8h15no2
Hydroxy/
2-hydroxyethyl methacrylate СНз CH2 =ССООСН2СН2ОН [868-77-9]
2-hydroxyethyl acrylate СН2=СНСООСН2 сн2 он [818-61-1] С5Н8О3
H-Hydroxymethyl
Л-hydroxymethyl acrylamide CH2=CHCONHCH2 он [92442-5] c4h7no2
Л-hydroxymethyl methacrylamide СНз CH2=CCONHCH2OH [9234924] c5h,no2
Oxirane
glycidyl methacrylate ?Нз А сн2 =ссоосн2сн —сн2 [106-91-2] C7H10O3
Multifunctional
1,4-butylene dimethacrylate СНз (СН2=ССООСН2)2 [2082-81-7] CI IO
Bulk Polymerization. The bulk polymerization of acrylic monomers is characterized by a rapid acceleration in the rate and the formation of a
cross-linked insoluble network polymer at low conversion (90,91). Such network polymers are thought to form by a chain-transfer mechanism involving
abstraction of the hydrogen alpha to the ester carbonyl in a polymer chain followed by growth of a branch radical. Ultimately, two of these branch radicals
combine (91). Commercially, the bulk polymerization of acryEc monomers is of limited importance.
Solution Polymerization. The solution polymerization of acryEc monomers to form soluble acryEc polymers is an important commercial
process. In general, the polyacrylate esters of the lower alcohols are soluble in aromatic hydrocarbons, esters, ketones, and chlorohydrocarbons. They are
insoluble or only slightly soluble in aEphatic hydrocarbons, ethers, and alcohols. The higher poly(alkyl acrylates) are generally insoluble in oxygenated
organic solvents and soluble in both aEphatic and aromatic hydrocarbons and in chlorohydrocarbons. Cost, toxicity, flammabiEty, volatiEty, and
chain-transfer activity are the primary considerations in the selection of a suitable solvent. Chain transfer to solvent is an important factor in controlling the
molecular weight of polymers prepared by this method. The chain-transfer constants C for poly(ethyl acrylate) in various solvents are Ested in Table 10.
Table 10. Chain-Transfer Constants to Common Solvents for Poly(ethyl acrylate)*
Solvent____________
benzene
toluene
isopropyl alcohol
isobutyl alcohol
chloroform
carbon tetrachloride
Cs x 105
5.2
26.0
260
46.5
14.9
15.5
aRefs. 79, 92, and 93.
The type of initiator utilized for a solution polymerization depends on several factors, including the solubiEty of the initiator, the rate of
decomposition of the initiator, and the intended use of the polymeric product. The amount of initiator used may vary from a few hundredths to several
percent of the monomer weight. As the amount of initiator is decreased, the molecular weight of the polymer is increased as a result of initiating fewer
polymer chains per unit weight of monomer, and thus the initiator concentration is often used to control molecular weight. Organic peroxides,
hydroperoxides, and azo compounds are the initiators of choice for the preparations of most acryEc solution polymers and copolymers.
The molecular weight of a polymer can be controlled through the use of a chain-transfer agent, as well as by initiator concentration and type,
monomer concentration, and solvent type and temperature. Chlorinated aEphatic compounds and thiols are particularly effective chain-transfer agents used
for regulating the molecular weight of acryEc polymers (94). Chain-transfer constants (C at 60°C) for some typical agents for poly(methyl acrylate) are as
follows (87):
carbon tetrabromi.de
ethanethiol
butanethiol
0.41
1.57
1.69
Solution polymerizations of acryEc esters are usually conducted in large stainless steel, nickel, or glass-lined cylindrical ketdes designed to withstand
at least 446 kPa (65 psi). An anchor-type agitator is suitable for solutions with viscosity up to 1.0 Pa-s (10 P); a slow-speed ribbon agitator with close
clearance to the walls is required for solutions of higher viscosity. In large kettles, turbine agitators with swept-back blades are often used. Typically,
production kettles are fitted with a jacket for steam or hot water heating and for cooling, a reflux condenser, inlets for addition of the reaction ingredients,
sightglasses, a thermometer, and a rupture disk. A bottom valve is used for discharging the finished product to receiving tanks or drums.
Kirk-Othmer Encyclopedia of Chemical Technology (4th Edition)
167
SURVEY
Vol 1
Since acrylic polymerizations liberate considerable heat, violent or runaway reactions are avoided by gradual addition of the reactants to the ketde.
Usually the monomers are added by a gravity feed from weighing or measuring tanks situated close to the kettle. The rate of monomer addition is adjusted
to permit removal of heat with full flow of water in the condenser and a partial flow in the cooling jacket. Flow in the jacket can be increased to control the
polymerization in cases of erroneous feed rates or other unexpected circumstances. A supply of inhibitor is kept on hand to stop the polymerization if the
cooling becomes inadequate.
Initiators, usually from 0.02 to 2.0 wt % of the monomer of organic peroxides or azo compounds, are dissolved in the reaction solvents and fed
separately to the kettle. Since oxygen is often an inhibitor of acrylic polymerizations, its presence is undesirable. When the polymerization is carried out
below reflux temperatures, low oxygen levels are obtained by an initial purge with an inert gas such as carbon dioxide or nitrogen. A blanket of the inert gas
is then maintained over the polymerization mixture. The duration of the polymerization is usually 24 h (95).
A typical process for the preparation of a 94.8% ethyl acrylate—5.2% acrylic acid copolymer as an approximately 39% solution in ethyl acetate is given
below:
Reactor charge__________________________________________________________________________________________________________________Parts
ethyl acetate 61.4
benzoyl peroxide 0.1
Monomer charge_________________________________________________________________________________________________________________________
ethyl acrylate 36.5
acrylic acid 2.0
The solvent and initiator are charged to the reactor and heated to reflux (ca 80°C). Forty percent of the monomer charge is then added. The remainder of
the monomer is added in four equal increments at 24, 50, 79, and 110 min after addition of the initial monomer charge. The reaction mixture is kept at
reflux overnight, then cooled and packaged (96).
Acrylic resins are shipped in drum, tank truck, and tank car quantities. Storage tanks, usually of 20 to 40 m3 capacity, are constructed of stainless
steel, although tanks of mild steel can be used if provisions are made to keep them free of water. Moisture in mild steel tanks causes rusting and
discoloration of the polymer solution. Typically, storage tanks are equipped with a bottom oudet and are dished or sloped to permit complete drainage.
Most are also equipped with a manhole so that they can be entered for cleaning. Because the viscosity of most acrylic solution polymers varies with
temperature, temperature must be controlled by means of tank location, insulation, and heating or cooling devices. Steel pipe with steel or stainless steel
valves is used for the resin transfer lines (97).
Emulsion Polymerization. Emulsion polymerization is the most important industrial method for the preparation of acrylic polymers. The
principal markets for aqueous dispersion polymers made by emulsion polymerization of acrylic esters are the paint, paper, adhesives, textile, floor polish,
and leather industries, where they are used principally as coatings or binders. Copolymers of either ethyl acrylate or butyl acrylate with methyl methacrylate
are most common.
Most of the lower alkyl acrylates readily polymerize in water in the presence of a surfactant and a water-soluble initiator. The final product is an
opaque, gray, or milky-white dispersion or latex of high molecular weight polymer at a concentration of 30—60% in water. The particle size of acrylic
copolymer dispersions ranges from about 0.1 to about 1.0 |lm. These emulsion polymerizations are usually rapid and give high molecular weight polymers
at high concentration and low viscosity. Difficulties in agitation, heat transfer, and material transfer, which are often encountered in the handling of viscous
polymer solutions, are gready decreased with aqueous dispersions. In addition, the safety hazards and the expense of flammable solvents are eliminated.
The surfactants used in the emulsion polymerization of acrylic monomers are classified as anionic, cationic, or nonionic. Anionic surfactants, such as
salts of alkyl sulfates and alkylarene sulfates and phosphates, or nonionic surfactants, such as alkyl or aryl polyoxyethylenes, are most common (87,98—101).
Mixed anionic—nonionic surfactant systems are also widely utilized (102—105).
Water-soluble peroxide salts, such as ammonium or sodium persulfate, are the usual initiators. The initiating species is the sulfate radical anion
generated from either the thermal or redox cleavage of the persulfate anion. The thermal dissociation of the persulfate anion, which is a first-order process
at constant temperature (106), can be greatly accelerated by the addition of certain reducing agents or small amounts of polyvalent metal salts, or both (87).
By using redox initiator systems, rapid polymerizations are possible at much lower temperatures (25—60°C) than are practical with a thermally initiated
system (75—90°C).
Industrial acrylic emulsion polymerizations are usually conducted by batch processes in jacketed stainless steel or glass-lined ketdes designed to
withstand an internal pressure of at least 446 kPa (65 psi). Glass-lined equipment is preferred for easier cleaning. Agitators are constructed from the same
materials as the reactor. Versatility in controlling agitation is provided by use of a variable speed drive. A baffle is sometimes used in the kettle to improve
mixing; however, excessive shear must be avoided to minimize the formation of coagulum. The temperature of the reactants is controlled by circulating
steam and cold water through the jacket. A schematic diagram of a typical plant installation is given in Figure 2. A filtered feed line for emulsified monomer
is installed to enter through the top of the kettle. Separate feed lines are also provided in the top of the reactor for adding aqueous solutions of initiators
and/or activators. Additional equipment includes a temperature recorder, manometer, sightglass, and emergency stack equipped with a rupture disk.
Kirk-Othmer Encyclopedia of Chemical Technology (4th Edition)
168
SURVEY
Voll
Water
Fig. 2. Emulsion polymerization plant. A, Emulsion feed tank; B, polymerization reactor; C, drumming tank; F, filter; M, meter; P, pressure gauge; T,
temperature indication.
Monomer emulsions are prepared in separate stainless steel emulsification tanks that are usually equipped with a turbine agitator, manometer level
gage, cooling coils, a sprayer inert gas, temperature recorder, rupture disk, flame arrester, and various nozzles for charging the ingredients. Monomer
emulsions are commonly fed continuously to the reactor throughout the polymerization.
A simple stainless steel drumming tank is used to receive the polymerized emulsion and hold it until it is packaged into drums or tank cars. This tank
is also employed to adjust the solids content and pH; for the addition of preservatives, stabilizers, and thickeners; and for blending operations. A
paddle-type low speed agitator is used for mixing. A cooling jacket on the drumming tank permits discharge of hot dispersion from the reactor, thus
increasing the productivity of the ketde. The cooled dispersion is passed through a coarse filter prior to packaging (87).
Numerous recipes have been published, primarily in the patent literature, that describe the preparation of acrylate and methacrylate homopolymer
and copolymer dispersions (107,108). A typical process for the preparation of a 50% methyl methacrylate, 49% butyl acrylate, and 1% methacrylic acid
terpolymer as an approximately 45% dispersion in water begins with the following charges:
Monomer emulsion charge
deionized water
sodium lauryl sulfate
methyl methacrylate
butyl acrylate
methacrylic acid
Initiator charge___________
ammonium persulfate
Reactor charge_____________
deionized water
sodium lauryl sulfate
Parts
13.65
0.11
22.50
22.05
0.45
023
30.90
0.11
The monomer emulsion charge is prepared by adding the listed ingredients in the order given while maintaining good agitation. The reactor charge
is heated with good agitation under a nitrogen atmosphere to 85°C; then the initiator charge is added to the reactor and the monomer emulsion feed is
begun. The monomer emulsion is fed uniformly over 2.5 h while maintaining 85°C. After the addition is complete, the temperature is raised to 95°C to
complete the conversion of monomer. The product is then cooled to room temperature, filtered, and packaged.
Acrylic dispersion polymers are shipped in bulk or in drums. Tank trucks and tank cars used for bulk shipment are constructed of stainless or
resin-coated steel and are insulated to prevent freezing. Filament-wound glass-fiber-reinforced polyester tanks are recommended for storage because of
their relatively low cost, ease of installation, and chemical resistance. Usually storage tanks are located in an enclosed and heated environment to prevent
freezing during cold weather. Dispersion polymers are subject to the various instability problems common to all colloidal systems, such as sedimentation,
skinning (surface film), gritting (solid within the dispersion), gumming (deposits on walls), and sponging (formation of an aerogel). Undesirable changes
may be caused by time, drift in pH, evaporation, high or low temperature, shear and turbulence, and foaming. Oxidative degradation is not usually
encountered with acrylic dispersion polymers, but bacterial attack is common and is avoided by pH adjustment, addition of bactericidal agents, and careful
housekeeping (95). Recent advances in the industrial aspects of emulsion polymerization can be found in reference 109.
Suspension Polymerization. Suspension polymerization yields polymer in the form of tiny beads, which are primarily used as molding
powders and ion-exchange resins. Most suspension polymers prepared as molding powders are poly(methyl methacrylate); copolymers containing up to
20% acrylate for reduced brittleness and improved processibility are also common.
In a suspension polymerization monomer is suspended in water as 0.1—5-mm droplets, stabilized by protective colloids or suspending agents.
Polymerization is initiated by a monomer-soluble initiator and takes place within the monomer droplets. The water serves as both the dispersion medium
and a heat-transfer agent. Particle size is controlled primarily by the rate of agitation and the concentration and type of suspending aids. The polymer is
obtained as small beads about 0.1—5 mm in diameter, which are isolated by filtration or centrifugation.
Suitable protective colloids for the preparation of acrylic suspension polymers include cellulose derivatives, polyacrylate salts, starch, poly(vinyl
alcohol), gelatin, talc, clay, and clay derivatives (95). These materials are added to prevent the monomer droplets from coalescing during polymerization
(110). Thickeners such as glycerol, glycols, polyglycols, and inorganic salts are also often added to improve the quality of acrylic suspension polymers (95).
Kirk-Othmer Encyclopedia of Chemical Technology (4th Edition)
169
SURVEY
Vol 1
Other constituents may be added to assist in the formation of uniform beads or to influence the use properties of the polymers through plasticization or
cross-linking. These include lubricants, such as lauryl or cetyl alcohol and stearic acid, and cross-linking monomers such as di- or trivinylbenzene, diallyl
esters of dibasic acids, and glycol dimethacrylates.
Initiators of suspension polymerization are organic peroxides or azo compounds that are soluble in the monomer phase but insoluble in the water
phase. The amount of initiator influences both the polymerization rate and the molecular weight of the product (95).
Because the polymerization occurs totally within the monomer droplets without any substantial transfer of materials between individual droplets or
between the droplets and the aqueous phase, the course of the polymerization is expected to be similar to bulk polymerization. Accounts of the quantitative
aspects of the suspension polymerization of methyl methacrylate generally support this model (95,111,112). Developments in suspension polymerization,
including acrylic suspension polymers, have been reviewed (113,114).
Graft Copolymerization. Graft copolymers are formed by attaching one polymer as a branch to the chain of another polymer. This method
requires the generation of radical sites on the first polymer onto which monomer of a second type is polymerized. The presence of distinct but chemically
bonded segments of two polymers often confers interesting and useful properties. Graft polymerizations of acrylic monomers onto both synthetic
(115,116) and natural polymers (117—120) are reported. The radical sites for grafting are generated by a variety of methods including chemical (121—123),
photochemical (124,125), radiation (126), and mechanical mastication (127). The synthesis and characterization of graft copolymers, including acrylic graft
copolymers, has been reviewed (128,129).
Radiation-Induced Polymerization. The uv cure of coatings, printing ink, and photoresists has become increasingly important in recent
years because it offers the economic advantage of requiring less energy than thermal cure and the ecological advantage of reduced solvent emissions. A
chief drawback of this technology is its inability to cure highly pigmented films because the pigments reflect and absorb uv radiation and prevent adequate
light penetration.
Ultraviolet curable coatings (130) and printing inks (131) are typically composed of the following ingredients: pigment, monomer, polymer,
photoinitiator, and inhibitor. The formulation is applied to a substrate as a thin film, then cured (polymerized) rapidly by exposure to uv radiation. The
polymers utilized often contain unsaturation in order to co-cure with the monomer. The function of the photoinitiator is to absorb the radiation and
initiate the free-radical polymerization. Because of their rapid cure rates, the high boiling acrylate monomers, both monofunctional and multifunctional, are
widely used as the solvent media in uv curable systems. Methacrylate functionality is often used as the co-curing unsaturation site on the polymer (132).
Methacrylate functional polymers and acrylate monomers also find use in uv curing photoresist applications (133). References 132, 134, 135, and 136 are
reviews of the state of the art in uv cure technology, including the use of acrylate monomers.
Electron-beam curing of coatings is becoming an area of active interest and increasing industrial importance. This technology uses formulations very
similar to those employed by the uv coatings industry, including the widespread use of higher boiling acrylate monomers. A good description and overview
of this technique can be found in Reference 137 (see also Radiation curing).
Ionic Polymerization
Acrylate monomers do not generally polymerize by a cationic mechanism. However, the anionic polymerization of acrylic monomers to stereoregular or
block copolymers is well known. These polymerizations are conducted in organic solvents, primarily using organometallic compounds as initiators.
Currendy this technology is of minor commercial significance, but stereoregular forms of numerous polyacrylates have been prepared and characterized.
These include poly (/-butyl acrylate) (138—141), poly(isopropyl acrylate) (142), and poly(isobutyl acrylate) (143,144). Carefully controlled reaction conditions
are usually required to obtain polymers with some measurable degree of crystallinity. In nonpolar solvents the anionic polymerization of acrylates generally
yields isotactic polymer, whereas in polar solvents syndiotactic polymerization is favored. The physical and chemical properties of the various forms are
often quite different. A general review covers these and other aspects of the anionic polymerization of acrylates (145).
Initiation of these anionic polymerizations is considered to take place via a Michael reaction:
li .(' M 1 + CH2=CHCOOR R3C—CH2—C—COOR
Propagation occurs by head-to-tail addition of monomer:
R3C—CH2—CH—COOR+ CH2 =CHCOOR R3C—CH2—CH—CH2—CH
COOR COOR
Despite numerous efforts, there is no generally accepted theory explaining the causes of stereoregulation in acrylic and methacrylic anionic
polymerizations. Complex formation with the cation of the initiator (146) and enolization of the active chain end are among the more popular hypotheses
(147). Unlike free-radical polymerizations, copolymerizations between acrylates and methacrylates are not observed in anionic polymerizations; however,
good copolymerizations within each class are reported (148).
A brief review has appeared covering the use of metal-free initiators in living anionic polymerizations of acrylates and a comparison with Du Font's
group-transfer polymerization method (149). Tetrabutylammonium thiolates run room temperature polymerizations to quantitative conversions yielding
polymers of narrow molecular weight distributions in dipolar aprotic solvents. Block copolymers are accessible through sequential monomer additions
(149—151) and interfacial polymerizations (152,153).
Economic Aspects
In 1989 the U.S. production of acrylic ester monomers was ca 450,000 t. This represents about 45% of the worldwide production; Western Europe (ca
35%) and Japan (ca 15%) account for most of the remainder. Essentially all of this was converted to acrylic polymers and copolymers. The U.S. production
is principally from four companies:
Producer
Rohm and Hass
Hoechst Celanese
BASF
Union Carbide
Capacity, t
280,000
195,000
105,000
100,000
The historical trend in U.S. production of the various acrylic monomers is shown in Table 11.
Table 11. U.S. Production of Acrylic Monomers, 103 ta
Monomer 1969 1975 1980 1984
methyl 14 20 22 28
ethyl 91 109 136 138
я-butyl 29 81 145 192
2-ethylhexyl 15 15 31 39
Kirk-Othmer Encyclopedia of Chemical Technology (4th Edition)
170
SURVEY
Voll
other
acrylate esters, total
aRef. 154.
4
153
9
234
23
357
27
424
In 1989 the U.S. prices for ethyl and butyl acrylate were in the range of $1.20 to 1.50/kg. Lower volume acrylates generally ranged in price from
$3.00 to 5.00/kg. Prices for acrylic polymers are generally one and one-half to three times the monomer costs.
Synthetic emulsion polymers account for approximately 70% of the U.S. consumption of acrylate monomers. Major end uses for these latex
polymers are coatings (32%), textiles (17%), adhesives (7%), paper (5%), and floor polishes (3%). The U.S. producers of acrylic copolymer emulsions
include Rohm and Haas, Reichhold, National Starch, Union Carbide, Air Products, Unocal, B. F. Goodrich, and H. B. Fuller.
Solution polymers are the second most important use for acrylic monomers, accounting for about 12% of the monomer consumption. The major
end use for these polymers is in coatings, primarily industrial finishes. Other uses of acrylic monomers include graft copolymers, suspension polymers, and
radiation curable inks and coatings.
Analytical Test Methods and Specifications
Emulsion Polymers. Acrylic emulsion polymers are usually characterized by their composition, solids content, viscosity, pH, particle size
distribution, glass-transition temperature, minimum film-forming temperature, and surfactant type. Where applicable, details of these characteristics are
similar to those described for solution polymers. Particle size is most easily evaluated by photon correlation spectroscopy and sedimentation field flow
fractionation (155) or more quantitatively by observation with an electron microscope (156). Minimum film-forming temperatures are determined by
casting a film of the dispersion on a variable temperature bar and observing the minimum temperature at which a continuous film is obtained (157). A
dispersion is classified as anionic, cationic, or nonionic depending primarily on the type of surfactant used in its preparation. In addition, acrylic dispersions
are often evaluated by their mechanical (primarily shear), freeze—thaw, and thermal stability, their tendency to form sediment on long term standing, and
their compatibility with other dispersions, salts, surfactants, and pigments. Details on methods for determining all of the properties are reported (87).
Solution Polymers. Acrylic solution polymers are usually characterized by their composition, solids content, viscosity, molecular weight,
glass-transition temperature, and solvent. The compositions of acrylic polymers are most readily determined by physicochemical methods such as
spectroscopy, pyrolytic gas—liquid chromatography, and refractive index measurements (97,158). The solids content of acrylic polymers is determined by
dilution followed by solvent evaporation to constant weight. Viscosities are most conveniently determined with a Brookfield viscometer, molecular weight
by intrinsic viscosity (158), and glass-transition temperature by calorimetry.
Health and Safety Factors
Acrylic polymers are considered to be nontoxic. In fact, the FDA allows certain acrylate polymers to be used in the packaging and handling of food.
However, care must be exercised because additives or residual monomers present in various types of polymers can display toxicity. For example, some
acrylic latex dispersions can be mild skin or eye irritants. This toxicity is usually ascribed to the surfactants in the latex and not to the polymer itself.
Potential health and safety problems of acrylic polymers occur in their manufacture (159). During manufacture, considerable care is exercised to
reduce the potential for violent polymerizations and to reduce exposure to flammable and potentially toxic monomers and solvents. Recent environmental
legislation governing air quality has resulted in completely closed kettle processes for most acrylic polymerizations. Acrylic solution polymers are treated as
flammable mixtures. Dispersion polymers are nonflammable.
Uses
The combination of durability and clarity and the ability to tailor molecules relatively easily to specific applications have made acrylic esters prime candidates
for numerous and diverse applications. At normal temperatures the polyacrylates are soft polymers and therefore tend to find use in applications that
require flexibility or extensibility. However, the ease of copolymerizing the softer acrylates with the harder methacrylates, styrene, acrylonitrile, and vinyl
acetate, allows the manufacture of products that range from soft rubbers to hard nonfilm-forming polymers.
Coatings. Their excellent clarity, toughness, color retention, uv stability, and chemical inertness make acrylic ester emulsion polymers prime
paint binders. Acrylics are widely used in all types of paint formulations: interior and exterior; flats, semigloss, and gloss; and primers and topcoats. Widely
used copolymer systems include all-acrylic (acrylate—methacrylate), vinyl— acrylic (vinyl acetate—acrylic), and styrene—acrylic. The all-acrylic copolymers are
generally favored for exterior applications because of their excellent durability (160). Typical paint formulations are given in reference 76, and general
techniques for manufacturing acrylic latex paints are given in Reference 161. Water-borne acrylic latex coatings compete for the protection of structural
steel (162) (see Coating processes).
Both acrylic emulsion and solution polymers are widely used in industrial finishing, including factory finished wood (163,164), metal furniture and
containers (165), and can and coil coating (166). Thermosetting coatings based on acrylic polymers cross-linked with melamines, epoxies, and isocyanates
are common. Acrylic coatings are applied to surfaces in various ways: spray, roll dip, and curtain coating are most common. New coating methods
applicable to acrylics include radiation cure of acrylic monomers (167—172); acrylic powder coatings, a coating where the pigment and the binder are applied
as powders (173—176); and electrode deposition of acrylic emulsion polymers (177—179). High solids and low emission industrial finishing systems are
described in reference 180, and a review of the chemistry of water-based acrylic polymers used for industrial finishing appears in Reference 181. A thorough
technical discussion and review of the place of acrylic emulsions in metal coil coatings may be found in Reference 182. A summary of the properties and
applications of pigmented and clear lacquers based on solution acrylics is presented in Reference 183. Clear acrylic solution coatings are used to protect the
luster of polished zinc, copper, and brass (184). The technology and formulation of high-solids solution acrylic resins as baking enamels have been
reviewed (185) (see Coatings).
Hydrophobe-modified copolymers of acrylate esters with acrylic or methacrylic acid are finding increasing use as high quality thickeners for both
trade sales and industrial paints (186). Formulations thickened with these unique water-soluble polymers show excellent flow and leveling characteristics.
Textiles. The uses of acrylic emulsion polymers in textiles are numerous and diverse. Large volume uses include binders for fiberfill and
nonwoven fabrics, textile bonding or lamininating, flocking, backcoating, and pigment printing binders. AH-acrylic binders are most common; however,
some vinyl—acrylics are also used. Self-cross-linking polymers containing copolymerized N-methylolacrylamide are common. The cross-linking improves
washing and dry cleaning durability as well as the overall strength of the binder (187). Acrylics are favored because of their resistance to discoloration and
for the soft feel they can provide.
As binders for fiberfill and nonwovens, the emulsions are applied to a loose web or mat, then heated to form a film that sticks the loose fibers
together. Polyester (188—191), glass (192), and rayon (193) mats are bonded in this manner for a variety of end uses including quilting, clothing, disposable
diapers and towels, filters, and roofing (see Nonwoven fabrics).
The exceptional resistance of acrylic to uv light, heat, ozone-yellowing, water, stiffening on aging, and dry cleaning make acrylics ideal as a textile
coating material where the use demands are severe: automotive upholstery, window drapes, pile fabrics used for outerwear, and boots or boot linings (194).
Automotive and furniture upholstery fabrics are often back-coated with thin films of acrylic polymers to improve dimensional handling properties, prevent
pattern distortion, prevent unraveling, and minimize seam slippage. Frothed and foamed back-coatings eliminate the strike-through problems, yield a softer
fabric, and save on energy costs (195). Crushed acrylic latex foams are used as backings for drapery fabric. The foam protects the drapery from sunlight; it
stabilizes the fabric, improves drape, and provides a softer hand than conventional backcoatings (196) (see Foamed plastics). Acrylics are also
recommended for fabric-to-fabric, fabric-to-foam, and fabric-to-nonwoven bonding and find some use as carpetbacking (197).
The preparation of flocked fabric using acrylic adhesives is detailed in Reference 198. In flocking, cut fibers are bonded to an adhesive-coated fabric
to achieve both a decorative and a functional effect. Acrylics can be tailored to provide the unique balance between softness and durability required for this
Kirk-Othmer Encyclopedia of Chemical Technology (4th Edition)
171
SURVEY
Voll
application. Textiles can be durably printed using acrylic emulsion polymers as binders for pigments. The printed fabrics are highly resistant to washing, dry
cleaning, and wear, and are soft and pleasant to the touch (35,199). Printing paste formulations and technology can be found in reference 200.
Another textile use of acryEc polymers is fabric finishing, to impart a desired hand or feel, or to aid soil release, or for permanent-press features.
Copolymers of acrylate esters with acryEc or methacryEc acid serve as thickeners for a variety of textile coating formulations (see Textiles, finishing).
Adhesives. AcryEc emulsion and solution polymers form the basis of a variety of adhesive types. The principal use is in pressure-sensitive
adhesives, where a film of a very low T (<—20° C) acryEc polymer or copolymer is used on the adherent side of tapes, decals, and labels. Acrylics provide a
good balance of tack and bond strength with exceptional color stabiEty and resistance to aging (201,202). AcryEcs also find use in numerous types of
construction adhesive formulations and as film-to-film laminating adhesives (qv).
Paper. Various paper and board mills have adopted acryEc—vinyl acetate copolymer emulsion polymers as pigment binders for their coated grade
papers and boards based on their cost—performance balance. The advantages over the more widely used styrene—butadiene copolymers are higher
brightness, opacity, and coating soEds, combined with improved adhesive abiEty (203,204). AcryEc ester polymers have been compared to natural rubber,
butadiene—acrylonitrile, and butadiene—styrene as paper saturants (205). AcryEc emulsions are offered that interact with clay in starch—latex-pigmented
coatings (206). AcryEc emulsions find some use in size-press appEcations (207) and in beater addition (208) (see Papermaking additives).
Other Applications. AcryEc ester emulsions are used for leather finishing (209) and as acryEc polymer—leather composites. AcryEcs can be
used in every stage of pigskin leather production from tanning to finishing. The use of specially designed acrylics imparts uniformity, break improvement,
better durabiEty, and surface resistance without impairing the beautiful aesthetic quaEties of pigskin (210) (see Leather).
AcryEc modifiers for cement impact strength and adhesion to substrates are discussed in reference 211. Both water-soluble acryEc and acryEc
emulsion polymers are used in the ceramic industry as temporary binders, deflocculants, and additive components in ceramic bodies and glazes (212) (see
Ceramcs).
AcryEcs are used as binders for both aqueous and solvent-based caulks and sealants (qv) (213,214). AcryEc elastomeric roof mastics are used to
protect polyurethane foam from uv radiation damage. The water-based formulation is easy to apply and is extremely resistant to chemical and uv radiation
attack, impacts such as hailstones, and temperature change (215). Powdered acryEc polymers serve as processing aids and plate-out scavengers for both
plasticized and unplasticized poly(vinyl chloride) in the manufacture of blown film and thin-gauge calendered film. This polymer type produces changes in
the melt viscosity that make it possible to calender smooth, thick vinyl sheet (216). An acryEc emulsion that forms a thin insoluble film over leaves and fruit
was used to control "Greasy Spot," a disease that can cause serious leaf-spotting and subsequent leaf fall in citrus trees (217). A comprehensive formulation
guide for acryEc floor poEshes (qv) is available (218).
Polyacrylate elastomers find limited use in hydraulic systems and gasket appEcations because of their superior heat resistance compared to the nitrile
rubbers (219,220). Ethylene—acrylate copolymers were introduced in 1975. The appEcations include transmission seals, vibration dampers, dust boots, and
steering and suspension seals. Further details and performance comparisons with other elastomers are given in reference 221 (see also Elastomers,
SYNTHETIC-ACRYLIC ELASTOMERS).
BIBLIOGRAPHY
"AcryEc Ester Polymers, Survey" in ECT 3rd ed., Vol. 1, pp. 386—408, by Benjamin B. Kine and Ronald W. Novak, Rohm and Haas Company.
1. J. Redtenbacher, Ann. 47, 125 (1843).
2. Fr. Englehom, Berichte 13, 433 (1880); L. Balbiano and A. Testa, Berichte 13, 1984 (1880).
3. W. Caspary and B. Tollens, Ann. 167, 241 (1873).
4. G. W. A. Kahlbaum, Berichte 13, 2348 (1880).
5. U.S. Pat. 1,121,134 (Dec. 15,1914), O. Rohm.
6. E. H. Riddle, Monomeric Acrylic Esters, Reinhold PubEshing Corp., New York, 1954.
7. J. Brandrup and E. H. Immergut, PolymerFIandbook, 2nd ed., Interscience PubEshers, Wiley-Interscience, New York, 1975.
8. H. B. Burrell, Off. Dig. Fed. Soc. Paint Technol. 131 (Feb. 1962).
9. D. W. van Krevelen, Properties of Polymers, Elsevier, Amsterdam, 1972.
10. J. L. Gardon in N. M. Bikales, ed., Encyclopedia ofPolymer Science andTechnology, Vol. 3, Interscience PubEshers, a division of John Wiley & Sons, Inc.,
New York, 1965, pp. 833-862.
11. T. G. Fox, Jr., Bull. Am. Phys. Soc. 1(3), 123 (1956).
12. J. A. Shetter,/ Polym. Sci. Part В 1, 209 (1963).
13. L. E. Nielsen, Mechanical Properties of Polymers, Van Nostrand Reinhold Co., Inc., New York, 1962, p. 122.
14. I. Wilhamson, Br. Plast. 23, 87 (1950).
15. R. F. Clark, Jr., and R. M. Berg, Ind. Eng. Chem. 34, 1218 (1942).
16. ASTM Standards, ASTM D1043-61T, Vol. 27, American Society for Testing and Materials, Philadelphia, Pa., 1964.
17. S. D. Gehman, D. E. Woodford, and C. S. Wikins on, Jr., Ind. Eng. Chem. 39, 1108 (1947).
18. ASTM Standards, ASTM D1053-61, Vol. 19, American Society for Testing and Materials, Philadelphia, Pa., 1974.
19. A. C. Nuessle and В. B. Kine, Ind. Eng. Chem. 45, 1287 (1953).
20. A. C. Nuessle and В. B. Kine, Am. Dyest. Rep. 50(26), 13 (1961).
21. V. J. Moser, Am. Dyest. Rep. 53(38), 11 (1964).
22. M. K. Lindemann, Appl. Polym. Symp. 10, 73 (1969).
23. W. H. Brendley, Jr., Paint Vam. Prod. 63(3), 23 (1973).
24. R. Zdanowski and G. L. Brown, Jr., Resin Review, Vol. 9, No. 1, Rohm and Haas Co., Philadelphia, Pa., 1959, p. 19.
25. R. Bakule and J. M. BEckensderfer, Tappi 56(4), 70 (1973).
26. A. V. Tobolsky, J. Pofm. Sci. Pofm. Symp. 9, 157 (1975).
27. L. J. Hughes and G. E. Britt,/. Appl. Polym. Sci. 5(15), 337 (1961).
28. S. Krause and N. Roman,/ Polym. Sci. Part A 3, 1631 (1965).
29. H. L. Gerhart, Off. Dig. Fed. Soc. Paint Technol. 680 (June 1961).
30. R. M. Christenson and D. P. Hart, Off. Dig. Fed. Soc. Paint Technol. 684 (June 1961).
31. H. A. Vogel and H. G. Brittle, Off. Dig. Fed. Soc. Paint Technol. 699 (June 1961).
32. J. D. Murdock and G. H. Segall, Off. Dig. Fed. Soc. Paint Technol. 709 (June 1961).
33. J. D. Petropoulous, C. Frazier, and L. E. Cadwell, Off. Dig. Fed. Soc. Paint Technol. 719 (1961).
34. D. G. Applegath, Off. Dig. Fed. Soc. Paint Technol. 737 (June 1961).
35. U.S. Pat. 2,886,474 (May 12, 1959), В. B. Kine and A. C. Nuessle (to Rohm and Haas Co.).
36. U.S. Pat. 2,923,653 (Feb. 2,1960), N. A. Matlin and В. B. Kine (to Rohm and Haas Co.).
37. D. H. Klein,/. Paint Technol. 42(545), 335 (1970).
38. S. H. Rider and E. E. Hardy, Polymerisation and Polycondensation Processes (Adv. Chem. Ser. No. 34), American Chemical Society, Washington, D.C.,
1962.
39. R. H. Wiley and G. M. Braver, / Polym. Sci. 3, 647 (1948).
40. J. R. Martin, J. F. Johnson, and A. R. Cooper, / Macrol. Sci. Rev. Macromol. Chem. 8, 57 (1972).
41. A. S. Craemer, Kunststoffe 30, 337 (1940).
Kirk-Othmer Encyclopedia of Chemical Technology (4th Edition)
172
SURVEY
Vol 1
42. В. E. Rehberg and С. H. Fisher, Ind. Eng. Chem. 40, 1429 (1948).
43. G. G. Cameron andD. R. Kane, Makromol. Chem. 109, 194 (1967).
44. L. Gunawan and J. K. Haken,/ Poly. Sci. Poly. Chem. Ed. 23, 2539 (1985).
45. A. R. Burgess, Chem. Ind. 78 (1952).
46. R. Stelle and H. Jacobs,/. Appl. Polym. Sci. 2(4), 86 (1959).
47. B. G. Achhammer, Mod. Plast. 35, 131 (1959).
48. K. L. Hoy,/ PaintTechnol. 43, 76 (1970).
49. A. F. M. Martin, Handbook of Solubility Parameters and Other Cohesion Parameters, CRC Press, Inc., Boca Raton, Fla., 1983.
50. J. H. Hildebrand and R. L. Scott, The Solubility ofNon-Electrolytes, 3rd ed., Rheinhold Publishing Corp., New York, 1949.
51. P. A. Small,/. Appl. Chem. 3, 71 (1953).
52. H. Burrell, Off. Dig. Fed. Soc. Paint Technol. 726 (Oct. 1955).
53. J. L. Gardon,/ PaintTechnol. 38, 43 (1966).
54. A. Rudin and H. K. Johnston,/ Paint Technol. 43(559), 39 (1971).
55. T. P. Forbarth, Chem. Eng. 69(5), 96 (1962).
56. M. Salkind, E. H. Riddle, and R. W. Keefer, Ind. Eng. Chem. 51, 1328 (1959).
57. H. Warson, The Applications of Synthetic Resin Emulsions, Ernest Benn Ltd., London, 1972.
58. R. F. B. Davies and G. E. J. Reynolds, / Appl. Polym. Sci. 12, 47 (1968).
59. A. R. Burgess, Chem. Ind. 78 (1952).
60. M. Tabata, G. Nilsson, and A. Lund,/ Polym. Sci. Polym. Chem. Ed. 21, 3257 (1983).
61. R. K. Graham,/ Polym. Sci. 38, 209 (1959).
62. W. Budant, J. Minsch, and C. Taylor,/ Polym. Sci. Part A 2, 57 (1964).
63. S. Sakuyama, T. Ohara, N. Shimixu, and K. Kubota, Chem. Technol. 350 (June 1973).
64. F. T. Maier and W. Bayer, Enycl. Chem. Process Des. 1, 401 (1976).
65. D. J. Hadley and E. M. Evans, Propylene and Its Industrial Derivatives, John Wiley & Sons, Inc., New York, 1973, pp. 416—497.
66. U.S. Pat. 3,875,212 (1975), T. Ohrui (to Sumitomo Chemical).
67. Storage and Handling of Acrylic and Methacrylic Esters and Acids, CM-17, Rohm and Haas Co., Philadelphia, Pa.
68. Analytical Methodsfor the Acrylic Monomers, CM-18, Rohm and Haas Co., Philadelphia, Pa.
69. Acrylate Monomers, Bulletin F-40252, Union Carbide Corp., New York.
70. Celanese Acrylates, Product Manual N-70-1, Celanese Chemical Co., New York.
71. State of California Health and Welfare Agency Safe Drinking Water and Toxic Enforcement Act of 1986.
72. M. H. Mackoy and H. W. Melville, Trans. Faraday Soc. 45, 323 (1949).
73. G. M. Burnett and L. D. Loan, International Symposium on Macromolecular Chemistry, Prague, 1957, p. 113.
74. U.S. Pats. 2,367,660 and 2,367,661 (Jan. 23, 1945), C. L. Agre (to E. I. du Pont de Nemours & Co., Inc.).
75. A. Chapiro, Radiative Chemistry of Polymeric Systems, Wiley-Interscience, New York, 1972.
76. Preparation, Properties and Uses of Acrylic Polymers, CM-19, Rohm and Haas Co., Philadelphia, Pa.
77. T. G. Fox, Jr., and R. Loshock,/ Am. Chem. Soc. 75, 3544 (1953).
78. J. L. O’Brien, / Am. Chem. Soc. 77, 4757 (1955).
79. E. P. Bonsall, Trans. Faraday Soc. 49, 686 (1953).
80. P. G. Griffiths and co-workers, Tetrahedron Eett. 23, 1309 (1982).
81. G. V. Schulz and G. Henrici, Makromol. Chem. 18/19, 473 (1956).
82. F. R. Mayo and A. A. Miller, / Am. Chem. Soc. 80, 2493 (1956).
83. M. M. Mogilevich, R/ш. Chem. Rev. 48, 199 (1979).
84. D. A. Tirrell in J. I. Kroschwitz, ed., Encyclopedia ofPolymer Science and Engineering, Wiley-Interscience, New York, 1986, pp. 192—233.
85. O. Yoshiahi and T. Imato, Rev. Phys. Chem. Jpn. 42(1), 34 (1972).
86. F. W. Bilhneyer, Jr., Textbook of Polymer Chemistry, Interscience Publishers, a division of John Wiley & Sons, Inc., New York, 1957.
87. Emulsion Polymerisation of Acrylic Monomers, CM-104, Rohm and Haas Co., Philadelphia, Pa.
88. J. J. Uibel and F. J. Dinon,/ Polym. Sci. Polym. Chem. Ed. 21, 1773 (1983).
89. F. A. Bovey, High Resolution NMR of Macromolecules, Academic Press, New York, 1972.
90. M. S. Matheson, E. E. Aner, E. B. Bevilacqua, and E. J. Hart,/ Am. Chem. Soc. 73, 5395 (1951).
91. T. G. Fox andR. Gratch, Ann. N.Y. Acad. Sci. 57, 367 (1953).
92. L. Maduga, An. Quim. 65, 993 (1969).
93. P. G. Griffiths, E. Rizzardo, and D. H. Solomon,/ Macromol. Sci. Chem. 17, 45 (1982).
94. J. G. Kloosterboer andH. L. Bressers, Polym. Bull. 2, 205 (1982).
95. The Manufacture of Acrylic Polymers, CM-107, Rohm and Haas Co., Philadelphia, Pa.
96. The Manufacture of EthylAcrylate-Acrylic Acid Copolymers, TMM-48, Rohm and Haas Co., Philadelphia, Pa.
97. Bulk Storage and Handling of Acryloid Coating Resins, C-186, Rohm and Haas Co., Philadelphia, Pa.
98. В. B. Kine and G. H. Redlich, in D. T. Wasan, ed., Suf actants in Chemical/ Process Engineering, Marcel Dekker, Inc., New York, 1988, p. 163.
99. A. E. Alexander,/ Oil Colour Chem. Assoc. 42, 12 (1962).
100. 100. С. E. McCoy, Jr., Off. Dig. Fed. Soc. Paint Technol. 35, 327 (1963).
101. A. F. Sirianni and R. D. Coleman, Can. J. Chem. 42, 682 (1964).
102. G. L. Brown, Off. Dig. Fed. Soc. Paint Technol. 28, 456 (1956).
103. Brit. Pat. 940,366 (Oct. 30,1963), P. R. van Ess (to Shell Oil).
104. U.S. Pat. 3,080,333 (Mar. 5,1963), R. J. Kray and C. A. DeFazio (to Celenese).
105. A. R. M. Azad, R. M. Fitch, and J. Ugelstad, in Colloidal Dispersions Micellar Behavior (Sympos. Ser. No. 9), American Chemical Society, Washington,
D.C., 1980.
106. H. Fikentscher, H. Gerrens, and H. Schuller, Angew. Chem. 72, 856 (1960).
107. U.S. Pat. 3,458,466 (July 29, 1969), W. J. Lee (to The Dow Chemical Company).
108. U.S. Pat. 3,344,100 (Sept. 26, 1967), F. J. Donat and co-workers (to B. F. Goodrich Co.).
109. H. Warson, Makromol. Chem. Suppl. 10/11, 265 (1985).
110. G. F. D'Alelio, Fundamental Principles ofPolymerisation, John Wiley & Sons, Inc., New York, 1952.
111. G. S. Whitby and co-workers,/ Polym. Sci. 16, 549 (1955).
112. B. N. Rutovshii and co-workers,/ Appl. Chem. UJGR 26, 397 (1953).
113. H. Warson, Polym. Paint Colour J. 178, 625 (1988).
114. H. Warson, Polym. Paint Colour J. 178, 865 (1988).
115. L. J. Hughes and G. L. Brown,/ Appl. Polym. Sci. J, 59 (1963).
116. B. N. Kishore and co-workers,/ Polym. Sci. Polym. Chem. Ed. 24, 2209 (1986).
117. G. Graczyk and V. Homof, J. Macromol. Sci. Chem. 12, 1633 (1988).
118. O. Y. Mansour and A. B. Moustafa,/ Polym. Sci. Polym. Chem. Ed. 13, 2795 (1975).
Kirk-Othmer Encyclopedia of Chemical Technology (4th Edition)
173
SURVEY
Voll
119.
120.
121.
122.
123.
124.
125.
126.
127.
128.
129.
130.
131.
132.
133.
134.
135.
136.
137.
138.
139.
140.
141.
142.
143.
144.
145.
146.
147.
148.
149.
150.
151.
152.
153.
154.
155.
156.
157.
158.
159.
160.
161.
162.
163.
164.
165.
166.
167.
168.
169.
170.
171.
172.
173.
174.
175.
176.
177.
178.
179.
180.
181.
182.
183.
184.
185.
186.
187.
188.
189.
190.
191.
192.
193.
T. Nagabhushanam andM. Santoppa,/ Polym. Sci. Polym. Chem. Ed. 14, 507 (1976).
L. Zlii-Cliong and co-workers, J. Macromol. Sci. Chem. 12, 1487 (1988).
С. E. Brockway and К. B. Moser,/. Polym. Sci. PartA-1 1, 1025 (1963).
G. Smets, A. Poot, and G. L. Dunean,/. Polym. Sci. 54, 65 (1961).
С. H. Bamford and E. F. T. White, Trans. Faraday Soc. 52, 719 (1956).
J. A. Hicks and H. W. Melville, Mature (London) 171, 300 (1953).
I. Sahata and D. A. I. Goring,/ Appl. Poly. Sci. 20, 573 (1976).
R. K. Graham, M. J. Gluchman, and M. J. Kampf, J. Polym. Sci. 38, 417 (1959).
D. J. Angier, E. D. Fadie, and W. F. Watson, Frans. Inst. Rubber Ind. 34, 8 (1958).
W. J. Burlant and A. S. Hoffman, Flock, and Graft Polymers, Reinhold Publishing Corp., New York, 1960.
R. J. Ceresa, Flock and Graft Copolymers, Butterworth, Inc., Washington, D.C., 1962.
D. McGinniss, in Ultraviolet Light Induced Reactions in Polymers (Sympos. Ser. No. 25), American Chemical Society, Washington, D.C., 1976.
J. W. Vanderhoff, in ref. 130.
S. P. Pappas, ed., U. I. Curing. Science and Technology, Technology Marketing Corp., Stamford, Conn., 1978.
U.S. Pat. 3,418,295 (Dec. 24,1968), A. C. Schwenthaler (to E. I. du Pont de Nemours & Co., Inc.).
V. D. McGinnis, SME Technical Paper (Ser.) FC 76-486, 1976.
J. V. Koleche, Photochemistry of Cycloaliphatic Epoxides andEpoxy Acrylates, Vol. I., ASTM International, 1989.
The Curing of Coatings with Ultra-Violet Radiation, D8667 G.D., Tioxide of Canada, Sorel, P.Q., Canada.
T. A. Du Plessis and G. De Hollain,/ Oil Colour Chem. Assoc. 62, 239 (1979).
M. L. Miller and С. E. Rauhut,/ Polym. Sci. 38, 63 (1959).
B. Garret, J. Am. Chem. Soc. 81, 1007 (1959).
A. Kawasahi and co-workers, Makromol. Chem. 49, 76 (1961).
G. Smets and W. Van Humbeeck,/ Polym. Sci. PartA-1 1, 1227 (1963).
W. E. Goode, R. P. Fellman, and F. H. Owens, in C. G. Overberger, ed., Macromolecular Synthesis, Vol. 1, John Wiley & Sons, Inc., New York, 1963,
p. 25.
J. Futukawa, T. Tsuruta, and T. Makimoto, Makromol. Chem. 42, 162 (1960).
T. Makmoto, T. Tsuruta, and J. Futukawa, Makromol. Chem. 50, 116 (1961).
Y. Heimei and co-workers, in N. A. J. Platzer, eA.,Appl. Polym. Symp. (26), 39 (1975).
D. E. Glusker and co-workers,/ Polym. Sci. 49, 315 (1961).
D. J. Cram and K. R. Kopecky,/ Am. Chem. Soc. 81, 2748 (1959).
H. Yuki and co-workers, in O. Vogl and J. Furukawan, eds., Ionic Polymerisation, Marcel Dekker, Inc., New York, 1976.
M. T. Reetz, Angew. Chem. Int. Ed. Engl. 27, 994 (1988).
V. V. Korshak and co-workers, Makromol. Chem. Suppl. 6, 55 (1984).
С. P. Bosmyak, I. W. Parsons, and J. N. Hay, PolymerM, 1488 (1980).
F. L. Keohan and co-workers,/ Polym. Sci. Polym. Chem. Ed. 22, 679 (1984).
Y. D. Lee and H. B. Tsai, Makromol. Chem. 190, 1413 (1989).
Synthetic Organic Chemicals, U.S. Production and Sales, 1970—1986, U.S. International Trade Commission, Washington, D.C.
E. A. Collines and co-workers,/. CoatingTechnol. 47, 35 (1975).
E. B. Bradford and J. W. Vanderhoff, J. Polym. Sci. Part С1, 41 (1963).
T. F. Protxman and G. L. Brown,/ Appl. Polym. Sci. 81 (1960).
P. W. Allen, Technique of Polymers Characterisation, Butterworths, London, 1959; Dilute Solution Properties of Acrylic andMethacrylic Polymers, SP-160,
Rohm and Haas Co., Philadelphia, Pa.
M. Harmon and J. King, U.S. NTIS AD Rep. AD-A0I7443,142 (1974).
R. E. Harren, A. Mercurio, and J. D. Scott, Aust. Oil Colour Chem. Assoc. Proc. News 17 (Oct. 1977).
Resin Review, Vol. 18, Rohm and Haas Co., Philadelphia, Pa., 1968.
R. N. Washbume, Am. Paint Coatings J. 67, 40 (1983).
R. P. Hopkins, E. W. Lewandowski, and T. E. Purcell, / Paint Technol 44, 85 (1972).
T. E. Purcell, Am. Paint J. (June 1972).
Technical Practices Committee, Materials Performance, Vol. 15, National Assoc, of Corrosion Engineers, Houston, Tex., 1976, pp. 4, 13.
К. E. Buffington, Maint. Eng. (Mar. 1976).
I. K. Schahidi, J. C. Trebellas, and J. A. Vona, Paint Vam. Prod. 64, 39 (1974).
С. B. Rybyn and co-workers, / PaintTechnol. 46, 60 (1974).
Multifunctional Acrylates in Radiation Curing Celanese Co., New York.
С. H. Carder, Paint Vam. Prod. 64,19 (1974).
MaterialsforPhotocurable Coatings andlnks, Union Carbide Corp., New York.
R. A. Hickner and L. M. Ward, Paint Vam. Prod. 64, 27 (1974).
F. Winglet and co-workers, Farbe + Lack 78, 1063 (1972).
R. Muller, Farbe + Lack 78, 1070 (1972).
J. K. Rankin,/ Oil Colour Chem. Assoc. 56, 112 (1973).
F. A. Kydova, Lakokras. Mater. Ikh Primen. 3, 20 (1969).
J. B. Zicherman, Am. Paint J. (May 1,1972).
U.S. Pat. 1,535,228 (Aug. 16, 1968), K. Shibayama (to Eiki Jidaito).
F. Beck and co-workers, Farbe + Lack 73, 298 (1967).
A. Mercurio and S. N. Lewis,/ PaintTechnol. 47, 37 (1975).
W. H. Brendley, Jr., and E. C. Cad, Paint Vam. Prod. 63, 23 (1973).
M. R. Yunaska and J. E. Gallagher, Resin Review, Vol. 19, Rohm and Haas Co., Philadelphia, Pa., 1969, pp. 1—3.
G. Allyn, Materials andMethods, Reinhold Publishing Co., New York, 1956.
Protecting the Sufaces of Copper and Copper-Fase Alloys, International Copper Research Association, New York.
R. R. Kuhn, N. Roman, and J. D. Whiteman, Mod. Paint Coatings 71, 50 (1981).
J. C. Thiabault, P. R. Sperry, and E. J. Schaller, in J. E. Glass, ed., Water-S oluble Polymers, American Chemical Society, Washington, D.C., 1986, p.
375.
N. Sutterlin, Makromol. Chem. Suppl. 10/11, 403 (1985).
V. J. Moser, Resin Review, Vol. 14, Rohm and Haas Co., Philadelphia, Pa., 1964, p. 25.
D. I. Lunde, Nonwoven FabricsForum, Clemson Univ., June 15—17, 1982.
U.S. Pat. 3,157,562 (Nov. 17,1964), В. B. Kine, V. J. Moser, and H. A. Alps (to Rohm and Haas Co.).
U.S. Pat. 3,101,292 (Aug. 20,1963), В. B. Kine and N. A. Madin (to Rohm and Haas Co.).
J. R. Lawrence, Resin Review, Vol. 6, Rohm and Haas Co., Philadelphia, Pa., 1956, p. 12.
U.S. Pat. 2,931,749 (Apr. 5,1960), В. B. Kine and N. A. Madin (to Rohm and Haas Co.).
Kirk-Othmer Encyclopedia of Chemical Technology (4th Edition)
174
SURVEY
Voll
194. G. C. Kantner, Text. WorldXSl. 89 (1982).
195. G. C. Kantner, Am. Text. 12, 30 (Feb. 1983).
196. L. Thompson and H. Mayfield, AASTCCFlationalTechnical Conference, 1974, p. 258.
197. F. X. Chancier and J. G. Brodnyan, Resin Review, Vol. 23, Rohm and Haas Co., Philadelphia, Pa., 1973, p. 3.
198. V. J. Moser and D. G. Strong, Am. Dyest. Rep. 55, 52 (1966).
199. U.S. Pat. 2,883,304 (Apr. 21, 1959), В. B. Kine and A. C. Nuessle (to Rohm and Haas Co.).
200. Brit. Pat. 1,011,041 (1962), K. Craemer (to Badische Anilin).
201. K. F. Foley and S. G. Chu, Adhes. Age 24 (Sept. 1986).
202. D. Satas, XL/Ах М^28 (Aug. 1988).
203. J. J. Latimer, Pulp Pap. Can. 82, 83 (1981).
204. J. E. Young and J. J. Latimer, South. Pulp Pap. J. 45, 5 (1982).
205. P. J. McLaughlin, Tappi 42, 994 (1959).
206. L. Mlynar and R. W. McNamee, Jr., Tappi 55, 359 (1972).
207. F. L. Schucker, Resin Review, Vol. 7, Rohm and Haas Co., Philadelphia, Pa., 1957, p. 20.
208. H. C. Adams, T. J. Drennen, and L. E. Kelley, Tappi 48, 486 (1965).
209. J. A. Handscomb,/ Soc. Feather Trades' Chem. 43, 237 (1959).
210. W. C. Prentiss,/. Am. Feather Chem. Assoc. 71, 54 (1976).
211. J. A. Lavelle and P. E. Wright, Resin Review, Vol. 24, Rohm and Haas Co., Philadelphia, Pa., 1974, p. 3.
212. J. R. Johnson, Resin Review, Vol. 11, Rohm and Haas Co., Philadelphia, Pa., 1961, p. 3.
213. P. E. Wright and H. C. Young, Resin Review, Vol. 24, Rohm and Haas Co., Philadelphia, Pa., 1974, p. 17.
214. P. H. Dougherty and H. T. Freund, Resin Review, Vol. 17, Rohm and Haas Co., Philadelphia, Pa., 1967, p. 3.
215. L. S. Frankel, D. A. Perry, and J. J. Lavelle, Resin Review, Vol. 32, Rohm and Haas Co., Philadelphia, Pa., 1982, p. 1.
216. J. T. Lutz, Jr., Resin Review, Vol. 19, Rohm and Haas Co., Philadelphia, Pa., 1969, p. 18.
217. M. Cohen, Proc. Fl. State Aortic. Soc. 72, 56 (1959).
218. Resin Review, Vol. 16, Rohm and Haas Co., Philadelphia, Pa., 1966, p. 12.
219. T. M. Vial, Rubber Chem. Technol. 44, 344 (1971).
220. P. Fram, in N. M. Bikales, ed., Encyclopedia ofPolymer Science andTechnology, Vol. 1, Interscience Publishers, a division of John Wiley & Sons, Inc.,
New York, 1964, pp. 226—246.
221. D. L. Schultz, Rubber World 182, 51 (May 1980).
Ronald W. Novak
Rohm and Haas Company
Kirk-Othmer Encyclopedia of Chemical Technology (4th Edition)
175
2-CYANOACRYLIC ESTER POLYMERS
Voll
2-CYANOACRYLIC ESTER POLYMERS
The polymers of the 2-cyanoacrylic esters, more commonly known as the alkyl 2-cyanoacrylates, are hard glassy resins that exhibit excellent adhesion to a
wide variety of materials. The polymers are spontaneously formed when their Equid precursors or monomers are placed between two closely fitting
surfaces. The spontaneous polymerization of these very reactive liquids and the excellent adhesion properties of the cured resins combine to make these
compounds a unique class of single-component, ambient-temperature-curing adhesives of great versatility. The materials that can be bonded run the gamut
from metals, plastics, most elastomers, fabrics, and woods to many ceramics.
The utility of these adhesives arises from the electron-withdrawing character of the groups adjacent to the polymerizable double bond, which
accounts for both the extremely high reactivity or cure rate and their polar nature, which enables the polymers to adhere tenaciously to many diverse
substrates.
The polymers first synthesized (1,2) were reported to be clear glassy resins. This original work involved a thermal polymerization, and it was not
until the early 1950s that scientists at Eastman Kodak discovered the rapid room-temperature cure and excellent adhesion of these materials quite by
accident. While determining the refractive index of a freshly prepared monomer, they discovered that the glass prisms of the refractometer had become
tighdy bonded. Further work led to the discovery that many other substrates became bonded in the same manner. This resulted in the commercialization in
1958 of Eastman 910, the first in what would become a large family of 2-cyanoacrylic ester adhesives. At present, a number of manufacturers in the United
States, Europe, Japan, and elsewhere market extended lines of these adhesives all over the world. Some of the major producers and their trademarks
include Loctite (Prism and Superbonder), Toagosei (Aron Alpha, Krazy Glue), Henkel (Sicomet), National Starch (Permabond), Sumitomo (Cyanobond),
Three Bond (Super Three), and Alpha Giken (Alpha Ace, Alpha Techno).
Physical Properties
The physical properties of the monomers must be discussed along with those of the cured polymers because consideration of one without the other
presents an incomplete picture. The 2-cyanoacrylic ester monomers are all thin, water-clear liquids with viscosities of 1-3 mPa-s( =cP). Although a number
of the esters have been prepared and characterized, only a relative few are of any significant commercial interest, and, of those, the methyl and ethyl esters
by far predominate. The physical properties of the principal monomers are included in Table 1.
CN
I
а __Г**I—I
Table 1. Properties of Common Cyanoacrylate Monomers, vn2
Property R
Methyl Ethyl Isopropyl \llvl //-Butyl Isobutyl Methoxyeth yl Ethoxyethyl
molecular formula C3H3O2N CII()\ 6/2 c7h9o2n c7h7o2n C8HuO2N C8HuO2N c7h9o3n C8HuO3N
CAS Registry Number [137-05-3] [7085-85-0 [10586-17-1 [7324-02-9 [6066-65-1 [1069-55-2 [27816-23-5 [21982-91-8
] ] ] ] ] ] ]
odor very sharp, < sharp acrylic odor, < virtually odorless >
lacrimatory ^lacrimatory
viscosity, mPa-s (=cP) 2.2 1.9 2.1 2.0 2.1 2.0 2.6 5.0
density, g/cm3 1.10 1.05 1.01 1.05 0.98 0.99 1.06 1.07
boiling point, °C 48-49 54-56 53-56 78-82 83-84 71-73 96-100 104-106
, b at kPa 0.33-0.36 0.21-0.40 0.27-0.33 0.80 0.40 0.25-0.29 0.35-0.44 0.67
refractive index, »D, 20°C 1.4406 1.4349 1.4291 1.4565 1.4330 1.4352 1.4470
heat of polymerization, 57.7 58.1 67.8 63 ±4 63 ± 1 66.9
kJ / molC flash point, °C 83 83 82 85 93 130
Alkyl cyanoacrylates or alkyl 2-cyano-2-propenoates.
To convert kPa to mm Hg multiply by 7.5.
To convert kJ to kcal divide by 4.184.
The base monomers are too thin for convenient use and therefore are generally formulated with stabilizers, thickeners, and property-modifying
additives. The viscosities of such formulated adhesives can range from that of the base monomer (for wicking grades) to thixotropic gels with viscosities of
20,000 to 50,000 mPa-s (=cP) for larger gaps. The liquid products are characterized by sharp, lacrimatory, faindy sweet odors, except for several recent
variants. The substitution of an alkoxyalkyl ester side chain for the normal alkyl group renders these products nearly odor free as well as slightly less
effective as adhesives.
The outstanding characteristic of the 2-cyanoacrylic esters is their high reactivity. The liquid monomers and adhesives will polymerize nearly
instantaneously via an anionic mechanism when brought into contact with any weakly basic surface. Even the presence of a weakly basic substance such as
adsorbed surface moisture is adequate to initiate the curing reaction. The adhesives cure very rapidly and are potentially hazardous skin bonders because of
the presence of moisture and protein in the skin. The adhesive bonding process is accomplished by placing a small drop or bead on one surface and quickly
bringing the mating part in contact with light pressure and holding it in place for a period of several seconds to several minutes. The rapid polymerization
will cause rapid fixturing and adhering of the mating parts. As one might expect, conditions of low humidity and/or acidic groups on the surface can slow
or inhibit the cure reaction.
Polymerization
The basic polymerization reaction is described by the following equations.
Kirk-Othmer Encyclopedia of Chemical Technology (4th Edition)
176
2-CYANOACRYLIC ESTER POLYMERS
Vol 1
Initiation
CN
H2C=c(
COOR
CN
--- B—CH2—c(
COOR
Propagation
CN
B—CH2—C^
COOR
ZCN
+ n CH2 =c(
COOR
CN CN
--► B—CH2—CHCH2—Cfrr
COOR COOR
Termination
ZCN CN ZCN ।
B—CH2—CH-CH2—CX, + H+ B—CH2—(CH2—С-)тгН
COOR COOR XCOOR ,1 _
The reaction proceeds until all available monomer has reacted or until it is terminated by an acidic species. The gel point in these in situ
polymerizations, as represented by the time of fixture, occurs within several seconds on strongly catalytic surfaces such as thermoset rubbers to several
minutes on noncatalytic surfaces.
When the surface conditions are acidic or the ambient humidity is low enough to affect the cure significandy, a surface accelerator may be used to
promote the reaction. Available from most manufacturers, these basic solutions may be dip, wipe, or spray applied. Recendy, new additive chemistry has
been developed that accelerates the cure under adverse conditions without the need for a separate accelerator.
The bulk physical properties of the polymers of the 2-cyanoacrylic esters appear in Table 2. All of these polymers are soluble in
A-methylpyrrolidinone, A A-diniethylfomiamide, and nitromethane. The adhesive bonding properties of typical formulated adhesives are listed in Table 3.
Table 2. Cured Bulk Properties of Common 2-Cyanoacrylic Esters
Property Monomer type
Methyl Ethyl Isopropyl Allyl Butyl Isobutyl Methoxyethyl Ethoxyethyl
softening point, °C (Vicat) 165 126 154 78 165 197 52
melting point, °C 205 179 192 165 103
refractive index, »D, 20°C 1.45 1.45 1.45 1.26 1.4 1.48
dielectric constant at 1 MHz 3.34 3.908 3.8 3.3 5.4
dissipation facto/ at 1 MHz 2.04 0.02
volume resistivity, MQ-mm 3 x 10¹⁵ 9 x 10¹² 7 x 10¹⁴ 5.37 x 10°
tensile strength , steel—steel, 31 27.6 20.7 20.4 24.5 30.3
MPaC
elongation, % <2 <2 <2 10 <2
flexural modulus , MPa 3400 2069 1752
hardness (Rockwell) M 65 M 58 R18
aASTMD150.
b ASTM D638.
To convert MPa to psi multiply by 145.
dASTMD790.
Table 3. Adhesive Bond Properties of 2-Cyanoacrylic Esters with Metals and Various Polymeric Materials
Ester type
Methyl Ethyf Butyl Isobutyl Methoxyethyl Ethoxyethyl
set time, s
steel 20 10 30 20 15 5
aluminum 3 10 5 20 15 5
nitrile rubber 5 3 5 5 5 3
neoprene rubber 5 3 5 5 5 3
ABS 20 10 20 20 5 3
polystyrene 20 10 20 20
polycarbonate 20 10 20 20 60 20
PMMA 10 5 10 15
PVC 5 3 2 5 10
nylon 30 15 30 10
phenolic resin 5 3 30 5 25 5
bond strength, kPa
steel 206 172 151 96 206 165
aluminum 186 158 151 96 138 117
ABS 48 48 96 48 48 48
polystyrene 34 34 83 34 34
polycarbonate 69 69 90 69 41
PMMA 48 48 62 41 48
PVC 96 96 62 83 55 69
Kirk-Othmer Encyclopedia of Chemical Technology (4th Edition)
177
2-CYANOACRYLIC ESTER POLYMERS
Voll
nylon 76 76 phenolic resin 69 76 62 34 41 90 62 62 55
Set times for allyl esters are similar to those for ethyl esters, as are bond strengths to steel, aluminum, ABS, PS, and PC.
b According to ASTM D1002.
To convert kPa to psi multiply by 0.145.
The cured polymers are hard, clear, and glassy thermoplastic resins with high tensile strengths. The polymers, because of their highly polar structure,
exhibit excellent adhesion to a wide variety of substrate combinations. They tend to be somewhat britde and have only low to moderate impact and peel
strengths. The addition of fillers such as poly (methyl methacrylate) (PMMA) reduces the britdeness somewhat. Newer formulations are now available that
contain dissolved elastomeric materials of various types. These rubber-modified products have been found to offer adhesive bonds of considerably
improved toughness (3,4).
The structure—property relationships for the lower cyanoacrylic ester polymers generally indicate that cure rates, tensile strength, tensile shear
strengths, and hardness vary inversely with increasing ester chain length and that glass-transition temperatures (Ip and adhesive bond service temperatures
decrease with increasing ester chain lengths.
Several special-property cyanoacrylic esters that offer variations on the general theme are also available. Allyl esters give bond properties similar to
the ethyl or isopropyl esters, but are reported to cross-link by a free-radical mechanism through the allyl group, providing increased thermal resistance. This
reaction is very sluggish and requires long exposures at high temperatures to proceed. The alkoxyalkyl esters, several of which are now commercially
available, are practically odorless because of the inclusion of an alkoxy group on the ester side chain. These modifications also impart slightly reduced
adhesive performance.
Manufacture and Processing
The cyanoacrylic esters are prepared via the Knoevenagel condensation reaction (5), in which the corresponding alkyl cyanoacetate reacts with
formaldehyde in the presence of a basic catalyst to form a low molecular weight polymer. The polymer slurry is acidified and the water is removed.
Subsequendy, the polymer is cracked and redistilled at a high temperature onto a suitable stabilizer combination to prevent premature repolymerization.
Strong protonic or Lewis acids are normally used in combination with small amounts of a free-radical stabilizer.
The above batch process has undergone numerous refinements to improve yields, processing characteristics, purity, and storage stability, but it
remains the standard method of manufacture for these products. Recently a continuous process has been reported by Bayer AG (6) wherein the
condensation is carried out in an extruder. The by-products are removed in a degassing zone, and the molten polymer, mixed with stabilizers, is
subsequently cracked to yield raw monomer.
Adhesives formulated from the 2-cyanoacrylic esters typically contain stabilizers and thickeners, and may also contain tougheners, colorants, and
other special property-enhancing additives. Both anionic and free-radical stabilizers are required, since the monomer will polymerize via both mechanisms.
The anionic stabilizers that have been reported include acidic gases such as NO, SO2, SO3, BF3, and HF (7—9). Strong protonic acids such as the aliphatic
and aromatic sulfonic acids (10), and even strong mineral acids, have been used at low concentrations. Combinations of nonvolatile strong acids with
gaseous stabilizers (11) have demonstrated synergistic improvements.
Although the anionic polymerization mechanism is the predominant one for the cyanoacrylic esters, the monomer will polymerize free-radically
under prolonged exposure to heat or light. To extend the usable shelflife, free-radical stabilizers such as quinones or hindered phenols are a necessary part
of the adhesive formulation.
Economic Aspects
Production of the 2-cyanoacrylic ester adhesives on a worldwide basis is estimated to be approximately 2400 metric tons. This amounts to only 0.02% of
the total volume of adhesives produced but about 3% of the dollar volume.
Because of the high costs of raw materials and the relatively complex synthesis, the 2-cyanoacrylic esters are moderately expensive materials when
considered in bulk quantities. Depending on the quantity and the specific ester or formulation involved, the prices for cyanoacrylic ester adhesives can
range from approximately $30/kg to over $1000/kg. For these reasons, as well as several technical factors related to handling and performance,
cyanoacrylic ester adhesives are best suited to small bonding applications, very often where single drops or small beads are adequate for bonding. In such
cases the cost of the adhesive becomes inconsequential compared to the value of the service it performs, and these adhesives become very economical to
use.
Specifications and Standards
A wide variety of adhesives based on the cyanoacrylic esters are now available worldwide. Product distinctions are based on ester type and specific
performance attributable to that ester, formulation, viscosity, and cure speed. A number of special performance grades have appeared that maximize
performance in specific areas, sometimes quite significandy. Adhesive grades are now available with improved thermal resistance; improved peel strengths,
impact resistance, and toughness; and low odor, low blooming characteristics. New formulations contain cure additives that reduce the sensitivity of cure
to acidic surfaces and low atmospheric humidity. More recendy, surface primers have been introduced that have dramatically improved bond strengths to
traditionally hard-to-bond surfaces such as polyolefins and other low energy polymers.
The adhesives are routinely tested for specific performance and compliance to many user specifications with different requirements. Government
purchases are covered in the Mil Standard A-46050C (12).
Analytical and Test Methods
The routine compositional and functional testing done on the adhesives includes gas chromatographic testing for purity, potentiometric titrations for acid
stabilizer concentrations, accelerated thermal stability tests for shelflife, fixture time cure speed tests, and assorted ASTM tests for tensile shear strengths,
peel and impact strengths, and hot strengths.
Health and Safety Factors
The 2-cyanoacrylic esters have sharp, pungent odors and are lacrimators, even at very low concentrations. These esters can be irritating to the nose and
throat at concentrations as low as 3 ppm; eye irritation is observed at levels of 5 ppm (13). The TLV for methyl 2-cyanoacrylate is 2 ppm and the
short-term exposure limit is 4 ppm (14). Good ventilation when using the adhesives is essential.
Eye and skin contact should be avoided because of the adhesive's rapid tissue-bonding capabilities. In case of eye or skin contact, the affected area
should be flushed with copious amounts of water. Especially with eye contact, the bonded area should not be forced apart, since this will produce more
damage than the initial bonding. Medical attention is recommended. Soaking in warm water will gradually weaken and release the bond. Contact through
clothing may produce a rapid exotherm and the clothing involved should be flooded with water. Efforts to pull the involved clothing away may result in
skin damage.
The cured 2-cyanoacrylic ester polymers are relatively nontoxic. Oral doses of 6400 mg/kg failed to kill laboratory rats. Mild skin irritation was
observed with guinea pigs, but there was no evidence of sensitization or absorption through the skin (15).
Kirk-Othmer Encyclopedia of Chemical Technology (4th Edition)
178
2-CYANOACRYLIC ESTER POLYMERS
Voll
Both the Equid and cured 2-cyanoacrylic esters support combustion. These adhesives should not be used near sparks, heat, or open flame, or in
areas of acute fire hazard. Highly exothermic polymerization can occur from direct addition of catalytic substances such as water, alcohols, and bases such
as amines, ammonia, or caustics, or from contamination with any of the available surface activator solutions.
Uses
The combination of fast room-temperature cure and excellent adhesion to numerous substrates makes the adhesives of the 2-cyanoacrylic esters a natural
choice in the assembly of small close-fitting parts in a number of diverse market areas. Some of the market segments served by these versatile materials
include automotive, electronic, sporting goods, toys, hardware, morticians, law enforcement, cosmetics, jewelry, and medical devices. Although they are not
approved for use in the United States, their strong tissue bonding characteristics have led to their use as chemical sutures and hemostatic agents in other
countries around the world.
The diverse nature of the cyanoacrylate adhesives applications illustrates vividly that there is no truly typical application. The number of applications
in which these adhesives are used is being expanded daily as technological improvements continue to broaden their capabilities.
Examples of some of the current uses for these adhesives include retention of automotive gaskets, weather stripping, side trim, and wiring
harnesses; athletic shoes; swim masks; shotgun recoil pads; arrow feathers; dolls and doll furniture; circuit board component mounting and wire tacking;
and lipstick tube and compact mirrors. Medical devices include balloon catheters and tubing sets; the adhesives are used by morticians to seal eyes and lips.
Law enforcement agencies make use of the volatility and reactivity of the vapors to develop fingerprints not retrievable with conventional methods.
The new technical developments have made possible quick bonding to woods, papers, and porous surfaces. Polyolefins, which comprise
approximately 50% of the U.S. thermoplastic production, are now bondable with the cyanoacrylic ester adhesives. These new capabilities are sure to
provide for continued market growth in the years ahead.
BIBLIOGRAPHY
"Acrylic Ester Polymers, 2-Cyano acrylic Ester Polymers" in ECT 3rd ed., Vol. 1, pp. 408—413, by H. W. Coover, Jr., and J. M. McIntire, Tennessee
Eastman Company.
1. U.S. Pat. 2,467,926 (Apr. 19,1949), A. E. Ardis (to BF Goodrich Co.).
2. U.S. Pat. 2,467,927 (Apr. 19,1949), A. E. Ardis (to BF Goodrich Co.).
3. U.S. Pat. 4,012,945 (July 23,1978), E. R. Gleave (to Loctite Corp.).
4. U.S. Pat. 4,440,910 (Apr. 3,1984), J. T. O’Connor (to Loctite Corp.).
5. U.S. Pat. 2,721,858 (Oct. 25, 1955), F. Joyner and G. Hawkins (to Eastman Kodak).
6. Ger. Pat. 3,320,796 (Dec. 13,1984), H. Waniczek and H. Bard (to Bayer AG).
7. U.S. Pat. 2,794,788 (June 4, 1957), H. W. Coover, Jr., andN. H. Shearer (to Eastman Kodak Co.).
8. U.S. Pat. 2,796,251 (July 24, 1956), F. B. Joyner and N. H. Shearer (to Eastman Kodak).
9. U.S. Pat. 3,557,185 (Jan. 19,1971), K. Ito and K. Kondo (to Toa Gosei).
10. U.S. Pat. 3,652,635 (Mar. 28, 1972), S. Kawamura and co-workers (to Toa Gosei).
11. Brit. Pat. GB 2,107,328B (Apr. 27, 1983), L. Lizardi, B. Malofsky, J. C. Liu, and C. Mariotti (to Loctite Corp.).
12. Adhesives, Cyanoacrylate, Rapid Room Temperature Curing, Solventless, Army Materials and Mechanics Research Center, Watertown, Mass.
13. W. A. McGee, F. A. Oglesby, R. L. Raleigh, and W. D. Fassett, Ind. Hyg. Assoc. J. 29, 558—561 (1968).
14. Threshold Eimit Values for Chemical Substances in Work Room Air, American Conference of Government Industrial Hygienists, Cincinnati, Ohio, 1975.
15. W. Thomsen, in G. Schneberger, Adhesives in Manufacturing Marcel Dekker, Inc., New York, 1983, p. 305.
J. T. O’Connor
Loctite Corporation
Kirk-Othmer Encyclopedia of Chemical Technology (4th Edition)
179
ACRYLONITRILE
Voll
ACRYLIC FIBERS.
See Fibers, acrylic.
ACRYLONITRILE
Prior to 1960, acrylonitrile [107-13-1] (also called acrylic acid nitrile, propylene nitrile, vinyl cyanide, propenoic acid nitrile) was produced commercially by
processes based on either ethylene oxide and hydrogen cyanide or acetylene and hydrogen cyanide. The growth in demand for acrylic fibers, starting with
the introduction of Odon by Du Pont around 1950, spurred efforts to develop improved process technology for acrylonitrile manufacture to meet the
growing market (see Fibers, acrylic). This resulted in the discovery in the late 1950s by Sohio (1) and also by Distillers (2) of a heterogeneous vapor-phase
catalytic process for acrylonitrile by selective oxidation of propylene and ammonia, commonly referred to as the propylene ammoxidation process.
Commercial introduction of this lower cost process by Sohio in 1960 resulted in the eventual displacement of all other acrylonitrile manufacturing
processes. Today over 90% of the approximately 4,000,000 metric tons produced woddwide each year use the Sohio-developed ammoxidation process.
Acrylonitrile is among the top 50 chemicals produced in the United States as a result of the tremendous growth in its use as a starting material for a wide
range of chemical and polymer products. Acrylic fibers remain the largest use of acrylonitrile; other significant uses are in resins and nitrile elastomers and
as an intermediate in the production of adiponitrile and acrylamide.
Physical Properties
Acrylonitrile (C3H3N, mol wt = 53.064) is an unsaturated molecule having a carbon—carbon double bond conjugated with a nitrile group. It is a polar
molecule because of the presence of the nitrogen heteroatom. There is a partial shift in the bonding electrons toward the more electronegative nitrogen
atom, as represented by the following heterovalent resonance structures.
CH2=CH—C=N: CH2=CH—C=N: CH2—CH=C=N:
Tables 1 and 2 list some physical properties and thermodynamic information, respectively, for acrylonitrile (3—5).
Table 1. Physical Properties of Acrylonitrile
Property Value
appearance/odor clear, colorless liquid with faindy pungent
odor
boiling point, °C 77.3
freezing point, °C -83.5
density, 20°C, g/cm3 0.806
volatility, 78°C, % >99
vapor pressure, 20°C, kPa 11.5
vapor density (air = 1) 1.8
solubility in water, 20°C, wt% 7.3
pH (5% aqueous solution) 6.0-7.5
critical values
temperature, °C 246
b pressure, MPa 3.54
volume, cm3 /g 3.798
refractive index, #25D 1.3888
dielectric constant, 33.5 MHz 38
ionization potential, eV 10.75
molar refractivity (D line) 15.67
surface tension, 25°C, mN/m (=dyn cm) 26.6
dipole moment, C-m
Equid 1.171 x 10⁻²⁹
vapor 1.294 x 10⁻²⁹
viscosity, 25°C, mPa-s (=cP) 0.34
To convert kPa to mm Hg multiply by 7.5
To convert MPa to psi multiply by 145.
C To convert C-m to debye, divide by 3.336 x 10“30
Table 2. Thermodynamic Data*
Property_____________________
flash point, °C
autoignition temperature, °C
Value
“0
481
Kirk-Othmer Encyclopedia of Chemical Technology (4th Edition)
180
ACRYLONITRILE
Voll
flammability limits in air, 25°C, vol %
lower
upper
free energy of formation, 25°C, kJ /mol
enthalpy of formation, 25°C, kJ/mol
AH°g
AH0!
heat of combustion, liquid, 25°C, kJ /mol
heat of vaporization, 25°C, kJ/mol
molar heat capacity, kJ/(kg-K)
Equid
gas at 50°C, 101.3 kPab
molar heat of fusion, kJ /mol
entropy, S, gas at 25°C, 101.3 kPab, kJ/(mol-K)
To convert kJ to kcal divide by 4.184.
b 101.3 kPa = 1 atm.
3.0
17.0
195
185
150
1761.5
32.65
2.09
1.204
6.61
274
Acrylonitrile is miscible in a wide range of organic solvents, including acetone, benzene, carbon tetrachloride, diethyl ether, ethyl acetate, ethylene
cyanohydrin, petroleum ether, toluene, some kerosenes, and methanol. Compositions of some common azeotropes of acrylonitrile are given in Table 3.
Table 4 presents the soluliilily of acrylonitrile in water as a function of temperature (6). Vapor—liquid equilibria for acrylonitrile in combination with
acetonitrile, acrolein, HCN, and water have been published (6—9). Table 5 gives the vapor pressure of acrylonitrile over aqueous solutions.
Table 3. Azeotropes of Acrylonitrile
Azeotrope Boiling point, °C Acrylonitrile concentration, wt %
tetrachloro silane 51.2 89
water 71.0 88
isopropyl alcohol 71.6 56
benzene 73.3 47
methanol 61.4 39
carbon tetrachloride 66.2 21
chlorotrimethylsilane 57.0 7
Table 4. Solubilities of Acrylonitrile in Water
Temperature, °C Acrylonitrile in water, wt % Water in acrylonitrile, wt %
-MJ 0.4
-30 1.0
0 7.1 2.1
10 7.2 2.6
20 7.3 3.1
30 7.5 3.9
40 7.9 4.8
50 8.4 6.3
60 9.1 7.7
70 9.9 9.2
80 11.1 10.9
Table 5. Acrylonitrile Vapor Pressure over Aqueous Solutions at 25°C
Acrylonitrile, wt %
i
2
3
4
5
6
7
To convert kPa to mm Hg multiply by 7.5.
Vapor pressure, kPa
1.3
2.9
5.3
6.9
8.4
10.0
10.9
Acrylonitrile has been characterized using infrared, Raman, and ultraviolet spectroscopies, electron diffraction, and mass spectroscopy (10—18).
Chemical Properties
Acrylonitrile undergoes a wide range of reactions at its two chemically active sites, the nitrile group and the carbon—carbon double bond. Detailed
descriptions of specific reactions have been given (19,20). Acrylonitrile polymerizes readily in the absence of a hydroquinone inhibitor, especially when
exposed to light. Polymerization is initiated by free radicals, redox catalysts, or bases and can be carried out in the liquid, solid, or gas phase.
Homopolymers and copolymers are most easily produced using liquid-phase polymerization (see Acrylonitrile polymers). Acrylonitrile undergoes the
reactions typical of nitriles, including hydration with sulfuric acid to form acrylamide sulfate (C3H5NO-H2SO4 [15497-99-1])> which can be converted to
acrylamide (C3H5NO [79-06-1]) by neutralization with a base; and complete hydrolysis to give acrylic acid (C3H4O2 [79-10-7]). Acrylamide (qv) is also
Kirk-Othmer Encyclopedia of Chemical Technology (4th Edition)
181
ACRYLONITRILE
Voll
formed directly from acrylonitrile by partial hydrolysis using copper-based catalysts (21—24); this has become the preferred commercial route for acrylamide
production. Industrially important acryEc esters can be formed by reaction of acrylamide sulfate with organic alcohols. Methyl acrylate (C4H6O2 [96-33-3])
has been produced commercially by the alcoholysis of acrylamide sulfate with methanol. Reactions at the activated double bond of acrylonitrile include
Diels-Alder addition to dienes, forming cycEc products; hydrogenation over metal catalysts to give propionitrile (C3H5N [107-12-0]) and propylamine
(C3H9N [107-10-8])-, and the industrially important hydrodimerization to produce adiponitrile (C6H8N2 [111-69-3]) (25—27). Other reactions include
addition of halogens across the double bond to produce dihalopropionitriles, and cyanoethylation by acrylonitrile of alcohols, aldehydes, esters, amides,
nitriles, amines, sulfides, sulfones, and halides.
Manufacturing and Processing
Acrylonitrile is produced in commercial quantities almost exclusively by the vapor-phase catalytic propylene ammoxidation process developed by Sohio
(28).
C3H6+NH3 + 3/2 02 ----------.catalyst C3H3N + 3H2O
A schematic diagram of the commercial process is shown in Figure 1. The commercial process uses a fluid-bed reactor in which propylene, ammonia, and
air contact a soEd catalyst at 400—510°C and 49—196 kPa (0.5—2.0 kg/cm2) gauge. It is a single-pass process with about 98% conversion of propylene, and
uses about 1.1 kg propylene per kg of acrylonitrile produced. Useful by-products from the process are HCN (about 0.1 kg per kg of acrylonitrile), which is
used primarily in the manufacture of methyl methacrylate, and acetonitrile (about 0.03 kg per kg of acrylonitrile), a common industrial solvent. In the
commercial operation the hot reactor effluent is quenched with water in a countercurrent absorber and any unreacted ammonia is neutralized with sulfuric
acid. The resulting ammonium sulfate can be recovered and used as a fertilizer. The absorber off-gas containing primarily N2, CO, CO2, and unreacted
hydrocarbon is either vented direcdy or first passed through an incinerator to combust the hydrocarbons and CO. The acrylonitrile-containing solution
from the absorber is passed to a recovery column that produces a crude acrylonitrile stream overhead that also contains HCN. The column bottoms are
passed to a second recovery column to remove water and produce a crude acetonitrile mixture. The crude acetonitrile is either incinerated or further treated
to produce solvent quaEty acetonitrile. AcryEc fiber quaEty (99.2% minimum) acrylonitrile is obtained by fractionation of the crude acrylonitrile mixture to
remove HCN, water, light ends, and high boiling impurities. Disposal of the process impurities has become an increasingly important aspect of the overall
process, with significant attention being given to developing cost-effective and environmentally acceptable methods for treatment of the process waste
streams. Current methods include deep-well disposal, wet air oxidation, ammonium sulfate separation, biological treatment, and incineration (29).
Acrylonitrile
Fluid - bed recovery
reactor Absorber column
Acetonitrile
recovery
column
Lights
column
Product
column
Crude acrylonitrile
Crude
HCN
A acetonitrile V a.
Hill
Off-gas
Crude
acetonitrile
H2O
Product
acrylonitrile
Heavy impurities
Fig. 1. Process flow diagram of the commercial propylene ammoxidation process for acrylonitrile. BFIV, boiler feed water.
Although acrylonitrile manufacture from propylene and ammonia was first patented in 1949 (30), it was not until 1959, when Sohio developed a
catalyst capable of producing acrylonitrile with high selectivity, that commercial manufacture from propylene became economically viable (1). Production
improvements over the past 30 years have stemmed largely from development of several generations of increasingly more efficient catalysts. These catalysts
are multicomponent mixed metal oxides mosdy based on bismuth—molybdenum oxide. Other types of catalysts that have been used commercially are
based on iron—antimony oxide, uranium—antimony oxide, and tellurium—molybdenum oxide.
Fundamental understanding of these complex catalysts and the surface-reaction mechanism of propylene ammoxidation has advanced substantially
since the first commercial plant began operation. Mechanisms for selective ammoxidation of propylene over bismuth molybdate and antimonate catalysts
are shown in Figures 2 and 3. The rate-determining step is abstraction of an CC-hydrogen of propylene by an oxygen in the catalyst to form a 7t-allyl
complex on the surface (31—33). Lattice oxygens from the catalyst participate in further hydrogen abstraction, followed by oxygen insertion to produce
acrolein in the absence of ammonia, or nitrogen insertion to form acrylonitrile when ammonia is present (34—36). The oxygens removed from the catalyst
in these steps are replenished by gas-phase oxygen, which is incorporated into the catalyst structure at a surface site separate from the site of propylene
reaction. In the ammoxidation reaction, ammonia is activated by an exchange with O2- ions to form isoelectronic NH2’ moieties according to the
following:
NH3 + O~ \ 11 - + H2O
These are the species inserted into the allyl intermediate to produce acrylonitrile.
Kirk-Othmer Encyclopedia of Chemical Technology (4th Edition)
182
ACRYLONITRILE
Voll
Fig. 2. Mechanism of selective ammoxidation and oxidation of propylene over bismuth molybdate catalysts. (31).
Fig. 3. Mechanism of selective ammoxidation and oxidation of propylene over antimonate catalysts (31).
The active site on the surface of selective propylene ammoxidation catalyst contains three critical functionalities associated with the specific metal
components of the catalyst (37—39): an CC-H abstraction component such as Bi3+, Sb3+, or Te4+; an olefin chemisorption and oxygen or nitrogen insertion
component such as Mo6+ or Sb5+; and a redox couple such as Fe2+/Fe3+ or Ce3+/Ce4+ to enhance transfer of lattice oxygen between the bulk and surface
of the catalyst. The surface and solid-state mechanisms of propylene ammoxidation catalysis have been determined using Raman spectroscopy (40,41),
neutron diffraction (42—44), x-ray absorption spectroscopy (45,46), x-ray diffraction (47—49), pulse kinetic studies (36), and probe molecule investigations
(50).
Obsolete Acrylonitrile Processes
Processes rendered obsolete by the propylene ammoxidation process (51) include the ethylene cyanohydrin process (52—54) practiced commercially by
American Cyanamid and Union Carbide in the United States and by I. G. Farben in Germany. The process involved the production of ethylene
cyanohydrin by the base-catalyzed addition of HCN to ethylene oxide in the liquid phase at about 60°C. A typical base catalyst used in this step was
diethylamine. This was followed by liquid-phase or vapor-phase dehydration of the cyanohydrin. The liquid-phase dehydration was performed at about
200°C using alkali metal or alkaline earth metal salts of organic acids, primarily formates and magnesium carbonate. Vapor-phase dehydration was
accomplished over alumina at about 250°C.
C2H4O + HCN -----------------> catalyst HOC2H4CN -----------------C3H3N
A second commercial route to acrylonitrile used by Du Pont, American Cyanamid, and Monsanto was the catalytic addition of HCN to acetylene
Kirk-Othmer Encyclopedia of Chemical Technology (4th Edition)
183
ACRYLONITRILE
Voll
(55).
C2H2+HCN ----------.catalyst C3H3N
The reaction occurs bypassing HCN and a 10:1 excess of acetylene into dilute hydrochloric acid at 80°C in the presence of cuprous chloride as the
catalyst.
These processes use expensive C2 hydrocarbons as feedstocks and thus have higher overall acrylonitrile production costs compared to the
propylene-based process technology. The last commercial plants using these process technologies were shut down by 1970.
Other routes to acrylonitrile, none of which achieved large-scale commercial application, are acetaldehyde and HCN (56), propionitrile
dehydrogenation (57,58), and propylene and nitric oxide (59,60):
CH3CHO + HCN CH3CH(OH)CN -----------------. C3H3N
CH3CH2CN C3H3N + H2
4 C3H6 + 6 NO 4 C3H3N + 6 H2O + N2
Numerous patents have been issued disclosing catalysts and process schemes for manufacture of acrylonitrile from propane. These include the
direct heterogeneously catalyzed ammoxidation of propane to acrylonitrile using mixed metal oxide catalysts (61—64).
C3Hs+NH3 + 2O2 ---------------.catalyst C3H3N + 4H2O
A two-step process involving conventional nonoxidative dehydrogenation of propane to propylene in the presence of steam, followed by the
catalytic ammoxidation to acrylonitrile of the propylene in the effluent stream without separation, is also disclosed (65).
C3HS ------c3H6 + H2 -^%Нз°2 C3H3N + 3H2O + H2
Because of the large price differential between propane and propylene, which has ranged from $155/t to $355 /1 between 1987 and 1989, a
propane-based process may have the economic potential to displace propylene ammoxidation technology eventually. Methane, ethane, and butane, which
are also less expensive than propylene, and acetonitrile have been disclosed as starting materials for acrylonitrile synthesis in several catalytic process
schemes (66,67).
Economic Aspects
The propylene-based process developed by Sohio was able to displace all other commercial production technologies because of its substantial advantage in
overall production costs, primarily due to lower raw material costs. Raw material costs less by-product credits account for about 60% of the total
acrylonitrile production cost for a world-scale plant. The process has remained economically advantaged over other process technologies since the first
commercial plant in 1960 because of the higher acrylonitrile yields resulting from the introduction of improved commercial catalysts. Reported per-pass
conversions of propylene to acrylonitrile have increased from about 65% to over 80% (28,68—70).
More than half of the worldwide acrylonitrile production is situated in Western Europe and the United States (Table 6). In the United States,
production is dominated by BP Chemicals, with more than a third of the domestic capacity (Table 7). Nearly one-half of the U.S. production was exported
in 1988 (Table 8), with most going to Japan and the Far East. The export market has been an increasingly important oudet for U.S. acrylonitrile producers,
with the percentage of U.S. production exported growing from around 10% in the mid-1970s to 53% in 1987 and 43% in 1988. Japanese and Far East
producers have not been able to satisfy the increasing domestic demand in recent years because of higher propylene costs relative to the United States. This
makes it more economical to import acrylonitrile from the United States than to install new domestic production. Table 9 provides a breakdown of
worldwide demand between 1976 and 1988. Growth in demand has averaged about 3.6% per year between 1984 and 1988. Projections are for a 3% per
year growth rate through 1993 (72).
Table 6. Worldwide Acrylonitrile Production in 1988*
Region Production, 103 t
Western Europe United States Japan Far East Mexico 1,200 1,170 600 200 60
aRef. 71.
Table 7. U.S. Acrylonitrile Producers*
Company Approximate capacity , 103 t/y
BP Chemicals Monsanto Chemical Company Sterling Chemical Company E. I. du Pont de Nemours & Co., Inc. American Cyanamid Company 430 220 220 175 160
aRef. 72.
b As of March 6, 1989.
Table 8. U.S. Acrylonitrile Exports*, 103 t
Destination 1988 1987
Far East/Asia Japan Western Europe 176 189 92 186 109 86
Kirk-Othmer Encyclopedia of Chemical Technology (4th Edition)
184
ACRYLONITRILE
Voll
Mexico / Canada
South America
Middle East/Africa
total export_______
aRef. 73.
71
34
28
510
60
48
41
610
Table 9. Worldwide Acrylonitrile Demand, 103 t/yr
Region 1988 1985 1980 1976
Western Europe 1,200 1,140 880 880
Japan 680 635 510 570
United States 660 640 660 590
Far East 560 385 270 200
Mexico/South America 250 200 130 81
total 3,350 3,000 2,450 2,321
Analysis, Testing, Standards, and Quality Control
Standard test methods for chemical analysis have been developed and published (74). Included is the determination of commonly found chemicals
associated with acrylonitrile and physical properties of acrylonitrile that are critical to the quality of the product (75—77). These include determination of
color and chemical analyses for HCN, quinone inhibitor, and water. Specifications appear in Table 10.
Table 10. Commercial Specifications for Acrylonitrile
Parameter
acetone, ppm, max
acetonitrile, ppm, max
aldehydes, ppm, max
color, APHA, max
distillation range, °C, min, ibp
°C, max, 97%
HCN, ppm, max
inhibitor, hydroquinone monomethyl ether, ppm
iron, ppm, max
nonvolatile matter, ppm, max
peroxides, ppm, max
pH, 5% aqueous
refractive index, #25D
water, wt %, max
purity, wt %, min
Specification______
300
500
100
15
74.5
78.5
10
35-50
0.10
100
0.5
6.0-7.5
1.3882-1.3892
0.50
99.0
Storage and Transport
Acrylonitrile must be stored in tighdy closed containers in cool, dry, well-ventilated areas away from heat, sources of ignition, and incompatible chemicals.
Storage vessels, such as steel drums, must be protected against physical damage, with outside detached storage preferred. Storage tanks and equipment
used for transferring acrylonitrile should be electrically grounded to reduce the possibility of static spark-initiated fire or explosion.
Acrylonitrile is transported by rail car, barge, and pipeline. Department of Transportation (DOT) regulations require labeling acrylonitrile as a
flammable liquid and poison. Transport is regulated under DOT 49 CFR 172.101. Bill of lading description is: Acrylonitrile, Flammable Liquid, Poison B,
UN 1093 "RQ."
Health and Safety Factors
Acrylonitrile is highly toxic if ingested, with an acute LDL value for laboratory rats of 113 mg/kg (78,79). It is moderately toxic if inhaled
(rat LCL0 = 500 ppm/4 h) and it is extremely irritating and corrosive to skin and eyes. Ingestion may cause gastrointestinal disturbances and inhalation
may result in respiratory tract irritation. Symptoms of overexposure include irritation, nausea, vomiting, and diarrhea and may include headache, weakness,
shortness of breath, dizziness, collapse, loss of consciousness, respiratory arrest, and death. Acrylonitrile is readily absorbed through the skin, and contact
may result in inflammation, itching, reddening, and blistering. These symptoms may be delayed. First-aid treatment for inhalation or ingestion involves
inhalation of amyl nitrite and induced vomiting if the victim is conscious.
Acrylonitrile is categorized as a cancer hazard by OSHA. It has been determined to be carcinogenic to laboratory animals and mutagenic in both
mammahan and nonmammahan tests. Genetic transformations and damage have been reported in tissue cultures exposed to acrylonitrile. Animal tests
show that it is a reproductive toxicant only at maternally toxic doses. Permissible exposure limits for acrylonitrile in the United States are 2 ppm for an 8-h
time-weighted average concentration and 10 ppm as the ceiling concentration for a 15-min period.
Acrylonitrile will polymerize violendy in the absence of oxygen if initiated by heat, light, pressure, peroxide, or strong acids and bases. It is unstable
in the presence of bromine, ammonia, amines, and copper or copper alloys. Neat acrylonitrile is generally stabilized against polymerization with trace levels
of hydroquinone monomethyl ether and water.
Acrylonitrile is combustible and ignites readily, producing toxic combustion products such as hydrogen cyanide, nitrogen oxides, and carbon
monoxide. It forms explosive mixtures with air and must be handled in well-ventilated areas and kept away from any source of ignition, since the vapor can
spread to distant ignition sources and flash back.
Federal regulations (40 CFR 261) classify acrylonitrile as a hazardous waste and it is listed as Hazardous Waste Number U009. Disposal must be in
accordance with federal (40 CFR 262, 263, 264), state, and local regulations only at properly permitted facilities. It is listed as a toxic pollutant (40 CFR
122.21) and introduction into process streams, storm water, or waste water systems is in violation of federal law. Strict guidelines exist for clean-up and
notification of leaks and spills. Federal notification regulations require that spills or leaks in excess of 100 lb (45.5 kg) be reported to the National Response
Center. Substantial criminal and civil penalties can result from failure to report such discharges into the environment.
Kirk-Othmer Encyclopedia of Chemical Technology (4th Edition)
185
ACRYLONITRILE
Voll
Uses
Worldwide consumption of acrylonitrile increased 52% between 1976 and 1988, from 2.5 x 10⁶ to 3.8 x 10⁶ t/yr. The trend in consumption over this time
period is shown in Table 11 for the principal uses of acrylonitrile: acryEc fiber, acrylonitrile—butadiene—styrene (ABS) resins, adiponitrile, nitrile rubbers,
elastomers, and styrene—acrylonitrile resins (SAN). Since the 1960s acryEc fibers have remained the major oudet for acrylonitrile production in the United
States and especially in Japan and the Far East. AcryEc fibers always contain a comonomer. Fibers containing 85 wt % or more acrylonitrile are usually
referred to as acrylics whereas fibers containing 35 to 85 wt% acrylonitrile are termed modacryEcs (see Fibers, acrylic). AcryEc fibers are used primarily for
the manufacture of apparel, including sweaters, fleece wear, and sportswear, as well as for home furnishings, including carpets, upholstery, and draperies.
Demand is largely subject to trends in the fashion industry, with the popularity of bulky sweaters, fleece wear, and sportswear helping to increase U.S.
consumption to record levels in the 1980s. AcryEc fibers consume about 65% of the acrylonitrile produced worldwide, while in the United States acryEc
fiber consumes only about 45% of the acrylonitrile used domestically. Growth in demand for acryEc fibers in the 1990s is expected to be modest, between
2 and 3% per year, primarily from overseas markets. Domestic demand is expected to be flat.
Table 11. Worldwide Acrylonitrile Uses and Consumption, 103 t
Use 1988 1985 1980 1976
acryEc fibers 2,520 2,410 2,040 1,760
ABS resins 550 435 300 270
adiponitrile 310 235 160 90
other (including nitrile rubber, SAN resin, acrylamide, 460 390 240 420
and barrier resins)
Significant growth in acrylonitrile end use has come from ABS and SAN resins and adiponitrile (see Acrylonitrile polymers). ABS resins are second
to acryEc fibers as an oudet for acrylonitrile. These resins normally contain about 25% acrylonitrile and are characterized by their chemical resistance,
mechanical strength, and ease of manufacture. Consumption of ABS resins increased significandy in the 1980s with its growing appEcation as a specialty
performance polymer in construction, automotive, machine, and appEance appEcations. Opportunities still exist for ABS resins to continue to replace more
traditional materials for packaging, building, and automotive components. SAN resins typically contain between 25 and 30% acrylonitrile. Because of their
high clarity, they are used primarily as a substitute for glass in drinking cups and tumblers, automobile instrument panels, and instrument lenses. Together,
ABS and SAN resins account for about 20% of domestic acrylonitrile consumption. The largest increase among the end uses for acrylonitrile over the past
10 years has come from adiponitrile, which has grown to become the third largest oudet for acrylonitrile. It is used by Monsanto as a precursor for
hexamethylenediamine (HMDA, C6H16N2 [124-09-4]) and is made by a proprietary acrylonitrile electrohydrodimerization process (25). HMDA is used
exclusively for the manufacture of nylon-6,6. The growth of this acrylonitrile oudet in recent years stems largely from replacement of adipic acid (C6H1QO4
[124-04-9]) with acrylonitrile in HDMA production rather than from a significant increase in nylon-6,6 demand. A non-electrochemical catalytic route has
also been developed for acrylonitrile dimerization to adiponitrile (26,27,80,81). This technology, if it becomes commercial, can provide additional
replacement opportunity for acrylonitrile in nylon manufacture. The use of acrylonitrile for HMDA production should continue to grow at a faster rate
than the other oudets for acrylonitrile, but it will not approach the size of the acryEc fiber market for acrylonitrile consumption.
Acrylamide (qv) is produced commercially by heterogeneous copper-catalyzed hydration of acrylonitrile (21—24). Acrylamide is used primarily in the
form of a polymer, polyacrylamide, in the paper and pulp industry and in waste water treatment as a flocculant to separate soEd material from waste water
streams (see Acrylamide polymers). Other appEcations include mineral processing, coal processing, and enhanced oil recovery in which polyacrylamide
solutions were found effective for displacing oil from rock. The latter use peaked in the early 1980s, coinciding with the peak in world oil prices. However,
the decline in world oil prices since 1980 has limited appEcation of acrylamide for enhanced oil recovery to a few test oil fields in the United States. Any
future appEcations of polymer flooding for enhanced oil recovery will require an increase in oil prices to the levels experienced in the early 1980s. Other
growth markets for acrylamide, including use in binders, adhesives, and absorbents, will not replace lost demand for enhanced oil recovery appEcation.
Nitrile rubber finds broad appEcation in industry because of its excellent resistance to oil and chemicals, its good flexibiEty at low temperatures, high
abrasion and heat resistance (up to 120°C), and good mechanical properties. Nitrile rubber consists of butadiene—acrylonitrile copolymers with an
acrylonitrile content ranging from 15 to 45% (see Elastomers, synthetic, nitrile rubber). In addition to the traditional appEcations of nitrile rubber for
hoses, gaskets, seals, and oil well equipment, new appEcations have emerged with the development of nitrile rubber blends with poly(vinyl chloride) (PVC).
These blends combine the chemical resistance and low temperature flexibiEty characteristics of nitrile rubber with the stabiEty and ozone resistance of PVC.
This has greatly expanded the use of nitrile rubber in outdoor appEcations for hoses, belts, and cable jackets, where ozone resistance is necessary.
Other acrylonitrile copolymers have found specialty appEcations where good gas-barrier properties are required along with strength and high impact
resistance. Examples of these are BP Chemicals' Barex 210 acrylonitrile—methyl acrylate—butadiene copolymer and Monsanto's Lopac styrene-containing
nitrile copolymer. These barrier resins compete directly in the alcohoEc and other beverage bottle market with traditional glass and metal containers as well
as with poly(ethylene terephthalate) (PET) and PVC in the beverage bottle market (see Barrier polymers). Other appEcations include food, agricultural
chemicals, and medical packaging. Total acrylonitrile consumption for barrier resin appEcations is small, consuming less than about 1% of the total U.S.
acrylonitrile production. Projections of a significant growth in demand for nitrile barrier resins remain unfulfilled because of an FDA ban in 1977 on the
use of acrylonitrile-based copolymers in beverage bottles. Although the ban was lifted in 1982 and limits were set on acrylonitrile exposure in beverage and
food packaging appEcations, it is unlikely that acrylonitrile copolymers will penetrate the current plastic bottle market dominated by PET.
A growing specialty appEcation for acrylonitrile is in the manufacture of carbon fibers. They are produced by pyrolysis of oriented polyacrylonitrile
fibers and are used to reinforce composites (qv) for high performance appEcations in the aircraft, defense, and aerospace industries. These appEcations
include rocket engine nozzles, rocket nose cones, and structural components for aircraft and orbital vehicles where light weight and high strength are
needed. Other small specialty appEcations of acrylonitrile are in the production of fatty amines, ion-exchange resins, and fatty amine amides used in
cosmetics, adhesives, corrosion inhibitors, and water treatment resins. Examples of these specialty amines include 2-acrylamido-2-methylpropanesulfonic
acid (C?H13NSO4 [15214-89-8]), 3-methoxypropionitrile (C4H?NO [110-67-8]), and 3-methoxypropylamine (C4HnNO [5332-73-0]).
BIBLIOGRAPHY
"Acrylonitrile" in ECT 1st ed., Vol. 1, pp. 184—189, by H. S. Davis, American Cyanamid Company; in ECT 2nd ed., Vol. 1, pp. 338—351, by W. O. Fugate,
American Cyanamid Company; in ECT 3rd ed., Vol. 1, pp. 414—426, by Louis T. Groet, Badger, В. V.
1. U.S. Pat. 2,904,580 (Sept. 15, 1959), J. D. Idol (to The Standard Oil Co.).
2. Brit. Pat. 876,446 (Oct. 3, 1959) and U.S. Pat. 3,152,170 (Oct. 6, 1964), J. L. Barclay, J. B. Bream, D. J. Hadley, andD. G. Stewart (to Distillers
Company Ltd.).
3. M. A. Dalin, I. K. Kolchin, and B. R. Serebryakov, Acrylonitrile, Technomic, Westport, Conn., 1971, pp. 161—162.
4. R. M. Paterson, M. I. Bomstein, and E. Garshick, Assessment of Acrylonitrile as a Potential Air Pollution Problem, GCA-TR-75-32-G(6), GCA
Corporation, 1976.
5. IARC Monographs on the Evaluation of the Carcinogenic Risk of Chemicals to ELumans, International Agency for Research on Cancer, Vol. 19, Feb. 1979.
Kirk-Othmer Encyclopedia of Chemical Technology (4th Edition)
186
ACRYLONITRILE
Voll
6.
7.
8.
9.
10.
11.
12.
13.
14.
15.
16.
17.
18.
19.
20.
21.
22.
23.
24.
25.
26.
27.
28.
29.
30.
31.
32.
33.
34.
35.
36.
37.
38.
39.
40.
41.
42.
43.
44.
45.
46.
47.
48.
49.
50.
51.
52.
53.
54.
55.
56.
57.
58.
59.
60.
61.
62.
63.
64.
65.
66.
67.
68.
69.
70.
71.
72.
73.
74.
75.
76.
77.
Ref. 3, p. 166.
N. M. Sokolov, Rev. Chim. 20, 169 (1969).
N. M. Sokolov, Proc. Int. Symp. Distill. 3, 110 (1969).
N. M. Sokolov, N. N. Sevryugova, and N. M. Zliavoronkor, Theor. Osn. Khim. Tekhnol. 3, 449 (1969).
T. Fukuyama and K. Kuchitsu,/ MoZ Struct. 5, 131 (1970).
The Chemistry of Acrylonitrile, 1st ed., American Cyanamid Company, New York, 1951, pp. 14—15.
EPA/NIH Mass Spectral Data Base, Vol. 1, U.S. National Bureau of Standards, Washington, D.C., 1978, p. 5.
M. C. L. Gerry, K. Yamada, and G. Winnewisser,/ Phys. Chem. Ref. Data 8, 107 (1979).
S. Suzer and L. Andrews,/. Phys. Chem. 93, 2123 (1989).
A. R. H. Cole and A. A. Green,/. Mol. Spectrosc. 48, 246 (1973).
V. I. Khvostenko, I. I. Iiirlci, V. A. Mazunov, and R. S. Rafikov, Dokl. Akad. Nauk .Ш1\ 213, 1364 (1973).
J. A. Nuth and S. Glicker,/ Quant. Spectosc. Radial Trans. 28, 223 (1982).
G. Cazzoli and Z. Kisiel,/. Mol. Spectrosc. 130, 303 (1988).
Ref. 3, pp. 120-159.
Ref. 11, pp. 21-51.
U.S. Pats. 3,597,481 (Aug. 3,1971), 3,631,104 (Dec. 28,1971), Re. 31,430 (Oct. 25,1983), B. A. Tefertfller and С. E. Habermann (to The Dow
Chemical Company).
U.S. Pat. 4,048,226 (Sept. 13, 1977), W. A. Barber and J. A. Fetchin (to American Cyanamid Co.).
U.S. Pat. 4,086,275 (Apr. 25, 1978), K. Matsuda and W. A. Barber (to American Cyanamid Co.).
U.S. Pat. 4,178,310 (Dec. 11, 1979), J. A. Fetchin and К. H. Tsu (to American Cyanamid Co.).
U.S. Pat. 3,193,480 (July 6, 1965), M. M. Baizer, C. R. Campbell, R. H. Fariss, and R. Johnson (to Monsanto Chemical Co.).
U.S. Pat. 3,529,011 (Sept. 15, 1970), J. W. Badham (to Imperial Chemical Industries Australia Ltd.).
Eur. Pat. Appl. E.P. 314,383 (May 3, 1989), G. Shaw and J. Lopez-Merono (to Imperial Chemical Industries PLC).
J. L. Callahan, R. K. Grasselli, E. C. Milberger, and H. A. Strecker, Ind. Eng. Chem. Prod. Rc<. Dev. 9, 134 (1970).
Chem. Eng. News 67(2), 23 (1989).
U.S. Pat. 2,481,826 (Sept. 13,1949), J. N. Cosby (to Allied Chemical & Dye Corp.).
J. D. Burrington, С. T. Kartisek, and R. K. GrasseHi,/. Catal. 87, 363 (1984).
C. R. Adams and T. J. Jennings,/ Catal. 2, 63 (1963).
C. R. Adams and T. J. Jennings,/ Catal. 3, 549 (1964).
G. W. Keulks,/ Catal. 19, 232 (1970).
G. W. Keulks and L. D. Krenzke, Proceedings of the International Congress on Catalysis, 6th, 1976, The Chemical Society, London, 1977, p. 806; J. Catal.
61, 316 (1980).
J. F. Brazdil, D. D. Suresh, and R. K. Grasselli,/. Catal. 66, 347 (1980).
R. K. Grasselli, J. F. Brazdil, and J. D. Burrington, Proceedings of the International Congress on Catalysis, 8 th, 1984, Vedag Chemie, Weinheim, 1984, Vol.
V, p. 369.
R. K. Grasselli, AppliedCatal. 15, 127 (1985).
R. K. Grasselli, React. Kinel Catal. Eett. 35, 327 (1987).
J. F. Brazdil, L. C. Glaeser, and R. K. Grasselli,/. Catal. 81, 142 (1983).
L. C. Glaeser, J. F. Brazdil, M. A. Hazle, M. Mehicic, and R. K. Grasselli,/. Chem. Soc. Faraday Trans. 1, 81, 2903 (1985).
R. G. Teller, J. F. Brazdil, and R. K. Grasselli, Acta Cyst. C 40, 2001 (1984).
R. G. Teller, J. F. Brazdil, R. K. Grasselli, R. T. L. Corliss, and J. Hastings,/ SolidState Chem. 52, 313 (1984).
R. G. Teller, J. F. Brazdil, R. K. Grasselli, and W. Yelon,/ Chem. Soc. Faraday Trans. 1, 81, 1693 (1985).
M. R. Antonio, R. G. Teller, D. R. Sandstrom, M. Mehicic, and J. F. Brazdil,/ Phys. Chem. 92, 2939 (1988).
M. R. Antonio, J. F. Brazdil, L. C. Glaeser, M. Mehicic, and R. G. Teller, / Phys. Chem. 92, 2338 (1988).
J. F. Brazdil and R. K. Grasselli,/. Catal. 79, 104 (1983).
J. F. Brazdil, L. C. Glaeser, and R. K. Grasselli, /. Phys. Chem. 87, 5485 (1983).
A. W. Sleight, in J. J. Burton and R. L. Garten, e&s.,AdvancedMaterials in Catalysis, Academic Press, New York, 1977, pp. 181—208.
R. K. Grasselli and J. D. Burrington, Adv. Catal. 30, 133 (1981).
K. Weissermel and H. J. Arpe, Industrial Organic Chemistry, A. Mullen, trans., Vedag Chemie, New York, 1978, pp. 266—267.
U.S. Pat. 2,690,452 (Sept. 28,1954), E. L. Carpenter (to American Cyanamid Co.).
U.S. Pat. 2,729,670 (Jan. 3, 1956), P. H. DeBruin (to Stamicarbon N.V.).
Chem. Eng. News, 23(20), 1841 (Oct. 25,1945).
D. J. Hadley and E. G. Hancock, eds., Propylene andlts Industrial Derivatives, Halsted Press, a division of John Wiley & Sons, Inc., New York, 1973,
p. 418.
K. Sennewald, World Petroleum Congress Proceedings, 5th, 1959, Section IV, Paper 19, pp. 217—227.
U.S. Pat. 2,554,482 (May 29,1951), N. Brown (to E. I. du Pont de Nemours & Co., Inc.).
U.S. Pat. 2,385,552 (Sept. 25,1945), L. R. U. Spence andF. O. Haas (to Rohm and Haas Co.).
U.S. Pat. 2,736,739 (Feb. 28,1956), D. C. England and G. V. Mock (to E. I. du Pont de Nemours & Co., Inc.).
U.S. Pat. 3,184,415 (May 18, 1965), E. B. Hundey, J. M. Kmse, and J. W. Way (to E. I. du Pont de Nemours & Co., Inc.).
U.S. Pats. 4,783,545 (Nov. 8,1988), 4,837,233 (June 6, 1989), and 4,871,706 (Oct. 3,1989), L. C. Glaeser, J. F. Brazdil, and M. A. Toft (to The
Standard Oil Co.).
Brit. Pats. 1,336,135 (Nov. 7,1973), N. Harris and W. L. Wood; 1,336,136 (Nov. 7,1973), N. Harris (to Power-Gas Ltd.).
U.S. Pat. 3,833,638 (Sept. 3, 1974), W. R. Knox, К. M. Taylor, and G. M. Tullman (to Monsanto Co.).
U.S. Pats. 4,849,537 (July 18,1989) and 4,849,538 (July 18,1989), R. Ramachandran, D. L. MacLean, and D. P. Satchell, Jr. (to The BOC Group,
Inc.).
U.S. Pat. 4,609,502 (Sept. 2,1986), S. Khoobiar (to The Halcon SD Group, Inc.).
U.S. Pat. 3,751,443 (Aug. 7,1973), К. E. Khchelan, О. M. Revenko, A. N. Shatalova, and E. G. Gelperina.
J. Perkowski, Pryem. Chem. 51, 17 (1972).
U.S. Pat. 4,746,753 (May 24,1988), J. F. Brazdil, D. D. Suresh, and R. K. Grasselli (to The Standard Oil Co. (Ohio)).
U.S. Pat. 4,503,001 (Mar. 5, 1985), R. K. Grasselli, A. F. Miller, andH. F. Hardman (to The Standard Oil Co. (Ohio)).
U.S. Pat. 4,228,098 (Oct. 14,1980), K. Aoki, M. Honda, T. Dozono, and T. Katsumata (to Asahi Kasei Kogyo Kabushiki Kaisha).
Chem. Eng. News, 36 (June 19, 1989).
Chem. Mark. Rep. 235, 50 (1989).
Propylene Newsletter, DeWitt & Company, Houston, Tex., March 15, 1989.
Ref. 3, pp. 163—165.
Annual Book ofASTM Standards, E 1178-87, American Society for Testing and Materials, Philadelphia, Pa., 1988.
Annual Book ofASTM Standards, E 203-75, American Society for Testing and Materials, Philadelphia, Pa., 1986.
Annual Book ofASTM Standards, E 299-84, American Society for Testing and Materials, Philadelphia, Pa., 1984.
Kirk-Othmer Encyclopedia of Chemical Technology (4th Edition)
187
ACRYLONITRILE
Voll
78. MaterialSafety Data SheetNumberl386, BP Chemicals Inc., Cleveland, Ohio, 1989.
79. Assessment of Human Exposures to Atmospheric Acrylonitrile, SRI International, Menlo Park, Calif., 1979.
80. U.S. Pat. 3,489,789 (Jan. 13, 1970), R. A. Dewar andM. A. Riddolls (to Imperial Chemical Industries Australia Ltd.).
81. U.S. Pat. 3,549,685 (Dec. 22, 1970), J. W. Badham, P. J. Gregory, and J. B. Glen (to Imperial Chemical Industries Australia Ltd.).
James F. Brazdil
BP Research
Kirk-Othmer Encyclopedia of Chemical Technology (4th Edition)
188
ACRYLONITRILE POLYMERS
Voll
Kirk-Othmer Encyclopedia of Chemical Technology (4th Edition)
189
ACRYLONITRILE POLYMERS
Voll
ACRYLONITRILE POLYMERS
Survey and SAN,
ABS Resins,
Kirk-Othmer Encyclopedia of Chemical Technology (4th Edition)
190
SURVEY AND SAN
Voll
SURVEY AND SAN
Acrylonitrile (AN), C3H3N, first became an important polymeric building block in the 1940s. Although it had been discovered in 1893 (1), its unique
properties were not realized until the development of nitrile rubbers during World War II (see Elastomers, synthetic, nitrile rubber) and the discovery of
solvents for the homopolymer with resultant fiber applications (see Fibers, acrylic) for textiles and carbon fibers. As a comonomer, acrylonitrile (qv)
contributes hardness, rigidity, solvent and light resistance, gas impermeability, and the ability to orient. These properties have led to many copolymer
application developments since 1950.
The utility of acrylonitrile [107-13-1] in thermoplastics was first realized in its copolymer with styrene, CgHg [100-42-5]> in the late 1950s.
Styrene—acrylonitrile (SAN) copolymers [9003-54-7[ have superior properties to polystyrene in the areas of toughness, rigidity, and chemical and thermal
resistance (2), and, consequently, many commercial applications for them have developed. These optically clear materials containing between 15 and 35%
AN can be readily processed by extrusion and injection molding, but they lack real impact resistance.
The subsequent development of ABS (acrylonitrile—butadiene—styrene) resins [9003-56-9]., which contain an elastomeric component within a SAN
matrix, further boosted commercial application of the basic SAN copolymer as a portion of these rubber-toughened thermoplastics (see Acrylonitrile
polymers, ABS resins). When SAN is grafted onto a butadiene-based rubber, and optionally blended with additional SAN, the two-phase thermoplastic
ABS is produced. ABS has the useful SAN properties of rigidity and resistance to chemicals and solvents, while the elastomeric component contributes real
impact resistance. Because ABS is a two-phase system and each phase has a different refractive index, the final ABS is normally opaque. A clear ABS can be
made by adjusting the refractive indexes through the inclusion of another monomer such as methyl methacrylate. ABS is a versatile material and
modifications have brought out many specialty grades such as clear ABS and high temperature and flame retardant grades. Saturated hydrocarbon
elastomers or acrylic elastomers (3,4) can be used instead of those based on butadiene, CAT [106-99-0].
In the late 1960s a new class of AN copolymers and multipolymers was introduced that contain >60% acrylonitrile. These are commonly known as
barrier resins and have found their greatest acceptance where excellent barrier properties toward gases (5), chemicals, and solvents are needed. They may be
processed into bottles, sheets, films, and various laminates, and have found wide usage in the packaging industry (see Barrier polymers).
Acrylonitrile has found its way into a great variety of other polymeric compositions based on its polar nature and reactivity, imparting to other
systems some or all of the properties noted above. Some of these areas include adhesives and binders, antioxidants, medicines, dyes, electrical insulations,
emulsifying agents, graphic arts, insecticides, leather, paper, plasticizers, soil-modifying agents, solvents, surface coatings, textile treatments, viscosity
modifiers, azeotropic distillations, artificial organs, lubricants, asphalt additives, water-soluble polymers, hollow spheres, cross-linking agents, and catalyst
treatments (6).
SAN Physical Properties and Test Methods
SAN resins possess many physical properties desired for thermoplastic applications. They are characteristically hard, rigid, and dimensionally stable with
load bearing capabilities. They are also transparent, have high heat distortion temperatures, possess excellent gloss and chemical resistance, and adapt easily
to conventional thermoplastic fabrication techniques (7).
SAN polymers are random linear amorphous copolymers. Physical properties are dependent on molecular weight and the percentage of acrylonitrile.
An increase of either generally improves physical properties, but may cause a loss of processability or an increase in yellowness. Various processing aids and
modifiers can be used to achieve a specific set of properties. Modifiers may include mold release agents, uv stabilizers, antistatic aids, elastomers, flow and
processing aids, and reinforcing agents such as fillers and fibers (7).
Methods for testing and some typical physical properties are listed in Table 1.
Table 1. Properties of Injection-Molded Commercial SAN Resins*
Property Monsanto Lustran-35 Dow Tyril-880 ASTM Method
tensile strength, MPa 79.4 82.1 D638
ultimate elongation, % 3.0 3.0 D638
modulus of elasticity, GPa 3.45 3.86 D638
Izod impact strength, J/m 24.0 26.7 D256
hardness—Rockwell M 83 80 D785
deflection temperature, °C 104.4 103.3 D648, annealed
Vicat softening temperature, °C 111.1 111.1 D1525
melt-flow rate, g/10 min 7.0 3.0 D1238, cond 1
coefficient of linear thermal expansion, cm/ (cm-°C) 6.8 x 10⁻⁵ 6.6 x 10⁻⁵ D696
flammability, cm /min 2.0 D635
specific heat, J/(g-K)e 1.3 Dow test
dielectric constant, kHz (MHz) 3.18 (3.02) D150
dissipation factor, kHz (MHz) 0.007 (0.012) D150
refractive index, 1.57 1.565 D542
water absorption, % in 24 h 0.25 0.35 D570
specific gravity 1.07 1.08 D792
mold shrinkage, cm / cm 0.003-0.004 0.003-0.007
Data taken from Monsanto and Dow product data sheets.
To convert MPa to psi multiply by 145.
C To convert GPa to psi multiply by 145,000.
To convert J /m to ftlb/in. divide by 53.39.
To convert J to cal divide by 4.184.
Kirk-Othmer Encyclopedia of Chemical Technology (4th Edition)
191
SURVEY AND SAN
Voll
The properties of SAN resins depend on their acrylonitrile content. Both melt viscosity and hardness increase with increasing acrylonitrile level.
Unnotched impact and flexural strengths depict dramatic maxima at ca 87.5 mol % (78 wt %) acrylonitrile (8). With increasing acrylonitrile content,
copolymers show continuous improvements in barrier properties and chemical and uv resistance, but thermal stabiEty deteriorates (9). The glass-transition
temperature (Ip of SAN varies nonlineady with acrylonitrile content, showing a maximum at 50 mol % AN. The alternating SAN copolymer has the
highest T (10,11). The fatigue resistance of SAN increases with AN content to a maximum at 30 wt %, then decreases with higher AN levels (12). The
effect of acrylonitrile incorporation on SAN resin properties is shown in Table 2.
Table 2. Compositional Effects on SAN Physical Properties*
AN, wt % Tensile Elongation, % Impact strength, Heat distortion, Solution viscosity, strength, MPab J/mnotcL temp., °C mPa-s (=cP)
5.5 9.8 14.0 21.0 27.0 42.27 1.6 26.6 72 11.1 54.61 2.1 26.0 82 10.7 57.37 2.2 27.1 84 13.0 63.85 2.5 27.1 88 16.5 72.47 3.2 27.1 88 25.7
aRef. 13.
To convert MPa to psi multiply by 145.
To convert J /m to fdb/in. divide by 53.39.
SAN Chemical Properties and Analytical Methods
SAN resins show considerable resistance to solvents and are insoluble in carbon tetrachloride, ethyl alcohol, gasoline, and hydrocarbon solvents. They are
swelled by solvents such as benzene, ether, and toluene. Polar solvents such as acetone, chloroform, dioxane, methyl ethyl ketone, and pyridine will dissolve
SAN (14). The interactions of various solvents and SAN copolymers containing up to 52% acrylonitrile have been studied along with their thermodynamic
parameters, ie, the second virial coefficient, free-energy parameter, expansion factor, and intrinsic viscosity (15).
The properties of SAN are significandy altered by water absorption (16). The equiEbrium water content increases with temperature while the time
required decreases. A large decrease in T can result. Strong aqueous bases can degrade SAN by hydrolysis of the nitrile groups (17).
The molecular weight of SAN can be easily determined by either intrinsic viscosity or size-exclusion chromatography (sec). Relationships for both
multipoint and single point viscosity methods are available (18,19). Two intrinsic viscosity and molecular weight relationships for azeotropic copolymers
have been given (20,21):
[q] = 3.6 x 1(T4 <62 dL/g in MEK at30°C
[77] = 2.15 x 1(T4 <68 dL/g in THF at25°C
Chromatographic techniques are readily appEed to SAN for molecular weight determination. Size-exclusion chromatography or gel permeation
chromatography (gpc) (22) columns and conditions have been described for SAN (23). Chromatographic detector differences have been shown to be of
the order of only 2—3% (24). High pressure precipitation chromatography can achieve similar molecular weight separation (25). Liquid chromatography (1c)
can be used with secfractioned samples to determine copolymer composition (26). Thin layer chromatography will also separate SAN by compositional
(monomer) variations (25).
Residual monomers in SAN have been a growing environmental concern and can be determined by a variety of methods. Monomer analysis can be
achieved by polymer solution or direcdy from SAN emulsions (27) followed by "head space" gas chromatography (gc) (28,29). Liquid chromatography (1c)
is also effective (30).
SAN Manufacture
The reactivities of acrylonitrile and styrene radicals toward their monomers are quite different, resulting in SAN copolymer compositions that vary from
their monomer compositions (31). Further compEcating the reaction is the fact that AN is soluble in water (see Acrylonitrile) and slightly different
behavior is observed between water-based emulsion and suspension systems and bulk or mass polymerizations (32). SAN copolymer compositions can be
calculated from copolymerization equations (33) and pubEshed reactivity ratios (34). The difference in radical reactivity causes the copolymer composition
to drift as polymerization proceeds, except at the azeotrope composition where copolymer composition matches monomer composition. Figure 1 shows
these compositional variations (35). When SAN copolymer compositions vary significandy, incompatibiEty results, causing loss of optical clarity,
mechanical strength, and moldabiEty, as well as heat, solvent, and chemical resistance (36). The termination step has been found to be controlled by
diffusion even at low conversions, and the termination rate constant varies with acrylonitrile content. The average half-life of the radicals increases with
styrene concentration from 0.3 s at 20 mol % to 6.31 s with pure styrene (37). Further compEcating SAN manufacture is the fact that both the heat (38,39)
and rate (40) of copolymerization vary with monomer composition.
Kirk-Othmer Encyclopedia of Chemical Technology (4th Edition)
192
SURVEY AND SAN
Voll
Fig. 1. Approximate compositions of styrene—acrylonitrile copolymers formed at different conversions starting with various monomer mixtures (35):
S/AN = A, 65/35; B, 70/30; C, 76/24; D, 90/10.
The early kinetic models for copolymerization, Mayo's terminal mechanism (41) and Alfrey's penultimate model (42), did not adequately predict the
behavior of SAN systems. Copolymerizations in DMF and toluene indicated that both penultimate and antepenultimate effects had to be considered
(43,44). The resulting reactivity model is somewhat complicated, since there are eight reactivity ratios to consider.
The first quantitative model, which appeared in 1971, also accounted for possible charge-transfer complex formation (45). Deviation from the
terminal model for bulk polymerization was shown to be due to antepenultimate effects (46). More recent work with numerical computation and 13C-nmr
spectroscopy data on SAN sequence distributions indicates that the penultimate model is the most appropriate for bulk SAN copolymerization (47,48). A
kinetic model for azeotropic SAN copolymerization in toluene has been developed that successfully predicts conversion, rate, and average molecular weight
for conversions up to 50% (49).
An emulsion model that assumes the locus of reaction to be inside the particles and considers the partition of AN between the aqueous and oil
phases has been developed (50). The model predicts copolymerization results very well when bulk reactivity ratios of 0.32 and 0.12 for styrene and
acrylonitrile, respectively, are used.
Commercially, SAN is manufactured by three processes: emulsion, suspension, and continuous bulk.
Emulsion Process. The emulsion polymerization process utilizes water as a continuous phase with the reactants suspended as microscopic
particles. This low viscosity system allows facile mixing and heat transfer for control purposes. An emulsifier is generally employed to stabilize the water
insoluble monomers and other reactants, and to prevent reactor fouling. With SAN the system is composed of water, monomers, chain-transfer agents for
molecular weight control, emulsifiers, and initiators. Both batch and semibatch processes are employed. Copolymerization is normally carried out at 60 to
100°C to conversions of ^97%. Lower temperature polymerization can be achieved with redox-initiator systems (51).
Figure 2 shows a typical batch or semibatch emulsion process (52). A typical semibatch emulsion recipe is shown in Table 3 (53).
Fig. 2. Styrene—acrylonitrile batch emulsion process (52).
Table 3. Semibatch Mode Emulsion Recipe for SAN Copolymers
Ingredient
acrylonitrile
Initial reactor charge
Parts
90
Kirk-Othmer Encyclopedia of Chemical Technology (4th Edition)
193
SURVEY AND SAN
Voll
styrene
Na alkanesulfonate (emulsifier)
K^Og (initiator)
4-(benzyloxymethylene)cydohexene (mol wt modifier)
water
acrylonitrile
styrene
Na alkanesulfonate (emulsifier)
K^Og (initiator)
4-(benzyloxymethylene)cyclohexene (mol wt modifier)
water
Addition charge
111
63
0.44
1
1400
350
1000
15
4
10
1600
The initial charge is placed in the reactor, purged with an inert gas such as N2, and brought to 80°C. The initiator is added, followed by addition of
the remaining charge over 100 min. The reaction is completed by maintaining agitation at 80°C for 1 h after monomer addition is complete. The product is
a free-flowing white latex with a total solids content of 35.6%.
Compositional control for other than azeotropic compositions can be achieved with both batch and semibatch emulsion processes. Continuous
addition of the faster reacting monomer, styrene, can be practiced for batch systems, with the feed rate adjusted by computer through gas chromatographic
monitoring during the course of the reaction (54). A calorimetric method to control the monomer feed rate has also been described (8). For semibatch
processes, adding the monomers at a rate that is slower than copolymerization can achieve equilibrium. It has been found that constant composition in the
emulsion can be achieved after ca 20% of the monomers have been charged (55).
Residual monomers in the latex are avoided either by effectively reacting the monomers to polymer or by physical or chemical removal. The use of
/^-butyl peroxypivalate as a second initiator toward the end of the polymerization or the use of mixed initiator systems of K2S2Og and /^-butyl
peroxybenzoate (56) effectively increases final conversion and decreases residual monomer levels. Spray devolatilization of hot latex under reduced pressure
has been claimed to be effective (56). Residual acrylonitrile also can be reduced by postreaction with a number of agents such as monoamines (57) and
dialkylamines (58), ammonium—alkali metal sulfites (59), unsaturated fatty acids or their glycerides (60,61), their aldehydes, esters of olefinic alcohols,
cyanuric acid (62,63), and myrcene (64).
The copolymer latex can be used "as is" for blending with other latexes, such as in the preparation of ABS, or the copolymer can be recovered by
coagulation. The addition of electrolyte or freezing will break the latex and allow the polymer to be recovered, washed, and dried. Process refinements have
been made to avoid the difficulties of fine particles during recovery (65—67).
The emulsion process can be modified for the continuous production of latex. One such process (68) uses two stirred-tank reactors in series,
followed by insulated hold-tanks. During continuous operation, 60% of the monomers are continuously charged to the first reactor with the remainder
going into the second reactor. Surfactant is added only to the first reactor. The residence time is 2.5 h for the first reactor where the temperature is
maintained at 65°C for 92% conversion. The second reactor is held at 68°C for a residence time of 2 h and conversion of 95%.
Suspension Process. Like the emulsion process, water is the continuous phase for suspension polymerization, but the resultant particle size is
larger, well above the microscopic range. The suspension medium contains water, monomers, molecular weight control agents, initiators, and suspending
aids. Stirred reactors are used in either batch or semibatch mode. Figure 3 illustrates a typical suspension manufacturing process while a typical batch recipe
is shown in Table 4 (69). The components are charged into a pressure vessel and purged with nitrogen. Copolymerization is carried out at 128°C for 3 h
and then at 150°C for 2 h. Steam stripping removes residual monomers (70), and the polymer beads are separated by centrifugation for washing and final
dewatering.
Fig. 3. Styrene—acrylonitrile suspension process (69).
Table 4. Batch Mode Recipe for SAN Copolymers*
Ingredient_________________________________________
acrylonitrile
styrene
dipentene (4-isopropenyl-l-methylcyclohexene)
di-Z^-butyl peroxide
acrylic acid-2-ethylhexyl acrylate (90:10) copolymer
water
Parts
30~
70
1.2
0.03
0.03
100
aRef. 69.
Kirk-Othmer Encyclopedia of Chemical Technology (4th Edition)
194
SURVEY AND SAN
Voll
Compositional control in suspension systems can be achieved with a corrected batch process. A suspension process has been described where
styrene monomer is continuously added until 75—85% conversion, and then the excess acrylonitrile monomer is removed by stripping with an inert gas
(71,72).
Elimination of unreacted monomers can be accomplished by two methods: dual initiators to enhance conversion of monomers to product (73—75)
and steam stripping (70,76). Several process improvements have been claimed for dewatering beads (77), to reduce haze (78—81), improve color (82—86),
remove monomer (87,88), and maintain homogeneous copolymer compositions (71,72,89).
Continuous Bulk Process. The continuous bulk process has several advantages including high space-time yield, and good quaEty products
uncontaminated with residual ingredients such as emulsifiers or suspending agents. SAN manufactured by this method generally has superior color and
transparency and is preferred for appEcations requiring good optical properties. It is a self-contained operation without waste treatment or environmental
problems since the products are either polymer or recycled back to the process.
In practice, the continuous bulk polymerization is rather compEcated. Because of the high viscosity of the copolymerizing mixture, complex
machinery is required to handle mixing, heat transfer, melt transport, and devolatilization. In addition, considerable time is required to estabEsh steady-state
conditions in both a stirred tank reactor and a linear flow reactor. Thus system start-up and product grade changes produce some off-grade or intermediate
grade products. Copolymerization is normally carried out between 100 and 200°C. Solvents are used to reduce viscosity or the conversion is kept to
40—70%, followed by devolatilization to remove solvents and monomers. D e vol a til i z a ti о n is carried out from 120 to 260°C under vacuum at less than 20
kPa (2.9 psi). The devolatilized melt is then fed through a strand die, cooled, and pelletized.
A schematic of a continuous bulk SAN polymerization process is shown in Figure 4 (90). The monomers are continuously fed into a screw reactor
where copolymerization is carried out at 150°C to 73% conversion in 55 min. Heat of polymerization is removed through cooling of both the screw and
the barrel walls. The polymeric melt is removed and fed to the devolatilizer to remove unreacted monomers under reduced pressure (4 kPa or 30 mm Hg)
and high temperature (220°C). The final product is claimed to contain less than 0.7% volatiles. Two devolatilizers in series are found to yield a better quaEty
product as well as better operational control (91,92).
Fig. 4. Styrene—acrylonitrile continuous mass process (90).
Condenser
> Product
Devolatilizer
Two basic reactor types are used in the continuous bulk process, the stirred tank reactor (93) and the linear flow reactor. The stirred tank reactor
consists of a horizontal cylinder chamber equipped with various agitators (94,95) for mixing the viscous melt and an external cooling jacket for heat
removal. With adequate mixing, the composition of the melt inside the reactor is homogeneous. Operation at a fixed conversion, with monomer make-up
added at an amount and ratio equal to the amount and composition of copolymer withdrawn, produces a fixed composition copolymer. The two types of
linear flow reactors employed are the screw reactor (90) and the tower reactor (95). A screw reactor is composed of two concentric cylinders. The reaction
mixture is conveyed toward the oudet by rotating the inner screw, which has heEcal threads, while heat is removed from both cylinders. A tower reactor
with separate heating zones has a scraper agitator in the upper zone, while the lower portion generates plug flow. In the linear flow reactors the conversion
varies along the axial direction as does the copolymer composition, except where operating at the azeotrope composition. A stream of monomer must be
added along the reactor to maintain SAN compositional homogeneity at high conversions. A combined stirred tank followed by a linear flow reactor
process has been disclosed (95). Through continuous recycle copolymerization, a copolymer of identical composition to monomer feed can be achieved,
regardless of the reactivity ratios of the monomers involved (96).
The devolatilization process has been developed in many configurations. Basically, the polymer melt is subjected to high temperatures and low
pressures to remove unreacted monomer and solvent. A two-stage process using a tube and shell heat exchanger with enlarged bottom receiver to vaporize
monomers has been described (92). A copolymer solution at 40—70% conversion is fed into the first-stage exchanger and heated to 120—190°C at a
pressure of 20—133 kPa and then discharged into the enlarged bottom section to remove at least half of the unreacted acrylonitrile. The product from this
section is then charged to a second stage and heated to 210—260°C at <20 kPa. The devolatilized product contains volatiles. Preheating the polymer
solution and then flashing it into a multipassage heating zone at lower pressure than the preheater produces essentially volatile-free product (91,97). SAN
can be steam stripped to quite low monomer levels in a vented extruder which has water injected at a pressure greater than the vapor pressure of water at
that temperature (98).
A twin-screw extruder is used to reduce residual monomers from ca 50 to 0.6%, at 170°C and 3 kPa with a residence time of 2 min (94). In another
design, a heated casing encloses the vented devolatilization chamber, which encloses a rotating shaft with specially designed blades (99,100). These
continuously regenerate a large surface area to faciEtate the efficient vaporization of monomers. The devolatilization equipment used for the production of
polystyrene and ABS is generally suitable for SAN production.
Processing. SAN copolymers may be processed using the conventional fabrication methods of extrusion, blow molding, injection molding,
thermoforming, and casting. Small amounts of additives, such as antioxidants, lubricants, and colorants, may also be used. Typical temperature profiles for
injection molding and extrusion of predried SAN resins are as follows (101).
cylinder
mold
melt
Molding Temperatures
193-288°C
49-88°C
218-260°C
Kirk-Othmer Encyclopedia of Chemical Technology (4th Edition)
195
SURVEY AND SAN
Voll
hopper zone
rear zone
middle zone
torpedo zone and die
TLxtrusion Temperatures
water-cooled
177-204°C
210-232°C
204-227°C
Other Copolymers
Acrylonitrile copolymerizes readily with many electron-donor monomers other than styrene. Hundreds of acrylonitrile copolymers have been reported, and
a comprehensive listing of reactivity ratios for acrylonitrile copolymerizations is readily available (34,102). Copolymerization mitigates the undesirable
properties of acrylonitrile homopolymer, such as poor thermal stability and poor processability. At the same time, desirable attributes such as rigidity,
chemical resistance, and excellent barrier properties are incorporated into melt-processable resins.
Barex 210, a commercial high barrier resin produced by BP America, is a copolymer of acrylonitrile and methyl acrylate [96-33-3]. This resin is an
excellent example of the use of acrylonitrile to provide gas barrier, chemical resistance, high tensile strength, and stiffness, and utilization of a comonomer
to provide thermal stability and processability. In addition, modification with an elastomer provides toughness and impact strength. This material has a
unique combination of useful packaging qualities, including transparency, and is an excellent barrier to permeation by gases, organic solvents, and most
essential oils. As a result, it prevents the migration of volatile flavors and odors from packaged foods and toiletry products (103)while also providing
protection from atmospheric oxygen.
Barex 210 extruded sheet can be easily thermoformed into lightweight, rigid containers (103,104). Packages can be printed, laminated, or metallized.
Recent developments in extrusion and injection blow molding (103,105), laminated film structures (103,106), and coextrusion (103,107) have led to
packaging uses for a variety of products. Barex 210 is especially well-suited for botde production. This acrylonitrile copolymer also provides a good example
of the dependence of properties on the degree and temperature of orientation (108,109). Figure 5 illustrates the improvement in tensile strength,
elongation, and the ability to absorb impact energy due to orientation (109). Tensile strength and impact strength increase with the extent of stretching, and
decrease with the orientation temperature, and oxygen permeability decreases with orientation.
Fig. 5. Stress elongation of Barex 210 sheet (109) . To convert MPa to psi multiply by 145.
Acrylonitrile—methyl acrylate—indene terpolymers, by themselves, or in blends with acrylonitrile—methyl acrylate copolymers, exhibit even lower
oxygen and water permeation rates than the indene-free copolymers (110,111). Terpolymers of acrylonitrile with indene and isobutylenealso exhibit
excellent barrier properties (112), and permeation of gas and water vapor through acrylonitrile—styrene—isobutyleneterpolymers is also low (113,114).
Copolymers of acrylonitrile and methyl methacrylate (115) and terpolymers of acrylonitrile, styrene, and methyl methacrylate (116,117) are used as
barrier polymers. Acrylonitrile copolymers and multipolymers containing butyl acrylate (118—121), ethyl acrylate (122), 2-ethylhexyl acrylate
(118,121,123,124), hydroxyethyl acrylate (120), vinyl acetate (119,125), vinyl ethers (125,126), and vinylidene chloride (121,122,127—129) are also used in
barrier films, laminates, and coatings. Environmentally degradable polymers useful in packaging are prepared from polymerization of acrylonitrile with
styrene and methyl vinyl ketone (130). Table 5 gives the structures, formulas, and CAS Registry Numbers for several comonomers of acrylonitrile.
Table 5. Monomers Commonly Copolymerized with Acrylonitrile
Monomer Molecular formula Structural formula CAS Registry Number
methyl methacrylate C5H8O2 СИ2=С(СИ3)СООСИ3 [80-62-6]
methyl acrylate C4H6O2 CH2=CHCOOCH3 [96-33-3]
indene c9h8 [95-13-6]
isobutylene C4H8 CH2=C(CH3)2 [115-11-7]
butyl acrylate C7H12O2 CH2=CHCOOC4H9 [141-32-2]
ethyl acrylate C5H8O2 CH2=CHCOOC2H5 [140-88-5]
2-ethylhexyl acrylate C14H20O2 CH2=CHCOOC8H17 [103-11-7]
hydroxyethyl acrylate C5H8O3 CH2=CHCOOC2H4OH [818-61-1]
vinyl acetate C4H6O2 CH2=CHOOCCH3 [108-05^-]
vinylidene chloride C2H2C12 CH2=C(C1)2 [75-35^-]
methyl vinyl ketone C4H6O CH2=CHCOCH3 [78-94^-]
Kirk-Othmer Encyclopedia of Chemical Technology (4th Edition)
196
SURVEY AND SAN
Voll
CC-methylstyrene
vinyl chloride
4-vinylpyridine
acrylic acid
C9H10
C2H3C1
c7h7n
C3H4O2
CH2=C(CH3)C6H5
СЮ—СНС1
ch2=chc5h4n
CH2=CHCOOH
[98-83-9]
[75-01-4]
[100-43-6]
[79-10-7]
Although the arrangement of monomer units in acrylonitrile copolymers is usually random, alternating or block copolymers may be prepared by
using special techniques. For example, the copolymerization of acrylonitrile, like that of other vinyl monomers containing conjugated carbonyl or cyano
groups, is changed in the presence of certain Lewis acids. Effective Lewis acids are metal compounds with nontransition metals as central atoms, including
alkylaluminum halides, zinc halides, and triethylaluminum. The presence of the Lewis acid increases the tendency of acrylonitrile to alternate with
electron-donor molecules, such as styrene, CC-methylstyrene, and olefins (131—135). This alternation is often attributed to a ternary molecular complex or
charge-transfer mechanism, where complex formation with the Lewis acid increases the electron-accepting ability of acrylonitrile, which results in the
formation of a molecular complex between the acrylonitrile—Lewis acid complex and the donor molecule. This ternary molecular complex polymerizes as a
unit to yield an alternating polymer. Cross-propagation and complex radical mechanisms have also been proposed (136).
A number of methods such as ultrasonics (137), radiation (138), and chemical techniques (139—141), including the use of polymer radicals, polymer
ions, and organometallic initiators, have been used to prepare acrylonitrile block copolymers (142). Block comonomers include styrene, methyl acrylate,
methyl methacrylate, vinyl chloride, vinyl acetate, 4-vinylpyridine, acrylic acid, and я-butyl isocyanate.
Acrylonitrile has been grafted onto many polymeric systems. In particular, acrylonitrile grafting has been used to impart hydrophilic behavior to
starch (143—145) and polymer fibers (146). Exceptional water absorption capability results from the grafting of acrylonitrile to starch, and the use of
2-acrylamido-2-methylpropanesulfonic acid [15214-89-8] along with acrylonitrile for grafting results in copolymers that can absorb over 5000 times their
weight of deionized water (147).
Economic Aspects
Since its introduction in the 1950s, SAN has shown steady growth. The combined properties of SAN copolymers such as optical clarity, rigidity, chemical
and heat resistance, high tensile strength, and flexible molding characteristics, along with reasonable price have secured their market position. The largest
portion of SAN (>80%) is incorporated into ABS resins, and their markets are inexorably joined. Both of these polymeric materials have shown similar
responses during the 1980s to market conditions such as recessions and oil prices (148).
There are two major producers of SAN resin in the United States, Monsanto Chemical Company and The Dow Chemical Company, which market
these materials under the names of Lustran and Tyril, respectively. Some typical physical properties of these have been shown in Table 1. Production
figures for SAN and ABS for the 1980s are shown in Table 6 (148).
Table 6. U.S. Production of SAN and ABS Resins/ 103 Metric Tonsb
Year SAN ABS
1979 56.2 956
1980 50.3 773
1981 48.5 791
1982 41.3 626
1983 42.2 857
1984 44.9 965
1985 39.5 923
1986 41.7 996
1987 57.1 1022
1988 67.1 1098
aRef. 148.
Dry-weight basis.
Health and Toxicology
SAN resins themselves appear to pose few health problems in that they have been approved by the FDA for beverage botde use (149). The main concern
is that of toxic residuals, eg, acrylonitrile, styrene, or other polymerization components such as emulsifiers, stabilizers, or solvents. Each component must
be treated individually for toxic effects and safe exposure level.
Acrylonitrile is believed to behave similarly to hydrogen cyanide (enzyme inhibition of cellular metabolism) (150) and is believed to be a potential
carcinogen (151). It can also affect the cardiovascular system and kidney and liver functions (150). Further information on the toxicology and human
exposure to acrylonitrile is available (152—154) (see Acrylonitrile).
Styrene toxicity is regarded to be relatively low. It is an irritant to the eyes and respiratory tract, and while prolonged exposure to the skin may cause
irritation, styrene is unlikely to be absorbed through the skin in harmful amounts. The American Conference of Government Industrial Hygienists
(ACGIH) threshold limit value (TLV) for styrene is 50 ppm time-weighted average (TWA) (155). More information on human exposure to styrene in the
workplace is available (156,157) (see Styrene).
Uses
Useful properties of acrylonitrile copolymers, such as rigidity, gas barrier, chemical and solvent resistance, and toughness, are dependent upon the
acrylonitrile content in the copolymers. The choice of the composition of SAN copolymers is dictated by their particular applications and performance
requirements. The well-balanced and unique properties possessed by these copolymers have led to broad usage in a wide variety of applications.
Because of their excellent barrier properties, acrylonitrile polymers and copolymers have been widely used in films and laminates for packaging
(158—162). In addition to laminates (163—167), SAN copolymers are used in membranes (168—171), controlled-release formulations (172,173), polymeric
foams (174,175), fire-resistant compositions (176,177), ion-exchange resins (178), reinforced paper (179), concrete and mortar compositions (180,181),
safety glass (182), solid ionic conductors (183), negative resist materials (184), electrophotographic toners (185), and optical recording (186). SAN
copolymers are also used as coatings (187), dispersing agents for colorants (188), carbon-fiber coatings for improved adhesion (189), and synthetic wood
pulp (190). SAN copolymers have been blended with aromatic polyesters to improve hydrolytic stability (191), with methyl methacrylate polymers to form
highly transparent resins (192), and with polycarbonate to form toughened compositions with good impact strength (193—195). Table 7 lists the most
common uses of SAN copolymers in major industrial markets (7,101). Some important modifications of SAN copolymers are listed in Table 8.
Kirk-Othmer Encyclopedia of Chemical Technology (4th Edition)
197
SURVEY AND SAN
Voll
Table 7. SAN Copolymer Usesa
Application Articles
appliances air conditioner parts, decorated escutcheons, washer and dryer instrument panels, washing machine filter bowls, refrigerator shelves, meat and vegetable drawers and covers, blender bowls, mixers, lenses, knobs, vacuum cleaner parts, humidifiers, and detergent dispensers
automotive construction electronic furniture housewares batteries, bezels, instrument lenses, signals, glass-filled dashboard components, and interior trim safety glazing, water filter housings, and water faucet knobs battery cases, instrument lenses, cassette parts, computer reels, and phonograph covers chair backs and shells, drawer pulls, and caster rollers brush blocks and handles, broom and brush brisdes, cocktail glasses, disposable dining utensils, dishwasher-safe tumblers, mugs, salad bowls, carafes, serving trays, and assorted drinkware, hangers, ice buckets, jars, and soap containers
industrial medical packaging batteries, business machines, transmitter caps, instrument covers, and tape and data reels syringes, blood aspirators, intravenous connectors and valves, petri dishes, and artificial kidney devices bottles, bottle overcaps, closures, containers, display boxes, films, jars, sprayers, cosmetics packaging, liners, and vials
custom molding aerosol nozzles, camera parts, dentures, disposable lighter housings, fishing lures, pen and pencil barrels, sporting goods, toys, telephone parts, filter bowls, tape dispensers, terminal boxes, toothbrush handles, and typewriter keys
aRefs. 7 and 101.
Table 8. Modified SAN Copolymers
Modifier Remarks Reference
p olybutadiene ABS, impact resistant a
EPDM rubber* impact and weather resistant 196,197
poly acrylate impact and weather resistant 198,199
poly (ethylene-^-vinyl acetate) (EVA) impact and weather resistant 200
EPDM + EVA impact and weather resistant 201
silicones impact and weather resistant 202
chlorinated polyethylene impact and weather resistant and flame retardant 203
polyester, cross-linked impact resistant 204
p о ly («-methylstyrene) heat resistant 205
poly (butylene terephthalate) wear and abrasion resistant 206
ethylene oxide—propylene oxide copolymers used as lubricants to improve processibility 207
sulfonation hydrogels of high water absorption 208
glass fibers high tensile strength and hardness 209
a See ACRYLONITRILE POLYMERS, ABS RESINS.
Ethylene—propylene—diene monomer rubber.
Acrylonitrile has contributed the desirable properties of rigidity, high temperature resistance, clarity, solvent resistance, and gas impermeability to
many polymeric systems. Its availability, reactivity, and low cost ensure a continuing market presence and provide potential for many new appEcations.
BIBLIOGRAPHY
"Acrylonitrile Polymers (Survey and SAN)" in ECT 3rd ed., Vol. 1, pp. 427—442, F. M. Peng, Monsanto Company.
1. The Chemistry ojAcrylonitrile, 2nd ed., American Cyanamid Co., Petrochemical Div., New York, 1959, p. ix.
2. Ref. l,p. 29.
3. J. L. Ziska, "Olefin-Modified Styrene-Acrylonitrile" in R. Juran, ed., Modem Plastics Encyclopedia 1989, 65(11), McGraw-Hill, Inc., New York, p. 105.
4. D. M. Bennett, "Acrylic-Styrene-Acrylonitrile" in R. Juran, ed., Modem Plastics Encyclopedia 1989, 65(11), McGraw-Hill, Inc., New York, p. 96.
5. S. P. Nemphos and Y. C. Lee, Иж Chem. Soc., Div. Org. Coat. Plast. Chem. Pap. 33(2), 618 (1973).
6. Ref. l,pp. 39-61.
7. F. L. Reithel, "Styrene—Acrylonitrile (SAN)," in R. Juran, ed., Modem Plastics Encyclopedia 1989, 65(11), McGraw-Hill, Inc., New York, p. 105.
8. B. N. Hendy in N. A. J. Platzer, ed., Copolymers, Polyblends, and Composites (Adv. Chem. Ser. 142), American Chemical Society, Washington, D.C.,
1975, p. 115.
9. W. J. Hall and H. K. Chi, SPE National Technical Conference: High Performance Plastics, Cleveland, Ohio, Oct. 5—7, 1976, pp. 1—5.
10. N. W. Johnston, Polym. Prepr. Am. Chem. Soc. 14(1), 46 (1973).
11. N. W. Johnston,/. Macromol. Sci. Rev. Macromol. Chem. C14, 215 (1976).
12. J. A. Sauer and С. C. Chen, Polym. Eng. Sci. 24, 786 (1984).
13. A. W. Hanson and R. L. Zimmerman, Ind. Eng. Chem. 49, 1803 (1957).
14. Brit. Pat. 590,247 (July 11,1947) (to Bakelite Ltd.).
15. R. F. Blanks and B. N. Shah, Polym. Prepr. Am. Chem. Soc. 17(2), 407 (1976).
16. S. A. Jabarin and E. A. Lofgren, Polym. Eng. Sci. 26, 405 (1986).
17. M. Kopic, F. Flajsman, and Z. Janovic,/ Macromol. Sci. Chem. A24(l), 17 (1987).
18. H. U. Khan and G. S. Bhargava,/ Polym. Sci., Polym. Eett. Ed. 22(2), 95 (1984).
19. H. U. Khan, V. K. Gupta, and G. S. Bhargava, Polym. Commun. 24(6), 191 (1983).
20. V. H. Gerrens, H. Ohlinger, and R. Fricker, Makromol. Chem. 87, 209 (1965).
21. Y. Shimura, I. Mita, andH. Kambe,/ Polym. Sci., Polym. Eett. Ed. 2, 403 (1964).
22. A. R. Cooper, "Molecular Weight Determination," in J. I. Kroschwitz, ed., Encyclopedia ofPolymer Science and Engineering, 2nd ed., Vol. 10,
Wiley-Interscience, New York, 1987, pp. 1—19.
23. L. H. Garcia-Rubio, J. F. MacGregor and A. E. Hamielec, Polym. Prepr. Am. Chem. Soc. 22(1), 292 (1981).
24. K. Tsuchida, Метро—Pukui-ken Kogyo Shikenjo, 1980, 74 (1981).
25. G. Gloeckner and R. Konigsveld, Makromol. Chem. Rapid Commun. 4, 529 (1983).
Kirk-Othmer Encyclopedia of Chemical Technology (4th Edition)
198
SURVEY AND SAN
Voll
26.
27.
28.
29.
30.
31.
32.
33.
34.
35.
36.
37.
38.
39.
40.
41.
42.
43.
44.
45.
46.
47.
48.
49.
50.
51.
52.
53.
54.
55.
56.
57.
58.
59.
60.
61.
62.
63.
64.
65.
66.
67.
68.
69.
70.
71.
72.
73.
74.
75.
76.
77.
78.
79.
80.
81.
82.
83.
84.
85.
86.
87.
88.
89.
90.
91.
92.
93.
94.
95.
96.
97.
98.
99.
100.
G. Gloeckner, Pure Appl. Chem. 55, 1553 (1983).
M. Alonso, F. Recasens, and L. Puiganer, Chem. Eng. Sci. 41, 1039 (1986).
G. Hempel and U. Ruedt, Disch. Eebensm.-Runsch. 84, 239 (1988).
I. Bruening, Bol. Tec. PETROBRAS, 26, 299 (1983).
K. Hidaka, Shokuhin Eiseigaku Z.asshi 22, 536 (1981).
R. G. Fordyce and E. C. Chapin,/. Am. Chem. Soc. 69, 581 (1947).
W. V. Smith, / Am. Chem. Soc. 70, 2177 (1948).
P. J. Flory, Principles opPolymer Chemistry, Cornell Univ. Press, Ithaca, N.Y., 1957, Chapter V.
L. J. Young, in J. Brandrup and E. H. Immergut, eds., PolymerElandbook, 2nd ed., John Wiley and Sons, Inc., New York, 1975, pp. II-128-II-139;
see also R. Z. Greenley in J. Brandup and E. H. Immergut, eds., PolymerElandbook, 3rd ed., Wiley-Interscience, New York, 1989, pp. II-165-II-171.
С. H. Basdekis, ABS Plastics, Reinhold Publishing Corp., New York, 1964, p. 47.
Brit. Pat. 1,328,625 (Aug. 30,1973) (to Daicel Ltd.).
R. V. Kucher, L. N. Anisimova, Yu. S. Zaitsev, N. B. Lachinov, and V. P. Zubov, Polym. Sci. USSR 20, 2793 (1978).
M. Suzuki, H. Miyama, and S. Fujimoto, Bull. Chem. Soc. Jpn. 35, 60 (1962).
H. Miyama and S. Fujimoto,/ Polym. Sci. 54, S32 (1961).
G. Mino, / Polym. Sci. 22, 369 (1956).
F. R. Mayo and F. M. Lewis,/ Am. Chem. Soc. 66,1594 (1944).
E. T. Mertz, T. Alfrey, and G. Goldfinger, J. Polym. Sci. 1, 75 (1946).
A. Guyot and J. Guillot,/ Macromol. Sci. Chem. Al, 793 (1967).
A. Guyot and J. Guillot,/ Macromol. Sci. Chem. A2, 889 (1968).
J. A. Seiner and M. Litt, Macromolecules 4, 308 (1971).
B. Sandner and E. Loth, Faserforsch Textiltech. 27, 571 (1976).
D. J. T. Hill, J. H. O'Donnell, and P. W. O'Sullivan, Macromolecules 15, 960 (1982).
G. S. Prementine and D. A. Tirrell, Macromolecules 20, 3034 (1987).
С. C. Lin, W. Y. Chiu, and С. T. Wang, / Appl. Polym. Sci. 23,1203 (1978).
T. Kikuta, S. Omi, andH. Kubota,/ Chem. Eng. Jpn. 9, 64 (1976).
Brit. Pat. 1,093,349 (Nov. 29, 1967), T. M. Fisler (to Ministerul Industrie! Chimice).
U.S. Pat. 3,772,257 (Nov. 13,1973), G. K. Bochum, P. K. Hurth Efferen, J. M. Liblar, and H. J. K. Hurth (to Knapsack A. G.).
U.S. Pat. 4,439,589 (Mar. 27,1984), H. Alberts, R. Schubart, and A. Pischtschan (to Bayer A.G.).
A. Guyot, J. Guillot, C. Pichot, and L. R. Gurerrero in D. R. Bassett and A. E. Hamielec, eds., Emulsion Polymers andEmulsion Polymerisation (Symp.
Ser. 165), American Chemical Society, Washington, D.C., 1981, p. 415.
J. Snuparek, Jr. and F. Krska,/ Appl. Polym. Sci. 21, 2253 (1977).
Ger. Pat. 141,314 (Apr. 23, 1980), H. P. Thiele and co-workers (to VEB Chemische Werke Buna).
Pol. Pat. PL 129,792 (Nov. 15, 1985), P. Penczek, E. Wardzinska, and G. Cynkowska (to Instytut Chemii Przemyslowej).
U.S. Pat. 4,251,412 (Feb. 17,1981), G. P. Ferrin! (to B. F. Goodrich Co.).
U.S. Pat. 4,255,307 (Mar. 10,1981), J. R. Miller (to B. F. Goodrich Co.).
U.S. Pat. 4,228,119 (Oct. 14,1980), I. L. Gomez and E. F. Tokas (to Monsanto Co.).
U.S. Pat. 4,215,024 (July 29,1980), I. L. Gomez and E. F. Tokas (to Monsanto Co.).
U.S. Pat. 4,215,085 (July 29,1980), I. L. Gomez (to Monsanto Co.).
U.S. Pat. 4,275,175 (June 23,1981), I. L. Gomez (to Monsanto Co.).
U.S. Pat. 4,252,764 (Feb. 24,1981), E. F. Tokas (to Monsanto Co.).
U.S. Pat. 3,248,455 (Apr. 26, 1966), J. E. Harsch and co-workers (to U.S. Rubber Co.).
Brit. Pat. 1,034,228 (June 29, 1966) (to U.S. Rubber Co.).
U.S. Pat. 3,249,569 (May 3, 1966), J. Fand (to Monsanto Co.).
U.S. Pat. 3,547,857 (Dec. 15,1970), A. G. Murray (to Uniroyal, Inc.).
Brit. Pat. 971,214 (Sept. 30,1964) (to Monsanto Co.).
U.S. Pat. 4,193,903 (Mar. 18,1980), В. E. Giddings, E. Wardlow, Jr., and B. L. Mehosky (to The Standard Oil Co. (Ohio)).
U.S. Pat. 3,738,972 (June 12,1973), K. Moriyama and T. Osaka (to Daicel Ltd.).
Brit. Pat. 1,328,625 (Aug. 30, 1973), K. Moriyama and S. Takahashi (to Daicel Ltd.).
Jpn. Pat. 80 000,725 (Jan. 7,1980), S. Kato and M. Astumi (to Denki Kagaku Kogyo KK).
Jpn. Pat. 78 082,892 (July 21,1978), S. Kato and M. Momoka (to Denki Kagaku Kogyo KK).
Jpn. Pat. 79 020,232 (July 20,1979), S. Kato and M. Momoka (to Denki Kagaku Kogyo KK).
Jpn. Pat. 79 119,588 (Sept. 17, 1979), K. Kido, H. Wakamori, G. Asai, and K. Kushida (to Kureha Chemical Industry Co., Ltd.).
Jpn. Pat. 82 167,303 (Oct. 15,1982) (to Toshiba Machine Co.).
U.S. Pat. 3,198,775 (Aug. 3, 1965), R. E. Delacretaz, S. P. Nemphos, and R. L. Walter (to Monsanto Co.).
U.S. Pat. 3,258,453 (June 28,1966), H. K. Chi (to Monsanto Co.).
U.S. Pat. 3,287,331 (Nov. 22,1966), Y. C. Lee and L. P. Paradis (to Monsanto Co.).
U.S. Pat. 3,681,310 (Aug. 1, 1972), K. Moriyama and T. Moriwaki (to Daicel Ltd.).
U.S. Pat. 3,243,407 (Mar. 29, 1966), Y. C. Lee (to Monsanto Co.).
U.S. Pat. 3,331,810 (July 18,1967), Y. C. Lee (to Monsanto Co.).
U.S. Pat. 3,331,812 (July 18, 1967), Y. C. Lee and S. P. Nemphos (to Monsanto Co.).
U.S. Pat. 3,356,644 (Dec. 5, 1967), Y. C. Lee (to Monsanto Co.).
U.S. Pat. 3,491,071 (Jan. 20,1970), R. Lanzo (to Montecatini Edison SpA).
Jpn. Pat. 83 103,506 (June 20,1983) (to Mitsubishi Rayon, Ltd.).
Jpn. Pat. 88 039,908 (Feb. 20,1988) (to Mitsui Toatsu Chemicals, Inc.).
Belg. Pat. 904,985 (Oct. 16, 1986), S. Ikuma (to Mitsubishi Monsanto Chemical Co.).
U.S. Pat. 3,141,868 (July 21, 1964), E. P. Fivel (to Resines et Verms Artificiels).
U.S. Pat. 3,201,365 (Aug. 17, 1965), R. K. Chadesworth, W. Creek, S. A. Murdock, and K. G. Shaw (to The Dow Chemical Company).
U.S. Pat. 2,941,985 (June 21, 1960), J. L. Amos and С. T. Miller (to The Dow Chemical Company).
U.S. Pat. 3,031,273 (Apr. 24,1962), G. A. Latinen (to Monsanto Co.).
U.S. Pat. 2,745,824 (May 15, 1956), J. A. Melchore (to American Cyanamid Co.).
Jpn. Pat. 73 021,783 (Mar. 19,1973), H. Sato, I. Nagai, T. Okamoto, and M. Inoue (to Toray, К. K. Ltd.).
R. L. Zimmerman, J. S. Best, P. N. Hall, and A. W. Hanson in R. F. Gould, ed., Polymerisation and Polycondensation Processes (Adv. Chem. Ser. 34),
American Chemical Society, Washington, D.C., 1962, p. 225.
Jpn. Pat. 87 179,508 (Aug. 6, 1987), N. Ito and co-workers (to Mitsui Toatsu Chemicals, Inc.).
Jpn. Pat. 83 037,005 (Mar. 4, 1983) (to Mitsui Toatsu Chemicals, Inc.).
U.S. Pat. 3,067,812 (Dec. 11,1962), G. A. Latinen and R. H. M. Simon (to Monsanto Co.).
U.S. Pat. 3,211,209 (Oct. 12,1965), G. A. Latinen and R. H. M. Simon (to Monsanto Co.).
Kirk-Othmer Encyclopedia of Chemical Technology (4th Edition)
199
SURVEY AND SAN
Voll
101.
102.
103.
104.
105.
106.
107.
108.
109.
110.
111.
112.
113.
114.
115.
116.
117.
118.
119.
120.
121.
122.
123.
124.
125.
126.
127.
128.
129.
130.
131.
132.
133.
134.
135.
136.
137.
138.
139.
140.
141.
142.
143.
144.
145.
146.
147.
148.
149.
150.
151.
152.
153.
154.
155.
156.
157.
158.
159.
160.
161.
162.
163.
164.
165.
166.
167.
168.
169.
170.
171.
172.
173.
174.
F. M. Peng, "Acrylonitrile Polymers" in J. I. Kroschwitz, ed., Enyclopedia of Polymer S cience and Engineering, 2nd ed., Vol. 1, Wiley-Interscience Inc.,
New York, 1985, p. 463.
F. M. Peng,/. Macromol Sci. Chem. A22, 1241 (1985).
S. Woods, Canadian Packaging 39(9), 48 (1986).
P. R. Lund and T. J. Bond, Soc. Plast. Eng. Tech. Pap. 24, 61 (1978).
R. C. Adams and S. J. Waisala, TAPPI Pap. Synth. Conf. Prepr, Adanta, Ga., 79 (1975).
Jpn. Pat. 85 097,823 (May 31,1985) (to Mitsui Toatsu Chemicals, Inc.).
U.S. Pat. 4,452,835 (June 5,1984), G. Vasudevan (to Union Carbide Corp.).
Ger. Pat. 2,656,993 (June 22,1978), R. E. Isley (to The Standard Oil Co. (Ohio)).
J. A. Cadson, Jr. and L. Boda, Mod. Plast. 57(6), 117 (1980).
U.S. Pat. 3,926,871 (Dec. 16, 1975), L. W. Hensley and G. S. Li (to The Standard Oil Co. (Ohio)).
U.S. Pat. 4,195,135 (Mar. 25,1980), G. S. Li and J. F. Jones (to The Standard Oil Co. (Ohio)).
U.S. Pat. 3,997,709 (Dec. 14,1976), W. Y. Aziz, L. E. Bah, and G. S. Li (to The Standard Oil Co. (Ohio)).
Fr. Pat. 2,207,938 (June 21,1974) (to Polysar Ltd.).
Can. Pat. 991,787 (June 22,1976), M. H. Richmond andH. G. Wright (to Polysar Ltd.).
U.S. Pat. 4,301,112 (Nov. 17, 1981), M. M. Zwick (to American Cyanamid Co.).
U.S. Pat. 4,025,581 (May 24,1977), J. A. Powell and A. Williams (to Rohm and Haas Co.).
Jpn. Pat. 79 058,794 (May 11, 1979), H. Futukawa and S. Matsumura (to Kanegafuchi Chemical Industry Co., Ltd.).
Fr. Pat. 2,389,644 (Dec. 1, 1978), P. Hubin-Eschger (to ATO-Chimie S.A.).
Jpn. Pat. 75 124,970 (Oct. 1, 1975), A. Kobayashi and M. Ohya (to Kureha Chemical Industry Co., Ltd.).
Jpn. Pat. 87 013,425 (Jan. 22,1987), M. Fujimoto, T. Yamashita, andT. Matsumoto (to Kanebo NSC KK).
U.S. Pat. 4,000,359 (Dec. 28, 1976), W. A. Watts and J. L. Wang (to Goodyear Tire and Rubber Co.).
U.S. Pat. 3,832,335 (Sept. 27, 1974), J. W. Bayer (to Owens-Illinois, Inc.).
Jpn. Pat. 74 021,105 (May 29, 1974), M. Takahashi, K. Yanagisawa, and T. Mori (to Sekisui Chemical Co., Ltd.).
U.S. Pat. 3,959,550 (May 25, 1976), M. S. Guillod and R. G. Bauer (to Goodyear Tire and Rubber Co.).
Fr. Pat. 2,041,137 (Mar. 5,1971), Q. A. Trementozzi (to Monsanto Co.).
Ger. Pat. 2,134,814 (May 31, 1972), T. Yamawaki, M. Hayashi, and K. Endo (to Mitsubishi Chemical Industries Co., Ltd.).
U.S. Pat. 3,725,120 (Apr. 3, 1973), C. A. Suter (to Goodyear Tire and Rubber Co.).
Ger. Pat. 1,546,809 (Jan. 31,1974), D. S. Dixler (to Air Products and Chemicals, Inc.).
Jpn. Pat. 87 256,871 (Nov. 9, 1987), H. Sakai and T. Kotani (to Asahi Chemical Industry Co., Ltd.).
Ger. Pat. 2,436,137 (Feb. 13, 1975), B. N. Hendy (to Imperial Chemical Industries Ltd.).
S. Yabumoto, K. Ishii, and K. Arita,/ Polym. Sci. Al, 1577 (1969).
N. G. Gaylord, S. S. Dixit, and В. K. Patnaik,/ Polym. Sci. B, 9, 927 (1971).
N. G. Gaylord, S. S. Dixit, S. Maiti, and В. K. Patnaik,/ Macromol. Sci. Chem. 6, 1495 (1972).
K. Arita, T. Ohtomo, and Y. Tsunami,/. Polym. Sci., Polym. Eett. Ed. 19, 211 (1981).
C. D. Eisenbach and co-workers. Angew. Makromol. Chem. 145/146, 125 (1986).
H. Hirai,/ Polym. Sci. Macromol. Ren. 11, 47 (1976).
A. Henglein, Makromol. Chem. 14,128 (1954).
A. Chapiro,/ Polym. Sci. 23, 377 (1957).
A. D. Jenkins, Pure Appl. Chem. 46, 45 (1976).
H. Craubner,/ Polym. Sci., Polym. Chem. Ed. 18, 2011 (1980).
I. G. Krasnoselskaya and B. L. Erusalimskii, Vysokomol. Soedin., Ser. В 29, 442 (1987).
A. Noshay and J. E. McGrath, Block Copolymers: Overview and Critical Survey, Academic Press, Inc., New York, 1977.
J. E. Turner, M. Shen, and С. C. Lin,/ Appl. Polym. Sci. 25, 1287 (1980).
E. I. Stout, D. Trimnell, W. M. Doane, and C. R. Russell,/ Appl. Polym. Sci. 21, 2565 (1977).
W. P. Lindsay, TAPPIAnnualMeetingPreprints, Adanta, Ga., 1977, p. 203.
F. Sundardi,/ Appl. Polym. Sci. 22, 3163 (1978).
U.S. Pat. 4,134,863 (Jan. 16, 1979), G. F. Fanta, E. I. Stout, andW. M. Doane (to U.S. Dept, of Agriculture).
Chem. Eng. News 67(25), 45 (June 19, 1989).
United States Food and Drug Administration, Fed. Regist. 52(173), 33802—33803 (Sept. 8, 1987).
United States Food and Drug Administration, Fed. Regist., 4510—26, 43(11), 2586 (Jan. 17,1978).
National Institute for Occupational Safety and Health, "A Recommended Standard for Occupational Exposure to Acrylonitrile," DHEW Publ.
No. 78—116, U.S. Government Printing Office Washington, D.C., 1978.
N. I. Sax and R. J. Lewis, Sr., Dangerous Properties of Industrial Materials, 7th ed., Van Nostrand Reinhold, 1989.
R. E. Lenga, The SigmaAldrich Eibrary of Chemical Safety Data, Sigma-Aldrich Corp., Milwaukee, Wis., 1985.
M. Sittig, ed., Priority Toxic Pollutants, Noyes Data Corporation, Park Ridge, N.J., 1980.
"Threshold Limit Values for Chemical Substances in the Work Environment Adopted by ACGIH for 1985—86," American Conference of
Government Industrial Hygienists, Cincinnati, Ohio, 1985.
"Criteria for Recommended Standard Occupational Exposure to Styrene", U.S. Department of Health and Human Services (NIOSH),
Washington, D.C. Rep. 83—119, pp. 18, 227,1983; available from NTIS, Springfield, Va.
J. Santodonato and co-workers, Monograph on Human Exposure to Chemicals in the Work Place; Styrene, PB86—155132, Syracuse, N.Y., July 1985.
Jpn. Pat. 76 000,581 (Jan. 6, 1976), M. Nishizawa and co-workers (to Toray Industries, Inc.).
Jpn. Pat. 82 185,144 (Nov. 15,1982) (to Gunze Ltd.).
Jpn. Pat. 81117,652 (Sept. 16, 1981) (to Asahi Chemical Industry Co., Ltd.).
U.S. Pat. 4,389,437 (June 21,1983), G. P. Hungerford (to Mobil Oil Corp.).
Jpn. Pat. 88 041,139 (Feb. 22,1988) (to Mitsui Toatsu Chemicals, Inc.).
Jpn. Pat. 83 119,858 (July 16,1983) (to Toyobo Co., Ltd.).
Jpn. Pat. 83 183,465 (Oct. 26,1983) (to Dainippon Printing Co., Ltd.).
Jpn. Pat. 84 012,850 (Jan. 23,1984) (to Asahi Chemical Industry Co., Ltd.).
Jpn. Pat. 85 009,739 (Jan. 18,1985) (to Toyo Seikan Kaisha, Ltd.).
Eur. Pat. Appl. EP 138,194 (Apr. 24,1985), J. H. Im and W. E. Shrum (to The Dow Chemical Company).
U.S. Pat. 4,364,759 (Dec. 21,1982), A. A. Brooks, J. M. S. Herds, and M. K. Tripodi (to Monsanto Co.).
Jpn. Pat. 84 202,237 (Nov. 16, 1984) (to Toyota Central Research and Development Laboratories, Inc.).
Jpn. Pat. 85 202,701 (Oct. 14, 1985), T. Kawai and T. Nogi (to Toray Industries, Inc.).
H. Kawato, M. Kakimoto, A. Tanioka, and T. Inoue, Renkyu Hokoku—Asahi Garasu Kogyo Gijutsu Shoreikai 49, 77 (1986).
Eur. Pat. Appl. EP 141,584 (May 15, 1985), R. W. Baker (to Bend Research, Inc.).
Y. S. Ku and S. O. Kim, Takhak Hoechi 31(3), 182 (1987).
U.S. Pat. 4,330,635 (May 18,1982), E. F. Tokas (to Monsanto Co.).
Kirk-Othmer Encyclopedia of Chemical Technology (4th Edition)
200
SURVEY AND SAN
Voll
175. Ger. Pat. 3,523,612 (Jan. 23,1986), N. Sakata and I. Hamada (to Asahi Chemical Industry Co., Ltd.).
176. Jpn. Pat* 84 024,752 (Feb. 8, 1984) (to Kanebo Synthetic Fibers, Ltd.).
177. Ger. Pat. 3,512,638 (Feb. 27, 1986), H. J. Kress and co-workers (to Bayer A.G.).
178. Jpn. Pat* 88 089,403 (Apr. 20, 1988) (to Sumitomo Chemical Co., Ltd.).
179. Jpn. Pat. 82 059,075 (Dec. 13,1982) (to Nichimen Co., Ltd.).
180. S. Milkov and T. Abadzhieva, Fz^. Khim. Mekh. 11, 81 (1983).
181. A. M. Gadalla and M. E. ELDerini, Polym. Eng. Sci. 24, 1240 (1984).
182. Ger. Pat. 2,652,427 (May 26, 1977), G. E. Cartier and J. A. Snelgrove (to Monsanto Co.).
183. Jpn. Pat. 82 137,359 (Aug. 24,1982) (to Nippon Electric Co., Ltd.).
184. Jpn. Pat* 83 001,143 (Jan. 6,1983) (to Fujitsu Ltd.).
185. Jpn. Pat* 88 040,169 (Feb. 20, 1988), Y. Takahashi, M. Nakamura, Y. Kitahata, and K. Maeda (to Sharp Corp.).
186. Jpn. Pat* 86 092,453 (May 10, 1986), Y. Ichihara and Y. Uratani (to Mitsubishi Petrochemical Co., Ltd.).
187. Braz. Pat. 87 818 (Dec. 22, 1987), T. P. Christini (to E. I. du Pont de Nemours & Co., Inc.).
188. Jpn. Pat* 84 018,750 (Jan. 31, 1984) (to Sanyo Chemical Industries, Ltd.).
189. Jpn. Pat* 84 080,447 (May 9, 1984) (to Mitsubishi Rayon Co., Ltd.).
190. P. Albihn and J. Kubat, Plast. Rubber Process. Appl. 3(3), 249 (1983).
191. U.S. Pat. 4,327,012 (Apr. 27, 1982), G. Salee (to Hooker Chemicals and Plastics Corp.).
192. Jpn. Pat* 83 217,536 (Dec. 17, 1983) (to Asahi Chemical Industry Co., Ltd.).
193. Eur. Pat. Appl. EP 96,301 (D ec. 21, 1983), H. Peters and co-workers (to Bayer A.G.).
194. Y. Fujita and co-workers, Kobunshi Ronbunshu, 43(3), 119 (1986).
195. H. Takahashi and co-workers,/. Appl. Polym. Sci. 36, 1821 (1988).
196. Ger. Pat. 2,830,232 (Mar. 29, 1979), W. J. Peascoe (to Uniroyal, Inc.).
197. Jpn. Pat* 083,088 (July 2, 1979), S. Ueda, K. Tazaki, H. Kitayama, and I. Kuribayashi (to Asahi-Dow Ltd.).
198. Ger. Pat. 2,826,925 (Jan. 17, 1980), J. Swoboda, G. Lindenschmidt, and C. Bernhard (to BASF A.G.).
199. U.S. Pat. 3,944,631 (Mar. 16, 1976), A. J. Yu and R. E. Gallagher (to Stauffer Chemical Co.).
200. H. Bard and co-workers, Paper 15,MGV National Meeting, Division of Industrial Engineering Chemistry, Adanta, Ga., Mar. 29—Apr. 3,1981.
201. Jpn. Pat* 79 083,049 (July 2, 1979), S. Ueda, K. Tazaki, H. Kitayama, and N. Asamizu (to Asahi-Dow Ltd.).
202. U.S. Pat. 4,071,577 (J an. 31, 1978), J. R. Falender, С. M. Metder, and J. C. Saam (to Dow Corning Corp.).
203. Mod. Plast. 60(1), 92 (1983).
204. U.S. Pat. 4,224,207 (Sept. 23,1980), J. C. Falk (to Borg-Warner Corp.).
205. U.S. Pat. 4,169,195 (Sept. 25,1979), M. K. Rinehart (to Borg-Warner Corp.).
206. Jpn. Pat. 81 016,541 (Feb. 17,1981) (to Asahi-Dow Ltd.).
207. Ger. Pat. 2,916,668 (Nov. 13, 1980), J. Hambrecht, G. Lindenschmidt, and W. Regel (to BASF A.G.).
208. Jpn. Pat* 80 157,604 (Dec. 8, 1980) (to Daicel Chemical Industries, Ltd.).
209. T. C. Wallace, SPE Regional Technical Conference, Las Vegas, Nev., Sept. 16—18,1975.
General References
Reference 101 is a general reference.
С. H. Bamford and G. E. Eastmond, "Acrylonitrile Polymers" in N. M. Bikales, ed., Encyclopedia ofPolymer Science andTechnology, Vol. 1, Interscience
Publishers, a Division of John Wiley & Sons, Inc., New York, 1964, pp. 374—425.
Lawrence E. Ball
Benedict S. Curatolo
BP Research
Kirk-Othmer Encyclopedia of Chemical Technology (4th Edition)
201
ABS RESINS
Voll
ABS RESINS
Acrylonitrile—butadiene—styrene (ABS) polymers [9003-56-9] are composed of elastomer dispersed as a grafted particulate phase in a thermoplastic matrix
of styrene and acrylonitrile copolymer (SAN) [9003-54-7]. The presence of SAN grafted onto the elastomeric component, usually polybutadiene or a
butadiene copolymer, compatabilizes the rubber with the SAN component. Property advantages provided by this graft terpolymer include excellent
toughness, good dimensional stability, good processability, and chemical resistance. Property balances are controlled and optimized by adjusting elastomer
particle size, morphology, microstructure, graft structure, and SAN composition and molecular weight. Therefore, although the polymer is a relatively low
cost engineering thermoplastic the system is structurally complex. This complexity is advantageous in that altering these structural and compositional
parameters allows considerable versatility in the tailoring of properties to meet specific product requirements. This versatility may be even further enhanced
by adding various monomers to raise the heat deflection temperature, impart transparency, confer flame retardancy, and, through alloying with other
polymers, obtain special product features. Consequently, research and development in ABS systems is active and continues to offer promise for achieving
new product opportunities.
Physical Properties
The range of properties typically available for general purpose ABS is illustrated in Table 1 (1). Numerous grades of ABS are available including new alloys
and specialty grades for high heat, plating, flaming-retardant, or static dissipative product requirements (1,2). Reference 1 discusses stress—strain behavior,
creep, stress relaxation, and fatigue in ABS materials.
Table 1. Material Properties of General Purpose and Heat Distortion Resistant ABSa
Properties ASTM Method High impact Medium impact Heat resistant
notched Izod impact at RT, J/m D256 347-534 134-320 107-347
tensile strength, MPa D638 33-43 30-52 41-52
tensile modulus, GPa D638 1.7-2.3 2.1-2.8 2.1-2.6
flexural modulus, GPa D790 1.7-2.4 2.2-3.0 2.1-2.8
elongation to yield, % D638 2.8-3.5 2.3-3.5 2.8-3.5
Rockwell hardness D785 80-105 105-112 100-111
heat deflection6, °C at 1820 kPaf D648 96-102 93-104 104-116
ё f heat deflection , °C at 455 kPa D648 99-107 102-107 110-118
Vicat softening pt, °C D1525 91-106 94-107 104-118
coefficient of linear thermal expansion, xlO5 cm/cm-°C D696 9.5-11.0 7.0-8.8 6.5-9.2
dielectric strength, kV/mm D149 16-31 16-31 14-35
dielectric constant, xlO6 Hz D150 2.4-3.8 2.4-3.8 2.4-3.8
aRef. 1.
To convert J/m to ftlb/in. divide by 53.4.
To convert MPa to psi multiply by 145.
d To convert GPa to psi multiply by 145,000.
e л л
Annealed.
To convert kPa to psi multiply by 0.145.
Impact Resistance. Toughness is a primary consideration in the selection of ABS for many applications. ABS is structured to dissipate the
energy of an impact blow through shear and dilational modes of deformation. Upon impact, the particulate rubber phase promotes both the initiation and
termination of crazes. Crazes are regions of considerable strength that contain both voids and polymer fibrils oriented in the stress direction. Crazes are
terminated by mutual interference or are stopped by other rubber particles, thereby dissipating energy without the formation of a crack, which would lead
to catastrophic failure. Shear deformation also contributes to stress relaxation. The behavior of the rubber phase is understood from analyses of the stress
distribution surrounding the particulate rubber phase. The rubber component may exist in a state of triaxial tension due to the higher rate of thermal
contraction of the rubber compared to styrene—acrylonitrile copolymer upon cooling after molding. Crazes, in general, are initiated at local points of stress
concentration. Mechanisms and the factors affecting fracture toughness have been discussed in detail in the literature (3—12).
The inherent ductility of the matrix phase depends on the composition of the SAN copolymer and is reported to increase with increasing
acrylonitrile content (3). Controlling rubber particle size, distribution, and microstructure are important in optimizing impact strength. Good adhesion
between the rubber and the matrix phase is also essential and is achieved by an optimized graft structure (3,8,10,13). Typically, toughness is increased by
increasing the rubber content and the molecular weight of the ungrafted SAN.
Rheology. Effects of structure of ABS on viscosity functions can be distinguished by considering effects at lower shear rates (<10/s) vs higher
shear rates. At higher shear rates melt viscosity is primarily determined by ungrafted SAN structure and the percentage of graft phase. The modulus curves
correspond in their shape to that of the ungrafted SAN component, and the rubber particle type and concentration have little effect on the temperature
dependence of the viscosity function (14). The extrudate swell, however, becomes smaller with increasing rubber concentration (15).
By contrast, the graft phase structure has a marked effect on viscosity at small deformation rates. The long time relaxation spectra are affected by
rubber particle—particle interactions (16,17), which are strongly dependent on particle size, grafting, morphology, and rubber content. Depending on
particle surface area, a minimum amount of graft is needed to prevent the formation of three-dimensional networks of associated rubber particles (17).
Thus at low shear rates ABS can behave similarly to a cross-linked rubber; the network structure, however, is dissolved by shearing forces. Extensive
studies on the viscoelastic properties of ABS in the molten state have been reported (14—21). Effects of lubricants and other nonpolymeric components
have also been described (22).
Gloss. Surface gloss values can be achieved ranging from a very low matte finish at <10% (60° Gardner) to high gloss in excess of 95%. Gloss is
dependent on the specific grade and the mold or polishing roll surface.
Kirk-Othmer Encyclopedia of Chemical Technology (4th Edition)
202
ABS RESINS
Voll
Electrical Properties. (See Table 1.) A new family of ABS products exhibiting electrostatic dissipative properties without the need for
nonpolymeric additives or fillers (carbon black, metal) is now also commercially available (2).
Thermal Properties. ABS is also used as a base polymer in high performance alloys. Most common are ABS—polycarbonate alloys which
extend the property balance achievable with ABS to offer even higher impact strength and heat resistance (2).
Color. ABS is sold as an unpigmented powder, unpigmented pellets, precolored pellets matched to exacting requirements, and "salt-and-pepper"
blends of ABS and color concentrate. Color concentrates can also be used for online coloring during molding.
Chemical Properties
The behavior of ABS may be inferred from consideration of the functional groups present within the polymer.
Chemical Resistance. The term chemical resistance is generally used in an appEcations context and refers to resistance to the action of
solvents in causing swelling or stress cracking as well as to chemical reactivity. In ABS the polar character of the nitrile group reduces interaction of the
polymer with hydrocarbon solvents, mineral and vegetable oils, waxes, and related household and commercial materials. Good chemical resistance
provided by the presence of acrylonitrile as a comonomer combined with relatively low water absorptivity (<1%) results in high resistance to staining agents
(eg, coffee, grape juice, beef blood) typically encountered in household applications (23).
Like most polymers, ABS undergoes stress cracking when brought into contact with certain chemical agents under stress (23,24). Injection molding
conditions can significandy affect chemical resistance, and this sensitivity varies with the ABS grade. Certain combinations of melt temperature, fill rate, and
packing pressure can significandy reduce stress cracking resistance, and this effect is interactive in complex ways with the imposed stress level that the part
is subjected to in service. Both polymer orientation and stress appear to be considerations; thus critical strains can be higher in the flow direction (25).
Consequently, all media to be in contact with the ABS part during service should be evaluated under anticipated end-use conditions.
Processing Stability. Processing can influence resultant properties by chemical and physical means (26,27). Degradation of the rubber and
matrix phases has been reported under very severe conditions (28). Morphological changes may become evident as agglomeration of dispersed rubber
particles during injection molding at higher temperatures (28). Physical effects such as orientation and molded-in stress can have marked effects on
mechanical properties. Thus the proper selection and control of process variables are important to maintain optimum performance in molded parts.
Antioxidants (qv) added at the compounding step have been shown to help retention of physical properties upon processing (26).
Appearance changes evident under certain processing conditions include color development (26), changes in gloss (28), and splaying. Discoloration
may be minimized by reducing stock temperatures during molding or extrusion. Splaying is the formation of surface imperfections elongated in the
direction of flow and is typically caused by moisture, occluded air, or gaseous degradation products; proper drying conditions are essential to prevent
moisture-induced splay.
Techniques for evaluating processing stabiEty and mechanochemical effects include using a Brabender torque rheometer (29,30), injection molding
(26,28), capillary rheometry (26,28), and measuring melt index as a function of residence time (26).
Thermal Oxidative Stability. ABS undergoes autoxidation and the kinetic features of the oxygen consumption reaction are consistent with
an autocatalytic free-radical chain mechanism. Comparisons of the rate of oxidation of ABS with that of polybutadiene and styrene—acrylonitrile copolymer
indicate that the polybutadiene component is significantly more sensitive to oxidation than the thermoplastic component (31—33). Oxidation of
polybutadiene under these conditions results in embrittlement of the rubber because of cross-linking; such embrittlement of the elastomer in ABS results in
the loss of impact resistance. Studies have also indicated that oxidation causes detachment of the grafted styrene—acrylonitrile copolymer from the
elastomer which contributes to impact deterioration (34).
Examination of oven-aged samples has demonstrated that substantial degradation is limited to the outer surface (34), ie, the oxidation process is
diffusion limited. Consistent with this conclusion is the observation that oxidation rates are dependent on sample thickness (32). Impact property
measurements by high speed puncture tests have shown that the critical thickness of the degraded layer at which surface fracture changes from ductile to
brittle is about 0.2 mm. Removal of the degraded layer restores ductiEty (34). Effects of embrittled surface thickness on impact have been studied using
ABS coated with styrene—acrylonitrile copolymer (35).
Antioxidants have been shown to improve oxidative stabiEty substantially (36,37). The use of rubber-bound stabilizers to permit concentration of
the additive in the rubber phase has been reported (38—40). The partitioning behavior of various conventional stabilizers between the rubber and
thermoplastic phases in model ABS systems has been described and shown to correlate with solubiEty parameter values (41). Pigments can adversely affect
oxidative stabiEty (32). Test methods for assessing thermal oxidative stabiEty include oxygen absorption (31,32,42), thermal analysis (43,44), oven aging
(34,45,46), and chemiluminescence (47,48).
Photooxidative Stability. Unsaturation present as a structural feature in the polybutadiene component of ABS (also in high impact
polystyrene, rubber-modified PVC, and butadiene-containing elastomers) also increases EabiEty with regard to photooxidative degradation (49—51). Such
degradation only occurs in the outermost layer (52,53), and impact loss upon Eradiation can be attributed to embrittlement of the rubber and possibly to
scission of the grafted styrene—acrylonitrile copolymer (49,54). Oxidative degradation induced by prior processing may affect photosensitivity (49,55).
Appearance changes such as yeEowing are also induced by Eradiation and caused by chromophore formation in both the polybutadiene and
styrene—acrylonitrile copolymer components (49,56). Comparative data on ABS with other acryEc-based plastics have been reported (57).
AppEcations involving extended outdoor exposure, especially in cErect sunlight, requhe protective measures such as the use of stabilizing additives,
pigments, and protective coatings and film. Light stabilizers provide some measure of protection (58,59) as illustrated by the very successful use of ABS in
interior automotive trim. Effects of polymer-bound stabilizers have been described (60). Pigments can significantly enhance stabiEty. Paints are also highly
effective in minimizing weather degradation (61). A particularly effective technique for sheet products is the lamination during extrusion of an acryEc film
to ABS. Test methods for assessing light stabiEty include outdoor exposure (62) and accelerated testing (62,63). Reactivity toward singlet oxygen has been
reported (64). The current trend in accelerated light-aging for ABS in automotive appEcations is the use of xenon arc testing.
Flammability. The general purpose grades are usually recognized as 94 HB according to the requhements of Underwriters' Laboratories UL94
and also meet the requhements, dependent on thickness, of the Motor Vehicle Safety Standard 302. Flame-retardant (FR) grades (V0, VI, and V2) are also
available which meet Underwriters' UL 94/94 5V and Canadian Standards Association (CSA) requhements beginning at a minimum thickness of 1.57 mm.
Flame retardancy is achieved by utilizing halogen in combination with antimony oxide or by alloys with PVC or PC. A new FR grade utilizing
polymer-bound bromine has been developed to avoid additive bloom and toxicity (65).
Polymerization
In all manufacturing processes, grafting is achieved by the free-radical copolymerization of styrene and acrylonitrile monomers in the presence of an
elastomer. Ungrafted styrene—acrylonitrile copolymer is formed during graft polymerization and/or added afterward.
Mechanism. A grafting mechanism involving the direct reaction of initiator radicals with the elastomer is supported by reports that percentage
grafting is dependent on the nature of the initiator (66—69). Initiators which generate radicals effective in abstraction from the rubber backbone (eg, oxy vs
carbon radicals) are generally more efficient in promoting graft formation. However, kinetic data and the fact that grafting does occur in reactions initiated
by carbon radicals (eg, from 2,2,-azobisisobutyronitrile) suggest that grafting by copolymerization may also occur (66) and proceed concurrently. The
degree of grafting is a function of factors including the 1,2-vinyl content of the polybutadiene, monomer concentration, extent of conversion, initiator,
temperature, and mercaptan concentration (66—71).
Monomer compositional drifts may also occur due to preferential solution of the styrene in the rubber phase or solution of the acrylonitrile in the
aqueous phase (72). In emulsion systems, rubber particle size may also influence graft structure so that the number of graft chains per unit of rubber
particle surface area tends to remain constant (73). Factors affecting the distribution (eg, core-shell vs "wart-like" morphologies) of the grafted copolymer
on the rubber particle surface have been studied in emulsion systems (74). Effects due to preferential solvation of the initiator by the polybutadiene have
been described (75,76).
Kirk-Othmer Encyclopedia of Chemical Technology (4th Edition)
203
ABS RESINS
Voll
In addition to graft copolymer attached to the rubber particle surface, the formation of styrene—acrylonitrile copolymer occluded within the rubber
particle may occur. The mechanism and extent of occluded polymer formation depends on the manufacturing process. The factors affecting occlusion
formation in bulk (77) and emulsion processes (78) have been described. The use of block copolymers of styrene and butadiene in bulk systems can control
particle size and give rise to unusual particle morphologies (eg, coil, rod, capsule, cellular) (77).
Manufacturing
There are three commercial processes for manufacturing ABS: emulsion, mass, and mass-suspension.
Emulsion Process. The emulsion (79,80) ABS process involves two steps, production of a rubber latex and subsequent polymerization of
styrene and acrylonitrile in the presence of the rubber latex to produce an ABS latex. This latex is then processed to isolate the ABS resin (81,82).
The rubber latex is usually produced in batch reactors. The rubber can be polybutadiene [9003-17-2] or a copolymer of 1,3-butadiene [106-99-0] and
either acrylonitrile [107-13-1] or styrene [100-42-5]. The latex normally has a polymer content of approximately 30 to 50%; most of the remainder is water.
In addition to the monomers, the polymerization ingredients include an emulsifier, a polymerization initiator, and usually a chain-transfer agent for
molecular weight control.
After the rubber latex is produced, it is subjected to further polymerization in the presence of styrene (CgHg) and acrylonitrile (C3H3N) monomers
to produce the ABS latex. This can be done in batch, semibatch, or continuous reactors. The other ingredients required for this polymerization are similar
to those required for the rubber latex reaction.
The ABS polymer is recovered through coagulation of the ABS latex. Coagulation is usually achieved by the addition of an agent to the latex which
destabilizes the emulsion. The resulting slurry can then be filtered or centrifuged to recover the ABS resin. The wet resin is dried to a low moisture content.
A variety of dryers can be used for ABS, including tray, fluid bed, and rotary kiln type dryers.
The emulsion process for making ABS has been commercially practiced since the early 1950s. Its advantage is the capability of producing ABS with
a wide range of compositions, particularly higher rubber contents than are possible with the other processes. Typically, the rubber content percentage can
be varied from approximately 10 to over 90. Mixing and transfer of the heat of reaction in an emulsion polymerization is achieved more easily than in the
mass polymerization process because of the low viscosity and good thermal properties of the water phase. The energy requirements for the emulsion
process are generally higher than for the other processes because of the energy usage in the polymer recovery area. The emulsion process has a greater
wastewater treatment demand than the other processes because of the quantity of water used.
Mass Process. In the mass (or bulk) (83) ABS process the polymerization is conducted in a monomer medium rather than in water. This
process usually consists of a series of two or more continuous reactors. The rubber used in this process is most commonly a solution-polymerized linear
polybutadiene (or copolymer containing sytrene), although some mass processes utilize emulsion-polymerized ABS with a high rubber content for the
rubber component (84). If a linear rubber is used, a solution of the rubber in the monomers is prepared for feeding to the reactor system. If emulsion ABS
is used as the source of rubber, a dispersion of the ABS in the monomers is usually prepared after the water has been removed from the ABS latex.
If a linear rubber is used as a feedstock for the mass process (85), the rubber becomes insoluble in the mixture of monomers and SAN polymer
which is formed in the reactors, and discrete rubber particles are formed. This is referred to as phase inversion since the continuous phase shifts from
rubber to SAN. Grafting of some of the SAN onto the rubber particles occurs as in the emulsion process. Typically, the mass-produced rubber particles
are larger (0.5 to 5 Цт) than those of emulsion-based ABS (0.1 to 1 Цт) and contain much larger internal occlusions of SAN polymer. The reaction recipe
can include polymerization initiators, chain-transfer agents, and other additives. Diluents are sometimes used to reduce the viscosity of the monomer and
polymer mixture to facilitate processing at high conversion. The product from the reactor system is devolatilized to remove the unreacted monomers and is
then pelletized. Equipment used for devolatilization includes single- and twin-screw extruders, and flash and thin film evaporators. Unreacted monomers
are recovered for recycle to the reactors to improve the process yield.
The mass ABS process was originally adapted from the mass polystyrene process (86). Mass-produced ABS typically has very good unpigmented
color and is usually somewhat translucent, which may reduce the concentration of colorants required. The mass-produced grafted rubber typically is more
efficient at impact modification than emulsion-grafted rubber; however, the extent of rubber incorporation is limited to approximately 15% because of
viscosity limitations in the process. The surface gloss of the mass-produced ABS is generally lower than that of emulsion ABS due to the presence of the
larger rubber particles.
Mass-Suspension Process. The mass-suspension process (87) utilizes a mass reaction to produce a partially converted mixture of polymer
and monomer and then employs a suspension reaction technique (88) to complete the polymerization. This is a batch process. The mass reaction is the
same as that described above for mass polymerization using a linear rubber, and the rubber particles formed during phase inversion are also similar to those
formed in the mass process. When the conversion of the monomers is approximately 15 to 30% complete, the mixture of polymer and unreacted
monomers is suspended in water with the introduction of a suspending agent. The reaction is continued until a high degree of monomer conversion is
attained. Unreacted monomers are stripped from the product before the slurry is centrifuged and dried. The mass-suspension product is in the form of
small beads (typically 100 to 500 Цт in diameter). The morphology and properties of the mass-suspension product are similar to those of the
mass-polymerized product. The mass-suspension process retains some of the process advantages of the water-based emulsion process, such as lower
viscosity in the reactor and good heat removal capability.
Compounding. ABS either is sold as an unpigmented product, in which case the customer may add pigments during the forming process, or it
is colored by the manufacturer prior to sale. Much of the ABS produced by the mass process is sold unpigmented. If colorants, lubricants, stabilizers, or
alloying resins are added to the product, a compounding operation is required. ABS is compounded on a range of equipment, including batch and
continuous melt mixers, and both single- and twin-screw extruders. In the compounding step, more than one type of ABS may be employed (ie, emulsion
and mass-produced) to obtain an optimum balance of properties for a specific application. Products can also be made in the compounding process by
combining emulsion ABS having a high rubber content with mass or suspension polymerized SAN.
Analysis
Analytical investigations may be undertaken to identify the presence of an ABS polymer, characterize the polymer, or identify nonpolymeric ingredients.
Fourier transform infrared (ftir) spectroscopy is the method of choice to identify the presence of an ABS polymer and determine the
acrylonitrile—butadiene—styrene ratio of the composite polymer (89,90). Confirmation of the presence of rubber domains is achieved by electron
microscopy. Comparison with available physical property data serves to increase confidence in the identification or indicate the presence of unexpected
structural features. Identification of ABS via pyrolysis gas chromatography (91) and dsc ((92) has also been reported.
Detailed compositional and molecular weight analyses involve: determining the percentage of grafted rubber; determining the molecular weight and
distribution of the grafted SAN and the ungrafted SAN; and determining compositional data on the grafted rubber, the grafted SAN, and the ungrafted
SAN. This information is provided by a combination of phase-separation and instrumental techniques. Separation of the ungrafted SAN from the graft
rubber is accomplished by ultracentrifugation of ABS dispersions (93,94) which causes sedimentation of the grafted rubber. Cleavage of the grafted SAN
from the elastomer is achieved using oxidizing agents such as ozone [10028-15-6] (94,95), potassium permanganate [7722-64-7] (96), or osmium tetroxide
[20816-12-0] with /^-butyl-hydroperoxide [75-91-2] (97). Chromatographic and spectroscopic analyses of the isolated fractions provide structural data on
the grafted and ungrafted SAN components (98). Information on the microstructure of the rubber is provided by analysis of the cleavage products derived
from the substrate (94,96). The extraction of ungrafted rubber has also been reported (99).
Additional information on elastomer and SAN microstructure is provided by 13C-nmr analysis (100). Rubber particle composition may be inferred
from glass-transition data provided by thermal or mechanochemical analysis. Rubber particle morphology as obtained by transmission or scanning electron
microscopy (101) is indicative of the ABS manufacturing process (77). (See Figs. 1 and 2.)
Kirk-Othmer Encyclopedia of Chemical Technology (4th Edition)
204
ABS RESINS
Voll
Fig. 1. Transmission electron micrograph of ABS produced by an emulsion process. Staining of the rubber bonds with osmium tetroxide provides contrast
with the surrounding SAN matrix phase.
Fig. 2. Transmission electron micrograph of ABS produced by a mass process. The rubber domains are typically larger in size and contain higher
concentrations of occluded SAN than those produced by emulsion technology.
The isolation and/or identification of nonpolymerics has been described, including analyses for residual monomers (90,102,103) and additives
(90,104—106). The determination of localized concentrations of additives within the phases of ABS has been reported; the partitioning of various additives
between the elastomeric and thermoplastic phases of ABS has been shown to correlate with solubility parameter values (41).
Processing
Good thermal stability plus shear thinning allow wide flexibility in viscosity control for a variety of processing methods. ABS exhibits non-Newtonian
viscosity behavior. For example, raising the shear rate one decade from 100/s to 1000/s (typical in-mold shear rates) reduces the viscosity by 75% on a
general purpose injection molding grade. Viscosity can also be reduced by raising melt temperature; typically increasing the melt temperature 20 to 30°C
within the allowable processing range reduces the melt viscosity by about 30%. ABS can be processed by all the techniques used for other thermoplastics:
compression and injection molding, extrusion, calendering, and blow-molding (see Plastics processing). Clean, undegraded regrind can be reprocessed in
most applications (plating excepted), usually at 20% with virgin ABS. Postprocessing operations include cold forming; thermoforming; metal plating;
painting; hot stamping; ultrasonic, spin, and vibrational welding; and adhesive bonding.
Material Handling and Drying. Although uncompounded powders are available from some suppliers, most ABS is sold in compounded
pellet form. The pellets are either precolored or natural to be used for in-house coloring using dry or Equid colorants or color concentrates. These pellets
have a variety of shapes including diced cubes, square and cylindrical strands, and spheroids. The shape and size affect several aspects of material handling
such as bulk density, feeding of screws, and drying (qv). Very small particles called fines can be present as a carryover from the pelletizing step or
transferring operations; these tend to congregate at points of static charge build up. Certain additives can be used to control static charges on pellets (107).
ABS is mildly hygroscopic. The moisture diffuses into the pellet and moisture content is a reversible function of relative humidity. At 50% relative
humidity typical equilibrium moisture levels can be between 0.3 and 0.6% depending on the particular grade of ABS. In very humid situations moisture
content can be double this value. Although there is no evidence that this moisture causes degradation during processing, drying is required to prevent voids
and splay (108) and achieve optimum surface appearance. Drying down to 0.1% is usually sufficient for general purpose injection molding and 0.05% for
critical applications such as plating. For nonvented extrusion and blow-molding operations a maximum of 0.02% is required for optimum surface
appearance.
Kirk-Othmer Encyclopedia of Chemical Technology (4th Edition)
205
ABS RESINS
Voll
Desiccant hot air hopper dryers are recommended, preferably mounted on the processing equipment. Tray driers are not recommended, but if used
the pellet bed should be no more than 5 cm deep. Many variables affect drying rates (109,110); the pellet temperature has a stronger effect than the dew
point. Most pellet drying problems can be a result of actual pellet temperatures being too low in the hopper. Large particles dry much more slowly than
pellets, thus regrind should be protected from moisture regain. Supplier data sheets should be consulted for specific drying conditions. Several devices are
available commercially for analytically determining moisture contents in ABS pellets (111—113). Alternatives to pellet drying are vented injection molding
(114) and cavity-air pressurization (counterpressure) (115).
Injection Molding.
Equipment. Although plunger machines can be used, the better choice is the reciprocating screw injection machine because of better melt
homogeneity. Screws with length-to-diameter ratios of 20:1 and a compression ratio of 2—3:1 are recommended. General purpose screws vary significandy
in number and depth of the metering flights; long and shallow metering zones can create melt temperature override which is particulady undesirable with
dame-retardent (FR) grades of ABS. Screws with a generous transition length perform best because of better melting rate control (116). Good results have
been realized with a long transition "zero-meter" screw design (117). Some comments on the performance of general purpose and two-stage vented screws
used for coloring with concentrates is given in reference 118. Guidelines for nozzle and nonreturn valve selection as well as metallurgy are given in
references 119 and 120. Gas-nitrided components should be avoided; ion-nitrided parts are acceptable.
A variety of mold types can be used: two plate, three plate, stack, or runnedess. Insulated runner molds are not recommended. If heated torpedoes
are used with hot manifold molds, they should be made from a good grade of stainless steel and not from beryllium copper. Molds are typically made from
P-20, H-13, S-7, or 420 stainless; chrome or electroless plating is recommended for use with FR grades of ABS. Mold cavities should be well vented (0.05
mm deep) to prevent gas bums. Polished, hill round, or trapezoidal runners are recommended; half or quarter round runners are not. Most conventional
gating techniques are acceptable (119,120). On polished molds a draft angle of 0.5° is suggested to ease part ejection; side wall texturing requires an
additional 1° per 0.025 mm of texture depth. Mold shrinkage is typically in the range of 0.5 to 0.9% (0.005 to 0.009 cm/cm) depending on grade, and the
shrinkage value for a given grade can vary much more widely than this because of the design of parts and molding conditions.
Processing Conditions. Certain variables should be monitored, measured, and recorded to aid in reproducibility of the desired balance of
properties and appearance. The individual ABS suppliers provide data sheets and brochures specifying the range of conditions that can be used for each
product. Relying on machine settings is not adequate. Identical cylinder heater settings on two machines can result in much different melt temperatures.
Therefore, melt temperatures should be measured with a fast response hand pyrometer on an air shot recovered under normal screw rpm and
back-pressure. Melt temperatures range from 218 to 268°C depending on the grade. Generally, the allowable melt temperature range within a grade is at
least 28°C. Excessive melt temperatures cause color shift, poor gloss control, and loss of properties. Similarly, a fill rate setting of 1 cm/s ram travel will not
yield the same mold filling time on two machines of different barrel size. Fill time should be measured and adjusted to meet the requirements of getting a
full part, and to take advantage of shear thinning without undue shear heating and gas bums. Injection pressure should be adjusted to get a full part free of
sinks and good definition of gloss or texture. Hydraulic pressures of less than 13 MPa (1900 psi) usually suffice for most molding. Excessive pressure
causes flash and can result in loss of some properties. Mold temperatures for ABS range from 27 to 66°C (60 to 82°C for high heat grades). The final
properties of a molded part can be influenced as much by the molding as by the grade of ABS selected for the application (121). The factors in
approximate descending order of importance are polymer orientation, heat history, free volume, and molded-in stress. Izod impact strength can vary
severalfold as a function of melt temperature and fill rate because of orientation effects, and the response curve is ABS grade dependent (122). The effect
on tensile strength is qualitatively the same, but the magnitude is in the range of 5 to 10%. Modulus effects are minimal. Orientation distribution in the part
is very sensitive to the flow rate in the mold; therefore, fill rate and velocity-to-pressure transfer point are important variables to control (123). Dart impact
is also sensitive to molding variables, and orientation and thermal history can also be key factors (124). Heat deflection temperature can be influenced by
packing pressure (125) because of free volume considerations (126). The orientation on the very surface of the part results from an extensionally stretching
melt front and can have deleterious effects on electro-plate adhesion and paintability. A phenomenon called the mold-surface-effect, which involves
grooving the nonappearance half of the mold, can be employed to reduce unwanted surface orientation on the noncorresponding part surface (127—129).
Other information regarding the influence of processing conditions on part quality are given in references 130—134.
Part Design. For optimum economics and production cycle time, wall thicknesses for ABS parts should be the minimum necessary to satisfy
service strength requirements. The typical design range is 0.08 to 0.32 cm, although parts outside this range have been successfully molded. A key principle
that guides design is avoiding stress concentrators such as notches and sharp edges. Changes in wall thickness should be gradual, sharp comers should be
avoided, and generous radii (25% of the wall thickness) used at wall intersections with ribs and bosses. To avoid sinks, rib thickness should be between 50
and 75% of the nominal wall. Part-strength at weld lines can be diminished; thus welds should be avoided if possible or at least placed in noncritical areas
of the part (135). Because of polymer orientation, properties such as impact strength vary from point to point on the same part and with respect to the
flow direction (121). Locations of highest Izod impact strength can be points of lowest dart impact strength because of the degree and direction of
orientation. ABS suppliers can provide assistance with design of parts upon inquiry and through design manuals (136). There are a number of special
considerations when designing parts for metal plating to optimize the plating process, plate deposition uniformity, and final part quality (137). ABS parts
can be also designed for solid—solid or solid—foam co-injection molding (138) and for gas-assisted-injection molding (139).
Extrusion.
Equipment. Since moisture removal is even more critical with extrusion than injection molding, desiccant hot-air hopper drying of the pellets
to 0.02% moisture is essential for optimum properties and appearance. The extruder requirements are essentially the same for pipe, profile, or sheet.
Two-stage vented extruders are preferred since the improved melting control and volatile removal can provide higher rates and better surface appearance.
Barrels are typically 24:1 minimum Е/D for single-stage units and 24 or 36:1 for two-stage vented units. The screws are typically 2:1 to 2.5:1 compression
ratio and single lead, full flighted with a 17.7° helix angle. Screen packs (20“40 mesh = 840“420 /ип) are recommended.
For sheet, streamlined coat-hanger type dies are preferred over the straight manifold type. Typically, three highly polished and temperature
controlled rolls are used to provide a smooth sheet surface and control thickness (140). Special embossing rolls can be substituted as the middle roll to
impart a pattern to the upper surface of the sheet. ABS and non-ABS films can be fed into the polishing rolls to provide laminates for special applications,
eg, for improved weatherability, chemical resistance, or as decoration. Two rubber pull rolls, speed synchronzied with the polishing rolls, are located far
enough downstream to allow sufficient cooling of the sheet; finally, the sheet goes into a shear for cutting into lengths for shipping.
Pipe can be sized using internal mandrels with air pressure contained by a downstream plug or externally using a vacuum bushing and tank. Cooling
can be done by immersion, cascade, or mist. Water temperatures of 41 to 49°C at the sizing zone reduce stresses. Foamcore pipe has increased in market
acceptance significandy over the last few years, and cooling unit lengths must be longer than for solid pipe. Drawdown should not exceed 10 to 15%.
Profile dies can be fiat plates or the streamline type. Flat plate dies are easy to build and inexpensive but can have dead spots that cause hang-up,
polymer degradation, and shutdowns for cleaning. Streamlined, chrome-plated dies are more expensive and complicated to build but provide for higher
rates and long runs. The land length choice represents a tradeoff; long lands give better quality profile and shape retention but have high pressure drops
that affect throughput. Land length to wall thickness ratios are typically 10:1. Drawdown can be used to compensate for die swell but should not exceed
25% to minimize orientation. Sizing jigs vary in complexity depending on profile design; water mist, fog, or air cooling can be used. The latter gives more
precise sizing. Also, water immersion vacuum sizing can be used. Accurate, infinitely adjustable speed control is important to the takeoff end equipment to
guarantee dimensional control of the profile.
With sheet or pipe, multilayer coextrusion can be used. Solid outer-solid core coextrusion can place an ABS grade on the outside that has special
attributes such as color, dullness, chemical resistance, static dissipation, or fire-retardancy over a core ABS that is less expensive or even regrind.
Composites can be created in which the core optimizes desired physical properties such as modulus, whereas the outer layer optimizes surface
considerations not inherent in the core material. Solid outer—foam core can provide composites with significant reductions in specific gravity (0.7). Dry
blowing agents can be "dusted" onto the pellets or liquid agents injected into the first transition section of the extruder.
Extrusion processing conditions vary depending on the ABS grade and application; vendor bulletins should be consulted for details. Information
for assistance in troubleshooting extrusion problems can be found in reference 141.
Calendering. The rheological characteristics of the sheet extrusion grades of ABS easily adapt them to calendering to produce film from 0.12
Kirk-Othmer Encyclopedia of Chemical Technology (4th Edition)
206
ABS RESINS
Voll
to 0.8 mm thick for vacuum forming or as laminates for sheet. The advantages of this process over extrusion are the capability for thinner gauge product
and quick turnaround for short runs.
Blow Molding. Although ABS has been blow molded for over 20 years, this processing method has been gaining popularity recendy for a
variety of applications (142). Better blow-molding grades of ABS are being provided by tailoring the composition and rheological characteristics specifically
to the process. Whereas existing polyolefin equipment can often be easily modified and adjusted to mold ABS, there are some key requirements that require
attention.
Pellet predrying is required down to 0.02 to 0.03% moisture. High shear polyolefin screws must be replaced with low shear 2.0:1 to 2.5:1 screws with
Е/D ratios of 20:1 to 24:1 to keep the melt temperature in the 193 to 221°C optimum range. The land length of the tooling can be reduced to 3:1—5:1
because ABS shows less die swell; this also helps to reduce the melt pressure resulting from the higher viscosity. The accumulator tooling should be
streamlined to reduce hang-up and improve re-knit, and be capable of handling the higher pressures required with large programmed parisons. Mold
temperatures of 77 to 88°C provide good surface finish. It is recommended that the material vendor be consulted to confirm equipment capability and
provide safety and processing information (143).
Secondary Operations.
Thermoforming'. ABS is a versatile thermoforming material. Forming techniques in use are positive and negative mold vacuum forming,
bubble and plug assist, snapback and single- or twin-sheet pressure forming (144). It is easy to thermoform ABS over the wide temperature range of 120 to
190°C. As-extruded sheet should be wrapped to prevent scuffing and moisture pickup. Predrying sheet that has been exposed to humid air prevents
surface defects; usually 1 to 3 h at 70—80°C suffices. Thick sheet should be heated slowly to prevent surface degradation and provide time for the core
temperature to reach the value needed for good formability. Relatively inexpensive tooling can be made from wood, plaster, epoxies, thermoset materials,
or metals. Tools should have a draft angle of 2° to 3° on male molds and S° to 1° on female molds. More draft may be needed on textured molds. Vacuum
hole diameters should not exceed 50% of the sheet thickness. Mold design should allow for 0.003 to 0.008 cm/cm mold shrinkage; exact values depend on
mold configuration, the material grade, and forming conditions. Maximum depth of draw is usually limited to part width in simple forming, but more
sophisticated forming techniques or relaxed wall uniformity requirements can allow greater draw ratios. Some definitions for draw ratios are given in
Reference 145. Pressure forming, with well-designed tools, can make parts approaching the appearance and detailing obtained by injection molding.
Additional information on pressure forming is given in Reference 146.
Cold Forming. Some ABS grades have ductility and toughness such that sheet can be cold formed from blanks 0.13—6.4 mm thick using
standard metal-working techniques. Up to 45% diameter reduction is possible on the first draw; subsequent redraws can yield 35%. Either aqueous or
nonaqueous lubrication is required. More details are available in Reference 147.
Other Operations.
Metallizing. ABS can be metallized by electroplating, vacuum deposition, and sputtering. Electroplating (qv) produces the most robust coating;
progress is being made on some of the environmental concerns associated with the chemicals involved by the development of a modified chemistry. An
advantage to sputtering is that any metal can be used, but wear resistance is not as good as with electroplating. Attention must be paid to the molding and
handling of the ABS parts since contamination can affect plate adhesion, and surface defects are magnified after plating. Also, certain aspects of part design
become more important with plating; these are covered in References 128 and 137 (see also Electroless plating; Metallic coatings.)
Fastening, Bonding, andJoining. Often parts can be molded with various snap-fit designs (148) and bosses to receive rivets or
self-tapping screws. Thermal-welding techniques that are easily adaptable to ABS are spin welding (149), hot plate welding, hot gas welding, induction
welding, ultrasonic welding, and vibrational welding (150,151). ABS can also be nailed, stapled, and riveted. There are a variety of adhesives and solvent
cements for bonding ABS to itself or other materials such as wood, glass, and metals; for more information, contact the material or adhesives suppliers.
Joining ABS with materials of different coefficients of thermal expansion requires special considerations when wide temperature extremes are encountered.
An excellent review of joining methods for plastics is given in reference 152.
Applications
Its broad property balance and wide processing window has allowed ABS to become the largest selling engineering thermoplastic. ABS enjoys a unique
position as a "bridge" polymer between commodity plastics and other higher performance engineering thermoplastics. Table 2 summarizes estimates for
1988 regional consumption of ABS resins by major use.
Table 2. Markets for ABS Plastics by Region in 1988a, 103 t
United States and Canada Western Europe Japan Total %
transportation 139 120 96 355 25
appliances 95 97 117 309 22
business machines 124 60 99 283 20
pipe and fittings 91 23 114 8
other 98 144 102 344 25
total 547 444 414 1405 100
aRef. 153.
In 1988 the largest market for ABS resins worldwide was transportation. Uses are numerous and include both interior and exterior applications.
Interior injection-molded applications account for the greatest volume. General purpose and high heat grades have been developed for automotive
instrument panels, consoles, door post covers, and other interior trim parts. ABS resins are considered by many the preferred material for components
situated above the "waistline" of the car. Exterior applications include radiator grilles, headlight housings, and extruded/thermoformed fascias for large
trucks. ABS plating grades also account for significant ABS sales and include applications such as knobs, light bezels, mirror housings, grilles, and
decorative trim. Appliances were the second largest market segment for ABS. The majority of this consumption was for major appliances;
extruded/thermoformed door and tank liners lead the way. Transparent ABS grades are also used in refrigerator crisper trays. Other applications in the
appliance market include injection-molded housings for kitchen appliances, power tools, vacuum sweepers, sewing machines, and hair dryers.
A large "value-added" market for ABS is business machines and other electrical and electronic equipment. Although general purpose
injection-molding grades meet the needs of applications such as telephones and micro floppy disk covers, significant growth exists in more demanding
flame-retardant applications such as computer housings and consoles.
Pipe and fittings remain a significant market for ABS, particularly in North America. ABS foam core technology allows ABS resin to compete
effectively with PVC in the primary drain-waste and vent (DWV) pipe market.
Other uses of ABS include consumer and industrial applications such as luggage, toys, medical devices, furniture, shower stalls, and bathroom
fixtures.
Economic Aspects
Capacity. Estimated ABS capacity worldwide in 1989 is given in Table 3. Accurate ABS capacity figures are difficult to obtain because
significant production capability is considered "swing" and can be used to manufacture polystyrene or SAN as well as ABS. The United States has the
largest ABS nameplate production capacity of any country at 867 x 103 tons accounting for approximately 25% of the world's capacity. Three producers
Kirk-Othmer Encyclopedia of Chemical Technology (4th Edition)
207
ABS RESINS
Voll
account for over 50% of the world's capacity; GE Plastics is the largest (Table 4).
Table 3. Worldwide Capacity for ABS Plastic in 1989*, 103 t
Americas
United States 867
Canada 70
other 157
total 1,094
Europe
Benelux 282
Germany 210
France 60
Eastern Europe 78
other 270
total 837
Pacific
Japan 753
Taiwan 502
Korea 160
other 92
total 1,507
Worldwide total 3,438
aRef. 154.
Table 4. World Capacity of Leading ABS Producers*
Company 1990 Capacity, 103 t
GE Plastics Chi Mei Industrial Monsanto 740 550 547
aRef. 154.
Price. The price history of ABS in the United States is presented in Table 5 for the period from 1979 to 1987. The almost continual rise in prices
during this period not only reflects the overall increase in cost of labor and feedstocks, but the changing mix of ABS resins and blends towards higher
value, higher performance applications.
Table 5. U.S. Unit Sales Values for ABS Resins*
Year Value, $/kg Year Value, $/kg
1979 1.17 1984 1.85
1980 1.41 1985 1.78
1981 1.63 1986 1.63
1982 1.74 1987 1.74
1983 1.78
aRef. 155.
Although ABS resins have a long history by industry standards, the products are anything but mature. ABS resins and blends are, and are expected
to remain, the engineering thermoplastics of choice for a wide array of markets.
BIBLIOGRAPHY
"Acrylonitrile Polymers, ABS Resins" in ECT 3rd ed., Vol. 1, pp. 442—456, by G. A. Morneau, W. A. Pavelich, and L. G. Roettger, Borg-Wamer Chemicals.
1. С. T. Pillichody and P. D. Kelley in I. I. Rubin, ed., Handbook of Plastic Materials and Technology Wiley & Sons, Inc., New York, 1990, Chapt. 3.
2. R. D. Leaversuch, Mod. Plast. 66(1), 77 (1989).
3. H. Kim, H. Keskkula, and D. R. Paul, Polymer M, 869 (1990).
4. G. H. Michler,/ Mater. Sci. 25, 2321 (1990).
5. E. M. Donald and E. J. Kramer,/. Mater. Sci. 17, 1765 (1982).
6. L. V. Newmann and J. G. Williams,/ Mater. Sci. 15, 773 (1980).
7. С. B. Bucknail, ToughenedPlastics, Applied Science Publishers, London, 1977.
8. M. Rink, T. Ricco, W. Lubert, and A. Pavan,/ Appl. Polym. Sci. T2., 429 (1978).
9. J. Mann and G. R. Williamson in R. N. Haward, ed., The Physics ofiGlassy Polymers,Wiley & Sons, Inc., New York, 1973, Chapt. 8.
10. H. Keskkula, Appl. Polym. Symp. 15, 51 (1970).
11. J. A. Schmitt,/ Polym. Sci. C30, 437 (1970).
12. S. L. Rosen, Polym. Eng. Sci. 7, 115 (1967).
13. L. Bohn, Angew. Makromol. Chem. 20, 129 (1971).
14. A. Zosel, Pheol. Acta 11, 229 (1972).
15. H. Munstedt, Polym. Eng. Sci. 21, 259 (1981).
16. Y. Aoki and K. Nakayama, Pofim. J. 14, 951 (1982).
17. Y. Aoki, Macromolecules 20, 2208 (1987).
18. Y. Aoki,/ Non-Newtonian YluidMech. T2., 91 (1986).
19. M. G. Huguet andT. R. Paxton, Colloidal and Morphological Behavior ofiBlock and Graft Copolymers, Plenum, New York, 1971,pp. 183—192.
Kirk-Othmer Encyclopedia of Chemical Technology (4th Edition)
208
ABS RESINS
Voll
20.
21.
22.
23.
24.
25.
26.
27.
28.
29.
30.
31.
32.
33.
34.
35.
36.
37.
38.
39.
40.
41.
42.
43.
44.
45.
46.
47.
48.
49.
50.
51.
52.
53.
54.
55.
56.
57.
58.
59.
60.
61.
62.
63.
64.
65.
66.
67.
68.
69.
70.
71.
72.
73.
74.
75.
76.
77.
78.
79.
80.
81.
82.
83.
84.
85.
86.
87.
T. Masuda and co-workers, Pure Appl. Chem. 56, 1457 (1984).
A. Casale, A. Moroni, and C. Spreafico in Copolymers, Polyblends, and Composites (Adv. in Chem. Ser. No. 142), American Chemical Society,
Washington, D.C., 1975, p. 172.
L. L. Blyler Jr., Polym. Eng. Sei. 14(11), 806 (1974).
D. M. Kulich, P. D. Kelley, and J. E. Pace in J. I. Kroschwitz, ed., Encyclopedia of Polymer S tience and Engineering, 2nd ed., Vol. 1, Wiley-Interscience,
New York, 1985, p. 396.
F. M. Smith, Manufacture of Plastics, Vol. 1, Reinhold Publishing Corp., New York, 1964, p. 443.
D. L. Fulkner, Polym. Eng. Sci. 24, 1174 (1984).
J. M. Heaps, Rubber Plast. Age, 967 (1968).
T. H. Rogers and R. B. Roennau, Chem. Eng. Progress 62(11), 94 (1966).
A. Casale and O. Salvatore, Polym. Eng. Sci. 15, 286 (1975).
W. I. Congdon, H. E. Bair, and S. K. Khanna, Org. Coatings Plast. Chem. 40, 739 (1979).
M. L. Heckaman, Soc. Plast. Eng. Tech. Pap. 18, 512 (1972).
B. D. Gesner,/ Appl. Polym. Sci. 9, 3701 (1965).
P. G. Kelleher, J. Appl. Polym. Sci. 10, 843 (1966).
J. Shimada,/ Appl. Polym. Sci. 12, 655 (1968).
M. D. Wolkowicz and S. Gaggar, Polym. Eng. Sci. 21, 571 (1981).
P. So and L. J. Broutman, Polym. Eng. Sci. 22, 888 (1982).
B. Gilg, H. Muller, and K. Schwarzenbach. Paper presented atMAtawr in Stabilisation and ControlledDegradation of Polymers, New Paltz, N.Y., June
1982.
J. Shimada, K. Kabuki, and M. Ando, Ren. Electr. Commun. Eab. 20, 564 (1972).
F. Gugumus in G. Scott, ed., Developments in Polymer Stabilisation, Vol. 1, Elsevier Applied Science Publishers, Ltd., London 1979, p. 319.
G. Scott, Developments in Polymer Stabilisation, Vol. 4, Elsevier Applied Science Publishers, Ltd., London, 1981, p. 181.
Eur. Pats. 0109008 and 0108396, J. C. Wozny (to Borg-Wamer Corp.).
D. M. Kulich and M. D. Wolkowicz in Rubber-Toughened Plastics (Adv. in Chem. Ser. No. 222), American Chemical Society, Washington, D.C.,
1989, p. 329.
B. D. Gesner, SPE J. 25, 73 (1969).
J. Kovarova, L. Rosik, and J. Pospisil, Polym. Mater. Sci. Eng. 58, 215 (1988).
F. Gugumus in G. Scott, ed., Developments in Polymer Stabilisation, Vol. 8., Elsevier, New York, 1987, p. 243.
D. M. Chang, Org. Coatings Plast. Chem. 44, 347 (1981).
M. G. Wygoski, Polym. Eng. Sci. 16, 265 (1976).
L. Zlatkevich in P. Klemchuk, ed., Polymer Stabilisation and Degradation (ACS Symp. Ser. No. 280), American Chemical Society, Washington, D.C.,
1985, Chapt. 27.
L. Zlatkevich,/. Polym. Sci. Polym. Phys. Ed. 25, 2207 (1987).
G. Scott and M. Tahan, Eur. Polym. J. 13, 981 (1977).
M. Tahan, Weathering of Plastics and Rubber, International Symposium of the Institute of Electrical Engineers, Eondon, June 1976, Chamelon Press, Ltd.,
London, 1976, p. A2.1.
J. B. Adeniyi, Eur. Pofm.J. 20, 291 (1984).
E. Priebe, P. Simak, and G. Stange, Kunststoffe 62, 105 (1972).
T. Hirai, Jpn. Plast. 23, Oct. 1970.
M. Ghaemy and G. Scott, Polym. Degrad. Stab. 3, 233 (1981).
J. B. Adeniyi and E. G. Kolawole, Eur. Polym. J. 20, 43 (1984).
R. D. Deanin, I. S. Rabinovic, and A. Llompart saMulticomponent Polymer Systems (Adv. in Chem. Ser. No. 99), American Chemical Society,
Washington, D.C., 1971, p. 229.
A. Blaga and R. S. Yamasaki, Durab. of Build. Mater. 4, 21 (1986).
J. Shimada and K. Kabuki,/. Appl. Polym. Sci. 12, 671 (1968).
T. Kurumada, H. Ohsawa, and T. Yamazaki, Polym. Degrad. Stab. 19, 263 (1987).
E. G. Kolawole and J. B. Adeniyi, Eur. Polym. J. 18, 469 (1982).
T. R. Bullet and P. R. Mathews, Plast. Polym. 39, 200 (1971).
A. Davis and D. Gordon,/ Appl. Polym. Sci. 18, 1159 (1974).
P. G. Kelleher, D. J. Boyle, and R. J. Miner, Mod. Plast. 189 (Sept. 1969).
M. L. Kaplan and P. G. Kelleher,/ Polym. Sci. PartA-1 8, 3163 (1970).
Product Information, GE Plastics, Pittsfield, Mass.
R. A. Hayes and S. Futamura,/ Polym. Sci. Polym. Chem. Ed. 19, 985 (1981).
A. Brydon, G. M. Burnett, and C. G. Cameron,/ Polym. Sci. Polym. Chem. Ed. 12, 1011 (1974).
P. W. Allen, G. Ayrey, and C. G. Moore,/ Polym. Sci. 36, 55 (1959).
J. L. Locatelli and G. Riess, Angew. Makromol. Chem. 32, 117 (1973).
G. Reiss and J. L. Locatelli in Copolymers, Polyblends, and Composites (Adv. in Chem. Ser. No. 142), American Chemical Society, Washington, D.C.,
1975, p. 186.
B. Chauvel and J. C. Daniel in Copolymers, Polyblends, and Composites (Adv. in Chem. Ser. No. 142), American Chemical Society, Washington, D.C.,
1975, p. 159.
J. L. Locatelli and G. Riess, Angew. Makromol. Chem. 27, 201 (1972).
C. F. Parsons and E. L. Suck, Jr., Multicomponent Polymer Systems (Adv. in Chem. Ser. No. 99), American Chemical Society, Washington, D.C., 1971,
p. 340.
J. Stabenow and F. Haaf, Angew. Makromol. Chem. 29—30, 1 (1973).
J. L. Locatelli and G. Riess,/ Polym. Sci. Polym. Chem. Ed. 2, 3309 (1973).
J. L. Locatelli and G. Riess, Angew. Makromol. Chem. 32, 101 (1973).
A. Echte in Rubber-Toughened Plastics (Adv. in Chem. Ser. No. 222), American Chemical Society, Washington, D.C., 1989, p. 15.
E. Beati, M. Pegoraro, E. Pedemonte, Angeir. Makrom. Chem. 149, 55 (1987).
G. Odian, Principles of Polymerisation, McGraw-Hill, Inc. New York, 1970, Chapt. 4.
P. J. Flory, Principles of Polymer Chemistry, Cornell University Press, Ithaca, N.Y., 1953, pp. 203—217.
U.S. Pat. 2,820,773 (Jan. 21,1958), C. W. Childers and C. F. Fisk (to United States Rubber Co.).
U.S. Pat. 3,238,275 (Mar. 1, 1966), W. C. Calvert (to Borg-Wamer Corp.).
Ref. 79, Chapt. 3.
U.S. Pat. 3,950,455 (Apr. 13, 1976), T. Okamoto and co-workers (to Toray Industries, Inc.).
U.S. Pat. 3,660,535 (May 2, 1972), C. R. Finch and J. E. Knutzsch (to The Dow Chemical Company).
U.S. Pat. 2,694,692 (Nov. 16, 1954), J. L. Amos, J. L. McCurdy, and O. R. McIntire (to The Dow Chemical Company).
U.S. Pat. 3,515,692 (June 2,1970), F. E. Carrock and K. W. Doak (to Dart Industries, Inc.).
Kirk-Othmer Encyclopedia of Chemical Technology (4th Edition)
209
ABS RESINS
Voll
88. F. Rodriguez, Principles of Polymer Systems, McGraw-Hill, Inc., New York, 1970, Chapt. 5.
89. J. Haslam, H. A. Willis, and D. С. M. Squirrell, Identification and Analysis of Plastics., 2nd ed., Heyden Book Co. Inc., Philadelphia, 1980, Chapt. 8.
90. J. C. Cobbler and G. E. Stobbe in F. D. Snell and L. S. Ettre, eds., Encyclopedia of Industrial ChemicalAnalysis, Vol. 18, Wiley-Interscience, New York,
1973, p. 332.
91. T. Okumoto and T. Tadaoki, Nippon Kagaku Kaishi 1, 71 (1972).
92. K. Sircar and T. Lamond, Thermochim. Acta 7, 287 (1973).
93. B. D. Gesner,/ Polym. Sci. Part A 3, 3825 (1965).
94. L. D. Moore, W. W. Moyer, and W. J. Frazer, Appl. Polym. Symp. 7, 67 (1968).
95. J. Tsurugi, T. Fukumoto, and K. Ogawa, Chem. High Polym. (Tokyo) 25, 116 (1968).
96. H. Shuster, M. Hoffmann, and K. Dinges, Angew. Makrom. Chem. 9, 35 (1969).
97. D. Kranz, K. Dinges, and P. Wendling, Angew. Makrom. Chem. 51, 25 (1976).
98. D. Kranz, H. V. Pohl, andH. Baumann, Angew. Makrom. Chem. 26, 67 (1972).
99. R. R. Turner, D. W. Carlson, and A. G. Altenau,/. ElastomerPlast. 6, 94 (1974).
100. L. W. Jelinski and co-workers, / Polym. Sci. Polym. Chem. Ed. 20, 3285 (1982).
101. V. G. Kampf andH. Shuster, Angew. Makrom. Chem. 14, 111 (1970).
102. D. Simpson, Br. Plast. 78 (1968).
103. L. I. Petrova, M. P. Noskova, V. A. Balandine, and Z. G. Guricheva, Gig Sanit. 37, 62 (1972).
104. T. R. Crompton, Chemical Analysis of Additives in Plastics, Pergamon Press, New York, 1971.
105. N. E. Skelly, J. D. Graham, and Z. Iskandarani, Polym. Mater. Sci. Eng. 59, 23 (1988).
106. R. Yoda, Bunseki 1,29 (1984).
107. R. J. Pierce andj. W. Bozzelli, Paper presented at the 45th Annual Technical Conference of the Society of Plastics Engineers, May 1987, p. 19.
108. L. W. Fritch, Paper presented at the 33rd Annual Technical Conference of the Society of Plastics Engineers, May 1975, p. 70.
109. L. W. Fritch, Plast. Technol. 69 (1980).
110. Cycolac BrandABS Pellet Drying, Technical Publication SR-601A, GE Plastics, 1989.
111. J. W. Bozzelli, B. J. Furches, and S. L. Janiki, Mod. Plast. 7 (1988).
112. Product Bulletin: Micro Moisture II, ZARAD Technology Inc., Cary, HI.
113. Product Bulletin E38855, DuPont 903 Moisture Evolution Analyzer, DuPont Company, Instrument Systems, Wilmington, Del.
114. B. Miller, Plast. World A (1987).
115. H. Lord, Paper presented at the 36th Annual Technical Conference of the Society of Plastics Engineers, May 1978, p. 83.
116. R. E. Nunn, Injection MoldingHandbook, VanNostrand Reinhold Co., New York, 1986, Chapt. 3.
117. B. Miller, Plast. WorldbWfi), 34 (1982).
118. B. Furches and J. Bozzelli, Paper presented at the 45th Annual Technical Conference of the Society of Plastics Engineers, May 1987, p. 6.
119. Cycolac BrandABS Resin Injection Molding, Technical Publication CYC-400, GE Plastics, Pittsfield, Mass., 1990.
120. MoldingFlame RetardentABS, Technical Publication P-408, GE Plastics, Pittsfield, Mass., 1989.
121. L. W. Fritch, Injection MoldingHandbook, VanNostrand Reinhold Co., New York, 1986, Chapt. 19.
122. L. W. Fritch, Plast. Eng. 43 (1989).
123. L. W. Fritch, Paper presented at the 45th Annual Technical Conference of the Society of Plastics Engineers, May 1987, p. 218.
124. L. W. Fritch, Paper presented at the 40th Annual Technical Conference of the Society of Plastics Engineers, May 1982, p. 332.
125. L. W. Fritch, Paper presented at the 5th Pacific Area Technical Conference of the Society of Plastics Engineers, Feb. 1980.
126. S. Gaggar and J. Wilson, Paper presented at the 40th Annual Technical Conference of the Society of Plastics Engineers, May 1982, p. 157.
127. L. W. Fritch, Paper presented at the 37th Annual Technical Conference of the Society of Plastics Engineers, May 1979, p. 15.
128. L. W. Fritch, Prod. Finish. Cincinnati 48(5), 42 (1984).
129. L. W. Fritch, Plast. Machin. Equip. 43 (1988).
130. R. M. Criens and H. Mosle, Paper presented at the 42nd Annual Technical Conference of the Society of Plastics Engineers, May 1984, p. 587.
131. J. W. Bozzelli and P. A. Tiffany, Paper presented at the 44th Annual Technical Conference of the Society of Plastics Engineers, May 1986, p. 120.
132. U. Wolfel and G. Menges, Paper presented at the 45th Annual Technical Conference of the Society of Plastics Engineers, May 1987, p. 292.
133. S. M. Janosz, Paper presented at the 45th Annual Technical Conference of the Society of Plastics Engineers, May 1987, p. 323.
134. H. Cox and C. Mentzer, Polym. Eng Sci. 26, 488 (1986).
135. G. Brewer, Paper presented at the 45th Annual Technical Conference of the Society of Plastics Engineers, May 1987, p. 252.
136. Cycolac BrandABS Resin Design Guide, Technical Publication CYC-350, GE Plastics, Pittsfield, Mass., 1990.
137. Cycolac BrandABS Electroplating, Technical Publication 402, GE Plastics, Pittsfield, Mass., 1990.
138. M. Snyder, Plast. Machin. Equip. 50 (1988).
139. К. C. Rusch, Paper presented at the 45th Annual Technical Conference of the Society of Plastics Engineers, May 1987, p. 1014.
140. W. Virginski, Paper presented at the 46th Annual Technical Conference of the Society of Plastics Engineers, May 1988, p. 205.
141. Plast. World, 28 (1987).
142. L. E. Ferguson and R. J. Brinkmann, Paper presented at the 45th Annual Technical Conference of the Society of Plastics Engineers, May 1987, p.
866.
143. Cycolac BrandABS—General Purpose Blow Molding Grades, Technical Publication SR-616, GE Plastics, Pittsfield, Mass., 1989.
144. Thermoforming Cycolac BrandABS, Technical Publication P-406, GE Plastics, Pittsfield, Mass., 1989.
145. J. L. Throne, Paper presented at the 45th Annual Technical Conference of the Society of Plastics Engineers, May 1987, p. 412.
146. N. Nichols and G. Kraynak, Plast. Technol. 73 (1987).
147. R. Royer, Paper presented at the Regional Conference of the Society of Plastics Engineers, Quebec Section, 1968, p. 43.
148. G. Trantina and M. Minnicheli, Paper presented at the 45th Annual Technical Conference of the Society of Plastics Engineers, May 1987, p. 438.
149. T. L. La Bounty, Paper presented at the 43rd Annual Technical Conference of the Society of Plastics Engineers, May 1985, p. 855.
150. Cycolac Brand ABS Resin—Assembly Techniques, Technical Publication CYC-352, GE Plastics, Pittsfield, Mass., 1990.
151. H. Potente and H. Kaiser, Paper presented at the 47th Annual Technical Conference of the Society of Plastics Engineers, May 1989, p. 464.
152. V. K. Stokes, Paper presented at the 47th Annual Technical Conference of the Society of Plastics Engineers, May 1989, p. 442.
153. Chemical Economics Handbook, SRI International, Menlo Park, Calif., 1989, 580.0180D.
154. WorldPetrochemicals, SRI International, Menlo Park, Calif., 1990, WORL 2-16.
155. Synthetic Organic Chemicals, United States Production and Sales, USITC Publication, 1989.
Donald M. Kulich
John E. Pace
Leroy W. Fritch Jr.
Angelo Brisimitzakis
GE Plastics
Kirk-Othmer Encyclopedia of Chemical Technology (4th Edition)
210
ABS RESINS
Voll
Kirk-Othmer Encyclopedia of Chemical Technology (4th Edition)
211
ACTINIDES AND TRANSACTINIDES
Voll
ACTINIDES AND TRANSACTINIDES
ACTINIDES
The actinide elements are a group of chemically similar elements with atomic numbers 89 through 103 and their names, symbols, atomic numbers, and
discoverers are given in Table 1 (1-3) (see Thorium and thorium compounds; Uranium and uranium compounds; Plutonium and plutonium compounds;
Nuclear reactors; and Radioisotopes).
Table 1. The Actinide Elements
Atomic number Element CAS Registry Number Symbol Atomic weight Discoverers and date of discovery
89 actinium [7440-34-8] Ac 227 A. Debieme, 1899
90 thorium [7440-29-1] Th 232 J. J. Berzelius, 1828
91 protactinium [7440-13-3] Pa 231 O. Hahn and L. Meitner, 1917, and F. Soddy and J. A. Cranston, 1917
92 uranium [7440-61-1] U 238 M. H. Klaproth, 1789
93 neptunium [7439-99-8] Np 237 E. M. McMillan and P. H. Abelson, 1940
94 plutonium [7440-07-5] Pu 242 G. T. Seaborg, E. M. McMillan, J. W. Kennedy, and A. C. Wahl, 1940-1941
95 americium [7440-35-9] Am 243 G. T. Seaborg, R. A. James, L. O. Morgan, and A. Ghiorso, 1944-1945
96 curium [7440-51-9] Cm 248 G. T. Seaborg, R. A. James, and A. Ghiorso, 1944
97 berkelium [744-40-6] Bk 249 S. G. Thompson, A. Ghiorso, and G. T. Seaborg, 1949
98 californium [7440-71-3] Cf 249 S. G. Thompson, K. Street, Jr., A. Ghiorso, and G. T. Seaborg, 1950
99 einsteinium [7429-92-7] Es 254 A. Ghiorso, S. G. Thompson, G. H. Higgins, G. T. Seaborg, M. H. Studier, P. R. Fields, S. M. Fried, H. Diamond, J. F. Meeh, G. L. Pyle, J. R. Huizenga, A. Hirsch, W. M. Manning, С. I. Browne, H. L. Smith, and R. W. Spence, 1952
100 fermium [7440-72-4] Fm 257 A. Ghiorso, S. G. Thompson, G. H. Higgins, G. T. Seaborg, M. H. Studier, P. R. Fields, S. M. Fried, H. Diamond, J. F. Meeh, G. L. Pyle, J. R. Huizenga, A. Hirsch, W. M. Manning, С. I. Browne, H. L. Smith, and R. W. Spence, 1953
101 mendelevium [7440-11-1] Md 258 A. Ghiorso, B. G. Harvey, G. R. Choppin, S. G. Thompson, and G. T. Seaborg, 1955
102 nobelium [10028-14-5] No 259 A. Ghiorso, T. Sikkeland, J. R. Walton, and G. T. Seaborg, 1958
103 lawrencium [22537-19-5J Lr 260 A. Ghiorso, T. Sikkeland, A. E. Larsh, and R. M. Latimer, 1961
a Mass number of longest lived or most available isotope.
Each of the elements has a number of isotopes (2,4), all radioactive and some of which can be obtained in isotopically pure form. More than 200 in
number and mosdy synthetic in origin, they are produced by neutron or charged-particle induced transmutations (2,4). The known radioactive isotopes are
distributed among the 15 elements approximately as follows: actinium and thorium, 25 each; protactinium, 20; uranium, neptunium, plutonium, americium,
curium, californium, einsteinium, and fermium, 15 each; berkelium, mendelevium, nobelium, and lawrencium, 10 each. There is frequendy a need for values
to be assigned for the atomic weights of the actinide elements. Any precise experimental work would require a value for the isotope or isotopic mixture
being used, but where there is a purely formal demand for atomic weights, mass numbers that are chosen on the basis of half-life and availability have
customarily been used. A list of these is provided in Table 1.
Thorium and uranium have long been known, and uses dependent on their physical or chemical, not on their nuclear, properties were developed
prior to the discovery of nuclear fission. The discoveries of actinium and protactinium were among the results of the eady studies of naturally radioactive
substances. The first transuranium element, synthetic neptunium, was discovered during an investigation of nuclear fission, and this event rapidly led to the
discovery of the next succeeding element, plutonium. The realization that plutonium as 239Pu undergoes fission with slow neutrons and thus could be
utilized in a nuclear weapon supplied the impetus for its thorough investigation. This research has provided the background of knowledge and techniques
for the production and identification of nine more actinide elements (and six transactinide elements).
Thorium, uranium, and plutonium are well known for their role as the basic fuels (or sources of fuel) for the release of nuclear energy (5). The
importance of the remainder of the actinide group lies at present, for the most part, in the realm of pure research, but a number of practical appEcations are
also known (6). The actinides present a storage-life problem in nuclear waste disposal and consideration is being given to separation methods for their
recovery prior to disposal (see Waste treatwnt, hazardous waste; Nuclear reactors, waste managea^nt).
Source
Only the members of the actinide group through Pu have been found to occur in nature (2,3,7,8). Actinium and protactinium are decay products of the
naturally occurring uranium isotope 235U, but the concentrations present in uranium minerals are small and the methods involved in obtaining them from
the natural source are very difficult and tedious in contrast to the relative ease with which the elements can be synthesized. Thorium and uranium occur
widely in the earth's crust in combination with other elements, and, in the case of uranium, in significant concentrations in the oceans. The extraction of
these two elements from their ores has been studied intensively and forms the basis of an extensive technology. Neptunium (239Np and 237Np) and
plutonium (239Pu) are present in trace amounts in nature, being formed by neutron reactions in uranium ores. Longer lived 244Pu, possibly from a
primordial source, has been found in very small concentration (1 part in 1018) in the rare earth mineral bastnasite [12172-82-6] (8). Mining these elements
Kirk-Othmer Encyclopedia of Chemical Technology (4th Edition)
212
ACTINIDES AND TRANSACTINIDES
Voll
from these sources is not feasible because the concentrations involved are exceedingly small. Thus, with the exceptions of uranium and thorium, the
actinide elements are synthetic in origin for practical purposes, ie, they are products of nuclear reactions. High neutron fluxes are available in modem
nuclear reactors, and the most feasible method for preparing actinium, protactinium, and most of the actinide elements is through the neutron irradiation
of elements of high atomic number (3,9).
Actinium can be prepared by the transmutation of radium,
226Ra + n 227Ra + 7; 227Ra --------> A min 227Ac
and gram amounts have been obtained in this way. The actinium is isolated by means of solvent extraction or ion exchange.
Protactinium can be produced in the nuclear reactions
230Th + n 231 Th + 7; 231Th --------Ut. . 231 Pa
1 ’ 2b.о h
However, the quantity of 231Pa produced in this manner is much less than the amount (more than 100 g) that has been isolated from the natural source.
The methods for the recovery of protactinium include coprecipitation, solvent extraction, ion exchange, and volatility procedures. All of these, however, are
rendered difficult by the extreme tendency of protactinium(V) to form polymeric colloidal particles composed of ionic species. These cannot be removed
from aqueous media by solvent extraction; losses may occur by adsorption to containers; and protactinium may be adsorbed by any precipitate present.
Kilogram amounts of neptunium (^Np) have been isolated as a by-product of the large-scale synthesis of plutonium in nuclear reactors that utilize
235U and 238U as fuel. The following transmutations occur:
238U + n 237U + 2n; 237U -----> A d 237Np
and
235U + n^ 236и + 7; 236U + n^ 237U + 7; 237U —> 237Np
The wastes from uranium and plutonium processing of the reactor fuel usually contain the neptunium. Precipitation, solvent extraction, ion exchange, and
volatility procedures (see Diffusion separation methods) can be used to isolate and purify the neptunium.
Plutonium as the important isotope 239Pu is prepared in ton quantities in nuclear reactors. It is produced by the following reactions, wherein the
excess neutrons produced by the fission of 235U are captured by 238U to yield 239Pu.
235 U + n fission products + 2.5 n + 200 MeV
238U + n 239U_________________> 0 239Nd _______> 0 239Pu
U U 23.5 min 2.3d r 11
The plutonium usually contains isotopes of higher mass number (Fig. 1). A variety of industrial-scale processes have been devised for the recovery and
purification of plutonium. These can be divided, in general, into the categories of precipitation, solvent extraction, and ion exchange.
Mass number, A
Fig. 1. Nuclear reactions for the production of heavy elements by intensive slow neutron irradiation. The main line of buildup is designated by heavy
arrows. The sequence above 22Fm represents predictions.
The isotope 238Pu, produced in kilogram quantities by the reactions
237Np + n 238 Np and 238Np ----------------> d 238 Pu
is an important fuel for isotopically powered energy sources used for terrestrial and extraterrestrial applications.
Kilogram quantities of americium as 241 Am can be obtained by the processing of reactor-produced plutonium. Much of this material contains an
appreciable proportion of 241Pu, which is the parent of 241Am. Separation of the americium is effected by precipitation, ion exchange, or solvent extraction.
The nuclear reaction sequences of neutron captures and beta decays involved in the preparation of the actinide elements by means of the slow
neutron irradiation of 239Pu are indicated in Figure 1. The irradiations can be performed by placing the parent material in the core of a high-neutron-flux
reactor where fluxes of neutrons in excess of 1014 may be available. Figure 2 gives an indication of the time required for typical preparation of various
heavy isotopes from 239Pu as the starting material. For example, beginning with 1 kg of 239Pu, about 1 mg of 252Cf would be present after 5—10 yr of
continuous irradiation at a neutron flux 3 x 10¹⁴ neutrons/(cm2-s). Much larger quantities can be produced by irradiating larger quantities of plutonium in
production reactors, followed by irradiation of the curium thus produced in higher-neutron-flux reactors, ca 1015 neutrons/(cm2-s), such as those at the
Savannah River Plant in South Carolina and the High Flux Isotopes Reactor (HFIR) at the Oak Ridge National Laboratory (ORNL) in Tennessee. Such
programs have led to the production of kilogram quantities of curium f^Cm and heavier isotopes), gram quantities of californium, 100-mg quantities of
berkelium, and milligram quantities of einsteinium (6,10). The elements 95 to 100 are also produced in increasing quantities by nuclear power reactors.
Kirk-Othmer Encyclopedia of Chemical Technology (4th Edition)
213
ACTINIDES AND TRANSACTINIDES
Voll
Fig. 2. Production of heavy nuclides by the irradiation of 239Pu at a flux of 3 x 10¹⁴ neutrons/(cm2-s).
Ion exchange (qv; see also Chromatography) is an important procedure for the separation and chemical identification of curium and higher
elements. This technique is selective and rapid and has been the key to the discovery of the transcurium elements, in that the elution order and approximate
peak position for the undiscovered elements were predicted with considerable confidence (9). Thus the first experimental observation of the chemical
behavior of a new actinide element has often been its ion-exchange behavior—an observation coincident with its identification. Further exploration of the
chemistry of the element often depended on the production of larger amounts by this method. Solvent extraction is another useful method for separating
and purifying actinide elements.
There are many similarities in the chemical properties of the lanthanide elements (see Lanthanides) and those of the actinides, especially with
elements in the same oxidation state. A striking example of this resemblance is furnished by their ion-exchange behavior. Figure 3 shows the comparative
elution data for tripositive actinide and lanthanide ions obtained by the use of the ion-exchange resin Dowex-50 (a copolymer of styrene and
divinylbenzene with sulfonic acid groups) and the eluting agent ammonium CC-hydroxyisobutyrate [2539-76-6]. In this system, which is used for illustration
because of its historical importance, the elutions occur in the inverse order of atomic number. The elution sequence depends on a balance between the
adherence to the resin and the stability of the complex ion formed with the eluting agent and may be correlated with the variation of ionic radius with
atomic number.
5 10 20 50 100 200 500 1000
Vol of eluant
Kirk-Othmer Encyclopedia of Chemical Technology (4th Edition)
214
ACTINIDES AND TRANSACTINIDES
Voll
Fig. 3. The elution of tripositive actinide and lanthanide ions. Dowex-50 ion-exchange resin was used with ammonium CC-hydroxyisobutyrate as the eluant.
The position predicted for short-lived lawrencium is indicated by a broken line.
Actinide ions of the III, IV, and VI oxidation states can be adsorbed by cation-exchange resins and, in general, can be desorbed by elution with
chloride, nitrate, citrate, lactate, CC-hydroxyisobutyrate, ethylenediaminetetraacetate, and other anions (11,12).
Ion-exchange separations can also be made by the use of a polymer with exchangeable anions; in this case, the lanthanide or actinide elements must
be initially present as complex ions (11,12). The anion-exchange resins Dowex-1 (a copolymer of styrene and divinylbenzene with quaternary ammonium
groups) and Amberlite IRA-400 (a quaternary ammonium polystyrene) have been used successfully. The order of elution is often the reverse of that from
cationic-exchange resins.
Extraction chromatography (see Adsorption), in which the organic extractant is adsorbed on the surfaces of a fine, porous powder placed in a
column, offers another excellent method for separating the actinide elements from each other. Useful cation extracting agents include
bis(2-ethylhexyl)phosphoric acid [298-07-7]\ mono(2-ethylhexyl)phenylphosphonic acid ester [1518-07-6]., and /otributyl phosphate [126-73-8] (12).
Excellent anion extracting agents include tertiary amines such as tricapryl amine [1116-76-3] or trilauryl amine [102-87-4]> or quaternary amines such as
tricaprylmethyl ammonium chloride [5137-55-3] (nitrate, thiocyanate) (12). Satisfactory supporting agents can be found in commercially available
diatomaceous earths or silica microspheres.
It is possible to prepare very heavy elements in thermonuclear explosions, owing to the very intense, although brief (order of a microsecond),
neutron flux furnished by the explosion (3,13). Einsteinium and fermium were first produced in this way; they were discovered in the fallout materials from
the first thermonuclear explosion (the "Mike" shot) staged in the Pacific in November 1952. It is possible that elements having atomic numbers greater
than 100 would have been found had the debris been examined very soon after the explosion. The preparative process involved is multiple neutron capture
in the uranium in the device, which is followed by a sequence of beta decays. For example, the synthesis of 255FM in the Mike explosion was via the
production of 255U from 238U, followed by a long chain of short-lived beta decays,
255U ______> 255Np ______> 255Pu ______> 255Fm
all of which occur after the neutron reactions are completed.
The process of neutron irradiation in high-flux reactors cannot be used to prepare the elements beyond fermium (257Fm), except at extremely high
neutron fluxes, because some of the intermediate isotopes that must capture neutrons have very short half-lives that preclude the necessary concentrations.
Transfermium elements are prepared in charged-particle bombardments (2,3). Such syntheses are characterized by the limited availability of target materials
of high atomic number, the small reaction yields, and the difficulties intrinsic in the isolation of very short-lived substances. Nonchemical separations of
short-lived isotopes from the target materials are carried out during bombardments. Numerous isotopes of mendelevium, nobelium, and lawrencium (the
heaviest actinide elements) are produced by bombardment with heavy ions. Despite the fact that these are usually produced on a "one-atom-at-a-time"
basis, the chemical properties of these elements have been studied using the tracer technique. Cyclotrons can be used to accelerate heavy ions; in addition,
linear accelerators designed for this express purpose are in operation in several laboratories throughout the world.
Isotopes sufficiently long-lived for work in weighable amounts are obtainable, at least in principle, for all of the actinide elements through fermium
(100); these isotopes with their half-lives are listed in Table 2 (4). Not all of these are available as individual isotopes. It appears that it will always be
necessary to study the elements above fermium by means of the tracer technique (except for some very special experiments) because only isotopes with
short half-lives are known.
Table 2. Long-Lived Actinide Nuclides Suitable for Investigation
Element Isotope CAS Registry Number Half-life
actinium-227 227Ac [14952^10-0] 21.8 yr
thorium-232 232Th [7440-29-1] 1.41 x IO10 yr
protactinium-231 231Pa [14331-85-2] 3.25 x 10⁴ yr
uranium-238 238pja [24678-82-8] 4.47 x 10° yr
nep tunium- 23 6 236Npb [15770-36^1] 1.55 x 10⁵ yr
nep tunium- 23 7 237Np [13994-20-2] 2.14 x 10⁶ yr
plutonium-238 238Pu [13981-16-3] 87.8 yr
plutonium-239 239Pu [15117-48-3] 24,150 yr
plutonium-240 240Pu [14119-33-6] 6,540 yr
plutonium-241 241Pu [14119-32-5] 14.9 yr
plutonium-242 242Pu [13982-10-0] 3.87 x 10⁵ yr
plutonium-244 244Pu [14119-34-7] 8.3 x 10⁷ yr
americium-241 241 Am [14596-10-2] 433 yr
americium-242 242Am [13981-54-9] 152 yr
americium-243 243Am [14993-75-0] 7,400 yr
curium-242 242Cm [15510-73-3] 163.0 d
curium-243 243Cm [15757-87-6] 30 yr
curium-244 244Cm [13981-15-2] 18.1 yr
curium-245 245Cm [15621-76-8] 8,540 yr
curium-246 246 Cm [15757-90-1] 4,800 yr
curium-247 247 Cm [15758-32^1] 1.6 x 10⁷ yr
curium-248 248 Cm [15758-33-5] 3.6 x 10⁵ yr
curium-250 250CmC [15743-88-6] 1.1 x 10⁴ yr
berkelium-247 247Bkb [15752-38-2] 1,380 yr
berkelium-249 249Bk [14900-25-5] 320 d
califomium-249 249Cf [15237-97-5] 350 yr
c alifо mium-2 5 0 250Cf [13982-11-1] 13.1 yr
califomium-251 251Cf [15765-19-2] 898 yr
c alifо mium-2 5 2 252Cf [13981-17^1] 2.6 yr
eins teinium- 253 253Es [15840-02-5] 20.5 d
eins teinium- 254 254Es [15840-03-6] 276 d
eins teinium- 255 255Es [15840-04-7] 40 d
fermium-257 257Fm [15750-26-2] 100 d
a Natural mixture (^U, 99.3%; 235U, 0.72%; and 234U, 0.006%). Half-life given is for the major constituent 238U.
Available so far only in trace quantities from charged particle irradiations.
Kirk-Othmer Encyclopedia of Chemical Technology (4th Edition)
215
ACTINIDES AND TRANSACTINIDES
Voll
C Available only in very small amounts from neutron irradiations in thermonuclear explosions.
Experimental Methods of Investigation
All of the actinide elements are radioactive and, except for thorium and uranium, special equipment and shielded facilities are usually necessary for their
manipulation (9,14,15). On a laboratory scale, enclosed containers (gloved boxes) are generally used for safe handling of these substances. In some work, all
operations are performed by remote control. Neptunium in the form of the long-lived isotope 237Np is relatively convenient to work with in chemical
investigations. Because of the existence of large quantities of the fissionable isotope 239Pu, the physiological toxicity of plutonium deserves emphasis. In
this form plutonium is a dangerous poison by reason of its intense alpha radioactivity [1.4 x 10⁸ alpha particles/(mg-min)] and its physiological behavior.
Ingested plutonium may be transferred to the bone and, over a period of time, give rise to neoplasms.
The study of the chemical behavior of concentrated preparations of short-lived isotopes is complicated by the rapid production of hydrogen
peroxide in aqueous solutions and the destruction of crystal lattices in solid compounds. These effects are brought about by heavy recoils of high energy
alpha particles released in the decay process.
Most chemical investigations with plutonium to date have been performed with 239Pu, but the isotopes 242Pu and 244Pu (produced by intensive
neutron irradiation of plutonium) are more suitable for such work because of their longer half-lives and consequendy lower specific activities. Much work
on the chemical properties of americium has been carried out with 241 Am, which is also difficult to handle because of its relatively high specific alpha
radioactivity, about 7 x 10⁹ alpha particles/(mg-min). The isotope 243Am has a specific alpha activity about twenty times less than 241 Am and is thus a
more attractive isotope for chemical investigations. Much of the earlier work with curium used the isotopes 242Cm and 244Cm, but the heavier isotopes
offer greater advantages because of their longer half-lives. The isotope 248Cm, which can be obtained in relatively high isotopic purity as the alpha-particle
decay daughter of 252Cf, is the most practical for chemical studies. Berkelium (as 249Bk) and californium (as a mixture of the isotopes 249Cf, 250Cf, 251Cf, and
252Cf) are available as the result of intensive neutron irradiation of lighter elements. The best isotope for the study of californium is 249Cf, which can be
isolated in pure form through its beta-particle-emitting parent, 249Bk. The isotope 253Es (half-life, 20 d), also a product from such intensive neutron
irradiation, is used to study the chemical properties of einsteinium. The isotope 254Es (half-life, 276 d) is more useful for work with macroscopic quantities
but is produced in much smaller amounts than 253Es. Weighable amounts of berkelium, californium, and einsteinium are difficult to handle because of their
intense radioactivity. Spontaneous fission is a mode of decay for 252Cf (half-life, 2.6 yr), 1 |lg of which emits approximately 2 x 10⁸ neutrons/min, and the
chief mode of decay of 254Cf (half-life, 56 d), 1 |lg of which emits approximately 8 x IO10 neutrons/min. Californium produced in the highest flux reactors
unfortunately contains 252Cf, which makes it very difficult to handle. In work with more than a few micrograms of 252Cf it is necessary to do all
manipulations by remote control, which is exceedingly cumbersome on such a small scale; therefore, 249Cf is generally used.
Special techniques for experimentation with the actinide elements other than Th and U have been devised because of the potential health hazard to
the experimenter and the small amounts available (15). In addition, investigations are frequendy carried out with the substance present in very low
concentration as a radioactive tracer. Such procedures continue to be used to some extent with the heaviest actinide elements, where only a few score
atoms may be available; they were used in the earliest work for all the transuranium elements. Tracer studies offer a method for obtaining knowledge of
oxidation states, formation of complex ions, and the solubility of various compounds. These techniques are not applicable to crystallography, metallurgy,
and spectroscopic studies.
Microchemical or ultramicrochemical techniques are used extensively in chemical studies of actinide elements (16). If extremely small volumes are
used, microgram or lesser quantities of material can give relatively high concentrations in solution. Balances of sufficient sensitivity have been developed for
quantitative measurements with these minute quantities of material. Since the amounts of material involved are too small to be seen with the unaided eye,
the actual chemical work is usually done on the mechanical stage of a microscope, where all of the essential apparatus is in view. Compounds prepared on
such a small scale are often identified by x-ray crystallographic methods.
Position in the Periodic Table and Electronic Structure. Prior to 1944 the location of the heaviest elements in the periodic table had
been a matter of question, and the elements thorium, protactinium, and uranium were commonly placed immediately below the elements hafnium,
tantalum, and tungsten. In 1944, on the basis of earlier chemical studies of neptunium and plutonium, the similarity between the actinide and the lanthanide
elements was recognized (1,7,14). The intensive study of the heaviest elements shows a series of elements similar to the lanthanide series, beginning with
actinium (Fig. 4). Corresponding pairs of elements show resemblances in spectroscopic and magnetic behavior that arise because of the similarity of
electronic configurations for the ions of the homologous elements in the same state of oxidation, and in crystallographic properties, owing to the near
matching of ionic radii for ions of the same charge. The two series are not, however, entirely comparable. A difference lies in the oxidation states. The
tripositive state characteristic of lanthanide elements does not appear in aqueous solutions of thorium and protactinium and does not become the most
stable oxidation state in aqueous solution until americium is reached. The elements uranium through americium have several oxidation states, unlike the
lanthanides. These differences can be interpreted as resulting from the proximity in the energies of the 7 s, 6<7, and 5/electronic levels.
Lanthanides
56 59 60 6i 62 63 64 65 66 67 68 69 70 71
Ce Pr Nd Pm Sm Eu Gd Tb □v Ho Er Tm Yb Lu
Actinides 90 Th 91 Pa 92 U 93 Np 94 Pu 96 Am 96 Cm 97 Bk 96 Cf 99 Es 100 Fm 101 Md 102 No 103 Lr
| (122) | (123) | (124) | (125) | (126) |
Superactinides
Г------1
I (153) I
Kirk-Othmer Encyclopedia of Chemical Technology (4th Edition)
216
ACTINIDES AND TRANSACTINIDES
Voll
Fig. 4. Futuristic periodic table showing predicted locations of a large number of transuranium elements (atomic numbers in parentheses).
Table 3 presents the actual or predicted electronic configurations of the actinide elements (2,14). Similar information for the lanthanide elements is
given for purposes of comparison (14). As indicated, fourteen 4/electrons are added in the lanthanide series, beginning with cerium and ending with
lutetium; in the actinide elements, fourteen 5/electrons are added, beginning, formally, with thorium and ending with lawrencium. In the cases of actinium,
thorium, uranium, americium, berkelium, californium, and einsteinium the configurations were determined from an analysis of spectroscopic data obtained
in connection with the measurement of the emission lines from neutral and charged gaseous atoms. The knowledge of the electronic structures for
protactinium, neptunium, plutonium, curium, and fermium results from atomic beam experiments (15).
Table 3. Electronic Configurations for Gaseous Atoms of Lanthanide and Actinide Elements
Atomic number Element CAS Registry Number4 Electronic configuration
57 lanthanum [7439-91-0] 5<76.Fa
58 cerium [7440-45-1] 4/5?6?
59 praseodymium [7440-10-0] 4/6?
60 neodymium [7440-00-8] 4/* 3 4 5 66?
61 promethium [7440-12-2] 4/6?
62 samarium [7440-19-9] 4/6?
63 europium [7440-53-1] 4/6?
64 gadolinium [7440-54-2] 4/5?6?
65 terbium [7440-27-9] 4/6?
66 dysprosium [7429-91-6] /106?
67 holmium [7440-60-0] /416?
68 erbium [7440-52-0] 4/126?
69 thulium [7440-30^] /136?
70 ytterbium [7440-64^] 4/146?
71 lutetium [7439-94-3] 4/45?6?
89 actinium
90 thorium bcPls2-
91 protactinium Sfbdls1
92 uranium Spbdls1
93 neptunium
94 plutonium Sfls1
95 americium 5/b2
96 curium 5/ 647s1
97 berkelium Sfls1
98 californium Sf^ls1
99 einsteinium Sf^s1
100 fermium Sf^ls1
101 mendelevium (5/137?)
102 nobelium (5/47?)
103 lawrencium (5/146?7? or 5/47?7x>)
Beyond xenon.
Beyond radon. The configurations enclosed in parentheses are predicted.
Measurements of paramagnetic susceptibility, paramagnetic resonance, light absorption, fluorescence, and crystal structure, in addition to a
consideration of chemical and other properties, have provided a great deal of information about the electronic configurations of the aqueous actinide ions
and of actinide compounds. In general, all of the electrons beyond the radon core in the actinide compounds and in aqueous actinide ions are in the 5/
shell. There are exceptions, such as U2U3, and subnormal compounds, such as Th2S3, where 6d electrons are present.
Properties
The close chemical resemblance among many of the actinide elements permits their chemistry to be described for the most part in a correlative way
(13,14,17,18).
Oxidation States. The oxidation states of the actinide elements are summarized in Table 4 (12—14). The most stable states are designated by
bold face type and those which are very unstable are indicated by parentheses. These latter states do not exist in aqueous solutions and have been produced
only in solid compounds. The IV state of curium is limited to CmO2 and CmF4 (solids) and a complex ion stable in highly concentrated cesium fluoride
solution, whereas the IV state of californium is limited to CfO2 and CfF4 (solids), and double salts such as 7NaF ’6CfF4 (solid). In the second half of the
series the II state first appears in the form of solid compounds at californium and becomes successively more stable in proceeding to nobelium. The II
state is observed in aqueous solution for mendelevium (and presumably for fermium) and is the most stable state for nobelium. Amencium(II), observed
only in solid compounds, and berkelium(TV) show the stability of the half-filled 5/configuration (5/) and nobelium(II) shows the stability of the full 5f
configuration (5/4). The greater tendency toward the II state in the actinides, as compared to the lanthanides, is a result of the increasing binding of the 5/
(and 6d) electrons upon approaching the end of the actinide series.
Table 4. The Oxidation States of the Actinide Elements
Atomic number and element
“89 90 91 92 93 94 95 96 97 98 99 100 101 102 103"
Ac Th Pa U Np Pu Am Cm Bk Cf Es Fm Md No Lr
(2) (2) (2) 2 2 2
3 (3) (3) 3 3 3 3 3 3333 3 3 3
44444 4 4 4 (4)
5 5 5 5 5
6 6 6 6
Kirk-Othmer Encyclopedia of Chemical Technology (4th Edition)
217
ACTINIDES AND TRANSACTINIDES
Voll
7
The actinide elements exhibit uniformity in ionic types. In acidic aqueous solution, there are four types of cations, and these and their colors are
listed in Table 5 (12—14,17). The open spaces indicate that the corresponding oxidation states do not exist in aqueous solution. The wide variety of colors
exhibited by actinide ions is characteristic of transition series of elements. In general, protactinium(V) polymerizes and precipitates readily in aqueous
solution and it seems unlikely that ionic forms are present in such solutions.
Table 5. Ion Types and Colors for Actinide Ions
Element M3+ M4+ MO+2 mo2+2 MO3~5
actinium colorless
thorium colorless
protactinium colorless colorless
uranium red green color unknown yellow
neptunium blue to purple yellow-green green pink to red dark green
plutonium blue to violet tan to orange-brown rose yellow to pink-orange dark green
americium pink or yellow color unknown yellow rum-colored
curium pale green color unknown
berkelium green yellow
californium green
Corresponding ionic types are similar in chemical behavior, although the oxidation—reduction relationships and therefore the relative stabilities differ
from element to element. The ions MO^ and MO|+ are stable with respect to their binding of oxygen atoms and remain unchanged through a great variety
of chemical treatment. They behave as single entities with properties intermediate to singly or doubly charged ions and ions of similar size but of higher
charge. The VII oxidation states found for neptunium and plutonium are probably in the form of ions of the type MO|- in alkaline aqueous solution; in
acid solution these elements in the VII oxidation state readily oxidize water.
The reduction potentials for the actinide elements are shown in Figure 5 (12—14,17,20). These are formal potentials, defined as the measured
potentials corrected to unit concentration of the substances entering into the reactions; they are based on the hydrogen-ion—hydrogen couple taken as zero
volts; no corrections are made for activity coefficients. The measured potentials were established by cell, equilibrium, and heat of reaction determinations.
The potentials for acid solution were generally measured in 1 M perchloric acid and for alkaline solution in 1 M sodium hydroxide. Estimated values are
given in parentheses.
Actinium -2.13
Acid Ac3* ~--9 » (Ac2*) ~°'7 > Ac -25
Base Ac(OH)3 ► Ac
Thorium _________________________________________
I” -35~ -49' +074
Acid Th4 ------» (Th3*)------► (Th2*)-------» Th
Base ThO2 ~2'56 > Th
Protactinium -147
Acid PaOOH2* ~005 > Pa4* (Pa3*) (Pa2*) Pa
Uranium ___________+027__________ ____________________-1-66________
Г +0J7 +038 1 -052 Г Z47 ' Z(n 1
Acid UOi*-------► UO2-------► (J4* ----► U3* —-------- (U2*)----> U
I_________________________________t
-128
-03 -2.6 -2.10
Base UO2(OH)2 ---------> UO2 -----► U(OH)3 -------► U
Neptunium +0.94 -1.79
Acid „+ +2.04 +1.24 , +0.64 , V +0.15 NpO3 > NpOg » NpO2 > Np4* 1 1 • Np3* -=^ (Np2*) — Np t
-1.30
Base NpO3 > NpO2(OH)2 *°'6 > NpO2OH > NpO2 21 > Np(OH)3 --23- > Np
Plutonium +1.03 -2.00
Acid (PuO3*) Pu'o^^PuOJ^TJ4* (Pl?*)
I__________________________J
-1.25
„ +0.94 +03 +09 -1.4 -2.46
Base P11O5 ----» PuO2(OH)2 -> PuO2OH ----► PuO2---► Ри(ОН)э---► Pu
Fig. 5a. Standard (or formal) reduction potentials of actinium and the actinide ions in acidic (pH 0) and basic (pH 14) aqueous solutions (values are in volts
vs standard hydrogen electrode) (19).
Kirk-Othmer Encyclopedia of Chemical Technology (4th Edition)
218
ACTINIDES AND TRANSACTINIDES
Voll
Americium
Acid
+1.68 -2.07
I JI I
ArrU Amo; Am4+ (Am2*) ^+ Am
i_________________________________t i__________________________________________________t
+1.21 -0.90
Base AmO2(OH)2
Curium
Acid
Base
Berkelium
Acid
Californium
Acid
Einsteinium
Acid
Fermium
Acid
Mendelevium
Acid
Nobelium
Acid
Lawrencium
Acid
+0.9 , _ _, . +0.7 . « +0.5 . -2.53 .
------» AmO2OH---------> AmO2 -----> Am(OH)3---------* Am
-2.06
Cm4+ — Cm3+ (Cm2+) — Cm
+07 -2.53
CmO2 ------> Cm(OH)3--------» Cm
-1.96
Bk4+ *1£7 > Bk3* ~2 80 > (Bk2t) ~154 >~Bk
____________-191___________
(Cf4+) Cf3* ~16° + (Cf2*) ~197 > Cf
-1.98
, +4.5 _ -155 _ - "-22 J
(Es4 )-------> Es3 -------► (Es2 ) ---> Es
-2.07
(Fm4+) F^+^UtFm2*)
-174
П ZqZw ’ -2.53 1
Md3" ------> Md2" -----> Md
-1.26
ГГ Zus Г Zae 1
No3 --------► No2 --------► No
q -2.1
Lr3+ -------> Lr
Fig. 5b. Continued
TheM4+ ^M3+ andMO|+ MO J couples are readily reversible, and reactions are rapid with other one-electron reducing or oxidizing agents
that involve no bond changes. The rate varies with reagents that normally react by two-electron or bond-breaking changes. The MOzJ- M3+ ,
MO|+ M3+ , MO J M4+ , and MO|+ M4+ couples are not reversible, presumably because of slowness introduced in the making and breaking of
oxygen bonds.
Table 6 presents a summary of the oxidation—reduction characteristics of actinide ions (12—14,17,20). The disproportionation reactions of UOJ,
Pu4+ , PuO J, and AmO^ are very complicated and have been studied extensively. In the case of plutonium, the situation is especially complex: four
oxidation states of plutonium [(III), (IV), (V), and (VI) ] can exist together in aqueous solution in equilibrium with each other at appreciable
concentrations.
Table 6. Stability of Actinide Ions in Aqueous Solution
Ion Stability
Md2+ No2+ Ac34 U3+ Np3+ Pu3+ Am34 Cm34 Bk3+ Cf3+ Es34 Fm3+ Md3+ No34 Lr3+ Th44 Pa44 Pa54 U4+ Np4+ Pu4+ Am44 Cm44 Bk4+ uo+2 NpO+2 PuO+2 AmO+2 stable to water, but readily oxidized stable stable aqueous solutions evolve hydrogen on standing stable to water, but readily oxidized by air to Np4+ stable to water and air, but easily oxidized to Pu4+ ; oxidizes slightly under the action of its own alpha radiation (in form of 239Pu) stable; difficult to oxidize stable stable; can be oxidized to Bk4+ stable stable stable stable, but rather easily reduced to Md2+ easily reduced to No2+ stable stable stable to water, but readily oxidized stable; hydrolyzes readily stable to water, but slowly oxidized by air to UO|+ stable to water, but slowly oxidized by air to NpO^ stable in concentrated acid, eg, 6 MHNO3, but disproportionates to Pu3+ and PuO|+ at lower acidities known in solution only as complex fluoride and carbonate ions known in solution only as complex fluoride ion marginally stable; easily reduced to Bk3+ disproportionates to U4+ and UO|+ ; most stable at pH 2—4 stable; disproportionates only at high acidities always tends to disproportionate to Pu4+ and PuO|+ (ultimate products); most stable at very low acidities disproportionates in strong acid to Am3+ and AmO|+ ; reduces fairly rapidly under the action of its own alpha radiation at low acidities (in form of 241 Am)
Kirk-Othmer Encyclopedia of Chemical Technology (4th Edition)
219
ACTINIDES AND TRANSACTINIDES
Voll
uo2+2
npo2+2
PuO2+2
AmO2+2
NpO3-5
PuO3\
stable; difficult to reduce
stable; easy to reduce
stable; easy to reduce; reduces slowly under the action of its own alpha radiation (in form of 239Pu)
easy to reduce; reduces fairly rapidly under the action of its own alpha radiation (in form of 241Am)
observed only in alkaline solution
observed only in alkaline solution; oxidizes water
Hydrolysis and Complex Ion Formation. Hydrolysis and complex ion formation are closely related phenomena (13,14).
Of the actinide ions, the small, highly charged M4+ ions exhibit the greatest degree of hydrolysis and complex ion formation. For example, the ion
Pu4+ hydrolyzes extensively and also forms very strong anion complexes. The hydrolysis of Pu4+ is of special interest in that polymers that exist as
positive colloids can be produced; their molecular weight and particle size depend on the method of preparation. Polymeric plutonium with a molecular
weight as high as IO10 has been reported.
The degree of hydrolysis or complex ion formation decreases in the order M4+ > MO|+ > M3+ > MO J • Presumably the relatively high tendency
toward hydrolysis and complex ion formation of MO|+ ions is related to the high concentration of charge on the metal atom. On the basis of increasing
charge and decreasing ionic size, it could be expected that the degree of hydrolysis for each ionic type would increase with increasing atomic number. For
the ions M4+ and M3+ , beginning at about uranium, such a regularity of hydrolytic behavior is observed, but for the remaining two ions, MO J and MO|+ ,
the degree of hydrolysis decreases with increasing atomic number, thus indicating more complicated factors than simple size and charge.
The extensive hydrolysis of protactinium in its V oxidation state makes the chemical investigation of protactinium extremely difficult. Ions of
protactinium(V) must be held in solution as complexes, eg, with fluoride ion, to prevent hydrolysis.
The tendency toward complex ion formation of the actinide ions is determined largely by the factors of ionic size and charge. Although there is
variation within each of the ionic types, the order of complexing power of different anions is, in general, fluoride > nitrate > chloride > perchlorate for
mononegative anions and carbonate > oxalate > sulfate for dinegative anions. The actinide ions form somewhat stronger complex ions than homologous
lanthanide ions.
Actinide ions form complex ions with a large number of organic substances (12). Their extractability by these substances varies from element to
element and depends markedly on oxidation state. A number of important separation procedures are based on this property. Solvents that behave in this
way are tributyl phosphate, diethyl ether [60-29-7]> ketones such as diisopropyl ketone [565-80-5] or methyl isobutyl ketone [108-10-1and several glycol
ether type solvents such as diethyl Cellosolve [629-14-1] (ethylene glycol diethyl ether) or dibutyl Carbitol [112-73-2] (diethylene glycol dibutyl ether).
A number of organic compounds, eg, acetylacetone [123-54-6] and cupferron [135-20-6], form compounds with aqueous actinide ions (IV state for
reagents mentioned) that can be extracted from aqueous solution by organic solvents (12). The chelate complexes are especially noteworthy and, among
these, the ones formed with diketones, such as 3-(2-thiophenoyl)-l,l,l-trifluoroacetone [326-91-0] (C4H3SCOCH2COCF3), are of importance in separation
procedures for plutonium.
Metallic State. The actinide metals, like the lanthanide metals, are highly electropositive (13,14,17). They can be prepared by the electrolysis of
molten salts or by the reduction of a halide with an electropositive metal, such as calcium or barium. Their physical properties are summarized in Table 7
(13,14,17,21). Metallic protactinium, uranium, neptunium, and plutonium have complex structures that have no counterparts among the lanthanide metals.
Plutonium metal has very unusual metallurgical properties. It is known to exist in six allotropic modifications between room temperature and its melting
point. One of the most interesting features of plutonium metal is the contraction undergone by the 8 and 8Z phases with increasing temperature. Also
noteworthy is the fact that for no phase do both the coefficient of thermal expansion and the temperature coefficient of resistivity have the conventional
sign. The resistance decreases if the phase expands on heating. Americium is the first actinide to show resemblance in crystal structure to the lanthanide
metals.
Table 7. Properties of Actinide Metals
Element Melting point, °C Heat of vaporization, АИ , kJ/mol (kcal/mol) Boiling point, °C Crystal structure
Phase Range of stability, °C Symmetry ao Lattice parameters, nm Density, g/mL, at T, °C
6 co
actinium thorium protactinium 11UU±MJ 1750 1575 293 (70) 564 (130) 3850 a ₽ a ₽ RT-1360 1360-1750 RT-1170 1170-1575 FC cubic FC cubic BC cubic tetragonal BC cubic 0.531 1 0.508 6 0.411 0.392 9 0.381 0.324 1 10.07, 25 11.724, 25 15.37, 25
uranium 1132 446.4 (106.7) 3818 a ₽ 7 RT-668 668-774 774-1132 orthorhombic tetragonal BC cubic 0.285 4 1.075 9 0.352 5 0.5869 0.495 6 0.565 6 18.97, 25 18.11, 720 18.06, 805
neptunium 637 ±2 418 (100) 3900 a ₽ 7 RT-280±5 280 ±5-577 ±5 577 ±5-637 ±2 orthorhombic tetragonal BC cubic 0.472 1 0.489 5 0.351 8 0.4888 0.488 7 0.338 6 20.45, 25 19.36,313 18.04, 600
plutonium 646 333.5 (79.7) 3235 a ₽ 7 8 RT-122 122-207 207-315 315-457 monoclinic BC monoclinic orthorhombic FC cubic 0.618 3 0.928 4 0.315 9 0.463 7 0.4822 1.0463 0.5768 /3 = 101.8° /3 = 92.13° 1.096 3 0.785 9 1.016 2 19.86,21 17.70,190 17.13, 235 15.92, 320
Kirk-Othmer Encyclopedia of Chemical Technology (4th Edition)
220
ACTINIDES AND TRANSACTINIDES
Voll
8' 457-479 tetragonal 0.332 0.446 16.01, 460
6 3
8 479-640 BC cubic 0.363 16.48, 490
6
americium 1173 230 (55) 2011 (% RT-658 hexagonal 0.346 1.124 13.67, 20
8 1
₽ 793-1004 FC cubic 0.489 13.65, 20
4
Y 1050-1173
curium 1345 386 (92.2) 3110 a below 1277 hexagonal 0.349 1.133 13.51, 25
6 1
₽ 1277-1345 FC cubic 0.503 12.9, 25
9
berkelium 1050 a below 930 hexagonal 0.341 1.106 14.78, 25
6 9
₽ 930-986 FC cubic 0.499 13.25, 25
7
californium ±30 a below 900 hexagonal 0.339 1.101 15.1, 25
p FC cubic 0.575 8.70, 25
einsteinium 860 3(1 a below 860 hexagonal
L_ FC cubic 0.575 8.84
With respect to chemical reactivity, the actinide metals resemble the lanthanide metals more than metals of the Sd elements such as tantalum,
tungsten, rhenium, osmium, and iridium. A wide range of intermetallic compounds has been observed and characterized, including compounds or alloys
with members of groups IB, IIA, IIIA, IVA, VIII, VA, and the VIB chalcogenides (13,17). The 5/electrons in the lighter actinides are not as localized as
the 4/electrons in the lanthanides and, with energies close to those of the 6d and Is electrons, participate actively in bonding. The participation in bonding
by 5/electrons is apparendy more prominent in the early actinides than in the heavier actinides, where a localized behavior becomes evident. The behavior
of the 5f electrons makes the actinide metals and their metallic compounds different in their behavior than the transition and lanthanide metals and their
compounds.
Solid Compounds. The tripositive actinide ions resemble tripositive lanthanide ions in their precipitation reactions (13,14,17,20,22).
Tetrapositive actinide ions are similar in this respect to Ce4+ . Thus the fluorides and oxalates are insoluble in acid solution, and the nitrates, sulfates,
perchlorates, and sulfides are all soluble. The tetrapositive actinide ions form insoluble iodates and various substituted arsenates even in rather strongly acid
solution. The MO^ actinide ions can be precipitated as the potassium salt from strong carbonate solutions. In solutions containing a high concentration of
sodium and acetate ions, the actinide MO|+ ions form the insoluble crystalline salt NaMO2(O2CCH3)3. The hydroxides of all four ionic types are insoluble;
in the case of the MO|+ ions, compounds of the type exemplified by sodium diuranate (Na2U2O7) can be precipitated from alkaline solution. The NpO|-
and PuO|- anions, which seem to exist in alkaline solution, form insoluble compounds with several di- and tripositive cations. Peroxide solutions react
with actinide ions, particularly M4+ ions, to form complex peroxy compounds in solution, and such compounds can be precipitated even from moderately
acid solutions. Inorganic anions, eg, sulfate, nitrate, and chloride, are often incorporated in the solid peroxy compounds.
Thousands of compounds of the actinide elements have been prepared, and the properties of some of the important binary compounds are
summarized in Table 8 (13,17,18,22). The binary compounds with carbon, boron, nitrogen, silicon, and sulfur are not included; these are of interest,
however, because of their stability at high temperatures. A large number of ternary compounds, including numerous oxyhalides, and more complicated
compounds have been synthesized and characterized. These include many intermediate (nonstoichiometric) oxides, and besides the nitrates, sulfates,
peroxides, and carbonates, compounds such as phosphates, arsenates, cyanides, cyanates, thiocyanates, selenocyanates, sulfites, selenates, selenites,
tellurates, tellurites, selenides, and tellurides.
Table 8. Properties and Crystal Structure Data for Important Actinide Binary Compounds
Lattice parameters
Compoun d Color Melting point, °C Symmetry Space group or structure type nm nm Cq, nm Angle, deg Density , g/ml
AcH2 black cubic fluorite 0.5670 8.35
ThH2 black tetragonal 0.5735 0.497 9.50
1
Th4H15 black cubic 1437 0.911 8.25
a-PaH3 gray cubic Pm3n 0.4150 10.87
P-PaH3 black cubic P-w 0.6648 10.58
a-UH3 cubic Pm3n 0.4160 11.12
P-UH3 black cubic P-w (РжЗ») 0.6645 10.92
nph2 black cubic fluorite 0.5343 10.41
NpH3 black trigonal РЗЛ 0.651 0.672 9.64
PuH2 black cubic fluorite 0.5359 10.40
PuH3 black trigonal РЗЛ 0.655 0.676 9.61
AmH2 black cubic fluorite 0.5348 10.64
AmH3 black trigonal РЗЛ 0.653 0.675 9.76
CmH2 black cubic fluorite 0.5322 10.84
CmH, black trigonal РЗЛ 0.6528 0.673 10.06
2
BkH2 black cubic fluorite 0.5248 11.57
BkH3 black trigonal РЗЛ 0.6454 0.666 10.44
3
Ac2O3 white hexagonal La2O3 (P3zM) 0.407 0.629 9.19
Pu2O3 cubic I<?3 (Mn2O3) 1.103 10.20
Pu2O3 black 2085 hexagonal La2O3 0.3841 0.595 11.47
8
Kirk-Othmer Encyclopedia of Chemical Technology (4th Edition)
221
ACTINIDES AND TRANSACTINIDES
Voll
Am2O3 tan hexagonal La2O3 0.3817 0.597 1 11.77
Am2O3 reddish brown cubic ЬЗ 1.103 10.57
Cm2O3 white to faint tan 2260 hexagonal La2O3 0.3792 0.598 12.17
5
Cm2O3 monoclinic С2/m (Sn^Cy 1.4282 0.364 0.888 /3 = 100.29 11.90
1 3
Cm2O3 white cubic ьз 1.1002 10.80
< > light green hexagonal La2O3 0.3754 0.595 12.47
8
< > yellow-green monoclinic С2/m 1.4197 0.360 0.884 I3 = 100.23 12.20
6 6
< > yellowish brown cubic \аЪ 1.0887 11.66
Cf2°3 pale green hexagonal La2O3 0.372 0.596 12.69
Cf2°3 lime green monoclinic С2/m 1.4121 0.359 0.880 /3 = 100.34 12.37
2 9
Cf2°3 pale green cubic \аЪ 1.083 11.39
Es2O3 white hexagonal La2O3 0.37 0.60 12.7
Es2O3 white monoclinic С2/m 1.41 0.359 0.880 /3 = 100 12.4
Es2O3 white cubic \аЪ 1.0766 11.79
ThO2 white ca 3050 cubic fluorite 0.5597 10.00
PaO2 black cubic fluorite 0.5509 10.45
uo2 brown to black 2875 cubic fluorite 0.5471 10.95
NpO2 apple green cubic fluorite 0.5425 11.14
PuO2 yellow-green to brown 2400 cubic fluorite 0.53960 11.46
AmO2 black cubic fluorite 0.5374 11.68
CmO2 black cubic fluorite 0.5358 11.92
BkO2 yellowish-brown cubic fluorite 0.5332 12.31
CfO2 black cubic fluorite 0.5310 12.46
Pa2C>5 white cubic fluorite-related 0.5446 or 11.14
0.5492
NP2°5 dark brown monoclinic P2> 0.4183 0.658 0.408 /3 = 90.32 8.18
4 6
a-U3O8 black-green 1150 (dec) orthorhombic C2mm 0.6716 1.196 0.414 8.39
0 7
p-u3o8 black-green orthorhombic Qmcm 0.7069 1.144 0.830 8.32
5 3
y-UO3 orange 650 (dec) orthorhombic Pddd 0.981 1.993 0.971 7.80
AmCl2 black orthorhombic Pbnm (РЬСЦ 0.8963 0.757 0.453 6.78
3 2
CfCl2 red-amber
AmBt2 black tetragonal SrBr2 (P4/«) 1.1592 0.712 7.00
1
CfBr2 amber tetragonal SrBr2 1.1500 0.710 7.22
9
Thl2 gold hexagonal P63/mmc 0.397 3.175 7.45
Aml2 black ca 700 monoclinic EuI2 (P21/c) 0.7677 0.831 0.792 /3 = 98.46 6.60
1 5
Cfl2 violet hexagonal cdl2 (Р3ж1) 0.456 0.699 6.63
Cfl2 violet rhombohedral CdCl2 (R3z2?) 0.743 a = 36 6.58
AcF3 white trigonal LaF3 (РЗЛ) 0.741 0.753 7.88
UF3 black >1140 trigonal LaF3 0.718 0.734 8.95
(dec) 8
\pl purple trigonal LaF3 0.7129 0.728 9.12
8
PuF3 purple 1425 trigonal LaF3 0.7092 0.725 9.33
4
AmF3 pink 1393 trigonal LaF3 0.7044 0.722 9.53
5
Crnl 0 white 1406 trigonal LaF3 0.7014 0.719 9.85
4
BkF3 yellow-green orthorhombic YF3 (Р/ша) 0.670 0.709 0.441 9.70
BkF3 yellow-green trigonal LaF3 0.697 0.714 10.15
CfF3 light green orthorhombic YF3 0.6653 0.703 0.439 9.88
9 3
CfF3 light green trigonal LaF3 0.6945 0.710 10.28
1
\cCI white hexagonal UC13 (Р63/ж) 0.762 0.455 4.81
uci3 green 835 hexagonal P63/zy 0.7443 0.432 5.50
1
NpCl3 green ca 800 hexagonal uci3 0.7413 0.428 5.60
2
PuCl3 emerald green 760 hexagonal uci3 0.7394 0.424 5.71
3
AmCl3 pink or yellow 715 hexagonal uci3 0.7382 0.421 4 5.87
Kirk-Othmer Encyclopedia of Chemical Technology (4th Edition)
222
ACTINIDES AND TRANSACTINIDES
Voll
CmCl3 white 695 hexagonal uci3 0.7374 0.418 5 5.95
BkCl3 green 603 hexagonal uci3 0.7382 0.412 6.02
7
(X-CfCl3 green 545 orthorhombic TbCl3 (Qmcm) 0.3859 1.174 0.856 6.07
8 1
P-CfCl3 green hexagonal uci3 0.7379 0.409 6.12
0
EsCl3 white to orange hexagonal uci3 0.740 0.407 6.20
AcBr3 white hexagonal UBr3 (Р63/ж) 0.806 0.468 5.85
UBr3 red 730 hexagonal Р63/m 0.7936 0.443 6.55
8
NpBr3 green hexagonal UBr3 0.7916 0.439 6.65
0
NpBr3 green orthorhombic TbCl3 (Qmcm) 0.4109 1.261 0.915 6.67
8 3
PuBr3 green 681 orthorhombic TbCl3 0.4097 1.261 0.914 6.72
7 7
AmBr3 white to pale yellow orthorhombic TbCl3 0.4064 1.266 0.914 6.85
625 ±5 1 4
CniBr pale yellow-green orthorhombic TbCl3 0.4041 1.270 0.913 6.85
0 5
BkBr3 light green monoclinic A1C13 (С2/ж) 0.723 1.253 0.683 /3 = 110.6 5.604
BkBr3 light green orthorhombic TbCl3 0.403 1.271 0.912 6.95
BkBr3 yellow green rhomb ohedral FeCl3 (R3) 0.766 a = 56.6 5.54
CfBr3 green monoclinic A1C13 0.7214 1.242 0.682 /3 = 110.7 5.673
3 5
CfBr3 green rhomb ohedral FeCl3 0.758 a = 56.2 5.77
EsBr3 straw monoclinic A1C13 0.727 1.259 0.681 /3 = 110.8 5.62
Pal3 black orthorhombic TbCl3 (Qmcm) 0.433 1.40 1.002 6.69
UI3 black orthorhombic TbCl3 0.4328 1.399 0.998 6.76
6 4
NPI3 brown orthorhombic TbCl3 0.430 1.403 0.995 6.82
Pul3 green orthorhombic TbCl3 0.4326 1.396 0.997 6.92
2 4
Ami, pale yellow ca 950 hexagonal Bil3 (R3) 0.742 2.055 6.35
Ami, yellow orthorhombic PuBr3 0.428 1.394 0.997 6.95
4
Cml3 white hexagonal Bil3 0.744 2.040 6.40
BH3 yellow hexagonal BiI3 0.7584 02.08 6.02
7
cfI3 red-о range hexagonal BiI3 0.7587 2.081 6.05
Esl3 amber to light yellow hexagonal BiI3 0.753 2.084 6.18
ThF4 white 1068 monoclinic UF4 (C2/f) 1.300 1.099 0.860 /3 = 126.4 6.20
PaF4 reddish-brown monoclinic UF4 1.288 1.088 0.849 /3 = 126.4 6.38
UF4 green 960 monoclinic С2Д 1.2803 1.079 0.837 /3 = 126.3 6.73
2 2
NPF4 green monoclinic UF4 1.268 1.066 0.834 !3 = 126.3 6.86
PuF4 brown 1037 monoclinic UF4 1.260 1.057 0.828 /3 = 126.3 7.05
AmF4 tan monoclinic UF4 1.256 1.058 0.825 /3 = 125.9 7.23
CmF4 light gray-green monoclinic UF4 1.250 1.049 0.818 /3 = 126.1 7.36
BkF4 pale yellow-green monoclinic UF4 1.2396 1.046 0.811 /3 = 126.3 7.55
6 8
CfF4 light green monoclinic UF4 1.2327 1.040 0.811 !3 = 126.4 7.57
2 3
a-ThCl4 white orthorhombic 1.118 0.593 0.909 4.12
P-ThCl4 white 770 tetragonal UC14 QAjamd) 0.8473 0.746 4.60
8
PaCl4 greenish-yellow tetragonal uci4 0.8377 0.748 4.72
1
uci4 green 590 tetragonal I44/ amd 0.8296 0.748 4.89
1
NpCl4 red-brown 518 tetragonal uci4 0.8266 0.747 4.96
5
<7.-TliBr white tetragonal I43A 0.6737 1.360 5.94
1
P-ThBr4 white tetragonal uci4 0.8931 0.796 5.77
3
PaBr4 orange-red tetragonal uci4 0.8824 0.795 5.90
7
UBr4 brown 519 monoclinic 2/f-/- 1.092 0.869 0.705 /3 = 93.15
NpBr4 dark red 464 monoclinic 2/f-/- 1.089 0.874 0.705 /3 = 94.19
ты4 yellow 556 monoclinic P23/» 1.3216 0.806 0.776 !3 = 98.68 6.00
8 6
Pal4 black
UI4 black
Kirk-Othmer Encyclopedia of Chemical Technology (4th Edition)
223
ACTINIDES AND TRANSACTINIDES
Voll
PaF5 white tetragonal 1427 1.153 0.519
a-UF5 grayish white tetragonal 14/m 0.6512 0.446 5.81
3
P-uf5 pale yellow tetragonal 1427 1.1456 0.519 6.47
6
NPF5 tetragonal 14/m 0.653 0.445
PaCl5 yellow 306 monoclinic C2/c 0.800 1.142 0.843 /3 = 1О6Л
a-UCl5 brown monoclinic 0.799 1.069 0.848 /3 =9L5 3.81
P-UC15 red-brown triclinic Pl 0.707 0.965 0.635 “ = 89-10
/3 = 117.36
7 = 108.54
CC-PaBr5 monoclinic Р2,Д 1.264 1.282 0.992 /3 = 108
P-PaBr5 orange-brown monoclinic P2,/» 0.9385 1.220 0.895 /3 = 91.1
5
UBr5 brown monoclinic P2,/»
Pal5 black orthorhombic 0.698 0.216 2.130
0
UF6 wllite 64.02a orthorhombic Pnma 0.9900 0.896 0.520 5.060
2 7
NPF6 orange 55 orthorhombic Pnma 0.9909 0.899 0.520 5.026
7 2
PuF6 reddish-brown 52 orthorhombic Pnma 0.995 0.902 0.526 4.86
uci6 dark green 178 hexagonal P3zM 1.09 0.603 3.62
a At 151.6 kPa, to convert kPa to atm, divide by 101.3.
Hundreds of actinide organic derivatives, including organometallic compounds, are known (12,19,23). A number of interesting actinide
organometallic compounds of the 7t-bonded type have been synthesized and characterized. The triscyclopentadienyl compounds, although more covalent
than the analogous lanthanide compounds, are highly ionic and include UCp3, NpCp3, PuCp3, AmCp3, CmCp3, BkCp3, and CfCp3 (Cp — C5H5); each,
except the uranium compound, is relatively stable and appreciably volatile but is sensitive to air (23). The tetrakiscyclopentadienyl complexes (ThCp4,
PaCp4, UCp4, and NpCp^ are, like the Cp3 complexes, soluble in organic solvents and moderately air-sensitive but not appreciably volatile. A number of
triscyclopentadienyl actinide halides, of the general formula MCp3X(M = Th, U, Np), are known, and these are soluble in a range of organic solvents, are
more stable to heat than the tetrakis complexes, and are moderately air-sensitive. The pentamethylcyclopentadienides of thorium and uranium also exist. Of
special interest are the cyclooctatetraene [629-20-1] (COT) complexes, including the bis compounds Th(COT)2, Pa(COT)2, U(COT)4, Np^OT)^ and
Pu(COT)4, and substituted derivatives of these (23). Characterized by monoclinic symmetry with a 7t-binding sandwich structure involving Solectron
orbitals, the prototype compound involving uranium is known as uranocene, in view of the analogy to ferrocene. The compounds are air-sensitive, are only
sparingly soluble in organic solvents, and can be sublimed in vacuum. A few are very stable to air. The actinides also form tetraallyl complexes, M(C3H5)4,
but these are stable only at low temperatures. Many organoactinide complexes with and 7C ligands of the type (Cp3M—R( R = alkyl, aryl, or alkynyl) are
known, as well as a number of borohydride compounds. Additional solid organoactinide complexes include alkoxides, dialkylamides, chelates such as
P-diketones and fCketoesters, P-hydroxyquinolines, A-nitroso-A-phemlliydroxylamines (cupferron type), tropolones, N,N-dialkyldithiocarbamates, and
phthalocyanines; many of these are useful for separation schemes.
Crystal Structure and Ionic Radii. Crystal structure data have provided the basis for the ionic radii (coordination number = CN = 6),
which are summarized in Table 9 (13,14,17). For both M3+ and M4+ ions there is an actinide contraction, analogous to the lanthanide contraction, with
increasing positive charge on the nucleus.
Table 9. Ionic Radii of Actinide and Lanthanide Elements
No. of 4/or 5/ electrons Lanthanide series Actinide series
Element Radius, nm Element Radius, nm Element Radius, nm Element Radius, nm
0 La3+ 0.1032 Ac3+ 0.112 Th4+ 0.094
1 Ce3+ 0.101 Ce4+ 0.087 (Th3+) (0.108) Pa4+ 0.090
2 ргз+ 0.099 pr4+ 0.085 (Pa3+) 0.104 U4+ 0.089
3 Nd3+ 0.0983 U3+ 0.1025 Np4+ 0.087
4 Pm3+ 0.097 Np3+ 0.101 Pu4+ 0.086
5 Sm3+ 0.0958 Pu3+ 0.100 Am44 0.085
6 Eu3+ 0.0947 Am34 0.0980 Cm44 0.084
7 Gd3+ 0.0938 Cm3+ 0.0970 Bk4+ 0.083
8 Tb3+ 0.0923 Tb4+ 0.076 Bk3+ 0.0960 Cf4+ 0.0821
9 Dy3+ 0.0912 Cf3+ 0.0950 Es4+ 0.081
10 Ho3+ 0.0901 Es3+ 0.0940
11 Er3+ 0.0890
12 Tm3+ 0.0880
13 Yb3+ 0.0868
14 Lu3+ 0.0861
As a consequence of the ionic character of most actinide compounds and of the similarity of the ionic radii for a given oxidation state, analogous
compounds are generally isostructural. In some cases, eg, UBr3, NpBr3, PuBr3, and AmBr3, there is a change in structural type with increasing atomic
number, which is consistent with the contraction in ionic radius. The stability of the MO2 structure (fluorite type) is especially noteworthy, as is shown by
the existence of such compounds as PaO2, AmO2, CmO2, and CfO2 despite the instability of the IV oxidation state of these elements in solution. The
actinide contraction and the isostructural nature of the compounds constitute some of the best evidence for the transition character of this group of
elements.
Absorption and Fluorescence Spectra. The absorption spectra of actinide and lanthanide ions in aqueous solution and in crystalline form
contain narrow bands in the visible, near-ultraviolet, and near-infrared regions of the spectrum (13,14,17,24). Much evidence indicates that these bands arise
from electronic transitions within the 4/ and 5/ shells in which the and bf configurations are preserved in the upper and lower states for a particular ion.
Kirk-Othmer Encyclopedia of Chemical Technology (4th Edition)
224
ACTINIDES AND TRANSACTINIDES
Voll
In general, the absorption bands of the actinide ions are some ten times more intense than those of the lanthanide ions. Fluorescence, for example, is
observed in the trichlorides of uranium, neptunium, americium, and curium, diluted with lanthanum chloride (15).
Practical Applications
The practical use of three actinide nuclides, 239Pu, 235U, and 233U, as nuclear fuel is well known (5,9). When a neutron of any energy strikes the nucleus of
one of these nuclides, each of which is capable of undergoing fission with thermal (essentially zero energy) neutrons, the fission reaction can occur in a
self-sustaining manner. A controlled self-perpetuating chain reaction using such a nuclear fuel can be maintained in such a manner that the heat energy can
be extracted or converted by conventional means to electrical energy. The complete utilization of nonfissionable 238U (through conversion to fissionable
239Pu) and nonfissionable 232Th (through conversion to fissionable 233U) can be accomplished by breeder reactors.
In addition, three other actinide nuclides (^Pu, 241Am, and 252Cf) have other practical applications (6). One gram of 238Pu produces approximately
0.56 W of thermal power, primarily from alpha-particle decay, and this property has been used in space exploration to provide energy for small
thermoelectric power units (see Thermoelectric energy conversion). The most noteworthy example of this latter type of application is a radioisotopic
thermoelectric generator left on the moon. It produced 73 W of electrical power to operate the scientific experiments of the Apollo lunar exploration, and
was fueled with 2.6 kg of the plutonium isotope in the form of plutonium dioxide, PuO2. Similar generators powered the instrumentation for other Apollo
missions, the Viking Mars lander, and the Pioneer and Voyager probes to Jupiter, Saturn, Uranus, Neptune, and beyond. Americium-241 has a
predominant gamma-ray energy of 60 keV and a long half-life of 433 yr for decay by the emission of alpha particles, which makes it particularly useful for a
wide range of industrial gaging applications, the diagnosis of thyroid disorders, and for smoke detectors. When mixed with beryllium it generates neutrons
at the rate of 1.0 x 10⁷ neutrons/(s-g) 241Am. The mixture is designated 241 Am—Be and a large number of such sources are in worldwide daily use in oil-well
logging operations to find how much oil a well is producing in a given time span. Califomium-252 is an intense neutron source: 1 g emits
2.4 x 10¹² neutrons/s. This isotope is being tested for applications in neutron activation analysis, startup sources for nuclear reactors, neutron radiography,
portable sources for field use in mineral prospecting and oil-well logging, and in airport neutron-activation detectors for nitrogenous materials (ie,
explosives). Both 238Pu and 252Cf are being studied for possible medical applications: the former as a heat source for use in heart pacemakers and heart
pumps and the latter as a neutron source for irradiation of certain tumors for which gamma-ray treatment is relatively ineffective.
TRANSACTINIDES
The elements beyond the actinides in the Periodic Table can be termed the transactinides. These begin with the element having atomic number 104 and
extend, in principle, indefinitely. Although only six such elements, numbers 104—109, were definitely known in 1991, there are good prospects for the
discovery of a number of additional elements just beyond number 109 or in the region of larger atomic numbers. They are synthesized by the
bombardment of heavy nuclides with heavy ions.
As indicated in Figure 4, the early transactinide elements find their place back in the main body of the Periodic Table. The discoverers of the
currendy known transactinide elements, suggested names and symbols, and dates of discovery are listed in Table 10 (19). Because there are competing
claims for the discovery of these elements, the two groups of discoverers in each case have suggested names for elements 104 and 105. In the case of
elements 106—109, names for the elements have not been suggested in order to avoid another duplication.
Table 10. The Transactinide Elements
Atomic number Element Symbol Atomic weight Discoverers and date of discovery
104 rutherfordium [53850-36-5] (U.S.A.) Rf 261 A. Ghiorso, M. Nurmia, J. Harris, K. Eskola, and P. Eskola, 1969
104 kurchatovium (USSR) Ku G. N. Flerov, Yu. Ts. Oganesyan, Yu. V. Lobanov, V. I. Kuznetsov, V. A. Druin, V. P. Perelygin, K. A. Gavrihov, S. P. Tretiakova, and V. M. Plotko, 1964
105 hahnium [53850-35-4] (U.S.A.) Ha 262 A. Ghiorso, M. Nurmia, K. Eskola, J. Harris, and P. Eskola, 1970
105 nielsbohrium (USSR) Ns G. N. Flerov, Yu. Ts. Oganesyan, Yu. V. Lobanov, Yu. A. Lazarev, and S. P. Tretiakova, 1970
106 [54038-81-2] 263 A. Ghiorso, J. M. Nitschke, J. R. Alonso, С. T. Alonso, M. Nurmia, G. T. Seaborg, E. K. Hulet, and R. W. Lougheed, 1974
106 Yu. Ts. Oganesyan, Yu. P. Tretiakov, A. S. Hjinov, A. G. Demin, A. A. Pleve, S. P. Tretiakova, V. M. Plotko, M. P. Ivanov, N. A. Danilov, Yu. S. Korotkin, and G. N. Flerov, 1974
107 262 G. Mbnzenberg, S. Hofmann, F. P. Hessberger, W. Reisdorf, К. H. Schmidt, J. H. R. Schneider, W. F. W. Schneider, P. Armbruster, С. C. Sahm, and B. Thuma, 1981
107 Y. T. Oganessian, A. G. Demin, N. A. Danilov, M. P. Ivanov, A. S. Hjinov, N. N. Kolesnikov, B. N. Markov, V. M. Plotko, S. P. Tretiakova, and G. N. Flerov, 1976
108 265 G. Mbnzenberg, P. Armbruster, H. Folger, F. P. Hessberger, S. Hofmann, J. Keller, K. Poppensieker, W. Reisdorf, К. H. Schmidt, H. J. Schgtt, M. E. Leino, and R. Hingmann, 1984
109 264 G. Mbnzenberg, P. Armbruster, F. P. Hessberger, S. Hofmann, K. Poppensieker, F. P. Hessberger, S. Hofmann, K. Poppensieker, W. Reisdorf, J. H. R. Schneider, К. H. Schmidt, С. C. Sahm, and D. Vermeulen, 1982
Mass number of longest lived isotopes.
Study of the chemical properties of element 104 has confirmed that it is indeed homologous to hafnium as demanded by its position in the Periodic
Table (20). Chemical studies have been made for element 105, showing some similarity to tantalum (25); no chemical studies have been made for elements
106—109. Such studies are very difficult because the longest-lived isotope of 104 (261104) has a half-life of only about 1 min, of 105 (262105) a half-life of
about 40 s, of 106 (263 106) a half-life of about 1 s, and of elements 107—109 half-lives in the range of milliseconds.
On the basis of the simplest projections it is expected that the half-lives of the elements beyond element 109 will become shorter as the atomic
number is increased, and this is true even for the isotopes with the longest half-life for each element. This is illustrated by Figure 6, in which the half-lives
Kirk-Othmer Encyclopedia of Chemical Technology (4th Edition)
225
ACTINIDES AND TRANSACTINIDES
Voll
of the longest-lived isotopes (for alpha and spontaneous fission decay) of transuranium elements are plotted against the increasing atomic number. Thus, if
this rate of decrease could be extrapolated to ever-increasing atomic numbers, it would present somewhat dismal future prospects for heavier transuranium
elements, but other factors have entered the picture in recent years. These have led to an optimism concerning the prospects for the synthesis and
identification of elements beyond the observed upper limit of the periodic table, elements that have come to be referred to as superheavy elements.
90 92 94 96 98 100 102 104 106 108 110 112 114
Atomic number, Z
Fig. 6. Longest-lived isotopes of transuranium elements.
Complicated theoretical calculations, based on filled shell (magic number) and other nuclear stability considerations, have led to extrapolations to the
far transuranium region (2,26,27). These suggest the existence of closed nucleon shells at Z = 114 (proton number) and N = 184 (neutron number) that
exhibit great resistance to decay by spontaneous fission, the main cause of instability for the heaviest elements. Earlier considerations had suggested a
closed shell at Z = 126, by analogy to the known shell at N = 126, but this is not now considered to be important.
Table 11 illustrates the known closed proton and neutron shells and the predicted closed nuclear shells (shown in parentheses) that might be
important in stabilizing the superheavy elements. Included by way of analogy are the long-known closed electron shells observed in the buildup of the
electronic structure of atoms. These correspond to the noble gases, and the extra stability of these closed shells is reflected in the relatively small chemical
reactivity of these elements. The predicted (in parentheses) closed electronic structures occur at Z = 118 and Z = 168.
Table 11. Closed Proton (Z) and Neutron (A^ Shells with Closed Electron (Noble Gas) Shells for Comparison*
z N e-
2(He) 8(0) 20(Ca) 28(Ni) 50(Sn) 82(Pb) 2(4He) 2(He) 8(16O) 10(Ne) 20(40Ca) 18(Ar) 28(56Ni) 36(Kr) 5O(88Sr) 54(Xe) 82(140Ce) 86(Rn) 126 (™Pb)
(И4) (126) (184) (118) Q68)
a Predicted shells shown in parentheses.
Enhancing the prospects for the actual synthesis and identification of super-heavy nuclei is the fact that the calculations show the doubly magic
nucleus 298114 not to be a single long-lived specimen but to be a part of a rather large "island of stability" in a "sea of spontaneous fission" (2,26,27). The
grid lines of Figure 7 show "magic" numbers of protons or neutrons giving rise to exceptional stability. The doubly magic region at 82 protons and 126
neutrons is shown by a mountain; a predicted doubly magic but less stable region at 114 protons and 184 neutrons is shown by a hill at the island of
stability. The ridges depict areas of enhanced stability due to a single magic number. Other calculations suggest that there should be stabilizing, deformed
nuclear shells (or subshells) at lower neutron numbers, such as N = 162.
Neutron number, N
Kirk-Othmer Encyclopedia of Chemical Technology (4th Edition)
226
ACTINIDES AND TRANSACTINIDES
Voll
Fig. 7. Allegorical representation of island of stability (magic island) (28).
The effects of a rather distinct deformed shell at N = 152 were clearly seen as early as 1954 in the alpha-decay energies of isotopes of californium,
einsteinium, and fermium. In fact, a number of authors have suggested that the entire transuranium region is stabilized by shell effects with an influence
that increases markedly with atomic number. Thus the effects of shell substructure lead to an increase in spontaneous fission half-lives of up to about 15
orders of magnitude for the heavy transuranium elements, the heaviest of which would otherwise have half-lives of the order of those for a compound
nucleus (IO-14 s or less) and not of milliseconds or longer, as found experimentally. This gives hope for the synthesis and identification of several elements
beyond the present heaviest (element 109) and suggest that the peninsula of nuclei with measurable half-lives may extend up to the island of stability at
Z = 114 and A = 184.
Turning to consideration of electronic structure, upon which chemical properties must be based, modem high speed computers have made possible
the calculation of such structures (13,26,27). The calculations show that elements 104 through 112 are formed by filling the 6d electron sub shell, which
makes them, as expected, homologous in chemical properties with the elements hafnium (Z = 72) through mercury (Z = 80). Elements 113 through 118
result from the filling of the Пр subshell and are expected to be similar to the elements thallium (Z = 81) through radon (Z = 86). Thus these calculations
are consistent with the periodic table shown in Figure 4, which shows the filling of the electron subshells extending beyond element 118.
The calculations indicate that the 8j' subshell should fill at elements 119 and 120, thus making these an alkali and alkaline earth metal, respectively.
Next, the calculations point to the filling, after the addition of a Id electron at element 121 of the inner 5g and 6f subshells, 32 places in all, which the author
has termed the superactinide elements and which terminates at element 153. This is followed by the filling of the 7d subshell (elements 154 through 162)
and 8p subshell (elements 163 through 168).
Actually, more careful calculations have indicated that the picture is not this simple. The calculations indicate that other electrons (8p and Id) in
addition to those identified in the above discussion enter prominendy as early as element 121, and other anomalies may enter as early as element 103, thus
further compEcating the picture. These perturbations, caused by spin-orbit splitting, become especially significant beyond the superactinide series, and lead
to predictions of chemical properties that are not consistent, element by element, with those suggested by Figure 4. The largest deviations occur far beyond
the region of expected nuclear stabiEty, the only region where it might be possible to synthesize or find superheavy elements.
Thus it can be seen that elements in and near the island of stabiEty based on element 114 can be predicted to have chemical properties as foEows.
Element 114 should be a homologue of lead, that is, should be eka-lead, and element 112 should be eka-mercury, element 110 should be eka-platinum, etc
(26,27). If there is an island of stabiEty at element 126, this element and its neighbors should have chemical properties like those of the actinide and
lanthanide elements (26).
Attempts to synthesize and identify superheavy elements, through bombardments of a wide range of heavy nucEdes with a wide range of heavy
ions, have so far been unsuccessful (27). Unfortunately, the yield of the deshed product nuclei is predicted to be very small because the overwhelming
proportion of the nuclear reactions lead to fission and other reactions, rather than to the deshed synthesis of superheavy nuclei through amalgamation of
the heavy ion projectile and the target nucleus. An inherent difficulty in the synthesis of the superheavy nuclei situated near the center of the island of
stabiEty is the simultaneous requirement that there be a sufficient number of neutrons as well as protons in the product nucleus. The deshed product nuclei
have larger ratios of neutrons to protons than the constituent projectiles and target nuclei, and hence, somewhat unusual nuclear reactions are required.
There is no way to know, prior to the actual experimental attempts, which nuclear reactions will be most effective. There are a number of aspects of the
dynamics of the reaction of the heavy incident nuclear projectile with the heavy target nucleus that are not understood and that might present serious or
fatal impediments to the production of superheavy nuclei; eg, the coulomb repulsive force exerted on a heavy projectile may be too large relative to the
nuclear attractive force to allow the deshed amalgamation reaction to occur, and nuclear matter may be too viscous to allow the required ready
amalgamation of the incident heavy ion with the heavy target nucleus.
If the half-life of a superheavy nucleus should happen to be as long as a few times 108 yr (now considered to be very unlikely), this would be long
enough to allow the isotope to survive and still be present on the earth (as in the case of 235U, which has a half-life of 7 x 10⁸ yr), provided that it was
initially present as a result of the cosmic nuclear reactions that led to the creation of the solar system. Every attempt to find evidence in nature, direct or
indirect, of the superheavy elements associated with the island of stabiEty centered around element 114 has been inconclusive. Because of the physical
limitations inherent in any experimental technique, it is not possible to say that such superheavy elements do not exist in nature. The results of such
searches estabEsh that the concentration, if they are present, is extremely small, eg, much less than one part in 1012 parts of ore. Searches have also been
made in cosmic rays, meteorites, and moon rocks, with generally negative results except for some indirect evidence of former presence in meteorites during
the early history of the meteorite's life. There was some evidence found in the Allende meteorite, which fell in Mexico in 1969; the evidence for such an
extinct superheavy element (now considered to be unlikely) was the observation of a unique composition of xenon isotopes that might have been formed
from decay by spontaneous fission with a half-life of 107—109 yr (29). The postulated current synthesis of a broad range of chemical elements, possibly
including superheavy elements, in stars might enhance the prospects for finding even shorter-Eved superheavy elements in cosmic rays (30); elements as
heavy as uranium have apparendy been found in cosmic rays emanating from such stars.
BIBLIOGRAPHY
"Actinides" in ECT 2nd ed., Vol. 1, pp. 351—371, by G. T. Seaborg, U.S. Atomic Energy Commission; "Actinides and Transactinides," in ECT 3rd ed., Vol.
1, pp. 456—488, by Glenn T. Seaborg, University of California, Berkeley.
1. G. T. Seaborg and J. J. Katz, eds., The Actinide Elements, NationalNuclear Energy Series, Div. IV, 14A, McGraw-HiE Book Co., Inc., New York, 1954;
G. T. Seaborg, ed., Transuranium Elements: Products of Modem Alchemy, Benchmark Papers, Dowden, Hutchinson & Ross, Inc., Stroudsburg, Pa.,
1978.
2. Transurane, Gmelins Handbuch der anorganischen Chemie, Part A, The Elements, Vedag Chemie GmbH, Weinheim/Bergstrasse, 1972—1973, Al,1,1973,
Al,II, 1974.
3. E. K. Hyde, I. Perlman, and G. T. Seaborg, Nuclear Properties of the Heaiy Elements, Vol. II, Detailed Radioactivity Properties, Prentice-Hall, Inc.,
Englewood Cliffs, NJ., 1964.
4. С. M. Lederer, J. M. Hollander, and I. Perlman, Table of Isotopes, Sixth Edition, John Wiley & Sons, Inc., New York, 1967.
5. Proceedings of the first United Nations International Conference on the Peaceful Uses of Atomic Energy, Geneva, 1955, United Nations, New York, 1955;
Proceedings of the Second United Nations International Conference on the Peaceful Uses of Atomic Energy, Geneva, 1958, United Nations, New York, 1958;
Proceedings of the Third United Nations International Conference on the Peaceful Uses of Atomic Energy, Geneva, 1964, United Nations, New York, 1964;
Proceedings of the Eourth United Nations International Conference on the Peaceful Uses of Atomic Energy, Geneva, 1971, United Nations, New York, and IAEA,
Vienna, 1972.
6. G. T. Seaborg, Nucl. Appl Technol. 9, 830 (1970).
7. G. T. Seaborg, J. J. Katz, and W. M. Manning eds., The Transuranium Elements: Research Papers, NationalNuclear Energy Series, Div. IV, 14B,
McGraw-HiE Book Co., Inc., New York, 1949.
8. D. C. Hoffman, F. O. Lawrence, J. L. Mewherter, and F. M. Rourke, Nature (Eondon) 234, 132 (1971).
9. G. T. Seaborg, Man-Made Transuranium Elements, Prentice-HaE, Inc., Englewood Cliffs, N.J., 1963.
10. J. L. CrandaE, Production of Berkelium and Californium, Proceedings of the Symposium Commemorating the 25th Anniversary of Elements 97 and 98 held on January
20, 1975, Eawrence Berkeley Eaboratory, Report EBE-4766. Available as TID 4500-R64 from National Technical Information Center, Springfield, Va.,
1975.
Kirk-Othmer Encyclopedia of Chemical Technology (4th Edition)
227
ACTINIDES AND TRANSACTINIDES
Voll
11. Series on Radiochemisty, National Academy of Sciences. Reports available from Office of Technical Services, Department of Commerce,
Washington, D.C.: P. C. Stevenson and W. E. Nervik, Actinium (with scandium, yttrium, rare earths), NAS-NS-3020; E. Hyde, Thorium, NAS-NS
3004-, H. W. Kirby, Protactinium, NAS-NS-3016,). E. Gindler, Uranium, NAS -NS-3050-, G. A. Bumey and R. M. Harbour, Neptunium,
NAS-NS-3060; G. H. Coleman and R. W. Hoff, Plutonium, NAS-NS-3058; R. A. Penneman and R. K. Keenan, Americium and Curium,
NAS-NS-3006-, G. H. Higgins, The Transcurium Elements, NAS-NS-3031.
12. Transurane, Gmelins Handbuch der anorganischen Chemie, Part D, Chemistry in Solution, Springer-Vedag, Berlin, Heidelberg, New York, 1975. DI, D2.
13. C. Keller, The Chemistry of the TransuraniumElements, Vedag Chemie GmbH, 1971.
14. J. J. Katz and G. T. Seaborg, The Chemistry of the Actinide Elements, Methuen & Co., Ltd., London and John Wiley & Sons, Inc., New York, 1957.
15. Ref. 2,A2.
16. G. T. Seaborg, The TransuraniumElements, Yale University Press, New Haven, Conn., 1958.
17. J. C. Bailor, Jr., J. Emeleus, R. Nyholm, and A. F. Trotman-Dickenson, eds., Comprehensive Inorganic Chemistry, Vol. 5, Actinides, Pergamon Press,
Oxford, New York, 1973.
18. Ref. 2, Index, 1979.
19. J. J. Katz, G. T. Seaborg, and L. R. Morss, eds., The Chemistry of the Actinide Elements, 2nd ed., Chapman and Hall, London, 1986.
20. W. Mbller and R. Lindner, eds., Transplutonium 1975, 4th International Transplutonium Element Symposium, Proceedings of the Symposium at Baden Baden
September 13—17, 1975-, W. Mbller and H. Blank, eds., Heaiy Element Properties, 4th International Transplutonium Element Symposium, 5th International
Conference on Plutonium and Other Actinides 1975, Proceedings of the Joint Session of the Baden Baden Meetings September 13, 1975, North-Holland Publishing
Co., Amsterdam, American Elsevier Publishing Co., Inc., New York.
21. Ref. 2, Parts Bl, B2, B3, The Metals and Alloys, 1976,1977.
22. Ref. 2, Part C, The Compounds, 1972.
23. E. C. Baker, G. W. Halstead, and K. N. Raymond, Struct. Bonding (Berlin) 25, 23—68 (1976); T. J. Marks and A. Streitwieser, Jr., Chapt. 22 of ref. 19;
T. J. Marks, Chapt. 23 of ref. 19.
24. W. T. Camall and H. M. Crosswhite, Chapt. 16 of ref. 19.
25. К. E. Gregorich, R. A. Henderson, D. M. Lee, M. J. Nurmia, R. M. Chasteler, H. L. Hall, D. A. Bennett, С. M. Gannett, R. B. Chadwick, J. D.
Leyba, D. C. Hoffman, and G. Herrmann, Radiochim. Acta 43, 223 (1988).
26. G. T. Seaborg, Ann. Rev. Nucl. Sci. 18, 53 (1968); O. L. Keller, Jr., and G. T. Seaborg, Ann. Rev. Nucl. Sci. 27,139 (1977).
27. G. Hermann, Superheavy Elements, International Review of Science, Inorganic Chemistry, Series 2, Vol. 8, Butterworths, London, and University Park Press,
Baltimore, Md., 1975; G. T. Seaborg and W. Loveland, Contemp. Physics 28, 233 (1987).
28. К. E. Gregorich and G. T. Seaborg, LBL Report 27947; Radioanal. Nucl. Chem. 142, 27 (1990).
29. E. Anders, H. Huguchi, J. Gros, H. Takahashi, and J. W. Morgan, Science 190, 1262 (1975).
30. V. Trimble, Rev. Mod. Phys. 47, 877 (1975).
Glenn T. Seaborg
University of California, Berkeley
Kirk-Othmer Encyclopedia of Chemical Technology (4th Edition)
228
ADHESIVES
Voll
ACTIVATED SLUDGE.
See Water, sewage.
ACTIVATION ANALYSIS.
See Fine art examination and conservation; Nondestructive evaluation.
ADAMANTANE.
See Hydrocarbons, survey.
ADHESION.
See Adhesives.
ADHESIVES
An adhesive is a material capable of holding together solid materials by means of surface attachment. Adhesion is the physical attraction of the surface of one
material for the surface of another. An adherend \s, the solid material to which the adhesive adheres and the adhesive bond or adhesive joint is the assembly made
by joining adherends together by means of an adhesive. Practical adhesion is the physical strength of an adhesive bond. It primarily depends on the forces of
adhesion, but its magnitude is determined by the physical properties of the adhesive and the adherend, as well as the engineering of the adhesive bond.
The interphase is the volume of material in which the properties of one substance gradually change into the properties of another. The interphase is
useful for describing the properties of an adhesive bond. The interface, contained within the interphase, is the plane of contact between the surface of one
material and the surface of another. Except in certain special cases, the interface is imaginary. It is useful in describing surface energetics.
Theories of Adhesion
There is no unifying theory of adhesion describing the relationship between practical adhesion and the basic intermolecular and interatomic interactions
which take place between the adhesive and the adherend either at the interface or within the interphase. The existing adhesion theories discussed below are,
for the most part, rationalizations of observed phenomena, although in some cases, predictions regarding the relative ranking of practical adhesion can
actually be made.
Diffusion Theory. The diffusion theory of adhesion is mostly applied to polymers. It assumes mutual solubility of the adherend and adhesive
to form a true interphase. The solubility parameter, the square root of the cohesive energy density of a material, provides a measure of the intermolecular
interactions occurring within the material. Thermodynamically, solutions of two materials are most likely to occur when the solubility parameter of one
material is equal to that of the other. Thus, the observation that "like dissolves like." In other words, the adhesion between two polymeric materials, one an
adherend, the other an adhesive, is maximized when the solubility parameters of the two are matched; ie, the best practical adhesion is obtained when there
is mutual solubility between adhesive and adherend. The diffusion theory is not applicable to substantially dissimilar materials, such as polymers on metals,
and is normally not applicable to adhesion between substantially dissimilar polymers.
Electrostatic Theory. The basis of the electrostatic theory of adhesion is the differences in the electronegativities of adhering materials (1,2).
If two materials having measurably different electronegativities are brought into contact, electron transfer from the material of lower electronegativity to
that of higher electronegativity can occur. This transfer then forms a double layer of charge across an interface and a net attraction results. (The electrostatic
theory of adhesion is generally regarded as being incomplete.)
Surface Energetics and Wettability Theory. The surface energetics and wettability theory of adhesion is concerned with the effect of
intermolecular and interatomic forces on the surface energies of the adhesive and the adherend and the interfacial energy between the two. The distances
over which interatomic and intermolecular forces operate are on the order of 10“ 7 cm. For these forces (and hence adhesion) to have any measurable
value, the adhesive must come into intimate contact with the adherend; the surface of the adherend must be completely "wetted" by the adhesive. Surface
energy, the excess energy that a material possesses because of its surface, can be understood by examining a molecule within the bulk of a material, where
the molecule experiences intermolecular bonding in essentially all directions. In contrast, a molecule at a surface has intermolecular bonds only in the
direction of the bulk material and in the same plane as the surface. There are no intermolecular forces above the surface and the lack of such forces causes a
change in the physical properties of the layers of molecules immediately adjacent to the surface. In general, the density of the surface layers is less than that
of the bulk. Because the distances between molecules are increased, the intermolecular energy is increased, giving rise to excess or surface energy. Interfacial
energy, which is usually smaller in magnitude than surface energy, is found when a material is in contact with a dissimilar substance. This energy arises
because the intermolecular forces in one medium are not necessarily matched by the intermolecular forces in another.
For Equids, the quantities surface energy and surface tension, usually given the symbol y, are numerically the same and are given in units of
millijoules per square meter. Liquid surface energy, or surface tension, is easily observed in that liquids appear to have a skin. Surface energies of common
organic liquids vary from about 10 mJ /m2 up to about 65 mJ /m2 at room temperature. The room-temperature surface energy of water is approximately 72
mJ / m2.
For a solid surface, surface energy and surface tension are not the same. Thermodynamically, the surface energy can be defined as a change in a free
energy function with a change in the surface area of a material. The surface energy of solids cannot be measured directly. However, the value for most
inorganic solids is thought to be in the hundreds of mJ /m2, and for polymers, to be approximately the same as that of organic liquids.
The wettability theory of adhesion is inextricably related to the study of contact angles of liquids on solid surfaces. A force balance at the point of
contact between the liquid and the solid can be written (3)
Kirk-Othmer Encyclopedia of Chemical Technology (4th Edition)
229
ADHESIVES
Voll
7lvcos 9 = 7SV - 7sl
(1)
where yLV is the Equid—vapor interfacial tension, 9 is the contact angle, ysv is the solid—vapor interfacial tension, and ySL is the solid—liquid interfacial
tension. These parameters are all defined in Figure 1.
Fig. 1. Schematic of a liquid drop on a solid surface showing the contact angle, 9, as well as the liquid—solid interfacial energy, ySL, the liquid—vapor
interfacial tension, yLV, and the solid—vapor interfacial energy, ysv.
EC, the work of adhesion, may be defined in terms of the surface energies of the adhesive and the adherend (4)
WA = 71 + 72 - 712
(2)
and the Young-Dupre equation allows one to determine the work of adhesion
WA = 7LV(1 + COS 9)
(3)
from a simple measurement of the contact angle and the liquid surface tension. Much of the experimental work in adhesion science has centered around
the relationship between practical adhesion and the work of adhesion. Recent investigations indicate that practical adhesion can be related to the work of
adhesion times a function describing the energy dissipation mechanisms within an adhesive bond (5).
The surface energy of polymers is an important consideration in the wettability theory of adhesion (6—8). The critical wetting tension, yc, of a solid
surface provides a criterion for the surface's complete wetting. For complete wetting, the liquid surface tension of the liquid that is wetting should be less
than the critical wetting tension of the solid surface wetted. Critical wetting tension is determined by the measurement of the equilibrium contact angles of
various liquids on a single surface to generate a cos 9 versus yLV plot. This plot, extrapolated to cos 0=1, defines the surface's critical wetting tension. A
situation where yLV < yc is necessary but not sufficient for good adhesion.
Also important in the wettability theory of adhesion is bonding across the interface, which can come about through hydrogen bonding, Lewis
acid-base or other donor-acceptor interactions, or covalent bonding. Bonding at an interface is exemplified by the action of coupling agents such as certain
silanes, zirconates, titanates, and chrome complexes. These agents form a covalent bond between an inorganic substrate and an organic overcoat. The
titanates have also been used to modify the rheology of inorganic particulates dispersed in organic media. The silanes have found wide use in adhesion
building situations, most notably that of fiberglass composites and especially in improving environmental resistance of adhesive bonds (see Silicon
COMPOUNDS, SILYLATING AGENTS).
Mechanical Interlocking Theory. If an adhesive and an adherend, differing substantially in physical properties, meet at a sharp interface,
there is an abrupt plane of stress transfer under load. In addition, there is minimal interfacial area between the two, and hence minimal bonding
opportunities. If instead of a sharp interface, there is a microscopically rough surface to which the adhesive can be applied, then there is the possibility of
mechanical interlocking. A microscopically rough surface provides more points of stress transfer under load as well as more surface area for possible
interfacial bonding, than does a sharp one. A rough surface also provides the possibility of a lock and key effect. If the adhesive has wet the adherend so
thoroughly that the adhesive has flowed completely around asperities on the adherend surface, then the adhesive would have to pass physically through the
adherend asperities in order to be removed. This is much the same situation as when a key is turned in a lock. The asperities within the lock cannot be
passed over by the key and hence the key cannot be removed. The adhesive's viscosity, as well as the time of contact of the adhesive on the adherend, play
a substantial role in determining how well a mechanically roughened surface is adhered to by an adhesive.
Guidelines for Good Adhesion. The various adhesion theories can be used to formulate guidelines for good adhesion:
(1) An adhesive should possess a liquid surface tension that is less than the critical wetting tension of the adherend's surface.
(2) The adherend should be mechanically rough enough so that the asperities on the surface are on the order of, or less than, one micrometer in size.
(3) The adhesive's viscosity and application conditions should be such that the asperities on the adherend's surface are completely wetted.
(4) If an adverse environment is expected, covalent bonding capabilities at the interface should be provided.
For good adhesion, the adhesive and the adherend should, if possible, display mutual solubility to the extent that both diffuse into one another, providing
an interphasal zone.
History of Adhesive Bonding
One of the earliest records of the use of adhesive bonding is a mural discovered in a sepulcher in ancient Thebes which depicts veneering of furniture by
means of a hot-melt adhesive. Veneering was discussed in The Natural History of Pliny the Elder, and adhesive bonding is mentioned in the Bible. The
oldest forms of adhesives were those of natural origin, eg, glues that are made from the collagen-containing parts of animals, or from animal blood. Casein,
or milk, glues have been known since the 9th century and exist to this date in a form not substantially different from that discussed by Theophilus. Some
of the more ancient resins used to form adhesives are materials such as bitumen, shellac, and pitch.
Some important advances in adhesive technology include (9):
The synthesis in 1869 of nitrocellulose [9004-70-0]\ the first synthetic adhesive.
The synthesis in 1912 of phenol—formaldehyde resins by Baekeland, which forms the basis of many modem day adhesives.
The synthesis in 1928 of polychloroprene or Neoprene, which has found much use in high strength elastomeric adhesives.
The 1930s marked the development of pressure-sensitive adhesive tapes. Even though adhesives were used in bonding wooden aircraft in the 1900s, the
first metal bonding adhesive was developed for aircraft in 1941 by Nicholas de Bruyne of the Aerotech Company. A significant development in the late
1940s was the advent of the first epoxy resin adhesives followed in the 1950s and 1960s by the cyanoacrylate adhesives which cure under the influence of
moisture. Anaerobic, as well as silicone, adhesives were developed. High temperature resistant adhesives, such as the aromatic polyimides, were formulated
in the United States in the late 1960s, in response to the supersonic transport program. From the late 1940s through the 1980s, the most significant
Kirk-Othmer Encyclopedia of Chemical Technology (4th Edition)
230
ADHESIVES
Voll
advances in adhesive bonding technology involved the marriage of different types of polymers to form hybrid adhesives. Most notable is the use of
elastomeric materials in combination with high strength, cross-linked polymers such as epoxies or phenolics. Recendy, work in the area of adhesives has
centered on modification of high temperature materials and elastomers or other substances. Post-It Notes, which use a specific type of microstructured
adhesive, are an example of the continually expanding appEcations of adhesives. Advances have also been made in the methods of adhesives application.
Application methods range from easy-to-mix containers to robots for high-volume adhesive application.
Advantages and Disadvantages of Using Adhesives
Adhesive Advantages. Adhesive bonding technology is but one means of joining adherends. Other joining technologies include the use of
mechanical fasteners eg, screws, nuts and bolts, rivets, and nails. In comparison to other methods of joining, adhesives provide several advantages. First, a
properly applied adhesive provides a joint having a more uniform stress distribution under load than a mechanical fastener which requires a hole in the
adherend. A hole acts as a stress concentrator; the presence of a hole causes the overall joint strength to be less than expected from the materials'
properties in the assembly under load. Second, adhesives provide the ability to bond dissimilar materials such as metals without facilitation of corrosion. If
two metals which are susceptible to galvanic corrosion are joined by means of a metallic mechanical fastener, the more active metal corrodes more rapidly
than if left unjoined. If this assembly is, instead, made by an adhesive, the adhesive acts as an electrical insulator protecting the more active material from
the less active one. Third, using an adhesive to make an assembly increases fatigue resistance. This factor is especially important in the aircraft industry,
where adhesives are routinely used to increase resistance to fatigue crack propagation in comparison to the use of mechanical fasteners. Fourth, adhesive
joints can be made of heat or shock sensitive materials. Use of these materials is precluded by mechanical fasteners because of the shock of putting the
fastener through the assembly. Fifth, adhesive joining can bond and seal simultaneously. In attempting to create a pressure vessel, a fuselage for an aircraft,
or similar application, an adhesive provides a bond which is strong enough to hold major loads and also seals the assembly against the ingress of water or
the egress of air or pressurized gases. And sixth, use of an adhesive to form an assembly usually results in a weight reduction in comparison to mechanical
fasteners since adhesives, for the most part, have densities which are substantially less than that of metals.
Adhesive Disadvantages. There are some limitations in using adhesives to form assemblies. The major limitation is that the adhesive joint is
formed by means of surface attachment and is, therefore, sensitive to the substrate surface condition. If the surface is substantially contaminated by oils or
dirt then the adhesive does not adhere well and the durability of the adhesive bond is decreased. Fasteners present no such problem. Thus, concomittant to
the increased useage of adhesives, a technology of substrate surface preparation has developed. If the substrate has a layer of extraneous material on the
surface, then the adhesive bond is more likely to fail in service because of the ingress of moisture into the adhesive bond. Coupling agents can play a role in
improving durability under these conditions.
Another limitation of adhesive bonding is the lack of a nondestructive quaEty control procedure. When a rivet or a mechanical fastener has not been
properly installed, it is normally obvious. However, an adhesive which is totally enclosed by the adherends is very difficult to inspect. A number of
nondestructive evaluation (qv) techniques, eg, ultrasonic scanning and x-ray penetration, have been developed, but these methods cannot predict the
strength of an adhesive bond. Rather, they provide information as to the presence of voids within the bond. Adhesive joining can also lead to slower
processing than mechanical fasteners. This depends substantially on the type of adhesive that is being used. Finally, adhesive joining is still somewhat
limited because most designers of assembEes are simply not famiEar with the engineering characteristics of adhesives. Because an adhesive bond depends
upon surface attachment for its strength, the adhesive must be in contact with a substantially larger area than that occupied by a mechanical fastener.
Adhesive joints need to be designed to use adhesive bonding advantages, rather than as a direct replacement to mechanical fasteners.
Mechanical Tests of Adhesive Bonds
The three principal forces to which adhesive bonds are subjected are illustrated in Figure 2. Figure 2a shows a shear force in which one adherend is forced
past the other whereas Figure 2b illustrates peeling. In the peeling situation shown, at least one of the adherends is flexible enough to be bent away from
the adhesive bond. Cleavage is shown in Figure 2c. The cleavage force and the peeling force are very similar to one another, but the former appEes when
the adherends are nondeformable and the latter when the adherends are deformable.
Fig. 2. Illustrations of forces to which adhesive bonds are subjected, (a) A standard lap shear specimen where the black area shows the adhesive. The
adherends are usually 25 mm wide and the lap area is 312.5 mm2. The arrows show the direction of the normal appEcation of load, (b) A peel test where
the loading configuration, shown by the arrows, is for a 180° peel test, (c) A double cantilever beam test specimen used in the evaluation of the resistance
to crack propagation of an adhesive. The normal appEcation of load is shown by the arrows. This load is appEed by a tensile testing machine or other
mechanical means of holding open the end of the specimen.
The principal type of shear test specimen used in the industry, the lap shear specimen, is 2.54 cm wide and has a 3.23-cm2 overlap bonded by the
adhesive. Adherends are chosen according to the industry: aluminum for aerospace, steel for automotive, and wood for construction appEcations. Adhesive
joints made in this fashion are tested to failure in a tensile testing machine. The temperature of test, as weE as the rate of extension, are specified. Results
are presented in units of pressure, where the area of the adhesive bond is considered to be the area over which the force is appEed. Although the 3.23-cm2
Kirk-Othmer Encyclopedia of Chemical Technology (4th Edition)
231
ADHESIVES
Voll
overlap is taken as a standard in the industry, many applications use far larger overlap areas and thus must be tested in such fashion.
Peel tests are accomplished using many different geometries. In the simplest peel test, the T-peel test, the adherends are identical in size, shape, and
thickness. Adherends are attached at their ends to a tensile testing machine and then separated in a ”T” fashion. The temperature of the test, as well as the
rate of adherend separation, is specified. The force required to open the adhesive bond is measured and the results are reported in terms of newtons per
meter (pounds per inch, ppi). There are many other peel test configurations, each dependent upon the adhesive application. Such tests are well described in
the ASTM literature.
Fracture mechanics (qv) tests are typically used for structural adhesives. Thus, tests such as the double cantilever beam test (Fig. 2c), in which two
thick adherends joined by an adhesive are broken by cleavage, provide information relating to structural flaws. Results can be reported in a number of ways.
The most typical uses a quantity known as the strain energy release rate, G^ given in energy per unit area.
Table 1 provides the approximate load bearing capabilities of various adhesive types. Because the load-bearing capabilities of an adhesive are
dependent upon the adherend material, the loading rate, temperature, and design of the adhesive joint, wide ranges of performance are listed.
Table 1. Load-Bearing Capabilities of Adhesives*
Adhesive type Shear load, MPab Peel load, N/mC
pressure sensitive 0.005-0.02d 300-600
rubber based 0.3-7 1000-7000
emulsion 10-14
hot melt 1-15 1000-5000
natural product (structural) 10-14
polyurethane 6-17 2000-10,000
acrylic 6-20 900-6000
epoxy 14-50 700-18,000
phenolic 14-35 700-9,000
polyimide 13-17 350-1760
Load bearing capabilities are dependent upon the adherend, joint design, rate of loading, and temperature. Values given represent the type of adherends
normally used at room temperature. Lap shear values approximate those obtainable from an overlap of 3.2 cm2.
To convert from MPa to psi, multiply by 145.
To convert from N/m to ppi, divide by 175.
Pressure sensitive adhesives normally are rated in terms of shear holding power, ie, time to fail in minutes under a constant load.
Chemistry and Uses of Adhesives
Although materials such as Pordand cement (see Cement), solder (see Solder and brazing alloys), and silicates can be considered to be adhesives, this
discussion only includes organic materials such as those that form the materials presented in Table 1.
Structural Adhesives. A structural adhesive is a resin system, usually a thermoset, that is used to bond high strength materials in such a way
that the bonded joint is able to bear a load in excess of 6.9 MPa (1,000 psi) at room temperature. Structural adhesives are the strongest form of adhesive
and are meant to hold loads permanently. They exist in a number of forms. The most common form is the two-part adhesive, widely available as a
consumer product. The next most familiar is that which is obtained as a room temperature curing liquid. Less common are primer—liquid adhesive
combinations which cure at room temperature. Structural adhesive pastes which cure at 120°C are widely available in the industrial market. Paste adhesives
are applied by methods such as troweling or by means of a spatula. Adhesives requiring the highest technology are obtained in film form: the material is
usually available as a roll in which the adhesive has been cast onto a release liner. The film adhesive is first removed from its release liner and then
smoothed onto the parts to be bonded. These parts are mated and the adhesive is cured in an autoclave where both pressure and temperature can be
controlled.
Epoxy Resins. The chemistry of epoxy resin adhesives is quite varied. However, the most widely used is that formed from the reaction of
4,4z-isopropylidene diphenol (bisphenol A) [80-05-7]) C15H1(5O2, and epichlorohydrin [106-89-8]\ C3H5C1O. This epoxy resin is more commonly known as
the diglycidyl ether of bisphenol A. Its chemistry can be extended by further reaction with the bisphenol A starting material, creating resins of varying
molecular weights that have either oxirane or hydroxyl end functionality. The formulation of most epoxy adhesives is based upon proper selection of
various molecular weights of the diglycidyl ether of bisphenol A and its chain-extended product (see Epoxy resins).
Common room temperature curing chemistries for epoxy resins include reaction with aliphatic amines or mercaptans to generate amino alcohols
and mercaptoether alcohols, respectively. A common high temperature curing method utilizes anhydride. Both the mercaptan and the anhydride addition
reactions are usually catalyzed. One of the more common catalysts for this reaction is tris (dimethylamino)phenol [31194-38-4]C12H21N3O. Etherification,
involving the reaction of alcohols that are often present in epoxy resins with an oxirane to create ether alcohols, is another common curing chemistry.
Although this reaction does not typically take place at room temperature, it does proceed readily in the presence of amine catalysts at temperatures in excess
of 120°C. Imidazoles, which react by an anionic polymerization mechanism with the oxirane at elevated temperatures, are also used in epoxy adhesive
chemistry.
Adhesives which are meant to cure at temperatures of 120 or 171°C require curatives which are latent at room temperature, but react quickly at the
cure temperatures. Dicyanodiamide [461-58-5]) is one such latent curative for epoxy resins. It is insoluble in the epoxy at room temperature but
rapidly solubilizes at elevated temperatures. Other latent curatives for 171°C are complexes of imidazoles with transition metals, complexes of Lewis acids
(eg, boron trifluoride and amines), and diaminodiphenylsulfone, which is also used as a curing agent in high performance composites. For materials which
cure at lower temperatures (120°C), these curing agents can be made more soluble by alkylation of dicyanodiamide. Other materials providing latency at
room temperature but rapid cure at 120°C are the blocked isocyanates, such as the reaction products of toluene diisocyanate and amines. At 120°C the
blocked isocyanate decomposes to regenerate the isocyanate and liberate an amine which can initiate polymerization of the epoxy resin. Materials such as
Monuron can also be used to accelerate the cure of dicyanodiamide so that it takes place at 120°C.
The two-part epoxy adhesive, readily available in hardware stores or other consumer oudets, comes in two tubes. One tube contains the epoxy resin,
the other contains an amine hardener. Common diamine room temperature epoxy curing agents are materials such as the polyamides, available under the
trade name Versamid. These polyamides are the reaction products of dimer acids and aliphatic diamines such as diethylenetriamine [111 -40-0]C4H13N3.
Other room temperature curing agents are triethylenetetraamine [112-24-3]) CRN, ailc^ ^ie polypropylene glycol diamines, known as the Jeffamines. The
physical properties of room temperature curing epoxies depend heavily upon the chemical structure of the curing agent. If there is a high cross-link density
because of polyamino functionality, the resultant cured epoxy resin is likely to be britde. If instead, there is a long distance between the amine functionalities
in the curing agent, the cured resin is likely to be more flexible.
Epoxy structural adhesives are used in an extraordinarily wide range of applications. They are available in essentially all of the forms discussed above,
except for primer—liquid combinations or as room temperature curing liquids. The highest technology application for epoxies is in aerospace structural
Kirk-Othmer Encyclopedia of Chemical Technology (4th Edition)
232
ADHESIVES
Voll
adhesive bonding. Epoxy resin structural adhesives are used for secondary structure in the fuselage, wings, and control surfaces of aircraft. Of specific
interest is the formation of honeycomb structures in which a structural film adhesive is used to bond metallic or nonmetalEc honeycomb face sheets,
generating a very lightweight, yet stiff, structure. Epoxy structural adhesives are also used in the automotive industry for such appEcations as heming flange
bonding or stiffener bonding.
Phenolic Resins. Phenolic resins (qv) are formed by the reaction of phenol [108-95-2], C6H6O, and formaldehyde [50-00-0], CH2O. If basic
conditions and an excess of formaldehyde are used, the result is a resole phenolic resin, which will cure by itself liberating water. If an acid catalyst and an
excess of phenol are used, the result is a novolac phenolic resin, which is not self-curing. Novolac phenolic resins are typically formulated to contain a
curing agent which is most often a material known as hexamethylenetetraamine [100-97-0], CH. 2NC. Phenolic resin adhesives are found in film or solution
form and normally require cures of at least 170°C. Volatiles are eliminated during the curing process for most phenolic-based adhesives. The cure is
performed under very high applied pressures typically exceeding 300—700 kPa (44—100 psi) and bonding is usually accomplished in a hot press or in an
autoclave.
Phenolic resins are the oldest form of synthetic structural adhesives. Usage ranges from bonding automobile and other types of brake linings to
aerospace applications. These adhesives have a reputation for providing the most durable structural bonds to aluminum. Because of volatiles, however, and
the need for high pressures, the phenolic resins are used less as adhesives than the epoxy resins.
Acrylic Adhesives. Acrylic structural adhesives can be classified into three major types: the surface-activated acrylics (anaerobics), the
surface-activated second-generation acrylics, and the cyanoacrylates.
Anaerobic structural adhesives are typically formulated from acrylic monomers such as methyl methacrylate [80-62-6], C5HgO2, and methacrylic acid
[79-41-4], C4H6O2 (see Acrylic ester polymers). Very often, cross-linking agents such as dimethacrylates are also added. A peroxide, such as cumene
hydroperoxide [80-15-9], is used as the polymerization initiator. Anaerobics polymerize by a redox mechanism which takes place between the
hydroperoxide and iron oxide containing surfaces. Materials such as saccharin [81-07-2] and A ,A^-diniethyl-^-toluidine [99-97-8] are used to catalyze this
reaction. The surface-activated acrylics have found use as thread locking adhesives and are widely used as such in machinery construction, automotive
engines, and similar applications. Surface-activated second-generation acrylic adhesives will be discussed later under elastomer modification of structural
adhesives.
Cyanoacrylate adhesives (Super-Glues) are materials which rapidly polymerize at room temperature. The standard monomer for a cyanoacrylate
adhesive is ethyl 2-cyanoacrylate [7085-85-0], which readily undergoes anionic polymerization. Very rapid cure of these materials has made them widely used
in the electronics industry for speaker magnet mounting, as well as for wire tacking and other applications requiring rapid assembly. Anionic polymerization
of a cyanoacrylate adhesive is normally initiated by water. Therefore, atmospheric humidity or the surface moisture content must be at a certain level for
polymerization to take place. These adhesives are not cross-linked as are the surface-activated acrylics. Rather, the cyanoacrylate material is a thermoplastic,
and thus, the adhesives typically have poor temperature resistance.
High Temperature Resistant Adhesives. Structural adhesives having high temperature resistance are used in the aerospace and other
industries wherever light weight, thermally resistant joints are needed. Such joints are often found in automotive, jet, and rocket engines. Resins having high
glass-transition temperatures and high cross-link densities, that are highly aromatic in character, are used to generate these adhesives. In general, the
polymer backbone is formed by multiple rather than single bonds. One example is a polyimide, formed by the reaction of an aromatic anhydride and an
aromatic amine. Telechelic polyimides having terminal norbomyl or acetylenic groups can also be generated in order to provide a cross-linking resin.
Polyphenylquinoxalines have been investigated as high temperature resistant structural adhesives and bismaleimides, using either Michael addition or
Diels-Alder curing chemistry, have recendy found their way into this technology.
Elastomeric Modified Adhesives. The major characteristic of the resins discussed above is that after cure, or after polymerization, they are
extremely brittle. Thus, the utility of unmodified common resins as structural adhesives would be very limited. For highly cross-linked resin systems to be
useful structural adhesives, they have to be modified to ensure fracture resistance. Modification can be effected by the addition of an elastomer which is
soluble within the cross-linked resin. Modification of a cross-linked resin in this fashion generally decreases the glass-transition temperature but increases
the resin flexibiEty, and thus increases the fracture resistance of the cured adhesive. Recently, structural adhesives have been modified by elastomers which
are soluble within the uncured structural adhesive, but then phase separate during the cure to form a two-phase system. The matrix properties are mosdy
retained: the glass-transition temperature is only moderately affected by the presence of the elastomer, yet the fracture resistance is substantially improved.
The eadiest known elastomeric modification of a structural adhesive occurred during World War II, when it was demonstrated that phenoEc resin
adhesives could be modified with poly(vinyl acetal) resins (10). Aluminum sheet was coated using a phenoEc resin and then particles of poly(vinyl acetal)
[26591-54-8] were sprinkled onto the uncured phenoEc resin. The bond was closed, cured at high temperature and high pressure, and a fracture-resistant
bond having improved performance was obtained. PhenoEc resins have also been modified by acrylonitrile—butadiene elastomers, which provide higher
peel strength of the cured adhesive than poly(vinyl acetal) modification. In both cases, flexibilization is presumably effected because the elastomer is soluble
within the phenoEc resin. This is fairly clearly demonstrated in the case of the acrylonitrile—butadiene elastomer modification because the glass-transition
temperature of these phenoEc materials is typically below room temperature.
Elastomer modifiers have also been used to improve the performance of epoxy-based structural adhesives. In much the same fashion as with the
phenoEc resins, butadiene—acrylonitrile elastomers modify epoxies for improvement in peel strength, eg, high molecular weight butadiene—nitrile rubbers
containing carboxyl groups have been used as flexibilizing agents. Epoxy resins have also been modified by elastomers which phase separate in order to
provide a toughened epoxy system. Such elastomers are based upon butadiene—nitrile rubbers that are low in molecular weight and are carboxy or amino
terminated. Prereaction of these elastomers with an epoxy resin forms a copolymer which is soluble in the resin before cure, but insoluble after cure.
Formulators of modified epoxy resin adhesives must also be careful to control the molecular weight between cross-links as the mechanism of toughening
by phase-separated elastomers requires a certain ductiEty of the resin. Materials such as bisphenol A can be included as a chain extension agent or judicious
choices of the curing agent used in the formulation must be made. Other elastomers have also been used to modify epoxy structural adhesives. Notable in
this technology is a phase-separated acryEc elastomer.
AcryEc structural adhesives have been modified by elastomers in order to obtain a phase-separated, toughened system. A significant contribution in
this technology has been made in which acryEc adhesives were modified by the addition of chlorosulfonated polyethylene to obtain a phase-separated
structural adhesive (11). Such adhesives also contain methyl methacrylate, glacial methacryEc acid, and cross-linkers such as ethylene glycol dimethacrylate
[97-90-5]. The polymerization initiation system, which includes cumene hydroperoxide, -dimethyl-^-toluidine, and saccharin, can be appEed to the
adherend surface as a primer, or it can be formulated as the second part of a two-part adhesive. Modification of cyanoacrylates using elastomers has also
been attempted: copolymers of acrylonitrile, butadiene, and styrene; ethylene copolymers with methylacrylate; or copolymers of methacrylates with
butadiene and styrene have been used. However, because of the extreme reactivity of the monomer, modification of cyanoacrylate adhesives is very difficult
and material purity is essential in order to be able to modify the cyanoacrylate without causing premature reaction.
Urethane Adhesives. Urethane structural adhesives are those based upon the reaction of a diisocyanate and a diol (see Urethane polymers).
The cross-linking reaction is between an isocyanate and carbamate to form an akophanate or between an isocyanate and a urea to form a biuret. The diols
are typically polyethers such as polypropylene or polytetramethylene oxide glycol. Polyester polyols, such as polycaprolactone diol, are also used.
Polyethylene and similar glycols are not used because of then affinity for water. Toluene diisocyanate [1321 -38-6] and diphenylmethane 4,4z-diisocyanate
[101-68-8] are used to make polyurethane structural adhesives but because of the toxicity of these aromatic isocyanates, they are not used in low molecular
weight form. Rather, a higher molecular weight material having lower volatiEty, and hence less possibiEty of user sensitization, is formed by reaction of the
diisocyanate and a polyol. Lower molecular weight polyols that are Equid at room temperature and hence easy to mix with the diisocyanate are used. Other
diisocyanates include the aEphatic hydrogenated diphenylmethane diisocyanate and isophorone diisocyanate [4098-71-9], used in appEcations where clear
products are needed.
The physical properties of polyurethane adhesives result from a special form of phase separation which occurs in the cross-linked polyurethane
structure. The urethane portions of polyurethanes tend to separate from the polyol portion of the resin, providing good shear strength, good low
temperature flexibiEty, and high peel strength. Catalysts such as dibutyltin dilaurate [77-58-7], stannous octoate [1912-83-0], l,4-diazabicyclo[2.2.2]octane
Kirk-Othmer Encyclopedia of Chemical Technology (4th Edition)
233
ADHESIVES
Voll
[280-57-9]\ and mercury compounds are used to promote the reaction of isocyanates and polyols. Polyurethanes are mosdy used as two-part structural
adhesives. In one part of the material is mosdy the diisocyanate or the diisocyanate prepolymer while the second part is mosdy the polyol. Various viscosity
modifiers such as inorganic fillers or other polymers are also used. Additionally, polyurethanes can be made into one-part reactive systems obtained by
using catalysts which unblock at cure temperatures or by providing a moisture curing mechanism. Reaction of isocyanates and moisture liberates amines
which can then react with isocyanates to provide a polyurea chain extension. Structural adhesives can also be formulated using blocked isocyanates. That is,
isocyanates can react with low molecular weight compounds materials which will to form thermally revert back to the isocyanate at a certain temperature.
Physical Properties of Structural Adhesives. Table 1 lists the ranges of performance which can be expected from structural adhesives.
Those materials providing highest temperature performance are also those which are most likely to be the most britde. Room temperature curing
adhesives, in general, provide the lowest performance. The best overall performance is from those obtained using the 120°C curing epoxy-based,
rubber-modified, film adhesive; these are the materials of choice for demanding applications such as aerospace structural adhesive bonding.
Natural-Product-Based Adhesives.
Protein-Based Adhesives. Protein-based adhesives are normally used as structural adhesives; they are all polyamino acids that are derived
from blood, fish skin, casein [9000-71 -9]\ soybeans, or animal hides, bones, and connective tissue (collagen). Setting or cross-linking methods typically used
are insolubilization by means of hydrated lime and denaturation. Denaturation methods require energy which can come from heat, pressure, or radiation, as
well as chemical denaturants such as carbon disulfide [75-15-0] or thiourea [62-56-6]. Complexing salts such as those based upon cobalt, copper, or
chromium have also been used. Formaldehyde and formaldehyde donors such as hexamethylenetetraamine can be used to form cross-links. Removal of
water from a protein will also often denature the material.
A typical formula for a protein-based adhesive includes a natural protein that has been solubilized by means of sodium hydroxide and then
dispersed in water. This ionized protein then is mixed with a defoamer, hydrated lime which acts as the cross-linking agent, sodium silicate, various
chemical denaturants, and biocides. These last materials are added because proteins are also nutrients for microbes. Fillers are also added in order to modify
viscosity. Depending upon the formulation, the pot life of such an adhesive can be from several hours to several days. The adhesive is typically applied by a
roll coater and is normally heat cured in a press. The formula just described is typical of those used for the manufacture of plywood where the critical
features include the moisture content of the wood, lack of foam in the coating, a material which is roll coatable, appropriate shelflife, and finally, resistance
to moisture. The moisture content is critical to adhesive bond performance in that the physical properties of wood (qv) are substantially affected by the
amount of water it contains. If plywood is made in such a fashion that the wood is either very dry or very wet during bonding, the plywood, when it
changes moisture content during use, will change its size enough that it may delaminate. Protein-based adhesives are normally ranked by their resistance to
moisture. Blood or blood—soybean-blend adhesives are considered to be the most water resistant, followed by casein or casein—soybean blends. The
adhesive of least water resistance is based upon soybeans or animal hide glue.
Starch-Based Adhesives. Starches in the form of amylose [9005-82-7] and amylopectin [9037-22-3]\ both branched carbohydrates, are
obtained from plants by hot water leeching of roots and seeds. The resultant starch (qv) is a granular, semicrystalline material, which must be cooked in
order to be dispersed in water and hence used as an adhesive. No true aqueous solutions form upon heating. Rather the mixture is a dispersion of various
portions of the starch molecules. Starch can be chemically modified in a number of fashions. One way is to modify starch in water in the presence of a
mineral acid leading to a composition known as thin boiling starch. Treatment using sodium hypochlorite [7681-52-9] or other oxidizing media leads to
oxidized starches in which the association of the chains is reduced. Dextran [9004-54-0] is obtained by roasting acidified, dried starch. Starch can also be
esterified to give various chemical materials. Typical starch-based adhesives include various additives and modifiers. One modifier is a plasticizer, which can
be used to flexibilize the starch adhesive. Preservatives are also added to prevent these materials from providing nutrients for microbes. Fillers, such as
kaolin [1332-58-7] clay, and calcium carbonate [471-34-1are added both to modify the viscosity of the starch adhesive and to reduce the cost of the
material. Borax [1303-96-4]y which can act as a viscosity modifier, is very often used because it increases the tack, and acts as an antimicrobial. Starch-based
adhesives find most use in the area of binding paper (qv). They have been used as gum label and envelope adhesives, and, in certain formulations, provide
the adhesive for the bottom of paper grocery bags.
Cellulosics. Cellulosic adhesives are obtained by modification of cellulose [9004-34-6] (qv) which comes from cotton linters and wood pulp.
Cellulose can be nitrated to provide cellulose nitrate [9004-70-0]y which is soluble in organic solvents. When cellulose nitrate is dissolved in amyl acetate
[628-63-7], for example, a general purpose solvent-based adhesive which is both waterproof and flexible is formed. Cellulose esterification leads to materials
such as cellulose acetate [9004-35-7]y which has been used as a pressure-sensitive adhesive tape backing. Cellulose can also be ethoxylated, providing
hydroxyethylcellulose which is useful as a thickening agent for poly(vinyl acetate) emulsion adhesives. Etherification leads to materials such as
methylcellulose [9004-67-5] which are soluble in water and can be modified with glyceral [56-81-5] to produce adhesives used as wallpaper paste (see
Cellulose esters; Cellulose ethers).
Tackifying Resins. Tackifying resins have found great use in modifying a number of different types of adhesives. Abietic acid [514-10-3] and
pimaric acid [127-27-5]\ known as rosin acids, are obtained from pine tree sap. These acids are not used in their natural form; rather they are modified by a
number of techniques, such as heating to high temperatures to induce disproportionation, reaction with alcohols to provide an esterified product, or
reaction with various catalysts either to hydrogenate or to polymerize the material. Aromatic resins, for example the coumarone—indene resins, are obtained
from natural product streams, such as coal, petroleum, or wood tar. Chemicals such as indene [95-13-6] or methylindene are polymerized with styrene
[100-42-5] or methylstyrene in the presence of a Lewis acid to provide aromatic tackifying resins. Aliphatic hydrocarbon tackifying resins are obtained from
polymerization products of cis- and trans-piperylene (1,3-pentadiene) and isoprene and dicylopentadiene; terpene resins are obtained from turpentine and
citrus peels. Additionally, natural products such as CC-pinene, P-pinene, and dipentene are polymerized in the presence of aluminum chloride to provide
terpene resins. The uses of tackifying resins are discussed below.
Pressure-Sensitive Adhesives. A pressure-sensitive adhesive, a material which adheres with no more than applied finger pressure, is
aggressively and permanendy tacky. It requires no activation other than the finger pressure, exerts a strong holding force, and should be removeable from a
smooth surface without leaving a residue.
Applications and Formulation. Pressure-sensitive adhesives are most widely used in the form of adhesive tapes. These tapes are used for
an extraordinary number of applications: masking, medical applications, electrical insulation, assembly, packaging, and other applications. The application
governs the choice of tape backing and the adhesive formulation. A transparent backing having a relatively weak adhesive is used for paper mending; a
filament filled backing having an aggressive adhesive is used for packaging applications. Pressure-sensitive adhesives are also obtainable in aerosol form for
use in various graphic arts applications.
The general formula for a pressure-sensitive adhesive includes an elastomeric polymer, a tackifying resin, any necessary fillers, various antioxidants
and stabilizers, if needed, and cross-linking agents. In formulating a pressure-sensitive adhesive, a balance of three physical properties needs to be taken
into account: shear strength, peel strength, and tack. The shear strength or shear holding power of the adhesive is typically measured by hanging a weight
on the end of a piece of tape and measuring the time to failure. Tack is the technical term applied to quantify the sticky feel of the material. In general, the
shear strength and the tack of a pressure-sensitive adhesive increase and then go through a maximum as a function of the amount of tackifying resin
added. The peel strength usually increases with the amount of tackifying resin. The shear holding power often depends upon the mode of cross-linking.
Thus, a balance of properties appropriate to the application is obtained by controlling the rubber-to-resin ratio as well as the level and type of cross-linking
agent.
The most widely, and perhaps the earliest, elastomer used to formulate pressure-sensitive adhesives is natural rubber. In 1845 a patent was granted
for a formulation including India rubber, gum of southern pine, balsam of Реш, and ground litharge (12). This formulation provided a material akin to a
pressure-sensitive adhesive. Other elastomers which have been used are the butyl rubbers, poly(vinyl ether)s, acrylics (especially those having long chain
alkyl groups), and silicones. The modes of tackifying depend upon the elastomers. Natural rubber, butyl rubber, and acrylic materials are typically tackified
by the addition of a tackifying agent of the type described above. Block copolymers such as the styrene—butadiene—styrene block or the
styrene—isoprene—styrene block must be treated so that the continuous phase is the tackified material. Thus, the choice of tackifying resin depends upon
the solubility of the tackifying agent in the continuous phase. Vinyl ethers are tackified by adding lower molecular weight poly(vinyl ether). Silicone
pressure-sensitive adhesives are typically tackified by the addition of silicone gum and silicone resin to the silicone elastomer.
Natural-rubber-based pressure-sensitive adhesives can be cured by standard rubber curatives, eg, sulfur plus an accelerator (see Rubber, natural);
Kirk-Othmer Encyclopedia of Chemical Technology (4th Edition)
234
ADHESIVES
Voll
butyl rubber adhesives can be cured by ^-quinone dioxime plus oxidizers; and acrylics can be cured by the addition of difunctional acrylics which form
cross-links upon curing. Silicones are typically cross-linked by means of peroxide cures. In order to form tapes, pressure-sensitive adhesives can be applied
to substrates by several methods. The most common is to apply adhesive out of solvent. However, considering the increased regulation of solvents, the
more environmentally safe method is to coat pressure-sensitive adhesives either as hot-melts or as water-based emulsions.
Hot-Melt Adhesives. Hot-melt adhesives are 100% nonvolatile thermoplastic materials that can be heated to a melt and then applied as a
Equid to an adherend. The bond is formed when the adhesive resoEdifies. The oldest example of a hot-melt adhesive is sealing wax.
Formulations. Hot-melt adhesive formulation involves providing the best physical properties over as large a temperature range as possible.
This type of adhesive is generally useful in the temperature range where the material is either leathery or rubbery, ie, between the glass-transition
temperature and the melt temperature. Hot-melt adhesives are based on thermoplastic polymers that may be compounded or uncompounded:
ethylene—vinyl acetate copolymers, paraffin waxes, polypropylene, phenoxy resins, styrene—butadiene copolymers, ethylene—ethyl acrylate copolymers, and
low, and low density polypropylene are used in the compounded state; polyesters, polyamides, and polyurethanes are used in the mosdy uncompounded
state.
The most widely used thermoplastic polymer is the ethylene—vinyl acetate copolymer, which is obtainable in a wide range of molecular weights as
well as in a variety of compositions. Often flexibilizers or plasticizers are added in order to improve both the mechanical shock resistance and the thermal
properties of the adhesive. Polybutenes, phthalates, and tricresyl phosphate have been used as plasticizers. Tackifying agents can also be added. Because
hot-melt adhesives are frequendy ethylene-based, they are subject to oxidation if, as in a typical situation, the adhesive sits in an appEcator for long periods
before use. Thus, antioxidants such as hindered phenols are often used, as are fillers. Fillers are added to opacify or to modify the adhesive's flow
characteristics, as well as to reduce cost. Wax is also a very important component. Wax alters surface characteristics by decreasing both the Equid adhesive's
surface tension and its viscosity in the melt. Upon soEdification, however, the wax acts to increase the strength of the adhesive. Both paraffin and
microcrystalline wax are used (see Waxes).
In the area of molecularly designed hot-melt adhesives, the most widely used resins are the polyamides (qv), formed upon reaction of a diamine and
a dimer acid. Dimer acids (qv) are obtained from the Diels-Alder reaction of unsaturated fatty acids. Linoleic acid is an example. Judicious selection of
diamine and diacid leads to a wide range of adhesive properties. Typical shear characteristics are in the range of thousands of kilopascals and are dependent
upon temperature. Although hot-melt adhesives normally become quite britde below the glass-transition temperature, these materials can often attain
physical properties that approach those of a structural adhesive. These properties severely degrade as the material becomes Equid above the melt
temperature.
Hot-melt adhesives, normally appEed from an automatic appEcator or a hand-held gun, are extraordinarily useful materials because of rapid bonding
characteristics. Problems in using hot-melt adhesives are usually associated with the lack of high temperature performance because, being thermoplastic,
they tend to creep under load. Many of these problems can be solved by adding some degree of cross-linking, which must take place after the adhesive has
been appEed, not at the temperature at which the adhesive is kept Equid inside the appEcator. Moisture-curing urethanes have been attempted as
cross-linking agents. One of the largest appEcations is in the paperback book industry in the area of book binding. Hot-melt adhesives have also been used
in shoe and furniture manufacture where, in the latter case, the problems of creep do enter into the appEcation consideration. Box and carton sealing is a
very large use area, as is that of corrugated paper manufacture. Consumer appEcations are growing also.
Solvent- and Emulsion-Based Adhesives.
Solvent-Based Adhesives. Solvent-based adhesives, as the name impEes, are materials that are formed by solution of a high molecular weight
polymer in an appropriate solvent. Although the polymer is usually an elastomer, there are a number of cases in which the adhesive contains a
nonelastomeric polymer such as poly(vinyl chloride). These adhesives can be divided into three categories: the contact bond, the reactivatable, and the
solvent weld adhesive. The contact bond adhesive is appEed by spray or roll coating on both sides of an adherend combination. After some portion of the
solvent evaporates, the adherends are joined and the adhesive rapidly bonds or knits to itself. There is a window of time in which there is just enough tack
exhibited by the adhesive to bond. The reactivatable adhesive is appEed to both sides of an adherend combination and the solvent is allowed to evaporate
completely. The adhesive, nontacky and dry to the touch, can be reactivated by wiping the surface with solvent. In the solvent weld adhesive, the polymer is
more than likely a nonelastomeric material and the solvent mix is chosen to dissolve the adherend to which the bond is to be made. After a portion of the
adherend dissolves, a solution forms between the high molecular weight, polymeric adhesive and the adherend at the surface. This type of adhesion is best
explained by diffusion theory.
A rubber-based adhesive can be a very complex mixture of ingredients. The main component is an elastomer from which the adhesive derives most
of its strength. Tackifiers are often added both to provide tack and to increase the autohesion or knitting characteristics; plasticizers are often added to
make the adhesive more permanendy soft; and pigments and fillers are used to change color, control viscosity, and reduce cost. Solvents, a key portion of
solvent-based adhesives, reduce viscosity to allow appEcation and modify the green strength or knitting characteristics. Curing systems, which can build
heat resistance and increase the shear strength of the material, are often added also. Metal oxides are frequently used because they participate in the cure in
the normal sense of vulcanization of elastomers. These oxides can act as acid acceptors when the base resin is a Neoprene polymer. Antioxidants can also
be added in order to provide stabiEty.
Almost all common elastomers have been used in rubber-based adhesives; the required performance governs the type. A natural-rubber-based
adhesive, in combination with naphtha, was originally introduced in 1791. More recendy, the use of reclaimed tire rubber has been attempted. The most
widely utilized elastomer is Neoprene (polychloroprene), which is especially good in contact bond adhesives when used in the presence of appropriate
tackifying resins (see Elastomers, synthetic,polychloroprene). The tackifying resins are much the same as those found in the formulation of
pressure-sensitive adhesives. The appEcation characteristics of the adhesives derive mainly from the type of solvent system employed. New regulations
regarding solvent emissions prescribe the use of a latex system, which can provide many of the same properties as a solvent-based system but are often not
as good overall. The first elastomer-based latex system was derived from natural rubber latex.
The largest market for elastomer-based adhesives is that of lamination (see Laminates). Modem office furniture having Formica as a surfacing
material is made with an elastomer-based adhesive. Tile adhesives for ceramic or carpet tile are also elastomer-based and usually solvent appEed. Paper
adhesives and shoe manufacture also use substantial quantities of rubber-based materials. Solvent-weld adhesives are used to join plastic plumbing and to
repair vinyl sheeting.
Emulsion Adhesives. The most widely used emulsion-based adhesive is that based upon poly(vinyl acetate)—poly(vinyl alcohol) copolymers
formed by free-radical polymerization in an emulsion system. Poly(vinyl alcohol) is typically formed by hydrolysis of the poly(vinyl acetate). The properties
of the emulsion are derived from the polymer employed in the polymerization as well as from the system used to emulsify the polymer in water. The
emulsion is stabilized by a combination of a surfactant plus a colloid protection system. The protective colloids are similar to those used paint (qv) to
stabilize latex. For poly(vinyl acetate), the protective colloids are isolated from natural gums and cellulosic resins (carboxymethylcellulose or
hydroxyethylcellulose). The hydrolized polymer may also be used. The physical properties of the poly(vinyl acetate) polymer can be modified by changing
the co-monomer used in the polymerization. Any material which is free-radically active and participates in an emulsion polymerization can be employed.
Plasticizers (qv), tackifiers, viscosity modifiers, solvents (added to coalesce the emulsion particles), fillers, humectants, and other materials are often added
to the adhesive to meet specifications for the intended appEcation. Because the presence of foam in the bond line could decrease performance of the
adhesion joint, agents that control the amount of air entrapped in an adhesive bond must be added. Biocides are also necessary: many of the materials that
are used to stabilize poly(vinyl acetate) emulsions are natural products. Poly(vinyl acetate) adhesives known as "white glue" or "carpenter's glue" are
available under a number of different trade names. AppEcations are found mostiy in the area of adhesion to paper and wood (see Vinyl polymers).
Economic Aspects
Although the manufacture and sale of adhesives is a worldwide enterprise, the adhesives business can be characterized as a fragmented industry. The 1987
Census of Manufacturers obtained reports from 712 companies in the United States, each of which considers itself to be in the adhesives or sealants
business (13); only 275 of these companies had more than 20 employees. The total value of material shipped by these companies approached 4.7 bilEon
Kirk-Othmer Encyclopedia of Chemical Technology (4th Edition)
235
ADHESIVES
Voll
dollars, 3 billion of which were attributed to materials classified as adhesives. Adhesive types and the corresponding dollar value of material in 1987 are
given in Table 2. Phenolics, poly(vinyl acetate) adhesives, rubber cements, and hot-melt adhesives are the leading products in terms of monetary value.
These products are used primarily in the wood, paper, and packaging industries. The annual growth rate of the adhesives market is 2.3% (14) and individual
segments of the market are expected to grow faster than this rate. For example, environmentally forgiving materials, such as emulsion-based or hot-melt
adhesives, are in the faster growth category.
Table 2. Value of Shipments Produced by Adhesives Suppliers in 1987a
Adhesive type Value, $ x 106
natural product adhesives epoxy adhesives phenolics (including resorcinol-based) urea and modified urea poly (vinyl acetate) emulsion poly(vinyl chloride) acryEc cyanoacrylate urethane hot melts rubber and synthetic resin combinations rubber cement emulsion rubber cement (solvent-based) 154 162 219 147 407 32 123 38 93 376 346 55 128
aRef. 13.
Market analysis predicts that the demand for adhesives will increase to ten billion dollars by 1993, given a manufacturing volume of 4.76 million
metric tons (14). The cost of specific adhesive materials depends upon the specifications of the final product, the manufacturing process, and the
marketing strategies used by individual companies. For example, given two epoxy adhesives having similar formulations, one could be sold at a relatively
low price to a general consumer market where exacting manufacturing conditions are not required, and the other could be sold at a substantially higher
price into an aerospace market where the manufacturing conditions must be exact and performance must meet demanding specifications.
Most adhesive manufacturers have a broad line of products often spanning the entire range of available materials. For example, the National Starch
and Chemical Corporation, now a subsidiary of Unilever, markets adhesives which range from hot-melts to dextrin [9004-53-9] based materials under
brand names such as Duro-Tak, Panel Master, Instant-Lok and Bondmaster. The 3M Company, which is also a multinational organization, markets all
forms of adhesives from the well-known Scotch Pressure-Sensitive Tapes to Scotch-Grip and Scotch-Weld adhesives. Ciba-Geigy, another multinational
company, sells structural adhesives under the Araldite brand name. A large number of adhesive manufacturers sell into specialty markets. An example is the
Loctite Corporation, which sells cyanoacrylates, acrylics, and anaerobic adhesives under a variety of brand names such as Loctite and Permatex. Consumer
needs are filled by such companies as Borden, which manufactures and sells the well known Elmer's Glue, a synthetic resin emulsion. Krazy Glue is a
cyanoacrylate adhesive marketed by the Krazy Glue Company; Duro Super Glue is sold by Loctite Corporation. Companies such as H. B. Fuller
manufacture many adhesives commonly found in hardware stores. Listings of brand names of adhesive products (15) and adhesive manufacturers (16) are
available.
Health and Safety
Health and safety information is available from the manufacturer of every adhesive sold in the United States. The toxicology of a particular adhesive is
dependent upon its components, which run the gamut of polymeric materials from natural products which often exhibit low toxicity to isocyanates which
can cause severe allergic reactions. Toxicological information may be found in articles discussing the manufacture of the specific chemical compounds that
comprise the adhesives.
BIBLIOGRAPHY
1. В. V. Derjaguin and V. P. Smilga,/ Appl. Phys. 38, 4609 (1967).
2. В. V. Derjaguin and Yu. P. Toporov, in K. L. Mittal, ed., Physicochemical Aspects of Polymer Surfaces, Plenum Press, New York, 1981, pp. 605—612.
3. T. Young, Trans. R Soc. (London) 95, 65 (1805).
4. A. Dupre, Theorie Mechanique de la Chaleur, Paris (1869).
5. A. N. Gent and G. R. Hamed, "Adhesion," inj. I. Kroschwitz, ed., Encyclopedia ofPolymer Science and Engineering, Vol 1, John Wiley & Sons, New
York, 1985, pp. 476-578.
6. H. W. Fox and W. A. Zisman,/. ColloidSci. 5, 514 (1950).
7. H. W. Fox and W. A. Zisman,/ ColloidSci. 7, 109, 428 (1952).
8. W. A. Zisman, in F. M. Fowkes, ed., Contact Angle, Wettability and Adhesion, (Adv. Chem. Ser. No. 43), American Chemical Society, Washington,
D.C., 1964, p. 1.
9. J. Delmonte, The Technology of Adhesives, Reinhold, New York, 1947.
10. Brit. Pat. 577,823 (June 3,1946), N. A. DeBruyne.
11. U.S. Pat. 3,890,407 (June 17, 1975), P. C. Briggs, Jr., and L. C. Muschiatti (to E. I. Du Pont de Nemours and Company).
12. U.S. Pat. 3,965 (1845), W. H. Shecut and H. H. Day.
13. Adhesives Age 33(2), 32 (1990).
14. Adhesives Age 32(9), 46 (1989).
15. A. Sweum, Adhesives Led Book, Communication Channels, Inc., Adanta, Ga, 1982.
16. Adhesives Age 32(6), 33 (1989).
General References
"Adhesion and Bonding;" "Adhesive Compositions," Vol. 1 (1985). "Pressure Sensitive Adhesives and Products," Vol. 3 (1988) in J. I. Kroschwitz, ed.,
Encyclopedia of Polymer Science and Engineering,) Am Wiley & Sons, Inc., New York.
I. M. Skeist, ed., Handbook of Adhesives, 3rd ed. Van Nostrand-Reinhold, New York, 1990. A basic resource for practitioners of this technology.
D. Satas, ed., Handbook of Pressure S ensitive Adhesive Technology, Van Nostrand-Reinhold, New York, 1989.
R. D. Adams and W. C. Wake, Structural Adhesive Joints in Engineering, Elsevier, New York, 1984.
S. R. Hartshorn, ed., Structural Adhesives: Chemistry andTechnology, Plenum, New York, 1986.
N. J. De Lollis, Adhesives, Adherends, Adhesion, Krieger Publishing Co., Melbourne, Fla., 1980.
Kirk-Othmer Encyclopedia of Chemical Technology (4th Edition)
236
ADHESIVES
Voll
A. Pizzi, ed., Wood Adhesives: Chemistry andTechnolo^y^ Marcel Dekker, New York, 1983.
W. C. Wake, ed., Adhesion and the formulation ojAdhesives, Elsevier Publishing Co., New York, 1982.
S. Wu, Polymer Interface and Adhesion., Marcel Dekker, New York, 1982. A basic textbook covering surface effects on polymer adhesion.
K. W. Allen, ed., Adhesion., Vols. 1—14, Elsevier Science Publishers Ltd., Barking, UK, Latest volume is 1990. An annual volume containing recendy
presented research results.
Alphonsus V. Pocius
The 3M Company
Kirk-Othmer Encyclopedia of Chemical Technology (4th Edition)
237
ADIPIC ACID
Voll
ADIPIC ACID
Adipic acid, hexanedioic acid, 1,4-butanedicarboxylic acid, mol wt 146.14, HOOCCH2CH2CH2CH2COOH [124-04-9]is a white crystalline solid with a
melting point of about 152°C. Litde of this dicarboxylic acid occurs naturally, but it is produced on a very large scale at several locations around the world.
The majority of this material is used in the manufacture of nylon-6,6 polyamide [32131 -17-2]> which is prepared by reaction with 1,6-hexanediamine
[124-09-4]. W. H. Carothers' research team at the Du Pont Company discovered nylon in the early 1930s (1), and the fiftieth anniversary of its commercial
introduction was celebrated in 1989. Growth has been strong and steady during this period, resulting in an adipic acid demand of nearly two billion metric
tons per year worldwide in 1989. The large scale availability, coupled with the high purity demanded by the polyamide process, has led to the discovery of a
wide variety of applications for the acid.
Chemical and Physical Properties
Adipic acid is a colorless, odorless, sour tasting crystalline solid. Its fundamental chemical and physical properties are listed in Table 1. Further information
may be obtained by referring to studies of infrared and Raman spectroscopy of adipic acid crystals (11,12), ultraviolet spectra of solutions (13), and
specialized thermodynamic properties (14,4). Solubility and solution properties are described in Table 2. The crystal morphology is monoclinic prisms
strongly influenced by impurities (21). Both process parameters (22) and additives (21) profoundly affect crystal morphology in the crystallization of adipic
acid, an industrially significant process. Aqueous solutions of the acid are corrosive and their effect on various steel alloys have been tested (23). Generally,
austenitic stainless steels containing nickel and molybdenum and over 18% chromium are resistant. Data on 20 metals were summarized in one survey (24).
Bulk and handling properties of adipic acid are summarized in Table 3.
Table 1. Physical and Chemical Properties of Adipic Acid
Property Value Reference
molecular formula I I (*
molecular weight 146.14
melting point, °C 152.1 ±0.3 2
specific gravity 1.344 at 18°C (sol) 3
1.07 at 170°C (Uq) 4
coefficient of cubical expansion, A-1 4.0 x 10~4 at 35-150°C (sol) 4
10.3 x HI at 155-168°C (Uq) 5
vapor density, air = 1 5.04
vapor pressure, Pa solid at °C 6
18.5 9.7
32.7 19.3
47.0 38.0
liquid at °C 7
205.5 1,300
216.5 2,000
244.5 6,700
265.0 13,300
specific heat, kJ/kg-K 1.590 (solid state) 8
2.253 (liquid state) 9,8
heat of fusion, kJ /kgb 1.680 (vapor, 300°C) 115
entropy of fusion, J/mol-K 79.8 4,10
heat of vaporization, kJ /kg 549
melt viscosity, mPa-s(=cP) 4.54 at 160°C
heat of combustion, kJ /mol 2.64 at 193°C 2800 10
To convert Pa to mm Hg divide by 133.3.
To convert J to cal divide by 4.184.
Table 2. Solution Properties of Adipic Acid
Property V alue Reference
heat of solution in H2O, kJ /kg 214 at 10-20°C 15 241 at 90-100°C
dissociation constant in H2O at 25°C кг К, 16,17 3.7 x 10⁻⁵ 3.86 x 10⁻⁶
at 50°C 3.29 x 10⁻⁵ 3.22 x 10⁻⁶
at 74°C solubflity in H2O, g/100 g H2O at 15°C 2.90 x 10⁻⁵ 2.55 x lO^6 18 1.42
Kirk-Othmer Encyclopedia of Chemical Technology (4th Edition)
238
ADIPIC ACID
Voll
at 40°C 4.5
at 60°C 18.2
at 80°C 73
at 100°C 290
pH of aqueous solutions 19
0.1 wt % 3.2
0.4 wt % 3.0
1.2 wt % 2.8
2.5 wt % 2.7
solubility in organic solvents at 25°C
very soluble in methanol, ethanol
soluble in acetone, ethyl acetate
very slighdy soluble in cyclohexane, benzene
distribution coefficient
organic solvents vs HnO wt % in H 9O
’ wt % in solvent
CC1., CHCL, C.H. 4’ 3’ 6 6 >10 20
disopropyl ketone 4.8
butyl acetate 2.9
ethyl ether 2.2
methyl isobutyl ketone 1.2
ethyl acetate 0.91
methyl propyl ketone 0.55
methyl ethyl ketone 0.50
cyclohexanone 0.32
я-butanol 0.31
To convert kJ to kcal divided by 4.184.
Table 3. Bulk Phase Handling Properties of Adipic Acid
Property Value Reference
bulk density , kg/m3 640-800 19
flash point, Cleveland open cup, °C 210 5
flash point, closed cup, °C 196
autoignition temperature, °C 420 5
dust cloud ignition temperature, °C 550
minimum explosive concentration (dust in air), kg/m3 0.035 25,26
minimum dust cloud ignition energy, J 6.0 x 10~2 27
maximum rate of pressure rise, MPa /s 18.6
A function of particle size.
To convert J to cal divide by 4.184.
To convert MPa to psi multiply by 145.
Chemical Reactions
Adipic acid undergoes the usual reactions of carboxylic acids, including esterification, amidation, reduction, halogenation, salt formation, and dehydration.
Because of its bifunctional nature, it also undergoes several industrially significant polymerization reactions.
Esterification. Esters and polyesters comprise the second most important class of adipic acid derivatives, next to polyamides. The acid readily
reacts with alcohols to form either the mono- or diester. Although the reaction usually is acid-catalyzed, conversion may be enhanced by removal of water
as it is produced. The methyl ester is an industrially important material, because it is a distillable derivative which provides a means of separating or
purifying acid mixtures. Recent modifications of adipic acid manufacturing processes have included methanol esterification of the dicarboxylic acid
by-product mixture. Thus glutaric acid [110-94-1J and succinic acid [110-15-6] can be recovered upon hydrolysis, or disposed of as the esters (28).
Monomethyl adipate can be electrolyzed as the salt to give dimethyl sebacate [106-79-6] (Kolbe synthesis) (29), an important ten-carbon diacid. Diesters
from moderately long-chain (8 or 10 carbon) alcohols are also an important group, finding use as plasticizers, eg, for PVC resins. Table 4 lists the boiling
points of several representative adipate esters. Reactions with diols (especially ethylene glycol) give polyesters, also important as plasticizers in special
appEcations. In another important use of adipate esters, low molecular weight polyesters terminated in hydroxyl groups react with polyisocyanates to give
polyurethane resins. Polyurethanes consumed about 4% of adipic acid production in the United States in 1986 (30).
Table 4. Esters of Adipic Acid
Ester CAS Registry Number Pressure, kPa Boiling point, °C
monomethyl [627-91-8] 1.3 158
dimethyl [627-93-0] 1.7 115
monoethyl [626-86-8] 0.9 160
diethyl [141-28-6] 1.7 127
di-я-propyl [106-19-4] 1.5 151
di-я-butyl [105-99-7] 1.3 165
di-2-ethylhexyl [103-23-1] 0.67 214
di-я-nonyl [151-32-6] 0.67 230
di-я-decyl [105-97-5] 0.67 244
di-tridecyl [16958-92-2] 101.3 349
octyl decyl [110-29-2] 0.67 235
di- (2-butoxyethyl) [141-18-4] 0.53 215
Kirk-Othmer Encyclopedia of Chemical Technology (4th Edition)
239
ADIPIC ACID
Voll
a To convert kPa to mm Hg multiply by 7.5.
Salt Formation. Salt-forming reactions of adipic acid are those typical of carboxylic acids. Alkali metal salts and ammonium salts are water
soluble; alkaline earth metal salts have limited solubility (see Table 5). Salt formation with amines and diamines is discussed in the next section.
Table 5. Solubility of Adipic Acid Salts
Salt CAS Registry Number Temperature, °C SolubiEty, g/100 g h2o
disodium (hemihydrate) [7486-38-6] 14 59
dipotassium [19147-16-1] 15 65
diammonium [3385-41-9] 14 40
calcium
(monohydrate) [18850-78-7] 13 4
(anhydrous) [22322-28-7] 100 1
barium
(monohydrate) 12 12
(anhydrous) [60178-88-0J 100 7
Amidation. Heating of the diammonium salt or reaction of the dimethyl ester with concentrated ammonium hydroxide gives adipamide
[628-94-4], mp 228°C, which is relatively insoluble in cold water. Substituted amides are readily formed when amines are used. The most industrially
significant reaction of adipic acid is its reaction with diamines, specifically 1,6-hexanediamine. A water-soluble polymeric salt is formed initially upon mixing
solutions of the two materials; then heating with removal of water produces the polyamide, nylon-6,6. This reaction has been studied extensively, and the
literature contains hundreds of references to it and to polyamide product properties (31).
n HOOC(CH2)4COOH + n H2N(CH2)6NH2 -------* [-OOC(CH2)4COONH3(CH2)6NH3]n ------*
О О
II II
(2n - 1)H20 + HO[C(CH2)4CNH(CH2)6NH]„H
Reduction. Hydrogenation of dimethyl adipate over Raney-promoted copper chromite at 200°C and 10 MPa produces 1,6-hexanediol
[629-11 -8], an important chemical intermediate (32). Promoted cobalt catalysts (33) and nickel catalysts (34) are examples of other patented processes for
this reaction. An earlier process, which is no longer in use, for the manufacture of the 1,6-hexanediamine from adipic acid involved hydrogenation of the
acid (as its ester) to the diol, followed by ammonolysis to the diamine (35).
Cyclization/Dehydration. Heating above the melting point results in elimination of water and formation of a linear or polymeric anhydride
2035-75-8], not the cyclic anhydride as produced in the case of glutaric anhydride [108-55-4] and succinic anhydride [108-30-5]. Decarboxylation occurs at
temperatures above 230—250°C, leaving cyclopentanone [120-92-3] as the chief product, bp 131°C. This reaction is catalyzed by metals such as calcium (36)
or barium (37). Behavior of adipic acid upon Curie-point pyrolysis has been reviewed; mass spectroscopy was used to analyze the anhydrides, cyclic
ketones, and rearranged fragments (38). Cyclization of the esters is accomplished by standard condensation chemistry with basic reagents. For example,
cyclization via the acyloin condensation occurs in the presence of sodium metal, producing 2-hydroxycyclohexanone [533-60-8] (39).
Miscellaneous Reactions. Conversion of the acid to the acid chloride is accomplished using standard laboratory techniques. The resulting
acid chloride frequently is used in subsequent synthesis reactions. An example is the laboratory synthesis of nylon-6,6 via the nylon rope trick, in which the
diamine reacts with adipoyl chloride [111-50-2] in a two-phase system. Polyamide produced at the interface maybe pulled continuously from the open
vessel in a startling demonstration of polymerization chemistry (40). The acid—nitrile interchange is another unique reaction, in which a mixture of adipic
acid and adiponitrile [111-69-3] are heated together, producing an equiEbrium mixture containing significant amounts of 5-cyanopentanoic acid [5264-33-5].
This material is a precursor to caprolactam [105-60-2] and may be isolated from the reaction mixture by a number of methods, including esterification and
hydrogenation (41).
Manufacture and Processing
Several general reviews of adipic acid manufacturing processes have been pubEshed since it became of commercial importance in the 1940s (42—46),
including a very thorough report based on patent studies (47). Adipic acid historically has been manufactured predominantly from cyclohexane [110-82-7]
and, to a lesser extent, phenol [108-95-2]. During the 1970s and 1980s, however, much research has been directed to alternative feedstocks, especially
butadiene [106-99-0] and cyclohexene [110-83-8], as dictated by shifts in hydrocarbon markets. AH current industrial processes use nitric acid [7697-37-2] in
the final oxidation stage. Growing concern with air quaEty may exert further pressure for alternative routes as manufacturers seek to avoid XO abatement
costs, a necessary part of processes that use nitric acid.
Since adipic acid has been produced in commercial quantities for almost 50 years, it is not surprising that many variations and improvements have
been made to the basic cyclohexane process. In general, however, the commerciaHy important processes stfll employ two major reaction stages. The first
reaction stage is the production of the intermediates cyclohexanone [108-94-1] and cyclohexanol [108-93-0], usuaHy abbreviated as KA, KA oil, ol-one, or
anone-anol. The KA (ketone, alcohol), after separation from unreacted cyclohexane (which is recycled) and reaction by-products, is then converted to
adipic acid by oxidation with nitric acid. An important alternative to this use of KA is its use as an intermediate in the manufacture of caprolactam, the
monomer for production of nylon-6 [25038-54-4]. The latter use of KA predominates by a substantial margin on a worldwide basis, but not in the United
States.
PREPARATION OF KA BY OXIDATION OF CYCLOHEXANE
There are three main variations to the basic cyclohexane oxidation process pioneered by Du Pont in the 1940s. The first, which can be termed
metal-catalyzed oxidation, is the oldest process stfll in use and forms the base for the other two. It employs a cyclohexane-soluble catalyst, usuaHy cobalt
naphthenate [61789-51 -3] or cobalt octoate [136-52-7], and moderate temperatures (150—175°C) and pressures (800-1200 kPa = 115-175 psi ). Air is fed to
each of a series of stirred tank reactors or to a column reactor which contains numerous reaction stages, along with cyclohexane. The catalyst, at 0.3—3 ppm
based on cyclohexane feed, is usuaHy premixed by injection into the feed stream, though it is not uncommon to divide the catalyst stream into many
separate additions to each of the series reactors. The conversion of cyclohexane to oxidized products is 3—8 mol %, which is quite low compared to most
important industrial processes. There are claims of commercial processes operating as low as 1 mol % conversion (48), which translates to 99% of the feed
material being recovered and recycled to the oxidation reactors. Low conversion is the major factor in achieving high selectivities to ketone (K) and alcohol
(A) (and to cyclohexylhydroperoxide [766-07-4] discussed below). This is so because the intermediates of interest (K, A, and cyclohexylhydroperoxide) are
aH much more easHy oxidized than is cyclohexane (49,50). Selectivities vary inversely and linearly with conversion, ranging from around 90 mol % at 1—2
mol % conversion to 65—70 mol % at 8 mol % conversion. Table 6 iHustrates the range of reaction conditions to be found in the patent Eterature.
Kirk-Othmer Encyclopedia of Chemical Technology (4th Edition)
240
ADIPIC ACID
Voll
Table 6. Reaction Conditions for Air Oxidation of Cyclohexane
Process and company Temperature, °C Pressure, MPaa Catalyst or additive Reactor type Cyclohexane conversion, mol % KA yield, mol % Reference
metal-catalysed Du Pont 170 1.1 Co column 6 76 51
Stamicarbon 155 0.9 Co tank 4 77 52
high peroxide BASF oxidation 145 1.1 none tank 3 83 53-55
deperoxidation Du Pont 125 Co/NaOH
oxidation 160 1.0 Co column 4 82 56-58
deperoxidation Шгфпе Poulenc 120 Co, Cr
oxidation 175 1.8 none tank 4 84 59-62
deperoxidation Stamicarbon 115 Cr, V, Mo
oxidation 160 1.3 none tank 3 86 48,63,64
deperoxidation boric acid 100 Co/NaOH
Halcon 165 1.0 h3bo3 tank 3 87 65,66
ICI 165 1.0 h3bo3 tank 5 85 67
IFP 165 1.2 h3bo3 12 85 68,69
Monsanto 165 1.0 h3bo3 tank 4 87 70
To convert MPa to psi multiply by 145.
Because the process operates at such low conversion of cyclohexane per pass through the oxidation reactors, large quantities of unreacted
cyclohexane must be recovered by distillation of the oxidizer effluent. This, and the increase in energy prices in the 1970s, has resulted in considerable
attention being given to the energy conservation schemes employed in recovering the cyclohexane. Examples of techniques used in energy conservation are
process—process heat interchange, high efficiency packed distillation columns, and use of the "pinch-point" technique in designing recovery steps.
Contacting the final crude KA oil with water or solutions of caustic soda, or both, for removal of mono- and dibasic acid impurities also can be considered
an energy conservation technique since this treatment can eliminate the final steam stripper often used to purify the crude KA oil.
Regardless of the techniques used to purify the KA oil, several waste streams are generated during the overall oxidation—separation processes and
must be disposed of. The spent oxidation gas stream must be scrubbed to remove residual cyclohexane, but afterwards will still contain CO, CO2, and
volatile hydrocarbons (especially propane, butane, and pentane). This gas stream is either burned and the energy recovered, or it is catalytically abated.
There are usually several aqueous waste streams arising from both water generated by the oxidation reactions and wash water. The principal hydrocarbon
constituents of these aqueous wastes are the C.—C: mono- and dibasic acids, but also present are butanol [71 -36-3]\ pentanol [71 -41 -0], S-hydroxycaproic
acid [1191 -25-9]> and various lactones and diols (71,72). The spent caustic streams contain similar components in addition to the caustic values. These
streams can be burned for recovery of sodium carbonate or sold direcdy as a by-product for use in the paper industry. The most concentrated waste stream
is one often called still bottoms, heavy ends, or nonvolatile residue. It comes from the final distillation column in which the KA oil is steam-stripped
overhead. The tails stream from this column contains most of the nonvolatile by-products, as well as metals and residues from the catalysts and from
corrosion. Both the metals and acid content may be high enough to dictate that this stream be classified as a hazardous waste. It usually is burned and the
energy used to generate steam (73). Much effort has gone into recovering valuable materials from it over the years, including adipic acid, which may be
present in as much as 3—4% of the cyclohexane oxidized (74). It has potential as a feedstock in the production of monobasic acids, polyester polyols,
butanediol, and maleic acid (75,76). The frequency of fugitive emissions from cyclohexane oxidation plants has been reviewed (77).
High Peroxide Process. An alternative to maximizing selectivity to KA in the cyclohexane oxidation step is a process which seeks to
maximize cyclohexylhydroperoxide, also called P or CHHP. This peroxide is one of the first intermediates produced in the oxidation of cyclohexane. It is
produced when a cyclohexyl radical reacts with an oxygen molecule (78) to form the cyclohexylhydroperoxy radical. This radical can extract a hydrogen
atom from a cyclohexane molecule, to produce CHHP and another cyclohexyl radical, which extends the free-radical reaction chain.
OO
The peroxide can be converted to KA easily, and in high yield, in a number of ways; thus maximization of CHHP, at high yield, gives a process with high
yield to KA. Techniques employed to produce high CHHP yield include drastically cutting or eliminating metal catalysts in the oxidation step, minimizing
cyclohexane conversion, passivating reactor walls, lowering reaction temperature (to as low as 140°C), adding water to the reaction mix to extract acid
catalysts from the cyclohexane phase, and adding metal-chelating agents to the reaction mix. Optimization of this process can produce CHHP in a
proportion as high as 75% of the reaction products (59). The CHHP then can be converted to KA by any of the following methods: decomposing it with
homogeneous or heterogeneous catalysts from the group Co, Cr, Mo, V, Cu, or Ru; dehydrating it by treatment with caustic soda (which preferentially
gives K); or hydrogenating it (which preferentially gives A). KA is separated from the reaction mixture in a manner similar to the conventional process. It
may be possible, however, to avoid a final steam distillation of the KA overhead if the tails stream from the distillation train is sufficiently clean. This could
result from a high yield process that employs thorough water and caustic washing. Figure 1 illustrates schematically the high peroxide process practiced by
Stamicarbon (60).
Kirk-Othmer Encyclopedia of Chemical Technology (4th Edition)
241
ADIPIC ACID
Voll
Fig. 1. Stamicarbon cyclohexane oxidation process.
Borate-Promoted Oxidation. Another alternative to the basic cyclohexane oxidation process is one which maximizes only the yield of A.
This process uses boric acid as an additive to the cyclohexane stream as both a promoter and an esterifying agent for the A that is produced. Metaboric
acid [10043-35-3] is fed to the first series oxidizer as a slurry in cyclohexane to give a molar ratio of boron:cyclohexane of around 1.5:100. No other metal
catalyst is used. Esterifying the A effectively shields it from overoxidation and thus allows the attainment of very high yields (ca 90%) (65). The ratio A: К
in the final product can exceed 10:1. The process was developed in the mid-1960s by a number of companies, including Halcon/Scientific Design (79,80),
Institute Francais Petrole (68,81), and Stamicarbon (82). The process was licensed and commercialized by several companies in the decade following its
development, including Monsanto, ICI, and Bayer. The major drawback to the process is the need to hydrolyze the borate ester in order to recover A. This
is an energy-intensive step and can be quite a mechanical nuisance because of the requirement for handling boric acid solids. Without careful attention to
energy conservation and engineering, the savings that accrue from the high yield can be more than offset. The process does, because of its high yield, offer
advantages in waste minimization and product purity. It does, however, introduce boron into the waste streams.
Other Routes to KA. Phenol [108-95-2] may be hydrogenated to KA in very high yield, typically 97—99% (83). Depending on catalyst selection
and operating conditions, the ratio of К to A in the product can be varied over a large range. If the product is to be further oxidized with nitric acid to
make adipic acid, then A would be the preferred choice since its reaction with nitric acid results in lower consumption of nitric than does K. If caprolactam
is to be produced, then the process would be designed to produce relatively more K, since this is the starting material for the production of caprolactam.
Because of the high yield to KA the purification is relatively simple, consisting mainly of removing the small amount of unreacted phenol via ion exchange
(84). Economics in recent years has dictated against this process because of the relatively high cost of phenol compared to cyclohexane. Typical reaction
conditions are 140°C and 400 kPa (58 psi) using a heterogeneous nickel on silica catalyst (83).
Cyclohexane, produced from the partial hydrogenation of benzene [71-43-2] also can be used as the feedstock for A manufacture. Such a process
involves selective hydrogenation of benzene to cyclohexene, separation of the cyclohexene from unreacted benzene and cyclohexane (produced from
over-hydrogenation of the benzene), and hydration of the cyclohexane to A. Asahi has obtained numerous patents on such a process and is in the process
of commercialization (85,86). Indicated reaction conditions for the partial hydrogenation are 100—200°C and 1—10 kPa (0.1—1.5 psi) with a Ru or
zinc-promoted Ru catalyst (87—90). The hydration reaction uses zeolites as catalyst in a two-phase system. Cyclohexene diffuses into an aqueous phase
containing the zeolites and there is hydrated to A. The A then is extracted back into the organic phase. Reaction temperature is 90—150°C and reactor
residence time is 30 min (91—94).
ARCO has developed a coproduct process which produces KA along with propylene oxide [75-56-9] (95—97). Cyclohexane is oxidized as in the high
peroxide process to maximize the quantity of CHHP. The reactor effluent then is concentrated to about 20% CHHP by distilling off unreacted
cyclohexane and cosolvent /^-butyl alcohol [75-65-0]. This concentrate then is contacted with propylene [115-07-1] in another reactor in which the
propylene is epoxidized with CHHP to form propylene oxide and KA. A molybdenum catalyst is employed. The product ratio is about 2.5 kg of KA per
kilogram of propylene oxide.
NITRIC ACID OXIDATION OF CYCLOHEXANOL(ONE)
Although many variations of the cyclohexane oxidation step have been developed or evaluated, technology for conversion of the intermediate
ketone—alcohol mixture to adipic acid is fundamentally the same as originally developed by Du Pont in the early 1940s (98,99). This step is accomplished by
oxidation with 40—60% nitric acid in the presence of copper and vanadium catalysts. The reaction proceeds at high rate, and is quite exothermic. Yield of
adipic acid is 92—96%, the major by-products being the shorter chain dicarboxylic acids, glutaric and succinic acids,and CO2. Nitric acid is reduced to a
combination of NO2, NO, N2O, and N2. Since essentially all commercial adipic acid production arises from nitric acid oxidation, the trace impurities
patterns are similar in the products of most manufacturers.
Chemistry. Papers addressing the mechanism of nitric acid oxidation began appearing in the mid 1950s (100). Then, a series of reports
beginning in 1962 described the mechanism of the oxidation in considerable detail (101—105). The reaction pathway diagram shown in Figure 2 is based on
these and other studies of nitric acid oxidation chemistry. A key intermediate in the reaction sequence is 2-oximinocyclohexanone [24858-28-4]y produced
via nitrosation of cyclohexanone. Nitrous acid [7782-77-6] is produced during the conversion of cyclohexanol to the ketone, and also upon oxidation of
aldehyde and alcohol impurities usually accompanying the KA and arising in the cyclohexane oxidation step. The nitric acid oxidation chemistry is
controlled by nitrous acid, which is in equilibrium with NO, NO2, HNO3, and H2O in the reacting mixture. Total inhibition of reaction can be achieved by
incorporating a small amount of urea [57-13-6]y which effectively scavenges (106) nitrous acid from the mixture. Further nitration leads to
Kirk-Othmer Encyclopedia of Chemical Technology (4th Edition)
242
ADIPIC ACID
Voll
2-nitro-2-nitrosocyclohexanone [23195-89-3]., which is converted via hydrolytic cleavage of the ring to 6-nitro-6-hydroximinohexanoic acid (nitrolic acid)
[1069-46-1]). Of all the intermediates shown in Figure 2, the nitrolic acid is the only one of sufficient stability to be isolable under very mild conditions. It is
hydrolyzed to adipic acid in one of the slowest steps in the sequence. Further hydrolysis produces adipic acid. Nitrous oxide (N2O) is formed by further
reaction of the nitrogen-containing products of nitrolic acid hydrolysis. The NO and NO2 are reabsorbed and converted back to nitric acid, but N2O
cannot be recovered in this manner, and thus is the major nitric acid derived by-product of the process.
HNO3 HNO3 Cu2 +
V5 +
HNO3
dimer
xCH2
CH2 '"'COOH
CH2 ^.CN
xch2
H20
NOH
I -co2
I
I
I
/ЮОН CH2
CH2 CH2 '"'COOH
I + I
CH2 CH2
'"COOH '"COOH
succinic glutaric
acid acid
J3H2
CH2 ""COOH
CH2
Nh2 N°2
^CH2
CH2 COOH
CH2 /CH<NO
4CH2 N°2
®|h2o
H2o
C
CH2 COOH
CH2
ch2 n°2
H20 I HN°3
I -co2
CH2 COOH
CH2 ^COOH
^CH2
adipic acid
^COOH
CH2
CH2
'"COOH
^CH2
CH2 "'COOH
CH2
'"COOH
succinic glutaric
acid acid
Fig. 2. Reaction paths to adipic acid. Encircled numbers label the pathways discussed in the text.
About 60—70% of the reaction occurs as in path 1 in Figure 2, the remainder by other pathways. About 20% of the reaction occurs by the vanadium
oxidation of 1,2-dioxygenated intermediates (path 2 in Fig. 2). This chemistry has been discussed in detail (104,105). This path is noteworthy since it does
not produce the nonrecoverable nitrous oxide. The other reactions shown in Figure 2 occur to varying degrees, depending on either an excess or deficiency
of nitrous acid, arising from variations in reaction conditions. These lead to varying yields of the lower dicarboxylic acids. Yield of monobasic and dibasic
acid by-products also is a function of the purity of the KA feed. A distinguishing characteristic for several of the commercial processes is the degree to
which the intermediate KA is refined, prior to feeding it to nitric acid oxidation.
Process Description. In a typical industrial adipic acid plant, as schematically illustrated in Figure 3, the KA mixture reacts in reactor A with
45—55% nitric acid containing copper (0.1—0.5%) and vanadium (0.02—0.1%) catalyst (107,108). Design of the oxidation reactor for optimum yield and heat
removal has been the subject of considerable research and development over the years of use of this process (109). The reaction occurs at 60—90°C and
0.1—0.4 MPa (14—58 psi). It is very exothermic (6280 kJ/kg = 1500 kcal/kg), and can reach an autocatalytic runaway state at temperatures above about
150°C. Control is achieved by limiting the KA feed to a large excess of nitric acid in a stirred tank or circulating loop reactor. Two stages of oxidation are
sometimes employed to achieve improve product quality (110). Oxides of nitrogen are removed by bleaching with air in column C, then water is removed
by vacuum distillation in column E.
Kirk-Othmer Encyclopedia of Chemical Technology (4th Edition)
243
ADIPIC ACID
Voll
Fig. 3. Typical nitric acid oxidation process. A, reactor; B, optional cleanup reactor; C, bleacher; D, XO absorber; E, concentrating still; F, crude
crystallizer; G, centrifuge or filter; H, refined crystallizer; I, centrifuge or filter; J, dryer; K, purge evaporator; L, purge crystallizer; M, centrifuge or filter; N,
ion-exchange beds; DBA = dibasic acids.
The concentrated stream, nominally adipic acid and lower dibasic acid coproducts in 35—50% HNO3 (organic-free basis), is then cooled and
crystallized (F). Crude adipic acid product is removed via filtration or centrifugation (G), and the mother liquor is returned to the oxidizer. Further refining
is required to achieve polymer grade material, usually by recrystallization from water. Residual lower dibasic acids, nitrogen-containing impurities, and
metals are removed in this step. Additional purification steps occasionally are employed, including slurry washing, further recrystallization, and charcoal
treatment. The bleacher off-gas, containing NO and NO2, reacts with air and is reabsorbed as nitric acid for reuse (D).
In order to control the concentration of lower dibasic acid by-products in the system, a portion of the mother liquor stream is diverted to a purge
treatment process. Following removal of nitric acid by distillation (Fig. 3, K), copper and vanadium catalyst are recovered by ion-exchange treatment (Fig.
3, N). This area of the process has received considerable attention in recent years as companies strive to improve efficiency and reduce waste. Patents have
appeared describing addition of SO2 to improve ion-exchange recovery of vanadium (111), improved separation of glutaric and succinic acids by
dehydration and distillation of anhydrides (112), formation of imides (113), improved nitric acid removal prior to dibasic acid recovery (114), and other
claims (115).
Because of the highly corrosive nature of the nitric acid streams, adipic acid plants are constructed of stainless steel, or titanium in the more
corrosive areas, and thus have high investment costs.
Wastes and Emissions. Nitric acid oxidation may be used to recover value from waste streams generated in the cyclohexane oxidation
portion of the process, such as the water wash (116) and nonvolatile residue (76) streams. The nitric acid oxidation step produces three major waste
streams: an off-gas containing oxides of nitrogen and CO2; water containing traces of nitric acid and organics from the water removal column; and a
dibasic acid purge stream containing adipic, glutaric, and succinic acids. The off-gas usually is passed through a reducing-flame burner to the atmosphere,
or it may be oxidized back to NO at 1000—1300°C and recovered as nitric acid, as claimed in a patent (117). The overhead water stream usually is treated
(eg, neutralization, biotreatment) and reused or disposed of. The dibasic acid stream usually is either burned or disposed of by deepwell injection or
biotreatment. However, as more uses for these acids are discovered, the necessity for their disposal diminishes. The principal emissions of concern from
these processes are related to nitric acid, either as the various oxides of nitrogen or as a very dilute solution of the acid itself. The fate of these waste
streams varies widely, subject to the usually very complex environmental and regulatory situations at each individual manufacturing site. These issues are
now a prime consideration, equal to economics, in the design of chemical processing systems in the petrochemical industry (118).
OTHER ROUTES TO ADIPIC ACID
A number of processes for producing adipic acid without producing the intermediates К and A, and from feedstocks other than cyclohexane and phenol,
have been investigated. None has been employed at a commercial scale. A one-step air oxidation process, first researched by Halcon (119,120) and Gulf
(121) in the 1960s, and developed by Asahi and others (122—126) in the 1970s, uses an acetic acid [64-19-7] solvent for the cyclohexane. High
concentrations of soluble cobalt catalyst (60—300 ppm) are used, along with cyclohexanone or acetaldehyde [75-07-0] promoter. Yields to adipic acid of
70—75% are reported at cyclohexane conversions of 50—75%. Reaction temperature is a moderate 70—100°C. References to air oxidation processes have
continued to appear through the 1980s (127—130).
It has been known since the early 1950s that butadiene reacts with CO to form aldehydes and ketones that could be treated further to give adipic
acid (131). Processes for producing adipic acid from butadiene and carbon monoxide [630-08-0] have been explored since around 1970 by a number of
companies, especially ARCO, Asahi, BASF, British Petroleum, Du Pont, Monsanto, and Shell. BASF has developed a process sufficiendy advanced to
consider commercialization (132). There are two main variations, one a carboalkoxylation and the other a hydrocarboxylation. These differ in whether an
alcohol, such as methanol [67-56-1is used to produce intermediate pentenoates (133), or water is used for the production of intermediate pentenoic acids
(134). The former is a two-step process which uses high pressure, >31 MPa (306 atm), and moderate temperatures (100—150°C) (132—135). Butadiene,
CO, and methanol react in the first step in the presence of cobalt carbonyl catalyst and pyridine [110-86-1] to produce methyl pentenoates. A similar second
step, but at lower pressure and higher temperature with rhodium catalyst, produces dimethyl adipate [627-93-0]. This is then hydrolyzed to give adipic acid
and methanol (135), which is recovered for recycle. Many variations to this basic process exist. Examples are ARCO's palladium/copper-catalyzed
oxycarbonylation process (136—138), and Monsanto's palladium and quinone [106-51-4] process, which uses oxygen to reoxidize the by-product
Kirk-Othmer Encyclopedia of Chemical Technology (4th Edition)
244
ADIPIC ACID
Voll
hydroquinone [123-31-9] to quinone (139).
Other processes explored, but not commercialized, include the direct nitric acid oxidation of cyclohexane to adipic acid (140—143), carbonylation of
1,4-butanediol [110-63-4] (144), and oxidation of cyclohexane with ozone [10028-15-5] (145—148) or hydrogen peroxide [7722-84-1] (149—150). Production
of adipic acid as a by-product of biological reactions has been explored in recent years (151—156).
Storage, Handling, and Shipping
When dispersed as a dust, adipic acid is subject to normal dust explosion hazards. See Table 3 for ignition properties of such dust—air mixtures. The
material is an irritant, especially upon contact with the mucous membranes. Thus protective goggles or face shields should be worn when handling the
material. Prolonged contact with the skin should also be avoided. Eye wash fountains, showers, and washing facilities should be provided in work areas.
However, MSDS Sheet400 (5) reports that no acute or chronic effects have been observed.
The material should be stored in corrosion-resistant containers, away from alkaline or strong oxidizing materials. In the event of a spill or leak,
nonsparking equipment should be used, and dusty conditions should be avoided. Spills should be covered with soda ash, then flushed to drain with large
amounts of water (5).
Adipic acid is shipped in quantities ranging from 22.7 kg (50-lb bags) to 90.9 t (200,000-lb hopper cars). Upon long standing, the solid material tends
to cake, dependent on such factors as initial particle size and moisture content. Shipping data in the United States are "Adipic Acid," DOT-ID 2\24 9077,
DOT Hazard Class ORM-E. It is regulated only in packages of 2.3 t (5,000 lb) or more (hopper cars and pressure-differential cars and trucks) (157).
Economic Aspects
The continuing pursuit of a wide variety of alternate manufacturing processes indicates an effort by competitors to position themselves to take advantage
of potential shifts in petrochemical feedstock prices. A large number of the reports concern the use of C4 feedstocks, notably butadiene, although several
major modifications to cyclohexane-based or benzene-based processes are included. The continued buildup of capacity in nylon-6,6 intermediates,
especially in the Far East, attests to the confidence in continued growth by the major participants. Although the nylon-6 [25038-54-4] market currently is
larger in Europe, both markets will share in the growth, especially in the developing areas of the world. The emergence of new polymers for specialized
applications may tend to limit growth in certain areas. For example, polypropylene may take a significant share of the lower cost carpet market. Specialized
polyamides such as nylon-4,6 [24936-71 -8] have now appeared, although this one consumes adipic acid.
Adipic acid is a very large volume organic chemical. Worldwide production in 1986 reached 1.6 x 10⁶ t (3.5 x 10⁹ lb) (158) and in 1989 was
estimated at more than 1.9 x 10⁶ t (Table 7). It is one of the top fifty (159) chemicals produced in the United States in terms of volume, with 1989
production estimated at 745,000 t (160). Growth rate in demand in the United States for the period 1988—1993 is estimated at 2.5% per year based on
1987—1989 (160). Table 7 provides individual capacities for U.S. manufacturers. Western European capacity is essentially equivalent to that in the United
States at 800,000 t/yr. Demand is highly cyclic (161), reflecting the automotive and housing markets especially. Prices usually follow the variability in crude
oil prices. Adipic acid for nylon takes about 60% of U.S. cyclohexane production; the remainder goes to caprolactam for nylon-6, export, and miscellaneous
uses (162). In 1989 about 88% of U.S. adipic acid production was used in nylon-6,6 (77% fiber and 11% resin), 3% in polyurethanes, 2.5% in plasticizers,
2.7% miscellaneous, and 4.5% exported (160).
Table 7. Worldwide Adipic Acid Capacities*
Company Location Capacity, 103 t/yr
North America
Allied-Signal Hopewell, Va. 14
E. I. du Pont de Nemours & Co. Orange, Tex. 180
E. I. du Pont de Nemours & Co. Victoria, Tex. 320
Monsanto Pensacola, Fla. 290
Du Pont of Canada Maitland, Ont. 109
subtotal 913
Western Europe
UCB-Ptal SA (Belgium) Oostende, W. Vlaanderen 27
Ш1фпе-Рои1епс (France) Chalampe, Haut-Rhin 230
BASF (Germany) Ludwigshafen 200
Bayer (Germany) Leverkusen 40
ICI (United Kingdom) Wilton, Cleveland 300
subtotal 797
Far East
Asahi Chemical (Japan) Nobeaka 70
Kanto Denka Kogyo (Japan) Shibukara 10
others less than 10,000 t each Japan 9
subtotal 89
remaining areas of the world
Rhodia SA (Brazil) Paulinia, Sao Paulo 55
Liaoyang Pet. Fiber (China) Liaoyang 55
Poland State Complexes three sites 17
subtotal 127
worldwide total 1938
Ref. 158 and news release updates since 1987.
The outlook as of late 1990 was positive, especially on the worldwide scene. Significant expansions or introduction of new capacity were announced
in Western Europe, Russia, and the Far East. Several large petrochemical complexes involving nylon-6,6 facilities have been announced in the USSR during
the late 1980s (163). The expansion is continuing; a 120,000-t/yr adipic acid plant was included in a large complex announced for the 1990s at Yarkova, in
Western Siberia (164). A 40,000-t/yr expansion also was reported by BASF, due to begin production in 1990 (165). New technology for adipic acid
manufacture was developed by BASF, but they have not yet announced plans to commercialize it (166).
Because of projected nylon-6,6 growth of 4—10% (167) per year in the Far East, several companies have announced plans for that area. A
Ш1фпе-Рои1епс/Oriental Chemical Industry joint venture (Kofran) announced a 1991 startup for a 50,000-t/yr plant in Onsan, South Korea (168,169).
Asahi announced plans for a 15,000-t/yr expansion of adipic acid capacity at their Nobeoka complex in late 1989, accompanied by a 60,000-t/yr
cyclohexanol plant at Mizushima based on their new cyclohexene hydration technology (170). In early 1990 the Du Pont Company announced plans for a
major nylon-6,6 complex for Singapore, including a 90,000-t/yr adipic acid plant due to start up in 1993 (167). Plans or negotiations for other adipic acid
capacity in the area include Formosa Plastics (Taiwan) (171) and BASF-Hyundai Petrochemical (South Korea) (167). Adipic acid is a truly worldwide
Kirk-Othmer Encyclopedia of Chemical Technology (4th Edition)
245
ADIPIC ACID
Voll
commodity. An average of 20,000 t/yr was exported from the United States in the years 1980—1986 (172). Western European exports have been
40,000—45,000 t/yr in the same period (173). Japan has been a net importer of the acid.
Specifications and Analysis
Quality Specifications. Because of the extreme sensitivity of polyamide synthesis to impurities in the ingredients (eg, for molecular-weight
control, dye receptivity), adipic acid is one of the purest materials produced on a large scale. In addition to food-additive and polyamide specifications,
other special requirements arise from the variety of other appEcations. Table 8 summarizes the more important specifications. Typical impurities include
monobasic acids arising from the air oxidation step in synthesis, and lower dibasic acids and nitrogenous materials from the nitric acid oxidation step.
Trace metals, water, color, and oils round out the usual specification lists.
Table 8. Quality Specifications
Application
Parameter Food grade Other Page reference
melting range 151.5-154.0°C 519
assay 99.6% min. 11
water 0.2% max. 552
residue on ignition 20.0 ppm max. 11
arsenic (as As) 3.0 ppm max. 464
heavy metals (as Pb) 10.0 ppm max 11,513
iron (as Fe) 2.0 ppm
ICV color 5.0 max
caproic acid 10.0 ppm
succinic acid 50.0 ppm
nitrogen 3 ppm
hydrocarbon oil 10 ppm
Refers to pages in Ref. 174.
Analytical Procedures. Standard methods for analysis of food-grade adipic acid are described in the Food Chemicals Codex (see Refs, in
Table 8). Classical methods are used for assay (titration), trace metals (As, heavy metals as Pb), and total ash. Water is determined by Kad-Fisher titration
of a methanol solution of the acid. Determination of color in methanol solution (APHA, Hazen equivalent, max. 10), as well as iron and other metals, are
also described elsewhere (175). Other analyses frequendy are required for resin-grade acid. For example, hydrolyzable nitrogen (NH3, amides, nitriles, etc) is
determined by distillation of ammonia from an alkaline solution. Reducible nitrogen (nitrates and nitroorganics) may then be determined by adding
DeVarda's alloy and continuing the distillation. Hydrocarbon oil contaminants may be determined by ir analysis of halocarbon extracts of alkaline solutions
of the acid.
Monobasic acids are determined by gas chromatographic analysis of the free acids; dibasic acids usually are derivatized by one of several methods
prior to chromatographing (176,177). Methyl esters are prepared by treatment of the sample with BF3~methanol, H2SO4—methanol, or
tetramethylammonium hydroxide. Gas chromatographic analysis of silylation products also has been used extensively. Liquid chromatographic analysis of
free acids or of derivatives also has been used (178). More sophisticated hplc methods have been developed recendy to meet the needs for trace analyses in
the environment, in biological fluids, and other sources (179,180). Mass spectral identification of both dibasic and monobasic acids usually is done on gas
chromatographically resolved derivatives.
Toxicity, Safety, and Industrial Hygiene
is relatively nontoxic; no OSHA PEL or NIOSH REL have been established for the material. Airborne exposure should be limited to 10 mg/m3 (total
dust), the ACGIH TLV-TWA for an organic nuisance dust (5). Toxicity in laboratory animals based on exposure to adipic acid has been reported (181).
eye, rabbit (eye irritant)
oral, rat
intraperitoneal, rat
oral, mouse
intraperitoneal, mouse
intravenous, mouse
20 mg/24 h (SEV)
LDLq: 3600 mg/kg
LD50: 275 mg/kg
LD50: 1900 mg/kg
LD50: 275 mg/kg
LD50: 6 80 mg/kg
Adipic acid is excreted essentially unmetabolized in human urine, based on tests with a series of dicarboxylic acids (182). However, adipic acid may be
produced via liver metabolism of longer chain diacids, as observed in a recent study with rats (183). The acid has achieved "generally recognized as safe"
(GRAS) status from the U.S. Food and Drug Administration for use as a direct ingredient in food for such uses as acidulant, leavening agent, or pH
control agent (184). The sodium salt [23311 -84-4] has not achieved GRAS status. Maximum permissible usage of the acid in foods was studied with respect
to toxicity and teratological and mutagenicity effects (185). No mutagenic or teratological activity was observed (186). Recommended maximum
concentration in water reservoirs is 2 mg/L (5).
Adipic acid is an irritant to the mucous membranes. In case of contact with the eyes, they should be flushed with water. It emits acrid smoke and
fumes on heating to decomposition. It can react with oxidizing materials, and the dust can explode in admixture with air (see Table 3). Fires may be
extinguished with water, CO2, foam, or dry chemicals.
Environmental Aspects. Airborne particulate matter (187) and aerosol (188) samples from around the world have been found to contain a
variety of organic monocarboxylic and dicarboxylic acids, including adipic acid. Traces of the acid found in southern California air were related both to
automobile exhaust emission (189) and, indirecdy, to cyclohexene as a secondary aerosol precursor (via ozonolysis) (190). Dibasic acids (eg, succinic acid)
have been found even in such unlikely sources as the Murchison meteorite (191). Public health standards for adipic acid contamination of reservoir waters
were evaluated with respect to toxicity, odor, taste, transparency, foam, and other criteria (192). Biodegradability of adipic acid solutions was also evaluated
with respect to BOD/theoretical oxygen demand ratio, rate, lag time, and other factors (193).
Uses
About 85% of U.S. adipic acid production is used captively by the producer, almost totally in the manufacture of nylon-6,6 (194). The remaining 15% is
sold in the merchant market for a large number of applications. These have been developed as a result of the large scale availability of this synthetic
petrochemical commodity. Prices for 1960—1989 for standard resin-grade material have paralied raw material and energy costs (petroleum and natural gas)
Kirk-Othmer Encyclopedia of Chemical Technology (4th Edition)
246
ADIPIC ACID
Voll
as follows: 57-71 0/kg (1960s); 40-42 0/kg (1970-1973); increasing to 88-90 0/kg (1974-1979); then to $1.15-1.26/kg (1980s) (194).
Polyamides. In 1988, 77% of U.S. demand for adipic acid was for nylon-6,6 fiber, while 11% was used in nyon-6,6 resins (195). In Western
Europe only about 66% was for polyamide, because of the stronger competition from nylon-6. The fiber applications include carpets (67%), apparel (13%),
tire cord (7%), and miscellaneous (13%). Nylon-6,6 resins were distributed between injection molding (85%) for such applications as automotive and
electrical parts and for extrusion resins (15%) for strapping, film, and wire and cable.
Polyurethanes. About 3% of the U.S. polyurethanes market in 1988 was derived from the condensation product of polyisocyanates with low
molecular weight polyadipates having hydroxyl end groups (195). In 1986 this amounted to 29,000 t, or 4% of total adipic acid consumption. The
percentage was similar in Western Europe. About 90% of these adipic acid containing polyurethanes are used in flexible or semirigid foams and elastomers,
with the remainder used in adhesives, coatings, and spandex fibers.
Plasticizers. About 2.5% of U.S. adipic acid consumed in 1988 was used in two basic types of adipic ester based plasticizers (195). Simple
adipate esters prepared from Cg—C13 alcohols are used especially as PVC plasticizers (qv). For special applications requiring low volatility or extraction
resistance, polyester derivatives of diols or polyols are preferred.
Adiponitrile Synthesis. 1,6-Hexanediamine, the second ingredient in the production of nylon-6,6 polyamide, is prepared by hydrogenation of
adiponitrile [111-69-3]. In several large plants around the world, the nitrile is produced from adipic acid by dehydration of the ammonium salt. A significant
percentage of adipic acid capacity in Western Europe currency is used for this purpose. The technology has been reviewed in the literature (196). Although
this was the primary adiponitrile process for several years, new processes based on propylene and butadiene have supplanted this technology in the United
States. For several years, Du Pont operated a process based on the chlorination and cyanation of butadiene, but this was shut down in 1983 (197,198). Du
Pont produces adiponitrile at two large U.S. plants and one French joint venture by direct nickel(0)-catalyzed homogeneous hydrocyanation of butadiene
(199). Monsanto and Asahi developed and practiced the electrolytic coupling of acrylonitrile process, used in the United States, Western Europe, and Japan
(200,201).
Miscellaneous Applications. About 2% of U.S. consumption in 1988 was distributed among several other applications, amounting to
several thousand tons each (195). Wet-strength resins based on polyamide—epichlorohydrin products consumed about 6800 t in 1986. Unsaturated
polyester resins (3600 t in 1986) are used in surface coatings, flexible alkyd resins (qv), coil coatings, and other coatings because of their curing properties.
Adipic acid also is used as a food acidulant in jams, jellies, and gelatins. Although it has only 2% of the acidulant market, 3200 t were used for this purpose
in 1989 (202). The synthetic lubricant market consumed about 1800 t as the Cg_13 adipate esters in 1986, for gas turbines, compressors, and military jet
engines. An environmentally significant use of the acid, and especially its dibasic acid by-products, is as a buffer in the scrubbing operation of power plant
flue gas desulfurization (203—205). Adipoyl chloride is occasionally used as a softening agent for leather.
BIBLIOGRAPHY
"Adipic Acid" under "Acids, Dicarboxylic" in ECT 1st ed., Vol. 1, pp. 153—154, by P. F. Bruins, Polytechnic Institute of Brooklyn; "Adipic Acid" in ECT
2nd ed., Vol. 1, pp. 405—421, by W. L. Standish and S. V. Abramo, E. I. du Pont Nemours & Co., Inc.; in ECT 3rd ed., Vol. 1, pp. 510—531, by D. C.
Danly and C. R. Campbell, Monsanto Chemical Intermediates Company.
1. E. Bolton, Ind. Eng. Chem. 34, 53 (1942).
2. H. Serwy, Tull. Soc. Chim. Belg. 42, 483 (1933).
3. Armour Research Foundation, Anal. Chem. 20, 385 (1948).
4. S. Khetarpal, L. Krishan, and H. Bhatnager, Ind. J. Chem., Sect. A. 19A, 516—519 (1986).
5. P. Igoe, D. Wilson, and W. Silverman, Material Safety Data Sheet No. 400 in Genum's Reference Collection, Genum Publishing Corp., Schenectady, N.Y.,
1989.
6. A. Granovskaya, Eh. Fiy. Khim. 21, 967 (1947).
7. F. Kraft and H. Noerdlinger, Ber. Dtsch. Chem. Ges. 22, 818 (1889).
8. A. Van Dooren and B. Mueller, Thermochim. Acta 54(1—2), 115—129 (1982).
9. P. E. Verkade, H. Hartman, and J. Coops, Reel Trav. Chim. Pays-Bas 45, 380 (1926).
10. I. Contineanu, E. Codateanu, J. Herscovici, and I. Dumitri, Rev. Chim. (Bucharest) 31, 763—764 (1980).
11. S. Kahnyakina and G. Puchkovskaya, Eh. Prikl Spektrosk. 34, 885—891 (1981).
12. Y. Morechal, Can. J. Chem. 63, 1684-1688 (1985).
13. K. Urano, K. Kawamoto, and K. Hayoshi, Yosui To Haisui 23(2), 196—202 (1981).
14. A. Babinkov and co-workers, Termodin. Organ. Sordin. Gor'kii VFWlfp, 28—33 (1979).
15. A. Apelblat, J. Chem. Thermodyn. 18, 351—357 (1986).
16. I. Jones andR. Soper,/. Chem. Soc. 1936, 135 (1936).
17. J. Burgot, Taianta 25, 233-235 (1978).
18. A. Apelblat and E. Manzurola,/ Chem. Thermodyn. 19, 317—320 (1987).
19. Adipic Arid, Product Bulletin E-99079-1, E. I. du Pont de Nemours & Co., Inc., 1989.
20. C. S. Marvel and J. C. Richards, Anal. Chem. 21, 1480 (1949).
21. K. Chow, J. Go, M. Mehdizadeh, and D. Grant, Int. J. Pharm. 20(1—2), 3—24 (1984).
22. L. Hus, C. Chang, J. Beddow, and A. Vetter, Proc. Tech. Prog. Int. Powder and Bulk Solids dandling and Processing, Atlanta, Georgia, May 24—26, 1983,
Books Demand UMI, Ann Arbor, Mich., 1983, pp. 52—66.
23. O. Georgescu, S. Ivascon, and M. Apostolescu, Rev. Chim. (Bucharest) 36, 839—844 (1985).
24. Corrosion Data Survey, Metals Section, 5th ed. and 6th ed., National Association of Corrosion Engineers, Houston, Texas, 1974 and 1985, p. 6 and p.
4.
25. G. Lunn,/ Hazard. Mater. 17(2), 207-213 (1988).
26. E. Scholl and co-workers, Inst. Explos. Sprengtech. Bergbau-VersuchstreckeFRG, STF-Rep. 1979(2), 99 (1979).
27. D. Felstead, R. Rogers, and D. Young, Conf. Ser.—Inst. Phys. (Electrostatics), ICI, United Kingdom 66, 105—110 (1983).
28. U.S. Pat. 4,375,552 (Mar. 1,1983), V. Kuceski (to С. P. Hah Co.).
29. M. Seko, A. Yomiyama, and T. Isoya, Chem. Econ. Eng. Rev. 11(9), 48—50 (1979).
30. R. T. Gerry, "Adipic Acid" in Chemical Economics Handbook, Marketing Research Report, SRI International, Menlo Park, Calif., 1987, p. 608.5032M.
31. M. I. Kohan, Nylon Plastics, John Wiley & Sons, Inc., New York, 1973, pp. 14—73.
32. Ger. Offen. 3,510,876 (Oct. 2, 1986), W. Hoelderich and co-workers (to Badische Anilinund Soda-Fabrik A. G.).
33. Jpn. Kokai Tokkyo Koho 6105,036 (Jan. 10, 1986), K. Tsukada, N. Fukuoka, and I. Kinoshita (to Kao Corp.).
34. Jpn. Kokai Tokkyo Koho 80 04,090 (Jan. 29, 1980), J. Kanetaka and S. Mori (to Mitsubishi Petrochemical Co.).
35. Fr. Pat. 1,509,288 (Jan. 12, 1968), P. Volpe and W. Humphrey (to Celanese Corp.).
36. W. Hentzchel and J. Yd\PUc^rws,&,]ustusEeibigs Ann. Chem. 275, 312 (1983).
37. G. Vavon and A. Apchie, Bull. Soc. Chim. Fr. 43, 667 (1928).
38. J. Dullinga, N. Nibbering, and A. Boerboom,/ Chem. Soc. Perkin Trans. 2, 1065—1076 (1984).
39. J. Sheehan, R. O’Neill, and M. White,/ Am. Chem. Soc. 72, 3376 (1950).
40. P. Morgan,/ Chem. Educ. 36(4), 182 (1959).
41. Ger. Offen. 3,235,938 (Apr. 21, 1983), K. Kimura and T. Isoya (to Asahi Chemical Industries, Ltd.).
Kirk-Othmer Encyclopedia of Chemical Technology (4th Edition)
247
ADIPIC ACID
Voll
42.
43.
44.
45.
46.
47.
48.
49.
50.
51.
52.
53.
54.
55.
56.
57.
58.
59.
60.
61.
62.
63.
64.
65.
66.
67.
68.
69.
70.
71.
72.
73.
74.
75.
76.
77.
78.
79.
80.
81.
82.
83.
84.
85.
86.
87.
88.
89.
90.
91.
92.
93.
94.
95.
96.
97.
98.
99.
100.
101.
102.
103.
104.
105.
106.
107.
108.
109.
110.
111.
112.
I. V. Berezin, E. T. Denisov, and N. M. Emanuel, The Oxidation of Cyclohexane, Pergamon Press, Oxford, England, 1965.
S. A. Miller, Chemical and Process Engineering, 1969, 63 (June 1969).
Tamarapu Sridliar, Mass Transfer in Cyclohexane Oxidation, Pli.D. Thesis, Dept, of Chemical Engineering, Monash Univ., Austта I in, 1978.
V. D. Luedeke, "Adipic Acid" in Encyclopedia of Chemical Process and Design,]. McKetta and W. Cunningham, eds. Vol. 2, Marcel Dekker, Inc., New
York, 1977, pp. 128-146.
A. K. Suresh, T. Shidhar, and О. E. Potter, AIChE J. 34 (1), 55—93 (1988).
Y. C. Yen and S. Y. Wu, Nylon 6,6, PEP Report 54B, SRI International, Menlo Park, Calif., 1987.
U.S. Pat. 4,238,415 (Dec. 9,1980), W. O. Bryan (to Stamicarbon N. V.).
L. Bateman, H. Hughes, and A. L. Morris, Faraday Discuss. Chem. Soc. 1953(14), 190—199 (1953).
D. G. Hendry and co-workers,/. Org. Chem. 41, 2 (1976).
U.S. Pat. 3,530,185 (Sept. 22,1970), K. Pugi (to E. I. du Pont de Nemours & Co., Inc.).
Elydrocarbon Process. 48, 163 (1969).
U.S. Pat. 4,163,027 (July 31, 1979), P. Magnussen, G. Herrman, and E. Frommer (to Badische Amlin- und Soda-Fabrik A. G.).
Ger. Offen. 3,328,771 (Feb. 28,1985), Stoessel and co-workers (to Badische Amlin- und Soda-Fabrik A. G.).
U.S. Pat. 4,704,476 (Nov. 3, 1987), J. Hartig, G. Herrman, and E. Lucas (to Badische Amlin- und Soda-Fabrik A. G.).
U.S. Pat. 3,957,876 (May 18, 1976), M. Rapoport and J. O. White (to E. I. du Pont de Nemours & Co., Inc.).
U.S. Pat. 3,987,100 (Oct. 19, 1976), W. J. Barnette, D. L. Schmitt, and J. O. White (to E. I. du Pont de Nemours Co., Inc.).
U.S. Pat. 4,465,861 (Aug. 14, 1984), J. Hermolin (to E. I. du Pont de Nemours & Co., Inc.).
U.S. Pat. 3,925,316 (Dec. 9, 1975), J. C. Brunie, N. Creene, and F. Maurel (to КЬфпе-РоЫепс S. A.).
Adapted from L. L. van Dierendonck and J. A. de Leeuw den Bouter, PT'/Procestechniek 39(3), 44—48 (1984).
U.S. Pat. 3,923,895 (Dec. 2,1975), M. Costantini, N. Creene, M. Jouffret, and J. Nouvel (to КЬфпе-РоЫепс S. A.).
U.S. Pat. 3,927,105 (Dec. 16, 1975), J. C. Brunie andN. Creene (to Rtujme-Poulenc S. A.).
U.S. Pat. 4,326,085 (Apr. 20,1982), M. De Cooker (to Stamicarbon N. V.).
Eur. Pat. 092,867 (Nov. 2,1983), J. G. Housmans and co-workers (to Stamicarbon N. V.).
U.S. Pat. 3,932,513 (Jan. 13, 1976), J. L. Russell (to Halcon International, Inc.).
U.S. Pat. 3,796,761 (Aug. 18, 1971), Marcell and co-workers (to Halcon International, Inc.).
Brit. Pat. 1,590,958 (June 10, 1981), J. F. Risebury (to Imperial Chemical Industries, Ltd.).
J- Tigy and co-workers, Elydrocarbon Process. 47(12), 131 (1968).
H. Van Landeghem, Ind. Eng. Chem. Process. Des. Dev. 13, 317 (1974).
U.S. Pat. 3,895,067 (Jan. 12,1973), G. H. Mock and co-workers (to Monsanto Co.).
E. F. J. Duynstee and co-workers, Reel Trav. Chim. Pays-Bas 89, 769—780 (1970).
Ref. 50, pp. 1—5.
С. T. Chi and J. H. Lester, Presentation to MCA Waste Minimisation Workshop, New Orleans, La., Nov. 11—13,1987.
U.S. Pat. 3,260,743 (July 12,1966), W. B. Hogeman (to Monsanto Co.); U.S. Pat. 3,365,490 (Jan. 23, 1968), W. J. Arthur and L. S. Scott (to E. I.
du Pont de Nemours & Co., Inc.); U.S. Pat. 3,969,465 (July 13, 1976), J. K. Brunner (to Badische Anilin- und Soda-Fabrik A. G.); U.S. Pat.
4,105,856 (Aug. 8,1978), C. A. Newton (to El Paso Products, Co.); KJ. Mehta and co-workers, Chem. Eng. World 24(30), 63—65 (1989).
U.S. Pat. 3,993,691 (Nov. 23,1976), J. K. Brunner (to Badische Anilin- und Soda-Fabrik A. G.); U.S. Pat. 4,166,056 (Aug. 28, 1979), К. P.
Sattedy and F. E. Livingston (to Witco Chemical Corp.); U.S. Pat. 4,233,408 (Nov. 11, 1980), К. P. Sattedy and F. E. Livingston (to Witco
Chemical Corp.).
Jpn. Pat. 82-041456-B (Sept. 3,1982), (to Sumitomo Chemical Co.).
B. Harris and B. Tichenor, Proceedings of 74 th Annual Meeting, Air Pollution Control Association, Pittsburgh, Pa., 1981, Vol. 3, paper 81—41.5.
Ref. 43, p. 69.
U.S. Pat. 3,243,449 (Mar. 29, 1966), C. N. Winnick (to Halcon International, Inc.).
Eur. Chem. News 15, 22 (May 2, 1969).
Eur. Chem. News 11, 32 (June 9, 1967).
U.S. Pat. 3,287,423 (Nov. 22, 1966), J. Steeman and J. von den Hoff (to Stamicarbon, N. V.).
U.S. Pat. 2,794,056 (May 28,1957), L. O. Winstrom (to Allied Chemical Co.).
Brit. Pat. 979,268 (Jan. 1, 1965), J. G. Mather and F. G. Webster (to Imperial Chemical Industries, Ltd.).
Japan Chem. Week, 5 (Oct. 29, 1987).
Comline Chemicals andMaterials, Comline News Service, Tokyo 107, Japan, Feb. 22, 1988.
Jpn. Pat. 59184138 (Oct. 19, 1984), O. Mitsui and Y. Fukuoka (to Asahi Chemical Industry, Ltd.).
Jpn. Pat. 59186929 (Oct. 23,1984), O. Mitsui and Y. Fukuoka (to Asahi Chemical Industry, Ltd.).
Jpn. Pat. 61050930 (Mar. 13, 1986), H. Nagahara and Y. Fukuoka (to Asahi Chemical Industry, Ltd.).
Jpn. Pat. 62045541 (Feb. 27, 1987), H. Nagahara and M. Konishi (to Asahi Chemical Industry, Ltd.).
Jpn. Pat. 60104029 (June 8, 1985), Y. Fukuoka and O. Mitsui (to Asahi Chemical Industry, Ltd.).
Fr. Pat. 2,554,440 (May 10, 1985), O. Mitsui and Y. Fukuoka (to Asahi Chemical Industry, Ltd.).
Eur. Pat. 162,475 (Nov. 11, 1985), M. Tojo and Y. Fukuoka (to Asahi Chemical Industry, Ltd.).
Ger. Offen. 3,441,072 (May 23, 1985), O. Mitsui and Y. Fukuoka (to Asahi Chemical Industry, Ltd.).
U.S. Pat. 3,987,115 (Oct. 19, 1976), J. G. Zajacek and F. J. Hilbert (to Adantic Richfield Co.).
U.S. Pat. 4,080,387 (Mar. 21,1978), J. C. Jubin, I. E. Katz, and R. G. Tave (to Atlantic Richfield Co.).
T. T. Shih and W. J. Klingebiel, paper presented to The First Shanghai International Symposium on Technology of Petroleum and Petrochemical Industry, May
16—20,1989, Shanghai, China.
U.S. Pat. 2,557,282 (1951), C. Hamblett and A. Mac Alevy (to E. I. du Pont de Nemours & Co., Inc.).
U.S. Pat. 2,703,331 (1953), M. Goldbeck and F. Johnson (to E. I. du Pont de Nemours & Co., Inc.).
H. Godt and J. Quinn,/. Am. Chem. Soc. T&, 1461—1464 (1956).
I. Lubyanitski, R. Minati, and M. Furman, Russ. J. Phys. Chem. (Engl, trans.), 32, 294—297 (1962).
I. Lubyanitski, ZJ). Obshch. TJiim. 36, 343 (1962).
I. Lubyanitski, ZA Prikl. TJiim. (Eeningrad) 36, 819—823 (1963).
D. van Asselt and W. van Krevelen, Chem. Eng. Sci. 18, 471—483 (1963).
D. van Asselt and W. van Krevelen, Reel. Trav. Chim. Pays-Bas 82, 51—56, 429—437, 438—449 (1963).
U.S. Pat. 3,758,564 (Sept. 11,1973), D. Davis (to E. I. du Pont de Nemours & Co., Inc.).
U.S. Pat. 3,564,051 (1971), E. Haarer and G. Wenner (to Badische Amlin- und Soda-Fabrik A. G.).
Brit. Pat. 1,092,603 (1969), G. Riegelbauer, A. Wegerich, A. Kuerzinger, and E. Haarer (to Badische Amlin- und Soda-Fabrik A. G.).
T. Hearfield, Chem. Eng. (Eondon) 1980 (361), 625—627 (1980).
U.S. Pat. 3,359,308 (Dec. 19, 1967), O. Sampson (to E. I. du Pont de Nemours & Co., Inc.).
Eur. Pat. Appl. 122-249Al (Oct. 17,1984), C. Hsu and D. Laird (to Monsanto Co.).
U.S. Pat. 4,254,283 (Mar. 3,1981), G. Mock (to Monsanto Co.).
Kirk-Othmer Encyclopedia of Chemical Technology (4th Edition)
248
ADIPIC ACID
Voll
113. Ger. Offen. 3,002,256 (July 30, 1981), W. Rebafka, G. Heilen, and W. Klink (to Badische Anilin- und Soda-Fabrik A. G.).
114. U.S. Pat. 4,014,903 (Mar. 29, 1977), W. Moore (to Allied Chemical Corp.).
115. Brit. Pat. 1,480,480 (July 20, 1977), A. Bowman (to Imperial Chemical Industries, Ltd.).
116. U.S. Pat. 4,227,021 (1980), O. Grosskinsky and co-workers (to Badische Anilin- und Soda-Fabrik A. G.).
117. Jpn. Kokai Tokkyo Koho, JP61-257940 (Nov. 15, 1986), T. Sakamoto, H. Suga, and T. Sakasegawa (to Asahi Chemical Industries Co., Ltd.).
118. S. Fathi-Afshar and J. Yang, Chem. Eng. Sci. 40, 781—797 (1985).
119. Brit. Pat. 956,779 (Apr. 29, 1964) (to Halcon International, Inc.).
120. Brit. Pat. 956,780 (Apr. 29, 1964) (to Halcon International, Inc.).
121. U.S. Pat. 3,231,608 (Jan. 22, 1966), J. Kollar (to Gulf Research and Development Corp.).
122. Jpn. Pat‘ 45-16444 (June 8,1970), G. Inoue and co-workers (to Asahi Chemical Industries, Ltd.).
123. Jpn* Pat. 50-116415 (Sept. 11, 1975), S. Furuhashi (to Asahi Chemical Industries, Ltd.).
124. Jpn* Pat. 51-29427 (Mar. 12, 1976), M. Nishino and co-workers (to Toray Industries).
125. U.S. Pat. 4,032,569 (June 28, 1977), A. Onopchenko and co-workers (to Gulf Research and Development Corp.).
126. K. Tanaka, Chem. Technol. 4(9), 555 (1974).
127. Jpn* Pat. 58-021642 (Feb. 8, 1983), M. Suematsu and K. Nakaoka (to Toray Industries).
128. H. Shen and H. Weng, Ind. Eng. Chem. Res. 27, 2254-2260 (1988).
129. E. Sorribes, J. Navarro, A. Romero, and L. Jodra, Rev. R. Acad. Gene. Exactas, Fis. Nat. Madrid 81(1), 233—235 (1987).
130. D. Rao and R. Tirukkoyilur, Ind. Eng. Chem. Process Des. Dev. 25(1), 299—304 (1986).
131. D. Forster and J. F. Roth, eds., Homogeneous Catalysis II (Advances in Chemistry Series 132), American Chemical Society, Washington, D.C. 1974;
H. Adkins and co-workers, J. O/g. Chem. 17, 980—987 (1952); U.S. Pat. 2,729,651 (Jan. 3, 1956), W. Reppe (to Badische Anilin-und Soda-Fabrik A.
G.); USSR Pat. 198,324 (June 28,1967), N. S. Imyanitov and co-workers; U.S. Pat. 3,509,209 (Apr. 28,1970), D. M. Fenton (to Union Oil of
California); U.S. Pat. 3,876,695 (Apr. 8, 1975), N. Von Kutepow (to Badische Anilin- und Soda-Fabrik A. G.).
132. Chem. Eng. News, 14 (May 25, 1987).
133. S. Hosaka and co-workers, Tetrahedron 27, 3821—3829 (1971); W. E. Billeys and co-workers, Chem. Commun. 1067—1068 (1971).
134. Ger. Offen. 2,630,086 (Jan. 12, 1978), H. Schneider and co-workers (to Badische Anilin-und Soda-Fabrik A. G.); U.S. Pat. 4,316,047 (Feb. 16,
1982), R. Kummer and co-workers (to Badische Anilin- und Soda-Fabrik, A. G.).
135. U.S. Pat. 4,169,956 (Oct. 2, 1979), R. Kummer and co-workers (to Badische Anilin- und Soda-Fabrik A. G.); U.S. Pat. 4,171,451 (Oct. 16, 1979),
R. Kummer and co-workers (to Badische Anilin- und Soda-Fabrik A. G.); U.S. Pat. 4,360,695 (Nov. 23,1982), P. Magnussen and co-workers (to
Badische Anilin- und Soda-Fabrik A. G.).
136. U.S. Pat. 4,171,450 (Oct. 16, 1979), H. S. Kesling, Jr., and co-workers (to Adantic Richfield Co.).
137. U.S. Pat. 4,166,913 (Sept. 4, 1979), H. S. Kesling, Jr., and co-workers (to Atlantic Richfield Co.).
138. U.S. Pat. 4,195,184 (Mar. 25, 1980), H. S. Kesling, Jr., and co-workers (to Atlantic Richfield Co.).
139. U.S. Pat. 4,575,562 (Mar. 11, 1986), С. K. Hsu and co-workers (to Monsanto Co.).
140. U.S. Pat. 3,306,932 (Feb. 28, 1967), D. D. Davis (to E. I. du Pont de Nemours & Co., Inc.).
141. U.S. Pat. 3,654,355 (Nov. 19, 1969), W. H. Mueller and co-workers (to Monsanto Co.).
142. U.S. Pat. 3,636,100 (Jan. 18, 1972), W. H. Mueller and co-workers (to Monsanto Co.).
143. U.S. Pat. 3,636,101 (Jan. 18, 1972), T. F. Doumani (to Union Oil Co. of California).
144. Brit. Pat. 1,278,353 (June 21, 1972), H. Arnold and co-workers (to Monsanto Co.).
145. Brit. Pat. 1,239,224 (July 14, 1971), C. Gardner (to Imperial Chemical Industries, Ltd.).
146. U.S. Pat. 3,607,926 (Sept. 21, 1971), R. D. Smetana (to Texaco, Inc.).
147. Fr. Add. 96,191 (May 19, 1972), C. Gardner (to Imperial Chemical Industries, Ltd.); Jpn. Pat. 56-5374 (Feb. 4, 1981), S. Miyazaki (to Agency of
Industrial Sciences andTechnology).
148. Brit. Pat. 1,361,749 (July 31,1974), S. D. Razumovskii and co-workers (to USSR).
149. Fr. Pat. 2,140,088 (Dec. 1, 1973), O. Grosskinsky, G. Herrmann, and R. Kaiser (to Badische Anilin- und Soda-Fabrik A. G.).
150. Jpn. Pat. 54-135720 (Oct. 22,1979), Y. Ishii (to Yasutaka).
151. U.S. Pat. 3,912,586 (Oct. 14, 1975), H. Kaneyuki and co-workers (to Mitsui Petrochemical Industries).
152. Jpn* Pat* 57-129694 (Aug. 11, 1982), H. Nakano and co-workers (to Dainippon Ink and Chemicals).
153. U.S. Pat. 4,400,468 (Aug. 23, 1983), M. Faber (to Hydrocarbon Research).
154. Jpn* Pat* 58-149687 (Sept. 6, 1983), T. Minoda, T. Oomori, andH. Narishima (to Nissan Chemical Industries).
155. Eur. Pat. 74,169 (Mar. 16, 1983), P. C. Maxwell (to Celanese Corp.).
156. Chem. Econ. Eng. Rev. 35—36 (Jan./Feb. 1986).
157. Hazardous Materials Table, Code of Federal Regulations 49CFR 172.101 (revisedNov. 1989).
158. Ref. 30, p. 608.5031C.
159. Chem. Eng. News 67(15), 12 (1989).
160. Chem. Mark. Rep. 236(15), 54 (1989).
161. Chem. Mark. Rep. 230(14), 58 (1989).
162. Chem. Mark. Rep. 236(17), 50 (1989).
163. Chem. Econ. Eng. Rev. 17(6), 45 (1985).
164. Eur. Chem. News 50(1329), 25 (1988).
165. Eur. Chem. News 52(1370), 10 (1989).
166. Chem. Eng. News 65(21), 14 (1987).
167. Chem. Week 142(2), 11 (1990).
168. AgenceEconomique andFinanciere, 7 (Nov. 1, 1987).
169. Chem. Eng. News 67(49), 15 (1989).
170. Jpn. Chem. Week 2—3 (April 27, 1989).
171. Eur. Chem. News 50(1329), 4 (1988).
172. U.S. Exports, EMS46, U.S. Dept, of Commerce, Bureau of Census, data for 1986.
173. Ref. 30, p. 608.5031A.
174. Food Chemicals Codex, 3rd ed., National Academy of Sciences, National Academy Press, Washington, D.C., 1981.
175. R. Keller in F. Snell and C. Hilton, eds., Encyclopedia of Industrial Chemicals Analysis, Vol. 4, Wiley-Interscience, New York, 1967, p. 408—423.
176. "Chromatography" in R. Freis and J. Lawrence, eds., Derivati^ation in Analytical Chemistry, Vol. 1, Plenum Press, New York, 1981.
177. J. Drozd, ChemicalDerivati^ation in Gas Chromatography, Elsevier, Amsterdam, 1980.
178. R. Schwarzenbach, J. Chromatogr. 251, 339—358 (1982).
179. M. Gennaro and co-workers, Ann. Chim. (Rome) 78(3—4), 137—152 (1988).
180. G. Lippe and co-workers, Clin. Biochem. 20(4), 275—279 (1987).
181. N. Sax, Dangerous Properties of Industrial Materials, Van-Nostrand Reinhold Co., New York, 1984, p. 141.
182. J. Svendsen, L. Sydnes, andj. Whist, Spectrosc. Inst. J. 3(4—5), 380—386 (1984).
Kirk-Othmer Encyclopedia of Chemical Technology (4th Edition)
249
ADIPIC ACID
Voll
183. J. Vamecq,J. Draye, and J. Prison, Мл?. J. Physiol. 256(4, pt. 1), G680—688 (1989).
184. F’ederalRegister 47(123) (June 25, 1982).
185. Y. Hirayama, Shokuhin Eisei Renkyu 33, 852—855 (1983).
186. H. Shimuzu and co-workers, Sangyo Igaku 27, 400—419 (1985); see also D. Guest and co-workers, eds., Patty's Industrial Hygiene andToxicology, 3rd
ed., Vol. 2C, Wiley-Interscience, New York, 1982, p. 4945.
187. Y. Yokouclii and Y. Amhi, Atmos. Environ. 20, 1727—1734 (1986).
188. R. Ferek, A. Lazrus, P. Haagenson, and J. Winchester, Environ. Sci. Technol. 17, 315—324 (1983).
189. K. Kawamura and I. Kaplan, Environ. Sci. Technol. 21, 105—110 (1987).
190. B. Appel and co-workers, Environ. Sci. Technol. 13, 98—104 (1979).
191. E. Pelzer, J. Bada, G. Schlesinger, and S. Miller, Adv. Space. R/j. 4(12), 69—74 (1984).
192. Y. Novikov and co-workers, Gig. Sanit. 1983(9), 72—75 (1983).
193. K. Urano and Z. Kato, J. Hazard Mater. 13(2), 147—159 (1986).
194. Ref. 30, p. 608.5032C,Q.
195. Chem. Mark. Rep. 54 (Oct. 9, 1989).
196. J. Szymanowski and A. Sobczynska, Pr^em. Chem. 66, 373—377 (1987).
197. U.S. Pat. 2,680,761 (1952), R. Halliwell (to E. I. du Pont de Nemours & Co., Inc.).
198. U.S. Pat. 2,518,608 (1947), M. Fadow (to E. I. du Pont de Nemours & Co., Inc.).
199. Eur. Chem. Mews 23(2), 17 (1973); U.S. Pats. 3,496,217; 3,496,218; 3,766,237; 3,526,654; 3,542,847; 3,536,748; W. Drinkard and co-workers (to E.
I. du Pont de Nemours & Co., Inc.).
200. M. M. Baizer and D. E. Danly, Chem. Technol. 10(10), 161-164, 302-311 (1980).
201. M. Kato, Nikkakyo Geppo 26, 561—567 (1973).
202. CPI Purchasing, 31 (Aug. 1989).
203. U.S. Pat. 4,423,018 (Dec. 27, 1983), D. Danly and J. Lester (to Monsanto Co., now dedicated to the public).
204. S. Lithedand and co-workers, Energy Research Abstr. 10(8), Abstr. No. 12145 (1985).
205. C. Chi and J. Lester, Jr., CHEMTECH, 308 (May 1990).
General References
Y. C. Yen and S. Y. Wu, Nylon-6,6, Report No. 54B, Process Economics Program, SRI International, Menlo Park, Calif., Jan. 1987, pp. 1—148.
V. D. Luedeke, "Adipic Acid" in Encyclopedia of Chemical Processing and Design,]. McKetta and W. Cunningham, eds., Vol. 2, Marcel Dekker, Inc., New York,
1977, pp. 128-146.
Darwin D. Davis
Donald R. Kemp
E. I. du Pont de Nemours & Co., Inc.
Kirk-Othmer Encyclopedia of Chemical Technology (4th Edition)
250
ADSORPTION
Voll
ADRENALINE.
See Epinephrine and norepinephrine; Hormones; Psychopharmacological Agents.
ADSORBENTS.
See Adsorption, liquid separation; Aluminum compounds, aluminum oxide (alumina); Carbon, activated carbon; Ion exchange; Molecular sieves; Silicon
COMPOUNDS, SYNTHETIC, INORGANIC SILICATES
ADSORPTION
Adsorption is the term used to describe the tendency of molecules from an ambient fluid phase to adhere to the surface of a solid. This is a fundamental
property of matter, having its origin in the attractive forces between molecules. The force field creates a region of low potential energy near the solid surface
and, as a result, the molecular density close to the surface is generally greater than in the bulk gas. Furthermore, and perhaps more importandy, in a
multicomponent system the composition of this surface layer generally differs from that of the bulk gas since the surface adsorbs the various components
with different affinities. Adsorption may also occur from the liquid phase and is accompanied by a similar change in composition, although, in this case,
there is generally little difference in molecular density between the adsorbed and fluid phases.
The enhanced concentration at the surface accounts, in part, for the catalytic activity shown by many solid surfaces, and it is also the basis of the
application of adsorbents for low pressure storage of permanent gases such as methane. However, most of the important applications of adsorption
depend on the selectivity, ie, the difference in the affinity of the surface for different components. As a result of this selectivity, adsorption offers, at least in
principle, a relatively straightforward means of purification (removal of an undesirable trace component from a fluid mixture) and a potentially useful
means of bulk separation.
Fundamental Principles
Forces of Adsorption. Adsorption may be classified as chemisorption or physical adsorption, depending on the nature of the surface forces.
In physical adsorption the forces are relatively weak, involving mainly van der Waals (induced dipole—induced dipole) interactions, supplemented in many
cases by electrostatic contributions from field gradient—dipole or —quadrupole interactions. By contrast, in chemisorption there is significant electron
transfer, equivalent to the formation of a chemical bond between the sorbate and the solid surface. Such interactions are both stronger and more specific
than the forces of physical adsorption and are obviously limited to monolayer coverage. The differences in the general features of physical and
chemisorption systems (Table 1) can be understood on the basis of this difference in the nature of the surface forces.
Table 1. Parameters of Physical Adsorption and Chemisorption
Parameter Physical adsorption Chemis orp tion
heat of adsorption (AH) low, <2 or 3 times latent heat of evaporation high, > 2 or 3 times latent heat of evaporation
specificity nonspecific highly specific
nature of adsorbed phase monolayer or multilayer, no dissociation of adsorbed species monolayer only may involve dissociation
temperature range only significant at relative low temperatures possible over a wide range of temperature
forces of adsorption no electron transfer, although polarization of sorbate may occur electron transfer leading to bond formation between sorbate and surface
reversibility rapid, nonactivated, reversible activated, may be slow and irreversible
Heterogeneous catalysis generally involves chemisorption of the reactants, but most applications of adsorption in separation and purification
processes depend on physical adsorption. Chemisorption is sometimes used in trace impurity removal since very high selectivities can be achieved.
However, in most situations the low capacity imposed by the monolayer limit and the difficulty of regenerating the spent adsorbent more than outweigh
this advantage. The higher capacities achievable in physical adsorption result from multilayer formation and this is obviously critical in such applications as
gas storage, but it is also an important consideration in most adsorption separation processes since the process cost is direcdy related to the adsorbent
capacity.
In very small pores the molecules never escape from the force field of the pore wall even at the center of the pore. In this situation the concepts of
monolayer and multilayer sorption become blurred and it is more useful to consider adsorption simply as pore filling. The molecular volume in the
adsorbed phase is similar to that of the saturated liquid sorbate, so a rough estimate of the saturation capacity can be obtained simply from the quotient of
the specific micropore volume and the molar volume of the saturated liquid.
Selectivity. Selectivity in a physical adsorption system may depend on differences in either equilibrium or kinetics, but the great majority of
adsorption separation processes depend on equilibrium-based selectivity. Significant kinetic selectivity is in general restricted to molecular sieve
adsorbents—carbon molecular sieves, zeolites, or zeolite analogues. In these materials the pore size is of molecular dimensions, so that diffusion is
sterically restricted. In this regime small differences in the size or shape of the diffusing molecule can lead to very large differences in diffusivity. In the
extreme limit one species (or one class of compounds) may be completely excluded from the micropores, thus giving a highly selective molecular sieve
separation. The most important example of such a process is the separation of linear hydrocarbons from their branched and cyclic isomers using a 5A
zeolite adsorbent. A second example, where the difference in diffusivities is less extreme but still large enough to produce an efficient separation, is air
separation over carbon molecular sieve or 4A zeolite, in which oxygen, the faster diffusing component, is preferentially adsorbed.
A degree of control over the kinetic selectivity of molecular sieve adsorbents can be achieved by controlled adjustment of the pore size. In a carbon
sieve this may be accomplished by adjusting the bum-out conditions or by controlled deposition of an easily crackable hydrocarbon. In a zeolite, ion
Kirk-Othmer Encyclopedia of Chemical Technology (4th Edition)
251
ADSORPTION
Voll
exchange offers the simplest possibility but controlled silanation or boration has also been shown to be effective in certain cases (1).
Control of equilibrium selectivity is generally achieved by adjusting the balance between electrostatic and van der Waals forces. This may be
accomplished by changing the chemical nature of the surface and also, to a lesser extent, by adjusting the pore size. In carbon adsorbents surface oxidation
offers a simple and effective way of introducing surface polarity and thus modifying the selectivity. One example is shown in Figure 1. On an untreated
carbon adsorbent ^-hexane is adsorbed more strongly than sulfur dioxide, whereas on an oxidized surface the relative affinities are reversed. With zeolite
adsorbents, changing the nature of the exchangeable cation by ion exchange or adjusting the silicon—aluminum ratio of the framework, which determines
the cation density, are the most common approaches. In some instances the aluminum-free zeolite analogue (a porous crystalline silicate) may be prepared
with the same channel geometry but with a nonpolar surface.
Fig. 1. EquiEbrium isotherms for adsorption on activated carbon at 298 К showing the effect of surface modification (2). —, SO2;-, ^-hexane. To
convert kPa to torr multiply by 7.5.
Adsorption on a nonpolar surface such as pure silica or an unoxidized carbon is dominated by van der Waals forces. The affinity sequence on such a
surface generally follows the sequence of molecular weights since the polarizability, which is the main factor governing the magnitude of the van der Waals
interaction energy, is itself roughly proportional to the molecular weight.
Hydrophilic and Hydrophobic Surfaces. Water is a small, highly polar molecular and it is therefore strongly adsorbed on a polar surface
as a result of the large contribution from the electrostatic forces. Polar adsorbents such as most zeoEtes, siEca gel, or activated alumina therefore adsorb
water more strongly than they adsorb organic species, and, as a result, such adsorbents are commonly called hydrophilic. In contrast, on a nonpolar surface
where there is no electrostatic interaction water is held only very weakly and is easily displaced by organics. Such adsorbents, which are the only practical
choice for adsorption of organics from aqueous solutions, are termed hydrophobic.
The most common hydrophobic adsorbents are activated carbon and siEcaEte. The latter is of particular interest since the affinity for water is very
low indeed; the heat of adsorption is even smaller than the latent heat of vaporization (3). It seems clear that the channel structure of siEcaEte must inhibit
the hydrogen bonding between occluded water molecules, thus enhancing the hydrophobic nature of the adsorbent. As a result, siEcaEte has some potential
as a selective adsorbent for the separation of alcohols and other organics from dilute aqueous solutions (4).
Capillary Condensation. The equiEbrium vapor pressure in a pore or capillary is reduced by the effect of surface tension. As a result, Equid
sorbate condenses in a small pore at a vapor pressure that is somewhat lower than the saturation vapor pressure. In a porous adsorbent the region of
multilayer physical adsorption merges gradually with the capillary condensation regime, leading to upward curvature of the equiEbrium isotherm at higher
relative pressure. In the capillary condensation region the intrinsic selectivity of the adsorbent is lost, so in separation processes it is generally advisable to
avoid these conditions. However, this effect is largely responsible for the enhanced capacity of macroporous desiccants such as siEca gel or alumina at
higher humidities.
Practical Adsorbents
To achieve a significant adsorptive capacity an adsorbent must have a high specific area, which impEes a highly porous structure with very small
micropores. Such microporous soEds can be produced in several different ways. Adsorbents such as siEca gel and activated alumina are made by
precipitation of colloidalparticles, followed by dehydration (see Aluminum compounds, aluminum oxide (alumina); Silica, amorphous silica). Carbon
adsorbents are prepared by controlled bum-out of carbonaceous materials such as coal lignite, and coconut shells (see Carbon, activated carbon). These
procedures generally yield a fairly wide distribution of pore size (Fig. 2). The crystalline adsorbents (zeoEte and zeoEte analogues) are different in that the
dimensions of the micropores are determined by the crystal structure and there is therefore virtually no distribution of micropore size (see Molecular
sieves). Although structurally very different from the crystalline adsorbents, carbon molecular sieves also have a very narrow distribution of pore size. The
adsorptive properties depend on the pore size and the pore size distribution as well as on the nature of the soEd surface. A simple classification of some of
the common adsorbents according to these features is as follows:
Surface polarity
polar
nonpolar
N arrow
zeoEtes (Al rich)
carbon molecular sieves
siEcaEte
Pore size distribution
Broad
activated alumina
siEca gel
activated carbon
Despite the difference in the nature of the surface, the adsorptive behavior of the molecular sieve carbons resembles that of the small pore zeoEtes. As their
name impEes, molecular sieve separations are possible on these adsorbents based on the differences in adsorption rate, which, in the extreme limit, may
involve complete exclusion of the larger molecules from the micropores.
Kirk-Othmer Encyclopedia of Chemical Technology (4th Edition)
252
ADSORPTION
Voll
Fig. 2. Pore size distribution of typical samples of activated carbon (small pore gas carbon and large pore decolorizing carbon) and carbon molecular sieve
(CMS). Az'/ Arrepresents the increment of specific micropore volume for an increment of pore radius.
Important properties and a number of applications of several commercial adsorbents are summarized in Tables 2—4.
Table 2. Properties and Applications of Amorphous Adsorbents
Adsorbent Pore diameter, nm Particle density, g/cm3 Specific area, m2/g Applications
activated carbon 1-103 (broad 0.6-0.8 200-600 water purification, sugar decolorizing
(large pore) range)
activated carbon 1-10 0.5-0.9 400-1200 removal of light organics
(small pore)
carbon molecular 0.4-0.5, 10-102 0.9-1.0 100-300 air separation (N2 production)
sieve (bimodal)
silica gel (high area) 2-10 1.09 800
silica gel (low area) 10-50 0.62 300 general purpose desiccants
activated alumina 2-10 1.2-1.3 300-400 i
Table 3. Properties and Application of Polymeric Adsorbents
Type of polymer Rep re s ent ative commercial product Properties Applications
sulfonated styrene—divinylbenzene copolymers with various degrees of cross-linking macroreticular sulfonated styrene—divinylbenzene Dowex-50Amberlite IR120B Diaion HPK-25 pore diameter, porosity, density, etc vary with degree of hydration or dehydration porosity -0.33, microparticles ~-80-/./m diameter . b sugar separations , eg, vanous fructose, glucose removal ofNH3 or light amines
Ion exchanged to Ca2+ form.
Liquid-phase operation.
Gas or Equid phase.
Table 4. Properties and Applications of Crystalline Adsorbents*
Structure Cation Typical formula of unit cell or pseudocell Window Effective channel diameter, nm Applications
4A Na+ Na12[(A1O2)12(siO2)12] obstructed 8-ring 0.38 desiccant; CO2
5A Ca2+ Ca5Na2[(AlO2)12(SiO2)12] free 8-ring 0.44 removal; air separation (N2) linear paraffin
ЗА K+ ^[(AlO^JSiO^] obstructed 8-ring 0.29 separation; air separation (O2) drying of reactive
13X 10X Na+ Ca2+ Nags [(VO2)86(SiO2)106] Ca43[(AlO2)86(SiO2)106] 12-ring (free) 12-ring (obstructed) 0.84 0.80 j gases air separation (O2),
SrBaX Sr2+, Ba2+ Sl21Ba22KA1O2)86(SiO2)106] 12-ring (obstructed) 0.80 removal of mercaptans
Kirk-Othmer Encyclopedia of Chemical Technology (4th Edition)
253
ADSORPTION
Voll
KY K+ I<56[(AlO2)56(SiO2)136] 12-ring (free) 0.80 1 separation of Cg aromatics
Mordenite H+ H8[(AlO2)8(SO2)40] 12-ring (free) 0.70 trapping of Kr from nuclear off-gas
Ag+ Ag8[(AlO2)8(SiO2)40] 12-ring (free) 0.70 trapping of CH3I from nuclear off-gas
AgX Ag+ Ag86 [(AlO2)86(SiO2)106] 12-ring (free) 0.84 i
siEcaEte/HZSM5 (SiO2)96 10-ring 0.60 removal of organics in aqueous systems
a Structural details can be found in refs. 5 and 6. A simplified description is given in ref. 7.
Amorphous Adsorbents. The amorphous adsorbents (silica gel, activated alumina, and activated carbon) typically have specific areas in the
200—1000-m2/g range, but for some activated carbons much higher values have been achieved (~To00 m2 /g). The difficulty is that these very high area
carbons tend to lack physical strength and this limits their usefulness in many practical applications. The high area materials also contain a large proportion
of very small pores, which renders them unsuitable for applications involving adsorption of large molecules. The distinction between gas carbons, used for
adsorption of low molecular weight permanent gases, and Equid carbons, which are used for adsorption of larger molecules such as color bodies from the
Equid phase, is thus primarily a matter of pore size.
In a typical amorphous adsorbent the distribution of pore size may be very wide, spanning the range from a few nanometers to perhaps one
micrometer. Since different phenomena dominate the adsorptive behavior in different pore size ranges, IUPAC has suggested the foEowing classification:
micropores, <2-nm diameter
mesopores, 2—50-nm diameter
macropores, >50-nm diameter
This division is somewhat arbitrary since it is really the pore size relative to the size of the sorbate molecule rather than the absolute pore size that governs
the behavior. Nevertheless, the general concept is useful. In micropores (pores which are only sEghtly larger than the sorbate molecule) the molecule never
escapes from the force field of the pore wall, even when in the center of the pore. Such pores generally make a dominant contribution to the adsorptive
capacity for molecules small enough to penetrate. Transport within these pores can be severely limited by steric effects, leading to molecular sieve behavior.
The mesopores make some contribution to the adsorptive capacity, but then main role is as conduits to provide access to the smaller micropores.
Diffusion in the mesopores may occur by several different mechanisms, as discussed below. The macropores make very Etde contribution to the adsorptive
capacity, but they commonly provide a major contribution to the kinetics. Then role is thus analogous to that of a super highway, allowing the adsorbate
molecules to diffuse far into a particle with a minimum of diffusional resistance.
Crystalline Adsorbents. In the crystalline adsorbents, zeoEtes and zeoEte analogues such as siEcaEte and the microporous aluminum
phosphates, the dimensions of the micropores are determined by the crystal framework and there is therefore virtually no distribution of pore size.
However, a degree of control can sometimes be exerted by ion exchange, since, in some zeoEtes, the exchangeable cations occupy sites within the structure
which partially obstruct the pores. The crystals of these materials are generally quite small (1—5 |lm) and they are aggregated with a suitable binder (generally
a clay) and formed into macroporous particles having dimensions large enough to pack direcdy into an adsorber vessel. Such materials therefore have a
well-defined bimodal pore size distribution with the intracrystalline micropores (a few tenths of a nanometer) linked together through a network of
macropores having a diameter of the same order as the crystal size (~1 pm).
Desiccants. A soEd desiccant is simply an adsorbent which has a high affinity and capacity for adsorption of moisture so that it can be used for
selective adsorption of moisture from a gas (or Equid) stream. The main requirements for an efficient desiccant are therefore a highly polar surface and a
high specific area (small pores). The most widely used desiccants (qv) are siEca gel, activated alumina, and the aluminum rich zeoEtes (4A or 13X). The
equiEbrium adsorption isotherms for moisture on these materials have characteristically different shapes (Fig. 3), making them suitable for different
appEcations.
Relative humidity, %
Fig. 3. Adsorption equiEbrium isotherms for moisture on three commercial adsorbents: pelletized 4A zeoEte (—), siEca gel (-), and a typical activated
alumina (------).
The zeoEtes have high affinity and high capacity at low partial pressures, shown by the nearly rectangular form of the isotherm. This makes them
useful desiccants where a very low humidity or dew point is required. The ЗА zeoEte is a molecular sieve desiccant, since its micropores are small enough to
exclude most molecules other than water. It is therefore useful for drying reactive gases. The major disadvantage of zeoEte desiccants is that a high
temperature is required for regeneration (>300° C), which makes then use uneconomic when only a moderately low dew point is required.
Considerable variation in the moisture isotherm for alumina can be obtained by different preparation and pretreatment. However, in general, the
initial slope of the isotherm is not as steep as that of a zeoEte, indicating a lower moisture affinity at low partial pressure, but the capacity at high humidities
is often higher than that of a zeoEtic adsorbent. Regeneration temperatures are typically in the 250—350°C range. Alumina adsorbents are also more robust
than zeoEtes and less sensitive to deactivation by organics, but they are generally less suitable than the zeoEtes where very low humidity is the primary
requhement.
The isotherm for siEca gel is more nearly linear over a wide range of partial pressure, although the affinity for moisture is lower than that of either
alumina or the zeoEtes. However, a correspondingly lower regeneration temperature is also required. This can be as low as 120°C, making siEca gel the
most suitable candidate for pressure swing driers, desiccant cooling systems (8), and other appEcations where low grade heat is used for regeneration of the
adsorbent..
Kirk-Othmer Encyclopedia of Chemical Technology (4th Edition)
254
ADSORPTION
Voll
Loaded Adsorbents. Where highly efficient removal of a trace impurity is required it is sometimes effective to use an adsorbent preloaded
with a reactant rather than rely on the forces of adsorption. Examples include the use of zeolites preloaded with bromine to trap traces of olefins as their
more easily condensible bromides; zeolites preloaded with iodine to trap mercury vapor, and activated carbon loaded with cupric chloride for removal of
mercaptans.
Adsorption Equilibrium
Henry’s Law. Like any other phase equiEbrium, the distribution of a sorbate between fluid and adsorbed phases is governed by the principles
of thermodynamics. EquiEbrium data are commonly reported in the form of an isotherm, which is a diagram showing the variation of the equiEbrium
adsorbed-phase concentration or loading with the fluid-phase concentration or partial pressure at a fixed temperature. In general, for physical adsorption
on a homogeneous surface at sufficiently low concentrations, the isotherm should approach a linear form, and the limiting slope in the low concentration
region is commonly known as the Henry's law constant. The Henry constant is simply a thermodynamic equiEbrium constant and the temperature
dependence therefore foEows the usual van't Hoff equation:
= K' = K'oe-AH°/RT
p^o \dpj T
(1)
in which —Aff0 is the limiting heat of adsorption at zero coverage. Since adsorption, particularly from the vapor phase, is usually exothermic, —A/f0 is a
positive quantity and K7 therefore decreases with increasing temperature. A corresponding dimensionless Henry constant (K) may also be defined, based on
the ratio of adsorbed and fluid-phase concentrations:
= K = Koe-AC7"/RT
c—>0 \dcJ T
?)
Since, for an ideal vapor phase, p = cRTy these quantities are related by
К = RTKr; -№0 = -MJ0+RT
(3)
Henry's law corresponds physically to the situation in which the adsorbed phase is so dilute that there is neither competition for surface sites nor
any significant interaction between adsorbed molecules. At higher concentrations both of these effects become important and the form of the isotherm
becomes more complex. The isotherms have been classified into five different types (9) (Fig. 4). Isotherms for a microporous adsorbent are generally of
type I; the more complex forms are associated with multilayer adsorption and capillary condensation.
Fig. 4. The Brunaner classification of isotherms (I—V).
Langmuir Isotherm. Type I isotherms are commonly represented by the ideal Langmuir model:
q _ bp
qs \ + bp
(4)
where q is the saturation limit and b is an equiEbrium constant which is directly related to the Henry constant (K' = bqs\ The Langmuir model was
originally developed to represent monolayer adsorption on an ideal surface, for which corresponds to the monolayer coverage. However, in applying this
model to physical adsorption on a microporous soEd, the saturation limit becomes the quantity of sorbate required to fill the micropore volume. This
expression is of the correct form to represent a type I isotherm, since at low pressure it approaches Henry's law while at high pressure it tends
asymptotically to the saturation limit. The equiEbrium constant b ( = K'/qs) decreases with increasing temperature (eq. 1); therefore, for a given pressure
range, the isotherm approaches rectangular or hreversible form at low temperatures (large b) and linear form at high temperatures (small b).
Although very few systems conform accurately to the Langmuir model, this model provides a simple quaEtative representation of the behavior of
many systems and it is therefore widely used, particularly for adsorption from the vapor phase. According to the Langmuh model the heat of adsorption
should be independent of loading, but this requirement is seldom fulfilled in practice. Both increasing and decreasing trends are commonly observed (Fig.
5). For a polar sorbate on a polar adsorbent (ie, a system in which electrostatic forces are dominant) a decreasing trend is normally observed, since the
relative importance of the electrostatic contribution declines at high loadings as a result of preferential occupation of the most favorable sites and
consequent screening of cations. In contrast, where van der Waals forces are dominant (nonpolar sorbates), a rising trend of heat of adsorption with
loading is generally observed. This is commonly attributed to the effect of intermolecular attractive forces, but other explanations are also possible (11). In
homologous series such as the linear paraffins the heat of adsorption increases linearly with carbon number (12).
Kirk-Othmer Encyclopedia of Chemical Technology (4th Edition)
255
ADSORPTION
Voll
C, mmol/g anhydrous zeolite
Fig. 5. Variation of isosteric heat of adsorption with adsorbed phase concentration. Reprinted from ref. 10, courtesy of Marcel Dekker, Inc. To convert kJ
to kcal divide by 4.184.
Freundlich Isotherm. The isotherms for some systems, notably hydrocarbons on activated carbon, conform more closely to the Freundlich
equation:
q = bp1/n (n > 1.0)
(5)
Although the Freundlich expression does not reduce to Henry's law at low concentrations, it often provides a good approximation over a wide range of
conditions. This form of equation can be explained as resulting from energetic heterogeneity of the surface. Superposition of a set of Langmuir isotherms
with different b values (corresponding to sites of different energy) yields an expression of this form.
Adsorption of Mixtures. The Langmuir model can be easily extended to binary or multicomponent systems:
4i =b1p1 q2 =b,i>,
4si ^+b1p1 + b2p2^----------’ qs2 1 + bxpx + b2p2; 1----------
(6)
Thermodynamic consistency requires qsl = qs2, but this requirement can cause difficulties when attempts are made to correlate data for sorbates of very
different molecular size. For such systems it is common practice to ignore this requirement, thereby introducing an additional model parameter. This
facilitates data fitting but it must be recognized that the equations are then being used purely as a convenient empirical form with no theoretical foundation.
Equation 6 shows that the adsorption of component 1 at a partial pressureis reduced in the presence of component 2 as a result of competition
for the available surface sites. There are only a few systems for which this expression (with qsl = qs2 = q9~) provides an accurate quantitative representation,
but it provides useful qualitative or semiquantitative guidance for many systems. In particular, it has the correct asymptotic behavior and provides explicit
recognition of the effect of competitive adsorption. For example, if component 2 is either strongly adsorbed or present at much higher concentration than
component 1, the isotherm for component 1 is reduced to a simple linear form in which the apparent Henry's law constant depends onp^:
0
For an equilibrium-based separation, a convenient measure of the intrinsic selectivity of the adsorbent is provided by the separation factor (ot12),
which is defined by analogy with the relative volatility as
_(X1/yi)
12 (v2/y2)
(8)
where X and Y refer to the mole fractions in the adsorbed and fluid phases, respectively, at equilibrium. For a system that obeys the Langmuir model (eq.
6) it is evident that a12 = Ьг / b2 and is thus independent of concentration. The Langmuir isotherm is therefore sometimes referred to as the constant
separation factor model.
The assumption of a constant separation factor is often a reasonable approximation for preliminary process design but this assumption is often
violated in real systems, where some variation of the separation factor with composition is common and more extreme variations involving azeotrope
formation (a = 1.0 at a particular composition) and selectivity reversal (a varying from greater than 1.0 to less than 1.0 with changing composition) are not
uncommon. There have been many attempts to improve the correlation of equilibrium data by using more complex expressions, one of the more widely
used being the Langmuir-Freundlich or loading ratio correlation (13):
bn, 7 no
, = 1P1<?2 = o2P2
4S 1 + &1K1 + Ь2Р2‘ H---’ 4S 1 + fejp"1 + fe2p22 H---
(9)
This has the advantage that the expressions for the adsorbed-phase concentration are simple and explicit, and, as in the Langmuir expression, the effect of
competition between sorbates is accounted for. However, the expression does not reduce to Henry's law in the low concentration limit and therefore
violates the requirements of thermodynamic consistency. Whereas it may be useful as a basis for the correlation of experimental data, it should be treated
with caution and should not be used as a basis for extrapolation beyond the experimental range.
Ideal Adsorbed Solution Theory. Perhaps the most successful approach to the prediction of multicomponent equilibria from
single-component isotherm data is ideal adsorbed solution theory (14). In essence, the theory is based on the assumption that the adsorbed phase is
thermodynamically ideal in the sense that the equilibrium pressure for each component is simply the product of its mole fraction in the adsorbed phase and
the equilibrium pressure for the pure component at the same spreadingpressure. The theoretical basis for this assumption and the details of the calculations
required to predict the mixture isotherm are given in standard texts on adsorption (7) as well as in the original paper (14). Whereas the theory has been
shown to work well for several systems, notably for mixtures of hydrocarbons on carbon adsorbents, there are a number of systems which do not obey
this model. Azeotrope formation and selectivity reversal, which are observed quite commonly in real systems, are not consistent with an ideal adsorbed
Kirk-Othmer Encyclopedia of Chemical Technology (4th Edition)
256
ADSORPTION
Voll
phase and there is no way of knowing a priori whether or not a given system will show ideal behavior.
Adsorption Kinetics
Intrinsic Kinetics. Chemisorption may be regarded as a chemical reaction between the sorbate and the solid surface, and, as such, it is an
activated process for which the rate constant (/&) follows the familiar Arrhenius rate law:
k= koe-E/RT
(10)
Depending on the temperature and the activation energy (E), the rate constant may vary over many orders of magnitude.
In practice the kinetics are usually more complex than might be expected on this basis, since the activation energy generally varies with surface
coverage as a result of energetic heterogeneity and/or sorbate-sorbate interaction. As a result, the adsorption rate is commonly given by the Elovich
equation (15):
q = p'ln('1 + k"^
(11)
where k' and k” are temperature-dependent constants.
In contrast, physical adsorption is a very rapid process, so the rate is always controlled by mass transfer resistance rather than by the intrinsic
adsorption kinetics. However, under certain conditions the combination of a diffusion-controlled process with an adsorption equiEbrium constant that
varies according to equation 1 can give the appearance of activated adsorption.
As illustrated in Figure 6, a porous adsorbent in contact with a fluid phase offers at least two and often three distinct resistances to mass transfer:
external film resistance and intraparticle diffusional resistance. When the pore size distribution has a well-defined bimodal form, the latter may be divided
into macropore and micropore diffusional resistances. Depending on the particular system and the conditions, any one of these resistances maybe
dominant or the overall rate of mass transfer may be determined by the combined effects of more than one resistance.
Macro particle
(spherical)
Macro particle
(idealized as sphere)
Fluid phase profile
in macropores
Adsorbed phase
profile through
microparticle
Fig. 6. Concentration profiles through an idealized biporous adsorbent particle showing some of the possible regimes. (1) + (a) rapid mass transfer,
equiEbrium throughout particle; (1) + (b) micropore diffusion control with no significant macropore or external resistance; (1) + (c) controlling resistance
at the surface of the microparticles; (2) + (a) macropore diffusion control with some external resistance and no resistance within the microparticle; (2) + (b)
all three resistances (micropore, macropore, and film) significant; (2) + (c) diffusional resistance within the macroparticle and resistance at the surface of the
microparticle with some external film resistance.
External Fluid Film Resistance. A particle immersed in a fluid is always surrounded by a laminar fluid film or boundary layer through
which an adsorbing or desorbing molecule must diffuse. The thickness of this layer, and therefore the mass transfer resistance, depends on the
hydrodynamic conditions. Mass transfer in packed beds and other common contacting devices has been widely studied. The rate data are normally
expressed in terms of a simple linear rate expression of the form
||= kfa(c - c*)
(12)
and the variation of the mass transfer coefficient (^ with the hydrodynamic conditions is generally accounted for in terms of empirical correlations of the
general form
2kfR
Sh=-^—=f(Re, Sc)
(13)
where Re and Sc are the (particle-based) Reynolds and Schmidt numbers. One of the most widely used correlations, appEcable to both gas and Equid
systems over a wide range of conditions, is (16)
2k fR ,
Sh = —2— = 2.0 + 1.1 Sc1/3Re°'6
J-^m
(14)
Macropore Diffusion. Transport in a macropore can occur by several different mechanisms, the most important of which are bulk molecular
Kirk-Othmer Encyclopedia of Chemical Technology (4th Edition)
257
ADSORPTION
Voll
diffusion, Knudsen diffusion, surface diffusion, and Poiseuille flow. In liquid systems bulk molecular diffusion is generally dominant, but in the vapor
phase the contributions from Knudsen and surface diffusion may be large or even dominant. The contribution from Poiseuille flow, ie, forced flow
through the pore under the influence of the pressure gradient, is generally relatively minor since pressure gradients are usually kept small. However, this is
not true in the pressurization and blowdown steps of a pressure swing process, where the contribution from Poiseuille flow can be dominant.
A molecule colliding with the pore wall is reflected in a specular manner so that the direction of the molecule leaving the surface has no correlation
with that of the incident molecule. This leads to a Fickian mechanism, known as Knudsen diffusion, in which the flux is proportional to the gradient of
concentration of partial pressure. The Knudsen diffusivity (D^) is independent of pressure and varies only weakly with temperature:
DK = 9700д/^Ж (cm2/s)
(15)
where p is the pore radius (cm) and M the molecular weight. Knudsen diffusion becomes dominant when collisions with the pore wall occur more
frequendy than collisions between diffusing molecules, ie, when the pore diameter is smaller than the mean free path. Since the mean free path varies
inversely with pressure there is a gradual transition from the molecular to the Knudsen regime as the pressure is reduced, but the pressure at which this
occurs depends on the pore size. At atmospheric temperature and pressure Knudsen diffusion is dominant in pores of less than about 10 nm diameter. In
the intermediate region, which spans the range of the macropores in many commercial adsorbents, both mechanisms are of comparable significance.
The combined effects of Knudsen and molecular diffusion may be estimated approximately from the reciprocal addition rule:
1 т / 1 1 \
epDp ep \DK DJ
(16)
The factor takes account of the fact that diffusion occurs only through the pore and not through the matrix; T is a tortuosity factor which accounts for
the increased path length and reduced concentration gradient arising from the random orientation of the pores as well as any other geometric effects. In a
typical adsorbent т ~ 3.0 and e0 ~ 0.3, so the effect of these two factors is to reduce the diffusivity by about one order of magnitude relative to the value
for a straight cylindrical capillary.
Micropore Diffusion. In very small pores in which the pore diameter is not much greater than the molecular diameter the diffusing molecule
never escapes from the force field of the pore wall. Under these conditions steric effects and the effects of nonuniformity in the potential field become
dominant and the Knudsen mechanism no longer applies. Diffusion occurs by an activated process involving jumps from site to site, just as in surface
diffusion, and the diffusivity becomes strongly dependent on both temperature and concentration.
The true driving force for any diffusive transport process is the gradient of chemical potential rather than the gradient of concentration. This
distinction is not important in dilute systems where thermodynamically ideal behavior is approached. However, it becomes important at higher
concentration levels and in micropore and surface diffusion. To a first approximation the expression for the diffusive flux may be written
J= -Bq d/i/dz
(17)
where q is the concentration in the adsorbed phase. Assuming an ideal vapor phase, the expression for the chemical potential is
p = + RT In p
(18)
where
Ф - RT dXnpdq
dz dq dz
(19)
Combining equations 17 and 18 yields, for the Fickian diffusivity (defined by J = —Ddq/dz),
(20)
where Do = BRT• If the equilibrium relation is linear, <71np/<71n q = 1.0 and D —» Do. At higher concentrations the equiEbrium relationship is nonlinear,
and as a result the diffusivity is generally concentration dependent. For the special case of a Langmuir isotherm (eq. 4), <71n p/<71n § = (1 — q/q9) so
(21)
A rapid increase in diffusivity in the saturation region is therefore to be expected, as illustrated in Figure 7 (17). Although the corrected diffusivity (Dq) is, in
principle, concentration dependent, the concentration dependence of this quantity is generally much weaker than that of the thermodynamic correction
factor (<71np/<71n q). The assumption of a constant corrected diffusivity is therefore an acceptable approximation for many systems. More detailed analysis
shows that the corrected diffusivity is closely related to the self-diffusivity or tracer diffusivity, and at low sorbate concentrations these quantities become
identical.
Kirk-Othmer Encyclopedia of Chemical Technology (4th Edition)
258
ADSORPTION
Voll
q, molecule/cage
(b)
Fig. 7. Variation of (a) intracrystalline diffusivity and (b) corrected diffusivity (D^) with sorbate concentration for ^-heptane in a commercial sample of 5A
zeolite crystals: Q 409 K; A, 439 К (ads, des); x, 462 K; +, 491 K. Reproduced by permission of National Research Council of Canada from ref 17.
The temperature dependence of the corrected diffusivity follows the usual Eyring expression
Do = Dx e-E/RT
(22)
in. which -E is the activation energy or the energy barrier between adjacent sites. In small pore zeolites and carbon molecular sieves the dominant
contribution to this energy is the repulsive interaction encountered by the molecule in penetrating the concentration in the pore. As a result, the activation
energy shows a well-defined correlation with the molecule diameter and the size of the micropore, as illustrated in Figure 8.
Fig. 8. Variation of activation energy with kinetic molecular diameter for diffusion in 4A zeolite (□), 5A zeolite (O)> ail<^ carbon molecular sieve (MSC-5A)
(A). Kinetic diameters are estimated from the van der Waals co-volumes. From ref. 7. To convert kJ to kcal divide by 4.184.
Sorption Rates in Batch Systems. Direct measurement of the uptake rate by gravimetric, volumetric, or piezometric methods is widely
used as a means of measuring intraparticle diffusivities. Diffusive transport within a particle may be represented by the Fickian diffusion equation, which, in
spherical coordinates, takes the form
Эд fd2q 2 dq\
dt \dr2 \dr)
(23)
For a step change in sorbate concentration at the particle surface (r = R) at time zero, assuming isothermal conditions and diffusion control, the
expression for the uptake curve maybe derived from the appropriate solution of this differential equation:
mt = ! _ 6 ух _1_е_п2^2р//д2
7Г2 n2
°° n = l
(24)
or, in the initial region,
Kirk-Othmer Encyclopedia of Chemical Technology (4th Edition)
259
ADSORPTION
Voll
6 (Dt\ 1/2
д/тг \R2 )
(25)
The time constant R2/Dy and hence the diffusivity, may thus be found direcdy from the uptake curve. However, it is important to confirm by experiment
that the basic assumptions of the model are fulfilled, since intrusions of thermal effects or extraparticle resistance to mass transfer may easily occur, leading
to erroneously low apparent diffusivity values.
In certain adsorbents, notably partially coked zeolites and some carbon molecular sieves, the resistance to mass transfer may be concentrated at the
surface of the particle, leading to an uptake expression of the form
= 1 - e~k^
mco
(26)
in place of equation 24. The difference between surface resistance and intraparticle diffusion control is easily apparent from the form of the uptake curves
(see Fig. 9). Since both D and are generally concentration dependent, it is preferable to make differential measurements over small concentration steps in
order to simplify the interpretation of the experimental data.
Fig. 9. Uptake curves for N2 in two samples of carbon molecular sieve showing conformity with diffusion model (eq. 24) for sample 1 (A), and with
surface resistance model (eq. 26) for example 2 (O)> LDF = linear driving force. Data from ref. 18.
For a macroporous sorbent the situation is slightly more complex. A differential balance on a shell element, assuming diffusivity transport through
the macropores with rapid adsorption at the surface (or in the micropores), yields
de , . dq /d2c 2 Эс\
~ep2~dt = €p p\dr^rdr)
(27)
Assuming a linear equilibrium relationship (over the range of the small concentration step, q* = Ke), this becomes
de epDp / d2c 2 Эс\
dt 1 + (1 - К \dr2 + r dr)
(28)
which is of the same form as equation 23 but with an effective diffusivity given by
1+ (1- ep)K
(29)
For adsorption from the vapor phase, К may be very large (sometimes as high as 107) and then clearly the effective diffusivity is very much smaller than the
pore diffusivity. Furthermore, the temperature dependence of К follows equation 2, giving the appearance of an activated diffusion process with
Ex (-AU).
As a result of these difficulties the reported diffusivity data show many apparent anomalies and inconsistencies, particularly for zeolites and other
microporous adsorbents. Discrepancies of several orders of magnitude in the diffusivity values reported for a given system under apparendy similar
conditions are not uncommon (18). Since most of the intrusive effects lead to erroneously low values, the higher values are probably the more reHable.
Adsorption Column Dynamics
In most adsorption processes the adsorbent is contacted with fluid in a packed bed. An understanding of the dynamic behavior of such systems is
therefore needed for rational process design and optimization. What is required is a mathematical model which allows the effluent concentration to be
predicted for any defined change in the feed concentration or flow rate to the bed. The flow pattern can generally be represented adequately by the axial
dispersed plug-flow model, according to which a mass balance for an element of the column yields, for the basic differential equation governing the
dynamic behavior,
d2ci d
dz2 dz
dci /1 - e\ dqi
—-+ ------ —-= 0
dt \ e dt
(30)
The term dqljdt represents the overall rate of mass transfer for component i (at time t and distance averaged over a particle. This is governed by a mass
transfer rate expression which may be thought of as a general functional relationship of the form
(31)
This rate equation must satisfy the boundary conditions imposed by the equilibrium isotherm and it must be thermodynamically consistent so that the
mass transfer rate falls to zero at equilibrium. It maybe a linear driving force expression of the form
Kirk-Othmer Encyclopedia of Chemical Technology (4th Edition)
260
ADSORPTION
Voll
(32)
where ) represents the equihbrium adsorbed phase concentration of component /, or it may be a set of diffusion equations with their associated
boundary conditions.
For an isothermal system the simultaneous solution of equations 30 and 31, subject to the boundary conditions imposed on the column, provides
the expressions for the concentration profiles £ (^/), ^i(%^) in both phases. If the system is nonisothermal, an energy balance is also required and since, in
general, both the equilibrium concentration and the rate coefficients are temperature dependent, all equations are coupled. Analytical solutions are possible
only for the simpler cases: single-component isothermal systems with linear or rectangular equihbrium isotherms. In the general case of a multicomponent
nonisothermal system, numerical solutions offer the only practical approach.
The form of the response for an adiabatic three-component system (two adsorbable components in an inert carrier) is illustrated in Figure 10. In
general, if there are n components (counting both heat and nonadsorbing species as components), the response contains (n — 1) transitions or mass
transfer zones, separated by (n — 2) plateaus between the initial and final states. When the change imposed at the column inlet involves an increase in the
concentration of the more strongly adsorbed species, the concentration at the intermediate plateau will exceed both its initial concentration and its final
steady-state concentration. This phenomenon, known as roll-up, results from displacement by the more strongly adsorbed species, which travels more
slowly through the column.
Fig. 10. Comparison of theoretical (—) and experimental (-) concentration and temperature breakthrough curves for sorption of С2Нб~CO2 mixtures
from a N2 carrier on 5A molecular sieve. Feed: 10.5% CO2, 7.03% C2H6 (molar basis) at 24°C, 116.5 kPa (1.15 atm). Column length, 48 cm. Theoretical
curves were calculated numerically using the linear driving force model with a Langmuir equihbrium isotherm. Experimental data are from ref. 19. From ref.
20, courtesy of Pergamon Press.
Equilibrium Theory. The general features of the dynamic behavior may be understood without recourse to detailed calculations since the
overall pattern of the response is governed by the form of the equihbrium relationship rather than by kinetics. Kinetic limitations may modify the form of
the concentration profile but they do not change the general pattern. To illustrate the different types of transition, consider the simplest case: an isothermal
system with plug flow involving a single adsorbable species present at low concentration in an inert carrier, for which equation 30 reduces to
дс дс /1 - e\ dq
~~ + “77 + I 777 = 0
dz di \ e J dt
(33)
Assuming local equihbrium, q = f(c) where this function represents the isotherm equation, this becomes
v de de
l+((l-e)/e)/'(c) ёГг + di =
(34)
where f' (c) = dq* /de is simply the slope of the equihbrium isotherm at concentration c.
Equation 34 has the form of the kinematic wave equation and represents a transition traveling with the wave velocity given by
C dz\ v
W=\^l)= l + ((l-e)/e) /'(c)
(35)
For a linear system f' (c) = A, so the wave velocity becomes independent of concentration and, in the absence of dispersive effects such as mass transfer
resistance or axial mixing, a concentration perturbation propagates without changing its shape. The propagation velocity is inversely dependent on the
adsorption equihbrium constant.
For a nonlinear system the behavior depends on the shape of the isotherm. If the isotherm is unfavorable (Fig. 11), f (e) increases with concentration
so that n> decreases with concentration. This leads to a spreading profile, as illustrated in Figure 12b. However, if the isotherm is favorable (in the direction
of the concentration change), an entirely different situation arises. Theip/0 decreases with concentration so that «’increases with concentration. This
would lead to the physically unreasonable overhanging profiles shown in Figure 12a. In fact, what happens is that the continuous solution is replaced by
the equivalent shock transition so that response becomes a shock wave which propagates at a steady velocity w' given by
= 1 + ((1 - e) /е) (Д<?/Дс)
(36)
where A^/Ar represents the ratio of the concentration changes in the adsorbed and fluid phases.
Kirk-Othmer Encyclopedia of Chemical Technology (4th Edition)
261
ADSORPTION
Voll
(a)
(b)
Fig. 11. (a) Equilibrium isotherm and (b) dimensionless equilibrium diagram showing favorable, linear, and unfavorable isotherms.
t
t = 0 / t t t ! ! 1 / / / ''fl
(b)
Fig. 12. (a) Development of the physically unreasonable overhanging concentration profile and the corresponding shock profile for adsorption with a
favorable isotherm and (b) development of the dispersive (proportionate pattern) concentration profile for adsorption with an unfavorable isotherm (or for
desorption with a favorable isotherm). From ref. 7.
Constant Pattern Behavior. In a real system the finite resistance to mass transfer and axial mixing in the column lead to departures from the
idealized response predicted by equiEbrium theory. In the case of a favorable isotherm the shock wave solution is replaced by a constant pattern solution.
The concentration profile spreads in the initial region until a stable situation is reached in which the mass transfer rate is the same at all points along the
wave front and exacdy matches the shock velocity. In this situation the fluid-phase and adsorbed-phase profiles become coincident, as illustrated in Figure
13. This represents a stable situation and the profile propagates without further change in shape—hence the term constant pattern. The form of the
concentration profile under constant pattern conditions may be easily deduced by integrating the mass transfer rate expression subject to the condition
c/c0 = q/50, where q- is the adsorbed phase concentration in equiEbrium with cQ.
Fig. 13. Schematic diagram showing (a) approach to constant pattern behavior for a system with a favorable isotherm and (b) approach to proportionate
pattern behavior for a system with an unfavorable isotherm, jy axis: с/C& —\ qljq^-------------------; t'*’/---. From ref. 7.
The distance required to approach the constant pattern limit decreases as the mass transfer resistance decreases and the nonlinearity of the
equiEbrium isotherm increases. However, when the isotherm is highly favorable, as in many adsorption processes, this distance may be very small, a few
centimeters to perhaps a meter.
Length of Unused Bed. The constant pattern approximation provides the basis for a very useful and widely used design method based on
Kirk-Othmer Encyclopedia of Chemical Technology (4th Edition)
262
ADSORPTION
Voll
the concept of the length of unused bed (LUB). In the design of a typical adsorption process the basic problem is to estimate the size of the adsorber bed
needed to remove a certain quantity of the adsorbable species from the feed stream, subject to a specified limit (/) on the effluent concentration. The
length of unused bed, which measures the capacity of the adsorber which is lost as a result of the spread of the concentration profile, is defined by
LUB = (1 - qf/q0)L= (1 - t'/t) L
(37)
where is the capacity at the break time / and //; is the stoichiometric time (see Fig. 14). The values of /, tl, and hence the LUB are easily determined from
an experimental breakthrough curve since, by overall mass balance,
_ L
t = —
v
t'=^
1 +
\CJ
(38)
1 +
(39)
Under constant pattern conditions the LUB is independent of column length although, of course, it depends on other process variables. The procedure is
therefore to determine the LUB in a small laboratory or pilot-scale column packed with the same adsorbent and operated under the same flow conditions.
The length of column needed can then be found simply by adding the LUB to the length calculated from equilibrium considerations, assuming a shock
concentration front.
Fig. 14. Sketch of breakthrough curve showing break time / and the method of calculation of the stoichiometric time tl; and LUB. From ref. 7. S = the
integral of equation 38; = the integral of equation 39.
One potential problem with this approach is that heat loss from a small scale column is much greater than from a larger diameter column. As a
result, small columns tend to operate almost isothermally whereas in a large column the system is almost adiabatic. Since the temperature profile in general
affects the concentration profile, the LUB may be underestimated unless great care is taken to ensure adiabatic operation of the experimental column.
Proportionate Pattern Behavior. If the isotherm is unfavorable, the stable dynamic situation leading to constant pattern behavior can never
be achieved. The situation is shown in Figure 13b. The equiEbrium adsorbed-phase concentration Ees above rather than below the actual adsorbed-phase
profile. As the mass transfer zone progresses through the column it broadens, but the limiting situation, which is approached in a long column, is simply
local equiEbrium at all points (c = c*) and the profile therefore continues to spread in proportion to the length of the column. This difference in behavior is
important since the LUB approach to design is clearly inappEcable under these conditions.
Favorable and unfavorable equiEbrium isotherms are normally defined, as in Figure 11, with respect to an increase in sorbate concentration. This is,
of course, appropriate for an adsorption process, but if one is considering regeneration of a saturated column (desorption), the situation is reversed. An
isotherm which is favorable for adsorption is unfavorable for desorption and vice versa. In most adsorption processes the adsorbent is selected to provide
a favorable adsorption isotherm, so the adsorption step shows constant pattern behavior and proportionate pattern behavior is encountered in the
desorption step.
Detailed Modeling Results. The results of a series of detailed calculations for an ideal isothermal plug-flow Langmuir system are
summarized in Figure 15. The soEd lines show the form of the theoretical breakthrough curves for adsorption and desorption, calculated from the
following set of model equations and expressed in terms of the dimensionless variables T, and |3:
Differentia/ Ralance for Column
de de
dz + dt
(Я
Rate Equation
%‘«'--я
(41)
Equilibrium Isotherm
Initial Conditions
<ff_ _ be
q„ 1 + be
(42)
q(z, 0) = c(z, 0) = 0 (adsorption)
(43)
q(z, 0) = q0, c(z, 0) = c0 (desorption)
Boundary Conditions
c(0, t) = c0 (adsorption)
(44)
c(0, t) = 0 (desorption)
Bed Length Parameter
v \CJ
Kirk-Othmer Encyclopedia of Chemical Technology (4th Edition)
263
ADSORPTION
Voll
Dimensionless Time
= к
(45)
Nonlinearity Parameter
qs 1 + bc0
Also shown are the corresponding curves calculated for the same system assuming a diffusion model in place of the linear rate expression. For
intracrystalline diffusion к = 15D0/r^, whereas for macropore diffusion к = (15epDp/R^tycQ/qty), in accordance with the Glueckauf approximation (21).
0 2 4 6 8 10 12 14 16 18
Fig. 15. Theoretical breakthrough curves for a nonlinear (Langmuir) system showing the comparison between the linear driving force (—), pore diffusion
(--------------------------), and intracrystalline diffusion (----) models based on the Glueckauf approximation (eqs. 40—45). From Ref. 7.
For linear or moderately nonlinear systems (/3 —» 1.0) there is litde difference in the response curves for all three models, thus verifying the validity of
the Glueckauf approximation. Differences between the models, however, become more significant for a highly nonlinear isotherm (/3 —» 0). For linear or
near linear systems the adsorption and desorption curves are mirror images, but as the isotherm becomes more nonlinear the adsorption and desorption
curves become increasingly asymmetric. The adsorption curve approaches its limiting constant pattern form whereas the desorption curve approaches the
limiting proportionate pattern form. In the long-time region the desorption curve is governed entirely by equilibrium, so that the curves for all three rate
models again become coincident.
The main conclusion to be drawn from these studies is that for most practical purposes the linear rate model provides an adequate approximation
and the use of the more cumbersome and computationally time consuming diffusing models is generally not necessary. The Glueckauf approximation
provides the required estimate of the effective mass transfer coefficient for a diffusion controlled system. More detailed analysis shows that when more
than one mass transfer resistance is significant the overall rate coefficient may be estimated simply from the sum of the resistances (7):
1 Д R2 R2
kK - 3k f + 15KDr + 15e„Z>
J p p
(46)
Adsorption Chromatography. The principle of gas-solid or liquid-solid chromatography may be easily understood from equation 35. In a
linear multicomponent system (several sorbates at low concentration in an inert carrier) the wave velocity for each component depends on its adsorption
equilibrium constant. Thus, if a pulse of the mixed sorbate is injected at the column inlet, the different species separate into bands which travel through the
column at their characteristic velocities, and at the oudet of the column a sequence of peaks corresponding to the different species is detected.
Measurement of the retention time (tl) under known flow conditions thus provides a simple means of determining the equiEbrium constant (Henry
constant):
Kirk-Othmer Encyclopedia of Chemical Technology (4th Edition)
264
ADSORPTION
Voll
ctdt - L
——Г= t = —
„cat v
1 +
К
(47)
In an ideal system with no axial mixing or mass transfer resistance the peaks for the various components propagate without spreading. However, in
any real system the peak broadens as it propagates and the extent of this broadening is direcdy related to the mass transfer and axial dispersion
characteristics of the column. Measurement of the peak broadening therefore provides a convenient way of measuring mass transfer coefficients and
intraparticle diffusivities. The simplest approach is to measure the second moments of the response peak over a range of how rates:
c(t - t) 2 dt
f0°°cdt
(48)
Solution of the model equations shows that, for a linear isothermal system and a pulse injection, the height equivalent to a theoretical plate (HETP) is given
by
_2DL 2t> / e '
t2 v kK\l-e
-| —2
e
(49)
where 1 /kKis the overall mass transfer resistance defined by equation 46.
For liquid systems D-Jv is approximately independent of velocity, so that a plot of H versus v provides a convenient method of determining both
the axial dispersion and mass transfer resistance. For vapor-phase systems at low Reynolds numbers DL is approximately constant since dispersion is
determined mainly by molecular diffusion. It is therefore more convenient to plot Н/v versus 1/z^, which yields DL as the slope and the mass transfer
resistance as the intercept. Examples of such plots are shown in Figure 16.
Fig. 16. Plots showing (a) variation of (^2.L/2|A) with l/г^ for O2 (left plot, x, 0.84- 0.72 mm = 20_25 mesh ; Q, 0.42-0.29 mm = 40-50 mesh) and N2
(right plot, on 3.2-mm pellets) in Bergbau-Forschung carbon molecular sieve and (b) variation of HETP with liquid velocity (interstitial) for fructose (solid
symbols), and glucose (open symbols) in a column packed with KX zeolite crystals. From refs. 22 and 23.
Applications
The appEcations of adsorbents are many and varied and may be classified as nonregenerative uses, in which the adsorbent is used once and discarded, and
regenerative applications, in which the adsorbent is used repeatedly in a cyclic manner involving sequential adsorption and regeneration steps.
l^onregeneratwe uses
Desiccant in dual pane windows
Odor removal in health care products
Desiccant in refrigeration and air conditioning systems
Kirk-Othmer Encyclopedia of Chemical Technology (4th Edition)
265
ADSORPTION
Voll
Cigarette filters
degenerative uses
Water purification (some systems)
Removal of trace impurities from gases or liquid streams
Bulk separations (gas or liquid)
Low pressure storage of methane
Desiccant cooling (open-cycle air conditioning)
In terms of tonnage usage, some of the nonregenerative appEcations, notably as desiccants in dual pane windows, in cigarette filters, and in water
purification, are surprisingly important, but most of the important chemical engineering applications are regenerative since, with a few notable exceptions,
the cost of the adsorbent is too great to allow nonregenerative use.
The application of adsorbents (generally high area activated carbon) as a means of storing methane fuel (natural gas) at relatively high density under
moderate pressure is relatively new. With current technology, capacities of about 180 m3 STP/m3 at 3 MPa (30 atm) pressure are achievable (24) but
somewhat higher capacities are needed to compete with liquid fuels for motor vehicles. However, depending on the cost of crude oil and the potential for
improvement of the adsorbent, this technology could become important in the future.
Open-cycle desiccant cooling is another area of emerging technology (8). Rather than cooling and dehumidifying by mechanical work, as in a
conventional air conditioning system, in an open-cycle desiccant system dehumidification is achieved direcdy, while cooling is achieved by controlled
evaporation. The energy input is in the form of the heat required to regenerate the desiccant. A significant advantage of this system is that it can be
designed to operate with a low regeneration temperature, thus making it possible to utilize low grade heat or even solar heat to drive the system.
Adsorption Separation and Purification Processes. The main area of current application of adsorption is in separation and purification
processes. Many different ways of operating such processes have been devised and it is helpful to consider the various systems according to the mode of
fluid-solid contact (see Fig. 17). In a cyclic batch process at least two beds are employed and each bed is successively saturated with the preferentially
adsorbed species (or class of species) during the adsorption step and then regenerated during a desorption step in which the direction of mass transfer is
reversed to remove the adsorbed species from the bed. In the continuous countercurrent process the adsorbent can be regarded as circulating continuously
between the adsorption and desorption beds, in both of which fluid and solid contact in countercurrent flow. More commonly, as in the Sorbex type of
process, the adsorbent is not physically circulated but the same effect is achieved in a fixed adsorbent bed equipped with multiple inlet and outlet ports to
which the fluid streams are directed in sequence. Such systems can achieve a close approximation to counter-current flow without the problems inherent in
circulating the solid adsorbent. However, the system is relatively expensive, so it is generally used only for difficult separations (low separation factor) which
cannot be carried out efficiently in a simple batch process.
(a)
pure В (+P)
Saturated
(b)
Fig. 17. The two basic modes of operation for an adsorption process: (a) cyclic batch system; (b) continuous countercurrent system with adsorbent
recirculation. From ref. 7.
The other major difference between adsorption processes lies in the method by which the adsorbent bed is regenerated. The advantages and
disadvantages of three different methods—temperature swing, pressure swing, and displacement—are summarized in Table 5. For efficient removal of
trace impurities it is normally essential to use a highly selective adsorbent on which the sorbate is strongly held. Temperature swing regeneration is therefore
generally used in such applications. However, in bulk separations all three regeneration methods are widely used.
Table 5. Factors Governing Choice of Regeneration Method*
Method Advantages Disadvantages
thermal swing good for strongly adsorbed species; small change in Tgives large change in thermal aging of adsorbent
desorbate may be recovered at high concentration heat loss means inefficiency in energy usage unsuitable for rapid cycling, so adsorbent cannot be used with maximum efficiency
gases and liquids in liquid systems the latent heat of the interstitial liquid must be added
pressure swing good where weakly adsorbed species is required at high purity very low P may be required
mechanical energy more expensive than heat
Kirk-Othmer Encyclopedia of Chemical Technology (4th Edition)
266
ADSORPTION
Voll
displacement desorption
rapid cycling—efficient use of adsorbent
good for strongly held species
avoids risk of cracking reactions during regeneration
avoids thermal aging of adsorbent
desorbate recovered at low purity
product separation and recovery needed
(choice of desorbent is crucial)
aRef. 7.
Process Design. As with any chemical engineering process, the choice of process type and the details of the design are dictated primarily by
economic considerations, subject to the overriding requirements of safety and reliability. Although the principles of adsorption processes are well
understood, most practical designs still rely on a good deal of empiricism since factors such as the aging and deterioration of an adsorbent under practical
operating conditions are difficult to predict except from experience.
In general the sophistication of the design procedures is closely related to the level of sophistication of the process. In the simple thermal swing,
batch type processes for removal of trace impurities the beds are generally sized on the basis of equilibrium capacity and LUB with a suitable allowance for
aging of the adsorbent. The desorption or regeneration temperature is generally selected on the basis of equilibrium data as the minimum temperature
which will allow the required specification of the purity of the raffinate product to be easily met. Use of a higher regeneration temperature generally gives a
purer product but only at the cost of increased energy consumption and reduction of the service life of the adsorbent. The quantity of purge gas is
estimated in two ways: from the overall heat balance with the required temperature rise and from the mass balance with the assumption of equilibrium at
the bed oudet. Depending on the particular system and the process conditions, either of these considerations may be limiting. In general, when
regeneration is carried out by purging at atmospheric pressure, the purge requirement is determined by the heat balance, but when the regeneration is
carried out at elevated pressure, the mass balance is often the major constraint.
The design of pressure swing systems is also largely dependent on the scale-up of pilot-plant units, although, with such systems, the use of a detailed
numerical simulation to guide the optimization of the operating conditions is more common. This is true also of countercurrent and simulated
countercurrent processes where the initial design is commonly based on a simple McCabe-Thiele diagram (25) (see Adsorption, liquid separation).
NOTATION
a
b
В
c
D
De
DK
Q
Q
ip
E
k
A
k', k"
A
A
L
M
m
mrrj
P
‘I
%
A
f
p
r
R
R
t
tl
/
T
-AU
v
w
w'
Z
a
€
ep
Ц
P
N
к
ratio of external surface area to particle volume
Langmuir equilibrium constant
mobility
sorbate concentration in fluid phase
initial value of c
diffusivity
effective diffusivity
molecular diffusivity
Knudsen diffusivity
axial dispersion coefficient
corrected diffusivity
preexponential factor
pore diffusivity
activation energy
limiting heat of adsorption
dimensionless equilibrium constant
preexponential factor
Henry's law constant
preexponential factor
rate constant
preexponential factor
constants in Elovich equation
fluid film mass transfer coefficient
surface mass transfer coefficient
bed length
molecular weight
mass adsorbed (or desorbed) at time t
mass adsorbed (or desorbed) at t —» oo
partial pressure of sorbate
adsorbed phase concentration
initial value of
adsorbed phase concentration averaged over a particle
equilibrium value of
saturation limit in Langmuir expression
radial coordinate
radius of adsorbent particle
gas constant
time
mean residence time or stoichiometric time
break time
temperature
change of interval energy on adsorption
interstitial fluid velocity
wave velocity
shock velocity
distance
separation factor
voidage of adsorbent bed
porosity of particle
chemical potential
mean pore radius
Kirk-Othmer Encyclopedia of Chemical Technology (4th Edition)
267
ADSORPTION
Voll
variance of pulse response
tortuosity factor
BIBLIOGRAPHY
"Adsorptive separation, introduction" in ECT 3rd ed., Vol. 1, pp. 531—544, by Theodore Vermeulen, University of California, Berkeley; "Adsorption,
theoretical" in ECT 2nd ed., Vol. 1, pp. 421—459, by Sydney Ross, Rensselaer Polytechnic Institute; "Adsorption, theoretical" in ECT 1st ed., Vol. 1, pp.
206—222, by P. H. Emmett, Mellon Institute of Industrial Research.
1. A. Thijs, G. Peters, E. F. Vansant, I. Verhaert, and P. deBievre, J. Chem. Soc. Faraday Trans. 1 79, 2821 (1983).
2. Y. Matsumura, Proceedings of the First Indian Carbon Conference, Neir Delhi, December 1982, pp. 99—106.
3. E. M. Flanigen and co-workers, Nature 271, 512 (1978).
4. S. M. Klein and W. H. Abraham, AIChE Symp. Ser. 53 (1984).
5. D. W. Breck, Zeolite Molecular Sieves, John Wiley & Sons, Inc., New York, 1974.
6. W. M. Meier and D. H. Olson, Atlas of Zeolite Structure Types, Juris Druck and Vedag AG, Zurich, 1978.
7. D. M. Ruthven, Principles of Adsorption and Adsorption Processes, Wiley-Interscience, New York, 1984.
8. T. R. Penney and I. Maclaine-Cross, Proceedings, Desiccant Cooling and Dehumidification Workshop, June 10—11, 1986, Chattanooga, Tenn., Sponsored by
Electric Power Research Institute, Gas Research Institute, and Tennessee Valley Authority.
9. S. Brunauer, L. S. Deming, W. E. Deming, and J. E. Teller, J. Am. Chem. Soc. 62, 1723 (1940).
10. D. M. Ruthven, Sep. Purif. Methods 5(2), 189 (1976).
11. D. M. Ruthven and K. F. Loughlin, J. Chem. Soc. Faraday Trans. 1 68, 696 (1972).
12. A. V. Kiselev and K. D. Shcherbakova in "Molecular Sieves," Proceedings 1 st International Zeolite Conference, Eondon, 1967, Society of Chemical
Industry, London, 1968.
13. R. Sips J. Chem. Phys. 16, 490 (1948).
14. A. L. Myers and J. M. Prausnitz, AIChE J. 11, 121 (1965).
15. P. G. Ashmore, Catalysis and Inhibition of Chemical Reactions, Butterworths, London, 1963, p. 164.
16. N. Wakao and T. Funazkri, Chem. Eng. Sci. 33, 1375 (1978).
17. I. H. Doetsch, D. M. Ruthven, and K. F. Loughlin, Can. J. Chem. 52, 2717 (1974).
18. J. A. Dominguez, D. Psaris, and A. I. La Cava, AIChE Symp. Ser. 84(264), 73 (1988).
19. D. Basmadjian and D. W. Wright, Chem. Eng. Sci. 36, 937 (1981).
20. A. I. Liapis and О. K. Grosser, Chem. Eng. Sci. 37, 958 (1982).
21. E. Glueckauf, Trans. Faraday Soc. 51, 1540 (1955).
22. D. M. Ruthven, N. S. Raghavan, and M. M. Hassan, Chem. Eng. Sci. 41, 1325 (1986).
23. С. B. Ching and D. M. Ruthven, Zeolites 8, 68 (1988).
24. S. S. Barton, J. A. Holland, and D. F. Quinn, Proceedings of the 2ndlntemational Conference on Adsorption, Santa Barbara, May 1986, Engineering
Foundation, New York, 1987, p. 99.
25. D. M. Ruthven and С. B. Ching, Chem. Eng. Sci. 44, 1011 (1989).
General References
D. M. Ruthven, Principles of Adsorption and Adsorption Processes, Wiley-Interscience, New York, 1984.
M. Suzuki, Adsorption Engineering, Kodansba-Elsevier, Tokyo, 1990.
R. T. Yang, Gas Separation by Adsorption Processes, Butterworths, Stoneham, Mass., 1987.
P. Wankat, Eatge Scale Adsorption and Chromatography, CRC Press, Boca Raton, Fla., 1986.
A. E. Rodrigues and D. Tondeur, eds., Percolation Processes, NATO ASI No. 33, Sijthoff & Noordhoff, Alpen aan den Rijn, 1980.
A. E. Rodrigues, M. D. Le van, and D. Tondeur, Adsorption: Science and Technology, NATO ASI E158, Kluwer, Amsterdam, 1989.
N. Wakao, Heat and Mass Transfer in Packed Beds, Gordon & Breach, New York, 1982.
M. Smisek and S. Cemy, Active Carbon, Elsevier, Amsterdam, 1970.
T. Vermeulen, M. D. LeVan, N. K. Hiester, and G. Klein, "Adsorption and Ion Exchange," Section 16 of Perry's Chemical Engineers' Handbook, 6th ed.,
McGraw-Hill Book Co., New York, 1984.
Douglas M. Ruthven
University of New Brunswick, Canada
Kirk-Othmer Encyclopedia of Chemical Technology (4th Edition)
268
ADSORPTION, GAS SEPARATION
Voll
ADSORPTION, GAS SEPARATION
Gas-phase adsorption is widely employed for the large-scale purification or bulk separation of air, natural gas, chemicals, and petrochemicals (Table 1). In
these uses it is often a preferred alternative to the older unit operations of distillation and absorption.
Table 1. Commercial Adsorption Separations
Separation Adsorbent
Gas bulk separations
normal paraffins, isoparaffins, aromatics zeolite
n2/o2 zeolite
o2/n2 carbon molecular sieve
CO, CH4, co2, N2, Ar, nh3/h2 zeolite, activated carbon
acetone /vent streams activated carbon
C2H4/vent streams activated carbon
H2O / ethanol zeolite
Gas purifications
H2O /olefin-containing cracked gas, natural gas, air, synthesis gas, etc siEca, alumina, zeoEte
CO2/C2H4, natural gas, etc zeoEte
organics /vent streams activated carbon, others
sulfur compounds/natural gas, hydrogen, liquified petroleum gas (LPG), zeoEte
etc
solvents / air activated carbon
odors/air activated carbon
№x/N2 zeoEte
SO2/vent streams zeoEte
Hg/chlor—alkali cell gas effluent zeoEte
aRef. 1.
An adsorbent attracts molecules from the gas, the molecules become concentrated on the surface of the adsorbent, and are removed from the gas
phase. Many process concepts have been developed to allow the efficient contact of feed gas mixtures with adsorbents to carry out desired separations and
to allow efficient regeneration of the adsorbent for subsequent reuse. In nonregenerative appEcations, the adsorbent is used only once and is not
regenerated.
Most commercial adsorbents for gas-phase applications are employed in the form of pellets, beads, or other granular shapes, typically about 1.5 to
3.2 mm in diameter. Most commonly, these adsorbents are packed into fixed beds through which the gaseous feed mixtures are passed. Normally, the
process is conducted in a cyclic manner. When the capacity of the bed is exhausted, the feed flow is stopped to terminate the loading step of the process,
the bed is treated to remove the adsorbed molecules in a separate regeneration step, and the cycle is then repeated.
The growth in both variety and scale of gas-phase adsorption separation processes, particularly since 1970, is due in part to continuing discoveries of
new, porous, high-surface-area adsorbent materials (particularly molecular sieve zeolites) and, especially, to improvements in the design and modification of
adsorbents. These advances have encouraged parallel inventions of new process concepts. Increasingly, the development of new applications requires close
cooperation in adsorbent design and process cycle development and optimization.
Adsorption Principles
The design and manufacture of adsorbents for specific applications involves manipulation of the structure and chemistry of the adsorbent to provide
greater attractive forces for one molecule compared to another, or, by adjusting the size of the pores, to control access to the adsorbent surface on the
basis of molecular size. Adsorbent manufacturers have developed many technologies for these manipulations, but they are considered proprietary and are
not openly communicated. Nevertheless, the broad principles are well known.
The attention of this article is focused on physical adsorption, which involves relatively weak intermolecular forces, because most commercial
applications of adsorption rely on this phenomenon alone. Chemisorption is discussed only briefly in some sections on specific applications.
Adsorption Forces. Coulomb's law allows calculations of the electrostatic potential resulting from a charge distribution, and of the potential
energy of interaction between different charge distributions. Various elaborate computations are possible to calculate the potential energy of interaction
between point charges, distributed charges, etc. See reference 2 for a detailed introduction.
An electric dipole consists of two equal and opposite charges separated by a distance. All molecules contain atoms composed of positively charged
nuclei and negatively charged electrons. When a molecule is placed in an electric field between two charged plates, the field attracts the positive nuclei
toward the negative plate and the electrons toward the positive plate. This electrical distortion, or polarization of the molecule, creates an electric dipole.
When the field is removed, the distortion disappears, and the molecule reverts to its original condition. This electrical distortion of the molecule is called
induced polarization; the dipole formed is an induced dipole.
The magnitude of the induced dipole moment depends on the electric field strength in accord with the relationship = ctF, where Ц is the induced
dipole moment, F is the electric field strength, and the constant CC is called the polarizability of the molecule. The polarizability is related to the dielectric
constant of the substance. Group-contribution methods (2) can be used to estimate the polarizability from knowledge of the number of each type of bond
within the molecule, eg, the polarizability of an unsaturated bond is greater than that of a saturated bond.
The total potential energy of adsorption interaction may be subdivided into parts representing contributions of the different types of interactions
between adsorbed molecules and adsorbents. Adopting the terminology of Barter (3), the total energy Фт of interaction is the sum of contributions
resulting from dispersion energy OD, close-range repulsion Фр, polarization energy Фр, field—dipole interaction Фр_м , field gradient—quadrupole interaction
Tsp-- , and adsorbate—adsorbate interactions, denoted self-potential Ф5р:
Kirk-Othmer Encyclopedia of Chemical Technology (4th Edition)
269
ADSORPTION, GAS SEPARATION
Voll
$Total — $D + $R + Фр + Фр-м + Ф«Р-Q + ФзР
nonspecific specific adsorbate-adsorbate
The Ф- and Фр terms always contribute, regardless of the specific electric charge distributions in the adsorbate molecules, which is why they are
called nonspecific. The third nonspecific Фр term also always contributes, whether or not the adsorbate molecules have permanent dipoles or quadrupoles;
however, for adsorbent surfaces which are relatively nonpolar, the polarization energy Фр is small.
The ФР_.( and Ф^р-Q terms are specific contributions, which are significant when adsorbate molecules possess permanent dipole and quadrupole
moments. In the absence of these moments, these terms are zero, as is true also if the adsorbent surface has no electric fields, a completely nonpolar
adsorbent.
Finally, the Ф-р term is the contribution resulting from interactions between adsorbate molecules. At low coverages of the adsorbent by adsorbate
molecules, this contribution approaches zero, and at high coverage it often causes a noticeable increase in the heat of adsorption.
The Фо + Фк (dispersion plus repulsion) terms are known as the London or van der Waals forces. Spherical, nonpolar molecules are well described
by the familiar Lennard-Jones 6—12 potential equation:
Фо + Фк=4е[-Иг)6 + (<7/г)12]
where ris the intermolecular separation distance, and (length units) and 8 (energy units) are constants characteristic of the colliding molecules. Values of
force constants and 8 have been compiled (2).
These forces arise from the fact that each molecule contains atoms having a nucleus and surrounded by a cloud of electrons. The electron cloud
fluctuates and is nonsymmetrical at various instants in time. Although a nonpolar neutral molecule has no net permanent charge or dipole, these fluctuating
electron distributions provide fluctuating dipoles in each molecule. These fluctuating dipoles interact to generate forces between molecules or between
adsorbed molecules and adsorbent surfaces. These contributions to the potential energy of adsorption are present even if the adsorbed molecules are
nonpolar and even if the adsorbent structure contains no strong electrostatic fields.
The contribution Фр is due to the polarization of the molecules by electric fields on the adsorbent surface, eg, electric fields between positively
charged cations and the negatively charged framework of a zeolite adsorbent. The attractive interaction between the induced dipole and the electric field is
called the polarization contribution. Its magnitude is dependent upon the polarizability CC of the molecule and the strength of the electric field F of the
adsorbent (4): Фр = —1 /2aF2.
The first of the two specific interaction terms ФР_.( is due to the attractive interaction between the permanent dipole moment Ц of a molecule and
the electric field on the adsorbent surface (4):
Фр_м = -F[i cos 0
where ® is the dipole—axis/field angle.
The other specific interaction term Ф^р-Q is due to the attractive interaction between the permanent quadrupole moment^ of the molecule and the
electric field gradient on the adsorbent surface (4):
Фда-Q = 1 /2QdF/dr
The final contribution, the self-potential term Ф5р, is the sum of all the above interactions of adsorbed molecules with each other.
Finally, an analysis of the energies of adsorption on many practical polar and nonpolar adsorbents has shown not only that the magnitude of the Фр
term depends direcdy upon the polarizability Ct, but also that the sum of all of the nonspecific terms taken together, ie, Фр + Фк + Фр, increases
monotonically, with increasing CC (4).
Adsorption Selectivities. For a given adsorbent, the relative strength of adsorption of different adsorbate molecules depends on the relative
magnitudes of the polarizability Ct, dipole moment Ц, and quadrupole moment^ of each. These properties of some common molecules are given in Table
2. Often, just the consideration of the values of Ct, Ц, and^ allows accurate qualitative predictions to be made of the relative strengths of adsorption of
given molecules on an adsorbent or of the best adsorbent type (polar or nonpolar) for a particular separation.
Table 2. Electrostatic Properties of Some Common Molecules
Molecule Polarizability a x IO40, CW/j” Dipole moment /х x 103° , Gmb Quadrupole moment Q x 104° , Gm2'
Ar 1.83 0.00 0.00
H2 0.90 0.00 2.09
n2 0.78 0.00 -4.91
°2 1.77 0.00 -1.33
CO 2.19 0.37 -6.92
co2 3.02 0.00 -13.71
cs2 9.41 0.00 12.73
n2o 3.32 0.54 -12.02
NH3 2.67 5.10 -7.39
C2H6 4.97 0.00 -3.32
XH6 11.49 0.00 -30.7
HCl 2.94 3.57 13.28
aTo convert C2m2/J to cm3, divide by 1.113 x IO-16 .
b To convert Gm to debyes, divide by 3.336 x 10“30 .
C To convert Gm2 to Buckinghams, divide by 3.336 x IO-40 .
For example, the strength of the electric field F and field gradient (6F = dF/dr) of the highly polar cationic zeolites is strong. For this reason,
nitrogen is more strongly adsorbed than is oxygen on such adsorbents, primarily because of the stronger quadrupole of N2 compared to O2.
In contrast, nonpolar activated carbon adsorbents lack strong electric fields and field gradients. Such adsorbents adsorb O2 slightly more strongly
than N2, because of the slightly higher polarizability of O2. Relative selectivities on nonpolar adsorbents often parallel the relative volatilities of the same
compounds. Compounds with higher boiling points are more strongly adsorbed. In this case, the higher boiling O2 (bp ~-90 K) is more strongly adsorbed
than is N2 (bp ~ 77 K).
The polarizabilities of molecules in a homologous series increase steadily with increasing numbers of atoms. Therefore, the relative strengths of
Kirk-Othmer Encyclopedia of Chemical Technology (4th Edition)
270
ADSORPTION, GAS SEPARATION
Voll
adsorption also increase (along with the boiling points).
For a given adsorbate molecule, the relative strength of adsorption on different adsorbents depends largely on the relative polarizability and electric
field strengths of adsorbent surfaces. On the one hand, water molecules, with relatively low polarizability but a strong dipole and moderately strong
quadrupole moment, are strongly adsorbed by polar adsorbents (eg, cationic zeolites), but only weakly adsorbed by nonpolar adsorbents (eg, silicalite or
nonoxidized forms of activated carbon). On the other hand, saturated hydrocarbons with low molecular weight have greater polarizabilities than does
water, but no dipoles and only weak quadrupoles. These molecules are adsorbed less strongly than water on polar adsorbents, but more strongly than water
on nonpolar adsorbents. Therefore, polar adsorbents are often called hydrophilic adsorbents and nonpolar adsorbents are called hydrophobic adsorbents.
Isotherms and Isobars. The graphical presentation of the equilibrium adsorbate loading vs adsorbate pressure (or concentration) at constant
temperature (Fig. 1) is an adsorption isotherm (1). A graph of the adsorbate loading vs temperature at constant adsorbate pressure (Fig. 2) is an adsorption
isobar (1). The greater the strength of adsorption, the greater is the adsorbate loading at a given temperature and partial pressure of the adsorbate up to the
point where the maximum adsorption capacity of the adsorbent has been attained.
H20 vapor pressure, kPa
Fig. 1. Water isotherms for various adsorbents (1). Activation conditions: Linde molecular sieves, 350°C and <1.33 Pa; activated alumina, 350°C and
<1.33 Pa; silica gel, 175°C and <1.33 Pa. To convert kPa to mm Hg, divide by 0.133.
Fig. 2. Water isobars for various adsorbents: Equilibrium H2O capacity vs temperature for three adsorbents (1); pH c = 1.33 kPa (10 mm Hg) at 12°C and
101.3 kPa (1 atm). Activation conditions: A, Linde molecular sieve, 350°C and <1.33 Pa; B, activated alumina, 350°C and <1.33 Pa; C, silica gel, 175°C and
<1.33 Pa. To convert Pa to mm Hg, multiply by 0.0075.
The strength of adsorption of unsaturated hydrocarbons by a polar adsorbent (zeolite) is much greater than for saturated hydrocarbons, and
increases with increasing carbon number (Fig. 3) (5). This observation may be understood as a consequence of the increasing polarizability of molecules
with increasing numbers of bonds and the presence of dipole and stronger quadrupole moments in the unsaturated hydrocarbons compared to the
saturated hydrocarbons.
Kirk-Othmer Encyclopedia of Chemical Technology (4th Edition)
271
ADSORPTION, GAS SEPARATION
Voll
Fig. 3. Adsorption of hydrocarbons by zeolites is much greater for unsaturated hydrocarbons whose molecules contain double or triple bonds. From top to
bottom, the curves show adsorption (at 150°C) of propylene, ethylene, acetylene, and isobutylene (unsaturated) and propane, ethane, and methane
(saturated) (5). To convert kPa to mm Hg, multiply by 7.5.
Courtesy of S'rientific American.
Heats of Adsorption. Physical adsorption processes are exothermic, ie, they release heat. Because the entropy change AS on adsorption is
negative (adsorbed molecules are more ordered than in the gas phase) and the free energy change AG must be negative for adsorption to be favored,
thermodynamics (AG = AH — TAS) requires the enthalpy change AH on adsorption (heat of adsorption) to be negative (exothermic). Adsorption
strengths thus decrease with increasing temperature.
The integral heat of adsorption is the total heat released when the adsorbate loading is increased from zero to some final value at isothermal
conditions. The differential heat of adsorption $H is the incremental change in heat of adsorption with a differential change in adsorbate loading. This
heat of adsorption $H may be determined from the slopes of adsorption isosteres (lines of constant adsorbate loading) on graphs of In P vs 1/T (Fig. 4)
(6) through the Clausius-Clapeyron relationship:
rflnF _ №iso
d(l/T) R
where R is the gas constant, P the adsorbate absolute pressure, and T the absolute temperature.
Fig. 4. Adsorption isosteres, water vapor on 4A (NaA) zeolite pellets (6). H2O loading: □, 15 kg/100 kg zeolite; A, 10 kg/100 kg, 0, 5 kg/100 kg. To
convert kPa to mm Hg, multiply by 7.5. Courtesy of Union Carbide.
Differential heats of adsorption for several gases on a sample of a polar adsorbent (natural zeolite chabazite) are shown as a function of the
quantities adsorbed in Figure 5 (4). Consideration of the electrical properties of the adsorbates, included in Table 2, allows the correct prediction of the
relative order of adsorption selectivity:
Ar < O2 < N2 < CO < CO2
Kirk-Othmer Encyclopedia of Chemical Technology (4th Edition)
272
ADSORPTION, GAS SEPARATION
Voll
Fig. 5. Differential heats of sorption in nature chabazite (4). ▲ = N2; M = Ar; 0 = O2; <(> = CO; • = CO2. See Table 2 for polarizability, dipole moment,
and quadrupole moment values for the gases. Volume adsorbed is expressed as cm3 of adsorbate as Equid. To convert kJ to kcal, divide by 4.184.
Courtesy of Academic Press.
At low adsorbate loadings, the differential heat of adsorption decreases with increasing adsorbate loadings. This is direct evidence that the adsorbent
surface is energetically heterogeneous, ie, some adsorption sites interact more strongly with the adsorbate molecules. These sites are filled first so that
adsorption of additional molecules involves progressively lower heats of adsorption.
All practical adsorbents have surfaces that are heterogeneous, both energetically and geometrically (not all pores are of uniform and constant
dimensions). The degree of heterogeneity differs substantially from one adsorbent type to another. These heterogeneities are responsible for many
nonlinearities, both in single component isotherms and in multicomponent adsorption selectivities.
In Figure 5, the heat of adsorption of CO2 increases slightly at the higher adsorbate loadings. This increase is due to the increasing self-potential
contribution at the higher loadings.
Isotherm Models. Many efforts have been made over the years to develop isotherm models for data correlation and design predictions for
both single component and multicomponent adsorption. Unfortunately, no single model is accurate over broad ranges of adsorbent and adsorbate types,
pressures, temperatures, and loadings, especially for multicomponent systems. This is probably due to deficiencies in the models in adequately describing
both the heterogeneities of the surface and the effects of the adsorbate on the properties of the adsorbent itself. Most models assume the adsorbent is
inert, ie, not altered by the presence of the adsorbate molecules; however, partial changes in some adsorbent properties are commonly observed.
Nevertheless, each of the more popular isotherm models have been found useful for modeling adsorption behavior in particular circumstances. The
following outlines many of the isotherm models presendy available. Detailed discussions of derivations, assumptions, strengths, and weaknesses of these
and other isotherm models are given in references 4 and 7—16.
Not all of the isotherm models discussed in the following are rigorous in the sense of being thermodynamically consistent. For example, specific
deficiencies in the Freundlich, Sips, Dubinin-Radushkevich, Toth, and vacancy solution models have been identified (14).
The Sips and related LRC (loading ratio correlation) models fail to properly predict Henry's law behavior (as required for thermodynamic
consistency) at the zero pressure limit (8). Thermodynamic inconsistency of the LRC model had also been noted by the original authors (17); nevertheless,
the model has been found useful in predicting multicomponent performance from single component data and correlating multicomponent data (18).
However, users of models lacking thermodynamic consistency must take due care, particularly in extrapolation beyond the range of actual experimental
data.
Thermodynamically Consistent Isotherm Models. These models include both the statistical thermodynamic models and the models
that can be derived from an assumed equation of state for the adsorbed phase plus the thermodynamics of the adsorbed phase, ie, the Gibbs adsorption
isotherm,
dP J T
qRt
~P~
where Ф is the spreading pressure, P the partial pressure of adsorbate, q the adsorbate loading .vper quantity w of adsorbent = x/wy T the temperature, and
R the gas constant. In the following models, 0 = q/gmax is the fractional surface coverage, where qm2S_ is the maximum loading. Constants are all fCs,
all /^’s, all M's, b, c, n, s, ty P, and T. The vapor pressure of pure adsorbate is PQ.
Henry’s law:
q = KF0
Langmuir: K' Po = ©/(1 — ©)
Volmer: bP0 = [©/(1 — ©) ] exp[©/(l — ©) ]
van der Waals: K"Po = [©/(1 — ©) ] exp[©/(l — ©) ] exp[B/FT]
Virial:
K'"P0/x = exp^2Агх + (3/2) A2x2 + ]
The Langmuir model is discussed in reference 19; the Volmer in reference 20; and the van der Waals and virial equations in reference 8.
Statistical Thermodynamic Isotherm Models. These approaches were pioneered by Fowler and Guggenheim (21) and Hill (22).
Examples of the application of this approach to modeling of adsorption in microporous adsorbents are given in references 3, 23—27. Excellent reviews
have been written (4,28).
SemiempincalIsotherm Models. Some of these models have been shown to have some thermodynamic inconsistencies and should be
used with due care. Nevertheless, they have each been found to be useful for data correlation and interpolation, as well as for the calculation of some
thermodynamic properties.
Models Based on the Polanyi Adsorption Potential
Kirk-Othmer Encyclopedia of Chemical Technology (4th Edition)
273
ADSORPTION, GAS SEPARATION
Voll
A = FTln(P0/P)
Dubinin-Rjadushkevich. This model (29) is the same as the more general Dubinin-Astakhov equation (30) (see below), with n = 2.
Dubinin-Astakhov:
© = exp[-(A/P)n]
where n is generally between 1 and 3.
Rjadke-Prausnit'^. This model (31) is also known as the Langmuir-Freundlich model:
Doth. This model (32) is represented as:
9__________________
[1 + (РР‘)1Л]
UNILAN. The uniform distribution, Langmuir local isotherm model (9,12):
BET. This model (33) estimates the coverage corresponding to one monolayer of adsorbate and is used to measure the surface areas of solids:
fi =_____________b(P/P0)____________
[(l-p/p0) (l-p/p0 + fep/p0)]
Isotherm Models for Adsorption of Mixtures. Of the following models, all but the ideal adsorbed solution theory (LAST) and the related
heterogeneous ideal adsorbed solution theory (HIAST) have been shown to contain some thermodynamic inconsistencies. References to the limited
available literature data on the adsorption of gas mixtures on activated carbons and zeolites have been compiled, along with a brief summary of
approximate percentage differences between data and theory for the various theoretical models (16). In the following the subscripts i and j refer to different
adsorbates.
Markham andBenton. This model (34) is known as the extended Langmuir isotherm equation for two components, i and j.
= КгРг/^ + КгРг + К3Р^
e3 = K^/fi + K^ + K^p;)
Leavittloading Ratio Correlation (LRC) Method. The LRC model (17) for a single component i parallels Sips model (35):
ег = (кгрг)1/п7[1 +(кгрг)1/пг]
but with
-In Кг = Au + A2JT
For the binary system of components i andJ, the LRC model (17) is
к = (кгрг) 1/n7[i + (кгрг)1/пг + (ад)1/nj]
Ideal Adsorbed Solution (IAS) Model. For components i andjy assuming ideal gas behavior, this model (36) is
ФА t‘P° /^°
/ k°(P)H(bF) = [q°(P)] d(\nP)
PY, = Р°Хг
PY] = P°X] = P°(l- Хг)
where P° is the vapor pressure of component /, <f2(P) the equilibrium loading of pure i at pressure P, Y the vapor phase mole fraction of component /, and
A the adsorbed phase mole fraction of component i. These equations are solved simultaneously to determine _P, and A, and the following equations
are used to calculate and ^total:
{VQtotal} = адыад ад/[Ы (7°)]
9г 9total
9j — 9total
Heterogeneous Ideal Adsorbed S olution Theory (HIAST). This IAS theory has been extended to the case of adsorbent surface energetic heterogeneity and is
shown to provide improved predictions over IAST (12).
Vacany Solution Model. The initial model (37) considered the adsorbed phase to be a mixture of adsorbed molecules and vacancies (a vacancy solution) and
assumed that nonidealities of the solution can be described by the two-parameter Wilson activity coefficient equation. Subsequendy, it was found that the
use of the three-parameter Flory-Huggins activity coefficient equation provided improved prediction of binary isotherms (38).
Adsorption Dynamics. An outline of approaches that have been taken to model mass-transfer rates in adsorbents has been given (see
Adsorption). Detailed reviews of the extensive literature on the interrelated topics of modeling of mass-transfer rate processes in fixed-bed adsorbers, bed
concentration profiles, and breakthrough curves include references 16 and 26. The related simple design concepts of WES, WUB, and LUB for
constant-pattern adsorption are discussed later.
Reactions on Adsorbents. To permit the recovery of pure products and to extend the adsorbent's useful life, adsorbents should generally be
inert and not react with or catalyze reactions of adsorbate molecules. These considerations often affect adsorbent selection and/or require limits be placed
upon the severity of operating conditions to minimize reactions of the adsorbate molecules or damage to the adsorbents.
However, even then, gradual reactions of trace impurities in a feed stream or slowly occurring reactions that modify the adsorbent may still cause a
gradual decline in the adsorbent performance, as illustrated in Figure 6 (39). To compensate, adsorbent beds are sized to account for the gradual loss in
capacity and to allow their use for a given period of time. Most commonly, at the end of its useful life, the adsorbent is dumped from the beds and replaced
with fresh adsorbent. However, in some cases, the process equipment is designed to allow periodic in situ rejuvenation of the adsorbent, eg, a periodic
burning-off of coke accumulated on the adsorbent.
Kirk-Othmer Encyclopedia of Chemical Technology (4th Edition)
274
ADSORPTION, GAS SEPARATION
Voll
Fig. 6. Adsorption capacity of various dessicants vs years of service in dehydrating high pressure natural gas (39). a, Alumina H-151, gas ~ 27° C and 123
kPa, from oil and water separators; b, silica gel, gas A380 C and 145 kPa, from oil absorption plant; c, sorbead, 136-kPa gas from absorption plant;
regeneration gas inlet temperature 243°C (maximum allowable dew point —6.7°C); d, sorbead, 40-kPa gas containing propane; regeneration gas
temperature 177°C (maximum allowable dew point —34° C); e, sorbead, 1950—1956 data; f, activated alumina, same gas as for Curve d; g, activated
bauxite(florite), residue gas from gasoline absorption plant; h, activated alumina, same gas for for Curve c.
Courtesy of Gulf Publishing Company.
Adsorbent Principles
Principal Adsorbent Types. Commercially useful adsorbents can be classified by the nature of their structure (amorphous or crystalline), by
the sizes of their pores (micropores, mesopores, and macropores), by the nature of their surfaces (polar, nonpolar, or intermediate), or by their chemical
composition. All of these characteristics are important in the selection of the best adsorbent for any particular appEcation.
However, the size of the pores is the most important initial consideration because, if a molecule is to be adsorbed, it must not be larger than the
pores of the adsorbent. Conversely, by selecting an adsorbent with a particular pore diameter, molecules larger than the pores may be selectively excluded,
and smaller molecules can be allowed to adsorb.
Pore size is also related to surface area and thus to adsorbent capacity, particularly for gas-phase adsorption. Because the total surface area of a given
mass of adsorbent increases with decreasing pore size, only materials containing micropores and small mesopores (nanometer diameters) have sufficient
capacity to be useful as practical adsorbents for gas-phase applications. Micropore diameters are less than 2 nm; mesopore diameters are between 2 and 50
nm; and macropores diameters are greater than 50 nm, by IUPAC classification (40).
The practical adsorbents used in most gas phase applications are limited to the following types, classified by their amorphous or crystalline nature.
Amorphous: siEca gel, activated alumina, activated carbon, and molecular sieve carbons.
Crystalline: molecular sieve zeoEtes, and related molecular sieve materials that are not technically zeoEtes, eg, siEcaEte, A1PO4s, SAPOs, etc.
Typical pore size distributions for these adsorbents have been given (see Adsorption). Only molecular sieve carbons and crystalline molecular sieves
have large pore volumes in pores smaller than 1 nm. Only the crystalline molecular sieves have monodisperse pore diameters because of the regularity of
then crystalline structures (41).
Activated carbons are made by first preparing a carbonaceous char with low surface area foEowed by controlled oxidation in ah, carbon dioxide, or
steam. The pore-size distributions of the resulting products are highly dependent on both the raw materials and the conditions used in then manufacture,
as maybe seen in Figure 7 (42).
Kirk-Othmer Encyclopedia of Chemical Technology (4th Edition)
275
ADSORPTION, GAS SEPARATION
Voll
0.3
0.2
0.1
0
0.3
0.2
0.1
0
.2 0.3
I ».2
Q.
"e o-i
Q
"e о
8 0.3
О
e o.2
° 0.1
о
I о
0.3
0.2
0.1
0
0.3
0.2
0.1
0
Coconut shell-
based
active carbon
Micro- Meso- Macro-
pores pores pores
Bituminous coal
based
active carbon
Peat-based
active carbon
Lignite-based
active carbon 1
Lignite-based
active carbon 2
Fig. 7. Pore size distribution in some active carbons obtained using different precursors (42).
Courtesy of Marcel Dekker Publishing Company.
Assuming the pores are large enough to admit the molecules of interest, the most important consideration is the nature of the adsorbent surface,
because this characteristic controls adsorption selectivity.
Practical adsorbents may also be classified according to the nature of their surfaces.
Highly polar: molecular sieve zeolites with high aluminum and cation contents.
Moderately polar: crystalline molecular sieves with low aluminum and low cation contents, silica gel, activated alumina, activated carbons with highly oxidii
4s-
Nonpolar: silicalilc, I silicalilc, other high silica content crystalline molecular sieves, activated carbons with reduced surfaces.
Adsorption Properties. Typical adsorption isotherms for water on various adsorbents are given in Figure 1, and the corresponding isobars in
Figure 2. Not only do the more highly polar molecular sieve zeolites adsorb more water at lower pressures than do the moderately polar silica gel and
alumina gel, but they also hold onto the water more strongly at higher temperatures. For the same reason, temperatures required for thermal regeneration
of water-loaded zeolites is higher than for less highly polar adsorbents.
Isotherms for H2O and /?-licxane adsorption at room temperature and for O2 adsorption at liquid oxygen temperature on 13X (NaX) zeolite and on
the crystalline SiO2 molecular sieve silicalilc are are shown in Figure 8 (43). Silicalilc adsorbs water very weakly. Further modification of silicalilc by fluoride
incorporation provides an extremely hydrophobic adsorbent, shown in Figure 9 (44). These examples illustrate the broad range of properties of crystalline
molecular sieves.
Kirk-Othmer Encyclopedia of Chemical Technology (4th Edition)
276
ADSORPTION, GAS SEPARATION
Voll
Fig. 8. Adsorption isotherms of H2O, O2, and ^-hexane on zeolite NaX (open symbols) and silicalite (filled symbols). Oxygen is at —183° C and water and
^-hexane (C6H14) at RT. Volume adsorbed is expressed as cm3 of adsorbate as liquid.
Courtesy of Nature, Condon (43).
Fig. 9. Adsorption of oxygen (90 K) and water (RT) on silicalite (—) and F-silicalite (---------------------) (44).
Activated carbons contain chemisorbed oxygen in varying amounts unless special care is taken to eliminate it. Desired adsorption properties often
depend upon the amount and type of chemisorbed oxygen species on the surface. Therefore, the adsorption properties of an activated carbon adsorbent
depend on its prior temperature and oxygen-exposure history. In contrast, molecular sieve zeolites and other oxide adsorbents are not affected by oxidizing
or reducing conditions.
This principle is illustrated in Figure 10 (45). Water adsorption at low pressures is markedly reduced on a poly (vinylidene chloride)-based activated
carbon after removal of surface oxygenated groups by degassing at 1000°C. Following this treatment, water adsorption is dominated by capillary
condensation in mesopores, and the size of the adsorption-desorption hysteresis loop increases, because the pore volume previously occupied by water at
the lower pressures now remains empty until the water pressure reaches pressures ~ 0.3 to 0.4 times the vapor pressure) at which capillary condensation
can occur.
Kirk-Othmer Encyclopedia of Chemical Technology (4th Edition)
277
ADSORPTION, GAS SEPARATION
Voll
Fig. 10. Adsorption (•, Q)-desorption (A, A) isotherms of water vapor on poly (vinylidene chloride) (PVDC) carbon before (filled symbols) and after
(open symbols) outgassing at 1000°C (46).
Courtesy of Carbon.
Typical adsorption isotherms for light hydrocarbons on activated carbon prepared from coconut shells are shown in Figure 11 (46). The
polarizabilities and boiling points of these compounds increase in the order
CH4 < C2H4 < C2H6 < C3H6 < C3HS
The relative strengths of adsorption of these compounds follow the same order, as expected for a nonpolar adsorbent, except that C3H6 was adsorbed
more strongly than C3Hg. This result indicates that the surface is weakly polar and that specific (dipole—field and quadrupole—field gradient) contributions
to the adsorption potential alter the expected order slightly. This situation may also be due to chemisorbed oxygen species on the surface.
Fig. 11. Adsorption isotherms for hydrocarbons on activated coconut-shell carbon at 25°C (46). Q, Adsorption; A, desorption. To convert kPa to mm Hg,
multiply by 7.5.
Courtesy of Industrial and Engineering Chemistry.
Physical Properties. Physical properties of importance include particle size, density, volume fraction of intraparticle and extraparticle voids
when packed into adsorbent beds, strength, attrition resistance, and dustiness. These properties can be varied intentionally to tailor adsorbents to specific
appEcations (See Adsorption liquid separation; Aluminum compounds, aluminum oxide (alumna); Carbon, activated carbon; Ion exchange; Molecular
sieves; and Silicon compounds, synthetic inorganic silicates).
Deactivation. Adsorbent degradation by chemical attack or physical damage is not reversible. Acids or acid gases can react with adsorbents
with alkaline surface chemistry, eg, some zeolites, and cause loss of adsorption capacity. Other adsorbents, such as siEca gel, are sensitive to alkaEes. The
constant thermal expansion and contraction in temperature swing adsorption (TSA) processes can cause damage to the internal pore and/or crystal
structure. Activated alumina and siEca gel can be dehydrated by excessive temperatures. When water is present, hydrothermal cycling can cause explosive
steam release that physically damages some adsorbents. Some types of siEca gel are susceptible to breakup caused by water droplets; special
decrepitation-resistant grades are available.
Adsorption Processes
Kirk-Othmer Encyclopedia of Chemical Technology (4th Edition)
278
ADSORPTION, GAS SEPARATION
Voll
Adsorption processes are often identified by their method of regeneration. Temperature-swing adsorption (TSA) and pressure-swing adsorption (PSA) are
the most frequendy applied process cycles for gas separation. Purge-swing cycles and nonregenerative approaches are also applied to the separation of
gases. Special appEcations exist in the nuclear industry. Others take advantage of reactive sorption. Most adsorption processes use fixed beds, but some use
moving or fluidized beds.
TEMPERATURE SWING
A temperature-swing or thermal-swing adsorption (TSA) cycle is one in which desorption takes place at a temperature much higher than adsorption. The
principal application is for separations in which contaminants are present at low concentration, ie, for purification. The TSA cycles are characterized by low
residual loadings and high operating loadings. Figure 12 depicts the isotherms for the two temperatures of a TSA cycle. The available operating capacity is
the difference between the loadings X^ and X? These high adsorption capacities for low concentrations mean that cycle times are long, hours to days, for
reasonably sized beds. This long cycle time is fortunate, because packed beds of adsorbent respond slowly to changes in gas temperature. A purge and/or
vacuum removes the thermally desorbed components from the bed, and cooling returns the bed to adsorption condition. Systems in which species are
strongly adsorbed are especially suited to TSA. Such applications include drying, sweetening, CO2 removal, and pollution control.
Less-adsorbed
product (adsorbate
partial pressure = P2)
Feed (adsorbate
partial pressure = Px)
Fig. 12. Temperature-swing cycle (4). Loading X^ at and feed partial pressure P^; X~ at the higher T2 and the lower P2 needed in the product (1).
Principles. In a TSA cycle, two processes occur during regeneration, heating and purging. Heating must provide adequate thermal energy to
raise the adsorbate, adsorbent and adsorber temperature, desorb the adsorbate, and make up for heat losses. Regeneration is heating-limited (or
stoichiometric-limited) when transfer of energy to the system is limiting. EquiEbrium determines the maximum capacity of the purge gas to transfer the
desorbed material away. Regeneration is stripping-limited (or equiEbrium-limited) when transferring adsorbate away is limiting.
Heating occurs by either direct (external heat exchange to the purge gas) or, less commonly, indirect (heating elements, coils or panels, inside the
adsorber) contact of the adsorbent by the heating medium. Dhect heating is simpler and is invariably used for stripping-limited regeneration. Microwave
fields (47) and dielectric fields (48) are alternate methods for supplying indirect heating. The complexity of indirect heating limits its use to heating-limited
regeneration where purge gas is in short supply. Coils or panels can supply indirect cooling as weE. The use of steam for the regeneration of activated
carbon is a combination of thermal desorption and purge displacement; direct heating is suppEed by water adsorption.
Another process for thermal cycling is parametric pumping. In the direct mode of parametric pumping, a single adsorbent bed is indirectly heated
and cooled while the fluid feed is pumped forward and backward through the column from reservohs at each end. For a binary fluid, one component
concentrates in one reservoh and one in the other. In the recuperative mode of parametric pumping, the heating and cooling takes place outside the
adsorbent column.
Steps. Thermal-swing cycles have at least two steps, adsorption and heating. A cooling step is also normally used after the heating step. A
portion of the feed or product stream can be utilized for heating, or an independent fluid can be used. Easily condensable contaminants may be
regenerated with noncondensable gases and recovered by condensation. Water-immiscible solvents are stripped with steam, which may be condensed and
separated from the solvent by decantation. Fuel and/or ah may be used when the impurities are to be burned or incinerated.
The highest regeneration temperatures are the most efficient for desorption. However, heater cost, metallurgy, and the thermal stabiEty of the
adsorbent and the fluids must be considered. SiEca gel requires the lowest temperatures and the lowest amount of heat of any commercial adsorbent.
Activated carbons and aluminas can tolerate the highest temperatures. Although thermal-swing regeneration can be done at the same pressure as
adsorption, lowering the pressure can achieve better desorption and is often used; such cycles are actually a hybrid of PSA and TSA. The heating gas is
normally used for the cooling step. Rather than cooling the bed, adsorption can sometimes be started on a hot bed. If certain criteria are met (49), the
dynamic adsorption performance does not depend on cooling.
Flow Sheet. The most common processing scheme is a pah of fixed-bed adsorbers alternating between the adsorption step and the
regeneration steps. An example is given in Figure 12. However, the variations possible to achieve special needs are endless. The flow directions can be
varied. Single beds provide interrupted flow, but multiple beds can ensure constant flow. Beds can be configured in lead-trim, parallel trains, series
cool-heat, or closed-loop (1). Regeneration may even be ex situ rather than in situ.
The normal flow direction through a fixed bed is usually in a vertical direction. The mechanical complexities required for horizontal- or annular-flow
beds often outweigh the decrease in pressure drop achieved. Because allowable velocities for crushing exceed those for lifting, the cycle step with the
highest pressure drop should be downward. AU other flows can then be in the same direction as the limiting flow (cocurrent) or in the opposite direction
(countercurrent). Each combination of flow directions for heating and cooling produces a different residual of adsorbate (Fig. 13).
Kirk-Othmer Encyclopedia of Chemical Technology (4th Edition)
279
ADSORPTION, GAS SEPARATION
Voll
Flow direction Countercurrent heating
•<- Countercurrent cooling
Cocurrent heating
Cocurrent cooling -►
Countercurrent heating
Cocurrent cooling —►
Cocurrent heating —►
Countercurrent cooling
Residual loading at
end of heating step
Residual loading at
end of cooling step
Fig. 13. Shape of residual loading gradient (124). L is bed length.
Courtesy of Chemical Engineering.
Although most appEcations of fixed bed have multiple adsorber beds to treat continuous streams, batch operation using a single adsorber bed is an
alternative. For purification applications, where one vessel can contain enough adsorbent to provide treatment for days, weeks, or even months, the cost
savings and simplicity often justify the inconvenience of stopping adsorption treatment periodically for a short regeneration.
When the mass transfer zone is a major portion of an adsorbent bed, the equiEbrium capacity is poorly utilized. A lead—trim configuration uses the
adsorbent more fully. The feed flows successively through a lead bed and then a trim bed. The lead bed is nearly exhausted before it is taken out of service
to be regenerated. When a lead bed is removed from adsorption, the trim bed becomes the lead, and a fully regenerated bed becomes the new trim bed.
When large flows are to be treated, designing and building a single adsorber vessel large enough to treat the entire stream is not practical. Instead,
the feed flow is spEt equally between parallel beds and/or trains of adsorbers. This provides the additional advantage of a convenient method of turning
down the process to save on utiEties.
At the start of the cooling step, the adsorber vessel is a large heat sink containing valuable energy: the sum of all of the sensible heats of the
adsorbent, the vessel, and any internals. Using three adsorber beds—one on adsorption, one on heating, and one on cooling—the purge gas flows in series
first to cool a hot bed and then to heat a spent bed. Thus all of the heat from the bed being cooled is recovered.
Thermal energy can be conserved by using a thermal-pulse cycle. When desorption is heat-limited, only a short soak time at temperature completes
regeneration. The entire adsorbent bed need not be at desorption temperature before beginning the cooling step. Only a pulse of heating gas that contains
the heat of desorption is required to move through the bed, desorbing the adsorbate until it exhausts its thermal energy as it reaches the oudet. Because
temperature fronts spread as they move through packed beds, a small excess of heat is added to the stoichiometric quantity to ensure that the oudet
reaches the deshed level before being cooled.
When the gas available for regeneration is in short supply, the regeneration steps are often carried out in a closed loop. This recycle of the bed
effluent back to the inlet has the advantage of concentrating the impurity and making it easier to separate by condensation or other recovery means.
Heating is usuaHy accompEshed with a semiclosed loop which has a constant fresh gas makeup and a bleed to draw off the desorbed material. However,
contaminant is at a higher level than in an open loop and product purity is harder to achieve.
Drying. The single most common gas phase appEcation for TSA is drying. The natural gas, chemical, and cryogenics industries all use zeoEtes,
siEca gel, and activated alumina to dry streams. Adsorbents are even found in mufflers.
ZeoEtes, activated alumina, and siEca gel have all been used for drying of pipeline natural gas. Alumina and siEca gel have the advantage of having
higher equiEbrium capacity and of being more easily regenerated with waste level heat (50—52). However, the much lower dewpoint and longer life
attainable with 4A makes zeoEtes the predominant adsorbent. Special acid-resistant zeoEtes are used for natural gas containing large amounts of acid gases,
such as CO2 and H2S.
The low dewpoint that can be achieved with zeoEtes is especially important when drying feed streams to cryogenic processes to prevent freeze-up at
process temperatures. Natural gas is dried before Equefaction to Equefied natural gas (LNG), both in peak demand and in base load faciEties (53,54).
ZeoEtes have largely replaced siEca gel and activated alumina in drying natural gas for ethane recovery utilizing the cryogenic turboexpander process, and
for heEum recovery (54). The ah to be cryogenically distilled into N2, O2 and argon must be purified of both water and CO2. This purification is
accompEshed with 13X zeoEtes (53).
The 4A zeoEte, siEca gel, and activated alumina all find appEcations drying synthesis gas, inert gas, hydrocracker gas, rare gases, and reformer recycle
H2. Cracked gas before low temperature distillation for olefin production is a reactive stream. The ЗА or pore-closed 4A zeoEte size selectively adsorbs
water but excludes the hydrocarbons, thus preventing coking (52). This molecular sieving also prevents coadsorption of hydrocarbons which would
otherwise be lost during desorption with the water. Small pore zeoEtes are also appEed to the drying of ethylene, propylene, and acetylene as they are drawn
from salt cavern, or conventional, storage (54). When industrial gases containing Cl2, SO2 and HC1 are dried, acid-resistant zeoEtes are used.
A recendy developed drying appEcation for zeoEtes is the prevention of corrosion in mufflers (52,55). Internal corrosion in mufflers is caused
primarily by the condensation of water and acid as the system cools. A unique UOP zeoEte adsorption system takes advantage of the natural thermal
cycling of an automotive exhaust system to desorb the water and acid precursors.
Sweetening. Another significant purification appEcation area for adsorption is sweetening. Hydrogen sulfide, mercaptans, organic sulfides and
disulfides, and COS need to be removed to prevent corrosion and catalyst poisoning. They are to be found in H2, natural gas, deethanizer overhead, and
biogas. Often adsorption is attractive because it dries the stream as it sweetens.
In the sweetening of wellhead natural gas to prevent pipeline corrosion, 4A zeoEtes allow sulfur compound removal without CO2 removal (to
reduce shrinkage), or the removal of both to upgrade low thermal content gas. When minimizing the formation of COS during desulfurization is deskable,
calcium-exchanged zeoEtes are commonly used because they are less catalytically active for the reaction of CO2 with H2S to form COS and water. Natural
gas for steam—methane reforming in ammonia production must be sweetened to protect the sulfursensitive, low temperature shift catalyst. ZeoEtes are
better than activated carbon because mercaptans, COS, and organic sulfides are also removed (54). Many refinery H2 streams require H2S and water
removal by 4A and 5A zeoEtes to prevent poisoning of catalysts such as those in catalytic reformers.
Other Separations. Other TSA appEcations range from CO2 removal to hydrocarbon separations, and include removal of ah poEutants and
odors, and purification of streams containing HC1 and boron compounds. Because of thek high selectivity for CO2 and thek abiEty to dry concurrendy,
4A, 5A, and 13X zeoEtes are the predominant adsorbents for CO2 removal by temperature-swing processes. The ak fed to an ak separation plant must be
H2O- and CO2-free to prevent fouling of heat exchangers at cryogenic temperatures; 13X is typically used here. Another appEcation for 4A-type zeoEte is
for CO2 removal from baseload and peak-shaving natural gas Equefaction faciEties.
The removal of volatile organic compounds (VОС) from ak is most often accompEshed by TSA. Air streams needing treatment can be found in
most chemical and manufacturing plants, especially those using solvents. At concentrations from 500 to 15,000 ppm, recovery of the VOC from steam
used to regenerate activated carbon adsorbent thermally is economically justified. Concentrations above 15,000 ppm are typically in the explosive range and
Kirk-Othmer Encyclopedia of Chemical Technology (4th Edition)
280
ADSORPTION, GAS SEPARATION
Voll
require the use of inert gas rather than air for regeneration. Below about 500 ppm, recovery is not economically justifiable, but environmental concerns
often dictate adsorptive recovery followed by destruction. Activated carbon is the traditional adsorbent for these appEcations, which represent the second
largest use for gas-phase carbons. New forms of activated carbon, such as carbon fabrics (56) and adsorbent wheels (57), have been introduced to reduce
the airflow pressure drop, which can result in large utility consumptions (see Carbon, activated carbon).
A number of inorganic pollutants are removable by TSA processes. One of the major pollutants requiring removal is SO2 from flue gases and from
sulfuric acid plant tail gases. The Sulfacid and Hitachi fixed-bed processes, the Sumitomo and BF moving-bed processes, and the Westvaco fluidized-bed
process all use activated carbon adsorbents for proven SO2 removal (58). Zeolites with high acid resistance, such as mordenite and clinoptilolite, have
proven to be effective adsorbents for dry SO2 removal from sulfuric acid tail gas (59), and special zeolite adsorbents have been incorporated into the UOP
PURASIV S process for this application (54).
Zeolites have also proven applicable for removal of nitrogen oxides (NO ) from wet nitric acid plant tail gas (59) by the UOP PURASIV N process
(54). The removal of NO from flue gases can also be accomplished by adsorption. The Unitaka process utilizes activated carbon with a catalyst for
reaction of NO with ammonia, and activated carbon has been used to convert NO to NO2, which is removed by scrubbing (58). Mercury is another
pollutant that can be removed and recovered by TSA. Activated carbon impregnated with elemental sulfur is effective for removing Hg vapor from air and
other gas streams; the Hg can be recovered by ex situ thermal oxidation in a retort (60). The UOP PURASIV Hg process recovers Hg from chlor-alkali
plant vent streams using more conventional TSA regeneration (54). Mordenite and clinoptilolite zeolites are used to remove HC1 from Cl2, chlorinated
hydrocarbons, and reformer catalyst gas streams (61). Activated aluminas are also used for such applications, and for the adsorption of fluorine and
boron—fluorine compounds from alkylation (qv) processes (50).
PRESSURE SWING
A pressure-swing adsorption (PSA) cycle is one in which desorption takes place at a pressure much lower than adsorption. Its principal application is for
bulk separations where contaminants are present at high concentration. The PSA cycles are characterized by high residual loadings and low operating
loadings. Figure 14 shows the operating loading (Ai—A7) that derives from the partial pressure at feed conditions and the lower pressure P2 at the end of
desorption. These low adsorption capacities for high concentrations mean that cycle times must be short, seconds to minutes, for reasonably sized beds.
Fortunately, packed beds of adsorbent respond rapidly to changes in pressure. A purge usually removes the desorbed components from the bed, and the
bed is returned to adsorption condition by repressurization. Applications may require additional steps. Systems with weakly adsorbed species are especially
suited to PSA adsorption. The applications of PSA include drying, upgrading of H2 and fuel gases, and air separation. Several broad reviews of PSA have
been written (62—64).
Fig. 14. Pressure-swing cycle (1).
Principles. In a PSA cycle two processes occur during regeneration, depressurizing, and purging. Depressurization must provide adequate
reduction in the partial pressure of the adsorbates to allow desorption. Enough purge gas must flow through the adsorbent to transfer the desorbed
material away. Equilibrium determines the maximum capacity of the gas to accomplish this. These cycles operate at nearly constant temperature and require
no heating or cooling steps. They utilize the exothermic heat of adsorption remaining in the adsorbent to supply the endothermic heat of desorption.
Pressure-swing cycles are classified as PSA, VSA (vacuum-swing adsorption), PSPP (pressure-swing parametric pumping) or RPSA (rapid pressure-swing
adsorption). PSA swings between a high superatmospheric and a low superatmospheric pressure, and VSA swings from a superatmospheric pressure to a
sub atmospheric pressure. Otherwise, the principles involved are the same.
The other means of accomplishing pressure cycling of an adsorbent is parametric pumping, in which a single adsorbent bed is alternately pressurized
with forward flow and depressurized with backward flow through the column from reservoirs at each end. Like TSA parametric pumping, one component
concentrates in one reservoir and one in the other. As the name implies, pressure-swing parametric pumping embodies pressure changes that are more than
pressuring and depressurizing a bed of adsorbent. Significant pressure gradients occur in the bed, much as temperature gradients are imposed in TSA
parametric pumping. These gradients are especially critical to the way that RPSA cycles operate and result in much smaller adsorbent beds and simpler
Kirk-Othmer Encyclopedia of Chemical Technology (4th Edition)
281
ADSORPTION, GAS SEPARATION
Voll
processes (57).
In most applications of adsorption, the separation is carried out by adsorbing the more strongly adsorbed species from the less strongly adsorbed.
These separations are thus equiEbrium-limited. However, an adsorptive separation can also be based on a rate- or kinetically limited system (65). Slightly
larger molecules diffuse more slowly through a microporous adsorbent with properly selected pore diameter. Therefore, in a rapidly cycling process such as
PSA, smaller molecules can be preferentially adsorbed even in the absence of any equilibrium selectivity. Indeed rate-limited PSA has preferentially
adsorbed oxygen from air on 4A zeolite when the equiEbrium selectivity favors N2 adsorption (52).
Steps. A pressure-swing cycle has at least three steps: adsorption, blowdown, and repressurization. Although not always necessary, a purge step
is normally used. In finely tuned processes, cocurrent depressurization and pressure-equalization steps are frequendy added.
At the completion of adsorption, the less selectively adsorbed components have been recovered as product. However, a significant quantity of the
weakly adsorbed species are held up in the bed, especially in the void spaces. A cocurrent depressurization step reduces the bed pressure by allowing flow
out of the bed cocurrendy to feed flow and thus reduces the amount of product retained in the voids (holdup), improving product recovery, and increases
the concentration of the more strongly adsorbed components in the bed. The purity of the more selectively adsorbed species has been shown to depend
strongly on the cocurrent depressurization step for some appEcations (66). A cocurrent depressurization step is optional because a countercurrent one
always exists. Criteria have been developed to indicate when the use of both is justified (67).
None of the selectively adsorbed components is removed from the adsorption vessel until the countercurrent depressurization (blowdown) step.
During this step, the strongly adsorbed species are desorbed and recovered at the adsorption inlet of the bed. The reduction in pressure also reduces the
amount of gas in the bed. By extending the blowdown with a vacuum (ie, VSA), the productivity of the cycle can be greatly increased.
Additional stripping of the adsorbates from the adsorbent and purging of them from the voids is accompEshed by the purge step. This step can
occur concurrently with the end of the blowdown or be carried out afterward. This step is accompEshed with a flow of product into the product end to
provide alow residual of the selectively adsorbed components at the effluent end of the bed.
The repressurization step returns the adsorber to feed pressure and completes the steps of a PSA cycle. Pressurization is carried out with product
and/or feed. Pressurizing with product is done countercurrent to adsorption so that purging of the product end continues; indeed it may be merely a
continuation of the purge step but with the bed exit valve closed. Pressurizing with feed cocurrent to adsorption in effect begins adsorption without
producing any product.
Pressure equalization steps are used to conserve gas and compression energy. They are appEed to reduce the quantity of feed or product gas needed
to pressurize the beds. Portions of the effluent gas during depressurization, blowdown, and purge can be used for repressurization.
Flow Sheet. The most common processing scheme has two or three fixed-bed adsorbers alternating between the adsorption step and the
desorption steps. The simplest two-bed configuration is illustrated in Figure 14. However, the variations possible to achieve special separations are endless.
Single beds with external surge vessels provide continuous flow; multiple beds are used to accommodate additional steps. An example of the bed
sequencing needed for multiple steps in a four-bed PSA is shown in Figure 15. Beds can be configured in series or parallel to accompEsh coproduction.
Vessel
number
Adsorption EQI ▲ CD ▲ EQ2 ▲ CD ▼ Purge ▼ EQ2 ▼ EQI ▼ R ▼
CD ▼ Purge ▼ EQ2 ▼ EQI ▼ R ▼ Adsorption EQI ▲ CD ▲ EQ2 ▲
EQI ▲ CD ▲ EQ2 ▲ CD ▼ Purge ▼ EQ2 ▼ EQI ▼ R ▼ Adsorption
EQI ▼ R ▼ Adsorption EQI ▲ CD ▲ EQ2 ▲ CD ▼ Purge ▼ EQ2 ▼
Fig. 15. Four-bed PSA system cycle sequence chart (64). EQ, equalization; C D ▲, cocurrent depressurization; C D ▼, countercurrent depressurization; R,
repressurization; ▲, cocurrent flow; ▼, countercurrent flow. Courtesy of American Institute of Chemical Engineers.
The flow directions in a PSA process are fixed by the composition of the stream. The most common configuration is for adsorption to take place
up-flow. AH gases with compositions rich in adsorbate are introduced into the adsorption inlet end, and so effluent streams from the inlet end are rich in
adsorbate. Similarly, adsorbate-lean streams to be used for purging or repressurizing must flow into the product end.
Because RPSA is appEed to gain maximum product rate from minimum adsorbent, single beds are the norm. In such cycles where the steps take
only a few seconds, flows to and from the bed are discontinuous. Therefore, surge vessels are usuaHy used on feed and product streams to provide
uninterrupted flow. Some RPSA cycles incorporate delay steps unique to these processes. During these steps, the adsorbent bed is completely isolated; and
any pressure gradient is aHowed to dissipate (68). The UOP Polybed PSA system uses five to ten beds to maximize the recovery of the less selectively
adsorbed component and to extend the process to larger capacities (69).
Purifications. The major purification appEcations for PSA are for hydrogen, methane, and drying. One of the first commercial uses was for gas
drying in which the original two-bed Skarstrom cycle was used. This cycle uses adsorption, countercurrent blowdown, countercurrent purge, and cocurrent
repressurization to produce a dry air stream with less than 1 ppm H2O (70). About half of aH dryers of instrument air use a PSA cycle similar to this one,
most commonly using activated alumina or siEca gel (71). ZeoEtes are used to obtain the lowest possible dewpoints. Some appEcations for drying air do
not require a low level of H2O, but only a significant lowering of the dew point. The pneumatic compressor systems used in vehicle air-brakes are an
example; when a 10—30-К dew point depression is needed for higher discharge air temperatures in the presence of compressor oil, zeoEtes have been
demonstrated to have an advantage over activated alumina and siEca gel (72).
High purity H2 is needed for appEcations such as hydrogenation, hydrocracking, and ammonia and methanol production. As a significant source of
such gas, PSA is able to produce purities as high as 99.9999% using technologies such as the UOP Polybed approach (69). Most H 2 purification by PSA is
associated with steam reforming of natural gas and with ethylene-plant and refinery off-gas streams (62). Hydrogen is also available in coke-oven gas,
cracked ammonia, and coal-gasification gas. The contaminants that have to be removed by PSA include carbon oxides, N2, O2, Ar, NH3, CH4, and heavier
hydrocarbons. To remove these components, adsorbent beds are compounded of activated carbon, zeoEtes, and carbon molecular sieves.
Bulk Separations. Air separation, methane enrichment, and iso-/normal separations are the principal bulk separations for PSA. Others are the
recovery of CO and CO2.
The PSA process is used to separate air into N2 and O2. Many companies market systems for PSA O2; zeoEtes 5A, 13X, clinoptiloEte and
mordenite, and carbon molecular sieves are commonly used in PSA, VSA, and RPSA cycles. The product purity ranges from 85 to 95% (limited by the
argon, which remains with the O2). About two-thirds of the O2 produced is employed for electric furnace steel, with lesser amounts for waste water
treating and soEd waste and kilns (62). SmaHer production units are used for patients requiring respiratory inhalation therapy in the hospital and at home
(64) and for pilots on board aircraft (73). Enriched air, 25 to 55% O2, used to enhance combustion, chemical reactions, and ozone production can be
produced by tuning PSA processes (63). High purity, up to 99.99%, N2 is produced by PSA and VSA cycles with zeoEtes and carbon molecular sieves (74).
The major use for the N2 is inert blanketing, such as in metal heat-treating furnaces; smaH units are used to purge aircraft fuel tanks (52) and in the food
and beverage industry.
Kirk-Othmer Encyclopedia of Chemical Technology (4th Edition)
282
ADSORPTION, GAS SEPARATION
Voll
The upgrading of methane to natural gas pipeline quality is another significant PSA separation area. Methane is recovered from fermentation gases
of landfills and wastewater purification plants and from poor-quality natural gas wells and tertiary oil recovery when CO2 is the major bulk contaminant.
Fermentation gases are saturated with water and contain "garbage" components such as sulfur and halogen compounds, alkanes, and aromatics (75). These
impurities must first be removed by TSA using activated carbon or carbon molecular sieves. The CO2 is then selectively adsorbed in a PSA cycle using
either zeolites or silica gel in an equilibrium separation, or carbon molecular sieve in a kinetic-assisted equilibrium separation (76,77).
One version of the UOP IsoSiv process uses PSA to separate normal paraffins from branched and cyclic hydrocarbons in the C5 to C range.
Zeolite 5A is used because its pores can size-selectively adsorb straight-chain molecules while excluding branched and cyclic species. The normal
hydrocarbon fraction has better than 95% purity, and the higher octane isomer fraction contains less than 2% normal hydrocarbons (64).
PURGE SWING
A purge-swing adsorption cycle is one in which desorption takes place at the same temperature and total pressure as adsorption. Regeneration is
accomplished either by partial-pressure reduction by an inert gas purge or by adsorbate displacement by an adsorbable gas. Its major appEcation is for bulk
separations when contaminants are at high concentration. Like PSA, purge cycles are characterized by high residual loadings, low operating loadings, and
short cycle times (minutes). Mixtures of weakly adsorbed components are especially suited to purge-swing adsorption. Applications include the separation
of normal from branched and cyclic hydrocarbons, gasoline vapor recovery, and bulk drying of organics.
Principles. Purging must provide adequate reduction in the partial pressure of the adsorbates to allow desorption. With enough purge volume,
loadings as high as the loading in equilibrium with the feed partial pressure can be achieved, as shown in Figure 16. Reduction in partial pressure
operates analogously to the reduction in system pressure in PSA cycles. Equilibrium determines the maximum capacity of the gas to purge the adsorbate.
These cycles operate adiabatically at nearly constant inlet temperature and require no heating or cooling steps. As with PSA, purge processes utilize the
exothermic heat of adsorption remaining in the adsorbent to supply the endothermic heat of desorption. Purge cycles are divided into two categories, inert
purge and displacement purge. In inert-purge stripping, inert refers to the fact that the purge gas is not appreciably adsorbable at the cycle conditions. Inert
purging desorbs the adsorbate solely by partial pressure reduction.
Fig. 16. Inert-purge cycle (1).
In displacement-purge stripping, displacement refers to the displacing action of the purge gas caused by its ability to adsorb at the cycle conditions.
This competitive adsorption tends to desorb the adsorbate in addition to the partial pressure reduction of dilution. Displacement purging is not as
dependent on the heat of adsorption remaining on the adsorbent, because the adsorption of purge gas can release much or all of the energy needed to
desorb the adsorbate. The adsorbate must be more selectively adsorbed than the displacement purge so that it can desorb purge fluid during the
adsorption step. The displacement purge gas composition must be carefully selected, because it contaminates both the product stream and the recovered
adsorbate and requires distillation as illustrated in Figure 17. The displacement purge is more efficient for less selective adsorbate-adsorbent systems;
systems with high equilibrium loading of adsorbate require more purging (78).
Kirk-Othmer Encyclopedia of Chemical Technology (4th Edition)
283
ADSORPTION, GAS SEPARATION
Voll
Fig. 17. Displacement-purge cycle (1).
Steps. A purge-swing cycle usually has two steps, adsorption and purge. Sometimes, a cocurrent purge is added. After the adsorption step has
been completed and the less selectively adsorbed components have been recovered, an appreciable amount of product is still stored in the bed. A purge
cocurrent to feed can increase recovery by displacing the fluid held in the voids.
The more selectively adsorbed components are stripped from the adsorbent bed during the countercurrent purge step. By purging into the product
end of the bed, a lower residual loading of the selectively adsorbed species can be achieved in the portion of the adsorber that determines product quaEty.
Flow Sheet. Most purge-swing appEcations use two fixed-bed adsorbers to provide a continuous flow of feed and product (Fig. 16). Single
beds are used when the flow to be treated is intermittent or cycEc. Because the purge flow is invariably greater than that of adsorption, purge is carried out
in the down-flow direction to prevent bed lifting, and adsorption is up-flow.
Applications. Several purge-swing processes for the separation of C1Q—C18 iso- from normal paraffins have been commercialized: Exxon's
Ensorb, UOP's IsoSiv, Texaco Selective Finishing (TSF), Leuna Werke's Parex, and the Shell Process (52). AH of these processes take advantage of the
molecular size selectivity of 5A zeoEte, but vary in the purge fluid. Ammonia is used in a displacement-purge cycle in Ensorb. Normal paraffins or light
naphtha with a carbon number of two to four less than the feed stream are used for the displacement purge for TSF, Parex, and the SheH Process (79).
One version of UOP purge IsoSiv for C5 to C naphtha employs H2 in an inert-purge cycle (64). UOP also developed a similar process, OlefinSiv, for the
separation of isobutylene from normal butenes using a size-selective zeoEte with displacement purge (80).
Since 1971 aH U.S. automobile models must have canisters of activated carbon to control gasoline vapors. Any gasoline vapors from the carburetor
or the gas tank during running, from the tank during diurnal cycling, and from carburetor hot-soak losses are adsorbed by the carbon and held until they
can be regenerated. The vapors are desorbed by an inert purge of air and are drawn into the carburetor as fuel when the engine is running (81). This
gas-phase use for activated carbon is the third largest after solvent recovery and air purification.
Another use of inert-purge regeneration is UOP's Adsorptive Heat Recovery (AHR) drying system (82). The AHR system has been commercialized
for drying azeotropic ethanol to be blended with gasoline into "gasohol." The process uses a closed loop of N2 as the inert purge to desorb the water. The
AHR process can be economicaHy superior to azeotropic distfllation for drying feeds with as much as 20% H2O.
NONREGENERATIVE PROCESSES
Gas-phase adsorption can also be used when regenerating the adsorbent is not practical. Most of these appEcations are used where the faciEties to effect a
regeneration are not justified by the smaH amount of adsorbent in a single unit. Nonregenerative adsorbents are used in packaging, dual-pane windows,
odor removal, and toxic chemical protection.
Applications. SiEca gel is the adsorbent most commonly used as a desiccant in packaging. Activated carbon is used in packaging and storage to
adsorb other chemicals for preventing the tarnishing of silver, retarding the ripening or spoiling of fruits, "gettering" (scavenging) outgassed solvents from
electronic components, and removing odors.
Adsorbents are used in dual-pane windows to prevent fogging between the sealed panes that could result from the condensation of water or the
solvents used in the sealants (83). Synthetic zeoEtes (ЗА, 4A, 13X) or, less frequendy, blends of zeoEtes with siEca gel are instated in the spacing strips in
double-glazed windows to adsorb water during initial dry-down and any in-leakage and to adsorb organic solvents emitted from the sealants during their
cure. The adsorbent or mix of adsorbents appEed depends on the sealant system and filling gas used.
The largest use of activated carbon is for the purification of air streams. Much of this carbon is used to treat recirculated air in large occupied
enclosures, such as office buildings, apartments, and plants. The carbon is incorporated into thin filtedike frames to treat the large volumes of air with low
pressure drop. Odors are also removed from smaHer areas by activated carbon filters in kitchen hoods, air conditioners, and electronic air purifiers. On a
smaHer scale, gas masks containing carbon or carbon impregnated with promoters are used to protect wearers from odors and toxic chemicals. The
smaHest scale carbon filters are those used in cigarettes. In addition to protection from hazardous chemicals in industry, activated carbon gas masks can
protect against gas-warfare chemicals. Activated carbon fibers have been formed into fabrics for clothing to protect against vesicant and percutaneous
chemical vapors (84).
REACTIVE ADSORPTION
Although chemisorbents are not used as extensively as physical adsorbents, a number of commerciaHy significant processes employ chemisorption for gas
purification.
Iron Sponge. An old method for removal of sulfur compounds involves contacting gases containing H2S and H2O with a- or v-ferric oxide
monohydrates at approximately 38°C to adsorb the sulfur in the form of ferric sulfide, foHowed by periodic reoxidation of the surface to form elemental
sulfur and to "revivify" the ferric oxides (85). The iron sponge is reused in this cycle until buildup of sulfur in its pores reduces its effectiveness and it is
replaced with fresh adsorbent. The process is most efficient when the treated gases contain oxygen to aHow continuous revivification. Spent adsorbents
may be regenerated, eg, by oxidation of the sulfur to SO2 to be fed to a sulfuric acid plant or by solvent extraction with carbon disulfide, and reused.
Mercury Removal. Trace amounts of mercury found in natural gas in some parts of the world are known to cause significant pinhole
corrosion damage to aluminum heat exchanger surfaces in cryogenic coldboxes upstream of Equefied natural gas LNG plants (86). Mercury can be
removed from such streams, and other industrial gases, down to low concentrations by treatment in an ex situ TSA regenerative process using an activated
carbon adsorbent containing sulfur, and aHowing reactions involving the formation of mercuric sulfide to remove mercury from the gas. Alternatively, the
mercury can be removed by a newly developed adsorbent that may be employed in either nonregenerative or TSA regenerative process cycles (87).
Nuclear Waste Management. Separation of radioactive wastes provides a number of relatively smaH scale but vitaHy important uses of
gas-phase purification appEcations of adsorption. Such appEcations often require extremely high degrees of purification because of the high toxicity of
Kirk-Othmer Encyclopedia of Chemical Technology (4th Edition)
284
ADSORPTION, GAS SEPARATION
Voll
many radioactive elements.
Delay for Decay. Nuclear power plants generate radioactive xenon and krypton as products of the fission reactions. Although these products
are trapped inside the fuel elements, portions can leak out into the coolant (through fuel cladding defects) and can be released to the atmosphere with other
gases through an air ejector at the main condenser.
To prevent such release, off gases are treated in Charcoal Delay Systems, which delay the release of xenon and krypton, and other radioactive gases,
such as iodine and methyl iodide, until sufficient time has elapsed for the short-lived radioactivity to decay. The delay time is increased by increasing the
mass of adsorbent and by lowering the temperature and humidity; for a boiling water reactor (BWR), a typical system containing 211 of activated carbon
operated at 255 K, at 500 К dewpoint, and 101 kPa (15 psia) would provide about 42 days holdup for xenon and 1.8 days holdup for krypton (88).
Humidity reduction is typically provided by a combination of a cooler-condenser and a molecular sieve adsorbent bed.
If the spent fuel is processed in a nuclear fuel reprocessing plant, the radioactive iodine species (elemental iodine and methyl iodide) trapped in the
spent fuel elements are ultimately released into dissolver off gases. The radioactive iodine may then be captured by chemisorption on molecular sieve
zeolites containing silver (89).
Other Applications. Many appEcations of adsorption involving radioactive compounds simply parallel similar applications involving the same
compounds in nonradio active forms, eg, radioactive carbon-14, or deuterium- or tritium-containing versions of CO2, H2O, hydrocarbons. For example,
molecular sieve zeolites are commonly employed for these separations, just as for the corresponding nonradio active uses.
MOVING AND FLUIDIZED BEDS
Most adsorption systems use stationary-bed adsorbers. However, efforts have been made over the years to develop moving-bed adsorption processes in
which the adsorbent is moved from an adsorption chamber to another chamber for regeneration, with countercurrent contacting of gases with the
adsorbents in each chamber. Union Oil's Hypersorption Process (90) is an example. However, this process proved uneconomical, primarily because of
excessive losses resulting from adsorbent attrition.
The commercialization by Kureha Chemical Co. of Japan of a new, highly attrition-resistant, activated-carbon adsorbent as Beaded Activated
Carbon (ВАС) allowed development of a process employing fluidized-bed adsorption and moving-bed desorption for removal of volatile organic carbon
compounds from air. The process has been marketed as GASTAK in Japan and as PURASIV HR (91) in the United States, and is now marketed as
SOLD ACS by Daikin Industries, Ltd.
The discovery (92) that the graphite coating of molecular sieves can dramatically improve their attrition resistance without significantly impairing
adsorption performance should allow the extension of moving-bed technology to bulk gas separations (93).
Design Methods
Design techniques for gas-phase adsorption range from empirical to theoretical. Methods have been developed for equilibrium, for mass transfer, and for
combined dynamic performance. Approaches are available for the regeneration methods of heating, purging, steaming, and pressure swing. Several broad
reviews have been published on analytical equations describing adsorption (94,95), of experimental adsorption equilibrium and kinetic data (96), on
theoretical models for adsorption processes (97,98), and on adsorption design considerations (1).
Adsorption. In the design of the adsorption step of gas-phase processes, two phenomena must be considered, equilibrium and mass transfer.
Sometimes adsorption equilibrium can be regarded as that of a single component, but more often several components and their interactions must be
accounted for. Design techniques for each phenomenon exist as well as some combined models for dynamic performance.
Equilibrium. Among the aspects of adsorption, equilibrium is the most studied and published. Many different adsorption equilibrium
equations are used for the gas phase; the more important have been presented (see section on Isotherm Models). Equally important is the adsorbed phase
mixing rule that is used with these other models to predict multicomponent behavior.
Many simple systems that could be expected to form ideal liquid mixtures are reasonably predicted by extending pure-species adsorption equilibrium
data to a multicomponent equation. The potential theory has been extended to binary mixtures of several hydrocarbons on activated carbon by assuming
an ideal mixture (99) and to hydrocarbons on activated carbon and carbon molecular sieves, and to O2 and N2 on 5A and 10X zeolites (100). Mixture
isotherms predicted by IAST agree with experimental data for methane + ethane and for ethylene + CO2 on activated carbon, and for CO + O2 and for
propane + propylene on silica gel (36). A statistical thermodynamic model has been successfully applied to equilibrium isotherms of several nonpolar
species on 5A zeolite, to predict multicomponent sorption equilibria from the Henry constants for the pure components (26). A set of equations that
incorporate surface heterogeneity into the IAST model provides a means for predicting multicomponent equilibria, but the agreement is only good up to
50% surface saturation (9).
For most models of adsorptive equilibrium, however, the coefficients derived from pure species are not adequate to predict multicomponent
equilibrium for nonideal mixtures. Fitting the systems ethane + ethylene Apropane on 5A zeolite and H2S A CO2 on H-mordenite required using binary
parameters with the IAST or the real adsorbed solution theory models (101). A coalescing factor applied to the potential theory did collapse all isotherms
to a single curve for activated carbon, zeolites, and silica gel. A binary interaction parameter that is a function of the coalescing factor was needed to gain
agreement with binary data (102). For the multicomponent system of H2, CO, CH4, CO2, and H2S on activated carbon, an interaction parameter was
required in the extended Langmuir equation to predict multicomponent equilibrium (103). Cross-correlation coefficients were necessary to apply a statistical
model to three nonideal ternary zeolite systems (104). An activity coefficient whose composition dependence is described by the Wilson equation has been
added to the vacancy solution model (VSM) to fit data for hydrocarbons on activated carbon and O2 A N2 on 10X zeolite (37). Activity coefficients of the
adsorbate-adsorbate interactions or treatment of the surface as heterogeneous are correlative methods that allow extension of the IAST to binary
adsorption (10).
Mass Transfer. The degree of approach to equilibrium that can be achieved in adsorption is determined by the mass-transfer rates. One useful
design concept is the mass-transfer zone (MTZ), an extension of the ion-exchange zone method (105). Figure 18b is a depiction of the adsorbate loading
in a fixed bed during adsorption. The ordinate is loading (X) and the abscissa is distance (L) from the inlet of the bed. Between the inlet and the exhaustion
point (L ), the loading is in equilibrium with the feed gas, and this section is called the equilibrium section. From the breakthrough point (L^) to the oudet
of the bed, the adsorbate loading is still at the residual loading level and is unused bed. Mass transfer between the gas and the adsorbent is occurring
between the breakthrough and exhaustion points, and so this zone is called the mass-transfer zone (MTZ). The length of the bed, E to Ee, is called the
mass-transfer zone length (MTZL). The MTZL is usually correlated to flow rate or flow velocity (106).
Kirk-Othmer Encyclopedia of Chemical Technology (4th Edition)
285
ADSORPTION, GAS SEPARATION
Voll
Time
(a)
Bed length
(b)
Fig. 18. (a) Time trace of adsorbate composition in an adsorber effluent during adsorption, (b) Adsorbate loading along the flow axis of an adsorber during
adsorption (1).
Most dynamic adsorption data are obtained in the form of oudet concentrations as a function of time as shown in Figure 18a. The area iebai
measures the removal of the adsorbate, as would the stoichiometric area idcai, and is used to calculate equilibrium loading. For constant pattern adsorption,
the breakthrough time (®b), and the stoichiometric time (®s), are used to calculate LUB as (1 — Ob/Qs )Lbed (107). This LUB concept is commonly used
for drying and desulfurization design in the natural gas industry and for air prepurification before cryogenic distillation.
Another way of subdividing the bed is illustrated in Figure 18b. If the mass-transfer resistance were negligible, the MTZ would become a square or
stoichiometric front along the line dsc. The area febgf represents used adsorbent loading, while the area ehbe between the potential loading and the actual
loading curve eb is unused. By material balance, the area fdcgf up to the stoichiometric front would also represent the used capacity. Therefore, areas febgf
and fdegf are equal. This portion of the bed up to the stoichiometric point, s, is called the weight of equivalent equiEbrium section (WES). The rest of the
adsorbent from the stoichiometric point to the breakthrough point is termed the weight of unused bed (WUB), because it is equivalent to a bed with no
usable capacity in the stoichiometric interpretation. Adsorption beds can thus be sized by combining a WTZS calculated from equiEbrium data and a WTJB
derived from kinetic data.
Dynamic Performance. Most models do not attempt to separate the equiEbrium behavior from the mass-transfer behavior. Rather they treat
adsorption as one dynamic process with an overall dynamic response of the adsorbent bed to the feed stream. Although numerical solutions can be
attempted for the rigorous partial differential equations, simplifying assumptions are often made to yield more manageable calculating techniques.
The J-function is a definite integral of an expression including Io, the modified Bessel function of the first kind. J-function curves use stoichiometric
time and the number of theoretical stages as the two parameters to fit breakthrough curves and extend to other conditions. These curves have been
approximated for use on PC microcomputers (108). A phenomenological model requires the determination of two parameters, a transfer coefficient, and a
linear isotherm constant, from a complete breakthrough curve. The solution to the model is in an infinite series form, which is calculable by a hand-held
calculator or personal computer (109). Another method separates the equiEbrium from the kinetic effects by constructing effective equiEbrium curves.
Because the solution to the model involves nonlinear algebraic or differential equations, graphs caked solution charts are used to predict breakthrough
fronts (110). Theoretical stages form the essence of the discrete cell model graphical procedures, which are appEed to flat isotherms and incorporate pore
diffusivity and axial dispersion (98). Another solution technique is the use of fast Fourier transforms. Linear isotherms are required, but their appEcabiEty
for predicting breakthrough curves has been demonstrated for isothermal and nonisothermal adsorbers (111). Another model, with a solution in infinite
series form, incorporates separate mass-transfer coefficients for external film, macropore, and micropore resistances (112). Techniques have also been
developed to predict breakthrough from fluidized beds. The behavior of organic solvents adsorbed from air on activated carbon was shown to exhibit
breakthrough times that can be correlated to the adsorption capacity and the amount of bed expansion (113).
Some specific design methods have been developed for particular appEcations. Several procedures have been pubEshed for the design of gas dryers.
The J-function has been appEed to siEca gel dryers after a correlated correction factor accounted for the nonisothermaEty (114). In other work on drying
with activated alumina and siEca gel, constant-pattern LUBs were shown appEcable for designs at H2O contents of less than 0.003 kg/kg air (115).
EquiEbrium and kinetic parameters for H2O on activated alumina were determined for a more rigorous nonisothermal model that predicted adiabatic
behavior (116). Breakthrough times for several organic vapors on activated carbon respirator cartridges have been found to be predictable by using a theory
of statistical moments. In one study, equiEbrium data was correlated by the Potential Theory and breakthrough was calculated using the normal probabiEty
distribution curve (117). In another, the equiEbrium data was represented by a FreundEch equation (118). For heavy hydrocarbon recovery from natural gas
on siEca gel, the equiEbrium data were fit to a FreundEch isotherm and the breakthrough composition was found to have a power dependence on the
extent of adsorptive saturation of the adsorbent (111). A WTJB design approach was found to predict breakthrough for several organics on activated
carbon using a Potential Theory equiEbrium curve (119). Correlations of equiEbrium capacity and WTJB were also found appEcable in the removal of H2S
from natural gas using 5A zeoEte (120).
Regeneration. In recent years, considerable effort has been expended to better understand and quantify the process of regeneration. Methods
are available to predict thermal, purge, and steaming requirements. Models are available to simulate all of the regeneration types, temperature, pressure, and
purge swings.
Thermal Requirements. Alien a temperature-swing cycle is heating limited, the regeneration design is only concerned with transferring
energy to the system. Charts for isothermal, linear-isotherm adsorption that were derived by Hougen and MarshaH (121) from earlier work on heat transfer
from a gas to fixed beds (122) can be reappEed to heat transfer for heating-limited regeneration when the heat of adsorption is negligible (123). This
Kirk-Othmer Encyclopedia of Chemical Technology (4th Edition)
286
ADSORPTION, GAS SEPARATION
Voll
approach has been expanded to include both a correction of one dimensionless time per dimensionless bed length for heat losses and another correction
particular to the H2O—4A zeolite system studied (124). Because cooling is a heating-limited step, it can be calculated by the modified Hougen and Marshall
method. As mentioned in the discussion of thermal swing, the cooling step can be performed under some process conditions by starting adsorption with a
hot adsorbent; performance is not affected.
Purge Requirements. The amount of purge gas needed in stripping-limited regeneration is similar to that for purge regeneration, but it
differs primarily in the temperature at which the isothermal desorption occurs. For a pressure-swing process, the theoretical minimum volumetric
purge-to-feed ratio is the ratio of the purge pressure to the feed pressure (123), and one model shows the optimum ratio to be the minimum purge volume
that can be used with the given cyclic steady-state conditions (125). For a thermal-swing process, the minimum purge-to-adsorbent ratio is the ratio of the
heat capacity of the solid to that of the gas (126). Specific design purge data have been published for purge-swing activated carbon automotive evaporative
emissions control (81) and for pressure-swing drying of pneumatic system air (72). The pneumatic system process exhibits an optimum purge ratio for
maximizing the attainable dewpoint depression. An isothermal purge-swing model that uses Langmuir equilibrium to simulate adsorbent performance has
been presented (127).
Steaming Requirements. The steaming of fixed beds of activated carbon is a combination of thermal swing and displacement purge swing.
The exothermic heat released when the water adsorbs from the vapor phase is much higher than is possible with heated gas purging. This cycle has been
successfully modeled by equiEbrium theory (128).
Temperature Swing. Several fairly comprehensive reviews of thermal-swing adsorption models are found in the Eterature (96,97,129,130).
Many of these models have been used to carry out parametric analyses with a goal of energy minimization. A nonisothermal model for single components
using equiEbrium theory demonstrated that efficiency improves with increased purge contact time and high heat capacity purge gas but is minimally
affected by initial bed loading (131), and the model defined conditions under which the desorption can be continued with a cold stream without additional
overall purge gas. That work also introduced the concept that minimum thermal energy is required at the characteristic temperature, that temperature at
which the slope of the equiEbrium isotherm is equal to the ratio of the heat capacity at the adsorbent to that of the purge gas. A nonequiEbrium,
mechanistic model with a multicomponent VSM model of equiEbrium (132) and a nonequiEbrium nonadiabatic computer model with a Langmuir-like
isotherm (130) reached similar conclusions on optimization. Another nonequiEbrium nonadiabatic computer model with an Antoine equation isotherm
was used with supporting data to demonstrate that significant energy can be saved by proper timing of the cooling step (133). Most modeling has assumed
that the purge gas is clean even though solvent recovery processes use a recirculated stream when an inert purge gas is employed. Using the method of
characteristics and a FreundEch isotherm, an equiEbrium theory modeled the incorporation of closed-loop heating and cooling steps (134).
Pressure Swing. Design equations have been developed to predict temperature rise, minimum bed length to retain the heat front, minimum
purge rate, and effluent composition (135). A nonequiEbrium, nonisothermal simulation program with a FreundEch isotherm equation was found to agree
with data for drying with siEca gel (136). A somewhat simpler isothermal model using an isotherm approximated by two straight lines successfully
calculated the volumetric purge-to-feed ratio needed to achieve varying product dryness using siEca gel (137). An adiabatic equiEbrium model with a
Langmuir isotherm was used to study the blowdown step of a cycle removing CO2 on activated carbon and 5A zeoEte (138). Changing to an isothermal
assumption introduced significant errors into the results. The countercurrent pressurization step was investigated with an isothermal equiEbrium model
using a Langmuir isotherm for O2 production from air with 5A zeoEte (139). The model predicted the dependence of O2 concentration on countercurrent
pressure and was used to study other parameters. An isothermal model with linear isotherms and component-specific pore diffusivity was used and
compared to data for the kinetic-limited separation of air by RS-10 zeoEte (140). The simulations agreed well with the experimental parametric studies of
time and pressure of feed, blowdown, purge, and pressurization. An equiEbrium model was formulated to simulate RPSA using a FreundEch isotherm for
separation of N2 and CH4 (141). Pressure responses, flow rates, and compositions compared favorably as a function of feed pressure, cycle frequency, and
product rate. A nonequiEbrium, nonisothermal model for RPSA was developed using a linear isotherm and Darcy's law for pressure drop (142). The model
predicted performance in agreement with previous data (57) for air separation on 5A zeoEte.
Pressure Drop. The prediction of pressure drop in fixed beds of adsorbent particles is important. When the pressure loss is too high, cosdy
compression may be increased, adsorbent may be fluidized and subject to attrition, or the excessive force may crush the particles. As discussed previously,
RPSA reEes on pressure drop for separation. Because of the cycEc nature of adsorption processes, pressure drop must be calculated for each of the steps of
the cycle. The most commonly used pressure drop equations for fixed beds of adsorbent are those of Ergun (143), Leva (144), and Brownell and
co-workers (145). Each of these correlations uses a particle Reynolds number (Re = Dp G//i) and friction factor (f) to calculate the pressure drop (AP) per
unit length (E) by the equation
AF f'G2
L ^gcDpp
where Г) is the particle diameter, G the mass flux, Ц the gas viscosity, and p the gas density. The methods differ in their definition of Г) and f. For up-flow
in fixed-bed adsorbers, fluidization occurs when the pressure drop just balances the weight, corrected by any buoyancy:
_ (! - e) (ps - P) 9
L gc
where ps is the density of the soEd. For down-flow in packed beds, the potential for crushing the adsorbent must be checked. Two forces act to crush the
particles, pressure drop and the weight of the bed. The sum of these two (AF + (1 — £)psL) should be kept less than that which is known to cause
adsorbent damage.
Future Directions
Advances in fundamental knowledge of adsorption equiEbrium and mass transfer will enable further optimization of the performance of existing adsorbent
types. Continuing discoveries of new molecular sieve materials will also provide adsorbents with new combinations of useful properties. New adsorbents
and adsorption processes will be developed to provide needed improvements in pollution control, energy conservation, and the separation of high value
chemicals. New process cycles and new hybrid processes linking adsorption with other unit operations will continue to be developed.
Fundamentals. Marked improvements in the prediction of multicomponent equiEbria from single-component data will be achieved by
developing more reaEstic theoretical models that provide for nonideal adsorbate phases and heterogeneities of surface energetics and geometries, and that
allow for the effect of adsorbates on adsorbent properties. Molecular modeling and molecular-dynamic simulations of adsorption phenomena on high
speed computers will improve dramatically over the next 5 to 10 years. These improvements will be driven by the need to better predict multicomponent
adsorption behavior and to develop better tools for the design of adsorbents with desired properties. Improvements in the understanding of mass-transfer
rate processes in adsorption will allow the development of new separation processes based on differences in the relative rates of adsorption.
New Adsorbent Materials. SiEcaEte and other hydrophobic molecular sieves, the new family of A1PO4 molecular sieves, and steadily
increasing famiEes of other new molecular sieves (including structures with much larger pores than those now commercially available), as well as new
carbon molecular sieves and pillared interlayer clays (PILCS), will become more available for commercial appEcations, including adsorption. Adsorbents
with enhanced performance, both highly selective physical adsorbents and easily regenerated, weak chemisorbents will be developed, as will new
rate-selective adsorbents.
Process Concepts. Hybrid systems involving gas-phase adsorption coupled with catalytic processes and with other separations processes
(especially distillation and membrane systems) will be developed to take advantage of the unique features of each. The roles of adsorption systems will be
to efficiendy achieve very high degrees of purification; to lower fouEng contaminant concentrations to very low levels in front of membrane and other
separations processes; or to provide unique separations of azeotropes, close-boiling isomers, and temperature-sensitive or reactive compounds.
Applications. Both industrial emissions reduction and indoor air-pollution abatement uses will grow. For example, the development of
adsorbents with higher capacity for removal of radon from humid air could allow the development of a one-bed, delay-for-decay system in which radon
adsorbs, decays to lead, and is precipitated onto the adsorbent.
Kirk-Othmer Encyclopedia of Chemical Technology (4th Edition)
287
ADSORPTION, GAS SEPARATION
Voll
Many existing applications involve small adsorption systems for home and automobile applications, eg, refrigerant drying in automobile air
conditioners, dual-pane window desiccants, medical oxygen systems, and muffler corrosion protection. Such small adsorption systems will continue to be
developed for new uses in indoor air pollution and odor abatement and for the enhancement of the performance of other equipment and appliances. For
example, adsorption-based control of the composition of air in refrigerators can provide improvements in the storage of fruits and vegetables.
Design Methods. Improvements in the ability to predict multicomponent equilibrium and mass-transfer rate performance will allow
significant improvements in the design of new adsorption systems and in the energy efficiency of existing systems.
Computer Systems. Improved "smart" control systems based on new computer capabilities (microprocessors, artificial intelligence, expert
systems) will be used increasingly in adsorption systems to provide more efficient operation. For example, the adjustment of the adsorption—regeneration
cycle to account for changing feed compositions and flow rates can significandy reduce energy consumption by carrying out regenerations only when
needed. Enhanced computer capabilities will also allow coupling of more sophisticated equiEbrium models with more exact models for adsorption
dynamics to provide improved design tools.
BIBLIOGRAPHY
"Adsorptive Separation, Gases" in ECT 3rd ed., Vol. 1, pp. 544—581, by D. B. Broughton, UOP Process Division, UOP Inc.
1. G. E. Keller, II, R. A. Anderson, and С. M. Yon, in R. W. Rousseau, ed., Handbook of Separation Process Technology, John Wiley & Sons, Inc., New
York, 1987, 644-696.
2. J. O. Hkschfelder, C. F. Curtiss, and R. B. Bkd, Molecular Theory of Gases and Eiquids,)A\n Wiley & Sons, Inc., New York, 1954, p. 215, 949, 1110.
3. R. M. Barrer and D. E. W. Vaughan,/. Phys. Chem. Solids 32, 731 (1971).
4. R. M. Barrer, Zeolites and Clay Minerals as Adsorbents and Catalysts, Academic Press, London, 1978, p. 164,174, 185.
5. D. W. Breck and J. V. Smith, Sci. Am., 8 (Jan. 1959).
6. Data from Union Carbide Molecular Sieves, UOP, Tarrytown, N.Y.
7. W. A. Steele, "The Physical Adsorption of Gases on SoHds," Adv. Colloid Inte face Sci. 1, 3—78 (1967). (Review with 360 refs.).
8. D. M. Ruthven, Principles of Adsorption and Adsorption Processes, John Wiley & Sons, Inc., New York, 1984, Chapt. 3, 4, p. 108.
9. A. L. Myers in A. L. Myers and G. Belfort, eds., fundamentals of Adsorption, Engineering Foundation, New York, 1984, pp. 365—381.
10. A. L. Myers in A. I. Liapis, ed., fundamentals of Adsorption, Engineering Foundation, New York, 1987, pp. 3—25.
11. A. L. Myers, NATO AST Ser, Ser. E, 158 (Adsorpt. Sci. Technol.), 15—36 (1989).
12. D. P. Valenzuela and A. L. Myers, Adsorption Equilibrium Data Handbook, Prentice Hall, Engelwood Cliffs, N.J., 1989.
13. D. P. Valenzuela and A. L. Myers, Sep. Purif. Methods 13(2), 153—183 (1984).
14. O. Talu and A. L. Myers, AIChE J. 34, 1887-1893 (1988).
15. Ibid., 1931-1932 (1988).
16. R. T. Yang, Gas Separation by Adsorption Processes, Butterworths, Boston, 1987, p. 86.
17. С. M. Yon and P. H. Tumock, AIChE Symp. Ser. 67(117), 75 (1971).
18. R. T. Maurer in J. R. Katzer, ed., Molecular Sieves—II (ACS Symp. Ser. 40) American Chemical Society, Washington, D.C., 1977, p. 379.
19. I. I .aiigiiiuir, /. M//7. Chem. Soc. 40, 1361 (1918).
20. M. Volmer, Z Phys. Chem. 115, 253 (1925).
21. R. H. Fowler and E. A. Guggenheim, StatisticalThermodynamics, Cambridge University Press, Cambridge, 1939.
22. T. L. Hill, Introduction to StatisticalThermodynamics, Addison-Wesley, Reading, Mass., 1960.
23. V. A. Bakaev, Dokl. Akad. Nauk SSSR 167, 369 (1967).
24. L. Riekert, Adv. Catal. 21, 287 (1970).
25. P. Brauer, A. Lopatkin, and G. Ph. Stepanez in E. M. Flanigen and L. B. Sand, eds., Molecular Sieve Zeolites, Adv. in Chem 102, American Chemical
Society, Washington, D.C., 1971, p. 97.
26. D. M. Ruthven, K. F. LoughEn, and K. A. Holborrow, Chem. Eng. Sci. 28, 701 (1973).
27. D. M. Ruthven, Nat. Phys. Sci. 232(29), 10 (1971).
28. Ref. 8,p. 75ff.
29. M. M. Dubinin and L. V. Radushkevich, Dokl. Akad. Nauk SSSR, Ser. Khim. 55, 331 (1947).
30. M. M. Dubinin and V. A. Astakhov, lyv. Akad. Nauk. SSSR, Ser. Khim. 71, 5 (1971).
31. C. J. Radke and J. M. Prausnitz, Ind. Eng. Chem. fundam. 11, 445 (1972); MRVE J. 18, 761 (1972).
32. J. Toth,Zk/<?. Chim. Acad. Sci. Hung. 69, 311 (1971).
33. S. Brunauer, P. H. Emmett, and E. Teller,/. Am. Chem. Soc. 60, 309 (1938).
34. E. C. Markham and A. F. Benton,/ Am. Chem. Soc. 53, 497 (1931).
35. R. Sips,/ Chem. Phys. 16, 490 (1948).
36. A. L. Myers and J. M. Prausnitz, AIChE J. 11, 121 (1965).
37. S. Suwanayuen and R. P. Danner, AIChE J. 26, 68, 76 (1980).
38. T. W. Cochran, R. L. Kabel, and R. P. Danner, AIChE J. 31, 268 (1985).
39. A. Kohl and F. Riesenfeld, Gas Purification, 4th ed., Gulf PubEshing Co., Houston, Tex., 1985, p. 651.
40. K. S. W. Sing and co-workers, Pure Appl. Chem. 57, 603 (1985).
41. D. W. Breck, Zeolite Molecular Sieves—Structure, Chemistry, and Use, John Wiley & Sons, Inc., New York, 1974.
42. R. C. Bans al, J.-B. Donnet, and F. StoeckE, Active Carbon, Marcel Dekker, New York, 1988, p. ix.
43. E. M. Flanigen and co-workers, Nature (Eondon) 271, 512 (1978).
44. E. M. Flanigen and R. L. Patton, UOP, Tarrytown, N.Y., private communication.
45. R. C. Bans al, T. L. Dhami, and S. Parkash, Carbon 16, 389 (1978).
46. W. K. Lewis, E. R. Gilliland, B. Chertow, and W. P. Cadogan, Ind. Eng. Chem. 42, 1326 (1950).
47. M. Benchanaa, M. Lallemant, M. H. Simonet-Grange, and G. Bertrand, Thermochim. Acta. 152, 43—51 (1989).
48. H. R. Burkholder, G. E. Fanslow, and D. D. Bluhm, Ind. Eng. Chem. Tundam. 25, 414—416 (1986).
49. D. Basmadjian, Can. J. Chem. Eng. 53, 234—238 (1975).
50. B. Crittenden, Chem. Eng. 452, 21—24 (1988).
51. К. P. Goodboy and H. L. Fleming, Chem. Eng. Progr. 80, 63—68 (1984).
52. D. M. Ruthven, Chem. Eng. Progr. 84, 42—50 (1988).
53. H. L. Brooking and D. C. Walton, Chem. Eng. 257, 13-17 (1972).
54. R. A. Anderson in ref. 18, pp. 637—649.
55. S. R. Dunne, Automotive Corrosion and Prevention Conf. Proc. Society of Automotive Engineers, Warrendale, Pa., 1989,165—173.
56. R. E. Kens on and J. F. Jackson, Prepared Paper, Ah PoEution Control Association, Annual Mtg., 1988.
57. G. E. Keller, II, and R. J. Jones in W. H. Flank, ed.., Adsorption and Ion Exchange with Synthetic Zeolites, Am. Chem. Soc. Symp. Ser. 135, American
Chemical Society, Washington, D.C., 1980, pp. 275—286.
58. H. Juentgen, Carbon 15, 273-283 (1977).
Kirk-Othmer Encyclopedia of Chemical Technology (4th Edition)
288
ADSORPTION, GAS SEPARATION
Voll
59. J. R. Kiovsky, P. B. Koradia, and D. S. Hook, Chem. Eng. Progr. 72, 98—103 (1976).
60. W. D. Lovett and F. T. Cunniff, Chem. Eng. Progr. 70, 43—47 (1974).
61. A. Dyer, An Introduction to Zeolite Molecular John Wiley & Sons, Inc., New York, 1988, 102—105.
62. J. R. Martin, C. F. Gotzmann, F. Notaro, and H. A. Stewart, Adv. Cryog. Eng 31, 1071—1086 (1986).
63. S. Sircar in A. E. Rodrigues, M. D. LeVan, and D. Tondeur, eAs., Adsorption: Science andTechnology, Kluwer Academic Publishers, Dordrecht,
Nethedands, 1988, 285-321.
64. R. T. Cassidy and E. S. Holmes, AIChE Symp. Ser. 80, 68—75 (1984).
65. Z. J. Pan, R. T. Yang, and J. A. Ritter in G. E. Keller, II, and R. T. Yang, eds., New Directions in Sorption Technology Butterworths, Boston, 1988.
66. P. Cen and R. T. Yang, Ind. Eng. Chem. Pundam. 25, 758—767 (1986).
67. S. S. Suh and P. C. Wankat, AIChE J. 35, 523-526 (1989).
68. G. E. Keller, II, in T. E. White, Jr., С. M. Yon, and E. H. Wagener, eds., Industrial Gas Separations, Am. Chem. Soc. Symp. Ser. 225, American Chemical
Society, Washington, D.C., 1983, pp. 145—169.
69. R. T. Cassidy in ref. 57, pp. 248—259.
70. C. W. Skarstrom in N. N. Li, ed., Recent Developments in Separation Science, Vol. 2, CRC Press, Boca Raton, Fla., 1975, pp. 95—106.
71. J. W. Armond in R. P. Townsend, ed., The Properties and Applications of Zeolites, The Chemical Society, London, 1980, pp. 92—102.
72. J. P. Ausikaitis in ref. 18, pp. 681—695.
73. J. B. Tedor, T. C. Horch, and T. J. Dangieri, SAFE J. 12, 4-9 (1982).
74. M. Kawai and T. Kaneko, Gas Sep. Purif. 3, 2—6 (1989).
75. R. Kumar and J. K. VanSloun, Chem. Eng. Progr. 85, 34—40 (1989).
76. E. Richter, ErdoelKohle, Erdgas, Petrochem. 40, 432—438 (1987).
77. A. Kapoor and R. T. Yang, Chem. Eng. Sci. 44, 1723-1733 (1989).
78. S. Sircar and R. Kumar, Ind. Eng. Chem. Proc. Des. Dev. 24, 358—364 (1985).
79. R. T. Yang, Gas Separation by Adsorption Processes, Butterworths, Stoneham, Mass., 1987.
80. M. S. Adler and D. R. Johnson, Chem. Eng. Progr. 75, 77—79 (1979).
81. P. J. Clarke, J. E. Gerrard, C. W. Skarstrom, J. Vardi, and D. T. Wade, JL4E Trans. 76, 824—842 (1968).
82. D. R. Garg and С. M. Yon, Chem. Eng. Progr. 82, 54—60 (1986).
83. J. P. Ausikaitis, Glass Dig. 61, 69-78 (1982).
84. R. N. Macnair and G. N. Arons in P. N. Cheremisinoff and F. Eleerbusch, eds., Carbon Adsorption Handbook, Ann Arbor Science, Ann Arbor,
Mich., 1978, 819-859.
85. Ref. 39, p. 421.
86. M. D. Bingham, Field Detection and Implications of Mercury in Natural Gas, Soc. Petrol. Engrs. Production Engrg., 120—124 (May, 1990).
87. J. Markovs, UOP, Tarrytown, N.Y., private communication; U.S. Pat. 4,874,525 (Oct. 17, 1989).
88. J. T. Collins, M. J. Bell, and W. M. Hewitt in A. A. Moghissi and co-workers, eds., Nuclear Power Waste Technology, American Society of Mechanical
Engineers, New York, 1978, Chapt. 4.
89. D. W. Holladay, A Eiterature Survey: Methodsfor the Removal of Iodine Speciesfrom Off-Gases andEiquid Waste Streams ofNuclearPowerandNuclearFuel
Reprocessing Plants, with Emphasis on Solid Sorbents, Report ORNL/TM-6350 (January, 1979), p. 46, available from National Technical Information
Service, Springfield, Va.
90. C. Berg, Pet. Reffner 30(9), 241 (Sept. 1951).
91. "Beaded Carbon Ups Solvent Recovery," Chem. Eng. 84(18) (Aug. 29, 1977).
92. U.S. Pat. 4,526,877 (July 2,1985), A. Acharya and W. E. BeVier.
93. G. E. Keller, III, Separations: New Directions for an OldField (AIChE Monogr. Ser. 17) American Institute of Chemical Engineers, 1987, p. 83.
94. C. Huang and J. R. Fair, AIChE J. 34, 1861-1877 (1988).
95. S. Sircar and A. L. Myers, Ads. Sci. Technol. 2, 69—87 (1985).
96. M. S. Ray, Sep. Sci. Tech. 18, 95-120 (1983).
97. J. W. Carter in R. P. Townsend, ed., The Properties and Applications of Zeolites, The Chemical Society, London, 1980, pp. 76—91.
98. D. D. Do, AIChE J. 31, 1328-1337 (1985).
99. R. J. Grant and M. Manes, Ind. Eng. Chem. Fundam. 5, 490—498 (1966).
100. S. J. Doong and R. T. Yang, Ind. Eng. Chem. R/j. 27, 630—635 (1988).
101. G. Gamba, R. Rota, G. Storti, S. Carra, andM. Morbidelli, AIChEJ. 35, 959-966 (1989).
102. S. D. Mehta and R. P. Danner, Ind. End. Chem. Fundam. 24, 325—330 (1985).
103. J. A. Ritter and R. T. Yang, Ind. Eng. Chem. R/j. 26, 1679—1686 (1987).
104. R. Rota, G. Gamba, R. Paludetto, S. Carra, and M. Morbidelli, Ind. Eng. Chem. R/j. 27, 848—851 (1988).
105. A. S. Michaels, Ind. Eng. Chem. 44, 1922-1930 (1952).
106. H. M. Barry, Chem. Eng. 67, 105-120 (1960).
107. J. J. Collins, Chem. Eng. Progr. Symp. Ser. 63, 31—35 (1967).
108. S. L. Forbes and D. W. UnderhillJMPG4 36, 61-64 (1986).
109. R. Mohilla, J. Argelan, and R. Szolcsanyi, Int. Chem. Eng. 27, 723—729 (1987).
110. D. Basmadjian and C. Karayannopoulos, Ind. Eng. Chem. Proc. Des. Dev. 24, 140—149 (1985).
111. C. L. Humphries, Hydrocarbon Process. 45, 88—95 (1966).
112. P. I. Cen and R. T. Yang, AIChE J. 32, 1635-1641 (1986).
113. H. Hori, I. Tanaka, and T. Akiyama,JAPCA 38, 269-271 (1988).
114. H. Lee and W. P. Cummings, Chem. Eng. Progr. Symp. Series 63(74), 42—49 (1967).
115. L. C. Eagleton andH. Bliss, Chem. Eng. Progr. 49, 543—548 (1953).
116. J. W. Carter, Br. Chem. Eng. 14, 303-306 (1969).
117. O. Gnibner and W. A. Burgess, Environ Sci. Technol. 15, 1346—1351 (1981).
118. Y. E. Yoon and J. H. Nelson, Am. Ind. Hyg. Assoc. J. 45, 517—524 (1984).
119. L. A. Jonas and J. A. Rehrmann, Carbon 11, 59—64 (1973).
120. C. W. Chi and H. Lee, AIChE Symp. Ser. 69, 95-101 (1973).
121. O. A. Hougen and W. K. Marshall, Chem. Eng. Progr. 43, 197—208 (1947).
122. С. C. Fumas, Trans. Am. Inst. Chem. Eng. 24, 142—193 (1930).
123. G. M. Lukchis, Chem. Eng. 80, (13), 111-116; (16), 83-87; (18), 83-90 (1973).
124. C. W. Chi, AIChE Symp. Ser. 74, 42-46 (1977).
125. R. P. Underwood, Chem. Eng. Sci. 41, 409—411 (1986).
126. R. Kumar and G. L. Dissinger, Ind. Eng. Chem. Proc. Des. Dev. 25, 456—464 (1986).
127. I. Zwiebel, R. L. Gariepy, and J. J. Schnitzer, AIChE J. 18, 1139-1147 (1972); 20, 915-923 (1974).
Kirk-Othmer Encyclopedia of Chemical Technology (4th Edition)
289
ADSORPTION, GAS SEPARATION
Voll
128. A. Jedrzejak and M. Paderewski, Int. Chem. Eng. 28, 707—712 (1988).
129. J. L. Bravo, Report of DOE Contract No. DE-AS07-831D12473, 1984,150-181.
130. J. M. Scliork and J. R. Fair, Ind. Eng. Chem. Rat. 27, 457—469 (1988).
131. D. Basmadjian, K. D. Ha, and C. Y. Pan, Ind. Eng. Chem. Proc. Des. Dev. 14, 328—340 (1975).
132. C. Huang and J. R. Fair, AIChE J. 35, 1667-1677 (1989).
133. M. M. Davis and M. D. LeVan, Ind. Eng. Chem. Res. 28, 778-785 (1989).
134. A. Jedrzejak, Chem. Eng. Eechnol. 11, 352—358 (1988).
135. D. H. White, Jr., and P. G. Barkley, Chem. Eng. Progr. 85, 25—33 (1989).
136. K. Chihara and M. Suzuki,/. Chem. Eng. Japan 16, 293—299 (1983).
137. J. W. Carter and M. L. Wyszynski, Chem. Eng. Sci. 38, 1093-1099 (1983).
138. R. Kumar, Ind. Eng. Chem. Rat. 28, 1677-1683 (1989).
139. J. L. Liow and C. N. Kenney, AIChE J. 36, 53—65 (1990).
140. H. Shin and K. S. Knaebel, AIChE J. 34, 1409-1416 (1988).
141. P. H. Tumock and R. H. Kadlec, AIChE J. 17, 335-342 (1971).
142. S. J. Doong and R. T. Yang, AIChE Symp. Ser. 84, 145—154 (1988).
143. S. Ergun, Chem. Eng. Progr. 48, 89—94 (1952).
144. M. Leva, Chem. Eng. 56, 115-117 (1949).
145. L. E. Brownell, H. S. Dombrowski, and C. A. Dickey, Chem. Eng. Progr. 46, 415—422 (1950).
John D. Sherman
Carmen M. Yon
UOP
Kirk-Othmer Encyclopedia of Chemical Technology (4th Edition)
290
ADSORPTION, LIQUID SEPARATION
Voll
ADSORPTION, LIQUID SEPARATION
Nearly every chemical manufacturing operation requires the use of separation processes to recover and purify the desired product. In most circumstances,
the efficiency of the separation process has a significant impact on both the quality and the cost of the product (1). Liquid-phase adsorption has long been
used for the removal of contaminants present at low concentrations in process streams. In most cases, the objective is to remove a specific feed
component; alternatively, the contaminants are not well defined, and the objective is the improvement of feed quality defined by color, taste, odor, and
storage stability (2-5) (see Wastes, industrial; Water, industrial watertreatwnt).
In contrast to trace impurity removal, the use of adsorption for bulk separation in the liquid phase on a commercial scale is a relatively recent
development. The first commercial operation occurred in 1964 with the advent of the UOP Molex process for recovery of high purity ^-paraffins (6—8).
Since that time, bulk adsorptive separation of liquids has been used to solve a broad range of problems, including individual isomer separations and class
separations. The commercial availability of synthetic molecular sieves and ion-exchange resins and the development of novel process concepts have been
the two significant factors in the success of these processes. This article is devoted mainly to the theory and operation of these liquid-phase bulk adsorptive
separation processes.
Adsorbate—Adsorbent Interactions
An adsorbent can be visualized as a porous solid having certain characteristics. When the solid is immersed in a liquid mixture, the pores fill with liquid,
which at equilibrium differs in composition from that of the liquid surrounding the particles. These compositions can then be related to each other by
enrichment factors that are analogous to relative volatility in distillation. The adsorbent is selective for the component that is more concentrated in the
pores than in the surrounding liquid.
The choice of separation method to be applied to a particular system depends largely on the phase relations that can be developed by using various
separative agents. Adsorption is usually considered to be a more complex operation than is the use of selective solvents in liquid—liquid extraction (see
Extraction, liquid-liquid), extractive distillation, or azeotropic distillation (see Distillation, azeotropic and extractive). Consequendy, adsorption is
employed when it achieves higher selectivities than those obtained with solvents.
A significant advantage of adsorbents over other separative agents lies in the fact that favorable equilibrium-phase relations can be developed for
particular separations; adsorbents can be produced that are much more selective in their affinity for various substances than are any known solvents. This
selectivity is particularly true of the synthetic crystalline zeolites containing exchangeable cations. These zeolites became available in the early 1960s under
the name of molecular sieves (qv) (9).
An example of unique selectivity is provided by the use of 5A molecular sieves for the separation of linear hydrocarbons from branched and cyclic
types. In this system only the linear molecules can enter the pores; others are completely excluded because of their larger cross section. Thus the selectivity
for linear molecules with respect to other types is infinite. In the more usual case, all the feed components access the selective pores, but some components
of the mixture are adsorbed more strongly than others. A selectivity between the different components that can be used to accomplish separation is thus
established.
Another example of unique selectivities is the separation of olefins from paraffins in feed mixtures containing about five successive molecular sizes,
eg, C10 to C14. Liquid—liquid extraction might be considered for this separation. However, polar solvents give solubility patterns of the type shown in Figure
1. Each olefin is more soluble than the paraffin of the same chain length, but the solubility of both species declines as chain length increases. Thus, in a
broad-boiling mixture, solubilities of paraffins and olefins overlap and separation becomes impossible. In contrast, the relative adsorption of olefins and
paraffins from the liquid phase on the adsorbent used commercially for this operation is shown in Figure 2. Not only is there selectivity between an olefin
and paraffin of the same chain length, but also chain length has little effect on selectivity. Consequendy, the complete separation of olefins from paraffins
becomes possible.
Fig. 1. Liquid—liquid extraction selectivity: Q, olefins; •, paraffins.
Kirk-Othmer Encyclopedia of Chemical Technology (4th Edition)
291
ADSORPTION, LIQUID SEPARATION
Voll
C atoms in molecule
Fig. 2. Liquid-phase selectivity of UOP Olex adsorbent: 0, olefins; •, paraffins.
Unique adsorption selectivities are employed in the separation of Cg aromatic isomers, a classical problem that cannot be easily solved by distillation,
crystallization, or solvent extraction (10). Although ^-xylene [106-42-3] can be separated by crystallization, its recovery is limited because of the formation of
eutectic with m- xylene [108-58-3] However, either ^-xylene, m- xylene, o- xylene [95-47-6]., or ethylbenzene [100-41-4] can be extracted selectively by suitable
modification of zeolitic adsorbents.
Literature dealing with adsorbent—adsorbate interactions in Equid phase is largely confined to patents (11—43). Although theoretical consistency tests
exist for such data (44), the search for an adsorbent of suitable selectivity remains an art.
Practical Adsorbents
The search for a suitable adsorbent is generally the first step in the development of an adsorption process. A practical adsorbent has four primary
requirements: selectivity, capacity, mass transfer rate, and long-term stability. The requirement for adequate adsorptive capacity restricts the choice of
adsorbents to microporous solids with pore diameters ranging from a few tenths to a few tens of nanometers.
Traditional adsorbents such as siEca [7631 -86-9]\ SiO2; activated alumina [1318-23-6]A12O3; and activated carbon [7440-44-0]C, exhibit large
surface areas and micropore volumes. The surface chemical properties of these adsorbents make them potentially useful for separations by molecular class.
However, the micropore size distribution is fairly broad for these materials (45). This characteristic makes them unsuitable for use in separations in which
steric hindrance can potentially be exploited (see Aluminum compounds, aluminum oxide (alumina); Silicon compounds, synthetic inorganic silicates).
Typical nonsieve, polar adsorbents are siEca gel and activated alumina. EquiEbrium data have been pubEshed on many systems (11—16,46,47). The
order of affinity for various chemical species is: saturated hydrocarbons < aromatic hydrocarbons = halogenated hydrocarbons < ethers = esters =
ketones < amines = alcohols < carboxyEc acids. In general, the selectivities are parallel to those obtained by the use of selective polar solvents; in
hydrocarbon systems, even the magnitudes are similar. Consequendy, the commercial use of these adsorbents must compete with solvent-extraction
techniques.
The principal nonpolar-type adsorbent is activated carbon. EquiEbrium data have been reported on hydrocarbon systems, various organic
compounds in water, and mixtures of organic compounds (11,15,16,46,47). With some exceptions, the least polar component of a mixture is selectively
adsorbed; eg, paraffins are adsorbed selectively relative to olefins of the same carbon number, but dicycEc aromatics are adsorbed selectively relative to
monocycEc aromatics of the same carbon number (see Carbon, activated carbon).
___(С10Ню)____
Polymeric resins [81133-25-7]y ' !n ' are widely used in the food and pharmaceutical industries as cation—anion exchangers for the
removal of trace components and for some bulk separations, such as fructose from glucose (48). These resins are primarily attractive for aqueous-phase
separations and offer a fairly wide potential range of surface chemistries to fit a number of separation needs. For example, polymeric resins are effective in
partitioning by size and molecular weight and may also be effective in ion exclusion (see Ion exchange).
In contrast to these adsorbents, zeoEtes offer increased possibiEties for exploiting molecular-level differences among adsorbates. ZeoEtes are
crystalline aluminosiEcates containing an assemblage of SiO4 and A1O4 tetrahedra joined together by oxygen atoms to form a microporous soEd, which has
a precise pore structure (49). Nearly 40 distinct framework structures have been identified to date. Table 1 and Figure 3 summarize some of those
structures that have been widely used in the chemical industry. The versatiEty of zeoEtes Ees in the fact that widely different adsorptive properties may be
realized by the appropriate control of the framework structure, the siEca-to-alumina ratio (Si/Al), and the cation form. For example, zeoEte A, shown in
Figure 4, has a three-dimensional isotropic channel structure constricted by an eight-membered oxygen ring. Its effective pore size can be controEed at
about 0.3, 0.4 and 0.45 nm by exchanging with potassium, sodium, and calcium, respectively. The potassium form, with 0.3-nm pores, is used for removing
water from olefinic hydrocarbons. The sodium form can be used to efficiendy remove water from nonreactive hydrocarbons, such as alkanes. The
substitution of calcium can provide a pore size that will admit ^-paraffins and exclude other hydrocarbons.
Table 1. Molecular Sieve Pore Structures
Common name Ring size, number of atoms Free aperture, nm Pore structure CAS Registry Number Formula
fauj asite 12 0.74 3-D [12173-28-3] (Ca, Mg, Na2, 5[(A1O2 )59 (SiO2 )133 (235H2О
mordenite 8 0.29 x 0.57 1-D [12173-98-7] Na8[(AlO2)8(SiO2 j40]-24H2O
12 0.67 x 0.7 1-D
L 12 0.71 1-D K9[(AlO2)9(SiO2)27]-22H2O
ZSM-5 10 0.54 x 0.56 1-D [58339-99^1] (Na, TPAb)3 [(A1O2 )3 (SiO2 )9316H2O]
10 0.51 x 0.56 1-D
Erionite 8 0.36 x 0.52 2-D [12150-42-8] (Ca, Mg, Na2, !<,),,[(A1O2 )9 (SiO2 )27 }27H2 О
A 8 0.42 3-D Na12[(AlO2 )12 (SiO2 )12 ]'27H2O
See Figure 3.
k TPA = tetrapropylammonium.
Kirk-Othmer Encyclopedia of Chemical Technology (4th Edition)
292
ADSORPTION, LIQUID SEPARATION
Voll
Fig. 3. Schematic diagram of molecular sieve pore structure. See Table 1.
Fig. 4. Three zeolites with the same structural polyhedron, cubo-octahedrons. (a) Type A, Na12[(AlO2)12(SiO2)12] 27H2O; (b) sodalite [1302-90-5]-, (c)
faujasite (Type X, Y), where X = Na86[(AlO2)86(SiO2)106]-264H2O; Y = Na56[(AlO2)56(SiO2)136]-250H2O
Large-pore zeolites, X, Y, and mordenites, have pores defined by 12-membered oxygen rings with a free diameter of 0.74 nm. The framework
structure of X and Y faujasites sketched in Figure 4 consists of a total of 192 SiO2 and A1O2 units. The Si/Al (atomic) ratio for X is generally between 1.0
and 1.5, whereas for Y it is between 1.5 and 3.0. With suitable procedures, Y can be dealuminated to make ultrastable Y with Si/Al ratios exceeding 100.
Adsorption properties of faujasites are strongly dependent on not only the cation form, but also the Si/Al ratio. The flexibiEty provided by faujasites in the
adsorption of C8 aromatics is shown in Table 2. The selectivity order, from the most selectively adsorbed to the least selectively adsorbed, can be changed
significandy by the choice of zeoEte properties.
Table 2. Selectivity of Zeolites in CgH10 Aromatic Systems
Adsorbent
No. 1 No. 2 No. 3 No. 4
^-xylene 1 2 3 4
ethylbenzene 2 1 4 3
m- xylene 3 3 1 2
o- xylene 4 4 2 1
Key: 1 = most selectively adsorbed, 4 = = least selectively adsorbed.
The separation of fructose from glucose illustrates the interaction between the framework structure and the cation (Fig. 5) (50). Ca2+ is known to
form complexes with sugar molecules such as fructose. Thus, Ca—Y shows a high selectivity for fructose over glucose. However, Ca—X does not exhibit
high selectivity. On the other hand, К—X shows selectivity for glucose over fructose. This polar nature of faujasites and their unique shape-selective
properties, more than the molecular-sieving properties, make them most useful as practical adsorbents.
Kirk-Othmer Encyclopedia of Chemical Technology (4th Edition)
293
ADSORPTION, LIQUID SEPARATION
Voll
(a) G F
zx\
(c)
Time
F G
Time
Fig. 5. Fructose—glucose separation on faujasite adsorbents, (a) Ca—Y adsorbent; (b) Ca—X adsorbent; (с) К—X adsorbent.
Polymeric cation-exchange resins are also used in the separation of fructose from glucose. The UOP Sarex process has employed both zeolitic and
polymeric resin adsorbents for the production of high fructose com symp (HFCS). The operating characteristics of these two adsorbents are substantially
different and have been compared in terms of fundamental characteristics such as capacity, selectivity, and adsorption kinetics (51).
The zeolite and the resin adsorbents show different adsorption isotherm characteristics, particularly at higher concentration (51). The resin
adsorbent isotherm is slightly concave upward, whereas the zeolite isotherm is linear, or even slightly concave downward. Resins, therefore, have an
advantage in a UOP Sarex operation that involves high feed-solids concentration.
In addition to the fundamental parameters of selectivity, capacity, and mass-transfer rate, other more practical factors, namely, pressure drop
characteristics and adsorbent life, play an important part in the commercial viability of a practical adsorbent.
Pressure Drop Characteristics. Ion-exchange resins are compressible and exhibit a characteristic stress—strain relationship, as shown in
Figure 6. In addition, they undergo shrinking and swelling as a result of osmotic pressure variation resulting from concentration changes. Zeolite
adsorbents are rigid and do not exhibit much strain with pressure. When resins are used as adsorbents, the implications of shrinking and swelling and
compressibility must be considered to ensure safe operation below the design pressure drop. The pressure drop can often become a major factor in the
determination of maximum throughput.
Fig. 6. Compressibility characteristics of adsorbents.
Kirk-Othmer Encyclopedia of Chemical Technology (4th Edition)
294
ADSORPTION, LIQUID SEPARATION
Voll
Adsorbent Life. Long term stability under rugged operating conditions is an important characteristic of an adsorbent. By their nature zeolites
are not stable in an aqueous environment and must be specially formulated to enhance their stability in order to obtain several years of service. Polymeric
resins do not suffer from dissolution problems. However, they are prone to chemical attack (52).
Commercial Processes
Industrial-scale adsorption processes can be classified as batch or continuous (53,54). In a batch process, the adsorbent bed is saturated and regenerated in
a cyclic operation. In a continuous process, a countercurrent staged contact between the adsorbent and the feed and desorbent is established by either a
true or a simulated recirculation of the adsorbent.
The efficiency of an adsorption process is significandy higher in a continuous mode of operation than in a cyclic batch mode (55). In a batch
chromatographic operation, the liquid composition at a given level in the bed undergoes a cyclic change with time, and large portions of the bed do not
perform any useful function at a given time. In continuous operation, the composition at a given level is invariant with time, and every part of the bed
performs a useful function at all times. The height equivalent of a theoretical plate (HETP) in a batch operation is roughly three times that in a continuous
mode. For difficult separations, batch operation may require 25 times more adsorbent inventory and twice the desorbent circulation rate than does a
continuous operation. In addition, in a batch mode, the four functions of adsorption, purification, desorption, and displacement of the desorbent from the
adsorbent are inflexibly linked, whereas a continuous mode allows more degrees of freedom with respect to these functions, and thus a better overall
operation.
Continuous Countercurrent Processes
The need for a continuous countercurrent process arises because the selectivity of available adsorbents in a number of commercially important separations
is not high. In the ^-xylene system, for instance, if the liquid around the adsorbent particles contains 1% ^-xylene, the liquid in the pores contains about 2%
xylene at equilibrium. Therefore, one stage of contacting cannot provide a good separation, and multistage contacting must be provided in the same way
that multiple trays are required in fractionating materials with relatively low volatilities.
The hypersorption process (56) developed by Union Oil Company in the early 1950s for the recovery of propane and heavier components from
natural gas is the earliest example of large-scale countercurrent adsorption processes. This process used an activated carbon adsorbent flowing as a dense
bed continuously downward through a rising gas stream. A unit built for the Dow Chemical Company had a gas capacity of more than 500,000 m3/day.
However, this process proved to be less economical than cryogenic distillation and is no longer in operation. A number of commercial moving-bed designs
exist mainly for ion exchange. A good review of these designs can be found in reference 57.
Since the 1960s the commercial development of continuous countercurrent processes has been almost entirely accomplished by using a flow scheme
that simulates the continuous countercurrent flow of adsorbent and process liquid without the actual movement of the adsorbent. The idea of a simulated
moving bed (SMB) can be traced back to the Shanks system for leaching soda ash (58).
Such a concept was originally used in a process developed and licensed by UOP under the name UOP Sorbex (59,60). Other versions of the SMB
system are also used commercially (61). Toray Industries built the Aromax process for the production of^-xylene (20,62,63). Illinois Water Treatment and
Mitsubishi have commercialized SMB processes for the separation of fructose from dextrose (64—66). The following discussion is based on the UOP
Sorbex process.
MOVING-BED OPERATION
A hypothetical moving-bed system and a liquid-phase composition profile are shown in Figure 7. The adsorbent circulates continuously as a dense bed in a
closed cycle and moves up the adsorbent chamber from bottom to top. Liquid streams flow down through the bed countercurrendy to the solid. The feed
is assumed to be a binary mixture of A and B, with component A being adsorbed selectively. Feed is introduced to the bed as shown.
Desorption
of A
Desorption
of В
Adsorption
of A
-----; у Partial
desorption
_____ofD
Fig. 7. Adsorptive separation with moving bed.
Desorbent D is introduced to the bed at a higher level. This desorbent is a liquid of different boiling point from the feed components and can
displace feed components from the pores. Conversely, feed components can displace desorbent from the pores with proper adjustment of relative flow
rates of solid and liquid.
Raffinate product, consisting of the less strongly adsorbed component В mixed with desorbent, is withdrawn from a position below the feed entry.
Only a portion of the liquid flowing in the bed is withdrawn at this point; the remainder continues to flow into the next section of the bed. Extract
product, consisting of the more strongly adsorbed component A mixed with desorbent, is withdrawn from the bed; again, only a portion of the flowing
Equid in the bed is withdrawn, and the remainder continues to flow into the next bed section.
The positions of introduction and withdrawal of net streams divide the bed into four zones, each of which performs a different function as
described below.
Zone 1. The primary function of this zone is to adsorb A from the Equid. The soEd entering at the bottom carries only В and D in its pores. As the Equid
stream flows downward, countercurrent to this soEd, component A is transferred from the Equid stream into the pores of the soEd. At the same time,
component D is desorbed (transferred from the pores to the Equid stream) to make room for A.
Zone 2. The primary function of this zone is to remove В from the pores of the soEd. When the soEd arrives at the fresh feed point, the pores contain the
Kirk-Othmer Encyclopedia of Chemical Technology (4th Edition)
295
ADSORPTION, LIQUID SEPARATION
Voll
quantity of A that was adsorbed in Zone 1. However, the pores also contain a large quantity of B, because the solid has just been in contact with fresh feed.
The Equid entering the top of Zone 2 contains no B, only A and D. As the solid moves upward, countercurrent to this stream, В is gradually displaced
from the pores and is replaced by A and D. Thus, when the solid arrives at the top of Zone 2, the pores contain only A and D. By proper regulation of the
Equid rate in Zone 2, В can be desorbed completely from the pores. This В desorption can be accompEshed without simultaneously desorbing all of A,
because A is more strongly adsorbed than B.
Zone 3. The function of this zone is to desorb A from the pores. The soEd entering the zone carries A and D in the pores; the Equid entering the top of
the zone consists of pure D. As the soEd rises, A in the pores is displaced by D.
Zone 4. The purpose of this zone is to act as a buffer to prevent component B, which is at the bottom of Zone 1, from passing into Zone 3, where it
would contaminate extracted component A. When the adsorbent leaves Zone 3, the pores are completely filled with desorbent. The Equid entering the top
of Zone 4 is of raffinate composition and contains В and D. If the flow rate in Zone 4 is properly regulated, component В will be readsorbed completely
from the Equid, preventing its entry into Zone 3, where it would contaminate the product A.
Difficulties of Moving-Bed Operation. The use of a moving bed introduces the problem of mechanical erosion of the adsorbent.
Obtaining uniform flow of both soEd and Equid in beds of large diameter is also difficult. The performance of this type of operation can be gready
impaired by nonuniform flow of either phase.
The use of a series of fluidized beds may be considered when soEd overflows from each bed to the next. However, this arrangement involves a
sacrifice in mass-transfer efficiency because the number of theoretical equiEbrium trays cannot exceed the number of physical beds. In contrast, the flow
through dense and fixed beds of adsorbent, as practiced in chromatography, can provide hundreds of theoretical trays in beds of modest length. Another
disadvantage of a fluidized-bed operation is the large-sized equipment required to contain a given inventory of adsorbent (see Fluidization; Reactor
technology). In view of these difficulties, only a few fluidized-bed operations are practiced commercially. The Purasiv HR system using beaded activated
carbon for the recovery of solvent is one example. This process uses a staged fluidized bed for adsorption and a moving bed for regeneration (67).
SIMULATED MOVING-BED OPERATION
In the moving-bed system of Figure 7, soEd is moving continuously in a closed circuit past fixed points of introduction and withdrawal of Equid. The same
results can be obtained by holding the bed stationary and periodically moving the positions at which the various streams enter and leave. A shift in the
positions of the introduction of the Equid feed and the withdrawal in the direction of fluid flow through the bed simulates the movement of soEd in the
opposite direction.
Of course, moving the Equid feed and withdrawal positions continuously is impractical. However, approximately the same effect can be produced by
providing multiple Equid-access lines to the bed and periodically switching each stream to the adjacent line. Functionally, the adsorbent bed has no top or
bottom and is equivalent to an annular bed. Therefore, the four Equid-access positions can be moved around the bed continually, always maintaining the
same distance between the various streams.
The commercial appEcation of this concept (68) is portrayed in Figure 8, which shows the adsorbent as a stationary bed. A Equid circulating pump is
provided to pump Equid from the bottom oudet to the top inlet of the adsorbent chamber. A fluid-directing device known as a rotary valve (69,70) is
provided. The rotary valve functions on the same principle as a multiport stopcock in directing each of several streams to different lines. At the right-hand
face of the valve, the four streams to and from the process are continuously fed and withdrawn. At the left-hand face of the valve, a number of lines are
connected that terminate in distributors within the adsorbent bed.
Fig. 8. UOP Sorbex simulated moving bed for adsorptive separation. AC = adsorbent chamber, RV = rotary valve, EC = extract column, RC = raffinate
column.
At any particular moment, only four lines from the rotary valve to the adsorbent chamber are active. Figure 8 shows the flows at a time when lines 2,
5, 9, and 12 are active. When the rotating element of the rotary valve is moved to its next position, each net flow is transferred to the adjacent line; thus,
desorbent enters line 3 instead of line 2, extract is drawn from 6 instead of 5, feed enters 10 instead of 9, and raffinate is drawn from 1 instead of 12.
Figure 7 shows that in the moving-bed operation, the Equid flow rate in each of the four zones is different because of the addition or withdrawal of
the various steams. In the simulated moving-bed of Figure 8, the Equid flow rate is controEed by the circulating pump. At the position shown in Figure 8,
the pump is between the raffinate and desorbent ports, and therefore should be pumping at a rate appropriate for Zone 4. However, after the next switch
in position of the rotary valve, the pump is between the feed and raffinate ports, and should therefore be pumping at a rate appropriate for Zone 1. Stated
briefly, the circulating pump must be programmed to pump at four different rates. The control point is altered each time an external stream is transferred
from line 12 to line 1.
To complete the simulation, the Equid-flow rate relative to the soEd must be the same in both the moving-bed and simulated moving-bed
operations. Because the soEd is physically stationary in the simulated moving-bed operation, the Equid velocity relative to the vessel wall must be higher
than in an actual moving-bed operation.
The primary control variables at a fixed feed rate, as in the operation pictured in Figure 8, are the cycle time, which is measured by the time required
for one complete rotation of the rotary valve (this rotation is the analog of adsorbent circulation rate in an actual moving-bed system), and the Equid flow
rate in Zones 2, 3, and 4. When these control variables are specified, all other net rates to and from the bed and the sequence of rates required at the Equid
Kirk-Othmer Encyclopedia of Chemical Technology (4th Edition)
296
ADSORPTION, LIQUID SEPARATION
Voll
circulating pump are fixed. An analysis of sequential samples taken at the liquid circulating pump can trace the composition profile in the entire bed. This
profile provides a guide to any changes in flow rates required to maintain proper performance before any significant effect on composition of the products
has appeared. Various aspects of process control are described in the patent literature (71—73).
Temperature and pressure are not considered as primary operating variables: temperature is set sufficiendy high to achieve rapid mass-transfer rates,
and pressure is sufficiently high to avoid vaporization. In liquid-phase operation, as contrasted to vapor-phase operation, the required bed temperature
bears no relation to the boiling range of the feed, an advantage when heat-sensitive stocks are being treated.
MODELING OF UOP SORBEX SYSTEMS
The theoretical performance of the commercial simulated moving-bed operation is practically identical to that of a system in which solids flow
continuously as a dense bed countercurrent to liquid. A model in which the flows of solid and liquid are continuous, as shown in Figure 7, is therefore
adequate.
The operation is modeled in terms of theoretical equilibrium trays having the same significance as in fractionating columns (see Distillation). Solid
and liquid are assumed to flow continuously through hypothetical well-mixed theoretical trays in which equiEbrium is attained. The number of theoretical
trays has no relation to the number of bed segments in the actual operation. Each segment can be equivalent to many theoretical trays. The number is
determined by bed height, mass-transfer coefficient, and flow rates. Axial mixing is generally of much greater significance in Equid than in vapor systems
because of the greater mass of process fluid in the voids relative to that in the pores. To allow for the effect of axial mixing in the Equid phase, a second
parameter is introduced into the model by assuming that the soEd entrains a certain quantity of Equid from deck to deck.
The relationship of this type of model to a true differential analysis has been discussed for the case of linear equiEbrium and first-order kinetics
(74,75). A minor extension of this work leads to the following relations for a bed section in which flow rates of soEd and Equid are constant. For the
number of theoretical trays, ny
n = KkH / Lz
(1)
where К is the adsorption equiEbrium constant; k the mass-transfer coefficient; FF the bed height; E the net Equid-flow rate; and z = j ln[j / (j — 1)], where j
is an integer. The entrainment factor per unit Equid flow rate is given by
e = KkD°/L2
(2)
where D° is the axial diffusion coefficient. Equations 1 and 2 are approximations that apply for efficient beds at reasonable operating conditions. These
equations appear to be ambiguous because the values of n and e are different, depending on the component being considered. However, this ambiguity is
not of great practical significance because each zone of the system is performing a function that is critical with respect to only one component. Values of n
and e corresponding to the equiEbrium properties of the critical component in each zone should be used.
The model of theoretical equiEbrium trays with entrainment is readily treated by computer with methods analogous to those used for the design of
fractionating columns.
McCABE-THIELE DIAGRAM
The McCabe-Thiele approach has been developed to describe the Sorbex process (76). Two feed components, A and B, with a suitable adsorbent and a
desorbent, C, are separated in an isothermal continuous countercurrent operation. If A is the more strongly adsorbed component and the system is linear
and noninteracting, the flows in each section of the process must satisfy the following constraints for complete separation of A from B:
Section
IV
I
II
III
Condition
S/(D + F - E - R) > Kc„
S/(D + F-E)> KBA
S/(D — E) < KAB
S/D < KCA
The required direction of the net flow of each component is illustrated in Figure 9. The UOP Sorbex process has four flow-rate variables (S/F, D/F, E/F>
and R/F) and four inequaEty constraints, one for each section of the bed. Once the equiEbrium is fixed, the only remaining degree of freedom is the
margin by which the inequaEty constraints are fulfilled. Once that is decided, the inequaEty constraints become four equations that define all flow-rate ratios
for the system. Once the flow rates are fixed, a preliminary estimate of the number of theoretical stages in each section may be obtained by a
McCabe-Thiele diagram, shown in Figure 10.
Net flows
1 c | в
f В | A
t В | A
t A | C
Fig. 9. Schematic diagram of a UOP Sorbex process. D, E, F, R, and S represent flow rates for desorbent, extract, feed, raffinate, and net solids,
Kirk-Othmer Encyclopedia of Chemical Technology (4th Edition)
297
ADSORPTION, LIQUID SEPARATION
Voll
respectively.
Fig. 10. UOP Sorbex operation with linear isotherms. Slope of CD = Кг‘} slope of ® = K2. Conditions for separation: Кг > K2> L-J S
L2/S < A\, K2 < L^/S < K^LJS < K2iL. — L2 = F; where К = adsorption coefficient, L = net Equid flow rate, S = net solids flow rate, and
F = feed flow rate.
McCabe-Thiele diagrams for nonlinear and more practical systems with pertinent inequality constraints are illustrated in Figures 11 and 12. The
convex isotherms are generally observed for zeolitic adsorbents, particularly in hydrocarbon separation systems, whereas the concave isotherms are
observed for ion-exchange resins used in sugar separations.
Fig. 11. UOP Sorbex operation with convex isotherms. Conditions for separation: at point A, slope of (D = K2> Кг > K2> L-JS
L2/S < KT < K., K2 < L-JS < K'^LjS < K'2i Lx — L2 = F; where K, F, A, and F are as defined in Figure 10.
Kirk-Othmer Encyclopedia of Chemical Technology (4th Edition)
298
ADSORPTION, LIQUID SEPARATION
Voll
Fig. 12. Conditions for separation: At point A, slope of (2) = Kx, Кг > A2, L3/S > K'19 K2 < KT < L-JS < K'2 < L2/S < K'19 L^JS < K2, where
K, L, and S are as defined in Figure 10. Adsorbent concentration of component 2 less than qA.
UOP Sorbex Applications
The first UOP Sorbex process was licensed in 1962 as a UOP Molex process to separate «-paraffins from branched paraffins, cyclic paraffins, and
aromatics. This plant started up in 1964, and its products were used for the manufacture of biodegradable detergents. Since then, about 80 units have been
put on-stream in a variety of appEcations that produce in excess of 8 million t/yr of products. The extent of commercialization, as of July 1989, is shown in
Table 3. The problems associated with large-scale commercial operation have been solved, as is evidenced by the satisfactory operation of a single A~ xylene
unit with a capacity of nearly 400,000 t/yr. The performance of the rotary valves has been excellent, and they have required only routine maintenance. The
largest adsorbent bed in commercial use has a diameter of 6.7 m and is performing as well as a pilot plant with a bed diameter of 0.1 m. This performance
is achieved by paying particular attention to the internal design of large adsorbent chambers to ensure good distribution and uniform flow of liquids
(77—79). Evolutionary improvements in the UOP Sorbex process design have reduced product impurities from tenths of a percent to a few hundred parts
per million. The following examples show various applications of continuous bulk adsorptive separation processes operating in liquid phase.
Table 3. UOP Sorbex Processes for Commodity Chemicals
UOP Processes Separation Licensed units
Parex A-xylene from Cg aromatics 44
Molex «-paraffins from branched and cyclic hydrocarbons 21
Olex olefins from paraffins 6
Cymex p- or /«-cymene from cymene isomers 1
Cresex p- or /«-cresol from cresol isomers 1
Sarex fructose from dextrose plus polysaccharides 5
Total 78
Л-Paraffin Separation. The UOP Molex process is used to separate «-paraffins from branched paraffins and aromatics in a variety of
applications. In the C5~C6 range, the Molex process is used to enhance the octane number of gasoline. As illustrated in Figure 13, the UOP Molex process
is integrated with a catalytic isomerization process, UOP Penex, to achieve maximum isomerization octane (80). This octane upgrade is a result of the
separation of the low octane «-paraffins from the high octane branched paraffins and the recycle of the «-paraffins to UOP Penex for further conversion.
The magnitude of the octane increase for the UOP Penex-Molex process over the once-through UOP Penex process depends on the C5~C6 content of the
feed. Typically, the product octanes are 4 to 5 numbers higher, for instance, 83.5 RON (research octane number) for the UOP Penex process and 88.5
RON for the UOP Penex-Molex process.
Fig. 13. UOP Penex-Molex process. AC = adsorbent chamber, EC = extract column, RC = raffinate column.
Kirk-Othmer Encyclopedia of Chemical Technology (4th Edition)
299
ADSORPTION, LIQUID SEPARATION
Voll
Linear paraffins in the C10 to C15 range are used for the production of alcohols and plasticizers and biodegradable detergents of the linear
alkylbenzene sulfonate and nonionic types (see Alcohols; Plasticizers; Surfactants). Here the UOP Molex process is used to extract «-paraffins from a
hydrotreated kerosine (6—8).
The fermentation of «-paraffins in the C10 to C23 range for protein production has provided a new oudet for these hydrocarbons (see Foods,
nonconventional). Because it operates in liquid phase, the UOP Molex process can readily accomplish the separation of «-paraffins from such a wide
boiling feedstock.
Olefin—Paraffin Separation. The catalytic dehydrogenation of «-paraffins offers a route to the commercial production of linear olefins.
Because of limitations imposed by equilibrium and side reactions, conversion is incomplete. Therefore, to obtain a concentrated olefin product, the olefins
must be separated from the reactor effluent (81—85), and the unreacted «-paraffins must be recycled to the catalytic reactor for further conversion.
The performance of the adsorptive section of such a combination in a commercial installation is shown in Table 4. The feedstock includes C^—C14
components, and olefins are recovered at about 94% efficiency.
Table 4. Commercial Operation of Linear Cn—C14 Olefin Extraction
Component Feed, wt % Extract, wt % Raffinate, wt %
«-olefins 9.0 96.2 0.6
«-paraffins 90.1 1.1 98.5
other components 0.9 2.7 0.9
Total 100.0 100.0 100.0
Including aromatics and branched-chain aliphatics.
The olefin product contains 1.1% of residual «-paraffins. Essentially similar results have been obtained in commercial operations on Cg—C10 and
C15~ C18 feedstocks. The desorbents used are generally hydrocarbon mixtures of lower boiling range than the feed components. The concentrated olefin
stream may then be used for production of detergent alcohols.
p-Xylene Separation. ^-Xylene finds wide use as a precursor for the production of polyester fibers and plastics. Before the advent of
adsorptive techniques, the ^-xylene was commonly separated from hydrocarbon mixtures by crystallization. However, recovery was limited to 55 to 60%
because of the formation of eutectic mixtures.
Since 1971 mainly adsorptive separation processes are used to obtain high purity ^-xylene (55,84—86). A typical commercial process for the
separation of ^-xylene from other Cg aromatics produces about 99.8% purity ^-xylene at greater than 95% recovery.
Ethylbenzene Separation. Ethylbenzene [100-41 -4]\ which is primarily used in the production of styrene, is difficult to separate from mixed
Cg aromatics by fractionation. A column of about 350 trays operated at a reflux:feed ratio of 20 is required. No commercial adsorptive unit to accomplish
this separation has yet been installed, but the operation has been performed successfully in pilot plants (see Table 5). About 99% of the ethylbenzene in the
feed was recovered at a purity of 99.7%. This operation, the UOP Ebex process, requires about 40% of the energy that is required by fractional distillation.
Table 5. Ethylbenzene Separation, Pilot-Plant Scale
Component Feed, wt % Ethylbenzene, wt % Residue, wt %
ethylbenzene ^-xylene /«-xylene o- xylene Total 30.5 99.7 0.4 12.9 0.1 18.4 35.8 0.1 51.3 20.8 0.1 29.9 100.0 100.0 100.0
Fructose—Dextrose Separation. Fructose—dextrose separation is an example of the application of adsorption to nonhydrocarbon systems.
An aqueous solution of the isomeric monosaccharide sugars, C3H12O3, fructose and dextrose (glucose), accompanied by minor quantities of
polysaccharides, is produced commercially under the designation of "high11 fructose com symp by the enzymatic conversion of cornstarch. Because
fructose has about double the sweetness index of dextrose, the separation of fructose from this mixture and the recycling of dextrose for further enzymatic
conversion to fructose is of commercial interest (see Sugar; Sweeteners).
The UOP Sarex process has been used since 1978 for the separation of high purity fructose from a mixture of fructose, glucose, and polysaccharides
(87,88). The pilot-plant performance of fructose—glucose separation is given in Table 6.
Table 6. Separation of Fructose from High Fructose Com Symp, Pilot-Plant Scale
Component Feed, wt %a Extract, wt %a Raffinate, wt %a
fructose 41.9 95.0 7.0
dextrose 53.1 5.0 84.7
other saccharides 5.0 0.0 8.3
Total 100.0 100.0 100.0
Dry basis.
Aromatic and Nonaromatic Hydrocarbon Separation. Aromatics are partially removed from kerosines and jet fuels to improve smoke
point and burning characteristics. This removal is commonly accomplished by hydroprocessing, but can also be achieved by liquid—liquid extraction with
solvents, such as furfural, or by adsorptive separation. Table 7 shows the results of a simulated moving-bed pilot-plant test using siEca gel adsorbent and
feedstock components mainly in the C1Q—C15 range. The extent of extraction does not vary gready for each of the various species of aromatics present.
SiEca gel tends to extract all aromatics from nonaromatics (89).
Table 7. Separation of Aromatics from Nonaromatics in C1Q—C15 Light Cycle Oil
Components
aromatics
Feed, Extract, vol Raffinate, vol % Extraction, %
vol % %
Kirk-Othmer Encyclopedia of Chemical Technology (4th Edition)
300
ADSORPTION, LIQUID SEPARATION
Voll
alkylbenzenes 17.9 34.3 7.5 76
tetralins, indanes 8.3 14.8 4.2 71
indenes 1.7 3.4 0.6 80
naphthalenes 13.6 30.0 1.6 86
acenaphthenes, biphenyls 4.4 9.1 0.8 89
tricyclic aromatics 1.7 3.3 0.2 92
Total aromatics 47.6 95.0 14.9 82
nonaromatics 52.4 5.0 85.1 4
Total 100.0 100.0 100.0 41
Citric Acid Separation. Citric acid [77-92-9] and other organic acids can be recovered from fermentation broths using the UOP Sorbex
technology (90—92). The conventional means of recovering citric acid is by a lime and sulfuric acid process in which the citric acid is first precipitated as a
calcium salt and then reacidulated with sulfuric acid. However, this process generates significant by-products and thus can become inefficient.
UOP has developed a UOP Sorbex process for the recovery and purification of citric acid from fermentation broths. The process provides
technical-grade citric acid, C6HgO7, which can be further recrystallized to obtain food-grade citric acid (qv).
Separation of Fatty Acids. Tall oil is a by-product of the pulp and paper manufacturing process and contains a spectrum of fatty acids, such
as palmitic, stearic, oleic, and linoleic acids, and rosin acids, such as abietic acid. The conventional refining process to recover these fatty acids involves
intensive distillation under vacuum. This process does not yield high purity fatty acids, and moreover, a significant degradation of fatty acids occurs because
of the high process temperatures. These fatty and rosin acids can be separated using a UOP Sorbex process (93—99) (Tables 8 and 9).
Table 8. UOP Sorbex Separation of Fatty Acids from Rosin Acids in Distilled Tall Oil
Composition Feed, wt % Extract, wt % Raffinate, wt %
rosin acid linoleic acid oleic acid neutrals 33.0 1.50 94.50 32.7 48.50 2.00 32.75 48.508 2.00 1.50 1.50 1.50
Table 9. UOP Sorbex Separation of Saturated and Unsaturated Tall Oil Fatty Acids
Composition Feed, wt % Extract, wt % Raffinate, wt %
oleic acid 48.55 92.00 5.00
linoleic acid 48.55 5.00 92.00
rosin acid 1.50 1.50 1.50
neutrals 1.50 1.50 1.50
Cyclic-Batch Processes
Continuous processes have wide application in different areas of the chemical industry. The separation efficiency of a continuous process is generally higher
than that of a batch or cyclic-batch process. However, in some applications the cyclic-batch process may be preferred because of the complexity of design
and the difficulty of controlling the continuous processes. Examples of commercial cyclic-batch adsorption processes operating in liquid phase include the
UOP methanol recovery (UOP MRU) and oxygenate removal (UOP ORU) processes, which separate oxygenates from C4 hydrocarbons; the UOP
Cyclesorb process, which separates fructose from glucose; and ion-exclusion processes for recovering sucrose from molasses.
UOP MRU—ORU Processes. Methyl /^butyl ether [1634-04-4] (MTBE) is an additive that is used to increase the octane value of gasoline.
In environmentally sensitive locations where a minimum oxygen content for gasoline is specified, MTBE can provide the desired oxygen content while
increasing octane and maintaining compatibility with the hydrocarbon components of gasoline. The MTBE synthesis typically requires an excess of
methanol [67-56-1] relative to isobutylene [115-11-7] to achieve as high a conversion as possible. Downstream of the reactor, this excess methanol must be
separated from the MTBE and unreacted C4 hydrocarbons so that it can be recycled back to the reactor. A two-stage water wash is conventionally used for
methanol recovery. The UOP MRU process offers an alternative means of recovering the 3 to 4% methanol contained in the C4 stream (100).
In most cases, the linear olefins in the C4 stream are subsequendy sent to alkylation or polymerization processes, both of which are sensitive to trace
oxygenates. The UOP ORU process can be used to remove trace dimethyl ether, /^-butyl alcohol, and water down to concentrations of a few parts per
million. Figure 14 shows how the UOP MRU and UOP ORU processes are integrated with the MTBE and downstream plants. The UOP MRU process is
a multibed thermal swing adsorption process that operates in a cyclic-batch adsorption mode. Methanol is preferentially adsorbed over the less polar
hydrocarbons. The desorption step is accomplished by a temperature swing using the reactor feed. The UOP ORU process involves liquid-phase
adsorption of the remaining trace oxygenates from the effluent C4 stream followed by vapor-phase desorption using an external regenerant. Both processes
are in commercial use.
Kirk-Othmer Encyclopedia of Chemical Technology (4th Edition)
301
ADSORPTION, LIQUID SEPARATION
Voll
CH3OH Oxygenate
Fig. 14. UOP raffinate process treatment process. MTBE = methyl /^-butyl ether.
UOP Cyclesorb Process. The UOP Cyclesorb process was developed by UOP in the mid-1980s as an alternative to the UOP Sarex process.
The UOP Cyclesorb process is simpler in design and yet attains reasonable efficiency of separation. The UOP Cyclesorb is a continuous recycle
chromatographic process, wherein a series of chromatographic columns are used to develop the separation of fructose from glucose, and a series of
internal recycle streams of impure and dilute portions of the chromatograph are used to improve the efficiency. The following process description is based
on UOP patent literature (101,102).
A schematic diagram of a six-vessel UOP Cyclesorb process is shown in Figure 15. The UOP Cyclesorb process has four external streams: feed and
desorbent enter the process, and extract and raffinate leave the process. In addition, the process has four internal recycles: dilute raffinate, impure raffinate,
impure extract, and dilute extract. Feed and desorbent are fed to the top of each column, and the extract and raffinate are withdrawn from the bottom of
each column in a predetermined sequence established by a switching device, the UOP rotary valve. The flow of the internal recycle streams is from the
bottom of a column to the top of the same column in the case of dilute extract and impure raffinate and to the top of the next column in the case of dilute
raffinate and impure extract.
Fig. 15. UOP Cyclesorb process flow.
Such a flow establishes a chromatographic profile in each column that is moving from top to bottom. Also, the profile is staggered from one
column to the other as each column is in a different stage of development of the chromatogram. The concentration at any given point in a column varies
with time, but the variation is more gradual than can be expected in a batch chromatographic process. Therefore, all portions of the column perform a
useful function at any given time.
Ion-Exclusion Processes for Sucrose. Molasses, which is a by-product of raw cane or beet sugar manufacturing processes, is a heavy,
viscous Equid that is separated from the final low grade massecuite from which no more sugar can be crystallized by the usual methods. Molasses has a
reasonably high sugar content. The recovery of sucrose from molasses has been the object of intense investigation for more than 50 years. In 1953, the
ion-exclusion process was introduced by the Dow Chemical Company (103). This process, which was developed to separate the ionic from the nonionic
constituents of molasses, was based on the fact that, under equiEbrium conditions, certain ion-exchange resins have a different affinity for nonionic species
than for ionic species.
The ion-exclusion process for sucrose purification has been practiced commercially by Finn Sugar (104). This process operates in a cycEc-batch
mode and provides a sucrose product that does not contain the highly molassogenic salt impurities and thus can be recycled to the crystallizers for
additional sucrose recovery.
Liquid Chromatography
Conventional Equid chromatography has not attained great commercial significance in the area of large-scale bulk separations from the Equid phase. In
1952 the Sun Oil Company announced such a process, designated as the Arosorb process, for separating aromatic hydrocarbons from naphthas with a
siEca gel (105). However, the Arosorb process did not attain wide commercial usage, largely because of the simultaneous development of efficient
Equid—Equid extraction processes for the same appEcation.
However, chromatographic processes still have a considerable appEcabiEty (106) (see Analytical methods). For instance, in small-scale operations,
the greater simpEcity of the chromatograph may more than compensate economically for the larger adsorbent inventory and desorbent usage.
Kirk-Othmer Encyclopedia of Chemical Technology (4th Edition)
302
ADSORPTION, LIQUID SEPARATION
Voll
Chromatography may also be advantageous when it is required to separate several pure products from a single feed stream. A simulated moving-bed
system can yield only two well-separated fractions from a single feed stream.
The separating power of a chromatographic process arises from the development of many theoretical plates to achieve adsorption equilibrium
within a column of moderate length. Even though the separation factor between two components may be small, any desired resolution may be achieved
with sufficient theoretical plates.
The height equivalent to a theoretical plate (HETP) for a chromatographic column is approximated by the van Deemter equation (107):
HETP = AlB/vkCv
where v is the interstitial velocity, and A, B, and C are related to such factors as particle size, bed porosity, and adsorption equilibrium constant. To obtain a
small HETP, and therefore an efficient separation process, uniform packing is essential. Such packing requires careful loading procedures to eliminate
variation in voidage and stratification of particle sizes and shapes across the cross section of the bed.
In analytical chromatography, the primary objective is to maximize the resolution between two components subject to some restrictions on the
maximum time of elution. As a result, the feed pulse loading is minimized, and the number of theoretical plates is maximized. In preparative
chromatography, the objective is to maximize production rate as well as reduce capital and operating costs at a given separation efficiency. The adsorption
column is therefore commonly run under overload conditions with a finite feed pulse width. The choice of operating conditions for preparative
chromatography has been discussed (53). In production chromatography, the optimal pulse sequence occurs when the successive pulses of feed are
introduced at intervals such that the feed components are just resolved both within a given sample and between adjacent samples.
Gas versus Liquid Adsorption
The question of whether adsorption should be done in the gas or Equid phase is an interesting one. Often the choice is clear. For example, in the separation
of nitrogen from oxygen, liquid-phase separation is not practical because of low temperature requirements. In C1Q—C14 olefin separation, a gas-phase
operation is not feasible because of reactivity of feed components at high temperatures. Also, in the case of substituted aromatics separation, such as
xylene from other Cg aromatics, the inherent selectivities of individual components are so close to one another that a simulated moving-bed operation in
Equid phase is the only practical choice.
However, in some cases, the answer is not clear. A variety of factors need to be taken into consideration before a clear choice emerges. For example,
UOP's Molex and IsoSiv processes are used to separate normal paraffins from non-normals and aromatics in feedstocks containing C5~C2Q hydrocarbons,
and both processes use molecular sieve adsorbents. However, Molex operates in simulated moving-bed mode in Equid phase, and IsoSiv operates in gas
phase, with temperature swing desorption by a displacement fluid. The foEowing comparison of UOP's Molex and IsoSiv processes indicates some of the
primary factors that are often used in decision making:
Factor Molex IsoSiv
adsorbent/extract 1 2
desorbent/extract 1 3
tolerance to feed contaminants low high
Outlook
Liquid adsorption processes hold a prominent position in several appEcations for the production of high purity chemicals on a commodity scale. Many of
these processes were attractive when they were first introduced to the industry and continue to increase in value as improvements in adsorbents,
desorbents, and process designs are made. The UOP Parex process alone has seen three generations of adsorbent and four generations of desorbent.
Similarly, Equid adsorption processes can be appEed to a much more diverse range of problems than those presented in Table 3.
A surprisingly large number of important industrial-scale separations can be accompEshed with the relatively small number of zeoEtes that are
commercially available. The discovery, characterization, and commercial availabiEty of new zeoEtes and molecular sieves are likely to multiply the number of
potential solutions to separation problems. A wider variety of pore diameters, pore geometries, and hydrophobicity in new zeoEtes and molecular sieves as
well as more precise control of composition and crystallinity in existing zeoEtes will help to broaden the appEcations for adsorptive separations and likely
lead to improvements in separations that are currendy in commercial practice.
The value of many chemical products, from pesticides to pharmaceuticals to high performance polymers, is based on unique properties of a
particular isomer from which the product is ultimately derived. For example, trisubstituted aromatics may have as many as 10 possible geometric isomers
whose ratio in the mixture is determined by equiEbrium. Often the purity requhement for the deshed product includes an upper limit on the content of one
or more of the other isomers. This separation problem is a compEcated one, but one in which adsorptive separation processes offer the greatest chances
for success.
BIBLIOGRAPHY
'Adsorptive separation, Equids," in ECT 3rd ed., Vol. 1, pp. 563—581, D. B. Broughton, UOP Process Division, UOP, Inc.
1.
2.
3.
4.
5.
6.
7.
8.
9.
10.
11.
12.
13.
14.
15.
16.
17.
18.
19.
Separation and Purification: CriticaTNeeds and Opportunities, National Research Council Report, National Academy Press, 1987.
C. L. ManteU, Adsorption, 2nd ed., McGraw-Hill, Inc., New York, 1951.
V. R. Deitz, Bibliography ofiSolid Adsorbents, N.B.S. Chcular 566, National Bureau of Standards, Washington, D.C., 1956.
T. Vermeulen, N. K. Heister, and G. Klein, Perry's Chemical Engineers Handbook, 4th ed., McGraw-HiE, Inc., New York, 1963, Sect. 16.
Adsorption Handbook, Pittsburgh Chemical Company, Activated Carbon Division, 1961.
D. B. Broughton, Chem. Eng. Prog. 64, 60 (1968).
D. B. Broughton and A. G. Lickus, Pet. Refiner 40(5), 173 (1961).
D. B. Carson andD. B. Broughton, Pet. Refiner 38(4), 130 (1959).
D. W. Breck, Zeolite Molecular Sieves, John Wiley & Sons, Inc., New York, 1974.
L. Berg, Chem. Eng. Prog. 65(9), 52 (1969).
A. E. Herschler and T. S. Mertes, Ind. Eng. Chem. 47, 193 (1955).
D. Haresnape, F. A. Fidler, and R. A. Lowry, Ind. Eng. Chem. 41, 2691 (1949).
B. J. Man andM. Shamaiengar, Anal. Chem. 30, 276 (Feb. 1958).
B. J. Mair, A. L. Gaboriault, and F. D. Rossini, Ind. Eng. Chem. 39, 1072 (1947).
S. Eagle and J. W. Scott, Ind. Eng. Chem. 42, 1287 (1950).
A. E. Hkschler and S. Amon, Ind. Eng. Chem. 30, 276 (Feb. 1958).
U.S. Pat. 3,133,126 (May 12, 1964), R. N. Fleck and C. G. Wright (to Union Oil Company).
Brit. Pat. 1,108,305 (Apr. 3, 1968), D. W. Peck, R. R. Gentry, andH. E. Frite (to Union Carbide Corp.).
U.S. Pat. 3,843,518 (Oct. 22, 1974), E. M. Magee and F. J. Healy (to Esso Research & Engineering Company).
Kirk-Othmer Encyclopedia of Chemical Technology (4th Edition)
303
ADSORPTION, LIQUID SEPARATION
Voll
20.
21.
22.
23.
24.
25.
26.
27.
28.
29.
30.
31.
32.
33.
34.
35.
36.
37.
38.
39.
40.
41.
42.
43.
44.
45.
46.
47.
48.
49.
50.
51.
52.
53.
54.
55.
56.
57.
58.
59.
60.
61.
62.
63.
64.
65.
66.
67.
68.
69.
70.
71.
72.
73.
74.
75.
76.
77.
78.
79.
80.
81.
82.
83.
84.
85.
86.
87.
88.
89.
90.
91.
92.
93.
U.S. Pat. 3,761,533 (Sept. 25, 1973), S. Otani and co-workers (to Toray Industries Inc.).
U.S. Pat. 3,686,343 (Aug. 22, 1972), R. Bearden and R. J. De Feo, Jr. (to Esso Research & Engineering Company).
U.S. Pat. 3,724,170 (Apr. 3,1973), P. T. Allen, В. M. Drinkard, and E. H. Vager (to Mobil Oil Corp.).
U.S. Pat. 3,626,020 (Dec. 7,1971), R. W. Neuzil (to Universal Oil Products Co.).
U.S. Pat. 3,558,730 (Jan. 26,1971), R. W. Neuzil (to Universal Oil Products Co.).
U.S. Pat. 3,558,732 (Jan. 26,1971), R. W. Neuzil (to Universal Oil Products Co.).
U.S. Pat. 3,663,638 (May 16,1972), R. W. Neuzil (to Universal Oil Products Co.).
U.S. Pat. 3,686,342 (Aug. 22,1972), R. W. Neuzil (to Universal Oil Products Co.).
U.S. Pat. 3,734,974 (May 22,1973), R. W. Neuzil (to Universal Oil Products Co.).
U.S. Pat. 3,706,813 (Dec. 19,1972), R. W. Neuzil (to Universal Oil Products Co.).
U.S. Pat. 3,851,006 (Nov. 26,1974), A. J. de Rosset and R. W. Neuzil (to Universal Oil Products Co.).
U.S. Pat. 3,698,157 (Oct. 17,1972), P. T. Aken and В. M. Drinkard (to Mobil Oil Corp.).
U.S. Pat. 3,917,734 (Nov. 4, 1975), A. J. de Rosset (to Universal Oil Products Co.).
U.S. Pat. 3,665,046 (May 23, 1972), A. J. de Rosset (to Universal Oil Products Co.).
U.S. Pat. 3,510,423 (May 5,1973), R. W. Neuzil (to Universal Oil Products Co.).
U.S. Pat. 3,723,561 (Mar. 27,1973), J. W. Priegnitz (to Universal Oil Products Co.).
U.S. Pat. 3,851,006 (Nov. 26, 1974), A. J. de Rosset (to Universal Oil Products Co.).
F. Wolf and K. Pilchowski, Chem. Technol. 23(11), (1971) (in Ger.).
R. M. Moore and J. R. Katzer, AIChE J. 18, 816 (1972).
C. N. Satterfield and C. S. Cheng, AIChE J. 18, 710 (1972).
F. Wolf, K. Pilchowski, К. H. Mohrmann, and E. Hause, Chem. Technol. 27(12), (1975) (in Ger.).
S. K. Suri and V. Ramkrishna, Trans. Faraday Soc. 65(6), 1960 (1969).
J. F. Walter and E. B. Stuart, AIChE J. 10, 889 (1964).
U.S. Pat. 3,929,669 (Dec. 30,1975), D. H. Rosback and R. W. Neuzil (to Universal Oil Products Co.).
S. Sircar and A. L. Meyers, AIChE J. 17, 186 (1971).
R. T. Yang, Gas Separation by Adsorption Processes, Butterworth, London, 1986.
E. Heftmann, ed., Chromatography, Van Nostrand-Reinhold, New York, 1975.
J. J. Kipling, Adsorption from Solutions ofiNon-Electrolytes, Academic Press, Inc., New York, 1965.
F. C. Nachod and J. Schubert, Ion-Exchange Technology, Academic Press, Inc., New York, 1956.
R. M. Barrer, Zeolites and Clay Minerals as Sorbents and Molecular Sieves, Academic Press, Inc., London, 1978.
J. A. Johnson and A. R. Oroskar, "Sorbex Technology for Industrial Scale Separation," in H. G. Karge and J. Weitkamp, eds., Zeolites as Catalysts,
Sorbents, and Detergent Builders, Elsevier Science Publishers BV, Amsterdam, 1989.
С. Но, С. B. Ching, and D. M. Ruthven, Ind. Eng. Chem. Rev. 26, 1407 (1987).
S. A. Fisher and G. Otten, Proceedings of the 42nd International Water Conference, Engineering Society of Western Pennsylvania, Pittsburgh, 1981.
D. M. Ruthven, Principles of Adsorption and Adsorption Processes, John Wiley & Sons, Inc., New York, 1984.
G. E. Keller II, in T. E. Whyte and co-workers, eds., Industrial Gas Separation (ACS Symposium Series No. 223), American Chemical Society,
Washington, D.C., 1983.
D. B. Broughton, R. W. Neuzil, J. M. Pharis, and C. S. Bready, Chem. Eng. Prog. 66(9), 70 (1970).
C. Berg, Trans. Am. Inst. Chem. Eng. 42, 665 (1946).
P. C. Wankat, Large Scale Adsorption and Chromatography, CRC Press, Boca Raton, Fla., 1986.
R. E. Treybal, Mass Transfer Operations, 3rd ed. McGraw Hill, New York, 1980.
D. B. Broughton, H. J. Bieser, and M. C. Anderson, Pet. Int. (Milan), 23(3), 91 (1976) (in English).
D. B. Broughton, H. J. Bieser, and R. A. Persak, Pet. Int. (Milan), 23(5), 36 (1976) (in English).
P. E. Barker and G. Gavelson, Separation and Purification Methods 17, 1 (1988).
S. Otani and co-workers, Chem. Econ. Eng. Rev. 3(6), 56 (1971).
S. Otani, Chem. Eng. 80(9), 106 (1973).
Making Waves in Liquid Processing Illinois Water Treatment Company, IWT Adsep System, Rockford, Hl., 1984, VI (1).
Tetsua Hirota, Sugar Appear Q an. 1980).
Advertisement, Sugar Appear (March 1980).
Chem. Eng. 39, (Aug. 29, 1977).
U.S. Pat. 2,985,589 (May 23,1961), D. B. Broughton and C. G. Gerhold (to Universal Oil Products Co.).
U.S. Pat. 3,040,777 (June 26,1962), D. B. Carson (to Universal Oil Products Co.).
U.S. Pat. 3,192,954 (July 6, 1965), C. G. Gerhold and D. B. Broughton (to Universal Oil Products Co.).
U.S. Pat. 3,268,604 (Aug. 23,1966), D. M. Boyd (to Universal Oil Products Co.).
U.S. Pat. 3,268,603 (Aug. 23,1966), D. M. Boyd (to Universal Oil Products Co.).
U.S. Pat. 3,131,232 (Apr. 28,1964), D. B. Broughton (to Universal Oil Products Co.).
T. Miyauchi and T. Vermeulen, Ind. Eng. Chem. Fundam. 2, 304 (1963).
S. Hardand and J. C. MecHenburgh, Chem. Eng. Sci. 21, 1209 (1966).
D. M. Ruthven and С. B. Ching, Chem. Eng. Sci. 44, 1011 (1989).
U.S. Pat. 3,208,833 (Sept. 28,1964), D. B. Carson (to Universal Oil Products Co.).
U.S. Pat. 3,214,247 (Oct. 26,1964), D. B. Broughton (to Universal Oil Products Co.).
U.S. Pat. 3,523,762 (Aug. 11,1970), D. B. Broughton (to Universal Oil Products Co.).
R. J. Schmidt, В. H. Johnson, and J. A. Weiszmann, 1987 National Petroleum Refiners Association Annual Meeting, San Antonio, Tex., Mar. 1987.
D. B. Broughton and R. C. Berg, Hydrocarbon Process. 48(6), 115 (1969).
D. B. Broughton and R. C. Berg, National Petroleum Refiners Association 1969 Annual Meeting, Mar. 23, 1969, technical paper AM-69-38.
J. A. Johnson, S. R. Raghuram, and P. R. Pujado, "Olex: A Process for Producing High Pudty Olefins," presented at the AIChE Summer National
Meeting, Minneapolis, Minn., Aug. 1987.
G. Koenig, ErdoelLohle 26, 323 (1973) (in German).
D. P. Thornton, Hydrocarbon Process. 49(11), 151 (1970).
F. H. Adams, Eur. Chem. News 62 (Oct. 13,1972).
R. W. Neuzil and R. A. Jensen, 85th National Meeting of the AIChE, Philadelphia, Pa., June, 1978.
A. J. de Rosset, R. W. Neuzil, and D. J. Korous, Ind. Eng. Chem. Proc. Des. Dev. 15, 261 (1978).
D. B. Broughton and L. C. Hardison, "Hydrocarbon-Type Separation by Unisorb," Paper presented at the 27th Midyear Meeting of the American
Petroleum Institute, Division of Refining, San Francisco, Calif., May 15, 1962.
U.S. Pat. 4,720,579 (Jan. 19,1988), S. Kulprathipanja (to UOP, Inc.).
U.S. Pat. 4,851,573 (June 25,1989), S. Kulprathipanja, J. Priegnitz, and A. R. Oroskar (to UOP, Inc.).
U.S. Pat. 4,851,574 (July 25,1989), S. Kulprathipanja (to UOP, Inc.).
U.S. Pat. 4,529,551 (1985), M. T. Cleary, S. Kulprathipanja, and R. W. Neuzil (to UOP, Inc.).
Kirk-Othmer Encyclopedia of Chemical Technology (4th Edition)
304
ADSORPTION, LIQUID SEPARATION
Voll
94. U.S. Pat. 4,534,900 (1985), M. T. Cleary (to UOP, Inc.).
95. U.S. Pat. 4,495,094 (1985), M. T. Cleary (to UOP, Inc.).
96. U.S. Pat. 4,495,106 (1985), M. T. Cleary and W. C. Laughlin (to UOP, Inc.).
97. U.S. Pat. 4,521,343 (1985), T. H. Chao and M. T. Cleary (to UOP, Inc.).
98. S. A. Gembicki, S. M. Shah, and M. T. Cleary, Pulp Chemicals Association, Pine Mountain, Ga., Mar. 10, 1983.
99. R. W. Johnson and E. Fritz, Patty Acids in Industry, Marcel Dekker, New York, 1989.
100. A. Benchikha and D. R. Garg, "The C4 Raffinate Treatment Process; Methanol Recovery/Oxygenate Removal," Presentation at HUELS MTBE
Symposium in Mad, West Germany, Sept. 6, 1988.
101. U.S. Pat. 4,402,832 (Sept. 6,1983), C. G. Gerhold (to UOP, Inc.).
102. U.S. Pat. 4,478,721 (Oct. 23,1984), C. G. Gerhold (to UOP, Inc.).
103. M. Wheaton and W. C. Bauman, I&EC Eng. and Proc. Dev. 45, 228 (1953).
104. H. Hongisto and H. Heikkila, Sugar Appear Sb, 60 (Mar. 1978).
105. W. H. Davis, J. I. Harper, and E. R. Weathedey, Pet. Refiner SI, 109 (1952).
106. C. J. King, Separation Processes, McGraw Hill, Inc., New York, 1971.
107. J. J. van Deemter, F. J. Zuiderweg, and A. IMinberg, Chem. Eng. Sci. 5, 271 (1956).
Stanley A. Gembicki
Anil R. Oroskar
James A. Johnson
UOP
Kirk-Othmer Encyclopedia of Chemical Technology (4th Edition)
305
Voll
ADSORPTIVE SEPARATION.
See Adsorption; Adsorption, gas separation; Adsorption, liquid separation.
Kirk-Othmer Encyclopedia of Chemical Technology (4th Edition)
306
ADVANCED CERAMICS
Voll
ADVANCED CERAMICS
Electronic ceramics,
Structural ceramics,
Kirk-Othmer Encyclopedia of Chemical Technology (4th Edition)
307
ELECTRONIC CERAMICS
Voll
ELECTRONIC CERAMICS
Electronic ceramics is a generic term describing a class of inorganic, nonmetallic materials utilized in the electronics industry. Although the term electronic
ceramics, or electroceramics, includes amorphous glasses and single crystals, it generally pertains to polycrystalline inorganic solids comprised of randomly
oriented crystallites (grains) intimately bonded together. This random orientation of small, micrometer-size crystals results in an isotropic ceramic
possessing equivalent properties in all directions. The isotropic character can be modified during the sintering operation at high temperatures or upon
cooling to room temperature by processing techniques such as hot pressing or poling in an electric or magnetic field (see Ceramics as ELECTRICAL materials).
The properties of electroceramics are related to their ceramic microstructure, ie, the grain size and shape, grain—grain orientation, and grain
boundaries, as well as to the crystal structure, domain configuration, and electronic and defect structures. Electronic ceramics are often combined with
metals and polymers to meet the requirements of a broad spectrum of high technology appEcations, computers, telecommunications, sensors (qv), and
actuators. Roughly speaking, the multibillion dollar electronic ceramics market can be divided into six equal parts as shown in Figure 1. In addition to
SiO2-based optical fibers and displays, electronic ceramics encompass a wide range of materials and crystal structure families (see Table 1) used as
insulators, capacitors, piezoelectrics, magnetics, semiconductor sensors, conductors, and the recendy discovered high temperature superconductors. The
broad scope and importance of the electronic ceramics industry is exemplified in Figure 2, which schematically displays electroceramic components utilized
in the automotive industry. Currently, the growth of the electronic ceramic industry is driven by the need for large-scale integrated circuitry giving rise to
new developments in materials and processes. The development of multilayer packages for the microelectronics industry, composed of multifunctional
three-dimensional ceramic arrays called monolithic ceramics (MMC), continues the miniaturization process begun several decades ago to provide a new
generation of robust, inexpensive products.
Fig. 1. Electronic ceramics market (1).
Oxygen sensor
Lean mixture sensor
Knock sensor
Coolant temperature sensor
Piezoelectric buzzer
LED laser
Fluorescent tube
EL display
Automatic choke heater
Early fuel evaporation
heater
Spark plug
Distributor rotor
Light sensor
Mechanical seal
Rocker arm pad
Humidity sensor
Cool and hot box heater
Fuel level sensor
Motor core
Quick heater
PTC resistor
Rain
sensor
Ultrasonic wave
sensor
Glow plug
Fuel heater
Swirl chamber
Piston ring
Turbo rotor
Exhaust gas temperature sensor
Catalytic substrate
Heat insulator
Hybrid IC printed circuit board
IC package
Capacitors
Resistors
Fig. 2. Electronic ceramics for automotive applications. Courtesy of Nippon Denso, Inc.
Table 1. Electronic Ceramic Functions and Products
Function
Material
Products
insulators
porcelain, glass, steatite
high voltage insulation
Kirk-Othmer Encyclopedia of Chemical Technology (4th Edition)
308
ELECTRONIC CERAMICS
Voll
packaging
capacitors (energy storage)
piezoelectrics
magnetics
semiconductors
conductors
Al^, BeO, AIN
BaTiO3, SrTiO3, TiO2
Pb(Zq Ti)O3, SiO2 (quartz)
Mn1 Znl ;c.O, Nq Znl ;c.O
(Ba,La)TiO3, V2O3, Fe2 Ti ( Z , ZnO—BqO^
MgCqO4-TiO2, CdS, SiC
Ru( ) ,\a\l(), Zr Y CL , YBa0Cu,O7
2’ 11 1/’ 1 - 2x 2x 2 - № 2 3 /
S’
IC substrates, packages (MMCs)
multilayer and barrier layer capacitors
vibrators, oscillators, filters, motors, and actuators
inductors, transformers, memory devices
PTC, NTC-thermistors, varistors, pH sensor, humidity
sensor, solar cells, electric heater
resistors (thick film), solid electrolytes, oxygen sensors,
superconductors
aMMC = multicomponent components; PTC = positive temperature coefficient; NTC = negative temperature coefficient.
Structure-Property Relations
An overview of the atomistic and electronic phenomena utilized in electroceramic technology is given in Figure 3. More detailed discussions of
compositional families and structure—property relationships can be found in other articles. (See for example, Ferroelectrics and Magnetic materials.)
Fig. 3. An overview of atomistic mechanisms involved in electroceramic components and the corresponding uses: (a) ferroelectric domains: capacitors and
piezoelectrics, PTC thermistors; (b) electronic conduction: NTC thermistor; (c) insulators and substrates; (d) surface conduction: humidity sensors; (e)
ferrimagnetic domains: ferrite hard and soft magnets, magnetic tape; (f) metal—semiconductor transition: critical temperature NTC thermistor; (g) ionic
conduction: gas sensors and batteries; and (h) grain boundary phenomena: varistors, boundary layer capacitors, PTC thermistors.
Multilayer capacitors, piezoelectric transducers, and positive temperature coefficient (PTC) thermistors make use of the ferroelectric properties of
barium titanate(IV) [12047-27-7]BaTiO3, and lead zirconate titanate [12626-81 -2]. On cooling from high temperature, these ceramics undergo phase
transformations to polar structures having complex domain patterns. Large peaks in the dielectric constant accompany the phase transitions where the
electric dipole moments are especially responsive to electric fields. As a result, modified compositions of barium titanate, BaTiO3, are widely used in the
multilayer capacitor industry and most piezoelectric transducers are made from lead zirconate titanate, PbZr^^. TirO3, (PZT) ceramics. Applying a large de
field (poling) aligns the domains and makes the ceramic piezoelectric. The designation PZT is a registered trademark of Vernitron, Inc.
Similar domain phenomena are observed in ferrimagnetic oxide ceramics such as manganese ferrite [12063-10-4]y MnFe2O4, and BaFe21O17, but the
underlying mechanism is different. The unpaired spins of Fe3+ and Mn2+ ions give rise to magnetic dipole moments which interact via neighboring oxygen
ions through a super-exchange mechanism. The magnetic dipoles are randomly oriented in the high temperature paramagnetic state, but on cooling
through the Curie temperature, Tc, align to form magnetic domains within the ceramic grains. The peak in the magnetic permeability at T~ is analogous to
the peakin the dielectric constant of ferroelectric ceramics. Domain walls move easily in soft ferrites (qv) like MnFe2O4 and y-Fe2O3, which are used in
transformers and magnetic tape. In barium ferrite [11138-1 7-7/, the spins are firmly locked to the hexagonal axis, making it useful as a permanent magnet.
Several kinds of conduction mechanisms are operative in ceramic thermistors, resistors, varistors, and chemical sensors. Negative temperature
coefficient (NTC) thermistors make use of the semiconducting properties of heavily doped transition metal oxides such as я-type Fe2 Ti O ? andq-type
Nq _ Li O. Thick film resistors are also made from transition-metal oxide solid solutions. Glass-bonded Bq ^Pb^IhqOy _ x having the pyrochlore
[12174-36-6] structure is typical.
Phase transitions are involved in critical temperature thermistors. Vanadium, VO2, and vanadium trioxide [1314-34-7]> V2O3, have
semiconductors—metal transitions in which the conductivity decreases by several orders of magnitude on cooling. Electronic phase transitions are also
observed in superconducting ceramics like YBaNmCL , but here the conductivity increases sharply on cooling through the phase transition.
Ionic conductivity is used in oxygen sensors and in batteries (qv). Stabilized zirconia, Zq _ CaCL _ has a very large number of oxygen vacancies
and very high O2- conductivity. (B-Alumina [12005-48-0]y NaAL^O^, is an excellent cation conductor because of the high mobility of Na+ ions. Ceramics
of P~alumina are used as the electrolyte in sodium-sulfur batteries.
Surface conduction is monitored in most humidity sensors through the use of porous ceramics of MgCr2O4—TiO2 that adsorb water molecules
which then dissociate and lower the electrical resistivity.
Grain boundary phenomena are involved in varistors, boundary layer capacitors, and PTC thermistors. The formation of thin insulating layers
between conducting grains is crucial to the operation of all three components. The reversible electric breakdown in varistors has been traced to quantum
mechanical tunneling through the thin insulating barriers. In a BaTiO3~PTC thermistor, the electric polarization associated with the ferroelectric phase
transition neutralizes the insulating barriers, causing the ceramic to lose much of its resistance below TQ. Boundary layer capacitors have somewhat thicker
barriers which cannot be surmounted, and hence the ceramic remains an insulator. However, the movement of charges within the conducting ceramic
grains raises the dielectric constant and increases the capacitance.
Lasdy, the importance of electroceramic substrates and insulators should not be overlooked. Here one strives to raise the breakdown strength by
eliminating the interesting conduction mechanisms just described. Spark plugs, high voltage insulators, and electronic substrates and packages are made
from ceramics like alumina, mullite [55964-99-3]^ and porcelain [1332-58-7].
Kirk-Othmer Encyclopedia of Chemical Technology (4th Edition)
309
ELECTRONIC CERAMICS
Voll
Electroceramic Processing
Fabrication technologies for all electronic ceramic materials have the same basic process steps, regardless of the application: powder preparation, powder
processing, green forming, and densification.
Powder Preparation. The goal in powder preparation is to achieve a ceramic powder which yields a product satisfying specified performance
standards. Examples of the most important powder preparation methods for electronic ceramics include mixing/calcination, coprecipitation from solvents,
hydrothermal processing, and metal organic decomposition. The trend in powder synthesis is toward powders having particle sizes less than 1 pm and little
or no hard agglomerates for enhanced reactivity and uniformity. Examples of the four basic methods are presented in Table 2 for the preparation of
BaTiO3 powder. Reviews of these synthesis techniques can be found in the literature (2,5).
Table 2. Methods Used to Prepare BaTiO3 Electronic Ceramic Powders
Method Reaction Particle size
mixing/calcination BaCO3 + TiO2 > лт BaTiO3 + CO2 f 1 pm to 100s of pm
. . . b coprecipitation Ba2+ +TiO2+2C,OL >H’° BaTi(C2O),4H2O >AT BaTiO3 +4H2Of +4COJ if calcined, mean size of M).5 pm after milling
hydrothermal Ba2+ + TiO2 + H2O » °® p BaTiO3 + 2 H2O nanosize to 50 pm
metal organic Ba(i-OC3H7 )2 + Ti(OC4H9 )4 + 3 H2O BaTiO3 + 2 C3H7OH + 4 C4H9OH 5.0—35.0 nm, depending upon
decomposition0 calcination conditions
aRef. 2.
b Ref. 3.
C Ref. 4.
The mixing of components followed by calcination to the desired phase(s) and then milling is the most widely used powder preparation method (2).
Mixing/calcination is straightforward, and in general, the most cost effective use of capital equipment. However, the high temperature calcination produces
an agglomerated powder which requires milling. Contamination from grinding media and mill lining in the milling step can create defects in the
manufactured product in the form of poorly sintered inclusions or undesirable compositional modification. Furthermore, it is difficult to achieve the
desired homogeneity, stoichiometry, and phases for ceramics of complex composition.
Coprecipitation is a chemical technique in which compounds are precipitated from a precursor solution by the addition of a precipitating agent, for
example, a hydroxide (5). The metal salt is then calcined to the desired phase. The advantage of this technique over mixing/calcination techniques is that
more intimate mixing of the desired elements is easily achieved, thus allowing lower calcination temperatures. Limitations are that the calcination step may
once again result in agglomeration of fine powder and the need for milling. An additional problem is that the ions used to provide the soluble salts (eg,
chloride from metal chlorides) may linger in the powder after calcination, affecting the properties in the sintered material.
Hydrothermal processing uses hot (above 100°C) water under pressure to produce crystalline oxides (6). This technique has been widely used in the
formation process of A12O3 (Bayer Process), but not yet for other electronic powders. The situation is expected to change, however. The major advantage
of the hydrothermal technique is that crystalline powders of the desired stoichiometry and phases can be prepared at temperatures significantly below those
required for calcination. Another advantage is that the solution phase can be used to keep the particles separated and thus minimize agglomeration. The
major limitation of hydrothermal processing is the need for the feedstocks to react in a closed system to maintain pressure and prevent boiling of the
solution.
Metal organic decomposition (MOD) is a synthesis technique in which metal-containing organic chemicals react with water in a nonaqueous solvent
to produce a metal hydroxide or hydrous oxide, or in special cases, an anhydrous metal oxide (7). MOD techniques can also be used to prepare nonoxide
powders (8,9). Powders may require calcination to obtain the desired phase. A major advantage of the MOD method is the control over purity and
stoichiometry that can be achieved. Two limitations are atmosphere control (if required) and expense of the chemicals. However, the cost of metal organic
chemicals is decreasing with greater use of MOD techniques.
Powder Processing. A basic guideline of powder manufacturing is to do as little processing as possible to achieve the targeted performance
standards (see Powders, handling). Ceramic powder fabrication is an iterative process during which undesirable contaminants and defects can enter into
the material at any stage. Therefore, it is best to keep the powder processing scheme as simple as possible to maintain flexibility. Uncontrollable factors
such as changes in the characteristics of as-received powders must be accommodated in the processing from batch to batch of material. Keeping the
processing simple is not always possible: the more complex the material system, the more complex the processing requirements.
A fundamental requirement in powder processing is characterization of the as-received powders (10—12). Many powder suppliers provide
information on tap and pour densities, particle size distributions, specific surface areas, and chemical analyses. Characterization data provided by suppliers
should be checked and further augmented where possible with in-house characterization. Uniaxial characterization compaction behavior, in particular, is
easily measured and provides data on the nature of the agglomerates in a powder (13,14).
Milling is required for most powders, either to reduce particle size or to aid in the mixing of component powders (15). Commonly employed types
of comminution include ball milling, and vibratory, attrition, and jet milling, each possessing advantages and limitations for a particular application. For
example, ball milling is well-suited to powder mixing but is rather inefficient for comminution.
Green Forming. Green forming is one of the most critical steps in the fabrication of electronic ceramics. The choice of green forming
technique depends on the ultimate geometry required for a specific application. There are many different ways to form green ceramics, several of which are
summarized in Table 3. Multilayer capacitors require preparation and stacking of two-dimensional ceramic sheets to obtain a large capacitance in a small
volume. Techniques used to prepare two-dimensional sheets of green ceramic, including tape casting, (16—22) are discussed later under processing of
multilayer ceramics. Manufacturing methods for ceramic capacitors have been reviewed (23).
Table 3. Green Forming Procedures for Electronic Ceramics
Green forming method Geometries Applications
uniaxial pressing disks, toroids, plates disk capacitors, piezo transducers, magnets
cold isostatic pressing complex and simple spark plugs, ZrO2—O2 sensors
colloidal casting complex shapes crucibles, porcelain insulators
extrusion thin sheets (>80 pm), rods, tubes, honeycomb substrates substrates, thermocouple insulator, catalytic converters, PTC thermistor heaters
injection molding small complex shapes (<1.0 cm) ZrO2~O2 sensors
Uniaxial pressing is the method most widely used to impart shape to ceramic powders (24). Binders, lubricants, and other additives are often
incorporated into ceramic powders prior to pressing to provide strength and assist in particle compaction (25). Simple geometries such as rectangular
Kirk-Othmer Encyclopedia of Chemical Technology (4th Edition)
310
ELECTRONIC CERAMICS
Voll
substrates for integrated circuit (IC) packages can be made by uniaxial pressing (see Integrated circuits).
More complex shapes can be made by cold isostatic pressing (CIP). CIP uses deformable rubber molds of the required shape to contain the
powder. The appEcation of isostatic pressure to the mold suspended in a pressure transfer media, such as oil, compacts the powder. CIP is not as easily
automated as uniaxial pressing, but has found wide application in the preparation of more complex shapes such as spark plug insulators (26).
Slip or colloidal casting has been used to make complex shapes in the whiteware industry for many years (24). Other work has shown that colloidal
casting can be used to produce electronic ceramic materials having outstanding strength because hard agglomerates can be eliminated in the suspension
processing (27—29). Colloidal casting uses a porous mold in which the fine particles in a colloidal suspension accumulate because of capillary forces at the
wall surface of the mold. Relatively dense packing of the particles, to approximately 60% of theoretical density, can be achieved. More importandy, hard
aggregates can be eliminated from the colloid by suitable powder selection and processing. Drying of the resulting material may not be trivial and sections
greater than about %L25 cm thick are sometimes difficult to obtain.
In addition to being the preferred forming technique for ceramic rods and tubes, extrusion processes are used to fabricate the thick green sheets
used in many electronic components (24,30,31). The smallest thickness for green sheets prepared by extrusion techniques is about 80 |lm. Organic
additives similar to those used in tape casting are employed to form a high viscosity plastic mass that retains its shape when extruded. The extrusion
apparatus, schematically shown in Figure 4, consists of a hopper for introduction of the plasticized mass, a de-airing chamber, and either a screw-type or
plunger-type transport barrel in which the pressure is generated for passage of the plastic mass through a die of the desired geometry. The plastic mass is
extruded onto a carrier belt and passed through dryers to relax the plastic strain remaining after extrusion. The green sheet can be stamped or machine
diced to form disks, wafers, or other platelike shapes.
Fig. 4. Schematic of extrusion type apparatus for green sheet fabrication.
Injection molding is particularly suited to mass production of small complex shapes with relatively small (<1.0 cm) cross sections (32—34). Powders
are mixed using thermoplastic polymers and other organic additives. A molten mass composed of the ceramic and a thermoplastic binder system are
injected via a heated extruder into a cooled mold of desired shape. The organic is burned out and the ceramic consolidated. Machining fragments from the
green ceramic can be recycled because the thermoplastic polymers can be reversibly heated. Molds can be relatively expensive so injection molding is best
suited to the preparation of a large number of single parts. Because of the high organic content required, organic removal is not trivial. Green sections
greater than 1.0 cm thick require slow heating rates during burnout to avoid bloating and delamination of the green ceramic.
Densification. Densification generally requires high temperatures to eliminate the porosity in green ceramics. Techniques include pressureless
sintering, hot-pressing, and hot isostatic pressing (HIP). Pressureless sintering is the most widely used because of ease of operation and economics.
Hot-pressing is limited to relatively simple shapes whereas more complex shapes can be consolidated using HIP (35). Sintering is used for most oxide
electronic ceramics. Hot-pressing and HIP, which employ pressure and high temperatures, are used to consolidate ceramics in which dislocation motion
(leading to pore elimination) is sluggish. Both techniques are particularly useful for nonoxide materials such as silicon nitride [12033-89-5] and silicon
carbide [409-21-2] (35,36) (see Carbides; Nitrides).
Special precautions are often used in the sintering of electronic ceramics. Heating rates and hold times at maximum temperature are critical to
microstructural development and grain size control. Sintering cycles may include intermediate temperature annealing or controlled cooling to relieve residual
strains or avoid deleterious phase transformations. Atmosphere control may be important to prevent loss of volatile components or avoid reduction
reactions. In continuous production, sequential burnout (organics) and sintering may take place in the same furnace, requiring complex temperature cycles
even for relatively simple devices. Complex devices such as thick film circuits and monolithic multicomponent ceramics may require many sequential
fabrication and sintering steps.
Processing of Multilayer Ceramics
Rapid advances in integrated circuit technology have led to improved processing and manufacturing of multilayer ceramics (MLC) especially for capacitors
and microelectronic packages. The increased reliability has been the result of an enormous amount of research aimed at understanding the various
microstructural—property relationships involved in the overall MLC manufacturing process. This includes powder processing, thin sheet formation,
metallurgical interactions, and testing.
Presendy, multilayer capacitors and packaging make up more than half the electronic ceramics market. For multilayer capacitors, more than 20 billion
units are manufactured a year, outnumbering by far any other electronic ceramic component. Multilayer ceramics and hybrid packages consist of alternating
layers of dielectric and metal electrodes, as shown in Figures 5 and 6, respectively. The driving force for these compact configurations is miniaturization.
For capacitors, the capacitance (Q measured in units of farads, F, is
t
where A is the dielectric constant (unitless); SQ the permittivity of free space = 8.85 x 10⁻¹² F/m; A the electrode area, m2; and / the thickness of dielectric
layer, m. Thus C increases with increasing area and number of layers and decreasing thickness. Typical thicknesses range between 15 and 35 |lm. Similarly,
for substrate packages, the multilayer configuration incorporates transversely integrated conductor lines and vertical conducting paths (vias) allowing for
numerous interconnects to components throughout the device system and power distribution in a relatively small space. MLC substrates capable of
providing 12,000 electrical connections containing 350,000 vias are currently manufactured (38,39).
Kirk-Othmer Encyclopedia of Chemical Technology (4th Edition)
311
ELECTRONIC CERAMICS
Voll
Ceramic
Fig. 5. Schematic cross section of a conventional MLC capacitor.
Fig. 6. Schematic of a MLC substrate for microelectronic packaging (37).
A number of processing steps, shown in Figure 7, are used to obtain the multilayer configuration(s) for the ceramic-metal composites. The basic
process steps are slip preparation, green tape fabrication, via-hole punching (packages), printing of internal electrodes or metallization, stacking and
laminating, dicing or dimensional control, binder burnout, sintering, end termination, and encapsulation. After each processing step, quaEty control in the
form of nondestructive physical and electrical tests ensures a uniform end-product.
Fig. 7. Fabrication process for MLC capacitors. Steps are (a) powder; (b) slurry preparation; (c) tape preparation; (d) electroding; (e) stacking; (f)
lamination; (g) dicing; (h) burnout and firing; and (i) termination and lead attachment.
The basic building block, the ceramic green sheet, starts using a mixture of dielectric powder suspended in an aqueous or nonaqueous Equid system
or vehicle comprised of solvents, binders, plasticizers, and other additives to form a sEp that can be cast in thin, relatively large area sheets. The purpose of
the binder (20,000—30,000 molecular weight polymers) is to bind the ceramic particles together to form flexible green sheets. Electrodes are screened on the
tape using an appropriate paste of metal powders. Solvents play a number of key roles, ranging from deagglomeration of ceramic particles to control the
viscosity of the cast sEp, to formation of microporosity in the sheet as the solvent evaporates. Plasticizers, ie, small to medium sized organic molecules,
decrease cross-linking between binder molecules, imparting greater flexibiEty to the green sheet. Dispersants, typically 1,000 to 10,000 molecular weight
polymer molecules, are added to sEps to aid in the de-agglomeration of powder particles, allowing for higher green densities in the cast tape. Several review
Kirk-Othmer Encyclopedia of Chemical Technology (4th Edition)
312
ELECTRONIC CERAMICS
Voll
articles on the functional additives in tape cast systems are available (16,17,25,40—44). The resulting slip should have pseudoplastic rheological behavior so
that the slip flows during high shear rate casting operations, but displays litde or no flow afterward, thus maintaining tape dimension (45)).
There are several methods to make large ceramic sheets for MLC manufacturing (17—23). The methods include glass, belt and carrier film casting,
and wet lay down techniques. The relative advantages and limitations of each technique have been reviewed (46). The two most commonly employed
techniques, belt casting and doctor blading, are depicted schematically in Figure 8.
Glass bed
(b)
Fig. 8. Schematic of methods for MLC manufacturing; (a) belt casting; (b) carrier film casting using a doctor blade.
Metallization of the green sheets is usually carried out by screen printing, whereby a suitable metal ink consisting of metal powders dispersed in resin
and solvent vehicles is forced through a patterned screen. Palladium [7440-05-3] and silver—palladium (Ag:Pd) alloys are the most common form of
metallization; tungsten [7440-33-7] and molybdenum [7439-98-7] are used for high (>1500° C) temperature MLCs (47—52). Following screening, the
metallized layers are stacked and laminated to register (align) and fuse the green sheets into a monolithic component. Proper registration is crucial to
achieve and maintain capacitance design (MLC capacitors) and for proper via-hole placement in MLC packages.
Sintering is the most complex process in MLC fabrication. Ideally, the binder burnout and sintering steps are performed during the same
temperature cycle and in the same atmosphere. Most binders bum out by 500°C, well before pore closure in the densification of most ceramics. Sintering
behavior of the many different MLC components must be reconciled to achieve a dense material. Internal metallization and the dielectric must со-fire in a
single process. Firing temperatures are related to material composition and can be adjusted using additives. Densification rates are related both to the
process temperature and to particle characteristics (size, size distribution, and state of agglomeration). Thus, the burnout and sintering conditions depend
heavily on the system.
After densification, external electrode termination and leads are attached for MLC capacitor components, and pin module assembly and IC chip
joining is carried out for MLC packages. The devices are then tested to ensure performance and overall reliability.
Thick Film Technology
Equally important as tape casting in the fabrication of multilayer ceramics is thick film processing. Thick film technology is widely used in microelectronics
for resistor networks, hybrid integrated circuitry, and discrete components, such as capacitors and inductors along with metallization of MLC capacitors
and packages as mentioned above.
In principle, the process is equivalent to the silk-screening technique whereby the printable components, paste or inks, are forced through a screen
with a rubber or plastic squeegee (see Fig. 7). Generally, stainless steel or nylon filament screens are masked using a polymeric material forming the desired
printed pattern in which the composition is forced through to the underlying substrate.
Thick film compositions possess three parts: (7) functional phase, (2) binder, and (J) vehicle. The functional phase includes various metal powders
for conductors, electronic ceramics for resistors, and dielectrics for both capacitors and insulation. Examples of typical components for thick film
compositions are given in Table 4. The binder phase, usually a low (<1000° C) melting glass adheres the fired film to the substrate whereas the fluid vehicle
serves to temporarily hold the unfired film together and provide proper rheological behavior during screen printing. Thick film processing for hybrid
integrated circuits typically takes place below 1000°C providing flexible circuit designs.
Table 4. Components of Thick Film Compositions*
Component Composition
functional phase conductor Au, Pt/Au Ag, Pd/Ag Cu, Ni
resistor RuO2 LaB, 6
dielectric BaTiO3
Kirk-Othmer Encyclopedia of Chemical Technology (4th Edition)
313
ELECTRONIC CERAMICS
Voll
binder
vehicle
aRef. 53
glass
glass—ceramic
ai2o3
glass: borosilicates, aluminosilicates
oxides: CuO, CdO
volatile phase: terpineol, mineral spirits
nonvolatiles: ethyl cellulose, acrylates
Current and Future Developments in Multilayer Electronic Ceramics
Advances in the field of electronic ceramics are being made in new materials, novel powder synthesis methods, and in ceramic integration. Monolithic
multicomponent components (MMC) take advantage of three existing technologies: (7) thick film methods and materials, (2) MLC capacitor processes,
and (3) the concept of cofired packages as presented in Figure 9. Figure 10 shows an exploded view of a monolithic multicomponent ceramic substrate.
Fig. 9. Monolithic multilayer ceramics (MMCs) derived from multilayer capacitor, high temperature cofire, and thick film technologies.
Brazed input/output pins
Fig. 10. Exploded view of a monolithic multicomponent ceramic substrate. Layers (a) signal distribution; (b) resistor; (c) capacitor; (d) circuit protection;
and (e) power distribution are separated by (f) barrier layers.
New materials for packaging include aluminum nitride [24304-00-5]> AIN, silicon carbide [409-21 -2]y SiC, and low thermal expansion glass-ceramics,
replacing present day alumina packaging technology. As shown in Table 5, these new materials offer significant advantages to meeting the future
requirements of the microelectronics industry. Properties include higher thermal conductivity, lower dielectric constant, cofire compatibility, and related
packaging characteristics such as thermal expansion matching of silicon and high mechanical strength as compared to A12O3.
Table 5. Properties of High Performance Ceramic Substrates*
Properties AIN SiC Glass-ceramics 90% A12O3
thermal conductivity, W/(m-K) 230 270 5 20
thermal expansion coefficient, 43 37 30-42 67
RT — 400°C x 10-7/°Cb
dielectric constant at 1 MHz 8.9 42 3.9-7.8 9.4
flexural strength, kg/cm2 3500-4000 4500 1500 3000
Kirk-Othmer Encyclopedia of Chemical Technology (4th Edition)
314
ELECTRONIC CERAMICS
Voll
thin film metals Ti/Pd/Au Ni/Cr/Pd/Au Ti/Cu Cr/ Cu, Au Cr/ Cu
thick film metals Ag—Pd Cu Au Ag—Pd Au, Cu, Ag—Pd Ag—Pd Cu, Au
cofired metals cooling capabiEty, °C/W w Mo Au—Cu, Ag—Pd W,Mo
ah 6 5 60 30
water <1 <1 <1 <1
aRef. 39.
k RT = room temperature.
External cooling.
Greater dimensional control and thinner tapes in multilayer ceramics are the driving forces for techniques to prepare finer particles. Metal organic
decomposition and hydrothermal processing are two synthesis methods that have the potential to produce submicrometer powders having low levels of
agglomeration to meet the demand for more precise tape fabrication.
As stated above, the development of multifunctional MLCs based on existing technologies offers excellent growth potential since MMCs combine
the possibilities of both the high cofire (packaged) substrates and burial of surface devices (54—57). Burial of surface devices promises gains in both circuit
density and device hermiticity, leading to increased reliability. Processing trade-offs are expected since current electronic materials for multilayer appEcations
(capacitors, transducers, sensors) are densified at very different firing temperatures. Consequently, integrated components will likely be of lower tolerance
and limited range, at least in the early developmental stages. Current efforts have been directed toward incorporation of multilayer capacitor-type power
planes and burial of thick film components, including resistors and capacitors. The latter processing technology offers more immediate possibilities as it is
developed to cofire at conventional thick film processing temperatures for which a wide range of materials exist.
The continuing miniaturization of electronic packaging should see the replacement of components and processes using such thin film technologies
developed for semiconductors as sputtering, chemical vapor deposition, and sol—gel (see Sol-gel technology; Thin films) (58,59). Sputtering is the process
whereby a target material is bombarded by high energy ions which liberate atomic species from the target for deposition on a substrate. Chemical vapor
deposition (CVD) involves a gaseous stream of precursors containing the reactive constituents for the desired thin film material, generally reacted on a
heated substrate. The more recent process for thin films, sol—gel, uses a nonaqueous solution of metal—organic precursor. Through controlled hydrolyses,
a thin, adherent film is prepared by dip-coating or spin-coating. The dried "gel" film is then crystallized and densified through heat treatments. Both
existing and future developments of thin film electronic ceramics and methods are presented in Table 6.
Table 6. Current and Future Developments in Thin Film Electronic Ceramics*
Material AppEcation Methods
PT, PZT, PLZT nonvolatile memory, h, pyroelectric detectors, sol—gel, sputtering electro—optic waveguide, and spatial light modulators
diamond (C) cutting tools, high temperature semiconductors, chemical vapor deposition protective optical coatings (CVD)
SiO2, BaTiO3 capacitors sol—gel, sputtering, chemical vapor deposition (CVD)
1:2:3 superconductors squids, nmr, interconnects
a Refs. 58 and 59.
BIBLIOGRAPHY
1. Japan Electronics Almanac, Dempa Publications, Inc., Tokyo, 1986, p. 412.
2. D. W. Johnson in G. Y. Chin, ed., Advances in Powder Technology, American Society for Metals, Metals Park, Ohio, 1982, pp. 23—37.
3. K. Osseo-Asare, F. J. Arriagada, and J. H. Adair, "Solubility Relationships in the Coprecipitation Synthesis of Barium Titanate: Heterogeneous
Equilibria in the Ba—Ti— C2O4—H2O System," in G. L. Messing, E. R. Fuller, Jr., and Hans Hausin, eds., Ceramic Powder Science, Vol. 2,1987, pp.
47-53.
4. D. Miller, J. H. Adair, W. Huebner, and R. E. Newnham, "A Comparative Assessment of Chemical Synthesis Techniques for Barium Titanate,"
Paper, 88th Annual Meeting of the American Ceramic Society, Pittsburgh, Pa., April 27—30, 1987.
5. B. J. Mulder, Am. Ceram. Soc. Bull 49(11), 990-993 (1970).
6. E. P. Stambaugh and J. F. Miller, "Hydrothermal Precipitation of High QuaEty Inorganic Oxides," in S. Somiya, ed., Proceedings of First International
Symposium on FJydrothermalB.eactions, Gakujutsu Bunken Fukyu-kai (c/o Tokyo Institute of Technology), Tokyo, Japan, 1983, pp. 859—872.
7. K. S. Mazdiyasni, С. T. Lynch, and J. S. Smith,/. Ceram. Soc. 48(7), 372—375 (1965).
8. R. R. Wills, R. A. Markle, and S. P. Mukherjee, Am. Ceram. Soc. Bull. 62(8), 904-911 (1983).
9. R. West, X.-H. Zhang, I. P. Djurovich, and H. Stuger, "Crosslinking of Polysilanes as SiEcon Carbide Precursors," in L. L. Hench and D. R.
Ulrich, eds., Science of Ceramic Chemical Processing,] ohn Wiley & Sons, New York, 1986, pp. 337—344.
10. К. K. Vema and A. Roberts in G. Y. Onoda, Jr., and L. L. Hench, eds., Ceramic Processing Before Firing,4 John Wiley & Sons, Inc., New York, 1978,
pp. 391-407.
11. J. H. Adak, A. J. Roese, and L. G. McCoy, "Particle Size Analysis of Ceramic Powders," in К. M. Nair, ed., Advances in Ceramics, Vol. 2, The
American Ceramic Society, Columbus, Ohio, 1984.
12. J. W. McCauley, Am. Chem. Soc. Bull. 63(2), 263-265 (1984).
13. G. L. Messing, C. J. Markhoff, and L. G. McCoy, Am. Ceram. Soc. Bull. 61(8), 857—860 (1982).
14. D. E. Niesz and R. B. Bennett, in ref. 10, pp. 61—73.
15. C. Greskovich, "Milling" in F. F. Y. Wang, ed., Treatise on Materials Science and Technology, Vol. 9, Academic Press, New York, 1976.
16. R. E. Mistier, D. J. Shanefield, and R. B. Runk, in ref. 10, pp. 411—448.
17. J. C. Wilhams, "Doctor-Blade Process," in F. F. Y. Wang, ed., Treatise on Materials Science and Technology, Vol. 9, Academic Press, New York, 1976.
18. U.S. Pat. 3,717,487 (1973) (to Sprague Electric Company).
19. B. Schwartz and D. L. Wilcox, Ceramic Age, 40—44 (June 1967).
20. R. B. Runk and M. J. Andrejco, Am. Ceram. Soc. Bull. 54(2), 199—200 (1975).
Kirk-Othmer Encyclopedia of Chemical Technology (4th Edition)
315
ELECTRONIC CERAMICS
Voll
21.
22.
23.
24.
25.
26.
27.
28.
29.
30.
31.
32.
33.
34.
35.
36.
37.
38.
39.
40.
41.
42.
43.
44.
45.
46.
47.
48.
49.
50.
51.
52.
53.
54.
55.
56.
57.
58.
59.
C. Wentworth and G. W. Taylor, Am. Ceram. Soc. Bull. 46(12), 1186—1193 (1967).
R. E. Mistier, Am. Ceram. Soc. Bull 52(11), 850-854 (1973).
J. M. Herbert, Methods of Preparation, Ceramic Dielectrics and Capacitors, Gordon and Breach Science Publishers, New York, 1985, Chapt. 3.
F. H. Norton, FormingPlastic Masses, Fine Ceramics: Technology and Applications, Robert E. Krieger Publishing, Huntington, NY, 1978, Chapt. 10.
T. Morse, Handbook of Organic Additivesfor Use in Ceramic Body Formulation, Montana Energy and MHD Research and Development Institute, Inc.,
Butte, Mont., 1979.
D. B. Quinn, R. E. Bedford, and F. L. Kennard, "Dry-Bag Isostatic Pressing and Contour Grinding of Technical Ceramics," in J. A. Mangels and
G. L. Messing, efts., Advances in Ceramics, Vol. 9 (Forming of Ceramics), 1984, pp. 4—31.
I. A. Aksay, F. F. Lange, and В. I. Davis,/. Am. Ceram. Soc. 66(10), C190—C192 (1983).
F. F. Lange, В. I. Davis, and E. Wright, J. Am. Ceram. Soc. 69(1), 66—69 (1986).
I. A. Aksay and С. H. Schilling, in ref. 26, pp. 85—93.
G. N. Howatt, R. G. Breckenridge, and J. M. Brownlow, J. Am. Ceram. Soc. 30(8), 237—242 (1947).
J. J. Thompson, Am. Ceram. Soc. Bull. 42(9), 480—481 (1963).
J. A. Mangels and W. Treia, in ref. 26, pp. 85—93.
T. J. Whalen and C. F. Johnson, Am. Ceram. Soc. Bull. 60(2), 216—220 (1981).
M. J. Edirisinghe and J. R. G. Evans, Int. J. High Technol. Ceram. 2(1), 1—31 (1986).
R. R. Wills, M. C. Brockway, and L. G. McCoy, "Hot Isostatic Pressing of Ceramic Materials," in R. F. Davis, H. Palmour III, and R. L. Porter,
eds., Materials Science Research, Vol. 17 (Emergent Process Methods for High-Technology Ceramics), Plenum Press, New York, 1984.
M. H. Leipold, "Hot Pressing," in F. F. Y. Wang, ed., Treatise on Materials Science and Technology, Vol. 9 (Ceramic Fabrication Processes), Academic
Press, New York, 1976.
A. J. Blodgett, Jr., Sci. Am. 249(1), 86-96 (1983).
R. R. Tummala and E. J. Rymaszewski, Microelectronics PackagingHandbook, Van Nostrand Reinhold, New York, 1989.
R. R. Tummala, Am. Ceram. Soc. Bull. 67(4), 752—758 (1988).
D. J. Shanefield and R. S. Misder, Am. Ceram. Soc. Bull. 53(5), 416—420 (1974).
D. J. Shanefield and R. S. Mistier, Am. Ceram. Soc. Bull. 53(8), 564—568 (1974).
R. A. Gardner and R. W. Nufer, Solid State Technol. (May 8—13,1974).
A. G. Pincus and L. E. Shipley, Ceram. Ind. 92(4), 106—110 (1969).
N. Sarkar and G. K. Greminger, Jr. Am. Ceram. Soc. Bull. 62(11), 1280—1284 (1983).
G. Y. Onoda, Jr., in ref. 10, pp. 235—251.
J. H. Adair, D. A. Anderson, G. O. Dayton, and T. R. Shrout,/. Mater. Ed. 9(1,2), 71—118 (1987).
D. A. Chance, Met. Trans. 1, 685—694 (March 1970).
I. Bum and G. H. Maher,/. Mater. Sci. 10, 633—640 (1975).
U.S. Pat. 4,075,681 (Feb. 1978), M. J. Popowich.
T. L. Rutt and J. A. Syne, "Fabrication of Multilayer Ceramic Capacitor by Metal Impregnation," IEEE Trans. Parts Hybrids Packag, PHP-9,
144-147 (1973).
D. A. Chance andD. L. Wilcox, Met. Trans. 2, 733—741 (March 1971).
D. A. Chance and D. L. Wilcox, Proc. IEEE 59(10), 1455-1462 (1971).
L. M. Levinson, Electronic Ceramics, Marcel Dekker, Inc., New York, 1988, Chapt. 6.
K. Utsumi, Y. Shimada, and H. Takamizawa, "Monolithic Multicomponent Ceramic (MMC) Substrate," in K. A. Jackson, R. C. Pohanka, D. R.
Ulhmann, and D. R. Ulrich, eds., ElectronicPackagingMaterials Science, Materials Research Society, Pittsburgh, Pa., 1986, pp. 15—26.
W. A. Vitriol and J. I. Steinberg, "Development of a Low Fire Cofired Multilayer Ceramic Technology," 1983, pp. 593—598.
H. T. Sawhill and co-workers, "Low Temperature Co-Firable Ceramics with Co-Fired Resistors," International Society of Hybrid Microelectronics
Proceedings, 1986, pp. 473—480.
С. C. Shiflett, D. B. Buchholz, and С. C. Faudskar, "High-Density Multilayer Hybrid Circuits Made with Polymer Insulating Layers (Polyhic's),"
Society of Hybrid Microelectronics Proceedings, 1980, pp. 481—486.
S. L. Swartz, "Topics in Electronic Ceramics," IEEE Trans. Elect. Insul. Digest on Dielectrics 25, 935—987 (Oct. 1990).
С. P. Poole, Jr., T. Datta, and H. A. Farach, Copper Oxide Superconductors, John Wiley & Sons, New York, 1988.
General References
R. C. Buchanan, ed., Ceramic Materials forElectronics, Marcel Dekker, Inc., New York, 1986.
L. M. Levinson, ed., Electronic Ceramics, Marcel Dekker, Inc., New York, 1988.
B. Jaffe, W. R. Cook, Jr., and H. Jaffe, Piezoelectric Ceramics, Academic Press, New York, 1971.
Robert E. Newnham
Thomas R. Shrout
Pennsylvania State University
Kirk-Othmer Encyclopedia of Chemical Technology (4th Edition)
316
STRUCTURAL CERAMICS
Voll
STRUCTURAL CERAMICS
Advanced structural ceramics are those ceramics intended for use as load-bearing members. They are materials that combine the properties and advantages
of traditional ceramics (qv), such as chemical inertness, high temperature capability, and hardness, with the ability to carry a significant mechanical stress.
Like all ceramics, they are inorganic and nonmetallic; in addition, they are often multicomponent and/or multiphased materials having complex crystal
structures. These materials are usually intended to be fully dense and to have tight dimensional tolerances. In addition to being designed to withstand
substantially higher levels of mechanical and thermal stress, there are other important features which make advanced structural ceramics different from
traditional ones. Starting powders, compositions, processing, and resulting microstructure must be carefully controlled to provide required levels of
performance. Consequendy, advanced structural ceramics are more expensive than traditional ceramics.
Most of the advanced structural ceramics under development today are based on silicon nitride [12033-89-5], SijN4; silicon carbide [409-21-2], SiC;
zirconia [1314-23-4], ZrO2; or alumina [1344-28-1], A12O3. In addition, materials such as titanium diboride [12045-63-5], TiB2; aluminum nitride
[24304-00-5], AIN; silicon aluminum oxynitride [52935-33-8], SiAlON; and some other ceramic carbides and nitrides are often classified as advanced or
high tech ceramics because of processing methods or applications. Ceramic matrix composites are also receiving increasing attention as advanced structural
ceramics (see Composite materials, ceramic-matrix). Monolithic silicon nitride, silicon carbide, and zirconia each represent a family of materials rather than a
single species. A wide range of microstructures and properties can be tailored within each family, through compositional or processing modifications, in
order to optimize materials performance for specific applications.
Physical Properties
Advanced structural ceramics typically possess some combination of high temperature capabilities, high strength, toughness or flaw tolerance, high
hardness, mechanical strength retention at high temperatures, wear resistance, corrosion resistance, thermal shock resistance, creep resistance, and long
term durability. Figure 1 shows the typical stress and temperature ranges of application for SiC, Si3N4, ZrO2. Zirconia ceramics, which find application
under conditions of high stress and moderately high (up to 600°C) temperatures, have the highest low temperature strength. Although the low temperature
strength of silicon nitride is less than that for zirconia, silicon nitride maintains these strength properties up to approximately 1200°C. Silicon carbide is
somewhat weaker than silicon nitride over the entire temperature range, but maintains good strength and creep resistance at even higher (1500°C)
temperatures.
Fig. 1. Stress and temperature ranges of application for ZrO2 (—), SijN4 (-), and SiC (-) advanced structural ceramics. To convert MPa to psi,
multiply by 145.
Processing and Fabrication Technology
The relationship between processing and properties is especially critical for advanced structural ceramics because subsequent successful operation in severe
environments often requires carefully controlled compositions and microstructures. Fabrication generally takes place in four steps: powder processing,
consolidation/forming, densification, and finishing. Starting powders must be chemically pure and fine grained. Then, depending on the forming and
densification processes to be used and the final properties and microstructure desired, the powders may be mixed with various additives. For example,
additives can be used to improve the flowability of dry powders to make mold filling easier. Plasticizers may be added to improve the formability of powder
blends for some shape forming operations. Binders are almost always added to powder blends, especially those intended for dry forming, in order to
Kirk-Othmer Encyclopedia of Chemical Technology (4th Edition)
317
STRUCTURAL CERAMICS
Voll
improve adherence of the fine powder particles and impart strength to the green part. (Green refers to powder compacts, formed by any process, which
have not yet been subjected to a densification operation.) Sintering additives are also necessary for covalent materials, particularly nonoxides, to enhance
densification rates.
Once the powder has been processed and the composition set, several techniques, including dry pressing (uniaxial or isostatic), slip casting, plastic
forming (extrusion or injection molding), and tape casting, can be used for forming. In a dry pressing operation, powders are fed into a die or cavity and
compacted under pressure. In general, pressure may be divided into two categories: uniaxial (unipressing) and isostatic (isopressing). For unipressing the
powder is fed into a die and pressure is externally applied along a single axis, which limits this technique to relatively simple shapes. For isopressing, powder
is fed into a compressible mold or bag and pressure is applied uniformly from all directions by a Equid or gas medium. Slip casting involves adding the
ceramic powder to a liquid medium that is typically aqueous to produce a slurry which is then poured into a porous mold. In time, water from the slurry is
absorbed by the mold and a solid ceramic results. This technique is most suitable for low volume production of relatively simple shapes and traditionally
has been used for hollow or tubular components. Advances in slurry compositions, mold materials, and mold design have resulted in faster casting times
however, permitting thicker cross-section parts and more complex shapes.
For plastic forming techniques the ceramic powder is combined with plasticizers such as thermoplastic resins and other additives to make a mixture
which is deformable under pressure. This mixture is then heated slightly, facilitating plasticity, and either forced through dies (extrusion) or into molds
(injection molding). Extrusion is a continuous, high volume process, but is limited to shapes having a constant cross section, eg, rods and tubes. Injection
molding is a high volume process capable of producing complex shapes, but tooling costs for molds can be very high.
Regardless of the consolidation method used, the formed or green part must generally undergo a bum-out step prior to densification in order to
remove the binders, plasticizers, and other decomposable additives which were added in the forming step. In the case of dry pressing usually only small
amounts (several volume percent) of binders are added, whereas for injection-molded components, the additives can comprise 30—40 vol % of the green
part. Additives are typically organic compounds that decompose at temperatures less than 700°C. However, in order to ensure complete removal of
additives without disruption to the part, eg, swelling or cracking, bum-out must be done slowly and under carefully controlled conditions. Bum-out may be
a separate step or it may be incorporated in the early stages of the densification procedure.
High temperature consolidation techniques such as conventional sintering, reaction sintering, hot-pressing, and hot isostatic pressing, are generally
necessary for advanced structural ceramics. Sintering involves subjecting a powder compact to high temperature without application of pressure and,
especially in the case of nonoxides, usually requires additives to promote densification and/or to inhibit grain growth. Achieving full density may be more
difficult than in pressure-assisted methods and the composition and quantity of densification aids required may degrade the material's high temperature
properties. Reaction sintering or reaction bonding involves the infiltration of a powder bed by the appropriate gaseous constituent or molten material at
elevated temperatures to produce the desired composition. Complex shapes can be formed using the starting powder and litde or no shrinkage occurs
during the reaction. However, residual unreacted starting material and/or residual porosity in the final product can be a problem.
Hot-pressing is the simultaneous application of uniaxial high pressure and temperature to the powder. Fully dense materials can be formed, often
having high strength, but the application of uniaxial pressure limits this technique to simple shapes. In the case of hot isostatic pressing (HIP), pressure is
applied to the powder compact equally in all directions through the use of a compressed gas. Fabrication of more complex shapes, not possible using
hot-pressing, can be accomplished, and densities approaching theoretical are often achieved. However, this technique requires that the material be either
sintered to closed porosity prior to application of isostatic pressure or encased in a compressible can of metal or molten glass.
Microwave sintering of powders, a relatively new technique, has the advantage of providing more uniform heating of the component, because it
does not rely on conduction and convection. Other routes to forming and densification which avoid traditional powder processing are also under
development. Sol—gel processing, chemical vapor deposition (CVD) and organometallic polymer pyrolysis are examples.
Although some postforming grinding and machining are often necessary, the intrinsic hardness of advanced structural ceramics makes them
difficult and cosdy to machine. In addition, grinding can introduce surface flaws which may serve as failure sites. Thus, forming processes producing near
net-shape components, such as injection molding and hot isostatic pressing, are desirable because their usage reduces the amount of postforming
machining required.
Applications
Throughout the development of structural ceramics the focus has been on applications for gas turbine, diesel, and spark-ignited engines. The ability of
ceramics to function at higher temperatures than superalloys, and to do so without cooling, has been a particularly important driving force. Ceramics
utilization in heat engines can lead to reduced fuel consumption and increased performance through higher engine operating temperatures, the elimination
of mechanical losses resulting from cooling, lower inertia, and reduced friction. In addition to the properties critical to mechanical performance, advanced
structural ceramics have the significant advantage of not requiring imported, strategic metals (eg, Ni, Co, Cr) for their fabrication.
Advanced structural ceramics are also under investigation for use in numerous other high performance applications including antifriction roller and
ball bearings, metal-cutting and shaping tools, hot extrusion and hot forging dies, industrial wear parts (eg, sand-blast nozzles, pump seals, thread guides,
chute liners), and various military applications (eg, armor, radomes, ir domes, gun barrel liners). More comprehensive works on the processing, properties,
and applications of advanced ceramics are available (1—4).
Silicon Carbide Structural Ceramics
Silicon carbide (see Carbides, silicon carbide) has been a candidate material for structural ceramic applications far longer than other materials. Properties
such as the relatively low thermal expansion, high strength-to-weight ratio, high stiffness, high thermal conductivity, hardness, erosion and corrosion
resistance, and most importandy, the maintenance of strength as high as 1650°C, have led to a wide range of applications. Additionally, it is possible to
produce both large quantities of pure silicon carbide powders and required component shapes. An in-depth review of SiC structural ceramics is available
(5).
Material System. Silicon carbide occurs in a variety of polymorphic crystalline forms, generally designated |3-SiC for the cubic form and Ct-SiC
for the hexagonal and rhombohedral varieties. The alpha form appears most stable at temperatures above 2000°C, whereas the cubic |3-SiC is the most
common product when silicon carbide is produced at lower temperatures (4). Most silicon carbide powder is produced by the Acheson process involving
the reduction of high purity siEca sand surrounding an electrically heated core of petroleum coke or anthracite coal (6). The reaction is carried out at about
2400°C in the core for as long as 36 h where the higher temperature СС-SiC is formed. The product is separated based on purity (determined by crystal
color) and ground. For structural ceramic appEcations this material must be milled, often to submicrometer sizes, and chemically cleaned of impurities. The
large scale of this process leads to a relatively low cost for such a high purity raw material.
СС-SiC can also be produced direcdy in the deshed purity by the plasma gas-phase reaction of species such as silane [7803-62-5]) SiH4, and methane
[74-82-8]) CH4 (7). |3-SiC powders can be produced by the same gas-phase reaction at lower temperature (1500—1600°C) or by polymer decomposition
reactions (8).
Fabrication Technology. SiEcon carbides for structural appEcation can be classed as reaction-bonded, Equid-phase sintered, and soEd-state
sintered. Reaction-bonded SiCs are actually a composite of a continuous SiC matrix having 5 to 20% siEcon [7440-21-3]) metal filling the remaining volume
(9). To form this material, a preform of powder containing carbon [7440-44-0] added either as a powder or as the decomposition product of a carbon
source resin, is infiltrated with siEcon at about 1500°C either through direct contact or using siEcon vapor. The siEcon reacts with the carbon preform to
form a bridging structure of more SiC. Excess siEcon remains, filling the residual pore space and giving a fully dense product having structural integrity to
1370°C. SiEcon melts at 1410°C. The preform can be fabricated by any of the traditional ceramic shaping processes (5,10). The siEcon carbide powder
utilized for the preform does not require the submicrometer particle sizes and the purity of other forms of dense SiC, although finer sized SiC preforms
tend to give a stronger product (11). Reaction bonding also leads to Etde dimensional change (<1%) from the preform, allowing large shapes and complex
Kirk-Othmer Encyclopedia of Chemical Technology (4th Edition)
318
STRUCTURAL CERAMICS
Voll
shapes having tight dimensional tolerances to be fabricated. Moreover, the low (1500°C) temperatures employed during reaction bonding, combined with
the flexibility in powder size and purity, provide a good quality product at a reasonable cost.
A desire for a higher strength form of dense SiC suitable for appEcations at temperatures above 1300—1400°C led to the development of
Equid-phase sintered material. This process involves reaction of an oxide additive (typically 1 to 2% A12O3) and the siEca present on the surface of SiC
grains to create a melt during densification above 2000°C. A simultaneous appEcation of pressure through hot-pressing is often required to achieve a dense
product and the resultant hot-pressed SiC exhibits exceEent room temperature strength and wear resistance. However, the hot-pressing process is limited
to the production of simple shapes, and the presence of the aluminosiEcate phase tends to decrease elevated temperature strength and oxidation resistance
(12). Liquid-phase sintered SiC usage has therefore been limited for appEcations requiring complex shapes and long term exposure to high temperatures.
A new type of Equid-phase sintered SiC using yttria [1314-36-9]> Y2O3, as the oxide additive and submicrometer SiC powder for enhanced
densification, produces a material which can be densified without the appEcation of pressure (13). This material, sintered from cold isostaticaEy pressed
billets, appears to be comparable to siEcon nitride in strength and fracture toughness.
Two forms of dense high purity SiC resulted from a discovery (14) that simultaneous additions of carbon and boron [7440-42-4] allow siEcon
carbide densification without the appEcation of pressure. One is a sinterable material based on |3-SiC raw materials and about 1% carbon and 0.5% boron
(15). Control of powder reactivity and densification conditions is critical because densification temperatures approach the region for transformation to the
alpha form of SiC resulting in excessive grain growth rates and resultant lowering of final strength. The other product results from the same additive
system, but is based on the more readily available Ct-SiC (16). Ultrafine SiC powder is utilized both to increase the driving force for densification and to
minimize diffusion distances (17). There has been extensive analysis of the role of these two additives in densification (18—21). The carbon appears to react
with surface oxygen present on the SiC grains, forming volatile CO and thereby purifying the surfaces. The role of boron is more difficult to define, but it
is beEeved to promote both volume diffusion and grain boundary diffusion.
Both a- and P-sintered siEcon carbides have been fabricated by all of the available ceramic forming methods. Sintering is performed in vacuum or in
an argon atmosphere (22). Shrinkages during densification are typically 15 to 20 linear percent. The resultant material is about 98% dense having small
isolated porosity and residual carbon particles. Analysis indicates no presence of second phases along the grain boundaries. This leads to a material with
exceEent retention of strength at temperatures in excess of 1500°C and superior resistance to elevated temperature oxidation (23,24).
A postsintering HIP treatment has been used to further improve the strength of sintered siEcon carbide (25). The component is sintered until aE
surface porosity is closed, about 95% dense or higher, then subjected to a combination of temperature and argon gas pressure to achieve final densification.
Finer grain sizes are achieved in the final body because sintering temperatures tend to be lower. The resultant material shows good density uniformity, even
in thick cross-section components, and density levels over 99% of theoretical density. If densification is performed properly, a significant increase and
improved uniformity in strength results (26).
Properties of Dense Silicon Carbide. Properties of the SiC structural ceramics are shown in Table 1. These properties are for
representative materials. Variations can exist within a given form depending on the manufacturer. Figure 2 shows the flexure strength of the SiC as a
function of temperature. Sintered or sinter/HIP SiC is the preferred material for appEcations at temperatures over 1400°C and the Equid-phase densified
materials show best performance at low temperatures. The reaction-bonded form is utilized primarily for its ease of manufacture and not for superior
mechanical properties.
Fig. 2. Strength as a function of temperature for representative SiC structural ceramics: ▲, sintered (Y2O3 added); □, hot-pressed (2% A12O3); •, sintered
beta; A, sintered alpha; and M, reaction-bonded. To convert MPa to psi, multiply by 145.
Table 1. Properties of Silicon Carbide Ceramics
Material densification mode
Property Reaction-bond ed Sintered alphaa Sintered beta Hot-pressed (Al2O3)b Sintered (Y2O3)c
density, kg/m3 3.1 3.1 3.0 3.3 3.2
hardness, kg/mm2 1620 2800 2400
flexure strength, MPad at 25°C 245 460 490 702 917
Young's modulus, GPae 383 410 372 446
Poisson's ratio, GPa 0.24 0.14 0.16 0.17
thermal expansion coeff, x 10-6 /° C 4.8 4.02 4.4 4.6
thermal conductivity, W/(m-K) at 25°C 135 126 71 80
Material subjected to a postsintering HIP treatment; sinter/HIP alpha SiC has a density of 3.2 g/mL and a flexural strength of 530 MPa at 25°C.
Kirk-Othmer Encyclopedia of Chemical Technology (4th Edition)
319
STRUCTURAL CERAMICS
Voll
Contains about 2% alumina.
Contains some yttria, see text.
To convert MPa to psi, multiply by 145.
e To convert GPa to psi, multiply by 145,000.
Flexural stress SiC rupture curves are shown in Figure 3 (27). All the forms tend to be fairly resistant to time-dependent failure by elevated
temperature creep. In addition, SiC shows outstanding resistance to oxidation even at 1200°C as a result of formation of a protective high purity silica
surface layer (28).
Fig. 3. Stress rupture behavior in air at 1200°C for SiC structural ceramics: —> hot-pressed;-, reaction-bonded; • • •, sintered alpha; —> sintered beta. To
convert MPa to psi, multiply by 145.
The elastic modulus and thermal expansion properties are dominated by the characteristics of the SiC crystal itself and the thermal conductivity or
thermal diffusivity of silicon carbides tends to be substantially higher than those of other structural ceramics. Thermal diffusivity as a function of
temperature is shown in Figure 4 (29). These values tend to be sensitive to the form of silicon carbide, but all values drop significandy as temperature
increases. The combination of a high elastic modulus and moderate thermal expansion coefficient result in SiC being susceptible to damage by thermal
shock. Resistance to thermal shock is significandy lower than that of silicon nitride, but higher than that of the high expansion zirconia structural ceramics.
Thermal shock behavior is also very application-dependent. For example, very rapid temperature changes can lead to a preference of Si3N4 over SiC,
whereas during moderate rates of temperature change the high thermal conductivity of SiC can lead to a superior performance.
Kirk-Othmer Encyclopedia of Chemical Technology (4th Edition)
320
STRUCTURAL CERAMICS
Voll
Fig. 4. Thermal diffusivity of silicon-based structural ceramics: (a) reaction-bonded SiC; (b) hot-pressed and sintered SiC; (c) hot-pressed Si3N4 (1% MgO,
8% Y2O3); (d) RS-Si3N4 (density is 2.1-2.9 g/mL).
Fracture toughness of SiC tends to be lower than that of other structural ceramics leading to some concern about the appEcation of SiC in certain
heat engines, such as turbine rotors which may be susceptible to impact from foreign objects (30). The yttria liquid-phase sintered SiC is, however, reported
to be comparable to other structural ceramics in fracture toughness. Erosion and corrosion characteristics have not been measured as extensively as other
mechanical properties. Wear and coefficient of friction measurements have mosdy been application specific, but point out the importance of surface
preparation and characterization. Published erosion results show good resistance to angular particle or slurry erosion. Reaction-bonded SiC tends to be the
most susceptible to erosive wear because of preferential wear of surface connected free silicon grains (31). Reaction-bonded SiC also appears much less
resistant to acids, alkali, and high temperature combustion products than the single-phase sintered material (32). In contact with sodium sulfate, or acidic or
basic coal slags from coal gasification, SiC tends to corrode slighdy in a pitting reaction. In basic coal slag reactions at temperatures from 1000 to 1300°C,
the reaction involves dissolution of the protective silica oxidation layer followed by reaction with Fe or Ni to form low-melting point silicides (33). Sintered
silicon carbide has also been shown to corrode at elevated temperature in hydrogen-containing atmospheres. The reaction appears to be a decarburization
of the SiC, particularly at grain boundaries, resulting in silicon rich regions and some grain fallout (34). Corrosion from sodium silicate glass vapors and
particulates has demonstrated that both sintered and reaction-bonded SiC corrode through passive oxidation followed by dissolution of the oxide coating.
The silicon component in reaction-bonded SiC was oxidized more rapidly than the SiC phase (35).
Applications of Silicon Carbide. Silicon carbides are used more for the low temperature wear properties than for the high temperature
behavior. Applications such as sand blasting nozzles, automotive water pump seals, bearings, pump components, and extrusion dies utilize the high
hardness, abrasion resistance, and corrosion resistance of silicon carbide (4,5,32). Elevated temperature structural applications range from rocket nozzle
throats to furnace rollers and the combination of high thermal conductivity and high temperature strength and stability make silicon carbide heat exchanger
tubes and diffusion furnace components feasible.
Most engine applications involve auxiliary components such as turbo-charger rotors, valve train parts to reduce friction losses, piston wrist pins, and
precombustion chambers. Application of SiC for pistons and cylinder liners has been demonstrated, but the high thermal conductivity makes SiC use more
difficult than that of other structural ceramics. However, high thermal conductivity and strength at high temperatures make SiC the material of choice for
combustors. Well-developed fabrication technology and lower raw material cost have also resulted in the use of SiC for many hot path stationary gas
turbine components. SiC turbine rotors and vanes have also been demonstrated, but material strength considerations have often resulted in the selection of
S.N,
Future applications may involve use of SiC as substrates for silicon chips, making use of the high thermal conductivity of SiC and its close thermal
expansion match to silicon. The low density and high stiffness of silicon carbides may also result in applications in space. One such application is for
space-based mirrors, making use of the high degree of surface polish possible on dense SiC.
Silicon Nitride Structural Ceramics
Silicon nitride (see Nitrides) is a key material for structural ceramic applications in environments of high mechanical and thermal stress such as in vehicular
propulsion engines. Properties which make this material uniquely suitable are high mechanical strength at room and elevated temperatures, good oxidation
and creep resistance at high temperatures, high thermal shock resistance, excellent abrasion and corrosion resistance, low density, and, consequendy, a low
moment of inertia. Additionally, silicon nitride is made from abundant raw materials.
Material System. There are two basic techniques for the industrial synthesis of Si3N4 powder, although other methods are available (36). The
older and most widely used method is the nitridation of silicon. Silicon is heated in a nitrogen [7727-37-9] atmosphere at temperatures of 1100—1450°C in
Kirk-Othmer Encyclopedia of Chemical Technology (4th Edition)
321
STRUCTURAL CERAMICS
Voll
the presence of an iron catalyst (37). The purity of the product depends on the purity of the starting materials, the amount of catalyst used, and the extent
to which the catalyst is removed (38). The other commercial process is a type of ammonolysis where silicon tetrachloride [10026-04-7] or a silane reacts
with Equid ammonia [7664-41 -7] at low temperatures. The siEcon compound is dissolved in an aromatic solvent such as toluene and siEcon imide is formed
at the interface between the Equid ammonia and the organic phase. The siEcon imide is separated and thermally converted to crystalline siEcon nitride (34)
resulting in a powder of high purity.
SiEcon nitride exists in two hexagonal crystallographic modifications designated as the a- and ^-phases (40). The latter is prevalent at high
temperatures. Metallic impurities are deleterious to Si3N4 thermomechanical properties and in the purest powders then total concentration does not exceed
100 ppm. Tolerance levels for the various metals vary, but any contaminant must be homogeneously dispersed in the powder rather than present in discrete
particles. AlkaEes and metals forming low melting glasses are whoEy unacceptable because they may cause failure at high temperatures; Al and Mg are not
as problematic because they are frequendy used as sintering aids; transition metals such as Fe, Ni, or Cr can adversely affect the material strength (36).
Fabrication Technology. A variety of simple and complex-shaped dense parts are made from Si3N4 powders by ceramic processing
techniques. Inasmuch as siEcon nitride is a covalently bonded compound having a low diffusion coefficient, sintering aids are used to achieve complete
densification. Aids are typically oxides such as A12O3, Y2O3, ZrO2, MgO, lanthanide oxides, and, at times, AIN as well. They are added singly or in
combinations in amounts of several weight percent and may reach as high as 15 wt % of the matrix. The CC-Si3N4 crystallites, which typically comprise over
90% of the starting powder material, dissolve in the Equid phase formed by the reaction of the sintering additives with the siEca layer present on the surface
of the siEcon nitride particles, then reprecipitate as |3-Si3N4 (41). This a- to (B-phase transformation is faciEtated by the presence of Equid phase as well as
(3-crystal nuclei (42). It does not appear to be reversible. The strongest ceramics are realized when all the pores are eliminated and full conversion to
P~Si3N4 takes place. A dense crystalline matrix consisting of rodlike grains characteristic of the (B-phase is formed (43). The crystallites are surrounded by a
thin intergranular amorphous or crystalline phase which forms upon cooling (44).
Both composition and the quantity of sintering additives profoundly affect the properties of siEcon nitride ceramics (43). Additives faciEtate
densification, serve as the strength limiting factor at high temperatures, and may also adversely affect oxidation resistance. Thus sintering additives are kept
to a minimum. The specific additive used depends on the ceramic's ultimate appEcation. For uses at lower (up to 1000°C) temperatures,
magnesia—magnesia/alumina combinations are frequendy employed; in the intermediate (up to 1200°C) range yttria—alumina formulations are usually
preferred; for the appEcations in which structural integrity and performance are required at temperatures up to 1400°C, yttria alone is used.
Si3N4 powder is typically mixed with the appropriate amount of sintering additives and an organic binder. This mixture then undergoes extensive
comminution, generally by milling, often using siEcon nitride grinding media. Powder processing for the most critical appEcations is frequendy done in
clean room environments.
The shaping of these fine, submicrometer powders into complex components and then subsequent consoEdation into dense ceramic parts of ideally
zero porosity is a major technological challenge. The parts formed need to be consoEdated to near-net shape because Si3N4 machining requires expensive
diamond grinding. Additionally, Si3N4 dissociates at or near the typical densification temperatures used in the fabrication of structural ceramics and,
therefore, special measures have to be taken to preserve the compositional integrity of the material.
Parts of simple geometries can be readily made by uniaxial die pressing or cold isostatic pressing and densified by sintering or hot isostatic pressing
(HIP). Typical sintering temperatures are in the range of 1700—2000°C, depending on the composition and concentration of the sintering aid, and in order
to prevent siEcon nitride decomposition, the parts are usually embedded in a protective powder such as boron or siEcon nitride and/or placed in a closed
vessel (45). An overpressure of 0.1—10 MPa (15—1500 psi) of nitrogen is usually maintained during sintering. Satisfactory products can be obtained at
atmospheric pressures, particularly using siEcon nitride formulations designed for appEcations at lower temperatures. Parts having densities over 99% of
theoretical can be made by this technique and shrinkage can be controlled to achieve near net shape fabrication.
Using hot-pressing, shaping and densification occur in a single process step. The temperatures are in the range of 1650—1800°C and appEed
pressures are from 30—40 MPa (4000—6000 psi) (45), resulting in parts of high quaEty. This method is limited to simple shapes and low production
volumes, however, and the process may also impart anisotropic characteristics to the material (46).
There are two operational variations in the HIP process as appEed to siEcon nitride parts. In one, shaped specimens are encapsulated in a glass and
then hot pressed isostaticaEy (46,47); in the other, caEed sinter-HIP, the parts are first presintered to closed porosity (<7%) and then hot isostaticaEy
pressed direcdy, without encapsulation (45,48—50). The latter technique, although a two-step process, offers the advantage of eliminating both the risk of
the diffusion of deleterious glass components into the work pieces and the need for a post-HIP decapsulation step. Process conditions for both variations
are similar: temperatures range from 1700—2000°C and pressures from 100—200 MPa (45). The quaEty of the resulting products is high. Densities approach
theoretical values and mechanical properties are comparable to those of hot-pressed components.
Injection molding and sEp casting are used for making complex-shaped siEcon nitride structural ceramic components. Injection molding is a high
volume production technique (51). To impart the appropriate rheological characteristics the powder is mixed with significant (10—15 wt %) amounts of
organic binder components which then need to be removed from the part prior to densification. This process requires careful time-temperature control
and may take from a few days to even weeks (52). Complex parts such as turbine rotors and turbochargers have been fabricated having adequate green
strength and the requisite microstructure for densification by HIP processing into high quaEty ceramics (53—57).
SEp casting, used increasingly for siEcon nitride parts, has the advantage that only smaE amounts of chemical additives are employed and therefore,
binder bum-out problems are basicaEy eliminated (46). The biggest disadvantage is the time it takes for the part to form. Tens of hours may be required to
cast a gas turbine engine rotor and during that time the stabiEty of the sEp suspension may change (58). Therefore, pressure-assisted casting is being used
to accelerate part formation (58,59) reducing the casting time to about an hour. After removal from the mold, the part needs to be dried carefuEy and
slowly to prevent crack formation (58). Automated process methodology is used to shape tens of thousands of siEcon nitride turbochargers per month by
pressure-assisted sEp casting. These are then densified either by HIP or gas overpressure sintering.
An alternative technique for the fabrication of complex Si3N4 parts is reaction bonding. A shape is formed from siEcon powder by any of the
aforementioned methods and the resulting green compact, having a typical density that is 60—70% of the theoretical value of Si, is then nitrided by reaction
with nitrogen at 1300—1400°C to form reaction-bonded siEcon nitride (RBSN). The reaction, carried out over a 3 to 10 day period, is exothermic and needs
to be carefuEy controEed so as not to exceed, even locaEy, the melting point of siEcon (1410°C). The final product is not fuEy dense; it has a residual
connected porosity of about 12—30% (45,49). This process aEows for real net shape fabrication of complex components because the part does not shrink
during the reaction. Precise dimensional tolerances can be obtained without postfabrication machining. Another advantage is that no sintering aids are used
so that RBSN parts retain then strength even at high temperatures and they are resistant to creep. However, the low density of RBSN materials results in
typical strength values that are only a fraction of fuEy dense siEcon nitride ceramics. The high porosity RBSN materials also have lower oxidation resistance
and are more brittle than dense siEcon nitride (45,46,49,60). Modifications to the reaction-bonding process material density include postsintering (SRBSN)
(45) or post-HIP (HIPRBSN) (48). Property improvements have been realized, but this approach does not appear to offer quaEty advantages over the
more direct processes.
Properties. Properties of structural siEcon nitride ceramics are given in Table 2. These values represent available, weE-tested materials. However,
test methodology and the quaEty of the specimens, particularly then surface finish, can affect the measured values. Another important material property is
tensEe strength. Values obtained on Norton's NT154 material are: 750 MPa at RT, 500 MPa at 1200°C, and 350 MPa (50,000 psi) at 1400°C (62).
Table 2. Properties of Silicon Nitride Ceramics
Material densification mode
Kirk-Othmer Encyclopedia of Chemical Technology (4th Edition)
322
STRUCTURAL CERAMICS
Voll
Property Reaction-bondeda Sinteredb Hot-pressed isostaticaUy Hot-pressedd
density, kg/m3 2.5 3.26 3.23 3.2
elastic modulus, GPa 180 300 310 310
hardness, kg/mm2 1350 1370 1620 1800
flexure strength, MPa at ambient 340 700 900 700
temperature
1000°C 600 610
1200°C 480 570
1370°C 210 580 310
fracture toughness, MPa^/in 3-4 4.6 4.7-5.5 4.9
thermal expansion coeff, 25—1000°C, 3 3.9 3.9 3.5
1CT6/°C
thermal conductivity, W/(m-K) at 25°C 12 32 38 32
Coors Ceramics Company, Bulletin #980.
b GTE Laboratories AY-6, 6 wt% yttria +2 wt% alumina (43).
C Norton NT154, 4 wt % yttria (61).
d Norton NC 132, 1 wt % magnesia (46).
To convert GPa to psi, multiply by 145 x 103 .
To convert MPa to psi, multiply by 145.
As noted, the oxidation resistance of silicon nitride ceramics depends on the type and concentration of the sintering aids. In materials designed for
high temperature appEcations the specific weight gain resulting from oxidation upon a 500-h air exposure at 1200°C and 1350°C is about 1—2 g/m2 and
2—4 g/m2, respectively. The kinetics of the oxidation process have been investigated (63,64) as has the corrosion resistance (65). Corrosion resistance is also
dependent on material formulation and density.
Applications. Silicon nitride is the leading material for components in advanced automotive, diesel, and gas turbine engines. The range of
potentially useful ceramic parts includes both static structural components and dynamic ones such as turbocharger rotors, gasifier turbine rotors, valves,
valve guides, valve seats, piston components, cam followers, fuel injector links, and bearings. Some of these parts have been commercialized, others are
being evaluated.
The first commercial use of silicon nitride ceramics for automotive applications was in glow plugs to reduce engine startup wait times for light duty
diesel engines. More recendy, Si3N4 hot plugs have been installed in similar engines. These plugs also reduce engine emissions and noise (66). Silicon nitride
turbocharger rotors are being used (67,68) in Japanese production cars sold in Japan. 1990 production rates were about 20,000/month and are projected to
reach 30,000/month in 1991. A limited production run of a U.S. model was also equipped with a ceramic turbocharger (60). The primary advantage is the
low density of the material and a consequent lower moment of inertia leading to faster engine response and to a decrease in turbocharger lag. Introduction
of such turbo-chargers into Japanese light duty diesel engines is probable (66). Silicon nitride cam followers are being introduced into heavy-duty diesel
engines in the United States because of their superior wear performance (69); an additional advantage is a reduction or even elimination of the need for
forced lubrication and for cosdy lubrication channels. Ceramic fuel injector links are being incorporated into heavy-duty diesel engines, also because of
superior wear resistance (70). A silicon nitride exhaust port liner is being used in sports cars because it results in faster heat up of the catalytic converter and
consequent reduction in hydrocarbon and oxide emissions (70). A Si3N4 rocker arm wear pad has been introduced (67).
The lower inertia of silicon nitride valves allows them to follow the valve-lifting cam more closely resulting in a more stable operation which could
increase the engine speed by up to 1000 rpm (68). This advantage was utilized effectively in stock car racing in which engines equipped with silicon nitride
valves out-performed standard engines in many competitions (71). In conventional applications the use of ceramic valves offers the potential for increased
fuel efficiency by reducing the spring load resulting in a lower camshaft torque. Large silicon nitride components, including valves about 50 cm in diameter
and 50 cm high, have been fabricated and are being evaluated in coal gasification plants in Japan (72).
The emerging field of gas turbine engines is a technology in which silicon nitride ceramics serve as enabling materials. The automotive version of
this engine is designed to provide the powertrain for the next generation of passenger cars (73). Car manufacturers in the United States, Germany, and
Japan are actively involved in the development of such engines and there are several variations in its design; one of the common features is that the engine
is intended to operate at a gas inlet temperature of 1375°C. The only suitable materials for rotating components under these conditions are silicon nitride
ceramics. Gas turbine rotors which successfully passed spin tests at maximum speed both at room temperature and at 1395°C have been developed (73).
A car powered with a gas turbine engine having ceramic rotors has been undergoing successful road tests in Germany for several years (74) and a
similar engine of larger capacity is being developed in Japan for stationary use for co-generation of electric power. Another application for silicon nitride
rotors is in auxiliary power unit (APU) engines (75).
In other useful applications, silicon nitride bearings have been found to offer excellent performance; silicon nitride cutting tool inserts are a
commercial product; wear parts such as sand blast nozzles, seals, and die liners are also commercially produced; the superior performance of heat
exchangers has been demonstrated and there are also military applications.
Zirconia Structural Ceramics
Zirconia ceramics represent a fairly new class of advanced structural materials (see Zirconium and zirconium compounds). Their potential use in structural
applications was first realized in the mid-1970s. Since then numerous publications have appeared devoted entirely to these materials (76—81).
Material System. Pure zirconia at atmospheric pressures exhibits three well-defined crystalline polymorphs: the monoclinic, tetragonal, and
cubic phases. The monoclinic phase is stable up to about 1170°C where it transforms to the tetragonal phase. At 2370°C the tetragonal phase transforms
to the cubic phase which exists up to 2680°C, the zirconia melting point (82). On cooling through the tetragonal-to-monoclinic transformation
temperature, a large volume increase (3—5%) occurs. This change is sufficient to cause cracking. Thus, fabrication of large components of pure zirconia is
not possible. The transformation volume expansion can be used to advantage, however, by the addition of cubic stabilizing oxides, most commonly
magnesia, calcium oxide [1305-78-8]) CaO, and yttria. These oxides can stabilize the relatively weak cubic form down to room temperature. Moreover, if
insufficient stabilizing oxide is added, and the material is properly processed, zirconia particles can be retained in the metastable tetragonal form at room
temperature. These materials are referred to as partially stabilized zirconia (PSZ) ceramics.
During application of stress, eg, in the region of a propagating crack, metastable tetragonal particles transform to the stable monoclinic phase. The
resulting volume expansion places the region around these particles, ie, adjacent to the crack, in compression and crack propagation is retarded until the
applied stress is increased. The extra work required to move the crack through the matrix can lead to increases in strength, toughness, and resistance to
thermal shock. The phases present in these ceramics, their amount, size, and distribution, can be controlled to produce materials having a range of
properties tailored for specific applications.
The transformation is believed to occur by a diffusionless shear process (83). It is often referred to as martensitic transformation, having a thermal
hysteresis between the cooling and heating cycles. The transformation is dependent on particle size; finer particles transforming at a lower temperature than
Kirk-Othmer Encyclopedia of Chemical Technology (4th Edition)
323
STRUCTURAL CERAMICS
Voll
coarser particles. Transformation toughening can also result upon incorporation of fine zirconia particles into another matrix such as A12O3 (84). These
materials are called zirconia toughened ceramics (ZTC). A third type of transformation-toughened ceramic material is formed using a low concentration of
yttria in zirconia and a very fine grain size (85—87). An approximately 100% tetragonal zirconia polycrystalline (TZP) ceramic results.
Fabrication Technology. Stabilizing additives must be uniformly distributed within the starting powders for zirconia ceramics.
Homogeneous distribution can be attained by controlled coprecipitation of hydroxides which are then decomposed by calcination yielding powders of fine
particle sizes. Active sinterable powders are produced commercially, usually by hydrolysis of a mixture of ZrOCl2 and YC13 to precipitate the mixed
hydroxide. The method produces a powder having a very fine (about 0.3 |lm) particle size. Alternative methods of fabricating fine active powders include
CVD and hydrothermal oxidation. Preparation of zirconia powders is covered in the literature (78,88—90).
Zirconia powders may be shaped using techniques such as slip casting, dry pressing, and injection molding. The ceramics may be densified by
sintering, hot pressing, or hot isostatic pressing, provided the thermal treatment of the material is appropriate to develop the desired microstructure. Other
fabrication methods, such as microwave sintering, are also under investigation. Reaction sintering has been used to produce microstructures of zirconia
particles in various ceramic matrices as well (91,92).
Partially Stabilized Zirconia. PSZ is comprised of a cubic zirconia matrix having a fine dispersion of tetragonal particles. Stabilizing
additives are on the order of several weight percent of MgO, CaO, or Y2O3 to produce the appropriate microstructures. Powders are first sintered at an
appropriate temperature, solution annealed in the single-phase cubic region of the zirconia phase diagram, and then heat-treated (aged) in the two-phase
tetragonal + cubic region to nucleate and grow tetragonal precipitates within the cubic matrix. A critical size range, submicrometer to several micrometers,
exists for stress-induced transformation of tetragonal zirconia particles. If the material is aged too long and the precipitates grow larger than the critical size,
particles spontaneously transform to the monoclinic phase upon cooling to room temperature; if the particles are smaller than the critical size,
transformation does not occur. The critical size limit depends on the matrix constraint and the composition of the zirconia. As the stabilizing oxide content
is increased, the chemical free energy associated with the phase transformation decreases and hence larger particles can be induced to remain in the
metastable tetragonal form.
Tetragonal Zirconia Polycrystal. TZP ceramics may be produced from compositions stabilized using Y2O3 (2—4 mol %) or cerium(IV)
oxide [1306-38-3]., CeCf (9—14 mol %) by sintering in the single-phase tetragonal region of the phase diagram (87,93). In order to retain the tetragonal
phase to room temperature, the grain size must be kept very small (usually <1 ^m). Each grain is restrained by surrounding grains from transforming to the
stable monoclinic form. TZP materials exhibit exceptionally high fracture strength values and high toughness. Yttria TZP, however, exhibits a serious
decrease in strength when aged in air between 150° and 300°C (94—97). Because of fine grain size and the presence of a grain boundary phase, TZP
ceramics exhibit pseudosuperplasticity at 1200°C with extension of >100% measured in tension (98,99). This feature provides opportunities for shape
forming of this material.
Zirconia Toughened Ceramics. Zirconia particles can be embedded in host matrices to form a variety of transformation-toughened
ceramics (100). Hosts include A12O3 (84,101), P"-alumina (102), mullite [55964-99-3] (103,104,91), Si3N4 (105-109), SiAlON (110), cordierite [12182-53-5]
(111), glass ceramics (112), TiB2 (113,114), MgO (115), and molybdenum silicide [12136-78-6] MoS^ (116). Requirements are that the host matrix not react
with the ZrO2 and that the matrix have a sufficiendy high elastic modulus to retain the ZrO2 in the tetragonal state. The zirconia particles can then
transform as they do in PSZ or TZP materials. Optimum toughness and strength result using very fine (usually <1 /an) zirconia. ZTC are generally formed
by either mixing powders of zirconia and the matrix and sintering or chemically preparing powders of mixed composition by coprecipitation. Mixed
powder synthesis yields intergranular particles whereas the chemical route yields intragranular ones. Mechanical properties are optimized by maintaining a
very well dispersed zirconia phase and avoiding particle growth during sintering. However, sintering temperatures must be high enough to achieve full
density.
Toughening Mechanisms. The mechanics of tetragonal-to-monoclonic transformation can effect the strength and toughness of the
ceramic.
Stress-Induced Transformation Toughening. The stress field of a crack can initiate martensitic transformation (117—121); the transformed particles expand
against the matrix, resulting in compressive stress on the crack surface. This stress acts to reduce the eventually stop propagation of the crack. The particles
which have transformed in the vicinity of the crack comprise what is called a process zone. This zone tends to shield the crack tip from applied stress.
Compressive Suface Cogers. Spontaneous tetragonal-to-monoclinic transformation of zirconia particles may take place at or near the surface of a macroscopic
part as a result of the absence of the hydrostatic constraint near the free surface. The particles expand and induce a compressive strain. This compressive
surface layer leads to high fracture strength and in some cases the strength maybe doubled. Surface grinding has been found to be the most effective
method of inducing this transformation.
Microcrack Toughening. Toughening can result from both residual and stress induced microcracks. Residual microcracks are formed when the retained
tetragonal particles are larger than some critical size causing them to spontaneously transform on cooling. The stresses generated around the transformed
particles induce microcracks between the particles and the matrix. The microcracks may extend in the stress field of the propagating crack, or deflect the
propagating crack, thereby absorbing or dissipating fracture energy and, hence, increasing the toughness of the ceramic. However, although fracture toughness
is increased, the presence of either stress-induced or residual microcracks can result in a significant reduction in the fracture strength. Because of increased
fracture toughness, microstructures having residual microcracks are useful in situations requiring resistance to thermal shock. These materials must be
carefully processed to produce particles large enough to transform but small enough to cause only limited microcrack development.
The microstructure of zirconia materials can be designed to yield optimum combinations of fracture strength and toughness by controlling the
relative amount of stress-induced transformation toughening and microcracking (122). The temperature dependence of mechanical properties is also
correlated with different toughening mechanisms. Transformation toughening provides high strength and toughness at low and intermediate temperatures
but its effectiveness decreases as temperature increases. Microcrack toughening is a less effective toughening mechanism but it is essentially
temperature-independent.
Crack Deflection. Crack deflection can result when particles transform ahead of a propagating crack. The crack can be deflected by the localized residual
stress field which develops as a result of phase transformation. The force is effectively reduced on the deflected portion of the propagating crack resulting
in toughening of the part.
Properties. Transformation toughened ceramics have excellent strength and toughness at low and intermediate temperatures. Compared to SiC
and Si3N4, ZrO2-toughened ceramics can withstand significandy higher applied stress at room temperature (see Fig. 1), but SiC and Si3N4 have much
greater high temperature potential. Zirconia ceramics have limited high (>800“ 1000° C) temperature capability for two reasons: creep rates are high
compared to nonoxide ceramics; and the contribution from the transformation toughening mechanism decreases as the temperature increases. That is, as
the tetragonal phase becomes more stable, the driving force for the transformation decreases. Table 3 lists the properties of zirconia ceramics each of
which is a family of materials. Specific properties are a function of amount and type of stabilizing agent, processing conditions utilized, and resulting
microstructure.
Table 3. Properties of Zirconia Ceramics
Property
density, kg/m3
hardness, kg/mm2
flexural strength, MPa
fracture toughness, MPa^/in
elastic modulus, GPae
PSZa TZPb ZTAC
5.7 6.0 4.2
1000 1300 1600
300-700 1000-2500 400-900
4-8 5-15 5-10
200 200 340
Kirk-Othmer Encyclopedia of Chemical Technology (4th Edition)
324
STRUCTURAL CERAMICS
Voll
thermal expansion coeff, x 10 6/K 9—10 10—11
thermal conductivity, W/(m-K) 2.0—2.5 2.7
maximum service temperature, °C 950 500
Properties of PSZ depend on whether CaO, MgO, or Y2O3 is used as the stabilizing agent.
k Properties of TZP depend on whether CeO2 or Y2O3 is used as the stabilizing agent.
Properties of zirconia toughened alumina, ZTA, depend on the specific microstructure and the proportions of zirconia and alumina.
To convert MPa to psi, multiply by 145.
To convert GPa to psi, multiply by 145 x 103 .
8-9
7-10
1700
TZP materials have exceptionally high fracture strength values: strengths greater than 1000 MPA are consistendy achieved and values over 2000
MPa have been reported. Toughness is generally greater than 5 MPa^/m (123). Yttria TZP, however, exhibits a serious decrease in strength when aged in air
between 150° and 300°C (94—97). The effect appears to be related to water vapor in the air reacting with the Y2O3-ZrO2 at the ceramic surface, promoting
the tetragonal-to-monoclinic transformation, and forming microcracks. There are indications that this problem can be avoided or at least minimized by
achieving a suitably fine grain size (0.2—0.6 |lm), by adding finely dispersed alumina to the yttria—zirconia (124), or by substituting CeO2 for Y2O3 as the
stabilizing oxide (125). Addition of alumina (M20 wt % A12O3) to Y—TZP inhibits grain growth and transformation of the tetragonal particles. The
toughness of Ce—TZP (>30 MPayTn) can be higher than that of Y—TZP (15-20 MPayTn) but the strength is relatively low, 500—1000 MPa for Ce—TZP vs
1500— 2000 MPa for Y—TZP (125). A limiting factor in the appEcation of zirconia ceramics is the decrease in properties that result as temperatures increase.
Several possible strategies exist for improving the high temperature capabilities of zirconia ceramics (126). SiC whisker reinforced zirconia ceramics have
also been investigated (127—129).
Applications. One of the most demanding applications for zirconia ceramics is in automotive engine parts, particularly for the diesel engine
(130). Applications attempt to exploit its low thermal conductivity and/or the wear-resistance characteristics. One approach utilizes ceramic liners or inserts
(eg, piston crowns, head face plates, and piston liners) attached to metal engine components. PSZ is a favored material for this approach, not only because
it has low thermal conductivity and is a good insulator, but more importandy, because its high thermal expansion coefficient is close to that of cast iron.
This compatibility facilitates attachment and reduces the possibility of failure during engine cycling. Other engine applications for zirconia include
components which are limited by wear, particularly in the valve train,such as cams, cam followers, tappets, and exhaust valves.
Alumina—zirconia ceramics have superior strength, toughness, and wear resistance when compared to conventional alumina and these composite
ceramics have found use as cutting tool tips and abrasion wheels. Applications include scissors and shears for cutting of difficult materials such as Kelvar,
and cutting and slitting of industrial materials, such as magnetic tape, plastic film, and paper items. The fracture toughness and thermal shock resistance of
transformation-toughened PSZ has made it a leading candidate for both wire drawing and hot extrusion dies. Seals in valves, chemical pumps, and abrasive
slurry pumps and impellers are being made of zirconia ceramics. In some applications involving abrasive slurries, PSZ materials can be more wear resistant
than siEcon carbide. Components requiring long life under low load conditions, such as thread guides and bearings and guides for dot matrix printers can
also be made successfully from zhconia. MgO—PSZ has found the widest commercial use because of the range of tailored microstructures which can be
produced.
Zhconia also has suitable properties for thermal barrier coatings, for turbine rotors for example, because of its high thermal expansion coefficient,
low thermal conductivity, good chemical stabiEty, and thermal shock resistance (131—133). Plasma-sprayed zhconia compositions have been investigated
and the most durable coatings were found to be formed from a partially stabilized zhconia composition. A major problem encountered with such coatings
is corrosive attack by the mineral constituents in fuel oil leading to destabilization of the tetragonal zhconia to give the monoclinic form.
In all appEcations involving zhconia, the thermal instabiEty of the tetragonal phase presents limitations especially for prolonged use at temperatures
greater than ^1000° C or uses involving thermal cycling. Additionally, the sensitivity of Y—TZP ceramics to aqueous environments at low temperatures has
to be taken into account. High raw material costs have precluded some appEcations particularly in the automotive industry.
Environmental Aspects
Exposure limits for siEcon carbide and powders of zhconium compounds (including zhconium dioxide) have been estabEshed by ACGIH. TLV—TWA's
are 10 mg/m3 and 5 mg/m3, respectively. OSHA guidelines for zhconium compounds call for a PEL of 5 mg/m3. There are no exposure limits for siEcon
nitride powder, but prudent practice suggests a TLV—TWA of 0.1 mg/m3. The soEd ceramics present no apparent health hazard. In machining such
ceramics, however, care should be taken to prevent inhalation of resphable particles in amounts in excess of estabEshed limits. Disposal should be in
approved landfills; the materials are inert and should pose no danger to the environment.
Economic Aspects
The production of advanced ceramic mechanical and wear components in Japan in 1989 is estimated at one bilEon U.S. doEars. SiEcon nitride powder
production amounted to about ten milEon U.S. dollars, about one tenth of the total nonoxide ceramic powder production. It is projected that in the year
2000 the market for these ceramic components will be in the $2.7—4.2 bilEon range (134). In Western Europe the market for mechanoceramics in 1989 was
estimated at $200 million U.S. dollars and projected to grow modesdy in the near future. The amount of siEcon nitride and siEcon carbide sold was $32 and
$21 milEon, respectively (135). It is projected that in the United States the market for structural ceramics in automotive appEcations will grow in the year
2000 to $820 million (in 1990 dollars) from the current estimate of $81 million for 1990. In the same time interval the market for wear parts and other
industrial advanced ceramics (excluding cutting tools) is expected to grow to $720 million from its 1990 value of $150 million. The corresponding figures
for the aerospace and defense-related advanced ceramics market are $445 and $80 milEon, respectively (136). Structural ceramics producers are given in
Table 4.
Table 4. Producers of Structural Ceramics
Location, company______
AustraEa
Nilcra
Europe
ASEA
ESK
Feldmbhlea
Japan
Kyocera Corp.
NGK Insulators
NTK Technical Ceramics
Ceramic type
ZrO2
Si3N4
SiC, Si3N4
ZrO2
SiC, Si3N4, ZrO2
SiC, Si3N4
Si3N4
Kirk-Othmer Encyclopedia of Chemical Technology (4th Edition)
325
STRUCTURAL CERAMICS
Voll
United States
Carborundum Co.
Ceramatec
Coors
Corning
Dow Chemical
WR Grace
GTE
SiC
ZrO2
ZrO2
ZrO2
ZrO2
ZrO2
Si3N4
Norton Co.
Zircoa
SiC, Si3N4, ZrO2
ZrO2
Kycocera Corp, licenses Feldmbhle and Max Planck Institute zirconia technology.
Largest U.S. suppliers of ZrO2 ceramics.
Premium zirconia powders cost from U.S. $55 to $100/kg. Suppliers include Ferro and Z-Tech (a subsidiary of ICI); Japanese sources of powders
include Toyo Soda Manufacturing Company (now Tosoh) and Daichi Kigenso.
BIBLIOGRAPHY
1. W. Bunk and H. Hausner, eds., Proc. of2ndlnt. Symp. on Ceramic Materials and Componentsfor Engines, Vedag Deutsche Keramische Gesellschaft, Bad
Honeff, 1986.
2. P. F. Becher, M. V. Swain, and S. Somiya, eds., Advanced Structural Ceramics, Materials Research Society Symp. Proc. Vol. 78, Materials Research Society,
Pittsburgh, Pa., 1987.
3. J. B. Wachtman, Jr., ed., Structural Ceramics: Treatise on Materials Science and Technology, Vol. 29, Academic Press, New York, 1989.
4. G. L. Leatherman and R. N. Katz, Superalloys, Supercomposites and Superceramics, Academic Press, New York, 1989, p. 671.
5. M. Srinivasan in Ref. 3, p. 99.
6. N. Ault andj. Crowe,Am. Ceram. Soc. Pull 68, 1062 (1989).
7. K. Kajima, H. Noguchi, and M. Konishi, J. Mater. Sci. 24, 2929 (1989).
8. P. Shaffer, Ceram. Eng. Sci. Proc. 6, 1289 (1985).
9. C. Forrest, P. Kennedy, and J. Sherman, Spec. Ceram. 5, 99 (1972).
10. F. Kennard, Ceram. Eng. Sci. Proc. 7, 1095 (1986).
11. P. Kennedy in S. Hampshire, ed., Mon-Oxide TechnicalandEngineering Ceramics, Elsevier Applied Science, London, 1986, p. 301.
12. G. Weaver and B. Olson in R. Marshal, J. Faust, Jr., and C. Ryan, eds., Silicon Carbide—1973, University of South Carolina Press, Columbia, S.C.,
1974, p. 367.
13. R. Storm, Sagamore Army Materials Research, 37th Conf. Proc. 1990.
14. S. Prochazka in J. Burke, A. Go mm, and R. Katz, eds., Ceramicsfor High Performance Applications, Brook Hill, Chestnut Hill, Mass., 1974, p. 239.
15. S. Prochazka, Spec. Ceram. 6, 171 (1975).
16. Y. Murata and R. Smoak in S. Somiya and S. Saito, eds., Proc. Int. Symp. of Factors in Densification and Sintering of Oxide and Monoxide Ceramics,
Gakujutsu Bunken Fukyu-Kai, Tokyo, 1979, p. 382.
17. W. Воске, H. Landfermann and H. Hausner, Powder Metal. Int. 13(1), 37 (1981).
18. W. Bocker and H. Hausner, Powder Metal. Int. 10(2), 87 (1978).
19. E. Maddrell, J. Mater. Sci. Eett. 6, 486 (1987).
20. T. Mizutani, M. Hayashi, and A. Tsuge,/ Ceram Soc. Jpn. Int. Ed. 96, 211 (1988).
21. R. Hamminger,/ Am. Ceram. Soc. 72(9), 1741 (1989).
22. S. Prochazka, C. Johnson, and R. Giddings in Ref. 16, p. 366.
23. J. Coppola and co-workers in Ref. 16, p. 400.
24. L. Ogbuji, Ceram. Int. 12, 173 (1986).
25. G. Watson, T. Moore, and M. Millard, Am. Ceram. Soc. Pull. 64(9), 1253 (1985).
26. K. Hunold, Powder Metal. Int. 21(3), 22 (1989).
27. R. Katz and G. Quinn in F. Riley, ed., Progress in Nitrogen Ceramics, Martinus Nijhoff Publishers, The Hague, Netherlands, 1983, p. 491.
28. D. Larsen and J. Adams, TechnicalReportAFWAH-TR-83M4, April 1984.
29. D. Larsen and J. Adams in Ref. 27, p. 695.
30. J. Cuccio and co-workers, Proc. 27th Automotive Technol. Dev. Contractors' Coord. Mtg, Publication P-230, Society of Automotive Engineers,
Warrendale, Pa., April 1990, p. 335.
31. D. Shetty, I. Wright, and A. Clauer, 1Емг79, 275 (1982).
32. S. Lasday, Ind. Heat. 35 (Aug. 1990).
33. M. Ferber and co-workers,/. Am. Ceram. Soc. 68(4), 191 (1985).
34. G. Fischman and S. Brown, Mater. Sci. Eng. 71, 295 (1985).
35. D. Butt, J. Mecholsky, and V. Goldfarb, / Am. Ceram. Soc. 72(9), 1628 (1989).
36. S. Natansohn in A. Vary and J. Snyder, eds., Nondestructive Testing of High Performance Ceramics, The American Ceramic Society, Westerville, Ohio,
1987, p. 73.
37. A. Atkinson, A. Moulson, and E. W. Roberts, / Am. Ceram. Soc. 59, 285 (1976).
38. W. Rhodes and S. Natansohn, Am. Ceram. Soc. Pull. 68, 804 (1989).
39. U.S. Pat. 4,405,589 (Sept. 20, 1983), T. Iwai, T. Kawahito, and T. Yamada (to Ube Industries, Ltd.).
40. E. Turkdogan, P. Bills, and V. Tippett, / Appl. Chem. 8, 296 (1958).
41. F. Lange, Int. Metals Rev. 25, 1 (1980).
42. S. Natansohn and V. Sarin in H. Hausner, G. Messing, and S. Hirano, eds., Ceramic Powder Processing Science, Deutsche Keramische Gesellschaft e.V.
Kirin, Germany, 1989, p. 433.
43. C. Quackenbush and J. Smith, Paper No. 84-GT-228, American Society of Mechanical Engineers, New York, 1984.
44. D. Clarke and G. Thomas,/ Am. Ceram. Soc. 61, 114 (1978).
45. G. Ziegler, Z. W erkstoftec/i. 14, 189 (1983).
46. M. Torti, in ref. 3, p. 161.
47. H. Larker in F. Riley, ed., Progress in Nitrogen Ceramics, Martinus Nijhoff, Boston, Mass., 1983, p. 717.
48. G. Ziegler and G. Woetting, Int. J. High Technol. Ceram. 1, 31 (1985).
49. G. Woetting and G. Ziegler, Sprechsaal 119, 555 (1986).
Kirk-Othmer Encyclopedia of Chemical Technology (4th Edition)
326
STRUCTURAL CERAMICS
Voll
50.
51.
52.
53.
54.
55.
56.
57.
58.
59.
60.
61.
62.
63.
64.
65.
66.
67.
68.
69.
70.
71.
72.
73.
74.
75.
76.
77.
78.
79.
80.
81.
82.
83.
84.
85.
86.
87.
88.
89.
90.
91.
92.
93.
94.
95.
96.
97.
98.
99.
100.
101.
102.
103.
104.
105.
106.
107.
108.
109.
110.
111.
112.
113.
114.
115.
116.
G. Ziegler, J. Heinrich, and G. Wool ling,/. Mater. Sci. 22, 3041 (1987).
G. Bandyopadhyay and K. French,/. Eng. for Gas Turbines and Power 108, 536 (1986).
C. Quackenbush, K. French, and J. Neil, Automotive Technol. Dev. Contractors' Coord. Mtg, 19th Summary Report, U.S. Dept, of Energy, Washington,
D.C., 1981, p. 424.
J. Neil and co-workers, Paper No. 82-GT-252, American Society of Mechanical Engineers, New York, 1982.
G. Bandyopadhyay and co-workers in J. Tennery, ed., Proc. 3rd. Int. Symp. on Ceramics Materials and ComponentsforEngines, American Ceramic Society,
Westerville, Ohio, 1989, p. 1397.
J. Neil and co-workers, Proc. 27th Automotive Technol. Dev. Contractors' Coord. Mtg, Society of Automotive Engineers, Warrendale, Pa., 1990, p. 303.
G. Bandyopadhyay and co-workers, Paper No. 90-GT-47, American Society of Mechanical Engineers, New York, 1990.
J. Neil and co-workers, Preprints of the 28th AnnualAutomotive Technol. Dev. Contractors' Coord. Mtg. (Oct. 1990, Dearborn, Mich.), Society of
Automotive Engineers, Warrendale, Pa., 1990.
J. Pollinger and B. Busovne, Proc. 27th Automotive Technol. Dev. Contractors' Coord. Mtg, Society of Automotive Engineers, Warrendale, Pa., 1990, p.
357.
B. Me Entire and co-workers, Proc. 27th Automotive Technol. Dev. Contractors' Coord. Mtg, Society of Automotive Engineers, Warrendale, Pa., 1990, p.
341.
G. L. Leatherman and R. N. Katz, Superalloys, Supercomposites, and Superceramics, Academic Press, New York, 1989, p. 671.
B. Me Entire and co-workers, Preprints of the 28th Annual Automotive Technol. Dev. Contractors' Coord. Mtg. (Oct. 1990, Dearborn, Mich.), Society of
Automotive Engineers, Warrendale, Pa., 1990.
N. Hecht and co-workers, Preprints of the 28th Annual Automotive Technol. Dev. Contractors' Coord. Mtg, (Oct. 1990, Dearborn, Mich.), Society of
Automotive Engineers, Warrendale, Pa. 1990.
J. Smith and C. Quackenbush, Am. Ceram. Soc. Bull 59, 533 (1980).
S. Natansohn in V. Tennery, ed., Proc, drdint. Symp. on Ceramics Materials and ComponentsforEngines, The American Ceramic Society, Westerville,
Ohio, 1989, p. 27.
Technical Bull, on Characteristics of Kyocera Technical Ceramics, Kyocera Corporation, 1988.
R. Katz in Ref. 3, p. 1.
J. Wachtman, Jr., and co-workers, Japanese Structural Ceramics Research andDevelopment, Technical Assessment Report, Science AppEcations International
Corporation, McLean, Va., 1989, Chapt. 5.
C. Lewis, Mater. Eng. 30 (May 1989).
K. Weber and N. Hakim, 1st Int. Ceramic Science and Technology Congress, Paper4-SI-89C, (Anaheim, Calif., October, 1989).
R. Katz, 7th Cimtec World Ceramic Congress, Paper B4.1-E01, (Montecatini Terme, Italy, July 1990).
R. Larsen, 1st Int. Ceramic Science and Technology Congress, Paper 9-SI-89C (Anaheim, Calif., Oct. 1989).
H. Yamaguchi and co-workers, 1st Int. Ceramic Science and Technology Congress, Paper 15-SI-89C, (Anaheim, Calif., October 1989).
H. Helms and co-workers, Preprints of the 28th Annual Automotive Technol. Development Contractors' Coord. Mtg. (Dearborn, Mich., Oct. 1990).
K. D. Moergenthaler, Preprints of the 28th Annual Automotive Technol. Development Contractors' Coord. Mtg. (Dearborn, Mich., Oct. 1990).
T. Bomemisza, 7th Cimtec World Ceramic Congress, PaperB4.1-E05, (Montecatini Terme, Italy, July 1990).
A. H. Heuer and L. W. Hobbs, eds., Science and Technology of Zirconia I, Adv. in Ceram. 3, American Ceramic Society, Columbus, Ohio, 1981.
N. Claussen, M. Rbhle, and A. H. Heuer, eds., Science andTechnology of Zirconia II, Adv. in Ceram. 12, American Ceramic Society, Columbus, Ohio,
1984.
R. Stevens, Zirconia and Zirconia Ceramics, 2nd ed., Magnesium Elektron Publication No. 113,1986.
Reference 2, pp. 3—172.
S. Somiya, N. Yamamoto, and H. Yanagida, eds., Science and Technology of Zirconia III, Adv. in Ceram. 24, American Ceramic Society, Columbus, Ohio,
1988.
W. Roger Cannon in Ref. 3, p. 195.
M. Yoshimura, Am. Ceram. Soc. Bull. 67(12), 1950 (1988).
R. Garvie, R. Hannink, and R. Pascoe, Nature (Eondon) 258, 703 (1975).
N. Claussen,/. Am. Ceram. Soc. 59(1—2), 49 (1976).
T. Gupta and co-workers,/ Mater. Sci. 12(12), 2421 (1977).
T. Gupta, F. Lange, and J. Bechtold,/ Mater. Sci. 13, 1464 (1978).
T. Gupta, Sci. Sintering, 10, 2421 (1978).
M. van de Graaf and A. Burggraaf in Ref. 77, p. 744.
D. Clough, Ceram. Eng. Sci. Proc. 6(9—10), 1244 (1985).
W. Zevert and co-workers,/ Mater. Sci. 25(8), 3449 (1990).
M. Hulmstrom, T. Chartier, and P. Boch, Mater. Sci. Eng. A 109, 105 (1989).
Y. Shen and R. Brook, Sci. Sintering 17(1—2), 35 (1985).
I. Netdeship and R. Stevens, Int. J. High Technol. Ceram. 3, 1 (1987).
K. Tsukuma, Y. Kubota, and Tsukidate in Ref. 77, p. 382.
T. Sato and co-workers, J. Am. Ceram. Soc. 68(12), C320 (1985).
N. Hecht, S. Jang, and D. McCullum in Ref. 80, p. 133.
M. Matsui and co-workers in Ref. 80, p. 607.
F. Wakai, Br. Ceram. Trans. J. 88(6), 205 (1989).
Y. Yoshizawa and T. Sakuma,/. Am. Ceram. Soc. 73(10), 3069 (1990).
N. Claussen in Ref. 77, p. 325.
J. Wang and R. Stevens,/ Mater. Sci. 24, 3421 (1989).
L. Viswanathan, Y. Ikuma, and A. V. Virkar,/ Mater. Sci. 18, 109 (1983).
J. Moya and M. Osendi,/ Mater. Sci. 19, 2909 (1984).
Q.-M. Yuan, J.-Q. Tan, and Z.-G. Jin,/ Am. Ceram. Soc. 69(3), 265 (1986).
N. Claussen and J. Jahn,/ Am. Ceram. Soc. 61(1—2), 94 (1978).
F. Lange, L. Falk, and B. Davis,/ Mater. R«. 2(1), 66 (1987).
S. Kobayashi and S. Wada in Ref. 80, p. 127.
A. Tjemlund and co-workers in Ref. 80, p. 1015.
T. I 'ksir ii.m, L. Falk, and E. Knutsonwedel,/ Mater. Sci. Eett. 9(7), 823 (1990).
S. Hirano, T. Hayashi, and T. Nakashima,/ Mater. Sci. 24(10), 3712 (1989).
I. Wadsworth, J. Wang, and R. Stevens,/ Mater. Sci. 25(9), 3982 (1990).
G. Leatherman and M. Tomozawa,/. Mater. Sci. 25(10), 4488 (1990).
T. Watanabe and K. Shoubu,/ Am. Ceram. Soc. 68(2), C34 (1985).
K. Shobu and co-workers in Ref. 80, 1091.
Y. Ikuma, W. Komatsu, and S. Yaegashi,/ Mater. Sci. Eett. 4, 63 (1985).
J. Petrovic and R. Honnell,/. Mater. Sci. 25(10), 4453 (1990).
Kirk-Othmer Encyclopedia of Chemical Technology (4th Edition)
327
STRUCTURAL CERAMICS
Voll
117. D. Porter and A. Heuer,/. Am. Ceram. Soc. 60(3—4), 183 (1977).
118. A. Evans and A. Heuer,/Am. Ceram. Soc. 63(5—6), 241 (1980).
119. F. Lange,/ Mater. Sci. 17(1), 225 (1982).
120. A. Evans in Ref. 77, p. 193.
121. J. Am. Ceram. Soc. 69(3,7) (1986). These two issues of the Journal contain a collection of articles devoted to the subject of transformation
toughening in ZrO2 containing ceramics.
122. M. Rbhle, N. Claussen, and A. Heuer,/Am. Ceram. Soc. 69(3), 195 (1986).
123. T. Masaki,/ Am. Ceram. Soc. 69(8), 638 (1986).
124. K. Tsukuma, K. Ueda, and M. Skimada,/ Am. Ceram. Soc. 68(1), C4 (1985).
125. K. Tsukuma, T. Takahata, and M. Shiomi in Ref. 80, p. 721.
126. N. Claussen, Mater. Sci. Eng. 71, 23 (1985).
127. N. Claussen, K. Weisskopf, and M. Rbhle, / Am. Ceram. Soc. 69(3), 288 (1986).
128. N. Claussen and G. Petzow in R. E. Tressler, G. L. Messing, C. G. Pantano, and R. E. Newnham, eds., TailoringMultiphase and Composite Ceramics,
Mater. Sci. Res. 20, 1986, p. 649.
129. E. Lucchini and S. Maschio,/ Mater. Sci. Lett. 9(4), 417 (1990).
130. U. Dworak and co-workers in Ref. 2, p. 480.
131. R. Bratton and S. Lau in Ref. 1, p. 226.
132. R. Miller, Surf. Coat Technol. 30(1), 1 (1987).
133. R. Vincenzini, Ind. Ceram. 10(3), 113 (1990).
134. A. Kato and H. Yoshida, 7th Cimtec World Ceramic Congress, Paper B6-L02, (Montecatini Terme, Italy, July 1990).
135. H. Reh, 7th Cimtec World Ceramic Congress, PaperB6-L04 (Montecatini Terme, Italy, July 1990).
136. R. Spriggs, R. Katz, and S. Hellem, 7th Cimtec World Ceramic Congress, PaperB6-L03, (Montecatini Terme, Italy, July 1990).
Marina R. Pascucci
Jeffrey T. Neil
Samuel Natansohn
GTE Laboratories Incorporated
Kirk-Othmer Encyclopedia of Chemical Technology (4th Edition)
328
AERATION
Voll
Kirk-Othmer Encyclopedia of Chemical Technology (4th Edition)
329
AERATION
Voll
AERATION
Biotechnology,
Water treatment,
Kirk-Othmer Encyclopedia of Chemical Technology (4th Edition)
330
BIOTECHNOLOGY
Voll
BIOTECHNOLOGY
The supply of oxygen to a growing biological species, aeration, in aerobic bioreactors is one of the most critical requirements in biotechnology. It was one
of the biggest hurdles that had to be overcome in designing bioreactors (fermenters) capable of turning penicillin from a scientific curiosity to the first
major antibiotic (1). Aeration is usually accomplished by transferring oxygen from the air into the fluid surrounding the biological species, from where it is
in turn transferred to the biological species itself The rate at which oxygen is demanded by the biological species in a bioreactor depends very significantly
on the species, on its concentration, and on the concentration of the other nutrients in the surrounding fluid (1,2) (see Cell culture technology). There is
no unique set of units used to define this rate requirement, but some typical figures are given in Table 1. The very wide range is noteworthy; during the
course of a batch bioreaction, oxygen demand often passes through a marked maximum when the species is most biologically active (1).
Table 1. Oxygen Demands of Biological Species
Biological species kg O2/(m3li) Reference
bacteria/yeasts 1 to 7 1,3
plant cells 0.03 to 0.3 4
seed priminga 1 to 8 x 1СГ2 5
mammalian cells 2 to 10 x 10“3 6
Based on a seed density of 100 kg/m3.
Based on a cell density of 1012 cells/m3.
The main reason for the importance of aeration lies in the limited solubility of oxygen in water, a value which decreases in the presence of
electrolytes and other solutes and as temperature increases. A typical value for the solubility of oxygen (the equilibrium saturation concentration) in water in
the presence of air at atmospheric pressure at 25°C is about 0.008 kg O2/m3 (= 8parts per million = 0.25 mmol/L). Thus, for a yeast or bacterial
bioreaction demanding oxygen at the rates given in Table 1, all oxygen is utilized in about 10 to 40 s (3,7).
In addition to each bioreaction demanding oxygen at a different rate, there is a unique relationship for each between the rate of reaction and the
level of dissolved oxygen (1,8). A typical generalized relationship is shown in Figure 1 for a particular species, eg, Penicillium chrysogenum or yeast. The shape
of the curve is such that a critical oxygen concentration, C , can be defined above which the rate of the bioreaction is independent of oxygen
concentration, ie, zero order with respect to oxygen. The typical values given in Table 2 indicate that the critical concentration is usually on the order of 1 to
20% of the oxygen saturation value. Thus for each species, oxygen should be transferred rapidly enough to allow the oxygen demand to be met throughout
the volume in which the bioreaction is occurring using a level of dissolved oxygen above the critical value. Failure to do so leads to a reduction in the overall
rate and possibly a change of bioreaction to a different and unwanted metabolic pathway. If oxygen concentration falls low enough, an anaerobic reaction
may develop. Yeast fermentations are a particularly good example of such possibilities (1,8).
Fig. 1. The relationship between rate of oxygen uptake and dissolved oxygen, concentration where C is the critical oxygen concentration.
Table 2. Critical Oxygen Concentrations at 30°Ca
Organism Ccnt, (kg °2/m3) x Ю4
A^otobacter vinelandi Pseudomonas denitrificans Penicillium chrysogenum Aspergillus ory^ae 6 to 16 3 3 6.5
aRef. 1.
In the cases of pellets (9), flocs (10), and immobilized cells and enzymes (11), aeration becomes more complex (1). Here it is the level of oxygen at
the active biological site within the solid particle or aggregate rather than the level of dissolved oxygen in the surrounding fluid that determines the overall
rate of reaction. Indeed, in certain cases such as penicillin fermentations, pellets form of such a size that the center of the pellet becomes inactive (12). A
similar effect is observed when biofilms form on cooling surfaces. At a certain thickness the oxygen concentration at the base of the film becomes zero, ie,
that region becomes anaerobic, and the biological species, eg Pseudomonasfluorescens^ at the surface which is being fouled dies and sloughs off (13).
Principles of Oxygen Transfer
Kirk-Othmer Encyclopedia of Chemical Technology (4th Edition)
331
BIOTECHNOLOGY
Voll
The Basic Mass Transfer Steps. Figure 2 shows the steps through which oxygen must pass in moving from air (or oxygen-enriched air) to
the reaction site in a biological species (1,14). The steps consist of transport through the gas film inside the bubble, across the bubble—Equid interface,
through the liquid film around the bubble, across the well-mixed bulk liquid (broth), through the liquid film around the biological species, and finally
transport within the species (eg, cell, seed, microbial floc) to the bioreaction site. Each step offers a resistance to oxygen transfer. In the last step, the
resistance to transport is negligible for freely suspended bacteria or cells which are extremely small, but for immobilized cells and biological flocs and pellets
the rate of oxygen diffusion through their structure may be rate-limiting. In the more complex situation, the rate of oxygen diffusion to the active sites
depends on mass transfer through the external boundary layer followed by diffusion through the solid as governed by Fick's law. The theory is essentially
the same as that applied to chemical catalysis (qv) and is described very well in reference 1, and other standard texts.
Bulk liquid
(broth)
film species
Fig. 2. Steps by which oxygen is transferred from the gas phase to the biological reaction site. Terms are defined in the text.
The rate-limiting step typically occurs at the air—liquid interface and, for biological species without diffusion limitations, the overall relationship can
be simply written at steady state as
oxygen transfer rate from air (OTR)
= oxygen uptake rate by biological species (OUR)
Provided this equality is satisfied and the dissolved oxygen concentration in the well-mixed liquid is greater than the critical concentration throughout the
bioreactor, then the maximum oxygen demand of the species should be met satisfactorily. Design of the bioreactor must ensure that the above
requirements are achieved economically and without damaging the biological species.
When the oxygen demand is low, eg, at the start of a batch fermentation when the amount of biomass is small, the oxygen uptake rate at the
bioreaction site is the limiting step and the level of dissolved oxygen is high (near saturation). When the oxygen demand becomes high, however, the
rate-limiting step is that associated with transfer across the bubble—liquid interface and this rate of transfer is critically dependent on the fluid flow at the
gas—liquid interface as well as the concentration of oxygen in both the gas and the liquid phases. The liquid-phase oxygen concentration is now low, but it
should not be allowed to fall below the critical value. It is when this gas-—liquid mass transfer step is rate-limiting that the biggest demands are made on the
bioreactor. Then there is the greatest difficulty in getting enough oxygen into the suspending fluid (broth) to satisfy the oxygen demand of the biological
species.
The Basic Mass Transfer Relationship. The basic principles which underlie oxygenation (aeration) are exacdy the same as those which
determine the rate of transfer of any sparingly soluble gas (oxygen) from the gas stream (air) to the unsaturated liquid (broth). The rate at which this
transfer takes place is dependent on four principal parameters (1,14,15). The first is the area of contact between the gas and the liquid. In most bioreactors,
this is provided by dispersing air in the suspending fluid (medium or broth) to give a large specific area of contact as implied by Figure 2. However, there
are also other methods, especially in wastewater treatment, by which large specific areas of contact are produced. Solid supports are used on which films of
the irrigated, biologically active species grow, eg, trickling bed filters and rotating disk contactors (11,14). The other three mass transfer rate parameters are
the driving force available (ie, the difference in concentration of oxygen in the two phases); the two-phase fluid dynamics (including the effect of viscosity);
and the chemical composition of the liquid.
The first assumption in all such physical mass transfer processes is that equiEbrium exists at the interface between the two phases. This assumption
impEes that, at the interface, the concentration of the gas in the Equid, C, is equal to its solubiEty at its partial pressure in the gas phase,p. Since, for
sparingly soluble gases such as oxygen, there is a direct proportionaEty between the two,
Pi = HC\
(1)
where H is the Henry's law constant. The second assumption is that as the gas is absorbed, its concentration falls progressively, from a high in the bulk
concentration in the gas phase, p to that at the interface, p^ then again from that on the Equid side of the interface, C, to a low in the bulk Equid, CL (see
Fig- 2)-
The rate of mass transfer, J, is then assumed to be proportional to the concentration differences existing within each phase, the surface area between
the phases, ^4, and a coefficient (the gas or Equid film mass transfer coefficient, k or respectively) which relates the three. Thus
J = &gA(pg - pj
(2)
= - cL)
(3)
Equations 2 and 3 also stand as the definitions of k and For sparingly soluble gases, however, ~ pg so that from equation 1,
q = Pi/H = Pg/H = c*g
(4)
and
J=kLA(C*-CL)
(5)
where C* is the solubiEty of oxygen in the broth that is in equiEbrium with the gas phase partial pressure of oxygen. Thus the aeration rate per unit volume
of bio reactor, N, is given by
N = J/V = kL (A/V) (C* - CL) = fcL«(Cg* + CL)
(6)
Kirk-Othmer Encyclopedia of Chemical Technology (4th Edition)
332
BIOTECHNOLOGY
Voll
where a is the interfacial area per unit volume. At steady state, IV must equal the OUR, which should be that demanded by the biological species in the
range C'L > Ccrit.
The Driving Force for Mass Transfer. The rate of mass transfer increases as the driving force, C* — CL, is increased. A', can be enhanced
as follows. From Dalton's law of partial pressures
pg = P&y
(7)
where у is the mole (volume) fraction of oxygen in the gas phase and P is the total pressure, ie, back pressure plus static head. C* (eqs. 4 and 5) is also a
function of composition and temperature, decreasing with both. CL can be low provided it is above C . However, in a very large scale bioreactor where
circulation times are of the same order as the time for total oxygen depletion (3,7), the average value may need to be kept well above C so that local
values below it may be avoided. There are very few studies on the variations of CL in any bioreactor (16,17), pardy because of the difficulty of measuring it.
Q is usually measured by an oxygen electrode which gives CL/C* as a percentage and this value is sensitive to the local velocity over the probe, particularly
if the Equid is viscous (18).
In a stirred bioreactor the liquid is generally considered well-mixed, ie, CL is spatially constant. The gas phase too may be well-mixed (19) so that
= constant = (r) )
S &/ out
(8)
where (/> )out is the partial pressure of oxygen in the exit gas and
C* = JH
& \2 g/ out '
J)
This situation is most probable with fairly intense agitation and on the small scale. On the other hand, for ease of application, it is often assumed that no
oxygen is utilized. This is the so-called no-depletion model. In this case
J = W JH
(10)
Again, it is most reasonable on the small scale, but only with low kya values. Most of the data leading to kyx values in the literature (especially those in the
review in reference 20) were obtained by making this assumption.
For large-scale bioreactors (21), especially those of the air lift type (22), the gas phase is best considered as being in plug flow, so that a log mean
value of driving force is obtained:
_ ACin-ACout
lm ln(XCin/XCout)
(И)
where
ACn = [Wjff] -Q
(12)
and
^ = [MoJh] -съ
(13)
The Mass Transfer Coefficient, Because of the interaction between and a when air is dispersed in the media, the two have rarely
been measured separately. When they have been measured, has been found to be dependent on the relative velocity between the phases, the level of
turbulence in the liquid, and the size of bubbles. However, it is a relatively weak function of all of those. In addition, it appears that impurities, whether in
solution or suspension, reduce the ease with which oxygen can pass across the interface (23) and, consequendy, reduce the value of
The specific surface, a* is also relatively insensitive to the fluid dynamics, especially in low viscosity broths. On the other hand, it is quite sensitive to
the composition of the fluid, especially to the presence of substances which inhibit coalescence. In the presence of coalescence inhibitors, the Sauter mean
bubble size, is significantly smaller (24), and, especially in stirred bioreactors, bubbles very easily circulate with the broth. This leads to a large hold-up, ie,
increased volume fraction of gas phase, 8^-. SH, and a are all related
a = 6eH/dB
(14)
Therefore, a values in the presence of coalescence inhibitors are much higher than without them (25), the changes in a outweighing changes in
Thus it is found that coalescence inhibitors such as electrolytes and low molecular weight alcohols increase kyz by up to an order of magnitude compared
to water (26). Coalescence promoters such as antifoams generally lower kyz by somewhat similar amounts (27,28). In addition, neither % nor /у is a strong
function of the fluid dynamics, but the amount of air recirculation is, so kyz and SH are both related to the fluid dynamics in similar ways (29).
Increases in broth viscosity significantly reduce kyt and cause bubble size distributions to become bimodal (30). Overall, kyt decreases
approximately as the square root of the apparent broth viscosity (31). kyt can also be related to temperature by the relationship (32)
къа = (k-,a)9nOl'T^20'1
J-i \ .Li /
(15)
where (^й)20 is the value at 20°C, 0 ~ 1.022, and Tis the temperature, °C; ie, Jy increases by about 2.5% per °C.
The Measurement of There are two main methods for measuring kyj, the unsteady-state method, and the steady-state method. In the
most common unsteady-state method, the level of dissolved oxygen is first reduced to zero, either by bubbling through nitrogen or by adding sodium
sulfite (20). Then, the increase in dissolved oxygen concentration as a function of time is followed using an oxygen electrode. One of the assumptions set
out earlier about the extent of gas-phase mixing has to be made and the choice can be very significant, giving Jy values differing by a factor of 3 for the
same raw data (33). If two oxygen electrodes, one in the liquid phase and one in the gas, are employed, this difficulty can be eliminated, but the technique is
quite difficult to use (34,35). In addition, the electrode response time requires consideration (18,20) as does the quaEty of Equid-phase mixing (22). Most
significandy, it should again be emphasized that Jy is very dependent on composition. For example, the Jy of distilled water measured by nitrogen
degassing is significandy less than that measured by sulfite deoxygenation. This difference occurs because the sulfite acts as a coalescence inhibitor, gready
enhancing hold-up, and therefore a and kyi. For stirred bioreactors, the unsteady-state technique can be adapted to give kyz values for real bioreactions
(36). Though the method has the same inherent weaknesses as all the dynamic techniques, its advantage is that the kyi is determined for the system of
Kirk-Othmer Encyclopedia of Chemical Technology (4th Edition)
333
BIOTECHNOLOGY
Voll
interest. These experimental values may well be very different from those predicted by literature correlations based on water or idealized Equids. This point
is likely to be particularly valid for mycelial fermentations for example. Additionally, the presence of antifoam can make a dramatic difference (28).
Steady-state techniques are better carried out on real bioreactions. In most cases however, and especially for batch systems, it is necessary to carry
out an oxygen balance on the air in order to determine the mass of oxygen utilized and thus the mass flux represented in equation 6. Assumptions must
again be made about the gas- and liquid-phase mixing. The significance of the assumptions is less than in the unsteady-state, except on the large scale
where the well-mixed liquid assumption breaks down (16,17). No really satisfactory way of overcoming this problem has yet been proposed. Given suitable
instrumentation, the steady-state method of measurement for the bioreaction of interest is the recommended technique. However, it is not suitable in
systems having very low oxygen demands, where the extent of oxygen utilization is insufficient to give an accurate measure of the drop in oxygen
concentration. In that case, the unsteady-state method (36) is best, as exemplified by its successful use with seed priming bioreactors (5). Recently, some
new techniques have been proposed, but they are not yet well established (37—39).
Aeration in Bioreactors
A huge variety of bio reactors has been developed and a thorough review is available (40). It is not feasible to consider them all and large numbers are only
curiosities. A useful subdivision has been made into three generic types involving the way in which air is dispersed to give the desired specific surface area.
These are bioreactors driven by rotating agitators (stirred tanks), bioreactors driven by gas compression (bubble columns /loop fermenters), and bioreactors
driven by circulating liquid (jet loop reactors) (41). The first two are the most important.
Stirred Tank Bioreactors. Traditionally, stirred tanks have been the most common types of bioreactors for aerobic processes and they
remain so even in the face of newer designs. One of the main reasons is their extreme flexibility. Operational designs using controlled air flow rates up to
about 1 wm (volume of air/min per unit volume of fermentation fluid) and variable speed motors capable of transmitting powers up to about 3 W/kg
with control down to close to zero are suitable for almost any bioreaction. These tanks are also relatively insensitive to fill, ie, to the proportion of liquid
added to the bioreactor, and are therefore quite satisfactory for fed batch operations. Control of dissolved oxygen can be carried out by either altering
aeration rate and/or agitator power input (via speed control). They are also capable of handling relatively satisfactorily broths which become significantly
viscous during the course of a fermentation. In that case design for good bulk mixing (homogenization) may be the most demanding task that the agitator
is required to carry out (42).
Until recently most industrial scale, and even bench scale, bioreactors of this type were agitated by a set of Rushton turbines having about one-third
the diameter of the bioreactor (43) (Fig. 3). In this system, the air enters into the lower agitator and is dispersed from the back of the impeller blades by
gas-filled or ventilated cavities (44). The presence of these cavities causes the power drawn by the agitator, ie, the power required to drive it through the
broth, to fall and this has important consequences for the performance of the bioreactor with respect to aeration (35). k^a has been related to the power
per unit volume, Р/ Р/ inW/m3 and to the superficial air velocity, ^,inm/s (20), where is the air flow rate per cross-sectional area of bioreactor. This
relationship in water is
/p\ 0,4
къа = 2.6 x 1(T2 (— J
(16)
and for electrolyte solutions:
(17)
Each equation is independent of impeller type. As pointed out earlier, the absolute k^a values vary considerably from liquid to liquid. However, similar
relationships have been found for other fluids, including fermentation broths, and also for hold-up, 8^-. Therefore, loss of power reduces the ability of the
Rushton turbines to transfer oxygen from the air to the broth.
Motor Gear box
Fig. 3.Alarge scale fermenter agitated by Rushton turbines (43)whereB/T = 0.1,H/T 3.3, DT (J. 35, CT = 0.25, and AC/T = 0.51.
There are two other special features of Rushton turbines (45). First, there is their radial flow. As these turbines disperse the gas—liquid mixture, they
drive it radially outward at each agitator leading to rather poor top-to-bottom mixing. Second, if the air flow rate is too high, they can no longer disperse
the air and the impellers are said to become flooded (46). New impellers have been introduced which are better able to handle the large quantities of air
needed in large scale fermentations and which do not lose power so significantly. These are still radial flow impellers and the best example is the Scaba
impeller (43) (Fig. 4a). Other types having good power characteristics and improved top-to-bottom bulk blending of nutrients (including air) are the
Lightnin' A315 (Fig. 4b) and the Prochem Maxflo T (Fig. 4c). The Ekato Tntermig (not shown) is another type proving popular in Europe (43). Though
Kirk-Othmer Encyclopedia of Chemical Technology (4th Edition)
334
BIOTECHNOLOGY
Voll
these impellers are not yet very well characterized (43,48), it is quite possible that they will take over from Rushton turbines in the future. Indeed, as the
interaction between fluid dynamics, biological performance, and aeration becomes better understood, it is quite likely that agitator types for specific
bioreactions will be chosen on a well-reasoned basis. It is also interesting to note that the reported improvements achieved by these newer agitators have
been attributed to better bulk blending compared to Rushton turbines rather than to improved aeration (42).
Fig. 4. Examples of alternative agitators: (a) Scaba 6 SRGT, (b) Lightnin' A 315, and (c) Prochem Maxflo T (43,47).
Bubble Column and Loop Bioreactors. Air driven bioreactors are said to offer these advantages (40): no opening for a shaft is required
and therefore they are less likely to become contaminated; they are less likely to damage bioreactions involving fragile material such as plant (4) or
mammahan cells (49); and they are very simple to operate on the very small scale and more economic on the very large scale where huge agitators and
motors would otherwise be required (50). Examples are given in Figure 5.
(a)
(c)
Fig. 5. Examples of air driven bioreactors: (a) bubble column, (b) draught tube, and (c) external loop.
The bubble column is clearly the simplest of these bioreactors to construct. However, because of its rather ill-defined liquid circulation, air-lift
reactors having either internal (draught tube) or external (loop) circulation of broth have been introduced. The major disadvantages of all three types are the
poor capability of handling very viscous fermentations, especially those having a yield stress; the inflexibility, especially of the air-lift types, which only work
well using a fill closely matched to the size of the bioreactor (this match affects both circulation rates, mixing and mass transfer, and bubble
disengagement); and lack of independent control of AT and mixing, since both are closely linked to the aeration rate. Reference 51 presents a very
interesting literature review and analysis of bubble columns. In contrast to stirred tank bioreactors, the bubble size may in certain cases be very dependent
on the way the air is introduced, ie, on the type of sparger employed. For systems having hindered coalescence, very fine (0.5 to 1 mm diameter) bubbles
can be formed by using porous disks provided the superficial gas velocity is less than about 10“ 2 m/s. These conditions lead to very high k^a values.
However, unless coalescence is very repressed, the bubble size grows within about 0.5 to 1 m to give k^a values similar to those found in coarse bubble
systems. There may also be disengagement problems if coalescence does not occur.
Coarse bubble systems are typically found with orifice, perforated disks, or pipe spargers. Under most realistic conditions, bubbles of about 4—6 mm
are formed. For a wide range of sizes
къа = 0.32<7
(18)
Figure 6 enables a comparison to be made of k^a values in stirred bioreactors and bubble columns (51). It can be seen that bubble columns are at least as
energy-efficient as stirred bioreactors in coalescing systems and considerably more so when coalescence is repressed at low specific power inputs (gas
velocities).
Kirk-Othmer Encyclopedia of Chemical Technology (4th Edition)
335
BIOTECHNOLOGY
Voll
Fig. 6. A comparison of k^a values (51). Represented are 1, stirred bioreactor using water, t?s = 0.02 m/s, k^a (eq. 16); 2, stirred bioreactor using water,
t?s = 0.04 m/s, k^a (eq. 16); 3, bubble column using water, k^a (eq. 18); 4, stirred bioreactor using salt water, t?s = 0.02 m/s, k^a (eq. 17); 5, stirred
bioreactor using salt water, t?s = 0.04 m/s, k^a (eq. 17); and 6, bubble column using salt water (noncoalescing).
It is also interesting to use Figure 6 to make a comparison of different aeration devices on the basis of energy-efficiency. From equation 6 and
assuming a constant driving force
oc OTR ос къа
(19)
and from Figure 6
fcL(I«:(p/v)0'6
(20)
Therefore
OTR ARV0'4
P/VX' (vJ
(21)
or
(OTR) V . ~0'4
P ДУ/
(22)
so that
fkg o2A ,7V0'4
(kWT / ' /У/
(23)
From equation 23, it can be seen that the higher the power input per unit volume, the lower the oxygen transfer efficiency. Therefore, devices should be
compared at equal transfer rates. All devices become less energy efficient as rates of transfer increase (3).
External and internal loop air-lifts and bubble column reactors containing a range of coalescing and non-Newtonian fluids, have been studied
(52,53). It was shown that there are distinct differences in the characteristics of external and internal loop reactors (54). Overall, in this type of equipment
ДаосД/0,9
(24)
showing a greater fall as viscosity increases than in stirred tank bioreactors (&Lac< ) and supporting the contention that such devices are unsuitable for
viscous broths. The complete lack of oxygen transfer found in the downcomer (52) is also a significant factor and could easily lead to values of CL < Ccrit
being found in that region.
Applications to Different Biological Species
Mycelial Fermentations. Mycelial fermentations typically become viscous and shear thinning and difficult to mix (47). For such systems k^a
and mixing are inextricably interlinked. Agitators that give better bulk blending per unit of energy can also give higher k^a values by involving more of the
fermenter volume in the mass transfer process (42). Agitation levels link with mycelial structure and if pelleted growth can be encouraged, for example,
using Penlcllllum chrysogenum (12), viscosity does not significandy increase and high levels of k^a can be maintained at satisfactory specific power inputs.
Difficulties may arise, however, if the pellets are too large, as a result of diffusion resistance within them (1), leading to oxygen starvation of the potentially
active sites at the center of the pellet (9). Though concern has been expressed about high power levels affecting mycelial length and structure, the effect has
been found to be rather small where careful experiments have been conducted. Neither has a strong link been established between morphology and
productivity (55).
Xanthan Gum Fermentations. Though xanthan gum fermentations become very viscous, the oxygen demand at this stage in a batch
fermentation appears to be rather low and hot rate limiting. Bulk blending and pH control is of more significance (56). Stirred bioreactors are therefore
preferable using large impeller to tank diameter ratios.
High Oxygen Demanding Fermentations. High oxygen demanding fermentations often require a higher level of oxygen over relatively
short periods of time. The use of enriched air, or pure oxygen, and back pressure for a short period to enhance C* as well as maximizing power and
aeration rate to give the highest k^a may be worth considering. In such circumstances the flexibiEty of the stirred bioreactor is a distinct advantage.
Mammalian Cell Culture. Air-lift (57) and bubble column bioreactors (49) have been considered necessary for handling fragile mammalian
cells because of the low oxygen demands (6). However, standard stirred bioreactors have been found not to damage hybridoma cells even at rather high
(0.25 kW/m3) power inputs using head space (nonbubbling) aeration on a small scale (58). The use of enriched ak and backpressure might also extend the
range of sizes of bioreactors operated in this mode. The successful use of stirred bioreactors at very low sparge rates has also been reported for such
systems (59).
Plant Cell Culture. Air-lift bioreactors have been favored for plant cell systems since these cultures were first studied (4). However, they can
give rise to problems resulting from flotation of the cells to form a meringue on the top. It is interesting to note that some reports indicate that stirred
bioreactors do not damage such cells (4).
Seed Priming Bioreactors. Seed priming is a new technique enabling seeds suspended in an osmotica to imbibe moisture and thus be
Kirk-Othmer Encyclopedia of Chemical Technology (4th Edition)
336
BIOTECHNOLOGY
Voll
brought to the point of germination (5). However, germination does not occur. Subsequently, on sowing, germination is very rapid and synchronous. While
the process, which takes up to about 14 days, is taking place, the seeds require oxygen. Both bubble column (60) and stirred bioreactors (5) have been used
successfully, although the former requires high air rates to keep seeds in suspension (60). In addition, some seeds such as onions, appear to have a critical
oxygen concentration greater than saturation with respect to air which may be due to diffusion limitations within the seed. In that case enriched air must be
used (60) and, in order for the process to be economic, stirred bioreactors are appropriate.
Single-Cell Protein. Systems involving single-cell proteins are often very large throughput, continuous processing operations such as the
Pruteen process developed by ICI. These are ideal for air-lift bioreactors of which the pressure cycle fermenter is a special case (50).
Biological Aerobic Wastewater Treatment. Biological aerobic waste-water treatment is a rather specialized biotechnical appEcation (61).
The activated sludge process consists of an aerated bioreactor to which the basic principles of oxygen transfer discussed here apply. Either aerated agitators
or air spargers (diffusers) are used. Where the effluent has especially high oxygen demands, however, pure oxygen or oxygen-enriched air is employed. Two
examples are the UNOX process (62) which involves agitation and the ICI deep-shaft process (equivalent to a loop fermenter) which is very effective
where space is a premium (63). For maintaining the aeration of large quantities of relatively pure water having a low oxygen demand, where space is not a
limitation, such as in reservoirs, simple plunging jets having low k^a values but very high energy efficiency are suitable (27). There is also a range of
specialized devices in which the area for oxygen transfer is achieved by the use of extended solid surfaces on which a biofilm, irrigated by the water being
treated, grows, eg, trickle beds and rotating disk contactors (61). Also, three-phase systems (fluidized beds) have been developed (11). These are bubble
columns in which the air flow keeps inert solids such as sand in suspension giving a large surface area on which the biofilm can grow (11).
NOMENCLATURE
Symbol Definition SI units
a interfacial area of air per unit volume of liquid 2 / 3 m/m
Л interfacial area available for mass transfer 2 m
c f ent critical dissolved oxygen concentration kg/m3
c concentration of oxygen in the liquid phase at the interface kg/m3
C-L concentration of oxygen in the bulk liquid kg/m3
c*g saturation concentration of oxygen in the liquid for an oxygen partial pressurep& kg/m3
Sauter mean bubble size m
H Henry's law constant kPa -m3 /kg
J oxygenation rate kg/s
k gas film mass transfer coefficient kg/(&m2kPa)
Л, liquid film mass transfer coefficient m/s
N oxygen mass flux kg/(m3-s)
P power imparted to the liquid w
P total pressure of the gas phase kPa
К partial pressure of oxygen in the bulk of the gas phase kPa
P. partial pressure of oxygen in the gas phase at the interface kPa
T temperature °C
V s superficial gas velocity m/s
J volume (mole) fraction of oxygen in gas phase dimensionless
eH hold-up dimensionless
0 temperature coefficient = 1.07 dimensionless
apparent dynamic viscosity kg/(ims)
Subscripts
in air entering the bioreactor
out gas leaving the bioreactor
lm In mean
BIBLIOGRAPHY
1. J. E. Bailey and D. F. Ollis, BiochemicalEngineeringFundamentals, 2nd ed., McGraw-Hill Book Co., New York, 1986.
2. K. Kargi and M. Moo-Young in M. Moo-Young, ed., Comprehensive Biotechnology, Vol. 2, Pergamon Press, Oxford, 1985, Chapt. 2.
3. K. van'tRiet, Trends Biotechnol. 1, 113 (1983).
4. A. H. Scragg and co-workers, Proceedings of the International Conference on Bioreactors andBiotransformations, NEL/Elsevier, London, 1987, p. 12.
5. A. W. Nienow and P. A. Broddehurst, Proceedings of the International Conference on Bioreactors andBiotransformations, NEL/Elsevier, London, 1987, p. 52.
6. M. Lavery and A. W. Nienow, Biotechnol. Bioeng. 30, 368 (1987).
7. A. P. J. Sweere, K. Ch. M. M. Luyben, and N. W. F. Kossen, Enzyme Microb. Technol. 9, 386 (1987).
8. B. Atkinson and F. Mavituna, Biochemical Engineering and Biotechnology Handbook, Macmillan, London, 1983.
9. B. Metz and N. W. F. Kossen, Biotechnol. Bioeng. 19, 781 (1977).
10. B. Atkinson and I. S. Daoud, Mdv. Biochem. Eng. 4, 42 (1976).
11. C. Webb in C. F. Forster and D. A. J. Wase, eds., EnvironmentalBiotechnology, Ellis Horwood, Chichester, 1987, Chapt. 9.
12. K. Schuged and co-workers, Proceedings of the 2nd International Conference on Bioreactor Fluid Dynamics, British Hydromechanics Research Association,
Cranfield, UK, 1988, p. 229.
13. J. A. Howell and B. Atkinson, Water Research 10, 304 (1976).
14. A. W. Nienow, in ref. 11, Chapt. 10.
15. P. V. Danckwerts, Gas—EiquidReactions, McGraw-Hill Book Co., New York, 1970.
16. N. M. G. Oosterhuis andN. W. F. Kossen, Biotechnol. Bioeng. 26, 546 (1984).
17. R. Manfredini, V. Cavallera, L. Marini, and G. Donati, Biotechnol. Bioeng. 25, 3115 (1983).
18. Y. H. Lee and G. T. Tsao,M<^. Biochem. Eng. 13, 35 (1979).
19. N. P. D. Dang, D. A. Karrer, and I. J. Dunn, Biotechnol. Bioeng. 19, 953 (1977).
20. K. van't Riet, Ind. Eng. Chem. (Proc. Des. Dev.) 18, 357 (1979).
21. D. I. C. Wang and co-workers, Fermentation andEnyyme Technology, Wiley-Interscience, New York, 1979.
22. G. Andrii, C. W. Robinson,and M. Moo-Young, Chem. Eng. Sci. 38, 1845 (1983).
23. J. T. Davies, Turbulence Phenomena, Academic Press, New York, 1972.
24. J. C. Lee andD. Meyrick, Trans. Inst. Chem. Eng. 48, T37 (1970).
25. A. Prins and K. van't Riet, Trends in Biotechnol. 5, 296 (1987).
Kirk-Othmer Encyclopedia of Chemical Technology (4th Edition)
337
BIOTECHNOLOGY
Voll
26.
27.
28.
29.
30.
31.
32.
33.
34.
35.
36.
37.
38.
39.
40.
41.
42.
43.
44.
45.
46.
47.
48.
49.
50.
51.
52.
53.
54.
55.
56.
57.
58.
59.
60.
61.
62.
63.
M. Zlokamik, Adv. Biochem. Eng. 8, 134 (1978).
J. A. C. van de Donk, R. G. J. M. Lans, and J. M. Smith, Proceedings of the Third European Conference on Mixing, British Hydromechanics Research
Association, Cranfield, 1979, p. 289.
В. C. Buckland and co-workers, in ref. 12, p. 1.
S. P. S. Andrews, Trans Inst. Chem. Eng. 60, 3 (1982).
V. Machon, J. Vlcek, A. W. Nienow, and J. Solomon, Chem. Eng. J. 14, 67 (1980).
A. D. Hickman, and A. W. Nienow, Proceedings of First International Conference on Bioreactor Fluid Dynamics, British Hydromechanics Research
Association, Cranfield, UK, 1986, p. 301.
M. L. Jackson, and С. C. Shen, AIChEJ. 24, 63 (1978).
С. M. Chapman, L. G. Gibilaro, and A. W. Nienow, Chem. Eng. Sci. 37, 891 (1983).
S. N. Davies and co-workers, Proceedings of the Fifth European Conf, on Mixing, British Hydromechanics Research Association, Cranfield, UK, 1985, p.
27.
A. W. Nienow and co-workers, in ref. 12, p. 159.
B. Bandyapadhyay, A. E. Humphrey, and H. Taguchi, Biotechnol. Bioeng. 9, 533 (1967).
A. D. Hickman, Proceedings of the Sixth European Conference on Mixing AIDIC/British Hydromechanics Research Association, Cranfield, UK, 1988, p.
369.
M. Zlokamik, Adv. Biochem. Eng. 11, 157 (1979).
H. N. Chang, B. Halard, andM. Moo-Young. Biotechnol. Bioeng. 34, 1147 (1989).
K. Schuged, Int. Chem. Eng. 22, 591 (1982).
H. Blenke, Adv. Biochem. Eng. 13, 121 (1979).
В. C. Buckland and co-workers, Biotechnol. Bioeng. 31, 737 (1988).
A. W. Nienow, Chem. Eng. Progr. 86, 61 (1990).
M. M. C. G. Warmoeskerken and J. M. Smith, in ref. 12, p. 179.
J. C. Middleton in N. Hamby, M. F. Edwards, and A. W. Nienow, eds, Mixing in the Process Industries, Butterworths, London, 1985, Chapt. 17.
A. W. Nienow, M. M. C. G. Warmoeskerken, J. M. Smith, and M. Konno, in ref. 34, p. 143.
A. W. Nienow, Trends Biotechnol. 8, 224 (1990).
G. J. Balmer, I. P. T. Moore, and A. W. Nienow in C. S. Ho and J. Y. Oldshue, Biotechnology Processes, AIChE, New York, 1987, p. 116.
A. Handa-Corrigan, A. N. Emery, and R. E. Spier, Enpyme Microb. Tech. 11, 230 (1989).
S. R. L. Smith, Philos. Trans. Toy. Soc. (Eondon), Ser. B. 290, 341 (1980).
J. J. Heinen and K. van't Riet, Proceedings of the Fourth European Conf, on Mixing, British Hydromechanics Research Association, Cranfield, UK, 1982,
p. 195.
M. K. Popovic and C. W. Robinson, AIChEJ. 35, 393 (1989).
M. Y. Chisti andM. Moo-Young,/. Chem. Tech. Biotechnol. 42, 211 (1988).
M. Y. Chisti, Airlift Bioreactors, Elsevier Applied Science, New York, 1989.
M. T. Belmar Campero and C. R. Thomas, in ref. 12, p. 215.
E. Galindo, A. W. Nienow, and R. S. Badham, in ref. 12, 1988, p. 65.
L. A. Wood and P. W. Thompson, in ref. 31, p. 157.
S. Oh, A. W. Nienow, M. Al-Rubeai, and A. N. Emery,/. Biotechnol. 12, 45 (1989).
M. P. Backer and co-workers, Biotechnol. Bioeng. 32, 993 (1988).
W. Bujalski, A. W. Nienow, andD. Gray, Ann. Appl. Biology, 115, 171, (1989).
C. F. Forster and D. W. M. Johnstone, in ref. 11, Chapt. 1.
A. J. Blatchford, E. M. Tramontini, and A. J. Griffiths, Water PoIIut. Control SI, 601 (1982).
J. Walker and G. W. Wilkinson,Мая. N.Y. Acad. Sci. 326, 181 (1979).
Alvin W. Nienow
University of Birmingham (UK)
Kirk-Othmer Encyclopedia of Chemical Technology (4th Edition)
338
WATER TREATMENT
Voll
WATER TREATMENT
Aeration, the transfer of oxygen [7782A4-7]y O2, from air to water [7732-18-5]\ is well-studied (1—10). The basic purpose of aeration, which is used
primarily for the treatment of wastewater, is to improve water quaEty for subsequent usage (see Water). Aeration can bring about the physical removal of
taste and odor producing substances such as hydrogen sulfide 7783-06-Г., H2S 7783-06-Г., and other volatiles as well as the chemical removal of metals
(iron, manganese), gases (hydrogen sulfide), and other compounds (organics and inorganics) through oxidation and settling (11). Additionally, aeration is
used extensively for the biological oxidation of both domestic and industrial organic wastes.
The function of aeration in a wastewater treatment system is to maintain an aerobic condition. Water, upon exposure to air, tends to estabEsh an
equiEbrium concentration of dissolved oxygen (DO). Oxygen absorption is controlled by gas solubiEty and diffusion at the gas—Equid interface.
Mechanical or artificial aeration may be utilized to speed up this process. Agitating the water, creating drops or a thin layer, or bubbling air through water
speeds up absorption because each increases the surface area at the interface.
Oxygen Solubility
The solubiEty of a gas in water is affected by temperature, total pressure, the presence of other dissolved materials, and the molecular nature of the gas.
Oxygen solubiEty is inversely proportional to the water temperature and, at a given temperature, directly proportional to the partial pressure of the oxygen
in contact with the water. Under equiEbrium conditions, Henry's law appEes
C = HP
where C is the concentration (solubiEty) of the oxygen in the water, P is the partial pressure of the oxygen, and H is the Henry's law constant. The partial
pressure of oxygen in air is assumed to be more or less constant at 21% by volume at sea level. The value decreases at higher altitudes, however.
Dissolved matter lowers oxygen solubiEty. At 20°C and 101.3 kPa (1 atm), the equiEbrium concentration of dissolved oxygen in seawater is 7.42
mg/L. It is 9.09 mg/L in chloride-free water and 9.17 mg/L in clean water. This lessening of oxygen solubiEty is of importance to wastewater treatment.
The solubiEty of atmospheric oxygen in a domestic sewage is much less than in distilled water (12).
Diffusion
The driving force in diffusion involves differences in the concentration of the diffusing substance. The molecular diffusion of a gas into a Equid is
dependent on the characteristics of the gas and the Equid, the temperature of the Equid, the concentration deficit, the gas to Equid contact area, and the
period of contact. Diffusion may be expressed by Fick's law (13,14):
dm t de
— = -DA —
dt dx
where dm]dtis the mass transfer rate by diffusion in time, de]dx is the concentration gradient, M is the area of contact per unit time, and D is the diffusion
coefficient. Thus, achieving saturation and the rate of oxygenation are not independent of one another because the further the system is from saturation,
the greater the driving force.
One important factor affecting oxygen transfer from air to water is the resistance generated by the film at the air—water interface (Fig. 1) (15). The
interface exhibits properties that are strikingly different from those of the main body of water or air. The degree of resistance depends on the presence of
surface active materials at the interface (16). Minute amounts of materials such as soap, detergent, or organic acids are capable of causing considerable
additional resistance to gas—Equid transfer (17).
Air (mixed)
Gas film
%%% Wateffflm
Water (mixed)
Fig. 1. Schematic representation of the two films at the air—water interface.
Two-Film Theory. The two-film theory is one of the best analyses of the gas absorption process in water (5,6). This theory involves
consideration of the resistance to mass transfer that is offered by the two films at the air—water interface. Components are defined in Figure 2. The films
are postulated to be present regardless of the type of aerator used. AH the gas diffusing into the water has to diffuse through both films, the characteristics
of which depend on the vapor pressure of the gas and solubiEty of the gas in water. Resistance to diffusion of a gas molecule results from coHisions with
molecules in the gas or Equid film through which diffusion is taking place. Molecules are much closer together in Equids than in a gas so that the resistance
to diffusion is higher in the water film, although resistance may vary depending on the intensity of turbulence and bubble shearing. Resistance is also
increased by increased film thickness. The film thickness of quiescent water has been calculated to be about 0.2 cm (6,18,19) whereas a falling drop of water
traveling at a very high velocity is reported to have a film thickness of about 0.003 cm.
Kirk-Othmer Encyclopedia of Chemical Technology (4th Edition)
339
WATER TREATMENT
Voll
Fig. 2. Schematic representation for the two-film theory of gas transfer; P = partial pressure of gas; Д = partial pressure of the gas at the interface;
Ct = concentration of gas at time t, Cy = initial concentration of gas at the interface; Co = initial concentration of gas at t = 0; and S = gas saturation.
Adapted from refs. 19 and 20.
In the case of a less soluble gas such as oxygen, diffusion occurs so slowly through the Equid film that only a small concentration difference is
required to overcome the resistance of the gas film. Thus the liquid film at the interface is considered to be very close to oxygen saturation and it is not
necessary to consider gas film resistance in the calculation (14).
The most basic oxygen transfer equation (6) states that the amount of diffusion is proportional to the surface of the interface (6,20):
=kL(C\-CL)
where w is the weight of solute, 9 the time in hours, dw/dP, the rate of absorption, M the area of Equid—gas interface, k the diffusion coefficient through
the gas film, the diffusion coefficient through the Equid film, P the concentration of oxygen in the gas, and C the concentration of oxygen in the Equid;
the subscripts g, i, and L apply to conditions in the main body of the gas, at the interface, and in the Equid, respectively. For oxygen, because of the
negligible resistance exhibited by the gas film, represents the overall gas transfer coefficient, kL = KL, so the equation may be rewritten
— = fcLA(q-cL) = kla(c;-cl)
and C represents the saturation concentration in the Equid at the partial pressure of oxygen, P for any given temperature.
The diffusion coefficient depends upon the characteristics of the absorption process. Reducing the thickness of the surface films increases the
coefficient and correspondingly speeds up the absorption rate. Therefore, agitation of the Equid increases diffusion through the Equid film and a higher gas
velocity past the Equid surface could cause more rapid diffusion through the gas film.
Methods for Determining Oxygen Demand
Several methods have been developed to estimate the oxygen demand in waste water treatment systems. Commonly used laboratory methods are
biochemical oxygen demand (BOD), chemical oxygen demand (COD), total oxygen demand (TOD), total organic carbon (TOC), and theoretical oxygen
demand (ThOD).
Biochemical Oxygen Demand. 5-Days BOD or BOD5, is the measurement of dissolved oxygen used in the biochemical degradation of
organic wastes. BOD5 measurement is widely used in wastewater and water treatment fields. The BOD5, however, has a number of limitations; the 5-day
test period is inconvenient in terms of the day-to-day operations of treatment plants; the test requires a high concentration of Eve, acclimated seed bacteria,
a skilled technician, and a laboratory in which to monitor the samples; only biodegradable wastes are accounted for; nonbio degradable toxics require
pretreatment; and the effect of nitrifying bacteria must be reduced.
Oxygen is used in these microbiolreactions to degrade substrates, in this case organic wastes, to produce energy required for ceE synthesis and for
resphation. A minimum residual of 0.5 to 2.0 mg/L DO is usuaHy maintained in the reactors to prevent oxygen depletion in the treatment systems.
Chemical Oxygen Demand. The COD test is used to measure the oxygen equivalent of the organic matter that can be oxidized by using
strong oxidizing agents in an acid medium at high temperatures. The COD of a wastewater is, in general, higher than the BOD because more materials can
be oxidized chemically than biologically. It is possible to correlate COD with BOD5 for many wastewaters, however, and a COD can be very useful. It can
be determined in 3 h. TOC, TOD, and ThOD are less frequendy employed but can be substituted for COD.
Aerating Systems
Aerators designed to faciEtate the transfer of oxygen from ak to water increase interfacial area by producing Equid turbulence and cEculation. There are
four basic types of aerators summarized in Table 1.
Table 1. Aerator Specifications
Aerator type Materials of construction Oxygen transfer efficiency, OTE, % Oxygen transfer rate, OTR, g/(Wh)
diffused aerator coarse bubble noncorrosive metal or plastic 4-20 0.73-1.09
fine bubble ceramic, cast Eon, or plastic 10-30 1.09-1.52
static tube noncorrosive metal or plastic 7-20 1.09-1.58
jet aerator noncorrosive metal 10-25 1.52-2.13
mechanical aerator low speed surface large diameter turbine having gear reducers (fixed 1.22-2.74
high speed surface bridge or platform mounted) noncorrosive metal small diameter propeEer having 1.22-1.52
direct drive
Kirk-Othmer Encyclopedia of Chemical Technology (4th Edition)
340
WATER TREATMENT
Voll
rotary brush and disk
horizontally mixing aspirating
aerator
noncorrosive metal gear reducers or direct drive
noncorrosive metal having hollow or solid shaft,
small marine propeller at high speed, direct drive
1.52-2.11
0.61-1.82
Diffused Aerators. Diffused aerators are of two types, a coarse bubble and a fine bubble. The air is compressed to the bottom of a container
or holding system such as a pond or tank, forced through pipes, and released through a diffuser. The function of the diffuser is to uniformly distribute and
break up the air into bubbles. Two such systems are shown in Figure 3a and 3b. Another version of a compressed air aerator utilizes spargers (Fig. 3c)
where air is piped under rotating turbines. The turbines circulate the water and break up the bubbles. Static tube aerators are also used (Fig. 3d). The air is
supplied by tubes at the bottom of the holding system and intimately mixed with water before being released at the top.
Fig. 3. Commercial aerating systems. Diffused aerators utilizing (a), (b) pipes, (c) a sparger, and (d) underwater air-supply tubes; (e) a mechanical aerator; (f)
a jet aerator; and (g) a horizontally mixing aspirator.
Coarse bubble aerators have the following advantages: they are nonclogging, maintain the liquid temperature, and have low maintenance costs. The
disadvantages are their high initial cost and low oxygen transfer rate; and they may foul. The advantages of fine bubble aerators include their good
operational flexibility and fairly good mixing ability. They also maintain liquid temperature. Disadvantages are the high initial and maintenance costs
because of the required air filter and other auxiliary equipment.
Static tube aerators are economically attractive and have a high transfer efficiency. They are well-suited for lagoon appEcations. On the other hand,
they are poor mixers and are not recommended for use when the sludge concentration is over 3000 mg/L.
Mechanical Aerators. Mechanical aerators are modular in design and built using electric motors. This type of aerator is also known as a
surface splasher because it pumps water vertically into the air. During this process the water is broken up into small droplets allowing exchange of oxygen
from the air to the water. One type of mechanical aerator is shown in Figure 3e.
Mechanical aerators may be of the low speed surface, high speed surface, or rotary brush and disk variety. Low speed surface aerators have both
high pumping and good oxygen transfer rates. The disadvantages include poor thermal retention as well as both high initial and high maintenance costs.
The gear reducers can also cause problems. High speed surface aerators have the advantage of having a fairly low initial cost and of being portable and
flexible in operation. However, these aerators have poor thermal retention, high maintenance cost, and poor oxygen transfer rate. They are also poor
mixers. Advantages of rotary brush and disk aerators include good oxygen transfer rate and good mixing ability. Disadvantages are that some require gear
reducers and all have a high power requirement, high cost, and require a special tank design.
Jet Aerators. Jet aerators are a cross between the diffused and mechanical aerators. Air and water are pumped separately under the water
surface into a mixing chamber and ejected as a jet at the bottom of the tank or pond (Fig. 3f). Jet aerators are suited for deep tanks and have only moderate
cost. Disadvantages include high operational costs, limitations caused by tank geometries, and nozzles that can clog. Additionally, they require blowers,
Kirk-Othmer Encyclopedia of Chemical Technology (4th Edition)
341
WATER TREATMENT
Voll
pumps, and pretreated waste.
Horizontally Mixing Aspirator Aerators. An aerator using a horizontally mixing aspirator has a marine propeller, submerged under water,
attached to a solid or a hollow shaft. The other end of the shaft is out of the water and attached to an electric motor. When the propeller is rotated at high
velocity, at either 1800 or 3600 rpm, a pressure drop develops around the propeller. Air is then aspirated under the water and mixed with the water, and
moved out. This type of aerator, shown in Figure 3g, is very efficient in mixing wastewater.
Horizontally mixing aspirating aerators produce no splashing and have no tank limitations. They are low in initial cost, are very good mixers, and
have good thermal retention. Additionally, they are portable, have operational flexibility, and generate less noise than many aerators. Disadvantages are
primarily their poor oxygen transfer rate coupled with some mechanical problems.
Several combinations of the aerators described are also available commercially. More information is available in References 21—23.
Oxygen Requirements
The oxygen requirements of wastewater depend on the treatment system utilized. For lagoons having a flow-through system without sludge recycle, there
is not only carbonaceous and ammonical BOD, but also a major portion of the sludge setdes and is subsequently digested. Recommended for lagoon
systems is a minimum of 2 kg of oxygen per kg of BOD5 loaded at actual lagoon working conditions. To treat the ammonical BOD effectively, a minimum
of 2.0 mg/L dissolved oxygen (DO) should be maintained in the lagoon at all times.
Activated sludge systems (ASS) vary considerably depending on cell residence time. The oxygen demand can range from 1.0 to 2.0 kg of oxygen per
kg of BOD5 removed. If nitrification occurs, however, additional oxygen should be provided at the rate of 4.6 kg O2 per kg of ammonia removed. When
diffused air systems are used, 0.01 to 0.06 m3 (0.5 to 2.0 ft3) per 3.785 L of wastewater or 34 to 51 m3 (1200 to 1800 ft3) of air per 0.45 kg of BOD loaded
should be provided (21).
Oxygen Transfer Rate
Oxygen transfer rate (OTR) is estimated by the following standard procedure (12), where the rate of mass transfer per unit volume of liquid is taken to be
direcdy proportional to the driving force of the system
OTR = KLaV(C^ - C)
where OTR is the oxygen transfer occuring in the liquid volume V\ K-ii is the overall volumetric transfer coefficient in clean water based on the liquid film
resistance; C'x is the dissolved oxygen concentration at saturation, approached at infinite aeration time; and C is the dissolved oxygen concentration (DO).
The value of the saturation concentration, C'x, is the spatial average of the value determined from a clean water performance test and is not
corrected for gas-side oxygen depletion; therefore K-ii is an apparent value because it is determined on the basis of an uncorrected Cx . A true volumetric
mass transfer coefficient can be evaluated by correcting for the gas-side oxygen depletion. However, for design purposes, Cx can be estimated from the
surface saturation concentration and effective saturation depth by
/ Pl ~ PyT + '"fviT^e
' p _ p
\ rs ryT
where C*T is the tabular value of DO surface saturation concentration at temperature T, standard total pressure Ps = 101.3 kPa (1 atm), and 100% relative
humidity; Cx is the spatial average dissolved oxygen saturation concentration approached at infinite aeration time at temperature T; is the effective
saturation depth; Pb is the atmospheric pressure; P__~ is the saturated vapor pressure of water at temperature T; and 7WT is the mass density of water at
temperature T.
The effective saturation depth, <7, represents the depth of water under which the total pressure (hydrostatic plus atmospheric) would produce a
saturation concentration equal to Cx for water in contact with air at 100% relative humidity. This can be calculated using the above equation, based on a
spatial average value of Cx T, measured by a clean water test. For design purposes, <7, can be estimated from clean water test results on similar systems,
and it can range from 5 to 50% of tank liquid depth. Effective depth values for coarse bubble diffused air, fine bubble diffused air, and low speed surface
aerators are 26 to 34%, 21 to 44%, and 5 to 7%, of the liquid depth, respectively.
The oxygen transfer rate for aerators is normally reported at standard conditions. Thus, in order to make meaningful comparisons, the ORT under
working or field conditions should be adjusted to standard conditions oxygen requirement for treatment (SORT) by means of
SORT = ORT 4- a
- Cl
9.09
g(T-20)
where P is the salinity—surface tension correction factor = (wastewater Cx )/(clean water С*); C is the oxygen saturation concentration for wastewater
at a given temperature and altitude (mg/L) (see Table 2); CL is the residual oxygen concentration (mg/L); T is the operating temperature of the wastewater
(C); a is the oxygen transfer correction factor = (wastewater KLa)/(clean water KLa). For domestic waste a is usually about 0.8 to 0.85.
Table 2. Altitude Correction Factors for Oxygen Transfer
Elevation, m Correction factor Elevation, m Correction factor
sea level 1.000 1524 0.830
305 0.950 1829 0.800
610 0.925 2134 0.765
914 0.900 2438 0.730
1219 0.860
The SORT value when divided by the standard conditions oxygen transfer rate (OTR) given for a mechanical aerator yields the oxygen
concentration required for treatment.
SORT
24(OTR)
When using a compressed air or diffused aeration system, the SORT has to be converted to a standard volume of air required per minute. This conversion
can be accomplished through the equation
SVM =
_________SORT__________
OTE x m x 1440(min/day)
where SVM is the standard volume of air required per minute, OTE is the oxygen transfer efficiency (see Table 1), and m is a correction factor. When
SORT is in units of kg/day and m = 1.157 kg/m3, SVM is in cubic meters; when SORT is inlb/day and m = 0.047 Ib/ft3, SVM is in cubic feet.
Kirk-Othmer Encyclopedia of Chemical Technology (4th Edition)
342
WATER TREATMENT
Voll
BIBLIOGRAPHY
1. W. E. Adeney and H. G. Becker, Phil. Mag. S 225, 317-337 (1919).
2. W. E. Adeney and H. G. Becker, Phil. Mag. S 232, 335-404 (1920).
3. W. E. Adeney, A. G. G. Leonard, and A. Richardson, Phil. Mag 45, 836—845 (1923).
4. W. E. Adeney, Philos. Mag 1140-1148 (1926).
5. W. G. Whitman, Chem. Metall. Eng 29(4), 146—148 (1923).
6. W. K. Lewis and W. G. Whitman, Ind. Eng. Chem. 16, 1215—1220 (1924).
7. H. W. Streeter, С. T. Wright, and R. W. Kehr, Sewage Works J. 8, 282—316 (1936).
8. W. W. Eckenfelder, Jr., Sewage Works J. 24, 1221—1228 (1952).
9. H. R. King, Sewage Ind. Wastes 27, 894—908 (1955).
10. H. R. King, Sewage Ind. Wastes 27, 1007-1026 (1955).
11. W. F. Langelier ,J. MIEUC4 24, 62-72 (1932).
12. L. C. Brown and C. R. Baillod, M. ASCE Modeling and Interpreting Oxygen Transfer Data, 108, EE4, 17240, 607—627 (1982).
13. C. J. Geankoplis, Transport Process and Unit Operations, 2nd ed., Allyn & Bacon, Newton, Mass., pp. 373.
14. P. D. Haney J. MIEUC4 46, 353-378 (1954).
15. W. H. Bartholomew, E. O. Karow, and M. R. Sfat, Ind. Eng. Chem. 42, 1801—1809 (1950).
16. W. W. Eckenfelder, Jr., and E. L. Barnhart, MIChE J. 7, 631—634 (1961).
17. R. W. Kehr, Sewage Ind. Wastes 10, 228 (1938).
18. J. R. Baylis, Elimination of Taste and Odor in Water, McGraw-Hill Book Co., New York, 1935, pp. 304—307.
19. M. H. Hutchinson andT. K. Sherwood, Ind. Eng. Chem. 29, 836 (1937).
20. A. Pasveer, Sewage Ind. Wastes 27, 1130—1146 (1955).
21. Metcalf and Eddy, WastewaterEngineering TreatmentTdisposalEeuse, 2nd ed., 1979.
22. Aeration, Oxygen Transfer Modeling, MOP, WPCF, No. FD-13,15 (1985).
23. F. N. Kemmer, Nalco Water Handbook, McGraw-Hill Book Co., New York, 1988.
Richard Rajenden
Aeromix Systems, Inc.
Kirk-Othmer Encyclopedia of Chemical Technology (4th Edition)
343
AEROSOLS
Voll
AEROSOLS
Classically, aerosols are particles or droplets that range from about 0.15 to 5 |lm in size and are suspended or dispersed in a gaseous medium such as air.
However, the term aerosol, as used in this discussion, identifies a large number of products which are pressure-dispensed as a Equid or semisolid stream, a
mist, a fairly dry to wet spray, a powder, or even a foam. This definition of aerosol focuses on the container and the method of dispensing, rather than on
the form of the product.
Aerosol technology may be defined as involving the development, preparation, manufacture, and testing of products that depend on the power of a
liquefied or compressed gas to expel the contents from a container. This definition can be extended to include the physical, chemical, and toxicological
properties of both the finished aerosol system and the propellants.
The aerosol container has enjoyed commercial success in a wide variety of product categories. Insecticide aerosols were introduced in the late 1940s.
Additional commodities, including shave foams, hair sprays, antiperspirants, deodorants, paints, spray starch, colognes, perfumes, whipped cream, and
automotive products, followed in the 1950s. Medicinal metered-dose aerosol products have also been developed for use in the treatment of asthma,
migraine headaches, and angina.
The production of aerosols has increased both in the United States and worldwide, in spite of a substantial decline during the middle to late 1970s
when the use of chlorofluorocarbons (see Fluorine compounds, organic) as propellants was seriously restricted. Hydrocarbons (qv) have since replaced the
chlorofluorocarbons as propellants and aerosols continue to be used by the general public. Not only did the total number of aerosol units produced
increase during the 1980s, but each year new applications for the aerosol system were introduced. As seen in Table 1, in 1989 U.S. aerosol production
reached a new high (2912 million units) accompanied by growth in all areas except animal products and the miscellaneous category. Although the personal
products category continued to grow in 1990, total aerosol production declined.
Table 1. Production of Aerosols in the United States**, 1982-1990, Millions of Units
Aerosol product category Year
1973b 198 2 198 3 198 4 198 5 198 6 198 7 198 8 198 9 199 0
personal products 1495 628 747 832 879 952 964 110 101 105
0 5 0
household products 690 556 586 603 630 635 640 650 680 680
automotive, industrial 176 286 303 337 342 375 379 440 475 415
paints, finishes 270 295 300 307 290 297 307 331 350 350
insect sprays 135 166 180 184 190 193 190 190 197 190
food products 94 132 132 138 140 136 140 157 175 175
animal products 18 20 19 16 15 22 22 8 8 8
miscellaneous 24 13 15 15 23 18 80 30 12 15
Total 2902 209 228 243 250 262 272 290 291 288
6 2 2 9 8 2 6 2 3
aRef. 2.
Highest annual total production prior to the 1980s is given for comparison.
Medical aerosols are included in the personal products category and in 1989 amounted to approximately 60 million units.
Personal products are the fastest growing segment of the aerosol industry and represent the largest of the categories. An increase in the use of hair
spray as well as deodorants and antiperspirants accounts for the major growth. Increase in industrial aerosol automotive products was also large in the
1980s.
Advantages of Aerosol Packaging
Aerosol products are hermetically sealed, ensuring that the contents cannot leak, spill, or be contaminated. The packages can be considered to be
tamper-proof. They deliver the product in an efficient manner generating litde waste, often to sites of difficult access. By control of particle size, spray
pattern, and volume delivered per second, the product can be applied direcdy without contact by the user. For example, use of aerosol pesticides can
minimize user exposure and aerosol first-aid products can soothe without applying painful pressure to a wound. Spray contact lens solutions can be applied
direcdy and aerosol lubricants (qv) can be used on machinery in operation. Some preparations, such as stable foams, can only be packaged as aerosols.
Spray shaving creams and furniture polish are examples of stable foams.
The use of metered-dose valves in aerosol medical applications permits an exact dosage of an active drug to be delivered to the respiratory system
where it can act locally or be systemically absorbed. For example, inhalers prescribed for asthmatics produce a fine mist that can penetrate into the
bronchial tubes (see Antiasthmatic agents).
Formulation of Aerosols
Aerosols are unique. The various components are all part of the product, and in the aerosol industry, the formulating chemist must be familiar with the
entire package assembly and each of its components. All aerosols consist of product concentrate, propellant, container, and valve (including an actuator
and dip tube). There are many variations of these components, and only when each component is propedy selected and assembled does a suitable aerosol
product result. A typical aerosol system is shown in Figure 1.
Kirk-Othmer Encyclopedia of Chemical Technology (4th Edition)
344
AEROSOLS
Voll
Container
Fig. 1. Solution-type aerosol system in which internal pressure is typically 240 kPa at 21°C. To convert kPa to psi, multiply by 0.145.
The aerosol formulater must be knowledgeable about the availability and usage of propellents, various valves and containers, including pressure
limitations and construction features, as well as any other components necessary for the product concentrate system. In contrast, the formulation of a
nonaerosol emulsion is not, to any great extent, affected by either the container or package closure. Nonaerosol products packaged using a pump may be
an exception, however, as this means of closure can also play a role in product formulation.
Product Concentrate. An aerosol's product concentrate contains the active ingredient and any solvent or filler necessary. Various propellent
and valve systems, which must consider the solvency and viscosity of the concentrate—propellent blend, may be used to deliver the product from the
aerosol container. Systems can be formulated as solutions, emulsions, dispersions, or pastes.
Solutions. To deliver a spray, the formulated aerosol product should be as homogeneous as possible. That is, the active ingredients, the solvent,
and the propellant should form a solution. Because the widely used halocarbon and hydrocarbon propellants do not always have the desired solubility
characteristics for all the components in the product concentrate, special formulating techniques using solvents such as alcohols (qv), acetone (qv), and
glycols (qv), are employed.
The rate of spray is determined by propellant concentration, the solvent used, and valve and vapor pressure. The pressure must be high enough to
deliver the product at the desired rate under the required operating conditions. For example, a windshield ice remover that is likely to be used around 0°C
must be formulated to provide an adequate pressure at that temperature. Spray dryness or wetness and droplet size depend upon propellant concentration.
Generally, aerosol packaging consists of many delicately balanced variables. Even hardware design plays an important part. For example, valves that
produce considerable breakup are used for the warm sensation desired in some personal products.
Emulsions. Aerosol emulsions (qv) may be oil in water (o/w), such as shaving creams, or water in oil (w/o), such as air fresheners and
polishes. These aerosols consist of active ingredients, an aqueous or nonaqueous vehicle, a surfactant, and a propellant, and can be emitted as a foam or as
a spray.
Foams. Systems that dispense foams (qv) are generally o/w emulsions, although nonaqueous solvents can also be used as the external phase. When the
propellant is a hydrocarbon such as an isobutane—propane blend, as litde as 3—4% in a 90—97% emulsion concentrate is sufficient to produce a suitable
foam. Although the majority of the propellant is emulsified, some vaporizes and is present in the head space. The resultant pressure is generally on the
order of 276 kPa (40 psig). When the valve is depressed, the pressure forces the emulsion up the dip tube and out of the container. Depending on the
formulation, either a stable foam, such as would be expected in a shaving cream, or a quick-breaking foam, which collapses in a relatively short period of
time, appears. The propellant is an important part of the formulation and is generally considered to be part of the immiscible phase. When the propellant is
included in the internal phase, a foam is emitted; when the propellent is in the external phase, the product is dispensed as a spray. Figure 2 illustrates these
situations.
Kirk-Othmer Encyclopedia of Chemical Technology (4th Edition)
345
AEROSOLS
Voll
Vaporized
Droplet
(b)
Propellant
Emulsified
concentrate
Vaporized
propellant
o°
о S ЖЖ
%^°oOoOo°§ о
Emulsified о % °
no о о
concentrate о °
о
Droplet
Finely dispersed spray
Fig. 2. Aerosol emulsion droplets containing propellant (a) in the internal phase with subsequent formation of aerosol foam and (b) in the external phase
with subsequent formation of a wet spray.
When the propellant is in the internal phase (Fig. 2a), the propellant vapor, upon discharge, must pass through the emulsion formulation in order to
escape into the atmosphere. In traveling through this emulsion, the trapped propellant forms a foam matrix. These systems, are typically oil-in-water
emulsions.
An emulsion system in which the propellant is in the external or continuous phase is shown in Figure 2b. As the liquefied propellant vaporizes, it
escapes direcdy into the atmosphere, leaving behind droplets of the formulation which are emitted as a wet spray. This system is typical of many
water-based aerosols or w/о emulsions.
Extended stabiEty testing is a necessity for emulsion systems in metal containers because of the corrosion potential of water. In most cases where a
stable emulsion exists, there is less corrosion potential in a w/о system because the water is the internal phase.
Quick-breaking foams consist of a miscible solvent system such ethanol (qv) [64-17-5] and water, and a surfactant that is soluble in one of the
solvents but not in both. These foams are advantageous for topical appEcation of pharmaceuticals because, once the foam hits the affected area, the foam
coEapses, deEvering the product to the wound without further injury from mechanical dispersion. This method is especially useful for treatment of bums.
Some personal products such as nail poEsh remover and after-shave lotion have also been formulated as quick-breaking foams.
Two advantages of foam systems over sprays (qv) are the increased control of the area to which the product is deEvered and the decreased incidence
of airborne particle release.
Sprays. Aerosol spray emulsions are of the water-in-oil type. The preferred propellant is a hydrocarbon or mixed hydrocarbon—hydrofluorocarbon. About
25 to 30% propellent, miscible with the oil, remains in the external phase of the emulsion. When this system is dispensed, the propellant vaporizes, leaving
behind droplets of the w/о emulsion (Fig. 2b). A vapor tap valve, which tends to produce finely dispersed particles, is employed. Because the propellant
and the product concentrate tend to separate on standing, products formulated using this system, such as pesticides and room deodorants, must be shaken
before use.
Dispersions. In a powder aerosol the powder is dispersed or suspended in propellant using dispersants (qv) (oily vehicles) and suspending
agents. Moisture content should be below 300 ppm and compacting, agglomeration, and sedimentation need to be minimized so that a fine powder can be
uniformly dispensed without clogging of the valve. Powders must have a particle size of less than 40 |lm (325 mesh screen) to pass through the valve
orifices. Sedimentation rate can be substantially reduced by adjusting the density of either the propellant or the powder. Techniques include using a mixture
of propellants of varying densities and adding an inert powder to the active ingredients. The use of surfactants (qv) as dispersing agents can also serve to
lubricate the valve to prevent its sticking.
Pharmaceutical powder aerosols have more stringent requhements placed upon the formulation regarding moisture, particle size, and the valve. For
metered-dose inhalers, the dispensed product must be deEvered as a spray having a relatively small (3—6 |lm) particle size so that the particles can be
deposited at the proper site in the resphatory system. On the other hand, topical powders must be formulated to minimize the number of particles in the
3—6-|lm range because of the adverse effects on the body if these materials are accidently inhaled.
Pastes. Aerosols utilizing a paste as the product concentrate base differ from other formulations in that the product and the propellant do not
come in contact with one another. The paste is placed in a bag that is attached to the valve system and fitted into the container. The propellant is then
placed between the bag and the outer wall so that the propellant presses against the outside of the bag, dispensing the contents through the valve.
Propellants. The propellant, said to be the heart of an aerosol system, maintains a suitable pressure within the container and expels the product
once the valve is opened. Propellants may be either a Equefied halocarbon, hydrocarbon, or halocarbon—hydrocarbon blend, or a compressed gas such as
carbon dioxide (qv), nitrogen (qv), or nitrous oxide.
Liquefied Gas Propellants. One of the advantages in using a Equefied gas propellant is that the pressure in the aerosol container remains
constant until the contents are completely expelled. The disadvantages are primarily ones of safety and environmental impact.
Chlorofluorocarbons (CFCs). Prior to 1978 most aerosol products contained chlorofluorocarbon propellants. Since that time, the use of chlorinated
fluorocarbons for aerosols has been seriously curtailed. These compounds have been impEcated in the depeletion of the ozone (qv) layer and are
considered to be greenhouse gases (see Airpollution; Atmospheric modeling).
The 1990 Clean Ah Act regulates the production and use of CFCs, hydrochlorocarbons, hydrochlorofluorocarbons (HCFCs), and
hydrofluorocarbon (HFC) substitutes. CFC and halon (Class I substances) usage is to be phased out in steps until total phaseout occurs on January 1,
2000. HCFC (Class II substance) production is currently frozen and a total HCFC production ban becomes effective on January 1, 2030. The EPA may,
however, grant small andlimited exceptions for Class I and II production schedules. Bans for HCFC usage in aerosols and foams begin January 1, 1994,
although some safety and medical aerosol products, and foams used for insulation are exempted. In addition, warning labels must be used for CFCs and
halons on all transport containers and all products containing these substances by May 15, 1993. Warning labels must also be used by that date for HCFCs
on all transport containers and for all products containing or made with these substances if there exist suitable alternatives.
In the United States, use of CFC propellants, designated as Propellants 11, 12, and 114, is strictly limited to specialized medicinal aerosol products
such as metered-dose inhalers. The physical properties and chemical names of these propellents are given in Table 2.
Kirk-Othmer Encyclopedia of Chemical Technology (4th Edition)
346
AEROSOLS
Voll
Table 2. Physical Properties of Chlorofluorocarbon and Hydrocarbon Propellants
Property Propellant
11 12 114 A-108 A-31 A-17
chemical name trichloro-monofluor o-methane dichloro-difluor o-methane l,2-dichloro-l,l,2,2-te tr a-flu о г о ethane propane isobutane ^-butane
CAS Registry Number [75-69-4] [75-71-8] [76-14-2] [74-98-6] [75-28-5] [1696-97-8]
formula CC13F CC12F2 CC1F2CC1F2 c3h8 HC(CH3)3 С4Ню
molecular weight 137.4 120.9 170.9 44.1 58.1 58.1
boiling point, °C vapor pressure, kPa 23.8 -29.8 3.6 -42.2 -10.2 -0.6
21°C 194 585 190 846 315 214
54°C 269 1349 507 1893 763 556
liquid density, g/mL, 21°C 1.485 1.325 1.468 O.5OO5b 0.5788b 0.557?
flammability limit, vol % in air nonflam-mable nonflam-mable nonflam-mable 2.3-7.3 1.8-8.4 1.6-6.5
To convert kPa to psi, multiply by 0.145.
b At 68°C.
Fluorocarbons are assigned numbers based on their chemical composition and, in general, these numbers are preceded by a manufacturer's
trademark. In the numbering system, the digit on the right denotes the number of fluorine atoms in the compound; the second digit from the right
indicates the number of hydrogen atoms plus 1; and the third digit from the right indicates the number of carbon atoms less 1. In the case of isomers, each
has the same number. The most symmetrical is indicated by the number without any letter following it. As the isomers become more unsymmetrical, the
letters a, b, and c are appended. If a molecule is cyclic, the number is preceded by C.
Hydrocarbons. Hydrocarbonsn such as propane, butane, and isobutane, which find use as propellants, are assigned numbers based upon their
vapor pressure in psia at 21°C. For example, as shown in Table 2, aerosol-grade propane is known as A-108, ^-butane as A-17. Blends of hydrocarbons, eg,
A-46, and blends of hydrocarbons and hydrochlorocarbons orHCFCs are also used. The chief problem associated with hydrocarbon propellants is their
flammability.
Hydrocarbons have, for the most part, replaced CFCs as propellants. Most personal products such as hair sprays, deodorants, and antiperspirants,
as well as household aerosols, are formulated using hydrocarbons or some form of hydro-carbon—halocarbon blend. Blends provide customized vapor
pressures and, if halocarbons are utilized, a decrease in flammability. Some blends form azeotropes which have a constant vapor pressure and do not
fractionate as the contents of the container are used.
Hydrof/uorocarbons andHydrochhrof/uorocarbons. The properties of HFC and HCFC propellants are given in Table 3. Propellant 22 is nonflammable and can
be mixed to form nonflammable blends. Some of these propellants are scheduled for phase-out by 2015—2030.
Table 3. Properties of Hydrofluorocarbon and Hydrochlorofluorocarbon Propellants
Propellant
Property 22 142b 152a
chemical name chlorodifluoro-methane l-chloro-l,l-difluoro-ethane 1,1 - diflu о г o - e th ane
CAS Registry Number [75-68-6] [75-68-3] [75-37-6]
formula chcif2 c2h3cif2 c2h4f2
molecular weight 86.5 100.5 66.1
boiling point, °C -40.8 -9.44 -23.0
vapor pressure, kPa
21°C 834 200 434
54°C 2048 669 1220
density, g/mL at 21°C 1.21 1.12 0.91
solubility in water, wt % at 21°C 3.0 0.5 1.7
Kauri-butanol value 25 20 11
flammability limit, vol % in air nonflammable 6.3-14.8 3.9-16.9
flash point, °C none none < - 50°
To convert kPa to psi, multiply by 0.145.
Compressed Gas Propellants. The compressed gas propellants, so named because they are gaseous in conventional aerosol containers, are
nontoxic, nonflammable, low in cost, and very inert. When used in aerosols, however, the pressure in the container drops as the contents are depleted.
Although the problem is lessened when the contents are materials in which the propellant is somewhat soluble, this pressure drop may cause changes in the
rate and characteristics of the aerosol spray. A compressed gas aerosol system is illustrated in Figure 3.
Kirk-Othmer Encyclopedia of Chemical Technology (4th Edition)
347
AEROSOLS
Voll
Fig. 3. Compressed gas aerosol using an insoluble gas as propellant.
Considerable developmental effort is being devoted to aerosol formulations using the compressed gases given in Table 4. These propellants are used
in some food and industrial aerosols. Carbon dioxide and nitrous oxide, which tend to be more soluble, are often preferred. When some of the compressed
gas dissolves in the product concentrate, there is partial replenishment of the headspace as the gas is expelled. Hence, the greater the gas solubility, the
more gas is available to maintain the initial conditions.
Table 4. Properties of the Compressed Gas Propellants
Property Carbon dioxide Nitrous oxide Nitrogen
CAS Registry Number [124-38-9] [10024-97-2] [7727-37-9]
formula co2 n2o n2
molecular weight 44.0 44.0 28.0
boiling point, °C -78 -88 -196
critical temperature, °C 31 37 -111
vapor pressure, kPa at 21°C 5772 4966
solubiEty in water, vol gas/vol Eq at 21°C and 0.82 0.6 0.016
101.3 kPa’
flammabiEty limits, vol % in ah nonflammable nonflammable nonflammable
flash point, °C none none none
To convert kPa to psi, multiply by 0.145.
Compressed gas systems were originally developed simply to provide a means of expelling a product from its container when the valve was
depressed. Semisolid products such as a cream, ointment, or caulking compound are dispensed as such. A liquid concentrate and a compressed gas
propellant (Fig. 3) produce a spray when a mechanical breakup actuator is used. Nitrogen, insoluble in most materials, is generally used as the propellant.
Aerosols using an insoluble gas are not intended to be shaken before use. Shaking causes some of the propellant to be dispersed in the liquid
concentrate. Although the product may then be dispersed to a greater extent, greater loss of propellant also results. If enough propellant is lost, the product
will become inoperative.
When gases that are somewhat soluble in a liquid concentrate are used, both concentrate and dissolved gas are expelled. The dissolved gas then
tends to escape into the atmosphere, dispersing the liquid into fine particles. The pressure within the container decreases as the product is dispersed
because the volume occupied by the gas increases. Some of the gas then comes out of solution, partially restoring the original pressure. This type of soluble
compressed gas system has been used for whipped creams and toppings and is ideal for use with antistick cooking oil sprays. It is also used for household
and cosmetic products either where hydrocarbon propellants cannot be used or where hydrocarbons are undesirable.
Other Propellants. Dimethyl ether (DME) [115-10-6] is finding use as an aerosol propellant. DME is soluble in water, as shown in Table 5.
Although this solubiEty reduces DME's vapor pressure in aqueous systems, the total aerosol solvent content may be lowered by using DME as a
propellant. The chief disadvantage is that DME is flammable and must be handled with caution.
Table 5. Properties of Dimethyl Ether Propellant
Property______________
CAS Registry Number
formula
molecular weight
boiling point, °C
___________Dimethyl ether
[115-10-6]
CH3OCH3
46.07
-24.8
Kirk-Othmer Encyclopedia of Chemical Technology (4th Edition)
348
AEROSOLS
Voll
vapor pressure, kPaa
21°C
54°C
density, g/mL at 21°C
solubility in water, wt % at 21°C and autogenous pressure
Kauri-butanol value
flammability limits in air, vol %
flash point, °C
To convert kPa to psi, multiply by 0.145.
434
1200
0.66
34
60
3.4-1.8
-41
Containers. Aerosol containers, made to withstand a certain amount of pressure, vary in both size and materials of construction. They are
manufactured from tin-plated steel, aluminum, and glass. The most popular aerosol container is the three-piece tin-plated steel container. Glass containers,
which are usually plastic coated, generally have thicker walls than conventional glass jars. They are limited to a maximum size of 120 mL and are used for
pharmaceutical and cosmetic aerosols.
Steel. The steel container's most usual form is cylindrical with a concave (or flat) bottom and a convex top dome with a circular opening finished
to receive a valve with a standard 2.54-cm opening. The three pieces (body, bottom, and top) are produced separately and joined by high speed
manufacturing. The size of the container is described by its diameter and height to top seam, in that order. Hence a 202 x 509 container is 54.0 mm (22/16
in.) in diameter by 141.3 mm (59/16 in.) high. Tables of available sizes and overflow volumes and suggested fill levels can be readily obtained from
manufacturers.
Tin-plated steel was long the mainstay of the U.S. aerosol industry and still represents a very large volume. The tin coating provides both protective
internal and external surfaces and the means for soldering the flat body plate into a leakproof cylinder. Both tin and lead solders are used, and both
frequendy contain small (5%) amounts of other metals, such as antimony and silver, for additional strength. In some products, the tin coating is removed
sacrificially by the product; attack on steel is avoided only as long as some of the tin remains.
Mass production welding processes have been developed for the steel container side walls and have largely replaced the soldered side seam. The
welding process has a slight financial advantage because it eliminates the need for tin. In addition, the welded joint is esthetically more desirable, it is less
than one-half the width of the soldered joint, and it does not weaken during prolonged storage at elevated temperatures.
In order to increase resistance of the container to the effect of the product or to protect the product from the tin plating, an inert, internal organic
coating can be applied.
Aluminum. The majority of aluminum containers are of monobloc (one-piece) construction, impact extruded from a slug of lubricated
aluminum alloy. These containers are widely used for many products and are available in a vast array of heights and diameters. Because these containers
lend themselves to additional shaping, many unusual shapes can be found in the marketplace. They may also be coated after the extrusion process.
Aluminum containers are recommended for many applications because of the very hard, corrosion-resistant oxide coating. They are deficient in only
one respect: once the protective skin has been penetrated, aluminum corrosion accelerates.
Two-piece aluminum containers are also available. These consist of impact-extruded upper shells having a seamed-on aluminum bottom. The valve
opening is machined from the solid aluminum rather than rolled. All coatings must be applied to the can body after the forming operation.
Glass. Glass containers present completely different design considerations from metal ones. They are totally nonreactive with the product, free
of potentially leaking seams (the valve joint may be an exception), transparent or opaque as desired, and can be beautiful in design. The larger sizes attract
attention on store shelves. On the other hand, they can break in manufacture, in shipping, and in usage. Although the extent and hazards of breakage can
be reduced by means of a thick vinyl coating, glass containers are heavy, making them most cosdy to ship. Glass containers are processed more slowly and
have higher scrap rates, and they are generally limited to low pressure product systems.
Valves. The dispensing valve and actuator serve to close the opening through which the product and frequendy the propellant entered the
container, to retain the pressure within the container and to dispense the product in the precise form and dosage intended by the manufacturer and
expected by the consumer. An aerosol valve shown in Figure 4, consists of seven components. Many variations exist both for special purposes and to
avoid existing patents.
Fig. 4. Aerosol valve components.
The mounting cup (ferrule for botde valves) mechanically joins the valve to the container. The mounting cup may be made from a variety of materials,
but is typically tin-plated steel coated on the underside. It contains the gasket which provides the seal. Soft gasketing material is applied wet and bonded in
place or, more frequendy in larger cans, cut rubber, polyethylene, or polypropylene gaskets are used.
The housing physically holds the valve pieces together by means of a mechanical lock (crimp) and fits into the pedestal of the mounting cup. It is
made from any of a number of common thermoplastics and contains the metering orifices for both the liquid and vapor phases of the effluent. Many
Kirk-Othmer Encyclopedia of Chemical Technology (4th Edition)
349
AEROSOLS
Voll
valves do not meter vapor; the flow of the Equid is controlled by other means. A vapor tap may also be present to reduce the flammability of the product
when it is emitted or to produce a finer, drier spray.
The plastic stem is the movable segment of the valve. It provides the opening mechanism and usually contains another metering orifice as shown.
The spring ensures a solid closing action and is usually wound from stainless steel wire. The dip tube conducts the product from the container to the
valve. It is usually extruded from polyethylene or polypropylene and has an inside diameter of over 2.54 mm, although it can be provided in capillary sizes
having diameters down to 0.25 mm. These small tubes are used to reduce flow rate and may function in place of the liquid metering orifice in the valve
housing.
The actuator contains the final orifice and a finger pad or mechanical linkage for on—off control. The spray pattern is largely affected by the
construction of the actuator, particularly by the chamber preceding the orifice. Actuators are often termed mechanical breakup and nonmechanical breakup
depending upon the complexity of this chamber. Mechanical breakup actuators are of more expensive two-piece construction. Actuators are usually
molded from polyethylene or polypropylene; the breakup insert may be almost any material, including metal.
Valves may differ depending upon the form of the product. Manufacturers stock a wide array of standard components. In addition, most are willing
to produce unique combinations at no additional charge if no major tooling changes are required. The largest numbers of aerosol valves are used to
produce sprays. These are actuated by either tilting forward or depressing vertically. Foam valves differ from spray valves primarily in the actuator, which is
relatively wide open. Small actuator orifices throw the foam and are used for products such as mg shampoos and decorative snow. Internally, foam valves
have no vapor tap and contain relatively large orifices.
Metering valves are used extensively in the pharmaceutical field for inhalers and other products requiring controlled dosage delivery. They typically
deliver 50 to 150 mg of product per stroke with good repeatability. The metering is achieved by plugging the body orifice with the downward stroke of the
stem, allowing only the product in the housing to escape.
Filtered valves contain a fine internal filter, typically below the body orifice. This filter prevents clogging by the debris sometimes found in product
and package. The use of filtration is recommended with any valve systems containing body, stem, or actuator orifices of 0.25-mm (or smaller) diameter
unless exceptional care is taken in the cleaning of product and package components. Valves containing these small orifices are used for products propelled
by compressed gas.
Codispensing valve (and container) systems are used for products that consist of two reactive ingredients that must be kept separate until dispensed.
They can deliver the product components in stoichiometrically correct amounts, thoroughly mixing them in the process. Successful use of these systems
requires proper metering throughout the life of the container, safety considerations (should the internal seals between reactants fail), acceptably low
permeation across internal membranes, end-use excess of the preferred component, and the usual product—package compatibility. The codispensing valves
are the most technically demanding systems in the marketplace.
Filling of Aerosols
All aerosols are produced by either a cold filing or pressure filling process. The cold fill process is used for some aerosols which contain a metered-dose
valve, although pressure filling is also adaptable to metered valves. Generally a concentrate is prepared which is filled into the aerosol container and then the
valve is added. For the most part, pressure filling is carried out either by an under-the-cap filler or through the valve. If an under-the-cap filler is used, a
vacuum is drawn, the propellant is added (under the valve cup), and then the valve is sealed in place. Where filling is done through the valve stem, the
product is first filled into the container and a valve is crimped into place and at the same time a vacuum is drawn in the can. The propellant filler then
forms a seal around the head of the can and under high pressure the propellant is forced through the actuator and valve stem into the container. The
contents are then checked for leaks and an overcap is added to complete the process.
Barrier Packs. Barrier packs utilize a plastic bag or piston to separate the product from the propellant. Many designs have been submitted for
these systems, but only two basic ones are commercially available. In barrier packs using a plastic bag (sepro containers) there is never any contact between
product and propellant, unless one or the other permeates through the bag or the bag breaks. In those using a piston, there may be some seepage of
propellant between the wall of the piston and the wall of the container; however, some of the newer designs greatly limit the extent of this seepage.
Piston Packs. A piston barrier pack, shown in Figure 5, consists of a free piston fitted into a container. It is used to package viscous, semisolid
products such as cheese spreads, cake-decorating icings, pharmaceutical ointments, caulking compounds, grease and lubricants, shave gels, and other
household and industrial items. The use of liquefied gas propellants is advantageous in piston packs because a constant pressure is maintained. These gases
cannot be used with all products however, because there may be some seepage of vapor through the piston or between the walls of the piston and the
container.
Actuator
Spout
Safety cap
Product
Gas
Gas plug
Polyethylene
piston
Aluminum
can body
Double-seamed
aluminum can end
Kirk-Othmer Encyclopedia of Chemical Technology (4th Edition)
350
AEROSOLS
Voll
Fig. 5. Piston-type barrier pack system.
The product is filled through the 2.54-cm opening of the metal container and occupies the space above the piston. The valve is then sealed into
place. After the propellant is added through a small hole in the bottom of the can, the opening is sealed using a rubber plug and pressurized either with
nitrogen to about 620 kPa (90 psig) or with about 5 to 10 g of hydrocarbon propellant. Valves with relatively large openings, such as foam valves, are
frequendy used. Products packaged using this system are semisolid and viscous; they are dispensed as a lazy stream rather than as a foam or spray.
Sepro Container. The Sepro container consists of a collapsible plastic bag fitted into a standard three-piece, tin-plated container such as a
202 x 214,202 x 406, or 202 x 509 can. The product is placed within the bag, and the propellant is added through the bottom of the container, which is
fitted with a one-way valve. There is no limitation on the viscosity of the product but compatibility with the plastic bag must be considered. A free-flowing
liquid can be dispensed either as a stream or a fine spray, depending on the type of valve employed. A viscous material is often dispensed as a stream. This
system has been used for caulking compounds, postfoaming gels, and depilatories.
Economic Aspects
In 1989 the aerosol industry in the United States consisted of about 250 companies that ranged from propellant, valve, and overcap, manufacturers to
contract product fillers and product marketers. The industry employed over 50,000 people in 1989 and retail sales amounted to over $10 billion.
There was a small drop in aerosol compounds in 1990 (2.88 billion units) as compared to 1989 (2.91 billion units). Aerosol valve and container
production remained high. 3.13 billion valves were produced in 1990. 320 million of the containers shipped in 1990 were aluminum.
BIBLIOGRAPHY
"Aerosols" in ECT 2nd ed., Vol. 1, pp. 470—480, by M. S. Sage, Sage Laboratories, Inc.; in ECT 3rd ed., Vol. 1, pp. 582—597, by Antoine Kawam and John
B. Flynn, The Gillette Company.
1. Aerosol Guide., 6th ed., Aerosol Division, Chemical Specialties Manufacturers Association, Washington, D.C., 1971.
2. Annual Aerosol Survey, Chemical Specialties Manufacturers Association, Washington, D.C., 1990; Chem. Week 18 (May 8, 1991).
General References
D. P. Dunn, Aerosol Age 33, 38 (Jan. 1988).
Handbook ofPharmaceuticalExcipients, American Pharmaceutical Association/The Pharmaceutical Society of Great Britain, Washington, D.C. and London,
1986, pp. 19, 99, 101, 145, 240, 333.
Link Labs, Aerosol Age У1, 30—32 (Sept. 1987).
M. A. Johnsen, The Aerosol Handbook, 2nd ed., Wayne Dorland Company, Mendham, N.J., 1982.
P. A. Sanders, Principles ojAerosol Technology, Van Nostrand Reinhold Co., Inc., New York, 1970.
P. A. Sanders, Handbook ojAerosol Technology, 2nd ed., Van Nostrand Reinhold Co., Inc., New York, 1979.
J. J. Sciarra and L. Stoller, The Science andTechnology ojAerosol Packaging, John WHey & Sons, Inc., New York, 1974.
J. J. Sciarra and A. J. Cutie, in H. A. Lieberman, M. M. Rieger, and G. S. Banker, eds., Pharmaceutical Dosage Forms: Disperse Systems, Vol. 2, Marcel Dekker,
Inc., New York, 1989, pp. 417—460.
J. J. Sciarra and A. J. Cutie, in A. R. Gennaro, ed., Remington's Pharmaceutical Sciences, 18th ed., Mack Publishing Company, Easton, Pa., 1990.
John J. Sciarra
Sciarra Aeromed Development Corporation
Kirk-Othmer Encyclopedia of Chemical Technology (4th Edition)
351
AIR CONDITIONING
Voll
AGAR.
See Gums.
AGAVE.
See Fibers, vegetable.
AGRICULTURAL CHEMICALS.
See Fertilizers; Fungicides, agricultural; Herbicides; Insect control technology; Soil chemistry of pesticides.
AIR CONDITIONING
In the past 100 years, air conditioning has progressed from its beginnings in the refrigeration industry (see Refrigeration) to being an indispensable factor
in society. AppEcations range from providing human comfort to controlling the conditions essential for the production of many chemical products.
The design of air conditioning systems is a highly specialized branch of engineering. A number of excellent information sources regarding air
conditioning are available (1).
Basic Principles
Thermodynamic principles govern all air conditioning processes (see Heat exchange technology, heat transfer). Of particular importance are specific
thermodynamic applications both to equipment performance which influences the energy consumption of a system and to the properties of moist air
which determine air conditioning capacity. The concentration of moist air defines a system's load.
Thermodynamics. Many definitions and formulations exist for the laws of thermodynamics, a detailed treatment of which may be found in
standard engineering texts (2). Definitions that apply best to air conditioning are as follows:
First law. This is the law of conservation of energy which states that the flow of energy into a system must equal the flow of energy out of the same system
minus the energy that remains inside the system boundary. For an open system in which the energy flows are not time dependent and in which there is
no accumulation of energy in the system, the first law may be written as
( V2\ • ( V2\
+ A'''- P« + a) = A11 + ( h] + Z] + Z)
in in ' ' out out ' '
where Q = rate of heat transfer to the system, m = mass flow rate, h = enthalpy of substance, Z = elevation of boundary above a horizontal
reference, V = velocity of substance, g = gravitational acceleration, and W = work done by the system.
Open steady-flow systems, which include almost all air conditioning processes, follow this law. Examples include the energy flows in a cooling and
dehumidifying coil or an evaporative cooling system.
Second Law. This law defines the maximum theoretical performance for air conditioning equipment and provides a means of identifying energy losses in a
system. It states that no heat engine operating in a closed cycle may produce work when communicating with a single temperature source. Air
conditioning is the result of a heat engine operating in reverse. This means that work is added to the system and there must always be at least two
temperatures, a low temperature source from which heat is received and a high temperature sink to which heat is rejected.
The Camot cycle is formulated direcdy from the second law of thermodynamics. It is a perfecdy reversible, adiabatic cycle consisting of two constant
entropy processes and two constant temperature processes. It defines the ultimate efficiency for any process operating between two temperatures. The
coefficient of performance (COP) of the reverse Camot cycle (refrigerator) is expressed as
CQp useful effect T\
work input T2 — Tx
where T\ = absolute temperature of the cold source and T2 = absolute temperature of the hot sink.
In some applications, large quantities of waste or low cost heat are generated. The absorption cycle can be direcdy powered from such heat. It
employs two intermediate heat sinks. Its theoretical coefficient of performance is described by
cop
“ ад2-т)
where TS1 = absolute temperature of one intermediate heat sink (condenser), and TS2 = absolutete temperature of the other intermediate heat sink
(absorber).
Real processes always involve losses and irreversibilities and thus deviate from theory. Typical inefficiencies arise from temperature differences
between the air stream and the heat exchange fluid, friction between moving parts, fluid pressure drops through heat exchangers and ducts, and pressure
drops through pipes and valves. The fewer the inefficiencies, the more closely the process approaches the theoretical limit. Good texts on air conditioning
(see general references or reference 1, provide a more detailed description of actual processes.
A simple cooling cycle serves to illustrate the concepts. Figure 1 shows a temperature—entropy plot for an actual refrigeration cycle. Gas at state 1
enters the compressor and its pressure and temperature are increased to state 2. There is a decrease in efficiency represented by the increase in entropy
from state 1 to state 2 caused by friction, heat transfer, and other losses in the compressor. From state 2 to states 3 and 4 the gas is cooled and condensed
by contact with a heat sink. Losses occur here because the refrigerant temperature must always be above the heat sink temperature for heat transfer to take
Kirk-Othmer Encyclopedia of Chemical Technology (4th Edition)
352
AIR CONDITIONING
Voll
place. The liquid refrigerant is commonly expanded adiabatically from state 4 to state 5 by a throttling device; thus there is a further loss in efficiency. Heat
is added to the refrigerant from state 5 to state 1 and the cycle is repeated. The loss in this process again results from the temperature difference between
the heat source and the refrigerant. Process А—В—C—D represents the Camot cycle. Because the area inside the cycle boundary represents the work added,
it is evident that the actual refrigeration cycle requires more work and thus has a considerably lower COP than the ideal cycle.
Fig. 1. Real refrigeration (—) and Camot (--------) cycles.
As illustrated both by the second law of thermodynamics and the example in Figure 1, the temperature difference between the heat source and sink
needs to be minimized in order to increase the efficiency of the process. This means rejecting heat to the sink having the lowest possible temperature while
obtaining heat from the source having the highest. Increased efficiency results from using the largest heat exchangers consistent with economy to minimize
temperature differences between the working fluid and the source and sink. Lack of maintenance, especially in regard to heat exchangers, significandy
increases the temperature differentials and the energy consumption. Other considerations resulting from the second law include minimizing fluid pressure
losses by using the largest practical air ducts and fluid piping and utilizing the most efficient mechanical devices obtainable.
Psychrometries. Psychrometries is the branch of thermodynamics that deals specifically with moist air, a binary mixture of dry air and water
vapor. The properties of moist air are frequendy presented on psychrometric charts such as that shown in Figure 2 for the normal air conditioning range at
atmospheric pressure. Similar charts exist for temperatures below 0°C and above 50°C as well as for other barometric pressures. All mass properties are
related to the mass of the dry air.
Enthalpy, kJ/кд of dry air
Fig. 2. Psychrometric chart at atmospheric pressure, 101.3 kPa (1 atm)(3). To convert kJ to kcal, divide by 4.184.
Courtesy of Business News Publishing Co.
The following quantities are found on a psychrometric chart:
Dry-bulb Temperature (DB) (Abscissa). DBT is the temperature of a gas or mixture of gases indicated by an accurate thermometer after
Kirk-Othmer Encyclopedia of Chemical Technology (4th Edition)
353
AIR CONDITIONING
Voll
correction for radiation effect.
Dew-point Temperature (DPT). DPT is the temperature at which the condensation of water vapor in a space begins for a given state of
humidity and pressure as the temperature is reduced. It is the temperature corresponding to saturation (100% rh) for a given absolute humidity at constant
pressure.
Enthalpy. Enthalpy is the thermodynamic property of a substance defined as the sum of its internal energy plus the quantity Pv/J, where
P = pressure of the substance, v = its specific volume, and J = the mechanical equivalent of heat. Enthalpy is also known as total heat and heat content.
Humidity Ratio (Ordinate). The humidity ratio is the weight of water vapor in the air per unit weight of dry air.
Relative Humidity (rh). Relative humidity is the ratio of the mole fraction of water vapor present in the air to the mole fraction of water
vapor present in saturated air at the same temperature and barometric pressure; it approximately equals the ratio of the partial pressure (or density) of the
water vapor in the air to the saturation pressure (or density) of water vapor at the same temperature.
Saturation Temperature. The temperature at which the water vapor in moist air is in equilibrium with Equid water.
Sensible Heat Factor. The ratio of the change in sensible (constant moisture content) cooling enthalpy to the change in total cooling
enthalpy.
Specific Volume. The volume of air per unit mass.
Wet-bulb Temperature. The equilibrium temperature which air attains if adiabatically saturated by water from a condensed phase.
The psychrometric chart may be used to determine the change in properties of air required for a condition or a process. For example, point A on
Figure 2 has a dry-bulb temperature of 18.8°C and a relative humidity of 70%. Further, the air has a wet-bulb temperature of 15.2°C, an enthalpy of 61
kJ /kg (14.6 kcal/kg), an absolute humidity of 0.0095 kg/kg, and a specific volume of 0.84 m3/kg. Sensible heating (no moisture addition) may be
represented by the line from point A to point B. This causes the relative humidity to decrease to 48% and the enthalpy to increase to 68 kJ /kg (16.3
kcal/kg). The amount of energy required to raise the dry-bulb temperature from 18.8°C to 25°C is 7 kJ /kg (1.7 kcal/kg) of dry air. If the air mass or flow
rate were known, the total energy required could be determined. Cooling and dehumidifying is represented by the line from point C to point A. This
increases the relative humidity and requires the removal of 26 kJ /kg (6.2 kcal/kg) of dry air. The amount of moisture removed is 0.0047 kg/kg of dry air.
Constructing a line parallel to A—C but through point 0 on the nomograph in the upper left of Figure 2 reveals that the sensible heat factor is 0.5. Other air
conditioning processes, except those involving substantial pressure changes, can be plotted on a psychrometric chart although the process may not always
be a straight line.
Design Conditions
Fundamental to the design of any air conditioning system is the determination of the operating conditions of temperature and humidity. Worker comfort
must also be considered.
Process Requirements. Typical inside dry-bulb temperatures and relative humidities used for preparing, processing, and manufacturing
various products, and for storing both raw and finished goods, are listed in Table 1. In some instances, the conditions have been compromised for the sake
of worker comfort and do not represent the optimum for the product. In others, the conditions listed have no effect on the product or process other than
to increase worker efficiency.
Table 1. Typical Industrial Inside-Design Conditions*
Industry Process Dry-bulb temperature, °C Rh, %
abrasives manufacture 24-27 45-50
bakery dough mixer 24-27 40-50
fermenting 24-28 70-75
proofbox 33-36 80-85
bread cooler 21-27 80-85
cold room 4-7
make-up room 26-28 65-70
cake mixing 35-41
crackers and biscuits 15-18 50
wrapping 15-18 60-65
storage: dried ingredients 21 55-65
fresh ingredients 0-7 80-85
flour 21-24 50-65
shortening 7-21 55-60
sugar 27 35
water 0-2
wax paper 21-27 40-50
brewery storage: hops -1-0 55-60
grain 27 60
liquid yeast 0-1 75
lager 0-2 75
ale 4-7 75
fermenting cellar: lager 4-7 75
ale 13 75
racking cellar 0-2 75
candy (chocolate) candy centers 27-29 40-50
hand-dipping room 15-18 50-55
enrobing room enrobing: 24-27 55-60
loading end 27 50
enrober 32 13
stringing 21 40-50
tunnel 4-7 dp-40
packing 18 55
pan specialty room 21-24 45
general storage 18-21 40-50
Kirk-Othmer Encyclopedia of Chemical Technology (4th Edition)
354
AIR CONDITIONING
Voll
candy (hard) manufacturing 24-27 30-40
mixing and cooling 24-27 40-45
tunnel 13 dp—55
packing 18-24 40-45
storage 18-24 45-50
drying: jellies, gums 49-65 15
cold room: marshmallow 24-27 45-50
chewing gum manufacturing 25 33
rolling 20 63
stripping 22 53
breaking 23 47
wrapping 23 58
ceramics refractory 43-65 50-90
molding room 27 60-70
clay storage 15-27 35-65
decal and decorating 24-27 45-50
cereal packaging 24-27 45-50
cosmetics manufacturing 18-21
distilling storage: grain 15 35-40
Equid yeast 0-1
manufacturing 15-24 45-60
aging 18-22 50-60
electrical products electronic and x ray: coils and transmission winding 22 15
tube assembly 20 40
electrical installations: manufacturing and laboratory 21 50-55
thermostat assembly and calibration 24 50-55
humidistat assembly and calibration 24 50-55
close-tolerance assembly 22 40-45
meter assembly test 23-24 60-63
switchgear: fuse and cut-out assembly 23 50
capacitor winding 23 50
paper storage 23 50
conductor wrapping 24 65-70
lightning arrestor 20 20-40
circuit breaker: assembly and test 24 30-60
rectifiers: process selenium and copper oxide plates 23 30-40
furs drying 43
shock treatment -8
storage 4-10 55-65
cutting comfort
vinyl-laminating room 13 15
leather drying: vegetable-tanned 21 75
chrome-tanned 49 75
storage 10-15 40-60
lenses (optical) fusing comfort
grinding 27 80
matches manufacturing 22-23 50
drying 21-24 40
storage 15-17 50
munitions metal percussion elements: drying parts 88
drying paints 43
black-powder drying 52
condition and load powder-type fuse 21 40
load tracer pellets 27 40
pharmaceutical powder storage: before manufacturing 21-27 30-35
after manufacturing 24-27 15-35
milling room 27 35
tablet compressing 21-27 40
tablet coating 27 35
effervescent: tablet and powder 32 15
hypodermic tablet 24-27 30
colloids 21 30-50
cough symp 27 40
glandular products 26-27 5-10
ampule manufacturing 27 35
gelatin capsule 78 40-50
capsule storage 24 35-40
micro analysis comfort
biological manufacturing 27 35
liver extract 21-27 20-30
serums; animal room comfort
photo material drying -7 to 52 40-80
Kirk-Othmer Encyclopedia of Chemical Technology (4th Edition)
355
AIR CONDITIONING
Voll
cutting and packing 18-24 40-70
storage: film base, film paper, coated paper 21-24 40-65
safety film 15-27 45-50
nitrate film 4-10 40-50
plastic manufacturing: thermosetting compounds 27 25-30
cellophane 24-27 45-65
plywood hot press: resin 32 60
cold press 32 15-25
spectrographic analysis comfort
precision machining gear matching and assembly storage: 24-27 35-40
gasket 38 50
cement and glue machines: 18 40
gauging, assembly comfort
adjusting precision comfort
parts comfort
honing 24-27 35-45
printing multicolor lithographing:
pressroom 24-27 46-48
stockroom 23-27 49-51
sheet and web printing comfort
storage, folding, etc comfort
valve manufacturing 24 40
refrigeration equipment compressor assembly 21-24 30-45
refrigerator assembly comfort
testing 18-28 47
manufacturing 32
rubber-dipped goods cementing 27 25-30
surgical articles 24-32 25-30
storage before manufacturing 15-24 40-50
laboratory (ASTM standard) 23 50
textiles cotton:
opening, picking 21-24 55-70
carding 28-30 50-55
drawing and roving 27 55-60
ring spinning: conventional 27-29 60-70
long-draft 27-29
frame spinning 27-29 55-60
spooling, warping 26-27 60-65
weaving 26-27 70-85
cloth room 24 65-70
combing linen: 24 55-65
carding, spinning 24-27 60
weaving woolens: 27 80
picking 27-29 60
carding 27-29 65-70
spinning 27-29 50-60
dressing 24-27 60
weaving: light goods 27-29 55-70
heavy goods 27-29 60-65
drawing worsteds: 24 50-60
carding, combing, and gilling 27-29 60-70
storage 21-29 75-80
drawing 27-29 50-70
cap spinning 27-29 50-55
spooling, winding 24-27 55-60
weaving 27 50-60
finishing silk: 24-27 60
preparation and dressing 27 60-65
weaving, spinning 27 65-70
throwing 27 60
rayon: spinning 27-32 50-60
throwing 27 55-60
weaving: regenerated 27 50-60
acetate 27 55-60
spun rayon 27 80
picking 24-27 50-60
Kirk-Othmer Encyclopedia of Chemical Technology (4th Edition)
356
AIR CONDITIONING
Voll
carding, roving, drawing 27-32 50-60
knitting: viscose or Cuprammonium 27-29 65
synthetic-fiber preparation and weaving:
viscose 27 60
celanese 27 70
nylon 27 50-60
tobacco cigar and cigarette manufacturing 21-24 55-65
softening 32 85-88
stemming, stripping 24-29 75
storage and preparation 26 70
conditioning 24 75
packing and shipping 24 60
Listed conditions are typical; final design conditions are established by customer requirements.
Specific inside design conditions are required in industrial applications for one or more of the following reasons:
A constant temperature is required for close-tolerance measuring, gauging, machining, or grinding operations, to prevent expansion and contraction
of machine parts, machined products, and measuring devices. In this instance a constant temperature is normally more important than the temperature
level. Relative humidity is secondary in importance but should not go above 45% to minimize formation of a surface moisture film.
Some nonhygroscopic materials such as metals, glass, and plastics, have the ability to capture water molecules within microscopic surface crevices,
thus forming an invisible, noncontinuous surface film. The density of the film increases as the relative humidity increases. Thus, relative humidity must be
held below the critical point at which metals may etch or at which the electrical resistance of insulating materials is significandy decreased.
Where highly polished surfaces are manufactured or stored for short intervals between different phases of processing, relative humidity and
temperature are both maintained constant to minimize surface moisture films. If these surfaces are shipped or stored for extended intervals, protective
coverings or coatings may be required.
The temperature and humidity should be maintained at comfort conditions consistent with the operator's expected level of activity in order to
minimize perspiration. Constant temperature and humidity may also be required in machine rooms to prevent the etching or corrosion of machine parts. If
perspiration causes only minor damage to the product and results in few rejects, then inside design conditions at 27°C and 40% rh are satisfactory. Where
even small amounts of perspiration cause extreme damage to precision-machined parts and result in a high amount of rejects, inside design conditions of
21°C and 40% rh are recommended.
Control of relative humidity is needed to maintain the strength, pliability, and moisture regain of hygroscopic materials such as textiles and paper.
Humidity control may also be required in some appEcations to reduce the effect of static electricity. Temperature and/or relative humidity may also have to
be controlled in order to regulate the rate of chemical or biochemical reactions, such as the drying of varnishes, the application of sugar coatings, the
preparation of synthetic fibers and other chemical compounds, or the fermentation of yeast.
Human Comfort. ASHRAE has extensively researched the effect of air conditioning on human comfort. The more practical results are
summarized below; reference 4 contains a complete discussion.
Thermal comfort may be defined as "that condition of mind in which satisfaction is expressed with the thermal environment" (4). It is thus defined
by a statistically valid sample of people under very specific and controlled conditions. No single environment is satisfactory for everybody, even if all wear
identical clothing and perform the same activity. The comfort zone specified in ASHRAE Standard 55 (5) is based on 90% acceptance, or 10% dissatisfied.
Recent experiments (4) have shown that there are no significant age or gender-related differences in thermal environment preference when all other
factors such as weight of clothing and activity level are the same. Whereas people often accept thermal environments outside of their comfort range, there
is no evidence that they adapt to these other conditions. Their environmental preference does not change. Similarly there is no evidence that there is any
seasonal or circadian rhythm influence on a person's thermal preference.
Local areas of thermal discomfort, ie, one part of the body warmer or cooler than preferred, may cause a person to be uncomfortable when the
overall temperature and humidity would normally produce a sensation of thermal comfort. Some causes of this are nonuniform thermal radiation, such as
hot or cold windows, walls, panels, floors, and ceilings. Experiments show that people are more sensitive to the asymmetry caused by a warm overhead
surface than by a cold vertical surface. However, the percentage of people dissatisfied begins to rise rapidly once the radiant surface temperature rises more
than a few degrees above the air temperature. Comfort charts are normally based on an environment where the mean radiant temperature is the same as
the air temperature. This means that if there are significant surfaces such as radiant ceilings or large windows outside the range of the air temperature, the
conditions for comfort may have to be adjusted. Drafts, normally felt by the local cooling effect of the air moving past the body, are another cause of local
thermal discomfort. They are one of the most annoying factors in offices and often result in complaints and demands for higher ambient temperatures.
Drafts can come from improperly designed air distribution systems as well as from localized surfaces such as cold windows or walls.
Figure 3 shows the winter and summer comfort zones plotted on the coordinates of the ASHRAE psychrometric chart. These zones should
provide acceptable conditions for room occupants wearing typical indoor clothing who are at or near sedentary activity. Figure 3 applies generally to
altitudes from sea level to 2150 m and to the common case for indoor thermal environments where the temperature of the surfaces (/) approximately
equals air temperature (L) and the air velocity is less than 0.25 m/s. A wide range of environmental applications is covered by ASHRAE Comfort Standard
55 (5). Offices, homes, schools, shops, theaters, and many other applications are covered by this specification.
Kirk-Othmer Encyclopedia of Chemical Technology (4th Edition)
357
AIR CONDITIONING
Voll
Fig. 3. Comfort zones at 6% of population predicted dissatisfied from ref 4. RH lines are valid only when the air temperature equals the average
temperature of the surfaces, (a) Operative temperature range where ET* is effective temperature as defined in text, (b) Comfort zone detail. To convert
kPa to mm Hg, multiply by 7.5.
Vapor pressure,
Effective temperature (ET*) is a single number representing those combinations of temperature and humidity which are equivalent in terms of
comfort. It is defined as the dry-bulb temperature of the environment at 50% relative humidity. Standard effective temperature loci for normally clothed,
sedentary persons are plotted on Figure 3. The sensation of comfort depends in part upon the wetness of one's skin. Thus, as a person becomes more
active the effective temperature lines become more horizontal and the influence of relative humidity is more pronounced.
When air movement, clothing, or activity are not as specified in the definition of ET*, Figure 4, derived from an equation developed by Fanger (6),
may be used. Knowledge of the energy expended during the course of routine physical activities is also necessary, since the production of body heat
increases in proportion to exercise intensity. Table 2 presents probable metabolic rates (or the energy cost) for various activities. However, for higher
activity levels, the values given could be in error by as much as 50%. Engineering calculations should allow for this. The activity level of most people is a
combination of activities or work—rest periods. A weighted average metabolic rate is generally satisfactory, provided that activities alternate several times per
hour.
Kirk-Othmer Encyclopedia of Chemical Technology (4th Edition)
358
AIR CONDITIONING
Voll
Fig. 4. Comfortlin.es, ambient air temperature equals mean radiant temperature (4). To convert watts to kcal/min, multiply by 0.143.
Table 2. Metabolic Rate at Different Activities
Activity Metab olic rate, W*
resting seated, quiet standing, relaxed walking on the level: 0.9 m/s (2 mph) 1.35 m/s (3 mph) 1.8 m/s (4 mph) miscellaneous occupations bakery, eg, cleaning tins, packing boxes brewery, eg, filling botdes, loading beer boxes onto belt foundry work using a pneumatic hammer tending furnaces general laboratory work machine work light, eg, electrical industry heavy, eg, steel work shop assistant teacher vehicle driving car heavy vehicle domestic work house cleaning cooking washing by hand and ironing office work typing miscellaneous office work drafting leisure activities calisthenics exercise dancing, social 100 120 200 260 380 140-200 120-240 300-340 500-700 140-180 200-240 350-450 200 160 150 320 200-340 160-200 200-360 120-140 110-130 110-130 300-400 240-440
Kirk-Othmer Encyclopedia of Chemical Technology (4th Edition)
359
AIR CONDITIONING
Voll
tennis, singles 360-460
squash, singles 500-720
golf, swinging and walking 140—260
golf, swinging and golf cart 140—180
Ranges are given for those activities which may vary considerably from one place of work or leisure to another, or when performed by different people.
Some occupational and leisure time activities are difficult to evaluate because of differences in exercise intensity and body position. To convert W to kcal/h,
divide by 1.162.
Equipment Size Requirements. Determining the proper size of air conditioning and heating equipment requires detailed study and
calculation. A comprehensive statement of requirements and allowable variations must be supplied so that the best comfort conditioning system choice can
be made. With such information it is possible to estimate not only equipment size, but also yearly energy requirements using any of several comprehensive
computer (7) or manual methods. Different systems can be designed and compared to ensure that the owner has a cost-effective yet energy-efficient
system.
An analysis of the building structure must be conducted to determine the effects of heat gain from the sun. This analysis includes building
orientation, type of construction, surrounding vegetation and structures, and reflective surfaces. People, lighting, machinery loads, and heat gains from
chemical processes are evaluated as well as hooded (ventilated) processes, and lengths of operation. Outdoor air required both for ventilation to remove
odors and contaminants, and for replacement of air exhausted through hoods must be conditioned. ASHRAE Standard 62 (8) provides recommendations
for minimum outdoor air requirements; local codes should be investigated. A building often requires cooling at low outdoor temperatures as a result of
high internal heat gains. Interior portions of many buildings require cooling during occupied hours throughout the year. The use of outdoor air, when its
temperature and dew point are suitable (economizer cycle), is an efficient means of air conditioning. Care must be taken, however, in applying economizer
cycles to areas where close humidity control is required because additional humidification or dehumidification may be needed.
The following information is customarily required for thorough design of new air conditioning systems or renovation of existing systems.
Temperature and/or humidity to be maintained
Allowable seasonal variations
Permissible control tolerance
Outdoor conditions to be assumed for design extremes under which the plant must operate
Architectural plans and details of building construction (if original plans are not available, the building must be measured carefully and details of
constmc-tion must be determined by inspection)
Orientation of the building
Neighboring structures
Special zoning requirements based on load concentrations, and differences in conditions required for various processes
Glass areas
Type of glass
Shading devices
Reveals and overhangs
Sensible heat gains
Power equipment
Usage factor
Percent loaded
Hours used
Rated power requirement
Lighting
Usage factor
Hours used
Auxiliaries
Rated power requirement
Miscellaneous, eg, ovens, exposed steam pipes, use of exhaust hoods
Temperature of product entering space
Product temperature above space temperature (resulting in a heat gain to the space)
Product temperature below space temperature (producing a credit to sensible-heat gain or a heating requirement)
Latent heat gains
Evaporation from wet surfaces due to process
Migration of water vapor through building materials (especially important in low dew-point application)
Water vapor from moist product
Sensible and latent heat gains
People
Degree of activity
Time of occupancy
Number
Gas burning equipment
Usage factor
Heating value of gas
Use of hoods
Equipment of evaporating water
Usage factor
Capacity
Energy required to operate
Chemical and biological reactions
Infiltration of air
Frequency of door opening
Window cracks
Porosity of building structure
Steam or water released
Ventilation air
For human occupancy
Toxic fume and smoke dilution
Odor dilution
Offsetting exhaust hood requirements
Energy sources
Kirk-Othmer Encyclopedia of Chemical Technology (4th Edition)
360
AIR CONDITIONING
Voll
Availability and cost
Options
Heat recovery possibilities
Process streams
Ventilation
Equipment
Lighting
Air conditioning system
Refuse
Air Conditioning and Humidification Systems
Ait conditioning may involve heating or cooling ait, humidifying or drying it, and the control of chemical impurities to maintain the desired space
conditions. Proper controls and energy conserving practices are also important to ait conditioning and humidification.
Typical Air Conditioning Systems. Two broad categories of air conditioning systems exist, unitary and applied. Unitary systems are
self-contained units that are "off the shelf." They use electricity for cooling, and may use electricity, natural gas, fuel oil, or propane for heating. Heat
rejected during the cooling cycle is dissipated to the outdoors. Multiple unitary systems may be employed to provide greater overall rc liabilily and to permit
individual control of various sections of a plant. A typical unit for rooftop mounting is shown in Figure 5. It contains means for heating, ventilating, and
cooling.
Economizer hood
2" Throwaway
filters
Outdoor air opening
for internal
economizer (option)
Side and bottom
supply & return air
duct openings (side x side)
High efficiency compressors
with crankcase heaters
» Copper tube/aluminum fin
\ condenser coils
Low voltage relay
board and terminal
strip
.W'
Belt-drive
blower motor
Base rails
Side duct requires flange accessory. with lifting holes
Bottom power &
control wiring entry
.Terminal block ।
1(for single point power ।
'supply with electric ।
heat) DCE units .
Fig. 5. Rooftop unitary system.
Courtesy of York International Corporation.
More flexibility is obtained with applied equipment (Fig. 6), which is normally used to condition a relatively large area of a plant. This is usually part
of a "field erected" system. In applied systems, outdoor air for ventilation or cooling (economizer cycle) is drawn through a preconditioning or preheat coil
and mixed with air returned from the conditioned space. Dampers regulate the relative amounts of outdoor and recycled air for temperature control. The
air is filtered before passing into the conditioning section which contains cooling and dehumidifying coils, air washers for humidity control, and heating
coils. Bypass of return air may be included for temperature control. The refrigerating effect is provided in one of several ways. Well water may be employed
if available in sufficient quality and quantity and at a suitable temperature. More commonly, refrigerating machines or "chillers" are used. In small systems,
reciprocating compressors are employed and the refrigerant maybe direcdy admitted to the cooling coil. In larger applications, water is chilled and
circulated through the central station unit. For applications in excess of 350 kW (1.2 X 10⁶ Btu/11), reciprocating compressors may be replaced by
centrifugal systems. Most systems are electrically powered; however, steam or gas turbines are used occasionally. Absorption chillers are frequendy used
when a suitable supply of "waste" heat is available. Low pressure steam, hot water, and process streams may provide the motive force. Solar heated water is
also finding application (9) (see Solarenergy).
Air returned from
Kirk-Othmer Encyclopedia of Chemical Technology (4th Edition)
361
AIR CONDITIONING
Voll
Fig. 6. Diagram of applied system.
Humidification. For winter operation, or for special process requirements, humidification maybe required (see Simultaneous heat and mass
transfer). Humidification can be effected by an air washer which employs direct water sprays (see Evaporation). Regulation is maintained by cycling the
water sprays or by temperature control of the air or water. Where a large humidification capacity is required, an ejector which direcdy mixes air and water in
a nozzle may be employed. Steam may be used to power the nozzle. Live low pressure steam can also be released direcdy into the air stream. Capillary-type
humidifiers employ wetted porous media to provide extended air and water contact. Pan-type humidifiers are employed where the required capacity is
small. A water filled pan is located on one side of the air duct. The water is heated electrically or by steam. The use of steam, however, necessitates
additional boiler feed water treatment and may add odors to the air stream. Direct use of steam for humidification also requires careful attention to indoor
air quality.
Dehumidification. Dehumidification may be accomplished in several ways (see Drying). Moderate changes in humidity can be made by
exposing the air stream to a surface whose temperature is below the dew point of the air. The air is cooled and releases a portion of its moisture. Closed
cycle air conditioning systems normally effect dehumidification also. The cooled air may require reheating to attain the desired dry-bulb temperature if there
is insufficient sensible load in the space.
Another method of moderate dehumidification is by direct contact between the air and cold water using open circuit equipment. An air washer or
capillary humidifier maintaining the water at a cold temperature is an example.
Some industrial processes produce predominately latent air conditioning loads. Others dictate very low humidities and when the dew point falls
below 0°C, freezing becomes a major concern. Dehydration equipment, using solid sorbents such as silica gel and activated alumina, or liquid sorbents such
as lithium chloride brine and triethylene glycol, may be used. The process is exothermic and may require cooling the exiting air stream to meet space
requirements. Heat is also required for reactivation of the sorbent material.
Solid sorbent materials have the ability to adsorb water vapor until an equilibrium condition is attained. The total weight of water that can be
adsorbed in a particular material is a function of the temperature of the material and of the relative humidity of the air (see Adsorption). To regenerate the
sorbent, its temperature must be raised or the relative humidity lowered. The solid sorbents most commonly used are silica (qv), alumina (see Aluminum
compounds), and molecular sieves (qv).
Liquid sorbent materials in aqueous solutions reduce the vapor pressure relative to that of pure water. Such a solution, if of proper strength, causes
moisture to condense from the air even though the solution temperature is above the dew point of the air. Brines such as calcium chloride, lithium chloride,
lithium bromide, and calcium bromide may be used singly or in combination. They are generally somewhat corrosive in nature. Triethylene glycol, and to a
lesser extent diethylene glycol and ethylene glycol, are also used (see Glycols). Brines should not have a solidification curve too near the working range;
they must be odorless, relatively noncorrosive, chemically stable, and reasonable in cost. The most serious hazards of application are corrosion and
carry-over from equipment into the room. Regeneration of the brine is generally accomplished by boiling the excess water out of the brine and exhausting
it to another air stream. The solution is then recooled to a temperature suitable for dehumidification. Equipment is available to make this process
continuous.
Chemical Neutralization. Spray-type air washers are used extensively for removal or neutralization of noxious components from large
volumes of air, particularly exhaust air streams. Appropriate reagents are sprayed into the washer to purify the air by neutralization, eg, sodium hydroxide
solution is used if the air contains acidic gases. The solution must be continuously reconcentrated and any precipitated salts removed. The contact
efficiency of such washers is high, and the simple construction provides easy maintenance and constant efficiency (see Airpollution control methods).
Evaporative Cooling. Evaporative air cooling equipment deposits water direcdy into the air stream through evaporation (see Heatexchange
technology; Simultaneous heat and mass transfer). These systems are employed where the application has a high sensible heat load and requires final
design relative humidities of 50% or greater, or where the entering air's relative humidity is very low. Evaporative cooling and humidification are often
accomplished by the same equipment, depending on the relative temperatures of the air and water.
There are several basic types of evaporative cooling devices. Among them are spray air washers, cell washers, and wetted media air coolers. Intimate
contact between the spray water and the flowing air causes heat and mass transfer between the air and the water. Cell washers obtain intimate air—water
contact by passing the air through cells packed with glass, metal, or fiber screens. Wetted media coolers contain evaporative pads, made usually of aspen
wood fibers, and a water circulating pump to lift the sump water to a distributing system from which it runs down through the pads and back into the
sump. Washers are commonly available from 1 to 118 m3/s (2000—250,000 ft3/min) capacity depending on the type; however, there is no limit to sizes that
can be constructed. Air velocity, air dry-bulb, air wet-bulb, water spray density, spray pressure, and other design factors must be considered for each
application.
Continued satisfactory performance of any evaporative cooling device depends largely on a regular cleaning and inspection schedule. The frequency
of this maintenance varies with operating conditions; however, a weekly inspection is common practice. A spray system requires the most attention:
partially clogged nozzles are indicated by a rise in spray pressure; eroded orifices by a fall in pressure. Strainers can minimize these problems. For
continuous operation a bypass around the strainer or duplex strainers is required. Air washer tanks should be drained and dirt deposits removed at regular
intervals. Eliminators and baffles should be inspected periodically and repainted to prevent damage by corrosion. A small amount of water, depending on
the hardness of the makeup water, should be bled-off to maintain an acceptable concentration of solids according to recommendations of a water
treatment specialist (see Water, industrial water treatment). In the case of cell-type washers, a differential pressure gage to measure the air flow resistance
across the cells can be used to determine the need to clean the media. In all washers, proper water treatment must be maintained to prevent the growth of
bacteria, fungi, and other microorganisms.
Air Conditioning Control. When sized to meet design conditions, a heating or cooling system normally operates over a wide range of
temperatures and loads; thus proper control becomes important. Controls may range from a single thermostat to complex computer systems. The general
references provide several texts on these subjects. The system must be adjusted and maintained in order to provide operation for many years. The simplest
control system which will produce the necessary results is best. The design professional should have the information noted in the sections on air
conditioning equipment requirements for all anticipated operating conditions. For energy efficiency the specifications should contain wide tolerances.
Energy Conservation. The design of systems that conserve energy requires knowledge of the building, its operating schedule, and the
systems to be installed (see Energy management). The following approaches lead to reduced energy consumption:
Use Equipment Only When Needed. Start morning warm-up no earlier than necessary and do not use outside air for ventilation until the
building is occupied. Use minimum amounts of outdoor air according to reference 8. Supply heat at night only to maintain a temperature above 13°C.
Supply Heating and Cooling from the Most Efficient Source.
Sequence Heating and Cooling. Do not supply both at the same time. The zoning and system selection should eliminate or at least
minimize simultaneous heating and cooling.
Provide Only the Heating or Cooling Actually Needed. Generally, the supply temperature of hot and cold air, or water, should be
reset according to actual need. This is especially important on systems or zones that allow simultaneous heating and cooling.
Uses of Air Conditioning in Industry
Many industrial processes require accurate environmental control. Examples include: chemical reactions and processes that are affected by atmospheric
conditions; biochemical reactions; quality, uniformity, and standardization of certain products; factors such as rate of crystallization and size of crystals;
product moisture content or regain; deliquescence, lumping, and caking of hygroscopic materials; expansion and contraction of machines and products;
physical, chemical, and biological cleanliness; effects of static electricity; odors and fumes; conditions in storage and packaging; quality of painted and
lacquered finishes; simulation of stratosphere or space conditions; and productivity and comfort of workers. Controlled atmospheric conditions are
Kirk-Othmer Encyclopedia of Chemical Technology (4th Edition)
362
AIR CONDITIONING
Voll
especially important to the textile, pharmaceutical, food processing, explosives, and photographic materials industries. Analytical laboratories, clean rooms,
and computer control rooms also require air conditioned environments.
Synthetic Fibers. In the synthetic textile industry, air conditioning is used to achieve uniform quaEty and viscosity for spinning; to control the
rate of reaction and coagulation; to control toxic fumes and evaporation from acid baths; to prevent stretching during the winding of wet threads; to
control regain; and to prevent crystal formation on threads and machines. Because of toxic fumes in some rayon processes, air conditioning with a large
amount of outdoor air and extensive exhaust is a hygienic necessity. In the mechanical handling of the finished synthetic yams, in throwing, weaving, and
knitting operations, air conditioning is necessary for quaEty and production control (see Textiles).
Pharmaceuticals and Biologicals. Air conditioning is an important processing requirement in the production of many pharmaceutical
materials, as in the manufacture of pills and capsules and in the packaging of the finished product to maintain constancy in formula, quaEty, and dosage. It
helps to achieve constant production rates, cleanliness, and purity of product; to prevent lumping, caking, and sticking; to reduce diffusion of material into
the air; to remove noxious fumes and gases; and to produce the desired poEsh on coated pills (see Pharmaceuticals).
Rubber. In the rubber industry, air conditioning provides uniform performance in drying and shortens the drying period, controls oxidation,
eliminates bEsters in dipping operations, preserves tensile strength, minimizes explosion hazards from static electricity, and reduces the concentration of
toxic fumes (see Rubbercompounding).
Photographic Materials. Air conditioning is an essential element in the processing of photographic materials to control the moisture regain
of film and minimize static discharge, thus reducing fire hazard and preventing fogging and streaking. Air conditioning assures dust-free air and provides
ideal conditions for packaging and storage, thereby reducing production losses. Careful control of temperature, humidity, cleanliness, and ventilation is
practical and essential (see Photography).
Explosives. The munitions industry employs air conditioning to control uniformity in the manufacture and loading of various explosive
mixtures, to control drying and moisture content, to minimize static discharges, to reduce the hazards of fire and explosion, to remove and neutralize toxic
fumes, to remove and recover dust or solvents from manufacturing or loading processes, and to provide proper atmospheric conditions for the storage of
raw materials or finished product (see Explosives).
Breweries. Air conditioning and the extensive use of refrigeration are necessary to provide controlled temperature in wort cooling,
fermentation, storage, and final packaging of the finished beer. Sanitation and removal of carbon dioxide are important aspects of this appEcation (see
Beer).
Food Processing. Air conditioning, including drying and freezing, has many appEcations in food processing. Examples are food dehydration,
blast freezing, smoke houses, storage faciEties, canned and dried foods, frozen foods, meat-packing, chewing gum manufacturing, concentrated fruit juices,
and hard and chocolate candy (see Food processing).
Metal Industry. Air Air conditioning plays an important part in cupola and blast furnaces and in Bessemer converters. It is used to supply air
of proper moisture content and to increase worker comfort, eg, in crane cabs, pulpits, or other individual "hot" operating spots. This is accompEshed by
individual or group spot-cooling. For powder metallurgy, a low temperature is needed in metal fitting and humidity control is required in metal finishing to
eliminate perspiration stains, etching, and rust (see Metal treatments; Metallurgy, powder metallurgy).
Ceramics. The drying of ceramic products before firing is controlled by air conditioning to standardize form and dimension, estabEsh uniform
drying at a controlled rate, and prevent strains that may otherwise cause cracking and crazing during firing (see Ceramics).
Laboratories. A wide range of temperatures from —110 to 120°C, humidities from 5 to 95%, pressures from near vacuum to many
atmospheres, as well as other special ambient conditions, are not unusual for test chambers and in some instances even for complete laboratories.
Requirements may be either to maintain constant conditions or to alternate high and low temperatures in conjunction with high and low humidities. Test
faciEties may be designed to test specifications and standards of materials and products as well as to determine environmental standards. Simulation of
conditions outside the earth's atmosphere is required for testing aerospace vehicles, eg, the radiation of the sun is approximated by banks of high energy
lamps on one wall; other surfaces are maintained at a temperature of —180° C or below to simulate the coldness of space.
Economic Evaluation of Air Conditioning Systems
The total economic picture, including life cycle costs and energy expenditures, must be considered in selecting an efficient air conditioning system. For
many systems, the ratio of annual energy usage to first cost ranges from 0.25 to 2. Thus, over its useful life, a system consumes many times its initial costs.
Comparing two or more complex alternatives is more difficult than examining equipment capacity or first cost. Characteristics of alternatives should
be weighted for relative importance and measured on a common scale to allow proper evaluation. Many characteristics such as first cost, capacity, space
requirement, and annual energy use can be measured objectively and used for system comparisons. Experience has shown that items such as maintenance
expense, component life, and downtime can also be reEably estimated. Other factors, eg, system maintainabiEty, flexibiEty, and comfort, are more arbitrary.
Life cycle cost analysis is the proper tool for evaluation of alternative systems (11,12). The total cost of a system, including energy cost, maintenance
cost, interest, cash flow, equipment replacement and/or salvage value, taxes, inflation, and energy cost escalation, can be estimated over the useful life of
each alternative system. A Est of life cycle cost items which may be considered for each system is presented in Tables 3 and 4. Reference 14 presents a cash
flow analysis which also includes factors such as energy cost escalation.
Table 3. Owning and Operating Cost Data and Summary*
Owning costs
Initial cost of system (amortized) b equipment Amortisation factors
control systems—complete amortization period n (number of years during which initial cost is to be recovered)
wiring and piping costs attributable to system interest rate, i capital recovery factor
any increase in building construction cost attributable to system any decrease in building construction cost attributable to system installation costs miscellaneous equivalent uniform annual cost Annual fixed charges income taxes property taxes insurance rent Total annual fixed charges Operating costs
Annual energy and fuel costs electric energy costs chiller or compressor pumps chilled water heating water condenser or tower water well water ventilation preheaters reheaters supplementary heating (ie, oil preheating) other domestic water heating cooking and food service equipment air conditioning
Kirk-Othmer Encyclopedia of Chemical Technology (4th Edition)
363
AIR CONDITIONING
Voll
boiler auxiliaries (including fuel oil heaters) fans condenser or tower inside air handling exhaust make-up air absorption chiller or compressor gas and diesel engine driven gas turbine driven steam turbine driven miscellaneous water
boiler auxiliaries and equipment room ventilation condenser make-up water sewer charges
resistance heaters (primary or supplementary) heat pump domestic water heating lighting chemicals miscellaneous Total annual fuel and energy costs Vages of engineers and operators
cooking and food service equipment Annual maintenance allowances
miscellaneous (elevators, escalators, computers, etc) replacement or servicing of oil, air, or water filters
gas, oil, coal, or purchased steam costs on-site generation of the electrical power requirements under electric energy costs heating direct heating contracted maintenance service lubricating oil and grease general housekeeping costs replacement of worn parts (labor and material) refrigerant Total annual maintenance allowance Summary
equivalent uniform annual cost
total annual fixed charges
total annual fuel and energy costs
wages of engineers and operators
total annual maintenance allowance
Total Annual Owning and Operating Costs.
aRef. 13.
b See Table 4.
Table 4. Initial Costs**
energy and fuel service costs fuel service, storage, handling, piping, and distribution costs electrical service entrance and distribution equipment costs total energy plant heat producing equipment boilers and furnaces steam—water converters heat pumps or resistance heaters make-up heaters heat producing equipment auxiliaries refrigeration equipment cooling distribution equipment pumps, piping, piping insulation, condensate drains, etc terminal units, mixing boxes, diffusers, grilles, etc air treatment and distribution equipment air heaters, humidifiers, dehumidifiers, filters, etc fans, ducts, duct insulation, dampers, etc exhaust and return systems system and controls automation terminal or zone controls system program control
compressors, chillers, or absorption units alarms and indicator system building construction and alteration
cooling towers, condensers, well water supplies refrigeration equipment auxiliaries heat distribution equipment mechanical and electric space chimneys and flues building insulation solar radiation controls
pumps, reducing valves, piping, piping insulation, etc terminal units or devices acoustical and vibration treatment distribution shafts, machinery foundations, furring
aRef. 13.
BIBLIOGRAPHY
"Air Conditioning" in ECT 1st ed., Vol. 1, pp. 238—252, by L. Macrow and U. A. Bowman, Carrier Corporation; in ECT 2nd ed., Vol. 1, pp. 481—501, by R.
Elsea and R. C. Terwilliger, Jr., Carrier Corporation; in ECT 3rd ed., Vol. 1, pp. 598—624, by K. W. Cooper and R. A. Erth, York Division, Borg-Warner
Corporation.
1. ASHRAE Handbooks, American Society of Heating, Refrigeration, and Air Conditioning Engineers, Inc., Publications Department, Adanta, Ga.
four vols.: Pundamentals, Equipment, Systems and Applications, and Refrigeration. One volume is revised each year.
2. F. C. McQuiston and J. D. Parker, Heating, Ventilating and Air Conditioning, 3rd ed., John Wiley & Sons, Inc., New York, 1988.
3. W. F. Stoecker, Using SI units in Heating, Air Conditioning, and Refrigeration, rev. ed., Business News Publishing Co., 1976.
4. Ref. 1, Eundamentals, 1989, Chapter 8.
5. ASHRAE Standards, American Society of Heating, Refrigerating, and Air Conditioning Engineers, Inc., Publications Department, Adanta, Ga.
Standard 55, 1981. Standards are upgraded on a regular basis.
6. Ref. ^fundamentals, 1989, p. 8.17.
7. A bibliography of Available Computer Programs in the Area of Heating, Ventilating, Air Conditioning and Refrigeration, American Society of Heating,
Refrigerating, and Air Conditioning Engineers, Inc., 1986.
8. Ref. 5, Standard 62.
Kirk-Othmer Encyclopedia of Chemical Technology (4th Edition)
364
AIR CONDITIONING
Voll
9. A. B. Newton, ASHRAE J. 34 (Feb. 1975).
10. Ref. 1, Equipment., 1988.
11. R. T. Ruegg, Eife-Cycle Cost Manualfor the Federal Energy Management Program, U.S. Department of Energy Federal Energy Management program,
NTIS-PR-360, May 1982.
12. R. T. Ruegg and S. R. Petersen, Comprehensive Guide for Eeast-cost Energy Decisions, NBS Special Publication 709, January 1987.
13. Ref. 1, Systems and Applications, 1987.
14. Ref. 1, Systems and Applications, Chapt. 49, 1987.
General References
ASHRAE Journal (monthly) and ASHRAE Transactions (semiannually) American Society of Heating, Refrigera ting and Air Conditioning Engineers,
Adanta, Ga.
ASHRAE Transactions (semiannually)
Heating/Piping/Air Conditioning, (monthly) Penton Publications, Inc., Cleveland, Ohio.
R. W. Haines, HVAC System Design Handbook, TAB Books, Blue Ridge Summit, Pa., 1988.
В. C. Langley, Control Systemsfor Air Conditioning and Refrigeration, Prentice Hall, Englewood Cliffs, N.J. 1985.
G. W. Gupton Jr., HVAC Controls, Operation and Maintenance, Fairmont Press, Lilburn, Ga., 1987.
R. W. Haines, Control Systems for Heating, Ventilating and Air Conditioning, Van Nostrand-Reinhold, New York, 4th ed., 1987.
Kenneth W. Cooper
Poolpak, Inc.
Kirk-Othmer Encyclopedia of Chemical Technology (4th Edition)
365
AIR POLLUTION
Voll
AIR, LIQUID.
See Cryogenics.
AIR POLLUTION
Air pollution, as defined by textbooks published in the 1970s and 1980s, is any atmospheric condition in which substances are present in concentrations
high enough above their normal ambient levels to produce a measurable effect on humans, animals, vegetation, or materials. This definition is deficient,
however, because it does not include the so-called greenhouse or ozone-depleting gases which have the potential to alter the global climate and hence the
global ecosystem. (The effects of these gases on humans, animals, vegetation, or materials have not been, and may never be, observed.) Therefore, in an
attempt to be more comprehensive, the following definition is offered: air pollution is the presence of any substance in the atmosphere at a concentration
high enough to produce an objectionable effect on humans, animals, vegetation, or materials, or to significandy alter the natural balance of any ecosystem.
Substances can be solids, Equids, or gases, and can be produced by anthropogenic activities or natural sources. In this article only nonbiological material is
considered and the discussion of airborne radioactive contaminants is limited to radon [10043-92-2] (see Helium group, gases), which is discussed in the
context of indoor air pollution.
Perceptions of air pollutant effects are limited by ease of detection. Historically, odors, soiling of surfaces, and smoke-belching stacks were
detectable. Three rare meteorological events, however, made it clear that air pollutants can be hazardous to human health and can even cause death at high
enough concentrations. The first, a week-long air stagnation in the Meuse Valley in Belgium in 1930, led to the death of 60 people and respiratory problems
for a large number of others. In 1948 similar conditions in Donora, Pennsylvania, resulted in nearly 7000 illnesses and 20 deaths, and in 1952, 4000 deaths
were attributed to a four-day "killer fog" in London, England. Although these episodes dramatized the acute health effects of high concentrations of air
pollutants, it was concern over longer term, chronic effects that led to the initiation of National Ambient Air QuaEty Standards (NAAQS) for six criteria
poEutants in the United States in the early 1970s.
The original six criteria pollutants, so named because the Environmental Protection Agency is required to summarize pubEshed information on each
and the summaries are caked criteria documents, were sulfur dioxide [7446-09-5], SOy carbon monoxide (qv) [630-08-0], CO-, nitrogen dioxide
[10102-44-0], NO2; ozone (qv) [10028-15-6], O3; suspended particulates; and nonmethane hydrocarbons, NMHC. The NMHC are now referred to as
volatile organic compounds, VOC. The criteria poEutants captured the attention of regulators for several reasons: they were ubiquitous; there was
substantial evidence linking them to health effects at high concentrations; three of them, O3, SO2, and NO2, were also known as phytotoxins; and they
were fairly easy to measure. The NMHC were dropped from the Est shordy after the criteria poEutants were so designated. In the late 1970s, lead (qv)
[7439-92-1], Pb, was added to the Est and in 1987, so was particulate matter having an aerodynamic diameter of less than or equal to 10 |lm, PM10.
There have been several developments since the estabEshment of the criteria poEutants. In the mid-1970s it was shown that high concentrations of
O3 and sulfate haze could be transported hundreds of miles and acid deposition studies in the 1980s clearly iEustrated the international and global aspects
of this transport. Then stratospheric O3 depletion and global warming became issues and ak poEution was finaEy viewed in a global context. At the same
time that the geographic scale of ak poEution was expanding, the number of poEutants of concern also increased and detection capabiEties improved,
leading to the estabEshment of a hazardous ak poEutant category which includes any potentiaEy toxic substance in the ak that is not a criteria poEutant.
Air Pollution Components
Ak poEution can be considered to have three components: sources, transport and transformations in the atmosphere, and receptors. The source emits
akbome substances that, when released, are transported through the atmosphere. Some of the substances interact with sunlight or chemical species in the
atmosphere and are transformed. PoEutants that are emitted dkecdy to the atmosphere are caEed primary poEutants; poEutants that are formed in the
atmosphere as a result of transformations are caEed secondary poEutants. The reactants that undergo transformation are referred to as precursors. An
example of a secondary poEutant is O3, and its precursors are NMHC and nitrogen oxides, NO , a combination of nitric oxide [10102-43-9], NO, and
NO2. The receptor is the person, animal, plant, material, or ecosystem affected by the emissions.
Sources. There are three types of ak poEution sources: point, area, and line sources. A point source is a single facEity that has one or more
emissions points. An area source is a coEection of smaEer sources such as emissions from residential heating within a particular geographic area. A line
source is a one-dimensional, horizontal configuration such as a roadway. Most emissions emanate from a specific stack or vent. Emissions emanating from
sources other than stacks, eg, storage pEes or unpaved lots, are classified as fugitive emissions.
EPA requkes that each state develop emissions inventories for aE primary poEutants and precursors to secondary poEutants that are classified as
criteria or hazardous ak poEutants (1). In clean, rural areas, county-wide emissions totals for individual poEutant species may be aE that is needed as long as
emissions from large point sources are inventoried separately. For urban areas having severe ak poEution problems, gridded emissions inventories are
requked. An area is divided into grids, typicaEy 5 to 10 km to a side, and area- and line-source emissions are calculated for each grid. Large point sources are
Ested individuaEy. Such inventories are used as inputs to sophisticated ak quaEty models, employed to develop ak poEution control strategies (see Air
POLLUTION CONTROL METHODS).
Emissions rates for a specific source can be measured dkecdy by inserting sampling probes into the stack or vent and this has been done for most
large point sources. It would be an impossible task to do for every source in an area inventory, however. Instead, emission factors, based on measurements
from similar sources or engineering mass-balance calculations, are appEed to most sources. An emission factor is a statistical average or quantitative
estimate of the amount of a poEutant emitted from a specific source type as a function of the amount of raw material processed, product produced, or fuel
consumed. Emission factors for most sources have been compEed (2). Emission factors for motor vehicles are determined as a function of vehicle model
year, speed, temperature, etc. The vehicles are operated using various driving patterns on a chassis dynamometer. Dynamometer-based emissions data are
used in EPA's MOBILE 4 model (3) to calculate total Beet emissions for a given roadway system.
Each year, EPA pubEshes a summary of ak poEution emissions and ak quaEty trends for the criteria poEutants (4). Table 1 contains the summary
for 1989. U.S. emissions estimates for these poEutants are avaEable back to 1940 (5).
Table 1. Nationwide Air Pollutant Emissions Estimates for the United States in 1989a
PoEutant emissions, 106 t/yr
Kirk-Othmer Encyclopedia of Chemical Technology (4th Edition)
366
AIR POLLUTION
Voll
Source category Particulates so \O VOC CO Pb
transportation 1.5 1.0 7.9 6.4 40.0 2.2h
stationary fuel combustion 1.8 16.8 11.1 0.9 7.8 0.5h
industrial processes 2.7 3.3 0.6 8.1 4.6 2.3h
solid waste 0.3 0.0 0.1 0.6 1.7 2.3h
miscellaneous 1.0 0.0 0.2 2.5 6.7
Totals 7.2 21.1 19.9 18.5 60.9 7.2h
aRef. 4
b 103 t/yr.
The sums of the subcategories may not equal totals as a result of rounding.
Transport and Transformation. Once emitted into the atmosphere, the fate of a particular pollutant depends upon the stability of the
atmosphere, which determines the concentration of the species, the stability of the pollutant in the atmosphere, which determines the persistence of the
substance. Transport depends upon the stability of the atmosphere which, in turn, depends upon the ventilation. The stability of a pollutant depends on:
the presence or absence of clouds, fog, or precipitation; the pollutant's solubility in water and reactivity with other atmospheric constituents (which may be
a function of temperature); the concentrations of other atmospheric constituents; the pollutant's stability in the presence of sunlight; and the deposition
velocity of the pollutant.
Atmospheric stability can be examined utilizing the Gaussian Plume model which ignores possible transformations:
Х(ж, y,z = 0) =--------exp —
where X is the concentration at the receptor located on the ground (z = 0); Q is the pollutant release rate; CT and CT are the crosswind and vertical plume
standard deviations, which are functions of the atmospheric stability and the distance downwind (x); и is the mean wind speed; H is the effective stack
height, equal to the height of release only if the plume is not buoyant; and x ancli’ are the downwind and crosswind distances. As the ventilation ie, //, CT
and CT increases, the concentration of the pollutants decreases for a given emission rate Q. The atmospheric stability is determined by comparing the actual
lapse rate to the dry adiabatic lapse rate. An air parcel warmer than the surrounding air rises and cools at the dry adiabatic lapse rate of 9.8°C/1000 m.
When the actual temperature-decline-with-altitude is greater than 9.8°C/1000 m, the atmosphere is unstable, the ct's become larger, and the concentrations
of pollutants lower. As the lapse rate becomes smaller, the dispersive capacity of the atmosphere declines and reaches a minimum when the lapse rate
becomes positive. At that point, a temperature inversion exists. Temperature inversions form every evening in most places. However, these inversions are
usually destroyed the next morning as the sun heats the earth's surface. Most episodes of high pollutant concentrations are associated with multiday
inversions.
The stability or persistence of a pollutant in the atmosphere depends on the pollutant's atmospheric residence time. Mean residence times and
principal atmospheric sinks for a variety of species are given in Table 2. Species like SO2, XO (NO and NO2), and coarse particles have lifetimes less than
a day; thus important environmental impacts from these as primary pollutants are usually within close proximity to the emissions sources. In the presence
of high concentrations of NO, the residence time of O3 is on the order of seconds to hours. In the relatively nonpolluted environment of the free
troposphere, from approximately 1500 m to the top of the troposphere (~12 km), the 90-day lifetime applies. Consequendy, given the right conditions, O3
could have important environmental impact far downwind from its source. In fact, concentrations of O3 near the NAAQS limit have been transported
from the Gulf Coast of the United States to the Northeast over a several-day period (9).
Table 2. Mean Atmospheric Residence Times (t) and Dominant Sinks of Air Pollutants
Species CAS Registry Number Dominant sink Sink i • ь location Reference
so2 [7446-09-5] 0.5 days OH T 6
\O 0.5 days OH T 6
coarse particles (diameter > 2.5pm) <1 day S,P T 7
fine particles (diameter < 2.5pm) 5 days p T 7
O3 (tropospheric) [10028-15-6] 90 daysd NO, uv, Sr, О T 6
co [630-08-0] 100 days OH T 6
co2 [124-38-9] 120 yr' о T 8
CH4 [74-82-8] 7-10 yr OH T 6
CFC13 (CFC-11) [75-69^1] 65-75 yr uv St 6,8
CF2C12 (CFC-12) [75-71-8] 110-130 yr uv St 6,8
n2o [10024-97-2] 120-150 yr uv St 6,8
C2C13F3 (CFC-113) [76-13-1] 90 yr uv St 6
Sinks, chemical species, or method: OH, reaction with OH radical; S, sedimentation; P, precipitation scavenging; NO, reaction with NO radical; uv,
photolysis by ultraviolet radiation; Sr, destruction at surfaces; O, adsorption or destruction at oceanic surface.
k T = trophosphere; St = stratosphere.
Applies to particles released in the lower troposphere only; the most important sink is scavenging by precipitation, so in the absence of precipitation, these
particles will remain suspended longer.
Tropospheric residence time only; shorter lifetime applies to urban areas where NO quickly destroys O3.
Combined lifetime for atmosphere, biosphere, and upper ocean.
Particles having diameters less than 2.5 pm have negligible settling velocities and therefore have residence times which are considerably longer than
those of larger particles. As a result, multiday transport of haze produced by fine particles over distances of more than a thousand kilometers is possible
(10). The longer lifetimes of the greenhouse gases, those listed below CO in Table 2, result in the accumulation and relatively even distribution of these
gases around the globe. Chlorofluorocarbons (CFCs) and nitrous oxide [10024-97-2]> N2O, are essentially inert in the troposphere and are only destroyed in
the stratosphere by ultraviolet solar radiation. The photolysis products of CFCs are the reactants which are responsible for stratospheric O3 depletion.
To determine the fate of a pollutant after it is released, both monitoring and modeling are available. Monitoring of the criteria pollutants is done
Kirk-Othmer Encyclopedia of Chemical Technology (4th Edition)
367
AIR POLLUTION
Voll
routinely by state and local air pollution agencies in most large urban areas and in some other areas as well. Recommended techniques for measuring criteria
and many other pollutants are available (11). Monitoring is expensive and time consuming, however, and even the most extensive urban networks are
insufficient to assess accurately the geographic distribution of pollutants. Consequently, air pollution models are employed. A microscale model extends
from the emission source to less than 10 km downwind. The Gaussian Plume model is an example. From 10 km to about 100 km downwind, mesoscale or
urban-scale models, which are used to describe the pollutant patterns both within and downwind of urban areas, are applied. From 100 km to about 1000
km, synoptic or regional-scale models are employed. These models are used to estimate pollution patterns in areas the size of the eastern United States.
Above 1000 km, global-scale or general-circulation models, which calculate the distributions of species having long atmospheric residence times such as the
greenhouse gases, are used. The complexity of the model depends on both the scale of the area covered and the number and kinds of transformation
processes which are included (see Atmospheric models).
Receptors. The receptor can be a person, animal, plant, material, or ecosystem. The criteria and hazardous air pollutants were so designated
because, at sufficient concentrations, they can cause adverse health effects to human receptors. Some of the criteria pollutants also cause damage to plant
receptors. An Air Quality Criteria Document (12) exists for each criteria pollutant and these documents summarize the most current literature concerning
the effects of criteria pollutants on human health, animals, vegetation, and materials. The receptors which have generated much concern regarding acid
deposition are certain aquatic and forest ecosystems, and there is also some concern that acid deposition adversely affects some materials.
For visibility-reducing air pollutants, CFCs, and greenhouse gases, the receptor is the atmosphere. Visibility-reducing species alter atmospheric
optical properties and CFCs alter its natural chemical composition in such a way that the atmosphere becomes more transparent to potentially harmful uv
solar radiation. The greenhouse gases alter atmospheric radiative properties and consequently have the potential to alter the global heat budget.
Air Quality Management
In the United States, the framework for air quality management is the Clean Air Act (CAA), which defines two categories of pollutants: criteria and
hazardous. For the criteria pollutants, the CAA requires that EPA establish NAAQS and emissions standards for some large new sources and for motor
vehicles, and gives the primary responsibility for designing and implementing air quality improvement programs to the states. For the hazardous air
pollutants, only emissions standards for some sources are required. The NAAQS apply uniformly across the United States whereas emissions standards for
criteria pollutants depend on the severity of the local air pollution problem and whether an affected source already exists or is proposed. In addition,
individual states have the right to set their own ambient air quality and emissions standards (which must be at least as stringent as the federal standards) for
all pollutants and all sources except motor vehicles. With respect to motor vehicles, the CAA allows the states to choose between two sets of emissions
standards: the Federal standards or the more stringent California ones.
The two levels of NAAQS, primary and secondary, are listed in Table 3. Primary standards were set to protect public health within an adequate
margin of safety; secondary standards, where applicable, were chosen to protect public welfare, including vegetation. According to the CAA, the scientific
bases for the NAAQS are to be reviewed every 5 years so that the NAAQS levels reflect current knowledge. In practice, however, the review cycle takes
considerably longer.
Table 3. National Ambient Air Quality Standards for Criteria Pollutants*
Pollutant Primary Secondary Averaging time
|lg/m3 ppm |lg/m3 ppm
PM10 50 50 annual arithmetic mean
150 150 _ . , b 24-h
so2 80 (0.03) annual arithmetic mean
365 (0-14) 24-hb
1300 (0.50) 3-hb
co (10) 9 8-hb
(Я 35 l-hb
no2 (100) 0.053 (100) 0.053 annual arithmetic mean
Pb 1.5 1.5 maximum quarterly average
°3 (235) 0.12 (235) 0.12 maximum daily 1-h average
Parenthetical value is an approximately equivalent concentration,
not to be exceeded more than once per year.
Not to be exceeded on more than three days in three years
In order to analyze trends in criteria pollutants nationwide, the U.S. EPA has established three types of monitoring systems comprised of 274 sites.
The first is a network of 98 National Air Monitoring Sites (NAMS), located in areas having high pollutant concentrations and high population exposures.
The system was established by regulations promulgated in 1979. In addition, EPA also regularly evaluates data from the State and Local Monitoring System
(SLAMS) and from Specific Purpose Monitors (SPM). To determine if NAAQS are met, states are required to monitor the criteria pollutants'
concentrations in areas that are likely to be near or to exceed the standards. If an area exceeds a NAAQS for a given pollutant, it is designated as a
nonattainment area for that pollutant, and the state is required to establish a State Implementation Plan (SIP).
The SIP is a strategy designed to achieve emissions reductions sufficient to meet the NAAQS within a deadline that is determined by the seventy of
the local pollution problem. Areas that receive long (six years or more) deadlines must show continuous progress by reducing emissions by a specified
percentage each year. For SO2 and NO2, the initial SIPs were very successful in achieving the NAAQS. For other criteria pollutants, particularly O3 and to a
lesser extent CO, however, many areas are starting a third round of SIP preparations with tittle hope of meeting the NAAQS in the near future. If a state
misses an attainment deadline, fails to revise an inadequate SIP, or fails to implement SIP requirements, EPA has the authority to enforce sanctions such as
banning construction of new stationary sources and withholding federal grants for highways.
In nonattainment areas, the degree of control on small sources is left to the discretion of the state and is largely determined by the degree of
required emissions reductions. Large existing sources must be retrofitted with reasonable available control technology (RACT) to minimize emissions. All
large new sources and existing sources that undergo major modifications must meet EPA's new source performance standards at a minimum. Additionally,
in nonattainment areas, they must be designed using lowest achievable emission rate (LAER) technology, and emissions offsets must be obtained. Offsets
require that emissions from existing sources within the area be reduced below legally allowable levels so that the amount of the reduction is greater than or
equal to the emissions expected from the new source. RACT usually is less stringent than LAER: it may not be feasible to retrofit certain sources using the
LAER technology.
In attainment areas, new large facilities must be designed to incorporate the best available control technology (BACT). Generally, BACT is more
stringent than RACT and equal to or less stringent than LAER. In addition, there are also rules that specify how much deterioration in baseline air quality a
new facility can cause. In no situation can the facility cause a new violation in the NAAQS.
Large sources of SO2 and NO may also require additional emission reductions because of the 1990 Clean Air Act Amendments. To reduce acid
Kirk-Othmer Encyclopedia of Chemical Technology (4th Edition)
368
AIR POLLUTION
Voll
deposition, the amendments require that nationwide emissions of SO2 and XO. be reduced on an annual basis by approximately 10 million and 2 million
tons, respectively, by the year 2000.
Once a substance is designated by EPA as a hazardous air pollutant (HAP), EPA has to promulgate a NESHAP (National Emission Standard for
Hazardous Air Pollutants), designed to protect public health with an ample margin of safety.
Air Pollution Issues
Photochemical Smog. Photochemical smog is a complex mixture of constituents formed when VOCs and XO are irradiated by sunlight.
O3, the most abundant species formed in photochemical smog, is the primary concern. Extensive studies have shown that O3 is both a lung irritant and a
phytotoxin. It is responsible for crop damage and is suspected of being a contributor to forest decline in Europe and in parts of the United States. There
are, however, a multitude of other photochemical smog species that also have significant environmental consequences. The most important of these
pollutants are particles, hydrogen peroxide (qv) [7722-84-1H2O2, peroxyacetyl nitrate [2278-22-0[, PAN, C2H3NO5 aldehydes, and nitric acid (qv)
[7697-57-2], HNO3.
Photochemical smog is a summertime phenomenon for most parts of the United States. In the warmer parts of the country, especially in Southern
California, the smog season begins earlier and lasts into the fall. Despite almost two decades of reducing VOC emissions from stationary and mobile
sources and NO emissions from mobile sources, litde or no progress has been made in reducing the number of areas in the United States designated as
nonattainment for O3. For the 1985—1987 period, there were 64 O3-nonattainment areas, mosdy urban, in the United States. This number increased to 101
areas after the anomalously hot summer of 1988, but then decreased to 96 areas in 1989. An area is classified nonattainment if the O3 design value exceeds
0.12 ppm. The design value is equal to the 4th highest maximum daily 1-h O3 concentration within a 3-yr period. For most of the nonattainment areas, this
value falls between 0.13 to 0.16 ppm. The three areas having the highest design values for the 1987—1989 period were the Los Angeles (0.33 ppm),
Houston (0.22), and New York (0.20) metropolitan areas.
There is a significant clean air background O3 concentration, measured at pristine areas of the globe, that varies according to the season and latitude.
This concentration consists of natural sources of O3, but it undoubtedly contains some anthropogenic contribution because it may have increased since the
last century (13). In the summertime in the United States, the average O3 background is about 0.04 ppm (14). Background O3 has four sources: intrusions
of Oyrich stratospheric air, in situ O3 production from methane oxidation, the photooxidation of naturally-emitted VOCs from vegetation, and the
long-range transport of O3 formed from the photooxidation of anthropogenic VOCs and NO emissions. Although there are several mechanisms which
transport Oyrich air from the stratosphere into the lower troposphere, the most important appears to be associated with large-scale eddy transport that
occurs in the vicinity of upper air troughs of low pressure associated with the jet stream (15). This is an intermittent mechanism, so the contribution of
stratospheric to surface O3 has a considerable temporal variation and on very rare occasions, has produced brief ground level concentrations exceeding 0.12
ppm (16). Three other mechanisms are described below.
In the presence of sunlight, hv, NO2 photolyzes and produces O3
no2 + ^^no + o
(1)
O + O2+M^O3 + M
(1)
NO + O3 NO2 + O2
(3)
where M is any third body molecule (most likely N2 or O2 in the atmosphere) that remains unchanged in the reaction. This process produces a steady-state
concentration of O3 that is a function of the initial concentrations of NO and NO2, the solar intensity, and the temperature. Although these reactions are
extremely important in the atmosphere, the steady-state O3 produced is much lower than the observed concentrations, even in clean air. In order for ozone
to accumulate, there must be a mechanism that converts NO to NO2 without consuming a molecule of O3, as does reaction 3. Reactions involving
hydroxyl radicals and hydrocarbons or VOC constitute such a mechanism. In clean air OH may be generated by
O3 + hv O2 + O^D)
(3)
O(1D) +H2O -2011
(5)
where O(1D) is an excited form of an О atom that is produced from a photon at a wavelength between 280 and 310 nm. This seed OH can then produce
the following chain reactions:
OH+ CH4 ^H2O + CH3
(6)
CH3 + O2 + M CH3O2 + M
0
CH3O2 + NO CH3O + NO2
(8)
The NO2 can then photolyze producing O3 (eqs.l and 2) and the CH3O radical continues to react:
CH3O + O2 HCHO + HO2
(9)
The HO2 radical also forms more NOy
HO2 +NO NO2 + OH
(10)
resulting in more O3. In addition, OH is regenerated to begin the cycle again. Further, the formaldehyde photodissociates:
HCHO + hv ------> a H2 + CO
(11)
Kirk-Othmer Encyclopedia of Chemical Technology (4th Edition)
369
AIR POLLUTION
Voll
--->b HCO + H
(12)
HCO O, • HO2 + co
(13)
110,- HO2
(14)
and the HO2 from both equations 13 and 14 can form additional NO2. Moreover, CO can be oxidized:
CO + OH^CO2 + H
(15)
and the H radical can form another NO2 (eqs. 14 and 10). Thus the oxidation of one CH4 molecule is capable of producing three O3 molecules and two
OH radicals. Although this chain reaction is less than 100% efficient, on the average, the chain results in a net production of O3 and OH. Two examples of
competing chain-terminating reactions are
HO2 +HO2 H2O2 + 02
(16)
OH + NO2 HNO3
(17)
In a polluted or urban atmosphere, O3 formation by the CH4 oxidation mechanism is overshadowed by the oxidation of other VOCs. Seed OH can be
produced from reactions 4 and 5, but the photodisassociation of carbonyls and nitrous acid [7782-77-6]> HNO2, (formed from the reaction of OH + NO
and other reactions) are also important sources of OH in polluted environments. An imperfect, but useful, measure of the rate of O3 formation by VOC
oxidation is the rate of the initial OH-VOC reaction, shown in Table 4 relative to the OH-CH4 rate for some commonly occurring VOCs. Also given are
the median VOC concentrations. Shown for comparison are the relative reaction rates for two VOC species that are emitted by vegetation: isoprene and
CC-pinene. In general, internally bonded olefins are the most reactive, followed in decreasing order by terminally bonded olefins, multialkyl aromatics,
monoalkyl aromatics, C5 and higher paraffins, C2~C4 paraffins, benzene, acetylene, and ethane.
Table 4. Median Concentration of the Ten Most Abundant Ambient Air Hydrocarbons in 39 U.S. Cities and Their Reactivity with Hydroxyl
Radical
Compound CAS Registry Number Median concentration ppb C Reactivity with OHb,C
isopentane [78-78^] 45.3 494
^-butane [106-97-8] 40.3 351
toluene [108-88-3] 33.8 831
propane [74-98-6] 23.5 143
ethane [74-84-0] 23.3 36
^-pentane [109-66-0] 22.0 480
ethylene [74-85-1] 21.4 1013
m- xylene [108-38-3] 18.1d 3117
^-xylene [106^12-3] 18.1d 1818
2-methylpentane [107-83-5] 14.9
isobutane [75-28-5] 14.8 325
Biogenic species
CC-pinene [80-56-8] 7792
isoprene [78-79-5J 12078
aRef. 17.
b Ref. 18.
C Relative to reaction of CH4 + OH at 298°C.
Combined xylene [1330-20-7] concentration.
The reaction mechanisms by which the VOCs are oxidized are analogous to, but much more complex than, the CH4 oxidation mechanism. The
fastest reacting species are the natural VOCs emitted from vegetation. However, natural VOCs also react rapidly with O3, and whether they are a net source
or sink is determined by the natural VOC to NO ratio and the sunlight intensity. At high VOC NO ratios, there is insufficient NO2 formed to offset the
O3 loss. However, when O3 reacts with the internally bonded olefinic compounds, carbonyls are formed and, the greater the sunshine, the better the
chance the carbonyls will photolyze and produce OH which initiates the Oyforming chain reactions.
Once the sun sets, O3 formation ceases and, in an urban area, ozone is rapidly scavenged by freshly emitted NO (eq. 3). On a typical summer night,
however, a nocturnal inversion begins to form around sunset, usually below a few hundred meters and consequendy, the surface-based NO emissions are
trapped below the top of the inversion. Above the inversion to the top of the mixed layer (usually about 1500 m), O3 is depleted at a much slower rate. The
next morning, the inversion dissipates and the O3-rich air aloft is mixed down into the Oydepleted air near the surface. This process, in combination with
the onset of photochemistry as the sun rises, produces the sharp increase in surface O3 shown in Figure 1. As shown, the overnight O3 depletion is less in
the more rural areas than in a large urban area such as New York City. This is a result of the lower overnight levels of NO in rural areas. Even in the
absence of NO or other O3 scavengers (olefins, for example), O3 decreases at night near the ground faster than aloft because of its destruction at any
surface, ie, the ground, buildings, trees. At the remote mountaintop sites, Whiteface and Utsayantha, there is no overnight decrease in O3 concentrations.
Kirk-Othmer Encyclopedia of Chemical Technology (4th Edition)
370
AIR POLLUTION
Voll
Fig. 1. Average hourly ozone concentrations during August 1, 1973 to August 17, 1973 for selected sites in New York State; site designations are: ••••
Kingston;------------------------Rensselaer; — Glens Falls; — New York City; • • • Mt. Utsayantha; —®- Whiteface Mountain (19).
Courtesy of Air and Waste Management Association.
Although photochemical smog is a complex mixture of many primary and secondary pollutants and involves a myriad of atmospheric reactions,
there are characteristic pollutant concentration versus time profiles that are generally observed within and downwind of an urban area during a
photochemical smog episode. In particular, the highest O3 concentrations are generally found 10—100 km downwind of the urban emissions areas, unless
the air is completely stagnant. This fact, in conjunction with the long lifetime of O3 in the absence of high concentrations of NO, means that O3 is a
regional air pollution problem. In the Los Angeles basin, high concentrations of O3 are transported throughout the basin and multiday episodes are
exacerbated by the accumulation of O3 aloft which is then mixed to the surface daily. On the east coast, a typical O3 episode is associated with a high
pressure system anchored offshore producing a southwesterly flow across the region. As a result, emissions from Washington, D.C. travel and mix with
emissions from Baltimore and over a period of a few days continue traveling northeastward through Philadelphia, New York City, and Boston. Under
these conditions, the highest O3 concentrations typically occur in central Connecticut (20).
It is obvious that in order to reduce O3 in a polluted atmosphere, reductions in the VOC and NO precursors are required. However, the choice of
whether to control VOC or NO or both depends on the local VOC NO ratio. At low VOC NO ratios, O3 formation is suppressed through equations
3 and 17. Consequendy, in this case reducing NO emissions, emitted mainly as NO, reduces the amount of O3 (eq. 3) and OH (eq. 17) scavenged,
increasing the O3 concentrations. This is illustrated in the Oyisopleth diagrams in Figure 2. Although the four chemical mechanisms used to obtain Figure
2 give somewhat different results, the shape of the isopleths are quite similar and the key features are summarized in Figure 3. The region in the upper left
is the NO -inhibition region where a decrease in NO alone results in an increase in O3, but a decrease in VOC decreases O3. The region at the bottom
right is the hydrocarbon, HC, or VOC saturation region where reducing VOCs has no effect on the O3 level. Here, a reduction in NO results in lower O3.
In the middle is the knee region, where reductions in either NO or VOC reduce O3. The upper boundary of this region varies from day to day and from
place to place as its location is a function of the reactivity of the VOC mix and the sunlight intensity.
Fig. 2. Examples of ozone isopleths generated using four different chemical mechanisms (a) EPA; (b) FSM; (c) CBII; (d) ELSTAR; NMOC = nonmethane
organic compounds (21).
Courtesy of Pergamon Press.
Kirk-Othmer Encyclopedia of Chemical Technology (4th Edition)
371
AIR POLLUTION
Voll
Fig. 3. Typical O3 isopleth diagram showing the three chemical regimes; HC = hydrocarbons (22).
Courtesy of Pergamon Press.
As a guideline, VOC controls are generally the most efficient way to reduce O3 in areas having a median 6 AM. to 9 AM. VOC XO ratio of 10:1 or
less; whereas areas with a higher ratio may need to consider XO reductions as well (23). The 1990 Clean Air Act Amendments require that O3
nonattainment areas reduce both VOC and XO from major stationary sources unless the air quaEty benefits are greater in the absence of XO reductions.
Large cities in the northeast tend to have ratios <10 : 1; cities in the south (Texas and eastward) tend to have ratios >10 : 1. Determining a workable
control strategy is further compEcated by the transport issue. For example, on high O3 days in the northeast, the upwind air entering Philadelphia and New
York City frequendy contains O3 already near or over the NAAQS as a result of emissions from areas to the west and south (24). Consequendy, control
strategies must be developed on a coordinated, multistate regional basis.
Because of the mixture of VOCs in the atmosphere, the composition of smog reaction products and intermediates is extremely complex. H2O2,
formed via reaction 16, is important because when dissolved in cloud droplets it is an important oxidant, responsible for oxidizing SO2 to sulfuric acid
[7664-93-9], H2SO4, the primary cause of acid precipitation. The oxidation of many VOCs produces acetyl radicals, CH3CO, which can react with O2 to
produce peroxyacetyl radicals, CH3(CO)O2, which react with NO2
CH3(CO) O2 + NO2 CH3C(O) O2NO2(PAN)
(18)
At high enough concentrations, PAN is a potent eye irritant and phytotoxin. On a smoggy day in the Los Angeles area, PAN concentrations are typically 5
to 10 ppb; in the rest of the United States PAN concentrations are generally a fraction of a ppb. An important formation route for formaldehyde [50-00-0],
HCHO, is reaction 9. However, ozonolysis of olefinic compounds and some other reactions of VOCs can produce HCHO and other aldehydes.
Aldehydes are important because they are temporary reservoirs of free radicals (see eqs. 11 and 12). HCHO is a known carcinogen. Nitric acid is formed by
OH attack on NO2 and by a dark-phase series of reactions initiated by O3 + NO2. Nitric acid is important because it is the second most abundant acid in
precipitation. In addition, in southern California it is the major cause of acid fog.
Particles are the major cause of the haze and the brown color that is often associated with smog. The three most important types of particles
produced in smog are composed of organics, sulfates, and nitrates. Organic particles are formed when large VOC molecules, especially aromatics and cycEc
alkenes, react with each other and form condensable products. Sulfate particles are formed by a series of reactions initiated by the attack of OH on SO2 in
the gas phase or by Equid-phase reactions. Nitrate particles are formed by
HNO3(g) +NH3(g) ^NH4NO3(s)
(19)
or by the reactions of HNO3 with NaCl or alkaline soil dust.
Volatile Organic Compounds (VOC). VOCs include any organic-carbon compound that exists in the gaseous state in the ambient air. (In
some of the older Eterature the term VOC is used interchangeably with NMHC. VOC sources may be any process or activity utilizing organic solvents,
coatings, or fuel. Emissions of VOCs are important: some are toxic by themselves, and most are precursors of O3 and other species associated with
photochemical smog. As a result of control measures designed to reduce O3, VOC emissions are declining in the United States. Between 1980 and 1989,
nationwide VOC emissions declined 19% (4). Trends in ambient VOC concentrations cannot be determined, however, because of the lack of
measurements.
Nitrogen Oxides (NOX). Most of the NO is emitted as NO, which is then oxidized to NO2 in the atmosphere (see eqs. 3 and 8). AH
combustion processes (see Combustion science and technology) are sources of NO . At the high temperatures generated during combustion, some N2 is
converted to NO in the presence of O2 and, in general, the higher the combustion temperature, the more NO produced. NO2 is one of the criteria
poEutants as weH as a precursor to O3, so it was the target of successful U.S. emissions reduction strategies in the 1970s and 1980s. As a result, in 1987, aH
areas of the United States, excepting the Los Angeles/Long Beach area, were in compEance with the NAAQS for NO2. From 1980 to 1989 nationwide
NO emissions and ambient concentrations declined 5% (4).
However, NO remains an important issue throughout the United States. In addition to being an essential ingredient of photochemical smog and a
precursor to HNO3, itself an ingredient of acid precipitation and fog, NO2 is the only important gaseous species in the atmosphere that absorbs visible
light. In high enough concentrations it can contribute to a brownish discoloration of the atmosphere.
Sulfur Oxides (SOx). The combustion of sulfur-containing fossil fuels, especiaHy coal, is the major source of SO. Between 97 and 99% of the
SO emitted from combustion sources is in the form of SO2, a criteria poEutant. The remainder is mosdy sulfur trioxide [7446-11 -9], SO3, which in the
presence of atmospheric water [7732-18-5] vapor is immediately transformed into H2SO4, a Equid particulate. Both SO2 and H2SO4 at sufficient
concentrations produce deleterious effects on the respiratory system. In addition, SO2 is a phytotoxin. As with NO2, control strategies designed to reduce
the ambient levels of SO2 have been highly successful. In the 1960s, most industrialized urban areas in the eastern United States had an SO2 air quaEty
problem. By 1987 only Pittsburgh, Pa., and Steubenvflle, Ohio, exceeded the 24-h SO2 NAAQS, and only Steubenvflle exceeded the annual NAAQS. Over
the past ten years, nationwide emissions declined 10% and ambient concentrations decreased 24% (4). However, the 1990 Clean Air Act Amendments
require additional SO2 reductions because of the role that SO2 plays in acid deposition. In addition, there is some concern over the health effects of H2SO4
particles, which are emitted direcdy from some sources as weH as being formed in the atmosphere (25).
Kirk-Othmer Encyclopedia of Chemical Technology (4th Edition)
372
AIR POLLUTION
Voll
Carbon Monoxide (CO). Carbon monoxide (qv) is emitted during any combustion process. Transportation sources account for about
two-thirds of the CO emissions nationally, but, in certain areas, most of the CO comes from woodbuming fireplaces and stoves. CO is absorbed through
the lungs into the blood stream and reacts with hemoglobin [9034-51-9] to form carboxyhemoglobin, which reduces the oxygen carrying capacity of the
blood.
Emissions of CO in the United States peaked in the late 1960s, but have decreased consistendy since that time as transportation sector emissions
significantly decreased. Between 1968 and 1983, CO emissions from new passenger cars were reduced by 96% (see Exhaust control, automotive). This has
been partially offset by an increase in the number of vehicle-miles traveled annually. Even so, there has been a steady decline in the CO concentrations
across the United States and the decline is expected to continue until the late 1990s without the implementation of any additional emissions-reduction
measures. In 1989, there were still 41 U.S. urban areas that exceeded the CO NAAQS on one or more days per year, but the number of exceedances
declined by about 80% from 1980 to 1989. Over the same time period, nationwide CO emissions decreased 23%, and ambient concentrations declined by
25% (4).
Particulate Matter. In the air pollution field, the terms particulate matter, particulates, particles, and aerosols (qv) are used interchangeably and
all refer to finely divided solids and Equids dispersed in the air. The original EPA primary standards were for total suspended particulates, TSP, the weight
of any particulate matter collected on the filter of a high volume air sampler. On the average, these samplers collect particles that are less than about 30—40
pm in diameter, but collection efficiencies vary according to both wind direction and speed. In 1987, the term PM10, particulate matter having an
aerodynamic diameter of 10 pm or less, was introduced. The 10-pm diameter was chosen because 50% of the 10-pm particles deposit in the respiratory
tract below the larynx during oral breathing and the fraction deposited decreases as particle diameter increases above 10 pm. Because the NAAQS standard
(see Table 3) was only enacted in 1987, currendy available PM10 data are insufficient to determine trends. However, from 1979 to 1988 TSP emissions
declined 22% and ambient concentrations decreased 20% (4).
Atmospheric aerosols can be classified into three size modes: nuclei, accumulation, and large or coarse-particle modes. Characteristics are given in
Figure 4. The bulk of the aerosol mass usually occurs in the 0.1- to 10-pm size range which encompasses most of the accumulation mode and part of the
large-particle mode. The nuclei mode is transient as nuclei, formed by combustion, nucleation, and chemical reactions, coagulate and grow into the
accumulation mode. Particles in the accumulation mode are relatively stable because they exceed the size range where coagulation is important, and they are
too small to have appreciable deposition velocities. Consequendy, particles "accumulate" in this mode. Particles larger than about 2.5 pm begin to have
appreciable deposition velocities, so their lifetimes in the atmosphere decrease significandy as particle size increases. The sources of large particles are
mosdy mechanical processes.
Parameter
Transient nuclei
Accumulation
mode
size, дгп 0.001
_____________L_
sources
fate
atmospheric
lifetime
0.01
_-L
combustion
nucleation
chemical reactions
rapidly coagulate
and grow into the
accumulation mode
less than 1 hour
0.1 1.0
J________________I—
haze
reduces visibility
H------------->4
contains bulk of
aerosol mass
*------PMio
combustion
condensation
coagulation
chemical reactions
stable for days
days
Large particles
________I__________________
10 100
________I_______________L_
I
I
I
I
i
=2
mechanical processes
wind blown dust
sea spray
buffalo effect
I
deposit
I
I
hours | minutes
I
Fig. 4. Some important aerosol characteristics. Data modified from Reference 26 which was adopted in part from Reference 27.
Figure 5 shows the mass size distribution of typical ambient aerosols. Note the mass peaks in the accumulation mode and between 5 and 10 pm.
The minimum in the curves at about 1—2.5 pm results from a lack of sources for these particles. Coagulation is not significant for the accumulation-mode
particles, and particles produced by mechanical process are larger than 2.5 pm. Consequendy, particles less than about 2.5 pm have different sources from
particles greater than 2.5 pm and it is convenient to classify PM10 into a coarse-particulate-mass mode (CPM, dia >2.5-10 pm) and a fine-particulate-mass
mode (FPM, dia <2.5 pm). By knowing the relative amounts of CPM and FPM as well as the chemical composition of the major species, information on
the PM10 sources can be deduced. In urban areas the CPM and FPM are usually comparable in mass; in rural areas the FPM is generally lower than in urban
areas, but higher than the CPM mass. A significant fraction of the rural FPM is generally transported from upwind sources, whereas most of the CPM is
generated locally.
Mass
concentration
0.01
Fig. 5. Size distributions of atmospheric particles in (—) urban, (------) rural, and (-----) remote background areas.
Kirk-Othmer Encyclopedia of Chemical Technology (4th Edition)
373
AIR POLLUTION
Voll
Chemical composition data for CPM and FPM for a variety of locations are summarized in Table 5. These data illustrate several important points.
First, the distributions of the PM1Q between CPM and FPM vary from about 0.4 to 0.7. Second, the ratio of PM1Q to TSP varies from 0.58 to 0.79. In
general, both this ratio and the ratio of FPM to PM1Q tend to be higher at rural sites, but Bermuda, because of the large influence of sea salt in the CPM, is
an exception. Sulfate (SO^- ), carbon (as organic carbon, ОС, and elemental carbon, EC), and nitrate (NO3 ) compounds generally account for 70—80% of
the FPM. In the eastern United States, SO^- compounds are the dominant species, although very litde SO^- is emitted direcdy into the atmosphere. Thus
most of the sulfate is a secondary aerosol formed from the oxidation of SO2, and in the eastern United States coal-burning emissions are the source of
most of the SO2.
Table 5. Summary of Detailed Particulate Measurements at Urban and Rural Locations
Species Urban Rural
Denver, Colo. Detroit, Mich. Long Beach, Calif. Claremont, Calif. Jacksonville, Fla. Blue Ridge Mts, Va. Lewes, Del. Bermuda
Concentrations pg/ m3
PM10 52.9a 79.1 59.7 38.8 32.5 22.0 20.8
FPM 39.5 25.1 57.8 36.0 22.6 23.9 15.9 9.4
CPM 50.9b 27.8 23.1 22.9 16.2 8.6 6.1 11.4
FPM/PM10 0.48a 0.73 0.60 0.58 0.74a 0.72 0.45
TSP 104.4 90.5 43.7 27.9 32.8
PM10/TSP 0.58a 0.74 0.79 0.63
Concentration as percentage of FPM
sulfate compounds 14 53 7 22 41 55 50 25
nitrate compounds 20 <1 33 28 3 <1 2
organic compounds 22 27 29 29 13 24 30 15
elemental carbon 15 4 12 5 6 5 6 <1
Concentration as percentage of CPM
crustal species 91 73 85 48 17
sea salt 43 57
References
28 29,30 31 31 32 33 34 35
a PM1Q in Detroit and Blue Ridge Mts is PM15 which is = to PM 10.
b CPM in Denver is dia > 2.5 //111 to about 30 pm.
In the atmosphere, the principal SO2 oxidation routes include homogeneous oxidation by OH, and the heterogeneous oxidation in water droplets
by H2O2, O3, or, in the presence of a catalyst, O2. Atmospheric particles which have been identified as catalysts include many metal oxides and soot. The
water droplets include cloud and dew droplets as well as aerosols which contain sufficient water: under high relative-humidity conditions, hygroscopic salts
deliquesce, and form Equid aerosols. Sulfuric acid is the initial SO2 oxidation product. This rapidly reacts with any available ammonia [7664-41 -7f NH3 to
form ammonium bisulfate [7803-63-6[\ NH4HSO4. If sufficient NH3 is present, the final product is ammonium sulfate [7783-20-2]^ (NH4)2SO4. In some
urban areas in the western United States, NO3 is more abundant than SO 4 . The NO3 in the FPM exists primarily as ammonium nitrate [6484-52-2]
NH4NO3, (see eq. 19). However, acidic SO4- (H2SO4 or NH^SO^ readily reacts with NH4NO3 and abstracts the NH3, leaving behind gaseous HNO3.
Consequendy, unless there is sufficient NH3 to completely convert all of the SO^- to (NH4)2SO4, NH4NO3 does not accumulate in the atmosphere. The
western U.S. cities shown in Table 5 have sufficient NH3, largely because of the presence of animal feedlots, and NH4NO3 accumulates. In the eastern
United States, there is generally insufficient NH3.
Organic compounds are a major constituent of the FPM at all sites. The major sources of ОС are combustion and atmospheric reactions involving
gaseous VOCs. As is the case with VOCs, there are hundreds of different ОС compounds in the atmosphere. A minor but ubiquitous aerosol constituent
is elemental carbon. EC is the nonorganic, black constituent of soot. Combustion and pyrolysis are the only processes that produce EC, and diesel engines
and wood burning are the most significant sources.
Crustal dust and water make up most of the remaining FPM mass. Crustal dust is composed of aerosolized soil and rock from the earth's crust.
Although this is natural material, human activities (traffic, which produces the buffalo effect by entraining street dust, construction activities, agricultural
and land-use practices, etc) affect the rate at which crustal material is aerosolized. Since it is aerosolized by frictional processes, the diameter of most of the
crustal dust is >2.5 pm. and typically accounts for most of the CPM and particles >10 pm. In global average crustal material, the major elements contained
in decreasing order are O, Si, Al, Fe, Ca, Na, K, and Mg. On the average, Si accounts for 20% of the crustal aerosol mass (36). Consequendy, the crustal
mass can be estimated from Si measurements alone. However, the relative amounts of the elements do vary spatially.
Lead. Lead (qv) is of concern because of its tendency to be retained by living organisms. When excessive amounts accumulate in humans, lead
can inhibit the formation of hemoglobin and produce life-threatening lead poisoning. In smaller doses, lead is also suspected of causing learning disabilities
in children. From 1980 to 1989, nationwide Pb emissions decreased 90%. The primary source, transportation, showed a 96% reduction (4) as a direct result
of the removal of lead compounds (qv) such as tetraethyllead [78-00-2] (C2H5)4Pb from fuels, primarily gasoline. Trends of Pb in the ambient air have
responded to the emissions reductions. In 1989 only a few isolated monitoring sites that were dominated by industrial sources experienced violations of the
NAAQS (4).
Air Toxics. There are thousands of commercial chemicals used in the United States. Hundreds are emitted into the atmosphere and have some
potential to adversely affect human health at certain concentrations; some are known or suspected carcinogens. Identifying all of these substances and
promulgating emissions standards is beyond the present capabilities of existing air quahty management programs. Consequendy, toxic ah poEutants (TAPs)
need to be prioritized based on risk analysis, so that those posing the greatest threats to health can be regulated. Although the criteria pollutants were so
designated because they can have significant pubEc-health impacts, these materials are not considered TAPs because they are regulated elsewhere in the
CAA. A distinguishing feature between TAPs and criteria pollutants is that criteria pollutants are considered to be national problems whereas TAPs are
most often localized near the source of the TAP emissions.
There are three types of TAP emissions: continuous, intermittent, and accidental. Both routine emissions associated with a batch process or a
continuous process that is operated only occasionally can be intermittent sources. A dramatic example of an accidental emission was the release of methyl
isocyanate [624-83-9] in Bhopal, India. As a result of this accident, the U.S. Congress created Tide III, a free-standing statute included in the Superfund
Amendments and Reauthorization Act (SARA) of 1986. Tide III provides a mechanism by which the pubEc can be informed of the existence, quantities,
and releases of toxic substances, and requires the states to develop plans to respond to accidental releases of these substances. Further, it requires anyone
releasing specific toxic chemicals above a certain threshold amount to annually submit a toxic chemical release form to EPA. At present, there are 308
specific chemicals subject to Tide III regulation (37).
Lists of workplace ah standards for over 700 substances, many of which would be considered a TAP if present in sufficient quantity in the ambient
Kirk-Othmer Encyclopedia of Chemical Technology (4th Edition)
374
AIR POLLUTION
Voll
air, are available (38). Toxicological data for these substances can be found in reference 39.
The 1970 Clean Air Act required that EPA provide an ample margin of safety to protect against hazardous air pollutants by establishing national
emissions standards for certain sources. From 1970 to 1990, over 50 chemicals were considered for designation as HAPs, but EPA's review process was
completed for only 28 chemicals. NESHAPs have been promulgated for only eight substances: beryllium [7440-41 -7]> mercury [7439-97-6]) vinyl chloride
[75-01 -4]> asbestos [1332-21 -4]benzene [71 -43-2]> radionuclides, inorganic arsenic [7440-38-2]., and coke-oven emissions (40). However, in the 1990 Clean
Air Act Amendments, 189 substances are listed (Table 6) that EPA must regulate by enforcing maximum achievable control technology (MACT). The
Amendments mandate that EPA issue MA CT standards for all sources of the 189 substances by the year 2000. In addition, EPA must determine the risk
remaining after MA CT is in place and develop health-based standards that would limit the cancer risk to one case in one million exposures. EPA may add
or delete substances from this list.
Table 6. Substances Listed as Hazardous Air Pollutants as Defined by the 1990 Clean Air Act Amendments
Substance CAS Registry Number Substance CAS Registry Number
acetaldehyde [75-07-0] hydrazine [302-01-2]
acetamide [60-35-5] hydrochloric acid [7647-01-0]
acetonitrile [75-05-8] hydrogen fluoride [7664-39-3]
acetophenone [98-86-2] hydro quinone [123-31-9]
2-acetylaminofluorene [53-96-3] isophorone [78-59-1]
acrolein [107-02-8] lindane (all isomers) [58-89-9]
acrylamide [79-06-1] maleic anhydride [108-31-6]
acrylic acid [79-10-7] methanol [67-56-1]
acrylonitrile [107-13-1] methoxychlor [7243-5]
allyl chloride [107-05-1] methyl bromide [74-83-9]
4- aminobiphenyl [92-67-1] methyl chloride [74-87-3]
aniline [62-53-3] methyl chloroform [71-55-6]
<9-anisidine [90-04-0] methyl ethyl ketone [78-93-3]
asbestos [1332-214] methyl hydrazine [60-344]
benzene [7143-2] methyl iodide [74-884]
benzidine [92-87-5] methyl isobutyl ketone [108-10-1]
b enz о trichlo ride [98-07-7] methyl isocyanate [624-83-9]
benzyl chloride [10044-7] methyl methacrylate [80-62-6]
biphenyl [92-524] methyl /^butyl ether [1634-044]
bis (2-ethylhexyl) phthalate [117-81-7] 4,4,-methylene bis(2-chloroaniline) [101-144]
bis (chloromethyl) ether [542-88-1] methylene chloride [75-09-2]
bromoform [72-25-2] methylene diphenyl diisocyanate [101-68-8]
1,3-butadiene [106-99-0] 4,4,-methylenedianiline [101-77-9]
calcium cyanamide [156-62-7] naphthalene [91-20-3]
caprolactam [105-60-2] nitrobenzene [98-95-3]
captan [133-06-2] 4-nitrobiphenyl [92-93-3]
carbaryl [63-25-2] 4-nitrophenol [100-02-7]
carbon disulfide [75-15-0] 2-nitroprop ane [7946-9]
carbon tetrachloride [56-23-5] N-nitro s o-N-methylurea [684-93-5]
carbonyl sulfide [463-58-1] IV-nitros о dimethylamine [62-75-9]
catechol [120-80-9] IV-nitro s omorpholine [59-89-2]
chloramben [133-904] parathion [56-38-2]
chlordane [57-74-9] pentachloronitrobenzene [82-68-8]
chlorine [7782-50-5] pentachlorophenol [87-86-5]
chloroacetic acid [79-11-8] phenol [108-95-2]
2-chloroacetophenone [532-274] ^-phenylenediamine [106-50-3]
chlorobenzene [108-90-7] phosgene [7544-5]
chlorobenzilate [510-15-6] phosphine [7803-51-2]
chloroform [67-66-3] phosphorus [7723-14-0]
chloromethyl methyl ether [107-30-2] phthalic anhydride [8544-9]
chloroprene [126-99-8] polychlorinated biphenyls [1336-36-3]
cresylic acid [1319-77-3] 1,3-propane sultone [1120-714]
<9-cresol [9548-7] P-propiolactone [57-57-8]
w-cresol [108-394] propionaldehyde [123-38-6]
^-cresol [10644-5] propoxur (Baygon) [114-26-1]
cumene [98-82-8] propylene dichloride [78-87-5]
2,4-D, salts and esters [94-75-7] propylene oxide [75-56-9]
DDE [3547-044] 1,2-propylenimine [75-55-8]
diazomethane [334-88-3] quinoline [91-22-5]
dibenzofurans [132-64-9] quinone [106-514]
l,2-dibromo-3-chloropropane [96-12-8] styrene [10042-5]
dibutylphthalate [84-74-2] styrene oxide [96-09-3]
l,4-dichlorobenzene(p) [10646-7] 2,3,7,8-tetrachlorodibenzo-^-dioxin [1746-01-6]
3,3-dichlorobenzidene [91-94-1] 1,1,2,2-tetrachloroethane [79-34-5]
dichloroethyl ether [111444] tetrachloroethylene [127-184]
1,3-dichloropropene [542-75-6] titanium tetrachloride [755045-0]
dichlorvos [62-73-7] toluene [108-88-3]
diethanolamine [11142-2] 2,4-toluenediamine [95-80-7]
N,N- diethylaniline [121-69-7] 2,4-toluene diisocyanate [584-84-9]
diethyl sulfate [64-67-5] <9-toluidine [95-534]
3,3 - dimetho xyb enzidine [119-904] toxaphene [8001-35-2]
dimethylaminoazobenzene [60-11-7] 1,2,4-trichlorobenzene [120-82-1]
3,3dimethylbenzidine [119-93-7] 1,1,2-trichloroethane [79-00-5]
dimethylcarbamoyl chloride [7944-7] trichloroethylene [79-01-6]
dimethylformamide [68-12-2] 2,4,5-trichlorophenol [95-954]
1,1-dimethyl hydrazine [57-14-7] 2,4,6-trichlorophenol [88-06-2]
dimethyl phthalate [131-11-3] trimethylamine [12144-8]
Kirk-Othmer Encyclopedia of Chemical Technology (4th Edition)
375
AIR POLLUTION
Voll
dimethyl sulfate /77-78-1] trifhiralin [1582-09-8]
4,6-dinitro-<9-cresol, and salts [534-52-1] 2,2,4-trimethylpentane [540-84-1]
2,4- dinitrophenol [51-28-5] vinyl acetate [108-054]
2,4-dinitrotoluene [121-14-2] vinyl bromide [593-60-2]
1,4-dioxane [123-91-1] vinyl chloride [75-014]
1,2-diphenylhydrazine [122-66-7] vinyEdene chloride [75-354]
epichlorohydrin [106-89-8] xylenes (isomers and mixture) [1330-20-7]
1,2-epoxybutane [106-88-7] o- xylenes [9547-6]
ethyl acrylate [140-88-5] m- xylenes [108-38-3]
ethyl benzene [100414] ^-xylenes [10642-3]
ethyl carbamate [51-79-6]
ethyl chloride [75-00-3] antimony compounds
ethylene dibromide [106-934] arsenic compounds
ethylene dichloride [107-06-2] beryHium compounds
ethylene glycol [107-21-1] cadmium compounds
ethyleneimine [151-564] chromium compounds
ethylene oxide [75-21-8] cobalt compounds
ethylene thiourea [9645-7] coke oven emissions
ethyEdene dichloride [75-34-3] cyanide compounds
formaldehyde [50-00-0] glycol ethers
heptachlor [7644-8] lead compounds
hexachlorobenzene [118-74-1] manganese compounds
hexachlorobutadiene [87-68-3] mercury compounds
hexachlorocyclopentadiene [77474] fine mineral fibers
hexachloroethane [67-72-1] nickel compounds
hex amethyl-1,6- diis о cyanate [822-06-0] polycycEc organic matter
hexamethylphosphoroamide [680-31-9] radionucEdes (including radon)
hexane [110-54-3/ selenium compounds
Because EPA was so slow in. promulgating standards for HAPs prior to the 1990 Amendments, most states developed and implemented their own
TAP control programs. Such programs, as well as the pollutants they regulate, differ widely from state to state. The ambient standards for a given
substance are usually selected to be some small fraction of the TLV for that substance.
Odors. The 1977 Clean Air Act Amendments directed EPA to study the effects, sources, and control feasibility of odors. Although no federal
legislation has been established to regulate odors, individual states have responded to odor complaints by enforcing common nuisance laws. About 50% of
all citizen air pollution complaints concern odors (see Odormodification). A disagreeable odor is perceived as an indication of air pollution but many
substances can be detected by the human olfactory system at concentrations well below those considered harmful. For example, hydrogen sulfide
[7783-06-4]> H2S, can be detected by most people at 0.0047 ppm, whereas the occupation health 8-h TLV is 10 ppm. Although exposures to such odors in
low concentrations may not in itself cause physical harm, the exposure can lead to nausea, loss of appetite, and other effects.
Odors are characterized by quaEty and intensity. Descriptive qualities such as sour, sweet, pungent, fishy, and spicy are commonly used. Intensity is
determined by how much the concentration of the odoriferous substance exceeds its detection threshold (the concentration at which most people can
detect an odor). Odor intensity is approximately proportional to the logarithm of the concentration. However, several factors affect the ability of an
individual to detect an odor: the sensitivity of a subject's olfactory system, the presence of other masking odors, and olfactory fatigue (ie, reduced olfactory
sensitivity during continued exposure to the odorous substance). In addition, the average person's sensitivity to odor decreases with age.
Visibility. Although there is no NAAQS designed to protect visual air quaEty, the 1977 Clean Air Act Amendments set as a national goal "the
remedying of existing and prevention of future impairment of visibiEty in mandatory Class I Federal areas which impairment results from man-made
pollution." Class I areas are certain national parks and wildernesses that were in existence in 1977. The Amendments also directed EPA to promulgate
appropriate regulations to protect against visibiEty impairment in these areas. In 1981, EPA directed 36 states to amend their State Implementation Plans to
develop control programs for visual impairment that could be traced to particular sources. This type of impairment is caked plume blight, and it was the
initial focus of EPA's effort because it involved easily identifiable sources. The 1990 Clean Air Act Amendments direct EPA to promulgate appropriate
regulations to address regional haze in affected Class I areas. EPA has not dealt with a third type of visibiEty impairment, urban-scale haze, because the
source-receptor relationships are extremely complex (41).
VisibiEty or visual range is the maximum distance at which a black object, a target, can be distinguished from the horizon. Under certain viewing
conditions, the apparent contrast (Q between a target and the horizon decreases exponentially with the distance (x) between the target and observer (42)
C = Coe-b^x
(20)
where C is the contrast at x = 0, and b is the extinction coefficient, a proportionaEty constant relating the intensity of light received by an observer from
a target to the intensity of light emitted by the target. The maximum distance, at which an observer can distinguish the target from the horizon occurs
when C = e, where 8 is the observer's contrast threshold. Substituting in equation 20 and rearranging:
In Co - In e
т — ------------------— v
max l
°ext
(21)
where Vis the visibiEty. For a black target, Co = — 1 and experiments have shown that 8 is between 0.02 and 0.05. Using the more sensitive value for 8,
equation 21 reduces to (43)
V = 3.9/feext
(22)
Equation 22 only appEes under ideal conditions, ie, black target against a bright horizon, and a well-iEuminated, homogeneous atmosphere. Actual
conditions, such as a nonblack target, which alters the value of Q, different viewing angles, and different iEumination conditions such as cloud cover and
different sun angles, are not described so simply, but they can have a profound effect on visual range. Nevertheless, is a useful indicator of the inverse
of visual range. It is widely used as an indicator of visual air quaEty. The total extinction can be written as the sum of a number of components:
^ext = ^sp T &r + &ap + bag
(23)
where Z» is the light extinction due to light scattered by particles; % is Rayleigh scattering, the light scattered by air molecules, and is a function of the
atmospheric pressure; b is the light absorbed by particles; and b is the light absorbed by gas molecules.
Rayleigh scattering accounts for only a minor part of the extinction, except on the clearest days. It is a function of atmospheric pressure alone and
Kirk-Othmer Encyclopedia of Chemical Technology (4th Edition)
376
AIR POLLUTION
Voll
does not depend appreciably on the composition of the pollutant gases present. At sea level and 25°C, is equal to 13.2 x 10⁻¹ m — 1 which, in the
absence of particles and absorbing gases, corresponds to a visual range of about 300 km. Light extinction budgets (excluding /»R) for several areas of the
United States are presented in Table 7.
Table 7. Light Extinction Budgets, excluding Z>R, Mean Percentage Contribution
Component Location
Denver „ • b Detroit Blue Ridge Mts.C
b ap 29 8 3
b sp 64 88 97
b ag 7 4
Total 100 100 100
aRef. 44.
b Ref. 30.
C Ref. 33.
In general, visibility limitations are dominated by light scattering from fine particles. The most efficient are those that are the same size (0.4—0.7 |lm)
as the wavelengths of visible light. As shown in Figure 5, a peak in particulate mass distribution occurs in this range, and therefore, these particles almost
always dominate b . Exceptions occur during fog, precipitation, and dust storms. On a per mass basis, the most efficient light-scattering fine particles are
hygroscopic ones. Sulfate, nitrate, and ammonium particles absorb significant amounts of water at moderate to high relative humidities. As the particles
increase in size, they become more efficient light scatterers. Light absorption by particles in the atmosphere results almost exclusively from elemental
carbon which also scatters light. The only common light-absorbing gaseous pollutant is NO2, which usually accounts for a few percent or less of the total
extinction.
There are three scales of visual impairment: plume blight, urban-scale haze, and regional-scale haze. Plume blight occurs when a plume from a large
point source travels into an otherwise clean area and interferes with viewing a particular vista. Such events can occur anywhere, but are usually most
noticeable in the western United States. Plume blight is frequendy associated with sulfate particles from a sulfur dioxide-emitting point source. Most large
urban areas occasionally experience urban haze, but the public perception of the haze is highest in those cities having scenic mountain vistas such as Los
Angeles and Denver. Most of the light extinction in urban haze can be accounted for by particles of sulfates (sulfuric acid and the ammonium salts), nitrate
(as ammonium nitrate), organic carbon, and elemental carbon.
Regional haze, a haze that extends for hundreds of miles, is usually dominated by sulfates. In the Southwest, for example, occasional haze obscures
scenic vistas over large areas. It is attributed to a combination of sulfates from coal-fired power plant and smelter emissions, and transport of urban,
southern California haze composed mainly of carbonaceous particles, nitrates and, to a lesser extent, sulfates from southern California. In the East, a
denser sulfate-dominated haze frequendy extends over much of the area during the summer. In the rural West, mean sulfate concentrations are ~1 /ig/m3,
whereas, in the rural East, they average ^8 /ig/тЗ; also, the relative humidity is generally much higher in the East. The primary source of the eastern haze is
coal-burning emissions. Natural haze, caused mainly by aerosols generated from biogenic VOC emissions from vegetation, was historically cited as the
regional haze in areas such as the Blue Ridge and Smoky Mountain Regions. Except on the cleanest days, however, sulfate haze now dominates natural
haze in these regions (33).
Air pollutants can also cause discolorations of the atmosphere. The most common are brownish discolorations such as the "brown LA haze" and
the "brown clouds" observed in Denver and elsewhere. Three factors can contribute to the brown tint. The first is the presence of nitrogen dioxide, a
brownish gas, most commonly viewed in a plume. In the urban hazes, however, discoloration from NO2 is usually overwhelmed by the effects caused by
particles. Since fine particles preferentially scatter blue light in the forward direction, the light viewed through an optically thin cloud as the sun is behind the
observer is deficient in the blue wavelengths and appears brown. In dense haze clouds, the preferential scattering is masked by multiple-scattering effects
and the haze is seen as white. However, a cloud can appear brown along its edges where it is optically thin. If the cloud is between the observer and the
sun, it appears as white, but a dense cloud in the distance against a background of a bright blue sky can appear brown through chromatic adaptation. In
chromatic adaptation, the blue receptors in the human eye are desensitized by the bright blue background; as a result, the white light from the haze appears
to be brown.
Acid Deposition. Acid deposition, the deposition of acids from the atmosphere to the surface of the earth, can be dry or wet. Dry deposition
involves acid gases or their precursors or acid particles coming in contact with the earth's surface and thence being retained. The principal species
associated with dry acid deposition are SO2(g), acid sulfate particles, ie, H2SO4 and NH4HSO4, and HNO3(g). Measurements of dry deposition are quite
sparse, however, and usually only speciated as total SO4- and total NO^ . In general, dry acid deposition is estimated to be a small fraction of the total
because most of the dry deposited material has been neutralized by basic gases and particles in the atmosphere. The sulfate and nitrate resulting from dry
deposition, however, is estimated to be a significant fraction of the total SO4- and NO3 deposition. Current spatial and temporal dry deposition data are
insufficient for specific estimates. On the other hand, there are abundant data on wet acid deposition. Wet acid deposition, acid precipitation, is the process
by which acids are deposited by rain or snow. The principal dissolved acids are H2SO4 and HNO3. Other acids such as HC1 and organic acids usually
account for only a minor part of the acidity although organic acids can be significant contributors in remote areas.
Both acid particles and gases can be incorporated into cloud droplets. Particles are incorporated into droplets by: nucleation, Brownian diffusion,
impaction, diffusiophoresis (transport into the droplet induced by the flux of water vapor to the same surface), thermophoresis (thermally induced
transport to a cooler surface), and electrostatic transport. Advective and diffusive attachment dominate all other mechanisms for pollutant gas uptake by
cloud droplets. Modeling and experimental evidence suggests that most of the H2SO4 is formed in cloud water droplets. SO2 diffuses into the droplet and
is oxidized to H2SO4 by one of several mechanisms. At a pH greater than about 5.5, oxidation of SO2 by dissolved O3 is the dominant reaction. At lower
pH, SO2 oxidation is dominated by the reaction with H2O2. Under some conditions, oxidation by O2, catalyzed by metals or soot, may contribute to the
formation of H2SO4. Most of the HNO3 in precipitation results from HNO3 that diffuses into the droplet. However, there is also observational evidence
that some HNO3 is formed in the droplets, but the mechanism has not been identified.
The pH of rainwater in equiEbrium with atmospheric CO2 is 5.6, a value frequendy cited as the natural background pH. However, in the presence of
other naturally occurring species such as SO2, SO4- , NH3, organic acids, sea salt, and alkaline crustal dust, the natural values of unpolluted rainwater vary
between 4.9 and 6.5 depending upon time and location. Across the United States, the mean annual average precipitation pH varies from 4.2 in western
Pennsylvania to 5.7 in the West (see Figure 6). In general, precipitation of the lowest pH occurs in the summer. Precipitation pH is generally lowest in the
eastern United States within and downwind of the largest SO2 and NO emissions areas. In the East, SO4- concentrations in precipitation are 1.5 to 2.5
times higher during the summer than in winter, but the NO3 values are about the same year round. Consequendy, the lower pH in summer precipitation
results mosdy from the higher SO4- concentrations. The equivalent ratio of sulfate to nitrate in precipitation where 1.0 represents equal concentrations is
an inexact measure of the relative contribution of these two species to the acidity. In the East during the winter, this ratio ranges from 1.0 to 2.5; during the
summer, it ranges from 2.0 to 3.0. On the average in the eastern United States, about 60% of the wet-deposited acidity can be attributed to SO4- and 40%
to NO“ (45).
Kirk-Othmer Encyclopedia of Chemical Technology (4th Edition)
377
AIR POLLUTION
Voll
Fig. 6. 1985 annual precipitation-weighted pH (45).
Since SO2 and NO2 are criteria pollutants, their emissions are regulated. In addition, for the purposes of abating acid deposition in the United
States, the 1990 Clean Air Act Amendments require that nationwide SO2 and XO emissions be reduced by approximately 10 million and 2 million t/yr,
respectively, by the year 2000. Reasons for these reductions are based on concerns which include acidification of lakes and streams, acidification of poorly
buffered soils, and acid damage to materials. An additional major concern is that acid deposition is contributing to the die-back of forests at high elevations
in the eastern United States and in Europe.
Global Warming (The Greenhouse Effect). Solar energy, mosdy in the form of visible light, is absorbed by the earth's surface and
reemitted as longer wavelength infrared radiation. Certain gases in the atmosphere, primarily water vapor and to a lesser degree CO2, have the ability to
absorb the outgoing ir radiation and translate it to heat. The result, a higher atmospheric equiEbrium temperature than would occur in the absence of these
molecules, is called the greenhouse effect. Gases that have the abflity to absorb radiation and bring about temperature enhancement are called greenhouse
gases. Without atmospheric water vapor and CO2, the earth's mean surface temperature would be —18° C instead of the present 17°C. However, there is
concern that increasing concentrations of CO2 and other trace greenhouse gases that result from human activities will enhance the greenhouse effect and
cause global warming. Scenarios that could then result include: an alteration in existing precipitation patterns, an increase in the severity of storms, the
dislocation of suitable land for agriculture, the dislocation and possible extinction of certain biological species and ecosystems, and the flooding of many
coastal areas because of rising sea levels resulting from the thermal expansion of the oceans, the melting of glaciers, and, probably less so, from the melting
of polar ice caps.
Measurements since 1958 clearly show that atmospheric CO2 concentrations are increasing at the rate of about 0.3%/yr. The present concentration
is -350 ppm compared to the preindustrial revolution (1800) value of 285 ppm that has been estimated from ice cores. Projections based on the current
rate of increase and future energy uses show that the CO2 concentration will approach 600 ppm some time in the middle of the 21st century. In the 1970s
and 1980s, the concentrations of other greenhouse gases were also discovered to be increasing. These gases include methane, nitrous oxide, tropospheric
O3, and a variety of CFCs. The greenhouse gases (not including water), concentrations, rates of increase in the atmosphere, and estimates of relative
greenhouse efficiencies and atmospheric residence times are presented in Table 8. Three important features are evident. First, CO2 is by far the most
abundant anthropogenic greenhouse gas. Second, all of the other greenhouse gases are much more efficient h-absorbers than CO2. Third, most of the
gases have very long atmospheric residence times so that even if emissions were to cease, the gases would remain in the atmosphere for decades (some for
centuries). The major sources of greenhouse gases are summarized in Table 9.
Table 8. Summary of Important Greenhouse Gases*
Gas CAS Registry Number 1990 Concentrations Concentration increases, %/yr Greenhouse efficiency Atmospheric residence times, yrs
co2 [124-38-9] 350 ppm 0.3 1 1208
CH4 [94-82-8] 1.68 ppm 0.8 25 7-10
n2o [10024-97-2] 340 ppb 0.2 250 -150
°3 [10028-15-6] 40 ppbe f 3000s 0.4
CFC13 (CFC-11) [75-69^1] 226 ppt 4 17500 75
CF2C12 (CFC-12) [75-71-8] 392 ppt 4 20000 120
CHC1F2 (HCFC-22) [75^5-6] 100 ppt 7 7500 20
C2H2F4 (HFC-134a] [811-97-2] 11600h 15.5h
C2C13F3 (CFC-113) [76-13-1] 30—70 ppt 11 22500h 90
CH3CC13 (methylchloroform) [71-55-6] 125 ppt 7 2500 5.5-10
cci4 [56-23-5] 75—100 ppt 1 12500 50
Ref. 46 unless otherwise indicated.
Relative to CO2 on a volume basis. A more useful way to compare the relative warming potentials is to consider the lifetimes of the species and integrate
the efficiencies over a fixed time interval, usually 100 years (see Ref. 8).
Kirk-Othmer Encyclopedia of Chemical Technology (4th Edition)
378
AIR POLLUTION
Voll
C Residence times may vary slightly from those in Table 2 because of the differences in the primary source.
d Ref. 8
Mean tropospheric background for O3 is given. Value can be much higher in polluted areas.
Small positive trend is evident (see Ref. 47).
ё Estimated from Ref. 48.
h Ref. 49.
Table 9. Sources of Greenhouse Gases*
Gases Sources
co2 CH4 n2o °3 CFC-11 CFC-12 HCFC-22 CFC-113 ch3cci3 cci4 fossil fuel combustion, deforestation, oceans, respiration wedands, rice paddies, enteric fermentation (animals), biomass burning, termites natural soils, cultivated and fertilized soils, oceans, fossil fuel combustion photochemical reactions in the troposphere, transport from stratosphere use in manufacturing of foam, aerosol propellant use as refrigerant, aerosol propellant, manufacturing of foams use as refrigerant, production of fluoropolymers use as electronics solvent use as industrial degreasing solvent use as intermediate in production of CFC-11, -12, solvent
aRef. 46.
From the analyses of air trapped in Antarctic and Greenland ice, the concentrations of greenhouse gases, except for O3, in the preindustrial
atmosphere (averaged over ~ T000 yr) can be estimated. The enhancement of the greenhouse effect as a result of current concentrations of gases relative to
preindustrial concentrations is called the enhanced greenhouse effect or radiative forcing. Using a radiative convective model, the contributions from the
various gases to the radiative forcing in the 1980s can be estimated (6). Such estimates are shown in Figure 7 where CO2 is shown to account for about half
of the radiative forcing. The relative contribution from CO2 has been shrinking and is expected to continue to do so. Other more efficient ir-absorber
species are increasing in concentration faster than CO2.
Fig. 7. Estimates of greenhouse-gas contributions to global warming in the 1980s. Percentages of total contributions are: CO2, 49; CH4, 18; CFC-11 and
CFC-12, 14; N2O, 6; and others, 13 (50).
Although there is no doubt that greenhouse gas concentrations and the radiative forcing are increasing, there is no unequivocal evidence that this
forcing is actually causing a net warming of the earth. Analyses of global temperature trends since the 1860s show that the global temperature has increased
about 0.5—0.7°C (51,52), but this number decreases to M).5° C when corrections for heat-island effects are considered (53). This is in reasonable agreement
with modeling results which predict a temperature increase of ~1° C (54). However, most of the temperature increase occurred prior to the increases in
CO2 (55). A detailed analysis of global temperature and CO2 concentration time-series from 1958 to 1988, the period of atmospheric CO2 measurements,
shows an excellent positive correlation, but CO2 changes lag temperature change by an average of 5 months (56). Thus, although there is strong evidence
linking temperature and CO2 changes, the cause and effect has not been demonstrated, and it is not clear which is the cause and which is the effect. The
lack of a definitive relationship may also be obscured by changes in other factors that affect the earth's heat budget such as increased atmospheric aerosols
or cloud cover and natural climatic cycles. Global circulation models (GCMs) predict that the average global temperature will increase from 2.0 to 5.5°C as
CO2 concentrations double from those of preindustrialized levels (57,58). The temperature increases are not expected to be uniformly distributed. The
uncertainties in these models are large because many of the important feedback processes involving oceans and clouds are not adequately understood to
properly incorporate them into the model system (see Atmospheric modeling).
Stratospheric O3 Depletion. In the stratosphere, O3 is formed naturally when O2 is dissociated by uv solar radiation in the region 180—240
nm:
O2 + uv О + О
(24)
and the atomic oxygen then reacts with molecular oxygen according to equation 2. Ultraviolet radiation in the 200—300 nm region can also dissociate O3:
Kirk-Othmer Encyclopedia of Chemical Technology (4th Edition)
379
AIR POLLUTION
Voll
Og “1“ UV -> Oq “1“ О
(25)
Equation 25 represents the reaction responsible for the removal of uv-B radiation (280—330 nm) that would otherwise reach the earth's surface. There is
concern that any process that depletes stratospheric ozone will consequently increase uv-B (in the 293—320 nm region) reaching the surface. Increased uv-B
is expected to lead to increased incidence of skin cancer and it could have deleterious effects on certain ecosystems. The first concern over O3 depletion
was from XO emissions from a fleet of supersonic transport aircraft that would fly through the stratosphere and cause reactions according to equations 3
and 26 (59):
no2 + o -^no + o2
(26)
The net effect of this sequence is the destruction of 2 molecules of O3 as the one is lost in NO2 formation and the О of equation 26 would have combined
with O2 to form the other. In addition, the NO acts as a catalyst. It is not consumed, and therefore can participate in the reaction sequence many times.
In the mid-1970s, it was realized that the CFCs in widespread use because of their chemical inertness, would diffuse unaltered through the
troposphere and into the mid-stratosphere where they, too, would be photolyzed by uv (<240 nm) radiation. For example, CFC-12 can photolyze:
CF2C12 + uv^ CF2C1+ Cl
(27)
CF2C1 + 02 CF2O + CIO
(28)
forming Cl and CIO radicals which then react with ozone and O:
Cl + O3 CIO + 02
(29)
C1O + O^C1+O2
(30)
In this sequence the Cl also acts as a catalyst and two O3 molecules are destroyed. It is estimated that before the Cl is finally removed from the atmosphere
in 1—2 yr by precipitation, each Cl atom will have destroyed approximately 100,000 O3 molecules (60). The estimated Oydepletion potential of some
common CFCs, hydrofluorocarbons, HFCs, and hydrochlorofluorocarbons, HCFCs, are presented in Table 10. The O3-depletion potential is defined as
the ratio of the emission rate of a compound required to produce a steady-state O3 depletion of 1% to the amount of CFC-11 required to produce the 1%
depletion. The halons, bromochlorofluorocarbons or bromofluorocarbons that are widely used in fire extinguishers, are also ozone-depleting compounds.
Although halon emissions, and thus the atmospheric concentrations, are much lower than the most common CFCs, halons are of concern because they are
from three to ten times more destructive to O3 than the CFCs.
Table 10. Ozone Depletion Potential Relative to CFC-1T
Compound CAS Registry Number Relative ozone depletion potential
CFC13 (CFC-11) [75-69-11] 1.0
CFC12 (CFC-12) [75-71-8] 0.87
C2C13F3 (CFC-113) [76-13-1] 0.76
(CFC-114) 0.56
C2C1F5 (CFC-115) [76-15-3] 0.27
CHC1F2 (HCFC-22) [75^5-6] 0.043
C2HC12F3 (HCFC-123) [3696-83-2] 0.016
C2HC1F4 (HFCF-124) [2837-89-69] 0.017
C2HF5 (HCFC-125) [354-33-6] 0
C2H2F4 (HFC-134a) [811-97-2] 0
cci4 [56-23-5] 1.1
ch3cci3 [71-55-6] 0.12
Ref. 61. Results are based on a Lawrence Livermore National Laboratory 2-Dimensional Model.
The strongest evidence that stratospheric O3 depletion is occurring comes from the discovery of the Antarctic ozone hole. In recent years during the
spring, O3 depletions of 60% integrated over all altitudes and 95% in some layers have been observed over Antarctica. During winter in the southern
hemisphere, a polar vortex develops that prevents the air from outside of the vortex from mixing with air inside the vortex. The depletion begins in
August, as the approaching spring sun penetrates into the polar atmosphere, and extends into October. When the hole was first observed, existing
chemical models could not account for the rapid O3 loss, but attention was soon focused on stable reservoir species for chlorine. These compounds,
namely HC1 and C1NO3, are formed in competing reactions involving Cl and CIO that temporarily or permanently remove Cl and CIO from participating
in the O3 destruction reactions. For example,
C1 + CH4 ^HC1 + CH3
(31)
CIO + NO2 + M CINO3 + M
(32)
where M is again any third body molecule, remaining unchanged, in the atmosphere. Within the polar vortex, temperatures as low as —90° C allow the
formation of polar stratospheric ice clouds. On the surfaces of the ice particles that compose these clouds, heterogeneous reactions which break down
these reservoir species occur. Two important ones are
CINO3 + HCl(s) Cl2 + HNO3 (s)
(33)
Kirk-Othmer Encyclopedia of Chemical Technology (4th Edition)
380
AIR POLLUTION
Voll
H2O(s) + C1NO3 HOC1 + HNO3(s)
(34)
During the polar winter night, Cl2, HOC1, and HNO3(s) accumulate. When sunlight returns to the polar regions, the chlorine compounds are photolyzed
producing Cl and CIO. Nitrogen oxides remain sequestered, and without NO2 to deplete CIO, massive O3 destruction occurs until the polar vortex
dissipates later in the spring and the mixing of air from lower latitudes occurs.
There is additional evidence that stratospheric O3 concentrations have declined an average of 2.5% globally from 1969 to 1986. After data was
adjusted for known cycles that cause variations in the O3, declines were most evident during winter months (62,63). The cause of this global decrease in
stratospheric O3 is under investigation.
In 1976 the United States banned the use of CFCs as aerosol propellants. No further steps were taken until 1987 when the United States and some
50 other countries adopted the Montreal Protocol, speciftng a 50% reduction of fully halogenated CFCs by 1999. In 1990, an agreement was reached
among 93 nations to accelerate the discontinuation of CFCs and completely eliminate production by the year 2000. The 1990 Clean Air Act Amendments
contain a phaseout schedule for CFCs, halons, carbon tetrachloride, and methylchloroform. Such steps should stop the increase of CFCs in the
atmosphere but, because of the long lifetimes, CFCs will remain in the atmosphere for centuries.
Indoor Air Pollution. Indoor air pollution, the presence of air pollutants in indoor air, is of growing concern in offices and residential
buildings. Pollution in the industrial environment has been monitored and regulated for some time (see Industrial hygiene). Pardy in response to the
"energy crisis" of the early 1970s, buildings are now constructed more air-tight. Unfortunately, air-tight structures create a setting conducive to the
accumulation of indoor air pollutants. Numerous sources and types of pollutants found indoor can be classified into seven categories: tobacco smoke,
radon, emissions from building materials, combustion products from inside the building, pollutants which infiltrate from outside the building, emissions
from products used within the home, and biological pollutants. Concentrations of the pollutants depend upon strength of the indoor sources, the
ventilation rate of the building, and the outdoor pollutant concentration.
Tobacco smoke contains a variety of air pollutants. In a survey of 80 homes in an area where the outdoor TSP varied between 10—30 pg/m3, the
indoor TSP was the same, or less, in homes having no smokers. In homes having one smoker, the TSP levels were between 30—60 pg/m3, while in homes
having two or more smokers, the levels were between 60—120 pg/m3 (64). In other studies, indoor TSP levels exceeding 1000 pg/m3 have been found in
homes with numerous smokers. In addition to TSP, burning tobacco emits CO, NO , formaldehyde [50-00-0], benzopyrenes, nicotine [54-17-5/, phenols,
and some metals such as cadmium [7440-43-9] and arsenic [7440-38-2] (65).
Radon-222 [14859-67-7], 222Rn, is a naturally occurring, inert, radioactive gas formed from the decay of radium-226 [13982-63-3], 226Ra. Because Ra
is a ubiquitous, water-soluble component of the earth's crust, its daughter product, Rn, is found everywhere. A major health concern is radon's radioactive
decay products. Radon has a half-life of 4 days, decaying to polonium-218 [15422-74-9]', 218Po, with the emission of an CC particle. It is 218Po, an CC-emitter
having a half-life of 3 min, and polonium-214 [15735-67-8], 214Po, an CC-emitter having a half-life of 1.6 x 10⁻⁴ s, that are of most concern. Polonium-218
decays to lead-214 [15067-28-4], 214Pb, a p-emitter having t1//2 = 27 min, which decays to bismuth-214 [14733-03-0], 214Bi, a p-emitter having
7^2 = 20 min, which decays to 214Po. Radon is an inert gas that, when inhaled, is not retained in the lungs. But the Rn daughters, when inhaled, either by
themselves or attached to an airborne particle, are retained and the subsequent CC-emissions irradiate the surrounding lung tissue.
Radon can enter buildings through emissions from soil, water, or construction materials. The soil route is by far the most common, and
construction material the least common, although there have been isolated incidents where construction materials contained high levels of Ra. The
emission rate of Rn depends on the concentration of Ra in the soil, the porosity of the soil, and the permeability of the building's foundation. For example,
Rn is transported faster through cracks and sumps in the basement floor than through concrete. In the ambient air Rn concentrations are typically 9.25—37
mBq/L, whereas the mean concentration in U.S. residences is about 44 mBq/L (66). However, it is estimated that there are 1 million residences that have
concentrations exceeding 0.3 Bq/L or 300 mBq/L, which is the level for remedial action recommended by the National Council on Radiation Protection
and Measurements (66). The highest values ever measured in U.S. homes exceeded 37 Bq/L (67). Remedial action consists of (7) reducing the transport of
Rn into the building by sealing cracks with impervious fillers and installing plastic or other barriers that have proven effective; (2) removing the daughters
from the air by filtration; and (J) increasing the infiltration of outside air using an air-exchanger system.
Of the pollutants emitted from construction materials within the home, asbestos (qv) [1332-21 -4] has received the most attention. Asbestos is a
generic term for a number of naturally occurring fibrous hydrated silicates. By EPA's definition, a fiber is a particle that possesses a 3:1 or greater aspect
ratio (length:diameter). The family of asbestos minerals is divided into two types: serpentine [12168-92-2] and amphibole. One type of serpentine, chrysotile
[12001 -29-5], Mg3Si4O10(OH)8, accounts for 90% of the world's asbestos production. The balance of the world's production is accounted for by two of the
amphiboles: amosite [12172-73-5], Fe5Mg2(Si8O22)(OH)2, and crocidolite [12001-28-4], Na2(Fe3+ )2(Fe2+ )3SigO22 (OH)2. Three other amphiboles,
anthophyllite [77536-67-5], (Mg,Fe)7Si8O22(OH)2, tremolite [77536-68-6], Ca2Mg5Si8O22(OH)2 and actinolite [77536-66-4], Ca2(Mg,Fe)5Si8O22(OH)2, have
been only rarely mined. The asbestos minerals differ in morphology, durability, range of fiber diameters, surface properties, and other attributes that
determine uses and biological effects. Known by ancients as the magic mineral because of its ability to be woven into cloth, its physical strength, and its
resistance to fire, enormous heat, and chemical attack, asbestos was incorporated into many common building products (68).
All forms of asbestos were implicated in early studies linking exposure to airborne fibers and asbestosis (pulmonary interstitial fibrosis), lung cancer,
and mesothelioma (a rare form of cancer of the lung or abdomen). However, most of the asbestos-related diseases are now thought to result from
exposure to airborne amphiboles rather than chrysotile, the most common asbestos type, and to fibers greater than or equal to 5 Ц111 in length (69). In the
1970s, the spray-on application of asbestos was banned and substitutes were found for many products. Nevertheless, asbestos was used liberally in
buildings for several decades, and many of them are still standing. Asbestos in building materials does not spontaneously shed fibers, but when the
materials become damaged by normal decay, renovation, or demolition, the fibers can become airborne and contribute to the indoor air pollution problem.
Formaldehyde (qv) [50-00-0], HCHO, another important pollutant emanating from building material, is important because of irritant effects and
suspected carcinogenicity. Traces of formaldehyde can be found in the air in virtually every modem home. Mobile homes and houses insulated using
urea—formaldehyde [9011-05-6] foam, an efficient insulation material that can be injected into the sidewalls of conventional homes, have the highest
concentrations. In 1982, use of the foam was banned in the U.S. Higher formaldehyde emissions can occur in mobile homes using particle board held
together using an urea—formaldehyde resin. This can also be a problem in a conventional house, but it is usually exacerbated in a mobile home because of
the low rate of air exchange. Plywood is also a source of formaldehyde as the layers of wood are held together using a similar urea-formaldehyde resin
adhesive. In general, however, particle board contains more adhesive per unit mass, so the emissions are greater. Other sources of indoor formaldehyde are
paper products, carpet backing, and some fabrics.
Whenever unvented combustion occurs indoors or when venting systems attached to combustion units malfunction, a variety of combustion
products will be released to the indoor environment. Indoor combustion units include: nonelectric stoves and ovens, furnaces, hot water heaters, space
heaters, and wood-burning fireplaces or stoves. Products of combustion include CO, NO, NO2, fine particles, aldehydes, polynuclear aromatics, and other
organic compounds. Especially dangerous sources are unvented gas and kerosene [8008-20-6] space heaters which discharge pollutants direcdy into the
living space. The best way to prevent the accumulation of combustion products indoors is to make sure all units are propedy vented and propedy
maintained.
Pollutants from outdoors can also be drawn inside under certain circumstances such as incorrecdy locating an air intake vent downwind of a
combustion exhaust stack. High outdoor pollutant concentrations can also infiltrate buildings. Unreactive pollutants like CO diffuse through any openings
in a building and pass unaltered through any air-intake system. Given sufficient time, the indoor/outdoor ratio for CO approaches 1.0 if outside air is the
only CO source. For reactive species such as ozone, which is destroyed on contact with most surfaces, the indoor/outdoor ratio is usually around 0.5, but
Kirk-Othmer Encyclopedia of Chemical Technology (4th Edition)
381
AIR POLLUTION
Voll
this ratio varies considerably depending on the ventilation rate and the internal surface area within the building (70).
Air contaminants are emitted to the indoor air from a wide variety of activities and consumer products, some of which are summarized in Table 11.
Most indoor activities produce some types of pollutants. When using volatile products or engaging in the activities listed, care should be exercised to
minimize exposure through proper use of the product and by providing adequate ventilation.
Table 11. Emission Mechanisms of Indoor Air Pollutants Arising from Activities and Consumer Products*
Activity or product Aerosol production Evaporation or sublimation Unintentional outgassing
Intentional Unintentional
cleaning X X X X
painting X X X
polishing X X X
stripping X X X
refinishing X X X
hobbies, crafts X X X X
deodorizer X X
insecticide X X
disinfectant X X
personal grooming product X X X
plastic X
aRef. 71.
Biological indoor air pollutants include airborne bacteria, viruses, fungi, spores, molds, algae, actinomycetes, and insect and plant parts.
Microorganisms many of which multiply in the presence of high humidity, can produce infections, disease, or allergic reactions; the nonviable biological
pollutants can produce allergic reactions. The most notable episode was the 1976 outbreak of Legionella (Legionnaires') disease in Philadelphia where the
American Legion convention attendees inhaled Legionella virus from a contaminated central air conditioning system. A similar incident in an industrial
environment occurred in 1981: more than 300 workers came down with "Pontiac fever" as a result of inhalation exposure to a similar virus aerosolized
from contaminated machining fluids (72). Preventive maintenance of air management systems and increased ventilation rates reduce the concentrations of
all species, and should consequendy reduce the incidence of adverse affects.
BIBLIOGRAPHY
"Smokes and Fumes" in ECT 1st ed., Vol. 12, pp. 558—573, by G. P. Larson, Air Pollution Control District of Los Angeles County; "Smokes, Fumes, and
Smog" in ECT 2nd ed., Vol. 18, pp. 400—415, by R. B. Engdahl, Battelle Memorial Institute; "Pollution—Air Pollution" in ECT 2nd ed., Supplement Vol.,
pp. 730—737, by G. P. Sutton, Envirotech Corp.; "Air Pollution" in ECT 3rd ed., Vol. 1, pp. 624—649 by P. R. Sticksei, R. B. Engdahl, Battelle Memorial
Institute.
1. Procedures for Emission Inventory Preparation, Vol 1 -4, Pub. No. EPA 450-4-81-026A-E, U.S. Environmental Protection Agency, Research Triangle
Park, N.C., 1981.
2. Compilation of 'AirPollution Emission Factors, Pub. No. AP-42, 5th ed., U.S. Environmental Protection Agency, Research Triangle Park, N.C., 1989.
3. Compilation of Air Pollution Emission Factors, Vol. 2. Mobile Sources, Pub. No. AP-42, 5th ed., U.S. Environmental Protection Agency, Research
Triangle Park, N.C., 1989.
4. National Air Quality & Emissions Trends Report, 1989, Pub. No. EPA-450/4-91-003, U.S. Environmental Protection Agency, Research Triangle Park,
N.C., 1991.
5. National Air Pollutant Emissions Estimates 1940—1986, Pub. No. EPA-450/4-87-024, U.S. Environmental Protection Agency, Research Triangle Park,
N.C., 1988.
6. V. Ramanathan and co-workers, Rev. Geophys. 25, 1441 (1987).
7. P. Wameck, Chemistry of Natural Atmospheres, Academic Press, New York, 1988, p. 367.
8. Intergovernmental Panel on Climate Change, S cientific Assessment of Climate Change, Section 2, Radiative Forcing of Climate, United Nations, New York,
1990, p. 14.
9. G. T. Wolff and P. J. Lioy, Environ. Sci. Technol. 14, 1257 (1980).
10. G. T. Wolff, N. A. Kelly, and M. A. Ferman, Science 311, 703 (1981).
11. J. P. Lodge, ed., Methods of Air Sampling and Analysis, Lewis Publishers, Chelsea, Mich., 1989, 763 pp.
12. Air Quality Criteria for Oxone and Other Photochemical Oxidants, Publication No. EPA-600-8-84-020F, 5 vols., U.S. Environmental Protection Agency,
Research Triangle Park, N.C., 1986. EPA publishes separate criteria documents for all the criteria pollutants and they are updated about every five
years.
13. A. M. Hough and R. G. Derwent, Nature 344, 645 (1990).
14. N. A. Kelly, G. T. Wolff, and M. A. Ferman, Atmos. Environ. 16, 1077 (1978).
15. W. Johnson and W. Viezee, Atmos. Environ. 15, 1309 (1981).
16. W. Attmannspacher and R. Hartmannsgruber, Pure Appl Geophys. 106—108, 1091 (1973).
17. R. L. Seila, W. A. Lonneman, and S. A. Meeks, D etermination of C2 to C12 Ambient Air Hydrocarbons in 39 U.S. Citiesfrom 1984 through 1986, Pub. No.
ЕРА/600/3-89/058, U.S. Environmental Protection Agency, Research Triangle Park, N.C., 1989.
18. P. Wameck, Chemistry of Natural Atmospheres, Academic Press, New York, 1988, pp. 721—729.
19. W. N. Stasiuk, Jr., and P. E. Coffey,/. AirPollut. Control Assoc. 24, 564 (1974).
20. G. T. Wolff and co-workers, Environ. Sci. Technol 11, 506 (1977).
21. A. M. Dunker, S. Kumar, and P. H. Berzins, Atmos. Environ. 18, 311 (1984).
22. N. A. Kelly and R. G. Gunst, Atmos. Environ. 24A, 2991 (1990).
23. Catching OurFreath. Next Steps forReducing Urban Ocpne, U.S. Office of Technology Assessment, Washington, D.C., 1989, pp. 101—102.
24. G. T. Wolff, P. J. Lioy, G. D. Wight, and R. E. Pasceri, J. AirPollut. Control Assoc. 27, 460 (1977).
25. An Acid Aerosols Issue Paper, Pub. No. EPA/600/8-88/005F, U.S. Environmental Protection Agency, Washington, D.C., 1989.
26. G. T. Wolff, Ann. NY Acad. Sci. 338, 379 (1980).
27. K. Willeke and К. T. Whitby, / AirPollut. Control Assoc. 25, 529 (1975).
28. R. J. Countess, G. T. Wolff, and S. H. Cadle,/ AirPollut. Control Assoc. 30, 1195 (1980).
29. G. T. Wolff and co-workers, Atmos. Environ. 19, 305 (1985).
30. G. T. Wolff and co-workers, / AirPollut. Control Assoc. 32, 1216 (1982).
Kirk-Othmer Encyclopedia of Chemical Technology (4th Edition)
382
AIR POLLUTION
Voll
31.
32.
33.
34.
35.
36.
37.
38.
39.
40.
41.
42.
43.
44.
45.
46.
47.
48.
49.
50.
51.
52.
53.
54.
55.
56.
57.
58.
59.
60.
61.
62.
63.
64.
65.
66.
67.
68.
69.
70.
71.
72.
G. T. Wolff, M. S. Ruthkosky, D. P. Stroup, and P. E. Korsog,^4/wx Environ. 25A (1991).
G. T. Wolff and co-workers,/. Air Waste Mgt. Assoc. 40, 1638 (1990).
M. A. Ferman, G. T. Wolff, and N. A. Kelly, / Air Pollut. Control Assoc. 31, 1074 (1981).
G. T. Wolff and co-workers, / Air Pollut. Control Assoc. 36, 585 (1986).
G. T. Wolff and co-workers, Atmos. Environ. 20, 1229 (1986).
M. S. Miller, S. K. Friedlander, and G. M. Hidy in G. M. Hidy, ed., Aerosol and Atmospheric Chemistry, Academic Press, New York, 1972, pp.
301-312.
P. W. Fisher, R. M. Currie, and R. J. Churchill,/ AirPollut. Control Assoc. 38, 1376 (1988).
Threshold Eimit Values and Biological Exposure Indices, American Conference of Governmental and Industrial Hygienists, Cincinnati, Ohio, 1989, p.
124.
N. I. Sax, Dangerous Properties of Industrial Materials, Van Nostrand Reinhold, New York, 1979, p. 1108.
J. A. Cannon,/. Air Pollut. Control Assoc. 36, 562 (1986).
J. C. Mesta in P. S. Bhardwaja, ed., Visibility Protection Research and Polity Aspects, Air and Waste Management Association, Pittsburgh, Pa., 1987, pp.
1-8.
W. E. Middleton, Vision Through the Atmosphere, University of Toronto Press, Toronto, Canada, 1968.
H. Koschmieder, Beitr. Phys. Prein Atm. 12, 33 (1924).
P. J. Groblicki, G. T. Wolff, and R. J. Countess, Atmos. Environ. 15, 2473 (1981).
D. Albritton and co-workers, NAPAP Interim Assessment, Vol. 3 (Atmosphere Process and Deposition), National Acid Precipitation Assessment
Program, Washington, D.C., 1987.
Polity Options for S tabilifing Global Climate, U.S. Environmental Protection Agency, Washington, D.C., 1990.
A. M. Hough and G. Derwent, Mature 344, 645 (1990).
J. Fishman, V. Ramanathan, P. J. Crutzen, and S. C. Liu, Mature 282, 818 (1979).
D. A. Fisher and co-workers, Mature 344, 513 (1990).
J. Hansen and co-workers,/ Geophys. R/j. 93, 9341 (1988).
P. D. Jones, T. M. L. Wigley, and P. B. Wright, Mature 322, 430 (1986).
J. Hansen and S. Lebedeff, J. Geophys. Rtx Dt 1,13, 345 (1987).
T. R. Kad and P. D. Jones, Bull. Am. Meteorol. Soc. 70, 265 (1989).
V. Ramanathan, 5А'т^240, 293 (1988).
R. S. Lindzen, Bull. Am. Meteorol. Soc. 71, 288 (1990).
C. Kuo, C. Lindberg, and D. J. Thomson, Mature 343, 709 (1990).
S. H. Schneider, Sci. Am. 261, 70 (Sept. 1989).
J. F. B. Mitchell, C. A. Senior, and W. J. Ingram, Mature 341, 132 (1989).
P. J. Cmtzen,j2-/ Royal Meteorol. Soc. 96, 320 (1970).
M. J. Molina and F. S. Rowland, Mature 249, 810 (1974).
D. A. Fisher and co-workers, Mature 344, 508 (1990).
M. B. McElroy and R. J. Salawitch, Science 243, 763 (1989).
F. S. Rowland, Am. Sci. 77, 36 (1989).
J. D. Spengler and co-workers, Atmos. Environ. 15, 23 (1981).
California Department of Consumer Affairs, Clean Your Room, Compendium on Indoor Air Pollution, Sacramento, Calif., 1982, p. III.FI—III. E. II.
Mueller Associates, Inc., Syscon Corporation, and Brookhaven National Laboratory, Handbook of Radon in Buildings, Hemisphere Publishing
Corporation, New York, 1988, p. 95.
H. W. Alter and R. A. Oswald, / Air Pollut. Control Assoc. 37, 227 (1987).
P. Brodeur, New Yorker 44, 117 (Oct. 12, 1968).
В. T. Mossman and co-workers, Science 247, 294(1990).
C. J. Weschler, H. C. Shields, and D. V. Naik,/ Air Waste Manage. Assoc. 39, 1562 (1989).
Indoor Air Pollutants, National Academy Press, Washington, D.C., 1981, p. 101.
L. A. Herwaldt and co-workers, Ann. Intern. Med. 100, 333 (1984).
General References
References 4, 5, 6, 7, 8, 11, 12, 45, 56, 61, 64, and 70 and the following books and reports constitute an excellent list for additional study. Reference 7 is an
especially useful resource for global atmospheric chemistry.
J. H. Seinfeld, Atmospheric Chemistry and Physics of Air Pollution, John Wiley & Sons, Inc., New York, 1986.
B. J. Finlayson-Pitts andj. N. Pitts, Jr., Atmospheric ChemistryFundamentals andExperimentalTechniques, John Wiley & Sons, Inc., New York, 1986.
T. E. Graedel, D. T. Hawkins, and L. D. Claxton, Atmospheric Chemical Compounds Sources, Occurrence and Bioassay, Academic Press, New York, 1986.
Atmospheric O^one 1985, World Meteorological Organization, Geneva, Switzerland (3 vols.); an excellent compendium on tropospheric and stratospheric
processes.
G. T. Wolff, J. L. Hanisch, and K. Schere, eds., The Scientific and Technical Issues Facing Post-1987 Ocyne Control Strategies, Air and Waste Management
Association, Pittsburgh, Pa., 1988.
J. H. Seinfeld, "Urban Air Pollution: State of the Sciences," Science 243, 745 (1989).
S. H. Schneider, "The Greenhouse Effect: Science and Policy," Science 243, 771 (1989).
Ggeorge T. Wolff
General Motors Research Laboratories
Kirk-Othmer Encyclopedia of Chemical Technology (4th Edition)
383
AIR POLLUTION CONTROL METHODS
Voll
AIR POLLUTION CONTROL METHODS
Air pollution (qv), recognized in the National Ambient Air Quality Standards (NAAQS) as being characterized by a time—dosage relationship, is defined
as the presence in the atmosphere (or ambient air) of one or more contaminants of such quantity and duration as may be injurious to human, plants, or
animal life, property, or conduct of business (1,2). Thus, air pollutants may be rendered less harmful by reducing the concentration of contaminants, the
exposure time, or both.
Selection of pollution control methods is generally based on the need to control ambient air quality in order to achieve compliance with standards
for criteria pollutants, or, in the case of nonregulated contaminants, to protect human health and vegetation. There are three elements to a pollution
problem: a source, a receptor affected by the pollutants, and the transport of pollutants from source to receptor. Modification or elimination of any one of
these elements can change the nature of a pollution problem. For instance, tall stacks which disperse effluent modify the transport of pollutants and can
thus reduce nearby SO2 deposition from sulfur-containing fossil fuel combustion. Although better dispersion aloft can solve a local problem, if done from
numerous sources it can unfortunately cause a regional one, such as the acid rain now evident in the northeastern United States and Canada (see
Atmospheric models). References 3—15 discuss atmospheric dilution as a control measure. The better approach, however, is to control emissions at the
source.
There are three main classes of pollutants: gases, particulates (which may be either Equid or solid or a combination), and odors (which may originate
as gases or particulates). Although odors are controlled similarly to other pollutants, they are often discussed separately because of the different methods
used for sensing and measurement (see Odormodification). Many effluents contain several contaminants: one or two may be present as gases; the others
often exist as liquid or solid particulates of various sizes. The possibility that effluent pollutants may be present in more than one physical state must be
taken into account in sampling, analysis, and control. To achieve air pollution control, reliable measurements are needed to quantify both the pollutant
concentration and the contribution of individual sources. These data are necessary for designing control equipment, for monitoring emissions, and for
maintaining acceptable ambient air quality.
Measurement of Air Pollution
Measurement techniques are divided into two categories: ambient and source measurement. Ambient air samples often require detection and measurement
in the ppmv to ppbv (parts by volume) range, whereas source concentrations can range from tenths of a volume percent to a few hundred ppmv. Federal
regulations (16—17) require periodic ambient air monitoring at strategic locations in a designated air quality control region. The number of required
locations and complexity of monitoring increases with region population and with the normal concentration level of pollutants. Continuous monitoring is
preferable, but for particulates one 24-h sample every sixth day may be permitted. In some extensive metropolitan sampling networks, averaged results
from continuous monitors are telemetered to a single data processing center. Special problems have been investigated using portable, vehicle-carried, or
airborne ambient sampling equipment. The utilization of remote-guided miniature aircraft has been reported as a practical, cost-effective ambient sampling
method (18). Ambient sampling may fulfill one or more of the following objectives: (7) establishing and operating a pollution alert network, (2) monitoring
the effect of an emission source, (J) predicting the effect of a proposed installation, (4) establishing seasonal or yearly trends, (5) locating the source of an
undesirable pollutant, (6) obtaining permanent sampling records for legal action or for modifying regulations, and (7) correlating pollutant dispersion with
meteorological, climatological, or topographic data, and with changes in societal activities.
The problems of source sampling are distinct from those of ambient sampling. Source gas may have high temperature or contain high
concentrations of water vapor or entrained mist, dust, or other interfering substances so that particulates or gases may be deposited on or absorbed into
the grain structure of the gas-extractive sampling probes. Depending on the objective or regulations, source sampling may be infrequent, occasional,
intermittent, or continuous. Typical objectives are (7) demonstrating compliance with regulations, (2) obtaining emission data, (J) measuring product loss
or optimizing process operating variables, (4) obtaining data for engineering design, (5) determining collector efficiency or acceptance testing of purchased
equipment, and (6) determining need for maintenance of process or control equipment.
Sampling of Gaseous Pollutants. Gaseous pollutant detection is dependent upon the chemistry of the material involved.
Reference methods for criteria (19) and hazardous (20) pollutants established by the US EPA include: sulfur dioxide [7446-09-5] by the West-Gaeke
method; carbon monoxide [630-08-0] by nondispersive infrared analysis; ozone [10028-15-6] and nitrogen dioxide [10102-44-0] by chemiluminescence (qv);
and hydrocarbons by gas chromatography coupled with flame-ionization detection. Gas chromatography coupled with a suitable detector can also be used
to measure ambient concentrations of vinyl chloride monomer [75-01-4], halogenated hydrocarbons and aromatics, and polyacrylonitrile [25014-41-9]
(21-22) (see Chromatography; Trace and residue analysis).
Automated analyzers may be used for continuous monitoring of ambient pollutants and EPA has developed continuous procedures (23) as
alternatives to the referenced methods. For source sampling, EPA has specified extractive sampling trains and analytical methods for pollutants such as
SO2 and SO3 [7446-11-9] sulfuric acid [7664-93-9] mists, NO. ,, mercury [7439-97-6], beryllium [7440-41-7], vinyl chloride, and VOCs (volatile organic
compounds). Some EPA New Source Performance Standards require continuous monitors on specified sources.
Sampling of Particulates. Ambient air suspended particulate concentration was traditionally measured gravimetrically over a 24-h period
with a "Hi-Vol" sampler. However, in 1987 the EPA changed ambient particulate control to the PM1Q reference method (24). In the PM1Q method, a
particle size classification head is attached to a Hi-Vol sampler so that only particulates finer than an aerodynamic 10 |lm are collected on the filter.
Although tape samplers, used for more frequent determination of suspended particulates, have been tied into the EPA Alert Warning System, it is not yet
apparent how they will be correlated with PM1Q monitoring. In the tape method, particulate quantity is measured automatically by light transmittance or
P~ray attenuation and converted to an electronic signal for transmission and data processing.
Source sampling of particulates requires isokinetic removal of a composite sample from the stack or vent effluent to determine representative
emission rates. Samples are collected either extractively or using an in-stack filter; EPA Method 5 is representative of extractive sampling, EPA Method 17
of in-stack filtration. Other means of source sampling have been used, but they have been largely supplanted by EPA methods. Continuous in-stack
monitors of opacity utilize attenuation of radiation across the effluent. Opacity measurements are affected by the particle size, shape, size distribution,
refractive index, and the wavelength of the radiation (25,26).
Particle size measurements for particulates extracted by filtration, electrostatic or thermal precipitation, or impaction may be performed using
microscopy, sieve analysis, gas or liquid sedimentation, centrifugal classification, or electrical or optical counters (see Size measurement of particles). For
aerosol particulate size determination, however, questions arise such as whether the collected particles agglomerate after capture, or whether they are
redispersed to the same degree in the measuring media as they were originally. These problems can be avoided mainly by performing particle size
measurements on the original aerosol by using devices such as cascade impactors (27), virtual impactors (28), and diffusion batteries and mobility analyzers.
Status of Air Pollution and Control Regulations
Kirk-Othmer Encyclopedia of Chemical Technology (4th Edition)
384
AIR POLLUTION CONTROL METHODS
Voll
There has been considerable improvement, especially in industrial areas, in U.S. air quaEty since the adoption of the Clean Air Act of 1972. Appreciable
reductions in particulate emissions and in SO2 levels are especially evident. In 1990, however, almost every metropoEtan area was in nonattainment status
on ozone air quaEty standards; 50 metropoEtan areas exceeded the CO standard and between 50 and 100 exceeded the PM1Q standard for particulate level
(29).
The U.S. Congress adopted a new clean air act in 1990 which has three areas of emphasis: acid rain reduction in the northeastern United States;
severe limitation on atmospheric emissions of 189 chemicals on the EPA Hazardous or Toxic Substance Est; and tightened regulations on vehicular
exhaust, reformulated vehicular fuels, and vehicles capable of using alternative fuels (ozone compEance and smog reduction). Regulations associated with
acid rain prevention emphasize reductions in sulfur oxide and XO emissions from combustion processes, especially coal-fired power boilers in the
midwest. The chemical process industry (CPI) will be increasingly under pressure to eliminate atmospheric releases of VOCs and carcinogenic-suspect
compounds.
Control technology requirements vary according to the scale of operation and type of emission problem. For instance, electrostatic precipitator
design requirements for fly-ash control from 1000-MW coal-fired power boilers differ from those for a chemical process operation. In the discussion that
follows, priority is given to control technology for the CPI as opposed to the somewhat special needs of other industries.
Minimizing Pollution Control Cost
Although the first impulse for emission reduction is often to add a control device, this may not be the environmentally best or least cosdy approach.
Process examination may reveal changes or alternatives that can eliminate or reduce pollutants, decrease the gas quantity to be treated, or render pollutants
more amenable to collection. Following are principles to consider for controlling pollutants without the addition of specific treatment devices, ie, the
fundamental means of reducing or eliminating pollutant emissions to the atmosphere (30):
Eliminate the source of the pollutant.
Seal the system to prevent interchanges between system and atmosphere.
Use pressure vessels.
Interconnect vents on receiving and discharging containers.
Provide seals on rotating shafts and other necessary openings.
Change raw materials, fuels, etc., to eliminate the pollutant from the process.
Change the manner of process operation to prevent or reduce formation of, or air entrainment of, a pollutant.
Change the type of process step to eliminate the pollutant.
Use a recycle gas or recycle the pollutants rather than using fresh air or venting.
Reduce the quantity of pollutant released or the quantity of carrier gas to be treated.
Minimize entrainment of pollutants into a gas stream.
Reduce number of points in system in which materials can become airborne.
Recycle a portion of process gas.
Design hoods to exhaust the minimum quantity of air necessary to ensure pollutant capture.
Use equipment for dual purposes, such as a fuel combustion furnace to serve as a pollutant incinerator.
Steps such as the substitution of low sulfur fuels or nonvolatile solvents, change of raw materials, lowering of operation temperatures to reduce XO
formation or volatilization of process material, and installion of well-designed hoods (31—37) at emission points to effectively reduce the air quantity
needed for pollutant capture are illustrations of the above principles.
Selection of Control Equipment
Engineering approaches (38) for the design and selection of pollution control equipment include knowledge of the properties of pollutants: chemical
species, physical state, particle size, concentration, quantity of conveying gas, and of effects of pollutant on surrounding environment. The design must
consider likely future collection requirements. Advantages of alternative collection techniques must be determined, eg
(1) Collection efficiency.
(2) Ease of reuse or disposal of recovered material.
(3) AbiEty of collector to handle variations in gas flow and loads at required collection efficiencies.
(4) Equipment reEabiEty and freedom from operational and maintenance attention.
(5) Initial investment and operating cost.
(6) PossibiEty of recovery or conversion of contaminant into a saleable product.
Known engineering principles must be appEed even in areas of extremely dilute concentration.
The physical state of a pollutant is obviously important; a particulate collector cannot remove vapor. Pollutant concentration and carrier gas quantity
are necessary to estimate collector size and required efficiency and knowledge of a pollutant's chemistry may suggest alternative approaches to treatment.
Emission standards may set collection efficiency, but specific regulations do not exist for many trace emissions. In such cases emission targets must be set
by dose—exposure time relationships obtained from effects on vegetation, animals, and humans. With such information, a Est of possible treatment
methods can be made (see Table 1).
Table 1. Checklist of Applicable Devices for Control of Pollutants
Pollutant classification
Particulate
Equipment type Gas Odor Liquid SoEd
absorption • •
aqueous solution
nonaqueous
adsorption • •
throw-away canisters
regenerable stationary beds
regenerable traveling beds
chromatographic adsorption
air dispersion (stacks) • • • •
condensation • •
centrifugal separation (dry) • •
Kirk-Othmer Encyclopedia of Chemical Technology (4th Edition)
385
AIR POLLUTION CONTROL METHODS
Voll
chemical reaction • •
coagulation and particle growth •
filtration
fabric and felt bags
granular beds •
fine fibers •
gravitational settling
impingement (dry)
incineration • • •
precipitation, electrical
dry •
wet • • •
precipitation, thermal •
wet collection • • •
a Includes cyclonic, dynamic, filtration, inertial impaction (wetted targets, packed towers, turbulent targets), spray chambers, and venturi.
Control devices which are too inefficient for a particular pollutant or too expensive can then be stricken from the list. For instance, atmospheric
dispersion is not always an acceptable solution; condensation may require cosdy refrigeration to give adequate collection. Although both absorption and
adsorption devices for contaminant gases can be designed for almost any efficiency, economics generally dictate the choice between the two.
Grade-efficiency curves should be consulted in evaluating particulate collection devices and the desirability of dry or wet particulate collection, should be
considered, especially with respect to material recycle or disposal.
Other factors to be evaluated are capital investment and operating cost, material reuse or alternative disposal economics, relative ruggedness and
reliability of alternative control devices, and the ability to retain desired efficiency under all probable operating conditions. Control equipment needs to be
both rugged and reHable, in part because managers are often reluctant to shut a process down for control equipment repair. Efficiency of control devices
varies with processing conditions, flow rate, temperature, emission concentration, and particle size. Control devices should be designed to handle these
variations. Combinations of gaseous and particulate pollutants can be especially troublesome as gaseous removal devices are often unsuitable for heavy
loadings of insoluble soEds. Concentrations of soluble particulates up to 11 g/m3 have been handled in gas absorption equipment with some success.
However, to ensure rapid particle solution, special consideration must be given to wet—dry interfaces and adequate Equid quantities.
Control of Gaseous Emissions
Five methods are available for controlling gaseous emissions: absorption, adsorption, condensation, chemical reaction, and incineration. Atmospheric
dispersion from a tall stack considered as an alternative in the past, is now less viable. Absorption is particularly attractive for pollutants in appreciable
concentration; it is also appEcable to dilute concentrations of gases having high solvent solubiEty. Adsorption is desheable for contaminant removal down
to extremely low levels (less than 1 ppmv) and for handling large gas volumes that have quite dilute contaminant levels. Condensation is best for
substances having rather high vapor pressures. Where refrigeration is needed for the final step, elimination of noncondensible diluents is beneficial.
Incineration, suitable only for combustibles, is used to remove organic poEutants and small quantities of H2S, CO, and NH3. Specific problem gases such
as sulfur and nitrogen oxides require combinations of methods and are discussed separately.
Absorption. Good references for absorption (qv) of gases are 39—42 (see also Distillation). AU types of absorption equipment, including plate
columns, can be used for ah contaminants, but the devices most frequendy used are packed columns, open spray chambers and towers, cyclonic spray
towers, and combinations of sprayed and packed chambers. For particulate-free gas, the counter-current packed tower is the usual choice to maximize
driving force. Plastic packings with extended surface area and high void space with wetted temperatures below 85°C minimize pressure drop and provide
high mass transfer and constant Equid film renewal. Insoluble particulates and heavy loads of soluble ones plug counterflow packing rapidly; concurrent
flow tends to reduce plugging. Six months of plug-free operation of a parallel-flow bed absorbing SiF4 in water has been reported (43).
The cross-flow packed scrubber (Fig. 1) (44) is even more plug-resistant and has been used extensively as a pollutant absorber. Typical design
parameters for gas absorption only are gas-flow rate G = 2.44 kg/(s-m2) and Equid flow rate L = 2.03 kg/(s-m2). When particulates are present, sprays
directed at the bed-retaining grillwork are added upstream. Most of the soEds are impacted on the first 150 mm of packing in the gas-flow direction. To
remove deposited soEds, the Equid rate over the first 300 mm of packing is increased to L = 13.56 kg/(s-m2), maintaining a rate of L = 2.71 kg/(&m2) over
the remainder of the bed. As indicated eadier, soEds loading up to 11 g/m3 has been successfully handled. A single transfer unit has been achieved in a
gas-flow depth of 200 mm absorbing HF in water. Because scale-up can be a problem, a computer program has been developed for the necessary
calculations (45).
Fig. 1. Cross-flow packed scrubber.
Open horizontal spray chambers (43) and vertical spray towers have both been used when soEds are present. Cyclonic spray towers provide slightly
better scrubbing when the optimum spray droplet size is used. Figure 2 illustrates various spray chambers. When a large number of transfer units are
required, single tower absorption contacting may be unsatisfactory. Loss of counter-currency resulting from spray entrainment limits the number of
transfer units achievable in a single tower. Using vertical spray towers (Fig. 2b), 5.8 transfer units have been attained (46). Seven transfer units in a
commercial cyclonic spray tower have been reported (47) and 3.5 transfer units have been reported in horizontal spray towers. The venturi scrubber is
advantageous for particulate collection, especially submicrometer particles, along with gas absorption, but it has been indicated that these scrubbers are
Kirk-Othmer Encyclopedia of Chemical Technology (4th Edition)
386
AIR POLLUTION CONTROL METHODS
Voll
limited to 3 transfer units (46).
(a)
Gas outlet
Clean gas out
Drain
(d)
Fig. 2. Types of spray towers: (a) horizontal spray chamber; (b) simple vertical spray tower; (c) cyclonic spray tower, Pease-Anthony type; (d) cyclonic spray
tower, external sprays.
Water is the most common absorption Equid. It is used for removing highly soluble acidic gases such as HC1 [7647-01 -OJ, HF [7664-39-3J, and SiF4
[7783-61-1J, especially if the last contact is with water of alkaline pH; NH3 [7664-41 -7] can also be recovered in water if the final contact is acidic. Problems
can arise in the initial absorption stages when contacting high concentration gases and volatile neutralizing agents. Vapor phase reactions can produce a
submicrometer smoke which is often difficult to wet and collect. These problems can be avoided if initial contact is made at points in the tower where
reactant vapor pressures are low. Gases such as SO2, CL [7782-50-5J, and H2S [7783-06-4J can also be absorbed more readily in an alkaline solution.
Absorption of SO2 has been practiced in two coal-fired power plants in England using seawater. Tremendous once-through water quantities have been
used; thus the discharge water is still unsaturated with SO2. Scrubbing of SO2 using alkaline ammonium salt solutions, as in the Cominco (48) process, has
also been practiced. Many absorption processes have been commercialized for removing SO2 from coal-fired power plant flue gas. Organic liquids such as
dialkyl aniline, the various ethanolamines, and methyldiethanolamine [105-59-9J can also be used for absorption of particulate-free acidic gases. Low
volatility oils and solvents such as kerosene [8008-20-6J can be used to absorb organic vapors as long as the scrub liquid volatility is low enough to prevent
vapor loss and atmospheric contamination. Control of VOC emissions from small industrial sources by absorption, adsorption, and condensation has
been compared (49). Organic compound oxidation and fire are other hazards to be considered.
Disposal of recovered gaseous pollutants can be a problem. Precipitation of the pollutant as an insoluble sludge may be possible through the
addition of lime or other reagents. The sludge may be thickened by settling, then dewatered by centrifugation or filtration; however, sludges containing
70% water are not uncommon. Disposal to streams is not feasible and impounding in landfills or tailing ponds is becoming less acceptable. Conversion of
the pollutant to a usable form is preferable. Recovered sulfate and sulfite compounds, if ammoniated, may be incorporated into fertilizer or may be used by
nearby sulfate—sulfite pulp and paper mills. Recovered halogens can be an even greater problem.
Adsorption.
Adsorption (qv) of gases has been reviewed (40,50) (see also Adsorption, gas separation). Adsorption, used alone or in combination with other removal
methods, is excellent for removing pollutant gases to extremely low concentrations, eg, 1 ppmv. When used in combination, it is typically the final step.
Adsorption, always exothermic, is even more attractive when very large gas volumes must be made almost pollutant free. Because granular adsorbent beds
are difficult to cool because of poor heat transfer, gas precooling is often practiced to minimize adsorption capacity loss toward the end of the bed.
Pretreatment to remove or reduce adsorbable molecules, such as water, competing for adsorption sites should also be considered (41).
Kirk-Othmer Encyclopedia of Chemical Technology (4th Edition)
387
AIR POLLUTION CONTROL METHODS
Voll
Adsorbents may be divided into two categories: general and specific. The most common general adsorbent, activated carbon, does a good job
adsorbing organic molecules of all types in the presence of polar molecules such as water vapor. Carbon is one of the few adsorbents that will work in a
humid gas stream. However, water vapor will be adsorbed as well and provision for adequate bed capacity must be made. Specific adsorbents are typically
simple or complex metal oxides (see Molecularsieves). They show greater selectivity than carbon and preferentially adsorb strongly polar molecules. They
usually cannot be used for pollution control in the presence of water vapor. Impregnated adsorbents typically contain carbon and a chemically reactive
material to remove some particular pollutant. Examples are carbon impregnated with 10—20% bromine to react with olefins, iodine to react with mercury
vapor, or lead acetate to remove H2S.
Desorption. Pollutants, once adsorbed, may be disposed of by discarding the saturated adsorbent or after adsorbent regeneration. Discarding
may be attractive when the quantity of adsorbed material is small, the adsorption process occurs infrequendy, or the cost of fresh adsorbent is insignificant
compared to the cost or inconvenience of regeneration. In such cases the adsorbent may be contained in a paper carrier or disposable cartridge. If the
adsorbed material is not toxic or cannot be removed by landfill leaching, ordinary landfill disposal maybe acceptable. However, adsorbate compliance with
TSCA (Toxic Substances Control Act) and RCRA (Resource Conservation and Recovery Act) regulations for disposal should be ascertained and utilization
of a hazardous waste landfill may be mandated. If both adsorbent and adsorbate are combustible, suitable incineration may be a better disposal method or
it may also be possible to return the saturated adsorbent to the manufacturer for regeneration. When economics or toxicity dictate adsorbent regeneration,
desorption may be accomplished by heating, evacuating, stripping with an inert gas, displacing the adsorbate with a more readily adsorbed material, or
some combination of these methods. The desired form of the recovered pollutant and its subsequent handling may influence the choice. If the bed is
heated to the adsorbate's atmospheric boiling point, the adsorbed pollutant will boil off in undiluted form and can then be condensed for process reuse or
disposal. Heat-sensitive materials that are apt to decompose and plug the adsorbent are treated at reduced pressure and temperature. Desorption by
stripping with an inert gas often produces a more concentrated form of the pollutant than in the original effluent, but separation of the pollutant from the
stripping gas is sometimes difficult. This pollutant concentration method may be desirable, however, if the ultimate disposition of the material is
incineration. Up to a 40-fold increase in pollutant concentration has been achieved by inert gas stripping (51). Complete separation of pollutant and
stripping gas can also be effected by partially condensing the stripped pollutant, reheating, and then recycling. Displacement of adsorbed pollutant with
another material is often accomplished through steaming. Once the adsorbent is saturated with water, however, a second regeneration cycle is required to
remove the water. In reality, steaming is a combination of methods: displacement, bed heating, and adsorbate stripping.
Regardless of method, desorption is never complete. Adsorbent capacity is always less following regeneration than it is on initial loading of
adsorbent. Some adsorbable materials undergo chemisorption: they chemically combine with the adsorbent. An example is the Reinluft process (52) for
removing SO2 from flue gas on activated carbon. The SO2 is attached to the carbon as sulfuric acid. Desorption occurs only upon heating to 370°C; a
mixture of CO2, evolved from the chemically bound carbon, and SO2 are driven off.
Adsorption Application. Figure 3 illustrates pollutant depletion from the carrier gas as it travels through the bed in a typical "adsorption
wave." Over time, the adsorbent becomes saturated near the bed inlet and the pollutants must penetrate the bed more deeply before being adsorbed. When
the maximum permissible pollutant concentration which can be discharged, (Q, is reached at the outlet, "breakthrough" has occurred, and the adsorbent
must be regenerated. The adsorption cycle time is represented by the horizontal displacement between the adsorption curves for the fresh bed and the bed
at breakthrough. Cycle times are controlled by the depth of the bed provided and the quantity of gas treated per unit of adsorbent. Stationary beds are used
for disposable canisters and for many regenerable appEcations. For very large gas-flow volumes or high pollutant concentrations, a static bed would be
exhausted too rapidly and fluidized-bed and traveling-bed systems are used. In a fluidized-bed adsorbent granules are well-mixed and an adsorption wave
does not exist. The bed's capacity may be quite low unless staging is practiced. Fluidization's advantage in single-stage beds is that the adsorbent can be
removed continuously from the bed through solids flow into a second regeneration vessel and then continuously returned to the adsorption chamber (see
Fluidization). In traveling-bed systems, spent adsorbent is continuously removed from the bottom, regenerated in another vessel, and continuously
recharged at the top of the adsorption bed. Solids flow is downward, and gas flow is upward, ie, countercurrent. A newer development (53), described as
chromatographic adsorption, consists of injecting a cloud of adsorbent particles into the gas stream. Adsorption occurs during the concurrent flow of
effluent and suspended particles. The adsorbent is then removed in a conventional bag filter. Some final adsorption takes place as the gas flows through
the adsorbent layer on the filter bag.
Fully saturated
sorbent
Fig. 3. Passage of the adsorption wave through a stationary bed during the course of an adsorption cycle. The progressing S-shaped curves indicate the
nonadsorbed vapor concentration by position in the bed at different time periods. Cb represents the maximum permissible oudet concentration for release
to the atmosphere.
In another new technology, called pressure-swing adsorption (54), the adsorption bed is subjected to relatively short pulses of higher pressure gas
containing the species to be adsorbed. The bed is then partially regenerated by reducing the pressure and allowing the adsorbed material to vaporize. By
controlling the gas flow and the pressure, the pollutant can be transferred from effluent to another gas stream. This same result can be achieved by
temperature fluctuation, but bed temperature changes cannot be as rapidly controlled as bed pressures.
Typical adsorption pollution applications have included odor control in food processing (qv): odor and solvent control in chemical and
manufacturing processes such as paints and coating operations, pulp and paper manufacture, and tanneries; odor control from foundries and animal
laboratories; and radioactive gas control in the nuclear industry. Additionally, small carbon-filled canisters have been mandated on U.S. automobiles in
recent years to reduce evaporative fuel emissions from gasoline engines. Similar adsorption equipment is used to control vapor emissions from fuel-tank
filling in states requiring this type of control because of noncompliance with ozone NAAQS regulations. An increasing emphasis on the control of toxic
and hazardous organic vapor emissions as presented in the Clean Air Act of 1990, should mean an increase in adsorption applications for air pollution
Kirk-Othmer Encyclopedia of Chemical Technology (4th Edition)
388
AIR POLLUTION CONTROL METHODS
Voll
control (49).
Condensation. Control or reduction of volatile gases and vapors by condensation is most feasible for organic compounds (49,55).
Compounds having low vapor pressures at room temperature are treated in water-cooled or air-cooled condensers, but more volatile materials often
require two-stage condensation, usually water cooling followed by refrigeration. Minimizing noncondensable gases reduces the need to cool to extremely
low dew points. Partial condensation may suffice if the carrier gas can be recycled to the process. Condensation can be especially helpful for primary
recovery before another method such as adsorption or gas incineration. Both surface condensers, often of the finned coil type, and direct-contact
condensers are used. Direct-contact condensers usually atomize a cooled, recirculated, low vapor pressure Equid such as water into the gas. The recycle
Equid is often cooled in an external exchanger.
If condensation requires gas stream cooling of more than 40—50°C, the rate of heat transfer may appreciably exceed the rate of mass transfer and a
condensate fog may form. Fog seldom occurs in direct-contact condensers because of the close proximity of the bulk of the gas to the cold-Equid droplets.
When fog formation is unavoidable, it may be removed with a high efficiency mist coEector designed for 0.5—5-|lm droplets. Collectors using Brownian
diffusion are usually quite economical. If atmospheric condensation and a visible plume are to be avoided, the condenser must cool the gas sufficiendy to
preclude further condensation in the atmosphere.
Chemical Reaction. Reaction of gaseous pollutants can open up new pathways for recovery. Utiliza tion of alkaline scrubbing solutions to
collect acidic gases has been discussed. Nitrogen oxides can be decomposed to N2 and O2 by reaction with H2 or CH4. Many odors can be controlled by
scrubbing organic compounds with solutions of strong oxidants such as potassium permanganate [7722-64-7]\ KMnO4; nitric acid [7697-37-2]\ HNO3;
hydrogen peroxide [7722-84-1H2O2; hypochlorites; and ozone, O3. Gas—soEd reactions such as the introduction of hydrated lime into a SO2-containing
flue gas stream (56) are also feasible although these schemes usually fall significantly short of 100% pollutant removal. Dry injection of soEd sodium
bicarbonate [144-55-8]\ NaHCO3, has been studied for removal of both SO and XO from flue gas, for HC1 removal from waste incineration emission
(57), and for other hazardous gases from hazardous waste incineration (58). Flue gas humidification generally aids in achieving a more complete gas-soEd
reaction. A volatile vapor pollutant can be rendered significandy less volatile by increasing its molecular weight, such as by vapor phase chlorination. An
example of a gaseous pollutant control problem that can be changed to a particulate one is the reaction of gaseous HC1 with ammonia to produce NH4C1
smoke.
Incineration. Gases sufficiendy concentrated to support combustion are burned in waste-heat boilers, dares, or used for fuel. Typical
pollutants treated by incineration are hydrocarbons, other organic solvents and blowdown gases, H2S, HCN, CO, H2, NH3, and mercaptans. VOC
emissions are frequendy destroyed by incineration (59—61) as are gases evolving from landfills. Dilute gases, not more concentrated than 25% of then lower
explosive limit, are burned in gas incinerators which use either catalytic oxidation or a direct dame contact to provide preheating and ignition. The former
require a more steady source of pollutants in regard to both flow and composition; they are more sensitive to overheating and to poisoning. Dhect flame
incinerators are frequently equipped with heat interchangers to minimize fuel consumption if they are in steady use (see Incinerators.) Flares burning
externally are unlikely to destroy hazardous and toxic gases totally because of such variables as atmospheric quenching of flame temperature, variations in
wind turbulence, and heat losses to the surroundings. For efficient combustion, the flare should be enclosed on the sides with a lightweight housing
containing a high temperature, fiberous insulating material. This reduces heat losses and shields the flame from external turbulence. Temperatures and
residence times for the efficient destruction of various hazardous organic vapors are known (62,63). Airborne combustible soEds could well be destroyed
by properly designed incinerators, but Ettle has been reported in this area. Combustion could be effected following the procedures developed for burning
pulverized coal (see Coal conversion processes) or for burning activated sludge from sewerage treatment.
Specific Problem Gases. Sulfur dioxide, nitrogen oxides, and vehicular exhaust gases are widespread gas pollutants that present specific
problems (see Airpollution; Atmospheric models). A revised U.S. Clean Ah Act has been enacted that requhes greater control of the emissions of these
gases. Germany and Denmark have already adopted acid rain regulations on sulfur and nitrogen oxide emissions.
Major sources of sulfur dioxide are the combustion of sulfur-containing fossil fuels, the manufacture of sulfuric acid and sludge acid purification,
sulfur recovery from petroleum processing, nonferrous smelting, and pulp and paper manufacture. Combustion emissions are controlled by substituting a
low sulfur fuel source, by fuel desulfurization and refining (see Coal; Petroleum; Fuels, synthetic), and by sulfur removal either in the combustion process
or from the flue gas (see Sulfurremoval and recovery). Many methods of sulfur removal from flue gas have been developed and voluminous Eterature is
available (64—88). Flue gas desulfurization (FGD) systems can be classified as (7) throwaway vs regenerative and (2) wet vs dry. In throwaway processes,
the removed sulfur is discarded, often as calcium sulfate—sulfide sludge; in the regenerative processes, the sulfur is recovered in a useful form. Most of the
eadier commercial processes used wet scrubbing and reaction with lime or limestone. Table 2 Ests a number of FGD processes. For new boiler
installations, fluid bed combustion is often used. The coal is burned in a fluid bed of limestone which reacts during the combustion with the sulfur in the
fuel to produce calcium sulfate. A number of newer FGD processes have been investigated or partially commercialized as shown in Table 3. SO2 emission
from sulfuric acid manufacture is controlled by interpass adsorption (91) and, when necessary, by the addition of tail-gas treatment to reduce the effluent
below 400—500 ppmv (see Sulfuric acid and sulfur trioxide). Emissions of SO2 from nonferrous smelters are being controlled by conversion to sulfuric
acid even when the acid is subsequently neutralized with limestone (92). Other SO2 emission control methods for smelters are discussed in references
(93,94) and for pulp and paper manufacture in References 95—98 (see Pulp; Paper).
Table 2. Commercialized Flue Gas Desulfurization (FGD) Processes
Process name Process description References Wet throwaway processes
dual alkaE system SO2 absorbed in tower with NaOH—Na2SO3 recycle solution. 78, 82 CaOH or CaCO3 added externally to precipitate CaSO4, regenerate NaOH; make-up NaOH or Na2CO3 added. Process attempts to eliminate scaling/plugging problems of limestone slurry scrubbing.
limestone slurry scrubbing Limestone slurry scrubs flue gas. SO2 absorbed, reacted to CaSO3. 82—84, 87 Further air-oxidized to CaSO^ settled/removed as sludge. Lower cost and simpler than other processes. Disadvantages: abrasive/corrosive, plugging and scaling, poor dewatering of CaSO4.
Dowa process Similar to dual alkaE except A12(SO4)3 solution used in scrubber. Limestone addition regenerates reactant, precipitating CaSO4-2H2O crystals which dewater more readily. Reduces plugging/scaling.
CHIYODA thoroughbred 121 process Single vessel used to absorb SO2 with limestone slurry and oxidize product to gypsum.
forced oxidation Limestone scrubbing, products air-oxidized to gypsum in separate tank.
lime spray drying Wet/dry process. Lime slurry absorbs SO2 in vertical spray dryer 82 forming CaSO3~CaS, H2O evaporated before droplets reach
Kirk-Othmer Encyclopedia of Chemical Technology (4th Edition)
389
AIR POLLUTION CONTROL METHODS
Voll
bottom or wall. Dry solids collected in baghouse along with flyash. Dry throwaway processes
direct injection Pulverized lime or limestone injected into flue gas (often through 79, 80, 86 burner). SO2 absorbed on solid particles. High excess alkali required for fairly low SO2 absorption. Finer grinding, lime preheat, flue gas humidification benefit removal. Particulate collected in baghouse.
Trona sorption Trona (natural Na2CO3) orNacolite (natural NaHCO3) injected 79, 80, 85, 86 into boiler; SO2 absorbed to higher extent than with dry lime. Product collected in baghouse. Also can capture high quantity of NCL Wet regenerative processes
Wellman-Lord After flue gas pretreatment, SO2 absorbed into Na2SO3 solution; 81, 82 solids and chloride purged, SO2 stripped, regenerating Na2SO3, and SO2 processed to S.
magnesium oxide process SO2 absorbed from gas with Mg(OH)2 slurry, giving MgSO3~MgSO4 solids which are calcined with coke or other reducing agent, regenerating MgO and releasing SO2.
citrate- scrubbing SO2 absorbed with buffered citric acid solution. SO2 reduced with 78 H2S to S. H2S produced on site by reduction of S with steam and methane.
Flakt-Boliden process SO2 absorbed with buffered citric acid solution. SO2 stripped from solution with steam.
aqueous carbonate SO2 absorbed into Na2CO3 solution in spray dryer, producing dry Na2SO3 particles.
SULF-X process FeS slurry absorbs SO2; product calcined producing S vapors which are condensed.
Conosox process K^CC^ and К salt solutions absorb SO2 forming K^SC^ which is converted to thiosulfate, KHSO3 which is converted to H2S, and regenerates K^CC^. Dy regenerative processes
Westvaco SO2 adsorbed in activated carbon fluid bed. SO2, H2O, and SO2 react at 65—150°C forming H2SO4. In next vessel, H2SO4 + 3H2S at 150°C gives 4S + 4H2O. Bed temperature is increased to vaporize some S. Remaining S reacts with H2 to H2S.
copper oxide adsorption SO2 adsorbed on copper oxide bed forming CuSO4. Bed is 79 regenerated with H2 or H2~CO mixture giving concentrated SO2 stream. Bed is reduced to Cu, but reoxidized for SO2 adsorption.
Table 3. Newer FGD Processes and Research
Process type and comments Paper number in reference 88
direct injection 4A-1, 4A-2, 4A-3, 4A-5
German technology 4A-6
Austrian technology 4A-7
wet calcium-based FGD
critique of present processes and improvements 5B-2
dual alkali process 5B-10
Austrian experiences 5B-13
German experiences 5B-16
German (Bischoff) process 5B-15
jet bubbling reactor for simultaneous SO2—particulate removal 5B-14
U.S. FGD status 1-1
retrofit economics 2-1, 2-2, 2-3
spray dryer technology 3-1, 3-2, 3-3, 3-4
SO — \O removal
activated coke processes 4B-7
dry sorbent injection 4B-8
spray dryer adsorption—oxidation 4B-5
utilizing ferrous chelates 4B—6, also see Ref. 89
gas rebuming, sorbent injection see Ref. 90
European experience 1-3, 1-4, 1-5
Japanese experience 1-6
Major sources of nitrogen oxide emission are nitrogen fixation during high temperature combustion, nitric acid manufacture and concentration (see
Nitric acid), organic nitrations (see Nitration), and vehicular emissions. During combustion in the presence of air, N2 and O2 react in the high
temperature of the flame to produce NO. This reversible reaction favors NO formation as the temperature increases (see Table 4). Because the kinetic rate
of the decomposition reaction drops essentially to zero at temperatures below 870°C, reversion of the NO to N2 and O2 upon cooling does not occur.
Kirk-Othmer Encyclopedia of Chemical Technology (4th Edition)
390
AIR POLLUTION CONTROL METHODS
Voll
Nitrogen present in the fuel tends to produce other nitrogen oxides in addition to NO, which leads to higher exhaust concentrations of NO than would
exist from the combustion-driven nitrogen fixation alone. NO reacts with O2 at a slow but steady rate in the atmosphere and thus NO ends up as NO2.
Combustion chemistry and NO formation and control have been reviewed (100,101). NO formation in combustion may be reduced by maintaining low
excess air (0.5% O2 or less in flue gas), employing two-stage combustion where the first stage is fuel-rich and reducing (high temperature) and the second
stage is oxidizing (1000—1100°C), flue gas recirculation, burner design, combustion chamber modifications, and burner placement. Combustion technology
(qv) methods (102—112) are limited in their NO__ reduction capabilities to ranges of 200—300 ppmv NO . Target emission levels for acid rain control are
expected to be 80—100 ppmv of NO . Retro-fitting with low NO burners is one of the least expensive ways to achieve NO reduction. References 103 and
104 discuss low NO burner design. An overview of NO control from industrial sources has been presented (113); references 114—116 discuss NO
control retrofit. Other control methods which are being developed for combustion NO emissions are selective catalytic reduction (SCR), Thermal Denox,
and urea reduction (88,113—122).
Table 4. Time to Form NO in a Gas Containing 75% N2 and 3% O2a
Temperature, °C Time to form 500 ppmv NO, s NO equiEbrium concentration, ppmv
1315 1370 550
1538 16.2 1380
1760 1.10 2600
1982 0.117 4150
aRef. 99.
SCR is a standard, commercially demonstrated process which has been applied to large coal-fired power boilers in Germany and Japan. Many of the
catalysts are preformed, supported catalysts impregnated with vanadium and tungsten oxides (see Catalysts, supported) that catalyze the reduction of NO
to N2 and O2 by reaction with NH3 at flue gas temperatures of 250—450°C. A catalyst charge is very expensive; it constitutes as much as 45% of the capital
cost of the SCR portion of boiler installation. Moreover, difficulties that have been encountered involving catalyst poisoning point to the need for careful
selection of coal sources. Thermal Denox (122,118) destroys NO by gas-phase reduction with NH3. It is limited to temperatures of 900—1100°C and an
oxygen content below about 3% by volume. Developed by Exxon, it has been used appreciably in petroleum and process industry combustion gases, as
well as in a few coal-fired boilers in Germany. Although less expensive than the SCR process, it has not received significant power industry attention,
probably as a result of its limited temperature appEcation window and the need to use an appreciable excess of NH3 (unless a mixture of both NH3 and H2
can be employed). The urea reduction process (119), utilizing a urea-water solution sprayed into the boiler flue gases, has a somewhat wider operating
window (800—1200°C, up to 7% O2) than Thermal Denox. The process is less well developed and has not been commercially demonstrated except for
trials on a power boiler in Sweden. Another process undergoing research development destroys NO by the reaction of isocyanic acid obtained from
cyanuric acid sublimation (120,121). This method appears to have good prospects for diesel engine exhaust NO removal.
Control of NO emissions from nitric acid and nitration operations is usually achieved by NO2 reduction to N2 and water using natural gas in a
catalytic decomposer (123—126) (see Exhaust control, industrial). NO from nitric acid/nitration operations is also controlled by absorption in water to
regenerate nitric acid. Modeling of such absorbers and the complexities of the NO — HNO — H2O system have been discussed (127). Other novel control
methods have also been investigated (128—129). Vehicular emission control is treated elsewhere (see Exhaust control, automotive).
Control of Particulate Emissions
The removal of particles (Equids, soEds, or mixtures) from a gas stream requires deposition and attachment to a surface. The surface maybe continuous,
such as the wall and cone of a cyclone or the coEecting plates of an electrostatic precipitator, or it may be discontinuous such as spray droplets in a
scrubbing tower. Once deposited on a surface, the collected particles must be removed at intervals without appreciable reentrainment in the gas stream.
One or more of seven physical principles (see Table 5) are frequendy employed to move particles from the bulk gas stream to the collecting surface. In
some instances, a few other principles such as diffusiophoresis and methods of particle growth and agglomeration have also been used. The magnitude of
the force developed to move a particle toward a collecting surface is influenced markedly by the size and shape of the particle. Gravity settling is efficient
only for large (D > 40“50 /xin) particles; flow-line interception and inertial impaction are effective for particles down to 2—3 |lm; diffusional deposition
and thermal precipitation, increasingly efficient with a decrease in particle size, are highly efficient for particles <0.5 /mi; and electrostatic forces are the
strongest forces available to act on fine particles, which are loosely defined as <2-3 /xm. There is a gap in collectabiEty between 0.2 and 2.0 |lm. Particles in
this range are the most difficult to charge electrically.
Table 5. Physical Principles Affecting Particle Movement and Collection
Control
principle______
gravity settling
Related equations
Dp(,Pt - Pg) 9
18 цд
(1)
^ = 1 + -^ (2)
centrifugal
deposition
T=ut
dt
JPPtVcT (3)
18 РдГ
flow line
interception
1
2.00 - 1пАД£
1 + Nsf ) ln(l -I- Nsf )
Nsf ^ + NsfU
Conditions and assumptions Reference
s
free falling, rigid sphere; fluid continuum; for 130—132
Nre <0.1, viscous, streamline flow, no
wake formation, CD = 24/ NRE ; for NRE >
0.1, other functions of must be used to
calculate CD
Cunningham-Stokes correction factor for
small particles when fluid does not behave as
continuum; in ай, for Dp = 1 /zm, Km = 117;
for Dp = 0.1 /zm, Krn = 2.7
the tangential velocity, Pp thus the particle 133,134
velocity, Ut}P is a function of the radius r,
usually VcT oc l/rn; for free gas rotation and
conservation of momentum, n = 1; for
cyclones, n varies between 0.5 and 0.7
for cylindrical target; A%is the ratio of 135,136
particle diameter, D , to the diameter of the
Kirk-Othmer Encyclopedia of Chemical Technology (4th Edition)
391
AIR POLLUTION CONTROL METHODS
Voll
inertial
imp action
V.
UtUr
18 ngD(
(5)
diffusional
deposition
KmkT (6)
‘iirp.gD
collector; assumes that particle will be
collected if it approaches within D /2 from
collector; none of the particles are reentrained
viscous flow; Stokes law region; physically,
NSI is the stopping distance in a quiescent
fluid of a particle with initial velocity UQ/D^
Figure 5 relates NSI to collection efficiency
particle diffusivity from Stokes-Einstein
equation; assumes Brownian motion; D
same order of magnitude or greater than
mean free path of gas molecules (0.1 |4m at
NTP)
136,139
electrostatic
precipitation
thermal
precipitation
(thermophores!
11D
11D
U
5^(2 +0.557 (7) efficiency for spherical collector; Nsc < 105 or Dp < 0.5 /tm in ambient air 140
-?—T+ 0.55 NPE V sc RE J (8) efficiency for cylindrical collector, 1 < NRE < 104 and Nsc < 100
E E D U„ = о P P 0 e ^gKv y ’ conductive spherical particles; streamline gas flow; gas behaves as continuum; negligible particle acceleration 141
r/ = 1 - (10) Deutsch-Anderson equation; assumes no reentrainment from collector; well mixed turbulent flow, turbulent eddies small
1 fcgTR dT (И) compared to precipitator dimensions D less than mean free path of gas; free 142,143
5(1 + тга/8) P dX molecular or Knudsen flow regime; a = fraction of inelastic collisions, usually taken as 0.81
3 dT (12) Dp same order of magnitude or greater than
2PgT (2+kp/kg) dX mean free path of gas molecules
Terms are defined in a nomenclature at the end of this article.
Terminal settling velocity can be calculated for spherical particles (eq. 1) in streamline flow (Stokes' law region). Small particles fall faster then
predicted as they tend to "slip" between gas molecules, and the Stokes-Cunningham correction factor (eq. 2) must be applied as indicated in Table 5. Figure
4 gives terminal settling velocities of spherical particles in air. For nonspherical particles, multiplication of equation 1 by a sphericity correction constant
Ks = 0.8431og (\p/0.065) has been recommended (145). The sphericity \|7 (146) is defined as the ratio of surface area of a sphere (of volume equal to the
particle) to the surface area of the particle. References 147 and 148 give further refinements when sphericity is less than 0.67.
Equivalent standard
Fig. 4. Terminal velocities in air of spherical particles of different densities settling at 21°C under the action of gravity. Numbers on curves represent true
(not bulk or apparent) specific gravity of particles relative to water at 4°C. Stokes-Cunningham correction factor is included for settling of fine particles.
Kirk-Othmer Encyclopedia of Chemical Technology (4th Edition)
392
AIR POLLUTION CONTROL METHODS
Voll
The air viscosity is 0.0181 mPa-s(=cP) and density is 1.2 g/L.
Particles approaching targets such as a baffle, impaction element, fiber, or droplet and having appreciable velocity have sufficient momentum that
they may collide with the target. Particles direcdy in line are collected by how-line interception and efficiency can be predicted from equation 4. Larger
particles outside the streamlines leading to the target maybe collected on the sides of the target because of the particle's inertia. Langmuir and Blodgett
(149) correlated target efficiency with the inertial separation number of equation 5. Figure 5 gives target efficiencies by impaction number for three target
shapes. Many moderate energy collectors capture smaller particles by a combination of direct interception and inertial impaction. It has been suggested
(151) that the combined efficiency for the two mechanisms can be obtained from
’/total = 1 ~ (1 ~ ’/Pb) (1 ~ ’/ш)
(13)
Efficiency of particle collection is most frequendy defined on a mass basis by
/mass of particles entering — mass of particles leaving
у mass of particles entering
(14)
Efficiency may also be expressed in terms of the number of particles or area of particles entering and leaving the collector. An alternative terminology, used
especially when collection efficiency is high, is that of penetration of particles through a collector. This focuses on the particles lost rather than those caught
and penetration is defined as unity minus the fractional efficiency, Pt = 1 — t/. Typical penetration of fine particles through different collectors as a function
of particle size is shown in Figure 6. Measurement of the difficulty of particle collection in terms of transfer units has been suggested (153) ; the number of
required collector transfer units is defined as Nt = ln[l/(l — ??)].
Fig. 5. Target efficiency of spheres, cylinders, and ribbons. The curves apply for conditions where Stokes' law holds for the motion of the particle (see also
NSI in Table 5). Langmuir and Blodgett have presented similar relationships for cases where Stokes' law is not valid (149,150). Intercepts for ribbon or
cylinder are /16; for sphere, /24.
Fig. 6. Penetration and fractional efficiency for fine particles. From ref. 152,
Kirk-Othmer Encyclopedia of Chemical Technology (4th Edition)
393
AIR POLLUTION CONTROL METHODS
Voll
courtesy ofM.cGraw-H.ill, Inc.
Equation 14 applies to the overall efficiency of a collector, but a collector's performance on a specific dust results from the integration of the
collector performance for each incremental particle size fraction handled. Typical grade-efficiency curves, graphs of collector efficiency vs particle diameter,
for a silica dust (specific gravity 2.3) in many different collectors have been published (154,155). For other particle densities, a correction factor based on the
effect of density on the predominating collection mechanism must be applied. The concept of "cutpoint," the particle size collected with 50% efficiency,
was introduced to develop generalized grade-efficiency curves (133—134). In a generalized grade-efficiency curve such as that shown in Figure 7, collection
efficiency is plotted against the dimensionless ratio D /D . An improved method for predicting collection equipment performance from particle size
distribution has been suggested (156).
Fig. 7. Cyclone generalized grade-efficiency curves. The solid line is for the Lappie cyclone dimension ratios given in Figure 9. The dotted line is theoretical
efficiency based on equations of Rosin and co-workers (157). From ref. 158,
courtesy of McGraw-Hill, Inc.
Gravity Settling. The gravity settling chamber is one of the oldest forms of gas—solid separation. It maybe nothing more than a large room
where the well-distributed gas enters at one end and leaves at the other. Such chambers were used at the turn of the century for collecting products such as
lamp-black. Although mechanical conveyors might minimize labor costs, gravity settlers have largely disappeared because of bulky size and low collection
efficiency. They are generally impractical for particles smaller than 40—50 |lm.
Centrifugal and Cyclonic Collection. A cyclonic collector is a stationary device utilizing gas in vortex flow, produced either by tangential
entry of the gas or by spin baffles with axial gas inlet, to collect particles. Centrifugal force acting on the particles in the gas stream causes them to migrate
to the cylindrical containing wall where they are collected by inertial impaction. Since the centrifugal force developed can be many times that of gravity, very
small particles can be collected in a cyclone, especially in a cyclone of small diameter.
Four common types of cyclone design are illustrated in Figure 8. In the conventional cyclone (Fig. 8a), the gas enters tangentially and spins in a
vortex as it proceeds down the cylinder. A conical section causes the vortex diameter to decrease until the gas reverses on itself and spins up the center to
the outlet pipe or "vortex finder." The cone causes flow reversal to occur sooner and makes the cyclone more compact than if a cylinder of constant cross
section were used. The dust particles collected on the wall flow down in the gas boundary layer to the cone apex and are discharged through an air lock or
into a dust hopper serving a number of parallel cyclones. Collection efficiency for a given size particle decreases with increasing diameter. Conventional
cyclones are usually 600—915 mm in diameter, although it is possible to build them in other sizes. The cyclones shown in Fig. 8c have very similar gas-flow
but generally range from 25 to 305 mm in diameter. Because of the small diameter, these have higher collection efficiencies, but lower gas capacity. Large
numbers of small cyclones are mounted in a housing with a common tube sheet and dust hopper. Spin vanes in the annular gas inlets produce the vortex
flow.
Kirk-Othmer Encyclopedia of Chemical Technology (4th Edition)
394
AIR POLLUTION CONTROL METHODS
Voll
Fig. 8. Cyclone types commonly used (161): (a) conventional, large diameter, tangential inlet, axial discharge; (b) smaller tube, tangential inlet, peripheral
concentrated aerosol discharge; (c) small tube axial inlet and discharge; (d) smaller tube axial inlet, peripheral concentrated aerosol discharge.
Courtesy of American Industrial Hygiene Association.
In other cyclone types (see Fig. 8b and 8d), the dust is not completely removed from the gas stream; instead it is concentrated into about 10% of the
total flow. Removal of the dust in aerosol form increases collection efficiency by reducing the dust entrainment losses which always occur at the cone apex
in an ordinary cyclone. This purge dust-aerosol flow can increase overall dust collection efficiency by as much as 20—28% of that otherwise lost. Obviously,
another separation device, bag filter or another cyclone, is required to complete the separation task on the purge flow. Such a cyclone dust-concentration
arrangement maybe especially attractive if the increased cyclone efficiency gives adequate particulate removal for a large volume gas stream. The smaller
purge stream can then be handled in a more efficient dust separation device. In the type shown in Fig. 8b, the gas reverses direction internally as in
conventional cyclones; in that shown in Fig. 8d, straight-through flow, is convenient for connecting large gas volume breaching without changes in gas
direction.
Cyclone Efficiency. Most cyclone manufacturers provide grade-efficiency curves to predict overall collection efficiency of a dust stream in a
particular cyclone. Many investigators have attempted to develop a generalized grade-efficiency curve for cyclones, eg, see (159). One problem is that a
cyclone's efficiency is affected by its geometric design. Equation 15 was proposed to calculate the smallest particle size collectable in a cyclone with 100%
efficiency (157).
^NeVe(Pp - Pg)
(15)
For smaller particles, the theory indicates that efficiency decreases according to the dotted line of Figure 7. Experimental data (134) (solid line of Fig. 7) for
a cyclone of Fig. 9 dimensions show that equation 15 tends to overstate collection efficiency for moderately coarse particles and understate efficiency for
the finer fraction. The concept of particle cut-size, defined as the size of particle collected with 50% mass efficiency, determined by equation 16 has been
proposed (134).
d = I 9ugWl
PC У 2тгАеК(/?р - pg)
(16)
This equation is for Figure 9 cyclone dimension ratios. The term IV, the effective number of spirals the gas makes in the cyclone, was found to be
approximately 5 for Lappie's system (134). The solid line grade-efficiency curve of Figure 7 is also used with Lappie's cyclone, which is a somewhat taller,
less compact cyclone than many commercial designs.
Kirk-Othmer Encyclopedia of Chemical Technology (4th Edition)
395
AIR POLLUTION CONTROL METHODS
Voll
Fig. 9. Dimension ratios of Lappie (134) cyclone design. From Ref. 160,
courtesy of Academic Press.
A more compact cyclone design dimension ratio has been developed for the American Petroleum Institute (API) (162). A third set of cyclone
dimension ratios has also been given (163). It is known that cyclone efficiency increases as dust loading increases but most efficiency prediction methods
other than that of the API neglect this fact. The generalized grade-efficiency curve of Figure 7 is used for a Lappie cyclone to predict collection efficiency
for particle sizes other than the cut-size. Then an integrated overall collection efficiency is calculated by an interval integration. Needed are a narrow-range
particle size analysis of the airborne dust as shown in Table 6 and a grade-efficiency curve for the cyclone for the dust density to be utilized. A
narrow-range particle size distribution may be obtained by plotting the actual analysis on log-probability graph paper and interpolating. Each narrow
particle interval is represented by its midpoint size and the corresponding collection efficiency shown in Table 6, columns 3 and 4 respectively. The product
of columns 2 and 4 is then entered in column 5 as the fraction collected. The summation of column 5 gives overall collection efficiency for the cyclone.
Table 6. Technique for Calculating Cyclone Overall Efficiency for Dust Particles*
(1) Size range, |lm (2) % by wt in size range (3) Median diameter in range, |lm (4) Efficiency of median diameter , % (5) Fraction collected, %
104-150 3 127 100.0 3.0
75-104 7 89.5 98.8 6.9
60-75 10 67.5 97.3 9.7
40-60 15 50 96.3 14.5
30-40 10 35 95.5 9.6
20-30 10 25 95.0 9.5
15-20 7 17.5 93.0 6.5
10-15 8 12.5 90.0 7.2
7.5-10 4 8.75 85.3 3.4
5-7.5 6 6.25 78.5 4.7
2.5-5 8 3.75 65.0 5.2
0-2.5 12 1.25 33.0 4.0
Total collection 84.2
Columns 1—5 are explained in text.
From a grade efficiency curve.
Cyclone Design Parameters. As indicated earlier, a cyclone's geometric design affects efficiency. The oudet pipe should extend at least
differentially below the bottom of the gas inlet to prevent inlet dust from short-circuiting direcdy to the oudet pipe. The gas inlet should be tangential to
the top plate of the cyclone to eliminate eddy flows and turbulence as well as reduce top-plate erosion. Efficiency is increased with a narrower gas inlet
since the dust has a shorter distance to travel to reach the cyclone wall. However, narrower inlets mean longer, less compact cyclones so that 2:1 rectangular
inlets are common. Grade-efficiency is predicated on uniform distribution of gas and dust across the gas inlet. To achieve uniform distribution, duct
transitions on the inlet should be gradual (no more than a 15° included angle). Elbows on cyclone inlets should not be used unless they concentrate the
dust toward the outside or top of the cyclone.
Traditionally, cyclone dimensions are multiples of outlet pipe diameter D. Typical barrel diameters are 2Do but efficiency increases at constant Do up
to a 3D barrel diameter. Efficiency also improves as barrel and cone length are increased at constant Do up to the natural length of the vortex. At constant
inlet velocity, efficiency increases as outlet diameter (and all ratioed dimensions in a family of cyclones) is decreased. Improved efficiency is attained at the
Kirk-Othmer Encyclopedia of Chemical Technology (4th Edition)
396
AIR POLLUTION CONTROL METHODS
Voll
expense of loss in cyclone gas handling capacity. Although cut-size equations indicate that cyclone efficiency can increase without limit (subject only to
available pressure drop) as inlet gas velocity is increased, this is not the case. Cyclone collection efficiency goes through a maximum as inlet velocity is
increased causing separated dust to be reentrained from the cyclone wall (164). Higher efficiencies can be reached by reducing the gas outlet pipe area in
relation to the gas inlet area (164).
The inside wall of a cyclone should be smooth. Bumps and projections create internal turbulence and dust layer reentrainment. Dust discharge from
the cyclone cone apex is also important and a smaller apex outlet will get the dust discharge farther from the turbulent area of flow reversal. Theoretically,
the apex opening should be less than j of the gas outlet pipe diameter. However, the outlet should not be so small that it bridges easily. Outlets of 75—150
mm are generally desireable. A good gas seal is needed for dust discharge, especially if the cyclone is under vacuum. Atmospheric air sucked in through the
apex reentrains collected dust and reduce cyclone efficiency significantly. Dust hoppers are often used and a good head of dust in the hopper helps to seal
against leakage through rotary valves and motorized flap gates. It is important to keep the dust level in hoppers pulled down, however, because dust
backing up into the cone of the cyclone reduces collection efficiency to zero.
Practically all cyclone performance data have been related to a present cyclone set of geometric ratios. One model for cyclone grade-efficiency curves
has been tested against reported commercial cyclone efficiencies (159). A good fit was obtained.
Cyclone Pressure Drop. Typical cyclone pressure drops range from 250 to 2000 Pa. Most data are reported for clean air flowing through the
cyclone and these data are conservative for design purposes. Many investigators have unsuccessfully attempted to relate pressure drops to inlet and outlet
dimension ratios. Manufacturers' calibration curves or experimental measurements on cyclones of similar dimension should be used where possible. If a
reHable experimental measurement is available, however, the pressure drop at other conditions can be estimated by first evaluating the constant К in
equation 17.
ди = ксст9/т
(17)
Some empirical equations to predict cyclone pressure drop have been proposed (165,166). One (166) reHably predicts pressure drop under clean air flow for
a cyclone having the API model dimensions. Somewhat surprisingly, pressure drop decreases with increasing dust loading. One reasonable explanation for
this phenomenon is that dust particles approaching the cyclone wall break up the boundary layer film (much like spoiler knobs on an airplane wing) and
reduce drag forces.
Cyclone Problems. Problems may be encountered in cyclone appHcation because of fouling and caking, or from erosion, or when using
multiple cyclones. Multiple cyclones are designed so that each cyclone handles a prorated share of gas and dust and the overall efficiency of the system is
the same as that calculated for an individual unit. This is the case, however, only when each cyclone receives identical dust fractions (size and loading) and
gas flow. Since cyclone efficiency increases with flow and dust loading and is affected by particle-size distribution, the design of the inlet gas distribution
system must accompHsh the proper distribution. Otherwise, those cyclones with lower gas flow and dust concentration (and perhaps finer dust) will have
much poorer efficiency. When multiple cyclones share a common dust hopper, it is important that all cyclones have essentially uniform pressures at the
cone apex. Wall caking, unequal gas flow or dust distribution resulting from pressure drop decreases that occur with increases in dust loading, or partial
plugging of cone or cyclone inlets can all cause unequal apex pressures. Unequal pressures will cause gas from higher pressure cyclones to flow into the dust
hopper and back into the cyclones having lower apex pressure. This short-circuiting can result in heavy dust reentrainment and decreased efficiency.
Fouling of cyclone walls is usually caused by sticky or hydroscopic particulates, or by moisture or other vapor condensation. To prevent particle
sticking, a highly poHshed finish, a graniteware glass coating, or fluorocarbon plastic lining may be used on the walls or alternatively, revolving wall scrapers.
Cables or chains are sometimes suspended from the center of the vortex outlet. Vortex flow causes the cable or chain to rotate and thus scrape the wall,
sometimes freeing the buildup. Condensation must be prevented by decreasing the dew point of the gas or by heating or insulating the cyclone wall. In
extreme situations, the cyclones may be enclosed in a heated chamber.
Erosion can be a severe problem even in well-designed cyclone installations when handling a heavy loading of coarse and abrasive angular particles.
One answer is lining the cyclone, using protective materials. The cyclone may be made of wear-resistant plate. Linings may be hard and thick sacrificial
castings, wear-resistant appHed welded coatings, or of rubber, ceramic shapes, reinforced castable, or brick. Alternatively, cyclones may be used in series,
increasing the velocity as dust loading is decreased. In this method, first-stage efficiency will be low, but the bulk of the coarser and more abrasive particles
will be collected, permitting higher velocities in second- and even third-stage cyclones. Inlet velocities and dust loadings at which erosion may be excessive
have been calculated (Table 7) (167). Dust particles smaller than 5—10 |4m do not cause appreciable erosion.
Table 7. Dust Loadings and Cyclone Inlet Velocities above Which Erosion Is Excessive*
Dust load, g/m3 Inlet velocity, m/s
0.7 35
7.0 20
7000 2
Recomputed from ref. 167.
Other problems affecting cyclone efficiency are usually caused by abuse or poor maintenance. Problems may arise from temperature warpage, rough
interior surfaces, overlapping plates and rough welds, or misalignment of parts, such as an uncentered (or cocked) vortex outlet in the barrel.
Other Centrifugal Collectors. Cyclones and modified centrifugal collectors are often used to remove entrained Hquids from a gas stream.
Cyclones for this purpose have been described (167—169). The rotary stream dust separator (170,171), a newer dry centrifugal collector with improved
collection efficiency on particles down to 1—2 |lm, is considered more expensive and hence has been found less attractive than cyclones unless improved
collection in the 2—10-|lm particle range is a necessity. A number of inertial centrifugal force devices as well as some others termed dynamic collectors have
been described in the Hterature (170).
Electrostatic Precipitation. An electrical precipitator can collect either soHd or Hquid particles very efficiently. Using a special design, it can
also collect soHds and Hquids in combination and perform an adequate job of gas absorption. Particles entering a precipitator are charged in an electric field
and then move to a surface of opposite polarity where deposition occurs. For particles <2 /xm, electrical forces are stronger than any other collectional
force. Thus precipitators have the highest energy utilization efficiency. Advantages are low pressure drops (often 250-500 Pa = 1.9-3.8 mm Hg ), low
electric power consumption, and low operating costs (mostly capital-related charges). Additionally, particulates are recovered in an agglomerated form,
rendering them more easily collectible in case of reentrainment. Unfortunately, precipitators are also the most capital-intensive of all control devices, and
mechanical, electrical, and process problems can cause poor on-stream time and reHability.
Precipitators are currently used for high collection efficiency on fine particles. The use of electric discharge to suppress smoke was suggested in
1828. The principle was rediscovered in 1850, and independently in 1886 and attempts were made to apply it commercially at the Dee Bank Lead Works in
Great Britain. The installation was not considered a success, probably because of the crude electrostatic generators of the day. No further developments
occurred until 1906 when Frederick Gardiner Cottrell at the University of California revived interest (U.S. Pat. 895,729) in 1908. The first practical
demonstration of a Cottrell precipitator occurred in a contact sulfuric acid plant at the Du Pont Hercules Works, Pinole, California, about 1907. A second
installation was made at Vallejo Junction, California, for the Selby Smelting and Lead Company.
Precipitators can be classed as single- or two-stage. In single-stage units, used for industrial gases, the particles are charged and collected in the same
electrical field. Negative discharge (gas-ionizing) polarity is practically always used in single-stage precipitators because higher voltages can be achieved
without sparkover. However, negative polarity also produces O3 from O2-containing gases. In two-stage precipitation, the particles are charged in an
Kirk-Othmer Encyclopedia of Chemical Technology (4th Edition)
397
AIR POLLUTION CONTROL METHODS
Voll
ionizing section and precipitated separately. Two-stage units are used for air purification, airconditioning (qv), or ventilation. They are operated at lower
voltage so there is less electrical hazard, less sparking, and fewer fires. These units have also received some consideration for the collection of condensed
hydrocarbon mists. A positive polarity is always used for room air conditioning to avoid ozone formation.
Single-Stage Precipitators. Single-stage precipitators are used for control of fine particulates such as those in mists and smoke, in the
2.5-0.2-Цт range. Recendy, technology in the development of larger and larger units to treat flue gas from 800—1200-MW coal-fired electric power boilers
has been markedly improved. This is a specialized market and these precipitators are well beyond the normal needs of the process industries to which this
article is primarily directed.
A complete precipitator consists of (7) discharge electrodes, (2) collecting surfaces (plates or tubes), (J) a suspension and tensioning system for
discharge electrodes, (4) a rapping system to remove dust from tubes, (5) dust hoppers and dust-removal system, (6) gas-distribution system and
precipitator housing, and (7) power supply and control system. Single-stage precipitators are subclassified as plate or tube type. Typical arrangements are
shown in Figure 10. A plate precipitator may have tall (10—15 m), parallel, flat plates with 228—400 mm horizontal spacing and discharge electrodes (wires)
that are suspended midway between the plates. Plate precipitators are utilized for collecting flyash, for high gas-flow appEcations, and for particulates which
are comparatively coarser than those caught in the tube-type equipment. Plate-type precipitators are lower in cost because both sides of the plate serve as
precipitating surfaces. Tube precipitators are frequendy used for liquid mists and sometimes for submicrometer metallurgical fumes. Tubes vary in diameter
from 150 to 304 mm; a popular size is 273 mm OD by 4.5—5.0 m long. One discharge wire is centered in each tube. Dirty gas generally enters the hopper at
the bottom and travels upward through the tubes. A tube sheet may be provided top and bottom; tubes may be rolled or welded into a flat top tube sheet
for a mist precipitator. For solids, however, each tube must have a round to square transition at the top end. The tubes are then welded together to form
an "egg-crate" sheet. Dust, if deposited on a flat tube sheet, can buildup with a nearly 90° angle of repose and short out the high tension support frame for
discharge electrodes.
High-voltage discharge electrode (—)
Charging field
Charged (—) particles
Collecting baffle
Grounded (+) collecting surface
Discharge electrode tension weight
Particle path
(a)
(b)
Fig. 10. Schematic arrangement of (a) typical plate and (b) tube precipitators (172).
Figure 11 shows a variety of plate and discharge electrode designs. The most common collecting plate design is flat with vertical, perpendicular
baffles at frequent intervals. The plate may be continuous or sectional. The Opzel design is a modification of perpendicular baffles devised to reduce
gas-flow resistance. Discharge electrodes may be round wires or small (2.5—4 mm) diameter rods. The smaller the diameter, the higher the intensity of the
Kirk-Othmer Encyclopedia of Chemical Technology (4th Edition)
398
AIR POLLUTION CONTROL METHODS
Voll
surrounding electric field. The wire must, however, be sufficiently rugged to withstand both tensioning and thermal stresses. In the event of heavy
suspended loads or long spans, wire size may become appreciable. In these cases, a 6 to 9 mm square may be a better design choice because the comers
produce a higher intensity field locally. Square bars are often twisted to give one 90° turn in 25—35 mm of length, producing a high intensity field which
rotates with the length of the discharge electrode. A 5-pointed-star-shaped discharge electrode yields an even higher field intensity. Discharge electrodes
with barbs and punched ribbons may also be used to produce higher intensity electric fields.
Sectional plates
u
Square
Round
Barbed Star Punched
ribbon
□
(b)
Fig. 11. Types of (a) collecting plate and (b) discharge electrode designs.
Discharge electrodes must be tensioned to hold the wire taut and maintain spacing. Tensioning may be accomplished by attaching a weight (5—10
kg), held in a weight-spacing frame to reduce sway, to the bottom of each wire. In some European designs, now offered in the United States, the wires are
stretched between light-weight high-tension pipe frames. The wires may be heavy barbed ribbons that are unlikely to fail from arcing, an important aspect
since no provision is made for wire replacement in these rigid frames. The wire supporting frames are hung from high voltage insulators in suitable
enclosures on top of the precipitator. Dust, fumes, and mist must be prevented from entering these insulator compartments and coating the insulators
with a conductive film. The insulator compartments may be purged with clean air and heated to prevent condensation. In a mist precipitator, liquid drains
from the collecting surfaces, but a dry dust precipitator must be rapped at intervals using a weight, hammers, or vibrators. The dust, broken loose from the
surface, slides down the plate into the dust hoppers. Dust is removed from the hoppers, usually batch-wise, with suitable conveyors. A precipitator's power
supply is usually rectified ac.
Operating Principles. No collection will occur in a precipitator, and no current will flow in the secondary circuit, until gas ionization starts
around the discharge electrode. This process is known as corona formation. The starting voltage for corona in air in a tube precipitator is given as
( 0.0436 \
Vs = (15.5 x
105) brkpDd
(18)
If the effluent is not air-based, it is necessary to multiply by the ratio of the gas electrical breakdown constant to that for air, both taken at 25°C and 101.3
kPa (1 atm).
When corona occurs, current starts to flow in the secondary circuit and some dust particles are precipitated. As potential is increased, current flow
and electric field strength increase until, with increasing potential, a spark jumps the gap between the discharge wire and the collecting surface. If this
"sparkover" is permitted to occur excessively, destruction of the precipitator's internal parts can result. Precipitator efficiency increases with increase in
potential and current flow; the maximum efficiency is achieved at a potential just short of heavy sparking.
Table 8 shows sparking potential in a clean tube precipitator with negative polarity. Sparking potential drops almost directly with decreasing gas
density, but increases with moisture content. At elevated temperatures or reduced pressure, the corona starting voltage also drops, but sparkover voltage
drops faster. Even low conductivity dust deposits can greatly decrease sparkover voltage until the buildup can be rapped off. For ease of operation and
Kirk-Othmer Encyclopedia of Chemical Technology (4th Edition)
399
AIR POLLUTION CONTROL METHODS
Voll
greatest efficiency, the largest possible spread between corona starting voltage and sparkover is desireable. With positive polarity, sparkover occurs at much
lower potential and it may become nearly impossible to operate a positive polarity precipitator at elevated temperatures.
Table 8. Sparking Potential for Small Wire Concentric in a Round Tube
Tube diameter, mm Peak voltage, V Root mean square voltage, V
102 59,000 45,000
152 76,000 58,000
229 90,000 69,000
305 100,000 77,000
Based on gases at atmospheric pressure, 38°C, containing water vapor, air, CO2, and mist, using negative polarity electrical discharge. Recalculated from
data reported in reference 176.
Dust particles entering the electric field become charged. Both negatively and positively charged ions exist in the small core of ionized gas
surrounding the discharge electrode. In a negative polarity precipitator, the positively charged ions are quickly attracted to the discharge electrode and
neutralized. Hence only electrons exist outside the corona area and travel through the gas space to the grounded collecting plate. Two mechanisms of
particle charging exist: charging by ion bombardment (often called field charging) and charging by ion diffusion. A number of equations to predict particle
charging rate have appeared in the literature (141,175). In field charging, electrons collide with dust particles and charge transfer may occur. Eventually, the
particle will develop a charge sufficient to repel other electrons, a phenomenon termed charge saturation. Field charging is rapid and most effective on
larger particles. The larger the particle, the higher the charge density, and thus the easier is precipitation. Coarse particles (5—30 |lm) can be collected almost
completely in a precipitator. The lower size range for effective field charging is on the order of 0.5—1.5 |lm, depending on particle dielectric constant.
In diffusion charging, particles are too small and mobile for rapid charging by ion bombardment. They become charged by collision caused by
motion of the gas molecules. Diffusion charging becomes efficient on particles smaller than 0.2 |lm and has been demonstrated to be effective on particles
down to 0.05 |lm. These fine particles are charged rapidly and have higher charge density at saturation. Unlike field charging, the rate of charging by
diffusion is independent of electric field strength. For particles between 0.2 pm and 1.5—2.0 pm neither charging mechanism is highly efficient, but both
operate. Particles in this size range are the most difficult to collect efficiently. Figure 12 compares experimental and calculated particle charge levels for
0.3-pm particles. The field has been reviewed (177) and a particle-charging equation which has been used in computer-modelled precipitator design has
been proposed (178,179).
Ion density X s
Fig. 12. Comparison of actual and predicted charging rates for 0.3-pm particles in a corona field of 2.65 kV/cm (141). The finite approximation theory
(173) which gives the closest approach to experimental data takes into account both field charging and diffusion charging mechanisms. The curve labeled
White (141) predicts charging rate based only on field charging and that marked Arendt and Kallmann (174) shows charging rate based only on diffusion.
From ref. 174,
courtesy ojAddison-Wesley Publishing Co.
It is possible to set up a force balance on a given size particle in a precipitator and hence calculate its trajectory. Three forces tend to move a particle
toward the collecting plate: the charge on the particle, the integrated average field strength through which the particle moves, and the electric wind. This last
results from the steady flow of ions from the discharge electrodes to the collecting plates; the motion is similar to thermal convective currents. Particle
movement is resisted by drag on the particle. In solving a force balance, it is convenient to define the particle migration velocity as the average velocity with
which the particle moves toward the collecting surface. This velocity is a function of particle size, field strength, and such particle material properties as
electrical conductivity and dielectric constant. The factors affecting migration velocity for conductive particles larger than 1 |lm that are in the Stokes' law
region can be expressed as (141):
у _ EoEpPp
^Kvtig
(19)
For conductive particles smaller than 1 pirn, equation 19 should be multiplied by the Cunningham correction factor, (1 + АХ/D). For air at room
temperature, the molecular mean free path, X, is 0.1 |lm, and A is 1.72. If the particles to be collected are not electrically conductive, equation 19 should be
multiplied by [1 + 2(6 — 1/6 + 2)] to correct for the dielectric constant of the material. Equation 19 can be used to predict the relative effect of changes in
particle size distribution, gas viscosity, and operating voltage on migration velocity and precipitator efficiency. An interval-integration procedure may be
used to calculate average migration velocity for a given particle size distribution, although more often, an average migration velocity is measured
experimentally in an existing precipitator for a similar dust. Average migration values are sometimes referred to as drift velocities to distinguish these values
from migration velocities which should be related to specific particle sizes. Table 9 lists drift velocities encountered in typical commercial precipitators.
Because of the demand for higher efficiency precipitators, drift velocities from less efficient ones must be adjusted for design utilization. To achieve higher
Kirk-Othmer Encyclopedia of Chemical Technology (4th Edition)
400
AIR POLLUTION CONTROL METHODS
Voll
efficiency, a greater portion of the difficult to charge particles must be collected; consequently the drift velocity achieved will be lower.
Table 9. Precipitator Applications of Drift Velocities, Z7, cm/s
Precipitator appEcation Average valuea Typical range
pulverized coal fly ash, power boilers 13.1 3.9-20.4
pulp and paper manufacturing particulate 7.6 6.4-9.4
sulfuric acid mist 7.3 6.1-8.5
cement kiln dust (wet process) 10.7 9.1-12.2
nonferrous smelter 1.8
steel open hearth furnace 4.9
Eon blast furnace 11.0 6.1-14.0
foundry cupola 3.0
a Average values are based on typical efficiencies of precipitators purchased. Drift velocities will drop if higher efficiencies are required. Recomputed from
data of reference 175.
The theoretical development of migration velocity involves only field strength, particle charge, and electric wind force; therefore, migration velocity
should be independent of forward gas velocity. However, mild turbulent flow can move particles close to the collecting surface, enhancing collection, and
giving improved measured migration velocity (180,181). A precipitator developed in Japan to give high migration velocities incorporates a pulse precharger
and zigzag collecting electrodes (182). The zigzag collectors probably enhance particle migration through turbulent diffusion.
Collection Efficiency. The classical Deutsch and Anderson equation for predicting particle collection efficiency is
= 1 _ е-(^еЛе/9е)
(20)
AJcan be replaced by K, which is defined in terms of precipitator geometric parameters and gas passage velocity. For tube precipitators,
Ke = 4Le / DtVe \ for plate precipitators, Ke = Le/ BeVe. Assumptions involved in applying the Deutsch and Anderson equation to an entire precipitator
are that all parallel gas passages have the same gas velocity (this is not necessary if the variation in gas velocity is known because the equation can then be
applied passage by passage) and that no reentrainment occurs once the particle is collected. Uniform gas distribution has been improved in some designs
with inlet baffling and gas-flow modeling tests (183) and particle reentrainment can be reduced by better dust rapping. Examining К indicates that
efficiency can be improved by increasing treatment time (longer flow path in the electric field or lower gas velocity) or collection plate area, decreasing the
distance from the discharge electrode to the collecting surface, or changing gas or electric field conditions to give higher migration velocity.
Precipitator Operating Problems. Dry dust precipitator operating problems may result from dust reentrainment, dust resistivity, gas
distribution, or electrical arcing or lack of voltage control, and some of these problems have been discussed in detail (184). Dust reentrainment can arise
from a localized high gas velocity, rapping problems, or dust resistivity. The collected dust becomes agglomerated and is easier to redeposit if entrained.
There is an optimum time interval, force intensity, and direction for rapping to minimize reentrainment. A rapping force normal to the plate is most
effective. The intensity of a single rap should be just enough to snap the dust cake loose from the plate and allow it to slide en masse down into the dust
hopper. Too intense a blow may shatter the cake and project it out into the bulk gas stream as a cloud of small particles; an inadequate blow will require
repeated raps to break the cake loose. Electrostatic forces hold the collected dust to the collection surface and the longer the dust layer is in place, the more
tightly it is held. When the cake stays in place too long, greater forces are required to dislodge it and chances of reentrainment are greater. One blow of
optimum intensity every 1—2 min, continuous intermittent rapping, is better than a burst of high frequency vibration as discussed in rapping parameter
experiments (185,186). However, periods of 30—90 min between successive raps may be better (187). Baffles on the collecting plate tend to keep the bulk
gas velocity away from the dust layer, providing a quiescent zone through which dust can slide downward during rapping.
Reentrainment can occur at either too high or too low a dust resistivity. With too low a dust resistivity (usually less than 1000 ohmcm), the dust loses
its charge to the collecting plate, randomly tumbles off, and is reentrained. Unbumed carbon in flyash is an example. A precipitator is completely
unsatisfactory as a total collector for very conductive and fine dusts such as carbon black. However, in such cases precipitators are used as electrostatic
agglomerators and final collection occurs in a cyclone. Very high dust resistivity (about 2-5 x IO10 ohmcm) causes a phenomenon known as back corona
resulting in poor operation and reentrainment. High resistivity causes a high voltage gradient across the dust layer. The resulting weaker field potential
between the discharge electrode and the dust layer surface gives lower drift velocity and collection efficiency. Moreover, the potential drop across the dust
layer maybe high enough to produce corona discharge, causing the particles to disperse from the collecting surface. These problems have been
encountered in some coal-fired power plant precipitators when high sulfur coal is replaced with low sulfur coal. Dust resistivity varies with precipitating
temperature and gas moisture content. Resistivity goes through a maximum with temperature increase, but higher moisture levels reduce resistivity at any
temperature. Typical remedies are (7) cool the gas (a "cold side" precipitator) (188); (2) treat the gas at a quite high temperature ("hot side" precipitator
(189) perhaps requiring alloy construction); and (J) condition the gas by adding steam or moisture. If the dust does not absorb moisture, chemical
conditioner may be needed to make the dust hygroscopic. SO3 is often added for alkaline dusts (190) and NH3 for acidic ones (191). A correlation for
predicting flyash resistivity from composition has been developed (192), and the entire dust resistivity problem has been discussed (193—195).
To achieve maximum efficiency, the precipitator should be operated at the highest voltage possible without excessive sparkover or arcing.
Precipitator voltage must be a function of the conditions of the process such as gas temperature, moisture, dust resistivity, and chemical composition. A
desirable option for modem precipitators is a voltage-optimizing control circuit which usually contains current-limiting controls and spark-rate sensors.
Voltage is automatically varied to maintain light sparking at 50—100 sparks per minute. Strength of sparking can be greatly affected by the pulsation
frequency and wave-form of the current. Full-wave, rectified 60—Hz a-c current permits a higher peak voltage than that obtained from a nonpulsing d-c
current because the voltage is not at the peak value long enough to produce extensive gas-path electrical breakdown or a heavy arc. Higher frequency
current permits the use of higher voltages resulting in higher efficiency without sparkover. The use of a 500-Hz pulse generator and special wave shape has
been demonstrated as extremely beneficial (175). Unfortunately, special frequencies or wave shapes have seldom been used commercially because of the
cost of power conversion equipment; however, pulse-energization equipment for precipitators (196) has become available in Denmark. Automatic control
systems are also available (197). Precipitator on-stream reliability can be enhanced using electrical sectionalization. Fewer discharge electrodes per rectifier
result in the loss of a smaller portion of the precipitator if a wire breaks and shorts out. Increasing the number of power rectifiers, however, also increases
purchase cost and increases in reliability must be balanced against increases in capital cost.
Power Supply. The preferred power supply for a modem precipitator is a siEcon semiconductor power rectifier submerged in oil along a
step-up transformer. Typical output voltages are 70—105 kV peak (45—67 root mean square average de) negative polarity producing output of either two
half-waves or one full-wave. Lower voltages are used in some cases of smaller discharge electrode to collecting surface distances. Individual set capacities
are typically 15—100 kVA, 250—1500 mA de. Input power is usually 460 V ± 5%, single phase 60 Hz. Power supply capacity must be carefully matched to
the needs of the precipitator for maximal operation. The power supply is generally chosen to operate at 70% of capacity or higher. A greatly oversized
power supply can result in poor electrical control, high peak currents or excessive sparking, frequent whe bum-out, and overall poor collection efficiency.
Too small a power supply can result in its operation being controlled by current limitation and the inabiEty to reach optimum voltage for maximum
coEection efficiency. Gas temperature and composition, dust loading and resistivity, whe alignment, adequacy of rapping system to keep thin dust layers,
collecting surface per electrical section, and geometric design are all factors that can affect power package sizing and selection (198).
Kirk-Othmer Encyclopedia of Chemical Technology (4th Edition)
401
AIR POLLUTION CONTROL METHODS
Voll
Precipitator Application and Cost. There were over 4100 precipitator installations in the United States in 1970, more than 1330 of which
were in electric power generating stations for flyash removal (199). About half this number was in each of the next three largest groups of appEcations:
metallurgical, chemical, and fuel-gas detarring. The number of installations may well have doubled by 1990. Design approaches have been discussed (175)
and the Air and Solid Waste Management Association (200) has developed an information checklist for precipitator specification and selection. A summary
(201) is available as is a review (202) of capital and operating costs for flyash precipitators at TVA steam power plants.
Wet Electric Precipitators. Tube precipitators have long been used for collection of acid mists and for removal of tar from coke oven gas.
More recendy, plate precipitators employing water sprays have become commercially available for the collection of dry, especially fine particulate, dusts
(203). Dust resistivity problems are eliminated because the water-saturated condition renders all particles conductive. All problems with particle
reentrainment are also eliminated, because the particles migrate to a water film on the collecting surfaces. Conductive particles have higher migration
velocities and therefore there are no problems with high resistivity dust and back corona either. Thus wet precipitators can be smaller for the same
collection efficiency. Particle dielectric strength becomes a much more important variable, however, and materials having low dielectric constants, such as
hydrocarbon mists, are much more difficult to collect than a water-wettable particle. Relationships for predicting particle charge and relative collection
efficiency in a wet precipitator that take the effect of dielectric constant into account have been developed (204). A wet precipitator can also be used to
absorb water soluble gases; the pH of the spray liquid can be adjusted to enhance absorption. Comparative tests of wet precipitators with and without the
electric field indicate that corona discharge also enhances absorption, but the reason is not known.
There are some disadvantages to wet precipitators. Water can enhance latent corrosion problems and require the utilization of expensive alloy
construction instead of the carbon steel often used in a dry precipitator. Some wet precipitators using plastic components have been developed to lower
costs in corrosive situations. Additionally, the collection of pollutants in aqueous media may create water treatment and waste handling problems which can
equal the cost and complexity of the precipitator installation itself. Spray rate and distribution can be critical in a wet precipitator and must be carefully
applied so as not to restrict operating voltage. Recirculated spray water may become supersaturated with low solubiEty compounds which plate out on
surfaces or build up in critical parts of the precipitator. Recirculated suspended soEds can erode or plug spray nozzles. Wet precipitators have been most
useful in treating mixtures of gaseous and submicrometer particulates such as aluminum pot line and carbon anode baking fumes, fiberglass fume control,
coke oven and metallurgical fumes, and phosphate fertilizer emissions.
Two-Stage Precipitators. In a two-stage precipitator, the particles are charged in an initial ionizing stage and then coEected in a second
section consisting of closely spaced plates as illustrated in Figure 13. Basic modular units are often stacked in banks as needed for the design gas flow. The
ionizing electric field is produced by fine tungsten wkes, often 0.20 mm in diameter, spaced midway between large diameter (30 mm) grounded rods or flat
plates at a 90-mm spacing. Corona discharge and occasional sparking to ground are produced by a 13-kV positive potential. The collecting stage usuaHy
consists of a number of parallel 20-gage plates spaced about 6—8 mm apart and separated by insulators. Alternate plates are grounded; the others are
charged positively at 5—7.5 kV. Charged particles are attracted to the grounded plates while being repeEed by the charged ones. The long, smooth plate
surfaces prevent corona or sparking. Thus there is no means in the coEector by which entrained particles may be recharged and coEected. The plates may
be coated with a film of water-soluble adhesive or oE to aid coEected particle retention. CoEection modules, often 600—1000 mm long, are mass produced.
Typical superficial gas velocities are in the range of 1.5—2.8 m/s. The two-stage precipitator has very low (0.042 kW-s/m3) power consumption and a
pressure drop in the range of 25—50 Pa (0.2—0.4 mm Hg). Operating voltage is suppEed from self-contained power packs that usuaEy have soEd state
rectifiers and sufficient controls to prevent excessive arcing in the ionizer and to control shorting in the coEector.
Grounded receiving
electrodes . Electrostatic \ field 4 >. ' now ) Discharge /.'”"i7j......... electrodes 3,000 Dust у 7.7.X’.'.Y~. partides -••••: Electrostatic' field Ionizing Alternately grounded and charged collector plates -+ 6.000 V > 6,000 V + 6,000 V - + 6,000 V Collecting
Fig. 13. Operating principle of two-stage electrical precipitator. From Ref. 205,
courtesy ofM.cGraw-H.ill, Inc.
Because the coEecting space for dust is very smaE, the use of two-stage precipitators is limited to Eght dust loads or coEection of Equid mists. The
most frequent use is for ak cleaning for ventilation and ak conditioning. In many of these units, the coEection section must be manuaEy removed for
cleaning when dust thickness reaches about 1.5—2.0 mm. Alternatively, they can be cleaned in place with automaticaEy controEed traveling spray cleaning
and adhesive coating systems. A major advantage of the two-stage precipitator is its low cost. CoEection of Equids is possible, eliminating cleaning needs,
but conductive Equids may short the spacing insulators. Two-stage units have also been used for coEecting hydrocarbon mists. Single-stage CottreE
precipitators are seldom used on combustible materials because of the danger of fire or explosions from arcs. Since two-stage precipitators operate at much
lower voltages and sparking is absent from the coEection stage, they are considered to be inherendy safer. Sparking can and does occur in the ionizer stage,
however, and extreme caution should be exercised if explosive mixtures could be present.
Electrically Augmented Particle Collection. In the 1970s considerable developmental research was devoted to improved fine particle
coEection by using a combination of electrostatic forces and other coEection mechanisms such as inertial impaction or Brownian diffusion. A number of
devices were developed and some successfuEy appEed. Little subsequent progress has been made, presumably because of the reduced avaEabEity of
governmental funding. As mentioned eadier, the electrostatic attractive force is the strongest coEecting force available for particles finer than 2—2.5 |lm. It is
therefore logical to couple it with other coEecting mechanisms in an attempt to buEd more highly efficient and cheaper fine particle coEectors. The forces
operating between charged and uncharged bodies decrease in magnitude in the order (206): (7) coulomb force, the attraction of a charged particle to an
oppositely charged particle or surface; (2) charged particle—uncharged conducting coEector; (J) uncharged particle—charged coEector; and (4) charged
particle in a space-charged repulsive field. These relationships have been quantified (207). The coulomb force, or migration of a particle in a gradient electric
field, is, of course, employed in both single-stage and two-stage precipitators. Electrostatics is also operative for charged particles and oppositely charged
water droplets. A coEection efficiency of 85—95% for industrial gases in such a single-stage vertical spray tower and up to 99% coEection efficiency utilizing
two towers in series have been demonstrated (208,209). A number of retrofit instaEations have been made on existing spray towers to enhance coEection of
submicrometer particles.
An investigation of the coEection of charged submicrometer particulates on an oppositely charged 0.8—2.0-mm fluidized bed of sand particles found
up to 90% efficiency. The charged particle—uncharged coEecting surface principle has been used and marketed in a device where particles are initiaEy
charged in a negative polarity ionizer before entering a grounded, irrigated, cross-flow, packed bed of TeEerette packing (211). The charged particles are
Kirk-Othmer Encyclopedia of Chemical Technology (4th Edition)
402
AIR POLLUTION CONTROL METHODS
Voll
brought very close to wetted surfaces in. the confines of tortuous paths through the bed, inducing a "mirror image" charge of opposite polarity in the water
film that causes the particles to impact the water for collection. This device can be used for simultaneous particulate collection and gas absorption.
Submicrometer particles have been collected at 85—90% efficiency in single-stage units and at 98% efficiency using two units in series. The principle of
charging particles in an ionizer and collecting them dry on uncharged filter media such as cellulose fibers has been practiced for many years in some types
of electronic air cleaners. This principle has been applied (212) to improved collection of fine particles in a bag dust filter. Another appEcation of the
charged particle—uncharged collector principle was its application to fine particle collection in venturi (wet) scrubbers. Precharging of particles in an ionizer
permitted efficient collection of submicrometer particles in the venturi with up to a 50% reduction in venturi pressure drop, a major savings in energy.
Unfortunately, a device marketed by Chemical Construction Company disappeared after their bankruptcy, but a similar adaptation is available in France. A
charged-droplet scrubber whose commercial design was installed on steel furnace fumes has been described (213). Severe corrosion and electrical loss
problems resulted in withdrawal of the scrubber.
Research devoted to optimizing design of various electric augmentation hardware items includes: exploration (214) of parameters for preionizer
design; and discussion (215) of detailed mathematical relations for types of charged-droplet scrubbing and means of charging spray particles. Wet
scrubbing appears to have a valid place in air pollution control because of its relatively low capital investment compared to other control techniques for fine
particles. However, wet scrubbing is a marginal control method because of its poor efficiency—energy relationship on fine particles, and thus electric
augmentation should be an attractive means of overcoming the weakness of wet scrubbing at moderate cost.
Particle Filtration. Filtration devices for particle collection can be divided into three categories: cloth filtration using either woven or felted
fabrics in a bag or envelope, paper and mat filters, and in-depth aggregate bed filtration. The first type is used for dry particle removal from gases, but
cannot be employed when liquid particulates are present or condensation is imminent. Subclasses of cloth filters are dust filters using cloth in the form of a
single envelope (pocket filter) and housings containing rows of stacked cannister filters. The pocket filter has low dust-handling capacity, and when
pressure drop becomes too high, the element must be removed and either discarded or manually cleaned. It is used primarily for very low dust loads,
occasional emissions, or as a safeguard against broken bags after a normal baghouse filter. Likewise, the multiple canister filters cannot be cleaned and must
be replaced once high pressure drop occurs. Filters in the form of fiber pads or pleated paper in frames are used for preparing clean air for process use or
ventilation. They have limited dust-holding capacity and are seldom used for air pollution control.
Several types of aggregate-bed filters are available which provide in-depth filtration. Both gravel and particle-bed filters have been developed for
removal of dry particulates but have not been used extensively. Filters have also been developed using a porous ceramic or porous metal filter surface.
Mesh beds of knitted wire mesh, plastic, or glass fibers are used for the removal of liquid particulates and mist. They will also remove solid particles, but
will plug rapidly unless irrigated or flushed with a particle-dis solving solvent.
Dust Filter. The cloth or bag dust filter is the oldest and often the most reliable of the many methods for removing dusts from an air stream.
Among their advantages are high (often 99+%) collection efficiency, moderate pressure drop and power consumption, recovery of the dust in a dry and
often reusable form, and no water to saturate the exhaust gases as when a wet scrubber is used. There are also numerous disadvantages: maintenance for
bag replacement can be expensive as well as a sometimes unpleasant task; these filters are suitable only for low to moderate temperature use; they cannot be
used where liquid condensation may occur; they may be hazardous with combustible and explosive dusts; and they are bulky, requiring considerable
installation space.
Bag filters may be woven or felted, an envelope ("pillow case") supported with an internal wire cage, or a long cylinder or stocking hung freely or
containing an internal wire cage, and subject to either shaking or reverse flow for dust removal. Older filter installations employed woven cloth bags and
the collected dust was generally removed by shaking. Newer bag cleaning methods such as reverse flow utilize nonwoven felted bags. The availability of
fibers is somewhat more limited with felts and one cannot choose a type of weave as with woven fabrics. Three main types of bag filters are illustrated in
Figure 14. A fourth type uses backflow of gas, thus essentially providing back-flushing of the cloth. In most baghouse designs, there is some means of
slowing the entering gas and deflecting it downward so that coarse dust particles drop out into the hopper. This may be as simple as routing the gas around
an inlet baffle. In passing through the filter media, the majority of the dust collects in a dust precoat built up on the bag surface and the cleaned air then
flows to the gas oudet. Deposited dust is removed at intervals to prevent excessive pressure drop. In shaker-cleaning filters (envelope and stocking types),
automatically controlled dampers shut off the air flow through the bag compartment when the bags are to be shaken. In filters designed for continuous
use, a number of parallel compartments are provided to handle flow when one compartment is shut off for cleaning.
Dust outlet
Fig. 14. Types of bag filters: (a) panel or envelope filter; (b) bag or stocking filter; (c) pulse-jet filter (216); (a) and (c) from ref. 216,
courtesy of Academic Press, (b) courtesy ofWheelabrator-Prye.
Kirk-Othmer Encyclopedia of Chemical Technology (4th Edition)
403
AIR POLLUTION CONTROL METHODS
Voll
In the pulse-jet (reverse-flow) filter (Fig. 14c), air flow is usually not shut off during bag cleaning. Rather, one row or group of bags are cleaned while
the rest of the filter remains in service. Dirty gas flows up around the outside of the bag and then through the cloth leaving the dust on the outside of the
bag. An internal wire cage keeps the bag expanded and bag and cage are hung from the top tube sheet. Each tube sleeve contains a venturi casting which
extends inside the bag and the cleaned air exits through this casting. For bag cleaning, compressed air from an orifice in a manifold pipe above the casting
is jetted back down through the venturi. The air pressure, usually at 620—690 kPa (90—100 psi), is released by a solenoid valve actuated by a timer. This jet
of air in the venturi induces backward flow of cleaned air from other tubes and an air bubble forms in the top of each bag being cleaned, snaps the cloth
away from the cage, and displaces the dust layer. The compressed air pulse must last long enough to allow the bubble to move slowly down the length of
the bag to the bottom, cleaning the entire bag surface as it goes. Frequency of cleaning is set to limit the bag pressure drop just before cleaning to the
maximum desired level, often 1—1.7 kPa (7.5—13 mm Hg). Degree of cleaning can be adjusted somewhat by changing the pressure of the compressed air
and the duration of the pulse. For efficient dust collection, it is desireable to leave a light dust precoat on the bag surface and for long bag life, a minimum
number of cleaning cycles is preferred. Since some bags in the compartment are filtering while some are being cleaned, any reentrainment of the dust is
followed by redeposition on bags remaining in the filtering operation. Dust redeposition is an appreciable problem even at low filtering velocities; it
becomes considerably worse as high filtering velocities are approached (217).
Reverse or backflow bag filters are rather similar in appearance to shaker filters except that the shaking mechanism is eliminated. The stockings are
clamped to a tube sheet at the bottom and are closed at the upper end with a metal cap from which they are suspended. Dirty gas enters below the tube
sheet and passes upward through the bag. When the bag cleaning cycle begins, the flow of dirty gas is shut off, and a fan forces cleaned gas backward
through the bags. A series of rings, sewn into the bags at intervals, prevent the complete collapse of the bag under the reverse-flow conditions. Dust
dislodged by the backflow falls down through the bag to a dust hopper below the tube sheet. The quantity of back-flush gas is usually sufficient to produce
a reverse-flow superficial velocity of 0.5—0.6 m/min through the bag. Woven fabrics are generally used for reverse-flow bag filters. The small reverse-flow
pressures generally used would be insufficient to back-flush felt bags. The principal appEcation for reverse-flow cleaning is in bag-houses using fiberglass
bags that handle gas at temperatures above 150°C such as boiler flue gas containing flyash. Bag collapse and reinflation must be sufficiendy gende that
excessive stress is not applied to the fiberglass fabric.
Dust Filter Design Considerations. Separation of the dust aerosol from the carrying gas is not a sieving or simple filtration process since
filter fabric pore size is much larger than the particles collected. The efficiency of a new bag for fine dust particles is quite low until the bag fibers and
interstices are coated with collected dust. A used bag always has higher collection efficiency than a new one because the entrapped dust particles reduce the
effective pore size. A precoat of coarser particles serves as the filter media for finer ones and filter efficiency drops momentarily after a bag cleaning that is
too thorough. Pressure drop through a cleaned, dust-impregnated bag may be as high as ten times that of a new bag. General particle collection
mechanisms, such as direct impingement, inertial impaction, gravity settling, Brownian diffusion, and electrostatic attraction, apply in initial bag coating. An
understanding of the importance of these mechanisms and their effect on collector efficiency for fine particles as well as for particle release during cleaning
is necessary for the development of improved filtration fabrics (218,219). Direct and inertial impingement are the most important mechanical means for
fabric impregnation of larger particles; Brownian diffusion is the most effective for submicrometer particles.
The effect of dust particle electrostatic attraction to fibers has been investigated (220). When air is passed through a fiber bag, it may generate an
electrostatic charge on the fiber. The relative magnitude and polarity of the charge depends on fiber composition and surface configuration (eg, filament vs
staple) (see Fibers). Table 10 gives a triboelectric series for various fabrics. If fine aerosol particles develop a charge that is opposite to that of the fabric
used in a dust filter, initial collection should be improved. For certain fabrics, collected particles are held so tenaciously that inadequate cleaning occurs and
excessive pressure drop develops very quickly. Selection of another fabric having less electrostatic attraction for the dust might well reduce this problem.
The effect of charge loss may be a significant factor in cloth cleaning because dust seepage following each cleaning cycle can be a severe problem. Selection
of a fabric having greater electrostatic attraction for the dust could be a remedy. Fabric surface characteristics can also affect the retention or release of fine
particles. Filament fabrics tend to have slick surfaces and thus easier release than staple fabric. In woven materials, napped fabrics tend to retain fine
particles and develop dust precoats better than unnapped materials. Finer and tighter weaves resulting in thicker fabrics (increased fabric weight), less
vigorous cleaning, and longer intervals between cleaning cycles all help to reduce leakage of fine particles. In extreme situations, bag precoating with a filter
aid after a cleaning cycle may be necessary. Fabric selection and efficiency have been discussed (221).
Table 10. Triboelectric Series for Commercial Fabrics’*
Polarity Material
+2b wool felt
+20 +15 glass, filament, heat cleaned and silicone treated glass, spun, heat cleaned and silicone treated wool, woven felt, T-2
+10 nylon-6,6, spun nylon-6,6, spun, heat set nylon-6, spun cotton sateen
+5 Odon 81, filament Odon 42, needled fabrics Amel, filament Dacron, filament Dacron, filament, silicone treated
0 Dacron, filament, M-31 Dacron, combination filament and spun Creslan, spun; Azoton, spun Verel, regular, spun; Odon 81, spun
-5 Dynel, spun Odon 81, spun Odon 42, spun Dacron, needled
-10 Dacron, spun; Odon 81, spun Dacron, spun and heat set polypropylene 01, filament
-15 Odon 39B, spun Fibravyl, spun Darvan, needled Ko del
-20 polyethylene B, filament and spun
Ref. 220, reprinted with permission of J. ЛРСЛ.
Kirk-Othmer Encyclopedia of Chemical Technology (4th Edition)
404
AIR POLLUTION CONTROL METHODS
Voll
Pressure drop through a filter bag has two components, the drop through the dust cake and that through the cloth. The flow through both is
streamline so the pressure drop varies direcdy with gas velocity. Pressure drop through the cloth is defined by equation 21. Values of essentially a drag
coefficient for the fabric, have been tabulated (222) for various types of unused cloth. However, the pressure drop for dust-impregnated fabric can be over
ten times as great. Whenever dust cake thicknesses exceed 1.5 mm, the pressure drop across the cloth becomes insignificant. Equation 22 gives the pressure
drop across the dust layer at any point in time following cleaning. If it is assumed that dust concentration, C, and gas flow volume are constant with
time, then vnd — CdVf0> where 9 is the time since the end of the last cleaning cycle and upon substitution equation 23 results. Despite the squared gas-how
term, flow is streamline, not turbulent.
ДРС = kcfigVf
(21)
= kd^gmdVf
(22)
APd = kd^gC'dVf®
(23)
The term essentially a drag coefficient for the dust cake particles, should be a function of the median particle size and particle size distribution, the
particle shape, and the packing density. Experimental data are the only reHable source for predicting cake resistance to flow. Bag filters are often selected for
some desired maximum pressure drop (500—1750 Pa = 3.75-13 mm Hg) and the cleaning interval is then set to limit pressure drop to a chosen maximum
value.
Bag filtering area is another variable to be determined. Selection is usually on the basis of the volume of gas to be filtered and a desired superficial
gas velocity through the bag surface. The design superficial velocity chosen should depend on the dust concentration in the gas to be filtered, the type of
dust, the fineness and abrasiveness, the type of cloth and weave, the cost of the cloth, and the desired frequency of bag cleaning. For woven cloth, the
typical range is 0.005—0.04 m/s; although many users like to limit the velocity to 0.020—0.025 m/s. If the dust is very fine or abrasive, or if the dust
concentration is unusually high, the velocity drops to 0.015 m/s or less. For shaking collectors, sufficient bag area is necessary that excessive velocities do
not exist when one compartment is off-line for shaking. Manufacturers of pulse-jet collectors (felt bags) recommend somewhat higher velocities:
0.025—0.075 m/s. Some users, from experience, prefer to use velocities no higher than those employed for cloth bags with shaker cleaning and the
experiments (217) involving redeposition would appear to support keeping pulse-jet collector velocities at the lower end of the range.
Bag cleaning and control methods need to be selected. For cloth bags, shaking is well-estabHshed, but pulse-jet cleaning is probably the most
popular choice today whenever felted bags can be successfully utilized. Pulse-jet cleaning should be more desireable for appHcations handling heavy dust
loads in continuous operation since it is always controlled by an automatic timing device. Automatic timing can also be appHed to shaker filters, but for
appHcations of light dust loading or intermittent gas flow, remote manual control may be preferred.
Choice of bag fabric depends on chemical compatibility with the dust to be collected (see Table 11) and temperature resistance (see Table 12) as well
as fabric cost. Additional data on fabric resistance to abrasion, temperature, and specific chemical compounds have been presented (223). There are also
other special fabric considerations. Glass fibers do not resist abrasion and flexing well. Surface coatings help, but special cleaning procedures such as
reverse flow are required for these fibers, and longer intervals between cleaning are desireable. Nomex nylon has poor resistance to moisture and should be
avoided whenever condensation is possible. Teflon, although highly resistant, is extremely expensive; cotton and Dacron are relatively inexpensive.
Table 11. Chemical Compatibility of Fibers in Dust Collector Bags
Resistance In acid media In alkaline media
excellent p olypropylene p olypropylene
polyethylene polyethylene
Saran Dynel
Teflon nylon-6,6
Odon Teflon
good Dacron cotton
Dynel nylon-6
glass N omex nylon
wool Saran
unsuitable cotton wool
nylon-6,6 nylon-6 N omex nylon glass
Table 12. Maximum Desirable Operating Temperature for Filter Bags*
Material Temperature, °C Material Temperature, °C
polyethylene 70 Amel 120
Saran 70 Microtain 125
cotton 80 Ko del 135
Dynel 85 Dacron 140
p olypropylene 90 Darvan 150
wool 100 N omex nylon 230
nylon-6,6 and -6 105 Teflon 260
Odon 120 glass 290
Acrilan 120
Longer bag life is obtained if bags are not operated at their maximum temperature.
No bag fabric can withstand truly high temperature, therefore gas cooling is often practiced. The usual methods are indirect cooling, tempering with
cold air, direct water spray cooling, or a combination of any of these. Indirect cooling may take place in radiation panels or ducts exposed to the
atmosphere, in waste heat boilers, or in heat transfer devices such as finned heat exchangers and heat wheels. Tempering consists of mixing air from the
atmosphere and the hot gas in a duct; good mixing must be provided to ensure temperature equilibration. Automatic temperature control can be quite
precise and tempering can reduce the dewpoint of a hot, humid gas. The major disadvantage is that tempering increases the gas volume and hence the
Kirk-Othmer Encyclopedia of Chemical Technology (4th Edition)
405
AIR POLLUTION CONTROL METHODS
Voll
required size of the dust filter and exhaust fan; it also necessitates additional power to draw the diluted gas through the filter.
Direct water spray cooling must be carried out with care. The spray chamber must be designed to ensure complete evaporation of all Equid droplets
before the gas enters the baghouse. Spray impinging on the chamber walls can result in a dust mud inside the chamber and any increase in gas dewpoint
may result in baghouse problems or atmospheric plume condensation. Spray nozzle wear can result in coarse or distorted spray and wetted bags, and water
pressure failure can cause high temperature bag deterioration.
Baghouse safety must also be taken into consideration since the forced ventilation of filtering air can convert a baghouse into a forge in short order,
especially if the dust is flammable. Most bags will bum; a few will char but not support combustion. Glass is the only fireproof bag material, but it has a
low softening temperature. Large installations need temperature-sensing devices to shut off air flow in the event of fire. In many installations sprinkler
heads, CO2 injection, or dry chemical systems are provided. Because baghouse explosions may also be a problem, large vents should be provided wherever
there are susceptible dusts. Checklists of recommendations for safeguarding fabric filters (224) and for specifying and evaluating dust-filter purchase (225)
have been prepared. Explosion venting (226) and optimization of pulse-jet filter design (227) have been discussed. The cost and performance of bag filters
has been compared with other particulate control devices (228). Other pertinent reviews (229—231) also exist.
Newer Bag Filter Applications and Developments. Bag filters have been used extensively for containing dust emissions from low
temperature process operations, such as milling and screening, drying, packaging, loading and unloading, and material conveying. Efforts have been made
to extend use to the control of fine particle emission from common large-volume, hot-gas streams, such as coal-fired power boilers, and ferrous and
nonferrous metallurgical processes. A number of demonstration installations of bag filters on power boiler effluent have been made (232—240). New
applications (241) and cost estimation procedures (242) for fabric filters have been discussed. The effects of conventional fabric structure on collection
efficiency have been studied (243) and nonconventional fabrics have also been investigated (244). Trilobal fibers gave improved collection efficiency and
reduced pressure drop; efficiency also improved when a weave tighter (0.33 tex) than the conventional (0.67 tex = 6 den) weave was used, but at the
expense of higher pressure drop. Crimped fibers also improved collection efficiency and reduced pressure drop.
Filtration by Granular Beds. Fine particle removal by filtering through a bed of granular solids has been known and used for many years,
but a basis for predicting efficiency and pressure drop has only been developed in the last decade or two. Granular filters have appeal because of corrosion
and temperature resistance, physical robustness, and theoretical ease of cleaning. Both the Lynch filter (245), described in 1936, and the Dorfan Impingo
filter (246) developed commercially in 1950, but now unavailable, utilized a downward-traveling gravel bed. A collection efficiency of 98% on 2 to 10-pm
particles was claimed for the latter filter, but such efficiency has been found only with a fresh packing charge (247). Another cross-flow granular scrubber,
developed by Combustion Power Company (248), used 3—6-mm pea gravel. Gas face velocities were 0.5—0.75 m/s and pressure drops were 0.5—3 kPa
(3—23 mm Hg). Collection efficiency on submicrometer particles was low, but subsequendy electric augmentation corrected this problem (249); this has
been confirmed (250). The process depends on the natural charge on the dust particles passing through the charged (20—30 kV of potential is imposed)
field of the gravel bed. Another type of gravel-bed filter, developed in Germany, has been described (251) in which gas, precleaned in a cyclone, is then
passed to a stationary gravel bed. When the bed becomes dust saturated, forward flow is stopped and the gravel is back-flushed using air to remove the
dust, which is then collected in the cyclone. Tests indicated low collection efficiency on 2-pm particles (252). A cross-flow granular limestone bed has been
used to remove both SO2 and fly ash from power boilers (253). The limestone loses its reactivity because of formation of a gypsum coating. Attempts to
remove the fly ash and gypsum using a combination of backflow and bed rapping techniques have not been particularly successful.
In one theoretical equation (254) for collection efficiency in granular beds important parameters are bed thickness, gravel size, and air velocity. A
cleanable granular bed filter (Fig. 15) has been commercially tested (255). Filtering granules are contained in annular compartments enclosed in a housing.
Dirty gas enters above the static granular bed, travels downward through the bed and emerges clean at the bottom. Collection efficiency is stated to be as
high as 99% on 1—3-pm particles. When the beds become dust-laden, forward flow is shut off and a reverse flow of high pressure air in short blasts
fluidizes the beds and elutriates the dust. This concentrated dust-air mixture must then be treated in another device for final dust recovery. Granules (590
pm or 30-mesh in size) of various materials have been used. One of the problems appears to be inadequate elutriation of particular dusts so that laboratory
tests are conducted using the applicant dust before a unit is recommended for installation.
Fig. 15. Zenz-Ducon expandable-bed granular filter. From Ref. 256,
courtesy ofM.cGraw-H.ill, Inc.
Particle collection in low fluidization velocity beds has been investigated (254,258); these studies indicate that collection efficiencies higher than 90%
would be difficult to obtain. Using shallow fluidized beds of 25-pm particles, 99.7% collection of submicrometer particles through bed staging was
obtained (259). Several conditions yielded this efficiency: three stages, each bed 76 mm thick, four stages, each bed 41 mm thick, and five stages, each bed
25 mm thick.
Fiber Bed Mist Filtration. In-depth fiber bed filters are used for the collection of liquid droplets, fogs, and mists. Horizontal pads of knitted
metal wire (or plastic fibers), 100—150 mm thick, and gas upflow are used for liquid entrainment removal. Pressure drop is 250—500 Pa (1.9—3.8 mm Hg).
Kirk-Othmer Encyclopedia of Chemical Technology (4th Edition)
406
AIR POLLUTION CONTROL METHODS
Voll
Characteristics of the pads vary slightly with mesh density, but void space is typically 97—99% of total volume. Collection is by inertial impaction and direct
impingement; thus efficiency will be low at low superficial velocities (usually below 2.3 m/s) and for fine particles. The desireable operating velocity is given
as:
IPl Pg
\ Pg
(24)
The value for Kb is 0.11 m/s, unless liquid viscosity is high or the liquid loading is very high, when somewhat lower values of are used. The same is true
for materials with low liquid surface tension. At desired operating velocities, 99% efficiency will prevail for particles 5 |lm and larger. For smaller particles,
efficiency drops rapidly; it is about 92% for 3-|lm particles. Design factors for wire-mesh mist eliminators have been discussed (260) and the use of two
mesh pads in series for collection of finer mist particles at much higher pressure drops have been investigated (261,262).
For collection of fine mist particles, the use of randomly oriented fiber beds is preferable. Three types of such beds are available: chemically resistant
glass, polypropylene, or fluorocarbon fibers. Beds 25—50 mm thick held between parallel screens are designated high velocity filters. Installed vertically, with
horizontal gas flow and vertical liquid drainage, such beds are sized for 2.5 m/s face velocity and pressure drops of 1—2.5 kPa (7.5—19 mm Hg). These
filters collect by inertial impaction. Efficiency improves with increasing velocity and pressure drop, eg, 92—94% efficiency on l-|lm particles at 1—1.5 kPa
pressure loss. The performance has been discussed (263). Large cylindrical elements similar to Figure 16, designated high efficiency mist eliminators, are
custom designed for collection of submicrometer mist at efficiencies as high as 99.9%. The collection parameters of these units have been described (264).
Bed thickness can vary from 75 to 101 mm and face velocities are much lower than those for high velocity units. Pressure drop is in the range of 2.5 to 7.5
kPa (19—56 mm Hg). For particles smaller than 3 |lm, the predominant collection mechanism is Brownian diffusion; efficiency increases with reduction in
flow and no turndown problems exist. A third type of bed, which is designated spray catcher and is lowest in efficiency, is available for 100% collection of
particles 3 |4m and larger. It is similar in configuration to the high velocity type, but has a pressure loss of only 138—276 Pa (1—2 mm Hg). Fiber bed mist
eliminators, designed primarily for liquid particulates, can also be efficient collectors of water-soluble solid particles if the dust loading is not high and the
bed is continuously irrigated with water or another solvent.
Clean
Fig. 16. Brink-Monsanto Envirochem high efficiency mist eliminator element (265).
Some effluents contain submicrometer oily or tarlike particulates that are difficult to remove from the collection surface. A disposable, dry glass fiber
mat, (266), that can handle such submicrometer particulates at 99% efficiency is known. A subsequent modification is the replacement of the disposable
mat with a cylindrical drum or endless belt of recticulated foam which is cleaned and recycled. Cleaning procedures, using steaming, detergent washing,
solvent cleaning, and ultrasonic cleaning in a variety of fluids, have been developed.
Wet Scrubbing. Scrubbers can be highly effective for both particulate collection and gas absorption. Costs can be quite reasonable for the
required efficiency, but the addition of water treatment for recycle or for waste disposal may make the total cost as great as any other collection method,
depending on water treatment complications. Although scrubbers automatically provide cooling of hot gases, the water-saturated effluent may produce
offensive plume condensation in cold weather. Many moist effluents become more corrosive than dry ones. Solids accumulation may occur at wet—dry
interfaces and icing problems may occur around the stack in winter. For efficient fine-particle collection, energy consumption may also exceed that of dry
collectors by an appreciable amount.
Scrubbers make use of a combination of the particulate collection mechanisms listed in Table 5. It is difficult to classify scrubbers predominandy by
any one mechanism; but for some systems, inertial impaction and direct interception predominate. Semrau (153,262,268) proposed a contacting power
principle for correlation of dust-scrubber efficiency: the efficiency of collection is proportional to power expended and more energy is required to capture
finer particles. This principle is applicable only when inertial impaction and direct interception are the mechanisms employed. Furthermore, the correlation
is not general because different parameters are obtained for differing emissions collected by different devices. However, in many wet scrubber situations for
constant particle-size distribution, Semrau's power law principle, roughly applies:
Nt = aP}
Kirk-Othmer Encyclopedia of Chemical Technology (4th Edition)
407
AIR POLLUTION CONTROL METHODS
Voll
(25)
The constants CC and у depend on the physical and chemical properties of the system, the scrubbing device, and the particle-size distribution in the entering
gas stream.
Table 13 can be used as a rough guide for scrubber collection in regard to minimum particle size collected at 85% efficiency. In some cases, a higher
collection efficiency can be achieved on finer particles under a higher pressure drop. For many scrubbers the particle penetration can be represented by an
exponential equation of the form (271—274)
Pt =
(26)
where Л. and В are constants dependent on scrubber design: В is 0.67 for centrifugal scrubbers and essentially 2 for packed towers, sieve plates, and venturi
scrubbers. Use of equation 26 permits development of generalized grade-efficiency curves of particle cut-size for a number of different types of scrubbers
(see ref. 169). If the entering particles have a log-normal mass distribution, Figure 17 can be used to obtain the integrated particle penetration leaving the
scrubber in terms of scrubber cut-size, mass median particle diameter, exponent B, and geometric particle-size distribution. Plotting particle cut-size vs
pressure drop for various scrubbers is suitable for developing generalized energy efficiency curves (271). The curves for the various devices outline an
imaginary band of pressure drop vs particle size for inertial impaction.
Fig. 17. Overall (integrated) penetration as a function of collector particle cut-size and characteristics and inlet particle parameters for collectors that follow
equation 26 (271).
Courtesy of J. p4P(C4.
Table 13. Particle Size Collection Capabilities of Various Wet Scrubbers*
Type of scrubber Pressure drop, Pa Minimum collectible particle dia, Jim
gravity spray towers 125-375 10
cyclonic spray towers 500-2,500 2-6
impingement scrubbers 500-4,000 1-5
packed and moving bed scrubbers 500-4,000 1-5
plate and slot scrubbers 1,200-4,000 1-3
fiber bed scrubbers 1,000-4,000 0.8-1
water jet scrubbers 0.8-2
dynamic 1-3
venturi 2,500-18,000 0.5-1
aRefs. 155, 269,270.
To convert Pa to psi, multiply by 1.450 x 10 4 .
Minimum particle size collectible with approximately 85% efficiency.
Wet scrubber collection efficiency may be unexpectedly enhanced by particle growth. Vapor condensation, high turbulence, and thermal forces
acting within the confines of narrow passages can all lead to particle growth or agglomeration. Of these, vapor condensation produced by cooling is the
most common. Condensation will occur preferentially on existing particles, making them larger, rather than producing new nuclei. Careful experimentation
(275) has shown that the addition of small quantities of nonfoaming surfactants to the scrubbing water can enhance the collection of hydrophobic dust
particles without further energy expenditure.
Scrubber Performance and Selection. A tremendous number of wet scrubbers have been marketed. References 155, 273, and 276 provide
general introductions. An extensive study of wet scrubbers has been done (272), and there are reports on wet scrubber selection and evaluation (277). An
open spray tower, such as the countercurrent vertical one of Figure 2b, is the simplest type of scrubber. Gas velocities (typically 0.6—1.2 m/s) should be less
than the terminal settling velocity of the spray droplets. Optimum spray droplet size for maximum target efficiency has been calculated (278) and can be
obtained from Figure 18. Figure 19a gives cut-size for vertical spray towers, 19b for horizontal spray towers. Tangential inlet of gas at the bottom of
vertical spray towers (Fig. 2b, c) greatly increases the collision of aerosol particles and spray droplets as a result of centrifugal force. The optimum spray
droplet size for greatest collection efficiency in centrifugal spray towers is considerably smaller than for gravity towers. Figure 20 shows calculated target
efficiencies (140), for spray droplets in a centrifugal field. Cyclonic scrubbers similar to Figure 2b have efficiencies of 97% on l-|±m particles (282). A
number of commercial scrubbers such as the type N and R Rotoclone and the Microdyne use a combination of water atomization and centrifugal force to
Kirk-Othmer Encyclopedia of Chemical Technology (4th Edition)
408
AIR POLLUTION CONTROL METHODS
Voll
capture particles.
Fig. 18. Target efficiency of a single water droplet in a gravitational spray tower (278,279). From Ref. 280,
courtesy ofM.cGraw-H.ill, Inc.
(a)
(b)
Fig. 19. Predicted performance cut diameter for typical spray towers (271): (a) vertical countercurrent spray tower; (b) horizontal cross-current spray
chamber. Liquid—gas ratio is 1 m3 of liquid/1000 m3 of gas. Drop diameter: curve 1, 200 |±m; curve 2, 500 |±m; curve 3, 1000 |±m. UG = 0.6 m/s.
Courtesy of J. МРСЛ.
Fig. 20. Spray droplet target efficiency in a centrifugal spray tower with a centrifugal field of 100 g (140,281).
Vertical columns with plates or trays are also used for particulate collection. Almost any type of perforated plate can be used: sieve plates (with or
without submerged impingement targets above the holes), slot plates, valve trays, and bubble caps. Collection efficiency is good down to l-|±m particles
using pressure drops of 400 Pa (30 mm Hg) per plate. The best efficiency is obtained in all wet scrubbers if the dirty gas is saturated with water vapor
before entering the first contact stage. Figure 21 shows predicted cut-size (271) for a simple sieve tray. Froth density must be predicted from complex
relationships for sieve plate behavior (272). Packed towers will collect particulates and cut-size is independent of packing type (Fig. 22) (271).
Countercurrent towers can be used for mist collection, but plug easily in the presence of solid particulates. Some particulates can be handled in concurrent
downflow towers. The ability of a cross-flow packed tower to handle loads of insoluble dust up to 11 g/m3 was mentioned earlier under gas absorption.
Ninety-five percent collection of 3-|±m particles in such a tower has been reported (283). Irrigated fiber pads commercially available are quite efficient on
3-|±m particles when operated under a pressure drop of 1 kPa (7.5 mm Hg); they will plug easily on heavy loadings of insoluble dust. Mobile-bed packing of
fluidized spheres (turbulent contactors) have both good particulate collection and good mass transfer characteristics. Collection efficiency is good on
particles down to 1 |±m and the constant movement and rubbing of the spherical targets prevents plugging. For greater efficiency, several stages in series
can be used. Typical pressure drop per stage is 0.75—1.5 kPa (5.5—11 mm Hg).
Kirk-Othmer Encyclopedia of Chemical Technology (4th Edition)
409
AIR POLLUTION CONTROL METHODS
Voll
Sieve plate hole velocity, m/s
Fig. 21. Performance cut diameter prediction for typical sieve plate operation on wettable particulates at foam densities F: solid line, F = 0.4 g/cm3, dashed
line, F = 0.65 g/cm3 (271).
Courtesy of J. FLPCA.
Packed bed height, m
Fig. 22. Performance cut diameter predictions for typical dry packed bed particle collectors as a function of bed height or depth, packing diameter and
packing porosity (void area) 8. Bed irrigation increases collection efficiency or decreases cut diameter (271). Solid lines, Dc = 25 mm; dashed lines,
Dc = 50 mm; e = 0.75.
Courtesy of J. FLPCA.
In several commercial scrubbers, the dirty gas jets direcdy into a pool of water where the momentum of the larger particles allows them to penetrate.
Some of the water is thus atomized into a spray aiding collision between water droplets and smaller particulate. In one such scrubber careful control of the
water level is necessary for efficient particle collection (284). These scrubbers have been used to collect coarser dusts such as from metal grinding; they have
good efficiencies on particles down to 3—5 |lm. Dynamic collectors employ a motor-driven centrifugal device resembling a water-sprayed centrifugal fan to
cause impingement of solid particles in a wetted film. Tests indicate that l-|lm particles can be collected with 50% efficiency in an ordinary water-sprayed
centrifugal fan if the wheel tip speed exceeds 90 m/s.
The collection of particles larger than 1—2 |lm in liquid ejector venturis has been discussed (285). High pressure water induces the how of gas, but
power costs for liquid pumping can be high because motive efficiency of jet ejectors is usually less than 10%. Improvements (286) to liquid injectors allow
capture of submicrometer particles by using a superheated hot (200°C) water jet at pressures of 6,900—27,600 kPa (1000—4000 psi) which flashes as it issues
from the nozzle. For 99% collection, hot water rate varies from 0.4 kg/1000 m3 for l-|lm particles to 0.6 kg/1000 m3 for 0.3-|lm particles.
Venturi and High Energy Scrubbers. The venturi scrubber has been studied more intensively than any other wet scrubber, perhaps
because of its ability to efficiendy scrub any size particle by changing the pressure drop. The design readily lends itself to mathematical modeling. Gas is
accelerated in the throat to velocities of 60—150 m/s where water is added either as a spray, as solid jets, or as a wall-flowing sheet. The water is atomized
into very small droplets by the high speed gas and aerosol particles, moving at close to the gas speed, collide with the accelerating liquid droplets and are
captured. A cyclonic collector is needed to remove the water mist produced by the venturi. Collection mechanisms have been studied (140,287—292). The
Equid drop size produced has been investigated (293); the effect of water-injection method on venturi performance, examined (294); and a generalized
pressure-drop prediction method has been developed (295).
Venturi scrubbers can be operated at 2.5 kPa (19 mm Hg) to collect many particles coarser than 1 |lm efficiendy. Smaller particles often require a
pressure drop of 7.5—10 kPa (56—75 mm Hg). When most of the particulates are smaller than 0.5 |lm and are hydrophobic, venturis have been operated at
pressure drops from 25 to 32.5 kPa (187—244 mm Hg). Water injection rate is typically 0.67—1.4 m3 of Equid per 1000 m3 of gas, although rates as high as
2.7 are used. Increasing water rates improves collection efficiency. Many venturis contain louvers to vary throat cross section and pressure drop with
changes in system gas how. Venturi scrubbers can be made in various shapes with reasonably similar characteristics. Any device that causes contact of
Equid and gas at high velocity and pressure drop across an accelerating orifice will act much like a venturi scrubber. A hooded-disk scrubber in which the
annular orifice created by the disc is equivalent to a venturi throat has been described (296). An hrigated packed fiber bed with performance similar to a
Kirk-Othmer Encyclopedia of Chemical Technology (4th Edition)
410
AIR POLLUTION CONTROL METHODS
Voll
venturi scrubber was offered commercially for collection of submicrometer particles at bed pressure drops of 7.5—15 kPa (56—113 mm Hg).
Wet Scrubber Entrainment Separation. Fiber pads and beds to collect fine liquid entrainment have been discussed. Unless fog is present
from condensation, scrubber entrainment will be coarse and the high efficiency of fiber beds is not needed. Entrainment separators for scrubbers are
usually centrifugal swid vanes, hook and zigzag eliminators, or momentum separators using a change in direction. Efficiency and pressure drop for zigzag
baffles, targets of staggered tube banks, packed beds, and knitted mesh have been compared (297) and these data supplemented with entrainment theory
and collection efficiency in centrifugal flow and in sieve plates (298). Entrainment separator design requirements for venturi scrubbers have been discussed
(299). Control of recycle water cleanliness is important to good wet scrubber performance and poor scrubber performance has been traced (300) to
entrainment of dirty scrubbing liquid and also to temperature flashing (evaporation) of fine particulate contained in recycle spray water.
Developing Particulate Control Technology. Present control methods for particulates are least efficient in the size range from 0.2 to 2.5
|_lm; this range is the most cosdy to collect and very energy intensive. Health studies indicate that particles in this size range are also those which penetrate
most deeply into, and often become deposited in, the human respiratory system. This is the main reason for the U.S. EPA change in the ambient air quality
standard from total suspended particulate (TSP) concentration to a PM10 standard (ambient air particles equal to or smaller than 10-pm aerodynamic
diameter). The new standard will undoubtedly place even more emphasis on the need to collect particulates in this difficult-to-control fine-particle range,
and therefore, collection of this size range is most in need of improvements in technology. Improved collection requires the use of a separating force which
is independent of gas velocity or of the growth of particles which can be more readily collected. Particle growth can be accomplished through coagulation
(agglomeration), chemical reaction, condensation, and electrostatic attraction. Promising separation forces are the "flux forces" involving diffusiophoresis,
thermophoresis, electrophoresis, and Stefan flow. Although particle growth techniques and flux-force collection theoretically can be considered
independendy, both phenomena are applied in many practical devices.
Thermophoresis may be considered a special form of thermal precipitation. If a hot submicrometer particle is close to a large cold particle or droplet
of such relative size that it resembles a wall to the small particle, the kinetic motion of the hot gas molecules opposite the cold particle will bombard and
propel the submicrometer particle toward the cold droplet. If cold droplets are introduced into a warmer saturated gas stream, water vapor will condense
on the cold droplets reducing the water vapor pressure near its surface and produce a water vapor pressure gradient. The hydrodynamic flow of vapor
toward the condensing surface is known as Stefan flow. If the molecular mass of the diffusing vapor is different from the molecular mass of the carrier gas,
the motion of small particles is further affected by a density differential. Both of these forces influence the movement of submicrometer particles, and their
algebraic sum is known as the force of diffusiophoresis. In condensation, diffusiophoresis tends to move submicrometer particles toward cold droplets; in
droplet evaporation, the action is reversed, moving the particles away from the droplet. This is one of the reasons wet scrubbing collection is enhanced if
the bulk gas stream is water saturated before its entry to the scrubber, and the scrubbing liquid is cooled below the gas dewpoint. Electrophoresis is the
movement of a small particle toward a charged particle. Mathematical description of these forces has been presented (282). Diffusiophoresis has also been
discussed (301).
In time, submicrometer particles will coagulate into chains or agglomerates through Brownian motion. Increasing turbulence during coagulation will
increase the frequency of collisions and coagulation rate. The addition of fans to stir the gas, or gas flow motion through tortuous passages such as those
of a packed bed, will aid coagulation. Sonic energy is also known as an aid to the coagulation process. Production of standing waves in the confines of long
narrow tubes can bring about concentration and coagulation of aerosols in band zones in the tube. The addition of water and oil mists to the treated
aerosol can improve the effectiveness of sonic agglomeration by improving the tendency of the colliding particles to stick together. Sulfuric acid mist (302)
and carbon black (303) have been sufficiently agglomerated so that the coagulated product can be collected in a cyclone. Sonic agglomeration has been
tested in the past for many metallurgical fumes, but has generally been found too power intensive for practical consideration. One problem is the low
energy efficiency of transforming other energy sources to sonic energy in available sonic generators. The development of more energy efficient sonic
generators, coupled with improved knowledge of the phenomenon of sonic coagulation, might justify further investigation. The combination of sonic
agglomeration and electrostatic precipitation could result in considerable reduction of precipitator size and perhaps capital cost (304). Coagulation
techniques have been discussed in mathematical terms in references 272 and 276.
Particle growth may be brought about (or the charge on particles modified) by the introduction of a gas to react with the particles. Another
procedure used is chemical modification of the particle to render it hygroscopic. This can be particularly beneficial for particle growth if the particle
continues to absorb moisture to form hydrates. It may also be possible to control the size of aerosols initially formed by chemical means. In studies (305)
of chemical reactions producing aerosols it was found that reactions having a large chemical driving force and hence releasing large quantities of energy
tended to produce very fine particles (high surface energy); conversely, reactions which occur without release of large amounts of energy tend to produce
larger particles (2—6 |±m). Therefore, limitation of chemical driving force may often be beneficial to prevent formation of fine aerosols. If steam or other
condensable vapors can be condensed while cooling an aerosol, particle growth will occur through vapor condensation on the existing aerosol nuclei. A
given mass of smaller particles will present more surface area for condensation than the same mass of larger particles. Thus the smaller particles will
selectively grow faster in size than will the larger particles. Also, the addition to the system of particles opposite in electrical charge will result in mutual
attraction and aid in particle growth.
Of these various possibilities, those involving electrostatic forces and condensation have received the most interest. Flux-force condensation
scrubbing may be desireable for hot gases needing treatment when there is no attractive alternative available to recover the energy. Sizeable amounts of low
pressure waste steam are also useful. Reports have appeared on condensation scrubbing in multiple sieve-plate towers (306,307), aspirative condensation
(308), and some of the parameters that affect particle growth and collection in a conventional orifice scrubber, with and without condensation (309). Fine
particle collection is appreciably improved by scrubbing a hot saturated gas stream with cold water rather than using recirculated hot water. Litde collection
improvement resulted in cooling below a 50°C dew point, but much better collection was achieved when the hot gas was introduced already saturated close
to its initial dew point (rather than admitting it unsaturated with substantial superheat). A decrease in scrubbing efficiency of an evaporative scrubber was
also found. Addition of an adiabatic presaturator for hot gases ahead of a scrubber should be quite beneficial.
Odor Control
Odor is a subjective preception of the sense of smell. Its study is still in a developmental stage: information including a patent index has been compiled
(310); 124 rules of odor preferences have been listed (311); detection and recognition threshold values have been given (312); and odor technology as of
1975 has been assessed (313). Odor control involves any process that gives a more acceptable perception of smell, whether as a result of dilution, removal
of the offending substance, or counteraction or masking (see Odormodification; Perfumes).
Odor Measurement. Both static and dynamic measurement techniques exist for odor. The objective is to measure odor intensity by
determining the dilution necessary so that the odor is imperceptible or doubtful to a human test panel, ie, to reach the detection threshold, the lowest
concentration at which an odor stimulus may be detected. The recognition threshold is a higher value at which the chemical entity is recognized. An odor
unit (o.u.) has been widely defined in terms of 0.0283 m3 (1 ft3) of air at the odor detection threshold. It is a dimensionless unit representing the quantity of
odor which when dispersed in 28.3 L (1 ft3) of odor-free air produces a positive response by 50% of panel members. Odor concentration is the number of
cubic meters that one cubic meter of odorous gas will occupy when diluted to the odor threshold. Selection of people to participate in an odor panel should
reflect the type of information or measurement required, eg, for evaluation of an alleged neighborhood odor nuisance, the test subjects should be
representative of the entire neighborhood. However, threshold determinations may be done with a carefully screened panel of two or three people (314). A
general population test panel of 35 people has been described (315).
Static Dilution Methods. A known volume of odorous sample is diluted with a known amount of nonodorous air, mixed, and presented
statically or quiescendy to the test panel. The ASTM D1391 syringe dilution technique is the best known of these methods and involves preparation of a
100-mL glass syringe of diluted odorous air which is allowed to stand 15 min to assure uniformity. The test panel judge suspends breathing for a few
seconds and slowly expels the 100-mL sample into one nostril. The test is made in an odor-free room with a minimum of 15 min between tests to avoid
olfactory fatigue. The syringe dilution method is reviewed from time to time by the ASTM E18 Sensory Evaluation Committee, who suggest and evaluate
changes. Instead of a syringe, a test chamber may be used which can be as large as a room (316,317). A technique to make threshold determinations for 53
Kirk-Othmer Encyclopedia of Chemical Technology (4th Edition)
411
AIR POLLUTION CONTROL METHODS
Voll
odorant chemicals has been described (316). The test room consisted of two chambers: an antechamber and the actual test chamber. The air in each
chamber was circulated through activated carbon to provide a controlled, odor-free background for sample dilution.
Dynamic Dilution Methods. In this method, odor dilution is achieved by continuous flow. Advantages are accurate results, simplicity,
reproducibility, and speed. Devices known as dynamic olfactometers control the flow of both odorous and pure diluent air, provide for ratio adjustment to
give desired dilutions, and present multiple, continuous samples for test panel observers at ports beneath odor hoods. The Hemeon olfactometer (318,319)
uses three ports, each designed as a face piece which surrounds the lower half of the face loosely, and allows three panelists to judge simultaneously. The
Hellman odor fountain (320—322) is a similar device. An olfactometer based on forced-choice-triangle statistical design has been constructed (323). To
distinguish dynamically obtained group threshold values from ASTM odor units, the ED50 (effective dose, 50%) designation may be used. ED50 is the
concentration at which half the panelists begin to detect odor in a dynamic test. ED50 values are 5% higher at the 1000 o.u. level than ASTM odor unit
values, 20% higher at 100 o.u. level, and 33% higher at the 20 o.u. level (323). Similar but greater deviations have been obtained when the Hemeon odor
meter results have been compared to results of the ASTM static syringe method (323).
Another dynamic instrument, the Scentometer, is the basis for odor regulations in the states of Colorado, Illinois, Kentucky, Missouri, Nevada, and
Wyoming, and in the District of Columbia (324). The portable Scentometer (Bameby-Cheney) can produce dilution ratios up to 128:1 in the field. The
Scentometer blends two air streams, one of which has been deodorized with activated carbon. The dilution ratio is decreased until the odor becomes
detectable (325). Improvements to dynamic methods have been recommended (326).
Odor Control Methods. Absorption, adsorption, and incineration are all typical control methods for gaseous odors; odorous particulates are
controlled by the usual particulate control methods. However, carrier gas, odorized by particulates, may require gaseous odor control treatment even after
the particulates have been removed. For oxidizable odors, treatment with oxidants such as hydrogen peroxide (qv), ozone (qv), and KMnO4 may
sometimes be practiced; catalytic oxidation has also been employed (see Exhaust control, industrial). Odor control as used in rendering plants (327),
spent grain dryers (328), pharmaceutical plants (329—331), and cellulose pulping (332) has been reviewed (333—335); some reviews are presented in two
symposium volumes (336,337) from APCA Specialty Conferences. The odor-control performances of activated carbon and permanganate—alumina for
reducing odor level of air streams containing olefins, esters, aldehydes, ketones, amines, sulfide, mercaptan, vapor from decomposed crustacean shells, and
stale tobacco smoke have been compared (338). Activated carbon produced faster deodorization in all cases. Activated carbon adsorbers have been used to
concentrate odors and organic compounds from emission streams, producing fuels suitable for incineration (339). Both air pollution control and energy
recovery were accompEshed.
NOMENCLATURE
Symbol Definition SI units
A constant in Stokes-Cunningham correction factor for particle velocity; Al.72, but often dimensionless considered a function of X and D P
A constant in Calvert correlation for relating penetration and particle size in wet scrubbers, as required by equation 26 Pt = exp(—A
Ar A collecting electrode area in an electrical precipitator m2 area of particle projected on plane normal to direction of flow or motion; Ap = ttD2 /4 m2 for spherical particles
а В fraction of inelastic collisions in thermophoresis, equation 11 dimensionless exponential constant in Calvert correlation for relating penetration and particle size in wet as required by equation 26 scrubbers, Pt = exp (—A dp )
ве distance between the discharge electrode and the collecting plate in a plate type electrical m precipitator
roughness factor for discharge electrode in an electrical precipitator; increasing roughness dimensionless decreases the value of br
4 Dc D. d D 0 DP F D p min 4 D dt dtC d pgm E 0 4 e F f overall drag coefficient = 2 Fd /pg u2 Ap dimensionless representative dimension or diameter of impingement body or target m packing diameter in packed column scrubber mm diameter of the discharge electrode in an electrical precipitator m diameter of oudet pipe on cyclone mm or m diameter (or equivalent diameter) of a particle m particle cut-size; diameter collected with 50% efficiency in a particulate collector m diameter of smallest particle collectible with 100% collection efficiency m diameter of a collecting tube in a tubular type electrical precipitator m diffusion coefficient for particle m2/s diameter of particle (in wet scrubbing and Calvert figures) цт particle cut size in Calvert wet-scrubbing illustrations цт geometric mass mean particle diameter цт electrostatic charging field strength in an electrical precipitator V/m or N/C electrostatic precipitating field strength in an electrical precipitator V/m or N/C natural or Naperian logarithm base, 2.718 dimensionless foam density above sieve plates kg/L Calvert correlation parameter for effect of hydrophobic ( f = 0.25) or hydrophilic ( f = dimensionless 0.50) nature of particles collected in venturi scrubbers
D G & к, b к к drag or resistance to motion of a body in a fluid N superficial gas mass velocity kg/(s-m2) local acceleration due to gravity m /s2 design constant for knitted mesh mist collectors, typically O.llm/s m/s cyclone friction factor in equation 17 dimensionless geometric design constant for an electrical precipitator; for a plate-type, Ke = Le/BeVe> s /m and for a tube-type, Ke = 4 Le/DtVe
к к k k k, d k £ Stokes-Cunningham correction factor dimensionless sphericity correction constant dimensionless Coulomb's law constant, 8.987 x 10⁹ (N-m2)/C Boltzmann constant, 1.380 x 10“23 J/K cloth drag coefficient for a fabric bag type filter as required by equation 21 drag coefficient for collected dust cake in a fabric bag type filter as required by equation 22 thermal conductivity of gas W/ (m-K)
Kirk-Othmer Encyclopedia of Chemical Technology (4th Edition)
412
AIR POLLUTION CONTROL METHODS
Voll
z,
^gTR
kp
kp
L
L
L
N
npe
NSC
4
P
T
t
и
G
и
0
и
иг
Ч
и
vc
cl
ve
VJ
vs
a
Y
8
e
n
nD
HlN
Пм
R
X
Lt
7?
Pl
P,
A
P,
°9
0
T
translational thermal conductivity of gas
thermal conductivity of particle
density correction factor for corona starting potential in electrical precipitator; ratio of the
precipitator gas density to that of air at 25°C and 101.3 kPa (1 atm)
superficial Equid mass velocity
treatment path length in a charged precipitating field in an electrical precipitator
mass of dust solids collected per unit cloth area in a bag type filter
effective number of spirals made by the gas in a cyclonic separator
Peclet number = U0Db/ Dv
Reynolds number = Dpppu/p,
Schmidt number = pg/ pgDv
flow-line separation number = D / Db
inertial separation number = Ut/Uo/Db
number of particulate collection transfer units = In [1/(1 — rf)]
system or collector total pressure
total power expended in a contacting device
particle penetration through a collector 1 — p or 100 — p (fraction or percentage)
pressure drop through a collector or control device
pressure drop through the filtering cloth in a fabric bag filter
pressure drop through the accumulated dust cake in a fabric bag filter
volumetric flow rate through collector
gas volumetric flow rate through an electrical precipitator
radius, distance from centerline of cyclone separator, or from centerline of concentric
cylinder electrical precipitator
system or collector absolute temperature
time
average-particle migration velocity for a given size particle in an electrical precipitator; also
used as the drift velocity which is the average migration velocity for all particles sizes
collected
superficial gas velocity in wet scrubber
linear gas velocity
operating superficial velocity through a knitted mesh mist collector
thermophoretic velocity of a particle
particle terminal settling velocity
particle terminal velocity in direction normal to gas velocity
velocity of particle relative to main body of fluid
average velocity of gas at cyclone inlet
tangential gas velocity component in a cyclone
average gas velocity in an individual flow passage in the precipitating field of an electrical
precipitator
superficial gas velocity through the fabric in a bag filter
minimum potential required for the start of corona discharge in an electrical precipitator
width of gas inlet of cyclonic separator
intercept constant in Semrau's power law collection principle, equation 25
power exponent in Semrau's power law collection principle, equation 25
dielectric constant for nonconductive particles
packed bed void fraction in a packed-bed wet scrubber
collection efficiency (fraction or percentage)
diffusional collection efficiency
flow-line interception efficiency
inertial deposition efficiency
collection efficiency by particle mass
target collection efficiency by inertial impact
molecular mean free path, 0.1 |lm for room temperature ambient air
aerosol carrier gas viscosity
geometric constant relating circumference and diameter of a circle, 3.14159
density of liquid or mist droplets
density of aerosol carrier gas
apparent or aerodynamic particle density
true (not bulk) density of solids
geometric standard deviation
time interval at any point since last bag cleaning in a fabric bag filter
sphericity, surface area of sphere having the same volume as a particle divided by the
actual surface area of the particle
W/(m-K)
W/(m-K)
dimensionless
kg/(&m2)
m
kg/m2
dimensionless
dimensionless
dimensionless
dimensionless
dimensionless
m/s2
dimensionless
Pa
W
dimensionless
Pa
Pa
Pa
m3/ s
m3/ s
m
К
s
M/s
m/s
m/s
m/s
m/s
m/s
m/s
m/s
m/s
m/s
m/s
m/s
V
m
as required by equation 25
dimensionless
dimensionless
dimensionless
dimensionless
dimensionless
dimensionless
dimensionless
dimensionless
dimensionless
m
Pas
dimensionless
kg/m3
kg/m3
kg/m3
kg/m3
dimensionless
s or h, as required, equation 23
dimensionless
BIBLIOGRAPHY
"Air Pollution Control Methods" in ECT 3rd ed., Vol. 1, pp. 649—716, by В. B. Crocker, D. A. Novak, and W. A. Scholle, Monsanto Company. References
have been subdivided by area of interest except that when they cover more than one interest area they are listed only in the area where first cited.
Kirk-Othmer Encyclopedia of Chemical Technology (4th Edition)
413
AIR POLLUTION CONTROL METHODS
Voll
Air Pollution, general
1. Guiding Principles of State Air Pollution Legislation, U.S. Department of Health, Education, and Welfare, Washington, D.C., 1965.
2. Sect. 1420, Chapt. Ill, GeneralLaws, Chapt. 836, Acts of 1969., the Commonwealth of Massachusetts, Department of Public Health, Division of
Environment, Health, Bureau of Air Use Management.
3. D. H. Slade, ed., Meteorology and Atomic Energy 1968., U.S. Atomic Energy Commission, July 1968; available as TID-24190, Clearinghouse for Federal
Scientific and Technical Information National Bureau of Standards, U.S. Department of Commerce, Springfield, Va.
4. D. B. Turner, Workbook of Atmospheric Dispersion Estimates, US EPA, OAP, Pub. AP26, Research Triangle Park, N.C., revised 1970, U.S. Department
Printing Office Stock No. 5503-0015.
5. A. D. Busse and J. R. Zimmerman, User's Guide for the Climatological Dispersion Model, US EPA Pub. No. EPA-R4-73-024, Research Triangle Park,
N.C., Dec. 1973.
6. M. Smith, ed., Recommended Guidefor the Prediction of the Dispersion of Airborne Effluents, American Society of Mechanical Engineers, New York, 1968.
7. G. A. Briggs, "Plume Rise," USAEC Critical Review Series HD-25075, NTIS, Springfield, Va., 1969.
8. Effective Stack Height: Plume Rise, US EPA Air Pollution Training Institute Pub. SI:406, with Chapts. D, E, and G by G. A. Briggs and Chapt. H by D.
B. Turner, 1974.
9. J. E. Carson andH. Moses J. APCA 19, 862 (Nov. 1969).
10. H. Moses and M. R. Kraimer,J. APCA 22, 621 (Aug. 1972).
11. G. A. Briggs, Plume Rise Predictions, Lectures on AirPollution andEnvironmental Impact Analyses, American Meteorological Society, Boston, Mass., 1975.
12. Guideline on Air Quality Models, OAQPS Guideline Series, U.S. Environmental Protection Agency, Research Triangle Park, N.C., 1980.
13. G. A. Schmel, Atmos. Environ. 14, 983—1011 (1980).
14. N. E. Bowne, R. J. Londergan, R. J. Minott, D. R. Murray, "Preliminary Results from the EPRI Plume Model Validation Project—Plains Site,"
Report EPRI EA-1788, Electric Power Research Institute, Palo Alto, Calif., 1981.
15. N. E. Bowne, "Atmospheric Dispersion," in S. Calvert and H. M. Englund, eds., Handbook of Air Pollution Technology, John Wiley & Sons, Inc., New
York, 1984, pp. 859-891.
16. Code of Federal Regulations 40 (CFR 40), Fed. Rtg., C-50-99.
17. Ref. 16, part 58.
18. W. W. Lund andR. Starkey,/. AirWaste Manage Assn. 40(6), 896—897 (June 1990).
19. Ref. 16, part 50, appendix A—G.
20. Ref. 16, part 62, appendix B, and subparts C—F, J, M, V.
21. T. A. Gosink, Environ. Sci. Technol. 9, 630—634 (July 1975).
22. S. R. Heller, J. M. McGuire, and W. L. Budde, Environ. Sci. Technol. 9, 210—213 (Mar. 1975).
23. Fed. Reg. 40, 46250 (Oct. 1975).
24. Fed. Reg. 52, 24634-24750 (July 1, 1987); Fed. Reg. 54, 41218-41232 (Oct. 5, 1989).
25. D. S. Ensor andM. J. Pilot,/ APCA 21, 496-501 (Aug. 1971).
26. В. B. Crocker, Chem. Eng. Prog. 71, 83—89 (March 1975).
27. L. E. Sparks, "Particulate Sampling and Analysis," in S. Calvert and H. E. Englund, eds., Handbook of Air Pollution Technology, John Wiley & Sons,
Inc., New York, 1984, pp. 800-818.
28. B. W. Loo, J. M. Jaklevic, and F. S. Goulding, "Dichotomous Virtual Impactors for Large Scale Monitoring of Airborne Particulate Matter," in B.
Y. H. Liu, ed., Fine Particles, Aerosol Generation, Measurement, Sampling, and Analysis, Academic Press, Inc., New York, 1976, pp. 311—350.
29. "Hard Realities: Air and Waste Issues of the 90s" (Report of 18th Government Affairs Seminar),/ Air and Waste Management Assn. 40(6), 855—860
(June 1990); also Proceedings of the 18th Air and Waste Management Assn. Govt. Affairs Seminar, Air and Waste Management Assn., Pittsburgh, Pa., 1990.
30. R. H. Perry, ed., EngineeringManual, 3rd ed., McGraw-Hill, Inc., New York, 1976. Text used with permission.
Control equipment, general
31. Industrial Ventilation, 15th ed., Sect. 4, American Conference of Governmental Industrial Hygienists, Committee on Industrial Ventilation, Lansing,
Mich., 1978.
32. R. Jorgensen, Fan Engineering, 7th ed., Buffalo Forge Company, Buffalo, N.Y., 1970, pp. 471—480.
33. W. E. L. Hemeon, Plant and Process Ventilation, Industrial Press Inc., New York, 1954.
34. J. M. Dalia Valle, Exhaust Hoods, Industrial Press Inc., New York, 1952.
35. J. L. Alden, Design of Industrial Exhaust Systems for Dust andFume Removal, 3rd ed., Industrial Press Inc., New York, 1959.
36. J. A. Danielson, ed., Air Pollution EngineeringManual, Pub. No. 999-AP-40, U.S. Department of Health, Education, and Welfare, Cincinnati, Ohio,
1973, Chapt. 3.
37. В. B. Crocker, "Capture of Hazardous Emissions," in Proceedings, Control of Specific (Toxic) Pollutants (Conference, Feb. 1979, Gainsville, Fla.), Air
Pollution Control Assn., Pittsburgh, Pa., 1979, pp. 415—433.
38. В. B. Crocker, Chem. Eng. Prog. 64, 79 (Apr. 1968).
Gaseous emission control
39. "Liquid-Gas Systems," in R. H. Perry and D. Green, eds., Perry's Chemical Engineers Handbook, 6th ed., McGraw-Hill, Inc., New York, 1984, Chapt.
18.
40. В. B. Crocker and К. B. Schnelle, Jr., "Control of Gases, by Absorption, Adsorption, and Condensation," in S. Calvert and H. M. Englund, eds.,
Handbook of Air Pollution Technology, John Wiley & Sons, Inc., New York, 1984, Chapt. 7, pp. 135—192.
41. T. C. Kenner andD. Zhou, Environ. Progress, 9(1), 40—46 (Feb. 1990).
42. P. N. Cheremisinoff and R. A. Young, eds., AirPollution Control and Design Handbook, Part 2, Marcel Dekker, Inc., New York, 1977.
43. H. O. Grant, Chem. Eng. Prog. 60, 53 (Jan. 1964).
44. A. J. Teller, Chem. Eng. Prog. 63, 75 (Mar. 1967).
45. S. V. Cabibbo and A. J. Teller, "The Crossflow Scrubber—A Digital Model for Absorption," Paper No. 69-186, APCA 62nd Annual Meeting, New
York, NY, (June 22—26, 1969).
46. К. E. Lunde, Ind. Eng. Chem. 50, 293 (Mar. 1958).
47. J. P. Jewell and В. B. Crocker, Proceedings of the 8th Annual Sanitary and Water Resources Engineering Conference, Vanderbilt University, Nashville, Tenn.,
1969, pp. 211-228.
48. W. W. Lehle in W. W. Duecker and J. R. West, eds., The Manufacture of Sulfuric Acid, Reinhold Publishing Corp., New York, 1959, pp. 348—352.
49. J. J. Spivey, Environ. Progress 7(1), 31—40 (Feb. 1988).
50. Ref. 39, Sect. 16.
51. B. Grandjacques, Pollut. Eng. 9, 28—31 (Aug. 1977).
52. D. Bienstock, J. H. Field, S. Katell, and K. D. Plants, / APCA 15, 459 (Oct. 1965).
53. D. Bienstock, J. H. Field, and J. G. Myers, / Eng. Power 86(3), 353 (1964).
Kirk-Othmer Encyclopedia of Chemical Technology (4th Edition)
414
AIR POLLUTION CONTROL METHODS
Voll
54. Ref. 39, p. 16-36.
55. S. M. Hall,/. Air Waste Manage Assn. 40(3), 404—407 (Mar. 1990).
56. C. S. Chang and C. Jorgensen, Environ. Progress 6(4), 26—32 (Feb. 1987).
57. К. T. Fellows andM. J. Filat,/ Air Waste Manage Assn. 40(6), 855—860 (June 1990).
58. P. J. Krall and P. Williamson,/. APCA, 36(11), 1258-1263 (Nov. 1986).
59. V. S. Katari, W. M. Vatavuk, and A. H. Wehe, Part I,/ APCA 37(1), 91 (Jan. 1987); Part II,/. APCA 37(2), 198-201 (Feb. 1987).
60. M. Kosusko and С. M. Nunez, / Air Waste Manage Assn. 40(2), 254—255 (Feb. 1990).
61. M. A. Palazzolo and B. A. Tichenor, Environ. Progress 6, 172—176 (Aug. 1987).
62. К. C. Lee, H. J. Janes, and D. C. Macauley, Preprint 78-58.6, APCA 71 st Annual Meeting, (June 25—30, 1978, Houston, Tex.) Air Pollution Control
Assn., Pittsburgh, Pa.
63. Ref. 39, p. 26-29.
64. R. W. Coughlin, R. D. Siegel, and C. Rai, eds., AIChE Symp. Ser. 70, (137) (1974). Contains four papers on flue gas desulfurization, four papers on
coal desulfurization, and three papers on petroleum desulfurization.
65. C. Rai and R. D. Siegel, eds., AIChE Symp. Ser. 71, (148) (1975). Contains seven papers on flue gas desulfurization, two on petroleum
desulfurization, one on coal desulfurization, and fifteen on NO control.
66. J. A. Cavallaro, A. W. Dearbrouck, and A. F. Baher, AIChE Symp. Ser. 70, (137); 114—122 (1974).
67. K. S. Murthy, H. S. Rosenberg, and R. B. Engdahl,/. APCA 26, 851—855 (Sept. 1976).
68. A. V. Slack, Chem. Eng. Prog. 72, 94—97 (Aug. 1976).
69. R. M. Jimeson and R. R. Maddocks, Chem. Eng. Prog. 72, 80—88 (Aug. 1976).
70. AIChE Symp. Ser. 68, (126) (1972). Contains four papers on flue gas desulfurization and two on NO control.
71. Control Technology: Gases and Odors, APCA Reprint Series, Air Pollution Control Assn., Pittsburgh (Aug. 1973). A reprint of 1970—1973 APCA
journal articles: six papers on flue gas desulfurization, three on NO control, and two on SO2 control from pulp and paper mills.
72. Sulfur Dioxide Processing, Reprints of 1972—1974 Chem. Eng. Prog, articles, AIChE, New York (1975). Contains thirteen papers on flue gas
desulfurization, two on SO2 control in pulp and paper, one on sulfuric acid tail gas, one on SO2 from ore roasting, and two on NO from nitric
acid.
73. E. L. Plyler and M. A. Maxwell, eds., Proceedings, Flue Gas Desulfurisation Symposium, (New Orleans, La., Dec. 1973), Pub. No. ЕРА-650/2-73-038,
U.S. EPA, Research Triangle Park, N.C., 1973. Contains 34 papers on flue gas desulfurization.
74. Proceedings: Symposium on Flue Gas Desulfurisation, (Atlanta, Ga., Dec. 1974), U.S. EPA, Research Triangle Park, N.C.
75. Proceedings: Symposium on Flue Gas Desulfurisation (New Orleans, Mar. 1976), U.S. EPA, Research Triangle Park, N.C. Contains 36 papers dealing
with flue gas desulfurization.
76. Proceedings of the Third Stationary Source Combustion Symposium, EPA 600/ 7-79-050a (NTIS PB 292 539) U.S. EPA, Industrial Environmental Research
Laboratory, Research Triangle Park, N.C., Feb. 1979.
77. G. M. Blythe and co-workers, Survey of Dy SO2 Control Systems, ЕРА-600/ 7-80-030 (NTIS PB 80 166853), U.S. EPA, Industrial Research
Laboratory, Research Triangle Park, N.C., Feb. 1980.
78. Definitive SO2 Control Process Evaluation: Eimestone Double Alkali and Citrate FGD Process, EPA Pub. EPA-600/7-79-177, Aug. 1979.
79. J. D. Mobley and K. J. Lim, "Control of Gases by Chemical Reaction," in S. Calvert and H. M. Englund, eds., Handbook of Air Pollution Technology,
John Wiley & Sons, Inc., New York, 1984, Chapt. 9, pp. 193—213.
80. G. M. Blythe and co-workers, Survey of Dy SO2 Control Systems, EPA Pub. ЕРА-600/ 7-80-030 (NTIS PB 80-166853), U.S. EPA, Research Triangle
Park, N.C., Feb. 1980.
81. R. Pedroso, An Update of the Wellman-EordFlue Gas Desulfurisation Process, EPA Pub. ЕРА-600/2-76-136a, May 1976.
82. T. W. Devitt, "Fossil Fuel Combustion," in S. Calvert and H. M. Englund, eds., Handbook of Air Pollution Technology, John Wiley & Sons, Inc., New
York, 1984, Chapt. 15, pp. 375-417.
83. Flue Gas Desulfurisation Systems andSO2 Control, Pub. GS-6121, Electric Power Research Institute, Palo Alto, Calif., October 1988. An abstracted
bibliography of EPRI Reports and Projects.
84. Introduction to Eimestone Flue Gas Desulfurisation, Pub. CS-5849, Electric Power Research Institute, Palo Alto, Calif., 1988.
85. SO2 Removal by Injection of Dy Sodium Compounds, Pub. RP-1682, Electric Power Research Institute, Palo Alto, Calif., 1987.
86. C. S. Chang and C. Jorgensen, Environ. Progress 6(1), 26 (Feb. 1987).
87. M. T. Melia and co-workers, "Trends in Commercial Applications of FGD," in Proceedings: Tenth Symposium on FGD, EPRI Report CS-5167, Electric
Power Research Institute, Palo Alto, Calif. (May 1987).
88. Proceedings of the ЕРА/EPRI First CombinedFlue Gas Desulfurisation and Dy SO2 Control Symposium, Oct. 25—28, 1988; St. Louis, Mo., Electric Power
Research Institute, Palo Alto, Calif.
89. S. S. Tsai and co-workers, Environ. Progress 8(2), 126—129 (May 1989).
90. W. Bartok and co-workers, Environ. Progress 9(1), 18—23 (Feb. 1990).
91. W. Moeller and K. Winkler,/. APCA 18, 324 (May 1968).
92. D. S. Davies, R. A. Jiminez, and P. A. Lemke, Chem. Eng. Prog. 70, 68 (June 1974).
93. R. G. Bierbower and J. H. Sciver, Chem. Eng. Prog. 70, 60 (Aug. 1974).
94. К. T. Semrau,/ APCA 21, 185 (Apr. 1971); its bibliography contains 140 refs.
95. J. E. Walther and H. R. Amberg,/ APCA 20, 9 (Jan. 1970).
96. S. F. Galeano and B. R. Dillard,/ APCA 22, 195 (Mar. 1972).
97. J. E. Walther, H. R. Amberg, and H. Hamby, III, Chem. Eng. Prog. 69, 100 (June 1973).
98. J. D. Rushton, Chem. Eng. Prog. 69, 39 (Dec. 1973).
99. Control Techniques for Nitrogen Oxide Emissions from Stationay Sources, Pub. No. AP-67, U.S. Department of Health, Education, and Welfare,
Washington, D.C., 1970.
100. "Formation and Control of Nitrogen Oxides," Catalysis Today 2, Elsevier Science Publishers B.V., Amsterdam, 1988, pp. 369—532.
101. J. A. Miller and G. A. Fisk, "Combustion Chemistry," C&EN, 22—46 (Aug. 31, 1987).
102. W. Bartok, A. R. Crawford, and A. Skopp, Chem. Eng. Prog. 67, 64 (Feb. 1974).
103. R. K. Srivastava andj. A. Mulholland, Environ. Progress!(I), 63—70 (Feb. 1988).
104. J. A. Mulholland and R. K. Srivastava,/ APCA 38(9), 1162-1167 (Sept. 1988).
105. W. Bartok, V. S. Fugleman, R. Goldstein, and E. G. del Valle, AIChE Symp. Ser. 68(126), 30 (1972).
106. W. Bartok, A. R. Crawford, and G. J. Piegari, AIChE Symp. Ser. 68(126), 66 (1972).
107. H. B. Lange, Jr., AIChE Symp. Ser. 68(126), 17 (1972).
108. D. Thompson, T. D. Brown, and J. M. Beer, Combust. Flame 19, 69 (1972).
109. W. Bartok and co-workers, Systems Study of Nitrogen Oxide Control Methods for Stationay Sources, Pub. PB-192789, NTIS, 1969.
110. J. H. Wasser and E. E. Berkau, AIChE Symp. Ser. 68(126), 39 (1972).
111. G. B. Martin and E. E. Berkau, AIChE Symp. Ser. 68(126), 45 (1972).
Kirk-Othmer Encyclopedia of Chemical Technology (4th Edition)
415
AIR POLLUTION CONTROL METHODS
Voll
112. F. A. Bagwell and co-workers,/. МРСЛ 21, 702 (Nov. 1971).
113. T. W. Rhoads and co-workers, Environ. Progress 9(2), 126—130 (May 1990).
114. M. J. Miller, Environ. Progress 5(3), 171—177 (Aug. 1986).
115. J. S. Maulbetsch and co-workers,/ APCA 36, 1294—1298 (Nov. 1986).
116. J. W. Jones, "Estimating Performance and Costs of Retrofit SO2 and NO Controls for Acid Rain Abatement," ACS Extended Abstract Preprint,
ACS Division of Environmental Chemistry Meeting (June 5—11, 1988, Toronto, Ontario).
117. J. D. Mobley and K. J. Lim, "Control of Gases by Chemical Reaction," in S. Calvert and H. M. Englund, eds., Handbook of Air Pollution Technology,
John Wiley & Sons, Inc., New York, 1984, Chapt. 9, pp. 203—213.
118. W. Bartok and co-workers, Chem. Eng. Progress 84(3), 54—71 (Mar. 1988).
119. C&EN 22 (April 18, 1988).
120. R. A. Perry and D. L. Siebers, Nature 324, 657—658 (1986).
121. U.S. Pat. 4,800,068 (Jan. 24,1989), R. A. Perry.
122. R. K. Lyon, Environ. Sci. Technol. 21(3), 231—236 (1987).
123. O. J. Adlhart, S. G. Hindin, and R. E. Kens on, Chem. Eng. Prog. 67, 73 (Feb. 1971).
124. D. J. Newman, Chem. Eng. Prog. 67, 79 (Feb. 1971).
125. G. R. Gillespie, A. A. Boyum, and M. F. Collins, Chem. Eng. Prog. 68, 72 (Apr. 1972).
126. R. M. Reed and R. L. Harvin, Chem. Eng. Prog. 68, 78 (Apr. 1972).
127. R. M. Counce and co-workers, Environ. Progress 9(2), 87—92 (May 1990).
128. L. L. Fomoff, AIChE Symp. Ser. 68(126), 111 (1972).
129. B. J. Mayland and R. C. Heinze, Chem. Eng. Prog. 69, 75 (May 1973).
Fine particle dynamics
130. R. Clift and W. H. Gauvin, Can. J. Chem. Eng. 49, 439 (1971).
131. F. A. Zenz and D. F. Othmer, Fluidisation andFluidParticle Systems, Reinhold, New York, 1960, pp. 206—207.
132. C. A. Lappie and co-workers, Fluid and Particle Mechanics, University of Delaware, Newark, Del., 1956, p. 292.
133. С. B. Shepherd and С. E. Lappie, Ind. Eng. Chem. 31, 972 (1939).
134. С. B. Shepherd and С. E. Lappie, Ind. Eng. Chem. У1, 1246 (1940).
135. К. E. Lunde and С. E. Lappie, Chem. Eng. Prog. 53, 385 (Aug. 1957).
136. C. Y. Shen, Chem. Rev. 55, 595 (1955).
137. P. O. Rhouhiainen and J. W. Stachiewicz,/ Heat Trans. 92, 169 (1970).
138. W. E. Ranz, Penn State Univ. Coll. Eng. Res. Pull. B-66 (Dec. 1966).
139. W. E. Ranz and J. B. Wong, Ind. Eng. Chem. 44, 1371 (1952).
140. H. F. Johnstone and M. H. Roberts, Ind. Eng. Chem. 41, 2417 (1949).
141. H. J. White, IndustrialElectrostatic Precipitation, Addison-Wesley Publishing Co., Reading, Mass., 1963.
142. B. Singh and R. L. Byers, Ind. Eng. Chem. Fund. 11, 127 (1972).
143. L. Waldmann, Z. Natuforsch. 14A, 589 (1959).
144. Control Techniques for Particulate Air Pollutants, AP-51, U.S. Department of Health, Education, and Welfare, Washington, D.C., 1969, p. 42.
145. E. S. Pettyjohn and E. B. Christiansen, Chem. Eng. Prog. 44, 157 (1948).
146. H. Wadell, Physics 5, 281 (1934).
147. H. A. Becker, Can. J. Chem. Eng. 37, 85 (1959).
148. Ref. 131, pp. 209-216.
149. I. Langmuir and К. B. Blodgett, U.S. Army Air Forces Technical Report 5418, February 19, 1946, U.S. Department Commerce, Office Technical
Services PB 27565.
150. Ref. 39, p. 20-83, Fig. 20-105.
151. J. H. Seinfeld, AirPollution Physicaland ChemicalFundamentals, McGraw-Hill, Inc., New York, 1975, p. 457.
152. A. E. Vandegrift, L. J. Shannon, and G. S. Gorman, Chem. Eng. Deskbook 80, 109 (June 18, 1973).
153. К. T. Semrau, C. W. Margnowski, К. E. Lunde, and С. E. Lappie, Ind. Eng. Chem. 50, 1615 (1958).
154. C. J. Stairmand,/ Inst. Fuel29(2), 58 (1956).
155. G. D. Sargent, Chem. Eng. 76, 130 (Jan. 27, 1969).
156. С. P. Kerr,/. APCA 39(12), 1585-1587 (Dec. 1989).
Particulate control, gravity, and centrifugal separation
157. P. Rosin, E. Rammler, and W. Intelmann, Zeit. Ver. Deut. Ind. 76, 433—437 (1932) (in German).
158. Ref. 39, p. 20-86, Fig. 20-109.
159. D. Leith and W. Licht, AIChE Symp. Ser. 68(126), 196-206 (1972).
160. A. C. Stem, Air Pollution, Vol. Ill, 2nd ed., Academic Press, Inc., New York, 1968, p. 370.
161. Ref. 160, p. 361; Air Pollution Manual, Part II, American Industrial Hygiene Association, Detroit, Mich., 1968, p. 29.
162. Manual on Disposal ofRefiney Wastes, API Pub. 931, American Petroleum Institute, Washington, D.C., 1975, Chapt. 11.
163. C. J. Stairmand, Trans. Inst. Chem. Eng. 29, 356—383 (1951).
164. B. Kalen and F. A. Zenz, AIChE Symp. Ser. 70(137), 388-396 (1974).
165. R. McK. Alexander, Proc. Australas. Inst. Min Eng. 152/3, 202—228 (1949).
166. C. J. Stairmand, Engineering 16B, 409—412 (Oct. 21, 1949).
167. A. C. Stem, K. J. Caplan, and P. D. Bush, Cyclone Dust Collectors, American Petroleum Institute, New York, 1955.
168. H. J. Tengbergen in K. Rietema and C. G. Verner, eds., Cyclones in Industry, Elsevier Publishing Co., Amsterdam, 1961 (in English).
169. В. B. Crocker in "Phase Separation" in ref. 39, pp. 18-70—18-88.
170. W. Strauss, Industrial Gas Cleaning, 2nd ed., Pergamon Press, Inc., Oxford, 1975.
171. K. J. Caplan in A. C. Stem, eT, Air Pollution, Vol. Ill, 2nd ed., Academic Press, New York, 1968, Chapt. 43.
172. Ref. 144, Figs. 4-43, 4-44.
Particulate control, electrostatic attraction
173. A. T. Murphy, F. T. Adler, and G. W. Penney, AIIE Trans. Preprint, Paper 59-102 (1959).
174. Ref. 141, p. 140.
175. S. Oglesby, Jr., and G. B. Nichols, "A Manual of Electrostatic Precipitator Technology," NTIS Report PB196380, Southern Research Institute,
Birmingham, Ala., 1970.
176. E. Anderson in R. H. Perry, ed., Chemical Engineers' Handbook, 2nd ed., McGraw-Hill, Inc., New York, 1941, p. 1873.
177. W. B. Smith and J. R. McDonald,/. APCA 25, 168 (Feb. 1975).
Kirk-Othmer Encyclopedia of Chemical Technology (4th Edition)
416
AIR POLLUTION CONTROL METHODS
Voll
178. J. P. Gooch and N. L. Francis J. APCA 25, 108 (Feb. 1975).
179. J. P. Gooch and J. R. McDonald, AIChE Symp. Ser 73(165), 146 (1977).
180. P. Cooperman, "Nondeutschian Phenomena in Electrostatic Precipitation," Preprint 76-42.2APCA 69th Annual Meeting Portland, Oregon, June
27-July 1, 1976.
181. P. L. Feldman, K. S. Kumar, and G. D. Cooperman, AIChE Symp. Ser. 73(165), 120 (1977).
182. Chem. Eng. 83, 51 (Aug. 30, 1976).
183. C. L. Burton and D. A. Smith,/. APCA 25, 139 (Feb. 1975).
184. A. G. Hein,/ APCA 39, 766-771 (May 1989).
185. W. T. Sproull,/. APCA 15, 50 (Feb. 1965).
186. W. T. Sproull,/ЛРСИ 22, 181 (Mar. 1972).
187. H. W. Spencer, III, and G. B. Nichols, "A Study of Rapping Re-entrainment in a Large Pilot Electrostatic Precipitator," Preprint 76-42.5, 68th
APCA AnnualMeeting Portland, Oregon,June27—July 1, 1976.
188. S. Matts, J. APCA 25, 146 (Feb. 1975).
189. A. B. Walker, J. APCA 25, 143 (Feb. 1975).
190. R. E. Cook,/.MPG4 25, 156 (Feb. 1975).
191. E. B. Dismukes,/ APCA 25, 152 (Feb. 1975).
192. R. E. Bickelhaupt,/ APCA 25, 148 (Feb. 1975).
193. H.J. White, /ЛРСИ 24, 313 (Apr. 1974).
194. H. J. White, "Control of Particulates by Electrostatic Precipitation," in S. Calvert and H. M. Englund, eds., Handbook of Air Pollution Technology, John
Wiley & Sons, Inc., New York, 1984, Chapt. 12, pp. 283—329.
195. S. Oglesby, Jr., and G. B. Nichols, Electrostatic Precipitation, Marcel Dekker, Inc., New York, 1978, pp. 132—155; resistivity and conditioning
discussion.
196. M. R. Schioeth, Pulse-Energi^edElectrostatic Precipitators, paper at the Third Conference on Electrostatic Precipitation, Albano-Padova, Italy, October,
1987, F. L. Smidth Co., Valby, Denmark.
197. V. Reyes, Comparison between TraditionalandModem Automatic Controllers on Pull-scale Precipitators, Seventh Symposium on Transfer and Utilization of
Particulate Control Technology, Nashville, Tenn., March 1988, F. L. Smidth Co., Valby, Denmark.
198. H. J. Hall,/. MPG4 25, 132 (Feb. 1975).
199. H.J. White,/. MPG4 25, 102 (Feb. 1975).
200. J. APCA 25, 362 (Apr. 1975).
201. T. T. Shen and N. C. Pereira, "Electrostatic Precipitation" in Handbook of Environmental Engineering Vol. 1, The Humana Press, Clifton, N.J., 1979,
Chapt. 4, pp. 103—143.
202. J. R. Benson and M. Com, / APCA 24, 340 (Apr. 1974).
203. E. Bakke,/. APCA 25, 163 (Feb. 1975).
204. E. Bakke, "The Application of Wet Electrostatic Precipitators for Control of Fine Particulate Matter," Preprint, Symposium on Control of Pine Particulate
Emissions from Industrial Sources, Joint U.S.-USSR Working Group, Stationary Source Air Pollution Control Technology, San Francisco, Calif, Jan. 15—18, 1974.
205. Ref. 39, p. 20-120, Fig. 20-152.
206. D. W. Cooper, "Fine Particle Control by Electrostatic Augmentation of Existing Methods," Preprint 75-02.1, 68th APCA Annual Meeting Poston,
Mass., June 15—20, 1975.
2РП. K. A. Nielsen and J. C. Hill, Ind. Eng. Chem. Fundam. 15, 149,157 (1976).
208. M.J. Pilot, J. APCA 25, 176 (Feb. 1975).
209. M. J. Pilot and D. F. Meyer, University of Washington Electrostatic Spray Scrubber Evaluation, NHS PB 252653, Apr. 1976.
210. K. Zahedi and J. R. Melcher, "Electrofluidized Beds in the Filtration of Submicron Particulate," Preprint 75-57.8, 68th APCA Annual Meeting Boston,
Mass., June 15—20, 1975.
211. W. L. Klugman and S. V. Sheppard, "The Ceilcote Ionizing Wet Scrubber," Preprint 75-30.3, 68th APCA Annual Meeting Boston, Mass., June 15—20,
1975.
212. Helfritch, Chem. Eng. Progress 73, 54—57 (Aug. 1977).
213. C. W. Lear, W. F. Krieve, and E. Cohen, / APCA 25, 184 (Feb. 1975).
214. D. H. Pontius, L. G. Felix, and W. B. Smith, "Performance Characteristics of a Pilot Scale Particle Charging Device," Preprint 76-42.6, 69th APCA
Annual Meeting Portland, Oregon, June 27—July 1, 1976.
215. J. R. Melcher and K. S. Sachar, "Charged Droplet Scrubbing of Submicron Particulate," NHS Pub. PB-241262, Aug. 1974.
Particulate control filtration
216. Ref. 160, p. 413.
217. D. Leith and M. W. First, / APCA 27, 534-539 (June 1977); 27, 636-642 (July 1977).
218. С. E. Billings and J. Wilder, "Handbook of Fabric Filter Technology," NHS Pub. PB200648, PB200649, PB200651, PB200650, 1970.
219. L. Bergmann,/. APCA 24, 1187 (Dec. 1974).
220. E. R. Frederick,/ APCA 24, 1164 (Dec. 1974).
221. R. Dennis,/. APCA 24, 1156 (Dec. 1974).
222. R. L. Lucas in R. H. Perry and С. H. Chilton, eds., Chemical Engineers Handbook, 5th ed., McGraw-Hill, Inc., New York, 1973, p. 20—90.
223. V. E. Schoeck in В. E. Kester, ed., Proceedings, Specialty Conference on Design, Operation, and Maintenance of High Efficiency Particulate ControlEquipment, Air
Pollution Control Association, Pittsburgh, Pa., 1973, pp. 103—117.
224. R. A. Gross, Proceedings of the Specialty Conference on the User and Fabric FilterEquipment II, Air Pollution Control Association, Pittsburgh, Pa., 1975, pp.
159-163.
225. J. APCA 25, 715 (July 1975). Informative Report No. 7 of the APCA TC-1 Particulate Committee.
226. G. W. Bowerman in S. Calvert and H. M. Englund, eds., Handbook of Air Pollution Technology, John Wiley & Sons, Inc., New York, 1984, pp.
153-158.
227. E. Bakke,/. APCA 24, 1150 (Dec. 1974).
228. J. D. Me Kenna, J. C. Mycock, and W. O. Lipscomb,/ APCA 24, 1144 (Dec. 1974).
229. Ref. 39, pp. 20-97-20-104.
230. J. H. Turner and J. D. McKenna, "Control of Particles by Filters," in S. Calvert and H. M. Englund, eds., Handbook of Air Pollution Technology, John
Wiley & Sons, Inc., New York, 1984, Chapt. 11.
231. C. Orr, Filtration, Principles andPractice, 2 vols., Marcel Dekker, Inc., New York, 1977.
232. M. J. Hobson, Review of Baghouse Systemsfor Boiler Plants, pp. 74—84, ref. 190a.
233. R. A. Gross, Proceedings of the Specialty Conference on the User and Fabric FilterEquipment II, Air Pollution Control Association, Pittsburgh, Pa., 1975, pp.
159-163.
234. R. L. Adams, "Fabric Filters for Control of Power Plant Emissions," Preprint 74-100, 67th APCA AnnualMeeting Denver, Col, June 9—13,1974.
235. R. P. Janoso, "Baghouse Dust Collectors on a Low Sulfur Coal Fired Utility Boiler," Preprint 74-101, 67th APCA Annual Meeting Denver, Col, June
Kirk-Othmer Encyclopedia of Chemical Technology (4th Edition)
417
AIR POLLUTION CONTROL METHODS
Voll
9-13, 1974.
236. D. S. Ensor, R. G. Hooper, R. C. Carr, and R. W. Scheck, "Evaluation of a Fabric Filter on a Spreader Stoker Utility Boiler," Preprint 76-27.6, 69th
APCA Annual Meeting, Portland, Oregon, June 27—July 1, 1976.
237. J. D. Me Kenna, J. C. Mycock, and W. O. Lipscomb, "Applying Fabric Filtration to Coal Fired Industrial Boilers: A Pilot Scale Investigation,"
NTIS Pub. PB-245186, Aug. 1975.
238. R. Dennis and co-workers, "Filtration Model for Coal Fly Ash with Glass Fabrics," EPA Rpt. EPA-600/7-77-095a, NTIS Pub. PB 276-489/AS,
August 1977.
239. R. L. Chang, T. R. Snyder, and P. Vann Bush,/ APCA 39, Pt. I, 228; Pt. II, 361 (1989).
240. К. M. Kushing, R. L. Merritt, and R. L. Chang,/. Air Waste Manage Assn. 40, 1051—1058 (July 1990).
241. J. H. Turner,/APCA 24, 1182 (Dec. 1974).
242. R. E. Jenkins and co-workers,/ APCA 37, Pt. I, 749; Pt. II, 1105 (1987).
243. D. C. Drehnel, "Relationship between Fabric Structure and Filtration Performance in Dust Filtration," NTIS Pub. PB-222237, 1973.
244. B. Miller, G. E. R. Lamb, and P. Costanza, "Influence of Fiber Characteristics on Particulate Filtration," NTIS Pub. PB-239997,Jan. 1975.
245. FuelEcon. 12, 47 (Oct. 1936).
246. U.S. Pat. 2,604,187, Dorfan.
247. Taub, "Filtration Phenomena in a Packed Bed Filter," Ph.D. Thesis, Carnegie-Mellon University, Pittsburgh, Pa., 1970.
248. Reese, TAPPI, 60(3), 109 (1977).
249. Parquet, TheElectroscrubberFilter. Applications and Particulate Collection Performance, EPA-600/9-82-005c, p. 363,1982.
250. Self and co-workers, "Electric Augmentation of Granular Bed Filters," EPA-600/9-80-039c, p. 309, 1980.
251. Schueler, Rock Prod, 76(7), 66 (1973); 77(11), 39 (1974).
252. EPA-600/7-78-093,1978.
253. A. M. Squires and R. Pfeffer,/ APCA 20, 534 (Aug. 1970); L. Paretsky, L. Theodore, R. Pfeffer, and A. M. Squires,/ APCA 21, 204 (Apr. 1971);
A. M. Squires and R. A. Graff, J. APCA 21, 272 (May 1971); U.S. Pat. 3,296,775, A. M. Squires.
254. S. Miyamoto andH. L. Bohn,/. APCA 24, 1051 (Nov. 1974); 25, 40 (Jan. 1975).
255. U.S. Pat. 3,410,055, F. A. Zenz.
256. Ref. 222, p. 20-89.
257. H. P. Meissner and H. S. Mickley, Ind. Eng. Chem. 41, 1238 (1949).
258. D. S. Scott and D. A. Guthrie, Can. J. Chem. Eng. 37, 200 (1959).
259. M. L. Jackson, AIChE Symp. Ser. 70(141), 82 (1974).
260. О. H. York, Chem. Eng. Prog. 50, 421 (1954); О. H. York and E. W. Poppele, Chem. Eng. Prog. 59, 45 (June 1963).
261. O. D. Massey, Chem. Eng. Prog. 55, 114 (May 1959); Chem. Eng. 66, 143 (July 13, 1959).
262. J. W. Coykendah, E. F. Spencer, and O. Y. York,/ APCA 18, 315 (May 1968).
263. J. A. Brink, W. F. Burggrabe, and J. A. Rauscher, Chem. Eng. Prog. 60, 68 (Nov. 1964).
264. J. A. Brink, Chem. Eng. 66, 183 (Nov. 16, 1959); Can. J. Chem. Eng. 41, 134 (1963); J. A. Brink, W. F. Burggrabe, and L. E. Greenwell, Chem. Eng.
Prog 64, 82 (Nov. 1968).
265. Ref. 144, p. 73.
266. J. Goldfield, V. Greco, and K. Gandhi, / APCA 20, 466 (July 1970).
Particulate control, wet scrubbing
267. К. T. Semrau,/ APCA 10, 200 (1960).
268. К. T. Semrau, / APCA 13, 587 (1963).
269. Ref. 222, p. 20-98.
270. G. J. Celenza, Chem. Eng. Prog. 66, 31 (Nov. 1970).
271. S. Calvert, / APCA 24, 929 (1974).
272. S. Calvert, J. Goldshmid, D. Leith, and D. Mehta, "Scrubber Handbook," NTIS Pub. PB-213016 andPB-213017, July—Aug. 1972.
273. S. Calvert, Chem. Eng. 84, 54-68 (Aug. 29, 1977).
274. S. Calvert, "Particulate Control by Scrubbing," in S. Calvert and H. M. Englund, eds., Handbook of Air Pollution Technology, John Wiley & Sons, Inc.,
New York, 1984, Chapt. 10, pp. 215-248.
275. H. E. Hesketh, "Atomization and Cloud Behavior in Wet Scrubbers," U.S.-USSR Symposium on Control of Fine Particulate Emissions, Jan. 15—18,1974.
276. W. Strauss, "Particulate Collection by Liquid Scrubbing," in Industrial Gas Cleaning 2nd ed., Pergamon Press, Oxford, 1975, Chapt. 9, pp. 367—408.
277. J. APCA 22, 54 (June 1972).
278. C. J. Stairmand, Trans. Inst. Chem. Eng. 28, 130 (1950).
279. C. J. Stairmand, / Inst. Fuel29(2), 58 (1956).
280. Ref. 222, p. 20-97.
281. Ref. 276, p. 374.
282. R. V. Kleinschmidt and A. W. Anthony in L. C. McCabe, ed., U.S. Technical Conference on Air Pollution, McGraw-Hill, Inc., New York, 1952, p. 310.
283. S. V. Sheppard, / APCA 22, 278 (Apr. 1972).
284. H. Doyle and A. F. Brooks, Ind. Eng. Chem. 49(12), 57A (1957).
285. L. S. Harris, Chem. Eng. Prog. 42, 55 (Apr. 1966).
286. H. E. Gardenier,/ APCA 24, 954 (Oct. 1974).
287. H. F. Johnstone, R. B. Field, and M. C. Tassler, Ind. Eng. Chem. 46, 1601 (1954).
288. W. Barth, Staub 19, 175 (1959).
289. S. Calvert and D. Lundgren, / APCA 18, 677 (Oct. 1968).
290. S. Calvert, D. Lundgren, and D. S. Mehta, / APCA 22, 529 (July 1972).
291. R. H. Boll, Ind. Eng. Chem. Fundam. 12, 40 (Jan. 1973).
292. H. E. Hesketh, / APCA 24, 939 (Oct. 1974).
293. R. H. Boll, L. R. Mais, P. W. Maurer, and W. L. Thompson, / APCA 24, 934 (Oct. 1974).
294. S. W. Behie and J. M. Beeckmans,/ APCA 24, 943 (Oct. 1974).
295. K. G. T. Hollands and К. C. Goel, Ind. Eng. Chem. Fundam. 14, 16 (Jan. 1975).
296. A. B. Walker and R. M. Hah,/. APCA 18, 319 (May 1968).
297. S. Calvert, I. L. Jashnani, and S. Yung, / APCA 24, 971 (Oct. 1974).
298. S. Calvert, I. L. Jashnani, S. Yung, and S. Stalberg, "Entrainment Separators for Scrubbers—Initial Report," NTIS Pub PB-241189, Oct. 1974.
299. E. B. Hanf, Chem. Eng. Prog. 67, 54 (Nov. 1971).
300. T. R. Blackwood, Environ. Progress 7(1), 71—75 (Feb. 1988).
Particulate control, developing technology
301. These references do not include electrostatic augmentation which are included under "Particulate Control, Electrostatic Attraction."L. E. Sparks
Kirk-Othmer Encyclopedia of Chemical Technology (4th Edition)
418
AIR POLLUTION CONTROL METHODS
Voll
and M. J. Pilat, Atmos. Environ. 4, 651 (1970).
302. H. W. Danser, Jr., Chem. Eng. 57, 158 (May 1950).
303. C. A. Stokes, Chem. Eng. Prog 46, 423 (1950).
304. E. P. Mednikov, Acoustic Coagulation and Precipitation of Aerosols., USSR Academy of Science, Moscow, 1963, translated by С. V. Larrick, Consultants
Bureau, 1965.
305. G. R. Gillespie and H. F. Johnstone, Chem. Eng. Prog. 51, 74F (Feb. 1955).
306. S. Calvert and N. C. Jhaveri,/ APCA 24, 946 (1974).
307. S. Calvert, J. Goldshmid, D. Leith, and N. Jhaveri, "Feasibility of Flux Force/Condensation Scrubbing for Fine Particle Collection," NHS Pub.
PB-227307, Oct. 1973.
308. S. R. Rich and T. G. Pantazelos ,/ APCA 24, 952 (Oct. 1974).
309. К. T. Semrau and C. L. Witham, "Condensation and Evaporation Effects in Particulate Scrubbing," Preprint 75-30.1, 68 th APCA Annual Meeting
Boston, Mass., June 15—20, 1975.
Odor measurement and control
310.
311.
312.
313.
314.
315.
316.
317.
318.
319.
320.
321.
322.
323.
324.
325.
326.
327.
328.
329.
330.
331.
332.
333.
334.
335.
336.
337.
338.
339.
J. P. Cox, Odor Control and Olfaction, Pollution Sciences Publishing Company, Lynden, Washington, 1975.
R. W. Moncrieff, Odour Preferences, John Wiley & Sons, Inc., New York, 1966.
W. H. Stahl, ed., Compilation of Odor and Taste Threshold Values Data, American Society for Testing and Materials Data Series 48, Philadelphia, Pa.,
1973.
P. N. Cheremisinoff and R. A. Young, eds., Industrial Odor Technology Assessment, Ann Arbor Science Publishers, Inc., Ann Arbor, Mich., 1975.
J. Wittes and A. Turk, Correlation of Subjective—Objective Methods in the Study of Odors and Taste, American Society for Testing and Materials Special
Technical Pubheation 440, Philadelphia, Pa., 1968, pp. 49—70.
F. V. Wilby,/ APCA 19, 96 (1969).
G. Leonardos, D. Kendall, and N. Barnard,/. APCA 19, 91 (1969).
A. Turk, Basic Principles of Sensoy Evaluation, American Society for Testing and Materials Special Technical Publication #433, 1968, pp. 79—83.
W. C. L. HemeonJ. APCA 18, 166 (1968).
W. C. L. Hemeon, AIChE Symp. Ser. 73(165), 260 (1977).
T. M. Hellman and F. H. Small, Chem. Eng. Prog. 69, 75 (1973).
T. M. Hellman and F. H. Small,/ APCA 24, 979 (1974).
T. M. Hellman in Ref. 266, pp. 45—56.
A. Dravnieks and W. H. Prokop,/ APCA 25, 28 (1975).
G. Leonardos,/. APCA 24, 456 (1974).
R. A. Duffee,/ APCA 18, 472 (1968).
S. C. Varshney, E. Poostchi, A. W. Gnyp, and С. C. St. Pierre, Environ. Progress 5(4), 240—244 (Nov. 1986).
R. M. Bethea and co-workers, Environ. Sci. Technol. 7, 504 (1973).
M. W. First and co-workers, / APCA 24, 653 (1974).
G. A. Herr, Chem. Eng. Prog. 70, 65 (1974).
D. E. Quane, Chem. Eng. Prog. 70, 51 (1974).
D. J. Eisenfelder and J. W. Dolen, Chem. Eng. Prog. 70, 48 (1974).
J. E. Paul,/. APCA 25, 158 (1975).
J. E. Yocom and R. A. Duffee, Chem. Eng. 77(13), 160 (1970).
M. Beltran, Chem. Eng. Prog. 70, 57 (1974).
R. M. Bethea, Engineering Analysis and Odor Control, Chapt. 13, pp. 203—214, ref. 266.
Proceedings, State of the Art of Odor Control Technology Specialty Conference, March 1974, Air Pollution Control Association, Pittsburgh, Pa., 1974.
Proceedings, State of the Art of Odor Control Technology Specialty Conference, March 1977, Air Pollution Control Association, Pittsburgh, Pa., 1977.
A. Turk, S. Mehlman, and E. Levine, Atmos. Environ. 7, 1139 (1973).
W. D. Lovett and F. T. Cunniff, Chem. Eng. Prog. 70, 43 (May 1974).
General References
A. C. Stem, ed., Air Pollution, 3rd ed., Vols. 1—5, Academic Press, Inc., New York (V ols. 1—3, 1976; Vols. 4—5, 1977).
R. G. Bond and С. P. Straub, eds., Handbook of Environmental Control, Vol. 1, CRC Press, Cleveland, Ohio, 1972.
K. Wark and C. F. Warner, Air Pollution: Its Origin and Control, Dun-Donnelley Publishing Corporation, New York, 1976.
J. H. Seinfeld, AirPollution: Physical and ChemicalPundamentals, McGraw-Hill, Inc., New York, 1975.
H. E. Hesketh, Air Pollution Control, Ann Arbor Science Publishers, Inc., Ann Arbor, Mich., 1979.
P. N. Cheremisinoff and R. A. Young, AirPollution Control and Design Handbook, Parts 1 and 2, Marcel Dekker, Inc., New York, 1977.
W. Licht, AirPollution Control Engineering: Basic Calculationsfor Particulate Collection, Marcel Dekker, Inc., New York, 1980.
H. C. Perkins, Air Pollution, McGraw-Hill, Inc., New York, 1974.
C. N. Davies, ed., Aerosol S cience, Academic Press, Inc., New York, 1966.
W. Ruch, ed., Chemical Detection of Gaseous Pollutants, Ann Arbor Science Publishers, Inc., Ann Arbor, Mich., 1966.
B. Y. H. Liu, ed., Pine Particles—-Aerosol Generation, Measurement, Sampling and Analysis, Academic Press, Inc., New York, 1976.
P. O. Warner, Analysis ojAir Pollutants, John Wiley & Sons, Inc., New York, 1976.
W. Strauss, Industrial Gas Cleaning, 2nd ed., Pergamon Press, Oxford, 1975.
L. Theodore and A. J. Bwcyrdenre, Air Pollution Control Equipment—Selection, Design, Operation and Maintenance, Prentice-Hall, Englewood Cliffs, N.J., 1982.
S. Calvert and H. M. Englund, eds., Handbook of Air Pollution Technology, John Wiley & Sons, Inc., New York, 1984.
L. K. Wang and N. C. Pereira, eds., Handbook of Environmental Engineering, Vol. 1—Air andNoise Pollution Control, The Humana Press, Clifton, N.J., 1979.
Burton B. Crocker
Consultant
Kirk-Othmer Encyclopedia of Chemical Technology (4th Edition)
419
ALCOHOL FUELS
Voll
AIR SEPARATION.
See Cryogenics; Membrane technology; Molecular sieves; Nitrogen.
ALCOHOL FUELS
The use of alcohols as motor fuels gained considerable interest in the 1970s as substitutes for gasoline and diesel fuels, or, in the form of blend additives, as
extenders of oil supplies. In the United States, most appEcations involved the use of low level ethanol (qv) [64-17-5] blends in gasoline [8006-61-9] (see
Gasoline and other motor fuels). Brazil, however, launched a major program to substitute ethanol for gasoline in 1976, beginning with a 22% alcohol
ethanol—gasoline blend and adding dedicated ethanol cars in the 1980s. By 1985 ethanol cars accounted for 95% of new car sales in Brazil. By 1988 Brazil
had 3,000,000 automobiles, about 30% of the total automobile population, dedicated to ethanol. The United States has demonstration vehicles using
alcohols (mosdy methanol (qv) [67-56-1J)> but otherwise has not yet passed beyond the use of limited amounts of alcohols and of ethers produced from
alcohols as gasoline components. However, proposals continue to be made to implement alcohol programs similar to that of Brazil (1). Other nations such
as New Zealand, Germany, and Sweden also investigated the use of alcohols as a transportation fuel.
The benefits of alcohol fuels include increased energy diversification in the transportation sector, accompanied by some energy security and balance
of payments benefits, and potential air quaEty improvements as a result of the reduced emissions of photochemically reactive products (see Air pollution).
The Clean Ah Act of 1990 and emission standards set out by the State of California may serve to encourage the substantial use of alcohol fuels, unless
gasoline and diesel technologies can be developed that offer comparable advantages.
Properties of Alcohol Fuels
Table 1 summarizes key properties of ethanol and methanol as compared to other fuels. Both alcohols make exceEent motor fuels, although the high latent
heats of vaporization and the low volatiEties can make cold-starting difficult in vehicles having carburetors or fuel injectors in the intake manifold where the
fuel must be vaporized prior to being introduced into the combustion chamber. This is not the case for direct injection diesel-type engines using methanol
or ethanol. Both methanol and ethanol have high octane values and aEow high compression ratios having increased efficiency and improved power output
per cylinder. Both have wider combustion envelopes than gasoline and can be run at lean air-fuel ratios with better energy efficiency. However, ethanol and
methanol have very low cetane numbers and cannot be used in compression-ignition diesel-type engines unless gas temperatures are high at the time of
injection. Manufacturers of heavy-duty engines have developed several types of systems to assist autoignition of direcdy injected alcohols. These include
glow plugs or spark plugs, reduced engine cooling, and increased amounts of exhaust gas recirculation or, in the case of two-stroke engines, reduced
scavenging. Additives to improve cetane number have been effective as have dual-fuel approaches, in which a smaE amount of diesel fuel is used as an
ignitor for the alcohol.
Table 1. Properties of Fuelsa
Properties Methanol Ethanol Propane Methane Isoctane Unleaded gasoline Diesel fuel #2
constituents ch3oh CH3CH2OH C3H8 CH4 c8h18 CJL.STn At C HL8„ (C8
to C12) to C20)
CAS Registry Number [67-56-1] [64-17-5] [74-98-6] [74-82-8] [5469-84-1] [8006-6-9]
molecular weight 32.04 46.07 44.10 16.04 114.23 -110 IB170
element composition, wt %
c 37.49 52.14 81.71 74.87 84.12 86.44 86.88
H 12.58 13.13 18.29 25.13 15.88 13.56 13.12
о 49.93 34.73 0 0 0 0 0
density at 16°C and 101.3 kPab, kg/m3 794.6 789.8 505.9 0.6776 684.5 721-785 833-881
boiling point at 101.3 kPab, °C 64.5 78.3 6.5 -161.5 99.2 38-204 163-399
freezing point, °C -97.7 -114.1 -188.7 -182.5 -107.4 < —7
vapor pressure at 38°C, kPa 31.9 16.0 1.297 0.5094 11.8 48-108 negligible
heat of vaporization, AH, MJ /kg 1.075 0.8399 0.4253 0.5094 0.2712 0.3044 0.270
gross heating value, MJ /kg 22.7 29.7 50.4 55.5 47.9 47.2 44.9
net heating value
Mj/kgc 20.0 27.0 46.2 50.0 44.2 43.9 42.5
mj/nA 15,800 21,200 23,400 30,600 32,000 35,600
stoichiometric mixture net heating value, 2.68 2.69 2.75 2.72 2.75 2.83 2.74
Mj/kgc
autoignition temperature, °C 464 363 450 537 418 260-460 257
dame temperature, °C 1,871 1,916 1,988 1,949 1,982 2,027 1,993
dash point, °C 11 13 4 -43 to -39 52-96
dame speed at stoichiometry, m/s 0.43 0.40 0.37 0.31 0.34
octane ratings
research 106 107 112 120 100 92-98
motor 92 89 97 120 100 80-90
cetane rating 0-5 >40
flammabiEty Emits, vol % in ah 6.72-36.5 3.28-18.95 2.1-9.5 5.0-15.0 1.0-6.0 1.4-7.6 1.0-5.0
stoichiometric ah—fuel mass ratio 6.46 8.98 15.65 17.21 15.10 14.6 14.5
Kirk-Othmer Encyclopedia of Chemical Technology (4th Edition)
420
ALCOHOL FUELS
Voll
stoichiometric air—fuel volumetric ratio 7.15 14.29 23.82 9.53 59.55 55 85
water solubility complete complete no no no no no
sulfur content, wt % 0 0 0 0 0 <0.06 <0.5
aRefs. 2-7.
To convert kPa to psi, multiply by 0.145.
C To convert MJ /kg to Btu/lb, multiply by 430.3.
dTo convert MJ/m3 to Btu/gal, multiply by 3.59.
There are particular alcohol fuel safety considerations. Unlike gasoline or diesel fuel, the vapor of methanol or ethanol above the liquid fuel in a fuel
tank is usually combustible at ambient temperatures. This poses the risk of an explosion should a spark or flame find its way to the tank such as during
refueling. Additionally, a neat methanol fire has very litde luminosity and, consequendy, fire fighting efforts can be difficult in daylight. However, low
luminosity also implies low radiative duxes from the fire. This, combined with the high latent heat of vaporization, means that the heat release of a
methanol fire is low relative to one of gasoline or diesel fuel. Because methanol or ethanol are both water-soluble, fires can be successfully controlled by
dilution with large amounts of water, a tactic that simply spreads gasoline fires. Nevertheless, fire-extinguishing foams (see Flame retardants) are the
preferred alcohol fire-fighting method.
Some potential problems of alcohol fuels have been addressed by adding small amounts of gasoline or specific hydrocarbons to the fuel, reducing
the flammability envelope and providing luminosity in case of fire.
Uses of Alcohol Fuels
Eady applications of internal combustion engines featured a variety of fuels, including alcohols and alcohol-hydrocarbon blends. In 1907 the U.S.
Department of Agriculture investigated the use of alcohol as a motor fuel. A subsequent study by the U.S. Bureau of Mines concluded that engines could
provide up to 10% higher power on alcohol fuels than on gasoline (8). Mixtures of alcohol and gasoline were used on farms in France and in the United
States in the eady 1900s (9). Moreover, the first Ford Model A automobiles could be run on either gasoline or ethanol using a manually adjustable
carburetor (1). However, the development of low cost gasoline pushed other automobile fuels into very minor roles and the diesel engine further solidified
the hold of petroleum fuels on the transportation sector. Ethanol was occasionally used, particulady in rural regions, when gasoline supplies were short or
when farm prices were low.
Methanol has been used as a motor racing fuel for many decades. Its high latent heat of vaporization cools the incoming charge of air to each
cylinder. Increasing the mass of air taken into each cylinder increases the power developed by each stroke, providing a turbocharger effect. Furthermore,
methanol has a higher octane value than gasoline allowing higher compression ratios, greater efficiency, and higher output per unit of piston displacement
volume. These power increases are advantages in racing as is the simple means by which methanol fuel quality and uniformity can be verified.
The transparency of methanol flames is usually a safety advantage in racing. In the event of fires, drivers have some visibility and the lower heat
release rate of methanol provides less danger for drivers, pit crews, and spectators.
Partly for these reasons, methanol has been the required fuel of the Indianapolis 500 since 1965. Methanol is also used in many other professional
and amateur races. However, transparency of the methanol flames has also been a disadvantage in some race track fires. The invisibility of the flame has
confused pit crews, delayed fire detection, and caused even trained firefighters problems in locating and extinguishing fires.
Low level blends of ethanol and and gasoline enjoyed some popularity in the United States in the 1970s. The interest persists into the 1990s,
encouraged by the exemption of low level ethanol-gasoline blends from the Federal excise tax as well as from state excise taxes in many states.
Energy Diversification and Energy Security
The ethanol program in Brazil addressed that country's oil supply problems in the 1970s, at times improved the balance of payments, and served to
strengthen the economy of the sugar production portion of the agricultural sector. Although the benefits are difficult to quantify because of the very high
inflation rate (10) the Brazilian ethanol program generally met its goals. Ironically the inability of ethanol to substitute successfully for diesel fuel in the
heavy-duty truck sector necessitated keeping refinery outputs up to provide sufficient available diesel fuel. Thus gasoline was in surplus in Brazil and oil
imports were not as much affected as originally hoped. The Brazilian program demonstrated that petroleum substitution strategies need to address the
"whole barrel" product slate of oil refineries.
In the 1990s world events precipitated renewed interest in energy diversification strategies for the U.S. transportation sector. However, few measures
are in place to encourage fuel alternatives outside of the exemption from the Federal excise tax on motor fuel granted to ethanol blends. The Alternative
Motor Fuels Act of 1988 did extend credits to automobile manufacturers in the calculation of corporate average fuel economy (CAFE) for vehicles that use
methanol or ethanol or natural gas; electric vehicles had previously been granted such a credit. Under the Act's provisions, neither ethanol nor methanol is
counted as fuel consumed in the calculation of fuel economy. Thus vehicles that use alcohol have very high fuel economy ratings, reflecting the value of
these vehicles in reducing oil imports. The credits take effect in model-year 1993. The fuel economy calculation assumes that methanol and ethanol fuels in
commerce contain 15% by volume gasoline. Vehicles that can use either alcohol fuels or gasoline receive a reduced CAFE credit. The maximum credit that
can be earned by a manufacturer for selling vehicles capable of using petroleum fuels is capped because alcohol fuels usage by these vehicles is not assured.
Alcohol Availability
Methanol. If methanol is to compete with conventional gasoline and diesel fuel it must be readily available and inexpensively produced. Thus
methanol production from a low-cost feed stock such as natural gas [8006-14-2] or coal is essential (see Feedstocks). There is an abundance of natural gas
(see Gas, natural) worldwide and reserves of coal are even greater than those of natural gas.
Natural Gas Reserves. U.S. natural gas reserves could support a significant methanol fuel program. 1990 proved, ie, well characterized
amounts with access to markets and producible at current market conditions U.S. resources are 4.8 trillion cubic meters
(168 trillion cubic feet = 168 TCF). U.S. consumption is about one-half trillion m3 (18 TCF) or 18 MJ equivalents per year, but half of that is imported.
Estimates of undiscovered U.S. natural gas reserves range from 14 to 16 trillion m3 (492 to 576 TCF) or roughly a 30-year supply at current U.S.
consumption rates. Additional amounts of natural gas may become available from advanced technologies (see Fuels, synthetic).
If 10% of the U.S. gasoline consumption were replaced by methanol for a twenty year period, the required reserves of natural gas to support that
methanol consumption would amount to about one trillion m3 (36 TCF) or twice the 1990 annual consumption. Thus the United States could easily
support a substantial methanol program from domestic reserves. However, the value of domestic natural gas is quite high. Almost all of the gas has access
through the extensive pipeline distribution system to industrial, commercial, and domestic markets and the value of gas in these markets makes methanol
produced from domestic natural gas uncompetitive with gasoline and diesel fuel, unless oil prices are very high.
It is therefore more relevant to examine world resources of natural gas in judging the supply potential for methanol. World proved reserves amount
to approximately 1.1 x 10¹⁵ m3 (40,000 TCF) (11). As seen in Figure 1, these reserves are distributed more widely than oil reserves.
Kirk-Othmer Encyclopedia of Chemical Technology (4th Edition)
421
ALCOHOL FUELS
Voll
Fig. 1. Distribution ofd the world proven gas and oil reserves as of January 1, 1988. (a) 107.5 x 10¹² m3 (3,800 TCF) natural gas; (b) 140 m3 (890 barrels)
Using estimates of proven reserves and commitments to energy and chemical uses of gas resources, the net surplus of natural gas in a number of
different countries that might be available for major fuel methanol projects has been determined. These are more than adequate to support methanol as a
motor fuel.
Coal Reserves. As indicated in Table 2, coal is more abundant than oil and gas worldwide. Moreover, the U.S. has more coal than other
nations: U.S. reserves amount to about 270 billion metric tons, equivalent to about 11 x 1016 MJ (1 x 10²° BTU = 6600 quads), a large number compared
to the total transportation energy use of about 3.5 x 10¹⁴ MJ (21 quads) per year (11). Methanol produced from U.S. coal would obviously provide better
energy security benefits than methanol produced from imported natural gas. At present however, the costs of producing methanol from coal are far higher
than the costs of producing methanol from natural gas.
Table 2. World Estimated Recoverable Reserves of Coal in Billions of Metric Tons*
Location Anthracite and bituminous coalb Lignite0 Total
North America Canada 4.43 2.42 6.85
Mexico 1.91 1.91
United States 231.13 32.71 263.84
Total 237.47 35.13 272.60
Central and South America Total 5.13 0.02 5.15
Western Europe Total 32.20 58.23 90.43
Eastern Europe and USSR USSR 150.19 94.53 2А47П
Total 182.82 139.17 321.99
Middle East Total 0.18 0.18
Africa Total 64.67 64.67
Far East and Oceania Australia 29.51 36.20 65.71
China 98.79 98.79
Total 130.39 38.61 169.00
World total 652.86 271.16 924.02
aRef. 12.
Includes subanthracite and subbituminous.
Includes brown coal.
Biomass. Methanol can be produced from wood and other types of biomass (see Chemurgy; Fuels frombiomass). The prospects for biomass
reserves are noted below.
Ethanol. From the point of view of availability, ethanol is extremely attractive because it can be produced from renewable biomass. Estimates
Kirk-Othmer Encyclopedia of Chemical Technology (4th Edition)
422
ALCOHOL FUELS
Voll
of the amount of ethanol that could be produced from biomass on a sustained basis range from about 3 x 10¹³ to more than 8 x 10¹⁴ MJ/yr (2—50
quad/yr), about half of which would derive from wood crops (11).
Economic Aspects
Alcohol Production. Studies to assess the costs of alcohol fuels and to compare the costs to those of conventional fuels contain significant
uncertainties. In general, the low cost estimates indicate that methanol produced on a large scale from low cost natural gas could compete with gasoline
when oil prices are around 140/L ($27/bbl). This comparison does not give methanol any credits for environmental or energy diversification benefits.
Ethanol does not become competitive until petroleum prices are much higher.
Methanol.
Produced from Natural Gas. Cost assessments of methanol produced from natural gas have been performed (13—18). Projections depend
on such factors as the estimated costs of the methanol production facility, the value of the feedstock, and operating, maintenance, and shipping costs.
Estimates vary for each of these factors. Costs also depend on the value of oil. Oil price not only affects the value of natural gas, it also affects the costs of
plant components, labor, and shipping.
Estimates of the landed costs of methanol (the costs of methanol deEvered by ship to a bulk terminal in Los Angeles), vary between 8.9 and 15.6
cents per liter (33.6 and 59.2 cents per gallon). Estimates range from 7.9 to 11.1 cents per liter (30 to 42 cents per gallon) in a large-scale established
methanol market and 11.9 to 19.3 cents per liter (45 to 73 cents per gallon) during a small volume transition phase (18).
Estimated pump prices must take terminaling, distribution, and retailing costs into account as well as any differences in vehicle efficiency that
methanol might offer. Estimates range from no efficiency advantage to about 30% improvement in fuel efficiency for dedicated and optimized methanol
light-duty vehicles. Finally, the cost comparison must take into account the fuel specification for methanol. Most fuel methanol for light-duty vehicles is in
the form of 85% methanol, 15% gasoline by volume often termed M85.
The sum of the downstream costs adds roughly 7.9 cents per liter (300/gal) and the adjustment of the final cost for an amount of methanol fuel
equivalent in distance driven to an equal volume gasoline involves a multiplier ranging from 1.6 to 2.0, depending on fuel specification and the assumed
efficiency for methanol light-duty vehicles as compared to gasoline vehicles. The California Advisory Board has undertaken such cost assessment (11).
A cost assessment must also take into account the volume of methanol use ultimately contemplated. A huge methanol program designed to replace
most of the U.S. gasoline use would be likely to increase the value of even remotely located natural gas. A big program would also tend to decrease the
price of oil, making it more difficult for methanol to compete as a motor fuel. Nevertheless, a balanced assessment of all the studies appears to indicate that
a large scale methanol project could provide a motor fuel that competes with gasoline when oil prices are not less than about $0.17/L (1988 U.S. $27/bbl).
In small volume transition phases, methanol cannot compete direcdy in price with gasoline unless oil prices become very high, with the possible
exception of a few scenarios in which low cost methanol is available from expansions to existing methanol plants currendy serving the chemical markets
for methanol. Energy diversification benefits have not been quantified but the potential air quaEty benefits have been studied in the work of the California
Advisory Board on Ah QuaEty and Fuels. The investment required to introduce methanol might weE be justified on ah quaEty grounds, at least in those
areas such as California where ah pollution programs involve substantial costs. However, the relative advantage of methanol depends on the emissions
levels from future vehicles and on the costs of cleaner gasolines that might be able to offer environmental benefits that compete at least to some extent
with the environmental benefits of methanol.
Produced from Coal. Estimates of the cost of producing methanol from coal have been made by the U.S. Department of Energy (DOE)
(12,17) and they are more uncertain than those using natural gas. Experience in coal-to-methanol faciEties of the type and size that would offer the most
competitive product is limited. The projected costs of coal-derived methanol are considerably higher than those of methanol produced from natural gas.
The cost of the production faciEty accounts for most of the increase (11). Coal-derived methanol is not expected to compete with gasoline unless oil prices
exceed $0.31/L ($50/bbl). Successful development of lower cost entrained gasification technologies could reduce the cost so as to make coal-derived
methanol competitive at oil prices as low as $0.25/L ($40/bbl) (17) (see Coal conversion processes).
These cost comparisons do not assign any credit to methanol for environmental improvements or energy security. Energy security benefits could be
large if methanol were produced from domestic coal.
Produced from Biomass. Estimates for methanol produced from biomass indicate (11) that these costs are higher than those of methanol
produced from coal. Barring substantial technological improvements, methanol produced from biomass does not appear to be competitive.
Ethanol. Accurate projections of ethanol costs are much more difficult to make than are those for methanol. Large scale ethanol production
would impact upon food costs and have important environmental consequences that are rarely cost-analyzed because of the complexity. Furthermore, for
com, the most likely large-scale feedstock, ethanol costs are strongly influenced by the credit assigned to the protein by-product remaining after the starch
has been removed and converted to ethanol.
Cost estimates of producing ethanol from com have many uncertainties (11). Most estimates fall into the range of $0.26 to 0.40 per Eter ($1 to
1.50/gal), after taking credits for protein by-products, although some estimates are lower. These estimates do not make ethanol competitive with oil until
oil prices are above $0.38/L ($60/bbl) (17).
For these reasons, ethanol is most likely to find use as a motor fuel in the form of a gasoline additive, either as ethanol or ethanol-based ethers. In
these blend uses, ethanol can capture the high market value of gasoline components that provide high octane and reduced vapor pressure.
Impact of Incremental Vehicle Costs. The costs of alcohol fuel usage may include other costs associated with vehicles. Incremental
vehicle costs have been estimated by the Ford Motor Company for the fuel-flexible vehicle that can use gasoline, methanol, ethanol, or any mixture of
these, to be in the range of $300 per vehicle assuming substantial production (14). This cost may or may not be passed along to the consumer, because of
incentives provided to the manufacturer by the Alternative Motor Fuels Act of 1988. There also may be incremental vehicle operating costs resulting from
increased lubrication or increased frequency of oil changes.
Infrastructure Requirements. In general, infrastructure requhements resulting from the expanded use of alcohol fuels are not especially
greater than those involved in the production and refining of oil. However, for a corresponding deEvery of energy, the capital costs of alcohol infrastructure
would presumably be larger, as capital costs of production faciEties appear to be larger than corresponding oil refinery costs for an equivalent amount of
energy output. Moreover, infrastructure costs for storage and distribution faciEties could be higher. FaciEties for hydrocarbon fuels are generally not
compatible with methanol and ethanol. Thus a program to introduce substantial amounts of alcohol fuel might well require existing infrastructure
modifications. These changes can be especially difficult and costiy for underground pipelines and tanks, which need to be replaced or modified.
In California, the South Coast Ah QuaEty Management District has implemented a local rule requiring that one new or replacement underground
tank at each gasoline retail faciEty must be suitable for methanol. Replacement of an existing tank can cost $50,000 and perhaps more. But many small retail
outlets are being replaced by larger more efficient ones, and many older underground tanks (qv) are being replaced to prevent possible leaks and hence
underground contamination. Therefore the compatibiEty rule allows for the gradual development of a methanol-compatible infrastructure at low costs. The
extra costs for methanol-compatible storage ranges from negligible to about $4000 per tank and dispenser, depending on the technical choices that would
otherwise be made for gasoline-only faciEties.
Vehicle Technology and Vehicle Emissions
One of the reasons that U.S. automobile manufacturers showed more interest in alcohols as alternative fuels in the late 1970s and early 1980s is because
alcohol's energy density is closer to gasoline and diesel than other alternatives such as compressed natural gas. They reasoned that consumers would be
more comfortable with Equid fuels, envisioning Ettie change in the fuel distribution of alcohols. Most of the research in the 1970s focused on converting
light-duty vehicles, to alcohol fuels. Towards the late 1970s, researchers also began to turn then attention to heavy-duty appEcations. In heavy-duty engines
the emissions benefits of alcohols are far clearer than in light-duty vehicles. However, it is also much harder to design heavy-duty engines to use the low
cetane number alcohols.
It was not until the early 1980s that the potential ah quaEty benefits of alcohol fuels started to be investigated. It was about five years later that
Kirk-Othmer Encyclopedia of Chemical Technology (4th Edition)
423
ALCOHOL FUELS
Voll
proponents argued that alcohols could provide significant air quality benefits in addition to energy security benefits. Low level blends of ethanol and
gasoline were argued to provide lower CO emissions. The exhaust from light-duty methanol vehicles was thought to be less reactive in the formation of
ozone. Uses of alcohols fuels in heavy-duty engines showed substantially reduced mass emissions in contrast to light-duty experience which showed about
the same mass emissions but a reduced reactivity of the exhaust components.
LIGHT-DUTY VEHICLES
Use of Low Level Blends. The first significant U.S. use of alcohols as fuels since the 1930s was the low level 10% splash blending of ethanol
in gasoline, which started after the oil crisis of the 1970s. This blend, called gasohol, is still sold in commerce although mosdy by independent marketers
and distributors instead of the major oil companies. EPA provided a waiver for this fuel allowing for a 6.9 kPa (1 psi) increase in the vapor pressure of
gasohol over that of gasoline.
In the first years of gasohol use some starting and driveability problems were reported (19). Not all vehicles experienced these problems, however,
and better fuel economy was often indicated even though the energy content of the fuel was reduced. Gasohol was exempted from the federal excise tax
amounting to a $0.16/L ($0.60/gal) subsidy. Without this subsidy, ethanol would be too expensive for use even as a fuel additive.
Nearly four billion L/yr of ethanol are added to gasoline and sold as gasohol (18). The starting or driveability difficulties have been solved, in part,
by the advances in vehicle technology employing fuel feedback controls.
Methanol was also considered as a gasoline additive. Table 3 summarizes some of the oxygenated compounds approved by EPA for use in unleaded
gasoline. EPA waivers were granted to Sun Oil Company in 1979 for 2.75% by volume methanol with an equal volume of tertiary butyl alcohol [75-65-0]
(TBA) up to a blend oxygen total of 2% by weight oxygen; ARCO in 1979 for up to 7% by volume TBA; and ARCO in 1981 for the use of the blends
containing a maximum of 3.5% by weight oxygen. These last blends are gasoline-grade TBA (GTBA) and OXINOL having up to 1:1 volume ratio of
methanol to GTBA. Petrocoal was also granted a waiver to market up to 10% by volume methanol and cosolvents in gasoline but this waiver was revoked
in 1986 after automobile manufactures complained of significant material compatibility problems and openly warned consumers against gasolines
containing methanol. A waiver was issued to Du Pont in 1985 which allowed addition of up to 5% methanol to gasoline having a mixture of 2.5%
cosolvents. None of these additives became very popular (20).
Table 3. EPA Approved Oxygenated Compounds for Use in Unleaded Gasoline*
Compound Broadest EPA waiver Date Maximum oxygen, wt % Maximum oxygenate, vol %
methanol substantially similar 1981 0.3
propyl alcohols substantially similar 1981 2.0 (7.1)c
butyl alcohols substantially similar 1981 2.0 (8.7)c
methyl /^z+butyl ether (MTBE) substantially similar 1981 2.0 (11.0)c
/^-amyl methyl ether (TAME) substantially similar 1981 2.0 (12.7)c
isopropyl ether substantially similar 1981 2.0 (12.8)c
methanol and butyl alcohol or higher mol wt substantially similar 1981 2.0 5.5
alcohols in equal vol
ethanol gasohol 1979, 1982 (3.5+ 10.0
gasoline grade /^z+butyl alcohol (GTBA) ARCO 1981 3.5 (15.7)c
methanol + GTBA (1:1 max ratio) ARCO (OXINOL) 1981 3.5 (9.4)c
Du Pon/ 1985 3.7 e
methanol at 5 vol % max + 2.5 vol % min Texas methanol 1988 3.7 e
cosolvent (OCTAMIX)g
aRef. 21
All blends of these oxygenated compounds are subject to ASTM D 439 volatility limits except ethanol. Contact the EPA for current waivers and detailed
requirements, U.S. Environmental Protection Agency, Field Operations and Support Division (EN-397F), 401 M Street, S.W., Washington, D.C. 20460.
Calculated equivalent for avaerage specific gravity gasoline (0.737 specific gravity at 16°C, NIPER Gasoline Report). Calculated equivalent depends on the
specific gravity of the gasoline.
Value shown is for denatured ethanol. Neat ethanol blended at 10.0 vol % produces 3.7 wt % oxygen.
The cosolvents are any one or a mixture of ethanol, propyl, and butyl alcohols. Corrosion inhibitor is also required.
Varies with type of cosolvent.
^The cosolvents are a mixture of ethanol, propyl, butyl and higher alcohols up to octyl alcohol. Corrosion inhibitor is also required.
Vehicle Emissions. Gasohol has some automotive exhaust emissions benefits because adding oxygen to a fuel leans out the fuel mixture,
producing less carbon monoxide [630-08-2] (CO). This is true both for carbureted vehicles and for those having electronic fuel injection.
Urban areas such as Denver, Phoenix, and others at high altitudes have problems complying with health-based carbon monoxide standards in part
because of automobile emissions. Vehicles calibrated for operation at sea level that are operated at high altitudes run rich, producing more CO. Blends such
as gasohol cause the engine to operate leaner because of the oxygen in the fuel. There are larger CO reductions using oxygenated blends in older,
carbureted engines. But even the newer technology vehicles have lower CO emissions using gasohol and other oxygenated fuels because of periods of open
loop operation, especially during cold starts.
Blended fuels increase the vapor pressure of the resulting mixture so that more hydrocarbons are evaporated into the atmosphere during operation,
refueling, or periods of extended parking. Although these hydrocarbons can react with NO emissions in sunlight to form ozone, atmospheric modeling
has indicated that ozone is probably not increased as a result of the higher fuel volatility for two reasons (see Atmospheric modeling). First, CO is also an
ozone precursor so reducing CO reduces ozone. Second, the hydrocarbon species are somewhat less reactive because of the lower reactivity of ethanol.
Furthermore, programs for oxygenated fuel use are focused at high CO occurrences during the year. These usually occur in the wintertime, whereas most
areas violate ozone standards in the summer months. Therefore, oxygenated fuel programs, as a CO control strategy, do not generally interfere with ozone
attainment strategies. However, programs should be individually evaluated (20).
Ethanol blends can also have an effect on NO emissions. Scattered data indicate that NO may increase as oxygenates are added to the fuel.
Other countries have also investigated the use of low level alcohol blends as an energy substitution strategy as well as to reduce exhaust emissions of
lead (qv) (22,23). Brazil implemented low level ethanol-gasoline blends throughout the twentieth century during times of oil shortages or as a hedge against
international fluctuations in sugar prices. Blends ranged from 15 to 42%. In 1975 Proalcool, Brazil's ethanol fuel program, was initiated and required the
blending of 20% by volume of ethanol in gasoline. This was not totally achieved throughout Brazil until about 1986 when a 22% ethanol-gasoline blend
was standardized. Once the fuel was standardized, engine modifications for new vehicles were made, including higher compression and adjustments to the
Kirk-Othmer Encyclopedia of Chemical Technology (4th Edition)
424
ALCOHOL FUELS
Voll
carburetor and timing (22).
Germany also evaluated the gasoline—alcohol blends using methanol. Eady programs used 15% methanol added to gasoline (M15). This program
required vehicles to be designed for this fuel. Modifications included changes to the fueling system for air—fuel control and vehicle material changes to be
compatible with the higher methanol concentrations. The program ended in 1982. M15 was concluded to be feasible if higher vehicle costs could be offset
by the possibility of lower fuel costs (24). Lower level blends were also investigated using up to 3% methanol with 2 or more percent of a suitable
cosolvent. Unlike M15, gasoline vehicles could use this blend without any modifications (25). Germany has for several years now used low level blends of
methanol in their gasoline.
Retrofits. Retrofits are vehicles designed for conventional fuels modified so that the vehicles can operate on alcohol. Generally, because both
ethanol and methanol have lower energy densities, the quantity of fuel entering the engine must be increased to get the same power. Also, because the
alcohols have slightly different combustion characteristics, engine parameters such as ignition timing need to be adjusted. To optimize performance and
fuel economy the compression ratio of the engine should be increased. However, the economics of these conversions are such that the least amount of
changes are made and adjustments to engine compression ratio is typically not done.
Retrofits were popular at the beginning of alcohol fuel programs. Kits were introduced that modified only the fuel flow rate into the engine, but
material changes were also necessary because both ethanol and methanol are more corrosive to metals than gasoline. Retrofitting allowed maximum market
penetration without having to wait for fleet roll over or for manufacturers to market new vehicles. There was some success in converting light-duty vehicles
to methanol. Bank of America operated a fleet of 292 converted Ford and Chevrolet vehicles in the late 1970s and into the 1980s before oil prices
collapsed. A conversion kit for these vehicles included hardware, material changes, and a fuel additive to help minimize corrosion (26,27).
The California Energy Commission (CEC) evaluated the conversion of 1980 Ford Pintos equipped with 2.3-L four-cylinder engines,
feedback-controlled carburetors, and three-way catalysts. Four vehicles were left unmodified, four converted to methanol, and four converted to ethanol.
The basic changes required to use the alcohols were: the terneplate coating in the fuel tanks was stripped; fuel level sending units and carburetors were
chromated to inhibit corrosion; and the air—fuel ratio, timing, and fuel vaporization mechanisms were recalibrated for proper combustion of alcohol fuels
and to comply with emission standards. Two methanol- and two ethanol-fueled engines had special pistons installed to raise compression ratios from 9:1
to 12:1 for better efficiency. These vehicles were operated for 18 months accumulating 272,000 km (169,300 miles). The methanol conversions averaged
25,000 km; ethanol conversions, 21,700 km; and gasoline controls, 22,100 km. Although both the methanol and ethanol vehicles were designed to operate
on 100% alcohol, they utilized M94.5 (94.5 vol % methanol and 5.5% isopentane [78-78-4] added to improve cold starts and engine warmup) and CDA-20
(ethanol denatured using 2 to 5% unleaded gasoline) (28,29).
This conversion program indicated that vehicles could be converted to alcohols. Good fuel economy was obtained; methanol vehicles averaged 4.7
km/L (11.0 mpg) or 9.1 km/L (21.3 mpg) on an equivalent energy basis compared to 8.3 km/L (19.5 mpg) for the gasoline control vehicles. No driveability
problems were reported and vehicles had no problems starting (lowest temperature was —1.1°C). Both the ethanol and methanol Pintos showed increased
upper cylinder wear over gasoline engines. Poor lubrication from using alcohols and excess fueling because of carburetor float problems contributed to the
higher wear rates. Hydrocarbon, carbon monoxide, and XO emissions were less for methanol, 0.14, 3.2, and 0.3 g/km, respectively, than for gasoline,
0.25, 5.6, and 0.6 g/km.
The biggest problems of the CEC Pinto fleet were that vehicle conversions were expensive and alcohol fuels were more expensive than gasoline.
Changes to the fuel tank, fuel lines, and the carburetor were too labor-intensive to be done cheaply. However, these changes if designed, could be made
during the vehicle manufacturing at litde additional cost (30). Brazil priced ethanol at 65% the cost of gasoline (10) so that conversions could be
cost-effective because of the savings on the fuel costs.
Other significant disadvantages of retrofits were the quaEty of the conversion kits and the ability of the conversions to meet emission regulations
over the useful vehicle life. The initial phases of the Brazilian ethanol program also suffered because of poor quaEty vehicle retrofits. The quaEty was so
poor that the program almost failed after a fairly substantial number of vehicles were converted and the ethanol fuel infrastructure was in place. Further
incentives and automobile manufacturers introducing new vehicles designed for ethanol stabilized the program (31).
For these reasons, CEC and DOE concluded that the only cost-effective method of getting alcohol fueled vehicles would be from original
equipment manufacturers (OEM). Vehicles produced on the assembly line would have lower unit costs. The OEM could design and ensure the success
and durabiEty of the emission control equipment.
Dedicated Vehicles. Only Brazil and California have continued implementing alcohols in the transportation sector. The BraziEan program,
the largest alternative fuel program in the world, used about 7.5% of oil equivalent of ethanol in 1987 (equivalent to 150,000 bbl of crude oil per day). In
1987 about 4 million vehicles operated on 100% ethanol and 94% of all new vehicles purchased that year were ethanol-fueled. About 25% of Brazil's
light-duty vehicle fleet (10) operate on alcohol. The leading BraziEan OEMs are Autolatina (a joint venture of Volkswagen and Ford), GM, and Fiat.
Vehicles are manufactured and marketed in Brazil.
In contrast the California program has some 600 demonstration vehicles (32). Both Ford and Volkswagen participated in the dedicated vehicle
phase of the California program. In 1981 Volkswagen provided the first alcohol vehicles produced on an assembly line, forty (19 methanol, 20 ethanol, and
1 gasoline) VW Rabbits and light-duty trucks were manufactured. Design incorporated continuous port fuel injection, 12.5:1 compression ratio, a new
ignition system caEbration, and a heat exchanger for faster oil warmup. The entire fuel system was designed using materials compatible with methanol and
ethanol. These vehicles operated until 1983 and logged 728,000 km of service. This fleet used the same fuel as the ethanol and methanol Pinto retrofits.
In 1981 Ford also provided CEC with 40 Escorts designed to operate on M94.5 and 15 gasoline vehicles to serve as controls. These vehicles had
accumulated over 3.4 million km of service as of March 1986. The 1981 Escorts were modified to use methanol. The 1.6-L gasoline engine had a
production piston used in European 1.6-L engines to raise the compression ratio to 11.4:1. Other field modifications included spark plug change, a
carburetor throtdeshaft material change, carburetor float redesign, and the replacement of tin-plated fuel tanks with ones of stainless-steel.
In 1983 the methanol fleet was expanded with the purchase of 506 Ford Escorts. These vehicles are equipped with engines and fuel systems
redesigned from Ford's standard 1.6-L gasoline-fueled Escort. Ford also produced five advanced technology vehicles equipped with electronic fuel
injection and microprocessor control, with the goal of improving fuel economy and reducing XO emissions to 0.25 g/km. The emissions control on these
vehicles used the same technology as on the carbureted gasoline versions: standard three-way catalyst, exhaust gas recirculation, and air injection. The 1981
and 1983 Escorts have logged over 48 million km in service and some vehicles have reached gasoline equivalent fuel usage per kilometer over the lifetime of
the vehicle.
The methanol fuel specification was changed for the Escorts, at the end of 1983 from M94.5 to a blend of 90% methanol and 10% unleaded
gasoline (M90). In the summer of 1984 the fuel was further modified to include 15% gasoline (M85). This change from isopentane was made because
gasoline was cheaper. In addition, M85 has a gasoline odor and taste, and in daylight the flame is more visible than either M94.5 or M90. Another safety
benefit of the added gasoline is the increased volatiEty creating a richer air—vapor mixture much less likely to bum or explode in closed containers than neat
or 100 percent methanol.
The results of the California fleet demonstrations indicated that fuel economy on an energy basis was equal to or better than gasoline, especially
using vehicles having higher compression. None of these engines, however, was fully optimized for methanol so additional improvements are possible.
DriveabiEty was also good for the methanol vehicles. An acceleration test of two 1983 methanol-fueled vehicles and a similar 1984 model resulted in: 1983
fuel injection (EFI) methanol, 14.53 s; 1983 carbureted methanol, 15.51 s; and 1984 carbureted gasoline, 19.10 s.
Tests demonstrate that methanol vehicles can meet stringent emission standards for HC, CO, and NO as indicated in Figure 2. The primary
benefit of methanol, however, is not the amount of hydrocarbons emitted but rather that methanol-fueled vehicles emit mainly methanol which is less
reactive in the formation of ozone than the variety of complex organic molecules in gasoline exhaust. Formaldehyde [50-00-0] emissions from methanol
vehicles are increased in comparison to gasoline vehicles. Tests of 1983 Escorts showed tailpipe levels as high as 62 mg/km, well above typical gasoline
levels of 2 to 7 mg/km. The 1981 Rabbits ranged from about 6 to 14 mg/km and the 1981 Escorts had levels less than 7 mg/km. AH results were obtained
on relatively low mileage vehicles. Deterioration of catalyst effectiveness could increase these emissions.
Kirk-Othmer Encyclopedia of Chemical Technology (4th Edition)
425
ALCOHOL FUELS
Voll
-Pintos Escorts
Volkswagens
EFI Escorts
1980 1981 1982 1983 1984 1985 1986
Fig. 2. CEC methanol-fueled vehicle exhaust profile for (a) HC, hydrocarbons; (b) NO ; and (c) CO. Solid line represents State of California standard
maximum emissions. Methanol HC emissions are calculated as CH . and not corrected for flame-ionization detector response.
The vehicles investigated were mosdy adaptions of gasoline technology. For example, automobile manufacturers recommended that catalytic
converters designed for gasoline automobiles be installed on vehicles in Brazil to control acetaldehyde [75-07-0] emissions. Brazil decided against catalysts
because gasoline vehicles at that time did not have these systems. Similarly, California adopted M85 to aid in cold starting and to provide some measures of
perceived safety. Research to find other additives that would assist in cold starting and provide safety characteristics at a reasonable price have been
relatively unsuccessful (33). But another way to overcome the issue of cold starting is to design and optimize engines to operate on 100% methanol (M100).
EPA has been pursuing M100 for several years with good success (34). Cold starting is not a problem for direct injected engines where high pressure is
used to atomize the fuel and results indicate that a light-duty, direct injection engine can attain very low emissions having good fuel economy and
driveability. However, safety concerns of using M100 in general commerce need to be addressed (35).
Fuel Flexible Vehicles. Using dedicated alcohol fuel vehicles pointed to the importance of a wide distribution of fueling stations.
Methanol-fueled vehicles require refueling more often than gasoline vehicles.
In 1981, the Dutch company TNО in cooperation with the New Zealand government converted a gasoline engine to a flexible fuel vehicle by
adding a fuel sensor. The sensor determined the amount of oxygen in the fuel and then used this information to mechanically adjust the carburetor jets.
The initial mechanical system was crude, but the advancement of engine and emission controls, in particular the use of electronics and computers, has
brought about substantial refinement (36).
Ford first tried the flexible fuel system on an Escort and called it the "flexible fueled vehicle" or FFV. As seen in Figure 3, the system included
building into the electronics any necessary calibrations for gasoline and methanol fuels, adding a sensor to determine the amount of methanol in the fuel,
and making necessary material changes to fuel wetted components. The sensor is one of the most critical parts of this system: its output determines
parameters such as the amount of fuel to be injected and engine timing. Fuel injectors must also have a wider response range. The engine compression
ratio was not changed because the vehicle is designed to operate as well on gasoline as on methanol.
Signal from engine computer
percent methanol
Fig. 3. Components of a Ford flexible fuel vehicle (FFV).
Of course, FFV drivers do not have to use methanol. Emissions benefits are not obtained if methanol is not used, and fuel economy is not
optimized for methanol nor are emissions. However the State of California has concluded that advantages offered by the flexibiEty of the FFV far
outweigh the disadvantages (37).
Many U.S. and foreign automobile manufacturers are developing a fuel flexible vehicle in the 1990s. Ford has developed FFVs for 5-L engines used
Kirk-Othmer Encyclopedia of Chemical Technology (4th Edition)
426
ALCOHOL FUELS
Voll
in. Crown Victorias and for 3.0-L engines used in their Taurus car line. GM followed Ford with a variable fueled vehicle (VFV) and applied this technology
first to the 2.8-L engine family used in the Corsica, and more recendy to the 3.1-L engine family in the Lumina (see Fig. 4). Prototype flexible fuel vehicles
are also being developed by Volkswagen, Chrysler, Toyota, Nissan, and Mitsubishi. California is in the process of obtaining an additional 5,000 of these
vehicles in the next several model years (MY92 and MY93) to be used by government and private fleets.
Fuel feed and
return hoses
Fig. 4. Components of a Lumina methanol variable fueled vehicle (VFV).
The experience using fuel flexible vehicles has been surprisingly successful. California is operating about 200 vehicles and driveability is excellent on
whatever fuel is used. Tests performed on a Ford Crown Victoria showed slightly better fuel economy (4%) and better acceleration (6%) on methanol than
gasoline (38). The fuel flexible technology is not limited to methanol but with electronic calibration changes also works for ethanol and gasoline
combinations. Changes can be made by adjusting the engine maps in the computer.
EPA, the Air Resources Board (ARB), and others are investigating the possible emission benefits of alcohol fueled vehicles. EPA and ARB adopted
regulations for hydrocarbon mass emissions which accounted for the oxygen components in the exhaust, so-called organic mass hydrocarbon equivalent
(OMHCE). The regulations required methanol vehicles to meet the same OMHCE value as gasoline hydrocarbons, which in California is 0.155 g/km in
1993. The trend is to account also for the total mass and the reactivity of individual hydrocarbon species and the measure being proposed for total mass is
non-methane organic gases or NMOG. Reactivity of the individual species that make up NMOG are estimated (39) to give a value of ozone/km.
Vehicle emissions have been monitored over the last several years on fuel flexible vehicles and depending on when the tests were performed,
reported in total hydrocarbons, OMHCE, or NMOG. The vehicle testing performed to date has shown that methanol FFVs can provide emissions
benefits. Figure 5 shows the emissions from a GM Corsica for various gasoline methanol mixtures (40). This vehicle was designed to meet the California
standards of 0.155 g/km hydrocarbon, 2.1 g/km CO, and 0.25 g/km NO . In addition California requires methanol vehicles to meet a formaldehyde
standard of 9.3 mg/km. The total organic emissions decrease with increasing methanol, whereas formaldehyde increases. NO and CO vary but appear
unaffected by methanol content. The Corsica data were taken on a green catalyst (low vehicle mileage) and some deterioration of these emissions levels can
be expected with age.
Kirk-Othmer Encyclopedia of Chemical Technology (4th Edition)
427
ALCOHOL FUELS
Voll
Fig. 5. Emissions from a GM Corsica VFV for gasoline and gasoline—methanol mixtures where И represents total organic material, including
hydrocarbons, methanol, and formaldehyde; I I represents XO ; И formaldehyde; and Scarbon monoxide.
Figure 6 shows data for four vehicles operated on gasoline and M85, two having an electrically heated catalyst (EHC). The two vehicles equipped
with EHC both showed low values of NMOG and estimated ozone production. These data seem to indicate that methanol vehicles result in less ozone
than comparable gasoline vehicles. However, the data only include exhaust emissions and not evaporative or running losses. These later sources of
emissions should be lower using methanol because of the lower reactivity of the alcohols.
Fig. 6. Comparison of M85 and gasoline emissions (including ozone) corresponding to И estimated ozone (ref. 40) and I I NMOG for vehicles having an
electrically heated catalyst (EHC) or not (OEM) (ref. 41).
HEAVY-DUTY VEHICLES
The use of alcohols in heavy-duty engines developed more slowly than in light-duty engines primarily because the majority of heavy-duty engines are
diesels. Diesels are unthrotded, stratified charge engines which autoignite fuel by heat generated during compression. Engine speed and load are modulated
by varying the quantity of fuel injected into the cylinder rather than by throttling the fuel-air mixture as done in the Otto cycle or spark-ignition engine.
Unthrottled air aspiration reduces pumping losses which in turn increases the engine's thermal efficiency. Diesel engines also are designed for higher
compression ratios resulting in further efficiency improvements. The higher efficiency and excellent reliability and durability of these engines make them
attractive for heavy-duty appEcations in trucks, buses, and off road equipment. Unfortunately, their low cetane number limited the compatibility of alcohol
fuels with diesel engines without modifications to assist ignition.
Not until the early 1980s were prototype heavy-duty engines developed to operate on methanol and ethanol, having efficiencies equal to or better
than corresponding diesel engines. These engines were quieter and had considerably cleaner exhaust emissions. Mass emissions of NO and particulates
were substantially lower when the cleaner alcohol fuels were used, overcoming the inherent NO -particulate tradeoff of diesel engines. The biggest
challenge facing engine manufacturers in the 1980s and 1990s was to make the alcohol engines as reliable and durable as heavy-duty diesel engines which
operate in the range of 0.3 to 0.5 million kilometers without major engine maintenance and repair.
Technology Options. Because alcohols are not easily ignited in diesel-type engines changes in engine hardware or modifications to the fuel
are needed. Engine modifications can include the addition of a spark ignition system or an additional fuel injection system to provide dual fuel capabilities.
Fuel modifications involve the addition of cetane improvers. Low level blends do not work because methanol and diesel fuels are not miscible. Some
research to emulsify diesel and alcohols was carried out, but was never successful (42). Other investigations involved adding a separate fuel system
including two fuel tanks, fuel lines, injection pumps, and injectors. In this approach diesel was used to ignite the fuel mixtures, and at low speeds—low loads
diesel was the primary fuel. At high speeds—high loads alcohol was the primary fuel. This dual fuel approach was both cumbersome and expensive (43).
One successful method for using alcohols was fumigation. In this technique alcohol is atomized in the engine's intake air either by carburetion or
injection. Diesel is direcdy injected into the cylinder and the combined air-alcohol and diesel mixture is autoignited. Diesel consumption is reduced by the
energy of the alcohol in the intake air. This approach, although technically feasible, also requires separate fuel systems for the diesel and alcohol fuels.
Additionally, the amount of alcohol used is limited by the amount that can be vaporized into the intake air. This approach is more appropriate as a engine
retrofit where total energy substitution is not the primary objective (44).
Other possible technologies involve either assisted ignition or cetane improvers. Assisted ignition approaches can be divided between direct
injection, stratified charge type engines, and engines converted back to Otto cycles, by throttling and lowering engine compression.
Dedicated Vehicles. As late as 1982, researchers were still arguing the worthiness of alcohols as fuels for heavy-duty engines (45). Pioneer
work on multifuel engines led to modifications in diesel engines to bum neat or 100% alcohol. The German manufacturers were the first to provide
prototype methanol engines. Daimler-Benz modified their four stroke M 407 series diesel engine to operate on 100% methanol, by converting the diesel
version to a spark-ignited, Otto cycle engine. This required lowering the compression, adding a spark ignition system, and carburetion (throttling). To get
back some of the efficiency loss caused by going to a throttling and lower compression, the Daimler-Benz design incorporated a heat exchanger to
vaporize the methanol using engine cooling water. Vaporized methanol was introduced into the engine using a standard gaseous carburetor-mixing device.
The M 407 hGO methanol engine is a horizontal, water-cooled, inline six-cylinder configuration (46). Basic combustion is similar to the
conventional spark-ignition Otto cycle with one significant exception. Lean combustion at part load is possible for two reasons: because of methanol's
favorable flammability limits and because methanol is vaporized and introduced as a gas. Equivalence ratios (air—fuel ratio relative to stoichiometric) greater
than 2 are possible without misfire, and minimum fuel consumption is obtained at an equivalence ratio of about 1.8. In the higher load range, the engine is
controlled by the air—fuel ratio, rather than by intake throttling, so efficiency is increased relative to the conventional spark-ignition engine. Intake throttling
is used for control in the lower load range.
The first methanol bus in the world was placed in revenue service in Auckland, New Zealand in June 1981. It was a Mercedes О 305 city bus using
the M 407 hGO methanol engine. This vehicle operated in revenue service for several years with mixed results. Fuel economy on an equivalent energy basis
ranged from 6 to 17% more than diesel fuel economy. Power and torque matched the diesel engine and drivers could not detect a difference. Reliability and
durability of components was a problem. Additional demonstrations took place in Berlin, Germany and in Pretoria, South Africa, both in 1982.
The world's second methanol bus was introduced in Auckland shordy after the first. This was a M.A.N. bus with a M.A.N. FM multifuel
combustion system utilizing 100% methanol. The FM system, more similar to a diesel engine, is a direct injection, high compression engine using a spark
ignition. Fuel is injected into an open chamber combustion configuration in close proximity to the spark plugs which ignite the air—fuel mixture. Near the
spark plugs the air—fuel mixture is rich and combustion proceeds to the lean fuel air mixtures in the rest of the cylinder. The air—fuel charge is thus stratified
in the cylinder and these types of engines are often called lean bum, stratified charge. Engine hardware is similar to the diesel version including a high
pressure injection pump and a compression ratio comparable to diesel (19:1). This technology was applied to M.A.N.'s 2566 series engines, an inline
Kirk-Othmer Encyclopedia of Chemical Technology (4th Edition)
428
ALCOHOL FUELS
Voll
6-cylinder engine, and for buses is configured horizontally (47). Like the Mercedes, it is a four stroke engine.
This technology was tested using diesel fuel, gasoline, methanol, and ethanol. A M.A.N. SL 200 bus having the M.A.N. D2566 FMUH methanol
engine was also demonstrated in Berlin. Results of these tests were somewhat mixed. Fuel economy was 12% less than a comparable diesel bus, but
driveability was very good. Because the methanol fueled bus was not smoke limited at low speeds, higher torque was possible and bus drivers used this
advantage to accelerate faster from starts. Emissions results indicated a considerable advantage in using fuels such as methanol. CO and XO were reduced
compared to diesel engines and particulates were virtually eliminated.
The success of the New Zealand and German programs were instrumental in implementing a similar bus demonstration in California in 1982 (48).
The primary objective was to assess the viability of using methanol in heavy-duty engines. The project focused on evaluating engine durability, fuel
economy, driveability, and emissions characteristics. CEC also initiated a demonstration project for off-road heavy-duty vehicles using a multifuel tractor
capable of operating on either neat methanol or ethanol (30).
M.A.N. and Detroit Diesel Allison, now Detroit Diesel Corporation (DDC), agreed to participate in the California bus program. DDC provided a
methanol version of their 6V-92TA engine, which along with the DDC 71 series, is the most commonly used bus engine in the United States. The engine is
a compression-ignited, two-stroke design having a displacement of 9.1 liters and power rating of 20,700 W (277 hp). Several design changes were
incorporated for operation on methanol, including electronic unit injectors (EUI) for more precise fuel control, an increased compression ratio, a bypass
blower, and glow plugs. Compression ignition is achieved by maintaining the cylinder temperatures above the autoignition temperature of methanol. Air is
diverted around the blower, reducing the amount of air entering the cylinders. Glow plugs are used as a starting aid and also at low speeds and low loads to
maintain the cylinder temperatures necessary for autoignition. The methanol-fueled engine is turbocharged and equipped with a blower (supercharged).
The engine was the first to incorporate compression ignition of alcohols (7). Low cetane fuels can autoignite, however, provided the in-cylinder
temperature is high enough and fuel injection correcdy timed. This compression ignition works for methanol as well as ethanol and gasoline.
The California bus program was run at Golden Gate Transit District (GG1D) and continued through late 1990 (49). M.A.N. supplied two
European SU 240 coaches for this project, one diesel powered and one methanol powered. DDC provided a GM RTS coach powered by methanol.
GG'ID already had a RTS diesel powered coach. Results indicate that methanol is a viable fuel for heavy-duty engines in general and transit in particular.
Driveability including starting, full and partial throtde acceleration, and deceleration was as good or better using the methanol buses as compared to their
diesel counterparts. Figure 7 illustrates the comparison of full throtde acceleration. Detailed fuel economy tests were also performed. Figures 8 and 9
compare steady-state and transient fuel consumption tests, respectively. The transient tests were performed using the Fuel Consumption Test Procedure,
Type II (50). Methanol is comparable to diesel in steady-state fuel usage tests, but methanol consumption is higher at idle and during accelerations. The idle
fuel consumption is higher because methanol can not bum as lean as diesel fuel. Higher transient fuel consumption is a result of poor combustion factors
resulting from poor fuel atomization, air control, and over fuelling. The methanol engine should not inherendy be worse than the diesel engine during
accelerations, if good combustion can be maintained.
Fig. 7. Full-throtde acceleration for diesel and methanol-powered GM RTS coaches having simulated full-seated passenger loads of 43 passengers.
Kirk-Othmer Encyclopedia of Chemical Technology (4th Edition)
429
ALCOHOL FUELS
Voll
Steady state speed, km/h
Fig. 8. Fuel consumption for GM RTS coaches using И diesel and □ methanol as fuel. Differences in fuel consumption are indicated by the symbol A. To
convert km/L to mpg, multiply by 2.35.
Fig. 9. GM RTS coaches transient fuel consumption for □ diesel and □ methanol. SAE type road test, UMTA ADB duty cycle. Differences in fuel
consumption are indicated by the symbol A. CBD (Central Business District), 4.3 stops per km, maximum speed 32 km/h, 18 m deceleration, 7 s dwell
time, 19.3 km; ART (arterial), 1.24 stops per km, maximum speed 64 km/h, 61 m deceleration, 7 s dwell time, 13 km; COM (commuter), one stop every 6.4
km, maximum speed of 88.5 km/h, 150 m deceleration, 20 s dwell time, 13 km. To convert km/L to mpg, multiply by 2.35.
The biggest problem of the GG1D program was engine and vehicle reliability and durability (see Fig. 10). Components needing the most frequent
replacement were electronic unit fuel injectors and glow plugs, followed by the electronic control system (controlled power to the glow plugs), throtde
position sensor, fuel pump, and fuel cooler fans. Other problems included increased engine deposits and ring and liner wear (51). The M.A.N. engine had
Kirk-Othmer Encyclopedia of Chemical Technology (4th Edition)
430
ALCOHOL FUELS
Voll
similar but fewer problems; the components having the lowest lifetime were spark-plugs.
Component
0
Glow plugs
Fuel pump
Fuel cooler fans
Electronic
control
system
Electronic unit
fuel injectors
Throttle position
sensor
GM RTS coach distance operated, km
20,000 40,000 60,000 80,000 100,000 120 000
□ Component replaced
° Failed component replaced
Fig. 10. Components of GM RTS methanol-powered coach replaced, Q, and replaced because of component failure, □, as a function of distance
operated.
California continued the development of methanol powered vehicles primarily because of the substantial emission benefits (52). Then in 1986, the
U.S. EPA promulgated technology-forcing standards for on-road, heavy-duty diesel engines which had been basically uncontrolled (53). These standards
were also adopted in California by the ARB for buses in 1991 and all heavy-duty engines in 1993. Diesel engine manufacturers have made significant
improvements in technology and new diesel engines are projected to meet standards without a particulate trap. These improvements have made the diesel
engine more competitive with alcohol fueled engines.
In 1987 Seatde Metro purchased 10 new American built M.A.N. coaches powered by methanol. Six GM buses powered by DDC methanol engines
entered revenue service at Triboro Coach in Jackson Heights, New York, 2 GM buses in Medicine Hat Transit in Medicine Hat, Manitoba, and 2 Flyer
coaches in Winnipeg Transit, Winnipeg, Manitoba, Canada. An additional 45 DDC powered methanol buses were introduced in California as indicated by
Table 4. Figure 11 shows the distance accumulation of alternate-fueled buses in the four California transit properties.
Year
Fig. 11. Distance methanol-fueled transit coaches traveled per year of operation in the □ Golden Gate Transit District (GG1D); • Riverside Transit
Agency (RTA), Southern California Rapid Transit District (SCRTD); and Q Orange County Transit District (OCTD).
Table 4. Distribution of California’s Heavy-Duty Alternative Fuel Demonstration Vehicles
Transit district No. of vehicles Fuel OEM / engine
South Coast Area Transit 1 methanol DDC 6V-92TA
Riverside Transit District 3 methanol DDC 6V-92TA
Southern California RTD 30 methanol DDC 6V-92TA
Southern California RTD 12 methanol/ Avocet DDC 6V-92TA
Southern California RTD 1 methanol MAN D2566 MUH
Orange County Transit District 2 methanol/ Avocet Cummins L10
Orange County Transit District 2 CNGb Cummins L10
Orange County Transit District 2 LPGb Cummins L10
School bus demo
various fleets 50 methanol DDC 6V-92TA
various fleets 10 CNG Bluebird/Teogen GM 454
Trucking applications
City of Los Angeles 1 methanol GMC DDC 6V-92TA
City of Los Angeles 1 methanol/ Avocet Peterbuilt Cummins L10
City of Glendale 1 methanol Peterbuilt Caterpillar 3306
Kirk-Othmer Encyclopedia of Chemical Technology (4th Edition)
431
ALCOHOL FUELS
Voll
Golden State Foods 1 methanol Freightliner DDC 6V-92TA
Federal Express 1 methanol Freightliner DDC 6-71TA
Arrowhead 1 methanol Ford/Ford 6.61
SCE 1 methanol Volvo/DDC 6V-92TA
South Lake Tahoe 1 methanol Intemational/Navistar DTG-460
Waste Management 2 methanol Volvo/DDC 6-71TA
Avocet is a cetane improver.
CNG, compressed natural gas, and LPG, liquefied petroleum gas, are also used as alternative fuels.
Many of the development problems identified in the first bus programs were carried into the more recent demonstration projects. Spark-plug life
continued to be an issue at Seattle Metro and the project was terminated in 1990 because of costs of replacement parts. Costs were compounded when
M.A.N. decided to discontinue manufacturing buses in the United States. DDC engines also continued to have problems with fuel injectors and glow
plugs. Unit injectors were failing for a variety of reasons but the biggest problem was plugging injector tips. Injectors on some buses had to be changed at
mileages as low as 1600 to 3200 km compared to diesel injectors which last up to 100 times as long. DDC and Lubrizol have since developed a fuel additive
that when added to methanol at 0.06% by volume substantially reduces injector failures (see Fig. 12).
1989 - 1990
Fig. 12. Methanol and coach fleet cumulative distance driven before fuel injector failure, where И represents operation without, and □ represents operation
with fuel additive.
Many improvements have been made in both combustion and emissions control from the first experimental engine operating at GG1D (54). The
new DDC preproduction engines have increased compression, 23:1 compared to 19:1, allowing the glow plugs to function only during starting. The rest of
the time the cylinder temperatures are high enough to autoignite methanol. This revision increased the life of glow plugs from an average of 11,900 to
22,100 km between failures. Fuel economy has also improved as have exhaust emissions. Tests performed on an engine dynamometer following the federal
test procedure are many times better than California's 1991 bus standard as shown in Table 5.
Table 5. Exhaust Emissions and California 1991 Bus Standards, g/kW-h#
Exhaust component 1991 California standards DC 6V-92TA (catalyst)
g/(bhph)a g/(kWli) g/(bhph)a g/(kWdi)
OMHCE 1.3 1.8 0.10 0.14
CO 15.5 21.1 0.22 0.3
\O 5.0 6.8 2.3 3.1
particulates 0.10 0.14 0.05 0.07
aldehydes 0.10/0.05b 0.14/0.07b 0.04 0.05
abhp = brake horsepower; lbhp = 0.735 kW.
b The 0.10 and 0.14 values apply from 1993 to 1995; the 0.05 and 0.07 values apply beginning in 1996.
Because of the success of these various alcohol fuel programs, heavy-duty demonstrations have been extended to other applications as shown in
Table 4. The majority of applications are still either in transit or school buses, but California has also begun a program to utilize methanol engines in
heavy-duty trucking applications (55). Domestic engine manufacturers participating in this program include Caterpillar, Cummins, DDC, Ford, and
Navistar. The Caterpillar and Navistar engines are four stroke engines having glow plugs to assist in igniting methanol. These engines are very different
from the two stroke DDC engine and from each other. The Navistar (56) uses a shield glow plug which neither Caterpillar (57) nor DDC do. Navistar
claims these glow plugs provide both good combustion and long life. The combustion chambers and fuel control schemes differ from manufacturer to
manufacturer. Ford converted a diesel engine to an Otto cycle and added electronically controlled port fuel injection, throttling, and a distributorless
spark-ignition system.
Methanol has been shown to be a viable fuel for a variety of trucking applications in a local yet fairly large geographical area (58). And although the
results focus primarily on dedicated methanol engines and vehicles in the United States, the conclusions are nearly transferrable to ethanol fuels. DDC's
6V-92TA methanol engine operates on ethanol using a different engine calibration optimized for good performance and emissions. Additional hardware
modifications are not anticipated.
Cetane Improvers. Compared to dedicated alcohol engines, fewer hardware changes need to be made to heavy-duty engines using cetane
Kirk-Othmer Encyclopedia of Chemical Technology (4th Edition)
432
ALCOHOL FUELS
Voll
improvers. The early research on using cetane improvers and alcohol fuels for heavy-duty diesel engines was performed by the Germans in the late
1970s-eady 1980s (59). The possibilities of using cetane improvers with ethanol for heavy-duty vehicles operating in Brazil were investigated (60). The work
indicated that nitrates are the most effective cetane improvers for alcohols (61) and the Brazilian program focused on nitrates that could be manufactured
from sugar cane, the feedstock for ethanol production. Additives considered included butyl nitrate, isoamyl nitrates, 2-ethoxyethyl nitrate, and ethylene
glycol nitrates. The selection of the improver depends on the method of the additive modifying the ignition delay over the entire speed and load range.
Ideally ethanol should match the same ignition delay behavior as diesel.
Four buses converted to ethanol started operation in 1979 and the engine used was an OM 352, 6 cylinder, direct injection engine rated at 96,200
watt (129 hp). The ignition improver was я-hexyl nitrate [20633-11-8] which was later changed to triethylene glycol dinitrate [111-22-8] (TEGDN).
TEGDN was mixed with ethanol at 5% or less by volume (60). The test fleet was further expanded to a variety of trucks manufactured and marketed by
Mercedes-Benz in Brazil. 1,700 heavy-duty trucks were converted to ethanol for use in the more gruelling sugar cane industry. Engines converted included
the OM 352 О (5.7 L, 96,200 watt) and OM 355/5 О (9.7 L, 141,000 watt). Modifications to the engines to use ignition improved ethanol included
increasing the fuel delivery capacity of the fuel injection pump, changing the fuel injection nozzles, and making material compatible with the
TEGDN/ethanol fuel. The engines provided equal or better power and torque than the unmodified models. Some durability problems, which arose
because of lack of lubrication or fuel material incompatibilities, were solved by adding lubricants to the injection pump plungers or by changing materials.
Emissions were also generally lower than those from the equivalent diesel engine. Even XO was lower because of the lower flame temperatures compared
to diesel (62).
The biggest drawback was the cost of ethanol compared to diesel fuel and the cost of the TEGDN and ethanol mixture compared to diesel. Unlike
in the United States, diesel fuel in Brazil is considerably less expensive on an energy basis than gasoline, because gasoline is taxed at a higher rate. This is
generally the case in Europe as well. So, although technically feasible, the costs were too high for Brazil to convert many heavy-duty vehicles to ethanol.
Additional research for both ethanol and methanol showed that the amount of ignition improver could be reduced by systems increasing engine
compression (63). Going from 17:1 to 21:1 reduced the amount of TEGDN required for methanol from 5% by volume to 3%. Ignition-improved
methanol exhibited very low exhaust emissions compared to diesels: particulate emissions were eliminated except for small amounts associated with engine
oil, NO was even lower with increased compression, and CO and hydrocarbons were also below diesel levels.
Auckland Regional Authority converted two M.A.N. buses to use a cetane improver and methanol and South Africa investigated the use of
methanol with a proprietary cetane improver. Four Renault buses were converted in Tours, France to operate on ethanol and a cetane improver, Avocet,
manufactured by Imperial Chemical Industries (ICI). The results of these demonstrations were also technically successful; slightly better fuel economy was
obtained on an energy basis and durability issues were much less than the earlier tests using dedicated engines.
Cetane improvers were first investigated in the U.S. as part of a demonstration project to retrofit DDC 6V-71 two stroke engines to methanol for
three transit buses operating in Jacksonville, Florida. This project started out using hardware conversion where the engine was modified to control air flow
and a glow plug was added to the system. Although this was basically the same approach as used in the dedicated 6V-92TA methanol engine, the 6V-71
employed mechanical injectors as opposed to electronic injectors. These mechanical injectors were failing even with 1% castor oil [8001-79-4] added to the
methanol. Jacksonville thus decided to use a nitrate based cetane improver containing a lubrication additive and a corrosion inhibitor and the project
proved the viability of cetane-improved methanol.
The first U.S. engine manufacturer to evaluate the use of cetane improvers was Cummins Engine Company. Their methanol designed L10 engines
were converted based on the knowledge gained in Brazil with ethanol and 4.5% TEGDN in their 14-L engine (64). They increased the fuel capacity of their
injection pumps, for instance, and modified the combustion process to match the diesel start of combustion by increasing the compression ratio from 15.8
to 16.1:1 and adding turbocharging (both increased in-cylinder temperatures). For the methanol L10 development Avocet at 5% by volume mixed with
100% methanol was selected (65). Engine modifications were only made to the fuel system. These included fuel pump changes for increased capacity, a
different camshaft to change injection timing, and larger injectors. Changes were also made in various materials to make them compatible with methanol.
The resultant L10 matched diesel power and torque, but emissions results were mixed. Data showed low emissions of particulates, but higher HC, CO, and
NO at low speed, low load operation. These data suggest that additional optimization may be necessary for the L10 methanol engine.
The L10 methanol engines are currendy being used in several demonstration fleets in California. The first use was in the city of Los Angeles
Peterbilt dump truck (58), a part of the CEC truck demonstration project. Methanol LlOs are also being used in the OCTD comparative alternative fuel
demonstration project. In this project methanol, CNG, and LPG L10 engines are being compared to each other in a transit bus application. In the
Canadian methanol in large engines (MILE) project, two L10 methanol engines were operated for several years in refuse haulers in Vancouver, British
Columbia.
The largest retrofit demonstration project in the United States is under way at SCR I'D where 12 vehicles using DDC 6V-92 with mechanical
injectors are being modified to use methanol with Avocet (66). This project has evaluated the changes necessary to optimize the conversions for both fuel
economy and emissions. Using the two stroke engine changes had to be made to reduce the air into the engine, increase compression from 17 to 23:1, and
use better ring packages. These changes gave both good fuel economy and reduced emissions of NO by 50%, considerably lowered particulates, and
maintained levels of CO and hydrocarbon. New York has also modified a 8V-71 for use on Avocet-improved methanol and had similar results (67).
The success of these tests indicate that cetane-improved alcohol is technically feasible. Engines can be designed to provide equal diesel power and
torque characteristics having lower NO and particulate emissions than diesel. However, if it is not necessary to achieve lowest possible emissions, only
changes in fuel rate are required, rather than engine changes, and the commercial application of this approach depends mosdy on the cost of the cetane
improvers. The price of Avocet is about $4/L in small quantities and adding 3.0% in methanol nearly doubles the cost of methanol from $0.13 to $0.22/L.
If Avocet were produced in larger quantities its price would drop considerably.
The biggest potential use of the cetane-improver approach may be in vehicle retrofits where for environmental reasons bus and truck fleets may be
required to convert to cleaner burning fuels.
Air Quality Benefits of Alcohol Fuels
In the 1970s evaluations of alcohol fuel programs always considered environmental impacts and objectives even though the main thrust of the programs
was toward energy security and diversification benefits. Assessments of performance identified these fuels as consistent with environmental goals and by
the mid 1980s, the environmental benefits of the alcohol fuels had become the chief driving force for their further consideration. Detailed assessments
were made of photochemical smog and air toxics reductions that might be obtained from the wide use of alcohol fuels in light-duty vehicles. Methanol
received the most evaluation, because it appeared to be far more cost competitive than ethanol. The potential benefits of alcohols used in heavy-duty
diesel-type engines were also studied.
The most comprehensive air quaEty study, supported by the California ARB and the South Coast Air QuaEty Management District (68), showed
that if gasoline and methanol cars emitted the same amounts of carbon, an assumption that seemed reasonable based on emissions test data taken
throughout the 1980s, and if methanol cars had formaldehyde emissions controlled to 9.3 mg/km (equal to the current California formaldehyde emissions
standard for methanol automobiles), then substituting M85 for gasoline would produce a 9% reduction in the peak summer-day afternoon ozone level and
a 19% reduction in exposure to ozone levels above the Federal standard of 0.12 ppm. These reductions constituted a substantial fraction of the reductions
that would be obtained by eliminating all the emissions from vehicles. Additional assumptions were that exhaust carbon emissions were at the level of 0.15
g/km, equal to the planned certification standard for new vehicles in California beginning in 1993 (but not really expected to be characteristic of in-use
vehicles) and that the distribution of hydrocarbon species in the exhaust resembled that of cars tested in the 1980s.
The results of the study, conducted at Carnegie Mellon University, are now generally accepted as the best available guides for the smog-reducing
benefits of a methanol substitution strategy, at least for the conditions prevailing in the Los Angeles basin. Overall, replacement of a conventional gasoline
vehicle by an equivalent M85 vehicle should provide about a 30% reduction in smog-forming potential. A 100% result would be earned by eliminating the
Kirk-Othmer Encyclopedia of Chemical Technology (4th Edition)
433
ALCOHOL FUELS
Voll
vehicle entirely. Vehicles using M100 would provide substantially greater benefits than M85 vehicles.
Benefits depend upon location. There is reason to believe that the ratio of hydrocarbon emissions to XO has an influence on the degree of benefit
from methanol substitution in reducing the formation of photochemical smog (69). Additionally, continued testing on methanol vehicles, particularly on
vehicles which have accumulated a considerable number of miles, may show that some of the assumptions made in the Carnegie Mellon assessment are not
valid. Air quality benefits of methanol also depend on good catalyst performance, especially in controlling formaldehyde, over the entire useful life of the
vehicle.
Methanol substitution strategies do not appear to cause an increase in exposure to ambient formaldehyde even though the direct emissions of
formaldehyde have been somewhat higher than those of comparable gasoline cars. Most ambient formaldehyde is in fact secondary formaldehyde formed
by photochemical reactions of hydrocarbons emitted from gasoline vehicles and other sources. The effects of slightly higher direct formaldehyde emissions
from methanol cars are offset by reduced hydrocarbon emissions (68).
Methanol use would also reduce public exposure to toxic hydrocarbons associated with gasoline and diesel fuel, including benzene, 1,3-butadiene,
diesel particulates, and polynuclear aromatic hydrocarbons. Although public formaldehyde exposures might increase from methanol use in garages and
tunnels, methanol use is expected to reduce overall public exposure to toxic air contaminants.
Alcohol Fuels Usage as an Air Quality Strategy
The cost-effectiveness of methanol substitution as an air quality strategy has been studied in some detail. Air quality planners usually rate cost-effectiveness
in terms of dollars per ton of reactive hydrocarbons controlled (or removed from the inventory of emissions). Typical costs for controlling reactive
hydrocarbon emissions in the United States are in the range of several hundreds of dollars per ton. In the Los Angeles area, the average costs of future
hydrocarbon control measures average about $500 per metric ton, although some individual measures have cost-effectiveness figures above $10,000 per
ton. Methanol substitution appears to be a viable and competitive control strategy. Cost-effectiveness is finked to the price of oil. Methanol appears to have
a cost-effectiveness ranging from a few thousand dollars to several tens of thousands of dollars per ton (18,70—73). In heavy-duty engines, the alcohols
may offer cost-effective reductions of particulates and XO emissions. A recent study indicates that the use of methanol was competitive with the use of
cleaner diesel fuels and diesel particulate traps under some circumstances (74).
The potential air quality impacts of ethanol use have not yet been studied in detail.
Global Warming Impacts. Several studies have been made of the global warming impacts of alcohol fuels. The most useful assessments
cover the entire life cycle from raw material feedstock production through processing, distribution, and fuel usage. They also consider global gases in
addition to carbon dioxide (75,76). Results reflect the influence of assumptions but methanol is expected to provide slight reductions in global warming
impacts compared to gasoline. Ethanol evaluations are less certain.
Public Safety Issues
Several investigators have assessed the comparative safety of methanol and conventional hydrocarbon fuels (14,77—79). The ingestion toxicity of methanol
has been of some concern because of the number of gasoline ingestions associated with siphoning and in-home accidental ingestions. The use of gasoline
in small engines such as those used for lawnmowers, leafblowers, and other small utility applications results in most of the siphoning ingestions and
in-home accidental ingestions of gasoline. This potential problem is addressed by discouraging methanol use in small engines, by labelling and public
education, and by positive siphoning prevention screens in the fill pipes of vehicles. These screens have been required in recent purchases of methanol
vehicles by California agencies.
Skin contact with methanol may present a greater health threat than skin contact with gasoline and diesel fuel and is being evaluated.
The fire hazard of methanol appears to be substantially smaller than the fire hazard of gasoline, although considerably greater than the fire hazard of
diesel fuel. The lack of luminosity of a methanol flame is still a concern to some, and M85 (or some other methanol fuel with an additive for flame
luminosity) may become the standard fuel for this reason.
In reviewing the full range of health and safety issues associated with all alternative fuels, the California Advisory Board determined that there were
no roadblocks that would prevent the near term deployment of either methanol or ethanol, assuming that adequate safety practices were followed
appropriate to the specific nature of each fuel (14).
The Future of Alcohol Fuels
In the late 1980s attempts were made in California to shift fuel use to methanol in order to capture the air quality benefits of the reduced photochemical
reactivity of the emissions from methanol-fueled vehicles. Proposed legislation would mandate that some fraction of the sales of each vehicle manufacturer
be capable of using methanol, and that fuel suppliers ensure that methanol was used in these vehicles. The legislation became a study of the California
Advisory Board on Air Quality and Fuels. The report of the study recommended a broader approach to fuel quality and fuel choice that would define
environmental objectives and allow the marketplace to determine which vehicle and fuel technologies were adequate to meet environmental objectives at
lowest cost and maximum value to consumers. The report directed the California ARB to develop a regulatory approach that would preserve
environmental objectives by using emissions standards that reflected the best potential of the cleanest fuels.
The ARB adopted a regulatory package for light-duty vehicles in 1990 that modifies the historically uniform approach to vehicle emissions, in which
each and every vehicle in a regulated class must meet the same emissions standard. The new approach adopts emissions standards that apply on the
average to the entire sales mix of vehicles sold by each manufacturer in each of several broad weight classes of vehicles. Thus vehicles that use fuels such as
methanol and ethanol having air quality benefits in the form of lower levels of photochemical reactivity have the emissions adjusted to reflect the lower
smog forming tendency of these fuels. This regulatory approach provides a powerful incentive for vehicle manufacturers to certify at least some of the sales
mix of vehicles on fuels such as methanol and ethanol.
The future market response to the new form of emissions regulation is unknown. For the purpose of meeting new vehicle emissions standards,
however, it is still not clear whether some combination of new emissions control approaches and reformulated gasolines can provide benefits equal to
those of methanol and ethanol. It is possible that the new emissions standards will simply result in improved gasoline technologies, and that, despite the
prospective air quality advantages of the alcohol fuels, the market result of the new standards will simply be cleaner gasolines. However, in 1990 the U.S.
Alternative Fuels Council agreed on a goal of a 25% share of nonpetroleum transportation fuels by 2005. Although this goal may not become part of a
national energy plan, it represents the first official statement of a specific goal to substitute for the use of petroleum in transportation. Alcohol fuels could
capture a large part of this 25% share of nonpetroleum fuels, although vehicles powered by natural gas and electric energy will no doubt win some
acceptance. For the ordinary passenger car, alcohol fuels may offer the most gasolinelike alternative in terms of range, comparable costs, and compatibility
with the current gasoline/diesel storage and distribution infrastructure.
BIBLIOGRAPHY
"Alcohol Fuels," in ECT 3rd ed., Suppl. pp. 1—42, by Donald L. Kloss, Institute of Gas Technology.
1. J. W. Shiller, "The Automobile and the Atmosphere" in Energy: Production, Consumption and Consequences, National Academy Press, Washington,
D.C., 1990, pp. 111-142.
2. Engineering Data Book, Gas Processors Suppliers Association, 1972.
3. Reference Data for Hydrocarbons and Petro-Sulfur Compounds, Phillips Petroleum Company, 1962.
Kirk-Othmer Encyclopedia of Chemical Technology (4th Edition)
434
ALCOHOL FUELS
Voll
4. J. B. Heywood, Internal Combustion Engine Fundamentals, McGraw-Hill, New York, 1988.
5. Fire Hazard Properties ofFlammable Eiquids, Gases, and Volatile Solids, Pub. # NFPA 325M, National Fire Protection Association, 1984.
6. P. F. Schmidt, Fuel OilManual, Industrial Press, 1969.
7. R. R. Toepel, J. E. Bennethum, R. E. Heruth, "Development of a Detroit Diesel Allison 6V-92TA Methanol-Fueled Coach Engine," V4E Paper
831744, SAE Fuels and Eubricants Meeting (San Francisco, Calif., Oct. 31—Nov. 3, 1983), Society of Automotive Engineers, Warrendale, Pa., 1983.
8. T. Powell, "Racing Experiences with Methanol and Ethanol-based Motor Fuel Blends," SME Paper 750124, Society of Automotive Engineers,
Warrendale, Pa., Feb., 1975.
9. Sypher-Mueller International, Inc., Future Transportation Fuels: AlcoholFuels, Energy, Mines and Resources—Canada, Project Mile Report, A Report
on the Use of Methanol in Large Engines in Canada, May 1990.
10. S. C. Trindade and A. V. de Carvalho, "Transportation Fuels Policy Issues and Options: The Case of Ethanol Fuels in Brazil" in D. Sperling, ed.,
Alternative Transportation Fuels, Qu о mm Books, New York, 1989, pp. 163—185.
11. Firstlnterim Report, United States Alternative Fuels Council, Washington, D.C., Sept. 30,1990.
12. Office of PoHcy, Planning, and Analysis, Assessment of Costs and Benefits of Flexible and Alternative Fuel Use in the U.S. Transportation Sector, Technical
Report #3 (Methanol Production and Transportation Costs) Pub. # DOE/P/E—0093, U.S. Department of Energy, Washington, D.C., Nov.
1989.
13. Bechtel Corporation, CalifomiaFuel Methanol Cost Study: Chevron Corporation, U.S., Vol. 1 (Executive Summary, Jan. 1989); Vol. 2, (Final Report, Dec.
1988), San Francisco, Calif., 1988-1989.
14. California Advisory Board on Air QuaEty and Fuels, Vol. 1, Executive Summary, Vol. 2, Eneyy Security Report, Vol. 3, Environmental Health and Safety
Report, Vol. 4, Economics Report, Vol. 5, Mandates and Incentives Report, San Francisco, Calif., June 13, 1990.
15. California Energy Commission, Methanol as a MotorFuel: Review of the Issues Related to Air Quality, Demand, Supply, Cost, Consumer Acceptance and Health
and Safety, Pub. # P500-89-002, Sacramento, Calif., April 1989.
16. California Energy Commission, Cost and Availability ofEow Emission Motor Vehicles and Fuels, Sacramento, Calif., Aug. 1989.
17. National Research Council, Fuels to Drive OurFuture, National Academy Press, Washington, D.C., 1990.
18. Office of Technology Assessment, Replacing Gasoline: Alternative Fuels for Eight-Duty Vehicles, Pub. # OTA—E—364, U.S. Congress, Washington,
D.C., Sept. 1990.
19. J. L. Keller, Hydrocarbon Process, May 1979.
20. Office of Mobile Sources, Analysis of the Economic and Environmental Effects of Methanol as an Automotive Fuel, U.S. Environmental Protection Agency,
Ann Arbor, Mich., Sept. 1989.
21. Alcohols and Ethers Blended with Gasoline, Pub. # 4261, American Petroleum Institute, Washington, D.C., Chapt. 4, pp. 23—27.
22. 7th Int. Symp. on Alcohol Fuels, Institut Francais du Petrole, Editions Technip, Paris, France, 1986.
23. 8th Int. Symp. on Alcohol Fuels, New Energy and Industrial Technology Development Organization, Sanbi Insatsu Co., Ltd. Tokyo Japan, Nov.
13-16,1988.
24. H. C. Wolff, "German Field Test Results on Methanol Fuels M100 and M15," American Petroleum Institute 48th Midyear Refining Meeting (Session on
Oxygenates and Oxygenate-Gasoline Blends as Motor Fuels) May 11, 1983.
25. H. Menrad, "Possibflities to Introduce Methanol as a Fuel, An Example from Germany," 6th Int. Symp. on Alcohol Fuels Technology, (Ottawa, Canada,
May 21-25, 1984), Vol. 2.
26. L. Schieler, M. Fischer, D. Dennler, and R. Nettell, "Bank of America's Methanol Fuel Program: An Insurance Policy that is Now a Viable Fuel,"
6th Int. Symp. on Alcohol Fuels Technology, (Ottawa, Canada, May 21—25, 1984), Vol. 2.
27. R. N. McGill and R. L. Graves, "Results from the Federal Methanol Fleet, A Progress Report," 8th Int. Symp. on Alcohol Fuels (Tokyo, Japan, Nov.
13-16,1988).
28. Alcohol Energy Systems: Alcohol Fleet One Test Report, Pub. # 500—82—058, California Energy Commission, Sacramento, Calif., Aug. 1983.
29. F. J. Wiens and co-workers, "California's Alcohol Fleet Test Program: Final Results" 6th Int. Symp. on Alcohols Fuels Technology (Ottawa, Canada, May
21-25, 1984), Vol. 3.
30. Acurex Corporation, California's Methanol Program: Evaluation Report, Vol. 2 (Technical Analyses), Pub. # P500—86—012A, California Energy
Commission, Sacramento, Calif., June 1987.
31. S. C. Trindade and A. V. de Carvalho, "Utilization of Alcohol Fuels in Brazil: Eady Experience, Current Situation, and Future Prospects," Int.
Symp. on Introduction of Methanol-Powered Vehicles (Tokyo, Japan, Feb. 19,1987).
32. Acurex Corporation, California's Methanol Program: Evaluation Report, Vol. 1 (Executive Summary), Pub. # P500-86-012, California Energy
Commission, Sacramento, Calif., Nov. 1986.
33. E. R. Fanick, L. R. Smith, J. A. Russell and W. E. Likos, "Laboratory Evaluation of Safety-Related Additives for Neat Methanol Fuel," SAE Paper
902156, (SP 840), Society of Automotive Engineers, Warrendale, Pa., Oct. 1990.
34. U. Hilger, G. Jain, E. Scheid, and F. Pischinger, "Development of a Direct Injected Neat Methanol Engine for Passenger Car Applications," SAE
Paper 901521, SAE Future Transportation Technology Conf, and Expo. (San Diego, Calif., Aug. 13—16,1990).
35. P. A. Machiele, "A Perspective on the FlammabiEty, Toxicity, and Environmental Safety Distinctions Between Methanol and Conventional Fuels,"
AIChE 1989 SummerNationalMeeting (Philadelphia, Pa., Aug. 22, 1989), American Institute of Chemical Engineers.
36. J. V. D. Weide and R. J. Wineland, "Vehicle Operation with Variable Methanol/Gasoline Mixtures," 6th Int. Symp. on Alcohol Fuels Technology
(Ottawa, Canada, May 21—25, 1984), Vol. 3.
37. T. B. Blaisdell, M. D. Jackson, and K. D. Smith, "Potential of Light-Duty Methanol Vehicles," SAE Paper 891667, SAE Future Transportation
Technology Conf. andExpo. (Vancouver, Canada, Aug. 7—10,1989), Society of Automotive Engineers, Warrendale, Pa.
38. Mobile Source Division, Alcohol Fueled Vehicle Fleet Test Program: 9th Interim Report, Pub. ARB /MS-89-09, California Air Resources Board, El Monte,
Calif., Nov. 1989.
39. W. Carter, Ocyne Reactivity Analysis of Emissionsfrom Motor Vehicles, (Draft Report for the Western Liquid Gas Association), Statewide Air Pollution
Research Center, University of California at Riverside, July 11, 1989.
40. P. A. Gabele,/, of Air Waste Management 40(3), 296—304 (Mar. 1990).
41. S. Albu, "California's Regulatory Perspective on Alternate Fuels," 13th North American Motor Vehicle Emissions Control Conf (Tampa, Fla., Dec. 11—14,
1990), Mobile Source Division, California Air Resources Board, El Monte, Calif.
42. A. Lawson, A. J. Last, A. S. Desphande, and E. W. Simmons, "Heavy-Duty Truck Diesel Engine Operation on Unstabilized Methanol/Diesel
Fuel Emulsion," SAE Paper 810346, (SP-480) Int. Congress andExpo (Detroit, Mich., Feb. 23—27, 1981) Society of Automotive Engineers,
Warrendale, Pa.
43. В. M. Bertilsson, "Regulated and Unregulated Emissions from an Alcohol-Fueled Diesel Engine with Two Separate Fuel Injection Systems," 5th
Int. Symp. on AlcoholFuelTechnology (Auckland, New Zealand, May 13—18, 1982) Vol. 3.
44. R. A. Baranescu, "Fumigation of Alcohols in a Multicylinder Diesel Engine: Evaluation of Potential," SAE Paper 860308, SAE Int. Congress and
Expo. (Detroit, Mich., Feb. 24—28, 1986) Society of Automotive Engineers, Warrendale, Pa.
45. R. G. Jackson, "Workshop on Diesel Fuel Substitution," 5th Int. Symp. on AlcoholFuelTechnology (Auckland, New Zealand, May 13—18, 1982), Vol. 4.
46. H. K. Bergmann and K. D. Holloh, "Field Experience with Mercedes-Benz Methanol City Buses," 6th Int. Symp. on Alcohol Fuels Technology (Ottawa,
Canada, May 21-25, 1984), Vol. 1.
47. A. Nietz and F. Chmela, "Results of Further Development in the M.A.N. Methanol Engine," 6th Int. Symp. on Alcohol Fuels Technology (Ottawa,
Kirk-Othmer Encyclopedia of Chemical Technology (4th Edition)
435
ALCOHOL FUELS
Voll
Canada, May 21-25, 1984), Vol. 1.
48. M. D. Jackson, C. A. Powars, K. D. Smith, and D. W. Fong, "Methanol-Fueled Transit Bus Demonstration," Paper 83-DGP-2, American Society
of Mechanical Engineers.
49. M. D. Jackson, S. Unnasch, C. Sullivan, and R. A. Renner, "Transit Bus Operation with Methanol Fuel," 5M_E Paper 850216, SAE Int. Congress and
Expo. (Detroit, Mich., Feb. 25—Mar. 1, 1986) Society of Automotive Engineers, Warrendale, Pa.
50. Joint ТМС/SAE Fuel Consumption Fest Procedure, Type 2, SAE J1321, SAE Recommended Practice Approved October 1981, Society of Automotive
Engineers, Warrendale, Pa., 1981.
51. M. D. Jackson, S. Unnasch, and D. D. Lowell, "Heavy-Duty Methanol Engines: Wear and Emissions," 8th Int. Symp. on Alcohol Fuels (Tokyo, Japan,
Nov. 13-16,1988).
52. K. D. Smith, "California's Methanol Program," 7th Int. Symp. on Alcohol Fuels, (Paris, France, Oct. 20—23, 1986).
53. EPA Emissions Standards, Code of Federal Regulations, Vol. 40, Chapt. 1, Sect. 86.088-11, 86.091-11, and 86.094-11, U.S. Environmental Protection
Agency, U.S.G.P.O., Washington, D.C., 1987.
54. J. Jaye, S. Miller, and J. Bennethum, "Development of the Detroit Diesel Corporation Methanol Engine," 8th Int. Symp. AlcoholFuels (Tokyo, Japan,
Nov. 13-16,1988).
55. R. A. Brown, J. A. Nicholson, M. D. Jackson, and C. Sullivan, "Methanol-Fueled Heavy-Duty Truck Engine Applications: The CEC Program."
SAE Paper 890972, SAE 40th Annual Earthmovingindustry Conf. (Peoria, Hl., April 11—13,1989) Society of Automotive Engineers, Warrendale, Pa.
56. R. Baranescu and co-workers, "Prototype Development of a Methanol Engine for Heavy-Duty Application-Performance and Emissions," SAE
Paper 891653, SAE Future Transportation Technology Conf. (Aug. 7—20,1989), Society of Automotive Engineers, Warrendale, Pa.
57. R. Richards, "Methanol-Fueled Caterpillar 3406 Engine Experience in On-Highway Trucks," SAE Paper 902160, (SP-840), Society of Automotive
Engineers, Warrendale, Pa., Oct., 1990.
58. M. D. Jackson, C. Sullivan, and P. Wuebben, "California's Demonstration of Heavy-Duty Methanol Engines in Trucking Applications," 9th Int.
Symp. on AlcoholFuels (Milan, Italy, April 9—12,1991).
59. W. Bandel, "Problems in the Application of Ethanol as Fuel for Utility Vehicles," 2nd Int. Symp. on Alcohol FuelFechnology (Wolfsburg, Germany,
Nov. 21-23,1977).
60. W. Bandel and L. M. Ventura, "Problems in Adapting Ethanol Fuels to the Requirements of Diesel Engines," 4th Int. Symp. on AlcoholFuels
(Guaruja, Brazil, Oct. 1980).
61. A. J. Schaefer and H. O. Hardenburg, "Ignition Improvers for Ethanol Fuels," SAE Paper 810249, SP-840, SAE Int. Congress, and Expo. (Detroit,
Mich., Feb. 23-27,1981).
62. E. P. Fontanello, L. M. Ventura, and W. Bandel, "The Use of Ethanol with Ignition Improver as a CI-Engine Fuel in BraziEan Trucks," 7th Int.
Symp. on AlcoholFuels (Paris, France, Oct. 20—23,1986).
63. H. O. Hardenburg, "Comparative Study of Heavy-Duty Engine Operation with Diesel Fuel and Ignition-Improved Methanol," SAE Paper
872093, SAE Int. Fuels and Eubricants Meeting and Expo. (Toronto, Canada, Nov. 2—5,1987), Society of Automotive Engineers, Warrendale, Pa.
64. E. J. Lyford-Pike, F. C. Neves, A. C. Zulino, and V. K. Duggal, "Development of a Commercial Cummins NT Series to Bum Ethanol Alcohol,"
7th Int. Symp. on AlcoholFuels (Paris, France, Oct. 20—23,1986).
65. A. B. Welch, W. A. Goetz, D. Elliott, J. R. MacDonald, and V. K. Duggal, "Development of the Cummins Methanol L10 Engine with an Ignition
Improver," 8th Int. Symp. on AlcoholFuels (Tokyo, Japan, Nov. 13—16,1988).
66. S. Unnasch and co-workers, "Transit Bus Operation with a DDC 6V-92TAC Engine Operating on Ignition-Improved Methanol," SAE Paper
90216J (SP-840), SAE Int. Fuels andEubricants Meeting and Expo. (Tulsa, Oklahoma, Oct. 22—23,1990).
67. С. M. Urban, T. J. Timbario, and R. L. Bechtold, "Performance and Emissions of a DDC 8V-71 Engine Fueled with Cetane Improved Methanol,"
SAE Paper 892064, SAE Int. Fuels andEubricants Meeting and Expo. (Baltimore, Md., Sept. 25—28,1989) Society of Automotive Engineers,
Warrendale, Pa.
68. J. N. Harris, A. R. Russell, and J. B. Milford, Air Quality Implications of Methanol Fuel Utilisation, SAE Paper 881198, Society of Automotive Engineers,
Warrendale, Pa., 1998.
69. T. Y. Chang and S. Rudy, Urban Ah QuaEty Impact of Methanol-Fueled Compared to Gasoline-Fueled Vehicles, in W. Kohl, ed., Methanol as an
Alternative Fuel Choice: An Assessment, John Hopkins Foreign PoEcy Institute, Washington, D.C., 1990, pp. 97—120.
70. С. B. Moyer, S. Unnasch, and M. D. Jackson, Air Quality Programs as Driving Forces for Methanol Use, Transportation Research, Vol. 23 A, No. 3, 1989,
pp. 209-216.
71. T. Lareau, The Economics of Alternative Fuel Use: SubstitutingMethanolfor Gasoline, American Petroleum Institute, Washington, D.C., June 1989.
72. Mobile Source Division, Alcohol-Fueled VehicleFleet Fest, 9th Interim Report ARB/MS-89-09, California Ah Resources Board, El Monte, Calif., Nov.
1989.
73. Proposed Regulationsfor Eow Emission Vehicles and Clean Fuels, Staff Report, California Ah Resources Board, Sacramento, Calif., Aug. 13, 1990.
74. S. Unnasch, С. B. Moyer, M. D. Jackson, and K. D. Smith, Emissions Control Options for Heavy-Duty Engines, SAE 861111, Society of Automotive
Engineers, Warrendale, Pa., 1986.
75. M. A. DeLuchi, "Emissions of Greenhouse Gases from the Use of Gasoline, Methanol, and Other Alternative Transportation Fuels," in W. Kohl,
ed., Methanol as an Alternative Fuel Choice: An Assessment, John Hopkins Foreign PoEcy Institute, Washington, D.C., 1990, pp. 167—199.
76. S. C. Unnasch, B. Moyer, D. D. LoweE, and M. D. Jackson, Comparing the Impacts of Different Transportation Fuels on the Greenhouse Effect, Pub.
# 500-89-001, California Energy Commission, Sacramento, Calif., April, 1989.
77. Methanol Health and Safety Workshop (Los Angeles, Calif., Nov. 1—2, 1989) South Coast Air QuaEty Management District, El Monte, Calif., 1989.
78. P. A. Machiele, "A Perspective on the FlammabiEty, Toxicity, and Environmental Safety Distinctions Between Methanol and Conventional Fuels,"
AIChE 1989 SummerNationalMeeting (Philadelphia, Pa., Aug. 22, 1989), American Association of Chemical Engineers.
79. P. A. Machiele, "A Health and Safety Assessment of Methanol as an Alternative Fuel," in W. Kohl, ed., Methanol as an Alternative Fuel: An
Assessment, John Hopkins Foreign PoEcy Institute, Washington, D.C., 1990, pp. 217—239.
General References
K. Boekhaus and co-workers, "Reformulated Gasoline for Clean Ah: An ARCO Assessment," 2nd Biennial U.C. Davis Conf, on Alternative Fuels (July 12,
1990).
California's Methanol Program, Evaluation Report, Vol. 2 (Technical Analyses), Pub. # P500-86-012A, California Energy Commission, Sacramento, Calif., June
1987.
A. V. de Carvalho, "Future Scenarios of Alcohols as Fuels in Brazil," 3rd Int. Symp. on Alcohol Fuels Technology (Asilomar, Calif., May 29—31,1979).
C. L. Gray, Jr. and J. A. Alson, Moving American to Methanol, University of Michigan Press, Ann Arbor, Mich., 1985.
P. A. Lorang, Emissions from Gasoline-Fueled and Methanol Vehicles, in W. L. Kohl, ed., Methanol as an Alternative Fuel Choice: An Assessment John Hopkins
Foreign PoEcy Institute, Washington, D.C., 1990, pp. 21—48.
J. H. Perry and С. P. Perry, Methanol: Bridge to a Renewable Energy Future University Press of American, Lanham, Md., 1990.
D. Sperling, New Transportation Fuels, University of California Press, Berkekey, Calif., 1988.
D. Sperling, Brazil, Ethanol, and the Process of Change, Energy, Vol. 12, No. 1, pp. 11—23,1987.
E. Supp, How to Produce Methanol from Coal, Springer-Vedag, Berlin, 1990.
Kirk-Othmer Encyclopedia of Chemical Technology (4th Edition)
436
ALCOHOL FUELS
Voll
J. V. D. Weide and W. A. Ramackers, "Development of Methanol and Petrol Carburation Systems in the Netherlands," 2ndlnt. Symp. onA.lcoholTuel
Technology, (Wolfsburg, Germany, Nov. 21—23, 1977).
1987 World Methanol Conf. (San Francisco, Calif., Dec. 1—3, 1987) Crocco and Associates, Houston, Tex.
1989 World Methanol Conf. (Houston, Tex., Dec. 5—7, 1989), Crocco and Associates, Houston, Tex.
Michael D. Jackson
Carl B. Moyer
Acurex Corporation
Kirk-Othmer Encyclopedia of Chemical Technology (4th Edition)
437
ALCOHOLS, HIGHER ALIPHATIC
Voll
Kirk-Othmer Encyclopedia of Chemical Technology (4th Edition)
438
ALCOHOLS, HIGHER ALIPHATIC
Voll
ALCOHOLS, HIGHER ALIPHATIC
Survey and natural alcohols manufacture,
Synthetic processes,
Kirk-Othmer Encyclopedia of Chemical Technology (4th Edition)
439
SURVEY AND NATURAL ALCOHOLS MANUFACTURE
Voll
SURVEY AND NATURAL ALCOHOLS MANUFACTURE
The monohydric aEphatic alcohols of six or more carbon atoms are generally referred to as higher alcohols. Historically, the higher alcohols, particularly
those of 12 or more carbon atoms, were derived from natural fats, oils, and waxes and were caked fatty alcohols (see Fats and fatty oils); but now similar
alcohols are widely available from synthetic processes using petrochemical feedstocks (qv). Although the natural and synthetic alcohols are used
interchangeably for many appEcations, for some appEcations the distinction still remains. The higher alcohols can be separated into the plasticizer range
alcohols, generally 6—11 carbon atoms, and the detergent range alcohols, 12 or more carbon atoms. There is, however, considerable overlap in use.
Production of higher alcohols in North America, Europe, and Japan in 1985 was about 2,600,000 tons and United States production was 35% of that total.
About three-fourths of the U.S. output was plasticizer range alcohols, which are used primarily as ester derivatives in plasticizers (qv) and lubricants (see
Lubrication and lubricants). The detergent range alcohols are used mainly as sulfate, ethoxy, and ethoxysulfate derivatives in a wide variety of detergent
and surfactant appEcations (see Detergency; Surfactants).
Most higher alcohols of commercial importance are primary alcohols; secondary alcohols have more Emited specialty uses. Detergent range alcohols
are apt to be straight chain materials and are made either from natural fats and oils or by petrochemical processes. The plasticizer range alcohols are more
likely to be branched chain materials and are made primarily by petrochemical processes. Whereas alcohols made from natural fats and oils are always linear,
some petrochemical processes produce linear alcohols and others do not. Industrial manufacturing processes are discussed in Synthetic processes.
Detergent Range Alcohols. Natural or synthetic detergent range alcohols are usuaHy described as middle cut (12—15 carbon atoms) or heavy
cut (16—18 carbon atoms), corresponding to the distillation fractions of coconut alcohol from which these alcohols were first derived. Because middle cut
alcohols are preferred for most detergent appEcations, manufacturers maximize this production through feedstock choice (natural alcohols), or by
manipulating processing conditions (synthetic alcohols). The coproduct light cut (6—11 carbon atoms) and heavy cut alcohols are also valuable products.
Only a small percentage of detergent range alcohols are sold as pure single carbon chain materials.
The higher alcohols occur in minor quantities primarily as the wax ester (ester of a fatty alcohol and a fatty acid) in many oilseed and marine sources.
Free alcohols octacosanol [557-61-9]\ C2gH5gO, and triacontanol [28351-05-5]> C32H66O, have been isolated in very small amounts from sugarcane and its
products (1). Oil from the sperm whale is rich in wax esters of hexadecanol, octadecenol, and eicosenol; this oil was formerly a major commerical source of
these alcohols. The oil of the North Adantic barracudina fish contains 85% wax esters that consist mainly of hexadecanol and octadecenol (2). Minor
amounts of alcohols having 12—26 carbon atoms have been found in both ancient and recent marine sediments, probably having their origin in ocean
marine life (3). Wool grease from sheep also contains higher alcohols as wax esters, and is a minor commercial source of alcohol. The seeds of the shrub
jojoba which grows in the North American desert give an oil which contains esters of eicosenol and docosenol [629-98-1and the natural waxes such as
carnauba wax [8015-86-9] and candelilla wax [8006-44-8] contain wax esters with alcohols of 26—34 carbon atoms (4). Although higher alcohols could be
obtained from any of these plant sources by saponification of the esters, they are not commercially important sources.
Plasticizer Range Alcohols. Commercial products from the family of 6—11 carbon alcohols that make up the plasticizer range are available
both as commercially pure single carbon chain materials and as complex isomeric mixtures. Commercial descriptions of plasticizer range alcohols are rather
confusing, but in general a commercially pure material is caked "-anol," and the mixtures are caked "-yl alcohol" or "iso...yl alcohol." For example,
2-ethylhexanol [104-76-7] and 4-methyl-2-pentanol [108-11-2] are single materials whereas isooctyl alcohol [68526-83-0] is a complex mixture of branched
hexanols and heptanols. Another commercial product contains linear alcohols of mixed 6-, 8-, and 10-carbon chains.
Physical Properties
Table 1 provides physical property data for selected pure alcohols (5). The homologous series of primary normal alcohols exhibits definite trends in
physical properties: for each additional CH2 unit the normal boiling point increases by about 20°C, the specific gravity increases by about 0.003 units, and
the melting point increases by about 10°C in the lower end of the range and about 4°C in the upper end. The water solubiEty decreases with increasing
molecular weight and the oil solubiEty increases. In general, the higher alcohols are soluble in lower alcohols such as ethanol and methanol and in diethyl
ether and petroleum ether. The solubiEty of water in 1-hexanol and 1-octanol is appreciable, but drops off rapidly as alcohol molecular weight increases.
Enough solubiEty remains, however, to make even 1-octadecanol slightly hygroscopic. Mixtures of alcohols, such as 1-octadecanol and 1-hexadecanol, are
considerably more hygroscopic. Below C12 the normal alcohols are colorless, oily Equids with light, rather fruity odors. At room temperature pure
1-dodecanol soEdifies to soft, crystalline platelets and the physical form of higher molecular weight alcohols progresses from these soft platelets to
crystalline waxes. Although 1-dodecanol has a slight odor, the higher homologues are essentially odorless. The secondary and branched primary alcohols
are oily Equids at room temperature and have light, fruity odors. They are soluble in alcohol solvents and diethyl ether, and also show less affinity for water
as molecular weights increase. The members of this group do not have wek-defined freezing points; they set to a glass at very low temperatures. Physical
properties are often Hi-defined because of difficulties in obtaining pure samples.
Table 1. Physical Properties of Pure Alcohols
SolubiEty, %
by wt
IUPAC name CAS Registry Number Molecula r formula Other common names Specific gravity, 20°Ca Refractiv e index, 20°Ca Bp, °C, 101.3 kPab Mp, °C Viscosit У, mPa-sac in water of wat er SolubiEty in other solvents
1-hexanol [111-27-3] C6H14O я-hexyl alcohol Primary normal aliphatic 0.8212 1.4181 157 -44 5.9 0.5920 7.2 petroleum ether,
1-heptanol 1-octanol [111-70-6] [111-87-5] C7H16O СЙН1ЙО я-heptyl alcohol я-octyl alcohol 0.8238 0.8273 1.4242 1.4296 176 195 -35 -15.5 7.4 8.4 0.1018 0.0625 4.5 ethanol ethanol,
1-nonanol 1-decanol [143-08-8] [112-30-1] C9H20O C10H22O я-nonyl alcohol я-decyl alcohol 0.8295 0.8312 1.4338 1.4371 213 230 -5 7 11.7 13.8 2.8 petroleum ether glacial acetic acid,
1-undecanol [112^-2-5] СиН24О я-undecyl 0.8339 1.4402 243 16 17.2 <0.02 benzene, ethanol, petro-leum ether
alcohol
Kirk-Othmer Encyclopedia of Chemical Technology (4th Edition)
440
SURVEY AND NATURAL ALCOHOLS MANUFACTURE
Voll
1-dodecanol [112-53-8] C12H26O n- do decyl alcohol, lauryl alcohol 0.83062 5 1.4428 1381-33 24 18.8 i 1.3 petroleum ether, ethanol
1-tridecanol [112-70-9] C13H2gO я-tridecyl alcohol 0.82383 1552-0 30.5
1
1-tetradecanol [112-72-1] CI 1 <) n- tetradecyl 0.81655 1.435850 1581-33 38 <0.02 nil petroleum ether,
alco-hol, myristyl alcohol 0 ethanol
1-pentadecanol [629-76-5] CI IO ^-pentadecyl alcohol 1.44O850 44
1-hexadecanol [36653-82-4 Clio cetyl alcohol, 0.81576 1.439260 I771.33 49 5375 O.O620 nil ethanol, methanol,
] palmityl alcohol 0 diethyl ether, benzene
1-heptadecanol [1454-85-9] C1?H36O margaryl alcohol 0.81676 1.439260 54
0
1-octadecanol [112-92-5] CigH38O stearyl alcohol, 0.81376 1.43 8860 2031-33 58 i nil
^-octadecyl alcohol 0
1-nonadecanol [1454-84-8] CI l() ^-nonadecyl alcohol 62
1-eicosanol [629-96-9] C I I O eicosyl alcohol, 2511-33 66 i nil benzene, ethanol,
arachidyl alcohol petroleum ether
1-hexacosanol [506-52-5] C26H54O ceryl alcohol 3052-67 79.5 i ethanol, ether
1-hentriacontanol [26444-39-3 Сз1Н64О melissyl alcohol, 0.77849 87 nil
] myricyl alcohol 5
9-hexadecen-l-ol [10378-01-5 CI IO palmitoleyl 2O5-21O20
] alcohol
9-octadecen-l-ol [143-28-2] oleyl alcohol 0.85045 1.447360 ethanol, diethyl
8 ether
10- eic 0 sen-1 - ol [28061-39^1 ] Clio eicosoyl alcohol
Primary branched aliphatic
2-methyl- 1-pentanol [105-30-6] C6H14O 2-methylpentyl alcohol 0.8254 1.4190 148 6.6 0.31 5.4
2-ethyl- 1-butanol [97-95-0] C6H14O 2-ethylbutyl alcohol 0.8348 1.4224 146.5 -114
2-ethyl- 1-hexanol [104-76-7] СЙН1ЙО 2-ethylhexyl 0.8340 1.4316 184 -70 9.8 0.07 2.6 ethanol, diethyl
alcohol ether
3,5-dimethyl-l-hexano 1 [13501-73-0 ] [123-44-4] C8H18O 0.8297 1.4250 182.5
1 2,2,4-trimethyl- 1-pent anol C8H18O 0.839 1.4300 168 -70 ethanol
Secondary aliphatic
4-methyl-2-pentanol [108-11-2] C6H14O methylamyl 0.8083 1.4112 132 -90 5.2 1.7 5.8 ethanol, diethyl
alco-hol, methylis o-butylc arbinol ether
2-octanol [123-96-6] C8H18O capryl alcohol 0.83S1O 1.4256 178-179 -38 8.2 0.09625 ethanol, petroleum ether
2,6-dimethyl-4-heptan [108-82-7] C9H20O diisobutylcar-bin 0.8121 1.4231 178 -65 14.3 0.06 0.9 ethanol, diethyl
ol ol 9 ether
2,6,8-trimethyl-4-nona [123-17-1] CI IO 0.8193 1.4345 225 -60 21 <0.02 0.6
nol 0
Temperature, °C, if other than 20°C >, is noted as superscript.
Pressure, kPa, if other than 101.3 kPa, is notec 1 as superscript. To convert kPa to mm Hg, multiply by 7.50.
C mPa-s =cP.
Chemical Properties
The higher alcohols undergo the same chemical reactions as other primary or secondary alcohols. Similar to other chemicals having long carbon chains,
however, reactivity decreases as molecular weight or chain branching increase. This lower reactivity and concommitant decreased solubility in water and in
other solvents means that more rigorous reaction conditions, or even use of different reaction schemes as compared to shorter chain alcohols, are generally
required. Typical reactions of the higher alcohols are as shown.
Esterification
ROH + R'COOH R'COOR + H20
Sulfation
ROH + SO3 ^ROSO3H
alkyl sulfuric acid
ROSO3H + NaOH ROSO3Na + H2O
sodium alkyl sulfate
Etherification
Kirk-Othmer Encyclopedia of Chemical Technology (4th Edition)
441
SURVEY AND NATURAL ALCOHOLS MANUFACTURE
Voll
ROH + n H2C —CH2
О
—► R(OCH2CH2)nOH
polyethoxylated alcohol
ROH + H2C —CH—CH2CI
О
ROCH2CH—CH2CI
OH
alkyl chlorohydrin ether
Halogenation
Dehydration
Oxidation
Amination
3 ROH + PC13 -3 13'1 P(OH) 3
RCH2CH2OH RCH=CH2 + H2O
RCH2OH + 72 O2 RCH=O + H2O
ROH + R'NH2 RNHR' + H2O
Oxidation (6,7) and amination (8,9) are discussed in detail elsewhere.
Shipment and Storage
Detergent range alcohols are available in 208-L (55-gal) drums of approximately 160-kg or 23,000-L (6000-gal) tank trucks, in tank cars of 75,000 L (20,000
gal) containing about 60,000 kg, and in marine barges. The tank trucks and cars are usually insulated and equipped with an external heating jacket; the
barges have coils for melting and heating the alcohols. High melting alcohols such as hexadecanol and octadecanol are also available as flaked material in
three-ply, polyethylene-lined 22.7 kg (50 lb) bags. Detergent range alcohols have a U.S. Department of Transportation classification as nonhazardous for
shipment. The perfume-grade alcohols, such as specially purified octanol and decanol, are available in botdes and cans; other plasticizer range materials are
available in 208-L drums, 23,000-L tank trucks, 75,000-L tank cars, and in marine barges. Because of low melting points, most of these materials do not
require transports having heating equipment. Bulk shipments are usually described by the commercial name of the material, such as methylisobutylcarbinol
for 4-methyl-2-pentanol. The names hexyl, octyl, or decyl alcohol are used as freight descriptions for the linear or branched alcohols of corresponding
carbon number. Linear and branched alcohols of 6—9 carbon atoms, and mixtures containing them, are classified as combustible for shipment by the U.S.
DOT because of their low flash points. Alcohols of 10 carbons and above are classified as nonhazardous.
The higher alcohols are not corrosive to carbon steel, and equipment suitable for handling solvents or gasoline is also suitable for the alcohols.
However, special storage conditions are often needed to maintain alcohol quaEty. Lined carbon steel tanks having nitrogen blankets to exclude both
moisture and oxygen are recommended for storage of detergent range alcohols (10). Preferred storage temperature is no higher than 10°C above the
alcohol melting point and repeated cycles of melting and soEdifying must be avoided. Low pressure steam is generally used for heating; for the high melting
hexadecanol and octadecanol, hot water can be used in order to reduce exposure to high temperature heating surfaces. Although they are generally
considered quite stable, alcohols which are stored either for long periods of time or under improper conditions can undergo such subde changes as
deterioration of color, increase in carbonyl level, or a decrease in acid heat stabiEty. It is sometimes preferable to store high melting alcohols as flakes in
bags at ambient temperature rather than melted in a tank at higher temperature.
To prevent rusting and moisture pickup resulting from the hygroscopic nature of plasticizer range alcohols, tanks should be protected from
moisture by such devices as a drying tube on the tank or a dry air blanket; nitrogen is usually not needed because ambient storage temperature is adequate
for these lower melting materials. In general, plasticizer range alcohols are more storage-stable than the detergent range alcohols. However, to avoid the
danger of fire resulting from the low flash points of plasticizer range alcohols, tanks should be grounded, have no interior sources of ignition, be filled from
the bottom or have a filling line extending to the bottom to prevent static sparks, and be equipped with flame arrestors.
Economic Aspects
United States production of detergent range alcohol was 354,000 t in 1987, according to the U.S. International Trade Commission, compared to 263,000 t
in 1974. About 60% was sold as alcohol on the merchant market; most of the rest was ethoxylated by the producers, then sold as the ethoxylated alcohol
or sulfated and sold as the ethoxysulfate surfactant. In the 1960s and early 1970s ethylene-based synthetic alcohols appeared to be the wave of the future.
Increases in petroleum prices and stabilization in the price of coconut and palm kernel oils, the primary raw materials for higher alcohols, have led back to
natural production. Most alcohol capacity installed in the 1980s uses catalytic hydrogenolysis processes employing natural fats and oils as feedstock to make
alcohol. Fatty alcohol capacity is increasingly being built in the coconut and palm oil producing countries. A number of natural alcohol plants have started
up or are in various stages of construction in the Philippines, Malaysia, and Indonesia. In the United States however, the Eon's share of detergent range
alcohol production is by synthetic processes; Shell Chemical is the largest producer in a plant having a 270,000-t capacity. Linear synthetic alcohols can be
used interchangeably with natural alcohols except where the presence of minor amounts of chain branching or secondary alcohols preclude use of the
synthetics. The more highly branched alcohols are used where branching is not a problem, is desired, or the alcohols are ethoxylated. Ethoxylation reduces
the physical and chemical effects of chain branching. Domestic detergent range alcohol producers are shown in Table 2; representative prices are given in
Table 3. Manufacturers often adjust coproduct alcohol prices to compensate for shortages or surpluses, keeping the price of the primary material stable.
Table 2. U.S. Manufacturers of Detergent Range Alcohols
Manufacturer Process Feedstock Products
Procter & Gamble catalytic hydrogenolysis coconut and palm kernel oils, r C % %8
tallow, palm oil
Sherex catalytic hydrogenolysis tallow C16> C18>
Shell Chemical modified oxo ethylene / olefins C -C % %5
Vista Ziegler ethylene C -C % ^22
Ethyl modified Ziegler ethylene C -C % ^22
Exxon modified oxo olefins c c %3’ %5
Kirk-Othmer Encyclopedia of Chemical Technology (4th Edition)
442
SURVEY AND NATURAL ALCOHOLS MANUFACTURE
Voll
Table 3. Prices of Detergent Range Alcohols*
Alcohol_______________________
lauryl alcohol, fob
dodecanol/tridecanol, deEvered
hexadecanol, fob
octadecanol, fob
Price, U.S.$/kg
1.54
1.26
2.01
2.01
November 1989 list prices.
United States production of plasticizer range alcohols was estimated to be 690,000 t in 1988 (11), 44% of which was 2-ethylhexanol. Domestic
manufacturers and prices of representative plasticizer range alcohols are given in Table 4. The previous decade has seen a reduction in the number of
manufacturers of 2-ethylhexanol and other branched chain alcohols. The volume of most branched alcohols has been static, however, and 2-ethylhexanol
volume has doubled; the volume of linear alcohols has also grown. A substantial portion of these materials is used in plasticizers for poly(vinyl chloride)
(PVC), so plasticizer range alcohol fortunes are tied to variations in the PVC industry. The plasticizers are mainly diesters of the alcohols and phthalic acid;
di(2-ethylhexyl) phthalate [117-81 -7] is the highest volume product. Recent price and volume history of 2-ethylhexanol is given in Table 5. Other branched
alcohols tend to be priced at, or slightly above, the price of 2-ethylhexanol; the linear alcohols are several cents per kilogram higher. Production costs of
plasticizer range alcohols, manufactured either by oxo or Ziegler processes, are strongly dependent on the cost of the ethylene or propylene feedstocks,
making them dependent on the cost of crude oil and natural gas.
Table 4. Prices and Manufacturers of Plasticizer Range Alcohols
Material Price, U.S.$/kga Manufacturer
hexanol 1.74 Ethyl Vista
4-methyl-2-pentanol 1.32 Union Carbide
octanol 2.01 Ethyl Vista
octanol, perfumer's grade 3.09
isooctyl alcohol 0.97 Exxon
2-ethylhexanol 0.93 BASF Eastman Sh.eE Chemical Tenn-USS Union Carbide
decanol 1.34 Ethyl Vista
decanol, perfumer's grade 1.65
a Delivered price May 1989. The listed price is not necessarily the price listed by the indicated manufacturer.
Table 5. Price and Production Volume of 2-Ethylhexanol*
Year Price, U.S.$/kg Volume, 103 t/yr
1988 0.73 337
1987 0.60 300
1986 0.55 259
1985 0.60 243
1984 0.71 245
1983 0.71 175
aRef. 12.
Most manufacturers sell a portion of their alcohol product on the merchant market, retaining a portion for internal use, typically for the manufacture
of plasticizers. Sterling Chemicals' linear alcohol of 7, 9, and 11 carbons is all used captively. Plasticizer range linear alcohols derived from natural fats and
oils, for instance, octanol and decanol derived from coconut oil and 2-octanol derived from castor oil, are of only minor importance in the marketplace.
The 13—carbon tridecyl alcohol is usually considered to be a plasticizer range alcohol because of its manufacture by the oxo process and its use in making
plasticizers. On the other hand, some types of linear 9- and 11-carbon alcohols find major application in detergents.
Analysis
Because the higher alcohols are made by a number of processes and from different raw materials, analytical procedures are designed to yield three kinds of
information: the carbon chain length distribution, or combining weight, of the alcohols present; the purity of the material; and the presence of minor
impurities and contaminants that would interfere with subsequent use of the product. Analytical methods and characterization of alcohols have been
summarized (13).
For the detergent range alcohols, capillary gas chromatography, fast, accurate, and simple to use, is by far the most useful method for determining
composition and purity (14). By the proper choice of the capillary stationary phase, carbon chain distribution and the amount of unsaturated, chain
branched, or secondary alcohols, as well as the level of minor materials such as esters and hydrocarbons, can be determined. Hydroxyl Value (HV = mg of
KOH equivalent to the hydroxyl content of 1 g of alcohol) measures the —OH end group and reflects both the combining weight and the purity of the
sample. Saponification Value (SV = mg of KOH required to saponify the esters and acids in 1 g of alcohol), Acid Value (AV = mg of KOH required to
neutralize the free fatty acid in 1 g of alcohol), and Ester Value (EV = SV minus AV) are measures of the carboxylic acid impurities present as the free acids
or esters. Iodine Value (IV = g of iodine absorbed by 100 g of alcohol) is a measure of carbon—carbon unsaturation present in the alcohol. HV, SV, AV,
EV, and IV can all be calculated from the capillary GC analysis. Moisture is also an important criterion of alcohol quaEty, and the color of the alcohol,
usuaHy determined by the APHA (Pt—Co) method, should be as close to water-white as possible. A number of other tests measure attributes important to
specific uses. Examples are melting point for the heavy cut alcohols, cloud point of unsaturated alcohols, odor, carbonyl content, peroxide content, and
various color stabiEty tests. One of these last is the acid heat stabiEty test. It determines the color change of middle cut alcohol in contact with concentrated
Kirk-Othmer Encyclopedia of Chemical Technology (4th Edition)
443
SURVEY AND NATURAL ALCOHOLS MANUFACTURE
Voll
sulfuric acid at an elevated temperature as an index of the color of alkyl sulfates that would be made from the alcohol. Test outcome is affected by carbonyl
at a level of a few hundred parts per million., and by traces of iron, rust, and dirt particles.
As for detergent range alcohols, extensive use of capillary gas chromatography is also made for composition and purity determination of the
plasticizer range materials. For those products that are a broad mixture of various isomers, however, distillation range and Hydroxyl Value are more useful
characterizations. From the HV the combining weight can be calculated for subsequent chemical reactions. Carbonyl content is important, especially for
those alcohols manufactured from aldehydes by the oxo process. It is often expressed similarly to HV: as the mg of KOH equivalent to the carbonyl
oxygen in 1 g of sample. Acidity, expressed in terms of the equivalent weight percent of acetic acid, is used to determine the quaEty of the alcohol, as are
moisture and APHA color. As with the detergent range alcohols, tests which measure color stabiEty in the presence of sulfuric acid are employed to predict
the color changes that may occur in subsequent reactions utilizing acid catalysts. Additionally, analytical determinations such as odor, chloride level,
hydrocarbon content, and trace metal content, are required for specific uses.
Specifications and Standards
Most of the detergent range alcohols used commercially consist of mixtures of alcohols, and a wide variety of products is available. Table 6 shows the
approximate carbon chain length composition of both the commonly used mixtures and single carbon materials; typical properties are given in Table 7.
The range of commercially available materials is further described in sales brochures pubEshed by the manufacturers (15), who usuaHy can also provide
speciaHy tailored blends to meet individual customer needs. Although only even-carbon alcohols are available from natural fats and oils and the Ziegler
process, the development of the oxo process for linear alcohols has made odd-carbon alcohols a commercial reaEty, albeit with some chain branching.
Commercial mixtures of these latter alcohols contain both odd and even numbered chain lengths. The major production of detergent range alcohols is in
the 12—18 carbon range. Alcohols with 20 carbons and above are available in mixtures such as Vista's Alfol 20+ and Ethyl's Epal 20+. Behenyl alcohol
(docosanol) [661 -19-8]> C22H46O, can be made from rapeseed oil. Except for oleyl alcohol, aH commercial alcohols are fuHy saturated.
Table 6. Composition of Commercial Detergent Range Alcohols*
Alcohol commercial name Representative trade name Derived from c %2 c %3 c '“'14 C!6 c c ^20
lauryl CO-1214b [67762-41-8] coconut, palm kernel 68 26 6
Alfol 1214е ethylene 55 45
Epal 1214d ethylene 66 27 7
Neodol 23е ethylene 41 57 1
Epal 1218 [67762-25-8] ethylene 49 20 17 14
Lauryl Alcohol Special-Type coconut 72 27 1
Epal 12 ethylene 99 1
myristyl Alfol 14 ethylene 1 99 1
cetyl CO-1695 [36653-82-4] vegetable oil 98 2
Epal 16 ethylene 1 98 1
taHow TA-1618b [67762-363-5] taHow 2 27 70h 1
Adol 64g fats 4 26 70
stearyl CO-1897 vegetable oil 1 98 1
oleyl HD Oleyl Alcohol Df fats 5 94‘ 1
Adol 80 fats 4 14 81‘ 1
Approximate composition by wt %, 100% alcohol basis.
Registered trademark for Procter & Gamble alcohols.
Registered trademark for Vista alcohols.
Registered trademark for Ethyl Corporation alcohols.
Registered trademark for SheH alcohols.
Registered trademark for Henkel alcohols.
Includes 1% C17 alcohol.
Registered trademark for Sherex alcohols.
Primarily unsaturated.
Table 7. Properties of Commercial Linear Detergent Range Alcohols
Commercial descriptive name Hydroxyl Value S ap onification Value Acid Valu e lodin e Value Melting point, °C Color, APHA Moisture, %
lauryl (99% C12) 301 0.2 0.02 0.2 23-25 5 0.03
lauryl (68% C12) 285 0.2 0.01 0 22 3 0.04
c —c a %2 %3 289 0.02 18-22 5 0.02
cetyl 229 0.4 0 0.6 49 6-10 0.04
taHow 208 1.8 0 0.5 53 10-20 0.03
stearyl 206 0.5 0 0.7 58 6-15 0.03
oleyl 206 0.5 94 4
Neodol 23 (registered trademark for SheH alcohols).
Both detergent range and plasticizer range alcohols and their derivatives have been accepted by the U.S. government for use in a number of drug
and food contact or food additive areas, and plasticizer range alcohols have been accepted as flavoring agents in foods (16). They must meet rigid
manufacture, quaEty control, and record keeping requirements. Hexadecanol and octadecanol are used extensively in drug and cosmetic areas which require
drug-grade raw materials. For this appEcation they are produced to the specifications of the National!? ormulaiy (NF) in faciEties registered by the U.S. Food
and Drug Administration. The NF requirements for hexadecanol are 45—50°C melting point, 2.0 max AV, 5.0 max IV, and 218—238 HV. The NF
Kirk-Othmer Encyclopedia of Chemical Technology (4th Edition)
444
SURVEY AND NATURAL ALCOHOLS MANUFACTURE
Voll
requirements for octadecanol are 55—60°C melting point, 2.0 max AV, 2.0 max IV, 200—220 HV, and 90% min. octadecanol.
Besides the linear detergent range alcohols, a number of highly branched alcohols of 12 or more carbon atoms made by the oxo process are of
commercial importance. Tridecyl alcohol [27458-92-0], C13H2gO, consisting mainly of tetramethyl-l-nonanols, is one such material; it is generally
considered to be a plasticizer range alcohol because of its manufacturing process and use in making plasticizers. Primary alcohols made by the Guerbet
process, consisting of alcohols characterized as 2,2-dialkyl-l-ethanols, are available as hexadecyl [68526-87-4], C16H34O, octadecyl [27458-93-1], ClgH3gO,
eicosyl [52655-10-4], C2QH42O, and hexacosyl [70693-05-9], C26H54O, materials sold by Exxon under the Exxal brand name (17). They should not be
confused with linear alcohols having similar names. Isostearyl alcohol [27458-93-1J is a highly branched natural alcohol containing a mixture of Clg alcohols
derived from isostearic acid.
The sales brochures of the manufacturers describe the plasticizer range alcohols available on the merchant market (18). Typical properties of several
commercial plasticizer range alcohols are presented in Table 8. Because in most cases these are mixtures of isomers or alcohols with several carbon chains,
the properties of a particular material can vary somewhat from manufacturer to manufacturer. Both odd and even carbon chain alcohols are available, in
both linear and highly branched versions. Examples of the composition of several mixtures are given in Table 9.
Table 8. Typical Properties of Commercial Plasticizer Range Alcohols
Name Molecular formula Hydroxyl Value Acidity, % as acetic Carbonyl, wt % О Boiling range, °C Color, APHA Moisture, % Flash point, °C
hexyl (C6H14O) 0.001 <U.UU3 152-160 5 0.05 63
2-ethylhexanol C8H18O) 431 <0.007 <0.02 182-186 <10 <0.10 84b
is о octyl (C8H18O) 0.001 <0.003 184-190 5 0.05 84
isononyl (C9H20O) 0.001 <0.003 202-213 5 0.05 91
hexyl decyl 408 <0.004 0.003 168-203 5 0.01 8f
octanol (C8H18O) 431 <0.005 0.003 184-195 5 0.03 88c
decanol (C1OH22°) 355 <0.01 0.003 226-230 5 0.03 113
tridecyl (C13H28°) 283 0.001 <0.003 254-263 5 <0.05 127
Pensky-Martens closed cup unless otherwise noted.
Cleveland open cup.
Tag close cup.
Table 9. Composition of Commercial Plasticizer Range Alcohols
Material Component Composition, wt %
is о octyl 3,4-dimethyl-l-hexanol [19138-79-5] 3,5-dimethyl-l-hexanol [69778-63-8] 4,5-dimethyl-l-hexanol [60564-76-3] 54
3-methyl-l-heptanol [31367-46-1] 5-methyl-l-heptanol [7212-53-5] } 25
3-ethyl-l-hexanol [41065-95-6] 13
other primary alcohols 8
hexyl decyl hexanol 10
(Epal 610) octanol 44
decanol 46
octyl decyl octanol 42
(Alfol 810) decanol 58
Toxicological Properties
The higher alcohols are among the less toxic of commonly used chemicals and, in general, their toxic effects are reduced as the number of carbon atoms is
increased. Table 10 gives data representative of the toxicological properties of the higher alcohols (19—23). Slight differences in material purity,
methodology, and grading of results may account for variations in data from different sources, and these data should not be regarded as representing a
consistent series. Because the data pertain to animals and not necessarily to humans, they should be used only as a guide. The values for acute oral toxicity
may be compared to an LD5Q of about 3.75 g/kg for sodium chloride ingested by rats. A substance with an LD5Q of 15 g/kg or above is generally
considered to be "practically nontoxic."
Table 10. Toxicological Properties of Higher Alcohols
Material Acute oral LD5Q rats, g/W Eye irritation, rabbits Primary skin irritation, rabbits
hexanol 3.2-4.4 severe moderate
octanol 18 severe moderate
decanol 20-26 severe moderate
dodecanol >40 moderate slight
tetradecanol >8 mild mild
hexadecanol >20 mild mild
octadecanol >20 mild mild
4-methyl-2-pentanol 2.6 slight moderate
2-ethylhexanol 3.7 severe moderate
mixed isomers
hexyl 3.7 severe moderate
Kirk-Othmer Encyclopedia of Chemical Technology (4th Edition)
445
SURVEY AND NATURAL ALCOHOLS MANUFACTURE
Voll
isooctyl severe moderate
decyl 4.7 severe moderate
tridecyl 4.7 moderate moderate
The lethal dose for 50% of the test animals, expressed in terms of g of material per kg of body weight.
Evaluation of the irritation elicited from 0.1 mL of the material applied to the eyes without rinsing.
Evaluation of the irritation elicited from an application of full-strength alcohol left in contact with the skin for 24 h.
Primary human skin irritation of tetradecanol, hexadecanol, and octadecanol is nil; they have been used for many years in cosmetic creams and
ointments (24). Based on human testing and industrial experience, the linear, even carbon number alcohols of 6—18 carbon atoms are not human skin
sensitizers, nor are the 7-, 9- and 11-carbon alcohols and 2-ethylhexanol. Neither has industrial handling of other branched alcohols led to skin problems.
Inhalation hazard, further mitigated by the low vapor pressure of these alcohols, is slight. Sustained breathing of alcohol vapor or mist should be avoided,
however, as aspiration hazards have been reported (25).
Manufacture from Fats and Oils
Fats and oils from a number of animal and vegetable sources are the feedstocks for the manufacture of natural higher alcohols. These materials consist of
triglycerides: glycerol esterified with three moles of a fatty acid. The alcohol is manufactured by reduction of the fatty acid functional group. A small
amount of natural alcohol is also obtained commercially by saponification of natural wax esters of the higher alcohols, such as wool grease.
The carbon chain lengths of the fatty acids available from natural fats and oils range from 6—22 and higher, although a given material has a narrower
range. Each triglyceride has a random distribution of fatty acid chain lengths and unsaturation, but the proportion of the various acids is fairly uniform for
fats and oils from a common source. Any triglyceride or fatty acid may be utilized as a raw material for the manufacture of alcohols, but the commonly
used materials are coconut oil, palm kernel oil, lard, tallow, rapeseed oil, and palm oil, and to a lesser extent soybean oil, com oil and babassu oil. Coconut
and palm kernel oil are the primary sources of dodecanol and tetradecanol; lard, tallow, and palm oil are the primary sources of hexadecanol and
octadecanol. Producers of natural fatty alcohols typically make a broad range of alcohol products having various carbon chain lengths. They vary feedstocks
to meet market needs for particular alcohols and to take advantage of changes in the relative costs of the various feedstock materials.
The first commercial production of fatty alcohol in the 1930s employed the sodium reduction process using a methyl ester feedstock. The process
was used in plants constructed up to about 1950, but it was expensive, hazardous, and complex. By about 1960 most of the sodium reduction plants had
been replaced by those employing the catalytic hydrogenolysis process. Catalytic hydrogenation processes were investigated as early as the 1930s by a
number of workers; one of these is described in reference 26.
Hydrogenolysis Process. Fatty alcohols are produced by hydrogenolysis of methyl esters or fatty acids in the presence of a heterogeneous
catalyst at 20,700—31,000 kPa (3000—4500 psi) and 250—300°C in conversions of 90—98%. A higher conversion can be achieved using more rigorous
reaction conditions, but it is accompanied by a significant amount of hydrocarbon production.
RCOOCH3 + 2H2 --------------- catalyst RCH2OH+CH3OH
о * high pressure о
rch2ch2oh + h2 RCH2CH3 + H2o
Fatty esters (wax esters), formed by ester interchange of the product alcohol and the starting material in the hydrogenolysis reactors, are later separated
from the product by distillation. Unreacted methyl esters are also converted to fatty esters in the distillation step
RCOOCHg + R'OH RCOOR' + CH3OH
so that they too can be separated from the product. Fatty esters are recycled to the hydrogenolysis reactors since they can undergo hydrogenation in a
manner similar to methyl esters, in this case yielding two moles of fatty alcohol per mole of ester. Fatty acids can also be used for the higher alcohol
production. The fatty acid is pumped into the high pressure reactor and esterified in situ using previously made fatty alcohol; the resulting fatty ester then
undergoes hydrogenolysis to two moles of fatty alcohol. A recendy disclosed process uses the naturally occurring triglyceride ester as the feedstock for
hydrogenolysis (27). Although the manufacturing process is simplified by eliminating the production of a methyl ester or fatty acid, degradation of glycerol
to 1,2-propanediol also occurs in the high temperature of the reaction and thus degrades a valuable coproduct.
To prepare methyl ester feedstock for making fatty alcohols, any free fatty acid must first be removed from the fat or oil so that the acid does not
react with the catalyst used in the subsequent alcoholysis step. Fatty acid removal may be accomplished either by refining or by converting the acid directly
to a methyl ester (28). Refining is done either chemically, by removal of a soap formed with sodium hydroxide or sodium carbonate (alkali refining), or
physically, by steam distillation of the fatty acids (steam refining) (29). In the case of chemical refining, the by-product soap is acidified to give a fatty acid
and these "foots" are used as animal feed or upgraded for industrial fatty acid use. The by-product fatty acid from steam refining is of a higher grade than
acidified foots and is used direcdy as an industrial fatty acid or as animal feed. In either case, the fatty acid can also be converted to the methyl ester and
used as additional alcohol feedstock. Refined oil is dried to prevent the reaction of water with the catalyst during alcoholysis.
Alcoholysis (ester interchange) is performed at atmospheric pressure near the boiling point of methanol in carbon steel equipment. Sodium
methoxide [124-41 -4]., CH3ONa, the catalyst, can be prepared in the same reactor by reaction of methanol and metallic sodium, or it can be purchased in
methanol solution. Usage is approximately 0.3—1.0 wt % of the triglyceride.
C3H5 (OOCR) 3 + 3 CH3OH ------------%аС)сн3 3RCOOCH3 + C3H5(OH)3
The alcoholysis reaction may be carried out either batchwise or continuously by treating the triglyceride with an excess of methanol for 30—60 min in a
well-agitated reactor. The reactants are then allowed to setde and the glycerol [56-81-5] is recovered in methanol solution in the lower layer. The sodium
methoxide and excess methanol are removed from the methyl ester, which then maybe fed direcdy to the hydrogenolysis process. Alternatively, the ester
may be distilled to remove unreacted material and other impurities, or fractionated into different cuts. Fractionation of either the methyl ester or of the
product following hydrogenolysis provides alcohols that have narrow carbon-chain distributions.
High Pressure Hydrogenolysis. There are three major hydrogenolysis processes in woddwide use: the methyl ester, slurry catalyst process
operated by Procter & Gamble, Henkel, and Kao; the methyl ester, fixed-bed catalyst process operated by Henkel and Oleofina; and the fatty acid, slurry
catalyst process developed by Lurgi and operated by several licensees. Each process typically uses a copper chromite or copper—zinc catalyst that is
modified to meet the needs of the individual producer. Copper chromite when prepared is nominally a complex mixture of primarily copper(II) oxide and
copper(II) chromite. But in use it is believed to be reduced to a mixture of metallic copper, copper(II) oxide, and copper(II) chromite, the metallic copper
playing an important, but as yet undefined, role in the catalysis of the reaction. The catalyst is made by reaction of copper nitrate and chromic oxide with
ammonia followed by vacuum filtering of the precipitate, water washing, and then roasting in air. The resulting material is a very fine black powder. The
roasting operation is continuous, utilizing accurate temperature control to give a catalyst of long life and high activity. Barium, manganese, or other metal
ions are sometimes added to improve stability, and silica or other binders may be put in to make a physically strong, fixed-bed catalyst pellet. Hydrogen
[1333-74-0] is usually generated on site from methane or propane. The hydrogen should be of high purity to avoid catalyst poisons, such as sulfur and
carbon dioxide, and to prevent buildup of inert gases in the system; pressure swing adsorption (PSA) is often used to remove gaseous impurities.
Methyl Ester Hydrogenolysis. The flow sheet for the continuous methyl ester, catalyst slurry process is shown in Figure 1. The dry methyl
ester, hydrogen, and catalyst slurry are fed cocurrendy to a series of four vertical reactors operated at 250—300°C and 20,700 kPa (3000 psi). The reactors are
unagitated, empty tubes, designed to provide adequate residence time, minimum backmixing, and a reasonable column height. Fresh catalyst powder is
Kirk-Othmer Encyclopedia of Chemical Technology (4th Edition)
446
SURVEY AND NATURAL ALCOHOLS MANUFACTURE
Voll
slurried with fatty alcohol and recycled catalyst in a weigh tank and metered into the bottom of the first reactor at approximately 3% of the ester feed rate.
The heated hydrogen is fed through a distributor in the bottom of the first reactor. Besides serving as the reducing agent, the hydrogen also provides the
principal source of heat and agitation for the reaction, and its flow conveys the mixture of ester, alcohol, and catalyst from one reactor to another.
Approximately 30 moles of hydrogen are fed per mole of ester. The product stream from the last reactor, consisting of fatty alcohol, methanol, hydrogen,
catalyst, and unreacted ester, enters a gravity separator where the vapor portion, consisting of hydrogen, methanol, and some fatty alcohol, goes overhead.
The underflow stream of crude alcohol and catalyst is heat-interchanged with ester feed and depressurized, and the catalyst is removed. Most of the catalyst
slurry is recycled but a small amount, to match the amount of fresh catalyst feed, is purged. This keeps a constant catalyst activity. The purged catalyst can
be regenerated (30) or sold to a reclaimer to recover copper values. The overhead stream is heat-interchanged with hydrogen feed, cooled, and separated
from hydrogen before being depressurized and filtered. An atmospheric stripping column removes methanol from the combined underflow/overhead
stream of crude alcohol, and the methanol is recycled to the alcoholysis process. The stripped crude fatty alcohol is distilled in a vacuum column, or
fractionated in a series of vacuum columns, to give the finished alcohol. The still bottoms, primarily fatty ester, are mainly recycled, and a small amount of
still bottoms is removed from the system as a purge.
Dried methyl
ester
Hydrogen
Blow
down
Filter
feed
Catalyst
removal
Fatty alcohol
to distillation
Spent
catalyst
Fig. 1. Methyl ester, slurry catalyst process.
The process is controlled by the reaction temperature, feed rate (residence time), catalyst rate, and fresh catalyst usage. It is operated to provide the
highest production rate commensurate with high yield and product quaEty, as well as lowest temperature and fresh catalyst usage. Heat interchange is used
wherever possible to minimize energy consumption; low pressure steam is generated from coolers and condensers for use elsewhere in the process.
Recycling from the two blowdown tanks recovers the hydrogen dissolved in those streams and reduces the usage of hydrogen feedstock. A fat trap is used
to recover minor amounts of fatty alcohol and ester from process water streams and spills to reduce COD (chemical oxygen demand) loadings in the
process sewer. The recovered material is then recycled to the process. A minor amount of still bottoms and unusable process remnants is burned as fuel.
The methyl ester, fixed-bed catalyst process is shown in Figure 2. A large excess of hydrogen is mixed with the methyl ester, part of which vaporizes
and is carried through one or more fixed beds of catalyst at 200—250°C and a pressure similar to that used in the slurry process (31). After leaving the
reactor, the mixture is cooled, then separated into a gaseous phase of mosdy hydrogen, which is recycled, and a Equid phase of methanol and fatty alcohol.
The Equid phase is depressurized into a blowdown tank, which removes the methanol; the fatty alcohol that remains does not require further purification.
The alcohol is fractionated, however, if a product having a narrower carbon chain distribution is desired. The high rate of recirculating hydrogen in this
process is claimed to provide fast removal of heat, providing high yields and minimizing side reactions such as hydrocarbon formation.
Kirk-Othmer Encyclopedia of Chemical Technology (4th Edition)
447
SURVEY AND NATURAL ALCOHOLS MANUFACTURE
Voll
Fig. 2. Methyl ester, fixed-bed catalyst process.
Fatty Acid Hydrogenolysis. The fatty acid, slurry catalyst process operates at 315°C and a pressure of 31,000 kPa (4500 psi); it is shown in
Figure 3 (32,33). This process uses a single large reactor with internal baffles and a complex flow system. First, previously prepared fatty alcohol reacts with
the acid feed to make a fatty ester via the alcoholysis reaction. A mole of water is also released. Then, the fatty ester reacts with hydrogen to give two moles
of fatty alcohol per mole of ester. One exits the reactor, the other is recycled to react with the fatty acid feed. In two stages of cooling and separation, the
excess hydrogen is separated from the reactor effluent for recycle, the reaction water is separated, and the catalyst containing fatty alcohol is recovered. The
catalyst is removed as a slurry in a centrifugal separator for recycle. A small amount of catalyst is continuously purged from the process; an equivalent
amount of fresh catalyst is added. After a final polish filtration, the crude fatty alcohol is sent to distillation: single-stage distillation for a broad range of
carbon alcohols; fractionation for a narrower range of carbon alcohols.
Reaction water Spent catalyst
Fig. 3. Fatty acid, slurry catalyst process.
Production of Unsaturated Alcohols
Unsaturated higher alcohols may be produced by saponification, sodium reduction, or hydrogenolysis of unsaturated fatty acids or esters. Saponification of
oil from the sperm whale was a former source, but bans on the slaughter of whales by some nations and a general reduction in whaling have made this
method obsolete. Alcohol made by saponification of wool grease (lanolin) is a minor product; sodium reduction of unsaturated esters is no longer an
economic process for manufacturing unsaturated alcohols. Hydrogenolysis of unsaturated fatty acids or esters to produce alcohol without loss of the
double bond has been a subject of interest for many years. Literature through the mid-1960s has been reviewed (34); and there has also been other work
reported (35). In general, the key to double bond retention is a specially designed catalyst to give selectivity coupled with reaction conditions adjusted for
the poorer reactivity of this catalyst compared to the copper—chromite catalysts. Cadmium modified catalysts are claimed to be effective, as are zinc
chromite and a zinc—lanthanum catalyst (36). A zinc—aluminum catalyst reportedly avoids isomerization of the cis double bond of octadecenoic acid,
soybean fatty acid, and linseed fatty acid methyl esters during hydrogenolysis (37). The known commercial hydrogenolysis processes for the production of
octadecenol and other unsaturated alcohols are practiced by Sherex Chemical Company in the United States, Henkel K.-G.a.A. in Germany, and the New
Japan Chemical Company in Japan. In at least one procedure (38), an unsaturated fatty acid reacts in a continuous process over a fixed catalyst bed at
Kirk-Othmer Encyclopedia of Chemical Technology (4th Edition)
448
SURVEY AND NATURAL ALCOHOLS MANUFACTURE
Voll
270—290°C and 19,600 kPa (2800 psi). The catalyst is a complex aluminum—cadmium—chromium oxide that has high activity and exceptionally long life.
The process is claimed to give a conversion of ester to alcohol of about 99% retaining essentially all of the original double bonds.
Uses of Detergent Range Alcohols
The detergent range alcohols and their derivatives have a wide variety of uses in consumer and industrial products either because of surface-active
properties, or as a means of introducing a long chain moiety into a chemical compound. The major use is as surfactants (qv) in detergents and cleaning
products. Only a small amount of the alcohol is used as-is; rather most is used as derivatives such as the poly(oxyethylene) ethers and the sulfated ethers,
the alkyl sulfates, and the esters of other acids, eg, phosphoric acid and monocarboxylic and dicarboxylic acids. Major use areas are given in Table 11.
Table 11. Uses of Detergent Range Alcohols
Industry Use as alcohol Use as derivative
detergent emollient, foam control, opacifier, softener surfactant, softener
petroleum and lubrication drilling mud emulsifier, lubricant, dispersant, viscosity index improver, oil field chemical, pour-point depressant, drag reducing agent
agriculture evaporation suppressant pesticide, emulsifier, soil conditioner
plastics mold release agent, antifoam, emulsion polymerization agent, lubricant plasticizer, emulsion polymerization surfactant, lubricant dispersant, antioxidant, stabilizer, uv absorber
textile lubricant, foam control, anti-static agent, ink ingredient emulsifier, finish, softener, lubricant, scouring agent
cosmetics softener, emollient emulsifier, biocide, hair conditioner, emollient
pulp andpaper food foam control deresination agent, de-inking agent emulsifier, antioxidant, disinfectant
rubber plasticizer, dispersant plasticizer
paint and coatings foam control emulsifier
metal working lubricant, rolling oil degreaser, lubricant
mineral processing flotation agent surfactant
Surfactants. The detergent range alcohols can be used as building blocks for all of the surfactant types: anionics, cationics, nonionics, and
zwitterionics. These alcohols are used for their emulsifying, dispersing, wetting, and cleaning properties and most surfactants (qv) made from them are
readily biodegradable. Formulation of nonphosphate heavy duty liquid laundry detergents was made possible by use of these materials as the primary
surfactant. The alkyl sulfates derived from C12 through C15 alcohols are widely used in consumer products such as shampoos, toothpastes, hand
dishwashing detergents, and light duty household cleaners. Sodium dodecyl sulfate [151 -21 -3] is the optimum material for many cleaning compounds
because of cleaning ability, mildness, and foaming capability. The alkyl sulfates of C1(5 and C18 alcohols are used in powder laundry detergents and other
heavy-duty cleaners. Minor amounts of unsulfated alcohol left in the alkyl sulfate detergents serve as foam stabilizers. Surfactants made from
polyethoxylated alcohols are in wider use than the alkyl sulfates. They tend to be less irritating to the skin than the alkyl sulfates and perform better in liquid
systems such as hand dishwashing detergents and liquid laundry detergents. The ethoxylated materials may be used underivatized as nonionic surfactants.
Alternatively, they may be sulfated and then neutralized using a base such as sodium or ammonium hydroxide to give ethoxysulfate anionic surfactants, the
largest usage category of detergent range alcohols. Although the amount of ethylene oxide [75-21 -8]> C2H4O, can range from 1 to about 45 moles per mole
of alcohol, the degree of ethoxylation of the anionic surfactants is typically 6 to 12, whereas that of the ethoxysulfates typically ranges from 3 to 12.
Additionally, ethoxylation yields a broad range of species: for instance, a nominal 3-mole ethoxylate has some alcohol molecules containing up to 14 units
of ethylene oxide, yet it also includes about 15% unreacted alcohol, giving the effect of a mixed surfactant system. Varying the number of parent alcohol
carbons, the amount of ethylene oxide used, and to some extent the breadth of the ethylene oxide distribution, gives wide latitude in the
hydrophile—lipophile balance (HLB) of the resulting surfactant, which maybe used as a nonionic surfactant or sulfated to give an anionic one. This
versatility accounts for the broad use of ethoxylates in consumer cleaning products and in industrial appEcations as wetting agents, cleaning products,
dispersing agents, and emulsifiers.
Alkyl glyceryl ether sulfonates are very mild, high foaming surfactants used in bar soaps and shampoos; they are made from the sulfonated alkyl
chlorohydrin ether of detergent range alcohols. Alkyldimethyl amines are made from alcohols and then oxidized to give the amine oxide which is used as a
mild surfactant in hand dishwashing products, shampoos, and some cosmetic applications. Some specialty cationic quaternary nitrogen surfactants are also
made from the alcohols. Specialty phosphate ester surfactants are made from detergent range alcohols and ethoxylated alcohols; these find use mainly as
lubricants and wetting agents in the textile industry.
In other surfactant uses, dodecanol—tetradecanol is employed to prepare porous concrete (39), stearyl alcohol is used to make a polymer concrete
(40), and lauryl alcohol is utilized for froth flotation of ores (41). A foamed composition of hexadecanol is used for textile printing (42) and a foamed
composition of octadecanol is used for coating polymers (43). On the other hand, foam is controlled by detergent range alcohols in applications: by lauryl
alcohol in steel cleaning (44), by octadecanol in a detergent composition (45), and by eicosanol—docosanol in various systems (46).
Cosmetics and Pharmaceuticals. The main use of hexadecanol (cetyl alcohol) is in cosmetics (qv) and pharmaceuticals (qv), where it and
octadecanol (stearyl alcohol) are used extensively as emollient additives and as bases for creams, lipsticks, ointments, and suppositories. Octadecenol (oleyl
alcohol) is also widely used (47), as are the nonlinear alcohols. The compatibility of heavy cut alcohols and other cosmetic materials or active drug agents,
their mildness, skin feel, and low toxicity have made them the preferred materials for these applications. Higher alcohols and their derivatives are used in
conditioning shampoos, in other personal care products, and in ingested materials such as vitamins (qv) and sustained release tablets (see Controlled
RELEASE TECHNOLOGY).
Lubricants and Petroleum. Methacrylate esters of detergent range alcohols find use as viscosity index improvers, pour-point depressants,
and dispersants (qv) in automobile engine lubricants. The free alcohol, particularly dodecanol (lauryl alcohol), is widely used in aluminum rolling, and also in
other metalworking (48). A composition of octadecenol and sodium lauryl sulfate is used for petroleum oil recovery (49). Esters of docosanol are used as
drag reducing agents for pipelining of crude petroleum oil, which reduces the power requirements for pumping.
Other Applications. Alkylbenzyldimethylammonium salts are made from alcohols in the C12—C1(5 range and find use as biocides and
disinfectants in a number of areas. Dodecanol, tetradecanol, octadecanol, and tridecyl alcohol esters of thiodipropionic acid are employed as part of the
antioxidant system of polyolefin plastics. Higher alcohols are used as antistatic agents (qv), mold release agents, and as additives in olefin polymerization
(50); other uses have been reviewed (51). Esters of detergent range alcohols and fatty acids, lactic acid, and maleic acid are used for cosmetics and
lubricants. Phosphites and phosphates of detergent range alcohols are also articles of commerce. Triacontanol (C32) has activity as a plant growth regulator,
but results have not been consistent enough for commercial use (52). Hexadecanol and octadecanol can be used to retard evaporation of water from
reservoirs in arid regions (53). Detergent range alcohols also find application in antifoulant coatings, adhesives, and fabric softeners (54).
Uses of Plasticizer Range Alcohols
The plasticizer range alcohols are utilized primarily in plasticizers, but they also have a wide range of uses in other industrial and consumer products, as
Kirk-Othmer Encyclopedia of Chemical Technology (4th Edition)
449
SURVEY AND NATURAL ALCOHOLS MANUFACTURE
Voll
shown in Table 12. As in the case of the detergent range alcohols, the plasticizer range materials are little used as is, but rather are employed as the ester
derivatives of acids such as phthalic, adipic, and trimellitic.
Table 12. Uses of Plasticizer Range Alcohols
Industry Use as alcohol Use as derivative
plastics emulsion polymerization plasticizer, flame retardant, oxidation and uv stabilizer, heat stabilizer, polymerization initiator
petroleum and lubrication defoamer lubricant, grease, lubricant additive, hydrauEc fluid, diesel fuel additive
agriculture stabilizer, tobacco sucker control, herbicide, fungicide surfactant, insecticide, herbicide
mineral processing solvent, extractant, antifoam extractant, surfactant
textile leveling agent, defoamer surfactant
coatings solvent, smoothing agent surfactant, drying agent, solvent
metal working solvent, lubricant, protective coating lubricant, surfactant
chemical processing antifoam, solvent solvent
food cosmetics perfume ingredient flavoring agent
Plasticizers. Over 70% of plasticizer range alcohols are ultimately consumed as plasticizers for PVC and other resins. Of this amount, 80% is
used as the diester of phthalic acid, for instance di-2-ethylhexyl phthalate (DOP) or diisodecyl phthalate (DIDP) [26761-40-0]. Other plasticizers made
from these alcohols are the diesters of adipic acid, azeleic acid, and sebacic acid, plus the triesters of phosphoric acid and trimellitic acid. A small amount of
alcohol is used as the terminating agent in specialty polyester plasticizers. The adipates, azelates, and sebacates are employed as specialty materials in some
food contact appEcations and in areas where low temperature flexibiEty is important, such as automobile interiors; eg, the diadipate ester of hexanol is the
plasticizer in poly(vinyl butyral) used for automobile safety glass. The phosphates find appEcation as good low temperature plasticizers and as flame
retardant additives, whereas the trimelEtates are used for high temperature appEcations such as the insulation of electrical wiring. The phthalates, however,
are the general purpose plasticizers. Phthalate esters of alcohols from 4—13 carbons are available although most are in the Cg through C10 range. AU
plasticizers are chosen on the basis of performance, cost, and ease of processing; DOP and DIDP are the workhorses of the industry. When compared to
DOP, phthalates of mixed linear alcohols (for instance, mixed heptyl, nonyl, and undecyl alcohols) give improved low temperature properties and
resistance to volatile loss whereas those made of higher molecular weight alcohols (for instance, isodecyl or tridecyl alcohols) give improved resistance to
extraction and volatile loss but exhibit some loss of plasticizing abiEty. In general, esters of mixtures of alcohols are favored as plasticizers because they give
a broader range of properties than esters of a single alcohol.
Other Plastics Uses. The plasticizer range alcohols have a number of other uses in plastics: hexanol and 2-ethylhexanol are used as part of the
catalyst system in the polymerization of acrylates, ethylene, and propylene (55); the peroxydicarbonate of 2-ethylhexanol is utilized as a polymerization
initiator for vinyl chloride; various trialkyl phosphites find usage as heat and light stabilizers for plastics; organotin derivatives are used as heat stabilizers for
PVC; octanol improves the compatibiEty of calcium carbonate filler in various plastics; 2-ethylhexanol is used to make expanded polystyrene beads (56);
and acrylate esters serve as pressure sensitive adhesives.
Lubricants, Fuels, and Petroleum. The adipate and azelate diesters of C6 through Си alcohols, as weE as those of tridecyl alcohol, are
used as synthetic lubricants, hydrauEc fluids, and brake fluids. Phosphate esters are utilized as industrial and aviation functional fluids and to a small extent
as additives in other lubricants. A number of alcohols, particularly the Cg materials, are employed to produce zinc dialkyldithiophosphates as lubricant
antiwear additives. A small amount is used to make viscosity index improvers for lubricating oils. 2-Ethylhexyl nitrate [24247-96-7] serves as a cetane
improver for diesel fuels and hexanol is used as an additive to fuel oil or other fuels (57). Various enhanced oil recovery processes utilize formulations
containing hexanol or heptanol to displace oil from underground reservohs (58); the alcohols and derivatives are also used as defoamers in oil production.
Agricultural Chemicals. Plasticizer range alcohols are used as intermediates in the manufacture of a number of herbicides (qv) and
insecticides, the largest use being that of 2-ethylhexanol and isooctyl alcohol to make the octyl ester of 2,4-dichlorophenoxyacetic acid (2,4-D) [94-75-7] for
control of broadleaf weeds. Surfactants made from these alcohols are used as emulsifiers and wetting agents for agricultural chemicals. A mixture of
octanol and decanol and the proper surfactants is able to kill the young meristemic tissue of some plants without harming more mature tissue. This is the
basis for formulations that kill unwanted buds (suckers) in tobacco (59) and other plants and serve as a selective herbicide. Both decanol and
4-methyl-2-pentanol can be used as fungicides (qv) (60).
Surfactants. A number of surfactants are made from the plasticizer range alcohols, employing processes similar to those for the detergent range
materials such as sulfation, ethoxylation, and amination. These surfactants find appEcation primarily in industrial and commercial areas: ether amines and
trialkyl amines are used in froth flotation of ores, and the alcohols are also used to dewater mineral concentrates or break emulsions (61). The dialkyl
sulfosuccinates of many of the Cg through C13 alcohols also have surfactant appEcations. Octanol has found an appEcation in a cleaning composition for
engine carburetors, and decanol in a detergent for cleaning cotton (62).
Other Applications. The alcohols through Cg have appEcations as specialty solvents, as do derivatives of linear and branched hexanols. Inks,
coatings, and dyes for polyester fabrics are other appEcation areas for 2-ethylhexanol (63). Di(2-ethylhexyl) phthalate is used as a dielectric fluid to replace
polychlorinated biphenyls. Trialkyl amines of the linear alcohols are used in solder fluxes, and hexanol is employed as a solvent in a soldering flux (64).
Quaternary ammonium compounds of the plasticizer range alcohols are used as surfactants and fungicides, similarly to those of the detergent range
alcohols.
BIBLIOGRAPHY
"Alcohols, Higher" in ECT 1st ed., Vol. 1, pp. 315—321, by H. B. McClure, Carbide and Carbon Chemicals Corporation, Unit of Union Carbide and
Carbon Corporation; "Alcohols, Higher, Fatty" in ECT, 2nd ed., Vol. 1, pp. 542—559, by K. R. Ericson and H. D. Van Wagenen, The Procter & Gamble
Company; "Alcohols, Higher, Synthetic" in ECT, 2nd ed., Vol. 1, pp. 560—569, by R. W. Miller, Eastman Chemical Products, Inc. "Alcohols, Higher
AEphatic, Survey and Natural Alcohols Manufacture" in ECT 3rd ed., Vol. 1, pp. 716—739, by R. A. Peters, Procter & Gamble Company.
1. Braz. Pat. Pedido 86 2469A (Jan. 27,1987), S. Inada and co-workers (to Seitetsu Kagaku Co., Ltd., Shinko Seito Co., Ltd., and Shinko Sugar
Production Co., Ltd.); Chem. Abstr 107, 236087n (1987).
2. R. G. Ackman, S. N. Hooper, S. Epstein, and M. Kelleher,/Am. OilChem. Soc. 49, 378—382 (1972).
3. J. Sever and P. L. Parker, Science 164, 1052—1054 (1969).
4. T. K. Miwa,/ Am. Oil Chem. Soc. 48, 259 (1971); A. P. Tulloch J. Am. Oil Chem. Soc. 50, 367-371 (1973).
5. R. C. Wilhoit and B. J. Zwolinski,/. Phys. Chem. Eef. Data 2 (1) (1973).
6. U.S. Pat. 4,097,535 (June 27, 1978), K. Yang, K. L. Motz, and J. D. Reedy (to Continental Oil Co.).
7. D. Landini, F. Montanari, and F. RoUa, Synthesis 2, 134—136 (1979).
8. Eur. Pat. Appl. EP 281,417 (Sept. 14,1988), P. Y. Fong, K. R. Smith, and J. D. Sauer (to Ethyl Corp.).
9. U.S. Pat. 4,683,336 (July 28, 1987), C. W. Blackhurst (to Sherex Chemical Co.).
10. Storage and Handling ojShellNeodolDetergent Alcohols, Ethoxylates, andEthoxysuljates, SC: 133—179, Shell Chemical Company, Houston, Tex., 1979.
Kirk-Othmer Encyclopedia of Chemical Technology (4th Edition)
450
SURVEY AND NATURAL ALCOHOLS MANUFACTURE
Voll
11. T. Gibson, CEH Marketing Research Report: Plasticiser Alcohols, SRI International, Menlo Park, Calif, 1989.
12. Data from U.S. International Trade Commission.
13. J. A. Monick, Alcohols, Their Chemistry, Properties and Manufacture, Reinhold Book Corp., New York, 1968, pp. 519—579.
14. R. E. Obom and A. H. Ullman,/. Am. OilChem. Soc. 63, 95—97 (1986).
15. Products from the Chemicals Division, Procter & Gamble Company, Cincinnati, Ohio, 1987; Adol Tatty Alcohols, Sherex Chemical Company, Dublin,
Ohio, 1986; Vista Sufactants, Industrial Chemicals, andPlastics, Vista Chemical Company, Houston, Texas, 1987; Epal Einear Primary Alcohols, Ethyl
Corporation, Baton Rouge, Louisiana, 1985; Neodol, Shell Chemical Company, Houston, Texas, 1987; HenkelFat Raw Materials, Henkel K.-G.a.A.,
Dusseldorf, Fed. Rep. Germany.
16. The United States Pharmacopeia, 21st rev. The NationalFormulary, 16th ed., United States Pharmacopeia! Convention, Rockville, Md., 1984; Food
Chemicals Codex, 3rd ed., National Academy Press, Washington, D.C., 1981.
17. Exxal GuerbetAlcohols, Exxon Corporation, Houston, Texas, 1988.
18. Vista Sufactants, Industrial Chemicals, andPlastics, Vista Chemical Company, Houston, Texas, 1987; Epal Einear Primary Alcohols, Ethyl Corporation,
Baton Rouge, Louisiana, 1985; ExxalAlcohols, Exxon Chemical Company, Houston, Texas, \T№r,Aristech Alcohols, 2-Ethlyhexanol, Aristech
Chemical Corporation, Pittsburgh, Pa., 1988; TechnicalRulletin, 2-Ethylhexanol, BASF Corporation, Parsippany, N.J., 1987.
19. D. L. J. Opdyke, ed., Monographs on Fragrance Raw Materials, Pergamon Press, Oxford, 1974, pp. 8, 35, 39, 42.
20. R. A. Scala and E. G. Burtis, J. Am. Ind. Hyg. Assn. 34, 493—499 (1973).
21. Epal Einear Primary Alcohols, Ethyl Corporation, Baton Rouge, Louisiana, 1985.
22. V. K. Rowe and S. B. McCollister in G. D. Clayton and F. E. Clayton, eds., Patty's Industrial Hygiene andToxicology, Vol. 2C, 3rd ed., John Wiley
& Sons, Inc., New York, 1982, pp. 4257—4708.
23. MSDS for Alfol Alcohols, Vista Chemical Company, Houston, Texas, 1984, 1985.
24. J. Am. Coll. Toxicol. 7, 359-423 (1988).
25. H. W. Gerarde and D. B. Ahlstrom,^4/rA Environ. Health 13, 457—461 (1966).
26. U.S. Pat. 2,091,800 (Aug. 31, 1937), H. Adkins, K. Folkers, and R. Connor (to Rohm & Haas Co.).
27. Ger. Offen. 3,624,812 (Jan. 28, 1988), F.-J. Carduck, J. Falbe, T. Fleckenstein, and J. Pohl (to Henkel K.-G.a.A.).
28. U.S. Pat. 4,608,202 (Aug. 26, 1986), H. Lepper and L. Friesenhagen (to Henkel K.-G.a.A.).
29. F. E. Sullivan, Chem. Eng. New York 81, 56 (April 15, 1974).
30. U.S. Pat. 4,533,648 (Aug. 6, 1985), P. J. Corrigan, R. M. King, and S. A. Van Diest (to The Procter & Gamble Co.).
31. U. R. Kreutzer, J. Am. Oil Chem. Soc. 61, 343—348 (1984).
32. H. Buchold, Chem. Eng. New York 90, 42, 43 (1983).
33. U.S. Pat. 4,259,536 (Mar. 31, 1981), T. Voeste, H. J. Schmidt, and F. Marschner (to Metallgesellschaft A.-G.).
34. H. Bertsch, H. Reinheckel, and K. Haage, Fette Seifen Anstrichm. 66, 763—773 (1964); E. S. Lower, Spec. Chem. 2(1), 30 (1982).
35. U.S. Pat. 3,193,586 (July 6, 1965), W. Rittmeister (to Dehydag, Deutsche Hydrierwerke); J. D. Richter and P. J. Van Den Berg,/ Am. Oil Chem.
Soc., 46, 158-162,163-166 (1969).
36. Brit. Pat. 1,076,855 (July 26, 1967), A. J. Pantulu, К. T. Achaya, G. S. Sidhu, and S. H. Laheer (to Council of Scientific and Industrial Research,
India); Jpn. Kokai 58 210,035 (Dec. 7, 1983) (to Kao Corp.); Ger. Pat. 2,513,377 (Sept. 9, 1976), G. Demmering (to Henkel & Cie.).
37. U.S. Pat. 3,729,520 (Apr. 24, 1973), H. Rutzen and W. Rittmeister (to Henkel & Cie.).
38. Brit. Pat. 1,335,173 (Oct. 24, 1973) (to New Japan Chemical Co.).
39. Eur. Pat. Appl. 296,941 (D ec. 28,1988), G. Dion Biro and R. De Bona Biro; Ger. Offen. 3,807,250 (Sep. 15,1988), J. Sulkiewicz (to Anthes
Industries, Inc.).
40. Jpn. Kokai 63 176,345 (July 20, 1988), C. Tomizawa and S. Narisawa (to Sumitomo Chemical Co.).
41. Ger. Offen. 3,517,154 (Nov. 13, 1986), W. Von Rybinski and R. Koester (to Henkel K.-G.a.A.).
42. Ger. Offen. 3,535,454 (Apr. 9, 1987), W. Braeuer and P. Diewald (to Bayer A.-G.).
43. Jpn. Kokai 53 101,061 (Sep. 4, 1978), E. Sugawara, S. Shioume, and K. Yorikane (to Dainichi Nippon Cables, Ltd.).
44. Jpn. Kokai 58 221,300 (Dec. 22,1983) (to Nippon Kokan K.K. and Kao Corp.).
45. Eur. Pat. Appl. 210,721 (Feb. 4, 1987), P. M. Burrill (to Dow Corning Corp.).
46. Ger. Offen. 3,001,387 (July 23, 1981), R. Peppmoeller (to Chemische Fabrik Stockhausen und Cie.).
47. U. Ploog, Seife. Oele. Fette. Wachse, 109, 225-229 (1983).
48. Eur. Pat. Appl. 182,552 (May 28, 1986), M. K. Budd and M. H. Foster (to Alcan International Ltd.); Jpn. Kokai 63 393 (Jan. 5, 1988), K.
Nabatake, M. Ogawa, Y. Iwasaki, and T. Mizuta (to Nippon Steel Corp, and Daido Chemical Industry Co., Ltd.); N. P. Korotkova, I. G.
Turyanchik, G. I. Cherednichenko, and V. P. Temnenko, Neftepererab. Neftekhim. (Kiev), 34, 16—18 (1988); Chem. Abstr. 110, 98392s (1989).
49. U.S. Pat. 4,213,500 (July 22, 1980), R. L. Cardenas and J. T. Carlin (to Texaco, Inc.).
50. Jpn. Kokai 59 217,782 (Dec. 7, 1984) (to Lion Corp.); U.S. Pat. 4,239,862 (Dec. 16, 1980), D. N. Matthews, W. Nudenberg, and H. A. Petersen
(to Uniroyal, Inc.); Jpn. Kokai 61138,606 (June 26,1986), T. Tsutsui, M. Kioka, andN. Kashiwa (to Mitsui Petrochemical Industries, Ltd.).
51. E. S. Lower, Polym. Paint Colour J. 173, 506 (1983).
52. S. K. Ries, CRC Crit. Rev. Plant Sci. 2, 239—285 (1985); S. K. Ries and R. Houtz, HortScience 18, 654—662 (1983).
53. U.S. Pat. 3,415,614 (Dec. 10, 1968), R. R. Egan and S. R. Sheeran (to Ashland Oil and Refining Co.).
54. Jpn. Kokai 62 13,471 (Jan. 22, 1987), Y. Yonehara and Y. Nanishi (to Kansai Paint Co., Ltd.); Jpn. Kokai 58 101,182 (June 16, 1983) (to Toshiba
Silicone Co., Ltd.); Belg. Pat. 904,142 (July 30, 1986), J. P. Grandmaire and A. Jacques (to Colgate-Palmolive Co.).
55. Eur. Pat. Appl. 190,892 (Aug. 13,1986), C. J. Chang (to Rhom and Haas Co.); Jpn. Kokai 62 135,501 (June 18,1987), Y. Kondo, M. Mori, Y.
Naito, and T. Chigusa (to Toyo Soda Mfg. Co., Ltd.); Jpn. Kokai 63 89,507 (Apr. 20, 1988), M. Terano, H. Soga, and M. Inoue (to Toho
Titanium Co., Ltd.).
56. Jpn. Kokai 58 122,935 (July 21,1983) (to Sekisui Kaseihin Kogyo К. K. and Eslen Kako К. K.); Fr. Demande 2,531,971 (Feb. 24, 1984), H. P.
Schlumpf, C. Stock, and P. Trouve (to Pluess-Staufer A.-G.).
57. Ger. Offen. 2,910,011 (Sep. 20, 1979), M. J. Rose; Ger. Offen. 3,626,102 (Feb. 11, 1988), M. L. Nelson and O. L. Nelson, Jr. (to Polar Molecular
Corp.).
58. U.S. Pat. 4,485,871 (Dec. 4,1984), B. W. Davis (to Chevron Research Co.); Brit. Pat. 1,542,166 (Mar. 14,1979), Y.-C. Chiu (to Shell
Internationale Research Maatschappij B.V.); U.S. Pat. 4,193,452 (Mar. 18, 1980), P. M. Wilson and J. Pao (to Mobil Oil Corp.).
59. Off-Shoot-T, Cochrane Corporation, Memphis, Tenn., 1984.
60. U.S. Pat. 3,778,509 (Dec. 11,1973), H. L. Lewis (to Cotton, Inc.); Ger. Offen. 2,330,596 (Jan. 10,1974), E. L. Frick and R. T. Burchill (to
National Research Development Corp.).
61. Ger. Offen. 3,018,758 (Dec. 17, 1981), R. Peppmoeller (to Chemische Fabrik Stockhausen und Cie.); U.S. Pat. 4,206,063 (June 3, 1980), C.
Dugan, M. E. Lewellyn, and S. S. Wang (to American Cyanamid Co.).
62. Jpn. Kokai 60 155,299 (Aug. 15, 1985), H. Murata and R. Hidaka (to Nitto Chemical Industry Co., Ltd.); U.S. Pat. 4,056,355 (Nov. 1, 1977), J. H.
Kolaian, F. C. McCoy, and J. A. Patterson (to Texaco, Inc.).
63. U.S. Pat. 4,711,802 (Dec. 8, 1986), H. P. Tannenbaum (to E. I. du Pont de Nemours & Co., Inc.); Ger. Offen. 3,508,419 (Sep. 11, 1986), G.
Neubert, M. Melan, and W. Schultze (to BASF A.-G.); Ger. Offen. 2,413,866 (Oct. 2, 1975), M. Vescia, M. Daeuble, and R. Widder (to BASF
A.-G.).
Kirk-Othmer Encyclopedia of Chemical Technology (4th Edition)
451
SURVEY AND NATURAL ALCOHOLS MANUFACTURE
Voll
64. Ger. Offen. 3,513,424 (Oct. 23,1986), W. Kellberg (to Siemens A.-G.).
General References
Tatty Alcohols, Taw Materials, Methods, Uses, Henkel K.-G.a.A., Dusseldorf, 1982. Also published in German as F'ettalkohole.
J. A. Monick, Alcohols, Their Chemistry, Properties and Manufacture, Reinhold Book Corp., New York, 1968.
E. J. Wickson, ed., Monohydric Alcohols, ACS Symp. Ser 159, American Chemical Society, Washington, D.C., 1981.
Richard A. Peters
The Procter & Gamble Company
Kirk-Othmer Encyclopedia of Chemical Technology (4th Edition)
452
SYNTHETIC PROCESSES
Voll
SYNTHETIC PROCESSES
Higher aliphatic alcohols (C^—C18) are produced in. a number of important industrial processes using petroleum-based raw materials. These processes are
summarized in Table 1, as are the principal synthetic products and most important feedstocks (qv). Worldwide capacity for all higher alcohols was
approximately 5.3 million metric tons per annum in early 1990, 90% of which was petroleum-derived. Table 2 lists the major higher aEphatic alcohol
producers in the world in early 1990.
Table 1. Synthetic Industrial Processes for Higher Aliphatic Alcohols
Process Feedstock(s) Principal products Worldwide capacity, millions of tons
Ziegler (organoaluminum) ethylene, triethylaluminum primary C^—C18 linear alcohols 0.3
oxo (hydroformylation) olefins based on ethylene, propylene, primary alcohols 4.2
butylene, or paraffins
aldol ^-butyraldehyde 2-ethylhexanol a
paraffin oxidation paraffin hydrocarbons secondary alcohols 0.2
Guerbet lower primary alcohols branched primary alcohols b
Total 4.7
a Included in oxo process total.
Less than 0.05.
Table 2. Major C6 and Higher Aliphatic Alcohol Producers*
Company and location Capacity 103 t/yr Alcohol products Feedstock
Ziegler process
Condea Chemie, Brunsbuettel, Germany 70 ®“C6,C8,C10,C12,C14,C16,C18,C20 ethylene
Ethyl Corp, Houston, Tex., U.S. 111 ®“C6,C8,C10,C12,C14,C16,C18,C20 ethylene
State, Ufa, USSR 48 ®“C6>C8,C10,C12,C14,C16,C18,C20 ethylene
Vista Chemical, Lake Charles, La., U.S. 100 ^C6,C8,C10,C12,C14,C16,C18,C20 ethylene
Ziegler subtotal 329 Guerbetprocess
Henkel, Duesseldorf, Germany 2 linear alcohols
Guerbet subtotal 2 Caustic fusion process
Witco Chemical, Dover, Ohio, U.S. 7 2-octanol castor oil
Causticfusion subtotal 7 Tatty acid hydrogenation processes
ATOCHEM SA, Lavera, France 7 n-(f castor oil
Cocochem, Batangas, Philippines 25 я-С8,С10,С12,С14,С16 coconut oil
Colgate, Barangay, Philippines 4 я-С8,С10,С12,С14,С16 coconut oil
Oleofabrik, Aarhus, Denmark 5 ®“C16’C18 palm oil, tallow
State, Kedzierzyn, Poland 10 я-С8,С10,С12,С14,С16 coconut oil
Tatty acid hydrogenation process 51 Methyl ester hydrogenation process
ATUL, India 3 я-С8,С10,С12,С14,С16 coconut oil
Aegis, Jalagon, India 5 я-С8,С10,С12,С14,С16 coconut oil
Condea Chemie, Brunsbuettel, Germany 30 я-С8,С10,С12,С14,С16 coconut oil
Henkel, Duesseldorf, Germany 130 я-С8,С10,С12,С14,С16С18 coconut oil, tallow
Henkel, Boussens, France 50 я-С8,С10,С12,С14,С16,С18,С20,С22 coconut oil, other fats
Hbls AG, Mad, Germany 10 я-С8,С10,С12,С14,С16 coconut oil
Kao Corp, Wakayama, Japan 15 я-С8,С10,С12,С14,С16 coconut oil
Marchon (Albright & Wilson), Whitehaven, UK 25 я-С8,С10,С12,С14,С16 coconut oil
New Japan Chemical, Tokushima, Japan 15 я-С8,С10,С12,С14,С16 coconut oil
Philippinas Kao, Jasaan, Philippines 30 я-С8,С10,С12,С14,С16 coconut oil
Procter & Gamble, Kansas City, Kan., U.S. 45 я-С8,С10,С12,С14,С16,С18 coconut oil, tallow
Procter & Gamble, Sacramento, Calif., U.S. 54 я-С8,С10,С12,С14,С16,С18 coconut oil, palm oil
Sherex, Mapleton, Hl., U.S. 7 oleyl alcohol, #-С18 tallow, soybean oil
Sinopec, Shanghai, China 15 я-С8,С10,С12,С14,С16 coconut oil
State, Radleben, Germany 10 я-С8,С10,С12,С14,С16 coconut oil
Kirk-Othmer Encyclopedia of Chemical Technology (4th Edition)
453
SYNTHETIC PROCESSES
Voll
Synfina-Oleofina, Ertvelde, Belgium 30 n-C c c c c coconut oil
Methyl ester hydrogenation process subtotal 474 Oxidation processes
Japan Catalytic Chemical, Kawasaki, Japan 12 sec-G11,C12,C13,C14,C15 ^-paraffins
State, Angarsk, USSR 45 ^“С1оА11>С12,С13,С14,С15,С16,С17,С18 ^-paraffins
State, Ufa, USSR 90 j^-C11,C12,C13,C14,C15,C1($ ^-paraffins
State, Volgodonsk, USSR 45 я“АоАц>С12,С13,С14,С15,С16,С17,С1 ^-paraffins
Oxidation subtotal 192
Oxo process
Enichem, Augusta, Italy 50 n-Gj to C15 ^-paraffins
Exxon Chemical France, Hames, France 125 /-C8,C9,C10;»-C9,C11,C13,C15 polygas olefins, alpha olefins
Exxon Chemical Holland, 200 /-c8,c9,c10,c13,c16 polygas olefins
Rozenburg-Europort, Netherlands Exxon Chemical, Baton Rouge, La., U.S. 295 ^-Cg to C10,C12,C13,C16, n-G-pG^G-yy polygas olefins, alpha olefins, butene
Hoechst, Oberhausen-Holten, Germany 40 ^“AoA13 propylene
ICI, Teeside, United Kingdom 250 /-C8,C9,Cw,/?-C9 to c^3 polygas olefins, alpha olefins
India Nissan Chemical Ind., Baroda, India 13 Z-CyjCgjCgjCjjjjCjj polygas olefins
Mitsubishi Kasei, Mizushima, Japan 25 Z-C9 butenes
Mitsubishi Kasei, Mizushima, Japan 30 »-C7,C9,C11;C13,C15 ethylene
Mitsubishi Petrochemical, Yokkaichi, Japan 30 »-c12,c13,c14,c15 ^-paraffins
Nippon Oxocol, Ichihara, Japan 85 /-Cy,C2,C^o>C^3 polygas olefins
Shell Chemical, Stanlow, UK 90 /?-C1o,C11,C12,C13,C14,C15 ethylene
Shell Chemical, Geismar, La., U.S. 272 я-С?,С8,С9,С10,С11,С12,С13,С14,С15 ethylene
Sterling, Texas City, Tex., U.S. 102 »-C7,C9,C11;C13 alpha olefins
Unipar, Sao Paulo, Brazil 20 ^“Ао’Аз propylene
Oxo process subtotal 1627 Oxo] aldolprocesses
Aristech, Pasadena, Tex., U.S. 86 2-ethylhexanol propylene
BASF, Ludwigshafen, Germany 100 z-C2,/?-C2,C^^,C^3,C^5 butenes, polygas olefins, alpha olefins
BASF, Ludwigshafen, Germany 150 2-ethylhexanol propylene
BASF, Freeport, Tex., U.S. 30 2-ethylhexanol propylene
BASF Espanol SA, Tarragona, Spain 30 2-ethylhexanol propylene
Celanese Mexicana, Celaya, Mexico 70 2-ethylhexanol acetaldehyde
Chemicke Zavodi, Litwinov, Czechoslovakia 30 2-ethylhexanol propylene
Chisso, Goi, Japan 50 2-ethylhexanol propylene
Ciquine, Camacari, Brazil 74 2-ethylhexanol propylene
Elekieroz do Nordeste, Igarassue, Brazil0 15 2-ethylhexanol acetaldehyde
Hoechst, Oberhausen-Holten, Germany 200 2-ethylhexanol propylene
Hbs AG, Mad, Germany 200 2-ethylhexanol propylene
Jilin, Jilin, China 50 2-ethylhexanol propylene
KU, Koper, Yugoslavia 42 2-ethylhexanol propylene
Kyowa Yuka, Yokkaichi, Japan 100 2-ethylhexanol propylene
Lucky, Naju, Korea 120 2-ethylhexanol propylene
Mitsubishi Kasei, Mizushima, Japan 146 2-ethylhexanol propylene
National Organic, Bombay, India 8 2-ethylhexanol propylene
Neste Oxo, Omskoldsvik, Sweden 10 2-ethylhexanol ^-butyraldehyde
Neste Oxo, Stennungsund, Sweden 126 2-ethylhexanol propylene
Shell Chemical, Deer Park, Tex., U.S. 27 2-ethylhexanol propylene
Sinopec, Daqing, China 50 2-ethylhexanol propylene
Sinopec, Yan Shan, China 20 2-ethylhexanol propylene
Sinopec, Yueyangshibequ, China 10 2-ethylhexanol propylene
Sinopec, Zibo, China 50 2-ethylhexanol propylene
Societe Oxo-Chemie, Lavera, France 105 2-ethylhexanol propylene
State, Burgas, Bulgaria 20 2-ethylhexanol propylene
State, Beijing, China 10 2-ethylhexanol propylene
State, Leuna, Germany 40 2-ethylhexanol propylene
State, Schkopau, Germany 40 2-ethylhexanol propylene
State, Rimnicu Vilcea, Romania 20 2-ethylhexanol propylene
State, Timisoara, Romania 60 2-ethylhexanol propylene
State, Angarsk, USSR 45 2-ethylhexanol propylene
State, Omsk, USSR 45 2-ethylhexanol propylene
State, Perm, USSR 90 2-ethylhexanol propylene
State, Saluwat, USSR 45 2-ethylhexanol propylene
Texas Eastman, Longview, Tex., U.S. 98 2-ethylhexanol propylene
Tonen, Kawasaki, Japan 50 2-ethylhexanol propylene
Union Carbide Corp., Texas City, Tex., U.S. 54 2-ethylhexanol propylene
Zaklady Azotowe, Kedzierzyn, Poland 100 2-ethylhexanol propylene
Oxo] aldol subtotal 2616
Total world 5298
a Data from Refs. 1—6.
Oxo/dimersol process.
C Aldol process.
By far the largest volume synthetic alcohol is 2-ethylexanol [104-76-7]\ CgH18O, used mainly in production of the poly(vinyl chloride) plasticizer
bis(2-ethylhexyl) phthalate [117-81-7]C24H3gO4, commonly called dioctyl phthalate [117-81-7] or DOF (see Plasticizers). A number of other plasticizer
Kirk-Othmer Encyclopedia of Chemical Technology (4th Edition)
454
SYNTHETIC PROCESSES
Voll
primary alcohols in. the С^—Си range are produced, as are large volumes of C1Q—C18 synthetic, mainly primary, alcohols used as intermediates to surfactants
(qv) for detergents. Other lower volume synthetic alcohol appEcation areas include solvents and specialty esters.
The Ziegler Process
The Ziegler process, based on reactions discovered in the 1950s, produces predominandy linear, primary alcohols having an even number of carbon atoms.
The process was commercialized by Continental Oil Company in the United States in 1962, by Condea Petrochemie in West Germany (a joint venture of
Continental Oil Company and Deutsche Erdid, A.G.) in 1964, by Ethyl Corporation in the United States in 1965, and by the USSR in 1983.
Four chemical reactions are used to synthesize alcohols from aluminum alkyls and ethylene (qv).
Priethylaluminum Preparation
2 A1 + 3H2 +6 C2H4 2 (C2H5)3A1
Chain Growth
(C2H5)3A1 + Зя: C2H4 [C2H5(C2H4)J3A1
Oxidation
2 [C2H5(C2H4)J3A1 + 3O2 ^2А1[О(С2Н4)жС2Н5]3
Hydrolysis
2 Al[O(C2H4)rcC2H5]3 + 3H2O -^6 C2H5(C2H4)rcOH + A12O3
This process is currently used by Vista Chemical, successor to Continental Oil Company's chemical business, and by Condea. In the Ethyl Corporation
process dilute sulfuric acid is used in place of water in the hydrolysis step; producing alum rather than alumina.
Triethylaluminum Preparation. Triethylaluminum [97-93-8]> C6H15A1, can be prepared by a two-step or a one-step process. In the former,
aluminum [7429-90-5]\ Al, powder is added to recycled triethylaluminum and the slurry reacts first with hydrogen [1333-74-0]> H2, to produce
diethylaluminum hydride [871 -27-2]\ which in the second step reacts with ethylene [74-85-1C2H4, to produce triethylaluminum. In the one-step process,
hydrogen and ethylene are simultaneously fed to the reactor containing the aluminum slurry.
Chain Growth. Triethylaluminum reacts with ethylene in controlled, highly exothermic, successive addition reactions to produce a spectrum of
higher molecular weight alkyls of even carbon number. The distribution of chain lengths in the chain growth mixture corresponds closely to the Poisson
equation (7). Side reactions lead to small deviations from the Poisson distribution, greater deviations being observed at higher reaction temperatures. Some
control of the distribution is obtained by adjustment of triethylaluminum—ethylene ratio as shown in Figure 1. In the Ethyl process, steps are taken to
produce a longer chain fraction (predominandy C12~C18) that is sent to the oxidation step, and a shorter chain fraction (predominandy C2~C10) that is
recycled for additional chain growth. The final product distribution is about 15—25% C^—C10 and 75—85% C12~C18 (8). This approach permits changes in
the carbon number distribution of the alcohol product as best fit market demands. A comparison of typical commercial product distributions in the Ethyl
and Vista processes is shown in Figure 2.
Fig. 1. Ziegler ethylene chain growth. Theoretical (Poisson) distribution of primary alcohols at (““) 2.5, (- — -) 3.0, (_<0>“) 3.5, and (-A-) 4.0 moles of
ethylene per /3 mole aluminum. Courtesy of Ethyl Corporation.
Kirk-Othmer Encyclopedia of Chemical Technology (4th Edition)
455
SYNTHETIC PROCESSES
Voll
Fig. 2. Estimated primary alcohol distributions for () Ethyl Corporation-modified Ziegler and (+) Vista Corporation Ziegler, at 4.0 moles ethylene per
1/3 mole aluminum. Courtesy of Ethyl Corporation.
There are two important side reactions, particularly above 120°C: (7) aluminum alkyls decompose to form dialkylaluminum hydrides and alpha
olefins (the dialkylaluminum hydrides rapidly react with ethylene to regenerate a trialkylaluminum);
R2A1CH2CH2R' R2A1H + CH2=CHR'
and (2) alpha olefins can react with trialkylaluminum to produce branched aluminum alkyls and branched olefins.
R2AICH2CH2R + CH2 CHR r2aich2chch2ch2r r2aih + ch2 c ch2ch2r
R R
This second reaction leads to the small amount of branching (usually less than 5%) observed in the alcohol product. The alpha olefins produced by the first
reaction represent a loss unless recovered (8). Additionally, ethylene polymerization during chain growth creates significant fouling problems which must be
addressed in the design and operation of commercial production facilities (9).
Oxidation. Aluminum alkyls are oxidized to the corresponding alkoxides using dry air above atmospheric pressure in a fast, highly exothermic
reaction. In general, a solvent is used to help avoid localized overheating and to decrease the viscosity of the solution. By-products include paraffins,
aldehydes, ketones, olefins, esters, and alcohols; accidental introduction of moisture increases paraffin formation. To prevent contamination, solvent and
by-products must be removed before hydrolysis. Removal can be effected by high temperature vacuum flashing or by stripping.
Hydrolysis. Aluminum alkoxides are hydrolyzed using either water or sulfuric acid, usually at around 100°C. In addition to the alcohol product,
neutral hydrolysis gives high quality alumina (see Aluminum compounds); the sulfuric acid hydrolysis yields alum. The crude alcohols are washed and then
fractionated.
Mild steel is a satisfactory construction material for all equipment in Ziegler chemistry processes except for hydrolysis. If sulfuric acid hydrolysis is
employed, materials capable of withstanding sulfuric acid at 100°C are required: lead-lined steel, some alloys, and some plastics. Flow diagrams for the Vista
and Ethyl processes are shown in Figures 3 and 4, respectively.
Solvent —
[ Alumina plant ~~[
Oxidation |
Wet
crude
alcohol
Fig. 3. Flow diagram for the Vista Corporation primary alcohols plant, Lake Charles, Louisiana.
Courtesy of Vista Corporation.
Kirk-Othmer Encyclopedia of Chemical Technology (4th Edition)
456
SYNTHETIC PROCESSES
Voll
Fig. 4. Flow diagram for the Ethyl Corporation primary alcohols plant, Houston, Texas.
Courtesy opHtbyl Corporation.
Environmental Considerations. Environmental problems in Ziegler chemistry alcohol processes are not severe. A small quantity of
aluminum alkyl wastes is usually produced and represents the most significant disposal problem. It can be handled by controlled hydrolysis and separate
disposal of the aqueous and organic streams. Organic by-products produced in chain growth and hydrolysis can be cleanly burned. Wastewater streams
must be monitored for dissolved carbon, such as short-chain alcohols, and treated conventionally when necessary.
The Oxo Process
The oxo or hydroformylation reaction was discovered in Germany in 1938 (10) and was first used on a commercial scale by the Enjay Chemical Company
(now Exxon) in 1948. By 1990 the total world alcohol capacity based on this general technology was over four million metric tons per year (see Oxo
process).
The structures and, hence, the properties of the higher oxo alcohols (C^—C18) are a function of the oxo process and the olefin employed. All the oxo
products are primary alcohols and contain one more carbon atom than the feedstock olefin. They differ in two respects from natural alcohols and from
Ziegler products, both of which are linear and of even carbon number. First, depending on the feedstock, they contain either even and odd carbon
numbers or all odd carbon numbers. Second, the oxo products all have more branching. Branched olefin gives completely branched products; linear olefin
gives some 2-methyl branching, the extent of which is dependent on the process. From a conventional cobalt-catalyzed process, the typical product of a
linear olefin is 40—50% branched. Modified catalysts reduce branching to 15—25%.
Process Technology. In a typical oxo process, primary alcohols are produced from monoolefins in two steps. In the first stage, the olefin,
hydrogen, and carbon monoxide [630-08-0]\ react in the presence of a cobalt or rhodium catalyst to form aldehydes, which are hydrogenated in the second
step to the alcohols.
rch=ch2 + co + h2 catalyst ► RCH2CH2CHO + RCHCHO
CH3
RCH2CH2CHO + RCHCHO + h2 catalyst ► rch2ch2ch2oh + rchch2oh
СНз СНз
The oxo catalyst maybe modified to function as a hydrogenation catalyst as well and, using a 2:1 ratio of hydrogen to carbon monoxide, alcohols are
produced direcdy.
rch=ch2 + CO + 2 h2 catalyst ► rch2ch2ch2oh + rchch2oh
CH3
These reactions are applicable to most monoolefins and are used to obtain a large number of commercial products.
Cobalt Catalyst, Two-Step, High Pressure Process. The olefin, with recycle and makeup cobalt catalyst at 0.1—1.0% concentration, is
preheated and fed continuously to the oxo reactor together with the synthesis gas at a 1—1.2:1 H2 to CO ratio. The reaction is conducted with agitation at
20,300—30,400 kPa (200—300 atm) and 130—190°C. Liquid houdy space velocity (LHSV) in the reactor is 0.5—1.0. The reaction is highly exothermic, 125
kJ/mol (54,000 Btu/lb-mol), and requires cooling. The intermediate aldehyde is hydrogenated to the alcohol at 5,070—20,300 kPa (50—200 atm) and
150—200°C using a catalyst containing copper, zinc, or nickel. The crude product is then fractionated (Fig. 5). The plant may be operated continuously or
on a campaign basis with subsequent blending of the alcohols to give the desired product. The reactor and parts exposed to aldehydes or acids are
constructed of alloy steel; the remainder is of carbon steel.
Kirk-Othmer Encyclopedia of Chemical Technology (4th Edition)
457
SYNTHETIC PROCESSES
Voll
Catalyst
absorber
Catalyst
regenerator
Olefin
column
Aldehyde
column
Alcohol
column
Fig. 5. Flow diagram for oxo alcohol manufactured by the two-stage process. Courtesy of the Ethyl Corporation.
The cobalt catalyst can be introduced into the reactor in any convenient form, such as the hydrocarbon-soluble cobalt naphthenate [61789-51-3]) as
it is converted in the reaction to dicobalt octacarbonyl [15226-74-1J, Co2(CO)g, the precursor to cobalt hydrocarbonyl [16842-03-8]> HCo(CO)4, the active
catalyst species. Some of the methods used to recover cobalt values for reuse are (11): conversion to an inorganic salt soluble in water; conversion to an
organic salt soluble in water or an organic solvent; treatment with aqueous acid or alkali to recover part or all of the HCo(CO)4 in the aqueous phase; and
conversion to metallic cobalt by thermal or chemical means.
Modified Cobalt Catalyst, One-Step, Low Pressure Process. The distinguishing feature of this process, as commercialized by Shell, is
catalysis by a cobalt—carbonyl—organophosphine complex such as [Co(CO)3P(C4H9)3]2 (12). The olefin, using recycle and makeup catalyst at about 0.5%
concentration, and synthesis gas at a 2—2.5:1 H2 to CO ratio, react at 6,080—9,120 kPa (60—90 atm) and 170—210°C for detergent range alcohols. Lower
pressures (3,040—7,080 kPa) are employed for ^-butanol [71-36-3] and 2-ethylhexanol production. LHSV in the reactor is 0.1—0.2. The catalyst is highly
selective for hydroformylation of 1-olefins at the terminal carbon atom; this results in a product from a linear feedstock which is up to 75—85% linear,
having mainly 2-methyl isomers as branched components. The product is alcohol rather than aldehyde, because the modified catalyst promotes
hydrogenation; and, because it is such an effective hydrogenation catalyst, approximately 10% of the olefin feed is also converted to paraffins. Because
rapid isomerization of intermediates occurs under the reaction conditions, high primary alcohol selectivity can be obtained from internal olefins as well as
from alpha olefins. After degassing and vacuum flashing, the crude alcohols are washed with caustic to convert esters to alcohols, water-washed, and
distilled. Purified alcohols are then finished by hydrogenation and filtration (13).
Significant differences in this modified process include use of a lower pressure, slightly higher temperature, lower LHSV, formation of alcohol in
one processing step, and a higher hydrogenation of the olefins to paraffins. The process is operated commercially by Shell Chemical U.S.A., Shell Chemical
UK, and Mitsubishi Petrochemical exclusively for detergent range alcohols. Detergent range alcohols produced by the Shell process are particularly
well-suited for downstream production of ethylene oxide adducts, which are major Shell Chemical products. The process schematic is shown in Figure 6.
Rhodium Catalysts. Rhodium carbonyl catalysts for olefin hydroformylation are more active than cobalt carbonyls and can be applied at
lower temperatures and pressures (14). Rhodium hydrocarbonyl [75506-18-2]) HRh(CO)4, results in lower ^-butyraldehyde [123-72-8] to isobutyraldehyde
[78-84-2] ratios from propylene [115-07-1C3H6, than does cobalt hydrocarbonyl, ie, 50/50 vs 80/20. Ligand-modified rhodium catalysts, HRh(CO)2L2 or
HRh(CO)L3, afford n-/iso-ratios as high as 92/8; the ligand is generally a tertiary phosphine. The rhodium catalyst process was developed joindy by Union
Carbide Chemicals, Johnson-Matthey, and Davy Powergas and has been licensed to several companies. It is particularly suited to propylene conversion to
^-butyraldehyde for 2-ethylhexanol production in that by-product isobutyraldehyde is minimized.
Olefin Sources. The choice of feedstock depends on the alcohol product properties desired, availability of the olefin, and economics. A given
producer may either process different olefins for different products or change feedstock for the same application. Feedstocks believed to be currendy
available are as follows.
Propylene. 2-Ethylhexanol is now produced almost entirely from propylene, with the exception of a minor portion that comes from
ethylene-derived acetaldehyde.
Polygas Olefins. Refinery propylene and butenes are polymerized with a phosphoric acid catalyst at 200°C and 3040—6080 kPa (30—60 atm) to
give a mixture of branched olefins up to C15, used primarily in producing plasticizer alcohols (isooctyl, isononyl, and isodecyl alcohol). Since the olefins are
branched (75% have two or more CH3 groups) the alcohols are also branched. Exxon, BASF, Ruhrchemie (now Hoechst), ICI, Nissan, Getty Oil, U.S.
Steel Chemicals (now Aristech), and others have all used this olefin source.
Other Dimer Olefins. Olefins for plasticizer alcohols are also produced by the dimerization of isobutene [115-11-7]) C4Hg, or the
codimerization of isobutene and ^-butene [25167-67-3]. These highly branched octenes lead to a highly branched isononyl alcohol [68526-84-1] product.
BASF, Ruhrchemie, ICI, Nippon Oxocol, and others have used this source.
The Dimersol process (French Petroleum Institute) produces hexenes, heptenes, and octenes from propylene and linear butylene feedstocks. This
process is reported to produce olefin with less branching than the corresponding polygas olefins. BASF practices this process in Europe.
Kirk-Othmer Encyclopedia of Chemical Technology (4th Edition)
458
SYNTHETIC PROCESSES
Voll
NormalParaffin-Based Olefins. Detergent range «-paraffins are currently isolated from refinery streams by molecular sieve processes (see
Adsorption, liquid separation) and converted to olefins by two methods. In the process developed by Universal Oil Products and practiced by Enichem
and Mitsubishi Petrochemical, a «-paraffin of the desired chain length is dehydrogenated using the Pacol process in a catalytic fixed-bed reactor in the
presence of excess hydrogen at low pressure and moderately high temperature. The product after adsorptive separation is a linear, random, primarily
internal olefin. Shell formerly produced «-olefins by chlorination—dehydrochlorination. Typically, C/4 «-paraffins are chlorinated in a fluidized bed at
300°C with low conversion (10—15%) to limit dichloroalkane and trichloroalkane formation. Unreacted paraffin is recycled after distillation and the
predominant monochloroalkane is dehydrochlorinated at 300°C over a catalyst such as nickel acetate [373-02-4]. The product is a linear, random, primarily
internal olefin.
Ethylene-Based Olefins.
Aluminum Alkyl Chain Growth. Ethyl, Chevron, and Mitsubishi Chemical manufacture higher, linear alpha olefins from ethylene via chain growth on
triethylaluminum (15). The linear products are then used as oxo feedstock for both plasticizer and detergent range alcohols; and because the feedstocks are
linear, the linearity of the alcohol product, which has an entirely odd number of carbons, is a function of the oxo process employed. Alcohols are
manufactured from this type of olefin by Sterling, Exxon, ICI, BASF, Oxochemie, and Mitsubishi Chemical.
Catalytic Oligomerisation. Shell Chemical provides C^—C14 linear internal olefin feedstock for C12~C15 detergent oxo alcohol production from its SHOP
(Shell Higher Olefin Process) plant (16,17). C9~Си alcohols are also produced by this process. Ethylene is first oligomerized to linear, even carbon—number
alpha olefins using a nickel complex catalyst. After separation of portions of the CC-olefins for sale, others, particularly C18 and higher, are catalytically
isomerized to internal olefins, which are then disproportionated over a catalyst to a broad mixture of linear internal olefins. The desired C^—C14 fraction is
separated; the lighter and heavier fractions are recycled to the isomerization/disproportionation section. The SHOP process has been described in detail in
the literature (18) and is shown schematically in Figure 6.
Alpha olefin sales
C;H4 ---1
T
Catalyst
Ethylene
chain growth
Alpha olefin
distillation
C20+
Isomerization and
disproportionation
Olefins/paraffins
Heavy ends
Caustic
water
Hydrogen
H2
Bleed
Crude
alcohol
Co ligand catalyst
________________________________ Internal
I Shell hydroformylation | olefin
___________________ sales
Finished
alcohol
I Filtration]
Ethylene oxide
Internal olefin
distillation
Alcohol distillation
and hydrogenation
Alcohol
ethoxylation
Storage
Fig. 6. Flow diagram for the Shell Chemical alcohol-olefin complex, Geismar, Louisiana, and Stanlow, United Kingdom.
Courtesy of the Shell Chemical Corporation and the Uthyl Corporation.
The Aldol Process
The important solvent and plasticizer intermediate, 2-ethylhexanol, is manufactured from «-butyraldehyde by aldol addition in an alkaline medium at
80-130°C and 300-1010 kPa (3-10 atm).
2 CH3CH2CH2CHO catalyst ► CH3CH2CH2CH =CCHO + H2O
CH2CH3
This step is followed by catalytic hydrogenation at 230°C and 5,070—20,300 kPa (50—200 atm).
CH3CH2CH2CH =CCHO + 2 H2 catalyst ► CH3CH2CH2CH2CHCH2OH
CH2CH3 CH2CH3
The «-butyraldehyde may be obtained from acetaldehyde [75-07-0] by aldol addition followed by hydrogenation, or from propylene by the oxo process.
This latter process is predominandy favored (Fig. 7).
Kirk-Othmer Encyclopedia of Chemical Technology (4th Edition)
459
SYNTHETIC PROCESSES
Voll
Hydrogen
Propylene
Carbon
monoxide
Catalyst
absorber
Catalyst
regenerator
Fig. 7. Flow diagram for the oxo—aldol manufacture of 2-ethylhexanol.
The oxo and aldol reactions may be combined if the cobalt catalyst is modified by the addition of organic—soluble compounds of zinc or other
metals. Thus, propylene, hydrogen, and carbon monoxide give a mixture of C4 aldehydes and 2-ethylhexenaldehyde [123-05-7] which, on hydrogenation,
yield the corresponding alcohols.
The Paraffin Oxidation Process
Secondary alcohols (C1Q—C14) for surfactant intermediates are produced by hydrolysis of secondary alkyl borate or boroxine esters formed when paraffin
hydrocarbons are air-oxidized in the presence of boric acid [10043-35-3] (19,20). Union Carbide Corporation operated a plant in the United States from
1964 until 1977. A plant built by Nippon Shokubai (Japan Catalytic Chemical) in 1972 in Kawasaki, Japan was expanded to 30,000 t/yr capacity in 1980
(20). The process has been operated industrially in the USSR since 1959 (21). Also, predominandy primary alcohols are produced in large volumes in the
USSR by reduction of fatty acids, or their methyl esters, from permanganate-catalyzed air oxidation of paraffin hydrocarbons (22). The paraffin oxidation is
carried out in the temperature range 150—180°C at a paraffin conversion generally below 20% to a mixture of trialkyl borate, (RO)3B, and trialkyl boroxine,
(ROBO)3. Unconverted paraffin is separated from the product mixture by flash distillation. After hydrolysis of residual borate esters, the boric acid is
recovered for recycle and the alcohols are purified by washing and distillation (19,20).
The product secondary alcohols from paraffin oxidation are converted to ethylene oxide adducts (alcohol ethoxylates) which are marketed by Japan
Catalytic Chemical and BP Chemicals as SOFT ANOL secondary alcohol ethoxylates. Union Carbide Chemical markets ethoxylated derivatives of the
materials in the United States under the TERGITOL trademark (23).
The Guerbet Process
Higher molecular weight branched alcohols are produced by condensation of lower alcohols in the Guerbet reaction.
2 rch2ch2oh —- RCH2CH2CHCH2OH + H2O
R
In earlier studies (24), the reaction was carried out at temperatures above 200°C under autogenous pressure conditions using alkali metal hydroxide or
alkoxide catalysts; significant amounts of carboxylic acid, RCH2COOH, were formed as were other by-products. More recent reports describe catalysts
which minimize by-products: MgO—K^CC^—CuC2O2 (25), less basic but still requiring high temperatures; Rh, Ir, Pt, or Ru complexes (26); and an alkali
metal alkoxide plus Ni or Pd (27), effective at much lower temperatures.
Some 2,000—3,000 t/yr of these specialty alcohols are produced in the United States (Exxon) and in Germany (Henkel) (28). Their high liquidity
because of branching permits use of less volatile, higher molecular weight materials, reported to be less irritating than the lower molecular weight linear
alcohol materials, in a variety of cosmetic products (29).
BIBLIOGRAPHY
"Alcohols, Higher" in ECT 1st ed., Vol. 1, pp. 315—321, by H. B. McClure, Carbide and Carbon Chemicals Corporation; "Alcohols, Higher, Synthetic" in
ECT 2nd ed., Vol. 1, pp. 560—569, by R. W. Miller, Eastman Chemicals Products, Inc; "Alcohols, Higher Aliphatic, Synthetic in ECT 3rd ed., Vol. 1 pp.
740—754 by M. F. Gautreaux, W. T. Davis, and E. D. Travis, Ethyl Corporation.
Kirk-Othmer Encyclopedia of Chemical Technology (4th Edition)
460
SYNTHETIC PROCESSES
Voll
1. Asociacion Petroquimica Latinomamericana, Anuario Petroquimico Latino Americano 1985, Buenos Aires, 1985.
2. J-P. Davreux, Synfina—Oleofina, 1988.
3. R. F. Modler, "Detergent Alcohols" in Chemical Economics Handbook, SRI International, Menlo Park, Calif., 1987.
4. T. Gibson, "Plasticizer Alcohols" in Chemical Economics Handbook, SRI International, Menlo Park, Calif., 1985.
5. T. Gibson, "Oxo Chemicals" in ref. 4.
6. G. R. Lappin, J. D. Wagner, Ethyl Corporation, 1989.
7. H. Weslau, Justus Liebigs Ann. Chem. 629, 198 (1960).
8. U.S. Pat. 3,415,861 (Dec. 10, 1968), W. T. Davis and C. L. Kingrea (to Ethyl Corporation).
9. G. R. Lappin in G. R. Lappin and J. D. Sauer, eds.,M$>/w Olefins Applications Handbook, Marcel Dekker, New York, 1989, p. 36.
10. Ger. Pat. 849,548 (Sept. 15, 1952), O. Roelen (to Chemische Verwertungsgesellschaft Oberhausen GmbH).
11. H. Lemke, Hydrocarbon Process. 45(2), 148 (Feb. 1966).
12. U.S. Pats. 3,239,569; 3,239,570; 3,239,571 (Mar. 8,1966), L. H. Slaugh and R. D. Mullineaux (to Shell Oil Company); Brit. Pats. 988,941;
988,942; 988,943; 988,944 (Apr. 14, 1965) (to Shell Internationale Research Maatschappij NV).
13. E. D. Heerdt, Shell Development Co., personal communication, 1989.
14. Ger. Pat. 953,605 (Dec. 6, 1956), G. Schiller (to Chemische Verwertungsgesellschaft Oberhausen GmbH).
15. Ref. 3, pp. 51-53.
16. Ref. 3, pp. 54-57.
17. U.S. Pat. 3,647,906 (Mar. 7,1972), F. F. Fadey (to Shell Oil Company); U.S. Pat. 3,726,938 (Apr. 10,1973), A. J. Berger.
18. E. R. Freitas and C. R. Gum, Chem. Eng Prog, 73 (Jan. 1979).
19. J. Kurata and K. Koshida, Hydrocarbon Process. 57(1), 145 (Jan. 1978); N.J. Steens and J. R. Livingston, Jr., Chem. Eng. Prog. 64(7), 61 (July 1968).
20. N. Kurata, K. Koshida, H. Yokoyama, and T. Goto, in E. J. Wickson, ed., Monohydric Alcohols, ACS Symp. Ser. 159, American Chemical Society
Washington, D.C., 1981, pp. 113-157.
21. I. M. Towbin and D. M. Boljanskii, Maslo. Zhir. Prom. 32, 29 (1966).
22. H. Stage, Sefen, Ц1е, Fette, Wachse 99 (6/7), 143; (8), 185; (9), 217; (11), 299 (1973).
23. M. Tsuchino, and co-workers, Paper no. 54 (I&EC Dir.), 196th National Meeting of the American Chemical Society, Los Angeles, September
25-30,1988.
24. M. Guerbet,/ Pharm. Chim. 6, 49 (1913); Chem. Abstr. 7, 1494 (1913).
25. M. N. Dvomikoff and M. W. Farrar,/. Org. Chem. 22, 540 (1957).
26. G. Gregorio and G. F. Pregaglia,/. Organometall. Chem. 37, 385 (1972); P. L. Burk, R. L. Pruett, and K. S. Campo,/ Mol. Catal. 33, 1,15 (1985).
27. J. Sabadie and G. Descotes, Pull. Soc. Chim. Fr. 253 (1983).
28. K. Noweck and H. Ridder, Eltmann's Encyclopedia ofilndustrial Chemistry, 5th ed., VCH Vedagsgesellschaft mbh, Weinheim, Germany, 1987, p. 288.
29. K. Klein, P. E. Bator, and S. Hans, Cosmetics andToiletries, 95 70 (1980); A. J. O'Lenick, Jr., and R. E. Bilbo, Soap, Cosmet. Chem. Spec. 52 (April, 1987).
General References
J. A. Monick, Alcohols, Their Chemistry, Properties, and Manufacture, Reinhold, New York (1968).
Ziegler chemistry processes; triethylaluminum synthesis
F. Albright, Chem. Eng. 74, 179 (Dec. 4, 1967).
K. Ziegler and co-workers, Angew. Chem. 67, 424 (1955).
K. Ziegler, ErdiilFohle 11, 766 (1958).
K. Ziegler and co-workers, Justus Liebigs Ann. Chem. 629, 1 (1960).
Ziegler chemistry processes: chain growth
K. Ziegler, Angew. Chem. 64, 323 (1952).
K. Ziegler, Brennst. Chem. 35, 321 (1954).
K. Ziegler, Angew. Chem. 68, 721 (1956).
K. Ziegler and co-workers, Justus Liebigs Ann. Chem. 629, 121,172 (1960).
K. Ziegler, Angew. Chem. 72, 829 (1960).
K. Ziegler and H. Hoberg, Chem. Ber. 93, 2938 (1960).
Ziegler chemistry processes: displacement reactions
K. Ziegler, H. Martin, and F. Krupp, Justus Liebigs Ann. Chem. 629, 14 (1960).
K. Ziegler, W. R. Kroll, W. Larbig, and O. W. Steudel, Justus Liebigs Ann. Chem. 629, 53 (1960).
K. Ziegler, in H. H. Zeiss, ed., Organometallic Chemistry, Reinhold, New York, 1960, p. 218 ff.
Ziegler chemistry processes: oxidation
K. Ziegler, F. Krupp, and K. Zosel, Justus Liebigs Ann. Chem. 629, 241 (1960).
K. Ziegler, F. Krupp, and K. Zosel, Angew. Chem. 67, 425 (1955).
Oxo processes
G. U. Ferguson, Chem. Ind. 11, 451 (1965).
H. Weber and J. Falbe, Ind. Eng. Chem. 62(4), 33 (Apr. 1970).
H. Weber, W. Diminling, and A. M. Desai, Hydrocarbon Process. 55(4), 127 (1976).
E. J. Wickson and H. P. Dengler, Hydrocarbon Process. 51(11), 69 (1972).
J. Falbe, Carbon Monoxide in Organic Synthesis, Springer-Vedag, New York, 1970.
B. Cormels, in J. Falbe, ed., New Synthesis with Carbon Monoxide, Springer-Vedag, New York, 1980, p. 1—225.
Plant locations, capacities, feedstocks
Refs. 1 through 6.
John D. Wagner
George R. Lappin
J. Richard Zietz
Ethyl Corporation
Kirk-Othmer Encyclopedia of Chemical Technology (4th Edition)
461
SYNTHETIC PROCESSES
Voll
Kirk-Othmer Encyclopedia of Chemical Technology (4th Edition)
462
ALCOHOLS, POLYHYDRIC
Voll
ALCOHOLS, POLYHYDRIC
Polyhydric alcohols or polyols contain three or more CH2OH functional groups. The monomeric compounds have the general formula R' CII Ol[y where
n = 3 and R is an alkyl group or CCH2OH; the dimers and trimers are also commercially significant. Related species where n = 2 are discussed elsewhere
(see Glycols).
The most important polyhydric alcohols are shown in Figure 1. Each is a white solid, ranging from the crystalline pentaerythritols to the waxy
trimethylol alkyls. The trihydric alcohols are very soluble in water, as is ditrimethylol-propane. Pentaerythritol is moderately soluble and dipentaerythritol
and tripentaerythritol are less soluble. Table 1 lists the physical properties of these alcohols. Pentaerythritol and trimethylolpropane have no known toxic or
irritating effects (1,2). Finely powdered pentaerythritol, however, may form explosive dust clouds at concentrations above 30 g/m3 in air. The minimum
ignition temperature is 450°C (3).
CH2OH CH2OH CH2OH
HOCH2 —c—CH2OH HOCH2 —c—CH2 —o—CH2 —c—CH2OH
CH2OH CH2OH CH2OH
pentaerythritol, tetramethylolmethane dipentaerythritol
CH2OH CH2OH CH2OH
HOCH2 —c—H2C —o—CH2 —c—CH2 —o—CH2 —c—CH2OH
CH2OH CH2OH CH2OH
CH2OH
H3c—c—CH2OH
CH2OH
(3) (4)
tripentaerythritol trimethylolethane
CH2OH 1 CH2OH CH2OH 1 1
H3C —CH2 —c—CH2OH H3C —CH2 —c—CH2 —0—CH2 —c—CH2 —CH3
CH2OH CH2OH CH2OH
(6)
trimethylolpropane
ditrimethylolpropane
Fig. 1. Polyhydric alcohols. Systematic names are (1) 2,2-bis(hydroxymethjd)-l,3-propanediol; (2)
2,2-[oxybis(methylene)]-bis[2-hydroxymethyl]-l,3-propanediol; (3) 2,2-bis{[3-hydroxy-2,2-bis(hydroxymethyl)propoxy]methyl}-l,3-propanediol; (4)
2-hydroxy-methyl-2-methyl-l-2-methyl-l,3-propanediol; (5) 2-ethyl-2-hydroxymethyl-l,3-propanediol; and (6)
2,2- [oxybis(methylene)]-bis(2-ethyl)-l,3-propanediol.
Table 1. Physical Properties of Polyhydric Alcohols
Property Pentaerythritol Dipentaerythritol Tripentaerythritol Trimethylolethane Trimethylolpropan e Ditrimethylolpropane
CAS Registry Number [115-77-5] [126-58-9] [78-24-0] [77-85-0] [77-99-6] [25255-61-2]
molecular formula C5H12O4 TT <^0-0-22 TT ^15-rL32^10 C5H12O3 ^6^14^3 C12H26O5
melting point, °C 261-262b 221-222.5b 248-250b 202е 58.8d 112-114
boiling point, °C solubility, g/100 g 276 (4 kPa) 283е 289d 210 (0.12 kPa)
water
25°C 7.23b 0.28е 0.018е soluble soluble 2.6
50°C 16.f 1.1е 0.07е 8.3
90°C 51.9е 6.1е 0.51е >200
(completely
soluble)
flash point, °C (Cleveland open cup) 260f 180d >150
density, g/mL 1.396f 1.369f 1.30f 1.09d 1.18
refractive index 1.55 (20°C)g 1.472 (70°C)g
Data supplied by Perstorp AB.
b Ref. 1.
C Refs. 4 and 5.
d Ref. 2.
Kirk-Othmer Encyclopedia of Chemical Technology (4th Edition)
463
ALCOHOLS, POLYHYDRIC
Voll
e Estimated value.
fRef. 6.
£Ref. 7.
Reactions
Direct acetylation of pentaerythritol using acetic acid in aqueous solution or in toluene produces a mixture of acetates which can be faidy readily separated
by chromatographic methods or distillation (8,9). The final product composition can be varied somewhat by altering the amount of water present. Esters
of higher homologues and trimethylolpropane can also be synthesized using this procedure. Acrylate and methacrylate monoesters may be produced
(10,11) when protecting groups are placed on three of the pentaerythritol hydroxyls. The protected intermediate then reacts with either acryloyl chloride
[814-68-6] or methacryloyl chloride [27550-72-7] to give products of the type
H2C--Q
Л,СН2 \ .
H2C=C—COOCH2—C \ /-p—R
2 I \ 07
R H2C—о
An alternative synthesis converts monobromopentaerythritol to the ortho ester, followed by reaction with cuprous acrylate.
Long-chain esters of pentaerythritol have been prepared by a variety of methods. The tetranonanoate is made by treatment of methyl nonanoate
[7289-51-2] and pentaerythritol at elevated temperatures using sodium phenoxide alone, or titanium tetrapropoxide in xylene (12). PhenoEc esters having
good antioxidant activity have been synthesized by reaction of phenols or long-chain aEphatic acids and pentaerythritol or trimethylolpropane (13).
Another ester synthesis employs the reaction of a long-chain ketone and pentaerythritol in xylene or chlorobenzene (14). Mixed esters have been produced
using mixed isostearic and cyclohexane carboxyEc acids in tribromophosphoric acid, foEowed by reaction with lauric acid (15).
Polyhydric alcohol mercaptoalkanoate esters are prepared by reaction of the appropriate alcohols and thioester usingp-toluenesulfonic acid catalyst
under nitrogen and subsequent heating (16,17). Organotin mercapto esters are similarly produced by reaction of the esters with dibutyltin oxide (18).
Pentaerythritol can be oxidized to 2,2-bis(hydroxymethyl)hydracryEc acid [2831-90-5], C^H . O^,
CH2OH
HOCH2 —С—COOH
CH2OH
by direct ah oxidation in aqueous solution using a palladium—carbon catalyst (19), or by biological oxidation using corynebacterium or arthrobacter cultures
(20).
Bromohydrins can be prepared direcdy from polyhydric alcohols using hydrobromic acid and acetic acid catalyst, followed by distillation of water
and acetic acid (21). Reaction conditions must be carefully controlled to avoid production of simple acetate esters (22). The raw product is usuaHy a mixture
of the mono-, di-and tribromohydrins.
Borolane products of mixed composition can be synthesized by direct addition of boric acid to pentaerythritol (23).
Reaction between pentaerythritol and phosphorous trichloride [7719-12-2] yields the spkophosphite,
3,9-dichloro-2,4,8,10-tetraoxa-3,9,-diphosphaspko[5,5]-undecane [3643-70-7], CgHgC^C^P^
n—CH2 .CH2— о
Cl-^CX /Р-Cl
o—CH2 xch2 —ox
in the presence of benzene or a methyl acid phosphate catalyst (24,25) foEowed by removal of hydrogen chloride. Substituents may then replace the
remaining chloride on treating the product with an alcohol or phenol (26) in the presence of a hydrogen chloride binding base such as triethylamine. Dkect
reaction of triethyl phosphite [122-52-1] and pentaerythritol is also possible (27). Pentaerythritol phosphate is similarly prepared by the reaction of
pentaerythritol and phosphorus oxychloride [10025-87-3], POC13, in dioxane (28). Substituted diphosphaspko compounds are made by reaction of
pentaerythritol and either phosphonic anhydrides or trialkyl phosphites and trialkjdamine (29,30).
The commerciaEy important explosive pentaerythritol tetranitrate [78-11-5] (PETN), C5HgN4O12,
O2NO—CH2 >CH2—ONO2
X
o2no —ch2 xch2 —ono2
is produced by direct reaction of pentaerythritol in nitric or nitric—sulfuric acid media (31—33).
Aminoalkoxy pentaerythritols are obtained by reduction of the cyanoethoxy species obtained from the reaction between acrylonitrile, pentaerythritol,
and Ethium hydroxide in aqueous solution. Hydrogen in toluene over a ruthenium catalyst in the presence of ammonia is used (34). The corresponding
aminophenoxyalkyl derivatives of pentaerythritol and trimethylolpropane can also be prepared (35).
Tosylates of pentaerythritol and the higher homologues can be converted to thek corresponding tetra-, hexa-, or octaazides by dkect reaction of
sodium azide (36), and azidobenzoates of trimethylolpropane and dipentaerythritol are prepared by reaction of azidobenzoyl chloride and the alcohols in
pyridine medium (37).
Pentaerythritol can be converted to the biscycEc formal, 2,4,8,10-tetra-oxaspko[5,5]undecane [126-54-5], C7H12O4,
,0—сн2 ,сн2— о
н2сх ^cx xch2
o—CH2 xch2 —ox
by heating in the presence of formaldehyde or paraformaldehyde and an acid catalyst (38). Alternatively, a cation-exchange resin catalyst may be used and
excess water removed by azeotropic distiEation (39). Higher aldehydes have also been used to prepare long-chain alkyl and aryl cycEc acetals (40—43).
Simple alkyl and alkenyl ethers of pentaerythritol are produced on dkect reaction of the polyol and the requked alkyl or alkenyl chloride in the
presence of quaternary alkylamine bromide (44). AEyl chloride produces the pentaerythritol tetraEyl ether [1471 -18-7],
H2C =CH—CH2 —o—CH2 >CH2 —o—CH2 —CH=CH2
^cx
H2C =CH—CH2 —o—CH2 XCH2 —o—CH2 —CH=CH2
Kirk-Othmer Encyclopedia of Chemical Technology (4th Edition)
464
ALCOHOLS, POLYHYDRIC
Voll
in. high yield by this method (45,46) or by using sodium hydroxide catalyst (47). Polycyclic crown looped and starburst dendrimer ethers are synthesized
utilizing blocking-deblocking and high dilution cyclization techniques in reactions of dialcohols and ditosylates (48,49).
Manufacture
Pentaerythritol is produced by reaction of formaldehyde [50-00-0] and acetaldehyde [75-07-0] in the presence of a basic catalyst, generally an alkali or
alkaline-earth hydroxide. Reaction proceeds by aldol addition to the carbon adjacent to the hydroxyl on the acetaldehyde. The pentaerythrose [3818-32-4]
so produced is converted to pentaerythritol by a crossed Cannizzaro reaction using formaldehyde. All reaction steps are reversible except the last, which
allows completion of the reaction and high yield industrial production.
The main intermediates in the pentaerythritol production reaction have been identified and synthesized (50,51) and the intermediate reaction
mechanisms deduced. Without adequate reaction control, by-product formation can easily occur (52,53). Generally mild reaction conditions are favored for
optimum results (1,54). However, formation of by-products cannot be entirely eliminated, particularly dipentaerythritol and the linear formal of
pentaerythritol, 2,2,-[methjdenebis(oxymethylene)]bis(2-hydroxymethyl-l,3-propanediol) [6228-26-8]'.
CH2OH CH2OH
HOCH2 —c—CH2—o—CH2—o—CH2—c—CH2OH
CH2OH CH2OH
The quantities of formaldehyde and base catalyst required to produce pentaerythritol from 1 mol of acetaldehyde are always in excess of the
theoretical amounts of 4 mol and 1 mol, respectively, and mole ratios of formaldehyde to acetaldehyde vary widely. As the mole ratio increases, formation
of dipentaerythritol and pentaerythritol linear formal is suppressed. Dipentaerythritol formation may also be reduced by increasing the formaldehyde
concentration, although linear formal production increases under those conditions (55,56).
The most common catalysts are sodium hydroxide and calcium hydroxide, generally used at a modest excess over the nominal stoichiometric
amount to avoid formaldehyde-only addition reactions. Calcium hydroxide is cheaper than NaOH, but the latter yields a more facile reaction and
separation of the product does not require initial precipitation and filtration of the metal formate (57).
A typical flow diagram for pentaerythritol production is shown in Figure 2. The main concern in mixing is to avoid loss of temperature control in
this exothermic reaction, which can lead to excessive by-product formation and/or reduced yields of pentaerythritol (55,58,59). The reaction time depends
on the reaction temperature and may vary from about 0.5 to 4 h at final temperatures of about 65 and 35°C, respectively. The reactor product, neutralized
with acetic or formic acid, is then stripped of excess formaldehyde and water to produce a highly concentrated solution of pentaerythritol reaction
products. This is then cooled under carefully controlled crystallization conditions so that the crystals can be readily separated from the liquors by
subsequent filtration.
Liquor
recovery
Fig. 2. Flow diagram for pentaerythritol production.
The first stage crystals are rich in pentaerythritol linear formal and may be treated (60,61) to convert this species to pentaerythritol and
formaldehyde, which can then be recovered. The concentrated liquors obtained after redissolving are then recrystallized and filtered prior to drying of the
final product.
The exact order of the production steps may vary widely; in addition, some parts of the process may also vary. Metal formate removal may occur
immediately after the reaction (62) following formaldehyde and water removal, or by separation from the mother liquor of the first-stage crystallization
(63). The metal formate may be recovered to hydroxide and/or formic acid by ion exchange or used as is for deicing or other commercial applications.
Similarly, crystallization may include sophisticated techniques such as multistage fractional crystallization, which allows a wider choice of composition of
the final product(s) (64,65).
Staged reactions, where only part of the initial reactants are added, either to consecutive reactors or with a time lag to the same reactor, maybe used
to reduce dipentaerythritol content. This technique increases the effective formaldehyde-to-acetaldehyde mole ratio, maintaining the original stoichiometric
one. It also permits easier thermal control of the reaction (66,67). Both batch and continuous reaction systems are used. The former have greater flexibility
whereas the product of the latter has improved consistency (55,68).
Dipentaerythritol and tripentaerythritol are obtained as by-products of the pentaerythritol process and may be further purified by fractional
Kirk-Othmer Encyclopedia of Chemical Technology (4th Edition)
465
ALCOHOLS, POLYHYDRIC
Voll
crystallization or extraction. Trimethylolethane and trimethylolpropane maybe prepared by a similar aldol—cross Cannizzaro reaction scheme using
propionaldehyde or butyraldehyde, respectively (58) in place of acetaldehyde. Formaldehyde and catalyst requirements are somewhat reduced because of
the lower hydrogen content. Ditrimethylolpropane is obtained as a by-product of the trimethylolpropane synthesis (59).
Economic Aspects
Production of pentaerythritol in the United States has been erratic. Demand decreased in 1975 because of an economic recession and grew only moderately
to 1980 (69). The range of uses for pentaerythritol has grown rapidly in lubricants (qv), fire-retardant compositions, adhesives, and other formulations
where the cross-linking capabilities are of critical importance.
The world's largest producers are Perstorp AB (Sweden, United States, Italy), Hoechst Celanese Corporation (United States, Canada), Degussa
(Germany), and Hercules (United States) with estimated 1989 plant capacities of 65,000, 59,000, 30,000, and 22,000 t/yr, respectively. Worldwide capacity
for pentaerythritol production was 316,000 t in 1989, about half of which was from the big four companies. Most of the remainder was produced in Asia
(Japan, China, India, Korea, and Taiwan), Europe (Italy, Spain), or South America (Brazil, Chile). The estimated rate of production for 1989 was about
253,000 t or about 80% of nameplate capacity.
The world's largest producers of trimethylolpropane are Perstorp AB at 50,000 t/yr, Hoechst Celanese at 23,000 t/yr, and Bayer at 20,000 t/yr.
Estimated worldwide capacity is 139,000 t and actual production is on the order of 88,000 t.
Dipentaerythritol is sold by Perstorp AB and by Hercules (United States), ditrimethylolpropane by Perstorp AB both in relatively pure form.
Tripentaerythritol is also available; however, the purity is limited. Trimethylolethane is produced commercially by Alcolac (United States) and Mitsubishi
Gas Chemicals (Japan).
Pentaerythritol is produced in a variety of grades having differing amounts of dipentaerythritol and small quantities of linear formal. Mono
pentaerythritol contains a minimum of 98.0% pentaerythritol with most of the remaining material being dipentaerythritol. Nitration-grade pentaerythritol
composition is dependent on the individual customer's demands. The product may be highly pure (>99.5% pentaerythritol) or may contain up to about
1.6% dipentaerythritol. Technical-grade pentaerythritols generally contain at least 8% dipentaerythritol and the normal limit is about 12%, although some
specialty products may be even higher. Pure dipentaerythritol may be added to standard technical-grade pentaerythritol. Tripentaerythritol is also present in
most technical-grade product.
Analysis
Pentaerythritol may be analyzed by nonspecific wet chemical means such as the hydroxyl method, the results of which include all the usual impurities such
as dipentaerythritol, tripentaerythritol, and the formats (70), or the benzal method. A number of gas chromatographic methods allowing facile analysis of
the more volatile ethers and esters formed by a number of reagents as well as simultaneous determination of other normal constituents are also available.
Acetate esters (71), trimethylsilyl ethers (72), and trifluoroacetate esters (73) give highly satisfactory analyses. ASTM methods D2195 (wet chemical) and
D2999 (gas chromatographic) are recognized standards for industrial use.
Health and Safety Factors
Pentaerythritol and trimethylolpropane are classified as nuisance particulate and dust, respectively. They are both nontoxic to animals by ingestion or
inhalation and are essentially nonirritating to the skin or eyes (2,74).
Uses
The most important industrial use of pentaerythritol is in a wide variety of paints, coatings, and varnishes, where the cross-linking capability of the four
hydroxy groups is critical. Alkyd resins (qv) are produced by reaction of pentaerythritol with organic acids such as phthalic acid or maleic acid and natural
oil species.
The resins obtained using pentaerythritol as the only alcohol group supplier are noted for high viscosity and fast drying characteristics. They also
exhibit superior water and gasoline resistance, as well as improved film hardness and adhesion. The alkyd resin properties may be modified by replacing all
or part of the pentaerythritol by glycols, glycerol, trimethylolethane, or trimethylolpropane, thereby reducing the functionality. Similarly, replacing the
organic acid by longer-chain acids such as adipic or altering the quantities of the oil components (linseed, soya, etc) modifies the drying, hardness, and wear
characteristics of the final product. The catalyst and the actual cooking procedures also significandy affect overall resin characteristics.
Rosin esters of pentaerythritol prepared from varying amounts of oil yield varnishes of the required oil length for a wide range of outlets such as
wood and metal finishing, sealing and jointing formulations, and sand binders for molds. Formulations for some of these complex resins have been
described in great detail in the literature, although exact production details are normally guarded jealously by the manufacturers because the order of
reaction can also alter the properties of the final product (75—78).
Long-chain esters of pentaerythritol have been used as pour-point depressants for lubricant products, ranging from fuel oils or diesel fuels to the
high performance lubricating oils required for demanding outlets such as aviation, power turbines, and automobiles. These materials require superior
temperature, viscosity, and aging resistance, and must be compatible with the wide variety of metallic surfaces commonly used in the outlets (79—81).
The explosives and rocket fuels formed by nitration of pentaerythritol to the tetranitrate using concentrated nitric acid (33) are generally used as a
filling in detonator fuses. Use of pentaerythritol containing small amounts of dipentaerythritol produces crystalliza tion behavior that results in a high bulk
density product having excellent free-flow characteristics, important for fuse burning behavior (82). PETN is also used for medicinal purposes as a
vasodilator in the treatment of angina. This product is a dry mixture of pure PETN and an inert carrier, for example, lactose or mannitol, to minimize the
usual explosive potential. For the same reason, only small quantities are normally shipped and rigorous packaging is recommended (83).
Pentaerythritol is used in self-extinguishing, nondripping, flame-retardant compositions with a variety of polymers, including olefins, vinyl acetate
and alcohols, methyl methacrylate, and urethanes. Phosphorus compounds are added to the formulation of these materials. When exposed to fire, a thick
foam is produced, forming a fire-resistant barrier (see Flame retardants) (84—86).
Polymer compositions containing pentaerythritol are also used as secondary heat-, light-, and weather-resistant stabilizers with calcium, zinc, or
barium salts, usually as the stearate, as the prime stabilizer. The polymers may be in plastic or fiber form (87—89).
Pentaerythritol in rosin ester form is used in hot-melt adhesive formulations, especially ethylene—vinyl acetate (EVA) copolymers, as a tackifier.
Polyethers of pentaerythritol or trimethylolethane are also used in EVA and polyurethane adhesives, which exhibit excellent bond strength and water
resistance. The adhesives maybe available as EVA melts or dispersions (90,91) or as thixotropic, one-package, curable polyurethanes (92). Pentaerythritol
spiro ortho esters have been used in epoxy resin adhesives (93). The EVA adhesives are especially suitable for cellulose (paper, etc) bonding.
Pentaerythritol and trimethylolpropane acrylic esters are useful in solvendess lacquer formulations for radiation curing (qv), providing a cross-linking
capability for the main film component, which is usually an acrylic ester of urethane, epoxy, or polyester. Some specialty films utilize dipentaerythritol and
ditrimethylolpropane (94,95).
Titanium dioxide pigment coated with pentaerythritol, trimethylolpropane, or trimethylolethane exhibits improved dispersion characteristics when
used in paint or plastics formulations. The polyol is generally added at levels of 0.1—0.5% (96).
Photocurable materials for photographic films contain pentaerythritol and dialkylamino and/or nitrile compounds, which have good adhesion and
peelability of the layers, and produce clear transfer images (97,98).
Electroless plating on metal substrates can be improved by addition of pentaerythritol, either to a photosensitive composition of a noble metal salt
(99), or with glycerine to nickel plating solutions (100). Both resolution and covering power of the electrolyte are improved.
Binary mixtures of pentaerythritol with many other polyol species can produce heat or electrical storage media having excellent retention properties
Kirk-Othmer Encyclopedia of Chemical Technology (4th Edition)
466
ALCOHOLS, POLYHYDRIC
Voll
based on the solid—solid, crystal—plastic—crystal phase-transition phenomena. The solid solutions of these mixtures can also be tailored, by adjusting the
ratios of the individual components, to exhibit phase transformation and energy release under the required conditions. These media are applicable to
domestic hot water, solar heat, and industrial process heat storage and recovery (101—103).
BIBLIOGRAPHY
"Pentaerythritol" inECT 1st ed., Vol. 10, pp. 1—6, by H. Weinberger, Fine Organics, Inc., "Other Polyhydric Alcohols" under "Alcohols, Polyhydric," in
ECT 2nd ed., Vol. 1, pp. 588—598, by E. Bedow, Heyden Newport Chemical Corp.; in ECT 3rd ed., Vol. 1, pp. 778—789, byj. Weber, Celanese Canada,
Ltd., andj. Daley, Celanese Chemical Company.
1. E. Bedow, R. H. Barth, and E. J. Snow, The P'entaerythritols, Reinhold Publishing Corp., New York, 1958.
2. Material Safety Data Sheet C41, Trimethylolpropane, Plake, Celanese Canada Inc., Montreal, 1990.
3. I. Harttmann and J. Nagy, U.S. Bureau of Mines Report ofInvestigation No. 3751, 1944.
4. Product Bulletin PE-10-55, Heyden Newport Chemical Corp.
5. Technical Data Sheets TDS-1 and TB-1, Commercial Solvents Corp.
6. Product Bulletin, Pentaerythritol, Sam Yang Chemical Co., Korea.
7. Physical Properties Manual, Celanese Chemical Company, Dallas, Tex., 1981.
8. N. S. Bankar, P. N. Chaudhari, and G. H. Kulkami, Indian J. Chem. 13, 986—987 (1975).
9. Jpn. Pat* 53/63,306 (June 6, 1978), K. Takeuchi, Y. Matsui, H. Kano, and T. Motohashi (to Ajinomoto Co., Ltd.).
10. A. B. Padias andH. K. Hall,fc.,Macromolecules 15, 217—223 (1982).
11. U.S. Pat. 4,405,798A (Sept. 20,1983), H. K. Hah and D. R. Wilson (to Celanese Corp.).
12. Brit. Pat. 1,374,263 (Nov. 20, 1974), T. Keating (to Imperial Chemical Industries Ltd.).
13. T. S. Chao, M. Kjonaas, and J. DeJovine, Preprints Div. Pet. Chem. Am. Chem. Soc. 24, 836—846 (1979).
14. U.S. Pat. 3,932,460 (Jan. 13, 1976), D. R. McCoy, T. B. Jordan, and F. K. Ward (to Texaco Inc.).
15. Ger. Pat. 2,758,780 (July 12, 1979), К. H. Hentschel, R. Dhein, H. Rudolph, K. Nuetzel, K. Morche, and W. Krueger (to Bayer A.G.).
16. Jpn. Pat. 57/38,767 A2 (Mar. 3, 1982), (to Asahi Denka Kogyo K.K.).
17. Jpn. Pat. 57/11,959 A2 (Jan. 21, 1982), (to Asahi Denka Kogyo K.K.).
18. Brit. Pat. 1,439,753 (June 16, 1976), H. Coates, J. D. Collins, and I. H. Siddiqui (to Albright and Wilson Ltd.).
19. Jpn. Pat* 52/100,415 (Aug. 23, 1977), T. Kiyoura (to Mitsui Toatsu Chemicals, Inc.).
20. Jpn. Pat* 52/72,882 (June 17, 1977), T. Ooe, T. Nakazato, and R. Yoshikawa (to Mitsubishi Gas Chemical Co., Inc.).
21. Ger. Pat. 2,440,612 (Mar. 6, 1975), Y. Christidis (to Nobel Hoechst Chimie).
22. Ger. Pat. 3,125,338 Al (Jan. 13, 1983), K. Koenig andM. Schmidt (to Bayer A.G.).
23. A. Kamors, Tefy Dokl. Konf. Molodykh Nauchn. Rah. Inst. Neorg. Khim., Akad. Nauk Eatv. SSR, 5th, pp. 17—20.
24. Czech. Pat. 190,732 В (Dec. 15, 1981),J. Holcik, M. Karvas, andj. Masek.
25. Eur. Pat. Appl. EP 113,994 Al (July 25, 1984), В. E. Johnston and P. R. Napier (to Mobil Oil Corp.).
26. Jpn. Pat* 61,225,191 A2 (Oct. 6, 1986), K. Tajima, M. Takahashi, K. Nishikawa, and T. Takeuchi (to Adeka Argus Chemical Co., Ltd.).
27. Ger. Pat. 2,630,257 (Jan. 12,1978), H. Habarlein and F. Scheidl (to Hoechst A.G.).
28. U.S. Pat. 4,454,064 A (June 12, 1984), Y. Halpern and R. H. Niswander (to Borg-Wamer Corp.).
29. Fr. Pat. 2,489,333 Al (Mar. 5, 1982), J. Kiefer (to Ciba-Geigy A.G.).
30. U.S. Pat. 4,152,373 (May 1, 1979), M. L. Honig and E. D. Weil (to Stauffer Chemical Co.).
31. L. Desvergnes, Chim. Ind. 29, 1263 (1933).
32. Jpn. Pat. 51/118,708 (Oct. 18, 1976), S. Oinuma andM. Kusakabe (to Agency of Industrial Sciences andTechnology).
33. Czech Pat. 221,031 В (Mar. 15, 1986), S. Zeman, M. Dimun, and Z. Cervenka.
34. U.S. Pat. 4,352,919 A (Oct. 5, 1982), E. W. Kluger and C. D. Welch (to Milliken Research Corp.).
35. U.S. Pat. 4,136,044 (Jan. 23,1979), M. Braid (to Mobil Oil Corp.).
36. W. S. Anderson and H. J. Hyer,JANNAF Propul Meet., vol. 1, AD-A103 844, CPIA Publ. 340, 1981, pp. 387-398.
37. Jpn. Pat. 56/55,362 (May 15,1981), (to Teijin Ltd.).
38. U.S. Pat. Appl. 183,707 (J an. 30, 1981), (to United States National Aeronautics and Space Administration).
39. USSR Pat. 1,035,025 Al (Aug. 15, 1983), E. B. Smirnova, Z. L. Chilyasova, N. P. Zykova, and L. A. Druganova (to Central Scientific-Research
and Design Institute of the Wood Chemical Industry).
40. Ger. Pat. 2,707,875 (Aug. 31, 1978), J. Pemer, K. Stork, F. Merger, and K. Oppenlaender (to BASF A.G.).
41. S. Shimizu, Y. Sasaki, and C. Hirai, Nihon Daigaku SeisankogakubuIdokoku,A, 15(1), 47—56 (1982).
42. U.S. Pat. 4,151,211 (Apr. 24, 1979), I. Heckenbleikner and W. P. Enlow (to Borg-Wamer Corp.).
43. Ger. Pat. 2,501,285 (July 24,1975), A Schmidt (to Ciba-Geigy A.G.).
44. Belg. Pat. 885,670 (Feb. 2, 1981), R. Leger, R. Nouguier,J. C. Fayard, and P. Maldonado (to Elf France).
45. Eur. Pat. Appl. EP 46,731 Al (Mar. 3, 1982), F. Lohse and С. E. Monnier (to Ciba-Geigy A.G.).
46. Jpn. Pat* 63,162,641 A2 (July 6, 1988), G. Watanabe, N. Nakajima, and Y. Ito (to Yokkaichi Chemical Co., Ltd.).
47. Jpn. Pat* 62,223,141 A2 (Oct. 1, 1987), Y. Fujio, Y. Nishi, and T. Nishimoto (to Osaka Soda Co., Ltd.).
48. E. Weber J. Org. Chem. 47, 3478-3486 (1982).
49. A. B. Padias, H. K. Hah, Jr., D. A. Tomalia, andj. R. McConnell,/. Org. Chem. 52, 5305-5312 (1987).
50. J. E. Vik, Acta Chem. Scand. 27, 239 (1973).
51. T. G. Bonner, E. J. Bourne, andj. Butler,/ Chem. Soc., 301 (1964).
52. J. E. Vik, Acta Chem. Scand. В 28, 325 (1974).
53. P. Werle, E. Busker, and E. Wolf-Heuss, EiebigsAnn. Chem. 1082—1087 (1985).
54. D. I. Belkin, ZA Prikl. Khim. (Eeningrad) 52, 237—239 (1979).
55. L. Kovacic-Beck, I. Beck, and F. Anusic, Nafta (Zagreb) 34(3), 131—135 (1983).
56. M. Lichvar, J. Sabados, V. Macho, and L. Komora, Chem. Prum. 36(2), 57—61 (1986).
57. U.S. Pat. 2,612,526 (Sept. 30, 1952), C. W. Gould (to Hercules Powder Co.).
58. Jpn. Pat. 57/139,028 A2 (Aug. 27, 1982), (to Koei Kagaku Kogyo K.K.).
59. U.S. Pat. 3,962,347 (June 8,1976), K. Herz (to Perstorp AB).
60. Ger. Pat. 2,930,345 (Feb. 19, 1981), P. Werle and G. Pohl (to Degussa).
61. Czech Pat. 183,405 (May 15, 1980), L. Komora and H. Nitoschneiderova.
62. Span. Pat. 467,714 (Oct. 16, 1978), (to Patentes yNovedades S.A.).
63. Eur. Pat. Appl. EP 242,784 Al (Oct. 28, 1987), H. V. Holmberg and H. E. Larsson (to Perstorp AB).
64. Czech Pat. 220,256 В (Feb. 15, 1986), J. Ziak.
65. Jpn. Pat. 5,808,028 (Jan. 18,1983), (to Koei Kagaku Kogyo K.K.).
66. Czech Pat. 181,486 (Jan. 15, 1980), M. Lichvar, J. Sabados, J. Vidovenec, and L. Butkovsky.
Kirk-Othmer Encyclopedia of Chemical Technology (4th Edition)
467
ALCOHOLS, POLYHYDRIC
Voll
67. Jpn. Pat. 57/142,929 A2 (Sept. 3, 1982), (to Koei Kagaku Kogyo K.K.).
68. V. V. Pakulin, A. A. Kruglikov, Y. V. Rogachev, and P. E. Gulevich, Plast. Massy 3, 12—13 (1988).
69. Synthetic Organic Chemicals, Publication 776, U.S. International Trade Commission.
70. PechnicalBulletin, P'entaeythritol, Oxyquim S.A.
71. D. S. Wiersma, R. E. Hoyle, andH. Rempis, Anal. Chem. 34, 1533 (1962).
72. R. R. Suchanec, Anal Chem. 37, 1361 (1965).
73. PechnicalBulletin, Pentaerythrit, Degussa.
74. Material Safety Data Sheet C73, Pentaery thritol, Celanese Canada Inc., 1990.
75. Belg. Pat. 874,241 (June 18,1979), (to BASF Farbenund Fasem A.G.).
76. Jpn. Pat* 55/82,165 (June 20, 1980), (to Nippon Synthetic Chemical Industry Co., Ltd.).
77. U.S. Pat. 4,690,783 A (Sept. 1, 1987), R. W. Johnston, Jr. (to Union Camp Corp.).
78. Czech Pat. 222,510 В (Mar. 15, 1986), K. Hajek and co-workers.
79. Neth. Pat. 77/11852 (May 2,1979), (to Hercules Inc.).
80. U.S. Pat. 4,229,310 (Oct. 21,1980), G. Frangatos (to Mobil Oil Corp.).
81. Ger. Pat. 3,328,739 (Feb. 9, 1984), C. J. Dorer and K. Hayashi (to Lubrizol Corp.).
82. Ger. Pat. 1,901,769 (Oct. 9, 1967), H. Thomas and J. Turbet (to Imperial Chemical Industries Ltd.).
83. U.S. Pharmacopeia: MationalPormulary 70V, 20th ed., Mack Publishing Co., Easton, Pa., 1980.
84. Eur. Pat. Appl. 17,609 (Oct. 15, 1980), D. Alt, K. D. Hutschgau, A. Schillmoeller, and B. Fischer (to Siemens A.G.).
85. U.S. Pat. 4,762,746 A (Aug. 9, 1988), L. Wesch and E. Weiss (to Odenwald-Chemie GmbH).
86. J. P. Jain, N. K. Saxena, I. Singh, and D. R. Gupta, Rtx Ind. 30(1), 20—24 (1985).
87. Ger. Pat. 2,847,628 (May 31, 1979), B. Sallmen, C. A. Sjoegreen, M. O. Maansson, and K. Ogemark (to Perstorp A.B.).
88. U.S. Pat. 4,162,242 (July 24, 1979), R. House (to Chevron Research Co.).
89. Eur. Pat. 219,427 Al (Apr. 11, 1987), C. D. G. deMezeyrac, R. Fugier, B. Gicquel, and S. Tetard (to Isover Saint-Gobain).
90. Fr. Pat. 2,378,835 (Aug. 25, 1978), (to E. I. du Pont de Nemours & Co., Inc.).
91. Ger. Pat. 3,410,957 Al (Sept. 26, 1985), K. J. Gardenier and W. Heimbuerger (to Henkel K.-G.a.A.).
92. Belg. Pat. 890,841 A2 (Feb. 15, 1982), S. B. Labelle and J. A. E. Hagquist (to Fuller H.B. Co.).
93. Jpn. Pat* 61,027,987 A2 (Feb. 7, 1986), A. Matsumaya, H. Ozawa, and S. Hirose (to Mitsui Toatsu Chemicals, Inc.).
94. R. Holman, ed., UV andEB CuringPormulations for Printinginks, Coatings and Paints, SITA Technology, London, 1984.
95. C. G. Roffey, Photopolymeri^ation of Suface Coatings, John Wiley & Sons, Inc., New York, 1982.
96. Brit. Pat. 896,067 (Aug. 19, 1960), W. R. Whately and G. M. Sheehan (to American Cyanamid Co.).
97. Jpn. Pat* 54/95,688 (July 28, 1979), S. Kondo, A. Matsufuji, and A. Umehara (to Fuji Photo Film Co., Ltd.).
98. Jpn. Pat* 60,237,444 A2 (Nov. 26, 1985), T. Komamura, M. Iwagaki, and T. Masukawa (to Konishirokn Photo Industry Co., Ltd.).
99. Jpn. Pat. 63,115,395 A2 (May 19, 1988), Y. Takeuchi (to Canon K.K.).
100. USSR Pat. 1,310,460 Al (May 15, 1987), Y. Y. Lukomski, T. V. Mulina, V. V. Vasiliev, and R. V. Kopteva.
101. Jpn. Pat* 61,204,292 A2 (Sept. 10, 1986), S. Anzai, H. Sakaguchi, H. Yamazaki, K. Shiina, and M. Kurodi (to Hitachi, Ltd.).
102. Jpn. Pat* 61,240,627 A2 (Oct. 25, 1986), Y. Kudo, S. Yoshimura, S. Tsuchiya, and T. Kojima (to Matsushita Electric Industrial Co., Ltd.).
103. U.S. Pat. 4,572,864 A (Feb. 25, 1986), D. K. Benson, R. W. Burrows, and Y. D. Shinton (to United States Dept, of Energy).
William N. Hunter
Celanese Canada Inc.
Kirk-Othmer Encyclopedia of Chemical Technology (4th Edition)
468
ALDEHYDES
Voll
ALCOHOLS, POLYHYDRIC.
See Sugar alcohols.
ALCOHOLS, UNSATURATED.
See Acetylene-derived chemicals.
ALDEHYDE RESINS.
See Acetal resins.
ALDEHYDES
Aldehydes are carbonyl-containing organic compounds in which the carbonyl function is at a terminal carbon. These compounds are extremely reactive.
The carbonyl group is susceptible to both oxidation and reduction, yielding acids and alcohols respectively. Additionally, the carbonyl group is susceptible
to nucleophilic addition, providing a means by which to form new chemical bonds. Furthermore, the presence of the carbonyl activates the hydrogens
bound to the alpha carbon and thus provides an additional site of reactivity. Ketones are a similar class of compounds where the carbonyl group is
nonterminal (see Ketones).
Nomenclature
The common method of naming aldehydes corresponds very closely to that of the related acids (see Carboxylic acids), in that the term aldehyde is added to
the base name of the acid. For example, formaldehyde (qv) comes from formic acid, acetaldehyde (qv) from acetic acid, and butyraldehyde (qv) from
butyric acid. If the compound contains more than two aldehyde groups, or is cyclic, the name is formed using carbaldehyde to indicate the functionality. The
IUPAC system of aldehyde nomenclature drops the final e from the name of the parent acyclic hydrocarbon and adds al. If two aldehyde functional groups
are present, the suffix -dlal\s, used. The prefix formyl \s, used with polyfunctional compounds. Examples of nomenclature types are shown in Table 1.
Table 1. Aldehyde Nomenclature
Structural formula Name CAS Registry Number
H—CHO formaldehyde or methanal [50-00-0]
CH3CHO acetaldehyde or ethanal [75-07-0]
(CH3)2CHCHO isobutyraldehyde or 2-methylpropanal or CC-methylpropionalde [78-84-2]
CH3CH=CHCHO CH3 CH3CH2CHCHO crotonaldehyde or 2-butenal 2-methylbutyraldehyde or 2-methylbutanal [4170-30-3] [96-17-3]
OHCCH2CH2CH2CHO CHO 1 OHCCH2CHCH2CHO glutaraldehyde or pentandial 1,2,3,-propanetricarbaldehyde or formylpentandial [111-30-8] [61703-13-7]
OHCCH2CH2CH2COOH CH2CH2CH2CH2CHCHO 4-formylbutanoic acid formylcyclopentane or cyclopentanecarbaldehyde [5746-02-1] [872-53-7]
Physical Properties
The C . and C2 carbon aliphatic aldehydes, formaldehyde and acetaldehyde are gases at ambient conditions whereas the C3 (propanal [123-38-6]) through
Си (undecanal [112-44-7]) aldehydes are Equids, and higher aldehydes are solids at room temperature. As can be seen from Table 2, the presence of
hydrocarbon branching tends to lower the boiling or melting point, as does unsaturation in the carbon skeleton. Generally, an aldehyde has a boiling point
between those of the corresponding alkane and alcohol. Aldehydes are usually soluble in common organic solvents and, except for the C . to C5 aldehydes,
are only sparingly soluble in water. The lower, C . to Cg, aldehydes have pungent, penetrating, unpleasant odors, some of which may be attributed to the
presence of the corresponding acids that form by air oxidation. Above Cg, aldehydes have more pleasant odors and some higher aldehydes are used in the
perfume and flavoring industries (see Perfumes). Interestingly, the C aldehyde, nonanal [124-19-6]\ is reported to possibly be a human sex pheromone (1).
Aldehydes must be kept from contact with air (oxygen) to retain purity.
Kirk-Othmer Encyclopedia of Chemical Technology (4th Edition)
469
ALDEHYDES
Voll
Table 2. Properties of Aldehydes
Aldehyde CAS Registry Number Molecular formula Molecular weight Melting point, °C Boiling point, °C Solubility, g/ 100g water
formaldehyde [500-00-0] ch2o 30.03 -У2 -21 v sol
acetaldehyde [75-07-0] C2H4O 40.05 -121 20 v sol
propionaldehyde [123-38-6] C3H6O 58.08 -81 49 16
butanal (^-butyraldehyde) [123-72-8] C4H8O 72.1 -99 75 7
2-methylprop anal [78-84-2] C4H8O 72.1 -66 64 11
(is obutyraldehyde) pentanal (^-valeraldehyde) [110-62-3] C5H10O 86.13 -91 103 sl s
3-methylbutanal [590-86-3] C5H10O 86.13 -51 93 si s
(is о valeraldehyde) hexanal (caproaldehyde) [66-25-1] C6H12O 100.16 -56 131 sl s
benzaldehyde [100-52-7] C7H,O 106.13 -26 179 0.3
heptanal (heptaldehyde) [111-71-7] C7H14O 114.19 -42 155 0.1
octanal (caprylaldehyde) [124-13-0] C8H16O 128.21 171 sl s
phenylacetaldehyde [122-78-1] CHO 120.16 33 194 sl s
o-1 olu aldehyde [529-20^-] CHO 120.14 202 sl s
m-1 olu aldehyde [620-23-5] CHO 120.14 199 sl s
p-1 olu aldehyde [104-87-0] CHO 120.14 205 sl s
s alicylaldehyde [90-02-8] C7H6O2 122.12 2 197 1.7
(<9-hydroxybenz aldehyde) ^-hydroxybenz aldehyde [123-08-0] C7H6O2 122.12 116 1.4
(4-formylphenol) p- anis aldehyde (^-methoxybenz aldehyde) [123-11-5] C8H8O2 136.14 0 248 0.2
Spectroscopic Properties. Characteristic aldehyde absorptions are summarized in Table 3. A carbonyl stretching frequency between 1720 and
1740 cm-1 in saturated compounds is lowered in unsaturated ones where there is conjugation with the carbon—oxygen double bond. The carbonyl group
also exhibits a weak ultraviolet absorption near 280 nm as a result of the excitation of one of the unshared electrons on the oxygen atom. Both proton
^H-nmr) and carbon-13 ^C-nmr) nmr spectra are often highly descriptive. The proton adjacent to the carbonyl exhibits a strong downfield (about 10
ppm) resonance relative to the standard tetramethylsilane, TMS, as does the carbonyl carbon which appears at about 200 ppm, again relative to TMS. The
low field nmr resonances and the intensity of the stretching frequency are attributable to the polar nature of the carbon—oxygen double bond.
Table 3. Spectroscopic Absorptions of Aldehydes
Compound Ir, cm 1 a Uv, nm 1 т т b H-nmr, ppm 13C-nmr, ppc
acetaldehyde 1730 290 9.80 200
butyraldehyde 1725 283 9.74 202
benzaldehyde 1695 278 10.00 192
2-butenal 1700 301 9.48 193
Carbonyl stretching frequency.
Aldehyde proton, relative to TMS.
Carbonyl carbon, relative to TMS.
Chemical Properties
Aldehydes are very reactive compounds. Reactions generally fall into two classes: those direcdy affecting the carbonyl group and those involving the
adjacent carbon atom. The polar nature of the carbonyl moiety lends itself to nucleophilic addition and also controls the reactivity of the alpha carbon atom
by rendering the hydrogens attached to this carbon relatively acidic. Species having acidic hydrogens are referred to as active methylene compounds and
must be protected against inadvertent contact with bases as such contact results in a highly exothermic condensation reaction that may become dangerous.
There are many available references offering detailed descriptions of aldehyde reactions (2—6). Many of the reactions involving aldehydes have been named
for their discoverers and comprehensive reviews of name reactions are also available (7—9).
Reduction Reactions. Aldehydes can be hydrogenated to the corresponding alcohol using a heterogeneous catalyst, for example
CH3CH2CH2CHO . CH3CH2CH2CH2OH
Common catalyst compositions contain oxides or ionic forms of platinum, nickel, copper, cobalt, or palladium which are often present as mixtures of more
than one metal. Metal hydrides, such as lithium aluminum hydride [16853-85-3] or sodium borohydride [16940-66-2]y can also be used to reduce aldehydes.
Depending on additional functionalities that may be present in the aldehyde molecule, specialized reducing reagents such as trimethoxyaluminum hydride
or alkylboranes (less reactive and more selective) may be used. Other less industrially significant reduction procedures such as the Clemmensen reduction or
the modified Wolff-Kishner reduction exist as well.
Oxidation Reactions. In general, the aldehyde function is easily oxidized to form the corresponding carboxylic acid.
RCHO -------> °* RCO2H
caraiysr
This is the basis for many industrially significant preparations, eg, acetaldehyde to acetic acid [64-19-7] (see Acetic acid and derivatives), propionaldehyde
to propionic acid [79-09-47]\ furfural [98-01-1] to furoic acid [26447-28-9]\ and acrolein to acrylic acid [79-10-7] (see Acrylic acid and derivatives). Air is the
common oxidant and homogeneous metal catalysts are used. Alternatively, a variety of oxidizing reagents are available to perform this transformation.
Although both chromium and manganese compounds can be used, an aqueous solution of potassium permanganate [7722-64-7] under either acidic or
basic conditions is the more commonly employed reagent. Other reagents that have been used for the oxidation of aldehydes include fuming nitric acid and
Kirk-Othmer Encyclopedia of Chemical Technology (4th Edition)
470
ALDEHYDES
Voll
a suspension of silver oxide in aqueous alkali. The latter provides a very mild and selective method for this type of oxidation.
Aldehydes can undergo an intermolecular oxidation—reduction (Cannizzaro reaction) in the presence of base to produce an alcohol and a carboxylic
acid salt. Any aldehyde is capable of participating in such a reaction, however, it is more common for those containing no protons on the alpha carbon, for
example
2 C6H5CHO ------->NaOH C6H5CH2OH + C6H5CO2Na
The Tischenko reaction is a related transformation where the product is an ester.
О
2 RCH2CHO а|(ОСН2СНз)з > RCH2CH2OCCH2R
Aldol Addition and Related Reactions. Procedures that involve the formation and subsequent reaction of anions derived from active
methylene compounds constitute a very important and synthetically useful class of organic reactions. Perhaps the most common are those reactions in
which the anion, usually called an enolate, is formed by removal of a proton from the carbon atom alpha to the carbonyl group. Addition of this enolate to
another carbonyl of an aldehyde or ketone, followed by protonation, constitutes aldol addition, for example
2CH3CHO ------->HG1 CH3CH(OH)CH2CHO
The name aldol was introduced by Wurtz in 1872 to describe the product resulting from this acid-catalyzed reaction of acetaldehyde. The addition will
occur with base catalysis as well.
The ^-hydroxy aldehyde which forms during aldol addition is not usually isolated; it readily dehydrates to form an CC,P-unsaturated aldehyde. This
overall transformation is commercially employed to produce 2-ethyl-2-hexenal [26266-68-2] often referred to as ethylpropylacrolein, from butyraldehyde
(qv). The ethylpropylacrolein is then hydrogenated to produce 2-ethylhexanol, a commercially significant plasticizer alcohol (See Alcohols, higher
aliphatic). The next higher homologue, a C10 alcohol mixture containing 2-propylheptanol, can be produced in an analogous fashion from a valeraldehyde
product mixture resulting from hydroformylating a mixed butenes stream (see Butylenes). This hydroformylation is accomplished using a new generation
of highly active phosphite-promoted rhodium catalysts.
Other reactions similar to the aldol addition include the Claisen and Perkin reactions. The Claisen reaction, carried out by combining an aromatic
aldehyde and an ester in the presence of metallic sodium, is useful for obtaining CC,P-unsaturated esters.
C6H5CHO + CH3CO2C2H5 -^5oc C6H5CH=CHCO2C2H5
The Perkin reaction, utilizing an aromatic aldehyde, an acid anhydride, and a base such as an acid salt or amine, produces the corresponding
CC,P-unsaturated acid.
C6H5CHO + (CH3CO)2O --------->(g2h5)3n c6H5CH=CHCO2H + CH3CO2H
Analogously, aldehydes react with ammonia [7664-41 -7] or primary amines to form Schiff bases. Subsequent reduction produces a new amine. The addition
of hydrogen cyanide [74-90-8]> sodium bisulfite [7631-90-5]> amines, alcohols, or thiols to the carbonyl group usually requires the presence of a catalyst to
assist in reaching the desired equilibrium product.
Addition of water or alcohols to aldehydes leads to the formation of a class of compounds known as acetals. This is an acid catalyzed reaction
H. ^OR'
RCHO + 2 ROH ------- RCH + H2O
^OR'
and the first addition product, a hemiacetal or gem-diol, is unstable, the equilibrium generally favoring the parent aldehyde. Subsequent steps involve
protonation of the —OH which leads to a stabilized carbonium ion, followed by addition of a second alcohol molecule. Acetals have been used in racing
car fuels, gasoline additives, and paint and varnish solvents and strippers. Acetals of higher aldehydes have fragrances similar to but not so pungent as the
parent aldehydes. Because they are not as sensitive to alkalies or autoxidation, acetals find use as fragrances for alkaline substances such as soaps, shampoos
and heavy-duty detergents.
Another very important reaction initially involving nucleophilic attack on an aldehyde carbonyl is the Wittig reaction. An ylid adds to the carbonyl
forming a betaine intermediate which then decomposes to produce an olefin and a tertiary phosphine oxide.
(C6H5 )3P + RR'CHBr ------->"-с<н.ч (C6H5)3P+—C"RR'
(C6H5)3P+—C"RR' + R"CH2CHO (C6H5)3PO + RR'C=CHCH2R"
Perhaps the most notable example of this chemistry is in the production of vitamin A [68-26-8]\ where the P-ionylidenacetaldehyde is condensed with the
ester-ylid to obtain the polyene ester. Reduction then yields vitamin A (see Vitamins).
The reaction has been extended to include carbanions generated from phosphonates. This is often referred to as the Homer-Wittig or
Homer-Emmons reaction. The Homer-Emmons reaction has a number of advantages over the conventional Wittig reaction. It occurs with a wider variety
of aldehydes and ketones under relatively mild conditions as a result of the higher nucleophilicity of the phosphonate carbanions. The separation of the
olefinic product is easier due to the aqueous solubility of the phosphate by-product, and the phosphonates are readily available from the Arbusov reaction.
Furthermore, although the reaction itself is not stereospecific, the majority favor the formation of the trans olefin and many produce the trans isomer as
the sole product.
A new class of synthetic aldehyde reactions involves effectively reversing the polarity of the carbonyl group by forming a dithiane intermediate.
HS—CH2 . C6H5 s
С6н5— CH + Deprotonation yields an anion available for alkylation. c6H5 s- Л- Hydrolysis of the resulting dithiane yields a ketone. /Сн2 У ) + H2O HS—CH2 H S—' “\ 1.n-BuLi C6H5 _/ 2. CH3CHICH3 CH3_^SA CH3
Kirk-Othmer Encyclopedia of Chemical Technology (4th Edition)
471
ALDEHYDES
Voll
C6H5 S—4 ♦
CH3—CH s—'
CH3
C6H5^ "''CH—CH3
CH3
Manufacture
Only a few of the wide variety of synthetic procedures which yield aldehydes as products are used for large-scale commercial preparation. A more complete
discussion of syntheses can be found in the literature (10,11).
Hydroformylation of an olefin using synthesis gas, the oxo process (qv), was first commercialized in Germany in 1938 to produce propionaldehyde
from ethylene and butyraldehydes from propylene (12).
rch=ch2 + co + h2 03131751 ► RCH—CH3 + RCH2CH2CHO
CHO
Recent advances in technology involving a new class of highly reactive phosphite-promoted catalysts permit the manufacture of higher (C7 to C15)
aldehydes and the hydroformylation of internal olefins at low temperatures and pressures. Fatty aldehydes, generally produced by dehydrogenation of
corresponding alcohols in the presence of a suitable catalyst, can now be manufactured using oxo technology.
The direct oxidation of ethylene is used to produce acetaldehyde (qv) in the Wacker-Hoechst process. The catalyst system is an aqueous solution of
palladium chloride and cupric chloride. Under appropriate conditions an olefin can be oxidized to form an unsaturated aldehyde such as the production of
acrolein [107-02-8] from propylene (see Acrolein and derivatives).
Another commercial aldehyde synthesis is the catalytic dehydrogenation of primary alcohols at high temperature in the presence of a copper or a
copper-chromite catalyst. Although there are several other synthetic processes employed, these tend to be smaller scale reactions. For example, acyl halides
can be reduced to the aldehyde (Rosenmund reaction) using a palladium-on-barium sulfate catalyst. Formylation of aryl compounds, similar to
hydroformylation, using HCN and HC1 (Gatterman reaction) or carbon monoxide and HC1 (Gatterman-Koch reaction) can be used to produce aromatic
aldehydes.
ArH+CO ---------> нсдС!2 ’ Alois ArCHO
Additionally, Grignard reagent reacts with an alkyl orthoformate to form an acetal which is then hydrolyzed to the corresponding aldehyde using dilute
acid.
CH3CH2MgX + HC(OR)3 ---* CH3CH2CH(OR)2 ---* CH3CH2CHO + ROH
Mg(OR)X
Production and Economic Aspects
As can be seen from Table 4, formaldehyde is clearly the most commercially significant of the aldehydes. Only a small selection of the less commercially
significant products are listed, however.
Table 4. Production of Aldehydes
Aldehyde Production, 103 t/yr 1990 prices, $/kg
U.S./Canada Europe East Asia Total
formaldehyde 4900 6200 2900 14000 0.23
acetaldehyde 340 740 650 1730 1.02
propionaldehyde 140 100 100 340 0.83
butyraldehyde 1500 1500 1000 4000 0.84
phenylacetaldehyde 9.90
s alicylaldehyde 3 9.24
p- anis aldehyde 2 0.20
Table 5 contains a listing of representative aldehyde producers. Only the products identified in Table 4 have been included.
Table 5. Aldehyde Producers
Company Aldehyde product
United States and Canada
Aristech Chemical Corp. BASF Corp. Borden Chemical E. I. du Pont de Nemours Eastman Georgia-Pacific Corp. Givauden Corp. Hoechst Celanese Koch Industries Penta Manufacturing Reichhold Limited Шхфпе—Polenc Inc. Union Carbide butyraldehyde butyraldehyde formaldehyde formaldehyde acetaldehyde, propionaldehyde, butyraldehyde formaldehyde phenylacetaldehyde, p- anis aldehyde formaldehyde, acetaldehyde, propionaldehyde, butyraldehyde p- anis aldehyde p- anis aldehyde formaldehyde s alicylaldehyde propionaldehyde, butyraldehyde Uurope
BASF Bayer Borden Chemical formaldehyde, propionaldehyde, butyraldehyde,^-anisaldehyde s alicylaldehyde formaldehyde
Kirk-Othmer Encyclopedia of Chemical Technology (4th Edition)
472
ALDEHYDES
Voll
Chemie Linz Degussa Givauden Hoechst AG Hbls Lonza Neste Oxo AB NORSOLOR Oxochimie phenylacetaldehyde formaldehyde phenylacetaldehyde, p- anis aldehyde acetaldehyde, butyraldehyde acetaldehyde, butyraldehyde acetaldehyde butyraldehyde formaldehyde butyraldehyde Past Asia
Chisso Corp. Daicel Chemical Kyowa Yuka Lucky Ltd. Midori Kagaki Co. Mitsubishi Kasei Mitsui Ogawa Co. Seimi Chemical Co., Ltd. Showa Denko К. K. Showa High Polymer Soda Aromatic Sumitomo Tokuyama Petrochemical Tonen Corp. butyraldehyde phenylacetaldehyde acetaldehyde, butyraldehyde butyraldehyde p- anis aldehyde formaldehyde, acetaldehyde, propionaldehyde, butyraldehyde formaldehyde, acetaldehyde p- anis aldehyde s alicylaldehyde acetaldehyde, phenylacetaldehyde formaldehyde p- anis aldehyde formaldehyde acetaldehyde butyraldehyde
Characterization
Aldehydes can be characterized qualitatively through the use of Tollens' or Fehling's reagents as well as by spectroscopic means. The use of Tollens'
reagent, a solution of silver nitrate in dilute, basic, aqueous ammonia, leads to the deposition of a silver mirror in the presence of an aldehyde. Fehling's
reagent, an aqueous solution of copper sulfate, sodium potassium tartrate, and sodium hydroxide, produces a reddish brown precipitate of cuprous oxide
in the presence of an aldehyde. Additionally, aldehyde carbonyl groups can be derivatized. Aldehyde oximes, phenylhydrazones, 2,4-dinitrohydrazones,
semicarbazones, or sodium bisulfite addition products can be generated, purified, and characterized by their distinctive melting points. Hydrazone
derivatives are often useful in isolating the aldehyde as a solid, crystalline material. The carbonyl group may also be oxidized to an acid through the use of
hydrogen peroxide or potassium permanganate and the resultant carboxylic acid characterized by its spectroscopic properties and derivatives.
Toxicology
Interest in the toxicity of aldehydes has focused primarily on specific compounds, particularly formaldehyde, acetaldehyde, and acrolein (13). Litde evidence
exists to suggest that occupational levels of exposure to aldehydes would result in mutations, although some aldehydes are clearly mutagenic in some test
systems. There are, however, acute effects of aldehydes.
Irritation and Sensitization. Low molecular weight aldehydes, the halogenated aliphatic aldehydes, and unsaturated aldehydes are
particularly irritating to the eyes, skin, and respiratory tract. The mucous membranes of nasal and oral passages and the upper respiratory tract can be
affected, producing a burning sensation, an increased ventilation rate, bronchial constriction, choking, and coughing. If exposures are low, the initial
discomfort may abate after 5 to 10 min but will recur if exposure is resumed after an intermption. Furfural, the acetals, and aromatic aldehydes are much
less irritating than formaldehyde and acrolein. Reports of sensitization reactions to formaldehyde are numerous.
Anesthesia. Materials that have unquestionable anesthetic properties are chloral hydrate [302-17-0]\ paraldehyde, dimethoxymethane [109-87-5]\
and acetaldehyde diethyl acetal. In industrial exposures, however, any action as an anesthesia is overshadowed by effects as a primary irritant, which prevent
voluntary inhalation of any significant quantities. The small quantities which can be tolerated by inhalation are usually metabolized so rapidly that no
anesthetic symptoms occur.
Organ Pathology. The principal pathology experimentally produced in animals exposed to aldehyde vapors is that of damage to the
respiratory tract and pulmonary edema. In general, the aldehydes are remarkably free of actions that lead to definite cumulative organic damage to tissues.
Thus the aldehydes cannot generally be regarded as potent carcinogens. Moreover, the intolerable irritant properties of the compounds preclude substantial
worker exposure under normal conditions.
There is a significant difference in the toxicological effects of saturated and unsaturated aliphatic aldehydes. As can be seen in Table 6, the presence
of the double bond considerably enhances toxicity. The precautions for handling reactive unsaturated aldehydes such as acrolein, methacrolein [78-85-3]y
and crotonaldehyde should be the same as those for handling other highly active eye and pulmonary irritants, as, for example, phosgene.
Table 6. Effect of Unsaturation on Toxicity of Aldehydes
Compound Formula LC50, ppm” LD50> '"S kg T\V \
acetaldehyde ch3cho 20000 1930 200
propionaldehyde CH3CH2CHO 26000 1410
acrolein CH2=CHCHO 130 25.9 0.1
is obutyraldehyde (CH3)2CHCHO >8,oood 2810
methacrolein CH2=C(CH3)CHO 250d 111
^-butyraldehyde CH3(CH2)2CHO 60000 2490
crotonaldehyde (2-butenal) CH3CH=CHCHO 1400 260 2
In rats, an exposure time of 30 min.
In rats, dosage administered orally.
C OSHA PEL.
Exposure time of 4 h.
Chemical safety data sheets for individual compounds should be consulted for detailed information. Precautions for the higher aldehydes are
essentially those for most other reactive organic compounds, and should include: adequate ventilation in areas where high exposures are expected; fire and
explosion precautions; and proper instruction of employees in use of respiratory, eye, and skin protection.
Kirk-Othmer Encyclopedia of Chemical Technology (4th Edition)
473
ALDEHYDES
Voll
Uses
Aldehydes find the most widespread use as chemical intermediates. The production of acetaldehyde, propionaldehyde, and butyraldehyde as precursors of
the corresponding alcohols and acids are examples. The aldehydes of low molecular weight are also condensed in an aldol reaction to form derivatives
which are important intermediates for the plasticizer industry (see Plasticizers). As mentioned earlier, 2-ethylhexanol, produced from butyraldehyde, is
used in the manufacture of di(2-ethylhexyl) phthalate [117-87-7]. Aldehydes are also used as intermediates for the manufacture of solvents (alcohols and
ethers), resins, and dyes. Isobutyraldehyde is used as an intermediate for production of primary solvents and rubber antioxidants (see Antioxidants). Fatty
aldehydes Cg—C13 are used in nearly all perfume types and aromas (see Perfumes). Polymers and copolymers of aldehydes exist and are of commercial
significance.
BIBLIOGRAPHY
"Aldehydes" in ECT 1st ed., Vol. 1, pp. 334—342 by E. F. Landau, Celanese Corporation of America, E. I. Becker, Polytechnic Institute of Brooklyn, and
О. C. Dermer, Oklahoma Agricultural and Mechanical College; in ECT 2nd ed., Vol. 1, pp. 639—648 by L. J. Fleckenstein, Eastman Kodak Co.; in ECT 3rd
ed., Vol. 1, pp. 790—798, by P. D. Sherman, Union Carbide Corporation.
1. J. Buckingham, Dictionary of Organic Compounds, 5th ed., Chapman and Hall, New York, 1982.
2. S. Patai, The Chemistry of the Carbonyl Groups Wiley-Interscience, New York, 1966 and 1970.
3. H. O. House, Modem Synthetic Reactions, 2nd ed., W. A. Benjamin, Inc., Menlo Park, Calif., 1972.
4. C. D. Gutche, The Chemistry of Carbonyl Compounds, Prentice-Hall, Inc., Englewood Cliffs, N.J., 1967.
5. A. T. Nielson and W. J. Houlihan, Organic Reactions, Vol. 16, John Wiley & Sons, Inc., New York, 1968.
6. T. Mukaiyama, Organic Reactions, Vol. 28, John Wiley & Sons, Inc., New York, 1982.
7. A. R. Surrey, Name Reactions in Organic Chemistry, 2nd ed., Academic Press, Inc., New York, 1961.
8. R. C. Denny, Named Organic Reactions, Plenum Press, New York, 1969.
9. H. Krauch and W. Kunz, Organic Name Reactions, 2nd ed., translated byj. M. Harkin, John Wiley & Sons, Inc., New York, 1964.
10. G. Hilgetag and A. Martini, eds., Preparative Organic Chemistry, 4th ed., Wiley-Interscience, New York, 1972, pp. 301—400.
11. Compendium of Organic Synthetic Methods-. Vol. 1, I. T. Harrison, ed., 1971, pp. 132—176; Vol. 2, I. T. Harrison, ed., 1974, pp. 53—69; Vol. 3, L. S.
Hegedus and L. G. Wade, Jr., eds., 1977, pp. 66-87; Vol. 4, L. G. Wade, Jr., ed., 1980, pp. 73-101; Vol. 5, L. G. Wade, Jr., ed., 1984, pp. 92-123;
Vol. 6, M. B. Smith, ed., 1988, pp. 51—66, Wiley-Interscience, New York.
12. J. Falbe, New Syntheses with Carbon Monoxide, Springer-Vedag, New York, 1980, pp. 1—181.
13. F. A. Patty, Patty's Industrial Hygiene andToxicology, John Wiley & Sons, Inc., New York, 1981, pp. 2629—2669.
David J. Miller
Union Carbide Chemicals and Plastics Corporation
Kirk-Othmer Encyclopedia of Chemical Technology (4th Edition)
474
Voll
ALDOL ADDITION.
See Addehhses; Kbtonbs.
ALDOSES.
See Carbohhsrates; Sugar.
ALE.
See Bbbr.
ALGAL CULTURES.
See Foods, Nonconvbntional.
ALGIN.
See Gums.
ALIZARIN.
See Dths and I ') ' Intermediates; Dtes, Anthraquinone.
Kirk-Othmer Encyclopedia of Chemical Technology (4th Edition)
475
ALKALI AND CHLORINE PRODUCTS
Voll
ALKALI AND CHLORINE PRODUCTS
Chlorine and sodium hydroxide,
Sodium carbonate,
Kirk-Othmer Encyclopedia of Chemical Technology (4th Edition)
476
CHLORINE AND SODIUM HYDROXIDE
Voll
CHLORINE AND SODIUM HYDROXIDE
PRODUCTION AND MANUFACTURE
Alkali and chlorine products are a group of commodity chemicals which include chlorine [7782-50-5], Cl2; sodium hydroxide (caustic soda) [1310-73-2],
NaOH; sodium carbonate (soda ash) [497-19-8], Na2CO3; potassium hydroxide (caustic potash [1310-58-3], KOH; and hydrochloric acid (muriatic acid or
anhydrous) [7647-01-0], HC1. Chlorine and caustic soda are the two most important products in this group, ranking among the top ten chemicals in the
United States. In 1989 chlorine and caustic soda were the eighth and nineth largest volume chemicals, respectively (Table 1). Soda ash, which competes
with caustic soda to satisfy the need for alkali (sodium oxide) in many processes, was the eleventh. The appEcation for chlorine and the alkalies are so
varied that there is hardly a consumer product which is not dependent on one or both of them at some manufacturing stage (2).
Table 1. United States 1989 Top 10 Chemicals Production*1
1989 Rank 1989 Production, 1061 Average annual growth, %
1988-1989 1984-1989 1979-1989
1 sulfuric acid 39.4 3.0 0.8 0
2 nitrogen 24.4 2.8 2.3 5.7
3 oxygen 17.1 0.9 3.4 0
4 ethylene 15.9 -6.0 2.2 1.6
5 ammonia 15.3 0.3 0.2 -1.0
6 limeb 15.0 3.0 0.6 -2.4
7 phosphoric acid 10.5 -1.0 0.3 1.1
8 chlorine 10.8е -0.9 0.8 -0.9
9 sodium hydroxide 11.3 5.2 0.3 -1.4
10 propylene 9.2 -4.7 5.4 3.6
aRef. 1.
Courtesy of American Chemical Society.
Except refractory dolomite.
C According to the Chlorine Institute, Inc.
Capacity and Consumption
In 1987 world chlorine capacity totaled 40.7 million tons while the world consumption was 34.5 million tons, so that the apparent world chlorine capacity
utiliza tion averaged 85%. As seen in Table 2, the North American continent had the highest percentage of world consumption (34.0%), followed by
Western Europe (28.7%), Eastern Europe (14.8%), Japan (8.5%), Asia (6.8%), and Latin America (4.3%). The two largest world markets for chlorine
constitute 39% of its demand. The manufacture of vinyl chloride monomer [75-01-4], C2H3C1, accounts for 26% of world chlorine demand and is the
largest chlorine use. The second largest world market for chlorine, at 13% of consumption, is pulp (qv) and paper (qv) manufacture, where it is used
primarily to bleach kraft pulp. Other major uses, shown in Table 3, are for the manufacture of ethylene dichloride [107-06-2], C2H2C12; chlorinated solvents;
propylene oxide [75-56-9], C?H : O; hypochlorites; and epichlorohydrin [106-89-8], C3H5C1O; and for use in water treatment.
Table 2. 1987 World Chlorine Capacity and Consumption by Region*
Capacity, 103 t Consumption, 103 t Percentage of world capacity Percentage of world consumption
North America 12,050 11,710 29.6 34.0
United States 10,240 10,340 25.2 30.0
Canada 1,810 1,370 4.4 4.0
Western Europe 11,540 9,890 28.4 28.7
Eastern Europe 6,840 5,110 16.8 14.8
Japan 3,930 2,940 9.7 8.5
Asia and Pacific 3,390 2,350 8.3 6.8
Latin America 1,790 1,500 4.4 4.3
Middle East 680 590 1.7 1.7
Africa 460 420 1.1 1.2
World total 40,680 34,510 100.0 100.0
aRef. 3.
Courtesy ofTecnon Consulting Group.
Table 3. 1987 World Chlorine Demand by Consuming Sector*
Chlorine usage
103t
Quantity consumed
Percentage
Kirk-Othmer Encyclopedia of Chemical Technology (4th Edition)
477
CHLORINE AND SODIUM HYDROXIDE
Voll
vinyl chloride monomer 9,012 26.1
pulp and paper 4,599 13.3
propylene oxide 1,990 5.8
water treatment 1,237 3.6
carbon tetrachloride 934 2.7
perchloroethylene 687 2.0
hypochlorite 681 2.0
epichlorohydrin 600 1.7
1,1,1 - trichlo г о ethane 560 1.6
methylene chloride 520 1.5
chloroform 464 1.3
methyl chloride 459 1.3
ethylene dichloride (solvent) 401 1.2
trichloroethylene 368 1.1
chlorobenzene 355 1.0
chloroprene 246 0.7
bromine 129 0.4
ethylene dichloride (trade) 50 0.1
chlorinated polyethylene 16 >0.1
miscellaneous organic 4,988 14.5
miscellaneous inorganic 6,215 18.0
Total 34,511 100.0
aRef. 3.
Courtesy ofTecnon Consulting Group.
Chlorine cannot be stored economically or moved long distances. International movements of bulk chlorine are more or less limited to movements
between Canada and the United States. In 1987, chlorine moved in the form of derivatives was 3.3 million metric tons or approximately 10% of total
consumption (3). Exports of ethylene dichloride, vinyl chloride monomer, poly(vinyl chloride), propylene oxide, and chlorinated solvents comprise the
majority of world chlorine movement. Countries or areas with a chlorine surplus exported in the form of derivatives include Western Europe, Brazil, USA,
Saudi Arabia, and Canada. Countries with a chlorine deficit are Taiwan, Korea, Indonesia, Venezuela, South Africa, Thailand and Japan (3).
Caustic soda and chlorine are coproducts and consequendy caustic soda production has been limited by chlorine demand. Through 1992 world
demand for caustic soda is expected to grow at a higher rate than the demand for chlorine and pressures limiting chlorine growth are expected to tighten
world caustic soda supplies (4). This tightening will presumably be addressed by switching to soda ash usage where ever possible. In addition, production
of sodium hydroxide by the lime—soda process is again gaining favor (see Alkali and chlorine products, sodium carbonate).
United States Chlorine Production. The record high for United States chlorine production occurred in 1979 at 11.2 million tons, followed
by a decline resulting in large part from the recessions of 1980 and 1981—1982, which led to a chlorine production low of 8.3 million tons in 1982. Chlorine
enjoyed a relatively steady growth throughout the 1980s. Production increased to 10.0 million tons in 1987, then again to 10.5 million in 1988. Furthermore,
chlorine production increased to 10.7 million tons in 1989 and remained flat at 10.7 million tons in 1990. Despite the strong economy of recent years,
however, United States chlor—alkali production is still below 1979 levels because of the relative maturity of chlorine usage industries and the environmental
pressures since the early 1980s aimed at curtailing use. Furthermore, leading edge technologies such as oxygen delignification and an increase in the
substitution of chlorine dioxide [10049-04-4f C1O2, for chlorine are expected to decrease chlorine use in Canadian pulp and paper. This may create a
surplus Canadian chlorine supply which could potentially flow into the U.S. market and slow future U.S. chlorine production.
In 1988 diaphragm cells accounted for 76% of all U.S. chlorine production, mercury cells for 17%, membrane cells for 5%, and all other production
methods for 2%. Corresponding statistics for Canadian production are diaphragm cells, 81%; mercury cells, 15%; and membrane cells, 4% (5). For a
number of reasons, including concerns over mercury pollution, recent trends are away from mercury cell production toward the more environmentally
acceptable membrane cells, which also produce higher quality product and have favorable economics.
Chlorine is produced as a gas that is used captively, transferred to customers via pipeline, or liquefied. Liquid chlorine, of higher purity than gaseous
chlorine, is either used internally by the producers or marketed. The percentage of U.S. chlorine gas production subsequently liquefied has increased over
the past ten years reflecting higher demand for high purity chlorine. This percentage was 60.7% in 1978 and 81.1% in 1987 (5). The majority of this chlorine
is consumed captively.
United States Caustic Soda Production. In 1987 U.S. production of caustic soda increased to 10.4 million tons (Fig. 1), more than 10%
over that of the previous year. Furthermore, 1988 production was up another 6.7% to 11.1 million tons. The demand for caustic soda has been very strong
in recent years as evidenced by both increased U.S. consumption and a strong export demand. In 1987 the United States exported 1.5 million tons, 14.5%
of the total caustic soda production (6), representing a 25.5% increase over exports in 1986. Then, in 1988, caustic soda exports grew by another 4.1%. A
weak dollar helped boost the 1987 exports. Growth slowed in 1988, however, as a result of an industry (and world) wide caustic soda shortage, which was
caused by lower U.S. chlorine consumption and forced allocations. Because industries switched from caustic to soda ash where possible, the lower 1988
export growth was not indicative of caustic soda's export potential.
Year
Fig. 1. United States chlorine and caustic soda production: □, annual chlorine capacity; O, caustic soda production; O, chlorine production (6).
Courtesy of Chemical Economics Handbook.
Because chlorine and caustic soda are electrolysis coproducts and chlorine cannot be stored economically, caustic soda production has been very
Kirk-Othmer Encyclopedia of Chemical Technology (4th Edition)
478
CHLORINE AND SODIUM HYDROXIDE
Voll
dependent on both short term and long term chlorine demand and production. Unlike chlorine, however, caustic soda is not under environmental pressure
and its growth potential is strong. The molecular weights of caustic soda (39.997) and of chlorine (70.914) result in a theoretical caustic soda to chlorine
weight production ratio of 1.128:1 for a 2:1 mole production ratio. However, using Chlorine Institute production data, the calculated 1988 ratio was
1.057:1. This discrepancy exists for a variety of reasons: some chlorine plants do not employ electrolytic methods; some plants that use electrolytic methods
produce sodium metal [7440-23-5], Na, as a by-product; and some electrolytic plants use potassium chloride instead of sodium chloride feed to produce
potassium hydroxide [1310-58-3]., KOH, as the coproduct. FMC presendy produces small amounts of caustic soda, used internally as a sodium cyanide
feedstock, by causticizing soda ash. Furthermore, Tenneco Inc. recently announced plans to build a plant to produce 68,000 t/yr of 50% caustic soda using
a soda ash feed.
Energy Requirements. An electrochemical unit (ECU) in the chlorine industry represents the stoichiometric yield of 1 mole of Cl2 and 2 of
NaOH. The minimum amount of energy required to produce 1 ECU per 1.0 ton of Cl2 and 1.128 tons of NaOH is 6.05 GJ (5.75 x 10⁶ Btu or 1686
kW h); to produce 1 ECU per short ton of Cl2 and 1.128 short tons of NaOH, 5.50 GJ (5.23 x 10⁶ Btu or 1534 kW h) is needed. The total energy
consumed by the chlor—alkaE industry in 1988 for U.S. chlorine production (10.5 million tons) was 1% of the total U.S. annual electrical consumption of
-2200 billion kW h.
Chlorine Capacity. In 1982 U.S. chlorine capacity reached a record high of 36,864 t/day (13.2 million tons per year) as shown in Figure 1.
After 1982, decreased chlorine demand lowered market prices and some producers discontinued production, so that capacity dropped to 31,888 t/day in
1987 (5). Expansion to meet demandled to an increased capacity in March of 1989 of 32,550 t/day (11.1 x 10⁶ t/yr).
In 1989 chlorine was produced by 25 companies at 52 locations in the United States (Table 4). Approximately half of these plants are located in the
Southeast (Fig. 2). Two companies, Dow Chemical USA and Occidental Chemical Corporation, accounted for 54.3% of the total operating capacity; the
top five companies accounted for 77.5%. Although 0.8 million tons per year of chlorine capacity is presendy idle (Table 4), announced expansions are
expected to bring an additional 660,000 t of new chlorine capacity onstream by 1992, increasing total capacity by about 6%/yr (Table 5).
Table 4. Chlorine Plants in the United States*
Annual capacity 103 t/yr Yearc built Cell type Notes'
Akzo Chemicals Inc. Le Moyne, Ala. Amax Magnesium Corp. 70.8 1965 De Nora 22 x 5 mercury 1
Rowley, Utah American Magnesium Co. 13.6 1977 modified IG Farben magnesium 9
Snyder, Tex. Atochem USA 1969 VAMI magnesium 8,9
Pordand, Oreg. 136.1 1947 OxyTech MDC29 1
Tacoma, Wash. Cedar Chemical Co. 82.6 1929 ICI FM21 membrane '85 1
Vicksburg, Miss. Dow Chemical USA 32.7 1962 nonelectrolytic 6
Freeport, Oyster Creek, Tex. 1,986.8е 1940 Dow diaphragm, Dow magnesium 1,9
Pittsburg, Calif. 132.5 1917 Dow diaphragm 1
Plaquemine, La. E. I. du Pont de Nemours & Co. 1,049.6 1958 Dow diaphragm 1
Niagara Falls, N.Y. 77.1 1898 Downs sodium 4
Formosa Plastics Corp., USA Baton Rouge, La. Fort Howard Corp. 179.6 1937 ICI-DMT diaphragm, '81 1
Green Bay, Wis. 8.2 1968 OxyTech HC3C diaphragm 1,7
Muskogee, OHa. General Electric Co. 5.4 1980 ICI FM21 membrane '85 1,7
Mount Vemon, Ind. 49.9 1976 OxyTech H2A diaphragm 1
Burkville, Ala. 23.6 1987 OxyTech H2A diaphragm 1
Georgia Gulf Corp. Plaquemine, La. 385.6 1975 OxyTech H4 diaphragm 1
Georgia-Pacific Corp. Bellingham, Wash. 81.6 1965 De Nora 18 x 4 mercury 1,7
Brunswick, Ga. B. F. Goodrich Group 48.1 1967 Ashai Chem membrane '83 1,7
Calvert City, Ky. 108.9 1966 De Nora 24H5 mercury 1
Hercules, Inc. Hopewell, Va. La Roche Chemicals 1939 OxyTech HC3 diaphragm 1,8
Gramercy, La. LCP Chemicals 181.4 1958 OxyTech НСЗВ, HC3C diaphragm 1
Acme, N.C. 48.1 1963 Solvay V-200 mercury 1
Ashtabula, Ohio 36.3 1963 Olin E11F mercury 2
Brunswick, Ga. 96.2 1957 Solvay V-100 mercury 1
Moundsville, W.Va. 78.9 1953 Solvay S60 mercury 1
Orrington, Mass. 72.6 1967 De Nora 24H5 mercury 1
Syracuse, N.Y. f 1927 Solvay S60 mercury, '53 1
Mobay Chemical Corp. Baytown, Tex. NiachlorS 81.6 1972 Uhde (HC1) 5
Niagara Falls, N.Y. 199.6 1987 Asahi membrane '87 1
Occidental Chemical Corp. Convent, La. 278.5 1981 OxyTech MDC55 diaphragm 1
Corpus Christi, Tex. 417.3 1974 OxyTech MDC55 diaphragm 1
Deer Park, Tex. 347.5 1938 OxyTech MDC21 diaphragm 1
1938 De Nora 18 x 6 mercury 1
Delaware City, Del. 126.1 1965 De Nora 18 x 4 mercury 3
LaPorte, Tex. 480.0 1974 OxyTech MDC 29 diaphragm 1
Kirk-Othmer Encyclopedia of Chemical Technology (4th Edition)
479
CHLORINE AND SODIUM HYDROXIDE
Voll
Mobile, Ala. 33.6 1964 De Nora 18 x 4 mercury, OxyTech MGC membrane, '91 3
Muscle Shoals, Ala. 132.5 1952 De Nora 12 x 3 mercury 3
Niagara Falls, N.Y. 293.0 1898 OxyTech H4 diaphragm, '74, '78 1
Tacoma, Wash. 202.3 1929 OxyTech H4, diaphragm 1
1929 OxyTech MGC membrane '88 1
Taft, La. 569.7 1966 OxyTech HC4B, H4 '75 diaphragm 1
1966 OxyTech MGC membrane '86 1
Olin Corporation Augusta, Ga. 101.6 1965 Olin E11F mercury 1
Charleston, Tenn. 230.4 1962 Olin E11F, E812 mercury 1
McIntosh, Ala. 331.1 1952 OxyTech H4 diaphragm, '77—'78 1
Niagara Falls, N.Y. 81.6 1897 Olin E11F mercury '60 3
Oregon Metallurgical Corp. Albany, Oreg. 1.8 1971 Alcan magnesium 9
Pioneer Chlor-Alkali Co., Inc. Henderson, Nev. 104.3 1942 OxyTech MDC29 diaphragm '76 1
St. Gabriel, La. PPG Industries 159.7 1970 Uhde 30 m2 mercury 1
Lake Charles, La. 1,041.5 1947 De Nora 48H5 mercury '69 1
1947 Glanor 1144 diaphragm '77, '80 1
1947 Bipolar 1161 diaphragm '83 1
New Martinsville, W.Va. 313.0 1943 Columbia N3, N6 diaphragm 1
1943 OxyTech MDC55 diaphragm '84 1
1943 Uhde 20-m2 mercury '58 1
RMI Company Ashtabula, Ohio 36.3 1949 Downs sodium 4
Titanium Metals Corp, of America Henderson, Nev. Vulcan Chemicals 1943 I.G. Farben magnesium 9
Geismar, La. 220.4 1976 OxyTech MDC55 diaphragm 1
Port Edwards, Wis. 65.3 1967 De Nora 24H5 mercury 3
Wichita, Kans. 165.1 1952 OxyTech НСЗВТ, H4 '75 diaphragm 1
1952 OxyTech membrane '83 1
Weyerhaeuser Company Longview, Wash. 136.1 1957 OxyTech MDC29 diaphragm '75 1,7
Total 11,135.lt
a Refs. 5, 6.
Courtesy of SRI International and The Chlorine Institute, Inc.
Operating capacity as of March 1989. Idled capacity is noted where information is available.
C Refers to year chlorine production started at location.
d, ,
Notes:
(1) Electrolytic plant producing caustic soda, chlorine, and hydrogen from brine.
(2) Electrolytic plant producing caustic potash, chlorine, and hydrogen from brine.
(3) Electrolytic plant producing caustic soda, caustic potash, chlorine, and hydrogen from brine.
(4) Electrolytic plant producing metallic sodium and chlorine from molten sodium chlorine.
(5) Electrolytic plant producing chlorine and hydrogen from hydrochloric acid.
(6) Nonelectrolytic plant producing chlorine and potassium nitrate.
(7) Pulp mill.
(8) Not operating.
(9) Electrolytic plant producing magnesium and chlorine from molten magnesium chloride.
e Idled capacity = 662.3 t/yr.
^Idled capacity = 82.6 t/yr.
A Du Pont—Olin partnership.
h Total idled capacity = 744.9 t/yr.
Kirk-Othmer Encyclopedia of Chemical Technology (4th Edition)
480
CHLORINE AND SODIUM HYDROXIDE
Voll
Fig. 2. Operating chlor—alkali plants in the United States and Canada (5). Courtesy of the Chlorine Institute, Inc. (500 miles = 800 km.)
Table 5. Publicly Announced Chlor-Alkali Expansions
Year Producer Location Chlorine expansions, t/day
1990 Atochem, USA Portland, Oreg. 100a
1992 Formosa Plastics Point Comfort, Tex. 1720
a Conversion to membrane cells.
Chlorine Per Capita Consumption. The U.S. per capita consumption of chlorine increased rapidly from 1955 to 1970, with an average
annual growth of 5.8% (Fig. 3). There has beenlitde, if any, growth since 1970 however, and recessionary effects, product maturity, and environmental
pressures are evidenced in the cyclic fluctuations. Fluctuations in per capita consumption of chlorine and caustic have more or less tracked each other over
the years, although chlorine per capita consumption has consistendy exceeded that of caustic soda since 1967.
Fig. 3. Annual per capita consumption of caustic (O) and chlorine (□) in the United States (6)).
Courtesy of Chemical Economics Handbook.
Electrolytic Decomposition of Sodium Chloride
Chlorine and caustic soda are coproducts of electrolysis of aqueous solutions of sodium chloride [7647-14-5f NaCl, (commonly called brine) following the
overall chemical reaction
2 NaCl + 2 H2 О --------->energy 2 NaOH + Cl2 + H2
(1)
Kirk-Othmer Encyclopedia of Chemical Technology (4th Edition)
481
CHLORINE AND SODIUM HYDROXIDE
Voll
This reaction has a positive free energy of 422.2 kJ (100.9 kcal) at 25°C and hence energy has to be supplied in the form of d-c electricity to drive the
reaction in a net forward direction. The amount of electrical energy required for the reaction depends on electrolytic cell parameters such as current density,
voltage, anode and cathode material, and the cell design.
Conversion of aqueous NaCl to CL and NaOH is achieved in three types of electrolytic cells: the diaphragm cell, the membrane cell, and the
mercury cell. The distinguishing feature of these cells is the manner by which the electrolysis products are prevented from mixing with each other, thus
ensuring generation of products having proper purity.
The component electrochemical reactions are the discharge of chloride ions, Cl-, at the anode,
2C1“ Cl2 + 2 e“
(2)
and the generation of hydrogen [1333-74-0]\ H2, and hydroxide ions, OH , at the cathode.
2H2O + 2e“ ^H2 + 2OH
(3)
Chlorine is produced at the anode in each of the three types of electrolytic cells. The cathodic reaction in diaphragm and membrane cells is the electrolysis
of water to generate H2 as indicated, whereas the cathodic reaction in mercury cells is the discharge of sodium ion, Na+, to form dilute sodium amalgam.
Na+ + Hg + e~ NaHg
(4)
This amalgam then reacts separately with H2O in denuders or decomposers to produce H2 and NaOH.
2 NaHg + 2 H2O 2 NaOH + 2 Hg + H2
(5)
Separation of the anode and cathode products in diaphragm cells is achieved by using asbestos [1332-21-4]or polymer-modified asbestos
composite, or Polyramix deposited on a foraminous cathode. In membrane cells, on the other hand, an ion-exchange membrane is used as a separator.
Anolyte—catholyte separation is realized in the diaphragm and membrane cells using separators and ion-exchange membranes, respectively. The mercury
cells contain no diaphragm; the mercury [7439-97-6] itself acts as a separator.
The catholyte from diaphragm cells typically analyzes as 9—12% NaOH and 14—16% NaCl. This cell liquor is concentrated to 50% NaOH in a series
of steps primarily involving three or four evaporators. Membrane cells, on the other hand, produce 30—35% NaOH which is evaporated in a single stage to
produce 50% NaOH. Seventy percent caustic containing very litde salt is made direcdy in mercury cell production by reaction of the sodium amalgam from
the electrolytic cells with water in denuders.
Efficiency and Energy Consumption. The electrical energy consumed during the electrolysis of brine to produce chlorine gas and sodium
amalgam is greater than that used to generate Cl2 and H2 in the diaphragm or membrane cell. However, the latter processes also use energy in the form of
steam for evaporation of the cell liquor. Table 6 summarizes the major differences in the three technologies. The minimum energy required to convert salt
to Cl2, H2, and 50% NaOH (6.05 GJ/t of Cy is, of course, the same in all of these processes.
Table 6. Components of Diaphragm, Membrane, and Mercury Cells
Component Mercury cell Diaphragm cell Membrane cell
anode RuO2 + TiO2 coating on Ti substrate RuO2-based coating on Ti substrate RuO2 based coating on Ti substrate
cathode mercury on steel steel or steel coated with activated nickel steel or Ni based catalytic coating on nickel
diaphragm none asbestos, polymer-modified asbestos, or Polyramix (nonasbestos) ion-exchange membrane
cathode product sodium amalgam 10-12% NaOH + 15-17% NaCl and H2 30-33% NaOH + <0.01% NaOH and H2
decomposer product 50% NaOH and H2 none none
evaporator product none 50% NaOH with ~1.1% salt and solid salt 50% NaOH with 0.01% salt
steam consumption none 1500—2300 kg/1 NaOH 450-550 kg/tNaOH
cell voltage, V 4-5 3-4 2.8-3.3
current density, kA /m2 7-10 0.5-3 2-5
Faraday's law states that 96,487 coulombs (1 C = 1 A-s) are required to produce one gram equivalent weight of the electrochemical reaction product. This
relationship determines the minimum energy requirement for chlorine and caustic production in terms of kiloampere hours per ton of Cl2 or NaOH
c 96,487 x 1000
tor Cl Q---------------
2 60 x 60 x 35.45
for NaOH
96,487 x 1000
60 x 60 x 40
756 kA-h/t
670 kA-h/t
The current efficiency of an electrolytic process (t]current) is the ratio of the amount of material produced to the theoretically expected quantities.
Inefficiencies arise from secondary reactions occurring at the anode and cathode and in the bulk.
There are two parasitic reactions offsetting anode efficiency: (7) cogeneration of oxygen [7782-44-7], O2, from the anodic discharge of water,
2H2O .O2 ||| |C
(6)
and (2) electrochemical oxidation of hypochlorite ion, ОСИ, to chlorate, ClOj ,
6 CIO- + 3H2O -x 2 CIO- +4 Cl- +6 H+ + 3/2 O2 + 6 e-
0
The oxygen contribution from these reactions is dependent on the nature of the anode material and the pH of the medium. The current efficiency for
oxygen is generally 1—3% using commercial metal anodes. If graphite anodes are used, another overall reaction leading to inefficiency is the oxidation of
Kirk-Othmer Encyclopedia of Chemical Technology (4th Edition)
482
CHLORINE AND SODIUM HYDROXIDE
Voll
carbon to CO2:
C + 2H2O C02 + 2H2
(8)
At the cathode, water molecules are discharged yielding H2 gas and hydroxide ions, OH . Some of the caustic generated in the cathode
compartment back-migrates to the anode compartment and reacts with dissolved chlorine (Cl2^) to form chlorate as follows
C12(aq) +0H- -HOC1+C1-
(9)
H0C1 + 011.11,0 + оси
(10)
2 H0C1 + ОСГ CIO? + 2 H+ + 2 cr
(И)
There are two reactions that influence the cathodic efficiency, namely the reduction of OC1- and of CIO/ :
OC1“ + H20 + 2 e“ Cl“ + 2 0H“
(12)
CO, + 3 H20 + 6 e- —» Cl- + 6 on
(13)
Although these reactions are thermodynamically favorable, they are not kinetically significant under normal operating conditions. Hence cathodic efficiency
is usually high (>95%) in diaphragm and membrane cells. In mercury cells cathodic inefficiency arises from the discharge of H2 at the cathode resulting
from impurities in the brine. Reactions contributing to anodic inefficiency are the same as in diaphragm or membrane cells.
Current Efficiency. Current efficiency for caustic production in diaphragm and membrane cells can be estimated from collection of a known
amount of caustic over a period of time and from a knowledge of the number of coulombs of electricity passed during that time period. An alternative
method involves analysis of the gases evolved during electrolysis and determining the anolyte composition. Material balance considerations (7) show the
expression for the caustic efficiency for membrane cells to be
, nn f1 - (2J7V) {A-B + Y-D)
’/NaOH iuu<^ 1+(2%02/%Cl2)
(14)
where
3? CNaG1O3 (d)
106.45
3? cNaGlo з (f)
106.45
q ci2(a)
70.91
pX
70.91
; C O') is the concentration in grams per liter of in mediumjy a is anolyte, c is catholyte, f is feed brine, and d is depleted brine; Cl2(a) is Cl2
(soluble) + HOC1 + OC1-; F is the faraday constant (= 96, 487 C/mol); I is the load in A; j?) is the feed brine flow rate in L/s; q is the depleted brine flow
rate in L/s; and
X = 1.338 CNa2 СОз (f) + 0.844 CNaHGo3 (f) + 1.773 CNaOH (f)
For estimating Cl2 efficiency (T]ci2)’ the term Cl2(a) in equation 14 should be dropped. The corresponding expression for caustic efficiency for diaphragm
cells is
100
7/1,3011 ~ /+(2%02/%Cl2) +(80/Coh) (E-F)
(15)
where C-H is catholyte caustic concentration in g/L,
ЗС'ЫаС1Оз(а)
106.45
; and
F = [Cl2(a) -X]/70.91
For chlorine efficiency in diaphragm cells
100
~ 1 + (2%02/%Cl2) + (2.2546G) /COH
(16)
where G = CNaClo з (a) - CNaClo з (f).
Equation 16 is the correct material balance expression for calculating the chlorine efficiency of diaphragm cells. Whereas many approximate versions
are used (8), the one closest to equation 16 is the "six equation":
t?ci2
_______________100_______________
1 + (2%02/%Cl2) + 6С'ЫаС1Оз (с)/C*oh
Kirk-Othmer Encyclopedia of Chemical Technology (4th Edition)
483
CHLORINE AND SODIUM HYDROXIDE
Voll
(17)
Current efficiency values based on the six equation are higher by approximately 1.0% than those from equation 16.
Cell Voltage and Its Components. The minimum voltage required for electrolysis to begin for a given set of cell conditions, such as an
operational temperature of 95°C, is the sum of the cathodic and anodic reversible potentials and is known as the thermodynamic decomposition voltage,
E°. E° is related to the standard free energy change, AG°C, for the overall chemical reaction,
AG = -nFe°
(18)
where n represents the number of moles of electrons involved in the primary electrode reaction and F is the Faraday constant, expressed in ampere-hour
equivalents. E° values for the diaphragm or membrane cells and for mercury cells are presented in Table 7. The +0.924 V difference in E°C values between
membrane cells and mercury cells results from the reaction
2Na+ 2H2O 2NaOH + H2
(19)
which takes place outside the electrolytic cells. Although, in principle, this voltage is recoverable, that has not yet been commercially demonstrated. The E°
value for diaphragm or membrane cells at 95°C is 2.23 V for a caustic concentration of 3.5 M. However, these cells operate around 3.0 to 3.2 V at a current
density of 2 to 3 кА/m2, not at 2.23 V, because in order to drive equation 1 at an acceptable rate, an additional driving force is required to overcome cell
resistances and electrode overvoltages.
Table 7. Thermodynamic Decomposition Voltage of Chlor-Alkali Cells at 25°C
Diaphragm/membrane cell Mercury cell
anode reaction anode potential, E°, V cathode reaction cathode potential E°, V overall reaction cell potential E°, V 2 Cl- — CI 2 r 2 Cl- — CI 2 e- 1.36 1.36 2 H2O + 2 e~ — 112 ОН- Na+ ' — Na (amalgam) -0.828 -1.77 2 H2O + 2 Cl- Cl2 + 2 OH- + H2 2 Na+ + 2 CH > Hs Cl2 + 2 Na (amalgam) 2.188 3.13
Electrolysis of brine (eq. 1) is endothermic. The overall heat of reaction is 446.68 kJ /mol (106.76 kcal/mol) of chlorine and the thermoneutral
voltage, ie, the voltage at which heat is neither required by the system nor lost by the system to the surroundings, would therefore be ~2.31 V. In practice,
however, chlor-alkali cells operate in the range of 3 to 3.5 V, at an average chlorine efficiency (CE) of ''-'95%, resulting in heat generation (0 to the extent
of 3960 kJ /kg (1710 Btu/lb) of Cl2, for a voltage of 3.5 V
Q = — [46.05 V] - ДЯ
у[CEJ J
(20)
Heat produced in these cells operating at voltages of >2.31 V is generally removed by water evaporation and radiation losses.
Overvoltage. Overvoltage (T| ) arises from kinetic limitations or from the inherent rate (be it slow or fast) of the electrode reaction on a given substrate. The
magnitude of this value can be generally expressed in the form of the Tafel equation
’lac = klog(i/i0)
(21)
where k is the slope of the T|ac vs log i curve, i the applied current density, and the exchange current density of the reaction. The quantity is a measure of
the relative rate of a given reaction, eg, 1 mA/cm2 for evolution on dimensionally stable electrodes (DSA). Overvoltage can be lowered by increasing
the electrochemically active surface area, which effectively reduces the magnitude of i, or by using catalytic cathodes.
Overvoltages for various types of chlor-alkali cells are given in Table 8. A typical example of the overvoltage effect is in the operation of a mercury
cell where Hg is used as the cathode material. The overpotential of the H2 evolution reaction on Hg is high; hence it is possible to form sodium amalgam
without H2 generation, thereby eliminating the need for a separator in the cell.
Table 8. Components of Chlor-Alkali Cell Voltages
Diaphragm cell Membrane cell Mercury cell
thermodynamic decomposition voltage anode 1.32 1.32 1.32
cathode 0.93 0.93 1.83
overvoltage anode 0.03 0.03 0.1
cathode 0.28 0.15 0.4
ohmic drops solution 0.12 0.05 0.15
diaphragm 0.38 0.35
anode and contact to base 0.11
base 0.06 0.37 0.2
cathode 0.09
cell voltage 3.32 3.2 4.0
Voltages given are for OxyTech H4 cell operating at 2.3 kA/m2 (150 kA).
Voltages given are for MGC-26 cell operating at 3.6 kA/m2 (140 kA).
Voltages given are for a De Nora 24M2 system operating at 10 kA/m2 (270 kA).
Ohmic Drops. Another irreversible contribution to the measured cell voltage is the ohmic or IE drop across the electrolyte, separator, and cell hardware.
The IE drop across the hardware can be estimated from Ohm's law and the relationship
R = pl/A
Kirk-Othmer Encyclopedia of Chemical Technology (4th Edition)
484
CHLORINE AND SODIUM HYDROXIDE
Voll
(22)
where R is the resistance (in ohms) of the conductor of length / with a specific resistance of p and cross-sectional area %.
The ohmic drop across the electrolyte and the separator can also be calculated from Ohm's law using a modified expression for the resistance.
When gas bubbles evolve at the electrodes they get dispersed in and impart a heterogeneous character to the electrolyte. The resulting conductivity
characteristics of the medium are different from those of a pure electrolyte. Although there is no exact description of this system, some approximate
treatments are available, notably the treatment of Rousar (9), according to which the resistance of the gas—electrolyte mixture, R , is related to the
resistance of the pure electrolyte, R p
-Rmix - Дзо1(1 + l-M
(23)
where 8 is the gas void fraction, defined as the ratio of the volume of the gas to the volume of the gas plus the volume of the electrolyte. The IR drop in
brine solution is generally around 30 to 40 mV/mm at 95°C and a current density of 2.32 кА/m2. Similarly, for calculating the IR drop across the separator,
the separator thickness term has to be modified because the distance between the two faces of a separator such as the asbestos diaphragm is not equal to
its thickness. The liquid path is tortuous and the area is limited by finite porosity. Thus the IR drop across the separator would be
7-Rsep = xilp
(24)
where x reflects the tortuosity-to-porosity ratio. Typical values of tortuosity for asbestos diaphragms range from 2.2 to 2.8; porosity is generally M).7-0.8.
The components of the diaphragm, membrane, and mercury cell voltages presented in Table 8 show that, although the major component of the cell
voltage is the EP term, ohmic drops also contribute to the irreversible energy losses during the operation of the cells.
Direct-Current Electric Power. The operation of a chlor-alkali plant is dependent on the availability of huge quantities of direct-current
electric power (8), which is usually obtained from a high voltage source of alternating current. The lower voltage required for an electrolyzer circuit is
produced by a series of step-down transformers. Silicon diode rectifiers convert the a-c electricity to d-c for the electrolysis. A set of rectifiers can supply up
to 450 kA. Although these diodes can operate at 400 V/diode, a peak a-c voltage of 1500 V corresponding to a d-c output of 1200 V is not exceeded for
safety reasons. Rectifier efficiency (nrectifier) genera^y around 97—98%.
The unit cost of the d-c supply decreases with increasing voltage and amperage (see Fig. 4). A chlor-alkali plant is therefore most economical when
as many high amperage cells as possible are connected in series.
Fig. 4. Variation of rectification costs with voltage.
Overall Energy Consumption. The voltage efficiency is the ratio of the thermodynamic decomposition voltage to the actual cell voltage
(Kell)’ 1'1C energy efficiency (t|ei1, which is a product of the current and voltage efficiencies, can be expressed for a diaphragm cell as
_ 2-2377currerit
"energy — ту
Vcell
However, the industry's popular terminology is the energy consumption expressed in terms of kilowatt hours per ton of Cl2 (ECb) or of NaOH
(HNaOH). An estimate of this value requires a knowledge of cell voltage, current efficiency, and the efficiency of the rectifier used to convert a-c power to
d-c. The energy consumption for producing a ton of Cl2 is
756 Kell /a-с kW‘h\
£/Cl = ----------------- ----------- I
^/current ^/rectifier \ /
and that for a ton of NaOH is
670.1 Vcell /a-ckWJA
BNaOH - I t /
'/current /rectifier \ /
Manufacturing Processes
The earliest annals of chemistry mention chlorine compounds. In AD 77 Pliny the Elder published a practical collection of chemical reactions including a
formula for gold purification that generates hydrogen chloride. Records from more than 800 years later indicate that the Arabic people knew that hydrogen
chloride and water produce hydrochloric acid. Sometime around AD 1200 alchemists discovered that a mixture of hydrochloric and nitric acids dissolves
gold. There is no record of the heavy, greenish gas generated, however, It was not until 1774 that Swedish apothecary Cad W. Scheele first generated and
collected chlorine by the reaction of manganese dioxide and hydrochloric acid. Scheele also discovered chlorine's bleaching action, after placing some leaves
Kirk-Othmer Encyclopedia of Chemical Technology (4th Edition)
485
CHLORINE AND SODIUM HYDROXIDE
Voll
and flowers in a bottle containing the gas. Textile producers in France soon heard of the new gas, and in 1789 they bubbled chlorine through a potash
solution, producing the first commercial liquid chlorine bleach (10).
Salt was first electrochemically decomposed by Cruickshank in 1800, and in 1808 Davy confirmed chlorine to be an element. In the 1830s Michael
Faraday, Davy's laboratory assistant, produced definitive work on both the electrolytic generation of chlorine and its ease of liquefaction. And in 1851 Watt
obtained the first English patent for an electrolytic chlorine production cell (11).
Through the 1880s and 1890s producers in Germany, England, Canada, and the United States refined chlorine technology: Siemens developed
electric generators; the Griesheim Company (Germany) invented the first practical diaphragm cell; Castner produced the first commercially viable mercury
cell; and German producers learned that, although wet liquid chlorine is almost impossible to package, water-free chlorine could be safely shipped in
ordinary iron or steel pressure vessels. Thus by the early 1900s chlorine was produced in mercury and diaphragm electrolytic cells and routinely shipped in
Equid form. In 1913 Altoona, Pennsylvania became the first of many cities to treat sewage using Equid chlorine. Throughout the early and mid-1900s a
myriad of other chlorine uses were discovered, so that today chlorine ranks in the top ten volume chemicals produced in the United States.
Eady demand for chlorine centered on textile bleaching, and chlorine generated through the electrolytic decomposition of salt (NaQ) sufficed.
Sodium hydroxide was produced by the lime—soda reaction, using sodium carbonate readily available from the Solvay process. Increased demand for
chlorine for PVC manufacture led to the production of chlorine and sodium hydroxide as coproducts. Solution mining of salt and the availabiEty of
asbestos resulted in the dominance of the diaphragm process in North America, whereas soEd salt and mercury availabiEty led to the dominance of the
mercury process in Europe. Japan imported its salt in soEd form and, until the development of the membrane process, also favored the mercury cell for
production.
Anodes. For over sixty years (1913—1979) graphite was the exclusive anode for chlorine production in spite of the high chlorine overpotential
and the dimensional instabiEty caused by the gradual oxidation of carbon to CO2. Thus a consequence of graphite anode use was an increased electrolyte
ohmic drop and a correspondingly high energy consumption. Then, in the late 1960s, the advent of noble metal oxide coatings on titanium substrates by
Beer (12) revolutionized the industry. The most widely used anodes were ruthenium oxide [12036-10-1J and titanium oxide [13463-67-7[ activated titanium,
which exhibits low chlorine overpotential and excellent dimensional stabiEty. Escalating power costs, triggered by the oil crisis in the mid 1970s, accelerated
the transition of the chlor—alkaE industry from graphite to metal anodes. AU but a very few installations have now converted to the exclusive use of the
RuO2 + TiO2-coated titanium anodes. These are suppEed under the trade name DSA (for dimensionally stable anode) (13). (DSA is a trade mark of Eltech
Systems Corp.).
The DSA electrode is coated with a titanium and ruthenium oxide mixture containing up to or over 50 mol % precious metal oxide, the precious
metal loading ranging from %) to 20 g/m2. These coatings are formed on titanium mesh substrates by thermal decomposition. Ruthenium and titanium
salts are appEed to the Ti mesh and fired at -500 °C in air to obtain the mixed oxides. RuO2 + TiO2-based coatings are polycrystalline and structurally
complex. The oxides exist in the catalytic layer as Ti^_n) Ru^O2, where n < 1. The coatings exhibit a "mud-cracked" surface morphology having a
crystallite size of 10—50 nm and an effective surface area of 200—500 cm2 per apparent cm2. The exact value is a function of the heat treatment and the
coating composition. Two coatings predominate in the industry: the original Beer coating is beEeved to contain a Ti:Ru mole ratio of 2:1; a newer
three-component coating has a mole ratio of 3Ru:2Sn:llTi. This coating has a RuO2 + SnO2 loading of ~1.6 mg/cm2. It generates 22 to 25% less oxygen
than RuO2 + TiO2 coatings. References 14 and 15 give more details about the various patented compositions and methods of preparation.
DSA anodes exhibit long life, very low operating voltage, and high efficiency. They have a reasonable tolerance to a wide range of operating
conditions, although performance degradation can occur when the percentage of O2 generated is high. These conditions include operating at feed brine pH
values of more than 11 and at feed brine NaQ concentrations of less than 280 g/L. Exposure to caustic or fluorides results in the dissolution of RuO2 as
RuO? or ruthenium fluoride and of titanium as soluble fluorides. Deposition of foreign matter such as MnO2 or BaSO4 can also result in blockage of
active sites and lead to the failure of the catalytic coatings.
The mechanism of coating failure appears to depend on the type of cell in which the anode is operated. Life in diaphragm cells is at least 12 + yr; in
mercury cells, it is considerably shorter, about 3—4 yr. The unavoidable occurrence of minor short circuits, through contact with the mercury cathode,
causes gradual physical wear of the anode coating. In the absence of this physical wear, ie, in membrane or diaphragm cells, the limiting factor appears to be
passivation of the anode, preceded by a very gradual dissolution of the RuO2 coating. DSA manufacturers recommend that, to ensure long life, assuming a
feed brine concentration of 200 g/L and a pH of <12, the following impurities, in ionic form, be kept at the concentrations indicated in parentheses: Hg
(40 ppb); Mn (0.01 ppm); heavy metals (0.3 ppm); total organic content (1 ppm); F- (1 ppm); Ba (0.4 ppm).
Electrolytic Cell Operating Characteristics. Currendy the greatest volume of chlorine production is by the diaphragm cell process,
followed by that of the mercury cell and then the membrane cell. However, because of the ecological and economic advantages of the membrane process
over the other systems, membrane cells are currently favored for new production faciEties. The basic characteristics of the three cell processes are shown in
Figure 5.
Kirk-Othmer Encyclopedia of Chemical Technology (4th Edition)
486
CHLORINE AND SODIUM HYDROXIDE
Voll
Chlorine
Mercury
cell
Amalgam
to decomposer
Chlorine
Hydrogen
Fig. 5. Chlorine electrolysis cells.
Courtesy of McGraw-Hill, Inc.
A typical energy distribution profile for a diaphragm chlor—alkali operation, illustrated in Figure 6, shows that the electrolytic cells consume about
10.1 x 10⁶ kJ/t of Cl2, and 9.55 x 10⁶ kJ are required for concentrating the cell liquor containing ~11% caustic and ~15% salt to 50% caustic. These are
not optimized energy values since the energy consumption of a diaphragm cell depends on the operating current density, cell voltage, and current efficiency.
Similarly, the energy required for evaporation also varies according to the type of evaporator system used. Using a quadruple-effect evaporator, the energy
would be ~4.1 x 10⁶ kJ/t of caustic. The cell efficiency of a diaphragm chlor-alkali unit is about 52%. Overall plant efficiency is only ^23%, however, and,
as stated, is a function of the evaporator system.
Kirk-Othmer Encyclopedia of Chemical Technology (4th Edition)
487
CHLORINE AND SODIUM HYDROXIDE
Voll
Fig. 6. Energy flow diagram of a typical diaphragm cell operation where numbers represent energy in millions of kilojoules per ton of chlorine. To convert
kJ to Btu, multiply by 0.949.
In the case of electrolytic membrane cells, the energy requirements would be ~15 to 20% lower than those of diaphragm cells. The exact value is
again a function of the operating current density, cell voltage, and current efficiency. The major energy savings would, however, be in caustic evaporation.
The energy needed for concentrating the 33% caustic output from the cells to 50% NaOH would be 2.6 x 10⁶ kJ/t using a single-effect and
~1.6 x 10⁶ kJ/t using a double-effect evaporator. The cell efficiency for membrane cells is ''-'50%, whereas the overall plant efficiency is ^35-40%.
The Mercury Cell Process. The mercury cell process (Fig. 7) actually consists of two electrochemical cells. In the electrolyzer, saturated (25.5
wt %) sodium or potassium brine flows through an elongated trough that is inclined approximately 1 to 2.5°. Mercury, which is the cathode, flows
concurrendy with the brine over a steel base. The sides of the trough are usually rubber lined. Anodes of activated titanium [7440-32-6] are suspended in
the brine from above. The anode reaction is represented by equation 2, the cathode reaction by equation 4. The resulting amalgam, containing from 0.25 to
0.5% sodium, flows from the electrolyzer into a second cell called the decomposer. This is a short-circuited electrical cell in which graphite acts as the
cathode and the amalgam as the anode; the reaction is that of equation 5.
Fig. 7. Mercury cathode electrolyzer and decomposer (11): 1, brine level; 2, metal anodes; 3, mercury cathode, flowing along baseplate; 4, mercury pump; 5,
vertical decomposer; 6, water feed to decomposer; 7, graphite packing, promoting decomposition of sodium amalgam; 8, caustic liquor exit; 9, denuded
mercury; 10, brine feed; 11, brine exit; 12, hydrogen exit from decomposer; 13, chlorine gas space; 14, chlorine exit; 15, wash water.
Courtesy of the Chlorine Institute, Inc.
The mercury cell operates efficiendy because of the higher overpotential of hydrogen on mercury to achieve the preferential formation of sodium
amalgam. Certain trace elements, such as vanadium, can lower the hydrogen overpotential, however, resulting in the release of hydrogen in potentially
dangerous amounts.
Mercury cells are operated to maintain a 21—22 wt % NaCl concentration in the depleted brine and thus preserve good electrical conductivity. The
depleted brine is dechlorinated and then resaturated with solid salt prior to recycling back to the electrolyzer.
Mercury has a high vapor pressure at the normal cell operating conditions; hence it is always found in the reaction products. Although the mercury is
almost completely recovered and returned to the process, environmental problems associated with mercury, combined with the less efficient energy
utiliza tion compared to the modem membrane cell process, has effectively stopped the building of new mercury cell plants. Furthermore, in the 1990s,
membrane cells will most likely replace most of the present mercury cells. For details related to mercury cells, see references 8 and 16 and general references.
The Diaphragm Cell Process. E. A. Le Sueur is credited with the design of the first chlorine cell incorporating a percolating asbestos
diaphragm in the 1890s. Brine flows continuously into the anolyte and subsequendy through a diaphragm into the catholyte. The diaphragm separates the
chlorine liberated at the anode from the sodium hydroxide and hydrogen produced at the cathode. Failure to separate the chlorine and sodium hydroxide
leads to the production of sodium hypochlorite [7681-52-9], NaQO, which undergoes further reaction to sodium chlorate [7775-09-9], NaQO3. The
commercial process to produce sodium chlorate is, in fact, by electrolysis of brine in a cell without a separator (see Chlorine oxygen acids and salts).
The early cells incorporated a horizontal asbestos sheet as the diaphragm. During the 1920s this type of cell was the most widely used in the world
and a few are still in operation. Subsequendy, three basic types of diaphragm cells have been developed: rectangular vertical electrode monopolar cells,
cylindrical vertical electrode monopolar cells, and vertical electrode filter press bipolar cells. These may differ in the choice of diaphragm as well as in
electrolyzer design. Electrolyzers are classified as being either monopolar or bipolar depending on the construction or assembly.
Asbestos Diaphragms. The earliest diaphragms were made of asbestos paper sheets. Asbestos (qv) was selected because of its chemical and
physical stabiEty and because it is a relatively inexpensive and abundant raw material. The vacuum-deposited asbestos diaphragm, developed in the 1920s,
was the diaphragm of choice until 1971, when it was supplanted by the Modified Diaphragm (trademark of OxyTech Systems, Inc.) (17). In its most
common form, the Modified Diaphragm contains fibrous polytetrafluoroethylene (PTFE) and a minimum of 75% asbestos. The polymer, following
fusion, stabilizes the asbestos, lowers cell voltage, and allows the use of the expandable DSA anode (18) (see Fig. 8), which further lowers the cell voltage
(19). The Modified Diaphragm in various formulations is the most common diaphragm in use today.
Fig. 8. Anode for monopolar diaphragm cells: a, activated (coated) expanded metal; b, expanding spring; c, titanium-clad copper bar; d, copper thread to fix
the anode to the cell base.
Kirk-Othmer Encyclopedia of Chemical Technology (4th Edition)
488
CHLORINE AND SODIUM HYDROXIDE
Voll
The toxicological problems associated with asbestos have been widely published and asbestos has been banned from most uses by the EPA.
However, modem diaphragm cell chlorine plants have not had difficulty meeting the required exposure limits for asbestos fibers, and, as of 1990, the
chlorine industry had an exemption allowing the continued use of asbestos as a diaphragm material.
Non asbestos Diaphragms. Many patents relating to the development of nonasbestos replacements for chlorine electrolyzer diaphragms
have been issued. One such replacement, the microporous diaphragm (20), incorporates a PTFE sheet containing sodium carbonate as a pore former.
Although early difficulties related to fluorocarbon wetting were overcome and the operating results were satisfactory, the microporous diaphragms have
not reached commercial status. A mixture of PTFE fibers and zirconia was patented (21), as were synthetic diaphragms having ion-exchange properties
similar to the membrane in a membrane cell (22). Neither of these diaphragms has been commercialized.
A vacuum-dep о sitable nonasbestos fiber called Polyramix (trademark of OxyTech Systems, Inc.), having a PTFE backbone and zirconium oxide
particles embedded in the structure, has been developed (23). The Polyramix diaphragm has a much longer operating life than an asbestos-based one
because of superior chemical stability. In addition, the voltage and current efficiencies have proven equal to or better than modified diaphragms. The first
chlorine plants to convert completely from asbestos-based diaphragms to the nonasbestos Polyramix design were G.E. Plastics plants in Mt. Vemon,
Indiana and Burkville, Alabama in 1991.
Electrolyzers. Bipolar electrolyzers have unit assemblies where the anode of one cell is direcdy connected to the cathode of the next cell unit.
This assembly minimizes intercell voltage loss because the cells are set up in series like a filter press. The voltage of the electrolyzer is therefore the sum of
the individual cell voltages. Bipolar electrolyzers have relatively high voltages and low amperage; thus the cost of electrical rectification is high per unit
production capacity (see Fig. 4). Bipolar electrolyzers must either be installed in a large number of electrical circuits or be designed with very large individual
cell components. Bipolar cell developers have opted for the latter. In the 1970s, following the development of the DSA anode, the Glanor bipolar
electrolyzer was developed.
A monopolar electrolyzer is assembled so that the anodes and cathodes are in parallel. As a result of this setup, the electrical potential of all cells in
the electrolyzer is the same. Monopolar electrolyzers operate at a relatively low voltage, 3 to 4 V, and high amperage, allowing circuit construction of up to
200 electrolyzers.
In the United States, 76% of the chlorine produced is from diaphragm cells. Production is equally divided between bipolar and monopolar
electrolyzers.
The Dow BipolarElectroly^er Dow has operated bipolar electrolyzers since before 1910, and the design is characterized by simple, rugged construction
utilizing relatively inexpensive materials (21,24,25). These cells employ vertical coated titanium anodes, vertical cathodes of mild steel wire mesh bolted to a
perforated steel backplate, and a vacuum-deposited asbestos-based diaphragm. A single bipolar element may have 100 m2 of active area. Copper spring
clips attached to the back of the perforated plate of the cathode place the anode of one cell in direct contact with the cathode of the next cell. This electrical
connection is immersed in the catholyte during operation. Figure 9 shows these internal cell parts. These electrolyzers are operated at lower current
densities than others in the industry, normally using 50 or more cells in one unit or series. One electrical circuit may consist of only two of these series.
Figure 10 shows a six-cell series. Treated saturated brine is fed into the anolyte compartment, where it percolates through the diaphragm into the catholyte
chamber. The percolation rate is controlled by maintaining the anolyte at a level sufficient to establish a positive, adjustable hydrostatic head. The optimum
brine flow rate results in the decomposition of about 50% of the input NaQ; thus the cell liquor contains 8—12 wt % NaOH and 12—18 wt % NaQ.
Fig. 9. Dow diaphragm cell, section view: a, perforated steel back plate; b, cathode pocket; c, asbestos diaphragm; d, DSA anode; e, copper back plate; f,
titanium back plate.
Kirk-Othmer Encyclopedia of Chemical Technology (4th Edition)
489
CHLORINE AND SODIUM HYDROXIDE
Voll
Fig. 10. Dow diaphragm cell: (a) Six-cell series, (b) Internal cell parts: a, cathode elements; b, cathode pocket elements; c, copper spring clips; d, perforated
steel backplate; e, brine inlet; f, chlorine oudet; g, copper backplate; h, titanium backplate; i, anode element.
These electrolyzers are operated at about 80°C, as opposed to the 95°C common in the industry. This lower temperature allows the use of vinyl
ester resins and other plastics for cell construction. Moreover, the Dow diaphragm cell is optimized for low current density (~0.5 kA/m2 ). It consumes less
electrical energy per unit of production than others in the industry. The cell voltage at low current density is only 300—400 mV above the thermodynamic
decomposition voltage. Dow does not license its diaphragm cell technology and operating data for these cells are not available in the open literature.
The Glanor BipolarTlectroly^er The Glanor bipolar electrolyzer, joindy developed by PPG Industries and De Nora Permelec, was especially designed for
large chlorine plants (26). It consists of a series of bipolar cells clamped between two end electrode assemblies by means of tie rods, forming a
filter-press-type electrolyzer. It was designed around and is equipped with DSA anodes. Although each electrolyzer normally consists of 11 cells, up to 12
cells have been operated, and a lesser number could be utilized.
Current is fed into the electrolyzer by means of anodic and cathodic end elements. The anodic compartment of each cell is joined to an independent
brine feed tank by means of flanged connections. Chlorine gas leaves each cell from the top, passing through the brine feed tank and then to the cellroom
collection system. Hydrogen leaves from the top of the cathodic compartment of each cell; the cell liquor leaves the cathodic compartment from the
bottom through an adjustable level connection.
The V-1144 electrolyzer (11 cells of 44 m2 each) was the first commercial unit, and eight plants utilize this model. The second generation
electrolyzer, the V-1161 (11 cells of 61 m2 each), employs narrower electrode gaps, lower current density, and modified diaphragms, consuming less energy
than the V-1144. The operating characteristics of the Glanor electrolyzers are shown in Table 9.
Table 9. Design and Operating Characteristics of Glanor Bipolar Diaphragm Electrolyzers
Item Model V-1144 Model V-1161
cells per electrolyzer 11 11
active anode area per cell, m2 35 49
electrode gap, mm 11 6
current load, kA 72 72
current density at 72 kA, kA/m2 2.05 1.47
cell voltage, V 3.50 3.08
current efficiency, % 95-96 95-96
energy consumption (d-c), kWh/tCl2 2800 2400
anode gas composition (alkaline brine), % C12 97.3-98.0 97.0-98.0
°2 1.5-2.2 1.5-2.2
h2 <0.1 <0.1
co2 0.4 0.4
cell liquor NaOH, g/L 135-145 135-145
NaClO3, % 0.03-0.15 0.03-0.15
production per electrolyzer, t/day chlorine 24.2 24.2
NaOH 27.0 27.0
OxyTech Monopolar Electrolyzers. OxyTech Systems (a joint venture company of Occidental Chemical and Eltech Systems) supplies monopolar diaphragm
electrolyzers of two designs: the OxyTech "Hooker" H-Type (27,28) shown in Figure 11 and the "Diamond" MDC-Type (28,29) in Figure 12.
Kirk-Othmer Encyclopedia of Chemical Technology (4th Edition)
490
CHLORINE AND SODIUM HYDROXIDE
Voll
Fiber-reinforced plastic top
Top hold-down
Rotameter
mounting
bracket
Chlorine outlet
Brine feed
Anode finger rod
Base support structure
Concrete pad
Anolyte level
indicator
Hydrogen
outlet
Anode base
copper
Anode-cathode
clamping device
Cathode
shell
Voltage
monitoring
. board
Gasket
Caustic
percolation
Pipe
Hydrogen
vent asembly
Current
interrupter
Cathode
lifting
lug
Jumper
switch
lug
Anode
lifting lug
Intercell
connector
Anode base
Cathode finger (asbestos covered)
Pedestal insulator
Pedestal
Anode finger
Flexible anode base seal
Fig. 11. Cut view of OxyTech H-4 diaphragm cell operating at a nominal load of 150 kA.
liquor
Fig. 12. OxyTech Systems MDC cell: a, brine feed rotometer; b, head sight glass; c, cell head; d, cathode assembly; e, tube sheet; f, grid plate; g, cathode
tube; h, grid protector; i, DSA expandable anode.
The first commercialized vacuum-deposited diaphragm cell was the Hooker type S-l monopolar cell, introduced in 1929. This design featured
vertical graphite plates connected to a copper bus bar and a cathode having woven steel wire cloth fingers between the rows of anodes. An asbestos
diaphragm, vacuum-deposited on the cathode, separated the anodic and cathodic compartments. The cathode fingers did not extend completely across the
cell, but left a central circulation space. In the following 40 years a family of S-type cells having similar characteristics evolved. Over 12000 were installed in
licensed plants.
In 1973 a new H-series of monopolar cells was introduced. These incorporated DSA anodes, operating at higher current densities. The H-series also
employs cathode tubes having both ends open and extending across the cell, possible because the circulation space requirement was satisfied by the change
from solid graphite to the open DSA anodes (Fig. 8). The anode and cathode row orientation was also rotated 90°, making the design similar to the MDC
cells.
The MDC cells feature woven steel cloth cathode screen tubes open at both ends and welded into thick steel tube sheets at each end (28). The
tubes, tube sheets, and the outer steel cathode shell form the catholyte chamber (Fig. 13). Copper is bonded to the rectangular cathode shell on the two
long sides parallel to the tube sheets and copper connectors attached at the ends of the copper side plates complete the encircling of the cathode to ensure
good current distribution. The rectangular design and electrode orientation reduces the electrical path around the circuit as compared to the S-series cells.
Modified or Polyramix diaphragms are vacuum-deposited on the cathode tubes (30). Expandable DSA anodes are connected to a copper cell base
protected by a TIBAC titanium or a rubber base cover. Orientation of the cathode tubes is parallel to the cell circuit, the opposite of the S-series cells. This
arrangement accommodates the thermal expansion of the cell and circuit without changing the anode-to-cathode alignment, allowing for the use of rigid
rather than flexible intercell connectors. Over 20,000 t/day of chlorine capacity has been licensed with MDC cells. This technology reduces energy
consumption by 15% compared to that of regular asbestos diaphragms and standard box anodes. Table 10 lists the operating characteristics of the four
most common OxyTech diaphragm cells.
Kirk-Othmer Encyclopedia of Chemical Technology (4th Edition)
491
CHLORINE AND SODIUM HYDROXIDE
Voll
Fig. 13. Exploded view of an OxyTech MDC-55 cell: a, end plate; b, rim screen; c, side screens; d, tube sheet; e, full-cathode tube; f, half-cathode or end
tube; g, side plate; h, lifting lug; i, punched and coined stiffener strap; j, bosses; k, end plate, operating aisle end; 1, hydrogen oudet; m, connector bar; n,
caustic oudet; o, clip angles; p, grid bar, connector side; q, side plate.
Table 10. Operating Capacities and Characteristics of OxyTech Diaphragm Cells
Characteristic MDC29 MDC55 H2A H4
operating range, kA/day 40 80 75 150 50 80 90 150
chlorine capacity, t/daya 1.21 2.43 2.26 4.55 1.51 2.42 2.71 4.54
caustic capacity, t/day 1.36 2.74 2.55 5.14 1.70 2.73 3.06 5.13
hydrogen capacity, m3/day 399 798 748 1,497 498 798 897 1,496
current density, kA/m2 1.38 2.76 1.37 2.74 1.38 2.21 1.40 2.33
current voltage, V (includes intercell bus) 2.97 3.60 2.97 3.59 2.97 3.35 2.98 3.40
energy consumption, d-c kW-h/t of Cl2 2363 2847 2363 2839 2363 2655 2371 2694
modified diaphragm life, days 425 200 410 200 410 300 425 275
anode life, yr 10-15 8-10 10-15 8-10 10-15 8-10 10-15 8-10
cathode life, yr 10-15 5-8 10-15 5-8 10-15 5-8 10-15 5-8
distance between cellsb, m 1.60 2.13 2.32 3.05
To convert t to ton (short), multiply by 1.1.
Distance is measured from center line to center line and side by side positioning with bus connecting.
OxyTech /Uhde HU-Type Designs. The HU-type cells (30) are shown in Figure 14. The HU-type electrolyzer is more rectangular than even the MDC cell. It
is narrow in the direction of current flow, since the anodes are arranged in a single row. Because the cathode is long and narrow, the current density
through the thick steel cathode shell is also very low. The cathode design leads itself to closer anode—cathode spacing without the use of the expandable
anode. Moreover, this heavy steel construction eliminates the copper around the cathode shell. Another advantage of the long, narrow design is shorter cell
circuits, resulting in less piping and savings in other materials. The HU-type cells incorporate a modified diaphragm.
Liquor
Fig. 14. OxyTech/Uhde HU-type cell: a, cell bottom; b, cathode; c, anode; d, cell cover; e, bus bars; f, brine level gauge; g, brine flow meter; h, bypass
switch.
A further novelty of the HU cell system is the design and arrangement of the electrical bypass switch installed underneath, not next to, the circuit of
Kirk-Othmer Encyclopedia of Chemical Technology (4th Edition)
492
CHLORINE AND SODIUM HYDROXIDE
Voll
cells. The cells are elevated above the floor, similar to mercury cells, creating a second operating floor; the interconnecting bus bars are flexible and are
distributed over the length of the cell. The HU cell design incorporates a bus bar for each individual anode instead of the copper base plate used in the H
and MDC series cells. During operation of the bypass switch, connection is made for each individual anode and no additional contact bars are required.
The HU-type cells are offered to cover the 30—150-kA range. All of the different cell types are equipped with cathodes and anodes of identical
height and width. The only difference between the various models is the number of anode—cathode elements and consequendy the length of the cell. Table
11 lists the characteristics of the various HU cells.
Table 11. Design and Operating Characteristics of HU Series Diaphragm Cells
Cell type
Item HU 24 HU 30 HU 36 HU 42 HU 48 HU 54 HU 60
number of anodes 24 30 36 42 48 54 60
anode surface area, m2 20.6 25.8 31.0 36.1 41.3 46.4 51.6
load, kA 30-45 40-60 50-70 55-85 60-95 70-105 80-120
Cl2 production, t/day 0.90-1.36 1.19-1.82 1.49-2.12 1.64-2.58 1.79-2.88 2.09-3.18 2.39-3.64
NaOH (100%) production, t/day 1.01-1.54 1.35-2.05 1.68-2.39 1.85-2.91 2.02-3.25 2.36-3.59 2.69-4.10
H2 production, kg/day 25-39 34-52 42-60 47-73 51-82 59-91 68-103
cell length, m 2.1 2.6 3.0 3.5 3.9 4.4 4.8
cell-to-cell distance, m 1.5 1.5 1.5 1.5 1.5 1.5 1.5
The Membrane Cell Process. In a membrane cell a cation-exchange membrane separates the anolyte and catholyte, as shown in Figure 5.
Brine is fed into the anode compartment, where chlorine gas is created and the sodium ions and associated water of hydration migrate through the
membrane into the catholyte. Unlike the diaphragm in the diaphragm cell process, the cation-exchange membrane prevents the migration of chloride ions
into the catholyte. Depleted brine is discharged from the anolyte to maintain a minimum NaCl concentration. Water is electrolyzed at the cathode and
strong caustic (32—35 wt %) is produced either by controlling the water addition rate direcdy to the catholyte or by recirculating caustic to which water has
been added. There is some back-migration of hydroxyl ions into the anolyte, which results in the loss of current efficiency.
Membranes. The membrane (see Membrane technology) is the most critical component of this cell technology, and current efficiency and cell
voltage, and hence energy consumption, are gready dependent on its quality. An ideal ion-exchange membrane separator should have (7) high selectivity for
the transport of sodium or potassium ions, (2) negligible transport of chloride, hypochlorite, and chlorate ions, (J) zero back migration of hydroxide ion,
(4) low electrical resistance, and (5) good mechanical properties and long term stability for practical use. The membrane in a chlor-alkali electrolyzer is
exposed to chlorine on one side and strong caustic on the other. Only perfluoro polymers have been found to withstand these conditions, and, combined
with appended groups having ion-exchange properties, they meet the requirements set forth above (31—39).
The first membranes to show significant potential and trigger the development of membrane electrolyzers were made from the perfluorosulfonate
polymer called Nation (40,41).
—(CF2CF2)n—CF—O—CF2CFO—CF2CF2SO3Na+
CF2 CF3
Nafion
—(CF2CF2)n—CF—O—CF2CF2CF2COONa+
CF2
Flemion
This first membrane was practical only at low caustic concentrations; it was deficient in limiting hydroxyl ion back migration. The idea of an asymmetric
membrane having sulfonic acid groups on the anodic side and converted groups on the cathodic side to overcome the back-migration problem was then
developed. These composite membranes operate efficiently at high caustic strengths, individual membranes exhibiting optimal efficiency at a given caustic
concentration. Later a perfluorocarboxylate membrane called Flemion (42) which had better resistance to the hydroxyl back migration but also had a much
higher electrical resistance was produced. Then the sulfonic acid group on the cathodic side of a Nafion membrane was converted to a carboxylic acid
group, achieving the beneficial properties of both membrane types. Today's membranes consist of a film of perfluorosulfonate polymer, a Teflon
reinforcing fabric, and a perfluorocarboxylate polymer all bonded together. The performance of such a membrane is shown in Table 12. References 39 and
43 discuss membranes in more detail.
Table 12. Nafiona 90209 Performance in Chlor-Alkali Production**
current density, kA/m2 2 3 4
caustic concentration, % 32 32 32
temperature, °C 90 90 90
current efficiency, % 96.0 96.0 96.0
voltage , V 2.84 3.07 3.30
energy consumption, kW-h/t caustic soda 1,980 2,140 2,300
water transport (mol H2O/mol Na+ ) 3.9 4.0 4.2
Du Pont registered trademark.
Data, for a 32% caustic concentration at 90°C and a current efficiency of 96.0%, obtained in laboratory cells using a DSA anode and an activated cathode,
where the membrane is against the anode at a 3-mm gap.
Electrode to electrode.
In the design of a membrane electrolyzer utilizing standard membranes, minimizing the voltage drop through the electrolyte gap is accomplished by
reducing the gap. When the gap is very small, however, an increase in voltage resulting from the entrapment of hydrogen gas bubbles between the cathode
and the hydrophobic membrane is observed. Development membranes, the cathodic surface of which is coated with a thin layer of a porous inorganic
material to improve the membrane's hydrophilicity, has solved the bubble effect problem (Fig. 15). These improved, surface-modified membranes have
Kirk-Othmer Encyclopedia of Chemical Technology (4th Edition)
493
CHLORINE AND SODIUM HYDROXIDE
Voll
allowed the development of modem electrolyzers called zero-gap or membrane-gap electrolyzers in which there is indeed no gap between the electrodes.
Performance data for a membrane-gap electrolyzer are given in Figure 16.
Fig. 15. Effect of electrode gap on cell voltage.
2400
2200
2000
1800
ed)
2400
2200
2000
1800
a
о
S
a
о
a
% NaOH
Fig. 16. Performance data obtained in laboratory cells using Nafion NX-961, DSA anode, activated cathode, narrow gap, at 90°C. Energy consumption is
expressed as d-c kilowatt hours (electrode to electrode) per ton of NaOH.
The electrolysis of potassium chloride [7447-40-7]., KC1, to produce chlorine and potassium hydroxide in membrane cells requires similar but unique
membranes. Commercial membranes currendy employed in high performance membrane electrolyzers include Du Font's Nafion 900 series and Asahi
Glass's Flemion 700 series.
Electrolyzers. Depending on the manner in which electrical connection is made between cell units, electrolyzers are labeled as monopolar or
bipolar. In the monopolar type all the anode and all the cathode elements are arranged in parallel, forming an electrolyzer having high amperage and low
voltage. In the bipolar type the cathode of a cell is connected to the anode of the subsequent cell, so that the cells are in series and the resulting electrolyzer
has low amperage and high voltage. The bipolar type is advantageous for attaining minimum voltage drop between the cells. But, as the influx and efflux of
electrolytes for cells having different electrical potential are gathered into common manifolds, problems of current leakage and corrosion become a concern
and must be addressed in the design. In the monopolar cells the voltage loss through the interelectrolyzer bus bars is an inevitable drawback which must be
minimized by conservative design. Monopolar electrolyzers are generally designed so that an individual electrolyzer can be short circuited, allowing
maintenance cell membrane replacement to be conducted without shutting down the entire circuit.
Asahi Chemical Industry Acilyzer-ML Bipolar Electrolyzers. Asahi Chemical's electrolyzer (Acilyzer-ML), shown in Figure 17, is of
the bipolar type, composed of a series of cell frames (42). Each cell consists of a pair of anode and cathode compartments facing each other, having an
ion-exchange membrane in between. The anode and cathode compartments are separated by an explosion-bonded titanium—steel or titanium—nickel plate,
and vertical support ribs are welded to each side of these partition walls, to which the anode and cathode mesh are spot welded in turn. Each compartment
has an electrolyte inlet at the bottom and gas/liquid oudet at the top. These inlets and oudets are connected to the supply and collection headers by PTFE
hoses. Both anolyte and catholyte are recirculated back to the electrolyzer from collection tanks. Deionized water is added to the catholyte collection tank
to control the caustic concentration, and ultrapurified brine is added to the anolyte collection tank to control the NaCl concentration. A portion of the
catholyte is drawn off and is sent to storage or an evaporator for further concentration. A portion of the depleted anolyte is drawn off and is returned to
the salt dissolution and primary brine purification system. Supporting arms are attached to both sides of the cell frame; from these the frames are hung on
the side bars of a hydraulic press. The electrolyzers are offered in two sizes: the ML-32, having a production capacity of 10,000 tons of sodium hydroxide
per year, is 1.2 by 2.4 m, and the ML-60, having a production capacity of 20,000 tons per year, is 1.5 by 3.6 m. As of January 1989, 23 plants having a
combined capacity of 1,711,000 tons of NaOH per year were operating or under construction.
Kirk-Othmer Encyclopedia of Chemical Technology (4th Edition)
494
CHLORINE AND SODIUM HYDROXIDE
Voll
(a)
(b)
Fig. 17. Schematic of Asahi Chemical Acilyzer-ML bipolar electrolyzer, (a) View of cell units; (b) structure of cell.
Asahi Glass AZEC Monopolar Electrolyzers. The Asahi Glass Company supplies the four different monopolar electrolyzers shown in
Figure 18 (44—46). The AZEC-M electrolyzer has elastomer cell frames having active areas that are 0.2 m wide and 1.0 m tall clamped between fastening
plates. The electrical bus connections are from the sides. Natural recirculation is provided for both anolyte and catholyte through gas—Equid separators
mounted above the cell frames. The AZEC-MD electrolyzer is a modification. Two M electrolyzers are connected directly side by side, compressed
between one set of fastening plates and eliminating one set of intercell connectors. The AZEC-F1 electrolyzer is constructed of metal frames having active
areas 2.4 m wide and 1.2 m high. The electrical bus connectors are from the bottom of the cell frames, which are arranged in either single or double stacks.
In the latter case, the stacks are electrically in series, but compressed by one set of fastening devices. The anodic and cathodic gas separators are located
above the electrolyzers. The AZEC-F2 electrolyzer also has metal frames. The active area is 1.71 m2 per frame and the electrical bus connections are from
the side. The cell frames are supported by the side arms of the supporting unit of the electrolyzer. Raney nickel electrocatalyst is available as an activated
cathode for these cells. In 1989 Asahi Glass had 26 plants in operation, producing approximately 1,900,000 tons of sodium hydroxide per year.
1,600-1,700 mm
AZEC-M electrolyzer
AZEC-MD electrolyzer
Membrane Cathode element
AZEC-F1 electrolyzer
AZEC-F2 electrolyzer
Fig. 18. Asahi glass electrolyzers.
Chlorine Engineers CME Monopolar Electrolyzers. Chlorine Engineers (CEC) (a joint venture company of Mitsui and Company and
Mitsui Shipbuilding Company), produces the filter press type of membrane electrolyzer shown in Figure 19 (47). It is of the large element type. Membrane
utilization ratio is very high. Uniform electrical current travels into each anode element through titanium-clad, copper-cored conductor rods and current
distributors. The current distributor in the electrolyzer serves an additional role as a downcomer, helping the electrolyte self-circulate within the cell to
maintain uniformly distributed concentrations as well as good gas release. The internal circulation is intended to eliminate the necessity for an external
forced recirculation system. The gasket thickness sets the electrode spacing, and either finite- or zero-gap configuration can be accompEshed. The anode
Kirk-Othmer Encyclopedia of Chemical Technology (4th Edition)
495
CHLORINE AND SODIUM HYDROXIDE
Voll
frame is titanium and the cathode frame is stainless steel. The CME elements are thicker than competing elements for a lower electrolyte gas void fraction.
This feature minimizes the drop in the Equid level during shutdowns. CEC offers electroplated activated cathodes. Gas and Equid exit the cell in the
stratified overflow mode, as the Equid level is maintained in the upper cell frame. Semitransparent teflon tubes are used to monitor the operation visually.
The electrical bus bars are installed underneath and at a right angle to the cell elements, requiring no equalizer between electrolyzers. The bus bar can be
used as a short circuiting element by changing the connections. Chlorine Engineers had Ecensed 15 plants by 1989 with its CME electrolyzers for an annual
production capacity of approximately 35,000 t of sodium hydroxide.
Fig. 19. CME monopolar electrolyzer: a, membrane; b, cathode element; c, half-cathode element; d, current distributor; e, Teflon tube; f, Cl2 + depleted
brine manifold; g, conductor rod; h, Cl2 + depleted brine oudet nozzle; i, base frame; j, recycled NaOH manifold; k, recycled NaOH inlet nozzle; 1, gasket
(the gasket-to-element ratio is quite small); m, tie rod; n, anode element; o, H2 + NaOH manifold; p, end plate, q, under cell bus bar (simplifies piping
around the electrolyzers); r, feed brine manifold.
Chlorine Engineers MBCElectrolyzer. Chlorine Engineers retrofits OxyTech MDC monopolar diaphragm cell electrolyzers to convert
them into membrane cells (48,49). In retrofitting, CEC installs the membrane in the form of a bag that encloses the anodes (membrane bag cell). In the
MBC-29 shown in Figure 20, one bag encloses two anodes. The current conductor bar of the anode passes through a hole in the bottom of the membrane
bag for connection to the base. The open end of the bag, facing upward, is fixed to the partition plate by a seaEng plug.
Fig. 20. Cut view of Chlorine Engineers membrane bag cell: a, manifold; b, frame; c, partition plate; d, seaEng plug; e, recirculated NaOH inlet; f, cathode;
g, anode; h, cathode can; i, membrane bag; j, base; k, butterfly valve; 1, feed brine; m, depleted brine; n, caustic outlet.
ICIFM-21 SP Monopolar Electrolyzers. Id’s FM-21 SP monopolar electrolyzer incorporates stamped electrodes that are 2 mm thick and
of a relatively small (0.2 m2) size (50). The electrolyte compartments are created by molded gaskets between two of the electrode plates; the electrode
spacing is finite and is estabEshed by gasket thickness. The electrode frames are supported from rails and are compressed between one fixed and one
floating end plate by tie rods. Inlet and outlet streams are handled by internal manifolds. A crosscut view of the electrolyzer is shown in Figure 21. As of
1989, ICI had Ecensed 20 plants having an annual capacity of 468,250 t of NaOH.
Kirk-Othmer Encyclopedia of Chemical Technology (4th Edition)
496
CHLORINE AND SODIUM HYDROXIDE
Voll
Cell gas (hydrogen)
Copper electrical connections
Tie rod
Floating end plate
Depleted
Fixed end plate
Support rail
Ion-exchange
membrane
Low friction
insulated foot
Disc spring assembly
Anode electrode assembly-
titanium panel between
compression molded
gaskets
Product
caustic
Cell gas
(chlorine)
Cathode electrode assembly-
nickel panel between
compression molded
gaskets
Fig. 21. Cut view of FM-21 electrolyzer.
Lurgi Monopolar Electrolyzer. The Lurgi monopolar electrolyzer, Figures 22 and 23, features louvered plate cathodes (51). Plastic spacers
not only set the finite gap between the electrodes but also subdivide the overall cell into a multiplicity of low height cells. The purpose is to force the gases
to leave the inner electrode gap and to use the gas lift to create an internal circulation which tends to keep the salt concentration in the gap close to that of
the bulk. The anode frame is made of titanium; the cathode frame maybe of steel or nickel. An activated nickel cathode is available. The hollow frames of
the cells have a multiplicity of orifices and provide ample room for distribution of fluids, reducing the possibility of clogging. The upper horizontal part of
the electrodes is designed for gas—liquid disengagement outside the electrical field, avoiding superheating of membranes in the foamy, heat insulating
environment.
Fig. 22. Schematic of Lurgi monopolar membrane cell.
Kirk-Othmer Encyclopedia of Chemical Technology (4th Edition)
497
CHLORINE AND SODIUM HYDROXIDE
Voll
Oronzio De Nora Technologies DD Monopolar and Bipolar Electrolyzers, Oronzio De N ora Technologies has the DD-type cell
design. Frame active area ranges from 0.9 to 1.7 m2 for monopolar electrolyzers and from 0.9 to 5.12 m2 for the bipolar ones (52,53). The unique design
feature of the DD electrolyzers is a thick cast-metal current distributing element, used for collection and distribution of the electrical current. The
cast-metal body has a number of protrusions which are used to conduct the current to the electrodes. Protection of the cast-metal bodies against chemical
attack is achieved by protective liners of nickel and titanium sheets that are welded to the cast elements. Inlet and oudet nozzles are welded onto the liners.
As of 1989, 11 plants representing a 283,700 t/yr NaOH capacity had been licensed.
The monopolar electrolyzer shown in Figure 24 consists of a repetition of anode element—membrane—cathode element series clamped between two
end plates, each consisting of a half element. When the electrolyzer is assembled, the nozzles of all inlets, located at the bottom of the electrolyzer, and all
oudets, located at the top of the electrolyzer, connect to form an integral manifold external to the cell. Current flows from one electrolyzer to the next in
series through flexible copper connectors attached to the cast-metal current distributing elements. Each electrolyzer is provided with individual gas
separators designed for natural recirculation. The elements are held together by a tie rod clamping system. The cathode includes a removable self-adjusting
elastic nickel element and an activated cathode mesh which can be adjusted to the finite-gap or zero-gap configuration. The anode system consists of a
removable thin DSA-coated screen against a titanium current conductor.
Hydrogen
disengaging box
Recycling
manifolds for brine
Chlorine disengaging box
Cathode package
i liner
Copper connection
Membrane
Membrane
Cathodic element
Current distributing
element
Cathodic
element
Anodic element or
cathodic element
and caustic
Fig. 24. De Nora Technologies DD-Туре monopolar membrane electrolyzer.
The De Nora DD-type bipolar electrolyzer is similar in construction to the monopolar electrolyzer except that each cell frame is composed of a pair
Kirk-Othmer Encyclopedia of Chemical Technology (4th Edition)
498
CHLORINE AND SODIUM HYDROXIDE
Voll
of anode and cathode compartments opposing each other and having one ion-exchange membrane placed between them. The iron frames are supported
by hangers. Each cell is provided with individual flexible PTFE inlet and oudet hoses between the electrolyzer and the feed and collection headers.
Recirculation of fluids may be either natural or pressure fed.
OxyTech Systems MGC Monopolar Electrolyzers. The MGC (membrane gap cell) electrolyzer is distinguished by a design in which the
electrodes are separated only by the thickness of the membrane itself (54). High surface area DSA anodes and activated cathodes are employed. The anode
and cathode sections are alternated in the electrolyzer sandwich and the ion-exchange membrane is placed between them. The anode section consists of a
lightweight stamped titanium anode frame having fixed supports welded between the pan and the DSA electrode mesh, a gasket, reticulate nickel interface
material, a copper current distribution plate, and a second anode pan electrode assembly. The nickel cathode section is similarly arranged; however, the
cathodic electrode is supported by flexible nickel springs, allowing the cathode mesh to press against and conform to the membrane and the opposing
anode mesh. The active area of each membrane is 1.5 m2 and up to 30 membranes can be assembled into one electrolyzer, providing a production capacity
of up to 2810 tons of NaOH per year per electrolyzer.
Connecting spool pieces and gaskets are inserted to create inlet and oudet anolyte and catholyte manifolds external to but integral with the
electrolyte compartments, as shown in Figure 25. The electrolyte compartments are sealed with unique О-ring gaskets in a staggered arrangement in which
the catholyte gasket is located closer to the fluids than the anolyte О-ring gasket. This design provides a double seal and utilizes the membrane itself to
protect the anolyte gasket from the corrosive anolyte. The intercell connections are from the sides, and the electrical bus provides the support for the
electrolyzer on a copper current redistribution bus between each electrolyzer. As of the end of 1989, OxyTech Systems had licensed 30 plants having annual
production capacity in excess of 750,000 tons of NaOH.
Fig. 25. OxyTech MGC electrolyzer: a, membrane; b, anode assembly; c, manifold spacer; d, anolyte oudet; e, catholyte oudet; f, bulkhead; g, brine inlet; h,
NaOH inlet; i, insulating channel; j, bulkhead insulator; k, interface material; 1, cathode assembly; m, intercell bus; n, tie rod; o, current distributor; p,
electrolyzer support; q, support beam; r, connecting bus bar.
Hoechst- Uhde Bipolar Electrolyzers. The characteristic design feature of the Hoechst-Uhde membrane cell is its single element shown in
Figure 26 (55). Each element consists of an anode pan, membrane, gasket, and a cathode pan sealed by means of individually bolted separate flanges
instead of the filter press designs used in other electrolyzers. A group of single elements is combined to form an electrolyzer. The current passes from the
cathodic back wall of one element to the anodic back wall of the subsequent element by a series of contact strips. Feed and discharge from the individual
elements is conducted by flexible PTFE hoses. Both inlet and oudet connections are located at the bottom of the electrolyzers. The electrodes are of the
louver type and the electrode spacing can be varied to either the finite-gap or zero-gap configuration. The elements are normally arranged in series (bipolar
arrangement) but may be arranged in parallel (monopolar arrangement).
Membrane
Cathode pan
Membrane
Electrode
Supply pipe
Fig. 26. Single element of Uhde membrane cell.
The typical electrode active areas are 1.8 and 2.7 m2 and annual electrolyzer production capacity can be up to 16000 tons of NaOH. In 1989 Uhde
had 17 plants in operation or under construction having an annual capacity of 800,000 tons of NaOH.
A summary of the current membrane cell technologies is provided in Table 13.
Kirk-Othmer Encyclopedia of Chemical Technology (4th Edition)
499
CHLORINE AND SODIUM HYDROXIDE
Voll
Table 13. Summary of Current Membrane Cell Technologies
Bipolar cells________ ________________________Monopolar cells
Asahi Chemical Acilyzer De Nora Bipolar Uhde Asahi Glass AZEC-M CEC DMC-404x2 De Nora DD Lurgi ICI FM-215P OxyTech MGC
effective membrane area, m2 2.88-5.4 0.9-5.12 1-3 0.2 3.03 0.9-1.7 0.8 0.21 1.5
cells per electrolyzer 50-100 10-32 2-120 30-540 4 10-32 1-120 2-30
current load, kA 5.8-21.6 2.7-20.5 2-18 18-340 24-48 27-218 1-100 6-225
current density 2-4 2-4 2-6 3-4 2-4 3-4 1-4 1.5-4.1 2-5
Catalytic Cathodes. The cathode material generally found in diaphragm cells is low carbon steel in either mesh or perforated form, whereas
nickel or stainless steel is used in membrane cell electrolyzers. The hydrogen overvoltage is typically about 350 to 400 mV at 20 А/dm2 in 2.5 XNaOH at
90°C. The exact value depends on the surface state of the steel or nickel. Energy savings by reducing overpotential as much as 200 to 250 mV are realizable
in principle by using catalytic coatings on the cathode substrates. Various surface modification approaches have been adopted since the mid 1970s to
decrease the overvoltage of these cathodes. Methods include enhancing the effective area of the cathode by using materials that provide high surface area
and better electrocatalytic properties than steel. Composites generally chosen for coating are nickel or noble metal based. They are deposited on the cathode
by thermal or plasma and/or electrolytic routes using a second component such as aluminum or zinc, which is leached out in NaOH solutions to achieve a
highly electrochemically active surface. Several compositions are mentioned in the literature (8,56—58). However, the coatings that are commercially
employed in membrane cells include Ni—S (59), Ni—Al (60), and Ni—NiO mixtures (61), and nickel coatings containing the platinum group metals (62).
Although catalytic cathode technology is practiced in membrane cells, commercialization is still awaited in diaphragm cells. The technical problems
confronting catalytic cathode use in diaphragm cells include selection of a coating technique for the complex cathode assembly that would not adversely
influence the structural tolerances involved in the fabrication of cathodes, and developing shutdown procedures which would eliminate hypochlorite as
quickly as possible to preserve the catalytic activity of the coatings. Such problems do not exist in membrane cells because of the simplicity of the cathode
structure and the anion rejection properties of the membrane.
Catalytic cathodes in membrane cell operations exhibit a voltage savings of 100—200 mV and a life of about 2 + yr using ultrapure brine. However,
trace impurities such as iron from the caustic recirculation loop can deposit on the cathode and poison the coating, thereby reducing its economic life.
Membrane Cells with Air Depolarized Cathodes. Substituting an oxygen reduction reaction for the hydrogen evolution reaction at the
cathode of a membrane cell reduces the electrical energy required to produce chlorine and sodium hydroxide (63). In the air cathode cell, shown in Figure
27, the anode reaction is the discharge of chloride ions to form chlorine. Brine entering the anolyte chamber is oxidized at the anode to form chlorine gas,
and sodium ions migrate through the ion-exchange membrane. Oxygen is reduced at the air cathode to form hydroxide ion which combines with the
sodium ion from the anode compartment to form sodium hydroxide. There are three unique features in an air cathode cell. The first is the inclusion of an
air chamber behind the electrode to provide oxygen for the cathodic reaction. Second, because no hydrogen is produced, there is no need for hydrogen
collection equipment. Third, and most important, is that the air cathode cell operates at approximately 1.0 V lower than a conventional hydrogen evolving
chlorine cell.
Chlorine
Fig. 27. Schematic of an air-cathode chlor—alkali cell.
The plant incorporating the air cathode electrolyzer must include a high performance air scrubbing system to eliminate carbon dioxide from the air.
Failure to remove CO2 adequately results in the precipitation of sodium carbonate in the pores of the cathode; this, in turn, affects the transport of oxygen
and hydroxide within the electrode. Left unchecked, the accumulation of sodium carbonate will cause premature failure of the cathodes.
Most of the voltage savings in the air cathode electrolyzer results from the change in the cathode reaction and a reduction in the solution ohmic
drop as a result of the absence of the hydrogen bubble gas void fraction in the catholyte. The air cathode electrolyzer operates at 2.1 V at 3 кА/m2 or
approximately 1450 d-c kW-h per ton of NaOH. The air cathode technology has been demonstrated in commercial sized equipment at Occidental
Chemical's Muscle Shoals, Alabama plant. However, it is not presendy being practiced because the technology is too expensive to commercialize at power
costs of 20 to 30 mils (1 mil = 0.1 0/kW).
Chlorine Plant Auxiliaries. Flow diagrams for the three electrolytic chlor-alkali processes are given in Figures 28 and 29. Although they
differ somewhat in operation, auxiliary processes such as brine purification and chlorine recovery are common to each.
Kirk-Othmer Encyclopedia of Chemical Technology (4th Edition)
500
CHLORINE AND SODIUM HYDROXIDE
Voll
Salt
Water Salt (brine)
Sodium hydroxide Hydrogen
Chlorine
Sodium hydroxide Hydrogen
Chlorine
Mercury process
Diaphragm process
Fig. 28. Flow diagrams of the Mercury and Diaphragm chlor—alkali processes.
Water Salt
Hydrogen Chlorine Sodium
hydroxide
Membrane process
Fig. 29. Flow diagram of the membrane chlor- alkali process.
Kirk-Othmer Encyclopedia of Chemical Technology (4th Edition)
501
CHLORINE AND SODIUM HYDROXIDE
Voll
Brine Purification. Sodium chloride, whether solution mined or obtained as either mined or solar evaporated solid salt, contains
contaminants (primarily calcium, magnesium, barium, and sulfates) that are detrimental to the electrolytic process. Trace metals such as iron, titanium,
molybdenum, chromium, vanadium, and tungsten can also cause problems in mercury cells by lowering the hydrogen overpotential on mercury.
Membranes are especially sensitive to brine impurities, and the membrane cell process requires a higher degree of brine quality than either the diaphragm or
mercury system. Impurities that are soluble in the acidic anolyte can become insoluble once they have entered the membrane. In addition to induced flow
of cation impurities, neutral or anion impurities can also enter the membrane via diffusion and the considerable water flow from the anolyte to the
catholyte. When impurities precipitate, the membrane is physically disrupted; reducing the current efficiency if the disruption occurs in the cathode-side
layer of the composite membrane. Even if the impurity is subsequendy washed out, the void left behind will still contribute to reduced current efficiency,
allowing hydroxyl ions to penetrate further into the membrane from the catholyte. There are synergistic effects, such as the precipitation of complex
compounds, usually incorporating calcium and magnesium impurities in the feed brine. Iodine can damage a membrane and reduce current efficiency by
precipitating as sodium paraperiodate, Na3H2IO6. In addition, some brines contain ammonium ions or organic nitrogen which can be converted to
nitrogen trichloride in the electrolyzer and, if concentrated in the downstream process, NC13 may explode. Ammonium ions in the brine are removed either
by chlorine, producing NH2C1 which can be removed as gas, or by hypochlorite, which produces nitrogen.
Removal of brine contaminants accounts for a significant portion of overall chlor-alkali production cost, especially for the membrane process.
Moreover, part or all of the depleted brine from mercury and membrane cells must first be dechlorinated to recover the dissolved chlorine and to prevent
corrosion during further processing. In a typical membrane plant, HC1 is added to liberate chlorine, then a vacuum is applied to recover it. A reducing agent
such as sodium sulfite is added to remove the final traces because chlorine would adversely react with the ion-exchange resins used later in the process.
Dechlorinated brine is then resaturated with solid salt for further use.
Brines, either from a well in the case of many diaphragm cell plants or from the recirculated, resaturated supply of the mercury or membrane
processes, are treated with sodium carbonate to precipitate calcium carbonate, followed by sodium hydroxide to precipitate magnesium hydroxide (64).
Most trace metal impurities are also precipitated during this process. The brine is usually heated before treatment to improve the reaction times and the
precipitation and settling. Flocculants and other agents are sometimes added, especially if the calcium to magnesium ratio is low, since the calcium
carbonate helps to settie the light, fragile magnesium hydroxide flock. In the diaphragm cell process sodium sulfate is controlled by a purge to another
process from the caustic evaporators, improving the purity of the salt recovered in the evaporators, which is used to saturate the brine. The dechlorinated
brine from the mercury and membrane cell processes is treated with calcium chloride to precipitate calcium sulfate, followed by settling.
Following carbonate and caustic treatment, the precipitates are allowed to settle in a clarifier where most of the solids are removed as a mud. The
mud is then washed to recover entrained sodium chloride. The overflow from the clarifiers is filtered, preferably by upflow sand filters followed by
precoated polishing filters, to remove all suspended solids. This primary purification step produces brine with less than 4 ppm calcium and 0.5 ppm
magnesium, which is satisfactory for both the mercury and diaphragm processes. The membrane process, however, requires brine having less than 20 ppb
hardness and this level of purity requires a further purification step. The alkaline brine passes through a series of two or more ion-exchange columns. The
quantity of resin in each column must be sufficient to remove all of the impurities (calcium, magnesium, and barium) while the other column is being
regenerated with HC1 followed by NaOH treatment.
The brine feed to the electrolyzers of all the processes is usually acidified with hydrochloric acid to reduce oxygen and chlorate formation in the
anolyte. Table 14 gives the specifications of the feed brines required for the membrane and diaphragm cell process to realize optimal performance.
Table 14. Typical Specifications for Feed Brine to Electrolyzers
Membrane cell process Diaphragm cell process
sodium chloride 280-305 g/L 320 g/Lb
calcium and magnesium 20 ppb 5 ppm
sodium sulfate 7 ppm 5 ppm
silicon dioxide 5 ppm 0.5 ppm
aluminum 50 ppb 0.5 ppm
iron 0.5 ppm 0.3 ppm
mercury 0.04 ppm 1 ppm
heavy metals 0.05 ppm 0.05 ppm
fluoride 1 ppm 1 ppm
iodine 0.4 ppm
strontium 0.5 ppm C
barium 0.4 ppm C
total organic carbon 1 ppm 1 ppm
pH 2-11 2.5-3.5
All ppb and ppm values represent maximum concentration allowed.
Minimum concentration allowed.
Included with calcium.
Chlorine Cooling, Drying, Liquefaction, and Recovery. Chlorine produced by any of the electrolyzer processes is saturated with water
vapor at high temperature. The pressure can range from a slightly negative or positive value to, in the case of some membrane cell plants, up to several
hundred kilopascals. In the case of the diaphragm process the chlorine gas stream also carries along droplets of sodium hydroxide and salt. The chlorine is
first cooled to usually not less than 10°C to avoid the formation of chlorine hydrate crystals. Cooling is carried out indirectiy in titanium tubular heat
exchangers in one or two stages using chilled water on the coolest stage. Water and remaining solids are removed in either wet Brinks demisters, which
have special filter elements containing glass wool fibers, or electrostatic precipitators.
Chlorine drying is carried out using concentrated (96—98 wt %) sulfuric acid, and, depending on the use intended for the dilute sulfuric acid
by-products, the drying can be accomplished in from two to four stages. The sulfuric acid and chlorine flow countercurrentiy. The drying towers are usually
packed towers of brick-lined rubber-lined steel, or PVC-lined glass-fiber-reinforced plastic. After drying, the chlorine gas is passed through demisters to
remove sulfuric acid mist. The upper limit for moisture remaining after drying is 50 ppm. Often, the cooled dry gas is scrubbed using liquid chlorine. This
precools the chlorine gas prior to compression and provides further purification. Small chlorine plants utilize reciprocating or sulfuric acid sealed liquid-ring
compressors. However, turbo compressors are the most economical for larger plants. In all chlorine operations involving compression, great care must be
taken to prevent the heat from increasing the temperature of the gas enough to reach the chlorine—steel ignition temperature. It is for this reason that the
precooling described above is used. In addition, there are often intercoolers between stages of turbo compressors.
About half of the chlorine produced is used as cooled dry gas which is transported by pipelines to the consuming process; the remainder is liquefied,
stored, and shipped. Chlorine can be liquefied over a wide range of pressures and temperatures. Increasing the liquefaction pressure increases the energy
required for compression. However, it also reduces the energy required for refrigeration to the extent that the overall energy spent is less. Thus the
temperature and pressure at which the chlorine is stored are also factors in selecting the liquefaction pressure.
Any hydrogen contained within the chlorine from the electrolyzer is concentrated in the residual gas from the liquefaction process and must not be
allowed to exceed the explosive concentration limit of 5%. Although hydrogen concentration can be controlled by adding dry air to the process,
Kirk-Othmer Encyclopedia of Chemical Technology (4th Edition)
502
CHLORINE AND SODIUM HYDROXIDE
Voll
single-stage liquefaction units are not designed to liquefy more than 90—95% of the chlorine. To achieve a higher percentage of liquefaction additional
compression and refrigeration are required. This is sometimes followed by the Oxy Tech chlorine recovery process (65).
Chlorine in the tail gas from liquefaction can be combined with chlorine from plant vessel evacuation systems and that from returned tank cars,
trucks, and barges, and be recovered in a chlorine recovery unit (66). The recovered gas mixture and recycle streams are further compressed in a
reciprocating compressor. The gas is then cooled, first using water, and then Freon, to —12° C. The chilled gas is sent to an absorber while a portion of
chlorine which is liquefied is either used as reflux later in the process or sent to storage. The chilled gas enters the bottom of a chlorine absorber flowing
upward through two packed sections while cold carbon tetrachloride flows countercurrendy. All of the chlorine is absorbed in the carbon tetrachloride and
the hydrogen and other inert gases exit the top of the absorber into a solvent recovery unit which removes the residual carbon tetrachloride before venting
to the atmosphere. The chlorine-rich carbon tetrachloride leaves the bottom of the absorber and is forced by differential pressure between the towers to
the middle of the chlorine stripper. The stripper feed flows downward through two packed sections, releasing chlorine as it is heated. A thermosiphon
reboiler provides the heat at the bottom of the stripper. Chlorine stripped from the carbon tetrachloride passes upward through a packed top section of the
column where it is cooled and scrubbed of solvent by liquid chlorine reflux. The recovered chlorine in the stripper overhead is sent to the chlorine
liquefaction system or recycled to the beginning of the chlorine recovery process to provide an adequate supply of stripper reflux.
Sodium Hydroxide Processing. Sodium hydroxide is usually produced as a 50% water-based solution, although 73% and anhydrous
sodium hydroxide are also marketed. High purity sodium hydroxide is available direcdy from the mercury and membrane cell processes. The mercury cell
caustic is produced at 50% strength and only filtration is required to remove mercury droplets. The concentration of sodium hydroxide in the diaphragm
cell effluent is only 10—12%. The effluent also contains 13—16% sodium chloride, 0.25% sodium sulfate, and 0.15% sodium chlorate. The solubility of NaCl
in 50% caustic is approximately 1—1.5%; thus the salt crystallizes during the evaporation process. From 4.6 to 7.3 tons of water must be evaporated to
produce 1 ton of 50% NaOH. Most large diaphragm cell chlor—alkaE plants have an associated cogeneration power plant. In these facilities the caustic
evaporators, which are triple or quadruple effect, are important for utilizing the by-product steam. The hows ofEquor to the different effects varies from
plant to plant. The triple-effect system presented in Figure 30 is an example of one of the many different systems. The cell Equor or effluent is fed into the
second-effect evaporator. It is partially concentrated and transferred to the third vapor effect through the salt setder system to the first-effect evaporator
and finally to the Equor flash tank. Salt is recovered from all three evaporators. Sodium borohydride [16940-66-2] is commonly added to the evaporation
system to reduce corrosion of the equipment and to reduce the nickel content in the finished product (67).
To barometric
Exchangers 1,2, and 3 are forced circulation
Fig. 30. Flow diagram of a triple-effect caustic evaporator.
Sodium sulfate [7757-82-6]> Na2SO4, also crystallizes in the latter stages of evaporation. This high sulfate salt can be removed by isolation and not
returned to the brine system. Because the diaphragm process produces high quaEty soEd salt and the membrane cell process requires soEd salt, it is a good
combination to have both diaphragm cells and membrane cells in the same chlor—alkaE producing complex. The membrane cell produces 32—35% caustic
direcdy from the electrolyzer. The concentration is normally raised to 50% in a multiple-effect evaporator that is much simpler than the diaphragm caustic
evaporator; no soEds separation equipment is needed because the salt concentration in this caustic is very low.
Hydrogen Processing. The hydrogen produced in all electrolytic chlor—alkaE processes is relatively (>99.9%) pure and requires only cooling
to remove water along with entrained salt and caustic. The heat is often recovered into the brine system. Hydrogen from the mercury process must also be
scrubbed to remove mercury. The hydrogen is compressed using water-sealed Equid-ring or Roots-type blowers. The hydrogen system, from the
electrolyzers to the compressor suction, is always under positive pressure to avoid combination with air, which could form an explosive mixture. Some uses
of hydrogen require additional removal of traces of oxygen. This is accompEshed by reaction of the hydrogen with oxygen over a platinum catalyst.
The hydrogen can be used for organic hydrogenation, catalytic reductions, and ammonia synthesis. It can also be burned with chlorine to produce
high quaEty HC1 and used to provide a reducing atmosphere in some appEcations. In many cases, however, it is used as a fuel.
Other Chlorine Production Processes. Although electrolytic production of Cl2 and NaOH from NaCl accounts for most of the chlorine
produced, other commercial processes for chlorine are also in operation.
Chlorine from Potassium Hydroxide Manufacture. One of the coproducts during the electrolytic production of potassium hydroxide
employing mercury and membrane cells is chlorine. The combined name plate capacity for caustic potash during 1988 totaled 325,000 t/yr and growth of
U.S. demand was expected to be steady at 2% through 1990 (68).
Chlorine from HC1. Most organic chlorination reactions consume only half the Cl2 to produce the desired product; the other half is converted
to HC1. Depending on demand and supply of Cl2 vs HC1, chlorine recovery from hydrochloric acid is sometimes attractive. Two commercial routes are
available: electrolysis and oxidation (69).
Pkctrolysls ofHCL Electrolytic decomposition of aqueous HC1 to generate Cl2 and H2 follows the overall reaction
Kirk-Othmer Encyclopedia of Chemical Technology (4th Edition)
503
CHLORINE AND SODIUM HYDROXIDE
Voll
2HC1^H2 + C12
(25)
A typical electrolytic cell employs graphite electrodes and a PVC diaphragm. Chlorine dissolved in the anolyte diffuses through the diaphragm and is
reduced at the cathode resulting in a 2 to 2.5% loss in chlorine efficiency. The cells are operated below 85°C at a HC1 concentration of 18.5 wt %. Each cell
has an effective surface area of 2.5 m2 and operates at a current density of 4—5 кА/m2 corresponding to a cell voltage of ~1.90 V and an energy
consumption of 1400—1500 kW-h per ton of Cl2. Spent acid (/-20% HC1) is resaturated after cooling and recycled. The chlorine is dried using sulfuric acid
and hydrogen is scrubbed with caustic for removal of Cl2 and HC1. Hydrochloric acid electrolysis cells are manufactured by Hoechst-Uhde (70). Each
electrolyzer consists of 30—36 individual cells connected in series and operates up to a load of 12 kA (69,70). There are a number of these electrolytic
operations throughout the world, but only one in the United States, operated by Mobay at Baytown, Texas.
Three other processes that electrolytically convert HC1 to Cl2 using metal chloride catalyst are the Schroeder process, using NiC^; the Westvaco
process, using CuCl2; and the South African process, using MnCl2. None of these processes is commercial. The Schroeder process illustrates the principles
involved in these technologies. The Schroeder process is cyclic and involves two steps. The metal chloride is electrolyzed to produce the metal and chlorine:
NiCl2 Ni + Cl2
(26)
During the second step the metal reacts with HC1 to reform the metal chloride, which is then recycled:
Ni + 2 HC1 NiCl2 + H2
(27)
The overall reaction is that of equation 25.
Chlorine from the Magnesium Process. Magnesium is produced by the fused salt electrolysis of MgCl2 (see Magnesium and magnesium
alloys). The largest magnesium plant in the United States, Dow Chemical at Freeport, Texas, uses calcium—magnesium carbonate as a raw material and the
chlorine is recycled within the process. The Rowley, Utah, plant of the AMAX Magnesium Corporation produces magnesium direcdy from purified
magnesium chloride recovered from the Great Salt Lake. Some of the chlorine is recycled in the process, but most of it is sold commercially. SRI
International lists AMAX's chlorine capacity at 13,600 t/yr.
Chlorine from the Titanium Process. Electrolysis of magnesium chloride is a process step in the production of titanium, and one plant
produces chlorine by-product for market. Titanium metal is produced by the reaction of titanium tetrachloride with magnesium (see Titanium and titanium
alloys). The magnesium chloride from this process step is then electrolyzed as in the production of magnesium. In most titanium plants, the chlorine is
recycled in the production of titanium tetrachloride from the titanium oxide ore rutile [1317-80-2]. There is, however, one titanium plant (Oregon
Metallurgical Corporation, Albany, Oregon) which purchases titanium tetrachloride [7550-45-0] as its raw material. This plant therefore markets the
chlorine generated by the magnesium chloride fused salt cells. SRI International lists Oregon Metallurgical Corporation's capacity at 10,800 t/yr.
Chemical Oxidation ofHCl. Chlorine can be produced from HC1 using air or O2 following the overall reaction
4HC1 + O2 2 Cl2 + 2H2O
(28)
Three routes pursued to achieve this conversion are catalytic oxidation of gaseous HC1, direct oxidation of HC1 by an inorganic oxidizing agent, and
two-stage processes involving intermediate formation of a metal chloride from either its oxide or oxychloride and subsequent release of the chlorine by air,
oxygen, or heat. Only two of these processes have been commercialized.
Shell Chlorine Process. The Shell process produces Cl2 from the HC1 using air or O2 in the presence of cupric and other chlorides on a silicate carrier (71).
The reaction proceeds at an optimal rate in the temperature range of 430—475°C at an efficiency of 60—70%. A manufacturing unit was built by Shell in the
Netherlands (41,000 t/yr) and another in India (27,000 t/yr). Both plants have been closed down.
Kellogg Chlorine Process. The Kellogg process uses ~1% nitro sylsulfuric acid [7782-78-7] catalyst and a dissimilar material containing a clay desiccant having a
reversible water content of -0.5 wt% and a crystalline structure stable to at least 760°C (72,73). Montmorillonite [1318-93-0] is the desired clay desiccant. It
absorbs water as it forms, shifting the equiEbrium of equation 28 to the right. The basic reaction is carried out on a fluidized bed in which the soEds run
countercurrent to the gaseous reactants at a temperature of 400—500°C and pressures of 300—1200 kPa (3—12 atm). Nitrosylsulfuric acid catalyst is fed into
the top of the stripper column where it reacts with HC1 to form nitrosyl chloride which then reacts with O2 in the oxidizer to produce Cl2:
HC1 + NOHSO4 NOCI + H2SO4
(29)
2NOC1 + O2 2NO2 + Cl2
(30)
In the absorber—oxidizer HC1 is further converted to chlorine
NO2 + 2 HC1 NO + Cl2 + H2O
(31)
and the nitrosyl sulfate formed is recycled to the stripper:
NO + NO2 + 2 H2SO4 2 NOHSO4 + H2O
(32)
NOCI + H2SO4 nohso4 + HC1
(33)
The cooled, dried chlorine gas contains ^2% HC1 and up to 10% O2, both of which are removed by Equefaction. A full scale 600-t/day plant was built by
Du Pont in 1975. This installation at Corpus Christi, Texas operates at 1.4 MPa (13.8 atm) and 120—180°C and uses tantalum-plated equipment and pipes.
Oxidation ofHCl Chloride by Nitric Ncid. The nitrosyl chloride [2696-92-6] route to chlorine is based on the strongly oxidizing properties of nitric acid
(74,75):
6 HC1 + 2 HN03 2 Cl2 + 2 NOCI + 4 H2O
(34)
2 NOCI + 2 H2O + O2 2 HC1 + 2 HN03
(35)
The practical problems Ее in the separation of the chlorine from the hydrogen chloride and nitrous gases. The dilute nitric acid must be
reconcentrated and corrosion problems are severe. Suggested improvements include oxidation of concentrated solutions of chlorides, eg, LiCl, by nitrates,
foEowed by separation of chlorine from nitrosyl chloride by distiEation at 135°C, or oxidation by a mixture of nitric and sulfuric acids, separating the
Kirk-Othmer Encyclopedia of Chemical Technology (4th Edition)
504
CHLORINE AND SODIUM HYDROXIDE
Voll
product chlorine and nitrogen dioxide by liquefaction and fractional distillation.
A survey of nonelectrolytic routes for Cl2 production was conducted by Argonne National Laboratory; the economics of these processes were
examined in detail (76). One route identified as energy efficient and economically attractive is the conversion of waste NH4C1 to Cl2.
CHLORINE
Physical Properties
Chlorine, a member of the halogen family, is a greenish yellow gas having a pungent odor at ambient temperatures and pressures and a density 2.5 times
that of air. In Equid form it is clear amber; Solid chlorine forms pale yellow crystals. The principal properties of chlorine are presented in Table 15;
additional details are available (77—79). The temperature dependence of the density of gaseous (Fig. 31) and liquid (Fig. 32) chlorine, and vapor pressure
(Fig. 33) are illustrated. Enthalpy pressure data can be found in ref. 78. The vapor pressure P can be calculated in the temperature (T) range of 172—417 К
from the Martin-Shin-Kapoor equation (80):
InF = A + — + ClnT + DT + Af—r)ln(7?—A
pp
where A = 62.402508, В = -4343.5240, C = 7.8661534, D = 1.0666308 x 0 , E = 95.248723, and F = 424.90.
Table 15. Physical Constants of Chlorine
Property Value
CAS Registry Number [7782-50-5]
atomic number 17
atomic weight 35.453
stable isotope abundance, %
35C1 75.53
37C1 24.47
electronic configuration in the ground state |\e|3.<3//
melting point, °C -100.98
-34.05
boiling point, °C, at 101.3 kPa
density relative to air 2.48
critical density, kg/m3 565.00
critical pressure, MPaa 7.71083
critical volume, m3/kg 0.001745
critical temperature, К 417.15
density, kg/m3 at 0°C and 101.3 kPaa 3.213
viscosity (gas), Pa • s at 20°C 14.0
viscosity (liquid), Pa sb at 20°C 340
latent heat of vaporization, J/g 287.4
enthalpy of fusion \ / /, kJ /kg 90.33
enthalpy of vaporization kJ /kg 287.1
standard electrode potential, V 1.359
enthalpy of dissociation, kJ/mol 2.3944
electron affinity, eV 3.77
enthalpy of hydration of Cl-, kJ /mol 405.7
ionization energies, eV 13.01, 23.80, 39.9, 53.3, 67.8, 96.6, and 114.2
specific heat kJ/kg Kc 0.481
specific heat kJ/kg • Kc 0.357
specific magnetic susceptibility, m3/kg at 20°C -7.4 x 10-°
electrical conductivity of liquid Cl2, (Qcm) at — 70° C 10~16
dielectric constant for wavelengths > 10 m at 0°C 1.97
To convert kPa to mm Hg, multiply by 7.5.
To convert Pa s to P, multiply by 10.
C To convert J to cal, divide by 4.184.
Kirk-Othmer Encyclopedia of Chemical Technology (4th Edition)
505
CHLORINE AND SODIUM HYDROXIDE
Voll
Temperature, °F
Fig. 31. Density of gaseous chlorine as a function of temperature at various pressures. To convert kPa to psig, multiply by 0.145 and subtract 14.6. (77).
Temperature, °C
Fig. 32. Temperature dependence of density of liquid chlorine (78).
Kirk-Othmer Encyclopedia of Chemical Technology (4th Edition)
506
CHLORINE AND SODIUM HYDROXIDE
Voll
Temperature, °F
Fig. 33. Vapor pressure of liquid chlorine as a function of temperature (78).
Chlorine is soluble in water and in salt solutions, the solubility decreasing with salt strength and temperature (see Fig. 34). It is partially hydrolyzed in
aqueous solution as
Cl2 + H2O^HC1 + HOC1
(37)
Temperature, °C
Fig. 34. Solubility of chlorine in. water and aqueous HC1 and NaCl. Solution concentrations are in wt %.
Below 10°C, chlorine forms hydrates which are greenish yellow crystals and the Cl2—H2O system has a quadruple point at 28.7°C. SolubiEty data of
chlorine in various solvents are given in Table 16.
Table 16. Solubility of Chlorine in Various Solvents
Solvent Temperature, °C Solubility1
sulfuryl chloride 0 12.0
disulfur chloride 0 58.5
phosphoryl chloride 0 19.0
siEcon tetrachloride 0 15.6
titanium tetrachloride 0 11.5
dimethylformamide 0 123
acetic acid, 99.84 wt % 0 . . _b 11.6
benzene 10 24.7
chloroform 10 20.0
carbon tetrachloride 20 17c
hexachlorobutadiene 20 22c
Kirk-Othmer Encyclopedia of Chemical Technology (4th Edition)
507
CHLORINE AND SODIUM HYDROXIDE
Voll
a Solubility in. wt % unless otherwise noted.
b Solubility in g/100 mL.
C Solubility in mol %.
Chemical Properties
The chemical properties of chlorine have been discussed (79). Chlorine generally exhibits a valence of —1 in compounds, but it also exists in the formal
positive oxidation states of +1 (NaClO [7681-52-9]), +3 (NaClO2 [7758-19-2]), +5 (NaClO3 [7775-09-9]), and +7 (NaClO4 [7601-89-0]), Molecular chlorine
is a strong oxidizer and a chlorinating agent, adding to double bonds in aEphatic compounds or undergoing substitution reactions with both aEphatic and
aromatic ones. Significant industrial reaction products are presented in Tables 17 and 18 (81). Chlorine is very reactive under specific conditions but it is not
explosive or flammable. Reactions of chlorine with most elements (eg, S, P, L, Brn, FT) are facile but those with N„, CL, and C are indirect. Chlorine reacts
with NH3 to form the explosive NC13. Chlorine gas does not react with H2 at normal temperatures in the absence of light. However, at temperatures above
250°C, or in the presence of sunlight or artificial light of -470-nm wavelength, H2 and CL combine explosively to form HC1. Explosive limits of mixtures
of pure gases are ^8 vol% H2 and ^2 vol% Cl2 (see Fig. 35). These limits depend on temperature, pressure, and concentration, and can be altered by
adding inert gases such as N2 or CO2.
Table 17. Chlorine Derivatives*
production of organic
chemicals by
oxychlorination processes
(often interchangeable —
with oxyhydrochlorination
processes)
bleach
Chlorine
electrolysis of brine
electrolysis of fused
salt
electrolysis of
magnesium chloride
electrolysis of
hydrochloric acid
catalytic oxidation of
hydrochloric acid
chemical reaction of
potassium chloride
and nitric acid
production of inorganic
chemicals -------------
sanitizing and disinfecting
agent (eg, for municipal
water supplies, swimming
pools)
waste and sewage treatment
slimicide
ethylene dichloride
chlorofluoro hydrocarbons
carbon tetrachloride
1,1,1-trichloroethane
1,1,2-trichloroethane
trichloroethylene
perchloroethylene
methyl chloride
phosgene
methylene chloride
chloroform
ethyl chloride
allyl chloride
chlorosulfonic acid
chloroprene
chloroanthraquinone
chloroanilines
dichloropropane (propylene
dichloride)
dichloropropenes —soil
fumigants
methallyl chloride
pulp and paper textiles
sodium chlorate
hypochlorous acid
amyl chloride
chlorinated paraffins
chlorinated waxes
chlorinated naphthalenes
chloroacetic acid
chloroacetyl chloride ----
chlorobenzene
dichlorobenzenes
tri chlorobenzene
tetrachlorobenzene
benzene hexachloride
polychlorinated biphenyls
chlorotoluenes
hexachloroethane
chlorophenols
chloral
hexachlorocyclopentadiene
perchloromethyl mercaptan
high pressure lubricants
fire-proofing agent for textiles
(with antimony oxide)
plasticizer for poly(vinyl)
chloride) detergents
moisture, flame, acid-, and
insect-proofing of wood,
fabrics, wire, and cable
solvent
2,4-dichlorophenoxyacetic
acid (2,4-D)
2,4,5-trichlorophenoxyacetic
acid (2,4,5-T)
herbicides
tear gas (chloroacetophenone)
dielectric fluid in transformers
and capacitors
organic synthesis
dye intermiediate
fumigant
tetrachlorophthalic anhydride
bleach
flame retardant for plastics
[textiles
[wood pulp
water purification antiseptic
epichlorohydrin, lithium hypochlorite
calcium, sodium hypochlorite
chlorinated trisodium phosphate
cleaner and disinfectant
chlorinated isocyanurates -----------------------
(potassium dichloroisocyanurate, sodium
dichloroisocyanurate, trichloroisocyanuric acid)
hydrochloric acid
phosphorus trichloride
phosphorus pentachloride
phosphorus oxychloride
titanium trichloride
titanium tetrachloride
ferric chloride
aluminum chloride, anhydrous
sulfur monochloride
sulfur dichloride
sulfuryl chloride, mercurous chloride
mercuric chloride
silicon tetrachloride
zinc chloride from zinc metal
antimony pentachloride, antimony trichloride
stannous chloride
sanitizers (eg, for swimming
pools)
household and commercial
bleaches
detergents for automatic
dishwashers
scouring powders
chlorinated cleaners and
sanitizers
arsenic trichloride, bismuth trichloride
chlorine trifluoride
molybdenum pentachloride
iodine momochloride ----------------- pharmaceutical (antiseptic)
iodine trichloride --------------> pharmaceuticals
aRef. 81.
Courtesy of SHI International.
Table 18. Hydrochloric Acid Derivatives'
Kirk-Othmer Encyclopedia of Chemical Technology (4th Edition)
508
CHLORINE AND SODIUM HYDROXIDE
Voll
steel pickling----------------------►
ferric chloride (by-product)
Hydrochloric acid
by-product
from salt and
sulfuric acid
from chlorine and
hydrogen
aRef. 81.
modifier in ore benefication
(flotation) processes
refining of tin and tantalum
chemical milling baths (metal
working)
gaseous flux for babbitting
operation
chemical reagent and
intermediate ------------------►
oil well acidizing
food processing (eg, in sugar
refining, brewing industry,
and for manufacture of
monosodium glutamate and
gelatin)
catalyst for production of
aniline by nitrobenzene
reduction
latex coagulating agent
deliming agent for hides
desulfurization agent for
petroleum
pH control
scale removal
veterinary medicine
Courtesy of SRI International.
production of chlorinated
hydrcarbons via
oxyhydrochlorination
processes (often
interchangeable with
oxychlorination processes)
production of alkyl chlorides
via substitution reactions
production of metallic
chlorides and other
inorganic chemicals ----------
vinyl chloride from acetylene
ethyl chloride
other chlorinated
hydrocarbons
methyl chloride
ethyl chloride
1,4-dichlorobutane
(tetramethylene dichloride)
higher alkyl chlorides
Grignard reagents:
organometallics,
alkychlorosilanes ----------
calcium chloride (waste
by-product)
aluminum chloride,
anhydrous
barium chloride
cadmium chloride
cobaltous chloride
cupric chloride
magnesium chloride from
brines
nickel chloride
stannic chloride
titanium tetrachloride
chlorosulfonic acid
zinc chloride
antimony trichloride
arsenic trioxide ------------
bismuth trichloride
lithium chloride
zirconium tetrachloride
l
zirconium------------------
water repellant agent
pigments
chlorine
silica gel
silica, hydrated
other inorganic chemicals
adiponitrile
other organic
synthesis products
silicone resins and
elastomers
arsenic trichloride
refractories
alloys
photoflash bulbs
pyrotechnics
production of
hydrochlorides
aniline hydrochloride 1
Fdiphenylamine ►
dyes
amine hydrochlorides ►
rubber accelerator
plastics stabilizer
rocket propellants
pesticides
pharmaceuticals
hydrzine dihydrochloride ---------► chlorine scavenger for
other hydrochlorides
hydrogen chloride
chloride gas streams
Other 80 60 40 20 Cl2
gas -<— Other gas, vol %
Fig. 35. Explosive limits of CL—FL—other gas mixtures where ED represents the explosive region in the presence of residue gas from Cl2 liquefaction (O2,
N2, CO2) and in. the presence of inert gases (N2, CO2).
Dry chlorine reacts with most metals combustively depending on temperature: aluminum, arsenic, gold, mercury, selenium, tellerium, and tin react
with dry Cl2 in gaseous or Equid form at ordinary temperatures; carbon steel ignites at about 250°C depending on the physical shape; and titanium reacts
violendy with dry chlorine. Wet chlorine is very reactive because of the hydrochloric acid and hypochlorous acid (see eq. 37). Metals stable to wet chlorine
include platinum, silver, tantalum, and titanium. Tantalum is the most stable to both dry and wet chlorine.
Chlorine reacts with alkali and alkaline earth metal hydroxides to form bleaching agents such as NaOCl:
Cl2 + 2 NaOH NaCl + NaOCl + H2O
(38)
Reaction with ammonia produces hydrazine.
2 NH3 + NaOCl N2H4 + NaCl + H2O
(39)
TiO2 reacts with Cl2 in the presence of carbon during the manufacture of TiCL, an intermediate step in the production of Ti metal and TiO2
pigment:
TiO2 + 2 Cl2 + C or 2 C TiCl4 + CO2 or 2 CO
Kirk-Othmer Encyclopedia of Chemical Technology (4th Edition)
509
CHLORINE AND SODIUM HYDROXIDE
Voll
(Я
SiCl4 is produced by reaction of SiO2 with Cl2.
Chlorine reacts with saturated hydrocarbons either by substitution or by addition to form chlorinated hydrocarbons and HC1. Thus methanol or
methane is chlorinated to produce CH3C1, which can be further chlorinated to form methylene chloride, chloroform, and carbon tetrachloride. Reaction of
Cl2 with unsaturated hydrocarbons results in the destruction of the double or triple bond. This is a very important reaction during the production of
ethylene dichloride, which is an intermediate in the manufacture of vinyl chloride:
CH2=CH2 + Cl2 CH2C1—CH2C1
(41)
or
CH2=CH2 + y2 O2 + 2 HC1 CH2C1—CH2C1 + H2O
(42)
Direct chlorination of vinyl chloride generates 1,1,2-trichloroethane [79-00-5] from which vinylidene chloride required for vinylidene polymers is
produced. Hydrochlorination of vinylidene chloride produces 1,1,1-trichloroethane [71 -55-6]> which is a commercially important solvent. Trichloroethylene
and perchloroethylene are manufactured by chlorination, hydrochlorination, or oxychlorination reactions involving ethylene. Aromatic solvents or
pesticides such as monochlorobenzene, dichlorobenzene, and hexachlorobenzene are produced by reaction of chlorine with benzene. Monochlorobenzene
is an intermediate in the manufacture of phenol, insecticide DDT, aniline, and dyes (see Chlorocarbons and Chlorohydrocarbons.)
Materials of Construction
The choice of construction material for handling chlorine depends on equipment design and operating conditions. Dry chlorine, with less than 40 ppm by
weight of water, can be handled safely below 120°C in equipment made from iron, steel, stainless steels, Monel Metal, nickel, copper, brass, bronze, and
lead. Silicone materials, titanium, and high surface area materials such as steel wool should be avoided. Titanium ignites spontaneously in dry chlorine; steel
reacts with Cl2 at an accelerated rate at temperatures greater than 50°C, igniting near 120°C (82). The presence of organic substances or rust increases the
risk of steel ignition. For dry chlorine, schedule 80 pipe is used in sizes up to 15-cm diameter; schedule 40 is satisfactory for large diameter pipe.
Liquid chlorine is generally stored in vessels made from nonalloyed carbon steel or cast steel. Fine grain steel with a limited tensile strength is used to
ensure proper conditions for welding these containers. Erosion of protective layers on steel is prevented by maintaining the flow velocities to less than 2
m/s. Although organic materials, zinc, tin, aluminum, and titanium are not acceptable for liquid chlorine use, copper, silver, lead, and tantalum are
acceptable for some equipment.
Dry chlorine has a great affinity for absorbing moisture, and wet chlorine is extremely corrosive, attacking most common materials except Hastelloy
C, titanium, and tantalum. These metals are protected from attack by the acids formed by chlorine hydrolysis because of surface oxide films on the metal.
Tantalum is the preferred construction material for service with wet and dry chlorine. Wet chlorine gas is handled under pressure using
fiberglass-reinforced plastics. Rubber-lined steel is suitable for wet chlorine gas handling up to 100°C. At low pressures and low temperatures PVC,
chlorinated PVC, and reinforced polyester resins are also used. Polytetrafluoroethylene (PTFE), poly (vinylidene fluoride) (PVDF), and
poly(tetrafluoroethylene-hexafluoropropylene) (FEP) are resistant at high temperatures. Other materials stable to moist chlorine include graphite, glass, and
halogenated plastics.
Gaskets in both dry gas and liquid chlorine systems are made of rubberized compressed asbestos. For wet chlorine gas, rubber or synthetic
elastomers are acceptable. PTFE is resistant to both wet and dry chlorine gas and to liquid chlorine up to 200°C. Tantalum, Hastelloy C, PTFE, PVDF,
Monel, and nickel are recommended for membranes, rupture disks, and bellows.
Storage and Transportation
Surveys of existing national and international regulations for the handling and transportation of chlorine are available (82). Emergency kits designed to
contain leaks during chlorine shipping are available from the Chlorine Institute. Chlorine is liquefied and stored at ambient or low temperature, ensuring
that the pressure in the storage system corresponds to the vapor pressure of liquefied chlorine at the temperature in the tank. Whereas permanent storage
of chlorine is not recommended, moderate amounts (not exceeding 450 t) are stored in tanks as a liquefied gas. Larger storage capacities employ a low
pressure storage system operating at a liquid chlorine temperature of ~-34: C, which requires a cooling or recompression system to liquefy evaporating
chlorine gas that is recycled. A stand-by caustic soda solution absorber absorbs the evaporated chlorine in case of an emergency resulting from failure of
the refrigeration unit. The storage system must be degreased, cleaned, and dried to a dew point of —40° C in the purge gas at the oudet of the system. The
filling ratio should never exceed 95% of the total volume of the vessel. This corresponds for pressure storage tanks to 1.25 kg of liquid chlorine per liter of
vessel capacity at 50°C.
Chlorine is stored and transported as a liquefied gas in cylinders of 45.4-kg or 68-kg capacity that are under pressure and equipped with fusible-plug
relief devices. Quantities in the range of 15 to 90 t are transported in tank cars having special angle valves on the manhole cover on top of the vessel. Tank
barges of the open-hopper type having several cylindrical uninsulated pressure vessels are used for amounts ranging from 600 to 1200 t. Road tankers are
used for capacities of 15 to 20 t.
Chlorine is classified by the U.S. Department of Transportation (DOT) as a nonflammable compressed gas requiring a green label. Chlorine must
be packaged in containers complying with DOT and/or Coast Guard regulations related to construction, loading, and labeling, and state, local, and
insurance regulations. Transportation of about 70% of liquid chlorine is by rail, 20% by pipe lines, 7% by barges, and the remainder in cylinders.
Analytical Methods
Industrial liquid chlorine is routinely analyzed for moisture, chlorine, other gaseous components, NC13, and mercury following established procedures
(10,79). Moisture and residue content in liquid chlorine is determined by evaporation at 20°C followed by gravimetric measurement of the residue. Free
chlorine levels are estimated quantitatively by thiosulfate titration of iodine liberated from addition of excess acidified potassium iodide to the gas mixture.
Safety
No attempt should be made to handle chlorine for any purpose without a thorough understanding of its properties and the hazards involved. This
information is available from the Chlorine Institute and from various handbooks (10,76,79).
Chlorine gas is a respiratory irritant and is readily detectable at concentrations of <1 ppm in air because of its penetrating odor. Chlorine gas, after
several hours of exposure, causes mild irritation of the eyes and of the mucous membrane of the respiratory tract. At high concentrations and in extreme
situations, increased difficulty in breathing can result in death through suffocation. The physiological response to various levels of chlorine gas is given in
Table 19.
Table 19. Physiological Response to Chlorine
Parameter
Parts of chlorine per million parts of air (volume)
Kirk-Othmer Encyclopedia of Chemical Technology (4th Edition)
510
CHLORINE AND SODIUM HYDROXIDE
Voll
least amount required to produce slight symptoms after several hours of exposure 1
least detectable odor 3.5
maximum amount that can be inhaled for 1 h without serious physiological 4
response
least amount required for throat irritation 15.1
least amount required for coughing 30.2
amount causing severe symptoms in 30—60 min 40-60
LD5q
humans, in 30 min 840
rats, in 60 min 290
mice, in 60 min 137
amount expected to affect aquatic life >0.1 ppm
SODIUM HYDROXIDE (CAUSTIC SODA)
Physical Properties
Sodium hydroxide, NaOH, mol wt 39.998, is a britde, white, translucent crystalline solid. Because of its corrosive action on all human body tissue, it is also
known as caustic soda. Physical properties of the pure material are noted in Table 20. Sodium hydroxide is produced and shipped in the anhydrous state in
the form of solid cakes, flakes, or beads, but is used in solution (4). Properties of aqueous sodium hydroxide solutions relevant to industrial operations are
available from manufacturers and in handbooks (79). Table 21 lists the significant uses.
Table 20. Physical Constants of Pure Sodium Hydroxide
Property Value
CAS Registry Number [1310-73-2]
molecular weight 39.998
specific gravity at 20°C 2.130
melting point, °C 318
boiling point, °C at 101.3 kPaa 1388
specific heat, J/g-°Cb at 20°C 1.48
refractive index at 589.4 nm
320°C 1.433
420°C 1.421
latent heat of fusion, J/g ’ 167.4
lattice energy, kJ /mol ’ 737.2
entropy, J/(mol-K)b at 25°C and 101.3 kPaa 64.45е
heat of information A / /, kJ /mol
CC form 422.46
P form 426.60
heat of transition from a to P form, J/g 103.3
transition temperature, °C 299.6
free energy of formation AG/ kJ /mol at 25°C and 101.3 kPa -379.5е
To convert kPa to mm Hg, multiply by 7.5.
To convert J to cal, divide by 4.184.
C To convert J/g to Btu/lb, multiply by 0.4302.
To convert kJ to kcal, divide by 4.184.
Values from ref. 83.
Table 21. Sodium Hydroxide Derivatives
Kirk-Othmer Encyclopedia of Chemical Technology (4th Edition)
511
CHLORINE AND SODIUM HYDROXIDE
Voll
chemical!
refining of kraft (sulfate)
process pulp to higher
a-cellulose content
(chemical cellulose) —
petroleum refining
sodium phosphate tribasic
sodium chlorite-----------
sodium chloroacetate
sodium cyanide
sodium fori
rayon via Cuprammonium
process
sodium cellulose------
oxidizing agent for improvement of potable water
bleach for textiles, paper pulp, edible oils, straw products
oxidizing agent for vat dyes
2,4-dichlorophenoxyacetic acid (2,3-D) —
2,4,5-trichlorophenoxyacetic acid (2,4,5-T)
dyes
vitamins
defoliants
sodium carboxymethylcellulose
a d i p о n t ri I e--------------------------------------------------
ethylenediaminetetraacetic acid (EDTA) -------------------------------
case hardening and heat treating agent for steel
sodium thiocyanate----------------------------------------------------
extraction agent for gold and silver production from ores
electroplating agent for copper, zinc, brass, and cadmium
ore flotation (sulfide ore depressant)
dyes
pharmaceuticals
plastics
hydrogen cyanide (for specialty chemicals)
cellulose xanthate -----------------►
other cellulose derivatives
viscose rayon
wood pulp (sulfate process)
Sodium hydroxide
brine electrolysis
lime-sodium carbonate
reaction (not
presently used)
manufacture of detergents:
sodium salt, linear
alkylate sulfonate ----------► surface-active agent
sodium lauryl sulfate
[wetting agent for textiles, surface-active agent,
[ food additive
sodium salt, benzenesulfonic acid -----------------------------►
sodium salt, toluenesulfonic acid I
sodium salt, xylenesulfonic acid J
manufacture of soaps:
sodium salt, stearic acid (sodium stearate) ---------------------
sodium salt, oleic acid (sodium oleate) -----------------------»
Г surface-active agent
sodium naphthenate -------------I emulsifier, disinfectant,
[ and driers
sodium abietate -----------------------------------------------►
glycerin (by-product)
phenol
dyes
synthetic detergents
catalysts
soaps and greases
pharmaceuticals
waterproofing
gelling agent
plastics stabilizer
aluminum stearate
calcium and zinc stearate
ore flotation, waterproofing textiles
emulsifier and soaps
pharmaceuticals
soap
paper coating
textile processing: crepeing agent for textiles, mercerizing and scouring cotton, vat dyeing
refining vegetable oils
rubber reclamation agent
metal processing: ore flotation, metal degreasing, and aluminum ore (bauxite)
water and acid waste stream treatment
pH control
wood pulp (soda process)
wallboard made from agricultural residues
groundwood pulp bleaching, paint remover, disinfectant, washing naphthalene
alkaline bottle washing formulations
rubber latex stabalizer
stabilization of sodium hypochlorite
Table 21. {Continued)
Kirk-Othmer Encyclopedia of Chemical Technology (4th Edition)
512
CHLORINE AND SODIUM HYDROXIDE
Voll
—► herbicide
—► herbicide
Films
nylon-6,6 —*• I fibers
—- hexamethylenediamine Lresins
- chelating agent nylon-6,10—► monofilaments
dyeing
—► pharmaceuticals
artificial mustard oil
rubber treatment
black nickel plating
polyacrylate solvent
—- reducing agent
pharmaceuticals
formic acid
oxalic acid
mordant
nickel formate
leather tanning agent
wallpaper printing
plating
catalyst
I pesticides
sodium propionete---------------J mold preventative
|_ for food
sodium phenolate-------------------------------------------------►
sodium metasilicate
sodium orthosilicate
sodium picramate------------------- dye intermediate
sodium stannate--------------------------------------------------►
sulfur dyes
insecticides
sodium polysulfides---------------- synthetic rubber
sodium sulfite (from sodium petroleum additives
benzene sulfonate) electroplating
sodium arsenite
sodium bromite------------------► textile desizer
sodium
dimethyldithiocarbamate --------- zinc dimethyldithio-
carbamate --------------------►
antiseptic
salicylic acid
tin, metal (electrolytic process)
blueprint papers
dye mordant
ceramics and glass
tin electroplating
textile fireproofing
stabilizer for hydrogen
peroxide
alkaline electroplating of tin
immersion tinning of aluminum
alloys
fungicide
activator for rubber vulcanization
herbicide
sodium dinitro-o-cresylate ------►
sodium diuranate
sodium tungstate
control agent for
fruit setting
fungicide
sodium fluoroacetate -----------► rodenticide
sodium formaldehyde
sulfoxylate------------------------------------------------>
monosodium glutamate----------• flavor enhancer
sodium molybdate
cupric hydroxide
manganous hydroxide
nickel hydroxide
beryllium hydroxide
barium hydroxide
cadmium hydroxide
cobalt hydroxide
lead hydroxide
amyl alcohol
ethylene oxide
hydrazine (Raschig process)
1-naphthol
2-naphthol
phenol (chlorobenzene process)
resorcinol
textile stripping
bleaching agent for molasses and soap
vanillin (from waste sulfite r,.
flavors
pulping liquor) --------------------- I
perfumes
vinyl chloride (from ethylene L
dichloride)
sodium salt, oil-soluble
petroleum sulfonate -------------► lubricating oil
additives
rosin size------------------------► paper
cryolite, synthetic (sodium
aluminum fluoride)
Sodium hydroxide deliquesces on exposure to air, resolidifying because of sodium carbonate formation upon absorbing carbon dioxide. It is very
soluble in water and forms hydrates containing 1, 2, 3, 5, and 7 molecule of H2O, depending on the concentration. Heat is generated during the dilution of
concentrated caustic solution, or when solid NaOH is dissolved in water. Figures 36 and 37 illustrate solution freezing point and enthalpy data. Because the
heat can be excessive to the extent that the temperature of a solution can increase above the boiling point, caution should be exercised during the dilution
of caustic from concentrations of >25% by providing proper cooling (84,85).
Fig. 36. Freezing points of caustic soda solutions (82): A, ice; B, ice + NaOH-7H2O; C, NaOH-7H2O; D, NaOH-7H2O + NaOH-5H2O; E, NaOH-5H2O; F,
NaOH-5H2O + NaOH4H2O; G, NaOH-4H2O; H, NaOH-4H2O + NaOH-3y2H2O; I, NaOH-3y2H2O; J, NaOH-3y2H2O + NaOH-2H2O; K, NaOH-2H2O;
L, NaOH-2H2O + NaOH-H2O; M, NaOH-H2O; N, NaOH-H2O + NaOH; and P, NaOH.
Courtesy of the Chlorine Institute, Inc.
Kirk-Othmer Encyclopedia of Chemical Technology (4th Edition)
513
CHLORINE AND SODIUM HYDROXIDE
Voll
Fig. 37. Enthalpy vs concentration of caustic soda solutions.
Chemical Properties
Aqueous solutions of caustic soda are highly alkaline. Hence caustic soda is primarily used in neutralization reactions to form sodium salts (79). Sodium
hydroxide reacts with amphotoric metals (Al, Zn, Sn) and their oxides to form complex anions such as A1O’2, ZnO2’2, SnO2’3, and H2 (or H2O with
oxides). Reaction of A12O3 with NaOH is the primary step during the extraction of alumina from bauxite (see Aluminum compounds):
Al(OH) 3 + NaOH NaA102 + 2 H20
(43)
Caustic soda reacts with weak-acid gases such as H2S, SO2, and CO2.
H2S + 2 NaOH Na2S + 2 H20
(44)
S02 + 2 NaOH Na2SO3 + H20
(45)
C02 + 2 NaOH Na2CO3 + H20
(46)
These reactions are used industrially for scrubbing operations and for selective removal of H2S from natural gas containing CO2.
Metallic ions are precipitated as their hydroxides from aqueous caustic solutions. The reactions of importance in chlor-alkali operations are removal
of magnesium as Mg(OH)2 during primary purification and of other impurities for pollution control. Organic acids react with NaOH to form soluble salts.
Saponification of esters to form the organic acid salt and an alcohol and internal coupling reactions involve NaOH, as exemplified by reaction with
triglycerides to form soap and glycerol,
C3H5 (COOR) 3 + 3 NaOH C3H5 (OH) 3 + 3 NaCOOR
(47)
and with propylene chlorohydrin to form propylene oxide,
C1C3H6OH + NaOH C3H6O + NaCl + H20
(48)
Reactions of NaOH with natural products are complex. They include solubilization of cotton in rubber reclaiming, starch dextrination, cotton
scouring, refining of vegetable oils, and removal of lignin and hemicellulose in the Kraft pulping process. The primary step during the reaction of cellulose,
caustic soda, and monochloroacetic acid to form the sodium salt of carboxymethylcellulose is similar to that used in mercerizing cotton and in the
preparation of rayon from cellulose xanthate (see Cellulose ethers; Fibers, regenerated cellulosics).
Other Processes for NaOH Production
The only caustic soda production process besides electrolysis is the soda—lime process involving the reaction of lime with soda ash:
Ca(OH) 2 + Na2CO3 CaCO3 + 2 NaOH
(49)
The lime—soda process is practiced mainly in isolated areas in some process operations, in the Kraft recovery process, and in the production of alumina. It
is not as efficient a route as electrolytic production.
In the Kraft recovery process the green liquor, which is an aqueous solution of sodium carbonate, is heated with lime to produce white liquor or
caustic soda, which is then returned to the pulp digestion operations. In the production of alumina, lime and soda are fed to bauxite digesters. The CaCO3
produced during the course of the reaction is rebumed to lime and is recycled. The main difficulties associated with these processes include the extensive
mechanical handling through the use of causticizers, setders, and repulpers in order to produce caustic that is low in carbonate and the high fuel
consumption needed to reconvert CaCO3 to lime.
Special Grades of Caustic Soda
Three forms of caustic soda are produced to meet customer needs: purified diaphragm caustic (50% Rayon grade), 73% caustic, and anhydrous caustic.
Regular 50% caustic from the diaphragm cell process is suitable for most appEcations and accounts for about 85% of the NaOH consumed in the United
States. However, it cannot be used in operations such as the manufacture of rayon, the synthesis of alkyl aryl sulfonates, or the production of anhydrous
caustic because of the presence of salt, sodium chlorate, and heavy metals. Membrane and mercury cell caustic, on the other hand, is of superior quality and
Kirk-Othmer Encyclopedia of Chemical Technology (4th Edition)
514
CHLORINE AND SODIUM HYDROXIDE
Voll
meets the high purity market requirements.
50% Caustic Soda. Diaphragm cell caustic is commercially purified by the DH process or the ammonia extraction method offered by PPG
and OxyTech (see Fig. 38), essentially involving Equid—Equid extraction to reduce the salt and sodium chlorate content (86). Thus 50% caustic comes in
contact with ammonia in a countercurrent fashion at 60°C and up to 2500 kPa (25 atm) pressure, the Equid NH3 absorbing salt, chlorate, carbonate, water,
and some caustic. The overflow from the reactor is stripped of NH3, which is then concentrated and returned to the extraction process. The product,
about 62% NaOH and devoid of impurities, is stripped free of NH3, which is concentrated and recirculated. MetaUic impurities can be reduced to low
concentrations by electrolysis employing porous cathodes. The caustic is then freed of Fe, Ni, Pb, and Cu ions, which are deposited on the cathode.
Fig. 38. Caustic purification system: a, 50% caustic feed tank; b, 50% caustic feed pumps; c, caustic feed preheater; d, amonia feed pumps; e, ammonia feed
preheater; f, extractor; g, trim heater; h, ammonia subcooler; i, stripper condenser; j, anhydrous ammonia storage tank; k, primary flash tank; 1, evaporator
reboiler; m, evaporator; n, caustic product transfer pumps; o, purified caustic product cooler; p, purified caustic storage tank; q, ammonia stripper; r,
purified caustic transfer pumps; t, overheads condenser; u, evaporator; v, evaporator vacuum pump; w, aqueous storage ammonia tank; x, ammonia
scrubber; y, scrubber condenser; z, ammonia recirculating pump; aa, ammonia recycle pump. CW stands for chilled water.
Purification can also be achieved by cooling the caustic by direct contact with Freon. Pure NaOH-3 /2H2O crystals are formed and these crystals are
centrifuged and separated from the salt containing the mother Equor. However, the purity of this material is not equivalent to that of the mercury grade,
although it can be used by the rayon industry. This technology, although proven technically, is not practiced commercially in the United States. See
reference 87 for a description of the freeze concentration of caustic. Asahi Chemical has reported that pure NaOH can also be made by forming a
NaOH—alcohol clathrate compound and distilling it at 100—120°C under reduced pressure (88). This process has been studied only on a laboratory scale
and is not yet commercialized.
73% Caustic Soda. About 5% of the caustic soda produced is concentrated to 73% solutions for special usage and for producing anhydrous
material. The deciding factor in the production of 73% caustic is the comparative economics of concentrating the 50% solution vs shipping the extra water
(the 73% material is made from 50% regular grade caustic). Freezing-point curves of NaOH solutions (see Fig. 36) indicate a relatively flat region from 65
to 75% caustic, where caustic soda freezes at ~-62: C, permitting 50% NaOH to be concentrated to 73%. Concentration is carried out in a single-effect
forced or natural recirculation mode in steam-heated nickel evaporators. Operation of the evaporators at low temperatures also minimizes nickel corrosion
problems and avoids Eon contamination in the product. The 73% product is stored in insulated, lined tanks using steam or electrical heating coils at >62° C
to prevent freezing.
Anhydrous Caustic. Anhydrous caustic is produced from either 50 or 73% caustic solutions in tubular flash-type nickel or Inconel
evaporators at over 400°C. Heat is suppEed by direct firing by Dowtherm heat-transfer fluid or by a eutectic mixture of molten potassium nitrate, sodium
nitrite, and sodium nitrate. Any sodium chlorate present in 50% caustic feed decomposes at these temperatures and corrodes nickel. Therefore it is
removed or destroyed when diaphragm-grade caustic is used by adding reducing agents such as sugar. After the water is removed, the molten caustic is
pumped either to a rotary drum flaker or to a drum-loading station and then poured into thin steel drums for shipment. Flaked soEd caustic, produced in
sizes ranging from ^2 to 20-mm diameters is also shipped in drums.
Materials of Construction
Steel is an acceptable material of construction for handling solutions of up to 50% NaOH below 40°C. Above 40°C the steel corrosion rate increases
rapidly and Eon is picked up in the solution. Materials for handling 50% NaOH are lined steel for tank cars and lined or unlined steel for tanks and piping.
Nickel is the ideal material for handling caustic at all concentrations and temperatures, including molten anhydrous caustic up to 480°C. Nickel
and/or nickel alloys are used for bodies, piping, and heat exchangers of the evaporators and for operations where high solution velocities are encountered,
such as centrifugal pumps. Plastics or plastic-lined steel are now commercially available for caustic solutions: fiberglass-reinforced plastic tanks of vinyl ester
resins are suitable but prone to mechanical damage; polypropylene is superior from both a cost and performance standpoint. At moderately high
temperatures fluorocarbon plastics have been used successfully as pipe linings. Aluminum, zinc, brass, bronze, and copper are readily attacked by caustic
and hence are unsuitable for storing caustic solutions.
Storage and Transportation
Caustic soda is classified as a corrosive material by the DOT and DOT regulations and specifications must be foEowed for handling, labeling, and
transportation in containers. Warning labels are recommended for containers of caustic soda solutions and anhydrous caustic soda by the MCA (79). The
DOT identification number is UN1824 for 50 or 73% Equid, and UN1823 for anhydrous caustic.
Liquid caustic is shipped in tank trucks, tank cars, and barges. Typical tank trucks, constructed of stainless steel without insulation or heating coEs,
carry 15,000 L or 11.3 t of caustic soda. Tank cars, usuaEy insulated and equipped with heating coEs, are made of nickel-clad steel or lined steel. Barges
carrying 50% caustic have capacities ranging from 1100 to 2200 t; 25% of the caustic produced in the United States is shipped by barges. Anhydrous caustic
marketed as beads and flakes is transported in bulk hopper cars or in steel or fiber drums of 204-kg capacity. They are also packaged in 22.7-kg multiwaEed,
polyethylene-lined paper bags.
Analytical Methods
Caustic soda solutions are normaEy tested for general alkalinity and percentages of NaCl, Na2SO4, and NaClO3 as weE as for Fe and Ni levels. The general
methods are outlined in Table 22. DetaEed analytical methodologies are avaEable from the major caustic soda suppEers.
Kirk-Othmer Encyclopedia of Chemical Technology (4th Edition)
515
CHLORINE AND SODIUM HYDROXIDE
Voll
Table 22. Analytical Methods for Caustic Soda
Parameter Method
total alkalinity and NaOH Na2CO3 NaCl Na2SO4 NaClO3 titration with standard acid gas-volumetric or gravimetric after decomposing carbonate to CO2 titration with AgNO3 using Volhard method gravimetric by removing sulfate as BaSO4 volumetric by reaction of the chlorate with FeSO4 in acid solution and titrating the excess FeSO4 with potassium dichromate using diphenylamine sulfonic acid indicator
Fe, Ni spectrophotometric or atomic absorption spectroscopy
Safety
Caustic soda in. liquid or solid form has a marked corrosive action on all body tissue, so that even dilute solutions have a deleterious effect on tissue after
prolonged contact. Inhalation of the dust or mist can cause damage to the upper respiratory tract; ingestion causes damage to the mucous membrane or
the exposed tissue. It is therefore important that all the properties of caustic and the safety precautions be reviewed before handling. During handling, all
persons should wear proper protective clothing, safety goggles (sometimes a full face shield), rubber gloves, boots, and a caustic resistant apron or suit.
Safe handling practices are essential at all stages of production, from the laboratory to the manufacturing operations. The safety committee should inspect
and advise on processing equipment and be responsible for providing personal protection, eye wash fountains, safety showers, etc.
If caustic soda should come in contact with the eyes, they should be flooded immediately and for at least 15 min, keeping the eyelids apart. If caustic
comes in contact with skin or clothing, washing with water must be started immediately to prevent a chemical bum. The reader is advised to consult all the
safety and first-aid techniques before handling (79).
Disposal of waste or spilled caustic soda must meet all federal, state, and local regulations and be carried out by properly trained personnel.
Accidental spills of dry caustic are shoveled and flushed with water; caustic soda solutions must be diluted and neutralized with acid before discharging into
sewers. Dilute acetic acid may be used to neutralize final traces of caustic.
United States Chlorine Market and Future Growth
Chlorine Consumption. In the latter part of the 1980s U.S. chlorine consumption grew an average of 3.2% annually from 9.7 x 10⁶ t in 1986
(6) to 11 x 106 t in 1990. Increased exports of chlorine derivatives, aided by the weaker dollar, have added to chlorine's recent recovery. Because of the
varied use pattern, future growth for U.S. chlorine consumption is best determined by compiling a composite based on the forecasted growth for each of
its major derivatives. Using this method, average annual growth rates of between 0.9 and 1.3% have been forecasted from 1987 to 1992 (Table 23); other
estimates of 0—1% per year are also possible (89). However, because of the unexpected high demand, by 1989 chlorine consumption already equaled the
1992 forecasted high of 11 x 106 t. The high growth rates of the late 1980s are unlikely to continue. Growth in 1990 was flat at 11 x 106 t. A mild decline
is expected in 1991, and in 1992 chlorine consumption is expected to recover back to 11 x 106 t. Table 23 provides a good indication of the general trends
and the relative importance of individual chlorine derivatives.
Table 23. U.S. Chlorine Consumption*
Usage Quantity, 103 t/yr Average annual growth rate, 1987-1992,%
Actual Forecast, 1992
1982 1987
organic chemicals (plus by-product HC1)
C2 derivatives 696 818 836 0.4
C2 derivatives0 2,991 3,696 4,201-4,242 2.6-2.8
fluorocarbons 25 64 54 d
C3 derivatives 810 1,154 1,261-1,288 1.8-2.2
C4 derivatives 178 116 109-118 (1.2)-0.3
other hydrocarbon derivatives5 226 250 243-254 (0.6)-0.3
chlorinated organics derived from inorganic 557 721 827 2.8
compounds
other chlorinated organics 348 272 259 -1
Total organic 5,831 7,091 7,790-7,878 1.9-2.1
inorganic chemicals
titanium tetrachloride 357 409 462-471 2.5-3
hydrogen chloride 210 222 209-227 (1)-1
bromine 86 67 71-74 1-2
phosphorus chlorides 61 73 78-83 1.5-2.5
aluminum and iron chlorides 35 32 -2
Total inorganic 714 806 852-887 1.3-2.2
pulp and paper production 1,240 1,608 1,346-1,418 (2.5)—(3.5)
water treatment 400 463 463
hypochlorites and other uses1 305 318 318-349 0-2
Total usage 8,490 10,28^ 10,769-10,995 0.9-1.3
aRef. 6.
Courtesy of SRI International.
k Chlorinated methanes, silicone.
Ethylene dichloride, vinyl chloride monomer, trichloroethylene, perchloroethylene.
Category includes only direct chlorine consumption; the majority of consumption is included in C.^ and C2 derivatives.
Epichlorohydrin, propylene oxide.
Kirk-Othmer Encyclopedia of Chemical Technology (4th Edition)
516
CHLORINE AND SODIUM HYDROXIDE
Voll
Chloroprene.
Monochlorobenzene, dichlorobenzene, linear alkylbenzenes, chlorinated paraffins.
Phosgene (for toluene diisocyanate, diphenylmethane diisocyanate, and polycarbonate resin manufacture), chloroisocyanuric acid, cyanuric chloride.
Titanium dioxide, titanium metal.
' Sodium hypochlorite, calcium hypochlorite, chlorinated isocyanurates.
к
Estimated consumption exceeds apparent consumption by 38 x 103 t.
Major Chlorine Markets. Forecasted changes in chlorine consumption (Table 23) are addressed below in descending order of the
importance of the major derivative, based on 1987 demand.
CT, In 1987, C2 derivatives accounted for approximately 36% of total U.S. chlorine consumption, and composed chlorine's largest
single use category. Chlorine is used primarily to manufacture ethylene dichloride (EDC), the precursor to vinyl chloride monomer (VCM), used in PVC
production [see Vinyl chloride monomer and polymers]. Approximately 24% of all 1987 U.S. chlorine production was consumed to satisfy growing PVC
demand, and through 1992, VCM demand is expected to grow at 4.3% annually (6), due to increasing demand for PVC in the construction, packaging, and
other industries. Nearly 85% of all EDC manufactured in the United States is used to produce VCM, and another 11% is exported, mosdy for foreign
VCM production. VCM exports are expected to grow 3.4% annually through 1992, while annual growth for EDC exports are expected to exceed 10% (6).
Chlorinated solvents made from EDC and VCM, such as perchloroethylene (PCE), 1,1,1-trichloroethane, and trichloroethylene (TCE), compose the
balance of the C2 chlorine derivatives. Demand for these products is expected to decline through 1992, mainly because of decreased demand for TCE in
vapor degreasing and for PCE in dry cleaning (see Cwdrocarbons and cwdrohydrocarbons, dicwdroeihylene; trichloroethylene; chldroethanes).
Pulp and Paper. In 1987 the pulp and paper industry accounted for 15.6% of U.S. chlorine consumption. However, concerns over chlorine's
potential in forming toxic chlorinated organics are expected to have a negative effect on growth in this industry over the next several years. Growth
forecasts for chlorine demand in pulp and paper are —2.5 to —3.5% through 1992. Recent substitutions of oxygen, hydrogen peroxide, and particularly
chlorine dioxide for chlorine in pulp bleaching indicate that declines in chlorine consumption for this use may be even greater than forecasted (see
Chlorocarbons and chlorohtydrocarbons; Toxicology).
Cj Derivatives. The two major C3 derivatives, propylene oxide (qv) and epichlorohydrin, composed 11% of 1987 chlorine consumption and
are expected to grow at between 1.8 and 2.2% through 1992. Propylene oxide is manufactured by two companies, each using a different technology and
different raw materials. About 45% is manufactured using the chlorohydrin route by a producer self-sufficient in chlorine (see Chlorohydrins). Average
annual growth of propylene oxide at between 1.5 and 2% is forecasted through 1992, based mosdy on growing demand for polyether polyol, a propylene
oxide derivative used in urethane foam manufacture (6). Chlorine consumption for epichlorohydrin [106-89-8] is expected to grow between 2.0 and 2.5%
annually through 1992. Growth will be driven primarily by increased demand for epoxy resins (qv).
Phosgene. Phosgene [75-44-5] accounted for 5.6% of 1987 chlorine consumption, which is expected to grow 2.8% annually through 1992.
Phosgene is used in toluene diisocyanate (1DI), diphenylmethane diisocyanate (MDI), and polycarbonate resin manufacture. The majority of 1DI is used
to manufacture flexible urethane foams for furniture carpet underlay and bedding; MDI is used predominantly in polymeric applications such as laminate
board and spray foam. Polycarbonate resin goes into glazing for sheeting polycarbonate composites, and alloys which are used to replace metal parts for
the electronic and automobile industries.
Cy Derivatives. The chlorinated methanes, chloroform, methylene chloride, and carbon tetrachloride, consumed approximately 0.8 million tons
of chlorine in 1987 and aggregate growth rates from this segment of the industry are expected to remain relatively flat through 1992. Because of its
contribution to ozone depletion, carbon tetrachloride use in chlorofluorocarbon manufacture will be phased out in compliance with the recent Montreal
Accord. In addition, environmental pressures are expected to continue to impact the use of methylene chloride in aerosol and paint remover applications.
Some of the decreases in C. derivatives should be offset by positive growth for chloroform in HCFC-22 manufacture, which has not been implicated in
ozone depletion (see CHLOROCARBONS AND CHLOROHYDROCARBONS, METHYLCHLORIDE; ETHYLENE CHLORIDE; CHLOROFORM; carbon tetrachloride).
Water Treatment. Chlorine is an excellent bacteriostat, unsurpassed for use in residual water treatment and growth is expected to remain flat
through 1992. Attempts by municipal and industrial water treatment facilities to improve economics by increasing chemical efficiency and concerns over
chlorine's involvement in the formation of undesirable organic compounds are the reasons for zero growth.
Titanium Tetrachloride. The major use for titanium tetrachloride 7550-15-0] is in titanium dioxide production, and titanium dioxide
[13463-67-7] is enjoying strong growth for use as a filler in pulp and paper manufacture and as a pigment in paint and plastic manufacture. Annual growth
for this product is forecasted at between 2.5 and 3.0% through 1992.
Chlorine—Hydrochloric Acid Balance. More than 90% of hydrochloric acid is produced as a by-product during chemical manufacture.
The remainder is produced intentionally either by burning chlorine and hydrogen or by reaction of salt and sulfuric acid. EDC manufacture by
oxychlorination constitutes the single largest use for by-product HC1, which is also used in chemical manufacture, oil well acidizing, and steel pickling.
Intentionally generated HC1 is used primarily in food applications and HC1 is also used to acidify brine in chlor—alkali production (see Hydrogen chloride).
Because HC1 is produced as a by-product, supply and demand are out of balance: merchant supply is presendy almost double merchant demand.
Furthermore, this imbalance is expected to increase over the next several years because of the restrictions imposed on CFG production. Although proposed
CFG replacements are expected to require chlorinated precursors for their manufacture, only minor amounts of chlorine will be present in the final product,
and the balance will exit the reaction as by-product HC1 that will require disposal in an already saturated market. Environmental pressures related to HC1
disposal are adding to concerns over the increasing supply. Resistance to HC1 deep welling is growing and regulation is increasing. Thus HC1 may be forced
to find new applications in the chlorine markets. Although the chlor—alkali industry has reacted to environmental concerns by neutralizing many HC1 waste
streams before disposal, finding appropriate uses for by-product HC1 without impacting chlorine production is a challenge facing the industry in the future.
United States Caustic Soda Market and Future Growth
Increases in U.S. demand for caustic soda have been unpredictably high in the last few years. Between 1987 and 1989, the annual increase in demand was
about 3% (6). However, the caustic soda market is mature and new areas of significant growth have not surfaced in recent years. The unexpected recent
demand is generally related to two factors: the pick-up in the U.S. economy after the slump of 1986 and pulp mills operating at full capacity, leading to less
efficient caustic use.
Pulp and paper manufacture accounts for 24% of the total U.S. caustic soda demand. To improve caustic soda efficiency, pulp mills use recovery
boilers to reclaim caustic soda from spent pulping liquor for later reuse, but, because recovery boilers are very expensive, few mills have excess boiler
capacity. Furthermore, mills having excess boiler capacity buy black liquor from mills that are boiler-limited to reclaim caustic value. In 1987, and especially
in 1988, extremely high operating rates in the pulp and paper industry caused maximum loads on recovery boilers, resulting in increased boiler outages and
decreased caustic soda recovery. To maintain the maximum production levels needed to meet the high demand for pulp and paper products, bottlenecks at
recovery boilers were avoided by placing spent pulping liquor in holding ponds for later reclamation, and make-up caustic soda was purchased externally
from chlor—alkali producers. This had the effect of increasing caustic soda demand beyond the relative increase in demand for pulp and paper products and
this decreased efficiency has made it difficult to forecast caustic soda consumption.
The latest caustic soda forecast (Table 24) shows a maximum 1992 demand of 10.2 million tons, arrived at by increasing 1987 actual demand by
1.5% annually (6). Because of the unexpectedly high caustic soda demand in 1988, however, the forecasted tonnage for 1992 has already been met. For the
reasons outlined above, this strong growth is not expected to continue. In 1989 caustic soda demand grew by 3% over 1988, but between 1989 and 1992 an
average annual growth of 1.5% or less is expected.
Kirk-Othmer Encyclopedia of Chemical Technology (4th Edition)
517
CHLORINE AND SODIUM HYDROXIDE
Voll
Table 24. U.S. Sodium Hydroxide Consumption*
Usage Quantity, 103 t/yr Average annual growth rate, 1987-1992, %
Actual Forecast, 1992
1982 1987
chemical manufacturing inorganic chemicals 1,081 1,363
organic intermediates, polymers, and end products 2,200 2,390
other and unidentified uses 619 993
Total for chemicals 3,900 4,746 5,239 2.0
pulp and paper manufacturing cleaning products 2,070 2,269 2,386 1.0
soap and other detergents 420 486 524
household bleaches, poEshes, and other cleaning goods 110 118 122
misceEaneous surface-active agents 40 44 48
Total cleaning petroleum and natural gas 570 648 694 1.4
oil and gas production 86 41 32-75
oil and gas processing 346 387 435
Total oil and gas cellulosics 432 428 467-510 1.8-3.6
rayon 111 127 133 other
other 62 54 51
Totalfibers 173 181 184 69.4
cotton mercerizing and scouring 109 165 127-146 (2.5)-(5)
i ь other 654-794 1,028 1,025
Total usage 7,908-8,048 9,465 10,122-10,184 1.4-1.5
aRef. 6.
Courtesy of SRI International.
Essentially for balancing consumption with supply. Includes stock changes.
Caustic Soda Markets. Forecasted changes in caustic soda consumption (Table 24) are addressed below in descending order of the
importance of the major industries, based on 1987 demand. Consumption patterns for many derivatives cannot be accurately quantitied and must be
estimated.
Chemical Manufacturing. Chemical manufacturing accounts for over 50% of all U.S. caustic soda demand. It is used primarily for pH
control, neutralization, off-gas scrubbing, and as a catalyst. About 50% of the total demand in this category, or approximately 25% of overall U.S.
consumption, is used in the manufacture of organic intermediates, polymers, and end products. The majority of caustic soda required here is for the
production of propylene oxide, polycarbonate resin, epoxies, synthetic fibers, and surface-active agents (6).
Another 29%, 14% of U.S. consumption, is used to manufacture inorganic chemicals, and the remainder is used in the manufacture of
miscellaneous chemicals (6). Although significant quantities of caustic soda are used by chlor—alkali producers for brine treatment, alumina production
consumes the largest amount of caustic soda in this category. Approximately 0.3 million tons per year of caustic soda is used in alumina production. The
U.S. alumina industry is presendy running at capacity, but because new alumina capacity is not scheduled to come onstream through 1992, caustic demand
for this application will remain relatively flat. Another 166,000 t of caustic soda is used to produce sodium hypochlorite. Zero growth is forecasted in this
category also. About 64,000 t of caustic soda goes into the manufacture of sodium cyanide [143-33-9]\ which is used to mine precious metals. Caustic soda
demand for sodium cyanide is expected to grow 12—13%/yr through 1992. Smaller uses for caustic soda and the respective growth rates are: titanium
dioxide (2.5—3% growth), silicates (0% growth), zeolites (2—3% growth), and phosphates (0% growth).
Pulp and Paper. Pulp and paper manufacture accounts for 24% of the total U.S. caustic soda demand (6). The caustic soda is used to pulp
wood chips, to extract lignin during bleaching, and to neutralize acid waste streams. Despite forecasted growth rates of up to 3%/yr for pulp and paper
products, caustic soda demand in this industry is forecasted to grow only 1%/yr (Table 24), and may be even less. Changes in technologies aimed at
decreasing chlorine use will also serve to decrease caustic soda requirements. In addition, sodium hypochlorite, which requires caustic soda in its
manufacture, is under attack in pulp and paper applications because of potential chloroform formation.
Cleaning Products. Caustic soda is used to produce a wide variety of cleaning products. This segment of the industry comprises 648,000 t or
6.8% of the total U.S. caustic soda consumption and is expected to grow at 1.4% annually through 1992. About 5.1% of the caustic soda consumed goes
into the production of soap and other detergent products; another 1.2% is used to produce household bleaches, polishes, and cleaning goods. Growth
forecasts for these uses are 1.5 and 1.0%/yr, respectively (6).
Petroleum and Natural Gas. Over 90% of the 428,000 t of caustic soda used in the petroleum and natural gas industry is used to process oil
and gas into marketable products, especially by removing acidic contaminants. The remainder is used primarily to decrease corrosion of drilling equipment
and to increase the solubiEty of drilling mud components by maintaining an alkaline pH (6).
Cellulosics. Rayon and other cellulose products such as cellophane and cellulose ethers (qv) consume 1.9% of U.S. caustic soda demand.
Because of competitive products, however, this market has been decreasing since 1965; and forecasted average annual growth through 1992 is less than
0.4% (6) (see Cotton).
Cotton Mercerizing and Scouring. An estimated 1.7% of caustic soda consumption goes into cotton mercerizing and scouring. The
majority is used for mercerizing and demand is expected to decline between 2.5 and 5%/yr (6).
Miscellaneous Consumption. An estimated 11% of caustic soda demand is used in a large number of miscellaneous markets: water
treatment, food processing, flue-gas scrubbing, mining, glass making, metal degreasing, rubber reclamation, textile dyeing, and adhesive preparations.
Composite demand in these markets is expected to remain at zero growth through 1992 (6).
Demand for Caustic Soda Types. Approximately 99% of the sodium hydroxide produced in 1987 was 50% caustic solution (5). Higher
concentrations require additional evaporation and therefore increased prices relative to the sodium oxide values. To obtain maximum value, users have
learned to adapt manufacturing processes to the 50% caustic soda.
Caustic Soda to Chlorine Balance. In 1988, the ratio of U.S. caustic soda to chlorine consumption was 0.96:1 (see Fig. 39). Since 1968 this
ratio has ranged from alow of 0.88:1 (1978 and 1981) to a high of 0.98:1 (1969). No single factor can explain these variations, since caustic soda and
chlorine, with few exceptions, have different markets and are therefore not driven by the same economic forces. This ratio is expected to trend upward
over the next five years, however, since caustic soda consumption in the United States is forecasted to grow somewhat faster than chlorine consumption. It
is expected that this ratio will remain within the range experienced in 1970—1990. Because caustic soda is co-produced with chlorine at a theoretical ratio of
1.1:1, a U.S. consumption ratio below that level results in excess availabflity of caustic soda. This material is typically shipped offshore to fill a significant
export demand, and in 1988, for example, net U.S. exports of caustic soda amounted to 7.1% of production.
Kirk-Othmer Encyclopedia of Chemical Technology (4th Edition)
518
CHLORINE AND SODIUM HYDROXIDE
Voll
Year
Fig. 39. Variation of caustic consumption from 1955 to 1988 (6).
Courtesy of SHI International.
Economic Aspects
The choice of technology, the associated capital, and operating costs for a chlor-alkali plant are strongly dependent on local factors. Especially important
are local energy and transportation costs, as are environmental constraints. The primary difference in operating costs between diaphragm, mercury, and
membrane cell plants results from variations in electricity requirements for the three processes (Table 25) so that local energy and steam costs are most
important.
Table 25. Energy Consumption of Operating Cells, Kilowatt-Hours per Ton of Chlorine
Energy Cell type
Diaphragm Mercury Membrane
electricity for electrolysis 2800-3000 3200-3600 2600-2800
steam requirements 600-800 0 200-300
Total 3,400-3,800 3,200-3,600 2,800-3,100
One ton of steam is assumed to be ~ 400 kW • h.
The cost of constructing a grass-roots membrane or diaphragm plant is about $200,000/t-day of chlorine based on 1980 data in Table 26, which is
doubled based on 1990 estimates. Environmental considerations have discouraged new mercury cell construction. The cost of converting a mercury cell
plant to a membrane cell operation appears to vary between $100,000 to $200,000/t per day of chlorine depending on the process needs, in addition to any
disposal and demolition costs required for the conversion. However, the conversion of a diaphragm circuit to a membrane operation may be less, around
$80,000 to $150,000/t per day, again depending on the process requirements because the available infrastructure can be readily adapted for the conversion.
When converting mercury cell operations to either membrane or diaphragm operations, the cost of cells and the membranes accounts for about 60% of the
total investment. Other costs for the conversion to the diaphragm process are less than conversion to membrane cell operation. See references 8, 90, and
91 for more details related to these capital costs.
Table 26. Plant Capital Costs for 500 Ton per Day Chlorine Production, Millions of Dollars
Parameter Diaphragm cells Membrane cells
cells 17.0 34.0
rectifiers 3.4 3.4
brine purification 5.0 10.0
chlorine collection 6.5 6.5
hydrogen collection 2.0 2.0
caustic evaporation 13.5 3.0
caustic storage 5.6 5.2
miscellaneous 7.0 6.3
utilities and offsites 23.0 22.0
overheads 12.0 11.3
engineering 12.0 11.3
Total 107 115
BIBLIOGRAPHY
"Alkali and Chlorine Industries" in ECT 1st ed., Vol. 1, pp. 358—430, by Z. G. Deutsch, Deutsch and Loonam; "Alkali and Chlorine Industries" in ECT
2nd ed., Vol. 1, pp. 668—758, by Z. G. Deutsch, Consulting Engineer, and С. C. Brumbaugh and F. H. Rockwell, Diamond Alkali Company; "Alkali and
Chlorine Products, Chlorine and Sodium Hydroxide" in ECT 3rd ed., Vol. 1, pp. 799—865, by J. J. Leddy, I. C. Jones, Jr., B. S. Lowry, F. W. Spillers, R. E.
Wing, and C. D. Binger, Dow Chemical U.S.A.; "Chlorine" in ECT 1st ed., Vol. 3, pp. 677—681, by D. G. Nicholson, University of Pittsburgh; "Chlorine"
in ECT 2nd ed., Vol. 5, pp. 1—6, by D. G. Nicholson, East Tennessee State University; "Chlorine" in ECT 2nd ed., Supplement, pp. 167—177, by H. B.
Kirk-Othmer Encyclopedia of Chemical Technology (4th Edition)
519
CHLORINE AND SODIUM HYDROXIDE
Voll
Hass, Chemical Consultant.
1. Chem. Eng. News 37 (June 18, 1990).
2. R. N. Shreve andj. A. Brink, Jr., Chemical Process Industries, 4th ed., McGraw-Hill Book Co., Inc., New York, 1977.
3. Chlorine andlts Derivatives: A World Survey of Supply, Demand, and Trade to 1992, Tecnon Consulting Group, London, 1988.
4. Caustic Soda in the 1990's: A World Survey of Supply, Demand, and Trade, Tecnon Consulting Group, London, 1989.
5. North American Chlor-Alkali Industry Plants and Production Data Book, Pamphlet 10, The Chlorine Institute, Washington, D.C., Jan. 1989.
6. M. Smart, G. Rice, A. Leder, W. Schlegel, and E. Nakamura, "Chlorine/Sodium Hydroxide, CEH Marketing Research Report," Chemical Economics
Handbook, Menlo Park, Calif., 1989, pp. 733.10000-733.1000W; 733.1001D-733.1001G; 733-1001K; 733.1001Q-733.1001Z;
733.1002A-733.10030.
7. В. V. Tilak, S. R. Fitzgerald, and C. L. Hoover,/. Appl. Electrochem. 18, 699 (1988).
8. P. Schmittinger and co-workers, in IJllmann's Encyclopedia of Industrial Chemistry, 5th ed., Vol. A6, 1986, p. 399.
9. I. Rousar, V. Cezner, M. Vender, M. Kroutil, andj. Vachuda, Chem. Prum. 17/42, 466 (1967).
10. Chlorine Handbook, Diamond Shamrock Chemical Co., Irving, Tex. 1984.
11. D. F. W. Hardie, Electrolytic Manufacture of Chemicals from Salt, The Chlorine Institute, Inc., New York, 1975.
12. Brit. Pats. 1,147,442 (May 12, 1965), H. B. Beer (to Chemnor Corp.); 1,195,871 (Feb. 10, 1967), H. B. Beer (to Chemnor AG).
13. V. de Nora andj. W. Kuhn Von Burgsdorff, Chem. Ing. Tech. 47, 125—128 (1975).
14. S. Trasatti, ed., Electrodes of Conductive Metallic Oxides, Parts A and B, Elsevier, Amsterdam, 1980, 1981.
15. D. M. Novak, В. V. Tilak, and В. E. Conway in J. O'M. Bockris, В. E. Conway, and R. E. White, eds., Modem Aspects of Electrochemistry, Vol. 14,
Plenum Press, New York, 1982.
16. J. E. Currey and G. G. Pumplin in J. J. McKetta and W. A. Cunningham, eds., Encyclopedia of Chemical Engineering and Design, Vol. 7, Marcel Dekker,
Inc., New York, 1978, p. 305.
17. U.S. Pat. 4,410,411 (Oct. 18, 1983), R. W. Fenn III, E. J. Pless, R. L. Harris, and K. J. O'Leary (to OxyTech Systems, Inc., Chardon, Ohio).
18. U.S. Pat. 3,674,676 (July 4, 1972), E. J. Fogelman (to OxyTech Systems, Inc., Chardon, Ohio).
19. U.S. Pat. 3,928,166 (Dec. 23, 1975), K. J. O'Leary, С. P. Tomba, and R. W. Fenn III (to OxyTech Systems, Inc., Chardon, Ohio).
20. E. H. Cook and M. P. Grotheer, Energy S avingDevelopments for Diaphragm Cells and Caustic Evaporators, 23rd Chlorine Plant Manager's Seminar, New
Orleans, The Chlorine Institute, Inc., Feb. 6, 1980.
21. U.S. Pats. 4,093,533 (June 6, 1978), 4,142,951 (March 6, 1979), R. N. Beaver and C. W. Becker (to The Dow Chemical Company).
22. U.S. Pat. 4,186,065 (J an. 29, 1980), C. D. Dilmore, E. V. Hoover, and A. B. Kriss (to PPG Industries).
23. L. C. Curlin, T. F. Florkiewicz, and R. C. Matousek, Polyramix (TM), A Depositable Replacementfor Asbestos Diaphragms, Paper presented at London
International Chlorine Symposium, 1988.
24. R. N. Beaver, The Dow Diaphragm Cell, The Dow Chemical Co., Freeport, Tex., 1985.
25. U.S. Pat. 4,497,112 (Feb. 5, 1985), H. D. Dang, R. N. Beaver, F. W. Spillers, and M. J. Hazelrigg, Jr. (to The Dow Chemical Company).
26. De Nora Glanor Diaphragm Cells, De Nora Permalec SpA, Milan, Italy.
27. Diaphragm Cells, OxyTech Systems, Inc., Chardon, Ohio, 1988.
28. U.S. Pat. 3,591,483 (July 6, 1971), R. E. Loftfield and H. W. Laub (to OxyTech Systems Inc., Chardon, Ohio).
29. U.S. Pat. 4,834,859 (May 30, 1989), L. C. Curlin and R. L. Romine (to OxyTech Systems Inc., Chardon, Ohio).
30. Alkaline Chloride Electrolysis by the Diaphragm Process; System Hooker, Uhde GmbH, Dortmund, Germany, 1985.
31. W. G. Grot, Discovey and Development ofNafion Pe fluorinated Membranes, The Castner Medal Lecture, 3rd London International Chlorine Symposium,
June, 1985.
32. J. L. Hurst, ImplementingMembrane Cell Technology Within OxyChem Manufacturing, International Symposium on Chlor—Alkali Industry, Tokyo, Japan,
April, 1988.
33. Pe fluorinated Membranesfor the Chlor—Alkali Industry, E. I. du Pont de Nemours & Co., Inc., Wilmington, Del., 1983.
34. D. L. Peet and J. H. Austin, Nafion Pefluorinated Membranes, Operation in Chlor-Alkali Plants, Chlorine Institute Plant Managers Seminar, Tampa, The
Chlorine Institute, Feb. 1986.
35. Nafion 90209, Product Bulletin, E. I. du Pont de Nemours & Co., Inc., Wilmington, Del., 1988.
36. Nafion NX-961, ProductBulletin, E. I. du Pont de Nemours & Co., Inc., Wilmington, Del., 1984.
37. D. L. Peet, Membrane Durability in Chlor-Alkali Plants, Electrochemical Society Meeting, Honolulu, Hawaii, Oct. 1987; Proceedings of the Symposium on
Electrochemical Engineering in the Chlor-Alkali and Chlorine Industries, PV. #88-2, 1988, pp. 329—336.
38. U.S. Pat. 4,025,405 (1972), R. L. Dotson and K. J. O'Leary (to OxyTech Systems, Inc., Chardon, Ohio).
39. H. Ukihashi, M. Yamabe, and H. Miyake, Prog. Polym. Sci. 12, 229 (1986).
40. Nafion Pefluorinated Membranesfor KOH Production, Nafion ProductBulletin, E. I. du Pont de Nemours & Co., Inc., Wilmington, Del., 1988.
41. Nafion PefluorinatedMembranes, Introduction, E. I. du Pont de Nemours & Co., Inc., Wilmington, Del., 1987.
42. Asahi Chemical Membrane Chlor—Alkali Process, Asahi Chemical Industry Co., Ltd., Tokyo, Japan, 1987.
43. N. M. Pront andj. S. Moorhouse, Modem Chlor-Alkali Technology, Vol. 4, Society of Chemical Industry, Elsevier Applied Sci., London, 1990.
44. Y. Sajima, K. Sato, and H. Ukihashi, Recent Progress of Asahi Glass Membrane Chlor-Alkali Process, AICHE Symp. Ser. 82(248), 108 (1985).
45. T. Yamashita, Y. Sajima, and H. Ukihashi, The Design and Operating Experiences ofA^ec Electrolyzers and Recent Development ofFlemion Membranes,
London International Chlorine Symposium, London, June 1988.
46. A^ec Electrolyzer Supply Record, Asahi Glass Co., Ltd., Tokyo, Japan, 1987.
47. CME Chlorine Engineers Membrane Electrolyzer, Chlorine Engineers Corp. Ltd., Tokyo, Japan, 1989.
48. M. Esayian andj. H. Austin, Membrane TechnologyforExisting Chlor—Alkali Plants, presented at The Chlorine Institute, Feb. 1984.
49. Japan's Chlor-Alkali Producers Save Energy by Retrofitting Diaphragm Cells (Case History), E. I. du Pont de Nemours & Co., Inc., Wilmington, Del.
50. FM-21 SP Series Membrane Electrolyzer, ICI Winnington, Northwich, Cheshire, England, 1989.
51. EurgiMembrane Electrolyzer, Lurgi GmbH, Frankfurt am Main, Germany, 1988.
52. Membrane Chlor-Alkali Process, Oronzio De Nora Technologies, BV Milan, Italy and Houston, Tex., 1988.
53. G. J. Morris and R. D. Wilson, Analysis of Oronfio De Nora Technologies Eero Gap Electrode, Oronzio De Nora Technologies, BV, Milan, Italy and
Houston, Tex., 1989; presented at The Electrochemical Society Meeting, Los Angeles, Calif., May 1989.
54. MGC Monopolar Membrane Electrolyzer, OxyTech Systems, Inc., Chardon, Ohio, 1988.
55. Alkaline Chloride Electrolysis by the Membrane Process, Uhde GmbH, Dortmund, Germany, 1989.
56. В. V. Tilak, A. C. R. Murthy, and В. E. Conway, Proc. Indian Acad. Sci. (Chem. Sci.) 97, 359 (1986).
57. D. L. Caldwell in J. O'M. Bockris, В. E. Conway, E. A. Yeager, and R. E. White, eds., Comprehensive Treatise of Electrochemistry, Vol. 2, Plenum Press,
New York, 1981, Chapt. 2.
58. F. Hine, В. V. Tilak, and K. Viswanathan in R. E. White, J. O'M. Bockris, and В. E. Conway, eds., Modem Aspects of Electrochemistry, Vol. 18, Plenum
Press, New York, 1986, Chapt. 5.
59. F. Hine, M. Yasuda, and M. Watanabe, Denki Kagaku 47, 401 (1979).
60. U.S. Pat. 4,024,044 (May 17, 1977), J. R. Brannan and I. Malkin (to OxyTech Systems, Inc., Chardon, Ohio).
61. Jpn. Pat* EP-A 31,948 (Oct. 15, 1986), M. Yoshida and H. Shiroki (to Ashahi Kasei Kogyo).
62. Eur. Pat. Appl. 129,734 (Jan. 2, 1985), N. R. Beaver, L. E. Alexander, and С. E. Byrd (to the Dow Chemical Co.); Eur. Pat. Appl. 129,374 (Dec.
Kirk-Othmer Encyclopedia of Chemical Technology (4th Edition)
520
CHLORINE AND SODIUM HYDROXIDE
Voll
27, 1984), J. F. Calms, D. A. Fenton, and P. A. Izard (to Imperial Chemical Industry PLC).
63. L. J. Gestaut, T. M. Clere, С. E. Graham, and W. R. Bennett, Abstract #393; L. J. Gestaut, T. M. Clere, A. J. Niksa, and С. E. Grahm, Abstract
#124., Electrochem. Soc. Meeting, Washington, D.C., Oct. 1983.
64. J. T. Keating and K. J. Behling, Brine, Impurities, and Membrane Chlor-Alkali Cell Performance, presented at the London International Chlorine
Symposium, 1988.
65. Chlorine Recovey System, OxyTech Systems, Inc., Chardon, Ohio, 1988.
66. T. A. Liederbach, Chem. Eng. Prog. 70, 64 (1974).
67. U.S. Pat. 4,585,579 (April 29, 1986), T. V. Bommaraju, W. V. Hauck, and V. J. Lloyd (to OxyTech Systems, Inc., Chardon, Ohio).
68. E. J. Rudd and R. F. Savinell, J. Electrochem. Soc. 136, 449c (1989).
69. K. Kerger, Chem. Eng. Tech. 43, 167 (1971).
70. Uhde: Chlor and Wasserstoff aus Salzsauredurch Elektrolyse, 1982.
71. C. W. Arnold and K. A. Kolbe, Chem. Eng. Prog. 48, 167 (1971).
72. The M. W. Kellogg Co., Elydrogen Chloride to Chlorine, The Eel-ChlorProcess, 20th Chlorine Plant Managers Seminar, New Orleans, La., Feb. 9, 1977.
73. The M. W. Kellogg Co., Hydrocarbon Process. 60(11), 143 (1981).
74. Neth. Appl. 6,407,015 (Dec. 22,1964) (to Dyamet-Nobel AG). Ger. Pat. DE 1245922-B (1967).
75. Fr. Pat. FR 1294 706 (June 1, 1962) P. Bedague, P. Baumgartner, and J. C. Balaceanu.
76. A Survey of Potential Chlorine Production Processes, Contract #31-109-38-2411 by Versar Inc., ANL/OEPM-79-1, Argonne National Laboratory,
Argonne, Hl., April, 1979.
77. A. S. Ross and C. Mass, Can. J. Rtx Sect. В 18, 55 (1940).
78. Handbooks published by Caustic Soda Suppliers, The Chlorine Institute, Washington, D.C., and The Manufacturing Chemists Assn., 1989.
79. J. J. Martin and D. M. Longpre, J. Chem. Eng. Data 29, 466 (1984).
80. R. Kapoor and J. J. Martin, Thermodynamic Properties of Chlorine, University of Michigan, 1957.
81. Gloria M. Lawler and co-workers, Chemical Origins and Markets, Plow Charts, and Tables, 5th ed., Chemical Information Services, Menlo Park, Calif.,
1977.
82. Chlorine Manual, The Chlorine Institute, Washington, D.C., 1986.
83. R. C. Weast, ed., CRC Handbook of Chemistry and Physics, 67th ed., CRC Press, Inc., Boca Raton, Fla., 1986—1987.
84. T. P. Hou, Ind. Eng. Chem. 46, 2401 (1954).
85. H. R. Wilson and W. L. McAbe, Ind. Eng. Chem. 34, 565 (1942).
86. Caustic Purification System, OxyTech Systems, Inc., Chardon, Ohio, 1988.
87. J. Douglas, EPRIJ. 21 (Jan./Feb 1989).
88. Jpn. Pats. J 62132729-A (June 16,1987), J 62143820-A (June 22,1987), J 62138322-A (1987), (to Asahi Chemical Industry KK).
89. С. C. Lewis, CPI Purchasing, 32 (July 1989).
90. У. C. Chen, Process Economics Program Report, Stanford Research Institute, Menlo Park, Calif., No. 61, 1970; No. 61A, 1974; No. 61B, 1978; No. 61C,
1982.
91. Abam Engineers, Pinal Report on Process Engineering and Economic Evaluations ofDiaphragm and Membrane Chloride Cell Technologies, ANL/OEPM-80-9,
Argonne National Laboratories, Argonne, Hl., Dec. 1980.
General References
References 8,16, 43, 57, 58, 89, 90, and 91 are general references.
J. S. Sconce, Chlorine, Its Manufacture, Properties, and Uses, Reinhold Publishing Corp., New York, 1962.
D. W. F. Hardie and W. W. Smith, Electrolytic Manufacture of Chemicals from Salt, The Chlorine Institute, New York, 1975.
M. O. Coulter, Modem Chlor-Alkali Technology, Ellis Horwood, London, 1980.
C. Jackson, Modem Chlor-Alkali Technology, Ellis Horwood, Chichester, UK, 1983.
K. Wall, Modem Chlor-Alkali Technology, Ellis Horwood, Chichester, UK, 1986.
Diaphragm Cellsfor Chlorine Production, Society of Chemical Industry, London, 1977.
F. Hine, R. E. White, W. B. Darlington, and R. D. Varjian, eds., Proceedings of the Symposium on Electrochemical Engineering in the Chlor-Alkali and Chlorate
Industries (Proc. Vol. 88-2), The Electrochemical Society Inc., Pennington, N.J., 1988.
F. Hine, В. V. Tilak, J. M. Fenton, and J. D. Lisius, eds., Proceedings of the Symposium on Performance of Electrodes for Industrial Electrochemical Processes (Proc. Vol.
89-10), The Electrochemical Society Inc., Pennington, NJ., 1989.
W. Grot in J. I. Kroschwitz, ed., Encyclopedia ofPolymer Science and Engineering, 2nd ed., Vol. 16, Wiley-Interscience, New York, 1989, p. 42.
N. M. Prout and J. S. Moorhouse, eds., Modem Chlor-Alkali Technology, Vol. 4, Elsevier Applied Science, 1990.
L. Calvert Curlin
OxyTech Systems, Inc.
Tilak V. Bommaraju
Constance B. Hansson
Occidental Chemical Corporation
Kirk-Othmer Encyclopedia of Chemical Technology (4th Edition)
521
SODIUM CARBONATE
Voll
SODIUM CARBONATE
Sodium carbonate [497-19-8]Na2CO3, formula wt 105.99, is a white crystalline solid known as soda ash and less commonly, ash, soda or calcined soda. It
is readily soluble in water and is strongly alkaline. It is the eleventh largest world commodity chemical; in 1989 33 million metric tons were produced,
including 9 million in the United States. About 75% of world production is synthetic ash made from sodium chloride via the Solvay or similar processes;
the remaining 25% is produced from natural sodium carbonate bearing deposits. Over half of the world's production is consumed in the glass industry and
another 22% is used in the production of sodium-based chemicals. Sodium carbonate is also used in detergents, pulp (qv) and paper (qv), and
environmental control (water treatment and flue gas desulfurization). The normal article of commerce is highly purified (>99%). Differences in bulk density
are the only major distinction between the various grades. Minor amounts of sodium carbonate monohydrate [5968-17-6/, Na2CO3-H2O, and sodium
carbonate decahydrate [6132-02-1Na2 CO3 • 10H2 O, are sold and used in specialty appEcations. Aqueous solutions are alkaline. At 25°C the pH of 1, 5, and
10 wt % Na2CO3 solutions is 11.37, 11.58, and 11.70, respectively. Physical properties and solubiEty data are given in Tables 1 and 2, respectively.
Table 1. Physical Properties of Sodium Carbonate*
Property Value Na2CO3 Na2CO3 H2O Na2CO3 7H2O Na2CO3 10H2O
melting point bulk density, g/mL specific gravity heat of formation, AH, kJ /molb at 0°C temperature, °C, stable soEd phase 825 0.59-1.04 2.533 -1131 -1459 -3201 -4082 >109 35.4-109.0 32.0-35.4 0-32.0
aRefs. 1-4.
To convert kJ/mol to kcal/mol, divide by 4.184.
Table 2. Solubility Data for Sodium Carbonate
Temperature, °C Na2CO3 in saturated solution, wt %
0 6
10 8.5
20 17
30 28
40 32.3
50 32.0
60 31.7
70 31.0
80 30.8
90 30.8
100 30.8
aRef. 3.
Manufacturing T echnology
Historically, soda ash was produced by extracting the ashes of certain plants, such as Spanish barilla, and evaporating the resultant Equor. The first large
scale, commercial synthetic plant employed the LeBlanc (Nicolas LeBlanc (1742—1806)) process (5). In this process, salt (NaCl) reacts with sulfuric acid to
produce sodium sulfate and hydrochloric acid. The sodium sulfate is then roasted with limestone and coal and the resulting sodium carbonate—calcium
sulfide mixture (black ash) is leached with water to extract the sodium carbonate. The LeBlanc process was last used in 1916—1917; it was expensive and
caused significant poEution.
These disadvantages prompted Ernest Solvay (1838—1922) to develop and commercialize a procedure using ammonia to produce soda ash from salt
and limestone. The first plant using the Solvay process was built in 1863; this process or variations are in use in much of the world in the 1990s.
Natural soda ash-containing brines and deposits were found in the United States at Searles Lake, California and Green River, Wyoming in the late
1800s. Sporadic attempts to commercialize these deposits were made in the early 20th century. During the first half of the 1900s the Searles Lake deposit
was commercialized and the production faciEties improved and expanded. In 1938 large deposits of trona [15243-87-5]^ Na2CO3-NaHCO3-2H2O, were
found in the Green River basin. The first process for producing refined soda ash from this source came onstream in 1953.
Synthetic Processes
SOLVAY-AMMONIA PROCESS
The basic Solvay process remains the dominant production route for soda ash. Its continued success is based on the raw materials, salt and limestone,
being more readily available than natural alkaE. AU soda ash processes are based on the manipulation of saline phase chemistry (6,7) an understanding of
which is important both to improving current processes and to the economic development of new alkaE resources.
Chemical Reactions. The overall chemical reaction,
2 NaCl + CaCO3 Na2CO3 + CaCl2
Kirk-Othmer Encyclopedia of Chemical Technology (4th Edition)
522
SODIUM CARBONATE
Voll
takes place in. a series of process steps. The ammonia formed in step 5 is recycled to step 1; the carbon dioxide from steps 3 and 4 is used in step 2. Overall
sodium utilization averages 70%. The remainder is sent to waste. Figure 1 shows a simplified flow diagram (8).
1. NaCl + NH3 ammoniated brine
2. ammoniated brine + CO2 NaHCO3 + NH4C1
3. 2NaHCO3^ANa2CO3 + CO2 + H2O
4. CaCO3 CaO + CO2
5. CaO + 2 NH4C1 2 NH3 + CaCl2 + H2O
Calcium chloride
Light soda ash
Fig. 1. Simplified Solvay flow diagram.
Brine Preparation. Sodium chloride solutions are occasionally available naturally but they are more often obtained by solution mining of salt
deposits. Raw, near-saturated brines containing low concentrations of impurities such as magnesium and calcium salts, are purified to prevent scaling of
processing equipment and contamination of the product. Some brines also contain significant amounts of sulfates (see Chemicals frombrine). Brine is
usually purified by a lime—soda treatment where the magnesium is precipitated with milk of lime (Ca(OH)2) and the calcium precipitated with soda ash.
After separation from the precipitated impurities, the brine is sent to the ammonia absorbers.
Ammonia Absorption. The strong brine is saturated with ammonia gas containing water vapor and carbon dioxide in an absorption tower.
The brine descends through the main part of the absorber countercurrent to the rising ammoniacal gases. Most of the ammonia is obtained from various
process steps; however, small amounts are added to make up for losses. During ammoniation, the brine requires cooling (ca 1650 MJ/t = 394 kcal/kg of
product soda ash). This operation is generally carried out at slightly less than atmospheric pressure.
Precipitation of Bicarbonate. The ammoniated brine from the absorber coolers is pumped to the top of one column situated in a group of
columns used to precipitate sodium bicarbonate [144-55-8]> NaHCO3. This column, fouled or partially plugged with bicarbonate after several days of
crystallization, is referred to as a cleaning column. Lime kiln gas, compressed to about 414 kPa (60 psi), enters the bottom of the cleaning column and
bubbles up through the solution absorbing most of the carbon dioxide. Thus the carbon dioxide concentration in the liquor leaving the cleaning column is
kept below the bicarbonate precipitation level. This liquor is fed in parallel to the top of the remaining columns in the block. These crystallizing or making
columns receive a mixture of kiln gas and bicarbonate calciner gas that bubbles up through the solution, precipitating sodium bicarbonate. This process is
accompanied by the evolution of considerable heat, 1450 MJ/1 (347 kcal/kg), that must be removed to maintain yield. Bicarbonate crystals gradually foul
the heat-exchange surfaces and crystallizing columns must be alternately used as the cleaning column. Gases, mosdy nitrogen but some carbon dioxide and
ammonia, are vented from the crystallizing tower columns and collected before being recycled to the absorber.
Filtration of Bicarbonate. The slurry from the crystallizing towers is fed to continuous vacuum filters or centrifuges where the crystals are
separated from the filter liquor. Air drawn through the vacuum filter (or the vent gas from the centrifuge operation) is returned to the ammonia absorber.
The filter cake is carefully washed with fresh water to control residual chloride and to meet customer specifications. It is then conveyed to the calcining
operation. Dewatering characteristics of the bicarbonate crystals are dependent on operating conditions in the crystallizing columns. The filter cake, often
called crude bicarbonate or ammonia soda, contains 9—10% moisture as residual diluted filter liquor. The cake is made up of sodium bicarbonate and small
amounts (5 mol % on a dry basis) of ammonia primarily in the form of ammonium bicarbonate.
Recovery of Ammonia. The filter liquor contains unreacted sodium chloride and substantially all the ammonia with which the brine was
originally saturated. The ammonia may be fixed or free. Fixed ammonia (ammonium chloride [12125-02-97]) corresponds stoichiometrically to the
precipitated sodium bicarbonate. Free ammonia includes salts such as ammonium hydroxide, bicarbonate, and carbonate, and the several possible
carbon—ammonia compounds that decompose at moderate temperatures. A sulfide solution may be added to the filter liquor for corrosion protection. The
sulfide is distilled for eventual absorption by the brine in the absorber. As the filter liquor enters the distiller, it is preheated by indirect contact with
departing gases. The warmed liquor enters the main coke, tile, or bubble cap-filled sections of the distiller where heat decomposes the free ammonium
compounds and steam strips the ammonia and carbon dioxide from the solution.
This carbon dioxide-free solution is usually treated in an external, well-agitated liming tank called a "prelimer." Then the ammonium chloride reacts
with milk of lime and the resultant ammonia gas is vented back to the distiller. Hot calcium chloride solution, containing residual ammonia in the form of
ammonium hydroxide, flows back to a lower section of the distiller. Low pressure steam sweeps practically all of the ammonia out of the limed solution.
The final solution, known as "distiller waste," contains calcium chloride, unreacted sodium chloride, and excess lime. It is diluted by the condensed steam
and the water in which the lime was conveyed to the reaction. Distiller waste also contains inert solids brought in with the lime. In some plants, calcium
chloride [10043-52-4]y CaC^, is recovered from part of this solution. Close control of the distillation process is required in order to thoroughly strip carbon
dioxide, avoid waste of lime, and achieve nearly complete ammonia recovery. The hot (56°C) mixture of wet ammonia and carbon dioxide leaving the top
of the distiller is cooled to remove water vapor before being sent back to the ammonia absorber.
Lime Preparation. The most suitable limestone (see Lime and limestone), hard and strong with low concentrations of impurities, is graded to
a reasonably uniform coarse size. Although other fuels may be used,the limestone is usually mixed with about 7% metallurgical-grade coke or anthracite
and then burned in vertical shaft kilns. Air is admitted continuously into the bottom of the kiln; the combustion products are taken off the top. The fuel
bums in a zone a litde before the middle of the kiln, where the charge is heated to about 950—1100°C, and the stone "bums" to lime. Carbon dioxide is
generated both by decomposition of limestone and by combustion of carbon in the fuel. The kiln gases are diluted with nitrogen from the combustion air.
This gas usually contains 37—42% CO2, stone dust, ash particles, and other gaseous impurities. The gas is partially cooled in the kiln by the upper layers of
stone. It is further cooled and cleaned before entering the compressors feeding the carbonating columns.
The lime, cooled somewhat by the entering air in the lower parts of the shaft kiln, is discharged intermittendy and slaked to calcium hydroxide with
Kirk-Othmer Encyclopedia of Chemical Technology (4th Edition)
523
SODIUM CARBONATE
Voll
an excess of water, usually in rotary slakers. This results in a thick suspension, commonly called milk of lime, stored in agitated tanks. The heat of the
reaction produces milk of lime at a temperature of 90—100°C; water addition is controlled to give a free calcium oxide content of 230—300 g/L. In some
operations, dry lime is used in place of the milk of lime. The dry lime is pulverized and added continuously to the prelimer in the distillation step, thus
reducing the amount of water added and the steam consumed, and producing a more concentrated distiller waste.
Calcining the Bicarbonate to Soda Ash. Crude filtered bicarbonate is continuously calcined by indirect heating. Various techniques are
used to heat, 2430 kJ /kg (581 kcal/kg) this material to 175—225°C in the calciners. Carbon dioxide, produced at 95% or higher purity, is compressed and
recycled to the carbonating tower in order to enrich the makeup kiln-gas feed. The hot soda ash discharged from the calciner is cooled, screened, and
packaged, or shipped in bulk. This product, called light ash has a bulk density of around 590 kg/m3. A certain amount is sold in this form; the majority,
however is converted to dense ash.
Dense Ash. Dense soda ash is manufactured by hydrating light ash to produce the larger sodium carbonate monohydrate crystals and then
dehydrating them. Hydration may be accomplished in one of two ways: by feeding light ash and water to mixers or blenders, or by adding light ash to a
saturated soda ash solution containing a slurry of monohydrate crystals. The monohydrate crystals are then fed to a continuous dryer and the dehydrated
product is screened before packing and shipping. Bulk densities typically run between 960—1040 kg/m3.
Waste Disposal. Large volumes of liquid waste containing suspended and dissolved solids are produced in an ammonia—soda plant. The
largest quantity comes from the distiller operation where, for every ton of product soda ash, nearly 10 cubic meters of liquid waste are produced. This waste
contains about one ton of calcium chloride, one-half ton of sodium chloride, and other soluble and suspended impurities. Traditionally, after settling the
suspended solids in large basins, the waste was discharged into local waterways, a practice no longer acceptable in the United States. The costs to comply
with environmental regulations and increasing operating costs relative to natural ash production have forced shutdown of all synthetic soda ash plants in
the United States.
AMMONIUM CHLORIDE (AC) PROCESS
The ammonium chloride process, developed by Asahi Glass, is a variation of the basic Solvay process (9—11). It requires the use of solid sodium chloride
but obtains higher sodium conversions (+90%) than does the Solvay process. This is especially important in Japan, where salt is imported as a solid. The
major difference from the Solvay process is that here the ammonium chloride produced is crystallized by cooling and through the addition of solid sodium
chloride. The resulting mother liquor is then recycled to dissolve additional sodium chloride. The ammonium chloride is removed for use as rice paddy
fertilizer. Ammonia makeup is generally supplied by an associated synthesis plant.
NEW ASAHI (NA) PROCESS
The NA process (9—11) has two variations named the co-production process and the mono-production process. In the co-production process, solid
ammonium chloride is produced as a by-product by direct contact cooling crystallization. In the mono-production process, the crystalline ammonium
chloride reacts with a lime slurry to release the ammonia for recycle sending the resulting calcium chloride solution to waste. Most Japanese plants have
adopted some aspects of the NA process which it is claimed requires less energy than the basic Solvay process and, by using direct contact cooling instead
of conventional heat exchangers, reduces fouling.
OTHER SYNTHETIC ROUTES
Two processes taken to some stage of development in the early 1980s have not yet been commercialized.
Hbls Process. Chemische Werke Hbls AG has developed a process to produce soda ash and hydrochloric acid from salt via an amine—solvent
system (12). A potential advantage of the Hbls process is that, under some market conditions, hydrochloric acid may be more easily sold than either
ammonium or calcium chloride.
Akzo Process. Akzo Zout Chemie has developed a route to vinyl chloride and soda ash from salt using an amine—solvent system catalyzed by a
copper—iodide mixture (13). This procedure theoretically requires half the energy of the conventional Solvay processes.
Natural Processes
Sodium carbonate bearing deposits and brines exist around the world. Locations are known in the United States, China, Turkey, Bolivia, Brazil, Venezuela,
Mexico, India, Pakistan, USSR, Kenya, Australia, and Botswana (14—20). The overwhelming majority of natural ash production comes from the Green
River Basin in southwestern Wyoming. Significant amounts are also produced at Searles Lake in California; lesser amounts at Lake Magadi in Kenya. Minor
quantities are reportedly produced in Pakistan, the USSR, and China and small amounts of impure trona come from Owens Lake, California. A plant is
currendy under construction to recover soda ash from brine at Sua Pan, Botswana. Each deposit has its own distinctive characteristics and each requires
different processing techniques.
GREEN RIVER BASIN
Sodium carbonate brines were discovered around Green River, Wyoming before 1900. In 1907 the Western AlkaE Corporation processed these brines and
produced small amounts of sal soda (Na2CO3-10H2O) until the end of World War I. The Green River trona (Na2CO3-NaHCO3-2H2O) beds were
discovered in 1938 and the first shaft sunk in 1947 by Westvaco Chlorine Products (since acquired by FMC). The first refined soda ash plant became
operational in 1953. Prior to that time and for a short period thereafter, small amounts of relatively impure soda ash were produced by hand sorting
calcined trona. There are currendy five soda ash producers in the Basin; capacities are shown in Table 3.
Table 3. Wyoming Soda Ash Producers
Company
FMC
General (49% ACI International)
Rhcjnie-Poulenc
TGI (Elf Acquitaine)
Tenneco
Total
1989 Capacity, 106 t/yr
2.6
2.0
1.7
1.0
1.0
8.3
Geology. The Green River Formation was deposited in a large Eocene lake varying in both size and salinity. Trona is found in the Wilkins Peak
Member. This represents the stage when the lake covered the smallest area and was the most saline. The bedded trona deposits cover an area of about 3400
km2 (14,15). At least 25 trona beds have been identified. Beds range in thickness from 1 to 11 m; mining heights are usually 2 to 3 m. The trona is
interbedded with fine silt and shale containing associated organic materials (see Oil shale). It is estimated that the deposit contains over 100,000 million
metric tons of trona, sufficient to satisfy wodd demand for over 2000 yr. The formation also contains other sodium carbonate salts, Dawsonite
[12011-76-6], Na3 A1(CO3)3 -2A1(OH)3, and nahcoHte [15752-47-3], NaHCO3, in the Uinta and Piceance Creek areas. Exploitation of these reserves has
been evaluated several times over the years with negative results.
Mining. The trona beds currendy mined are between 85 and 95% pure. The balance is predominandy oil shale and associated minerals, but
Kirk-Othmer Encyclopedia of Chemical Technology (4th Edition)
524
SODIUM CARBONATE
Voll
small amounts of sodium chloride and sodium sulfate are also present. Mining is generally confined to one bed at a time. Methods are similar to coal
mining (see Coal): room and pillar, longwall, and shortwall mining techniques are used. Equipment, however, is modified to withstand the more abrasive
trona.
Room and pillar techniques are used to extract most of the trona. Conventional blasting methods as well as drum (ripper) and borer mining
machines are employed. Longwall and shortwall mining techniques which involve hydraulically supporting the overburden while undercutting the trona
seam have recendy been introduced. In these methods, the hydraulic supports are advanced after the trona is extracted. Eventually the previous cut caves
in. These newer techniques allow over 70% recovery of the ore compared to 50% recovery for conventional room and pillar methods.
In 1983 FMC started an experimental program to solution mine trona in situ using a proprietary water-based solvent system. This method avoids
expensive mine development costs and allows ore recovery in beds that are too deep for conventional mining. Pairs of wells are drilled into the ore bodies
and frac-connected using high pressure pumps. The solvent is then circulated through the wells and sent to the processing plant. This well system has been
successfully producing commercial quantities of soda ash since 1983.
Another mining process involves the recovery of sodium carbonate decahydrate from alkaline ponds. FMC mines this material from its solar
evaporation pond using a bucket wheel dredge. The decahydrate slurry is dewatered, melted, and processed to soda ash.
Trona Purification Processes. Two processes, named the monohydrate and sesquicarbonate according to the crystalline intermediates, are
used to produce refined soda ash from trona. Both involve the same unit operations only in different sequences. Most ash is made using the monohydrate
process. Figure 2 shows simplified flow diagrams for each.
Mono Process
Trona ore
I
Crushing
I
Calcination
I
r.. , Water
Dissolution -<-------
I
Clarification
I
Filtration
I
Carbon treatment
I
Evaporative
crystallization
I
Centrifugation
I
Drying
I
Shipping
Mother
liquor
Sesqui Process
Trona ore
I
Crushing
I
------► Dissolution
I
Clarification
I
Carbon treatment
I
Filtration
I
Cooling
crystallization
I
Mother ’
---------Centrifugation
liquor
Calcination
I
Cooling
I
Shipping
Fig. 2. Simplified flow diagrams for soda ash from trona.
Monohydrate Process. In this process (21), trona is ground and calcined (150—300°C) to a crude soda ash using rotary gas-fired and coal
grate-fired calciners. The calciner product is then leached with hot water and the clear, hot liquor sent to evaporative recirculating crystallizers (40—100°C)
where sodium carbonate monohydrate is produced. Both multiple-effect and mechanical vapor recompression (MVR) crystallizers are used. Some
producers send the liquor through activated carbon beds before crystallization to remove trace organics from the solution. These organics, solubilized from
the oil shale, can affect crystallizer performance by foaming and changing crystal growth rates and habit. Other trace contaminants are removed from the
system by purging small amounts of mother liquor. Weak liquors and insolubles are removed by clarifiers and subsequent filtration. The insolubles are
washed again to recover any additional alkali.
Sodium carbonate monohydrate crystals from the crystallizers are concentrated in hydroclones and dewatered on centrifuges to between 2 and 6%
free moisture. This centrifuge cake is sent to dryers where the product is calcined 150°C to anhydrous soda ash, screened, and readied for shipment. Soda
ash from this process typically has a bulk density between 0.99—1.04 g/mL with an average particle size of about 250 |lm.
Sesqui Process. In this process (22), the crushed ore is dissolved in hot (95°C) return liquor, clarified, filtered and sent to cooling crystallizers
where sodium sesquicarbonate [6106-20-3]\ Na2CO3-NaHCO3-2H2O is formed. Carbon is added to the filters to control any crystal modifying organics.
The sesquicarbonate crystals are hydrocloned, centrifuged, and calcined (110—175°C) using either indirect steam heat or gas. This product has a typical bulk
density of around 0.89 g/mL. Densities similar to the monohydrate ash may be achieved by subsequendy heating the material to about 350°C.
Alternatively, the ash can be converted to the monohydrate and calcined as practiced by the Solvay industry.
OTHER NATURAL ASH DEPOSITS
Searles Lake. Searles Lake is a large evaporite deposit about 78 km square and 46 m deep. It contains a complex mixed salt system that
includes trona along with potassium, boron, and other salts (23,24). North American Chemical Company recovers soda ash (1.0 x 10⁶ t/yr) from the lake
by carbonating and cooling the brine to crystallize sodium bicarbonate (25). The bicarbonate is filtered and calcined to light soda ash which is densified by
conversion to the monohydrate followed by calcining. The procedure results in a dense ash with properties equivalent to Wyoming trona derived ash.
Other salts, most notably borax, are also recovered from the lake.
Lake Magadi. Lake Magadi, about 19 km long and 3 km wide, is in the Great Rift Valley of East Africa (26). It is about 6000 m above sea level,
has no oudet, and is fed by alkali springs which upon evaporation leave behind trona and other salts. ICI, Ltd. operates a plant at the lake (27,28). Raw
trona is dredged up from the lake, crushed, slurried, and sent to an on-shore refining plant where it is washed, screened, and calcined to soda ash. The
product is less pure than synthetic soda or the other natural ashes because it contains relatively high amounts of salt, sodium fluoride, and sulfate. About
220,000 t were produced in 1989.
Lake Texcoco. Lake Texcoco, a few miles northeast of Mexico City, is in the lowest part of the Valley of Mexico. The lake is mostly dry and
alkali is recovered from brine wells that have been drilled into the underlying structure. The brine is concentrated first in a spiral flow solar evaporation
pond and further in conventional evaporators. This strong brine is carbonated and then cooled to crystallize sodium bicarbonate which is subsequendy
filtered and calcined to soda ash. Purity of this product is similar to Magadi material (9,29).
Owens Lake. Owens Lake is a relatively small alkali deposit in Southern California where small amounts of crude trona are recovered and sold
(30,31). Several feasibility studies with regard to expanding production at this site have been conducted over the years with negative results.
Kirk-Othmer Encyclopedia of Chemical Technology (4th Edition)
525
SODIUM CARBONATE
Voll
Sua Pan, Botswana. A soda ash plant is under construction at Sua Pan in Botswana (32). The plant will recover ash from an alkali brine via a
process similar to that at Searles Lake (29).
Economic Aspects
Natural and synthetic soda ash capacity is shown in Table 4. As indicated in Table 5, eight companies represent about 75% of the Western world's soda ash
capacity.
Table 4. World Distribution of Soda Ash Capacity*
Region Soda ash, 106 t/yr
Natural Synthetic
North American 9.5 0.4
Western Europe 6.7
Latin America 0.2 0.8
Africa 0.3 0.1
Asia 4.3
Oceania 0.4
USSR, China, Eastern Europe 0.5 14.5
Total 10.5 27.2
a Refs. 9 and 29.
Table 5. Soda Ash Producers*
Company Capacity, 106 t/yr
Solvay & Cie FMC Ш1фпе-Рои1епс General Chemical ICI North American Chemical Co. Tenneco Elf Acquitaine Total 4.3 2.6 2.4 2.4 1.3 1.0 1.0 1.0 16.0
aRefs. 9, 29.
Capital and operating costs for soda ash production are extremely site specific (29,10). Key factors include infrastructure development, freight to
consumers, local energy and labor costs, and by-product saleability. 1990 list price of bulk natural soda ash was $108/t, F.O.B. Wyoming.
Although each production process yields ash that is essentially chemically equivalent, the various products differ in physical properties and in
contaminants as shown in Table 6. Hopper cars, pneumatic trucks, supersacks, and multiwall kraft bags with polyethylene liners are the usual shipping
containers.
Table 6. Typical Properties of Commercial Soda Ash
Property Synthetic ash Natural ash (U.S.)
Light Dense Intermediate Dense
bulk density, g/mL 0.59 1.04 0.80 1.04
N aCl, ppm 8000-1000 5000-300 300 300
Na2SO4, ppm 200 200 300 300
Fe2O3, ppm 80-20 80-20 5 3
size distribution, cumulative % on sieve no. +40 size, pm 3 11 10 11
420
+100 149 17 90 89 90
+200 74 63 99 99 99
+325 44 86 99 99 99
pore volume, mL/g 0.4 0.1 0.3 0.1
shape A M N M
Particle shapes are classified as acicular, A, monoclinic and blocky, M, or monoclinic and needle, N.
Dense ash is preferred by the glass industry because its size and bulk density minimize segregation when mixed with other glass batch materials.
Light and intermediate grades of soda ash are preferred for some detergent applications where surfactant carrying capacity and dissolution are important.
The different physical properties of the various grades are dependent both on the crystalline product calcined (bicarbonate, monohydrate, or
sesquicarbonate) and on calcination conditions.
Safety and Handling
Under National Fire Protection Association (NFPA) Designation 704, soda ash is classified as a moderate health hazard. Exposure to soda ash dust may
cause severe eye and slight nose and throat irritation. Repeated contact may affect the skin causing redness, dryness, and cracking. First aid procedures are
to flush or wash the affected part with water for 15 min, obtaining medical attention if the irritation persists. Simultaneous exposure to the dusts of lime
and soda ash should be avoided. The two react to form caustic soda in the presence of moisture or perspiration. Soda ash is strongly alkaline and should
not be stored close to acids. It is mildly hygroscopic and generally stored in closed bins or multiwall kraft bags (see Packaging, containers and industrial
materials).
Kirk-Othmer Encyclopedia of Chemical Technology (4th Edition)
526
SODIUM CARBONATE
Voll
Environmental Aspects
Synthetic Processes. Traditional Solvay plants produce large volumes of aqueous, chloride-containing waste which must be discharged. This
fact, in addition to a noncompetitive cost position, is largely responsible for the demise of U.S. synthetic plants. In countries other than the United States,
waste is sent to the ocean, rivers, or deep underground wells. The AC and NA coproduct processes produce less aqueous waste than the traditional Solvay
and NA mono processes. Related environmental concerns are added whenever a plant complex includes lime quarries and ammonia-producing equipment.
Natural Production Processes. The natural soda ash processes produce no large volumes of associated wastes. The major waste products
are the tailings, insoluble shale and minerals associated with the trona and removed during processing. These solids along with purge liquors containing
organic and trace impurities are sent to large evaporation ponds where concentration of the aqueous streams is a first step in the eventual recovery of the
residual alkaE. Because the soEds can create dust when dry, several Wyoming producers are experimenting with injecting the tailings into mined out areas
underground. Care must also be taken to avoid groundwater contamination by alkaE runoff and mine incursion. These risks are not integral to the recovery
process, but are affected by plant siting and construction.
By-Products and Coproducts
Calcium Chloride. Distiller waste Equor from synthetic plants can be evaporated in multiple effect evaporators, precipitating residual sodium
chloride. The resulting mother Equor is then further evaporated to a molar ratio of 1СаС12:2Н2О and cooled to produce flakes that are dried in rotary or
tray type driers. The product assays at 77—80% calcium chloride [10043-52-4], CaCl2. Most is used as road de-icer; significant amounts are also used as dust
control agents and dessicants.
Ammonium Chloride. Most ammonium chloride [12125-02-9]NH4C1, is used as rice paddy fertilizer; small amounts are used in dry cells and
as fluxing agents (see Ammonium compounds).
Sodium Bicarbonate. Many soda ash plants convert a portion of their production to sodium bicarbonate [144-55-8], NaHCO3. Soda ash is
typically dissolved, carbonated, and cooled to crystallize sodium bicarbonate. The mother Equor is heated and recycled. The soEd bicarbonate is dried in
flash or tray driers, screened, and separated into various particle size ranges. Bicarbonate markets include food, pharmaceuticals, catde feed, and fire
extinguishers. U.S. demand was approximately 320,000 t in 1989; world demand was estimated at one million metric tons.
FMC makes sodium bicarbonate at the Green River complex by reaction of sesquicarbonate (Na2 CO3 -NaHCO3 -2H2 O) with carbon dioxide
recovered from a sodium phosphate plant. This faidy recendy patented process avoids the energy intensive heating step (33).
Sodium Hydroxide. Before Wodd War I, neady all sodium hydroxide [1310-93-2]., NaOH, was produced by the reaction of soda ash and
lime. The subsequent rapid development of electrolytic production processes, resulting from growing demand for chlorine, effectively shut down the old
lime—soda plants except in Eastern Europe, the USSR, India, and China. Recent changes in chlorine consumption have reduced demand, putting pressure
on the price and availabiEty of caustic soda (NaOH). Because this trend is expected to continue, there is renewed interest in the lime—soda production
process. FMC operates a 50,000 t/yr caustic soda plant that uses this technology at Green River; it came onstream in mid-1990. Other U.S. soda ash
producers have announced plans to construct similar plants (1,5).
Lime Soda. Process. Lime (CaO) reacts with a dilute (10—14%), hot (100°C) soda ash solution in a series of agitated tanks producing caustic
and calcium carbonate. Although dilute alkaE solutions increase the conversion, the reaction does not go to completion and, in practice, only about 90% of
the stoichiometric amount of lime is added. In this manner the lime is all converted to calcium carbonate and about 10% of the feed alkaE remains. The
resulting slurry is sent to a clarifier where the calcium carbonate is removed, then washed to recover the residual alkaE. The clean calcium carbonate is then
calcined to lime and recycled while the dilute caustic—soda ash solution is sent to evaporators and concentrated. The concentration process forces
precipitation of the residual sodium carbonate from the caustic solution; the ash is then removed by centrifugation and recycled. Caustic soda made by this
process is comparable to the current electrolytic diaphragm cell product.
BIBLIOGRAPHY
"Sodium Carbonates" in ECT 1st ed., Vol. 12, pp. 601—602, by J. A. Brink, Jr., Purdue University; "Sodium Compounds, Carbonates" in ECT 2nd ed., Vol.
18, pp. 458—468, by E. Rau, FMC Corporation. "AlkaE and Chlorine Products—Sodium Carbonate" in ECT 3rd ed., Vol. 1, pp. 866—883, by A. S.
Robertson, Allied Chemical Corporation.
1. J. W. Mellor, M Comprehensive Treatise on Inorganic and Theoretical Chemistry, Vol. 2, Suppl. 2, John Wiley & Sons Inc., New York, 1961.
2. F. D. Rossini and co-workers, Selected Values of Chemical Thermodynamic Properties, U.S. Government Printing Office, Washington D.C., 1952.
3. A. Seidell, Solubilities of Inorganic and Metal Organic Compounds, Van Nostrand Co., Princeton, N.J., 1958.
4. J. Wisniak, Phase Diagrams, Elsevier Scientific PubEshing Co., New York, 1981.
5. T. P. Hou, Manufacture of Soda (AQS Monogr. Ser.) Hafner PubEshing Co., New York, 1969.
6. J. Nyvlt, Solid—Liquid Phase Equilbria, Elsevier Scientific PubEshing Co., New York, 1977.
7. W. C. Blasedale, Equilibria in Saturated Salt Solutions, (ACS Monogr. Ser.) Reinhold PubEshing Corp., New York, 1927.
8. Z. Rant, Die Er^eugung von Soda, F. Enke, Stuttgart, Germany, 1968.
9. The Economics of Soda Ash, Roskill Information Services Ltd., London, 1989.
10. K. Tsunashima and K. Nakaya, The New Asahi (NA) Process for Synthetic Ash Production, 5th Industrial Mineral International Conference, Madrid,
1982.
11. H. Matsuo, Kagaku Kogaku 49(7), 553—558 (1985).
12. U.S. Pat. 4,320,106 (Mar. 16, 1982), B. Hentschel and co-workers (to Chemische Werke Hbls AG).
13. U.S. Pat. 4,256,719 (Mar. 17,1981), E. Van Andel (to AKZO N.V. NL).
14. J. J. Fahey, Saline Minerals of the Green RiverFormation, Geological Survey Professional Paper 405, U.S. Government Printing Office, Washington
D.C., 1962.
15. R. B. Parker, ed., Contributions to Geology, Trona Issue, University of Wyoming, Spring 1971.
16. FMC pubEcation, The City Below.
17. P. W. Hynes, Min. Eng. 1126 (Nov. 1989).
18. D. R. Delling, Min. Eng. 1197 (Oct. 1985).
19. L. N. Post, Min. Eng. 1200 (Oct. 1985).
20. R. E. Harris, Min. Eng. 1204 (Oct. 1985).
21. U.S. Pats. 2,962,348 (Nov. 29,1960), 3,655,331 (Apr. 11,1972), 3,131,996 (May 5, 1964), L. Seglin and H. S. Winnicki (to FMC Corp.); U.S. Pat.
3,244,476 (Apr. 5, 1966), L. K. Smith (to Intermountain Research & Development Corp.); U.S. Pat. 3,260,567 (July 12, 1966).
22. U.S. Pat. 2,639,217 (May 19,1953), R. D. Pike (to FMC Corp.); U.S. Pat. 2,792,282 (May 14,1957), R. D. Pike and К. B. Ray (to FMC Corp.);
U.S. Pat. 3,028,215 (Apr. 3,1962), W. R. Frint (to FMC Corp.); U.S. Pat. 3,084,026 (Apr. 2,1963), W. R. Frint and W. D. Smith (to FMC Corp.);
U.S. Pat. 3,309,171 (Mar. 14, 1967), A. B. Gancy (to Intermountain Research & Development Corp.).
23. J. E. Teeple, The Industrial Development of Searles Lake Brines (ACS Monogr. Series), University Microfilms Inc., Ann Arbor, Mich., 1979.
24. G. F. Moulton Jr., Compendium of Searles Lake Operations, AIME Meeting, Las Vegas, Nev., Feb. 1980.
25. Trona Soda Ash and the Argus Facility, Bull. 1400, Kerr-McGee Chemical Corp., 1981.
26. В. H. Baker, Geology of the Magadi Area, Geological Survey of Kenya, Report 42.
27. J. J. C. Freeman, Chem. Eng. 293 (July 1982).
28. S. C. Hatwell, Natural Soda Ash from Magadi Glass International, March 1982, p. 52.
Kirk-Othmer Encyclopedia of Chemical Technology (4th Edition)
527
SODIUM CARBONATE
Voll
29. A. Russell, Ind. Min. London 19 (Jan. 1990).
30. G. D. Dub, Owens Lake-Source oj'Sodium Minerals, Technical Publication No. 2235, American Institute of Mining and Metallurgical Engineers, Sept.
1947.
31. Soda Ash Industry of Owens Lake, Vol. 12, No. 10, Mineral Information Service, State of California, 1959.
32. Chem. Week, 13 (Nov. 13, 1988).
33. U.S. Pat. 4,654,204 (Mar. 31,1987), F. Rauh, H. A. Pfeffer, and W. C. Copenhafer (to FMC Corp.).
General References
D. S. Kostick, Soda Ash and Sodium Sulfate Minerals Yearbook—1988, U.S. Department of the Interior, Washington D.C., 1988.
R. W. Phelps, "Trona—a Tale of Two Companies," Eng Mining]., 20 (1990).
M. J. Sagers and T. Shabad, The Chemical Industry in the USSR, ACS Professional Reference Book, Westview Press, Boulder, San Francisco and Oxford,
1990.
J. W. Savage and D. Bailey, Economic Potential of the New Sodium Minerals Found in the Green RiverFormation, presented at 61st Annual Meeting of the American
Institute of Chemical Engineers, Los Angeles, Calif., Dec. 1—5, 1968.
A. F. Zeller, "Trona," Eng. Mining], 51 (March 1991).
Francis Rauh
FMC Corporation
Kirk-Othmer Encyclopedia of Chemical Technology (4th Edition)
528
ALKALOIDS
Voll
ALKALI METALS.
See Cesium and cesium compounds; Lithium and lithium compounds; Potassium; Rubidium and rubidium compounds; Sodium compounds.
ALKALINE-EARTH METALS.
See Barium; Cadcium; Magnesium; Strontium and strontium compounds.
ALKALOIDS
The actions of the naturally occurring materials now known as alkaloids were probably utilized by the early Egyptians and/or Sumarians (1). However, the
beginnings of recorded, reproducible isolation from plants of substances with certain composition first took place in the early nineteenth century. Then in
close succession, narcotine [128-62-1J (1, now called noscopine, C22H23NO7) (2) and morphine (2, R = H) (3) (both from the opium poppy, Papaver
somniferum L2) were obtained.
Although their presendy accepted structures were unknown, they were characterized with the tools available at the time. Because morphine (2, R = H),
c17h19no3, was shown to have properties similar to the basic soluble salts obtained from the ashes of plants (alkali) it was categorized as a vegetable alkali
or alkaloid, and it is generally accepted that it was for this case the word was coined.
However, there is currently no simple definition of what is meant by alkaloid. Most practicing chemists working in the field would agree that most
alkaloids, in addition to being products of secondary metabolism, are organic nitrogen-conntaining bases of complex structure, occurring for the most part
in seed-bearing plants and having some physiological activity. An old compendium (4) carefully avoids simple amine bases known to be present in some
plants, but does list a variety of compounds such as aristolochic acid I [313-67-7] (3) (котЛш/о/о^й!? indlca L., the Dutchman's Pipe) and colchicine (4)
(from Colchlcum autumnala L., the autumn crocus), neither of which is basic, but both of which are physiologically active.
(4)
Kirk-Othmer Encyclopedia of Chemical Technology (4th Edition)
529
ALKALOIDS
Voll
In a later reference (5) the list of materials called alkaloids had grown and more structures had been elucidated, but the definition was essentially unchanged.
Subsequendy, a much more sophisticated definition was proposed (6) which, while meritorious, has apparently been found unworkable, as the most recent
catalog (7), listing nearly ten thousand alkaloids, contains compounds generally fitting within the categories which were used in 1960, but widened still
further to include not only nonbasic nitrogen-containing materials from plants, but also substances occurring in animals. Other compounds, the
physiological activity of which has not been measured, are also reported (8). Nonetheless, because of their widespread distribution across all forms of life,
alkaloids are intimately interwoven into the fabric of existence, and our understanding of some of the roles these substances play is the focus of
considerable research as the twenty-first century dawns.
History
From today's perspective, the history of alkaloid chemistry can be divided into four parts. The first part, which doubdessly developed over aeons prior to
the appearance of present-day humanity and about which litde is known, deals with the role alkaloids may really play (as divorced from anthropocentric
imaginings) in animal and plant defense, reproduction, etc. Second, in the era prior to about 1800, apothecaries' crude mixtures and folk medicinals were
administered as palliatives, poisons, and potions. Knowledge of this is based on individual or group records or memory. In the third period, ca 1800—1950,
eady analytical and isolation technologies were introduced. Good records were kept and techniques honed, so that the wrenching out of specific materials,
in truly minute quantities, from the cellular matrices in which they are held could be reproducibly effected. This time period also saw the beginnings of
correlation of the specific structures of those hard-won materials with their properties. Finally, the current era has seen a dowering of structure elucidation
as a consequence of the maturation of some analytical techniques, a renaissance in synthetic methods, and the introduction of biosynthetic probes, the last
two developments taking advantage of the advances in the first. Most recendy, the ability to correlate huge quantities of information at high speed has been
developed.
During the first era some insects developed relationships with the plants on which they fed which allowed them to incorporate intact alkaloids for
storage and subsequent use. This type of relationship apparendy continues to exist. Thus in 1892 there was a report (9) that pharmacophagus swallowtail
butterflies (Papilios) obtain and store poisonous substances from their food plants, and some seventy-five years later an investigation (10) showed that the
warningly colored and potendy odoriferous Anstolochla-feeding swallowtail butterfly [Pachlloptera aristolochlae Fabr] is even less acceptable than the
unpalatable Danainae to bird predators. Both the plant on which the swallowtail feeds (eg, Aristolchia indica L.) and the swallowtail itself contain aristolochic
acid I (3), C17HnNO7, and related materials. These materials are presumably ingested as larvae feed on the plant, stored during the pupal stage, and carried
into the adult butterfly. With regard to the Danainae, the larvae of the butterflies Danauspkxippus L. and Danaus chrysippus L. feed on Senecio spp. which
contain, among other compounds, the pyrrolizidine alkaloid senecionine (5) (11). (Structure (5) appears in Table 4.) Metabolites of this and other related
alkaloids apparendy serve in courtship and mating, with the more alkaloid-rich individuals having an advantage (12).
There are many other examples of insect use of alkaloids, such as the homotropane alkaloid euphococcinine [15486-23-4] (6), C9H15NO, which has
been noted as a defensive alkaloid in the blood of the Mexican bean beetle [Epllachna varivestis) (13); the azaspiroalkene polyzonimine [55811-47-7] (7),
c10h17n, an insect repellent produced by the milliped Doly^onium rosalbum (14); and the "very fast death factor" (VFDF), anatoxin-a [64285-06-9] (8),
C.-H.AO, a fish poison, which has been isolated from a toxic strain of microalgae Anabaenaflos-aquae (15). For (6), (7), and (8), little is yet known about
the formation (or genesis) of the alkaloid material.
H
l\F
(6)
The period prior to about 1800 includes the history of the crude exudate from unripe poppy pods, which, it is now known, contains narcotine (1,
noscopine), C22H23NO7, and morphine (2, R = H) along with other closely related materials. Also during this time natives of the Upper Amazon basin
were making use of crude alkaloid-containing preparations. To help their hunting, some tribes developed the red resinous mixture called tubocurare,
containing, among others, the alkaloid tubocurarine [57-95-4] (9), C37H41N2O6, obtained primarily from plants of the Chondrodendron; others developed
Calabash curare, containing, among others, the alkaloid C-toxiferine [6696-58-8] (10), C40 H46 N4O2 -2C1, from plants belonging to Strychnos spp.
Kirk-Othmer Encyclopedia of Chemical Technology (4th Edition)
530
ALKALOIDS
Voll
(Ю)
The natives of Peru were learning to ease their physical pains by chewing the leaves of coca shrub [~H,rythro)xylojn truxlllence, which contain, among
others, the alkaloid cocaine (11), and European citizens were recognizing other poisons such as coniine (12), from the poison hemlock (Conlum maculatum
L).
С X
N I 'CH2 CH3
| H
H
(12)
With the introduction of improved analytical techniques, starting around 1817, the evaluation of drugs began and, over a span of about 10 years,
strychnine (13, R = H), emetine (14), brucine (13, R = OCH3), piperine (15), caffeine (16), quinine (17, R = OCH3), colchicine (4), cinchonidine (17,
R = H), and coniine (12) were isolated (16) (Table 1). But, because the science was young and the materials complex, it was not until 1870 that the structure
of the relatively simple base coniine (12) was established (17) and not until 1886 that the racemic material was synthesized (18). The correct structure for
strychnine (13, R = H) was not confirmed by x-ray crystallography until 1956 (19) and the synthesis was completed in 1963 (20).
Table 1. Some Alkaloid Drugs
Name Molecular formula CAS Registry Number Structure number Structure
colchicine C^NOj [64-86-8] (4)
(3)-coniine c8h17n [458-58-8] (12)
strychnine ^21^22^2^2 [57-24-9] (13)(R = H)
(13)
Kirk-Othmer Encyclopedia of Chemical Technology (4th Edition)
531
ALKALOIDS
Voll
brucine
C23H26H2O4 [357-57-3] (13) (R = OCH3)
emetine C29H4QN2O4 [483-18-1] (14)
(14)
piperine C17H19NO3 [94-62-2] (15)
caffeine C8H10N4O2 [58-08-2] (16)
cinchonidine C19H22N2° [118-10-5] (17)(R = H)
CH3
(16)
quinine C20H24N2O2 [130-95-0] (17) (R = OCH3)
a T
ln text.
Occurrence, Detection, and Isolation
Given the massive volume of material available, the following discussion is necessarily incomplete and the interested reader is directed to the materials in
References 7 and 8, in particular, for more detailed information.
The most recent compendium (7) of alkaloids indicates that most alkaloids so far detected occur in flowering plants and it is probably true that the
highest concentrations of alkaloids are to be found there. However, as detection methods improve it is almost certain that some concentration of alkaloids
will be found almost everywhere. In the higher plant orders, somewhat more than half contain alkaloids in easily detected concentrations. Major alkaloid
bearing orders are Campanulaks^ Centrospermae^ Gentianaksy Gerantaks^ Riliflorae^ Rana/es., Rhoedaks^ Rosa/es, Rubiaks^ Sapindaks^ and Rubijlorae, and within these
orders most alkaloids have been isolated from the families AmaryHidaceae, Apocynaceae, Euphorbiaceae, Lauraceae, Leguminoseae, Liliaceae, Loganiaceae,
Kirk-Othmer Encyclopedia of Chemical Technology (4th Edition)
532
ALKALOIDS
Voll
Menispermaceae, Papveraceae, Ranuculaceae, Rubiaceae, Rutaceae, and Solanaceae. Alkaloids have also been found in butterflies, beedes, millipedes, and
algae and are known to be present in fungi, eg, agroclavine (18) from the fungus Clavlcepspurpurea., which grows as a parasite on rye and has been
implicated, with its congeners, in causing convulsive ergotism (21). They are found in toads, eg, bufotenine (19), an established hallucinogen in humans
(22); and in the musk deer, muscopyridine [501-08-6] (20), C16H25N. Even in humans morphine (2, R = H) is a naturally occurring component of
cerebrospinal fluid (23).
(29)
The concentration of alkaloids, as well as the specific area of occurrence or localization within the plant or animal, can vary enormously. Thus the
amount of nicotine [54-11-5] (21), C1QH14N2, apparently synthesized in the roots of various species of 5\icojtiana and subsequently translocated to the leaves
varies with soil conditions, moisture, extent of cultivation, season of harvest, etc and may be as high as 8% of the dry leaf, whereas the amount of
morphine (2, R = H) in cerebrospinal fluid is of the order of 2 to 339 fmol/mL (23).
(21)
Initially, the search for alkaloids in plant material depended largely on reports of specific plant use for definite purposes or observations of the effect
specific plants have on indigenous animals among native populations. Historically, tests on plant material have relied on metal-containing reagents such as
that of Dragendorff (24), which contains bismuth salts, or Mayer (25), which contains mercury salts. These metal cations readily complex with amines and
the halide ions present in their prepared solutions, yielding brightly colored products. Despite false positive and negative responses (26), field testing
continues to make use of these solutions. However, it is now clear that newer methods, such as kinetic energy mass spectrometry (MIKE) on whole plant
material (27), have the potential to replace these spot tests. After detection of a presumed alkaloid, large quantities of the specific plant material are
collected, dried, and defatted by petroleum ether extraction if seed or leaf is investigated. This process usually leaves polar alkaloidal material behind but
removes neutrals. The residue, in aqueous alcohol, is extracted with dilute acid and filtered, and the acidic solution is made basic. Crystallization can
occasionally be effected by adjustment of the pH. If such relatively simple purification fails, crude mixtures may be used or, more recendy, very
sophisticated separation techniques have been employed. Once alkaloidal material has been found, taxonomically related plant material is also examined.
Until separation techniques such as chromatography (28,29) and counter-current extraction had advanced sufficiently to be of widespread use, the
principal alkaloids were isolated from plant extracts and the minor constituents were either discarded or remained uninvestigated. With the advent of, first,
column, then preparative thin layer, and now high pressure liquid chromatography, even very low concentrations of materials of physiological significance
can be obtained in commercial quantities. The alkaloid leurocristine (vincristine, 22, R = CHO), one of the more than 90 alkaloids found in Catharanthus
roseus G. Don, from which it is isolated and then used in chemotherapy, occurs in concentrations of about 2 mg/100 kg of plant material.
(22)
Properties
Most alkaloids are basic and they are thus generally separated from accompanying neutrals and acids by dilute mineral acid extraction. The physical
Kirk-Othmer Encyclopedia of Chemical Technology (4th Edition)
533
ALKALOIDS
Voll
properties of most alkaloids, once purified, are similar. Thus they tend to be colorless, crystalline, with definite melting points, and chiral; only one
enantiomer is isolated. However, among nearly ten thousand individual compounds, these descriptions are overgeneralizations and some alkaloids are not
basic, some are liquid, some brightly colored, some achiral, and in a few cases both enantiomers have been isolated in equal amounts, ie, the material as
derived from the plant is racemic.
Organization
Eady investigators grouped alkaloids according to the plant families in which they are found, the structural types based on their carbon framework, or their
principal heterocyclic nuclei. However, as it became clear that the alkaloids, as secondary metabolites (30—32), were derived from compounds of primary
metabolism (eg, amino acids or carbohydrates), biogenetic hypotheses evolved to link the more elaborate skeletons of alkaloids with their simpler proposed
pregenitors (33). These hypotheses continue to serve as valuable organizational tools (7,34,35).
The building blocks of primary metabolism, from which biosynthetic studies have shown the large majority of alkaloids to be built, are few and
include the common amino acids ornithine (23), lysine (24), phenylalanine (25, R = H), tyrosine (25, R = OH, and tryptophan (26). Others are nicotinic acid
(27), anthranilic acid (28), and histidine (29), and the nonnitrogenous acetate-derived fragment mevalonic acid (30) (Table 2). Mevalonic acid (30) is the
pregenitor of isopentenyl pyrophosphate (31) and its isomer 3,3-dimethylallyl pyrophosphate (32), later referred to as the C5 fragment. A dimeric C5
fragment (the C10 fragment), ie, geranyl pyrophosphate (33), gives rise to the iridoid loganin [18524-94-2] (34), and the trimer famesyl pyrophosphate (35).
The C15 fragment is also considered the precursor to the C3Q steroid, ie, 2 x C15 = C30 (see Table 3 and Figure 1).
Table 2. Pregenitors of Alkaloids
Name Molecular formula CAS Registry Number Structure number Structure
ornithine C5H12N2O2 [7006-33-9] (23) H2N ' ~U H /CH2 ,>coo CH2 xc I I ^CH2 NH3 (23)
lysine XH14N2O2 [6899-06-5] (24) h2n ' /CH2 CH2 XCH2 XCH2 _C^-H H3N COO' + (24)
phenylalanine C9HuNO2 [63-91-2] (25)(R = H) H Noo )l JI I NH3 (25)
tyrosine c9huno3 [60-18^-] (25) (R = OH) OFT ^.СИг NjOO' )l । NH3 (25)
tryptophan [73-22-3] (26) Нузоо- CH2—c^ + -A NH3 "NH (26)
nicotinic acid c6h5no2 [59-67-6] (27) ^,COOH (27)
anthranilic acid c7h7no2 [118-92-3] (28)
(28)
Kirk-Othmer Encyclopedia of Chemical Technology (4th Edition)
534
ALKALOIDS
Voll
histidine ci i \ о [71-00-1] (29)
mevalonic acid О I I O [150-97-0] (30)
(29)
НО. _>CH3
CH2 CH2
,CH2 JC<
HO OH
(30)
Table 3. Pyrophosphate Biogenic Precursors*
Name CAS Registry Number Structure Molecular formula number
isopentenyl pyrophosphate [358-71-4] 3,3-dimethylallyl pyrophosphate [358-72-5] geranyl pyrophosphate [763-10-0] famesyl pyrophosphate [13058-04-3] (31) C5H9O7P2 (32) C5H9O7P2 (33) C10H17O7P2 (35) C!5H25O7P2
See Figure 1.
CH3
X..
CH2 CH2
_CH2
PPO
CH3
❖c.
CH CH3
_CH2
PPO
/СНз
CH2— c
/
CH2 CH /ОРР
XCH XCH2
X
H3C CH3
(31)
(32)
(33)
H
I
H3C. ^c.
C CH2 H
CH3 CH2 \
у ^CH2 H
CH3 CH2 c ^OPP
NX ЧН;
CH3
о о
II II
PPO = О —P—о—P— = P2O3e
O- O-
(35)
Fig. 1. Pyrophosphate biogenic precursors. See Table 3.
Ornithine-Derived Alkaloids. Ornithine (23) undergoes biological decarboxylation reductively to generate either putrescine [110-60-1] (36),
c4h12n2, or its biological equivalent, and subsequent oxidation and cyclization gives rise to the pyrroline [5724-81 -2]\ (37), C4H7N.
CH2
H3C XCH2
,CH2 nh2
h2n
(36)
Kirk-Othmer Encyclopedia of Chemical Technology (4th Edition)
535
ALKALOIDS
Voll
(37)
The details have been confirmed by suitable labeling (14C and 15N) and it is faidy certain that either (37) or something very similar to it is available to react
with either acetoacetic acid or its biological equivalent to generate the alkaloid hygrine (38) (Table 4). Hygrine is an oily, distillable base found, along with
cocaine (11), in the leaves of the Peruvian coca shrub (^ythrozylon truxilknce Rusby).
a b
Table 4. Alkaloids Derived from Ornithine ,
Name Molecular formula CAS Registry Number Structure number
cocaine C17H21NO4 [50-36-2] (11)
(R)-hygrine c8h15no [496^-9-1] (38)
atropine C1?H23NO3 [51-55-8] (41)
scopolamine C17H21NO4 [51-34-3] (42)
helio tridine CgH13NO2 [520-63-8] (43)
senecione C18H25NO5 [130-01-8] (5)
Structure
(11)
снЛСНз
CH3
(38)
(41)
(42)
(43)
Examples in this table exclude those from tobacco.
Kirk-Othmer Encyclopedia of Chemical Technology (4th Edition)
536
ALKALOIDS
Voll
See Refs. 36 and 37 for additional information.
If, instead of an acetoacetate equivalent, a malonyl derivative such as (39) were involved (37), appropriate condensation reactions would lead to the
tropane [280-05-7] skeleton (40), C?H13N.
COOH
I
.CH СНз
HOOC xc
(39)
H
N
(40)
The physiologically and commercially important alkaloids of this group of compounds, occurring widely in the Solanaceae and Convolvoulaceae as well as
the Erythroxylaceae, include not only cocaine (11) but also atropine (41) and scopolamine (42).
Atropine (41), isolated from the deadly nightshade (Atropa belladonna L.) is the racemic form, as isolated, of (—)-hyoscyamine [which is not isolated,
of course, from the same plant but is typically found in solanaceous plants such as henbane (Hyoscyamus nigerlD)]. Atropine is used to dilate the pupil of the
eye in ocular inflammations and is available both as a parasympatholytic agent for relaxation of the intestinal tract and to suppress secretions of the salivary,
gastric, and respiratory tracts. In conjunction with other agents it is used as part of an antidote mixture for organophosphorus poisons (see Chemicals in
war).
Scopolamine (42), an optically active, viscous liquid, also isolated from Solanaceae, eg, Datura metelD., decomposes on standing and is thus usually
both used and stored as its hydrobromide salt. The salt is employed as a sedative or, less commonly, as a prophylactic for motion sickness. It also has some
history of use in conjunction with narcotics as it appears to enhance their analgesic effects. Biogenetically, scopolamine is clearly an oxidation product of
atropine, or, more precisely, because it is optically active, of (—)-hyoscyamine.
Cocaine (11) had apparently been used by the natives of Peru prior to the European exploration of South America. Stories provided by early
explorers suggested that the leaves of, for example, Drythroxylon coca Lam. were chewed without apparent addiction by the indigenous peoples and with only
mild numbing of the lips and tongue in return for increased endurance. Indeed, the recognition of the anesthetic properties possessed by the leaves and the
(unwarranted) assumption that addiction was avoidable led to creation of plantations in Bolivia, Brazil, and Java to ensure a continued supply of this
valuable material for medicinal purposes. Although it appears that native populations continue the practice of leaf chewing, the purified base obtained by
simple extraction of the leaves has become a substance of abuse in the more civilized world. It is now recognized that the alkaloid (11) itself is too toxic to
be used as an anesthetic by injection.
Condensation of a pyrroline system (37) with a second equivalent of ornithine-derived precursor is presumably an alternative to condensation with
acetoacetate- or malonate-derived fragments. Indeed, early feeding experiments with, for example, Senecio istideus showed that two equivalents of ornithine
(23) could be accounted for in the structure of the necine, ie, the l-azabicyclo[3.3.1]heptane or pyrrolizidine portion of the alkaloids, eg, helio tridine (43),
containing that ring system (38). Generally, the pyrrolizidine alkaloids are found esterified with low molecular weight carboxylic acids (or dicarboxylic acids,
as in senecionine, (5)) at either or both of the hydroxyl groups of the necine. The acids themselves, called necic acids, are generally not found elsewhere in
alkaloids, and, although for some time they were believed to arise from acetate or mevalonate, it is now clear that, at least for the few that have been
carefully examined, they are themselves derived from simple amino acids.
In addition to the alkaloids in Senecio spp. (including asters and ragworts) commented on earlier, the adaptive use of which by butterflies was noted,
members of this widely spread group of compounds are found in different genera (D.eliotropiumy Drachelanthus^ and Trichodesmd) within cosmopolitan families
(eg, Boraginaceae and Leguminoseae). Most of these alkaloids are toxic, affecting the liver (an organ lacking in moths, butterflies, etc) and their ingestion is
manifested in animals with the onset of symptoms associated with names such as horse staggers or walking disease.
Lysine-Derived Alkaloids. Just as putrescine (36) derived from ornithine (23) is considered the pregenitor of the nucleus found in
pyrrohdine-containing alkaloids, so cadaverine [462-94-2] (44), C5H14N2, derived from lysine (24) is the idealized pregenitor of the 1-dehydropiperidine
[28299-36-7] nucleus (45), GH X, found in the pomegranate, Sedumy Dobelia^ Dupiny and Dycopodlum alkaloids (39).
XCH2
CH2 xch2
CH2 CH2
h2n h2n
(44)
(45)
As was the case for the alkaloids derived from ornithine (23), if either (45), its biological equivalent, or something closely resembling it reacts with
acetoacetate or its biological equivalent, the pomegranate alkaloid pelletierine (46) can arise; note the resemblence to hygrine (38). Simple reduction of the
carbonyl, with stereospecificity common to enzyme-mediated reactions, can be accommodated and the Sedum alkaloid sedridine (47) results; cyclization and
N-methylation produce pseudopelletierine (48) (Table 5). There are somewhat more than 600 annual, biennial, or perennial succulents belonging to the
Sedum genus of the family Crassulaceae, many of which are characterized by the ability to grow where little else can.
a b
Table 5. Alkaloids Derived from Lysine ,
Kirk-Othmer Encyclopedia of Chemical Technology (4th Edition)
537
ALKALOIDS
Voll
Name
pelletienne
Molecular
formula
c8h15no
CAS Registry
Number
[4396-01-4]
Structure number
Structure
sedridine CgH17NO [501-83-7] (47)
pseudopelletierine c9h15no [552-70-5] (48)
lobeline C22H27NO2 [90-69-7] (49)
(+)-lupanine C15H24N2° [550-90-3] (50) (R = O)
(-)-sparteine [90-39-1] (50) (R = H,H)
lycopodine c16h25no [466-61-5] (51)
annotinine C16H21NO3 [559^-9-9] (52)
Examples in this table exclude those from tobacco.
See references 36 and 37 for additional information.
The pomegranate alkaloids, pelletienne (46) and pseudopelletierine (48) as well as minor accompanying bases, have a long history as salts of tannic
acid as an anthelmintic mixture for intestinal pinworms (see Antiparasitic agents, anthelmintics). The alkaloids themselves (as the tannates) are obtained
from pomegranate tree (Punicagranatum L.) root bark and are among the few bases named after an individual (P. J. Pelletier) rather than a plant.
Kirk-Othmer Encyclopedia of Chemical Technology (4th Edition)
538
ALKALOIDS
Voll
Isolates from Indian tobacco (Lobelia injlata L.), as a crude mixture of bases, have been recognized as expectorants. The same (or similar) fractions
were also used both in the treatment of asthma and as emetics. The principal alkaloid in L. Injlata is lobeline (49), an optically active tertiary amine which,
unusual among alkaloids, is reported to readily undergo mutarotation, a process normally associated with sugars. Interestingly, it appears that the
aryl-bearing side chains in (49) are derived from phenylalanine (25, R = H) (40).
Feeding experiments utilizing 13C-, 15N-, and 2H-labeled cadaverine (44) and lysine (24) in Lupinus augustjolius, a source of the lupine alkaloids
(—)-sparteine (50, R = H,H) and (+)-lupanine (50, R = O), have been reported which lend dramatic credence to the entire biosynthetic sequence for these
and the related compounds discussed above (41). That is, the derivation of these bases is in concert with the expected cyclization from the favored all-trans
stereoisomer of the trimer expected on self-condensation of the 1-dehydropiperidine (45).
The spores of Lycopodium clavatum L. (a club moss), sometimes called vegetable sulfur, have been used medicinally as an absorbent dusting powder;
other uses as diverse as additives to gunpowder and suppository coatings have also been recorded. Although for some years the alkaloids common to a
number of Lycopodium spp., lycopodine (51) and annotinine (52), were thought to have arisen from suitably folded polyketide chains, it is now accepted that
two pelletierine (46) or pelletierine-like fragments would suffice. The details of feeding experiments with pelletierine and its precursors appear to indicate,
however, that only one pelletierine and, separately, a second acetoacetate and second 1-dehydropiperidine (45), which could otherwise be combined to a
second pelletierine, are used to generate both of these alkaloids.
Tobacco Alkaloids. The relatively small number of alkaloids derived from nicotinic acid (27) (the tobacco alkaloids) are obtained from plants
of significant commercial value and have been extensively studied. They are distinguished from the bases derived from ornithine (23) and, in particular,
lysine (24), since the six-membered aromatic substituted pyridine nucleus common to these bases apparendy is not derived from (24).
These alkaloids include the substituted pyridone ricinine [524-40-3] (53), CgHgN2O2, which is easily isolated in high yield as the only alkaloid from
the castor bean (Ridnus communis L.). The castor bean is also the source of castor oil (qv), which is obtained by pressing the castor bean and, rich in fatty
acids, has served as a gende cathartic.
(55)
(56)
The highly toxic alkaloid (—)-nicotine (21) and related tobacco bases including such materials as (—)-anabasine [494-52-0] (54), C1QH14N2, are
obtained from commercially grown tobacco plants (eg, Nlcotlana tabacum L). Various tobaccos have differing amounts of these and other bases, as well as
different flavoring constituents, some of which are apparently habituating to some individuals. Currently, the assay of the (—)-nicotine (21) content of
tobacco, the annual wodd production of which is in excess of three million tons, is desirable and in some countries mandatory, although the toxicity of the
unassayed plant bases may be as high as or higher than that of (—)-nicotine. Interestingly, there appears to be some evidence that cultivation of tobacco
increases the alkaloid content, from which it can be argued that increased alkaloid content has ensured survival of a particular cultivar.
The pyrrolidine ring of nicotine is derived from ornithine (23), whereas the piperidine ring of anabasine (54) is derived from lysine (24) (42). Also,
the carboxylic acid functionality of nicotinic acid (27) is lost (along with the C-6 proton) during the biosynthesis in the roots of the tobacco plants from
which the bases are subsequendy translocated to the leaves. Curiously, whereas nomicotine [494-97-3] (55), C9H12N2, frequendy accompanies nicotine, the
former is apparendy derived by demethylation of the latter rather than the latter undergoing methylation to the former. This is in contrast to what usually
seems to occur; that is, methylation at nitrogen and oxygen is usually a late-stage process in alkaloid biosynthesis.
Finally, millions of people in the Far East are apparendy addicted to chewing ground betel nut, the fruit of the palm tree Areca catechu L, which they
mix with lime and wrap in betel leaf (Piper betle L.) for consumption. They are said to experience a feeling of well-being. Among the alkaloids found in betel
nut is arecoline [63-75-2] (56), CgH13NO2, an optically inactive, steam-volatile base which is used commercially as a vermifuge in dogs and is also a potent
muscarinic agent. It is reasonable to assume (evidence lacking) that arecoline may be derived from nicotinic acid (27) by a (rare) reductive mechanism.
Phenylalanine- and Tyrosine-Derived Alkaloids. Carbohydrate metabolism leads via a seven-carbon sugar, ie, a heptulose, derivative to
shikimic acid [138-59-0] (57), C7H10O5, which leads in turn to prephenic acid [126-49-8] (58), C10H10O6 (43).
Kirk-Othmer Encyclopedia of Chemical Technology (4th Edition)
539
ALKALOIDS
Voll
COOH
OH
(57)
О
II
C—COOH
OH
(58)
This is the branch-point differentiating phenylalanine (25, R = H) from tyrosine (25, R = OH). Both phenylalanine and tyrosine contain an aryl ring, a
three-carbon side chain (a C6—C3 fragment), and a nitrogen. Decarboxylation yields a two-carbon side chain (a C6—C2 fragment), eg, 2-phenethylamine
(59, R = H) from phenylalanine and tyramine (59, R = OH) from tyrosine, although it is not certain that in all cases decarboxylation must precede use in
alkaloid construction.
(59)
After the branching point at prephenic acid (58), phenylalanine and tyrosine as well as the amines (59) are not interconvertible. Finally, deamination and
oxidative cleavage of the presumed (and in some circumstances isolated) resulting alkenes yields the equivalent of benzaldehyde (60, R = H), C-HO, and
y-hydroxybenzaldehyde (60, R = OH), ie, aromatics with one aliphatic carbon attached C6—C1 fragments).
All of these pieces are used, in conjunction with some of the earlier fragments discussed, as building blocks for alkaloids containing an aromatic ring.
In the cases discussed here, a link to either phenylalanine or tyrosine or, in some cases with two aromatic rings to both, has been estabEshed by suitable
feeding experiments on growing plants.
There is a relatively large number of alkaloids which maybe considered as simple phenethylamine [64-04-0] (59, R = H), CgH-^N, or tyramine
[51-67-2] (59, R = OH), CgHnNO, derivatives. These include mescaline (61) from the small wooly peyotyl cactus Lophophora williamsii (Lemaire) Coult.y
anhalamine (62) and lophocerine (63) from other Cactaceae, and the important antamebic alkaloids (—)-protoemetine (64), (—)-ipecoside (65), and
(—)-emetine (66) from the South American straggling bush Cephaelis ipecacuanha (Brotero) Rich. All of these bases appear to be derived from tyrosine (25,
R = OH) and not from phenylalanine (25, R = H) (Table 6).
Table 6. Alkaloids Derived from Tyrosine
Name Molecular formula CAS Registry Number Structure number Structure
mescaline CnH17NO3 [54-04-6] (61) CH3O. /CH2 JOI fH2 CHsO^Np nh2 OCH3 (61)
anhalamine WO3 [643-60-7] (62) jCX ^N. ch3ct у OH (62)
lophocerine
C15H23NO2 [19485-63-3] (63)
Kirk-Othmer Encyclopedia of Chemical Technology (4th Edition)
540
ALKALOIDS
Voll
(63)
(—)-protoemetine c19h27no3 [549-91-7] (64) CH3°\zzVz\
СНзО-Х>Г >H /СНз TVCH2 H ,CH2 X II 0 (64)
(—)-ipecoside C27H35NO12 [15401-60-2] (65) T )T 1 _N CH3 но , H Ah >ch=ch2 oX X/O O-Glu 1 OCH3 (65)
(—)-emetine ^29^40^2<~-)4 [483-18-1] (66)
Crude preparations of mescaline (61) from peyote were first reported by the Spanish as they learned of its use from the natives of Mexico during the
Spanish invasion of that country in the sixteenth century. The colorful history (44) of mescaline has drawn attention to its use as a hallucinogen and even
today it is in use among natives of North and South America. Although in connection with drug abuse complaints, mescaline is considered dangerous, it
has been reported (45) that it is not a narcotic nor is it habituating. It was also suggested that its sacramental use in the Native American Church of the
United States be permitted since it appears to provoke only visual hallucination while the subject retains clear consciousness and awareness.
Both of the alkaloids anhalamine (62) from Lophophora wllllamsn and lophocerine (63) from Lophocereus schotti were isolated (after the properties of
purified mescaline had been noted) in the search for materials of similar behavior. Interestingly, lophocerine, isolated as its methyl ether, after diazomethane
treatment of the alkali-soluble fraction of total plant extract, is racemic. It is not known if the alkaloid in the plant is also racemic or if the isolation
procedure causes racemization.
The iridoid loganin (34), C17H26O10, has been shown to serve as a C10 pregenitor (see Table 3) and, here, C10 fragments are apparent in the alkaloids
(—)-protoemetine (64), (—)-ipecoside (65), and (—)-emetine (66). It has been shown that loganin is specifically incorporated into each of these bases in
Cephaells Ipecacuanha (Brot. A. Rich) and that they are apparendy formed sequentially, that is, formation of (—)-ipecoside (65) precedes that of
(—)-protoemetine (64) and (—)-emetine (66). The crude dried rhizome and roots from C. Ipecacuanha which is sometimes known as Rio or Brazilian ipecac,
contains all three, as well as other related bases, and has a long history based on native Indian reports of use as an emetic. Purification of the crude extract
yields the individual bases, and, because it is relatively more stable and is also present in reasonable quantity, led to the use of emetine (66) as its
hydrochloride salt in place of the crude plant extract. This use of the pure base rather than crude plant extract has allowed greater certainty in dosage, which
is important because, although emetine is quite effective in combating acute amebic hepatitis and is claimed to have some effect against the present scourge
of African schistosomiasis, its administration may be accompanied by a rapid drop in blood pressure, irregular heart function, and paralysis of skeletal
muscle. The danger of inappropriately large doses, certain to cure the ailment but with the possible death of the patient, is clearly greater with crude extract
than with purified alkaloid. Long term, even appropriate, dosage may be accompanied by dermatitis, diarrhea, nausea, etc.
There are only two groups of alkaloids that appear to be derived from tyrosine (25, R = OH) utilized as a C6—C2 fragment and a C6—C1 unit
which comes from phenylalanine (25, R = H). The first is that small group found only in the Orchidaceae, exemplified by cryptostyline I [22324-79-4] (67,
from Cryptostylis julva Schltrp CWH21NO4.
Kirk-Othmer Encyclopedia of Chemical Technology (4th Edition)
541
ALKALOIDS
Voll
(67)
The second, a very large group of compounds, is the alkaloids of the Amaryllidaceae. This cosmopolitan family of related compounds includes over one
hundred isolated and characterized members of known structure. In every case examined the C6—C2 unit is derived from tyrosine and the C6—C1 unit
comes from phenylalanine, never from tyrosine. For this large number of compounds it is now believed (46) that a single pregenitor derived from the
original coupling of the C6—C2 unit and a C6—C1 unit, ie, norbelladine (68, R = H) accounts for all of the compounds isolated. This precursor (68,
R = H) undergoes a variety of enzyme-catalyzed free-radical intramolecular cyclization reactions, followed by late-stage oxidations, eliminations,
rearrangements, and O- and N-alkylations. Working from this generalization as an organizing principle, the majority of known Amaryllidaceae alkaloids can
be divided into eight structural classes (47).
These eight classes and alkaloids typical of them are given in Table 7 and Figure 2. The simple base ismine (75), isolated from, for example, Sprekelia
formosissima, along with numerous other alkaloids, has long been considered a degradation product of other bases and is presumably generated in that way
from a suitable member of the pyrrol о [^jphenanthridine or [5,103]ethanophenanthridine group.
(68) (69)
(70)
Fig. 2. Examples of Amaryllidaceae alkaloids. See Table 7.
Table 7. Structural Classes of Amaryllidaceae Alkaloidsa,b
Class Example Molecular formula CAS Registry Number Structureb number
N-benzyl-N- (2-phenylethyl)- amine derivatives belladine C19H25NO3 [501-06^-] (68)c
pyrrolo [6^]phenanthridines lycorine c16h17no4 [476-28-8] (69)
[2]-benzopyrano[3,5^|indole alkaloids homolycorine C18H21NO4 [477-20-3] (70)
dibenzofuran bases galanthamine C1?H21NO3 [357-70-0] (71)
(+)-crinine C H AO; 16 1 / 3 [510-69-0] (72)
[5,103]ethanophenanthridine alkaloids (—)-crinine C16H1?NO3 [510-67-8] (72)
[2]-benzopyrano[3,4f]indole alkaloids tazettine C18H21NO5 [507-79-9] (73)
[5,ll]methanomorphanthri-dine bases man thine C18H21NO4 [606-51-9] (74)
f ismine c15h15no3 [1805-78-3] (75)
A large group derived from tyrosine as a C6—C2 fragment and phenylalanine as a C6—C1 fragment.
See Figure 2.
CR = CH3.
Can rationally be derived from [5,10£]ethanophenanthridine bases.
Can also be derived from suitably substituted [5,10£]ethanophenanthridine bases.
Derived from either a pyrrolo[6^]phenanthridine or a [5,10£]ethanophenanthridine.
Lycorine (69) was recognized as a potent emetic and a moderately toxic base from the time of its initial isolation from Narcissus pseudonarcissus L. (in
about 1877) (48). Since that time its isolation from many other Amaryllidaceae, for example, Lpcoris radiate Herb., has served to establish it as the most
cosmopolitan alkaloid of the family. Typically, as much as 1% of the dry weight of daffodil bulbs may consist of lycorine (69), which has been reported to
Kirk-Othmer Encyclopedia of Chemical Technology (4th Edition)
542
ALKALOIDS
Voll
crystallize as colorless prisms directly from aqueous acid extract of crude plant material after basification. A high yield synthesis of the racemic base has
been reported (49). Galanthamine (71) was originally isolated from the Caucasian snowdrop, Galanthus woronowii Vel, and as its hydrobromide salt has been
proposed for use in regeneration of sciatic nerve. In addition to demonstration of powerful cholinergic activity (50), it is reported to have analgesic activity
comparable to morphine (2, R = H) (51).
Tazettine (73) has gained notoriety since, subsequent to its isolation from Sprekellaformoslsslma or Nareisus ta^etta and proof that it was generated in
vivo from haemanthamine [466-75-1] (76), C17H19NO4, in accord with biosynthetic dogma (52), more careful work (53) in which the strongly basic
conditions usually employed in alkaloid isolation were avoided showed that it is an artifact of isolation and that it is readily generated from its precursors
during the work-up of the plant material. Man thine (74) occurs, along with several homologues, in South African PLaemanthus species. Manthine is of interest
to the chemical community because it appears that, like tazettine (73), it can be easily generated In vitro from a derivative of haemanthamine (76) (54).
Just as norbelladine (68, R = H) can be considered as the precursor of C6—C2 + C6—C1 alkaloids, nodaudanosoline (77, R = H) seems to be the
pregenitor of the vast number of C6—C2 + C6—C2 alkaloids (Table 8). Laudanosine (77, R = CH3), isolated from Papaver somniferum L. [along with
narcotine (1, noscopine), morphine (2, R = H), and numerous other alkaloids], has been shown to have tyrosine (25, R = OH) as a specific precursor.
Labeling experiments with, for example, [2-14C]tyrosine show that two equivalents of this amino acid are incorporated specifically but not to the same
extent, implying that some partitioning has occurred prior to alkaloid formation. Papaverine (78), isolated in much greater quantity from P. somniferum L.
than its tetrahydro derivative laudanosine (77, R = CH3), has a long history of use as an antispasmodic for smooth muscle. It is used as its hydrochloride
salt, a more stable material than the free base. It is said to be nonhabit-forming, although it is classified as a narcotic by the U.S. Federal Narcotic Laws.
Large doses may produce drowsiness, constipation, and increased excitability; if it is given orally, gastric distress may occur.
Table 8. Alkaloids from Norlaudanosoline as Pregenitora
Name Molecular CAS Registry Structure Structure
formula Number number
nodaudano s oline c16h17no4 [4747-99-3] (77) (R = H)
laudanosoline C21H27NO4 [2688-77-9] (77) (R = CH3)
papaverine C20H21NO4 [58-74-2] (78)
oxyacanthine C37H40N2O [548^-0-3] (79) b
tetrandrine ^38^42^20 [518-34-3] (80) b
is о thebaine C19H21NO3 [568-21-8] (81)
orientaline C19H23NO4 [270693-74-3] (82)
(78)
(81)
Kirk-Othmer Encyclopedia of Chemical Technology (4th Edition)
543
ALKALOIDS
Voll
CH3OX
HO'" Г'Н 'СН3
CH3OX Qfc"2
HO^ (82)
orientalinone C19H21NO4 [2689-17-0] (83) CH3O,
HO' 'СНз
CH3O— \
d (83)
thebaine c19h21no3 [115-37-7] (84) CH3O. Лн
H"/ 'Ж' J--N- -СНз
0
CH3O^ (84)
morphine c17h19no3 [57-27-2] (2) (R = H) b
codeine ClgH21NO3 [76-57-3] (2) (R = CH3) b
(-)-reticuline C19H23NO2 [485-19-8] (85) CH3OX
HOX Г'Н 'СН3
HOX Qfc"2
СНзО^ (85)
(+)-N-norprotosinomenine C18H21NO4 [26153-70-8] (86) нох
CH3O'" Г'Н 'СН3
HOX Qfc"2
СНзО^ (86)
erythraline C18H19NO3 [466-77-3] (87)
CH3O.^
€
(87)
argemonine C21H25NO4 [6901-16-2] (88) С
berberine C2t)H18N o4 [2086-83-1] (89) С
protopine C2qH19NO5 [130-86-9] (90) С
chelidonine c20h19no5 [476-32-4] (91) С
rhoeadine C21H21NO6 [2718-25-4] (92) С
harringtonine C28H37NO9 [26833-85-2] (93) С
This group has tyrosine or phenylalanine joined as C6- —C2 fragments.
D T ln text.
See Figure 3.
Phenolic intermolecular coupling (46) of two laudanosoline (77, R = H) fragments, which may be preceded or followed by partial O- or
N-methylation, gives rise to the dimeric or bisbenzylisoquinoline alkaloids such as oxyacanthine (79), obtained along with related materials from the roots
of Berbens vulgaris L.
Kirk-Othmer Encyclopedia of Chemical Technology (4th Edition)
544
ALKALOIDS
Voll
Many other bisbenzylisoquinoline alkaloids, such as tetrandrine (80), from Cycleapeltata Hook., are also known. Compound (80), for example, although it
causes hypotension and hepatotoxicity in mammals, in other tests, possessed enough anticancer activity to be considered for preclinical evaluation (55). The
arrow poison tubocurare prepared from Chondrendendron spp. also contains the bisbenzylisoquinoline alkaloid tubocurarine (9).
In an early attempt to understand the genesis of alkaloids from amino acids it was postulated (56) that intramolecular phenolic coupling should lead
from benzylisoquinoline bases such as laudanosine (77, R = CH3), before it was completely methylated, to aporphine bases such as isothebaine (81). For
example, between a benzylisoquinoline derived from laudanosoline (77, R = H), such as orientaline (82), and an aporphine alkaloid such as isothebaine (81),
there should be a proaporphine alkaloid such as orientalinone (83) (56). The isolation of 83 lent credence to the hypothesis. Indeed, the fragile nature of 83
(it readily undergoes the dienone—phenol rearrangement on acid treatment) required unusual skill in obtaining it from total plant extract.
Isothebaine (81), which may be derived from orientalinone (83) in the laboratory, is isolated from the roots of Papaver orientals after the period of
active growth of the aerial parts and the production of thebaine (84) has ceased. The viscous milky exudate of the unripe seed pods of P. orientate as well as
the opium poppy Papaver somniferum P. is opium. Opium cultivation appears to have spread from Asia Minor to China (via India) and it has been noted that
the smoking of opium was common in China and elsewhere in the Far East when trade began in earnest as the eighteenth century closed. Active cultivation
was encouraged by the revenues generated from addicts. Today, in the United States, although narcotine (1, noscopine) has some commercial value as a
nonaddictive antitussive which occasionally leads to drowsiness, it is morphine (2, R = H), codeine (2, R = CH3), and thebaine (84), the latter being
converted to both of the former, which are of major commercial value.
The importance of morphine (2, R = H) as an analgesic, despite danger of addiction and side effects that include depression of the central nervous
system, slowing of respiration, nausea, and constipation, cannot be underestimated, and significant efforts have been expended to improve isolation
techniques from crude dried opium extract. Depending on its source, the morphine content of poppy straw or dried exudate may be as high as about 20%.
Although the details of current manufacturing processes are closely held secrets, early work (57) has probably not been modified extensively. Usually the
crude opium is extracted with water and filtered, and the aqueous extract concentrated, mixed with ethanol, and made strongly basic with ammonium
hydroxide. Morphine usually precipitates, while the other bases remain in solution, and is further purified by crystallization as its sulfate.
Codeine (2, R = CH3) occurs in the opium poppy along with morphine (2, R = H) but usually in much lower concentration. Because it is less toxic
than morphine and because its side effects (including depression, etc) are less marked, it has found widespread use in the treatment of minor pain and
much of the morphine found in crude opium is converted to codeine. The commercial conversion of morphine to codeine makes use of a variety of
methylating agents, among which the most common are trimethylphenylammonium salts. In excess of two hundred tons of codeine are consumed
annually from production facilities scattered around the world.
The first synthesis of morphine, and therefore also codeine, was completed in 1956 (58). Although an additional twelve or so syntheses have been
reported since then, isolation of morphine remains more important than any synthetic process. However, synthetic endeavors continue to demonstrate new
synthetic tools and capabilities and to conduct the search for modified analogues that retain the analgesic properties of morphine but are nonaddicting.
Whereas the particular methylated derivative of laudanasoline (77, R = H) called (—)-reticuline (85) (59) gives rise to thebaine (84), codeine (2,
R = CH3), and morphine (2, R = H), a different derivative of 77 (R = H), ie, (+)-IV-norprotosinomenine (86), serves as the pregenitor of erythraline (87),
one of the bases found in Prythrina cristagalli (60). The alkaloids found in all plant parts of Prythrina have been intensively studied because many of them
produce smooth muscle paralysis, much like tubocurarine (9).
Additional oxidative coupling processes among the various methylated derivatives of laudanosoline yield many other families of bases, including the
pavine argemonine (88) PoiaiH.rgemone mexicana P.; berberine (89) from Hydrastis canadensis P. which, despite its toxicity, has been used as an antimalarial;
protopine (90) and chelidonine (91) from Chelidonium majus P.; rhoeadine (92); and the cephalotaxus ester harringtonine (93) from Japanese plum yews
(Cephalotaxus spp.\ which is a compound of some significance because it possesses potent antileukemic activity (see Fig. 3).
Kirk-Othmer Encyclopedia of Chemical Technology (4th Edition)
545
ALKALOIDS
Voll
Fig. 3. Oxidative coupling products of methylated derivatives of laudanosoline (77, R = H). See Table 8.
The last group of compounds from tyrosine and phenylalanine is the group derived from utilization of tyrosine (25, R = OH) as the C6—C2
fragment and phenylalanine (25, R = H) as a C6—C3 fragment (Table 9). They include the 1-phenethyltetrahydroisoquinoline autumnaline (94) and the
homoproaporphine kreysiginone (95), which are typical of their kind and are both isolated from Colchlcum comlgerum (Schwelnf) and the toxic principle of the
autumn crocus {Colchlcum autumnale}., colchicine (4). In crude form, extracts of Colchlcum spp. were reportedly known to Dioscorides, a contemporary of
Pliny, who served Nero as a physician and was the first to establish systematically the medicinal value of some 600 plants. The use of Colchlcum spp. extracts
in the treatment of gout appears to have begun in the sixteenth century, although it was not until much later that colchicine (4) was actually isolated (about
1884). Recent interest in colchicine stems from its ability to bring cell division to an abrupt halt at a particular stage.
Table 9. Alkaloids Derived from Tyrosine as a C6-C2 Fragment and Phenylalanine as a C6-C3 Fragment
Name Molecular formula CAS Registry Structure number Structure
Number
autumnaline C21H27NO5 [23068-65-7] (94)
kreysiginone C2qH23N O4 [17441-87-1] (95)
colchicine C^H^NOj [64-86-8] (4) a
betanidine [2181-76-2] (96) (Rj = H,
(94)
Kirk-Othmer Encyclopedia of Chemical Technology (4th Edition)
546
ALKALOIDS
Voll
R2 = COOH)
(96)
isobetanidine [4934-32-1] (96) (R.j = COOH, R2 =H)
betalamic acid c9h9no5 [18766-66-0] (97)
(96)
ZCHO
CH
HOOC
H
(97)
a T
ln text.
The structures of the brightly colored (red-violet and yellow) alkaloids found in the order Centrospermae (cacti, red beet, etc) remained unknown until
the 1960s. In part this was doubdessly due to the fact that these pigments, called betacyanins or betaxanthins, are relatively unstable and they are water
soluble zwitterions. Invariably, in these plants they are found as acetals or ketals of sugars and one of two aglycone fragments called betanidine (96,
Rj = H, R2 = COOH) and isobetanidine (96, R2 = H, R: = COOH). Furthermore, it would appear that all betacyanins or betaxanthins may simply be
imine derivatives (with the appropriate amino acid) of betalamic acid (97).
Tryptophan-Derived Alkaloids. There are a few simple indole derivatives which are arguably derived, or have actually been shown to be
derived, from tryptophan (Table 10) (61). Serotonin (5-hydroxytryptamine [50-67-9]\ ([)^\ R = OH) was first isolated (62) as a vasoconstrictor substance
from beef serum and shown to be derived from tryptophan. It has also been isolated from bananas and the stinging netde but its genesis in plants has not
yet been estabEshed. NA-Dimethylserotonin [487-93-4] (bufotenine (19)) has been found in such widely diverse sources as the shrub Piptadeniaperegrina^
the seeds of which are said to be the source of a ceremonial narcotic snuff; the parotid gland of the toad (Bufo vulgaris Kauri); certain fungi (eg, Amantla
mappa Batsch.); and human urine. The only slightly more complicated base harmine (99) is found widely distributed in the Legumlnoseae and Bubiaceae^ extracts
of which were at one time used therapeutically against tremors in Parkinson's disease. The seeds of the African me, Peganum harmala L., which are rich in
harmine and related alkaloids, have also been used as a tapeworm remedy. Harmine has been shown to be derived from tryptamine (98, R = H) by 14C- and
15N-labeling experiments (63).
Table 10. Alkaloids from Tryptophan
Name Molecular formula CAS Registry Number Structure number Structure
serotonin C10H12N2O [50-67-9] (98) (R = OH) OH \. H2C—CH2 XN 1 H (98)
bufotenine C12H16N2O [487-93^-] (19) a
harmine C13H12N2O [442-51-3] (99)
Kirk-Othmer Encyclopedia of Chemical Technology (4th Edition)
547
ALKALOIDS
Voll
agroclavine C16HlgN2 548-42-3 (18)
lysergic acid
C16H16N2O2 [82-58-6] (100) (R = OH)
lysergic acid diethylamide
C20H25N3O [50-37-3] (100) (R = N(CH2CH3)2
(100)
(100)
ergonovine
C19H23N3O2 [60-79-7] (100) (R = NHCHCH2OH)
(100)
ajmalicine C21H24N2°3 [483-04-5] (103) b
yohimbine C21H26N2O3 [146^-8-5] (Ю4) b
reserpine [50-55-5] (Ю5) b
ajmaline [4360-12-7] (Ю6) b
catharanthine C21H24N2°2 [2468-21-5] (107) b
tabersonine C21H24N2°2 [4429-63-4] (108) b
vincamine C21H26N2O3 [1617-90-9] (109) b
strychnine C21H22N2O2 [57-24-9] (13) (R = H) C
quinine (^20^24^2<~-)2 [130-95-0] (17) (R = OCH3) c
cinchonidine C19H22N2° [118-10-5] (17) (R = H) c
leurocristine (^46^56^4<--)l [57-22-7] (22) (R = CHO) a
0
vincaleukoblastine (^46^58^4<--)9 [865-21-4] (22) (R = CH3) a
elliptic in e c17h14n2 [519-23-3] (112) (Rj = CH3,R2 = H)
oliavacine
c17h14n2
[484^-9-1]
(112) (Rj = H, R2 = CH3)
Kirk-Othmer Encyclopedia of Chemical Technology (4th Edition)
548
ALKALOIDS
Voll
calycanthine
C22H26N4 [595-05-1] (113)
a T
ln text.
See Fig. 4.
See Table 1.
The C6 building block, mevalonic acid (30), has been shown again and again to lose CO2 and then serve as the pregenitor of C5, C10, C15, C20, and
C30 systems via the isomeric pair 3,3-dimethylallyl pyrophosphate (32)-isopentenyl pyrophosphate (31) (Table 3). This explains the genesis of a variety of
bases containing the pattern defined by the five-carbon branched chain common to them and to the derivatives of mevalonic acid. Included among these
are that small group of alkaloids which correspond to a joining of a tryptophan (26) and a C5 unit to produce bases such as the potent uterine stimulant
agroclavine (18) and its relatives, among which are the peptide amides of lysergic acid (100, R = OH).
The pistil of rye and certain other grasses may be infected by the parasitic fungus Clavlcepspurpurea Fries. Unless the infected grain is sieved, the
fungus passes into the flour, and bread made from such contaminated flour apparently retains activity from some of the alkaloids elaborated by and
present in the fungus. Thus ingestion of the contaminated flour results in the disease called ergotism (St. Anthony's Fire). Convulsive ergotism causes
violent muscle spasms which bend the sufferer into otherwise unattainable positions and frequently leaves physical and mental scars; outbreaks of the
disease have been recorded into the twentieth century (21). Agroclavine (18) and derivatives of lysergic acid (100, R = OH) are considered responsible.
Nonetheless, extracts of C. purpurea have long been used medicinally since they effect smooth muscle contraction and, even today, compounds related to
lysergic acid and agroclavine are used for the same purpose. In the early 1940s it was discovered that the diethylamide of lysergic acid (100,
R = N(CH2CH3 )2) (LSD-25, as the tartrate salt) could be absorbed through the skin with resulting inebriation. In a bold experiment, it was then
demonstrated that oral ingestion resulted in symptoms characteristic of schizophrenia which, although temporary, were quite dramatic (64).
There are currently two medicinally valuable alkaloids of commercial import obtained from ergot. Commercial production involves generation
parasitically on rye in the field or production in culture because a commercially useful synthesis is unavailable. The common technique today (65) is to grow
the fungus in submerged culture. Clavlcepspaspall (Stevens and Hall) is said to be more productive than C. purpurea (Fries). In this way, ergotamine (100,
R =101) and ergonovine (100, R = NHCH(CH3)CH2OH) are produced. Ergotamine is obtained from crude extract by formation of an aluminum complex
which can then be defatted.
(101)
Destruction of the aluminum complex with ammonia then permits hydrocarbon extraction of the alkaloid. The alkaloid is subsequently both isolated and
used as its tartrate salt. This nonnarcotic drug, for which tolerance may develop, is frequently used orally with caffeine (16) for treatment of migraine; it acts
to constrict cerebral blood vessels, thus reducing blood flow to the brain.
Ergonovine (100, R = NHCH(CH3)CH2OH) was found to yield lysergic acid (100, R = OH) and (+)-2-aminopropanol on alkaline hydrolysis during
the early analysis of its structure (66) and these two components can be recombined to regenerate the alkaloid. Salts of ergonovine with, for example, make
acid are apparently the drugs of choice in the control and treatment of postpartum hemorrhage.
Loganin (34), the iridoid derived from the dimer (33) of the isomeric pair of C5 isoprenoid units, isopentenyl pyrophosphate (31) and
3,3-dimethylallyl pyrophosphate (32) (Table 3), has been recognized for some years (67) as the C9—C10 unit which, along with tryptophan (26), makes up
the huge group of bases, nearly one thousand well characterized compounds, found in the Corynanthe-Strychnos^ Cinchona., Ibogay Aspidosperma., and Ebuma.
Loganin is known to undergo oxidative cleavage to secologanin [19351 -63-4] (102),
(Ю2)
and this fragment, combined with what appears to be tryptamine [61-54-1] (98, R = H), C1QH12N2, or its biological equivalent, leads to compounds whose
permuted structures are often novel and quite complicated. Numerous single examples of rearranged, oxidized, and convoluted structures abound, but the
subdivision into the families given above is convenient for description of the majority of structural types of bases (68).
Thus in the Corynanthe-Strychnos are found bases such as ajmalicine (103), yohimbine (104), reserpine (105), ajmaline (106), and strychnine (13); in the
Cinchona^ quinine (17, R = OCH3) and cinchonidine (17, R = H); in the Ibogay catharanthine (107); in the A.spidospermay tabersonine (108); and in the Ebumay
vincamine (109).
Kirk-Othmer Encyclopedia of Chemical Technology (4th Edition)
549
ALKALOIDS
Voll
Fig. 4. Alkaloids from secologanin (102) and tryptamine (98, R = H). (See Table 10).
Ajmalicine (103) has been isolated (frequendy as the weakest base present) numerous times from a variety of sources, eg, from the bark of Coynanthe
yohlmbe K. Sebum. (Rubiaceae), from the roots of Bauwolfia serpentina (L.) Benth. (Apocynaceae), and from many other species of the genus Bauwolfia, and it is
also found in plants of the genus Catharanthus (Apocynaceae). It is included here to demonstrate the pattern in secologanin (102)—tryptamine (98, R = H)
coupling, the subsequent elaboration of which will give rise to the other bases to be considered. Thus ajmalicine (103) can be visualized as arising from the
formation of an imine between the exposed aldehyde in the secologanin (102) and the basic nitrogen of tryptamine (98, R = H), followed by cyclization to
the 2-position of the indole nucleus to form the C ring, opening of the glucose-masked acetal, and carbon—carbon bond rotation changing the cis ring
junction stereochemistry found in secologanin to the trans stereochemistry of the D/Е ring juncture in ajmalicine. The process continues with a second
cyclization, now to the freshly exposed aldehyde resulting from opening of the acetal, the latter having swung around so that it is close to the secondary
amine of the newly created C ring; a reduction of the imine so created; and a final cyclization of the liberated enol onto the alkene. In short, all ten carbon
atoms of secologanin and the entire tryptamine skeleton, as well as the geometry of the product, have been accounted for. This pathway, broadly painted
above, is supported in detail by numerous labeling experiments with isotopes of carbon, hydrogen, and nitrogen, as well as the actual isolation of some of
the intermediates described. All of the work has been summarized (69), Ajmalicine increases cerebral blood flow and commercial mixtures of ajmalicine
with one or more ergot alkaloids have been used in treating vascular disorders and hypertension.
Yohimbine (104), also from the bark of C.yohlmbe К Schum. and from the roots of R serpentina (L.) Benth., has a folk history (unsubstantiated) of use
as an aphrodisiac. Its use has been confirmed experimentally as a local anesthetic, with occasional employment for relief in angina pectoris and
arteriosclerosis, but is frequendy contraindicated by its undesired renal effects. Yohimbine and some of its derivatives have been reported as hallucinogenic
(70). In addition, its pattern of pharmacological activities in a variety of animal models is so broad that its general use is avoided. All ten carbon atoms of
secologanin (102) as well as the entire skeleton of tryptamine (98, R = H) are cleady seen as intact portions of this alkaloid.
Reserpine (105), also from the roots of R sepentlna (L.) Benth. and other Bauwolfia spp., is currendy used as a hypotensive. There are reports in the
older popular literature showing its use for a wide variety of ailments in the tropics and subtropics where the plants grow. Apparendy it was originally used
to treat both high blood pressure and insanity. The former use has been replaced by substances of greater value. Even its use as a tranquilizer and sedative,
which has shown some apparent successes with neuroses, at lower doses (0.05—1.5 mg/day), is no longer in vogue for treatment of psychoses (at 0.5—5.0
mg/day); better materials have been found. Nonetheless, although no analgesic effect has been noted, reserpine does act as a sedative which reduces
aggressiveness. At higher doses, reserpine has been reported to cause depression as well as peptic ulceration. There is some evidence that chronic
administration in women results in an increased incidence of breast cancer (71). In other experimental systems it has shown antitumor activity (72). Its
interesting structure contains, as expected, a tryptamine unit (this time substituted with a 6-methoxy group), a secologanin (102) C10 fragment, and a
trimethoxybenzoic acid unit. This is presumably derived by methylation of gallic acid [149-91-7] (110),
c.
^OH
(110)
typically derived oxidatively from shikimic acid (57) and normally associated with tannins in nutgalls, from which it is obtained by hydrolysis. It is not
known for Bauwolfia spp. if methylation of the gallic acid to produce the trimethoxybenzoic acid unit found in reserpine (105) occurs before the acid is
esterified with the remainder of the system or if methylation occurs later. Indeed, the involvement of gallic acid (110), C/H6O5, itself is, as noted above,
Kirk-Othmer Encyclopedia of Chemical Technology (4th Edition)
550
ALKALOIDS
Voll
presumptive. The total synthesis of resperpine was a landmark synthesis (73).
In ajmaline (106), also obtained from the roots of R serpentina (L.) Benth., a more deeply rearranged secologanin (102) fragment is embedded in the
molecular framework and there has been a decarboxylation from the masked (3-keto carboxylic acid to generate a C unit. Current hypotheses argue that
the C9 unit found in ajmaline actually began as the same C10 unit already seen in ajmalicine (103), yohimbine (104), and reserpine (105), but the additional
cyclization to the C ring and subsequent bonding to the 3-position on the indole nucleus creating a sixth ring is accompanied by decarboxylation. Ajmaline
has aroused some interest because it appears to possess antiarrhythmic activity (74), but care is required for this use when there is Ever disease.
The synthesis of strychnine was a truly monumental undertaking (20). Strychnine (13, R = H), although only moderately toxic when compared to
other poisons, both naturally occurring and produced synthetically, probably owes its reputation to its literary use. Obtained from the seeds and leaves of
Strychnos nux vomica IL. and other Strychnos spp., it has some history of use as a rodenticide. Poisoning is manifested by convulsions, and death apparendy
results from asphyxia. As little as 30 to 60 mg has been reported as fatal to humans, although at lower dosage it has received some medical use as an
antidote for poisoning by central nervous system depressants, as a circulatory stimulant, and in treatment of delirium tremens. The useful medicinal dosage
is normally less than 4 mg. As was the case for ajmaline (106), also derived from tryptamine (98, R = H) and secologanin (102), the pattern for the
formation of strychnine (13) has been extended to even more deep seated rearrangement as well as the loss of one carbon atom, the same carboxylate as
was lost in ajmaline (106). In addition, an acetate (C2) unit has been added (to the indole nitrogen) and another ring created.
Quinine (17, R = OCH3) and cinchonidine (17, R = H), which occur together along with other bases, eg, materials epimeric at the one-carbon
bridge joining the aromatic nucleus with the l-azabicyclo[2.2.2]heptane system, are constituents of the root, bark, and dried stems of various Cinchona
species, but the main source remains Cinchona officinalis L. A crude preparation from this source was introduced into use as a palliative for malaria in the
seventeenth century but several hundred years then elapsed before the first mixture of crystalline bases was obtained. Until the second World War quinine
(17, R = OCH3) and crude Cinchona preparations were the only antimalarials available. As supplies became unobtainable, synthetic materials capable of
replacing quinine were developed. Recendy, however, quinine has again become the treatment of choice for malaria as Plasmodiumfalciparum resistant to
other drugs developed. Apparently, resistance to quinine is more difficult for the rapidly changing mosquito population to acquire. Nonetheless, because
quinine is not a prophylactic drug but rather a material which suppresses the overt manifestations of malaria, work continues on better treatment. The
isolation of quinine from Cinchona bark generally involves conversion of the salts of the basic alkaloids to the free bases with, eg, calcium hydroxide (75),
and extraction of the alkaloids into benzene or toluene.
Examination of the structures of the alkaloids (17) obtained from Cinchona suggests that they probably have a different pattern of formation than
those already discussed. However, the differences are more formal than profound. Thus the 1-azabicyclic system is formed from one of the aldehyde
equivalent carbons of a secologanin (102) bound fragment with the terminal nitrogen of tryptamine (98, R = H). Cleavage of that nitrogen away from the
indole leaves behind the carbon to which it was bound, formally, at the oxidation level of an aldehyde. Then, oxidative opening of the five-membered ring
between the indole nitrogen and the adjacent carbon is followed by recyclization from the aryl amine so liberated to the aldehyde function set free in the
previous step. Thus the nine expected carbons, one of the original carbons in the C10 fragment having been lost by decarboxylation, remain.
An understanding of the chemistry and structure of catharanthine (107), an otherwise minor alkaloid found in Vinca rosea Linn, or Catharanthus roseus
G. Don. which is a potent diuretic in rats, was critical in unraveling the structure of two of the alkaloids co-occurring in Vinca which had been shown to be
active against leukemia, first in mice and later in humans, ie, leurocristine (vincristine [57-22-7f 22, R = CHO) and vincaleukoblastine (vinblastine
[865-21-4], 22, R = CH3). Interestingly, the genera Vinca and Catharanthus (Apocynaceae) appear to be used interchangeably, ie, Vinca rosea Linn, is
frequendy called Catharanthus roseus G. Don. by some but not by others and vice versa (76). Thus both catharanthine (107) and vincaleukoblastine in
concentrated hydrochloric acid, when treated with stannous chloride yielded, among other fragments, the (+)-cleavamine [1674-01-7] (111), so called
because it is a broken or cleaved amine.
After the structure and absolute stereochemistry of cleavamine (111), C19H24N2, was established, its synthesis was shordy completed and impetus to
unravel the structure of the dimeric bases (22) was bolstered (77). Again, the C fragment, now only slightly modified from that originally present in
secologanin (102), is readily seen in catharanthine (107).
Tabersonine (108), cleady a reduced and simplified version of the second-half of the alkaloids 22, was originally isolated from Vmsonia
tabemaemontane L. and is considered to be a simplified parent of a rather more elaborate subgroup of indole alkaloids.
Among the examples of monoindole bases being discussed, vincamine (109) is the principal alkaloid of Vinca minor L. and has received some
notoriety because it apparendy causes some improvement in the abilities of sufferers of cerebral arteriosclerosis (78). It is believed that this is the result of
increasing cerebral blood Row with the accompanying increase in oxygenation of tissue as a result of its action as a vasodilator.
Finally, for this group of tryptophan (26)-derived bases there are those in which a tryptamine (98, R = H) residue is not obvious. Nonetheless, the
pyridocarbazole bases originally isolated from Ochrosia elliptica Labill (Apocynaceae) and subsequendy from the genus Aspidosperma, among others, which
include ellipticine (112, Rj = CH3, R2 = H) and olivacine (112, Rj = H, R2 = CH3), are derived from tryptophan and the normal C9—C10 fragment
expected. These alkaloids are known to inhibit proliferation of cells and continue to be of interest in chemotherapeutic treatments. They appear to inhibit
nucleic acid synthesis irreversibly by interacting strongly with DNA.
Bisindole Alkaloids from Tryptophan. There are two widely different types of alkaloids derived from two tryptophan (26) units. The first
is a rather small group of compounds based simply on the dimers of tryptophan which includes compounds such as calycanthine (113) (Table 10),
isolated from the seeds of the flowering aromatic shrubs Carolina Allspice (Calycanthus floridus) and Japanese Allspice (Chimonanthus fragans). The second type
is that group, reviewed in Reference 79, in which the two halves arise in two distinct ways. Both halves may be composed of identical fragments, as in
C-toxiferine (10), the arrow poison packed in gourds and derived from, eg, Strychnosfroesii Ducke and Strychnos toxifera. The more common and very
numerous (nearly one thousand compounds) family is characterized by two halves derived from different fragments, eg, leurocristine (vicristine (22),
R = CHO) and vincaleukoblastine (vinblastine (22), R = CH3), along with nearly one hundred other compounds, from Catharanthus roseus (L.) G. Don,
Kirk-Othmer Encyclopedia of Chemical Technology (4th Edition)
551
ALKALOIDS
Voll
occasionally referred to erroneously as Vinca rosea V. (80). This second group has in common the genesis of each half from tryptophan (26) and at least one
fragment derived from mevalonic acid (30) itself (ie, a C5 fragment) or derived from a monoterpene such as geraniol (33, —OH in place of—OPP), ie,
loganin (34) or secologanin (102), a C10 fragment.
The search for the bisindole derivatives (22) was originally (81) initiated on the basis of folklore. A brew made from Jamacian periwinkle had
established itself in local medicine as a treatment for diabetes and it was this material that was investigated and found to contain the cytotoxic compounds
(22), among others. No materials useful in the treatment of diabetes have been reported from this source.
Although the compounds were isolated in quantities of only a few milligrams per kilogram of crude plant leaves, extensive work on a variety of
animal tumor systems led to eventual clinical use of these bases, first alone and later in conjunction with other materials, in the treatment of Hodgkin's
disease and acute lymphoblastic leukemia. Their main effect appears to be binding tighdy to tubulin, the basic component of microtubules found in
eukaryotic cells, thus interfering with its polymerization and hence the formation of microtubules required for tumor proliferation (82).
Initial attempts to synthesize the compounds (22) were hampered by the failure to obtain the correct stereochemical configuration about the
vindoline—catharanthine linkage, a most difficult problem eventually solved by insight and hard work (83).
Introduction of Nitrogen into a Terpenoid Skeleton. The acetate-derived fragments (35) mevalonic acid (30), which yields isopentenyl
pyrophosphate (31) and its isomer, 3,3-dimethylallyl pyrophosphate (32); a dimeric C5-fragment, geranyl pyrophosphate (33), which gives rise to the iridoid
loganin (34); and the trimer famesyl pyrophosphate (35), which is also considered the precursor to C30 steroids, have already been mentioned (see Table 3
and Fig. 1). Three of the fragments ((30), the pair (31—32), and (34)) have been invoked as descriptive pregenitors of alkaloids such as emetine (66), lysergic
acid (100), and many other bases already discussed and broadly categorized as monoterpenoid indole alkaloids, eg, ajmalicine (103). Although the path that
links (30) to (35) and thence to the steroids is clear (84), the details of the relationships with any of the subfragments on that path and the alkaloids
resembling them and included here is less clear. The obscurity arises from two related problems involved in labeling experiments. First, the techniques for
feeding suitably labeled precursors such as 13C- and/or 14C-labeled and 2H- and/or 3H-labeled acetate or even larger fragments (those further along on the
metabolic pathway to alkaloidal product) such as mevalonic acid (30) and loganin (34) to many actively growing plants have been worked out, as shown by
their incorporation into alkaloids. However, lack of incorporation does not rule out utiliza tion by the plant of the material fed to it, because there is no
guarantee that the fed material reached the site of alkaloid synthesis. Thus a negative result may simply mean that the particular technique, stage of plant
growth, feeding cycle, photo cycle, etc, was inappropriate for the specific material fed, rather than implying that the material is not capable of incorporation.
In this vein, it is generally true that the larger fragments are more difficult to incorporate. Even though they may enter the plant when they might be actively
metabolized, the particular form in which they arrive at the cell wall may be wrong for transport across the wall. Smaller fragments are less likely to have
transport problems. Thus mevalonic acid (30) generated endogenously from exogenous labeled acetate is frequendy more easily traced than suitably labeled
exogenous mevalonic acid itself. However, the value is correspondingly diminished because everything may be thought of as derived from acetate and
whatever the precursor, the label will have been incorporated. Thus a balance must be struck between what can be fed as labeled material and what will be
incorporated into the plant. Frequently the largest useful fragment that can be incorporated is mevalonic acid (or its corresponding lactone).
The second experimental problem is that incorporation of a material such as loganin (34), or even an amino acid which seems clearly to be a
precursor by some biogenetic hypothesis, does not necessarily prove it is a precursor. The material fed may so completely swamp the normal pathways in
the plant that the utiliza tion of what was fed generates an aberrant path which nonetheless produces the same product.
These considerations are particularly important when the description of the alkaloids is based on a presumed biosynthesis from terpene fragments
because the experimental work linking the smaller pieces with the larger has yet to succeed. That is, the well worked out paths from acetate, through (30) to
the steroids, via geranyl pyrophosphate (33), famesyl pyrophosphate (35), and the universal steroid precursor squalene [111-02-4] (114), C3QH50, (84) have
not been clearly demonstrated to apply in the higher, alkaloid producing, plants. Furthermore, in almost all of the alkaloids whose presumed biosynthesis
derives from an insertion of nitrogen into the mevalonic acid-derived fragment, it is not quite clear at what stage the nitrogen insertion occurs. Introduction
of the nitrogen at a very late stage might be an artifact of isolation because basification with ammonia of the acidic extract initially employed to isolate the
basic materials is common and reaction of water soluble materials with ammonia, followed by cyclizations, etc, might occur.
When racemic mevalonic acid as the corresponding lactone and labeled at C-2 with 14C is fed to the Chilean shrub Skytanthus acutusMeyen.., labeled
p-skytanthine [24282-31-3] (115) is obtained. Skytanthus alkaloids are reputed to be tremorgenic (85).
,CH3
.H
H
H3c'
N\
CH3
(115)
H3C'
N\
CH3
(116)
Kirk-Othmer Encyclopedia of Chemical Technology (4th Edition)
552
ALKALOIDS
Voll
COOH
,CH3
H
J3H
H3(V 'COOH
(117)
H
(118)
Tecomanine [6878-83-7] (116), C^H^NO, said to be a potent feline attractant (86) and a material clearly related to P-skythathine (115), C^H^N, as well as
to nepetalinic acid [485-06-3] (117), C1QH16O4, a degradation product of nepetalactone [490-10-8] (118), C1QH14O2, which is a major constituent of volatile
oil of catnip (Neteta cataria L.), is obtained from Tecoma stans^uss. Extracts of the latter (87) have some history demonstrating antidiabetic properties. Both
of these bases (115 and 116) are derived from geranyl pyrophosphate (33) or loganin (34) or suitable similar precursor(s) before cleavage of the precursor to
secologanin (102) or its equivalent.
Alternatively, there are those alkaloids, such as gentianine [439-89-4] (119), C1QH9NO2,
(119)
isolated from Gentiana tibetica King, among others, which are presumably derived from secologanin (102) and which exhibit anti-inflammatory action along
with being muscle relaxants.
The C5 trimer famesyl pyrophosphate (35), in addition to serving as a pregenitor of steroids via squalene (114), is also the pregenitor of the C15
compounds known as sesquiterpenes. It has been suggested that famesyl pyrophosphate (88) similarly serves as the carbon backbone of alkaloids such as
deoxynupharidine (120) itcymPdupbarjapomcum (Nymphaceae) (waterlilies) and dendrobine (121) frovciDendrobium nobikUndl (Orchidaceae) (Table 11).
The latter is the source of the Chinese drug Chin-Shih-Hu. Compared to the other families of bases discussed earlier, the numbers of alkaloids supposedly
derived from famesyl pyrophosphate or a close relative is small. However, given the wide variety of plant families containing sesquiterpenes, it is most likely
that the numbers of compounds to be found will dramatically increase.
Table 11. Alkaloids from Famesyl Pyrophosphate
Name Molecular formula CAS Registry Number Structure number Structure
de о xynupharidine c15h23no [1143-54-0] (120) H н\ ,zCH3 h H3CV X н о ХУ (120)
dendrobine C16H25NO2 [2115-91-5] (121) H / N\-CH3 НзС—NvN/ 0 H'Z^y'H Ah CH3 XCH3 (121)
veatchine C22H33NO2 [76-53-9] (123) a
atisine C22H33NO2 [466-43-3] (124) a
aconitine [302-27-2] (125) a
See Figure 5.
Whereas dimerization of two famesyl pyrophosphates (35) generates squalene (114) on the path to steroids (89), the addition of one more C5 unit,
as isopentenyl pyrophosphate (31) or its isomer, 3,3-dimethylallyl pyrophosphate (32), to the C15 compound famesyl pyrophosphate produces the C2Q
diterpene precursor geranylgeranyl pyrophosphate [6699-20-3] (122).
Kirk-Othmer Encyclopedia of Chemical Technology (4th Edition)
553
ALKALOIDS
Voll
H
H3c
I
^CAC""CH2 H
CH3 CH2
[ ^CH2 H
CH3 CH2
""CH2 H
CH3 CH2 (L
"C CH2
CH3
(122)
This C20 pyrophosphate (122), C20H33O7P2, is thought to provide the carbon framework of the diterpene alkaloids such as veatchine (123), atisine (124),
and aconitine (125) (Fig. 5). It is not known at what stage the nitrogen is incorporated into the framework established by the skeleton. The potential for
terpene rearrangements and the observation that the alkaloids are frequendy found esterified, often by acetic or benzoic acid, as well as free, has led to
permutations and combinations producing over 100 such compounds.
(125)
Fig. 5. Diterpene alkaloids (see Table 11).
The diterpene alkaloids elaborated by most species of Aconitum and Delphinium (family Ranunculaceae) are apparently not found in other genera
(Ranunculus., Drolliusy Anemone, etc) in the same family. Similar bases are, however, found in Garrya (eg, Garrya veatchii Kellog., family Comaceae). Monkshood
(occasionally wolf s bane, friar's cowl, or mouse bane) is obtained from the dried tuberous root of Aconitum napellus L. agg., and the plant is said to occur
wild (90) in England and Wales as well as in the Swiss and Italian Alps. It is considered among the most dangerous of plants, all parts of it being
poisonous, although the bases appear to be most concentrated in the roots. As has usually been the case, this alkaloid-bearing plant, along with the others
containing diterpene alkaloids, was initially examined based on folklore and in the hope of finding medicinally valuable palliatives. Thus crude plant material
has long been used internally as a febrifuge to lower fever and externally for neuralgia.
The base veatchine (123) and related materials are found in the bark of, eg, G. veatchii Ke/log., and structural elucidation of this complicated and
reactive material required massive efforts (91). Its relationship to atisine (124) from the roots of the atis plant, Aconitum heterophyllum Wall., is clearly seen as
that of the well known terpene rearrangement of an t'AW-methylene octa[3.2.1]bicyclic system to that of its [2.2.2] isomer, the remainder of the molecule
remaining unchanged. More deep seated rearrangements in the same part of the molecule (ie, a 6—6—5 set of rings with an t'AW-methylene group yielding a
7—5—6 set now incorporating the methylene) generates aconitine (125).
The path from squalene (114) to the corresponding oxide and thence to lanosterol [79-63-0] (126), C30H50O, cholesterol [57-88-5] (127), and
cycloartenol [469-38-5] (128) (Fig. 6) has been demonstrated in nonphotosynthetic organisms. It has not yet been demonstrated that there is an obligatory
path paralleling the one known for generation of plant sterols despite the obvious structural relationships of, for example, cycloartenol (128), C30H50O, to
cyclobuxine-D (129), C25H42N2O. The latter, obtained from the leaves of Buxus sempervirens D, has apparendy found use medicinally for many disorders,
from skin and venereal diseases to treatment of malaria and tuberculosis. In addition to cyclobuxine-D [2241-90-9] (129) from the Buxaceae, steroidal
alkaloids are also found in the Solanaceae, Apocynaceae, and Liliaceae.
Kirk-Othmer Encyclopedia of Chemical Technology (4th Edition)
554
ALKALOIDS
Voll
(126)
(128)
H3CHN
Fig. 6. Steroids from squalene (114).
(129)
(130)
The plants of Solanum include, among others, the potato (Solanum tuberosum L.) and the tomato (Solanum lycoperisicum L.). Frequendy the plant bases occur as
the aglycone portion of a glycoalkaloid bonded to one or more six-carbon sugars. Hydrolysis of the sugar portion and, somewhere along the degradative
pathway, excision of the nitrogen (usually via a Hoffmann-type elimination) results in a steroid-like fragment, the analysis of which falls back on the large
body of accumulated information about steroids and their degradation products. Solanidine [80-78-4] (130) is typical of the kind of bases present and has
been isolated from a number of Solanum.
Interestingly, feeding experiments in Solanum chacoense L. (92) demonstrate that cholesterol (127), C27H46O, can be incorporated into solanidine (130),
C27H43NO, but the amount of steroid incorporated is very low and there has been more than one suggestion (93) that the route involves initial degradation
of the fed cholesterol to acetate, followed by recreation of the entire skeleton.
In addition to the alkaloids such as cyclobuxine-D (129) and solanidine (130) where the structural similarities to steroids are clear (although it must
be remembered that detailed evidence actually linking the compounds is lacking) there are the less obvious (but nonetheless also clearly related) Veratrum
alkaloids. These compounds, of which protoveratrine A [143-57-7] (131), C41H63NO14, obtained from the rhizome of Veratrum album L. (Liliaceae), is a
typical example, produce dramatic declines in blood pressure on administration and have been received by the medical community as good antihypertensive
agents. Generally, however, the dosage must be individualized (slowly) from about 2 mg in 200 mL of saline upward. Because the therapeutically valuable
dosage is similar to the toxic dose, and even nonlethal large doses may cause cardiac arrhythmias and peripheral vascular collapse, use of these compounds
has frequendy been limited to extreme cases where close attention can be accorded the patient.
Kirk-Othmer Encyclopedia of Chemical Technology (4th Edition)
555
ALKALOIDS
Voll
О
8з1)
Purine Alkaloids. The purine skeleton is not derived from histidine (29), as might be imagined, nor is it derived from any obvious amino acid
pregenitor. As has been detailed elsewhere (33,35), the nucleus common to xanthine [69-89-6] (132), C5H9N4O2, and found in the bases of caffeine (16),
theophylline [58-55-9] (133, Щ = R2 = CH3; R3 = H), and theobromine [85-67-0] (133, R: = H; R2 = R3 = CH3), C7H8N4O2, is created from small
fragments which are attached to a ribosyl unit during synthesis and which can presumably be utilized in a nucleic acid backbone subsequendy. All three
alkaloids, caffeine, theophylline, and theobromine, occur widely in beverages commonly used worldwide.
H
(132)
R2
(133)
The leaf and leaf buds of Cammelia sinensis (L.) О Kuntze and other related plants and most teas contain, depending upon climate, specific variety,
time of harvest, etc, somewhat less than 5% caffeine (16) and smaller amounts of theophylline (133, Rj = R2 = CH3; R3 = H) and theobromine (133,
Rj = H; R- = R3 = CH3). Coffee consists of various members of the genus Coffea^ although the seeds of Coffea arabica L., believed to be indigenous to East
Africa, are thought to have been the modem pregenitor of the varieties of coffees currently available and generally cultivated in Indonesia and South
America. The seeds contain less than about 3% caffeine which, bound to other agents, is set free during the roasting process. The caffeine maybe sublimed
from the roast or extracted with a variety of agents, such as methylene chloride, ethyl acetate, or dilute acid (eg, an aqueous solution of carbon dioxide) to
generate decaffinated material (94).
Two other commonly found sources of caffeine (16) are kola (Cold) from the seeds of, for example, Cola nitida (Vent.) Schott and Engl., which
contains 1—4% of the alkaloid, but litde theophylline or theobromine, and cocoa (from the seeds of Eheobroma cacao L.), which generally contains about 3%
theobromine and significandy less caffeine.
All three of these materials are apparendy central nervous system (CNS) stimulants. It is believed that for most individuals caffeine causes greater
stimulation than does theophylline. Theobromine apparendy causes the least stimulation. There is some evidence that caffeine acts on the cortex and
reduces drowsiness and fatigue, although habituation can reduce these effects.
Miscellaneous Alkaloids. Shikimic acid (57) is a precursor of anthranilic acid (28) and, in yeasts and Escherichia coli (a bacterium), anthranilic
acid (o-aminobenzoic acid) is known to serve as a precursor of tryptophan (26). A similar but yet unknown path is presumed to operate in higher plants.
Nonetheless, anthranilic acid itself is recognized as a precursor to a number of alkaloids. Thus damascenine [483-64-7] (134), C10H13NO3, from the seed
coats of Nigella damascena has been shown (95) to incorporate labeled anthranilic acid when unripe seeds of the plant are incubated with labeled precursor.
^^/СООСНз
Y^NHCH3
OCH3
(134)
Similarly, anthranilic acid (28) has been suggested as a reasonable precursor and some early labeling studies have been carried out showing that dictamnine
[484-29-7] (135), C12H9NO2, from Dictamnus albus and skimminanine [83-95-4] (136), C14H13NO4, from Skimmiajaponica incorporate anthranilic acid in a
nonrandom fashion (96,97).
(135)
Kirk-Othmer Encyclopedia of Chemical Technology (4th Edition)
556
ALKALOIDS
Voll
ОСНз
OCH3
(136)
Securinine [3610-40-2] (137), C13H15NO2, is the major alkaloid of Securinega surroticosa Rehd. and has been shown to arise from two amino acid
fragments, lysine (24) and tyrosine (25).
(137)
Reactions at the aromatic nucleus that are quite different from the usual mild condensations and rearrangements which apparendy generate the typical
alkaloids already discussed must be involved. Securinine (137) is reported to stimulate respiration and increase cardiac output, as do many other alkaloids,
but it also appears generally to be less toxic (98).
Coniine (12), implicated by Plato in the death of Socrates, is the major toxic constituent of Conium maculatum L. (poison hemlock) and, as pointed
out earlier, was apparendy the first alkaloid to be synthesized. For years it was thought that coniine was derived from lysine (24), as were many of its
obvious relatives containing reduced piperidine nuclei and a side chain, eg, pelletierine (46). However, it is now known (99) that coniine is derived from a
polyketooctanoic acid [7028-40-2] (138), CgH10O5, or some other similar straight chain analogue.
О
II
СИ2 CH2 О
HOOC ^C. /С
о CH2 CH3
(138)
Economic Aspects
As the twentieth century draws to a close, many alkaloids, such as atropine (41) and reserpine (105), that have served humanity since eady history are being
replaced by synthetic materials. Others, such as the Vinca bases, eg, vincristine (leurocristine, 22, R = CHO) remain as powerfill medical tools. Replacement
of naturally occurring alkaloids is desireable in order to maintain and augment favorable properties while eliminating undesireable properties and effects.
Through strides in biochemical research, especially structure-reactivity studies and design of model compounds, synthetic materials have been developed.
These new materials, while occasionally related to alkaloids, either because they are derived from alkaloids or because their structures are similar, are not
naturally occurring and thus are not alkaloids. However, they are generally much more specific in their action and since they are protected by patents, much
more expensive.
There are four broad classes of alkaloids whose general economic aspects are important: (7) the opiates such as morphine and codeine (2, R = H
and R = CH3, respectively); (2) cocaine (11) (both Heit and illicit); (J) caffeine (16) and related bases in coffee and tea, and (4) the tobacco alkaloids such as
nicotine (21).
The Opiates. The International Narcotics Control Board—Vienna, tracks the Heit production of narcotic drugs and annually estimates world
requirements for the United Nations. Their most recent pubHcation (100) points out that more than 95% of the opium for Heit medical and scientific
purposes is produced by India and, in a declining trend, only about 600 t was utilized in 1988. This trend appears to be due to the fact that the United
States, the largest user of opium for alkaloid extraction, reduced the amount of opium being imported from about 440 t in 1986 to 249 t in 1987 and 224 t
in 1988. The United States used about 48 t of morphine (2, R = H) in 1988, most (about 90%) being converted to codeine (2, R = CH3) and the remainder
being used for oral administration to the terminally ill (about 2 t) and for conversion to other materials of minor commercial import which, while clearly
alkaloid-derived, are not naturally occurring.
Cocaine. Production of cocaine [50-36-2] (11) for Heit purposes (100) takes place in BoHvia and Реш. In 1988 the former exported 204 t and the
latter 47 t of coca leaves into the United States. The average total Heit production of cocaine as a by-product in the extraction of flavoring agents from coca
leaves was reported (100) to be only 425 kg in the United States in 1988. This must be weighed against the estimates by the U.S. Drug Enforcement
Administration that the value of illegal annual exports of coca from BoHvia (1987) is $2 bilHon (101). It has been suggested (101) that this doHar sum is
three times as much as the earnings from legal exports of tin, coffee, etc and that it is a significant support to the BoHvian economy.
Caffeine. About 3% by weight of the roasted coffee bean is caffeine (16). The second U.S. Department of Agriculture world coffee crop
estimate for 1988—1989 was 4.24 x 10⁹ kg (93.3 million 100-lb bags) (102). World coffee consumption was predicted to rise in the foreseeable future at the
rate of 1—2% per year and thus the total amount of caffeine and related alkaloids ingested from this source can also be expected to increase. Caffeine and
related bases (eg, theophylline) are also found in various teas but, because most of the major producers (India, China, etc) export relatively Httle of their
crops and keep most for domestic consumption, accurate figures on year-to-year production are more difficult to obtain. Nevertheless, these crops are of
significant economic import (103).
Tobacco. Tobacco is the principal source of the alkaloid nicotine (21), which, it is claimed, is at least partially responsible for the addicting
properties of tobacco. A study (104) concerning the world market outiook for this crop claims that in developed countries individual annual consumption
of tobacco will decrease from 2.48 to 2.21 kg per adult between 1986 and 2000 while in developing countries, it will increase from 1.59 to 1.75 kg per adult
over the same time span. Given expected trends in world population growth, this suggests that total production of leaf tobacco will increase by about 2%
annually during the same period. A significant impact on the foreign exchange earnings for developing countries which fail either to produce tobacco for
export or to satisfy domestic demand is expected.
BIBLIOGRAPHY
"Alkaloids, Manufacture" in ECT 1st ed., Vol. 1, pp. 507—516, by N. Applezweig, Hygrade Laboratories, Inc.; "Alkaloids, History, Preparation, and Use" in
ECT 2nd ed., Vol. 1, pp. 778—809, by G. H. Svoboda, EH Lily and Co.; "Alkaloids, Survey" in ECT 2nd ed., Vol. 1, pp. 758—778, by W. I. Taylor, Ciba
Pharmaceutical Co.; "Alkaloids" in ECT 3rd ed., Vol. 1, pp. 883—943, by Geoffrey A. CordeH, CoHege of Pharmacy, University of Illinois.
1. T. I. Wilhams, Drugs from Plants, Sigma, London, 1947, p. 87; L. S. Goodman and A. Gilman, The Pharmacological Basis of Therapeutics: A. Textbook of
Kirk-Othmer Encyclopedia of Chemical Technology (4th Edition)
557
ALKALOIDS
Voll
2.
3.
4.
5.
6.
7.
8.
9.
10.
11.
12.
13.
14.
15.
16.
17.
18.
19.
20.
21.
22.
23.
24.
25.
26.
27.
28.
29.
30.
31.
32.
33.
34.
35.
36.
37.
38.
39.
40.
41.
42.
43.
44.
45.
46.
47.
48.
49.
50.
51.
52.
53.
54.
55.
56.
57.
58.
59.
60.
61.
62.
63.
64.
65.
66.
67.
68.
69.
70.
71.
72.
73.
Pharmacology, 3rd ed., Macmillan, New York, 1965, pp. 247—266.
C. Derosne, Ann. Chim. (Paris) 45, 257 (1803).
F. W. Sertumer, Ann. Chim. Phys. (2) 5, 21 (1817).
H.-G. Boit, Ergebnisse derAlkaloid-Chemie Bis 1960, Akademie-Vedag, Berlin, 1961.
J. S. Glasby, Encyclopedia of the Alkaloids, Vols. 1 and 2, Plenum Press, New York, 1975.
S. W. Pelletier, Alkaloids. ChemicalandBiologicalPerspectives, Vol. 1, John Wiley & Sons, Inc., New York, 1983, pp. 25—27.
I. W. Southon and J. Buckingham, eds., Dictionary of Alkaloids, Chapman and Hall, New York, 1989.
R. H. F. Manske and H. L. Holmes, eds., The Alkaloids: Chemistry and Physiology, Vol. 1, Academic Press, Inc., New York, 1950. This series gives a
detailed exposition of the chemistry and pharmacology of the alkaloids, by structural class. Vol. 36, A. Brossi, ed., was published in 1989.
E. Hasse, Biblotheca Zoologica 8, 1 (1892).
J. v. Euw, T. Reichstein, and M. Rothschild, IsraelJ. Chem. 6, 659 (1968).
J. A. Edgar, P. A. Cocknim, and J. L. Frahn, Experientia 32, 1535 (1976).
J. Meinwald, Ann. N.Y. Acad. Sci. 471, 197 (1986).
T. Eisner, M. Goetz, D. Aneshansley, G. Ferstandig-Arnold, and J. Meinwald, Experientia 42, 204 (1986).
J. Smolanoff and co-workers, Science 188, 734 (1975).
J. J. Tufariello, H. MecHer, and К. P. A. Senaratne,/ Am. Chem. Soc. 106, 7979 (1984).
P. J. Pelleiter and J. B. Caventou, Ann. Chim. Phys. 8, 323 (1818); 10, 142 (1819).
J. Geiger, Berzelius'Jahresber. 12, 220 (1870).
A. Ladenburg, Ber. 19, 439 (1886).
A. F. Peerdeman, Acta Crystallogr. 9, 824 (1956).
R. B. Woodward and co-workers, Tetrahedron 19, 247 (1963).
L. R. Caporael, Science 192, 21 (1976).
H. Weiland, F. Konz, and K. Mittasch, Ann. 513, 1 (1934).
G. J. Cardinale and co-workers, Efe Sci. 40, 301 (1987).
O. Dragendorff, Zeitschr. Anal. Chem. 137 (1866); The Merck Index, 5th ed., Merck & Co., Rahway, N.J., 1940, p. 687.
H. Mayer, Am. J. Pharm. 35, 20 (1863); The Merck Index, 5th ed., Merck & Co., Rahway, N.J., 1940, p. 883.
N. R. Farnsworth,/. Pharm. Sci. 55, 225 (1966).
R. W. Kondrat, R. G. Cooks, and J. L. McLaughlin, Science 199, 978 (1978).
G. Zweig and J. Sherma, eds., CRC Handbook of Chromatography, CRC Press, Cleveland, Ohio, 1972.
E. Stahl, Dunnschicht-Chromatographie, Springer, Berlin, 1969.
R. Bendey and I. M. Campbell in M. Florkin and E. H. Stotz, eds., ComprehensiveBiochemistry, Vol. 20, Elsevier, New York, 1968, pp. 415ff
E. Winterstein and G. Trier, Die Alkaloids, Bemtrager, Berlin, 1910.
Sir Robert Robinson, The Structural Relations of Natural Products, Oxford University Press, Oxford, 1955.
I. D. Spenser in M. Florkin and E. H. Stotz, eds., ComprehensiveBiochemistry, Vol. 20, Elsevier, New York, 1968, pp. 231ff
G. A. Cordell, Introduction to Alkaloids: A Biogenetic Approach, Wiley-Interscience, New York, 1981.
D. R. Dalton, The Alkaloids—A Biogenetic Approach, Marcel Dekker, New York, 1979.
R. W. Herbert in S. W. Pelletier, A., Alkaloids, ChemicalandPhysiologicalPerspectives, Vol. 3, Wiley-Interscience, New York, 1985.
E. Leete and S. H. Kim,/. Am. Chem. Soc. 110, 2976 (1988).
G. Grue-Sorensen and I. D. Spenser,/. Am. Chem. Soc. 105, 7401 (1983).
E. Leistner and I. D. Spenser,/ Am. Chem. Soc. 95, 4715 (1973); T. Hemscheidt and I. D. Spenser,/ Am. Chem. Soc. 112, 6360 (1990).
D. G. O'Donovan, D. J. Long, E. Forde, and P. Geary,/ Chem. Soc. Perkin Trans. 1, 415 (1975).
W. M. Golebiewski and I. D. Spenser,/ Am. Chem. Soc. 106, 7925 (1984).
E. Leete and Y.-Y. Liu, Phytochemistry 12, 593 (1973).
S. D. Copley and J. R. Knowles,/ Am. Chem. Soc. 109, 5008 (1987); W. J. Guilford, S. D. Copley, and J. R. Knowles,/ Am. Chem. Soc. 109, 5013
(1987).
R. E. Schultes and A. Hofmann, Plants of the Gods, McGraw-Hill Book Co., Inc., New York, 1979.
W. La Barre, D. P. McAllister, J. S. Slotkin, О. C. Stewart, and S. Tax, Science 114, 582 (1952).
W. I. Taylor and A. R. Battersby, eds., Oxidative Coupling of Phenols, Marcel Dekker, New York, 1967.
Ref. 35, pp. 197ff.
A. W. Gerrard, Pharm. J. 8, 214 (1877).
O. Moller, E. M. Steinberg, and K. Torssell, Acta Chem. Scand. B32, 98 (1978).
J. Boissier, G. Combes, and J. Pagny, Ann. Pharm. Fr. 18, 888 (1960).
T. Kametani and co-workers, J. Chem. Soc. C, 1043 (1971).
H. M. Fales, J. Mann, and S. H. Mudd,/ Am. Chem. Soc. 85, 2025 (1963).
W. C. Wildman and D. T. Bailey,/ Am. Chem. Soc. 91, 150 (1969).
W. C. Wildman in R. H. F. Manske, eds., The Alkaloids, Vol. 11, Academic Press, New York, 1968, pp. 308ff.
E. H. Herman and D. P. Chadwick, Pharmacology 12, 97 (1974); E. J. Gralla, G. L. Coleman, and A. M. Jonas, Cancer Chemother. Rep. Part 3 5, 79
(1974).
D. H. R. Barton and T. Cohen, Festschrift A. Stoll, Birkhauser Vedag, Basel, 1957, p. 117.
M. A. Barbier, Ann. Pharm. 5, 121 (1947).
M. Gates and G. Tschudi,/ Am. Chem. Soc. ПЧ, 1380 (1956).
H. I. Parker, G. Blaschke, andH. Rapoport,/. Am. Chem. Soc. 94, 1276 (1972).
D. H. R. Barton, C. J. Potter, and D. A. Widdowson,/ Chem. Soc. Perkin Trans. 1, 346 (1974); D. H. R. Barton, R. D. Bracho, C. J. Potter, and D.
A. Widdowson,/ Chem. Soc. Perkin Trans. 1 2278 (1974).
J. E. Saxton, ed., Indoles, Part Four, The Monoterpenoid Indole Alkaloids, Wiley-Interscience, New York, 1983.
M. M. Rapport, A. A. Green, and I. H. Page, / Biol. Chem. 176, 1243 (1948).
K. Stolle and D. Groger, Arch. Pharm. (Weinheim) 301, 561 (1968).
A. Hofmann, Botanical Museum Leaflets, Vol. 20, Harvard University, Cambridge, Mass., 1963, p. 194.
Fr. Add. 91,948 (Aug. 30, 1968), J. Rutschmann andH. Kobel (Sandoz Ltd.).
W. A. Jacobs and L. C. Craig, Science 82, 16 (1935).
A. R. Battersby, A. R. Burnett, and P. G. Parsons, Chem. Commun., 1280 (1968).
I. Kompis, M. Hesse, and H. Schmid, Eloydia 34, 269 (1971) (gives a much more elaborate classification scheme).
Ref. 35, pp. 443ff.
G. Holmberg and S. Gershon, Psychopharmacologia 2, 93 (1961); M. L. Brown, S. Gershon, W. J. Lang, and B. Korol, Arch. Intern. Pharmacodyn. 160,
407 (1966).
B. Armstrong, N. Stevens, and R. Doll, Lancet 2, 672 (1974).
J. L. Hartwell, CancerTreatmentRep. 60, 1031 (1976).
R. B. Woodward, F. E. Bader, H. Bickel, A. J. Frey, and R. W. Kierstead, Tetrahedron 2, 1 (1958).
Kirk-Othmer Encyclopedia of Chemical Technology (4th Edition)
558
ALKALOIDS
Voll
74. M. L. Chatterjee and M. S. De, Bull. Calcutta School Trop. Med. 5, 173 (1957); Chem. Abstr 52, 8356a (1958).
75. J. Schwyzer, DieFabrikation Bharma^eutischerand Chemisch, TechnischerBrodukte, Springer-Vedag, Berlin, 1931.
76. W. I. Taylor and N. R. Farnsworth, eds., The Catharanthus Alkaloids, Botany, Chemistry, Bharmacology and Clinical Uses, Marcel Dekker, New York, 1973;
W. I. Taylor and N. R. Farnsworth, eds., The Winca Alkaloids, Botany, Chemistry andBharmacology, Marcel Dekker, New York, 1973.
77. G. Buchi, P. Kulsa, K. Ogasawara, and R. L. Rosati,/. Am. Chem. Soc. 92, 999 (1970) and references therein.
78. A. Ravina, Bresse Med. 74, 525 (1978).
79. G. A. Cordell in ref. 61, pp. 539ff.
80. W. T. Steam, Eloydia 29, 196 (1966).
81. W. A. Creasey in F. Hahn, ed., Antibiotics, Vol. 5, Springer-Vedag, Berlin, 1979, p. 414.
82. E. K. Rowinsky, L. A. Cazenave, and R. C. Donehower,/ Nat. Cancer Inst. 82, 1247 (1990) (deals with antimicrotubule agents, albeit with a
nonalkaloidal agent).
83. J. P. Kutney and co-workers,/ Am. Chem. Soc. 97, 5013 (1975); M. E. Kuehne and T. C. Zebovitz,/. Org. Chem. 52, 4331 (1987); M. E. Kuehne, T.
C. Zebovitz, W. G. Bornmann, and I. Marko,/ Org. Chem. 52, 4340 (1987).
84. G. Popjak and J. W. Comforth, Biochem. J. 101, 553 (1966); J. W. Comforth, R. H. Comforth, A. Pelter, M. G. Homing, and G. Popjak, Tetrahedron
5, 311 (1959); R. B. Clayton in T. W. Goodwing, eA., Aspects of Terpenoid Chemistry and Biochemistry, Academic Press, New York, 1971, pp. Iff
85. T. Sakan, Tampakushitsu Kakusan Koso 12, 2 (1967); Chem. Abstr. 73, 42351c (1970).
86. G. L. Gatti andM. Marotta, Ann. 1st. Super. Sanita'l, 29 (1966); Chem. Abstr. 65, 14293e (1966).
87. W. C. Wildman, J. LeMen, and K. Wiesner in W. I. Taylor and A. R. Battersby, eds., Cyclopentanoid Terpene Derivatives, Marcel Dekker, New York,
1969, pp. 239ff.
88. О. E. Edwards in W. I. Taylor and A. R. Battersby, eds., Cyclopentanoid Terpene Derivatives, Marcel Dekker, New York, 1969, pp. 357ff
89. T. T. Tchen and K. Block,/ Am. Chem. Soc. 77, 6085 (1955); R. B. Clayton and K. Block,/ Biol. Chem. 218, 319 (1956); L. J. Goad, Symp. Biochem.
Soc. 29, 45 (1970).
90. G. A. Swan, An Introduction to the Alkaloids,} ohn Wiley & Sons, Inc., New York, 1967, p. 274.
91. S. W. Pelletier, N. V. Mody, and H. K. Desai,/ Org. Chem. 46, 1840 (1981).
92. H. Ripperger, W. Mortiz, and K. Schreiber, Bhytochemistry 10, 2699 (1971).
93. S. J. Jadav, D. K. Salunkhe, R. E. Wyse, and R. R. Dalvi,/ FoodSci. 38, 453 (1973).
94. U.S. Pat. 3,108,876 (Oct. 29, 1963), H. H. Turken and T. P. Daley (to Duncan Coffee Co.); U.S. Pat. 3,361,571 (Jan. 2, 1968), L. Nutting and G. S.
Chong (to Hills Bros. Coffee, Inc.).
95. E. J. Miller, S. R. Pinnell, G. R. Martin, and E. Schiffman, Biochem. Biophys. R/x Commun. 26, 132 (1967).
96. E. Monkovic, I. D. Spenser, and A. O. Plunkett, Can. J. Chem. 45, 1935 (1967).
97. M. Matsuo and Y. Kasida, Chem. Bharrn. Bull. (Tokyo) 14, 1108 (1966).
98. V. A. Snieckus, Alkaloids (N.Y.) 14, 425 (1973).
99. E. Leete, Accounts Chem. R/x 4, 100 (1971).
100. International Narcotics Control Board—Vienna, Narcotic Drugs, Estimated World Requirementsfor 1990, Statistics for 1988, United Nations Publ.
E/F/S.89.XI.3, New York, 1989, pp. 33ff.
101. L. MSBrMe,AachenerGeographische Arbeit. 19, 137 (1987).
102. USDA, Foreign Agricultural Service Circular Series No. FCOF 3-88, Foreign Agricultural Service, U.S. Department of Agriculture, 1988.
103. Economist (UK), 296, 57 (1985).
104. Tobacco, Supply, Demand and Trade Projections, 1995 and 2000, FAO Economic and Social Development Вaper 1990, No. 86, FAO.
General References
References 7 and 8 are general references.
David R. Dalton
Temple University
Kirk-Othmer Encyclopedia of Chemical Technology (4th Edition)
559