/


Text
D AV I D M . A N D E R S O N
DESIGN
for
MANUFACTURABILITY
How to Use Concurrent Engineering to
Rapidly Develop Low-Cost, High-Quality
Products for Lean Production
DESIGN
for
MANUFACTURABILITY
How to Use Concurrent Engineering to
Rapidly Develop Low-Cost, High-Quality
Products for Lean Production
D AV I D M . A N D E R S O N
DESIGN
for
MANUFACTURABILITY
How to Use Concurrent Engineering to
Rapidly Develop Low-Cost, High-Quality
Products for Lean Production
Boca Raton London New York
CRC Press is an imprint of the
Taylor & Francis Group, an informa business
A PRODUCTIVITY PRESS BOOK
CRC Press
Taylor & Francis Group
6000 Broken Sound Parkway NW, Suite 300
Boca Raton, FL 33487-2742
© 2014 by David M. Anderson
CRC Press is an imprint of Taylor & Francis Group, an Informa business
No claim to original U.S. Government works
Printed on acid-free paper
Version Date: 20131217
International Standard Book Number-13: 978-1-4822-0492-6 (Hardback)
This book contains information obtained from authentic and highly regarded sources. Reasonable efforts
have been made to publish reliable data and information, but the author and publisher cannot assume
responsibility for the validity of all materials or the consequences of their use. The authors and publishers
have attempted to trace the copyright holders of all material reproduced in this publication and apologize to
copyright holders if permission to publish in this form has not been obtained. If any copyright material has
not been acknowledged please write and let us know so we may rectify in any future reprint.
Except as permitted under U.S. Copyright Law, no part of this book may be reprinted, reproduced, transmitted, or utilized in any form by any electronic, mechanical, or other means, now known or hereafter invented,
including photocopying, microfilming, and recording, or in any information storage or retrieval system,
without written permission from the publishers.
For permission to photocopy or use material electronically from this work, please access www.copyright.
com (http://www.copyright.com/) or contact the Copyright Clearance Center, Inc. (CCC), 222 Rosewood
Drive, Danvers, MA 01923, 978-750-8400. CCC is a not-for-profit organization that provides licenses and
registration for a variety of users. For organizations that have been granted a photocopy license by the CCC,
a separate system of payment has been arranged.
Trademark Notice: Product or corporate names may be trademarks or registered trademarks, and are used
only for identification and explanation without intent to infringe.
Library of Congress Cataloging‑in‑Publication Data
Anderson, David M. (Engineer)
Design for manufacturability : how to use concurrent engineering to rapidly develop
low-cost, high-quality products for lean production / author, David M. Anderson.
pages cm
Includes bibliographical references and index.
ISBN 978-1-4822-0492-6 (hardback)
1. Lean manufacturing. 2. Concurrent engineering. I. Title.
TS183.A57 2014
670--dc23
Visit the Taylor & Francis Web site at
http://www.taylorandfrancis.com
and the CRC Press Web site at
http://www.crcpress.com
2013048176
Dedicated to my loving and supportive wife, Lin.
Contents
List of Figures...................................................................................... xxv
Preface............................................................................................... xxvii
About the Author...............................................................................xxxv
Section I Design Methodology
Chapter 1 Design for Manufacturability............................................ 3
1.1
1.2
1.3
1.4
1.5
1.6
1.7
Manufacturing before DFM.............................................4
1.1.1 What DFM Is Not.................................................5
1.1.2 Comments from Company DFM Surveys........5
Myths and Realities of Product Development......... 6
Achieving the Lowest Cost...............................................7
1.3.1 Toyota on When Cost Is Determined................7
1.3.2 Ultra-Low-Cost Product Development.............8
Designing for Low Cost....................................................9
1.4.1 Design for Cost Approaches...............................9
1.4.1.1 Cost-Based Pricing................................9
1.4.1.2 Price-Based Costing (Target
Costing)................................................10
1.4.1.3 Cost Targets Should Determine
Strategy.................................................11
1.4.2 Cost Metrics and Their Effect on Results........11
1.4.3 How to Design Very Low Cost Products.........13
1.4.4 Cost Reduction by Change Order....................14
Cutting Time-to-Market in Half...................................16
Roles and Focus...............................................................18
1.6.1 Human Resources Support for Product
Development.......................................................19
1.6.2 Job Rotation........................................................ 20
1.6.3 Management Role to Support DFM................ 20
1.6.4 Management Focus............................................22
1.6.5 Successful or Counterproductive Metrics
for NPD................................................................24
Resistance to DFM...........................................................25
vii
viii • Contents
1.8 Arbitrary Decisions.........................................................25
1.9 DFM and Design Time...................................................29
1.10 Engineering Change Orders..........................................29
1.11 Do It Right the First Time............................................. 30
1.12 Strategy to Do It Right the First Time......................... 30
1.13 Company Benefits of DFM.............................................32
1.14 Personal Benefits of DFM...............................................33
1.15 Conclusions..................................................................... 34
Notes ............................................................................................35
Chapter 2 Concurrent Engineering................................................... 37
2.1
2.2
Resources..........................................................................37
2.1.1 Front-Loading at Toyota....................................41
Ensuring Resource Availability.....................................41
2.2.1 Prioritization...................................................... 42
2.2.2 Prioritizing Product Portfolios........................ 42
2.2.3 Prioritizing Product Development Projects.... 43
2.2.4 Prioritization at Leading Companies............. 43
2.2.4.1 Prioritization at Apple....................... 43
2.2.4.2 Product Development
Prioritization at HP........................... 44
2.2.4.3 Prioritization at Toyota..................... 44
2.2.4.4 Product Prioritization for Truck
Bodies.................................................. 44
2.2.5 Prioritizing Resources for Custom
Orders, Low-Volume Builds, Legacy
Products, and Spare Parts................................ 44
2.2.6 Develop Acceptance Criteria for Unusual
Orders.................................................................. 46
2.2.7 Make Customizations and
Configurations More Efficient......................... 46
2.2.8 The Package Deal................................................47
2.2.9 Rationalize Products......................................... 48
2.2.10 Maximize Design Efficiency of Existing
Resources.............................................................50
2.2.11 Avoid Product Development Failures..............52
2.2.12 Avoid Supply Chain Distractions.....................52
Contents • ix
2.3
2.4
2.5
2.6
2.7
2.8
2.2.13 Optimize Product Development Project
Scheduling...........................................................53
2.2.14 Ensure Availability of Manufacturing
Engineers.............................................................53
2.2.15 Correct Critical Resource Shortages............... 54
2.2.16 Invest in Product Development Resources..... 54
2.2.16.1 R&D Investment at Medtronic..........55
2.2.16.2 R&D Investment at General
Electric and Siemens...........................55
2.2.16.3 R&D Investment at Apple..................55
2.2.16.4 R&D Investment at Samsung............55
Product Portfolio Planning........................................... 56
Parallel and Future Projects...........................................57
Designing Products as a Team.......................................59
2.5.1 The Problems with Phases, Gates,
Reviews, and Periodic Meetings.......................59
2.5.2 Huddles............................................................... 60
2.5.3 Building Many Models and Doing Early
Experiments........................................................61
2.5.4 Manufacturing Participation............................61
2.5.5 Role of Procurement..........................................62
2.5.6 Team Composition.............................................63
2.5.7 Team Continuity................................................ 64
2.5.8 Part-Time Participation.................................... 64
2.5.9 Using Outside Expertise................................... 64
2.5.10 The Value of Diversity........................................65
2.5.11 Encouraging Honest Feedback.........................65
Vendor Partnerships........................................................65
2.6.1 The Value of Vendor/Partnerships...................65
2.6.2 Vendor/Partnerships Lead to Lower Net
Cost...................................................................... 66
2.6.3 Vendor Partner Selection..................................67
2.6.4 Working with Vendor Partners....................... 68
The Team Leader..............................................................69
2.7.1 The Team Leader at Toyota...............................70
2.7.2 The Team Leader at Motorola...........................71
2.7.3 Team Leaders and Sponsors at Motorola........71
Co-Location......................................................................71
x • Contents
2.8.1
Effect of Onshoring on Concurrent
Engineering.........................................................72
2.8.2 The Project Room (The “Great Room” or
Obeya)..................................................................72
2.9 Team Membership and Roles.........................................73
2.9.1 Manufacturing and Service..............................74
2.9.2 Tooling Engineers...............................................74
2.9.3 Purchasing and Vendors....................................74
2.9.4 Marketing............................................................75
2.9.5 Customers............................................................75
2.9.6 Industrial Designers...........................................76
2.9.7 Quality and Test.................................................77
2.9.8 Finance.................................................................77
2.9.9 Regulatory Compliance.....................................77
2.9.10 Factory Workers.................................................78
2.9.11 Specialized Talent...............................................78
2.9.12 Other Projects.....................................................78
2.10 Outsourcing Engineering...............................................79
2.10.1 Which Engineering Could Be Outsourced?.....81
2.11 Product Definition...........................................................82
2.11.1 Understanding Customer Needs......................82
2.11.2 Writing Product Requirements........................83
2.11.3 Consequences of Poor Product Definition.... 84
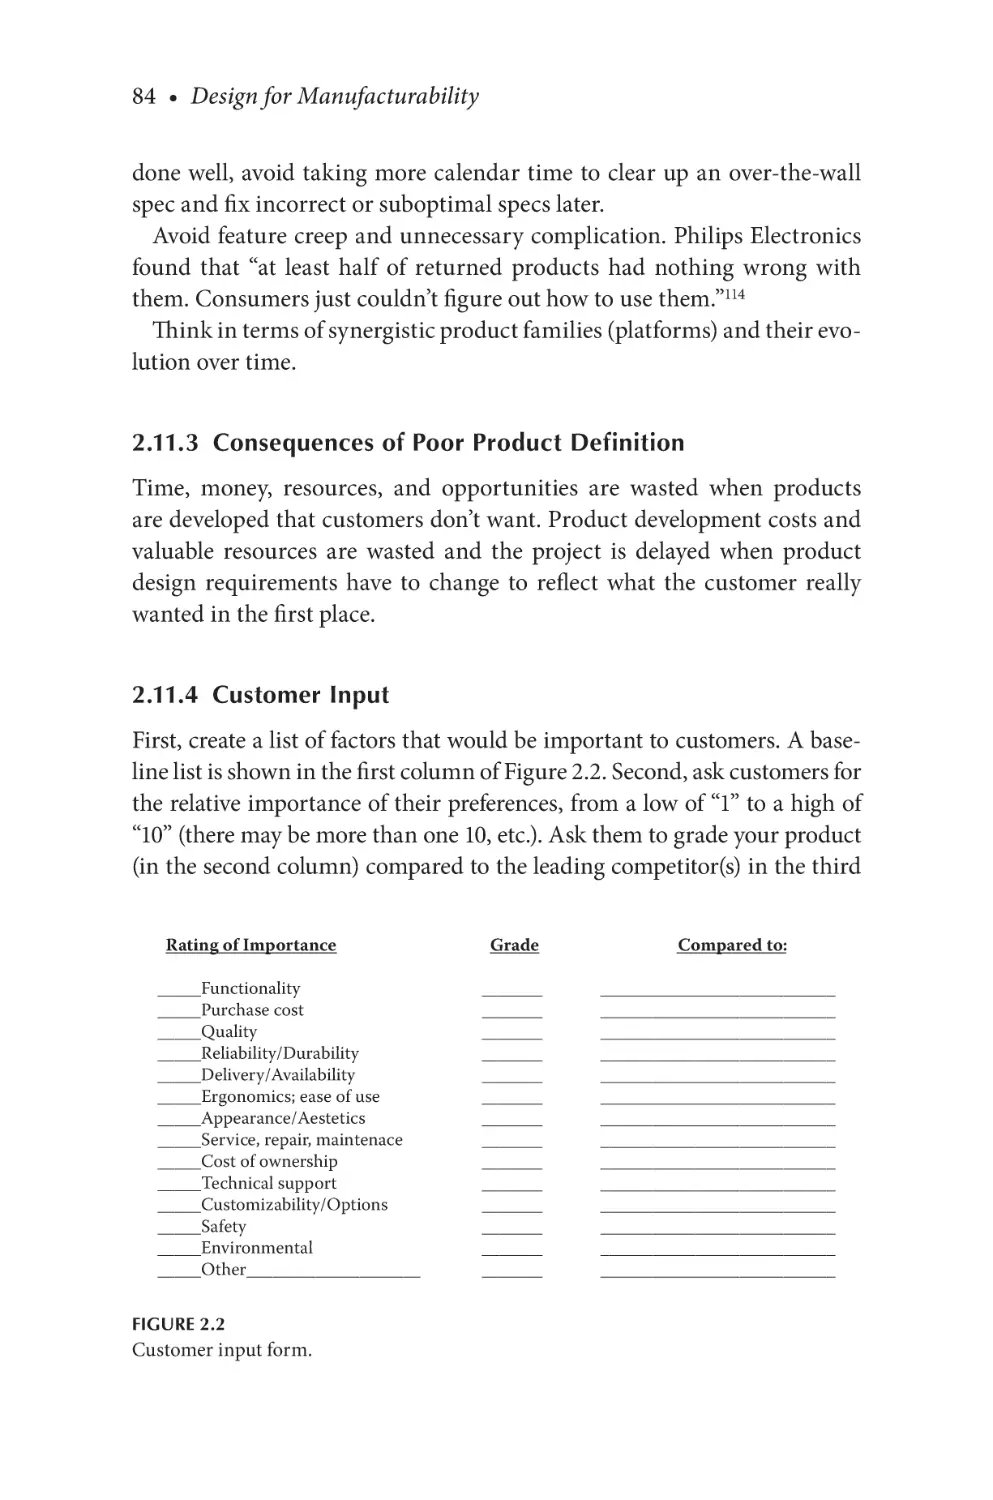
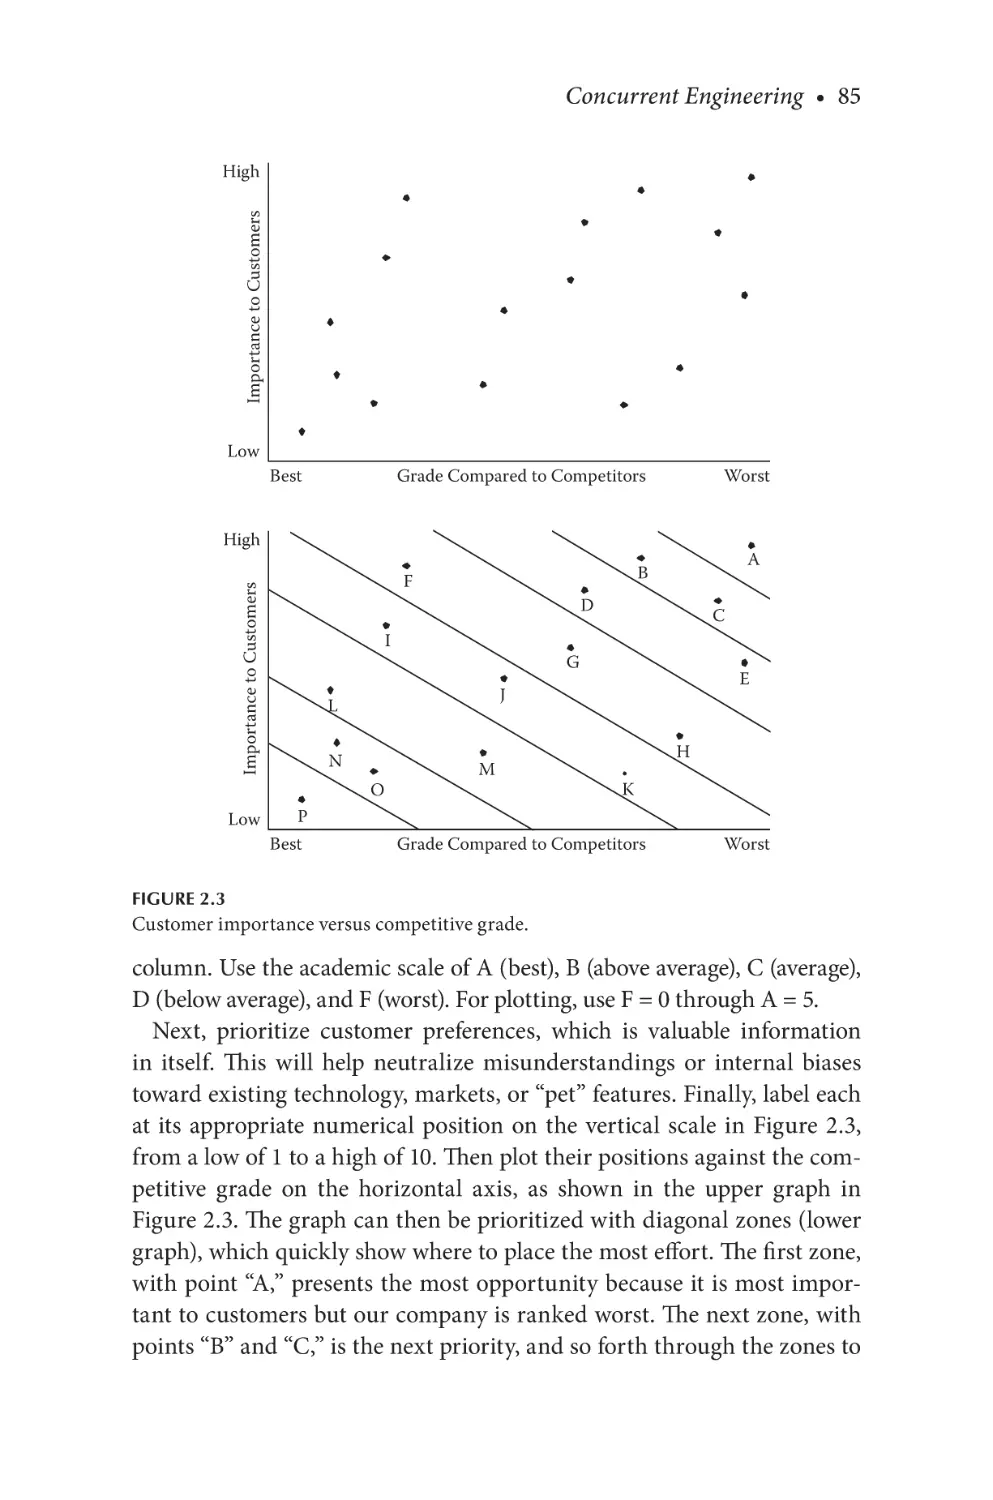
2.11.4 Customer Input.................................................. 84
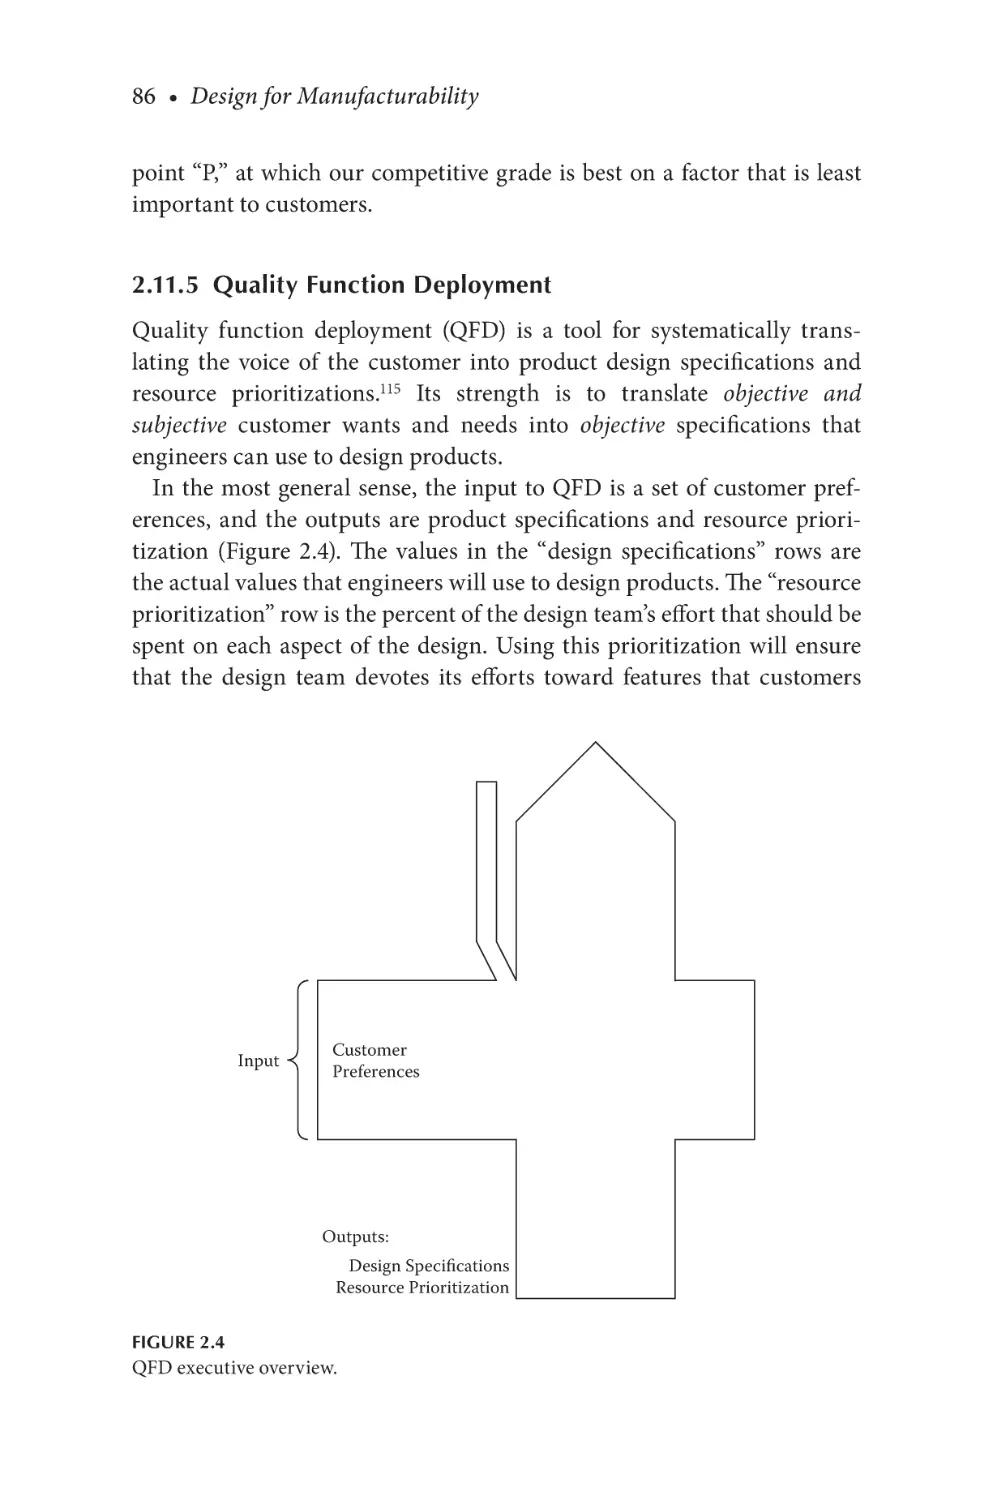
2.11.5 Quality Function Deployment........................ 86
2.11.6 How QFD Works................................................87
Notes ............................................................................................89
Chapter 3 Designing the Product...................................................... 95
3.1
Design Strategy............................................................... 96
3.1.1 Designing around Standard Parts................... 96
3.1.1.1 Sheet Metal.......................................... 96
3.1.1.2 Bar Stock..............................................97
3.1.2 Consolidation......................................................97
3.1.3 Off-the-Shelf Parts..............................................97
3.1.4 Proven Processing..............................................98
3.1.5 Proven Designs, Parts, and Modules...............98
3.1.6 Arbitrary Decisions............................................98
Contents • xi
3.2
3.3
3.1.7 Overconstraints................................................. 99
3.1.8 Tolerances........................................................... 99
3.1.9 Minimizing Tolerance Demands.................... 99
3.1.10 System Integration........................................... 100
3.1.11 Optimizing All Design Strategies................. 100
3.1.12 Design Strategy for Electrical Systems..........101
3.1.13 Electrical Connections: Best to Worst...........101
3.1.14 Optimizing Use of Flex Layers.......................103
3.1.15 Voltage Standardization..................................103
3.1.16 DFM for Printed Circuit Boards....................104
Importance of Thorough Up-Front Work..................105
3.2.1 Thorough Up-Front Work at Toyota..............107
3.2.2 Thorough Up-Front Work at Motorola.........108
3.2.3 Thorough Up-Front Work at IDEO...............108
3.2.4 Avoid Compromising Up-Front Work..........108
3.2.4.1 Slow Processes for Sales and
Contracts............................................108
3.2.4.2 Rushing NPD for Long-Lead-
Time Parts..........................................108
3.2.4.3 Rushing NPD for Early
Evaluation Units................................109
3.2.5 Early Evaluation Units.....................................109
Optimizing Architecture and System Design...........110
3.3.1 Generic Product Definition.............................110
3.3.2 Team Composition and Availability..............110
3.3.3 Product Development Approach....................111
3.3.4 Lessons Learned...............................................111
3.3.4.1 Categories of Lessons Learned........111
3.3.4.2 Methodologies for Lessons
Learned...............................................111
3.3.5 Raising and Resolving Issues Early................112
3.3.5.1 Project Issues.....................................113
3.3.5.2 Team Issues........................................113
3.3.5.3 Mitigating Risk..................................114
3.3.5.4 New Technologies.............................114
3.3.5.5 Techniques to Resolve Issues Early....114
3.3.5.6 Contingency Plans............................115
3.3.5.7 Achieving Concurrence before
Proceeding.........................................115
xii • Contents
3.3.6
3.3.7
3.3.8
3.3.9
3.3.10
3.3.11
3.4
3.5
Manual Tasks....................................................115
Skill and Judgment...........................................116
Technical or Functional Challenges..............117
Commercialization...........................................118
Manufacturable Science..................................119
Concept/Architecture Design
Optimization.....................................................119
3.3.12 Optimizing the Use of CAD in the
Concept/Architecture Phase.......................... 120
3.3.13 Concept Simplification....................................121
3.3.14 Manufacturing and Supply Chain
Strategies........................................................... 122
Part Design Strategies.................................................. 123
Design for Everything (DFX)..................................... 126
3.5.1 Function............................................................ 126
3.5.2 Cost.................................................................... 126
3.5.3 Delivery..............................................................127
3.5.4 Quality and Reliability.....................................127
3.5.5 Ease of Assembly..............................................127
3.5.6 Ability to Test................................................... 128
3.5.7 Ease of Service and Repair............................. 128
3.5.8 Supply Chain Management............................ 128
3.5.9 Shipping and Distribution..............................129
3.5.10 Packaging...........................................................129
3.5.11 Human Factors.................................................129
3.5.12 Appearance and Style......................................130
3.5.13 Safety..................................................................130
3.5.14 Customers’ Needs.............................................130
3.5.15 Breadth of Product Line..................................130
3.5.16 Product Customization....................................131
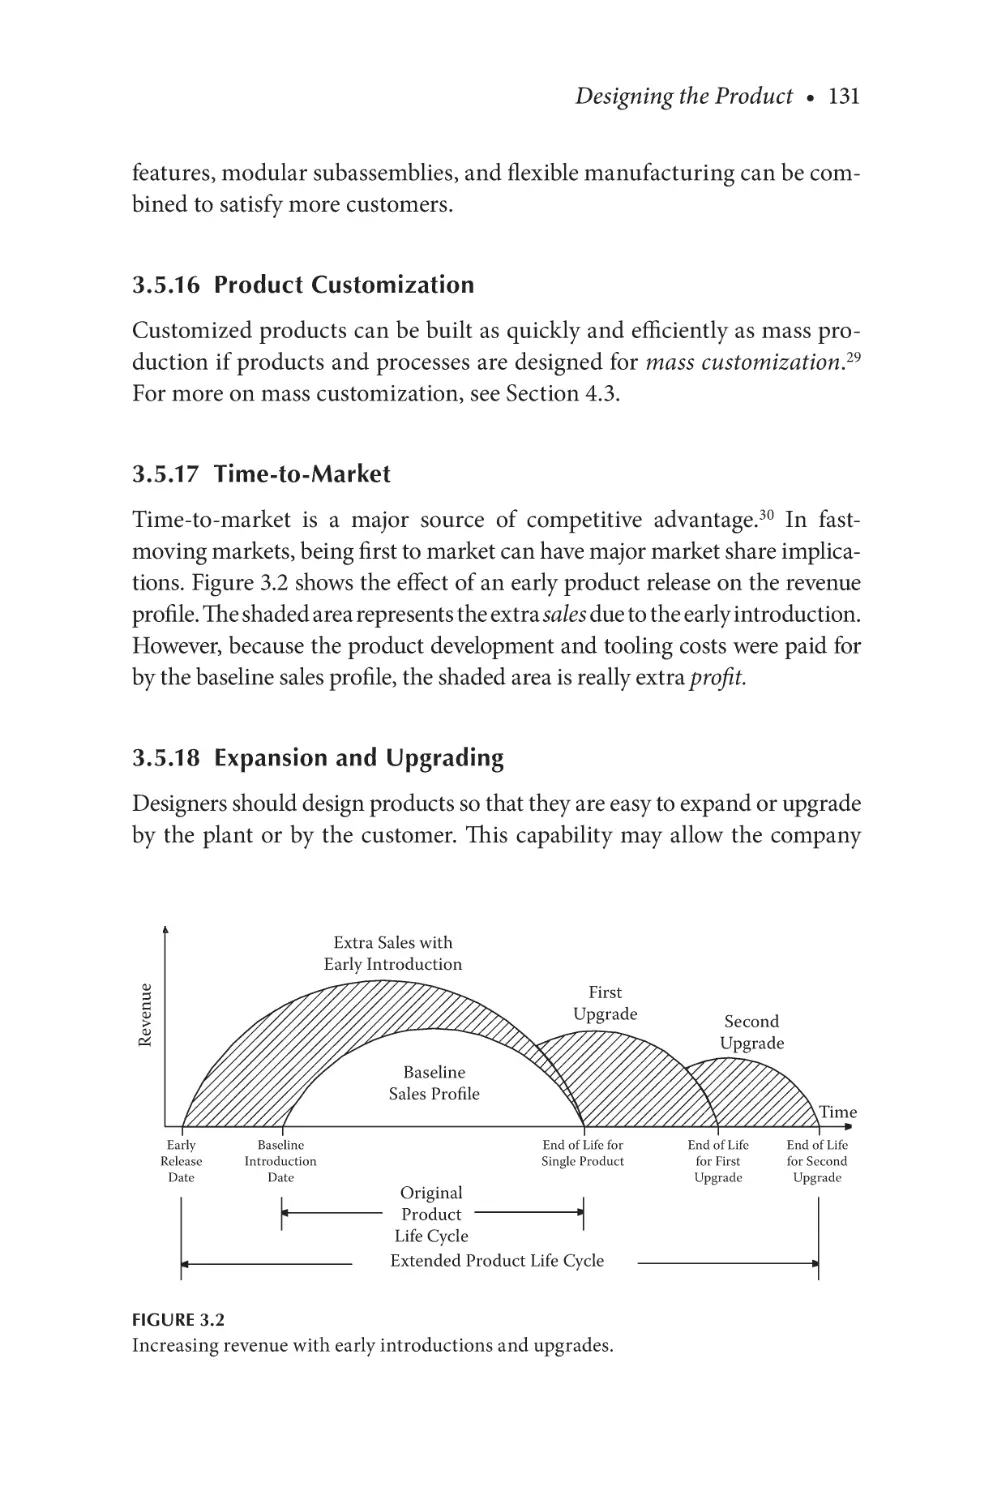
3.5.17 Time-to-Market................................................131
3.5.18 Expansion and Upgrading..............................131
3.5.19 Future Designs..................................................132
3.5.20 Environmental Considerations......................132
3.5.20.1 Product Pollution..............................132
3.5.20.2 Processing Pollution.........................132
3.5.20.3 Ease of Recycling Products..............133
3.5.21 Summary...........................................................133
Contents • xiii
3.6
Creative Product Development................................... 134
3.6.1 Generating Creative Ideas.............................. 134
3.6.2 Generating Ideas at Leading Companies......135
3.6.3 Encouraging innovation at Medtronic..........136
3.6.4 Nine Keys to Creativity....................................136
3.6.5 Creativity in a Team.........................................137
3.6.6 The Ups and Downs of Creativity..................138
3.7 Brainstorming................................................................139
3.8 Half-Cost Product Development.................................140
3.8.1 Prerequisites for Half-Cost Development.....140
3.8.1.1 Total Cost...........................................140
3.8.1.2 Rationalization..................................140
3.8.2 Designing Half-Cost Products.......................141
Notes ..........................................................................................142
Section II Flexibility
Chapter 4 Designing for Lean and Build-to-Order........................ 147
4.1
4.2
4.3
4.4
4.5
4.6
Lean Production............................................................147
4.1.1 Flow Manufacturing........................................148
4.1.2 Prerequisites......................................................149
Build-to-Order...............................................................149
4.2.1 Supply Chain Simplification...........................150
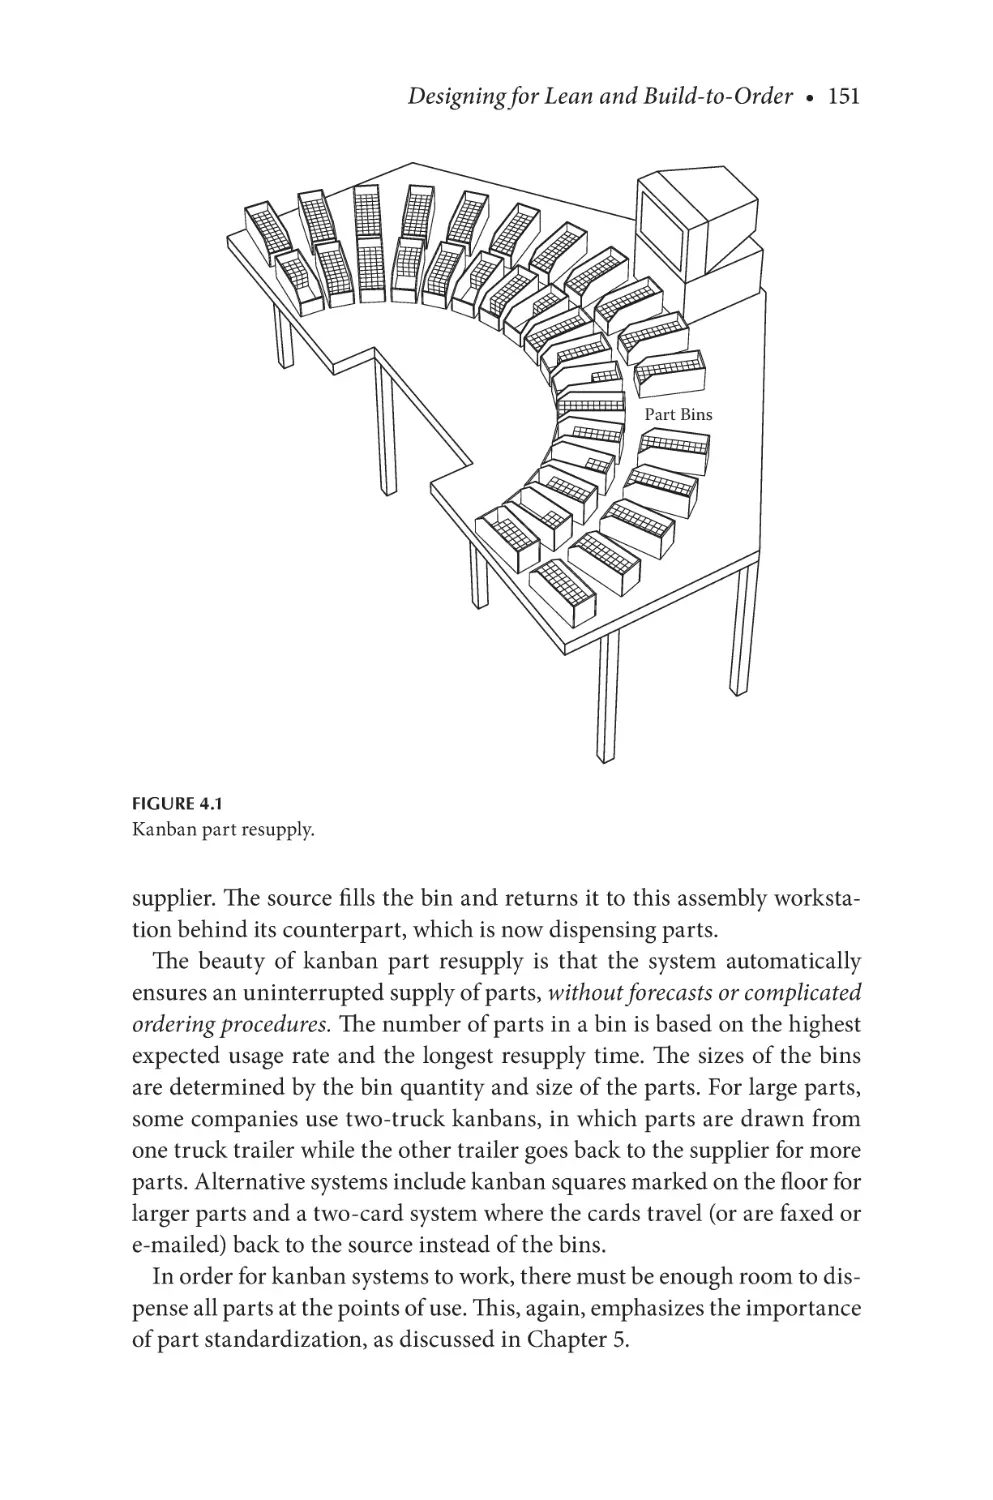
4.2.2 Kanban Automatic Part Resupply..................150
Mass Customization......................................................152
Developing Products for Lean, Build-to-Order,
and Mass Customization..............................................153
Portfolio Planning for Lean, Build-to-Order, and
Mass Customization..................................................... 154
Designing Products for Lean, Build-to-Order,
and Mass Customization............................................. 154
4.6.1 Designing around Standard Parts..................155
4.6.2 Designing to Reduce Raw Material Variety....156
4.6.3 Designing around Readily Available
Parts and Materials..........................................156
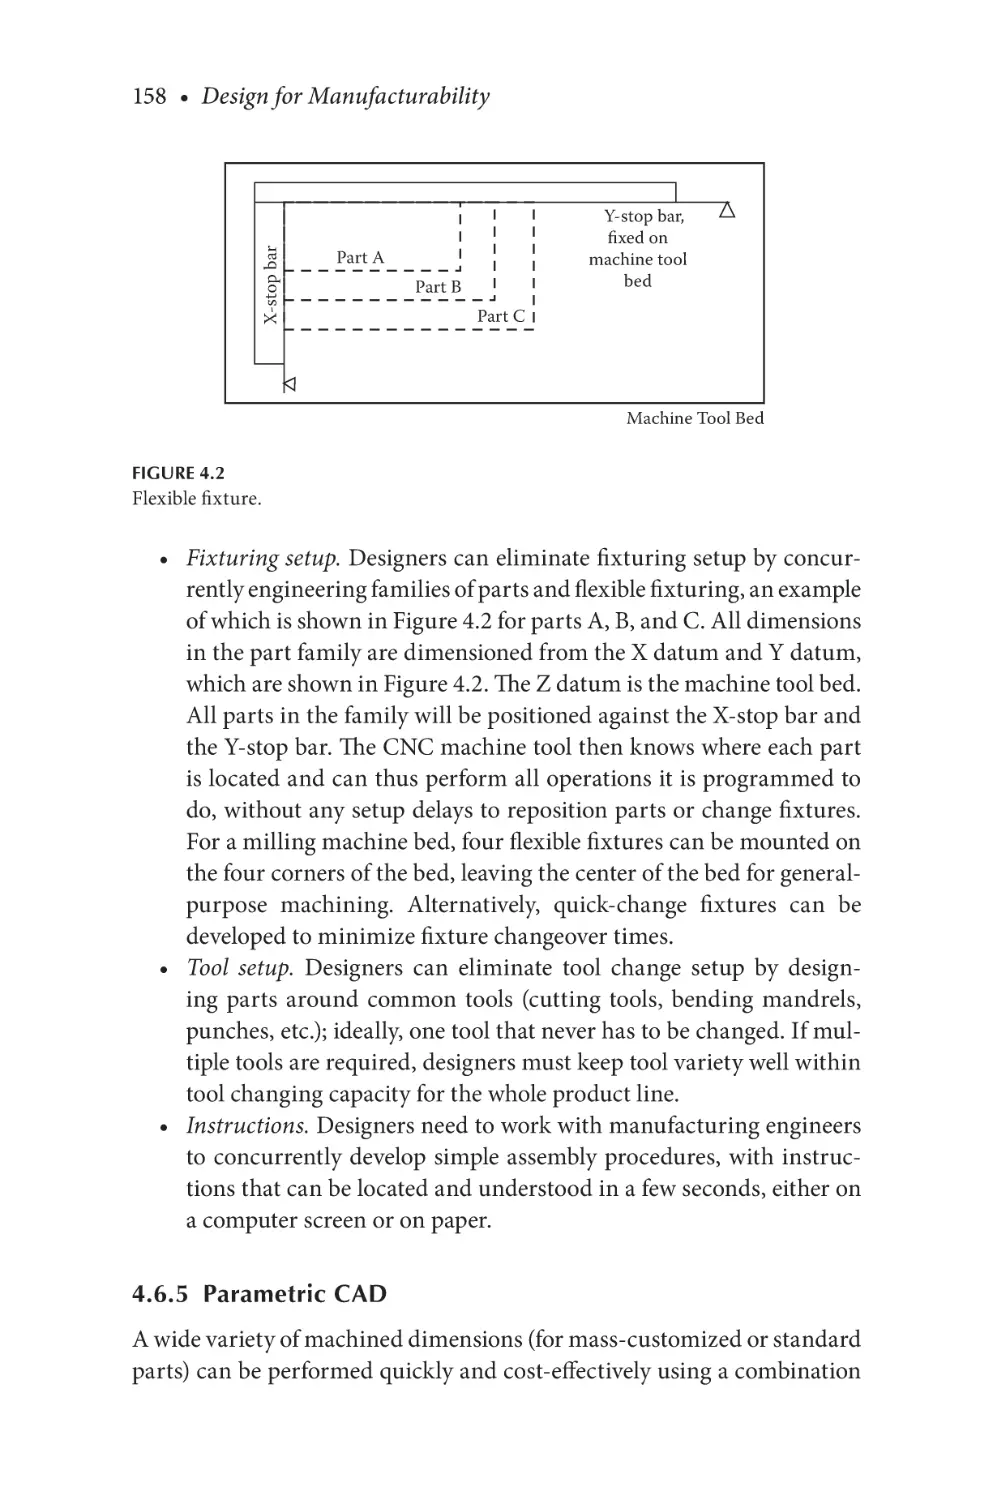
4.6.4 Designing for No Setup...................................157
4.6.5 Parametric CAD...............................................158
xiv • Contents
4.6.6
4.6.7
4.6.8
4.6.9
4.6.10
Designing for CNC...........................................159
Grouping Parts..................................................159
Understanding CNC........................................159
Eliminating CNC setup...................................160
Developing Synergistic Families of
Products.............................................................160
4.6.11 Strategy for Designing Product Families......161
4.6.12 Designing Products in Synergistic
Product Families...............................................161
4.7 Modular Design.............................................................163
4.7.1 Pros and Cons of Modular Design.................163
4.7.2 Modular Design Principles.............................165
4.8 Offshoring and Manufacturability..............................166
4.8.1 Offshoring’s Effect on Product
Development.....................................................166
4.8.2 Offshoring’s Effect on Lean Production
and Quality........................................................167
4.8.3 Offshoring Decisions.......................................167
4.8.4 Bottom Line on Offshoring.............................168
4.9 The Value of Lean Build-to-Order and Mass
Customization................................................................169
4.9.1 Cost Advantages of BTO&MC.......................170
4.9.2 Responsive Advantages of BTO&MC............171
4.9.3 Customer Satisfaction from BTO&MC.........172
4.9.4 Competitive Advantages of BTO&MC..........173
4.9.5 Bottom Line Advantages of BTO&MC.........174
Notes...........................................................................................174
Chapter 5 Standardization............................................................... 177
5.1
5.2
5.3
5.4
5.5
Part Proliferation...........................................................179
The Cost of Part Proliferation......................................179
Why Part Proliferation Happens.................................180
Results of Part Proliferation.........................................183
Part Standardization Strategy......................................183
5.5.1 New Products....................................................183
5.5.2 Existing Products.............................................184
Contents • xv
5.6
Early Standardization Steps.........................................184
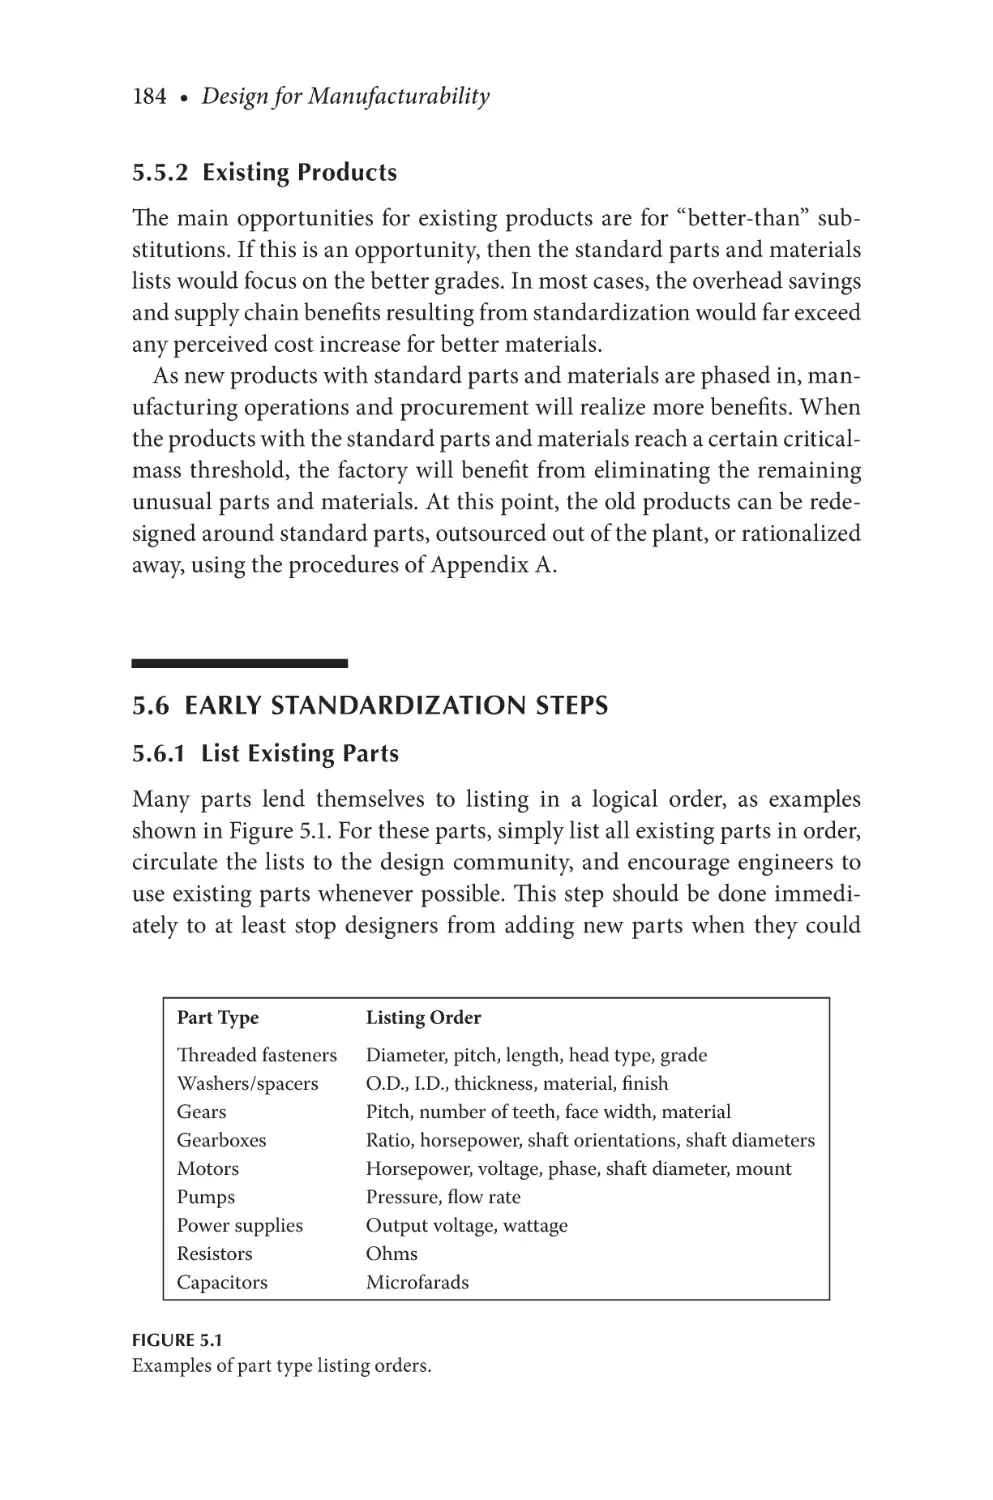
5.6.1 List Existing Parts............................................184
5.6.2 Clean Up Database Nomenclature.................185
5.6.3 Eliminate Approved but Unused Parts.........185
5.6.4 Eliminate Parts Not Used Recently...............185
5.6.5 Eliminate Duplicate Parts...............................185
5.6.6 Prioritize Opportunities..................................186
5.7 Zero-Based Approach...................................................187
5.8 Standard Part List Generation.....................................188
5.9 Part Standardization Results.......................................193
5.10 Raw Materials Standardization...................................194
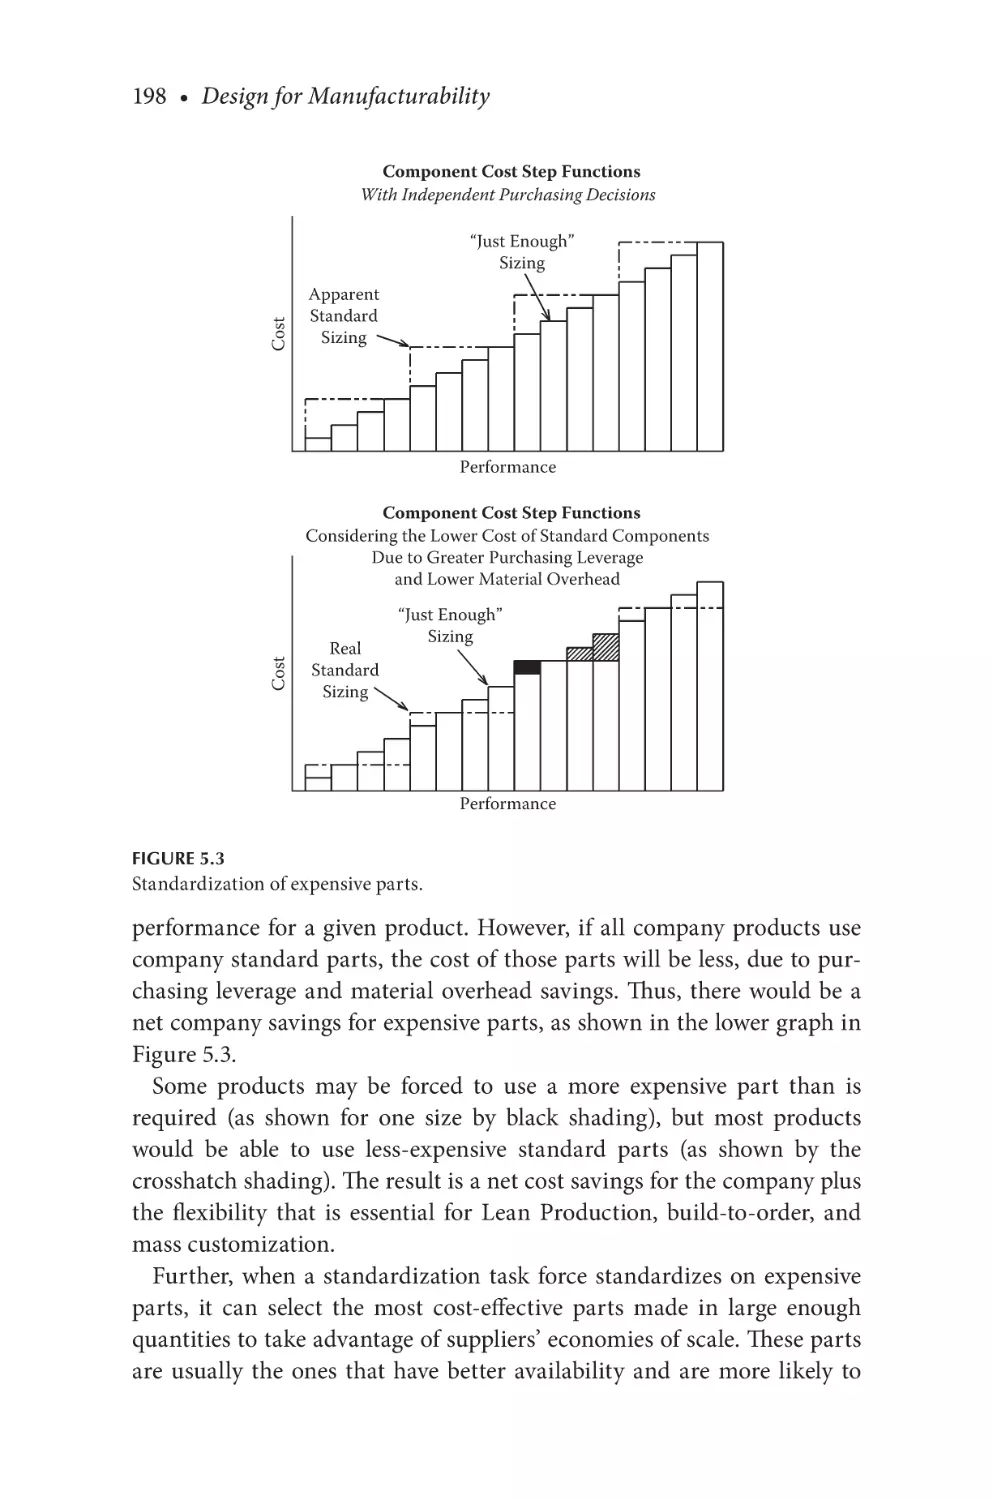
5.11 Standardization of Expensive Parts............................197
5.12 Consolidation of Inflexible Parts.................................199
5.12.1 Custom Silicon Consolidation........................201
5.12.2 VLSI/ASIC Consolidation...............................201
5.12.3 Consolidated Power Supply at
Hewlett-Packard.............................................. 203
5.13 Tool Standardization.................................................... 203
5.14 Feature Standardization.............................................. 204
5.15 Process Standardization.............................................. 205
5.16 Encouraging Standardization..................................... 205
5.17 Reusing Designs, Parts, and Modules....................... 208
5.17.1 Obstacles to Reusable Engineering............... 209
5.17.2 Reuse Studies.................................................... 209
5.18 Off-the-Shelf Parts.........................................................210
5.18.1 Optimizing the Utilization of Off-the-
Shelf Parts..........................................................210
5.18.2 When to Use Off-the-Shelf Parts...................211
5.18.3 Finding Off-the-Shelf Parts.............................212
5.19 New Role of Procurement.............................................213
5.19.1 How to Search for Off-the-Shelf Parts...........213
5.19.2 Maximizing Availability and
Minimizing Lead Times..................................215
5.20 Standardization Implementation................................216
Notes...........................................................................................218
xvi • Contents
Section III Cost Reduction
Chapter 6 Minimizing Total Cost by Design.................................. 221
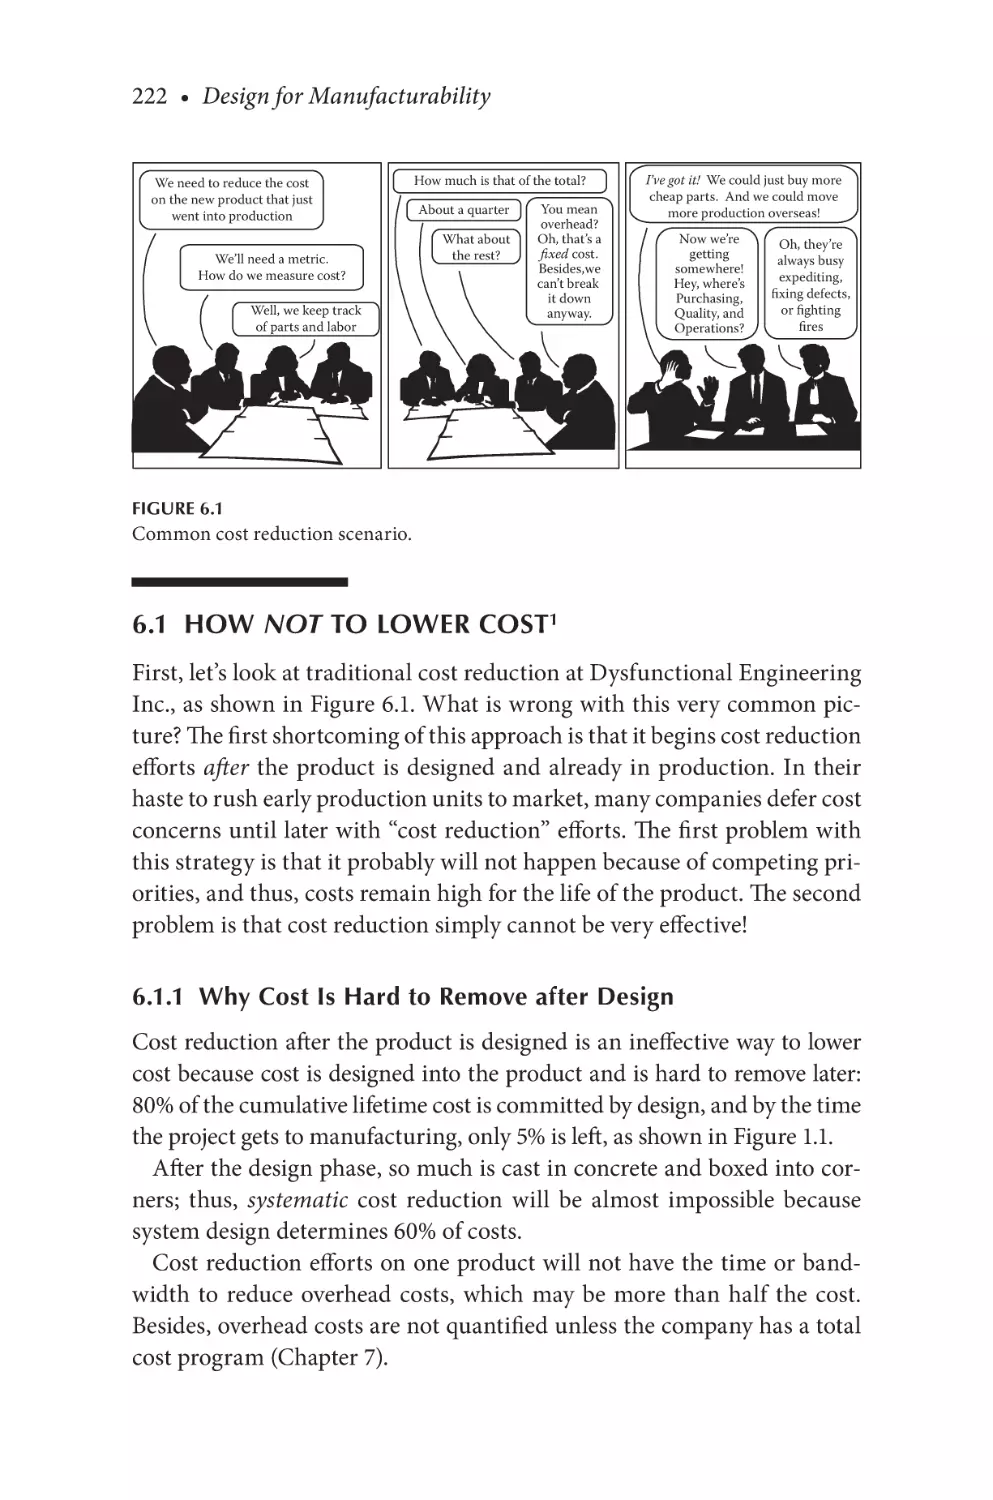
How Not to Lower Cost............................................... 222
6.1.1 Why Cost Is Hard to Remove after Design.... 222
6.1.2 Cost-Cutting Doesn’t Work........................... 224
6.2 Cost Measurements...................................................... 224
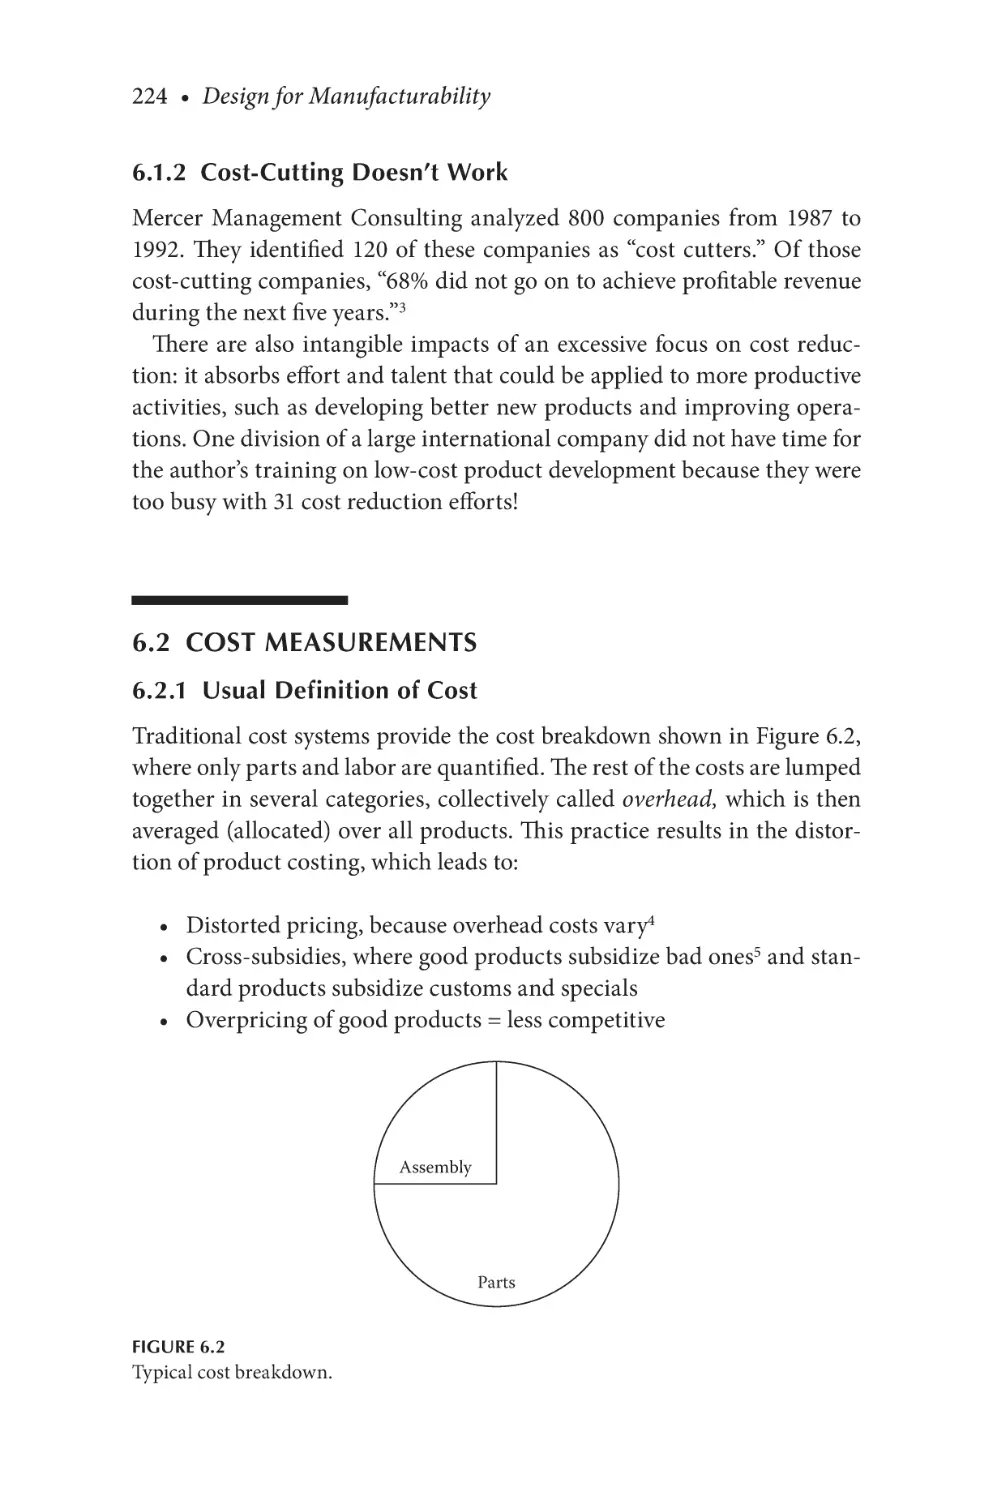
6.2.1 Usual Definition of Cost................................. 224
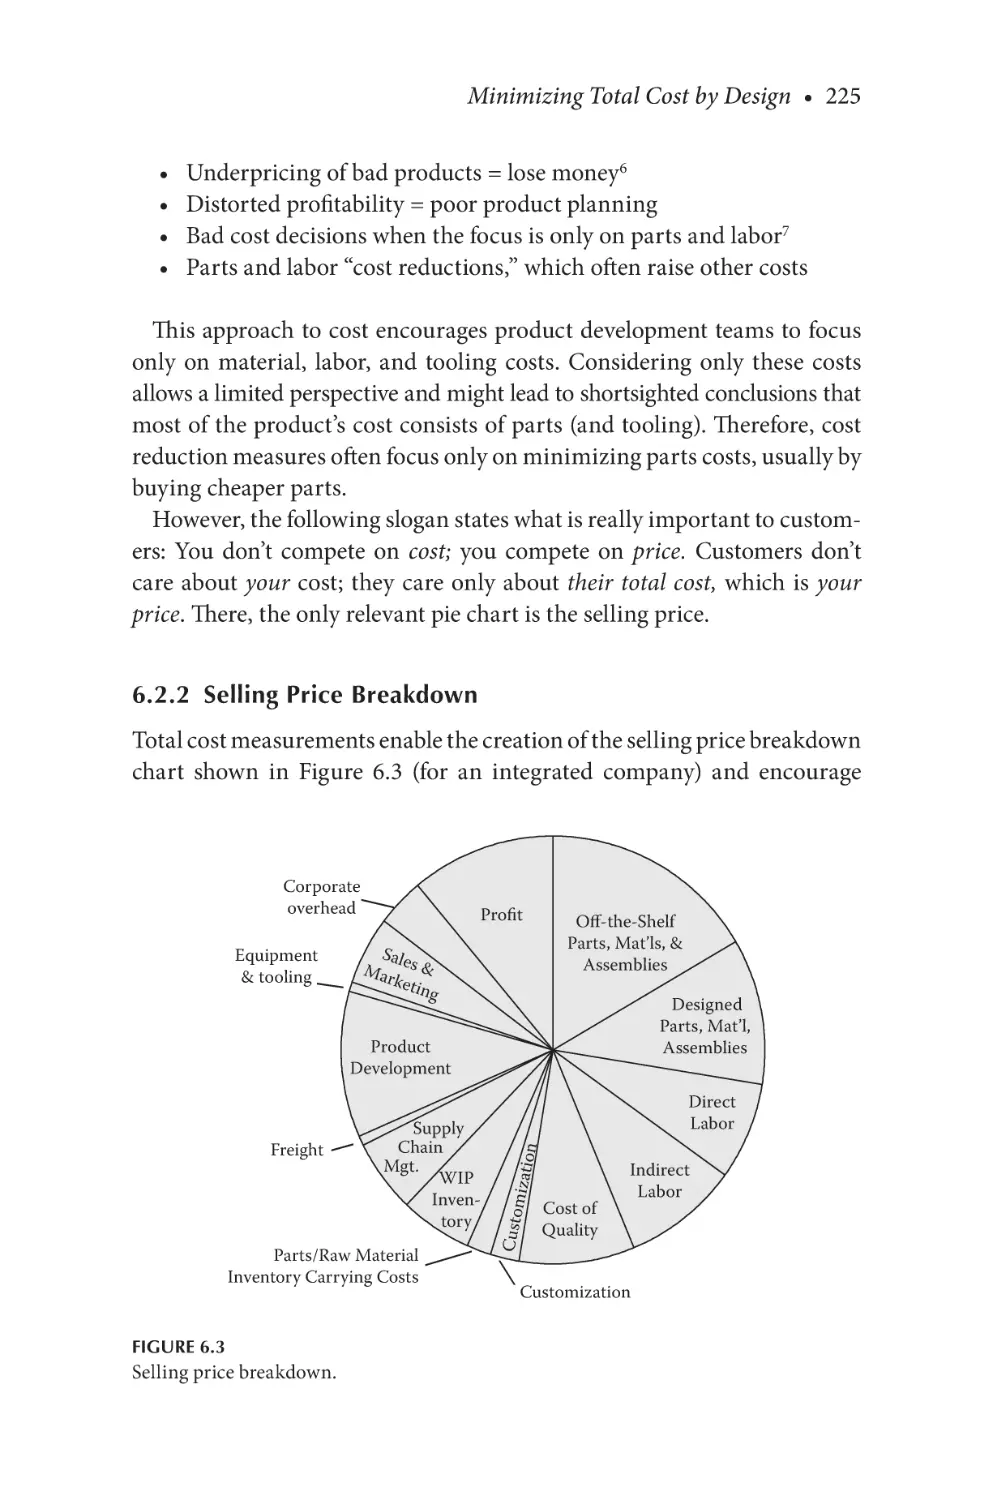
6.2.2 Selling Price Breakdown................................. 225
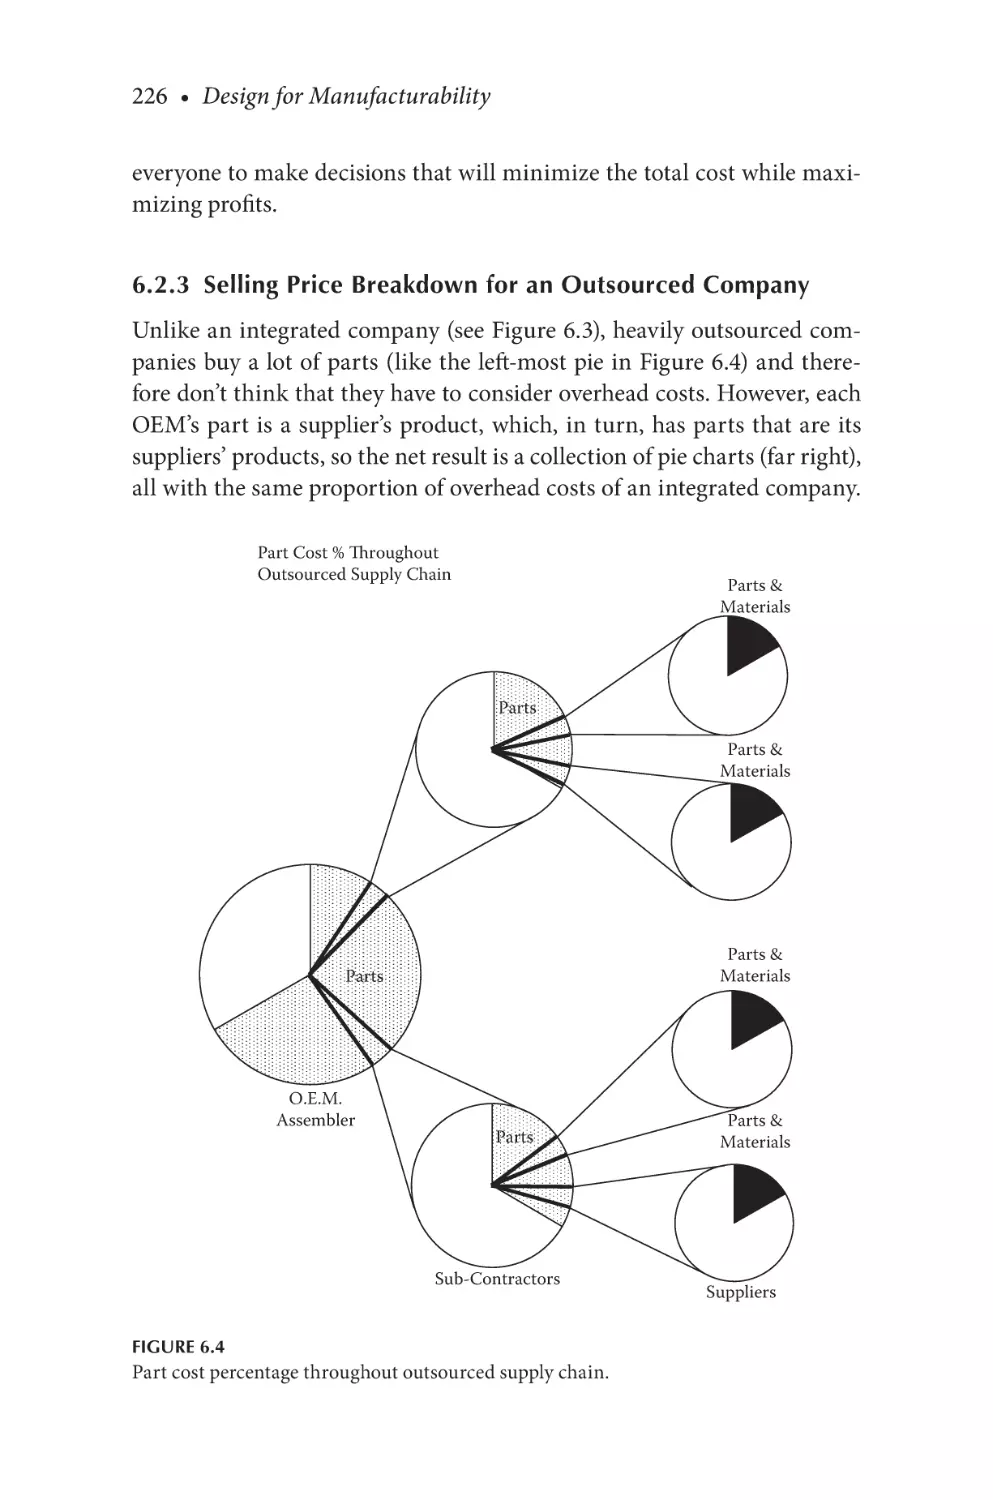
6.2.3 Selling Price Breakdown for an
Outsourced Company..................................... 226
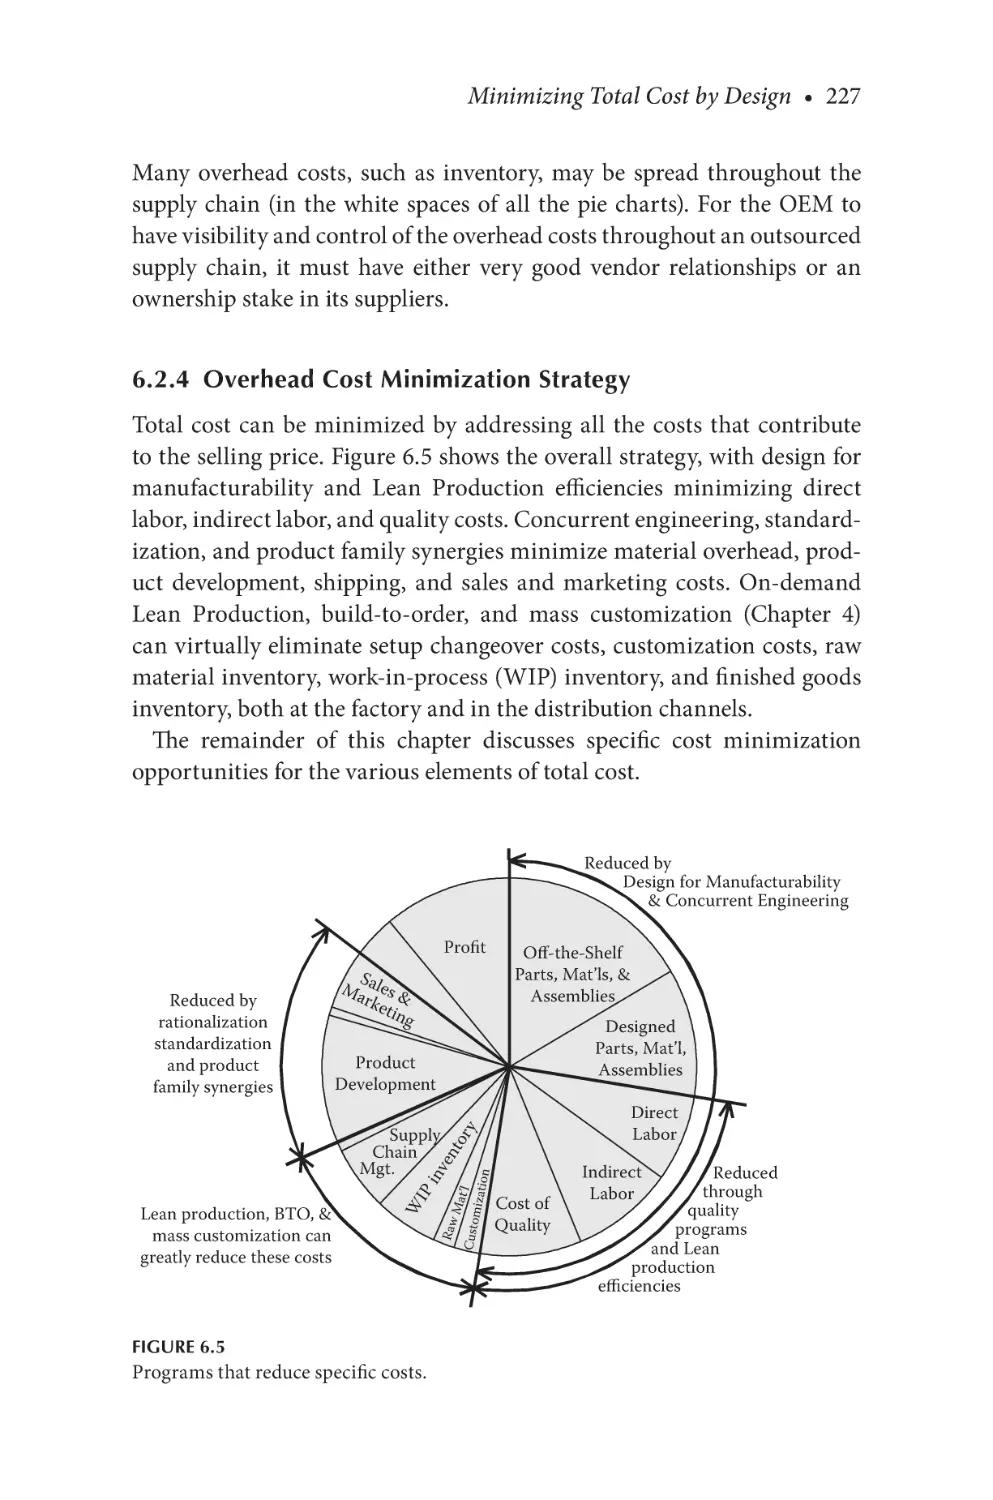
6.2.4 Overhead Cost Minimization Strategy........ 227
6.3 Strategy to Cut Total Cost in Half.............................. 228
6.4 Minimizing Cost through Design.............................. 229
6.5 Minimizing Overhead Costs....................................... 230
6.6 Minimizing Product Development Expenses............231
6.6.1 Product Portfolio Planning.............................231
6.6.2 Multifunctional Design Teams.......................231
6.6.3 Methodical Product Definition......................232
6.6.4 Total Cost Decision Making...........................232
6.6.5 Design Efficiency..............................................232
6.6.6 Off-the-Shelf Parts............................................233
6.6.7 Product Life Extensions...................................233
6.6.8 Debugging Costs..............................................233
6.6.9 Test Cost............................................................233
6.6.10 Product Development Expenses.................... 234
6.6.11 More Efficient Development Costs Less....... 234
6.6.12 Product Development Risk............................ 234
6.7 Cost Savings of Off-the-Shelf Parts............................ 234
6.8 Minimizing Engineering Change Order Costs.........235
6.9 Minimizing Cost of Quality........................................235
6.10 Rational Selection of Lowest Cost Supplier...............237
6.11 Low Bidding.................................................................. 238
6.11.1 Cost Reduction Illusion...................................239
6.11.2 Cost of Bidding................................................ 240
6.11.3 Pressuring Suppliers for Lower Cost.............241
6.11.4 The Value of Relationships for Cost
Reduction.......................................................... 242
6.1
Contents • xvii
6.11.5 Cheap Parts: Save Now, Pay Later................. 243
6.11.6 Reduce Total Cost Instead of Focusing
on Cheap Parts................................................. 244
6.11.7 Value of High-Quality Parts.......................... 244
6.12 Maximizing Factory Efficiency................................... 245
6.13 Lowering Overhead Costs with Flexibility............... 245
6.14 Minimizing Customization/Configuration Costs... 246
6.15 Minimizing the Cost of Variety................................. 247
6.15.1 Work-in-Process Inventory............................ 247
6.15.2 Floor Space....................................................... 248
6.15.3 Internal Logistics............................................. 248
6.15.4 Utilization......................................................... 248
6.15.5 Setup Costs....................................................... 249
6.15.6 Flexibility.......................................................... 249
6.15.7 Kitting Costs.................................................... 250
6.16 Minimizing Materials Management Costs............... 250
6.17 Minimizing Marketing Costs..................................... 250
6.18 Minimizing Sales/Distribution Costs.........................251
6.19 Minimizing Supply Chain Costs.................................251
6.20 Minimizing Life Cycle Costs.......................................251
6.20.1 Reliability Costs................................................252
6.20.2 Field Logistics Costs.........................................252
6.21 Saving Cost with Build-to-Order................................252
6.21.1 Factory Finished Goods Inventory................252
6.21.2 Dealer Finished Goods Inventory..................253
6.21.3 Supply Chain Inventory...................................253
6.21.4 Interest Expense............................................... 254
6.21.5 Write-Offs......................................................... 254
6.21.6 New Technology Introduction...................... 254
6.21.7 MRP Expenses................................................. 254
6.22 Effect of Counterproductive Cost Reduction........... 254
Notes ..........................................................................................255
Chapter 7 Total Cost......................................................................... 259
7.1
Value of Total Cost....................................................... 260
7.1.1 Value of Prioritization and Portfolio
Planning............................................................ 260
7.1.2 Value of Product Development.......................261
xviii • Contents
7.1.3
Value of Resource Availability and
Efficiency............................................................261
7.1.4 Value of Knowing the Real Profitability.......261
7.1.5 Value of Quantifying All Overhead Costs.... 262
7.1.6 Value of Supply Chain Management............ 262
7.2 Quantifying Overhead Costs...................................... 262
7.2.1 Distortions in Product Costing..................... 263
7.2.2 Cross-Subsidies................................................ 263
7.2.3 Relevant Decision Making............................. 264
7.2.4 Cost Management........................................... 265
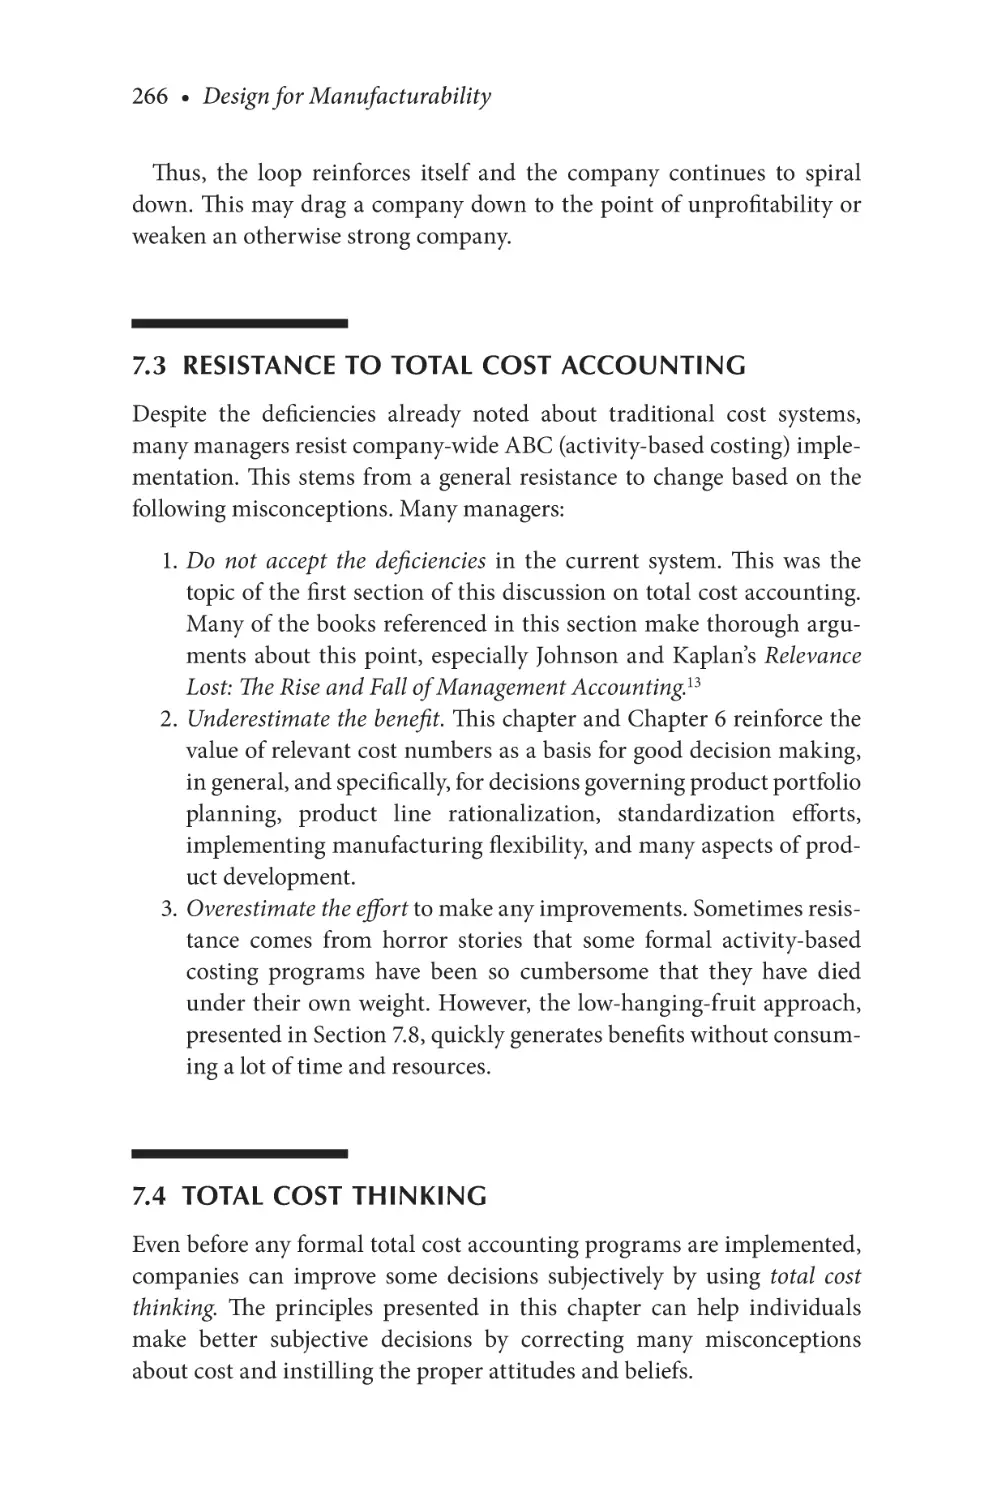
7.2.5 Downward Spirals........................................... 265
7.3 Resistance to Total Cost Accounting......................... 266
7.4 Total Cost Thinking..................................................... 266
7.5 Implementing Total Cost Accounting....................... 268
7.6 Cost Drivers................................................................... 269
7.6.1 Tektronix Portable Instruments Division.....270
7.6.2 HP Roseville Network Division (RND)........271
7.6.3 HP Boise Surface Mount Center....................271
7.7 Tracking Product Development Expenses.................272
7.8 “abc”: The Low-Hanging-Fruit Approach..................273
7.8.1 Estimates............................................................274
7.8.2 Implementing “abc”.........................................274
7.9 Implementation Efforts.................................................275
7.10 Typical Results of Total Cost Implementations.........276
Notes ......................................................................................... 277
Section IV
Design Guidelines
Chapter 8 DFM Guidelines For Product Design............................ 281
8.1
8.2
8.3
8.4
8.5
Design for Assembly......................................................281
8.1.1 Combining Parts............................................. 282
Assembly Design Guidelines...................................... 283
Fastening Guidelines.................................................... 288
Assembly Motion Guidelines...................................... 290
Test Stragedy and Guidelines...................................... 292
Contents • xix
8.6
Testing in Quality versus Building in Quality......... 294
8.6.1 Testing in Quality with Diagnostic Tests..... 294
8.6.2 Building in Quality to Eliminate
Diagnostic Tests................................................295
8.7 Design for Repair and Maintenance...........................295
8.8 Repair Design Guidelines.............................................295
8.9 Design for Service and Repair.................................... 299
8.10 Maintenance...................................................................301
8.11 Maintenance Measurements........................................301
8.11.1 Mean Time to Repair.......................................301
8.11.2 Availability....................................................... 302
8.12 Designing for Maintenance Guidelines..................... 302
Notes ......................................................................................... 304
Chapter 9 DFM Guidelines for Part Design................................... 305
9.1
9.2
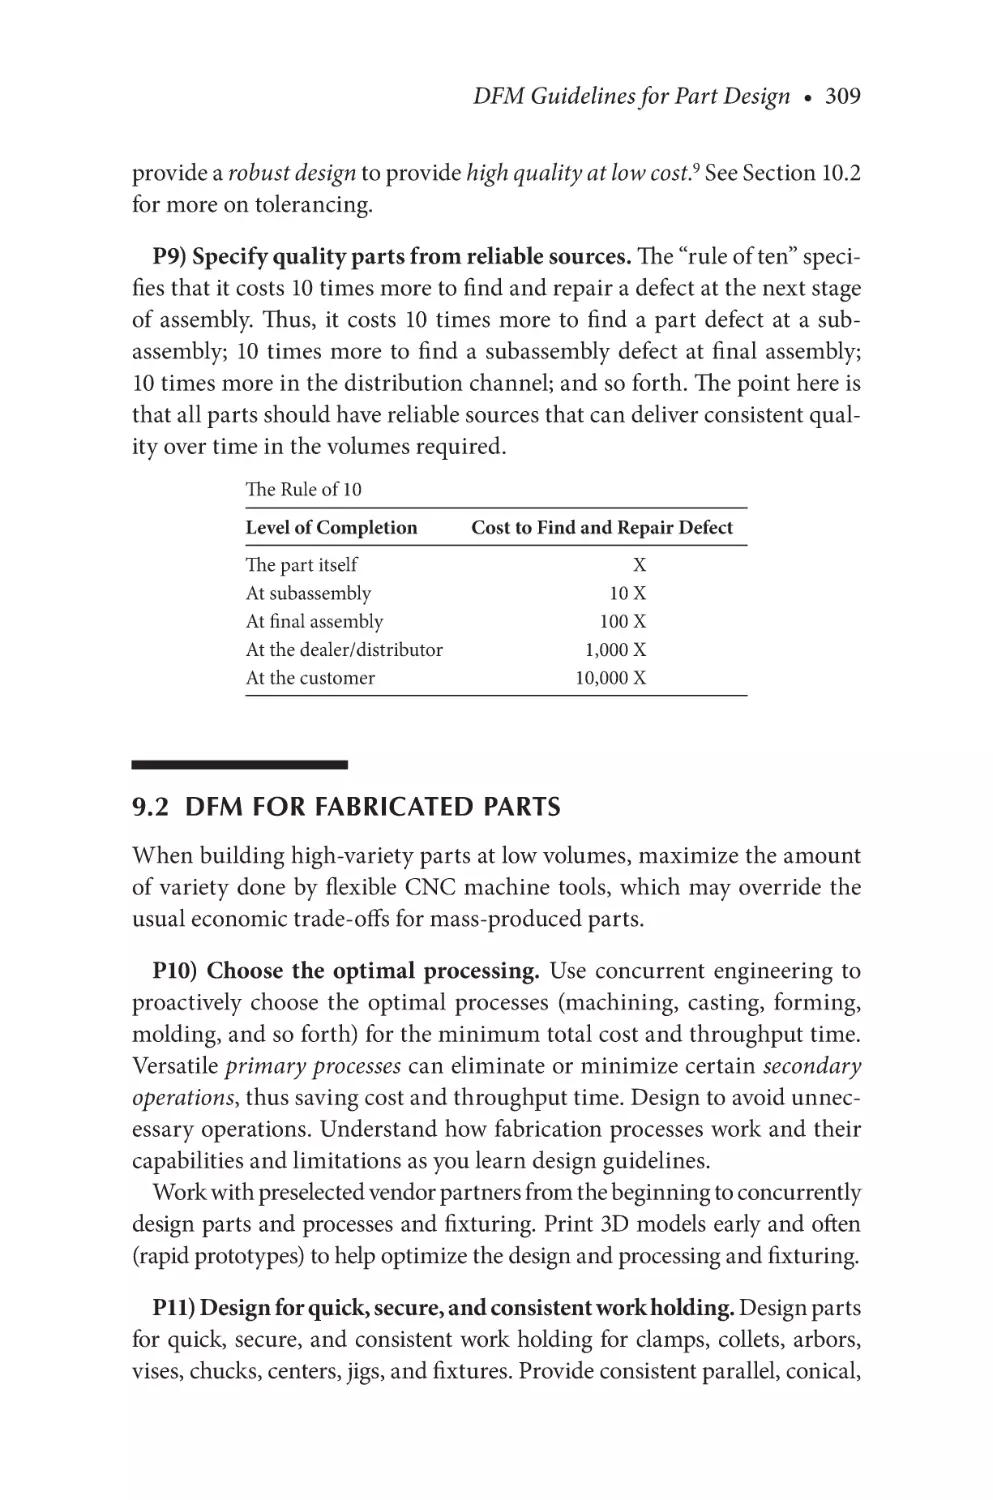
9.3
9.4
9.5
9.6
Part Design Guidelines................................................ 306
DFM for Fabricated Parts............................................ 309
DFM for Castings and Molded Parts..........................315
9.3.1 DFM Strategies for Castings...........................315
9.3.2 DFM Strategies for Plastics.............................316
DFM for Sheet Metal.....................................................317
DFM for Welding...........................................................319
9.5.1 Understanding Limitations and
Complications...................................................319
9.5.2 Optimize Weldment Strategy for
Manufacturability........................................... 320
9.5.3 Adhere to Design Guidelines......................... 320
9.5.4 Work with Vendors/Partners......................... 320
9.5.5 Print 3D Models................................................321
9.5.6 Learn How to Weld..........................................321
9.5.7 Minimize Skill Demands................................321
9.5.8 Thoroughly Explore Non-Welding
Alternatives.......................................................321
DFM for Large Parts.....................................................321
9.6.1 The Main Problem with Large Parts..............321
9.6.2 Other Costs.......................................................322
9.6.3 Residual Stresses...............................................322
xx • Contents
9.6.4 Loss of Strength................................................322
9.6.5 Strategy..............................................................323
9.6.6 Approach...........................................................323
9.6.7 Procedure...........................................................323
9.6.8 Results............................................................... 324
Notes...........................................................................................325
Section V Customer Satisfaction
Chapter 10 Design for Quality........................................................... 329
10.1 Quality Design Guidelines...........................................330
10.2 Tolerances.......................................................................334
10.2.1 Excessively Tight Tolerances...........................334
10.2.2 Worst-Case Tolerancing..................................335
10.2.3 Tolerance Strategy............................................335
10.2.4 Block Tolerances...............................................336
10.2.5 Taguchi Method™ for Robust Design..........336
10.3 Cumulative Effects on Product Quality.....................337
10.3.1 Example.............................................................338
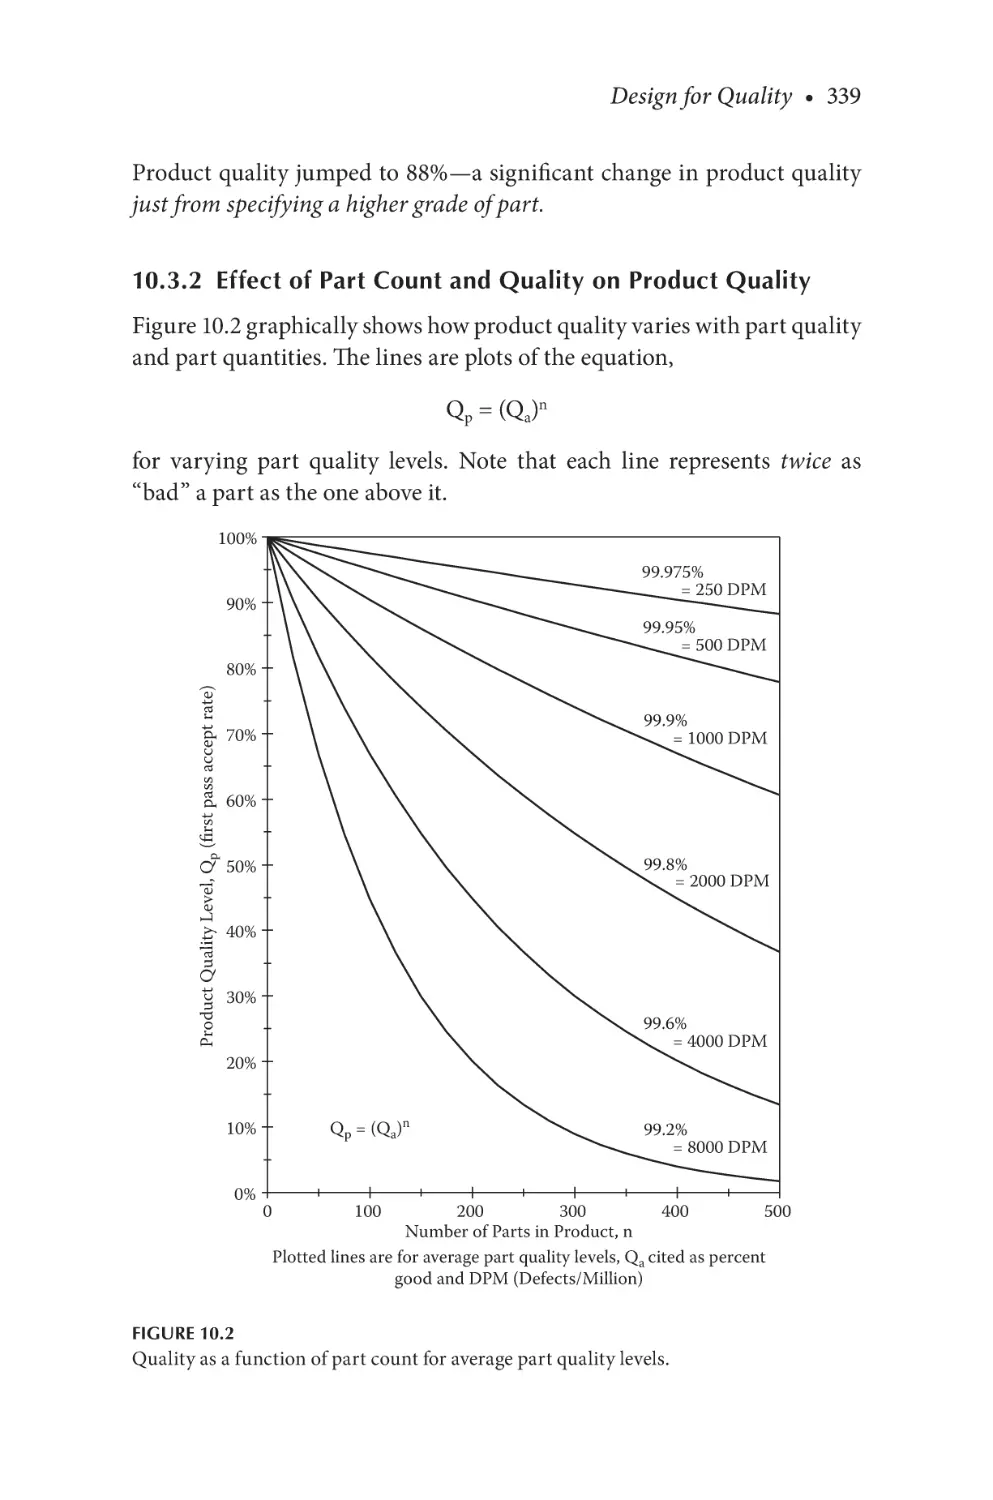
10.3.2 Effect of Part Count and Quality on
Product Quality................................................339
10.3.3 Predictive Quality Model............................... 340
10.3.4 Quality Strategies for Products..................... 340
10.4 Reliability Design Guidelines..................................... 341
10.5 Measurement of Reliability......................................... 344
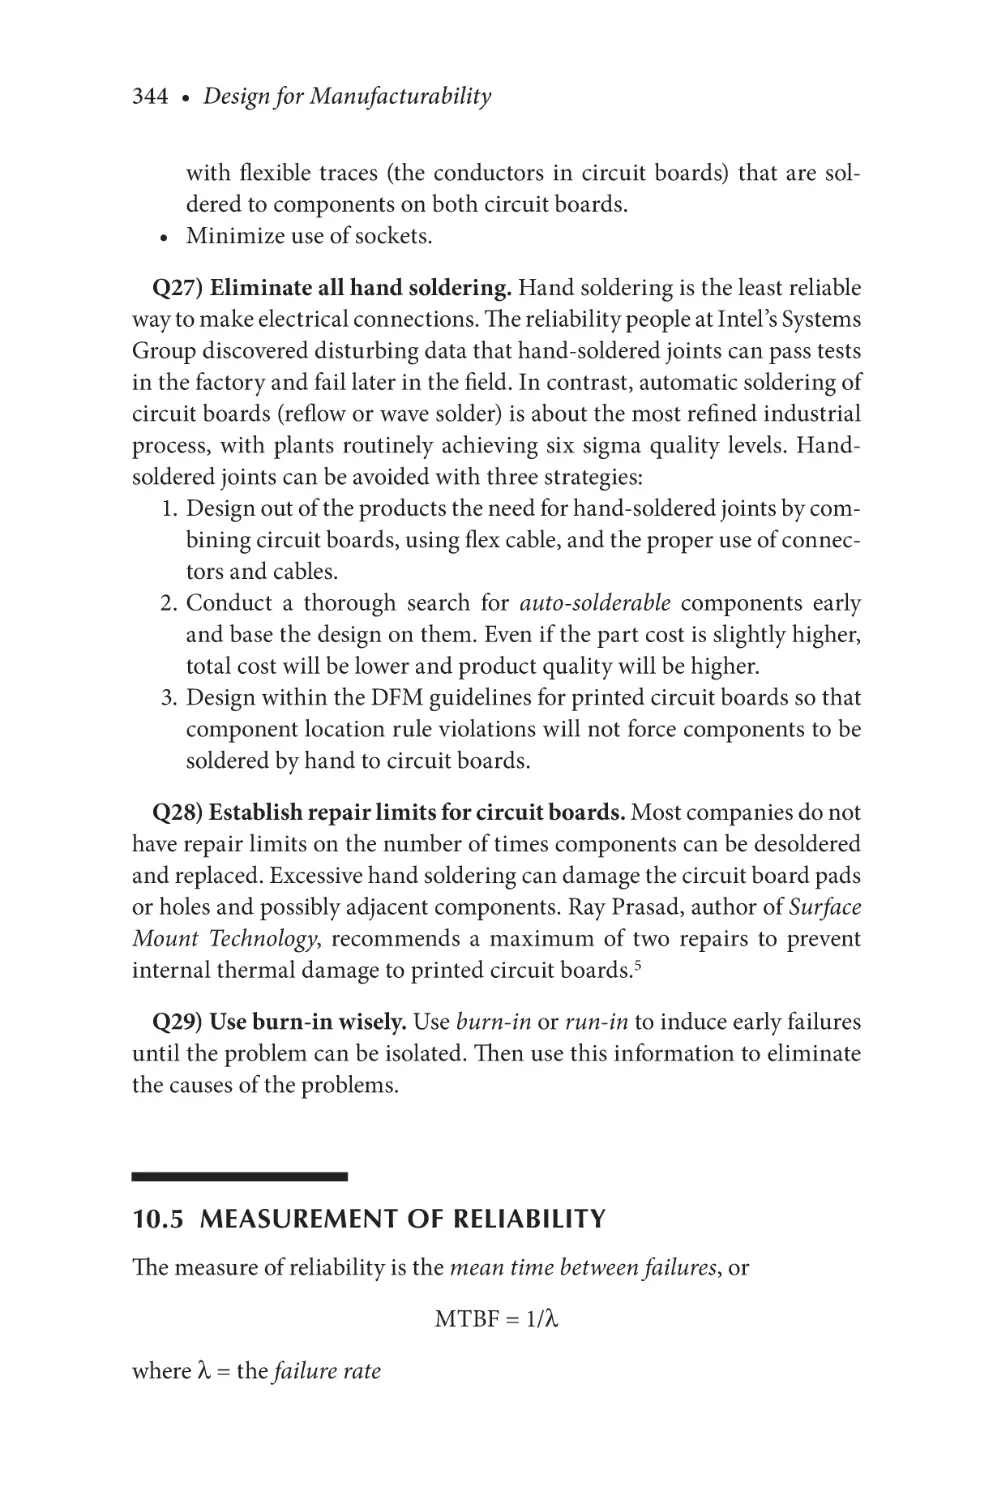
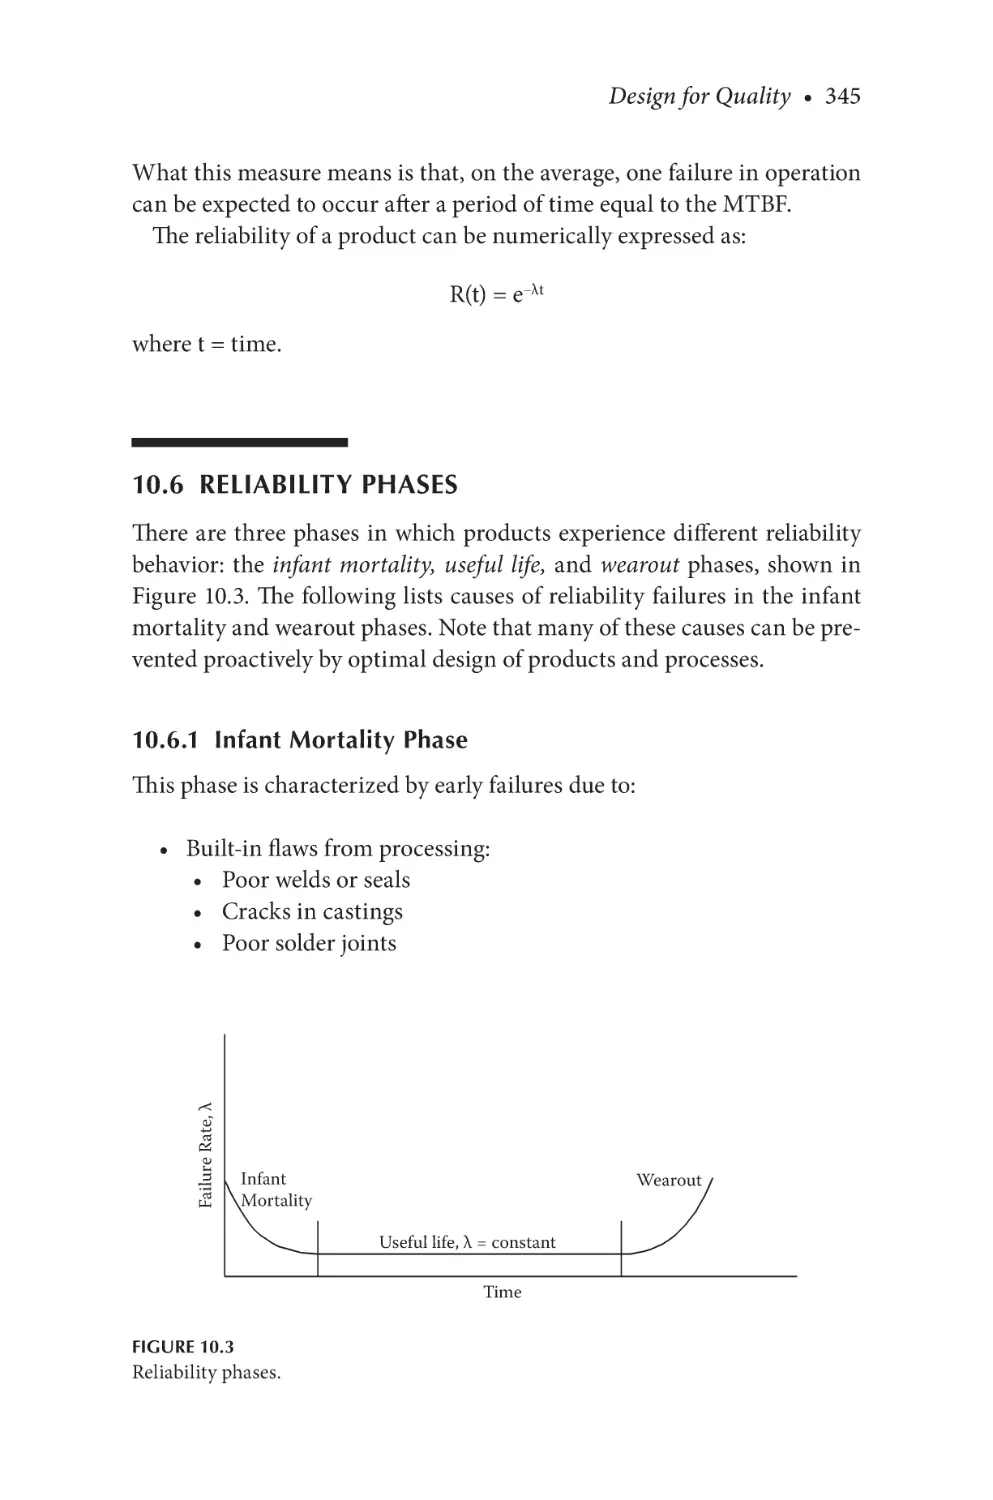
10.6 Reliability Phases.......................................................... 345
10.6.1 Infant Mortality Phase.................................... 345
10.6.2 Wearout Phase................................................. 346
10.7 Poka-Yoke (Mistake-Proofing)................................... 346
10.8 Poka-Yoke Principles.................................................... 347
10.8.1 How to Ensure Poka-Yoke by Design........... 347
10.8.2 Solutions to Error Prevention after Design.... 349
10.9 Strategy to Design in Quality..................................... 349
10.10 Customer Satisfaction...................................................351
Notes...........................................................................................351
Contents • xxi
Section VI Implementation
Chapter 11 Implementing DFM......................................................... 355
11.1 Change........................................................................... 356
11.1.1 Change at Leading Companies.......................359
11.2 Preliminary Investigations.......................................... 360
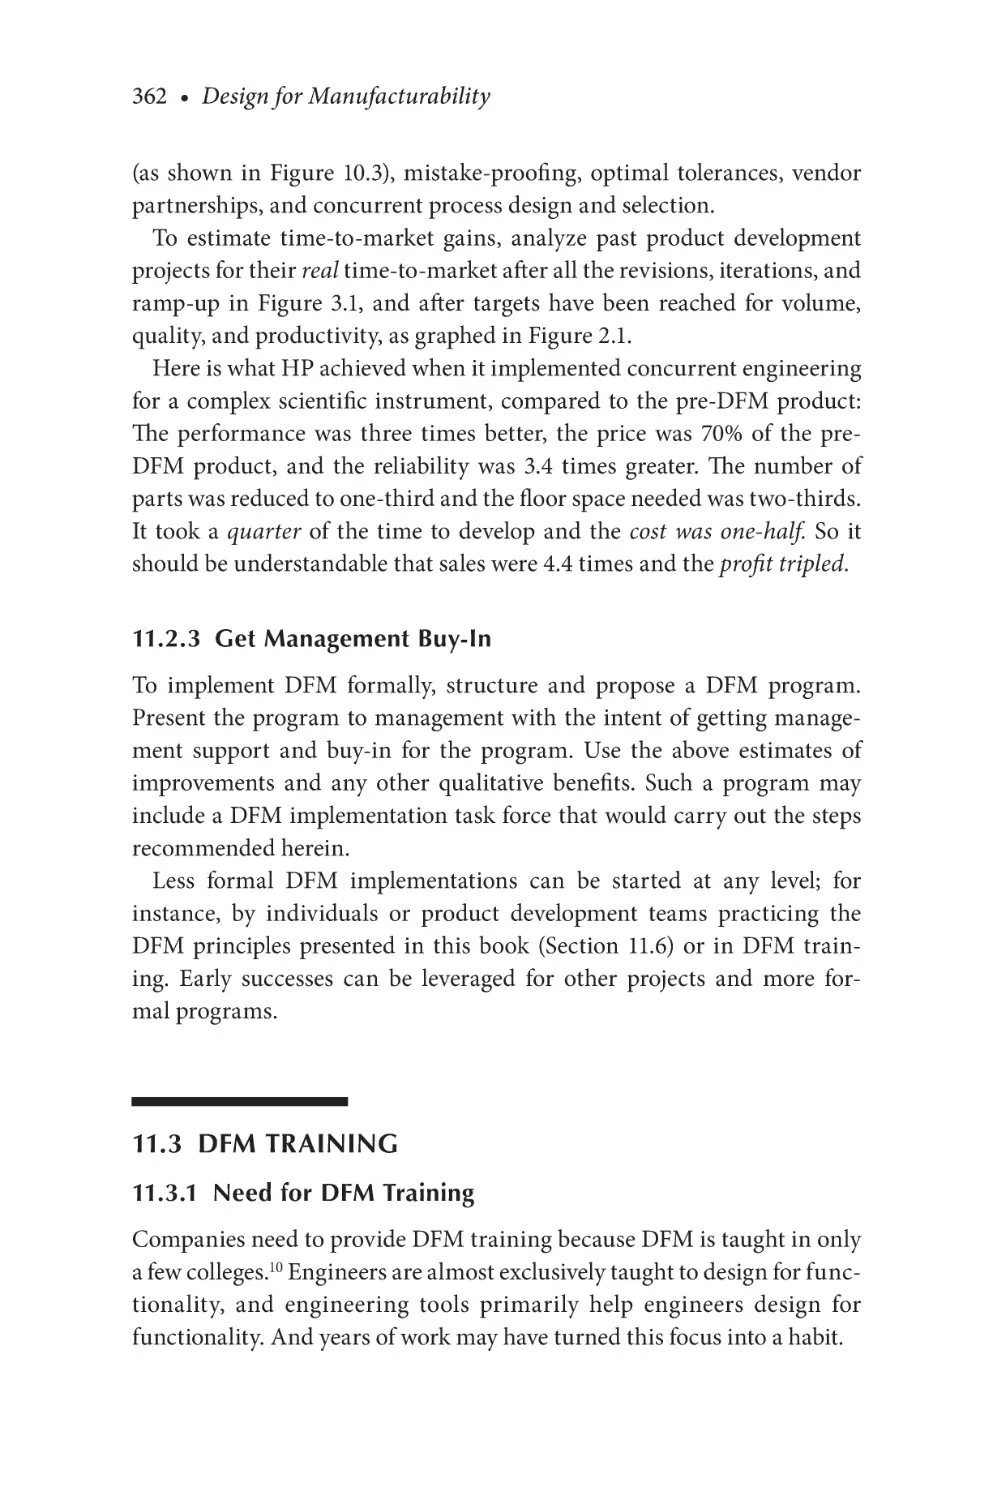
11.2.1 Conduct Surveys.............................................. 360
11.2.2 Estimate Improvements from DFM...............361
11.2.3 Get Management Buy-In................................ 362
11.3 DFM Training............................................................... 362
11.3.1 Need for DFM Training.................................. 362
11.3.2 Don’t Do DFM Training “On the Cheap”.... 363
11.3.3 Customize Training to Products................... 363
11.3.4 Trainer Qualifications..................................... 364
11.3.5 DFM Training Agenda................................... 364
11.3.6 “What Happens Next?”................................... 366
11.3.7 Training Attendance....................................... 367
11.4 DFM Task Force............................................................ 368
11.5 Stop Counterproductive Policies................................ 369
11.6 Company Implementation...........................................371
11.6.1 Optimize NPD Teams......................................371
11.6.2 Optimize NPD Infrastructure........................372
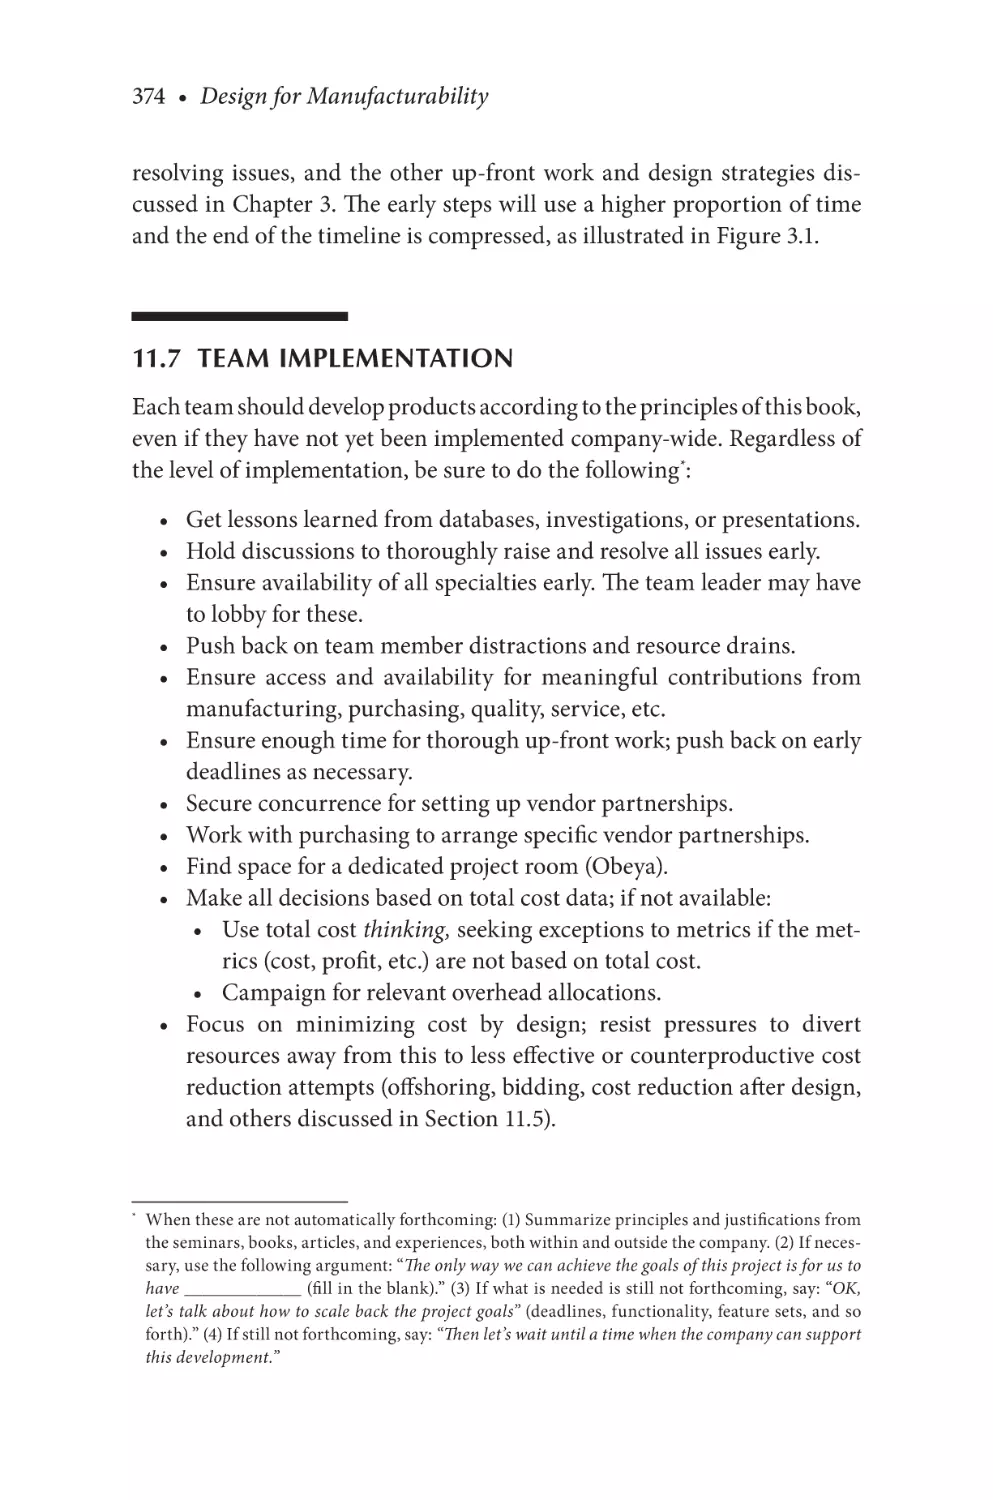
11.6.3 Incorporating DFM into the NPD Process....373
11.7 Team Implementation...................................................374
11.7.1 Importance for Challenging Projects............375
11.7.2 Microclimates...................................................375
11.7.3 Ensuring Success for the First Team
Concurrent Engineering Project....................375
11.8 Individual Implementation..........................................376
11.9 DFM for Students and Job Seekers..............................378
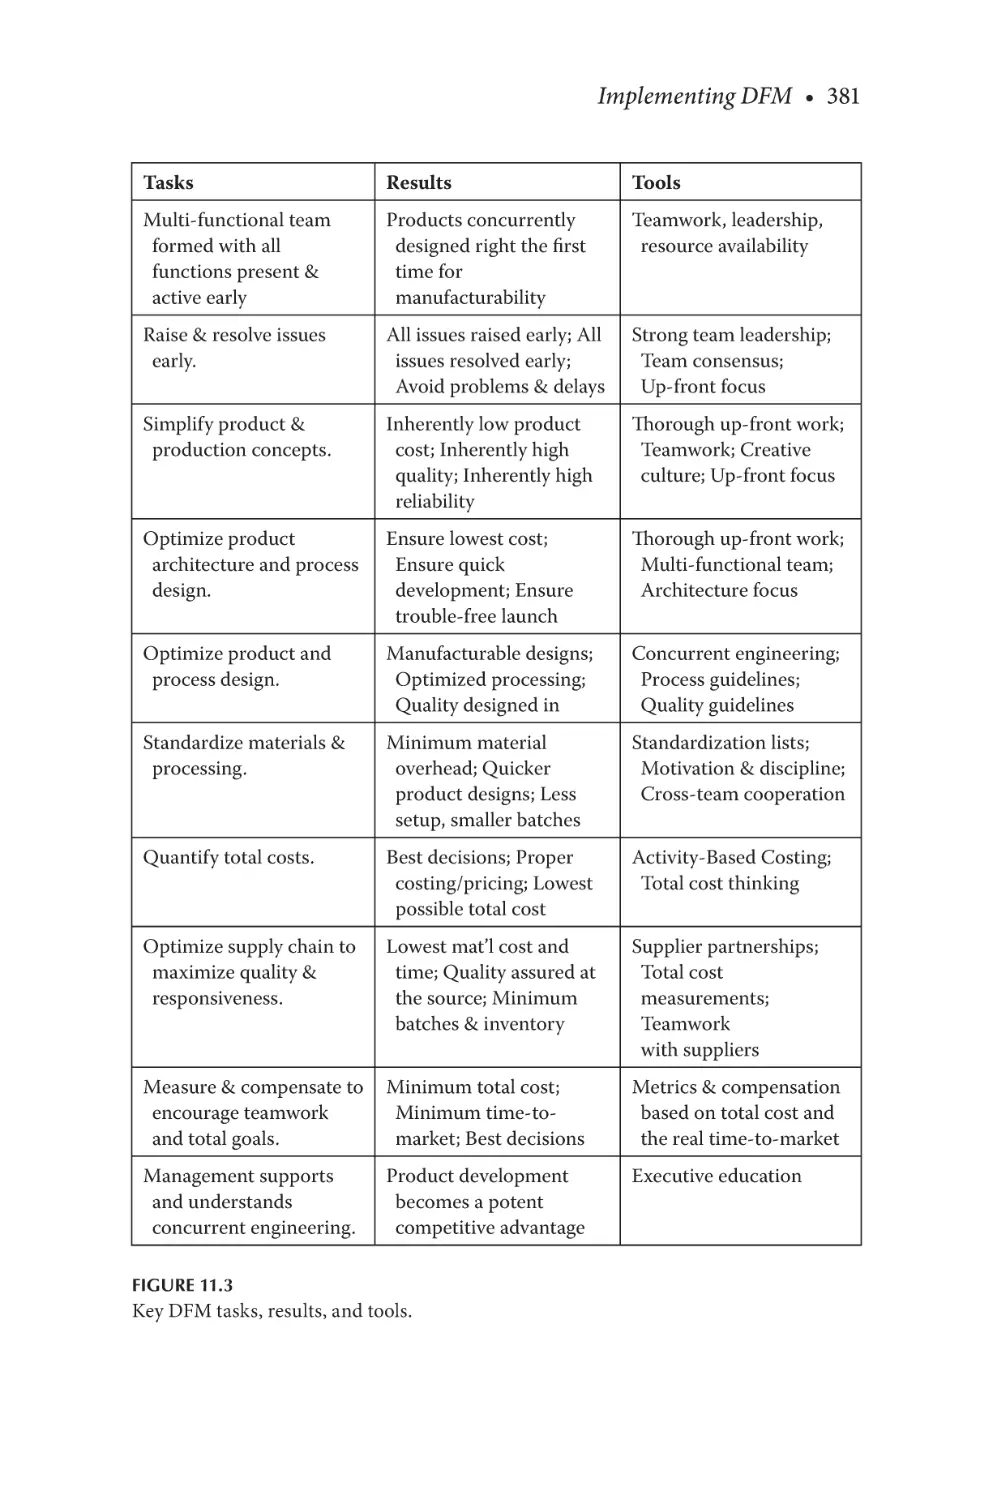
11.10 Key DFM Tasks, Results, and Tools........................... 380
11.11 Conclusion..................................................................... 380
Notes.......................................................................................... 382
xxii • Contents
Section VII Appendices
Appendix A: Product Line Rationalization....................................... 385
A.1 Pareto’s Law for Product Lines................................... 385
A.1.1 Focus................................................................. 386
A.1.2 Competitive Challenges without
Rationalizing.................................................... 386
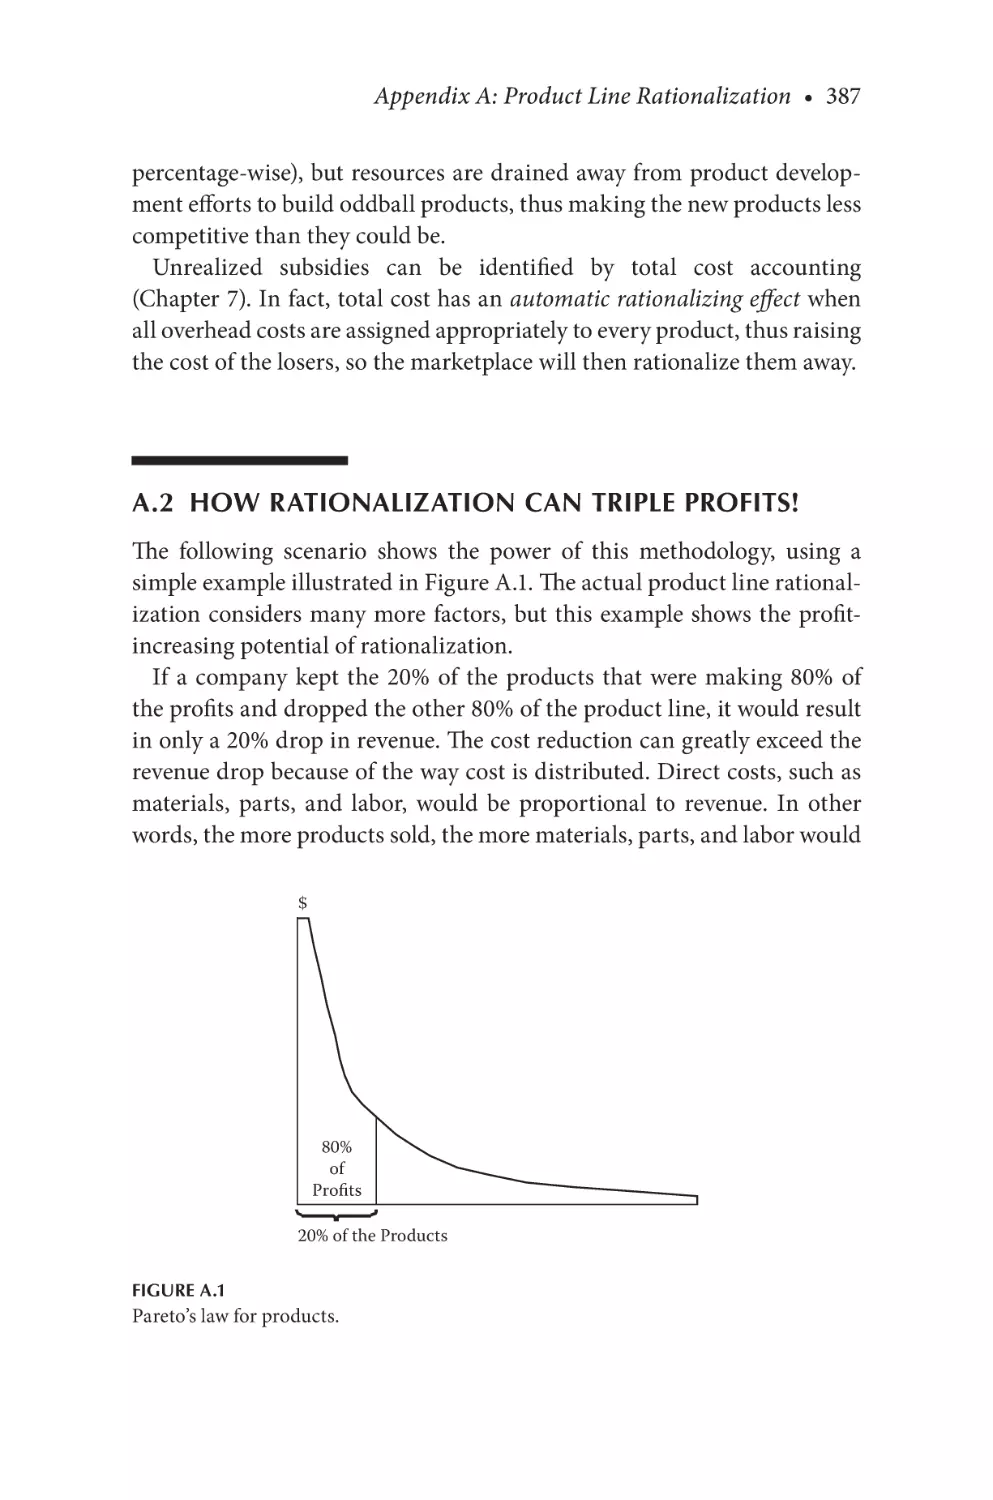
A.2 How Rationalization Can Triple Profits!................... 387
A.3 Cost Savings from Rationalization............................ 390
A.3.1 Short-Term Cash Savings............................... 390
A.3.2 Investments...................................................... 390
A.4 Shifting Focus to the Most Profitable Products.........391
A.5 Rationalization Strategies.............................................393
A.5.1 What Is More Important: Volume or
Profit?.................................................................393
A.5.2 Profitable Growth............................................ 394
A.5.3 Rationalization Prerequisite—Eliminating
Duplicate Products.......................................... 394
A.6 The Rationalization Procedure................................... 394
A.7 Total Cost Implications................................................ 396
A.7.1 Margin Trap..................................................... 397
A.7.2 Seldom-Built Products.................................... 397
A.7.3 Obsolescence Costs......................................... 397
A.8 Overcoming Inhibitions, Fears, and Resistance....... 398
A.8.1 Competitive Scenarios.................................... 400
A.8.2 Role Playing.......................................................401
A.8.3 Rationalization Synergy with Other
Improvement Programs.................................. 402
A.9 Implementation and Corporate Strategy.................. 402
A.9.1 Approach for Mass Production..................... 402
A.9.2 Approach for Mass Customization and
Build-to-Order................................................. 403
A.9.3 Implementation Steps..................................... 403
A.10 How Rationalization Improves Quality.................... 406
A.11 Value of Rationalization.............................................. 406
Notes.......................................................................................... 408
Appendix B: Summary of Guidelines................................................ 411
B.1 Assembly Guidelines from Chapter 8.........................411
B.2 Fastening Guidelines from Chapter 8.........................411
Contents • xxiii
B.3
B.4
B.5
B.6
B.7
B.8
B.9
B.10
B.11
B.12
B.13
Assembly Motion Guidelines from Chapter 8...........412
Test Guidelines from Chapter 8...................................412
Repair Guidelines from Chapter 8..............................413
Maintenance Guidelines from Chapter 8...................413
Part Design Guidelines from Chapter 9.....................414
DFM for Fabricated Parts from Chapter 9.................414
DFM Strategies for Castings from Chapter 9............415
DFM Strategies for Plastics from Chapter 9..............415
DFM for Sheet Metal from Chapter 9.........................416
Quality Guidelines from Chapter 10..........................416
Reliability Guidelines from Chapter 10......................416
Appendix C: Feedback Forms............................................................. 419
Appendix D: Resources....................................................................... 425
D.1 Books Cited.................................................................... 425
D.2 Companion Book for Matching Improvements
in Operations................................................................. 425
D.2.1 Book Description............................................. 425
D.2.2 Which Companies Need This........................ 426
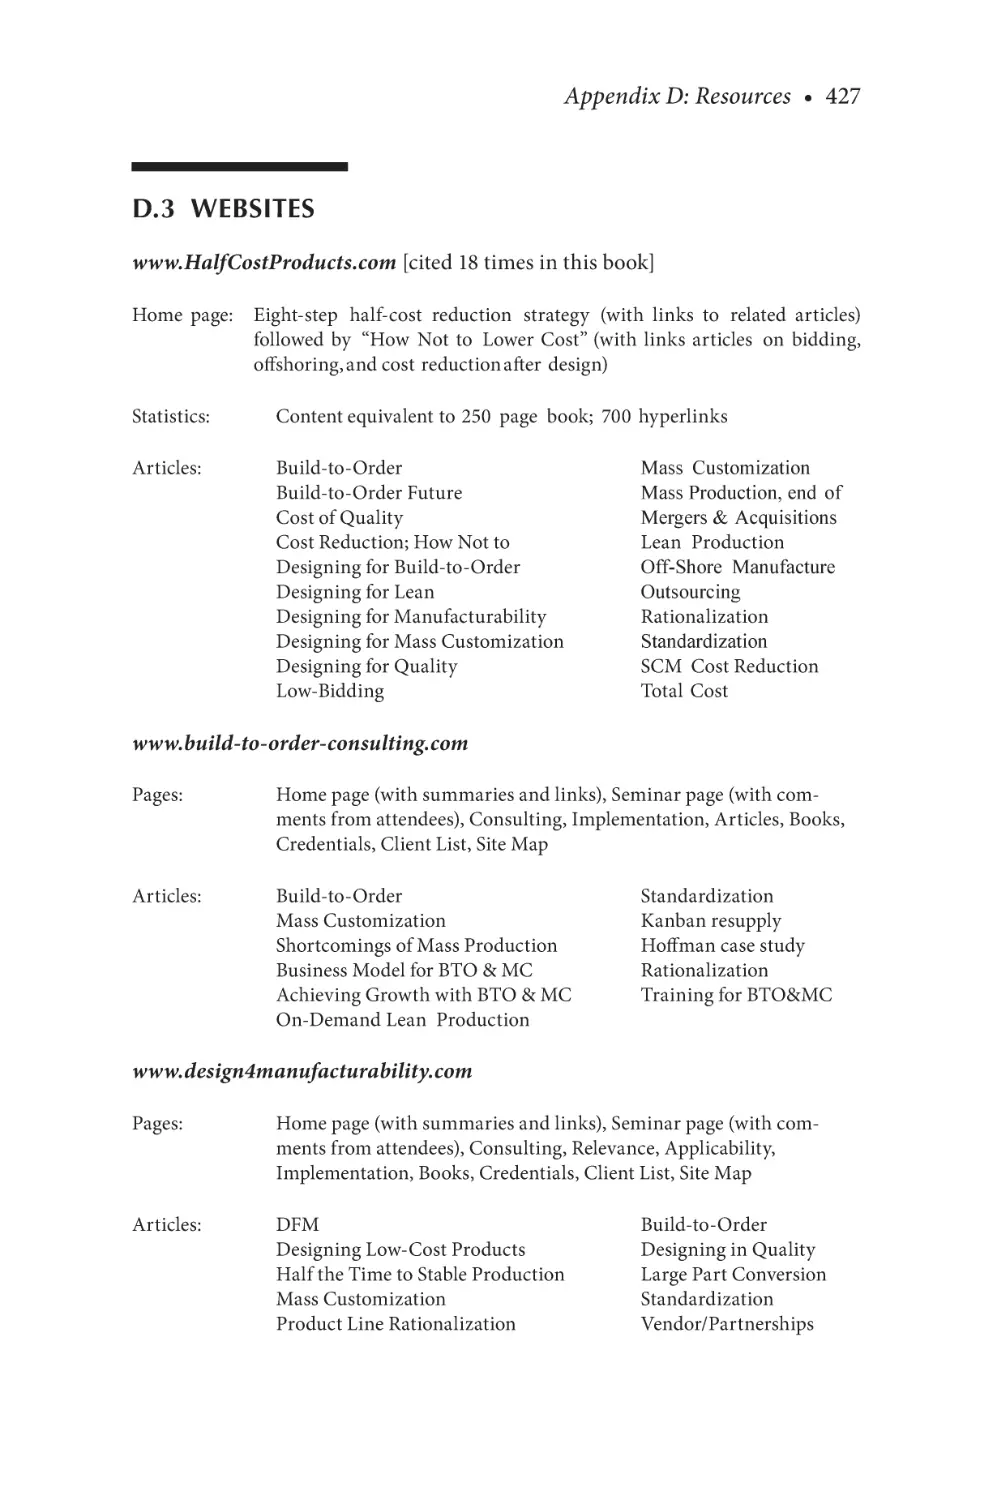
D.3 Websites......................................................................... 427
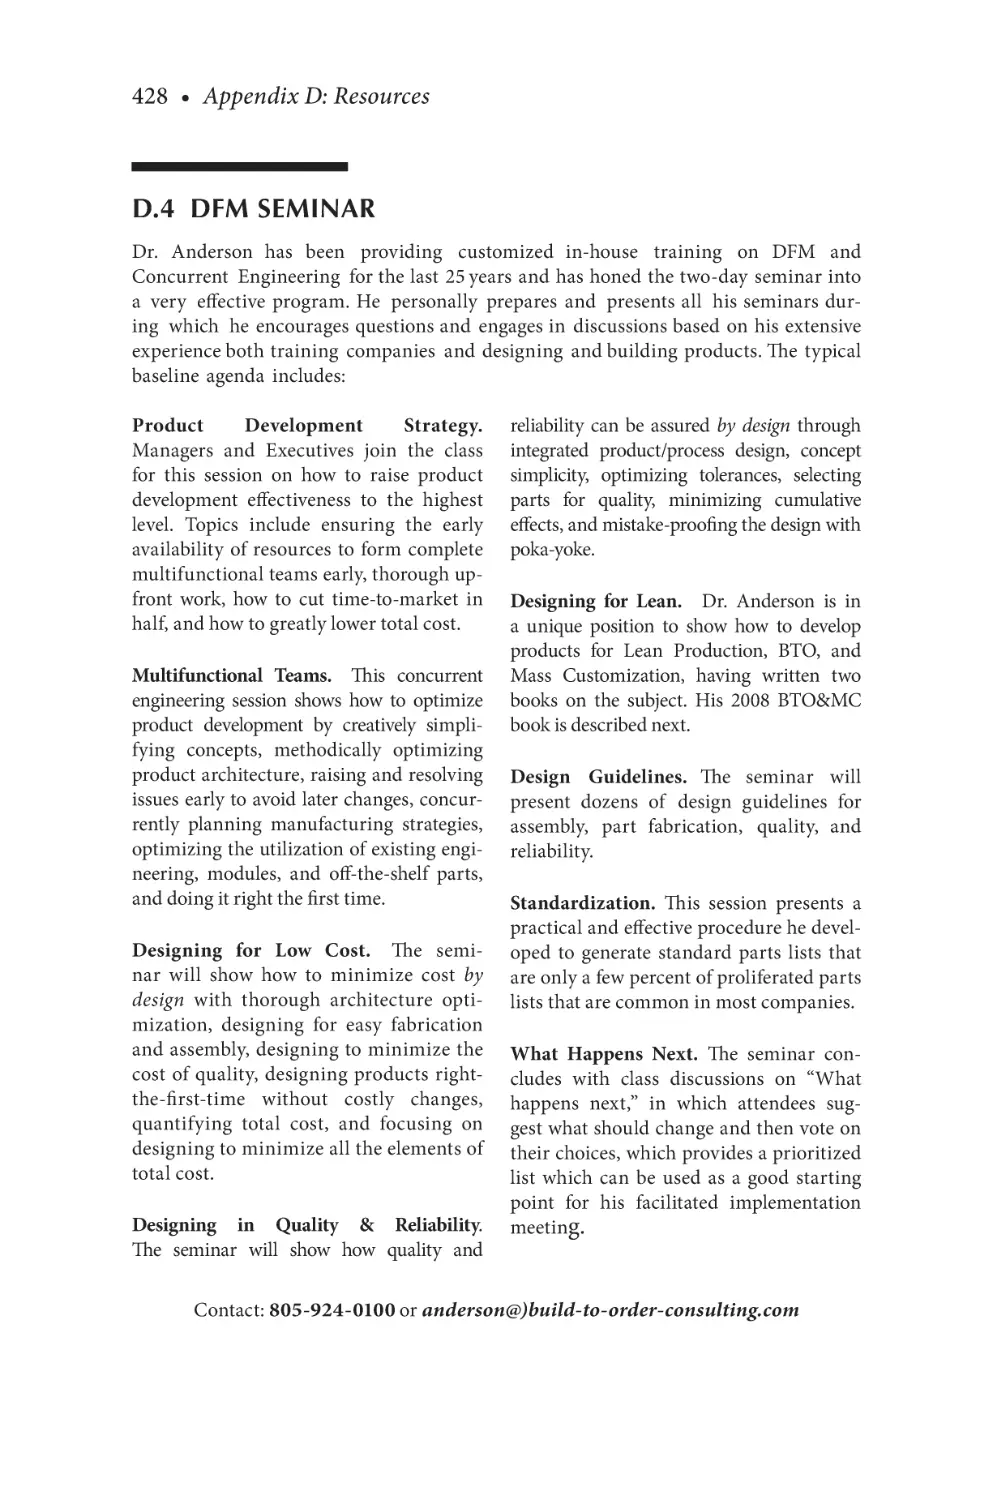
D.4 DFM Seminar................................................................ 428
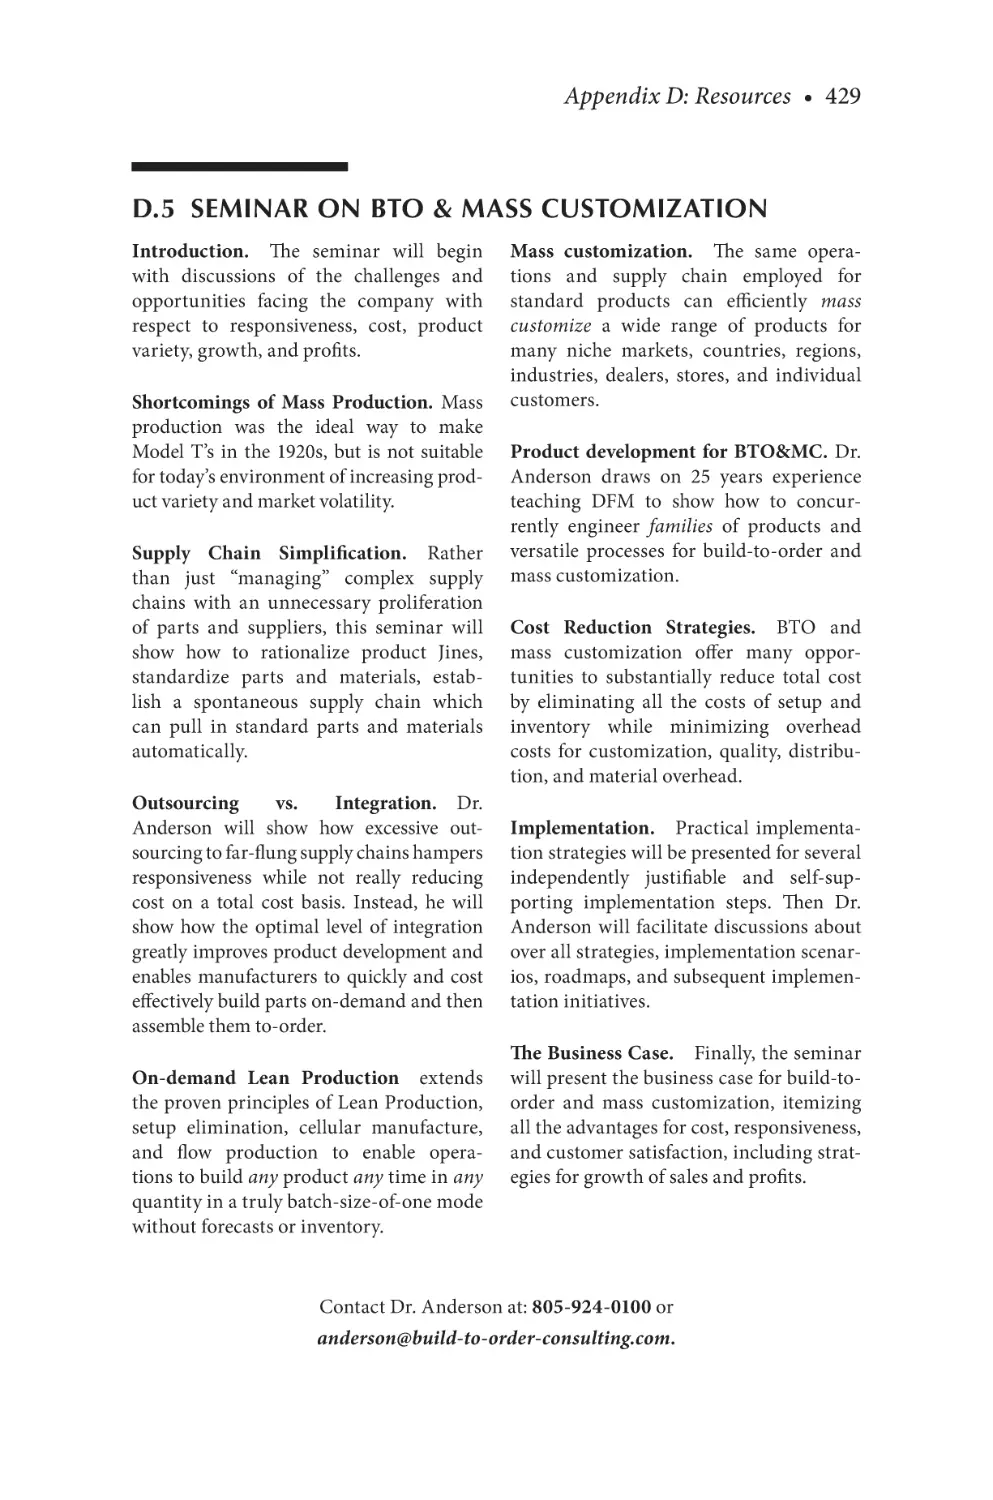
D.5 Seminar on BTO & Mass Customization.................. 429
D.6 Workshops Facilitated by Dr. Anderson................... 430
D.6.1 Product-Specific Workshop........................... 430
D.6.2 Commercialization Workshop...................... 430
D.6.3 DFM Replacements of Large Weldments
and Castings..................................................... 430
D.6.4 Standardization Workshop............................ 430
D.6.5 Product Line Rationalization Workshop......431
D.7 Design Studies and Consulting...................................431
D.7.1 Half-Cost Design Studies................................431
D.7.2 Design Studies on Mechanisms......................431
D.7.3 Design Studies on Large Part
Conversions...................................................... 432
D.7.4 Consulting........................................................ 432
List of Figures
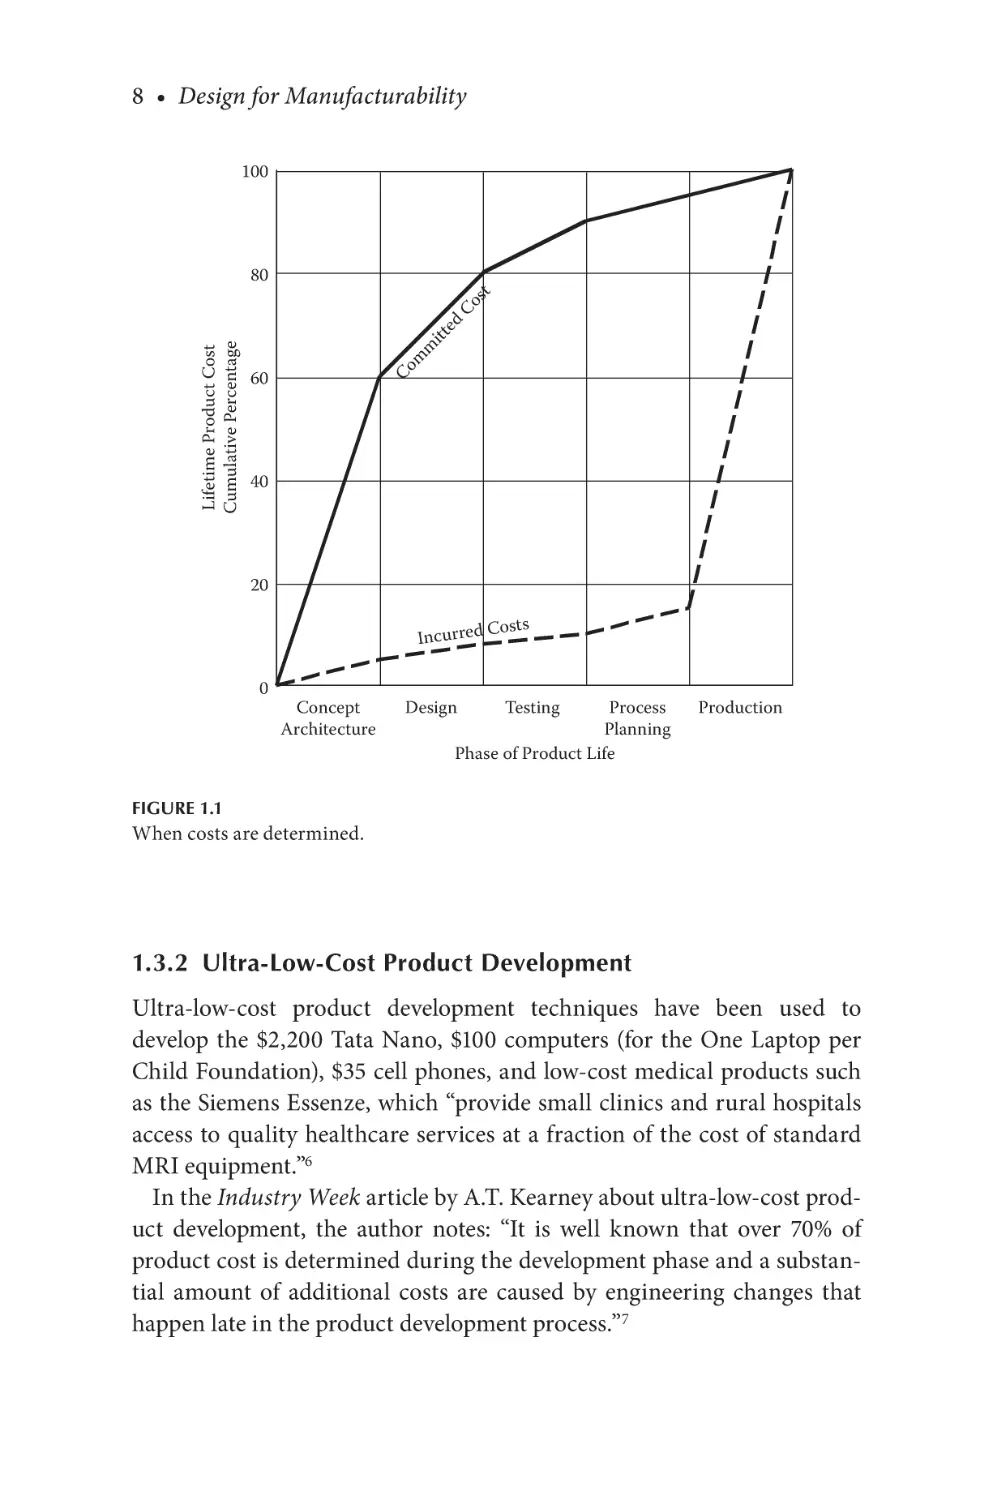
Figure 1.1
When costs are determined........................................................8
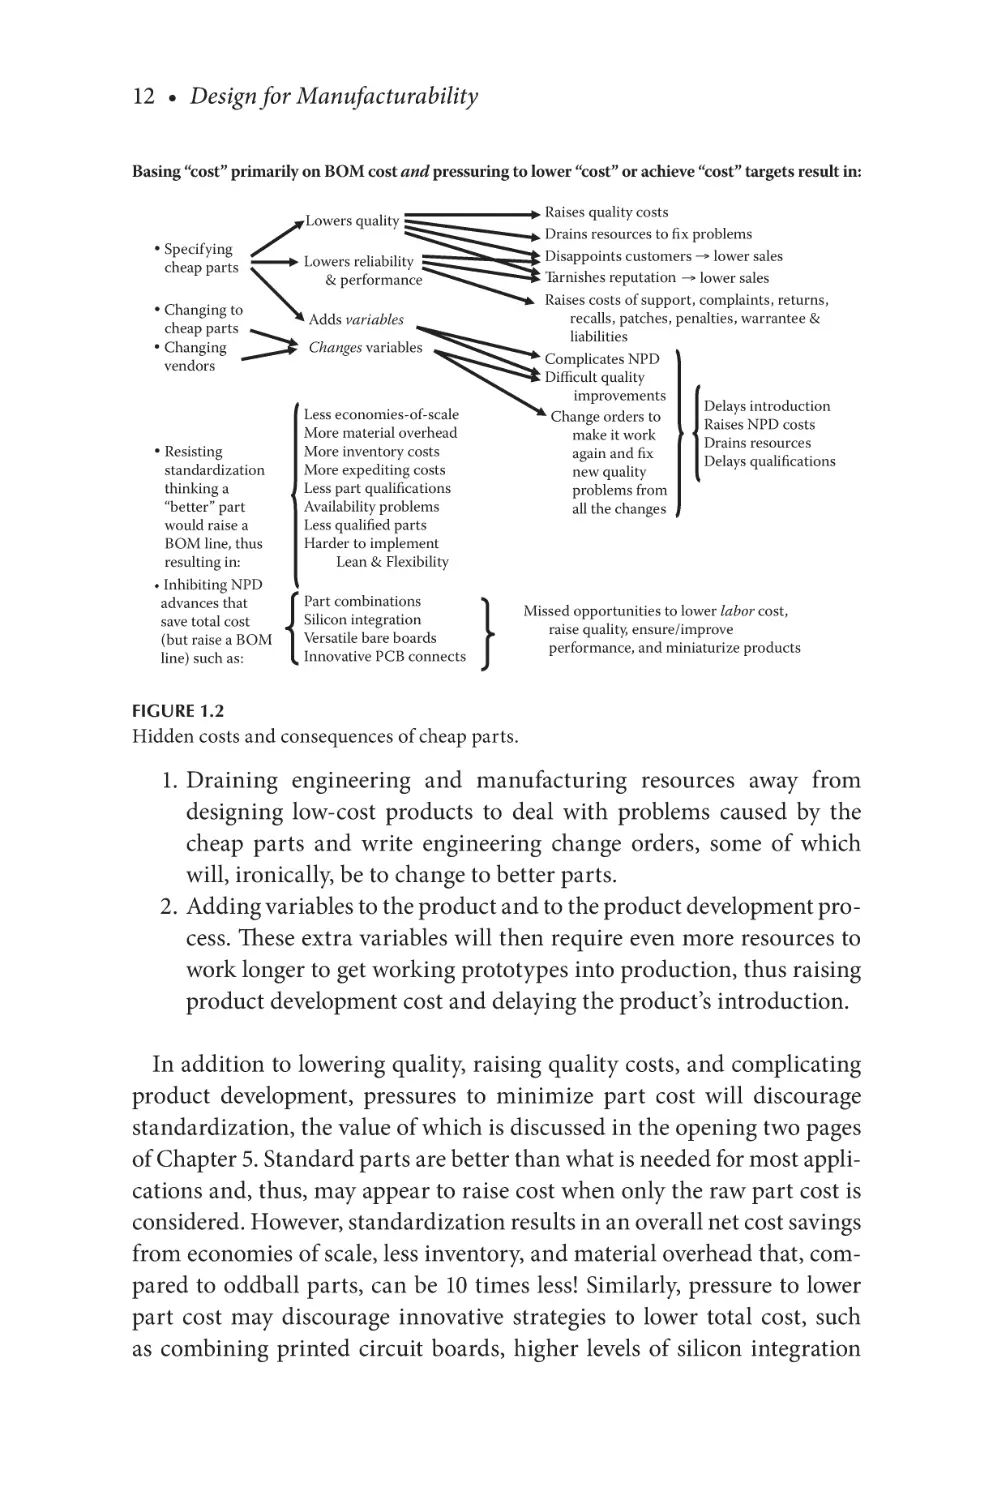
Figure 1.2 Hidden costs and consequences of cheap parts.....................12
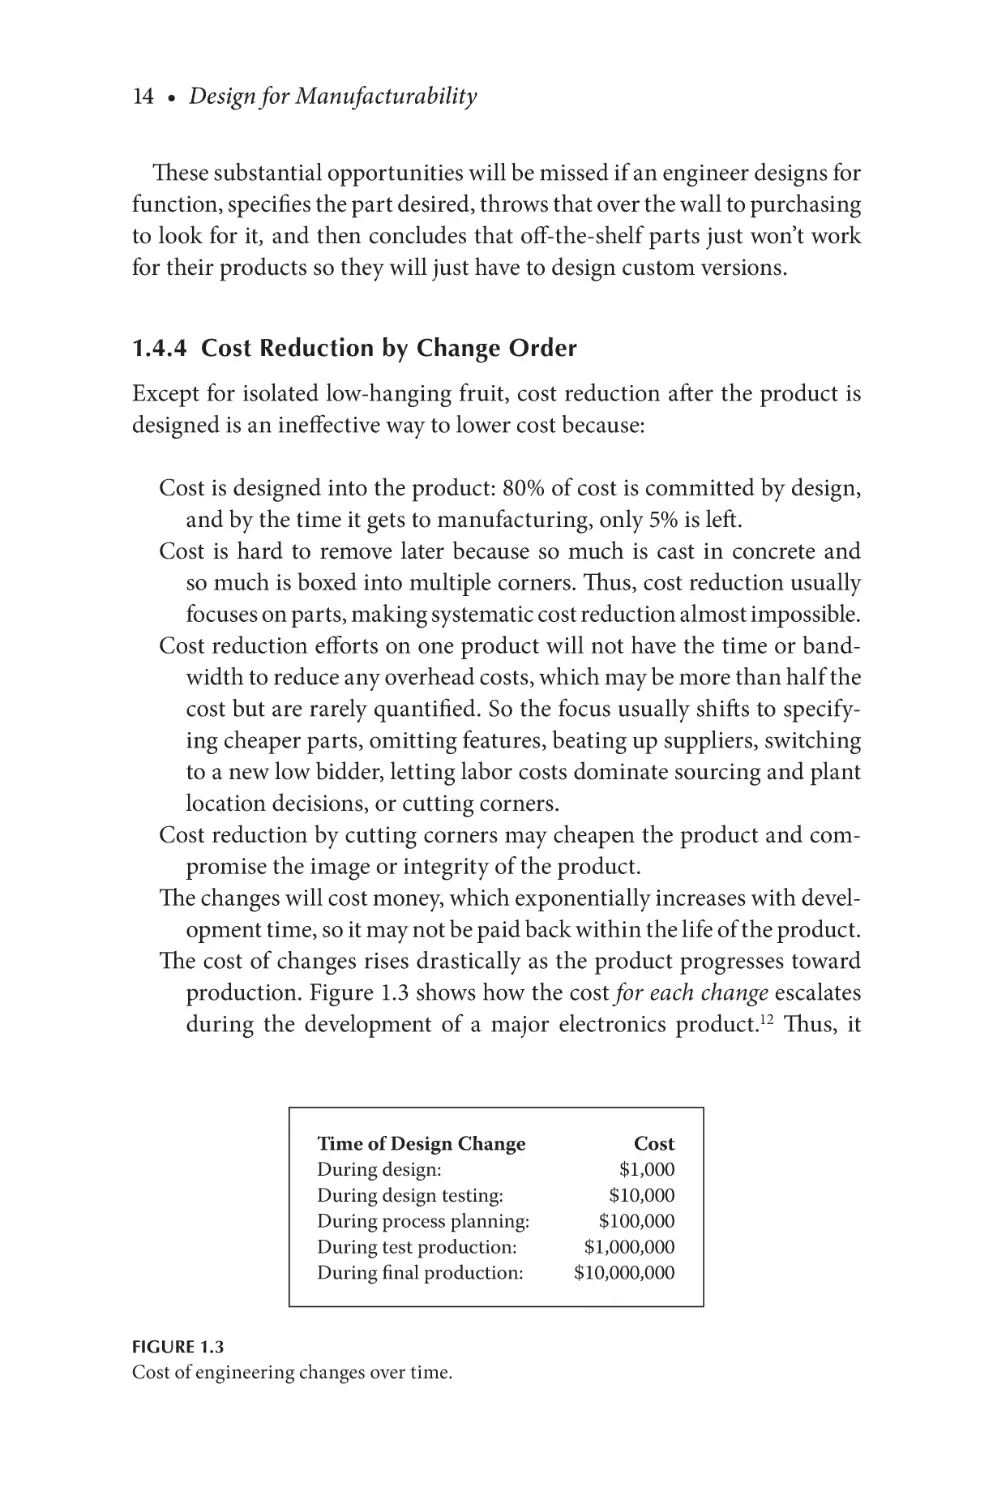
Figure 1.3
Cost of engineering changes over time...................................14
Figure 1.4
The decision tree.........................................................................27
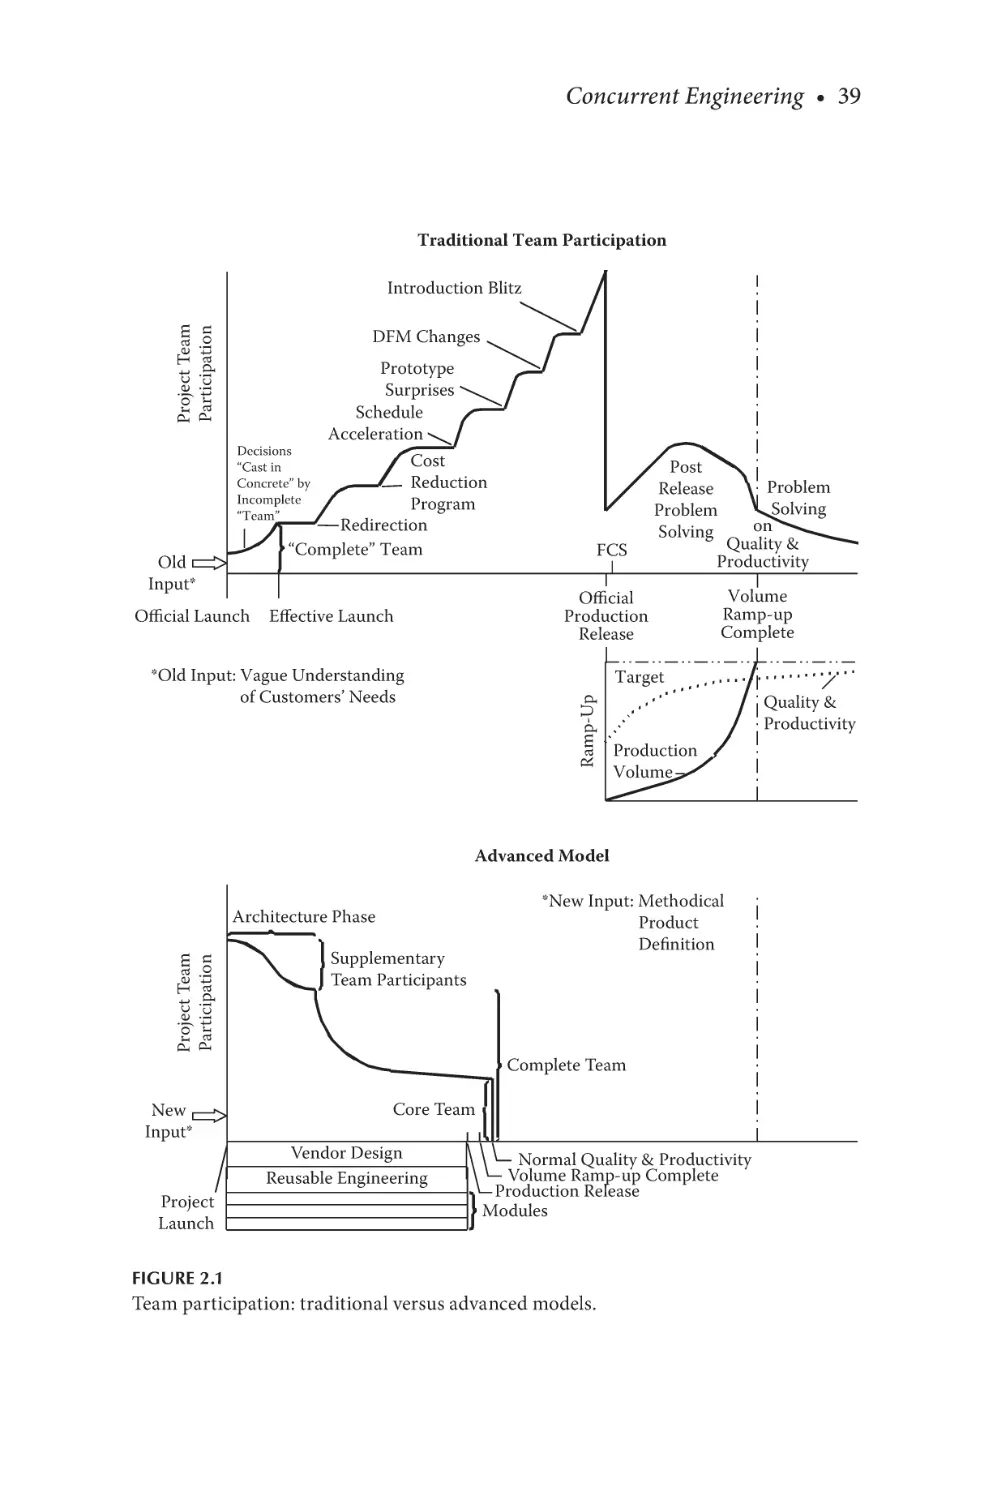
Figure 2.1
Team participation: traditional versus advanced models.....39
Figure 2.2
Customer input form................................................................ 84
Figure 2.3 Customer importance versus competitive grade...................85
Figure 2.4
QFD executive overview........................................................... 86
Figure 2.5
QFD “house of quality” chart..................................................87
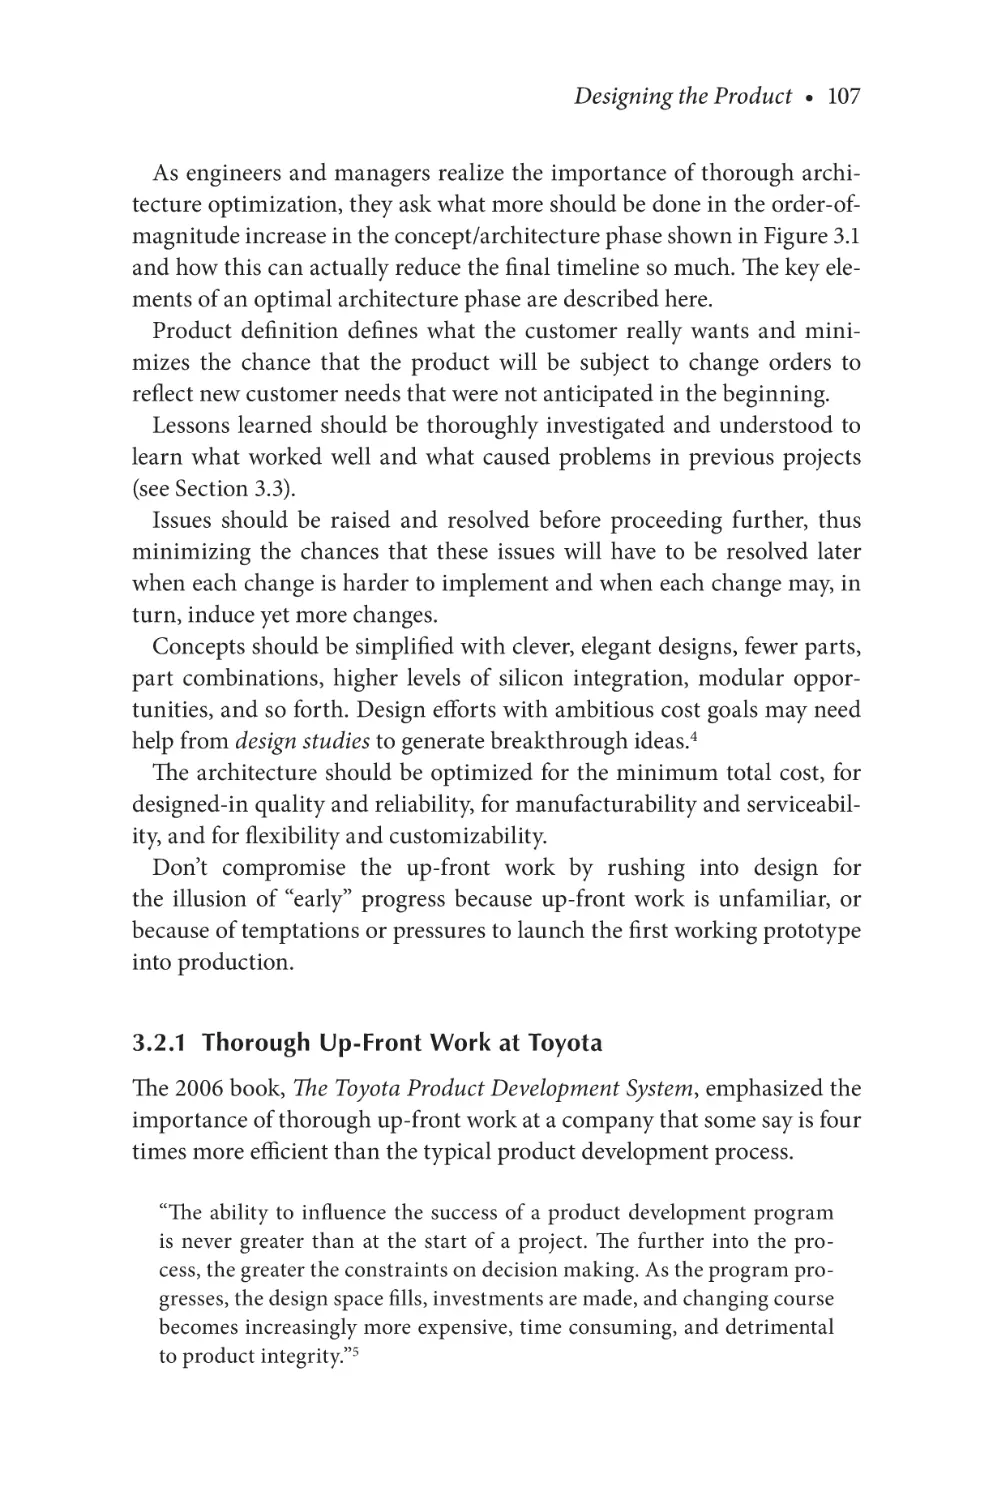
Figure 3.1
Traditional vs. front-loaded time lines..................................106
Figure 3.2 Increasing revenue with early introductions and
upgrades...........................................................................................................131
Figure 4.1 Kanban part resupply..............................................................151
Figure 4.2 Flexible fixture..........................................................................158
Figure 5.1
Examples of part type listing orders......................................184
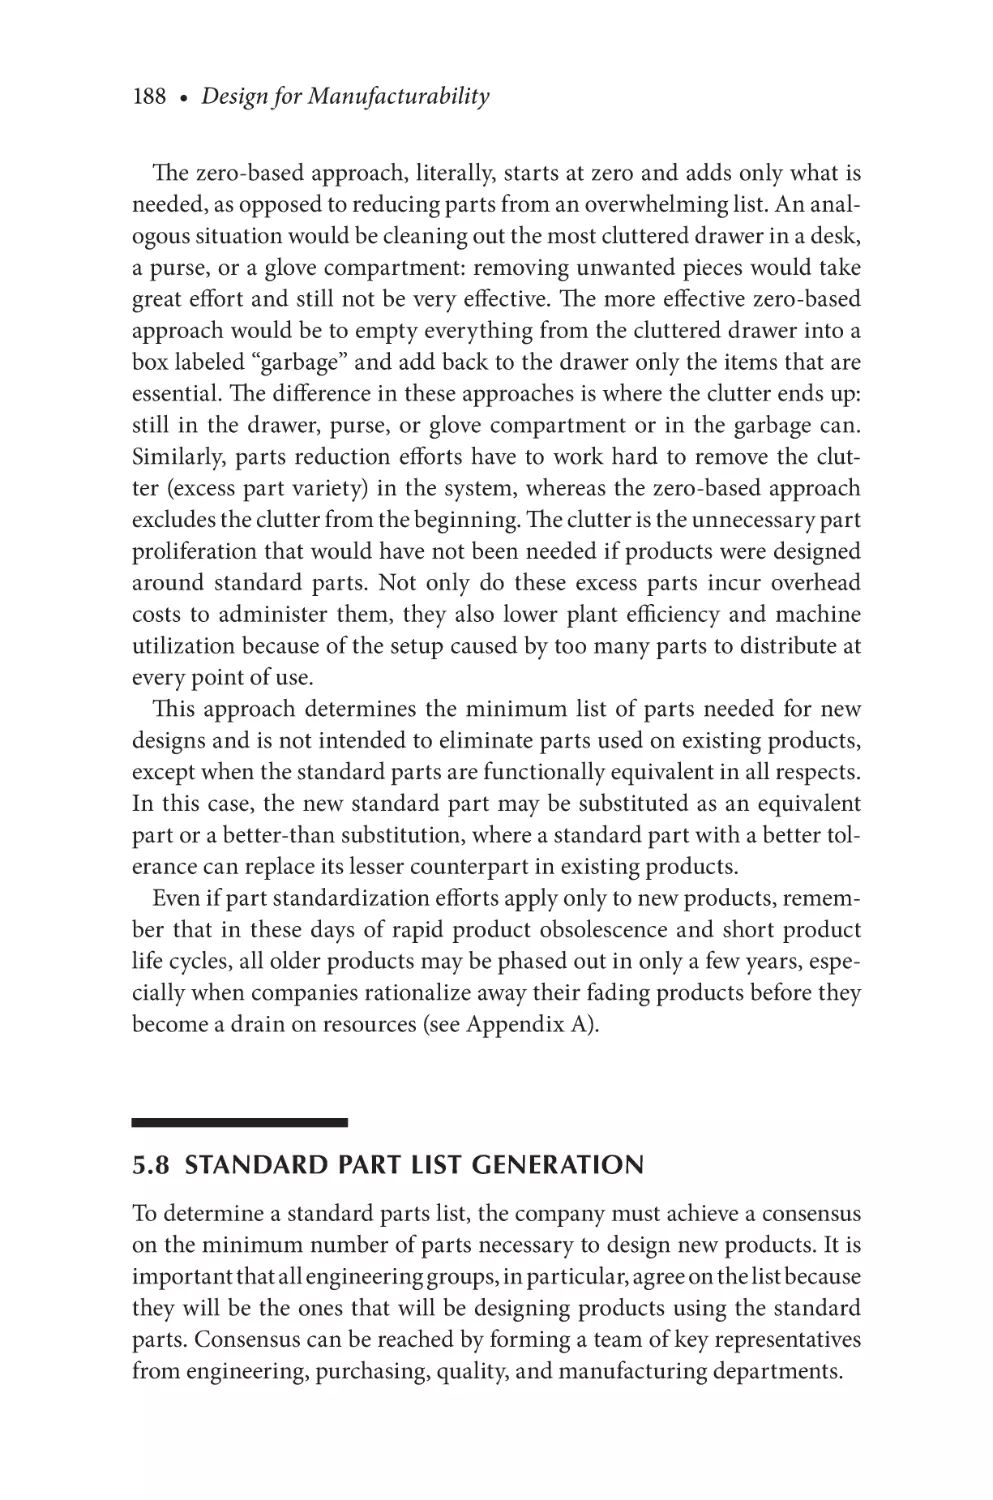
Figure 5.2 Pareto chart of existing part usage........................................189
Figure 5.3
Standardization of expensive parts.......................................198
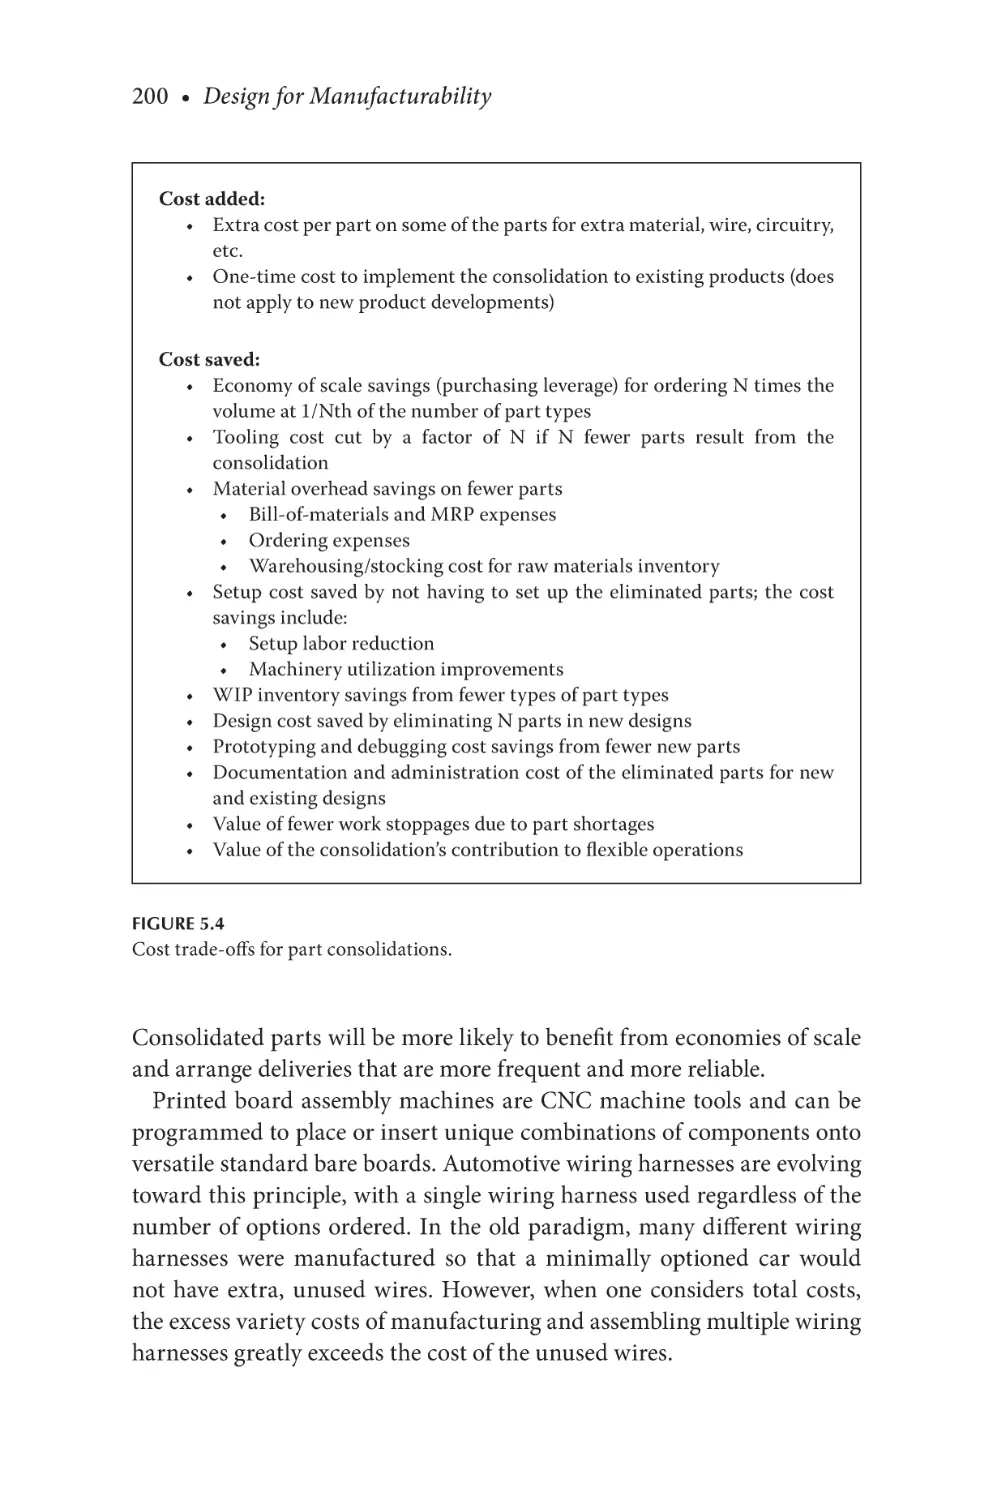
Figure 5.4
Cost trade-offs for part consolidations................................ 200
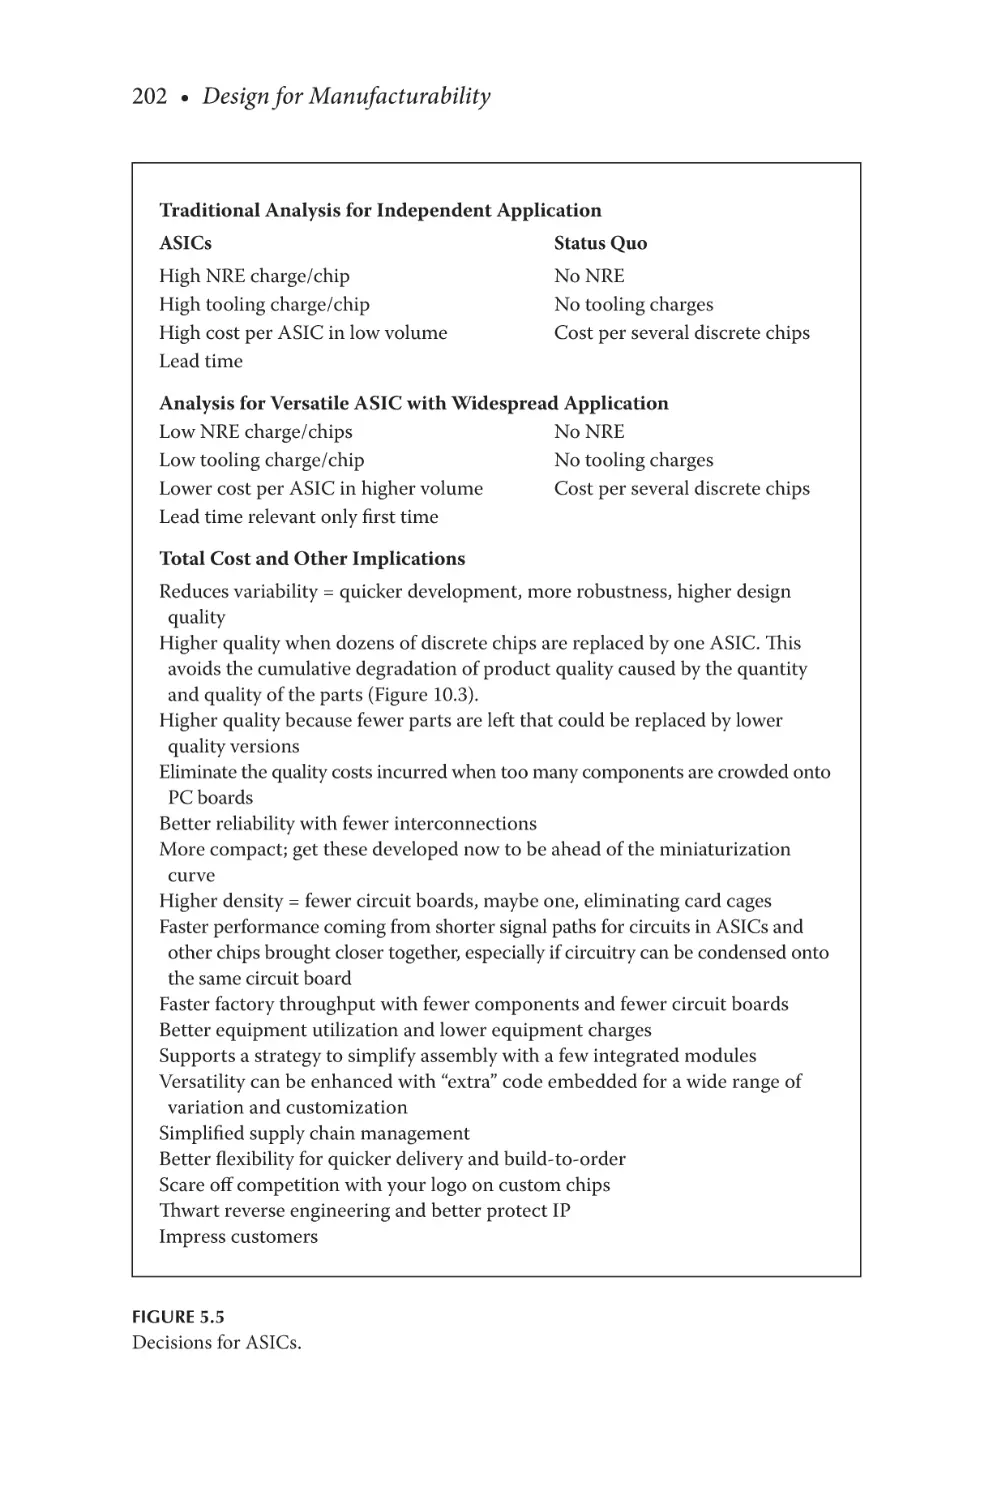
Figure 5.5
Decisions for ASICs................................................................ 202
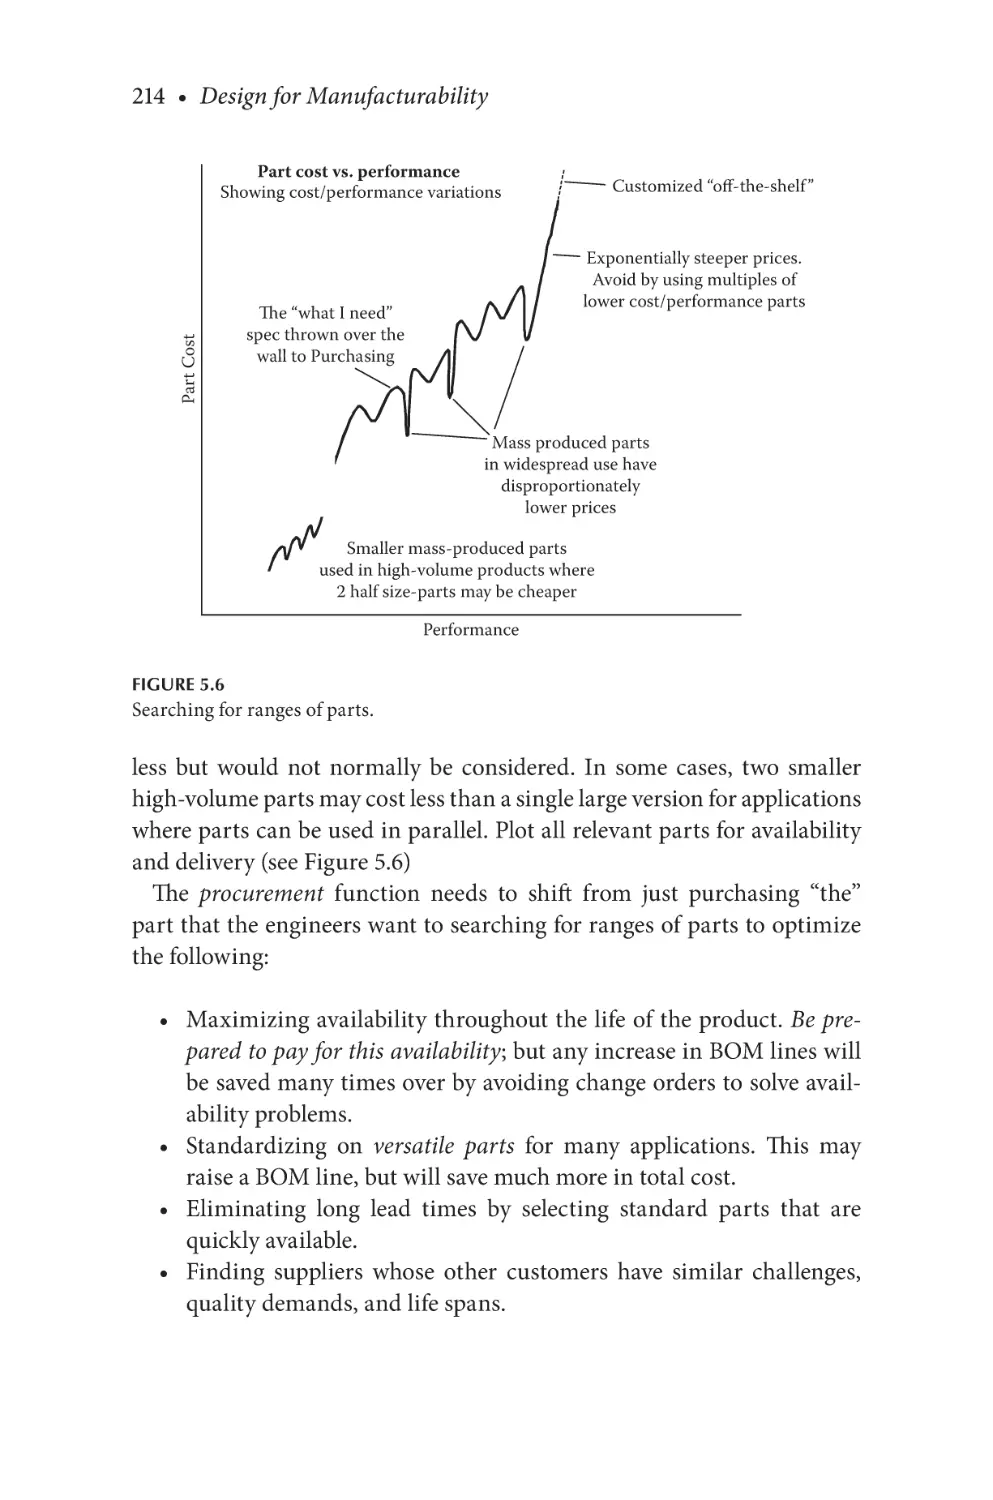
Figure 5.6
Searching for ranges of parts..................................................214
Figure 6.1 Common cost reduction scenario......................................... 222
Figure 6.2 Typical cost breakdown.......................................................... 224
Figure 6.3
Selling price breakdown......................................................... 225
xxv
xxvi • List of Figures
Figure 6.4 Part cost percentage throughout outsourced supply
chain................................................................................................................. 226
Figure 6.5
Programs that reduce specific costs..................................... 227
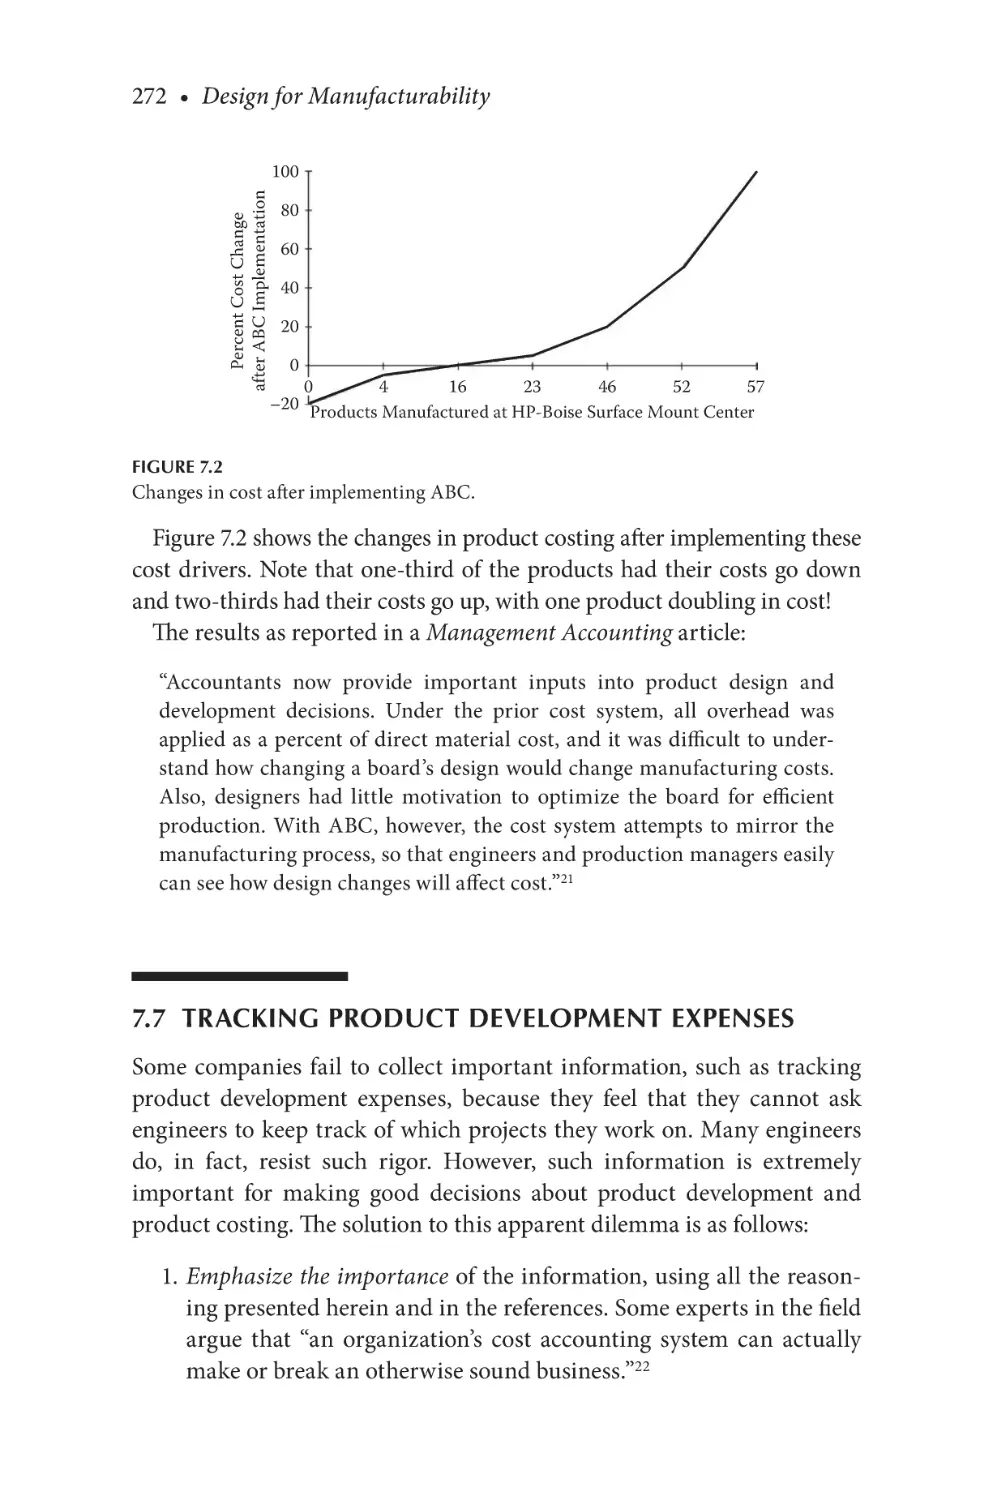
Figure 7.1 Cost distortion downward spiral........................................... 265
Figure 7.2 Changes in cost after implementing ABC............................272
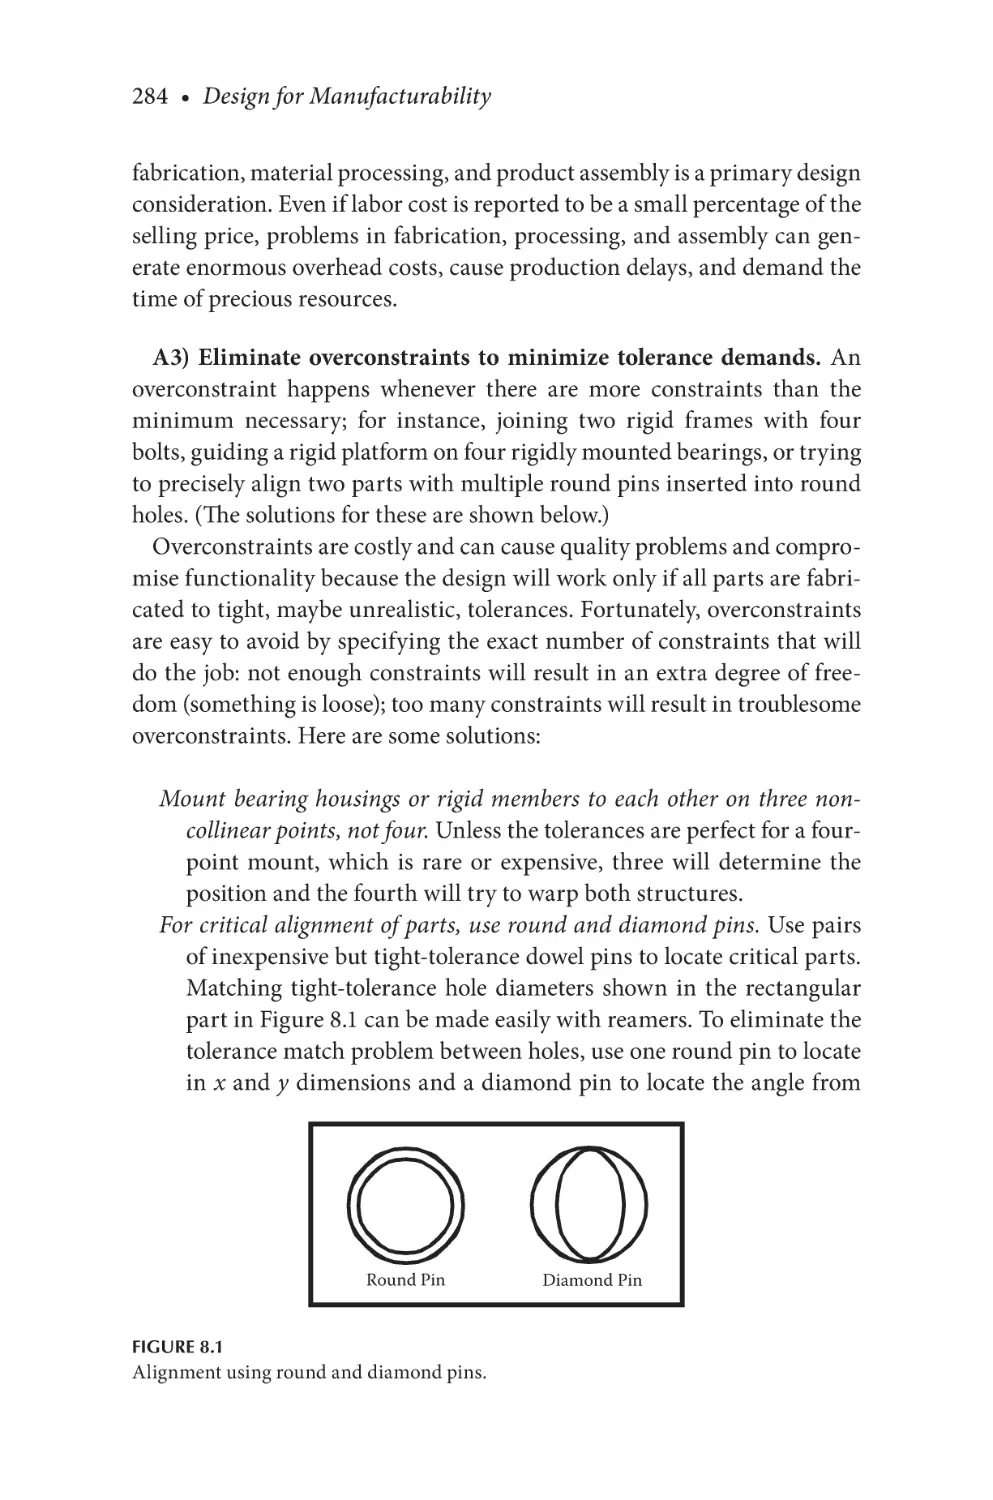
Figure 8.1 Alignment using round and diamond pins......................... 284
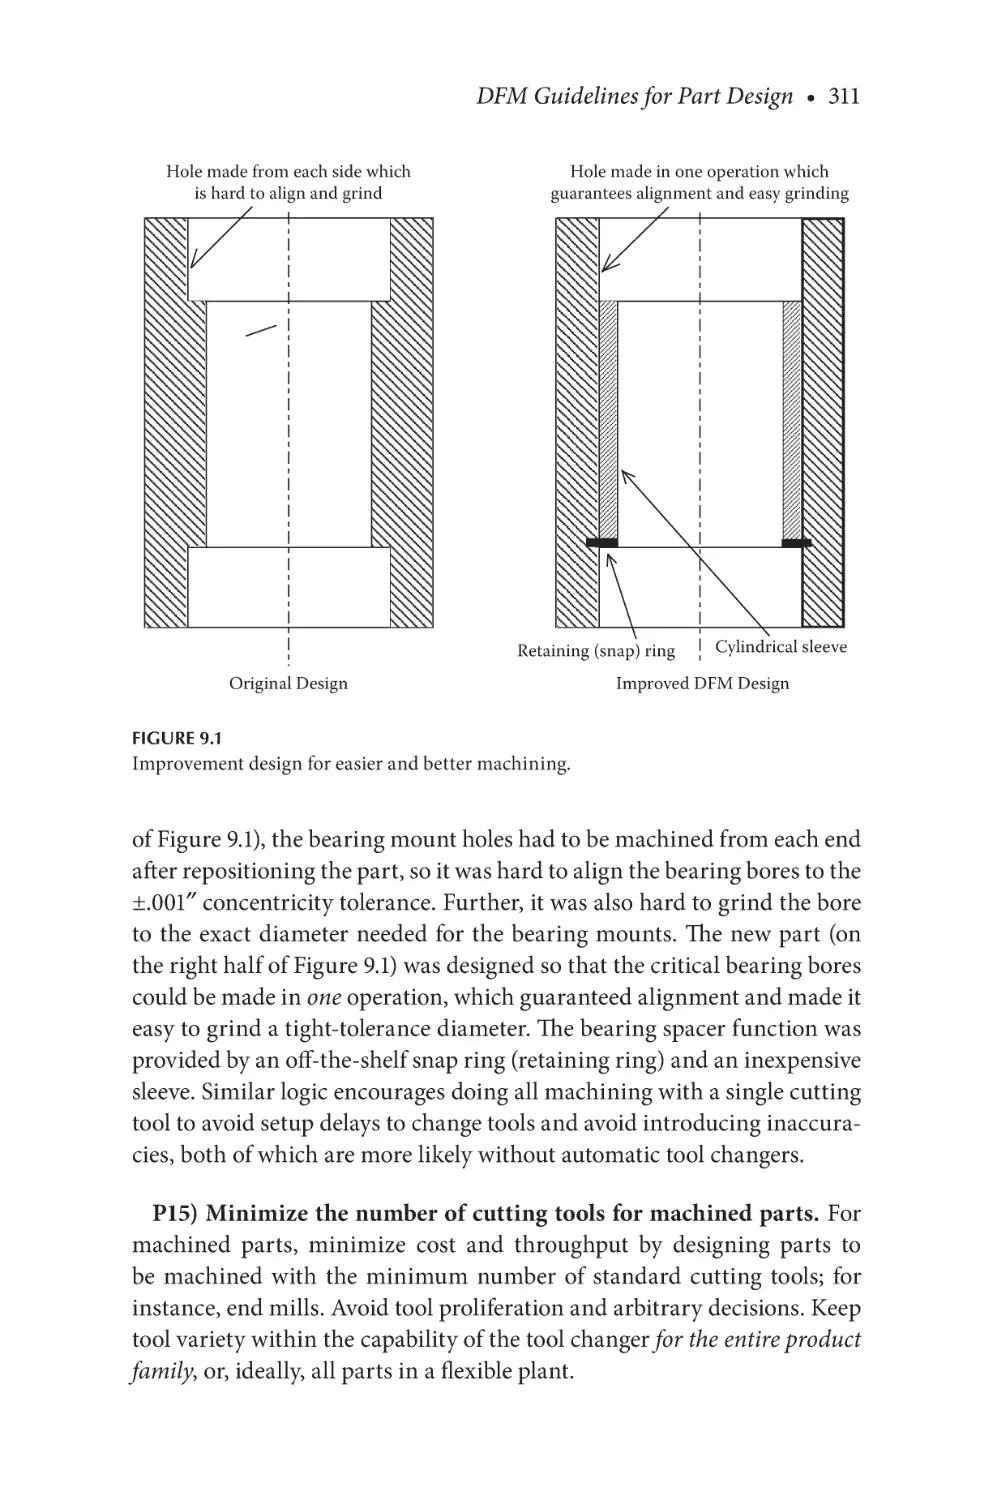
Figure 9.1 Improvement design for easier and better machining........311
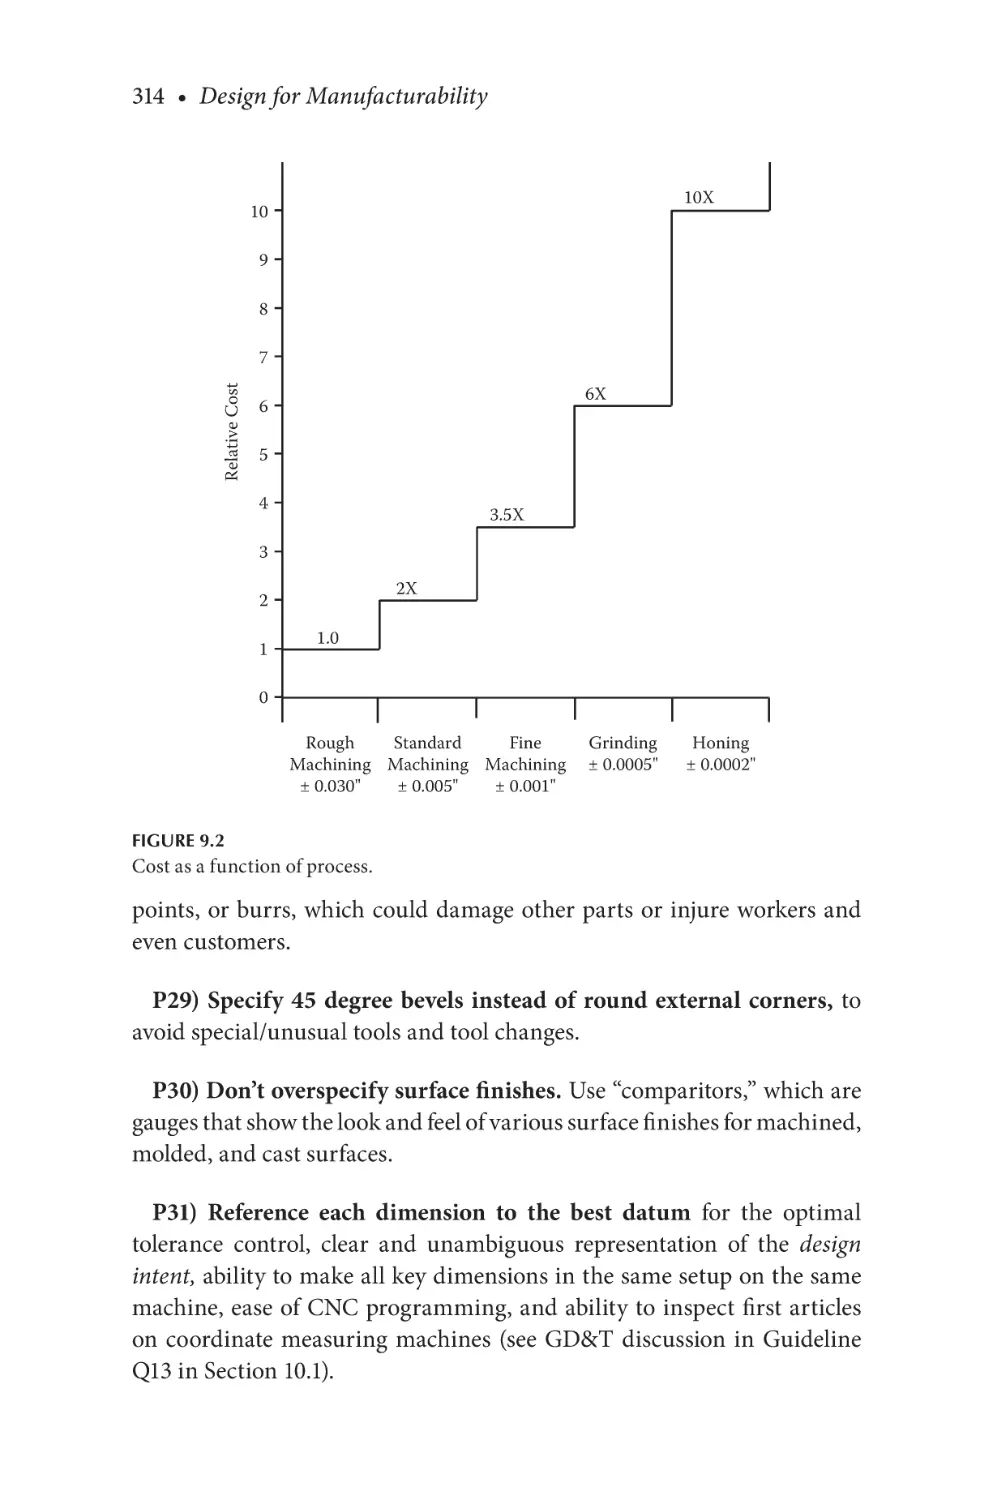
Figure 9.2 Cost as a function of process..................................................314
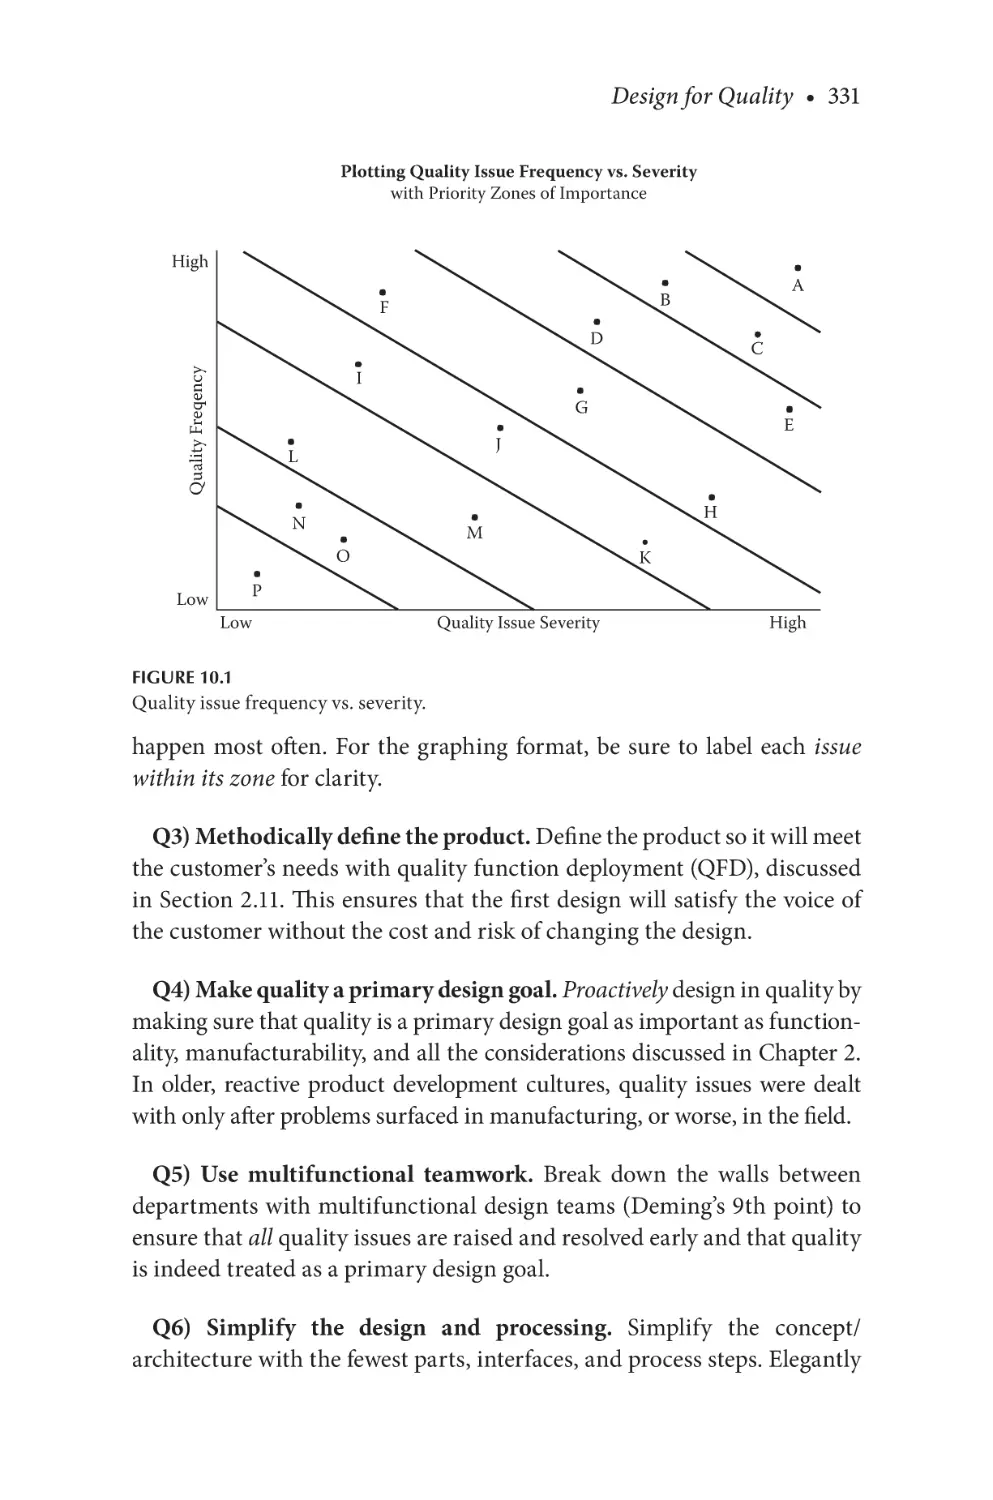
Figure 10.1
Quality issue frequency vs. severity.....................................331
Figure 10.2 Quality as a function of part count for average part
quality levels.....................................................................................................339
Figure 10.3
Reliability phases................................................................... 345
Figure 11.1
Pre-seminar survey results....................................................361
Figure 11.2
Incorporating DFM into the NPD process.........................373
Figure 11.3
Key DFM tasks, results, and tools........................................381
Figure A.1
Pareto’s law for products....................................................... 387
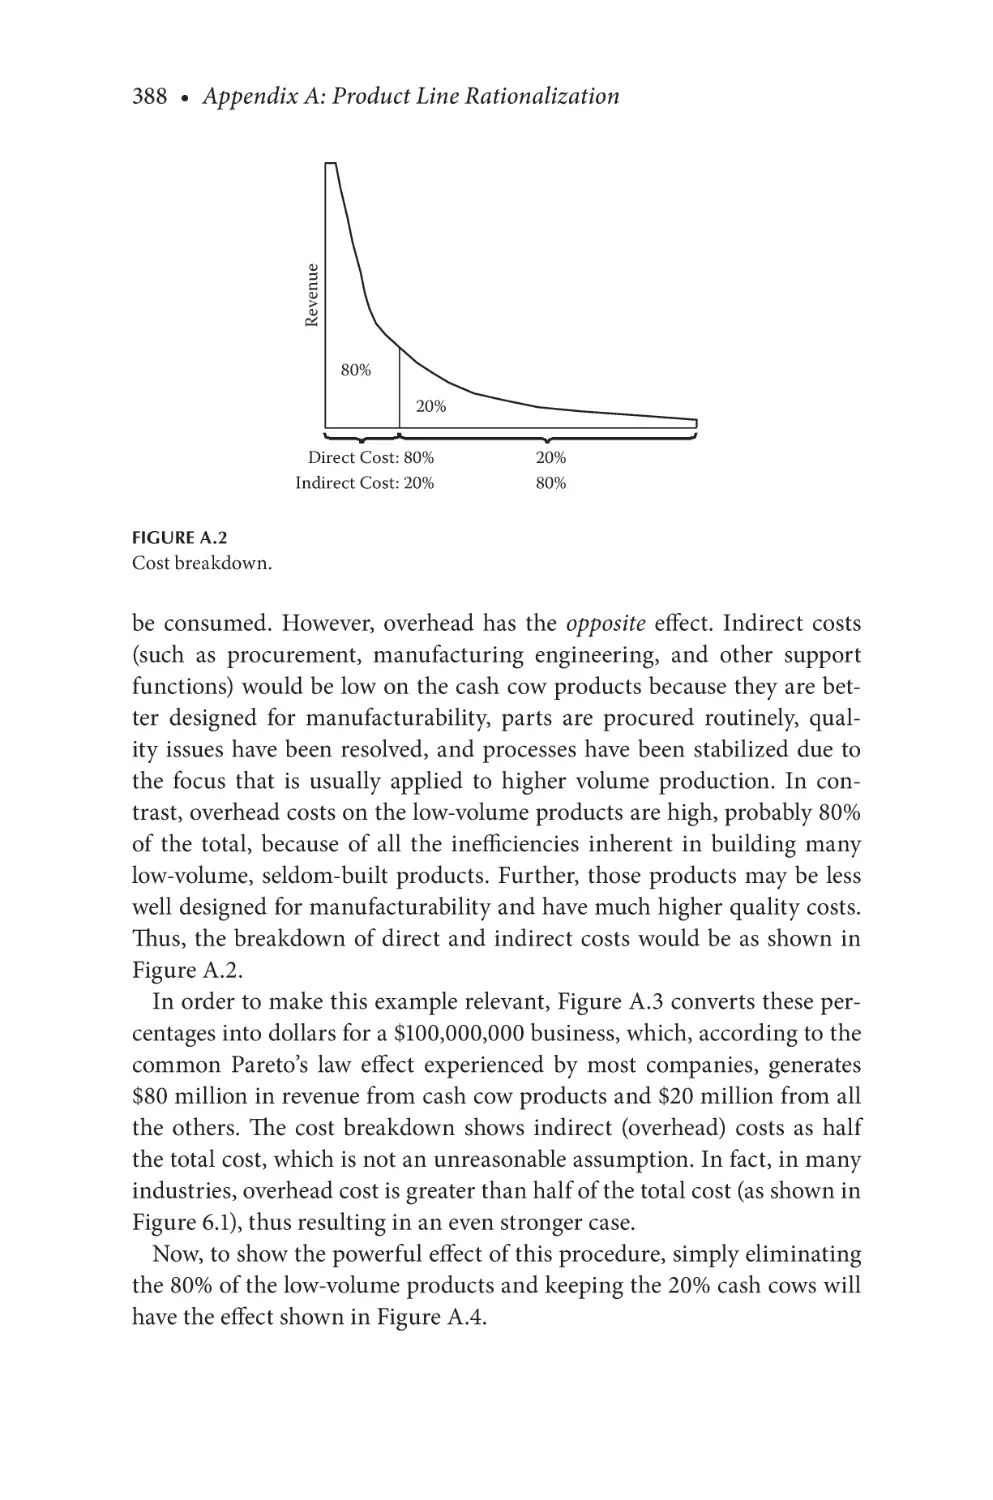
Figure A.2
Cost breakdown...................................................................... 388
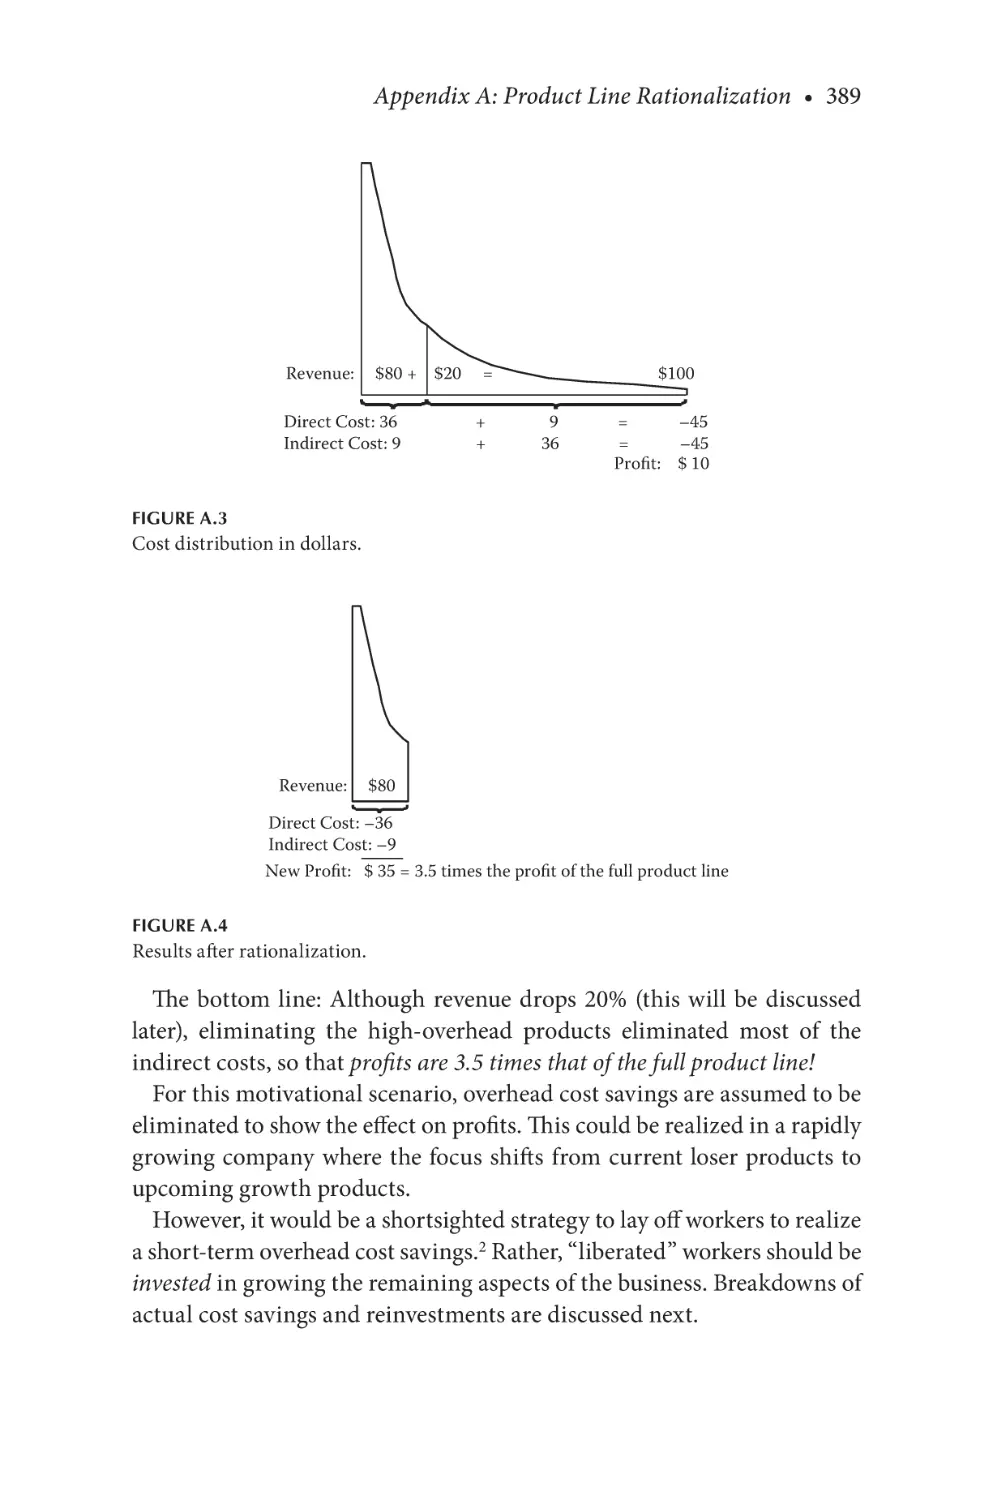
Figure A.3
Cost distribution in dollars................................................... 389
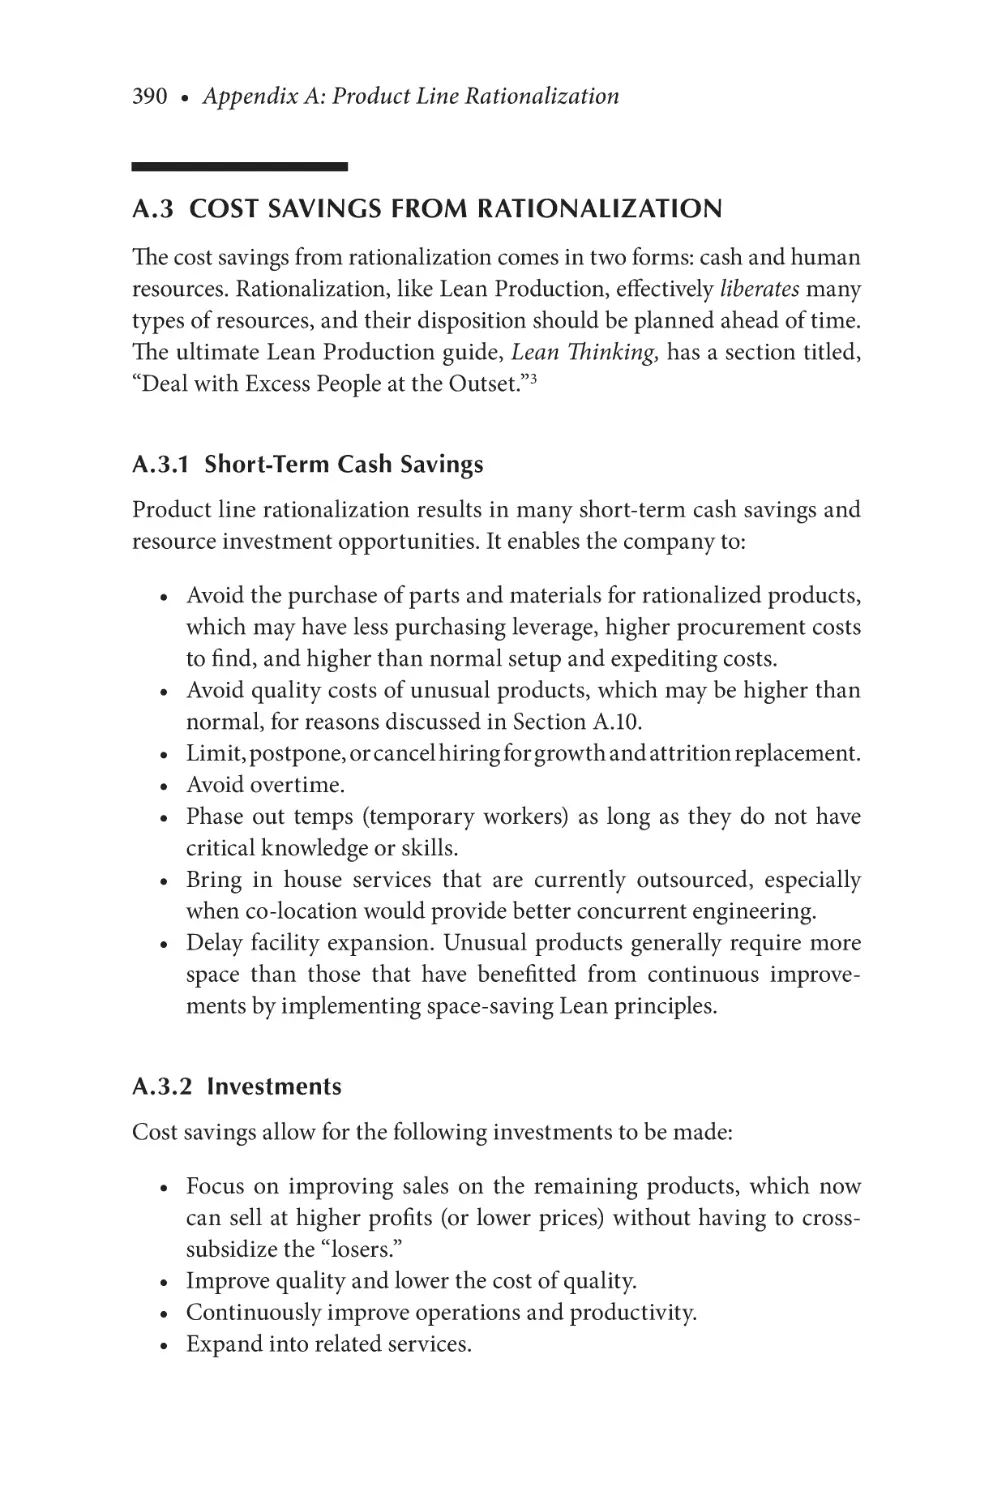
Figure A.4
Results after rationalization.................................................. 389
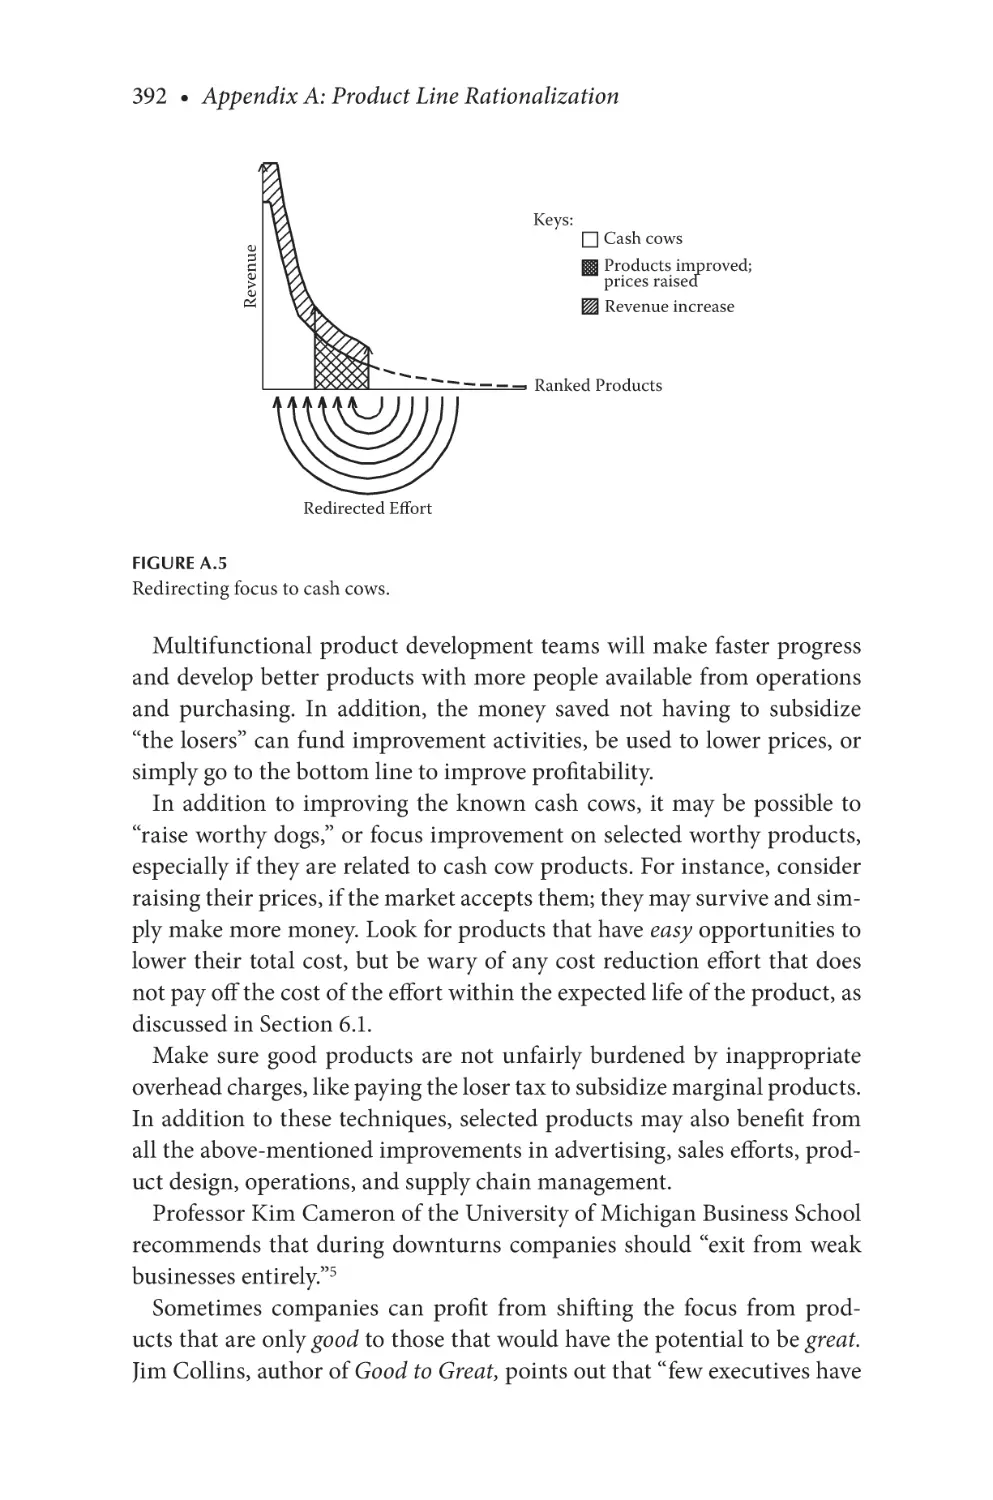
Figure A.5
Redirecting focus to cash cows............................................ 392
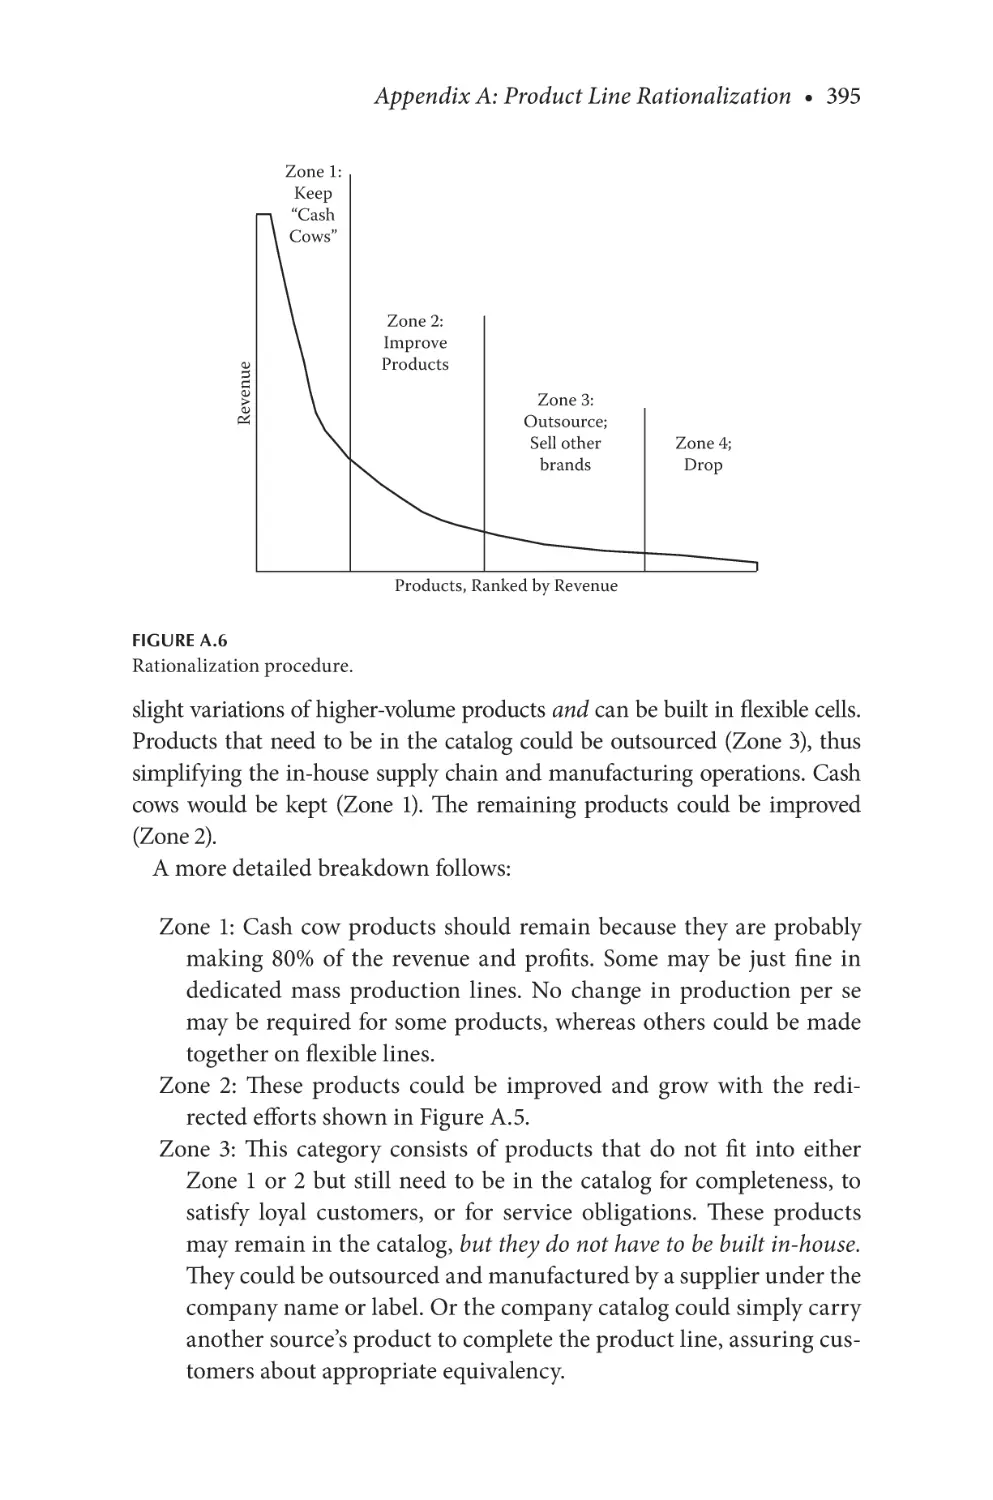
Figure A.6
Rationalization procedure.....................................................395
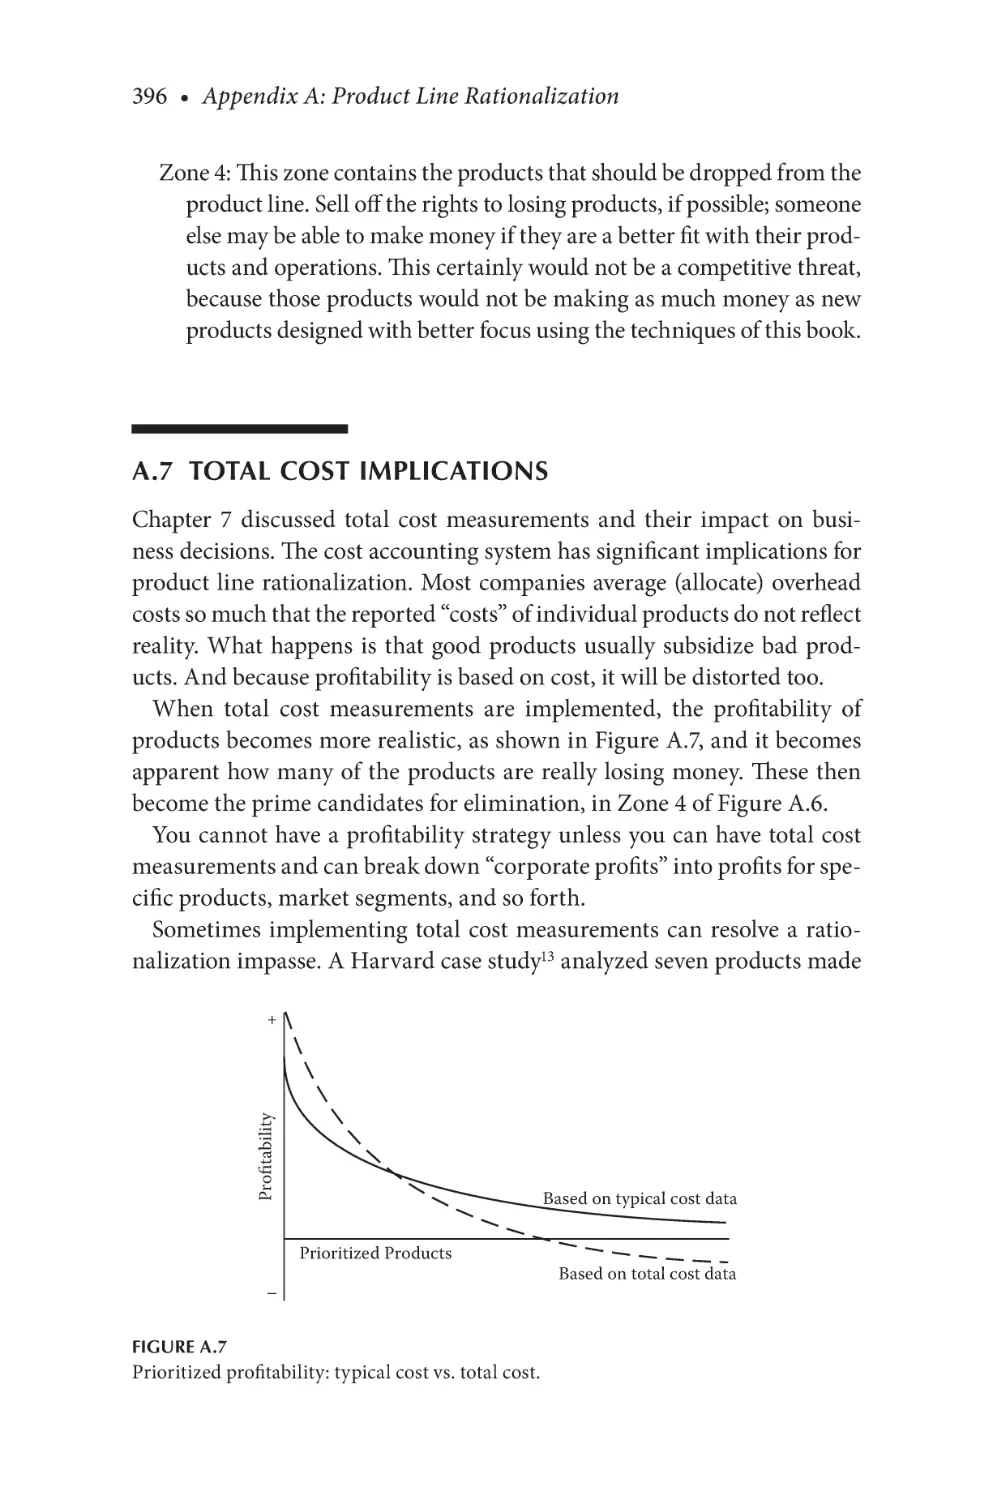
Figure A.7
Prioritized profitability: typical cost vs. total cost............. 396
Preface
This book shows companies how to design products that are manufacturable the first time and enables companies to quickly develop low-cost,
high-quality products that satisfy customer needs by design.
It might seem obvious enough to ask: why would anyone do otherwise?
Many companies think that because elements of the opening sentence are
in the corporate goals and mission statements, this will automatically happen by decree. Therefore, why would any company need a book on design
for manufacturability? Unfortunately, there are many reasons why products are not automatically designed for manufacturability.
Engineers are generally not taught DFM (design for manufacturability)
or concurrent engineering in college. The focus is usually on designing
for functionality. Further, they are typically trained to design parts, not
products or systems. Many design courses don’t even talk about how the
parts are to be manufactured. And engineering students rarely follow
their designs to completion to obtain feedback on their manufacturability.
Similarly, powerful computer-aided design (CAD) tools help engineers
design parts, not products. Sure, CAD tools can assemble parts into products for analysis, but that does not generate the most creative product
design, the simplest concepts, or the most optimized product architecture.
Because engineering training and tools are more adept at part design,
engineers and managers tend to skip the critical concept/architecture
phase and “get right to work” designing parts. This behavior is reinforced
by far too many managers, who want to see “visible progress,” which may
mean a quickly constructed breadboard which, after it “works,” is drawn
up and sent into production.
Product development management usually stresses schedule and cost,
which, if not measured right, may further reinforce all the above suboptimal behavior. Pressuring engineers to complete tasks on schedule is
really telling them to just throw it over the wall on time. In reality, the
most important measure of schedule is the time at which the product has
ramped up to stable production and is satisfying all the customers who
want to buy it.
Similarly, cost metrics usually emphasize just part cost, assembly cost,
and development budget, which are usually a small percentage of the only
xxvii
xxviii • Preface
cost metric that matters—the selling price. Overemphasizing only these
costs, just because they are the only ones measured, encourages engineers to specify cheap parts, cut corners, omit features, move assembly
to low-labor-rate countries, and perform other shortsighted actions that
make the product less desirable and ultimately more expensive on a total
cost basis.
In addition, too often engineering education and computer tools emphasize individual efforts instead of teamwork. Further, college deadlines may
be loose and, if not, the traditional college all-nighter might just compensate for procrastination. Traditional homework assignments issue all the
data needed—not too much, not too little—and there is a single answer.
Often, students don’t even have to get the answer right, as long as they
have the right approach. However, real life adds many constraints beyond
functionality, such as cost, quality, and time to market. And the designers
have to do all of this quickly and efficiently. Further, the designs have to be
manufacturable. Very few individuals, especially right out of college, have
enough experience to pull this off alone.
Fortunately, companies can compensate with multifunctional teams
that have enough specialties to successfully address all the goals and constraints. Teamwork may never have been taught to or practiced by many
engineers or managers, but their companies need multifunctional teams
that can work together to design products for manufacturability.
One goal of this book is to present many improvements to current
engineering practices, education, tools, and management. It shows the
importance of thoroughly optimizing the concept/architecture phase,
designing products as systems—not just collections of parts—and how
multifunctional teams can accomplish this quickly. This book contains
more than a hundred design guidelines to help development teams design
manufacturable products. It shows how to design for Lean Production and
build-to-order and to design in quality and reliability. The book has a big
picture perspective that emphasizes designing for the lowest total cost and
time to production when volume, quality, and productivity targets have
been reached.
If engineers practice the principles of this book, they will be able to
spend a higher proportion of their time doing fun, productive design work
and less on change orders and firefighting.
Preface • xxix
READING SCENARIOS
Engineers: Read the whole book; be familiar with Chapter 7 and
Appendix A
Team leaders and engineering instructors: Read the whole book; be
familiar with Chapter 7 and Appendix A
Purchasing: Chapters 1, 2, 5, and 6; Sections 7.6 and 7.8; and Appendix A
Program and R&D managers: Sections I, III, and VI and Appendix A
Finance: Sections 1.3, 1.4, and 2.6; Chapters 6 and 7; and Appendix A
Marketing and portfolio planners: Sections 1.4 and 1.5; Chapters 2
and 3; and Appendix A
Managers, investors, and boards: Chapters 1, 2, and 3; Sections 6.1–6.3
and 11.5; and Appendix A
BOOK OUTLINE
Section I: Design Methodology
Chapter 1 introduces the concept of design for manufacturability and
describes the problems that can be avoided when products are designed
for manufacturability. It also discusses roles, focus, and how to overcome
resistance, understand the myths and realities of product development,
and motivate engineers to design for manufacturability, avoid arbitrary
decisions, and do it right the first time. The chapter concludes with benefits
of DFM.
Chapter 2 shows how to use concurrent engineering to develop products
in multifunctional design teams. Such teams are most effective when they
have early and active participation of all specialties. This chapter describes
the problems when this does not happen and how to ensure availability of
resources. Just as Chapter 1 showed that the majority of the cost is committed by the concept/architecture, the key to getting products quickly to market is thorough up-front work. Product development phases are presented
with the tasks that enable good DFM, including: defining products to satisfy the voice of the customer with QFD (Quality Function Deployment);
xxx • Preface
optimizing the product architecture and strategies for operations and supply chains; raising and resolving the issues early; concurrently designing
the product and processes; and launching quickly into production.
Chapter 3, “Designing the Product,” focuses on thorough up-front work,
optimizing the concept/architecture phase, and a wide scope of design considerations. The chapter also shows how to use creativity and brainstorming to develop better products and how to develop half-cost products.
Section II: Flexibility
Chapter 4 shows how to design products for Lean Production, build-to-
order, and mass customization.
Chapter 5 offers effective procedures to standardize parts and materials, save time and money with off-the-shelf parts, search for them early
before arbitrary decisions preclude their use, and implement a standardization program.
Section III: Cost Reduction
Chapter 6 emphasizes the importance of minimizing the total cost and
then shows many ways to minimize total cost by design. It also shows why
cost is hard to remove after products are designed.
Chapter 7 emphasizes the importance of quantifying all product and
overhead costs and then shows easy ways to quantify total cost.
Section IV: Design Guidelines
Chapter 8 presents 27 design guidelines for product design, including
assembly, fastening, test, repair, and maintenance.
Chapter 9 presents 51 design guidelines for designing parts for manufacturability. The chapter also has a section on tolerance step functions
and how to specify optimal tolerances.
Section V: Customer Satisfaction
Chapter 10 shows how to design in quality and reliability with 34 quality
guidelines and sections on mistake-proofing (poka-yoke) and designing to
minimize errors. The chapter also explains that product quality is a function of the cumulative exponential effect of part quality and part quantity.
Preface • xxxi
Section VI: Implementation
Chapter 11 shows how to implement DFM, including: determining the
current state of how well products are designed for manufacturability;
estimating how much could be improved by implementing DFM; getting management support and buy-in; arranging DFM training; forming a task force to implement DFM; stopping counterproductive policies;
implementing DFM at the team and individual levels; and implementing
standardization and total cost measurements.
Section VII: Appendices
Appendix A presents effective methodologies for product line rationalization to maximize resource availability for product development and
increase profits immediately.
Appendix B lists the design guidelines without explanation to help DFM
task forces create customized design guidelines and checklists.
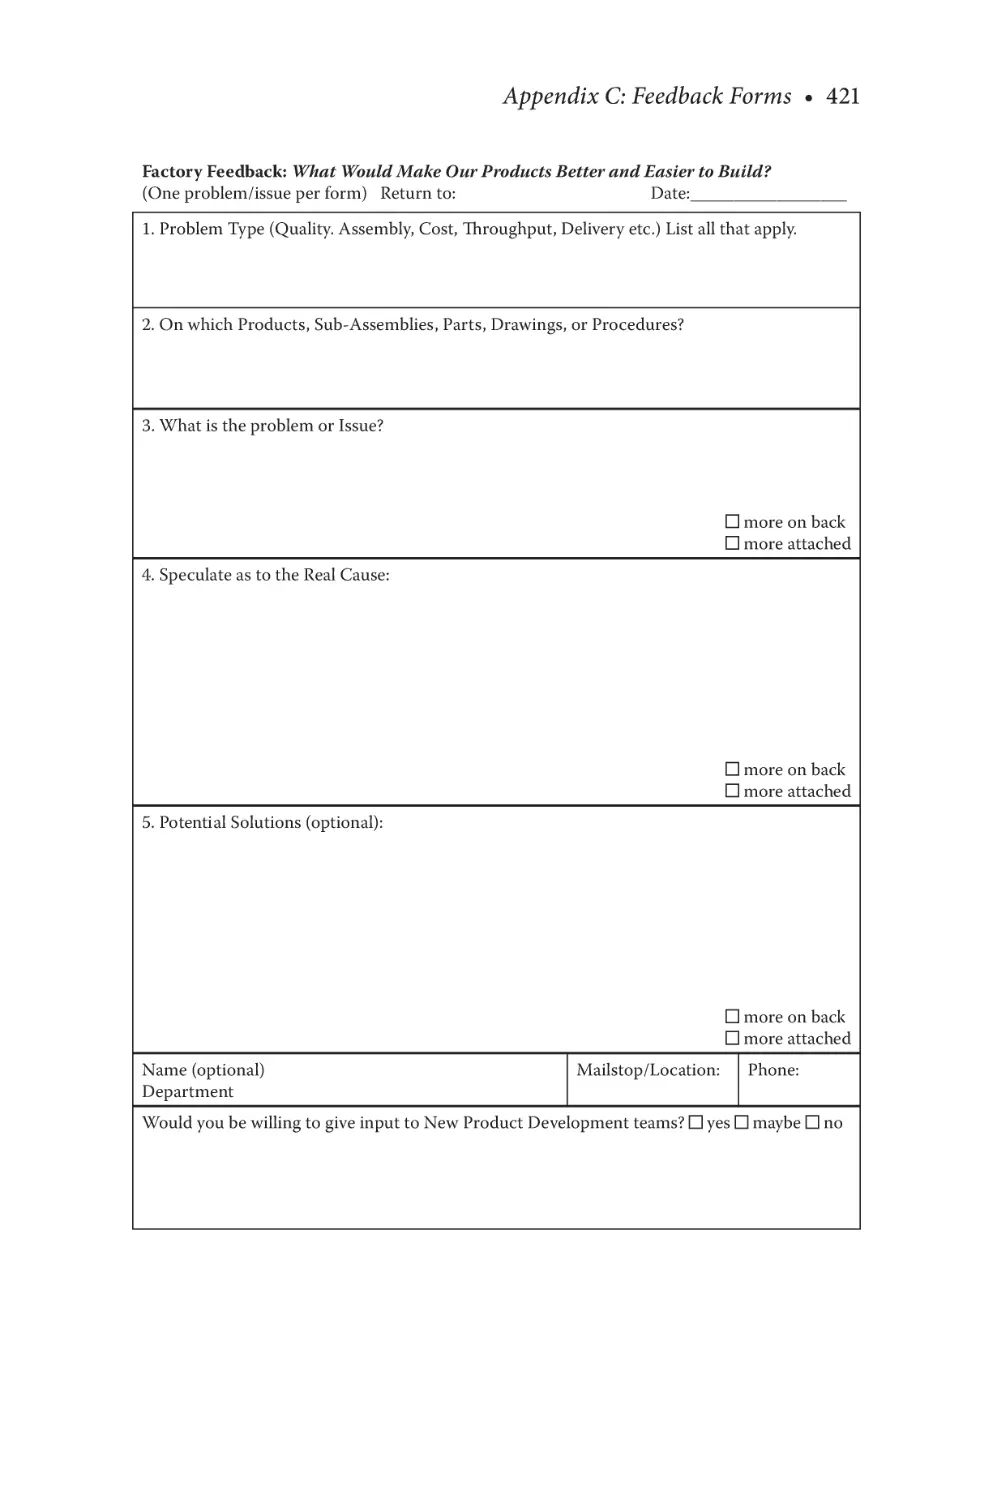
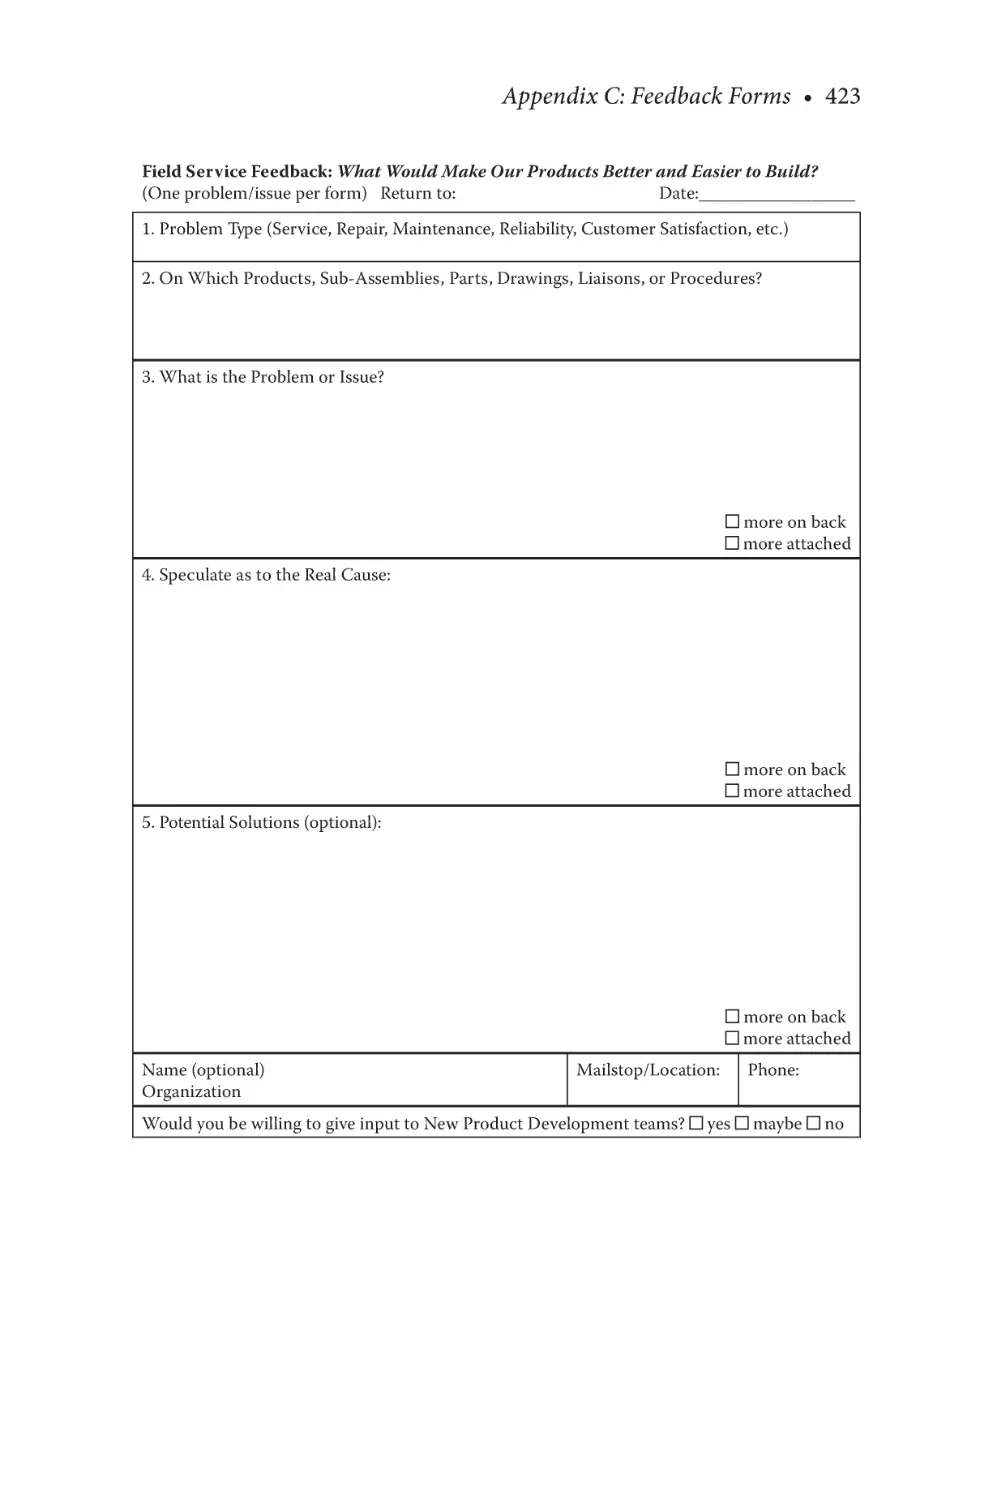
Appendix C contains several useful forms for obtaining feedback from
customers, factories, vendors, and field service.
Appendix D provides resource listings for the references that were cited
the most in this book and information about the author’s websites, customized in-house training, workshops, consulting, commercialization,
and half-cost design studies.
PREFACE FOR INSTRUCTORS
This book can be especially effective for use as a textbook for a senior or
graduate-level course on design for manufacturability and for company
in-house training. It contains the latest material from the author’s 27 years
of in-house DFM seminars at manufacturing companies.
The book evolved from his experience initiating and implementing
the DFM program for electronic products at Intel’s Systems Group and
teaching internal courses. That evolved into college courses on DFM at
the University of Portland and later in the management of technology program at the University of California at Berkeley.
Various editions of this book have been used for courses at UC
Berkeley Extension, Bemidji State University, Cleveland State University,
xxxii • Preface
University of Colorado, University of Dayton, Eastern Michigan State
University, Morehead State University, New Mexico State University,
North Carolina State University, North Central Michigan State, Northern
Illinois University, Oregon Institute of Technology (two campuses),
University of Portland, San Jose State University, Sinclair College (part
of joint program with University of Dayton), South Alabama University,
Southern Methodist University, the St. Thomas University, West Carolina
University, Washington State University (four campuses), the University
of Wisconsin at Platteville, and Worchester Polytechnic Institute.
The industrial orientation of this book should give practical direction to
college students to help them adapt quickly to the real world and design
manufacturable products. Additional reading assignments can be selected
from the references listed at the end of each chapter and in Appendix D,
Section D.1.
This book can also be used to supplement courses on machine design,
project design, system engineering, engineering management, engineering economy, value analysis, or management courses in business administration or mechanical, industrial, or manufacturing engineering.
A complimentary instructor package is available from the author that
includes a college course outline, term project suggestions, homework,
and exam questions with answers.
COMPANIES THAT USE THESE PRINCIPLES
DFM Books
The following companies have bought five or more copies of previous
editions of this book (* means more than 50 copies; ** means more than
100 copies):
Allergan-Humphreys *
Applied Materials
Asyst Technology
Bayer Corporation
Beckman-Coulter *
Bio-Rad
Boeing
Boston Scientific *
Bristol-Meyers Squibb
Brooks/PRI Automation
Daikin McQuay
EG&G Instruments
Fisher Controls
FMC
Freightliner
Hewlett-Packard **
Preface • xxxiii
Ice-O-Matic
Itron
Hoeffer Scientific
Hollister
KLA/Tencor
Lam Research*
Loral**
Measurex
Moog Aircraft
Parker Hannifin
Physics International
Plantronics
PRI Automation*
Rainbird
Rantron
Smiths Aerospace
Spraying Systems*
Stanford Telecom
United Technologies Corp**
Watlow
W.L. Gore
In-House Seminars
Dr. Anderson has conducted seminars (see description in Appendix D,
Section D.4) or provided consulting services for the following companies
(number of seminars in parentheses):
Advanced Bionics
Ansitsu
BAE Systems (4)
Ball Aerospace
Bausch & Lomb
Beckman Coulter (3)
Becton-Dickinson
BOC (formerly Airco)
Boeing (4)
Bucyrus, a division of Caterpillar
Crane Merchandising Systems
Emergency One (3)
Emerson Electric (2)
FMC/JBT FoodTech (2)
Freightliner (2)
GE Energy & Transportation (3)
Hewlett-Packard (7)
Honeybee Robotics
Intel Systems Group (10)
Invivo, now Philips (3)
John Deere
L-3 Communications (3)
LG Group, Korea (4)
Loral (2)
Medrad
Moog Aircraft
NCR (2)
Northern Telecom
Plantronics (5)
PRI Automation-Robot Division
Qualcomm
Sloan Valve
Smiths Aerospace, now GE (4)
St. Jude Medical (2)
United Technologies (2)
Varian Medical Systems
Winegard (2)
About the Author
David M. Anderson, PhD, is the world’s leading expert on using concurrent engineering to design products for manufacturability. Over the past
27 years presenting customized in-house DFM seminars, he has honed
these methodologies into an effective way to accelerate the real time-tostable production and significantly reduce total cost.
His book-length website, www.HalfCostProducts.com, presents a comprehensive cost reduction strategy (summarized in Section 6.3) consisting
of eight strategies, all of which can offer significant returns as stand-alone
programs and even greater results when combined into a synergistic business model. DFM is a key strategy because it supports most of the others.
Dr. Anderson shows clients how to apply these strategies for cost reduction, ranging from half cost to an order of magnitude, which he teaches in
customized in-house seminars, workshops, and design studies to generate
innovative breakthrough concepts (see Appendix D).
In the management of technology program at the University of California
at Berkeley, he wrote and taught the product development course twice.
He wrote the opening chapter in the sixth volume of the Tool and
Manufacturing Engineers Handbook. His second book on mass customization, Build-to-Order & Mass Customization: The Ultimate Supply Chain
Management and Lean Manufacturing Strategy for Low-Cost On-Demand
Production Without Forecasts or Inventory, is described in Appendix D.
Dr. Anderson has more than 35 years of industrial experience in design
and manufacturing. For seven years, his company, Anderson Automation,
Inc., built special production equipment and tooling for IBM and
OCLI and did design studies for FMC, Clorox Manufacturing, and SRI
International. As the ultimate concurrent engineering experience, he personally built the equipment he designed in his own machine shop. He has
been issued four patents and is working on more.
Dr. Anderson is a fellow of ASME (American Society of Mechanical
Engineers) and a life member in SME (Society of Manufacturing Engineers).
He is a certified management consultant (CMC) through the Institute of
Management Consultants. His credentials include professional registrations in mechanical, industrial, and manufacturing engineering and a
doctorate in mechanical engineering from the University of California,
xxxv
xxxvi • About the Author
Berkeley, with a major in design for production and minors in industrial
engineering, metalworking, and business administration.
Dr. Anderson can be reached via email: anderson@build-to-orderconsulting.com. His websites are www.design4manufacturability.com
and www.HalfCostProducts.com.
Section I
Design Methodology
1
Design for Manufacturability
Design for manufacturability (DFM) is the process of proactively designing products to (1) optimize all the manufacturing functions: fabrication, assembly, test, procurement, shipping, service, and repair; (2) ensure
the best cost, quality, reliability, regulatory compliance, safety, time-to-
market, and customer satisfaction; and (3) ensure that lack of manufacturability does not compromise functionality, styling, new product
introductions, product delivery, improvement programs, or strategic initiatives and make it difficult to respond to unexpected surges in product
demand or limit growth.
Concurrent engineering is the proactive practice of designing products
in multifunctional teams, with all specialties working together from the
earliest stages. Concurrent engineering with multifunctional teams is discussed in Chapter 2.
DFM and concurrent engineering are proven design methodologies
that work for any size company. Early consideration of manufacturing
issues shortens product development time, minimizes development cost,
and ensures a smooth transition into production for the quickest real
time-to-market.
Quality is designed in (Chapter 10) with concept and process simplicity,
optimal tolerances, quality parts, mistake-proofing, concurrent design of
robust processes, and specification of quality parts to minimize the cumulative effect of part quality on product quality.
Many costs are reduced with products that can be quickly assembled
from fewer parts. Products are easier to build and assemble, in less time,
with better quality. Parts are designed for ease of fabrication and commonality with other designs.
Products are designed for Lean Production and build-to-order with
aggressive standardization (Chapter 5), elimination of setup by design,
3
4 • Design for Manufacturability
and the concurrent engineering of versatile products and flexible processes (Chapter 4).
Companies that have applied DFM have realized substantial benefits.
Total cost and time-to-market can be cut in half with significant improvements in quality, reliability, serviceability, product line breadth, delivery,
customer satisfaction, growth, and profits.
1.1 MANUFACTURING BEFORE DFM
Before DFM, the motto was “I designed it; you build it!” Design engineers
worked alone or only in the company of other design engineers in “the
engineering department.” Designs were thrown over the wall to manufacturing, which then had the dilemma of either objecting (“But it’s too
late to change the design!”) or struggling to launch a product that was
not designed well for manufacturability. Often this delayed both the product launch and the time to ramp up to full production, which is the only
meaningful measure of time-to-market.
Poor manufacturability raises many categories of cost to pay for launch
difficulties, special equipment or modifications, difficult part fabrication,
inefficient assembly, excessive part proliferation, laborious procurement,
numerous changes, and many other overhead costs. These issues not
only raise cost but also delay shipments. Problem product introductions
may absorb so much effort that production of other products may suffer.
Lack of manufacturability also degrades quality, which, in turn, raises
costs further and delays the real time-to-market. This is because products not designed for quality are unnecessarily complex, have too many
parts from too many suppliers, require more difficult manual assembly,
and may not be robust enough for consistent processing. Further, counterproductive “cost reduction” may compromise quality while, ironically, not
lowering total cost.
Probably the most subtle effect (but most damaging in the long run)
is that a series of problem product introductions drains resources (both
people and money) away from new product development (NPD) and continuous improvement efforts that should be making product lines and factories more competitive.
Excessive proliferation of parts and products can make it harder to implement just-in-time, Lean Production, build-to-order, and mass customization.1
Design for Manufacturability • 5
DFM may make the difference between a competitive product line and,
in the extreme, products that are not manufacturable at all. The main
causes of product failures are that costs are too high, quality is too low,
introductions are too late, and stable production is even later, or, if the
product is a big hit, production is unable to keep up with demand. These are
all manufacturability issues and therefore can be much improved by DFM.
Before DFM, companies felt limited by trade-offs, such as “cost, quality,
time-to-market; take two!” Some companies may not have been able to
achieve two or one or even any of these goals if they rushed up-front work,
repeated past mistakes because lessons were not learned, did not resolve
issues early, did not design in manufacturability and quality, did not work
from a clear and stable product definition, and did not design in low cost.
1.1.1 What DFM Is Not 2
• DFM is not a late step that, once checked off, gets you through a
design review or gate.
• DFM is not done only at the parts level; most opportunities are at the
system architecture level.
• DFM is not done by the “DFM engineer.”
• DFM is not to be “caught” later in design reviews.
• DFM is not an afterthought.
• DFM is not to be accomplished by changes.
• DFM is not done alone by engineers in their cubicles.
• DFM is not done by a “tool.”
1.1.2 Comments from Company DFM Surveys
The following are verbatim comments from company surveys before DFM
training. (The use of these surveys is discussed in Section 11.2.) When
asked about the consequences of inadequate DFM, engineers and managers usually cite problems with quality, cost, delivery, profits, and competitiveness, which are tabulated in Section 11.2. The colorful comments
convey what it is like to work in a company that does not design products
well for manufacturability.
The consequences of inadequate DFM for delivery are
“Line stoppers”
“Parts do not assemble correctly”
6 • Design for Manufacturability
“Endless engineering change orders”
“Much pruning, grooming, and tuning to get products out the door”
“Poor yield invariably results in late delivery or 11th hour miracles”
“When a problem is encountered the production line comes to a stop”
“Emergency change orders and redlines to keep manufacturing
operating”
The behavioral hurdles to good DFM are
“Lack of DFM training,” “Lack of DFM knowledge”
“Parts designed with no consideration of how it is to be built”
“‘Over the wall’ syndrome: after release, no longer engineering’s
problem”
“Never enough time to design parts right the first time; always
enough time to do it over”
The attitude hurdles to good DFM are
“Tradition”
“Designer’s limited knowledge of manufacturing processes”
“Reluctance to accept suggestions from suppliers regarding design
issues”
“We don’t seem to allot time to design systems properly up front, but
we are willing to do it over later after a product is released”
The bottom line consequences, besides profitability, include:
“Unhappy customers”
“Sometimes problems get shipped to the field”
“Customers losing confidence in our products”
“Problems increase overall costs, resulting in loss of the ability to
compete”
“Low product quality leads to poor customer satisfaction, poor performance, and eventually to high costs”
“Post-launch redesigns”
1.2 MYTHS AND REALITIES OF PRODUCT DEVELOPMENT
Resistance to DFM may stem from myths about product development.
Here are the most common myths and the corresponding realities:
Design for Manufacturability • 7
Myth #1: To develop products quicker, immediately move forward with
detail design and software coding, and then enforce deadlines
to keep design release and first-customer-ship on schedule.
Fact: The most important measure of time-to-market is the time to stable,
trouble-free production, which depends on getting the design
right the first time.
Myth #2: To achieve quality, find out what’s wrong and fix it.
Fact: The most effective way to achieve quality is to design it in and then
build it in.
Myth #3: To customize products, take all orders and use an ad hoc “fire
drill” approach.
Fact: The most effective way to customize products is with the concurrent
design of versatile product families and flexible processes. This
is known as mass customization.3
Myth #4: Cost can be reduced by cost reduction efforts.
Fact: Cost is designed into the product, especially by early concept decisions, and is difficult to remove later.
1.3 ACHIEVING THE LOWEST COST
Figure 1.1 shows that by the time a product is designed, 80% of the cost
has been determined.4 And by the time a product goes into production,
95% of its cost is determined, so it will be very difficult to remove cost at
that late a date. The most profound implication for product development is
that 60% of a product’s cumulative lifetime cost is committed by the concept/
architecture phase! This is why it is important to fully optimize this phase,
as will be shown in Section 3.3.
1.3.1 Toyota on When Cost Is Determined
The Toyota philosophy confirms this. “The cost of a [product] is largely
determined at the planning and design stage. Not much in the way of cost
improvement can be expected once full-scale production begins.” “Skillful
improvements at the planning and design stage are ten times more effective than at the manufacturing stage.”5
8 • Design for Manufacturability
100
Co
m
m
itt
ed
Lifetime Product Cost
Cumulative Percentage
Co
st
80
60
40
20
Incurred
0
Concept
Architecture
Design
Costs
Testing
Process
Planning
Phase of Product Life
Production
FIGURE 1.1
When costs are determined.
1.3.2 Ultra-Low-Cost Product Development
Ultra-
low-
cost product development techniques have been used to
develop the $2,200 Tata Nano, $100 computers (for the One Laptop per
Child Foundation), $35 cell phones, and low-cost medical products such
as the Siemens Essenze, which “provide small clinics and rural hospitals
access to quality healthcare services at a fraction of the cost of standard
MRI equipment.”6
In the Industry Week article by A.T. Kearney about ultra-low-cost product development, the author notes: “It is well known that over 70% of
product cost is determined during the development phase and a substantial amount of additional costs are caused by engineering changes that
happen late in the product development process.”7
Design for Manufacturability • 9
1.4 DESIGNING FOR LOW COST
The DFM techniques presented herein provide proactive ways to achieve
much greater cost reduction than can be achieved by reactive approaches,
such as “cost reduction,” the problems of which are discussed in Section 6.1.
This reality counters the myth that cost can be reduced by cost reduction efforts.
Cost is designed into the product, especially by early concept decisions, and
is difficult to remove later.
The book, When Lean Enterprises Collide, studied the competition and
cost practices of several Lean Production companies in Japan. The author,
Robin Cooper, has also written extensively on total cost accounting. His
view on product development’s role in determining cost: “Effective cost
management must start at the design stage of a product’s life because once
a product is designed the majority of its costs are fixed.”8
The main cost minimization opportunities are to simplify concepts and
product architecture (Section 3.3), which determines 60% of the lifetime
cumulative cost, as shown in Figure 1.1. A key part of this is optimal selection of versatile modules (Section 4.7), previous engineering (Section 5.18),
and off-the-shelf parts (Section 5.19), which usually result in total cost savings while ensuring quality and reliability because they are proven parts
that can be verified by their track records. Chapter 6 shows several ways to
minimize cost through design. Applying these DFM techniques should
enable companies to develop products at half the total cost, with special
emphasis on the key points discussed in Section 3.8.
1.4.1 Design for Cost Approaches
Various approaches exist to determine the goals for costs and the pricing
of products.
1.4.1.1 Cost-Based Pricing
The way this approach typically works is engineers design the product and
then add up the parts and labor costs, which are usually their only cost
10 • Design for Manufacturability
focus. To that the company adds average overhead costs, selling costs, and
profit to arrive at the selling price.
1.4.1.2 Price-Based Costing (Target Costing)
The target costing approach starts with a selling price that is estimated to be
competitive. From that, profits, selling costs, and overhead are subtracted
to determine the target cost for parts and labor.9,10 A more advanced version would be to subtract profits and selling commissions from the selling
price to determine the total cost, which would include parts, labor, and all
overhead costs.
However, it should be kept in mind that costing/pricing policies are
really targets, not strategies to design low-cost products. If product development teams do not know how to really design low-cost products, these
costing/pricing approaches will have different consequences.
In the case of cost-based pricing, not knowing how to design low-cost
products will result in higher-than-necessary costs, which will result in
pricing that may be too high to be competitive. In the case of price-based
costing, not knowing how to design low-cost products can result in the
following dangerous scenario:
• Engineers design the product as they usually do—for functionality.
• Accountants add up the part and labor costs and apply the usual
overhead costs.
• Management then realizes how much the part and labor costs are “over
the target” and pressures the engineering, purchasing, and manufacturing departments to “lower the cost” (of the parts and labor).
• Design engineers and “value engineers” find it difficult to reduce cost
after design (for reasons presented in Section 6.1), so they may be tempted
to do some desperate things to achieve the part and labor targets, such
as cutting corners, omitting features, or specifying cheaper parts. All of
these changes incur the costs of making and documenting the changes.
Moreover, cutting corners and cheaper parts will add to quality costs.
• The purchasing department might try low bidding of parts, pressuring suppliers, or changing suppliers for a slightly better purchase
cost. However, while this might appear to lower part cost, it will
most likely raise other costs and compromise quality (Chapter 6),
delivery (Chapter 4), and collaboration with vendors to develop more
manufacturable products (Chapter 2).
Design for Manufacturability • 11
• Manufacturing, under enough pressure, might do some desperate
things, such as outsourcing and moving manufacturing to “low-
labor-
cost” countries, which decreases responsiveness while not
really reducing total cost.11
1.4.1.3 Cost Targets Should Determine Strategy
Cost goals should determine the approach, not exert pressures to “do the
same thing, but better.”
Key cost goals should be expressed to management and the design teams
in degrees or even the desired percentage improvement. For instance, a 5%
goal might be achieved with better diligence. A 20% to 30% cost improvement goal would need some serious application of all the DFM principles
presented herein. Above 50% would require breakthrough concept innovation, because that is where most cost is determined.
So the degree of the needed cost reduction would determine how ambitious the product development approach should be and how well staffed
and how well structured the timelines should be.
1.4.2 Cost Metrics and Their Effect on Results
This book shows how to design products with the lowest total cost, which
is discussed in Chapter 7. If all costs are quantified, and DFM principles
are followed, design teams will design to minimize total cost. On the
other hand, if the only costs measured are parts and labor, the results will
be counterproductive.
If the driving cost metric is labor cost, then decision makers may conclude that if labor rates offshore are one-fifth, then they will save four-fifths
of the labor budget. However, this fails to consider that the total will go
up much more, for reasons presented in Section 4.8 (on offshoring effects
on product development, Lean Production, and quality) and Section 6.9
(on the cost of quality).
If the primary cost metric is parts cost, then engineers will be encouraged, even pressured, to specify cheap parts. Those “savings” will be more
than cancelled out by the costs of quality (diagnoses, repair, scrap, retesting, etc.) and “firefighting,” as shown graphically in Figure 1.2. This will
compromise product development by:
12 • Design for Manufacturability
Basing “cost” primarily on BOM cost and pressuring to lower “cost” or achieve “cost” targets result in:
Lowers quality
% Specifying
cheap parts
% Changing to
cheap parts
% Changing
vendors
%Resisting
standardization
thinking a
“better” part
would raise a
BOM line, thus
resulting in:
• Inhibiting NPD
advances that
save total cost
(but raise a BOM
line) such as:
Lowers reliability
& performance
Adds variables
Changes variables
Less economies-of-scale
More material overhead
More inventory costs
More expediting costs
Less part qualifications
Availability problems
Less qualified parts
Harder to implement
Lean & Flexibility
Part combinations
Silicon integration
Versatile bare boards
Innovative PCB connects
Raises quality costs
Drains resources to fix problems
Disappoints customers A lower sales
Tarnishes reputation A lower sales
Raises costs of support, complaints, returns,
recalls, patches, penalties, warrantee &
liabilities
Complicates NPD
Difficult quality
improvements
Delays introduction
Change orders to
Raises NPD costs
make it work
Drains resources
again and fix
Delays qualifications
new quality
problems from
all the changes
Missed opportunities to lower labor cost,
raise quality, ensure/improve
performance, and miniaturize products
FIGURE 1.2
Hidden costs and consequences of cheap parts.
1. Draining engineering and manufacturing resources away from
designing low-cost products to deal with problems caused by the
cheap parts and write engineering change orders, some of which
will, ironically, be to change to better parts.
2. Adding variables to the product and to the product development process. These extra variables will then require even more resources to
work longer to get working prototypes into production, thus raising
product development cost and delaying the product’s introduction.
In addition to lowering quality, raising quality costs, and complicating
product development, pressures to minimize part cost will discourage
standardization, the value of which is discussed in the opening two pages
of Chapter 5. Standard parts are better than what is needed for most applications and, thus, may appear to raise cost when only the raw part cost is
considered. However, standardization results in an overall net cost savings
from economies of scale, less inventory, and material overhead that, compared to oddball parts, can be 10 times less! Similarly, pressure to lower
part cost may discourage innovative strategies to lower total cost, such
as combining printed circuit boards, higher levels of silicon integration
Design for Manufacturability • 13
(VLSI, ASICs, FPGAs, etc.), and flex layers (Section 3.1), which may appear
on a bill of materials (BOM) line as an expensive part.
1.4.3 How to Design Very Low Cost Products
Quantify all costs. Without quantifying overhead costs, cost reduction
strategies will focus on just parts and labor, because (1) parts and labor
are only a portion of the cost and, worse, (2) shortsighted efforts to
reduce parts and labor costs usually raise overhead costs much more.
Avoid policies that inhibit real cost reduction opportunities or drain
resources, such as rushing up-front work, selling difficult high-
overhead orders, not prioritizing engineering resources, and not
correcting critical staffing gaps that inhibit concurrent engineering.
Understand that 80% of cost is committed by the design phase and 60%
is committed by the concept and architecture phase, as shown in
Figure 1.1. Given this, don’t assume that a poorly designed product
can be cost-reduced by high-volume mass production or automation.
Don’t just look at lists of parts, because (1) that will cause you to miss
opportunities at the architecture level, which determines 60% of
the cost, and (2) substituting cheaper parts requires new product
development resources and introduces many new variables that
will lower quality, raise other costs, and delay product development
itself, as shown in Figure 1.2.
Investigate what worked well and what caused extra expenditures on
related programs—the “lessons learned.” Also, raise and resolve all
cost issues early, including cost of quality, which should be quantified.
Identify and prioritize cost challenges and cost reduction opportunities.
Preselect vendors and partners who will help design their parts. This
will save much more money than designing parts in isolation and
going for the low bidder.
Implement concurrent engineering in which complete multifunctional
teams do all of the above.
Thoroughly search for standard off-the-shelf parts, before arbitrary decisions preclude their use. Then the product will be literally designed
around them.
Select off-the-shelf parts by thoroughly searching acceptable ranges
of candidate parts, instead of telling purchasing: “this is the spec I
need; find a part that matches that spec” (see Chapter 5).
14 • Design for Manufacturability
These substantial opportunities will be missed if an engineer designs for
function, specifies the part desired, throws that over the wall to purchasing
to look for it, and then concludes that off-the-shelf parts just won’t work
for their products so they will just have to design custom versions.
1.4.4 Cost Reduction by Change Order
Except for isolated low-hanging fruit, cost reduction after the product is
designed is an ineffective way to lower cost because:
Cost is designed into the product: 80% of cost is committed by design,
and by the time it gets to manufacturing, only 5% is left.
Cost is hard to remove later because so much is cast in concrete and
so much is boxed into multiple corners. Thus, cost reduction usually
focuses on parts, making systematic cost reduction almost impossible.
Cost reduction efforts on one product will not have the time or bandwidth to reduce any overhead costs, which may be more than half the
cost but are rarely quantified. So the focus usually shifts to specifying cheaper parts, omitting features, beating up suppliers, switching
to a new low bidder, letting labor costs dominate sourcing and plant
location decisions, or cutting corners.
Cost reduction by cutting corners may cheapen the product and compromise the image or integrity of the product.
The changes will cost money, which exponentially increases with development time, so it may not be paid back within the life of the product.
The cost of changes rises drastically as the product progresses toward
production. Figure 1.3 shows how the cost for each change escalates
during the development of a major electronics product.12 Thus, it
Time of Design Change
During design:
During design testing:
During process planning:
During test production:
During final production:
FIGURE 1.3
Cost of engineering changes over time.
Cost
$1,000
$10,000
$100,000
$1,000,000
$10,000,000
Design for Manufacturability • 15
can be concluded that a very expensive and time-consuming way
to implement DFM is through engineering change orders. And yet,
that is what happens when DFM and all the other considerations are
ignored in the early design steps.
The changes will cost time, especially if requalifications are required,
which may delay the time-to-market. Changes may induce more
problems, thus requiring further changes, which will involve expenditure of more hours, calendar time, and money, and possibly compromise functionality, quality, and reliability.
Another reason cost reduction cannot be counted on is that it may just
not happen due to competing priorities, such as mandatory changes
and designing new products.
Studies show that cost reduction does not work. Mercer Management
Consulting analyzed 800 companies over five years. They identified
120 of these companies as “cost cutters.” Of those cost-cutting companies, “68% did not go on to achieve profitable revenue during the
next five years.”13
Committing valuable resources to implement cost reduction strategies
after design takes resources away from other more effective efforts
in product development, quality, Lean Production, and elsewhere. If
too many resources are committed to cost reduction, then:
1. There will not be enough resources available for real cost reduction through new product development. If this continues over
time, the result will be little, if any, real reduction in cost, while
such a drain of resources will impede new product development
innovation.
2. It will prevent the transition from back-loaded efforts to the more
effective front-loaded methodology, which uses complete multifunctional teams to design low-cost products right the first time.
3. The company will be lured into thinking it is doing all it can to
lower cost, when, in fact, costs are not really being reduced and
opportunities for real cost reduction are not being pursued.
In conclusion, do not attempt cost reduction on existing designs after
receiving an order. Furthermore, cost reduction attempts, coupled with
incomplete cost data, may discourage innovative ways to lower cost,
maybe even thwarting promising attempts. If certain product lines have
chronic cost challenges and individual cost reductions efforts do not work
on a total cost basis, consider redesigning them for manufacturability.
16 • Design for Manufacturability
1.5 CUTTING TIME-TO-M ARKET IN HALF
Time-to-market should be measured using big picture measure, such as the
time to target volume, quality target, productivity target, qualification,
change orders completed, or customer acceptance, as shown in the middle
graph in Figure 2.1. To compare to previous projects, metrics may have to
be recomputed. Defining time-to-market as design release really means
“throw it over the wall on time.” This results in abandonment by design
engineers and unfinished designs being released, both of which delay the
real time-to-market: the time to stable production or customer acceptance.
Define the product methodically to avoid “changes” to satisfy customers.
Make sure the product requirements are complete before the engineering
begins or else the requirements may be poorly formed or the project will
be delayed. In one survey, 71% of managers said that poor product definition caused product development delays, making it the top reason for
delays.14 Another survey of 153 companies15 concluded that the biggest
cause for product failure16 was “unclear or continuously changing product definitions,” and the next most common cause of failure was “product
does not meet customer or market requirements.”
Only take custom orders that can quickly and efficiently be designed and
built, instead of taking all orders. Remember that all sales do not take the
same amount of time and resources, have the same cost, or generate the
same profit.
Find out how much actual time and total cost it will take for each contemplated customization and configuration. Ask for time and cost data
before accepting the order. Get approvals from engineering, manufacturing, purchasing, and so forth for each custom order. Create databases with
enough time and total cost data to generate accurate estimates, which can
then be built into software configurators.17
Ensure all necessary specializations are available and active early to optimize all aspects of manufacturability from the very beginning. Ensure all
resources are available for immediate deployment when they are needed
throughout the product development.
Create realistic schedules based on a combination of market needs
and new product development capabilities. If the market is moving fast,
develop fast, efficient NPD (new product development) methodologies
that will quickly get to stable production or customer acceptance. Make
Design for Manufacturability • 17
sure NPD resources are not spread too thin on too many projects and
fire drills so that complete multifunctional teams can be fast and efficient.
Encourage customers to order early, and streamline the sales and contract
process. Plan ahead to start NPD as early as possible.
Begin decisively. Do long-term market research, industry analysis, and
product portfolio planning to avoid getting behind and rushing to catch
up. Teams should not procrastinate or wait for deadline pressures to get
motivated. Encourage customers to place orders early through incentives
for early orders or penalties for late or rush orders. Minimize the time to
negotiate orders.
Learn lessons from past projects to avoid wasting time repeating the
same mistakes (see Section 3.3). Raise and resolve issues early and avoid
the delays of much more difficult change orders. Thoroughly resolve technical or functional challenges and issues early (see Section 3.3).
Work together well throughout the project with on-demand meetings,
instead of saving issues for periodic meetings.
Work efficiently with the most efficient design and simulation tools and
use product data management to document progress to ensure that everyone’s work is based on the most current drawings and documents.
Purchase and outsource wisely, since low bidders selected for cost often
cause delays.18
Avoid “creeping elegance” to endlessly pursue unnecessary refinements
and enhancements.
Avoid administrative delays for design reviews, budget hold-ups, and
loss of key people, temporary or permanent, to firefights on other projects.
Design thoroughly and complete all documentation because time-to-
market can be significantly delayed by design gaps, glitches, and incomplete documentation. Significant, expensive launch or build delays can be
prevented by up-front thoroughness, which is much more efficient in the
relatively orderly design stage than in the panic mode that results when
problems delay production. Design and documentation shortcomings not
only delay that product but also take resources away from other products.
Avoid premature release. Don’t allow bad metrics, such as development
budget pressures or defining time-to-market as “design release,” to allow
or encourage premature designs to be released to manufacturing, because
finishing the design under change control constraints will cost much
more and take more calendar time, in addition to starving new product
developments of operation resources.
18 • Design for Manufacturability
Design for existing processes to eliminate the need to design, develop,
and debug new production machinery. Obey all the design rules for all
processing to avoid delays to either correct the designs or correct the problems every time products are built. Avoid redesigns, which will take time
to design, debug, and build, which will delay the time-to-market.
Select proven materials, parts, suppliers, and vendors. Any glitches in
these can delay the market launch. Thoroughly optimize material and part
availability, including best-case sales scenarios, to avoid delays to find and
incorporate alternatives.
Avoid excessively long supply chains, which can increase the calendar build
time and are vulnerable to cumulative delays and shipping interruptions.
Proactively avoid compromising functionality, quality, cost, or manufacturability to get products out the door.
Thorough up-front work greatly shortens the real time-to-market and
avoids wasting time and resources on revisions, iterations, and ramp
problems. This is thoroughly discussed in Section 3.2 on the importance
of optimizing the concept and architecture stages (the up-front work), citing the Lexmark model (Figure 3.1). This model graphically shows how
the “concurrent” model (basically, doing everything recommended in this
book) results in completing the production ramp 40% sooner than the
“linear” model, which rushes right through the concept and architecture
stages. The first half of Chapter 3 explains how to optimize the critical
up-front work.
Finally, mitigate the risk of changing market conditions with fast product development.
1.6 ROLES AND FOCUS
Optimal company performance comes from whole-company synergy,
where the whole company works together to develop products for
manufacturability:
Engineering and manufacturing concurrently engineer products and
processes, as discussed in Chapters 2 and 3.
Marketing works with the team from the earliest stages to define whole
product families that satisfy the “voice of the customer.”
Design for Manufacturability • 19
The purchasing and materials groups support product development by
nurturing vendor and partner relationships instead of looking for
the lowest bidders; taking pressure off product development teams
by shortening procurement times; encouraging part standardization; and prequalifying parts and vendors to optimize quality
and delivery.
Finance quantifies total cost to support relevant decision making
and arranges for appropriate overhead charges for new-generation
products.19
A DFM task force incorporates DFM steps into the product development process and creates, issues, and updates a consistent set of
design rules and guidelines (see more in Section 11.4).
1.6.1 Human Resources Support for Product Development
The human resources (HR) department should hire or develop good
project leaders with team-leading abilities, as well as good team players.
According to Sony:19
“When hiring, you have to also be mindful of how well the new managers
work with the rest of your existing team. Hiring a good team player is as
important as hiring someone with the right expertise.”20
HR should provide team-leader training for managers and team-
building21 workshops for engineers. At Nokia, “the focus was not just on
recruiting but on ‘marinating’ that begins with orientation and ends with
highly refined team training.”22
Growing departments should not be allowed to raid other departments,
which may weaken critical internal functions. HR should hire design
engineers with experience in manufacturing, test, field service, sales, and
so forth. It should give extra consideration to potential employees who
have been users or worked for customers, suppliers, or regulators. Finally,
HR should arrange for training for all aspects of product development (see
Chapter 11 on implementation).
Senior management should work with HR to ensure that performance
measurements encourage teamwork and support overall goals. The company must also ensure retention of talent, information, and complete
teams during downturns, restructuring, and internal transfers, and strive
to maximize internal continuity and minimize turnover.
20 • Design for Manufacturability
1.6.2 Job Rotation
Company policy should also arrange job rotation to encourage cross-
learning and informal communications, starting with placing new design
engineers in manufacturing first. It can be argued that it takes new
employees time just to learn their way around the company, and engineers
on their first job need to learn even more. So while they are getting up to
speed on how the company operates, they can be learning about the company’s manufacturing practices.
“At Honda, all entry-level engineers spend their first three months in the
company working on the assembly line. They’re then rotated to the marketing department for the next three months. They spend the next year rotating through the engineering departments—drive train, body, chassis, and
process machinery. Finally after they have been exposed to the entire range
of activities involved in designing and making a car, they are ready for an
assignment to an engineering specialty, perhaps in the engine department.”23
At Samsung, “team-building practices include frequent meetings for all
individual team members along with something as simple as conversations
over a drink after working hours—for the purpose of exchanging internal
communications or resolving conflicts.”24
Nokia owes much of its success to encouraging its brightest managers to
work in manufacturing. CEO Jorma Ollila says, “If you do well in manufacturing, you get a good career in Nokia.”
1.6.3 Management Role to Support DFM
Senior managers and executives should understand these principles
enough to execute the following advice.
Encourage innovation. Bill George, CEO of Medtronic, encourages
“walking through the labs and learning about creative ideas before they
get killed off” by the system, because “a growing bureaucracy is a huge
barrier to innovative ideas and dampens creativity, no matter how much
it spends on research and development. Leaders committed to innovation
have to work hard to offset these tendencies, giving preference to the mavericks and the innovators and protecting new business ventures while they
are in the fragile, formative stage.”25
Design for Manufacturability • 21
Plan the product portfolio and its evolution over time objectively to provide the greatest net profit over time, defined as all the financial gains
minus all the costs.
Don’t spread resources too thin by “taking all orders.” Focus on selling
the most profitable products and rationalizing away the “losers.”
Ensure resource availability so that complete teams can form early. Don’t
waste product development resources trying to reduce cost after the product is designed. Preselect vendors so they can help the team design the
parts they will build, which saves much more money than bidding.
Have realistic expectations compatible with product development
methodology.
Encourage a high proportion of thorough up-front work through good
product definition, early issue resolution, concept simplification, and
architecture optimization. Avoid early deadline pressure that thwarts
thorough up-front work.
Implement total cost measurements (Chapter 7) to enable prioritizing
all activities, planning product portfolios, rationalizing products by real
profitability, and relevant decision making.
Follow through so the team is responsible for transition into production and the team stays with the project until production has stabilized
in volume, productivity, and quality. Paul Horn, who oversees research at
IBM, says:
“Everything we do is aimed at avoiding a ‘handoff’—there is no ‘technology
transfer.’ It is a bad phrase at IBM. Research teams stay with their ideas all
the way through to manufacturing.”26
Encourage job rotation. Nokia “encourages job rotation within the
company—from Ollila’s executive board to all levels of the workforce.”27
Empower an effective project leader to make decisions as they need to be
made, thus minimizing dependence on design reviews.
Encourage feedback and be receptive to all news about product developments. Create an open culture where issues can be raised and discussed
early with the focus on issue resolution. When the current Ford Americas
President Mark Fields came to Ford from IBM, he was discouraged from
airing problems at meetings unless his boss approved first! 28
Ensure ownership so that product development teams own all aspects
of manufacturability and are accountable for the total cost and the real
time-to-market.
22 • Design for Manufacturability
Implement compensation and reward systems that encourage teamwork
and big picture goals; change sales incentives from revenue to profit.
Motorola’s policy is that, “Corporate leaders must emphasize the need to
partner and, as at Motorola, even overhaul how people are paid, rewarding
those who promote partnering.”29
1.6.4 Management Focus
Senior managers and executives should focus on the following:
• The activities and methodologies that lower cost and speed development, instead of relying just on goals, targets, metrics, reviews,
gates, and deadlines. It is important for product development teams
to have the right focus when developing products.
• Customers’ needs, not on the company programs, competition, or
technology.
• Proactive resolution of issues early rather than reactive resolution
later.
• Problem avoidance rather than problem solving.
• Eliminating engineering change orders rather than streamlining the
change control process.
• Core competencies and new and pivotal aspects of the design instead
of reinventing the entire wheel and diluting resources with low-
leverage activities.
• Product and software architecture, not just drawings and code.
• The design process itself, not on project control and management.
• How to optimize activities in the phases, not the gates or design
reviews.
• On-demand discussions and decision making, not periodic meetings and reviews.
• Product design, not proofs-
of-
principle, breadboards, and
prototypes.
• Optimizing product architecture, not just designing a collection of
parts and subassemblies.
• Rapid production ramps in real production environments, not pilot
production by prototype technicians or engineers.
Design for Manufacturability • 23
• Time-to-stable-production, not time-to-design-release or firstcustomer-ship.
• Minimizing total cost, not just reported costs (labor and materials).
• Designing and building in quality and reliability, not by testing,
inspections, or reacting to field problems.
• Compensation systems that encourage behavior that benefits the
company, not departments or individuals.
• Activities that achieve major and lasting cost reduction (superior
product development, Lean Production, quality programs, etc.),
instead of cost reduction attempts that may compromise real cost
reduction and delay the time to stable production.
• Activities that achieve goals, not the goals themselves. The movie
Jerry Maguire made famous the phrase, “Show me the money,” which
was chanted in the part of the movie when neither the football player
nor his agent were being “shown” any money because they were
concentrating solely on the goal of making money rather than what
achieved the goal, which was playing good football. The analogies
for business:
The CEO says,
The CFO says,
The V.P. of sales says,
The V.P. of marketing says,
The V.P. of research says,
The V.P. of purchasing says,
The V.P. of engineering says,
The V.P. of manufacturing says,
“Show me the profits.”
“Show me the market value.”
“Show me the sales.”
“Show me more market share.”
“Show me more patents.”
“Show me less part cost.”
“Show me faster developments.”
“Show me less assembly cost.”
However, none of these goals will be met unless the company has effective ways to achieve them. Dr. W. Edwards Deming said, “A goal without
a method is cruel.”
Ironically, too much pressure to meet departmental targets without
a real way to achieve them usually leads to counterproductive actions,
like buying cheap parts (Section 6.11), which degrades quality. Similarly,
moving manufacturing to low-labor-cost areas can actually increase other
costs and compromise responsiveness and product development, as discussed in Section 6.1.
24 • Design for Manufacturability
1.6.5 Successful or Counterproductive Metrics for NPD
Cost Measurement (Chapter 1)
Successful Metric
Total cost
Counterproductive Metric
Quantify only parts and labor, which may distort:
• Make/buy decisions
• Part/material selection
• Costing, if overhead is averaged
• Pricing, when good products subsidize bad ones and
well-designed products subsidize hard-to-build
products
New Product Development Completion (Chapter 2)
Successful Metric
Measure to stable production,
customer acceptance, or
time-to-revenue
Counterproductive Metric
Measuring to release or to ramp results in “throw over
the wall on time” incomplete designs without thorough
up-front work, which leads to:
• Difficult resolution of design and quality issues
• Lengthy ramps and delays to reaching volume
production
• Missed sales and/or disappointed customers
Sales or Development Incentives (Section 2.2)
Successful Metric
Profitability
Counterproductive Metric
Based on revenue or quantity of projects, which results in:
• “Taking all orders,” or
• “Develop all products for all markets,” which:
• Lowers profits by taking on low-profit/money-
losing products or projects
• Drains NPD resources away from developing
truly low-cost products that will actually sell
better and make more money
Intermediate Deadlines (Chapter 3)
Successful Metric
Allot time for thorough
up-front work for the best:
• Time
• Cost
Counterproductive Metric
Early deadlines to “show early progress” result in lack of
thorough up-front work and suboptimal architecture,
which misses opportunities for:
• Substantial product cost reduction
• Shorter product development, lower NPD budget,
and quicker time to stable production
• High-quality products by design
Design for Manufacturability • 25
1.7 RESISTANCE TO DFM
Despite these problems, some companies and individual designers still
resist DFM. Here are the most common reasons that people often cite:
1. Linear thinking
Just let me get something working now; sometime later we (actually
someone else) will take care of manufacturability, cost, quality,
reliability, serviceability, variety, etc.
2. Misconceptions about time
I don’t have time to worry about manufacturability now; I’ve got
deadlines to meet.
3. Misconceptions about constraints
I’m a “blue sky” thinker; don’t bother me with unnecessary constraints. Don’t limit my design freedom.
4. Misconceptions about innovation
I’m very creative, and don’t want to be stifled even thinking about
design for…whatever.
5. “I don’t have time for DFM.” However, if you don’t have time to do
DFM now, how will you ever find the time to do it later when it is
much more difficult, maybe impossible?
However, manufacturability problems can delay the launch, cause availability problems and shortages throughout the product life cycle, delay
rapid growth if the product is a big hit, degrade the quality of the look
and feel of the product, and raise the cost so much that the price has to be
raised or profit lowered, all of which will result in an unsuccessful product.
Then there is the common resistance to different ways of doing things.
This section concludes with Murphy’s law of product development: If
you don’t consider manufacturability early in the design, it is very unlikely
that it can be quickly and easily incorporated later.
1.8 ARBITRARY DECISIONS
Designers may be tempted to think that fewer constraints result in more
design freedom and many may resist DFM on those grounds. But, in reality,
26 • Design for Manufacturability
too few constraints may lead to the design equivalent of “writers’ block.” If
every design decision has many open choices, the whole design will represent an overwhelming array of choices that can lead to design paralysis.
So, the designer breaks the impasse by making arbitrary decisions. Every
arbitrary decision will probably make it difficult to incorporate other considerations later. And the further the design progresses (the more arbitrary decisions), the harder it will be to satisfy additional considerations.
Not considering all the goals and constraints at the beginning results in arbitrary decisions that eliminate solutions downstream.
Thus, another motto for product development teams should be:
No arbitrary decisions!
Figure 1.4 graphically shows a decision tree. The concept of decision
trees applies to everything from product development to life in general.
The tagline in TV ads for the show Touched by an Angel comes to mind:
In each moment lies a choice that can change the story of your life.
The process of developing products is a series of decisions, from deciding which products to develop to optimizing product architecture to
designing parts. Every decision sends you down a certain branch of a decision tree. Every arbitrary decision will probably send you down the wrong
path, which will limit subsequent choices. And more arbitrary decisions
are even more likely to send you further down the wrong path. So instead
of making methodical decisions to arrive at the desired point A, arbitrary
decisions lead you to point B. And the farther you get into a design (and
the more work is based on that path), the harder it is to make the changes
to backtrack from point B to point A.
The following are common examples of arbitrary decisions that should
be avoided in product development:
• Product definition is often arbitrary instead of systematically understanding the “voice of the customer,” as shown in Section 2.11.
• Markets in which to compete may be chosen arbitrarily if overhead
costs are averaged, thus obscuring the profitability of individual
products. This may lead companies to compete and develop products
in markets that, historically, may have not been the most profitable.
Design for Manufacturability • 27
A
B
FIGURE 1.4
The decision tree.
• Project milestone deadlines are often set early in an arbitrary way
(for instance, based on quarterly milestones) and underemphasize
crucial architecture optimization.
• Concept and architecture are often based on previous or conventional
concepts or the first idea to come to mind.
• Technologies may be chosen by techies who are impressed with the
advertised functionality. However, technology decisions also need
to include how proven the technology is, its track record, the total
cost, the real availability, the production volume capabilities of the
supplier, the financial strength of the supplier, contingency (Plan B)
planning, and the risks, especially if there are multiple sources of risk.
• Manufacturing decisions, if arbitrary, may steer the design in the
wrong direction and preclude the best processes and sources.
28 • Design for Manufacturability
• Outsourcing decisions may arbitrarily draw a line between “us” and
“them,” which can result in outsourcing all parts, even when selective internal integration would save time and money and improve
the manufacturability of the design (Section 4.8).30
• Supplier decisions may be made on part cost only and not include
quality, quick turn prototype capabilities, production deliveries, and
the value of assistance designing products.
• Part selection decisions may be based only on functional specifications and the cost of the part itself, and not include the impact of
sourcing, quality, standardization, and the part’s impact on total
cost.
• Order of design may be chosen arbitrarily from the ground up or
starting with the most obvious or most understood aspects instead
of the most constrained aspects first, which may be the least obvious.
• Detail design decisions are often arbitrary if designers ignore any
design considerations.
• Tolerances are often specified arbitrarily if designers do not understand processes, dimensional referencing, or relationships between
multiple tolerances. When in doubt, many designers specify unnecessarily tight tolerances, instead of methodically specifying and dimensioning tolerances, as discussed in Guideline Q12 in Section 10.1.
• Overhead allocation algorithms usually allocate overhead arbitrarily
based on labor, processing, or material costs, which does not provide
relevant computations of the total cost (Chapter 7).
• Styling decisions which are made arbitrarily can compromise manufacturability by unnecessarily complicating designs, tooling, and
manufacturing operations. Don’t allow styling to be thrown over the
wall. Instead, the whole team should work together to create styles
that both look good and are manufacturable.
• Boxing the design into a corner. Don’t make so many other arbitrary
decisions that the design becomes unnecessarily complicated.
When faced with too many open choices, seek out additional constraints. Not doing so may result in arbitrary decisions that will preclude
adding them later. When stuck, seek out additional constraints. It may
be that a solution cannot be justified to solve one problem, but it can if it
solves multiple problems.
Design for Manufacturability • 29
1.9 DFM AND DESIGN TIME
Some designers may be tempted to think that considering all these constraints will mean more time needed to complete the design. However, it
really takes no more time (maybe even less time), because thinking about
all the constraints at once will steer the designer more quickly to the optimal design.
Theoretically, the ideal number of goals and constraints would lead
the designer directly to the single optimal design. Too many constraints
would result in no solution. However, too few constraints would result in
multiple solutions, which must be systematically evaluated. When this is
not done, it is unlikely that the chosen solution will optimize manufacturability and all the other constraints.
The net result of not considering manufacturability early is a design that
will not easily incorporate DFM principles later. In order to make such
a design manufacturable, it may be necessary to make later changes in
the design, as discussed next.
1.10 ENGINEERING CHANGE ORDERS
One of the biggest payoffs of do-it-right-the-first-time product development is avoiding expensive and time-consuming engineering change
orders (ECOs).
Early and thorough inclusion of all the design considerations can do
a lot to minimize the need for change orders. Methodically defining the
product to satisfy customer needs (Section 2.11) will avoid changes to
“satisfy the customer”—a common, but illusory complaint. Changing the
design to satisfy the customer really means the product definition phase
did not thoroughly gather the voice of the customer in the first place.
One of the most insidious aspects of change orders is that a change to fix
one problem may induce new problems. And changes to fix those may induce
even more problems. Toyota says that late design changes are “expensive,
suboptimal, and always degrade both product and process performance.”31
Further, change orders will probably negate any qualifications or certifications the product received while in its original form.
30 • Design for Manufacturability
1.11 DO IT RIGHT THE FIRST TIME
Do it right the first time, because you will not have the chance to do it
again, especially in the following cases:
•
•
•
•
Fast paced projects, which you do not have time to do over
Expensive development projects, which you cannot afford to do over
Complex projects, where each change may induce other changes
Regulations contracts, or change restrictions, that discourage change
or force requalification of the product after any changes
And this is the setting in most companies today.
Everyone who practices DFM should adopt the motto: Do it right the first
time. This advice seems obvious because no designer would begin a design
expecting to redesign any part of it later. However, it is distressing how
many companies routinely tolerate change orders, maybe because they
always have. Some companies camouflage the process by euphemistically
calling them “revisions” or even “updates.” But, regardless of the label,
changes can have a severe impact on a product’s cost and time schedule,
not to mention employee morale and corporate reputation.
On the other hand, if designers use these DFM techniques to actually do
it right the first time, the new product will sail through product introduction into stable, trouble-free production with the best cost, delivery, and
quality to provide early customer satisfaction.
Companies’ goals should be that each product is designed once and that
the initial design can be manufactured easily as a high-quality product and,
of course, one that works properly. In many companies, the DFM program
evolves from some “never again” trauma to a do-it-right-the-first-time
thrust, including the strategies and methodologies in the following section.
1.12 STRATEGY TO DO IT RIGHT THE FIRST TIME
The strategy starts with multifunctional teams with all specialties present
and active early, as well as good product definition to eliminate later engineering changes to satisfy the customer.
Design for Manufacturability • 31
Throughout the product development process, the team must raise issues
(the “what ifs” and the “what abouts”) and resolve them early through
simulations, experiments, research, and early models, mock-ups, solid
models, and rapid prototypes, with statistical significance assured by the
design of experiments. Critical applications may need failure modes and
effects analyses (FMEAs).
The team must understand the lessons learned from previous projects
through summaries of lessons-learned databases, investigations of lessons learned from previous projects, and presentations and feedback from
previous projects, vendors, and in-house production.32 This is discussed
further in Section 3.3.4.
The team needs to formulate “Plan B” contingency plans to deal with the
most likely changes, setbacks, delays, shortages, or other problems regarding technology, processing, customers, markets, regulation, and so forth.
For instance, products can be designed to readily accept the Plan B part if
the Plan A part does not work out or is not available in time.
The team needs to achieve concurrence before proceeding. Another
MIT study, Made in America: Regaining the Productive Edge, offers additional insight into Japanese product development project management:
“A key task of the manager is to make sure that all disagreements [issues]
are aired and resolved at the outset. Achieving consensus takes a great deal
of effort, but by skillful management at this point it is possible to gain the
full commitment of all members of the program team so that subsequent
progress is very rapid.”33 (emphasis added)
The design of the product can be done right the first time by simplifying
the concept and optimizing product architecture, thoroughly designing
the product, focusing on new and pivotal aspects with optimal use of previous engineering, peer review and design checking, and good documentation management.
The design needs to be conveyed to production unambiguously so the
product is built right the first time. And all changes, updates, and revisions must be implemented promptly and accurately so that subsequent
designs will be done right the first time.
Finally, fast development has the least vulnerability to changing environments with respect to changing customer preferences, markets, competitors, regulation, and trends.
32 • Design for Manufacturability
1.13 COMPANY BENEFITS OF DFM
The following slogan sums up the importance of DFM:
Functionality gets us into the game;
Quality and reliability keep us in the game;
Manufacturability determines the profit.
And yet most engineers and managers focus primarily on functionality. In
order to stay in the game, products need to be produced with high quality
and reliability. And what about profits? Unless the product has a formidable head start or incredibly strong patents, the product will have to be
priced competitively, which then means that profits will be determined by
the cost. And, as pointed out earlier and in Section 6.1, it is very difficult
to reduce cost by “cost reduction” efforts after the product is designed.
Therefore, profits are determined by how well low cost can be assured
by design—that is, designed for manufacturability.
The benefits of DFM range from the obvious cost, quality, and delivery,
to some important subtle benefits:
• Lower production cost. Designing for simplicity, fewer parts, and
easier assembly results in lower assembly cost. Lower cost of quality
(Section 6.9) results from fewer parts and foolproof assembly. Smoother
product introduction means less time spent on costly change orders
and firefighting to deal with product introduction problems.
• Higher quality. Higher quality results from more robust designs,
fewer parts, foolproof assembly (Section 10.9), optimal process selection and design, the use of more standardized parts with known
good quality, and designing around proven engineering, parts, modules, and processes.
• Quicker time to market. DFM products fit better into existing processes and are less likely to require special equipment and procedures. The use of standard parts means most will be on hand or
be easy to procure. Better DFM means fewer product introduction
problems, leading to a quick and smooth introduction.
• Lower capital equipment cost. Designs that assemble easily need less
time on assembly machinery. Less need for special equipment saves
equipment capital. Designing to minimize setup (Section 4.6) and
Design for Manufacturability • 33
•
•
•
•
•
the use of standardized parts result in fewer setup changes, thus
leading to greater machinery utilization.
Greater automation potential. Designing for automatic assembly
maximizes the potential for automation, with all its cost and quality advantages.
Production up to speed sooner. Faster development, fewer introduction problems, and less need for special equipment or procedures
result in production that will be up to speed sooner.
Fewer engineering changes. Early adjustments are much easier to
make than later changes that are under change control procedures. If
the original design satisfies all the goals and constraints (Section 3.5),
it will not have to be changed or redesigned for manufacturability or
any of the other design considerations.
Fewer parts to purchase from fewer vendors. Having fewer parts to
purchase saves purchasing expense, especially for standard parts.
Dealing with fewer suppliers strengthens relations with those suppliers and results in less cost and effort to qualify parts and deal with
quality problems.
Factory availability. Fewer production problems and greater machine
tool utilization make factories more available for other products.
1.14 PERSONAL BENEFITS OF DFM
The previous discussion cites many corporate justifications for DFM. The
following points are used in the author’s seminars34 to motivate engineers
at the personal level.
Why bother to do anything differently? Many engineers think that their
companies are doing fine and they are really too busy to do anything differently, especially if company success is somehow based on technology.
However, there are many compelling reasons to apply these methodologies:
1. Ensure the health of the company and job security. Very few companies are free of competitive pressures, even those with an apparent
technological lead. Very few can coast along in such a turbulent and
fast-changing environment.
2. World-class new product development increases the fortunes of the
company and its employees and offers many career opportunities.
34 • Design for Manufacturability
3. Work will be more interesting because, by using these principles,
engineers will spend a higher proportion of their time doing fun
design work and less time on change orders and firefighting.
4. The next project will be a better experience because you will not be
distracted by change orders or firefights on past projects. Further,
new projects can build on successful new practices and get better
each time.
5. Thrive easily during growth. Without DFM, production workers
will be under pressure to meet demand. Engineers will have to help
solve production problems that may have been tolerable in lower volumes but are show stoppers at peak demands. New opportunities
will probably be more challenging, thus compounding new problems if not done right the first time. Since new engineers will be less
adept at solving problems on existing products, they will probably be
assigned to new designs, leaving current engineers to continue to
be the troubleshooters on existing products.
6. Enhance company success, and your career, with receptivity.
Enthusiastically accept, support, and implement new product development methodologies. This will maximize your chances of being
selected for the first teams to apply these principles. Work cooperatively with others applying new methodologies. Be openly receptive
to new ways of designing and manufacturing parts and products.
Enthusiastically accept new, different, and innovative assignments.
Suggest design and processing innovations. Volunteer to work on or
lead innovative endeavors.
1.15 CONCLUSIONS
DFM alone may make the difference between being competitive and not succeeding in the marketplace. Most markets are highly competitive, so slight
competitive advantages (or disadvantages) can have a significant impact.
DFM may make the difference between a competitive product line and,
in the extreme, products that are not manufacturable at all. Products fail
and go out of production because costs are too high, quality is too low, the
introduction was too late, or production could not keep up with demand.
These are all manufacturability issues and therefore very much affected
by DFM.
Design for Manufacturability • 35
NOTES
1. David M. Anderson, Build-to-Order & Mass Customization: The Ultimate Supply
Chain Management and Lean Manufacturing Strategy for Low-Cost On-Demand
Production without Forecasts or Inventory (2008, CIM Press). See book description in
Appendix D.
2. See also Section 6.1 (“How Not to Lower Cost”) and Section 11.5 (“Stop
Counterproductive Policies”).
3. Anderson, Build-to-Order & Mass Customization.
4. This data was generated by DataQuest and presented in the landmark article that
started the concurrent engineering movement: “A Smarter Way to Manufacture:
How ‘Concurrent Engineering’ Can Invigorate American Industry,” Business Week,
April 30, 1990, p. 110. In the author’s in-house seminars, he presents similar data
from Motorola, Ford, General Motors, Westinghouse, Rolls Royce, British Aerospace,
the Allison Division of Detroit Diesel, Draper Labs, Rensselear Polytechnic Institute,
and several other published sources.
5. Satoshi Hino, Inside the Mind of Toyota: Management Principles for Enduring Growth
(2006, Productivity Press), Chapter 3, “Toyota’s System of Management Functions,”
p. 133.
6. Joachim Ebert, Shiv Shivaraman, and Paul Carrannanto, http://www.industryweek.
com/companies-amp-executives/driving-growth-through-ultra-low-cost-product-
development, February 23, 2010.
7. Ibid.
8. Robin Cooper, When Lean Enterprises Collide (1995, Harvard Business School Press),
Part Three, “Managing the Costs of Future Products,” p. 131.
9. Ibid., Chapter 7, “Target Costing.”
10. Yasuhiro Monden, Cost Reduction Systems: Target Costing and Kaizen Costing (1995,
Productivity Press).
11. See the offshoring article at www.HalfCostProducts.com/offshore_manufacturing.
htm.
12. “A Smarter Way to Manufacture: How ‘Concurrent Engineering’ Can Reinvigorate
American Industry,” Business Week, April 30, 1990, p. 110.
13. Robert G. Atkins and Adrian J. Slywotzky, “You Can Profit From a Recession,” Wall
Street Journal, February 5, 2001, p. A22.
14. A.S.K. Gupta and D.L. Wileman, “Accelerating the Development of Technology-
Based New Products,” California Management Review, Winter 1990.
15. Jim Brown, The Product Portfolio Management Benchmark Report, Achieving
Maximum Product Value, August 2006, the Aberdeen Group, http://www.aberdeen.
com/link/sponsor.asp?spid=30410396&cid=3359.
16. In the Aberdeen Group study, product failure was defined as “products that are not
launched or launched products that significantly fall below revenue, market share, or
profit targets.”
17. Configurators can automate the processes of determining the feasibility, cost, and
time to do customizations, instead of the time-consuming and less accurate manual estimating. See Anderson, Build-to-Order & Mass Customization, Chapter 8,
“On-Demand Lean Production.”
36 • Design for Manufacturability
18. Jordan D. Lewis, The Connected Corporation: How Leading Companies Win Through
Customer–Supplier Alliances (1995, Free Press), p. 38.
19. David Pringle, “How Nokia Thrives by Breaking the Rules,” The Wall Street Journal,
January 3, 2003.
20. Shu Shin Luh, Business the Sony Way (2003, John Wiley), p. 195.
21. Patrick Lencioni, Overcoming the Five Dysfunctions of a Team: A Field Guide for
Leaders, Managers, and Facilitators (2005, Josey-Bass).
22. Dan Steinbock, The Nokia Revolution: The Story of an Extraordinary Company That
Transformed an Industry (2001, AMACOM), p. 186.
23. James Womack, Daniel Jones, and Daniel Roos, The Machine that Changed the World:
The Story of Lean Production (1990, Rawson Associates; 1991, paperback edition,
Harper Perennial), pp. 129–130.
24. Lee Dongyoup, Samsung Electronics: The Global Inc. (2006, YSM Inc., Seoul, Korea),
Chapter 5, “Research & Development,” p. 97.
25. Bill George, Authentic Leadership (2003, Jossey-Bass), Chapter 12, “Innovations from
the Heart,” pp. 133–134.
26. “Out of the Dusty Labs,” The Economist, March 3–9, 2007, pp. 74–76.
27. Dan Steinbock, The Nokia Revolution: The Story of an Extraordinary Company That
Transformed an Industry (2001, AMACOM), p. 185.
28. “The New Heat on Ford,” Business Week, June 4, 2007, pp. 32–38.
29. “Smart Partners,” Business Week; review of The Connected Corporation by Jordan
D. Lewis. December 10, 1995. http://www.businessweek.com/stories/1995-12-10/
smart-partners.
30. Bryan Bunch with Alexander Hellemans, The History of Science and Technology
(2004, Easton Press), Appendix D.
31. James Morgan and Jeffrey K. Liker, The Toyota Product Development System (2006,
Productivity Press), Chapter 4, p. 40, “Front-
Load the PD Process to Explore
Alternatives Thoroughly.”
32. The feedback forms in Appendix C can be used to solicit valuable feedback from
factories, vendors, and field service.
33. Dertouzos, Lester, and Solow, Made in America: Regaining the Productive Edge, from
the MIT Commission on Industrial Productivity (1989, Harper Perennial), p. 71.
34. For more information on customized in-house DFM seminars, see Appendix D or
www.design4manufacturability.com/seminars.htm.
2
Concurrent Engineering
Concurrent engineering is the practice of concurrently developing products and their manufacturing processes in multifunctional teams, with all
specialties working together from the earliest stages.
The most critical factor in the success of concurrent engineering is the
availability of resources to form multifunctional teams with all specialties
present and active early.
The consequences of inadequate resources at the beginning are
significant delays and wasted resources,
which in turn will delay other projects and deplete their resources,
while expending more development cost for all projects.
2.1 RESOURCES
The most distinct contrast between advanced and primitive product
development methodologies is the concept of ensuring that all the specialties are present and active early. This concept was presented in the landmark $5 million MIT study, The Machine That Changed the World: The
Story of Lean Production.1 In Chapter 5 on product development, authors
Womack, Jones, and Roos conclude:
“In the best Japanese ‘Lean’ projects, the numbers of people involved are
highest at the very outset. All the relevant specialties are present, and the
project leader’s job is to force the group to confront all the difficult tradeoffs
they’ll have to make to agree on the project.”
37
38 • Design for Manufacturability
The authors also conclude:
“By contrast, in many mass-produced design exercises, the number of people involved is very small at the outset but grows to a peak very close to the
time of launch, as hundreds or even thousands of extra bodies are brought
in to resolve problems that should have been cleared up in the beginning.”
This concept supports the philosophy of this book, which emphasizes
thorough up-front work. Figure 2.1 graphically shows this front-loading
in the advanced model (lower graph) as compared to the traditional team
participation (upper graph).
The traditional product development gets off to a bad start, with a vague
understanding of customers’ needs and the production definition based
on technological advancements, whims, or previous or competitive products. Typically, only a few people are involved at the beginning, either
because of resource availability problems or by choice because project
management does not appreciate the value of complete teams. In some
cases, product development begins with a small clique because of downright exclusivity or because some elite people think that “DFM starts after
they are finished” (which was actually said by one physicist).
Whether or not deficiencies in the team composition are acknowledged,
schedule pressures will force the “team” to make some “progress.” And a
key part of making progress is making decisions. However, without the
benefit of a complete team, the decisions will probably not address all the
considerations discussed in Chapter 3. The problem will be made worse if
there is no diversity among the people involved; for instance, if everyone
works in the same department and has the same education and experiences.
Unfortunately, without a complete team, many early decisions will be
arbitrary, which is especially problematic because these arbitrary decisions then become the basis for subsequent decisions, which in turn, will
allow for even fewer open options. After several levels of subsequent arbitrary decision making, the product architecture becomes cast in concrete,
which makes it very hard to optimize or correct later.
Continuing to follow the sequence in the top graph of Figure 2.1, what is
perceived to be a “complete” team eventually forms, but it is not as complete
as recommended herein. The team may proceed for a while in a state of naïve
contentment, but eventually there will have to be some form of redirection
because of the inadequate product definition or because of the arbitrary decisions made by an incomplete team. So then more effort is expended, possibly
with more people added, because the project is starting to get into trouble.
Concurrent Engineering • 39
Traditional Team Participation
Project Team
Participation
Introduction Blitz
Old
Input*
DFM Changes
Prototype
Surprises
Schedule
Acceleration
Decisions
Cost
“Cast in
Concrete” by
Reduction
Incomplete
Program
“Team”
Redirection
“Complete” Team
Official Launch
FCS
Post
Release
Problem
Solving
Official
Production
Release
Effective Launch
*Old Input: Vague Understanding
of Customers’ Needs
Problem
Solving
on
Quality &
Productivity
Volume
Ramp-up
Complete
Ramp-Up
Target
Production
Volume
Advanced Model
Project Team
Participation
Architecture Phase
Supplementary
Team Participants
*New Input: Methodical
Product
Definition
Complete Team
New
Input*
Project
Launch
Core Team
Vendor Design
Reusable Engineering
Normal Quality & Productivity
Volume Ramp-up Complete
Production Release
Modules
FIGURE 2.1
Team participation: traditional versus advanced models.
Quality &
Productivity
40 • Design for Manufacturability
By the time cost estimates are generated, word gets out that the cost is
too high, so then a cost reduction program is initiated. However, it will
be difficult to reduce cost at this stage, because 60% of cumulative cost is
committed in the architecture stage, as shown in Figure 1.1.
After the above redirections and delays, the project is now behind, so
the schedule needs to be accelerated. This is so common that one product
development book even has a chapter titled, “Throw Money at It,” based
on the thinking that time is more valuable than money at this point.
Then come the prototype surprises, which are the inevitable consequences of an incomplete team, cumulative arbitrary decisions, and failure to address all the design considerations detailed in Chapter 3. Work
then proceeds, after many fire drills to try to correct problems and get the
prototype to work. Of course, one prototype is not a statistically signif
icant sample, so real-life production problems could be worse than indicated by the prototype.
Then, the typical project starts to consider DFM only as production
ramps approach. If DFM did not occur early, it will probably be very difficult to make the product manufacturable through changes at this late a
date (Murphy’s law of product development). Faced with the formidable
scope of implementing DFM by change order under intense time pressures, the team pursues only the easy changes and production soon begins
on a product with questionable manufacturability.
As the product goes into production, manufacturability shortcomings
manifest as painfully slow ramps, sometimes taking months to reach the
volume production target. Manufacturability problems also show up as
poor quality and disappointing productivity, which may take even longer to attain acceptable levels. Not only do these delays and shortcomings
disappoint customers, but they also consume a great deal of resources—
resources that should have been utilized more wisely and proactively at
the beginning rather than at the inefficient, reactive end of the project.
This, of course, emphasizes the importance of measuring time-to-market
as the time of full stabilized production, instead of first-customer-ship
(labeled “FCS” in Figure 2.1), which is meaningless as a measure of time-
to-market—the factory could build three and ship the one that works!
Does this scenario sound familiar? In fact, most of the attendees queried
in the author’s seminars2 admit that many elements in this sequence are
quite familiar, many painfully so.
In the advanced model in Figure 2.1, all the relevant specialties are
present and active early. If individual team members have versatile
Concurrent Engineering • 41
backgrounds and can represent multiple specialties, then the team may be
smaller and easier to manage.
The complete team is formed at the beginning to simplify concepts and
optimize product architecture (Section 3.3). In addition to the full-time
core team are vendors, consultants, and part-time specialists for specific
tasks such as various analyses and regulatory compliance.
The activities start with a methodical product definition, as discussed
in Section 2.11. After the architecture phase is thoroughly optimized, the
remaining workload actually can drop off because: (1) many tasks may be
completed; (2) the off-the-shelf parts selected avoid the associated design
efforts; (3) vendors help design parts or actually design parts entirely; and
(4) previous modules can be utilized or the design of new modules can be
shared with other projects.
The result is that the volume ramp is completed quickly. Similarly,
normal quality and productivity targets are reached rapidly. One important result is the ability to cut in half the real time-to-market as measured
to stable production. The other equally important result is that the cost of
engineering resources (the areas under either curve) is half compared to
the traditional model.
2.1.1 Front-Loading at Toyota
“Because front-loading solves problems at a root cause level early in the
process, it nearly eliminates the traditional product development problem of late design changes, which are expensive, suboptimal, and always
degrade both product and process performance.”3
2.2 ENSURING RESOURCE AVAILABILITY
Schedules or workloads should never exceed the capability of design
teams to develop good products. If this is a problem, the solutions are to
(1) prioritize product development projects to focus on the highest return
for effort; (2) hire more people; or, (3) use more efficient product development methodologies, as presented in this book.
The success of product development will be dependent on how complete—how multifunctional—the teams are and how early the complete
team is active. Most companies understand the value of complete teams
42 • Design for Manufacturability
but do not form them early because of resource availability problems. The
resource situation is even more difficult when a company is converting
from a back-loaded model to a front-loaded model, in which case it is difficult to find enough people for a complete team when many of the people
are still busy fixing the problems of the last product developments.
Resource availability issues can be solved with good prioritization of
product development efforts and efficient use of team members’ time. In a
recent Harvard Business Review issue with a spotlight on recession recovery, one of the focus articles recommended: “allocating resources according
to their articulated strategic priorities.”4 The strategic priorities get articulated by good product portfolio planning, which is discussed in Section 2.3.
Good product development methodologies can solve resource availability problems and save development cost and time. There are dozens of
techniques to solve resource availability problems.
2.2.1 Prioritization
Rather than competing head-to-head on price for similar commodity
products, focus on differentiating superior product designs, which have
inherent advantages such as lower cost, better performance, higher quality, and better delivery. Rather than copying or “specing” competitors’
products, leap past them with better designs.
Jim Collins, writing in Good to Great,5 asserts that companies gradually
build up momentum, like a giant flywheel. Great companies build up this
momentum over time, providing many competitive advantages. By the time
competitors notice news or ads about the great company’s new product introductions, they are years behind and, thus, have little chance of catching up.
2.2.2 Prioritizing Product Portfolios
Prioritize product development efforts to get the highest return from
given resources, especially if you don’t have enough engineers, managers,
and workers with experience, talent, or skill.
Prioritization is necessary to grow revenue or profits without adding proportionate resources.
An Aberdeen Group report provided a blunt assessment on common
portfolio shortcomings: “Companies frequently develop portfolios of
Concurrent Engineering • 43
products that are more comfortable than profitable, develop product strategies based more on wishful thinking than on sound reasoning, and create project and resource plans that are not designed for success.”6
UCLA strategy professor Richard Rumelt, writing in Good Strategy, Bad
Strategy, notes that, “Most complex organizations spread rather than concentrate resources.”7
2.2.3 Prioritizing Product Development Projects
The most effective prioritization of resources comes from prioritizing product development projects and only embarking on high-return development
efforts that have the greatest synergy with other development projects.
The book, Fast Innovation,8 presents a case study at Motorola that clearly
shows how too many projects diminish the chances of project success.
In 2002, Motorola’s Computer Group tried to develop 120 products, but
resources were spread so thin that no products were introduced at all! The
next year they cut the development load to 22 projects and were able to
introduce eight products. In 2004, as they became more focused (with
only 20 projects), they were able to successfully launch almost twice as
many products in half the time of the previous year!
Further, the Motorola case study also correlated project success with the
total number of legacy products in the portfolio: The year when they introduced no products, this division had 3,500 products in its portfolio. After
this dropped to 2,000, they launched eight products, and after it dropped
to 500, they were able to launch 14 products.
During this span, manufacturing productivity tripled, early life failures decreased by 38 times, customer satisfaction rose from 27% to 90%,
revenue increased by 2.4 times, and operational earnings increased from
–6% to +7%.
2.2.4 Prioritization at Leading Companies
2.2.4.1 Prioritization at Apple
When Steve Jobs returned to Apple in 1997, “he found a demoralized company that had spread its resources across no fewer than fifteen product platforms. Those teams were competing with one another for survival. … Jobs
slashed the company’s offerings from fifteen to four. … Every employee
understood that the project that he or she was working on represented fully
one-quarter of Apple’s business and there was no possibility that it would be
44 • Design for Manufacturability
killed by an accountant scrutinizing the balance sheet. Optimism soared,
morale turned 180 degrees, and the rest, as the saying goes, is history.”9
2.2.4.2 Product Development Prioritization at HP
“Of the $3.5 billion that goes into HP Labs, the company allocates the
money based on where it expects the biggest payoffs.”10
2.2.4.3 Prioritization at Toyota
Toyota invests in research and module development, which can benefit a
broad stream of future products. At Toyota, “managers might spend over
half their time on a portfolio of ideas and projects.”11
2.2.4.4 Product Prioritization for Truck Bodies
The largest manufacturer of truck bodies in the US, Knapheide, “pays
strict attention the product pipeline or ‘funnel.’ The funnel now has only
five to seven projects in it. In order to ‘do fewer projects really well instead
of fifty things poorly and late’.”12
2.2.5 Prioritizing Resources for Custom Orders, Low-Volume
Builds, Legacy Products, and Spare Parts
Avoid blanket policies to take all orders or accept all customizations and
throw them over the wall thinking that “our guys can do anything and make
money at everything!”
Don’t take hard-to-build orders for revenue, because the total cost may
exceed revenue thus losing money, while draining resources from designing
and building more profitable products.
Don’t be misled by obsolete “profit margins” that were computed when a
product was at its peak. Very low-volume legacy orders will lose money if
setup costs exceed revenue regardless of how good the “margin” looks.
Instead, prioritize all orders by real profitability, based on total cost numbers. Prioritize all low-volume orders by potential: the top priority would
be those orders that lead to more higher volume sales. For those that don’t
lead to more high volume sales, consider the following approaches:
Concurrent Engineering • 45
• Steer customers to newer versions, emphasizing quicker delivery,
better quality, and low enough cost to pay for some adaptation effort
on their part. Overcome inertia and resistance to change.
• If considering reviving a legacy design, do the trade-off for the minimum total cost (to all) of reviving legacy production and upgrading
designs and supply chains compared to adapting the newer version
to the customers’ needs.
• Consider outsourcing legacy products and spare parts, realizing that
the total cost charged by the outsourcer will have to be fairly traded
off against all the internal costs, including the cost of overhead people (who are not “free”) and legacy and spare parts fire drills that
could drain away NPD (new product development) people and compromise NPD opportunities.
• Consider reselling another company’s subsystems, or even entire
products that may be rebranded if necessary. Mutual arrangements
can be made, even among competitors, to cover each other’s weakest
offerings that are hard to build.
• For synergistic spare parts and legacy subassemblies, incorporate
them into flexible cells that can build any part on demand,13 supplied
by the spontaneous resupply of standard materials.14 If not possible,
outsource them to a part supplier whose product line is synergistic.
• If accepting these orders for in-house production, do not just throw
them into “the system.” If there is any chance these activities will drain
resources from new product development or any other improvement
programs, then it is imperative to have all this work done in a self-
funding profit and loss center that:
• Is fully staffed with a complete set of its own people to do everything, including documentation retrieval, tooling retrieval,
relearning the “learning curve,” all setup, all manufacturing
steps, all purchasing, all upgrades, all conversions, all change
orders, and all firefighting without needing anyone working on
new product development and improvement programs. Staffing
would include resourceful technicians and experienced purchasing agents.
• Charges enough to pay for this self-supporting operation. If not,
then prices need to be raised accordingly, to cover all costs. If this
is not possible, just say no.
46 • Design for Manufacturability
• For other products, consider rationalizing15 product lines to scrutinize low-volume, hard-to-build, money-losing products for elimination, improvement, or outsourcing, or to incorporate into new
platform development (Appendix A).
If some of these opportunities are potentially promising, then proactively
develop product families that are easy to customize.
2.2.6 Develop Acceptance Criteria for Unusual Orders
Consider the above options first. Find out the actual resources that will
be needed for each contemplated customization and configuration. Ask
people for time and cost data before accepting orders. Get approvals from
engineering, manufacturing, purchasing, etc., for each custom order.
Create databases containing enough time and resource data to generate
accurate estimates, which can then be built into software configurators.16
Develop profiles that provide general characteristics of acceptable orders
and unacceptable orders. Approvals should be needed for anything not in the
profiles. For low-volume orders, an important profile criteria would be the
ratio of setup to run time and if the total cost for all setups exceeds revenue.
If the original profile is too limiting, develop mass customization17 capabilities to expand the range of quick and efficient customizations and
configurations with parametric CAD, quick program generation, or CNC
machine tools, standard parts, and versatile quick-loading fixtures.
If customizations cannot be built quickly and efficiently in the production factory without draining resources from product development, create
a profit and loss center that has enough dedicated resources to do all tasks
for all customizations and configurations. If that cannot make a profit,
then raise prices, make the operation more flexible, or narrow the focus.
2.2.7 Make Customizations and Configurations More Efficient
Develop the ability to make customizations and configurations more efficient with modular design, mass customization,18 and configurators.19
Only take custom orders that can quickly and efficiently be customized
and designed, without draining resources from new product development.
Proactively ensure quick and easy configuration by concurrently engineering hardware, software, and tooling.20 Pay for new or special configuration development either through investments or by charging customers
Concurrent Engineering • 47
and committing resources to do that rather than tapping “overhead”
resources who should be helping develop new products.
Utilize a postponement strategy21 and develop versatile product platforms that can be configured by adding preplanned options. Develop
modules that can be used for many product variations or subsequent
product developments.
Practice “flexible design,”22 which recommends designing products
“cleverly to deal with future eventualities.” This includes designing in versatility to enable adaptability to changing market conditions. For instance,
designers should endow the baseline product with enough utility capacity
for many evolution scenarios, along with extra ports, connectors, mounting holes, and space for future add-ons.
2.2.8 The Package Deal
If low-volume, hard-to-build, or custom products are perceived to be necessary to get “the big sale,” consider the following alternatives:
• Before making any offers or commitments, quantify all the costs,
including all the resource demands and setup costs at the build
quantity. Then adjust your selling price and bid price accordingly.
• If customers are just asking for hard-to-build products as deal sweeteners, resist that and realize (and convey) that it will distract your
company from the main order. Given that, a better deal sweetener
would be a lower cost or faster delivery, which should be offered only
if the company has learned how to do that efficiently.
• If the original design cannot be built as designed and needs requalification, steer the customer to a newer version, offering them help with
integrating your product into their system or adapting your product.
This may cost less and require fewer resources than a difficult build.
• Push back—the customer may not really go to a competitor over this.
If this still must be done and it will lose money:
1. Don’t dilute resources in operations, supply chain management, and
engineering, and don’t let the costs of the lower volume order be
added to the overhead burdens of the main order. This will make it
48 • Design for Manufacturability
less competitive or earn less money. Rather, outsource the production or do it in your own self-supporting profit and loss center.
2. Consider the loss a sales and marketing expense, and don’t burden
good products and cash cows to pay for their losses.
Not doing the above may drain resources from new product development,
burden cash cow products with excessive overhead to pay for “the losers,” and
may delay the time-to-revenue for profitable products.
2.2.9 Rationalize Products
Rationalize products to eliminate or outsource demanding products,
legacy products, and spare parts currently in production that consume
too many hours of product development resources to set up production
and find tooling, instructions, unusual parts, and people who remember
how to build it. It also takes resources to deal with the problems typically
encountered with unrefined, seldom-built products.
A proliferation of too many products in the portfolio uses up valuable
resources from manufacturing, engineering, and purchasing. Instead of
helping teams develop new products, those employees must spend time
building a multitude of low-volume and unusual products, with the usual
fire drills to set up production, deal with the problems typically encountered with unrefined products, and find unusual parts.
Because these oddball products have such high overhead costs, they are
probably losing money (or making significantly less than desired). To pay
for that loss, the good products will have to subsidize them. Think of it as
a “loser tax” on all good products.
Portfolio proliferation places a double whammy on new product development. Not only are resources drained away to build oddball products,
but when the new product is launched, it too will have to pay this loser tax
to subsidize unprofitable products, thus raising the new product’s selling
price, which, in turn, will make it less competitive.
The solution is to rationalize product lines to eliminate or outsource
“loser” products to free up valuable resources to help develop “winner”
products. Rationalization not only improves product development immediately (because resources are freed up whenever a company turns down
a high-overhead product), but it also will improve profits immediately by
eliminating the money-losing products. Effective methodologies for product line rationalization are presented in Appendix A.
Concurrent Engineering • 49
Rationalize away or outsource legacy products and spare parts production and management, unless synergistic with current production processes and supply chains. At a minimum, segregate legacies and spares into
a separate profit and loss center that has enough dedicated resources to do
all tasks. If that cannot make a profit, narrow the focus (through rationalization), raise prices, or make the operation more efficient. This can free up
valuable resources who could now help develop new products, instead of
the tremendous fire drills to gear up to build unusual products or products
“revived from the dead.” If you must build legacy products and spares, be
sure to charge enough to cover all the costs and use that money to hire
more people to build them.
Outsourcing hard-to-build legacy products has the following benefits:
(1) It stops overhead demands for local support people so they can help
teams develop new products; and (2) it segregates overhead charges for
legacy products that are then applied (charged) to these legacy products,
so that new products will not have to subsidize them, which would raise
the new products’ cost unfairly.
Outsourcing legacy products will also probably appear to “raise” their
cost because then customers will be paying for their full overhead costs,
which may not have been the case when internal overhead costs were averaged. If their total cost exceeds their sales price, then this would encourage
rationalizing them away, hopefully before expending the cost to transfer
them. Outsourced products will also need to have good documentation,
without the need for undocumented “tribal lore.”
When outsourcing to your own plant, especially to offshore plants, all
transfer costs should be paid for by the destination plant or, ideally, by
the product itself. Transfer efforts should not be performed by corporate support people, who should be helping product development teams
develop products.
If legacy products are truly necessary to support the sales of cash cow
products, be sure to:
• Quantify all overhead costs, including the cost of all people who
should be involved in product development. For each legacy sale
contemplated, understand the man-hours that would be taken away
from all the people who should be designing products or supporting
product development teams.
• Charge enough for legacy products to pay for all their costs.
50 • Design for Manufacturability
• Use this income to pay for all costs, especially personnel who may need
to be committed to these tasks, using contractors for temporary spikes.
• If necessary, create a separate profit and loss center to ensure that
legacy and spare part activities are fully staffed and supported without taking people away from product development.
For products sold as “loss-leaders,” any shortfall between revenue and
total cost would have to be reimbursed as a sales expense or paid for by
the products that benefit. Failure to do this may drain resources and funds
away from new product development and other improvement programs.
Don’t offer customized legacy products, unless they have been designed
for mass customization23 and can be built quickly and cost-effectively by
flexible operations (see Chapter 4).
Outsource parts and subassemblies that are hard to build, are too different, or require special skill, talent, and equipment.
2.2.10 Maximize Design Efficiency of Existing Resources
Ensure complete and stable product definitions and requirements documents that avoid expending valuable resources to redo previous work to
accommodate new or different requirements. Changing previous work is
much less efficient than getting the specs right the first time, takes more
calendar time, risks introducing other problems, and compromises thorough up-front work on the next project.
Preserve, document, and learn from lessons learned to avoid wasting
resources and time repeating past mistakes and missing out on more efficient techniques and methodologies.
Ensure fewer engineering changes to write when teams do it right the
first time. This will ensure that team members are not lost to finishing
incomplete designs, which lowers the overall effectiveness of product
development because it is so inefficient to finish designs under change
control or in the field.
Focus on new and pivotal aspects of the product design, not boilerplate, and
parts that could be reused or bought off-the-shelf. Buy standard off-the-shelf
parts instead of designing redundant versions. Reuse previously designed
details, parts, and subassemblies and software code. Use modular design to
incorporate existing modules or share engineering with multiple projects.
Maximize procurement’s contributions by avoiding looking for cheaper
parts (unless this provides a substantial net cost reduction without risking
Concurrent Engineering • 51
time or quality). And shift resources from managing bidding, especially
on custom parts, to helping teams do concurrent engineering, which will
save more money than bidding.
Arrange for vendors to help design what they build, which will save more
money than any “saving” from low bidding (Section 2.6). This will result
in: (1) more resources on the design team without increasing the development budget; (2) quicker part development and less chance of delays from
part design or tooling shortcomings; and, (3) fewer team resources wasted
dealing with manufacturability problems that come from less experienced designers.
Document well to avoid wasting resources to buy the wrong thing and
build the wrong thing, and then spending more effort to figure out what’s
wrong, correct the documentation, expedite ordering the right thing, build
the right thing, reintegrate the right thing, and various other damage control activities.
Avoid the drain of NPD resources for other improvement projects. Make
sure other programs and initiatives (such as big IT implementations) are
fully staffed and do not consume NPD resources or even distract them. The
funding for all improvement programs should include enough to pay for all
the resources necessary for implementation without expecting departments
or NPD projects to chip in “free” resources. Focus “change energy” on one
major change for each person, for instance: Each design engineer should
focus change energy only on product development improvement initiatives.
Each manufacturing engineer should be able to help teams design products
and get them into production while focusing change energy on manufacturing or quality improvement initiatives. Part of the project leader’s responsibility at Motorola is to be “able to shield their team from distractions and
people who are not actively contributing to the completion of the project.”24
Avoid the practice of raiding internal resources from critical functions.
This just shifts the hiring and training burden to the critical functions,
which will be weakened by both the loss of experience and the need to find
and train new hires. Poorly documented companies that rely on “tribal
lore” must minimize all forms of turnover for groups that have people
that remember or know valuable knowledge and can convey that to new
product development projects. Maximize overall effectiveness by hiring for
growth from the outside, unless the internal transfer results in a net gain
for the company.
Avoid problems with factory ramp-up and productivity targets with
more thorough up-
front work. Level production to avoid draining
52 • Design for Manufacturability
resources away from NPD for artificially created emergencies, such as big
shipments or burning the midnight oil to meet periodic targets. This pulls
key resources from NPD, possibly at critical times. It wastes the time of
purchasing and operations people, who will then have less time to contribute to NPD teams. Womack and Jones, authors of Lean Thinking, note:
“Raising awareness of the tight connection between sales and production
also helps guard against one of the great evils of traditional selling and
order-taking systems, namely the resort to bonus systems to motivate a
sales force working with no real knowledge of or concern about the capabilities of the production system.”25
Maximize the chances of project completion and minimize the chances
of major redirection or outright cancellation by following the most effective product development methodologies to avoid big delays, which minimizes obsolescence risks. These methods include good and stable product
definition, complete multifunctional teamwork with all specialties present
and active early, drawing on lessons learned about what works and what to
avoid, and thorough up-front work for the fastest ramps.
2.2.11 Avoid Product Development Failures
An Aberdeen Group survey26 cited the top reasons for product development failures, which are defined as “products that are not launched or
launched products that significantly fall below revenue, market share,
or profit targets.” Product development failures can be avoided with a good
and stable product definition to satisfy the voice of the customer, complete multifunctional teams with all specialties available and active early,
learning from past lessons, thorough up-front work that includes raising
and resolving issues and optimizing product architecture, and fast enough
development to avoid obsolescence or changing markets when launched.
2.2.12 Avoid Supply Chain Distractions
Avoid supply chain distractions that keep manufacturing engineers and
purchasing people from making significant contributions to product
development team participation because they are distracted by:
Concurrent Engineering • 53
• Finding, qualifying, evaluating, and choosing among multiple vendor bids. As Womack, Jones, and Roos noted in the book that started
the Lean Production movement in the US, in the best companies
studied, vendors “are not selected on the basis of bids, but rather on
the basis of past relationships and a proven record of performance.”27
• Finding, qualifying, or evaluating for new low bidders to replace
current vendors.
• Working with new low bidders to help them up the learning curve.
• Writing new contracts and change orders to accommodate new vendors with respect to material changes, different processes, translations, converting CAD drawings, and generating new machine tool
programming.
• Dealing with new low-bidder problems regarding quality, performance, delivery, etc.
2.2.13 Optimize Product Development Project Scheduling
Optimize product development scheduling and planning to ensure each
multifunctional team can form early with a complete mix of talent throughout the project, including specialized or scarce talent. The count and mix of
resources are allocated proportional to the challenge. Ambitious projects
or bids should receive adequate resource commitments before they are
started or a binding proposal is submitted.
New product development resource commitments should be less than
80% of capacity to allow for statistical variation and ensure that all teams
have the right mix of talent at the right time, so complete multifunctional teams can form early for each project. (See Figure 5.3, “Effect of
Overburdening Capacity on Development Lead Time,” in The Toyota
Product Development System.28)
2.2.14 Ensure Availability of Manufacturing Engineers
To protect product development support from firefighting distractions
and maximize their participation in product development teams, restructure manufacturing engineering into three subgroups that are financed
and staffed differently:
54 • Design for Manufacturability
• New product development support (paid for by the development project; staffed with manufacturing engineers most experienced in new
product introduction)
• Process improvements (on overhead, but expected to pay back investment in process cost savings; staffed by the manufacturing engineers
most competent in process improvement)
• Firefighting and engineering change orders (ideally, paid for by the
product involved; staffed by lower cost personnel who are experienced in the change order and firefighting process—not necessarily
degreed engineers)
2.2.15 Correct Critical Resource Shortages
Correct critical resource shortages by selectively hiring permanent or temporary employees whose absence has created gaps in the multifunctional
teams. Typically, the most common gaps are in the following positions:
• Manufacturing engineers, who generally spend most of their efforts
on change orders and firefighting instead of showing design teams
how to eliminate the firefighting by design
• Quality and test engineers, who can help ensure quality in the design
stage, instead of expending many times the effort to fix quality problems later
• DFM engineers with specific expertise (e.g., circuit boards or plastics), who can eliminate subsequent problems that cost many times
the cost of designing for manufacturability
At Toyota, “Skillful improvements at the planning and design stages are
ten times more effective than at the manufacturing stage.”29 Given this ten
times leverage, hiring people to fill these gaps will represent a ten times net
savings for the company.
Groups that support product development (manufacturing, testing,
quality engineering) should be billed to the development project, to avoid
resistance to increasing overhead costs.
2.2.16 Invest in Product Development Resources
View product development as an investment, not a “cost.” A Battelle R&D
report on product development drew the conclusion that “the support of
Concurrent Engineering • 55
research and development runs the risk of being viewed as an expense
and a luxury, rather than an investment, and one that can be shelved
until more funds are available.”30 And a Deloitte study of 650 companies in North America and Europe revealed that “while manufacturers
cite launching new products and services as the No. 1 driver of revenue
growth, they also view supporting product innovation as one of the least
important priorities.”31
2.2.16.1 R&D Investment at Medtronic
According to Bill George, chairman and CEO at Medtronic: “Companies
must rigorously reinvest a significant portion of their increased profits in
R&D, market development, and future growth opportunities, and not let
it all go to the bottom line.”32
Medtronic increased R&D spending from 9% of revenues to 12%, knowing that these investments would not produce any bottom line return for
5 to 10 years.33 Medtronic’s shareholder value increased 150 times over a
period of 18 years.34
2.2.16.2 R&D Investment at General Electric and Siemens
The Economist reported in September of 2010 that “Jeff Immelt, GE’s chief
executive, has increased its spending on research and development to 5.6%
of its industrial revenue, a ratio he calls ‘pretty world class’… Siemens
spends about the same proportion.”35 In April of 2012, the Financial Post
reported that GE announced “industrial orders had risen 20% in the quarter and selling prices had improved in most of its businesses.”36
2.2.16.3 R&D Investment at Apple
One of the key principles of innovation at Apple is, “If you believe in the
future, and your future lies in R&D, don’t starve R&D.”37
2.2.16.4 R&D Investment at Samsung
“Samsung believes that constant advances are the only way it can reach a
sustainable competitive advantage” and “has consistently been a first-to-
market player with pioneering products—thanks in large part to its continuing investment in research and development.”38
56 • Design for Manufacturability
2.3 PRODUCT PORTFOLIO PLANNING
The very first step in product development is deciding what to develop.
Product portfolio planning is the proactive determination of what products to develop.
Prioritize product development efforts to focus resources on the most
profitable products to maximize the ratio of total gain over total cost. Total
gain includes the potential gains for all variations and derivatives over
time. Total cost includes all overhead costs to be incurred by the candidates. Toyota uses “multiproject management to optimize the sharing of
resources across multiple, concurrent projects.”39
Prioritize customers and customer segments and focus on the ones with
the best current and future opportunities for profit and growth.40
Allocate the optimal resources (count and mix) proportional to the
challenge for new technology, risk, cost, time, and so forth.
Know the true profitability of all product variations to deliver the highest return from given resources.
Develop profiles that describe the characteristics of the most profitable
customers and customer segments. Use these profiles to help prioritize product development opportunities, scrutinize unusual or low-
volume sales, and rationalize away high-overhead, low-profit products.
Focus on product families that can benefit from synergies in product
development, operations, and supply chain management. Identify opportunities where products could benefit from build-to-order of standard
products and the mass customization of specials.41 Toyota produces an
average of seven different vehicles on each platform, which maximizes
reliability across vehicle types. Platforms are designed to be a basis for
these vehicles for up to 15 years.42
Plan the portfolio around versatile products and flexible processes that
(1) can easily satisfy the anticipated range of product breadth and customization, (2) have the potential to satisfy even broader ranges of customer
needs, and (3) can easily adapt to evolving trends and upgrade possibilities.
Plan the portfolio to avoid the commodity trap, with its inherently
low profits, and evolve to innovative products designed for low cost and
sales at high profit. Set aside resources and budget for breakthroughs43
in blue oceans, where innovative products would create uncontested markets. Based on analysis of 150 strategic moves spanning 100 years and
Concurrent Engineering • 57
30 industries, the blue ocean strategy recommends using value innovation
to pursue differentiation and low cost simultaneously,44 a goal that is also
supported by mass customization, which can achieve premium prices at
lower cost.45
Use all the above techniques to prioritize the portfolio to maximize the
return from available resources. Make sure all approved projects will have
enough resources with the right mix of talent for thorough up-front work
and consistently methodical work throughout the project.
Make all product portfolio decisions rationally and objectively. Avoid
temptations to base portfolio decisions on automatic upgrades, enticing
market opportunities, exciting technology, whims, pet projects, competitive precedents, and so forth. Do not allow portfolio decisions to be influenced by politics, powerful backers, attachments, inertia, fears, unrealistic
expectations, folklore (e.g., “I heard somewhere that…”), and so forth.
Don’t limit the portfolio to only products. Invest in research and module development that can benefit a broad stream of future products.
Make total cost numbers the cost basis of all product portfolio decisions,
as discussed in Chapter 7. Relieve resource demands caused by existing
products by planning versatile new products that can also replace hard-to-
build or low-profit products that the company may not be able to rationalize away.
2.4 PARALLEL AND FUTURE PROJECTS
Each product development team should be coordinated with other parallel
product development teams to simultaneously work together to set compatible design strategy, share engineering effort on common design features, determine common parts for use on all projects, and design modules
for use on multiple projects. Further, future projects should be considered
to set design strategy for current and future projects, establish an upgrade
path for current products, isolate areas most likely to change to minimize
engineering on future projects, and design modules on which future projects can be based.
Management guru Peter Drucker has presented a powerful version of
this principle.46 He recommends the following procedure, in which
58 • Design for Manufacturability
“A single team of engineers, scientists, marketers, and manufacturers
works simultaneously at three levels of innovation:
1) At the lowest level, they seek incremental improvement of an existing product;
2) At the second, they try for a significant jump;
3) The third is true innovation.
The idea is to produce three new products to replace each present product,
with the same investment of time and money—with one of the three then
becoming the new market leader.”
Along a similar vein, Megatrends 2010 reports that at Medtronic, “for
each product launched, the company is working on four generations of
upgrades.”47
At Philips, “At any one time, Philips Consumer Electronics is actively
working on three product generations: one in production, one in final
development (for which major changes are not acceptable), and one at the
concept generation stage (which is where new ideas enter).”48
At Sony, “from the moment the first machine was made, and before it
even hit the market, Sony’s engineers were already back at the design table,
refining and tweaking the original blueprints to get better sound and better quality tapes to the consumers.”49
At Crown, “When the company started development of its three-wheel
sit-down counterbalanced lift truck, the design team all had in mind the
future development of a four-wheel model. This allowed them to consider design challenges associated with both applications and essentially
address them for both models at the same time.”50
Knapheide, the largest truck body manufacturer in the United States,
“develops digital models of their products and shows them to potential
customers in advance. This allows them to get feedback early in the design
process. … Then, they continue to share virtual prototypes with customers throughout development. The result is greater interest by customers
when the product is first released resulting in new fleet business and sales
ramping up faster because the customers get what they want.”51
In all these examples, many parts and design aspects are the same while
others are similar. At the first level, designers can leave connectors, extra
capacity, and space for future features. The customers and marketing
channels may be the same. While purchasing agents are getting quotes on
the current models or volumes, they can easily get quotes on alternative
parts and higher volumes for subsequent endeavors.
Concurrent Engineering • 59
2.5 DESIGNING PRODUCTS AS A TEAM
The following discussions apply both to formal multifunctional teams and
to individuals, who should proactively engage people in operations, supply
chain management, quality, customer liaison, etc.
The team should be designing the product concurrently as a team. In
multifunctional design teams, all members are expected to jointly design
the product.
The team should set the intermediate milestones between concept/
architecture and the design phase. These are not assigned unilaterally.
Team members should not discuss important issues only on email;
instead, use the rapid dialogue of face-to-face communication.
Team members should: not react to drawings or prototypes; not give
their first “input” after something has been designed or is in design
reviews; and not interact only in weekly meetings.
The team should work well as a team rather than just a group of
individuals. Team members should communicate, discuss, and resolve all
issues early. A popular saying at IDEO is “all of us are smarter than any
of us.”52 Don’t do concurrent engineering primarily in period meetings.
2.5.1 The Problems with Phases, Gates,
Reviews, and Periodic Meetings
Consulting firm A. T. Kearney wrote in Industry Week about the typical
rigid processes for new product development:
“Most companies have well-established product-development processes
that are highly rigorous with fixed tollgates, multiple interim milestones,
and reviews to ensure that product development is on track and on budget.
This approach, while inherently sound, contributes to a lot of inefficiency
and lack of speed while adding additional cost elements.”53
The context of the article was ultra-low-cost product development, which
has been used to develop the $2,200 Tata Nano, $100 computers (for the
One Laptop per Child Foundation), $35 cell phones, and low-cost medical
products, such as the Siemens Essenze, which was designed for small clinics and rural hospitals to provide access to quality healthcare services at a
fraction of the cost of standard MRI equipment.
60 • Design for Manufacturability
The article summarized how to achieve ambitious cost and development
time targets:
“To develop an ultra-low-cost product while meeting aggressive time-to-
market goals, companies should develop and deploy a flexible product
development process that eliminates much of the intermediate reviews and
all but the major tollgates.
The process should instead require more frequent cross-
f unctional
engineering reviews. This ensures timely cross-functional engineering
input into the development process while minimizing the amount of post-
design-freeze changes.”54
This corresponds to the principles of DFM, which advocate not only
replacing these intermediate reviews but also recommend replacing
scheduled periodic meetings with on-demand huddles (discussed next).
Tim Brown, the CEO of IDEO, agrees: “Good ideas rarely come on schedule and may wither and die in the interludes between weekly meetings.”55
Instead, utilize on-demand meetings.
2.5.2 Huddles
Rather than trying to do concurrent engineering in scheduled periodic
meetings and many formal reviews, team members should be continuously working together and calling huddles to make decisions and resolve
issues as they need to be addressed. Thus, the design is continuously
“reviewed.” People inside and outside the team should huddle on demand
for “peer review,” rather than accumulating issues for an event.
The team leader calls huddles whenever appropriate and invites relevant
participants. In addition to continuously talking with other team members, any team member can ask the team leader to call a huddle. When
appropriate, the team leader calls huddles to present progress to management. And management or staff can ask the team leader to call a huddle to
update the team on new developments in the company, markets, technologies, regulations, and so forth.
At Ford’s successful 2009 skunkworks project (skunkworks are discussed in Section 11.7.2), which quickly developed the new “Scorpion”
diesel engine: “We saved months by knowing hourly what the other guys
were thinking and what their problems were.”56
Concurrent Engineering • 61
2.5.3 Building Many Models and Doing Early Experiments
IDEO emphasizes the value of building models, which they call “prototypes”:
“Prototyping allows exploration of many ideas in parallel. Early prototypes
should be fast, rough, and cheap. The greater the investment in an idea, the
more committed one becomes to it.”
“Product designers can use cheap and easy-to-manipulate materials: cardboard, surfboard foam, wood, and even objects and materials they find
lying around – anything they can glue or tape or staple together to create a
physical approximation of ideas.”57
IDEO avoids arbitrary decisions by trying many experiments: “Most
problems worth worrying about are complex, and a series of early experiments is often the best way to decide among competing directions.”58
2.5.4 Manufacturing Participation
One of the most effective ways to ensure manufacturability is early and active
participation from manufacturing, including manufacturing engineers, tool
designers, and whoever is experienced with problems and change orders
regarding assembly, throughput, quality, testing, repair, and ramping into
production. It is much easier to prevent these problems in the design phase
instead of trying to deal with them when the product is going into production.
The following should be early priorities for manufacturing personnel on
product development teams:
• Fully convey the difficulties encountered, and their consequences,
when products are not designed for manufacturability.
• Turn this experience into actionable proactive design recommendations and manufacturing strategies, including:
• Processing strategy, including process selection, the flow of parts
and products, and flexible cell and line design for product families
• Investigating the optimal use of automation and CNC operations
and, if necessary, making them flexible enough for high-mix
operations (mass customization)
• Optimizing outsourcing and internal integration decisions.59
• Helping the team choose and find off-the-shelf parts
62 • Design for Manufacturability
•
•
•
•
Resupply strategy for parts and raw materials
Identifying the supplier base for purchased parts and materials
Vendor strategy for custom parts; possibly part design by vendor
Identifying potential vendor partnerships early and arranging
for early participation on the design team
• Strategies for quality and reliability assurance and test
• Mistake-proofing (poka-yoke) strategies
• Manufacturing strategy for customization, configurations, product variety, extensions, and derivatives.
• Help the team actually design the product.
• Push back on any distracting activities that contribute less to the
company’s real profitability than new product development, such as
cost reduction on existing products, building low-volume or oddball products, accepting unusual customizations, building legacy
products, spare parts production, implementing big IT programs,
qualifying new low bidders and getting them up the learning curve,
dealing with quality problems from low bidders, and so forth.
• Be an early and active team member, thoroughly raising and resolving all issues related to manufacturability. Be proactive and forceful
to ensure the product is designed for manufacturability.
The Toyota perspective:
“Manufacturing and production engineers are now involved very early in
the design process—working with design engineers at the concept development stage, to give input on manufacturing issues.”60
2.5.5 Role of Procurement
The procurement function needs to shift from just purchasing “the” part
that engineers want to searching for broad ranges of parts to maximize
part availability throughout the life of the product. Broad searches are discussed further in Section 5.19.1.
Be prepared to pay for this availability. But any increase in the purchase
price will be saved many times over by avoiding change orders to solve
availability problems.
Procurement people should look for suppliers whose other customers
have similar challenges, quality demands, and life spans. They should also
qualify suppliers and vendors for quality, ability to deliver, and stability.
Concurrent Engineering • 63
Potential new parts should be prequalified so they will be ready for engineers to incorporate into new designs. Long lead times can be avoided by
selecting standard parts that are readily available. In emergencies, projects
can borrow those standard parts from each other.
2.5.6 Team Composition
The multifunctional aspect of teamwork requires representation of all relevant specialties, as discussed in greater detail in Section 2.9. Key team
members may be full time, while some members may be part time. The
team should have a strong team leader, as will be discussed in Section 2.7.
In the concept/architecture phase, team staffing should consist of:
• System engineers (system architects), whose focus is simplifying
concepts, optimizing product (system) architecture, system integration, wiring, off-the-shelf part decisions, and so forth
• All the functions and specialists that are needed to optimize the
product architecture (Section 3.3)
• Designers of critical parts; they should be early and active participants in
system engineering of the product or subassembly to help optimize the
systems architecture concept that determines the part’s requirements
In the design phase, team staffing should consist of:
• Enough system engineering resources to ensure optimal system
architecture and integration
• A well-coordinated group of part and subsystem designers and manufacturing people concurrently designing the parts and processing
• Manufacturing engineers working with part and subassembly designers
• Purchasing agents to help select parts and subassemblies
• Tests engineers to develop and implement tests, fixtures, and equipment
• Software engineers to write code
At Apple, they believe that: “having all the experts in the same place—
the mechanical, electrical, software, and industrial engineers, as well
as the product designers—leads to a more holistic perspective on product development.”61
64 • Design for Manufacturability
2.5.7 Team Continuity
Project success depends on staff continuity and consistent responsibilities. The team should be assigned a complete mix of talents that will have
adequate bandwidth throughout the project. Corporate resource planning
should ensure that this is so by following the dozens of methods presented
in Section 2.2.
Here is the team continuity policy at Philips:
“[The team] continues from planning through design and interactive problem solving to final products being shipped. The constant makeup of the
team supports easy raising of issues, shared understandings, and fast decisions. While new people occasionally enter the process, total continuity is
essential during the final design iteration.”62
2.5.8 Part-Time Participation
Smaller companies may not have enough resources for several complete
product development teams staffed exclusively with full-time personnel. In
these companies, specialists (e.g., regulatory compliance, heat flow analysis, stress analysis, tolerance analysis, design of experiments, etc.) may be
assigned to multiple products on a part-time basis. It is especially important
that each team have a complete set of expertise early, when fundamental decisions are being made. However, these part-time people must not be spread so
thin that they cannot make meaningful contributions to all projects.
Xomed (a division of Medtronic) makes sure part-time team members
have enough focus on all their projects:
“To assure that engineers pay close attention to projects, Xomed limits
them to no more than two projects concurrently. Xomed can’t afford to
have time conflicts delay moving a hot new product to market.”63
2.5.9 Using Outside Expertise
Consider bringing in consultants, experts, and contractors to help smooth
out peak demands, enhance diversity, and add specific expertise when
needed. Be careful to ensure the availability of these workers when the
team needs them and ensure security of critical or proprietary knowledge.
“To avoid compromising either quality or time-
to-
market with not-
invented-here issues, Xomed contracts expertise when needed.”64
Concurrent Engineering • 65
2.5.10 The Value of Diversity
One important benefit of having multidisciplinary membership is to provide a variety of experience and viewpoints. This diversity will help the
team perform some of its most important tasks of raising issues, resolving
issues, solving problems, and generating ideas. When Bill George was
chairman and CEO of Medtronic, he said:
“It is diversity, and the intense debates it generates, that leads to the best
decisions. By calling upon the broad experiences of team members, you
can avoid pitfalls and make better decisions.”65
2.5.11 Encouraging Honest Feedback
Encourage feedback and be receptive to all news about product developments. Create an open culture where issues can be raised and discussed
early, with the focus on issue resolution.
When the current Ford Americas President Mark Fields came to Ford
from IBM, he was discouraged from airing problems at meetings unless
his boss approved first!66
In How the Mighty Fall, Jim Collins relates that when leaders start to fall
in Stage 3, denial of risk and peril, “leaders discount negative data, amplify
positive data, and put a positive spin on ambiguous data.”67 He describes
teams on the way down as follows: “People shield those in power from
unpleasant facts, fearful of penalties and criticism for shining light on
the rough realities.” Teams on the way up are described this way: “People
bring forth grim facts—‘Come here and look, man this is ugly’—to be discussed; leaders never criticize those who bring forth harsh realities.”
2.6 VENDOR PARTNERSHIPS
2.6.1 The Value of Vendor/Partnerships
One of the main strengths of concurrent engineering is early and active
participation of vendors (which is defined here as a supplier who builds
your custom parts). The only way to get this is to preselect the vendor
or partner on the basis of past relationships and a proven record of performance. They will not participate early unless they are reasonably sure
66 • Design for Manufacturability
paid work will follow. Implying that certain vendors will get your business
and then going out for bids will alienate those vendors and ruin previous relationships.
Industry Week’s “Best Plant” survey of the 25 top-performing candidate
companies found that 92% emphasize early supplier involvement in product development.68
“Toyota selects suppliers early in the product development program, guarantees the business, and incorporates them as part of the extended product
development team.”69
“Teamwork at Motorola is imbedded in the firm’s culture, and this is one
reason for its success with supply alliances. … [The teams] focus on quality
(as broadly defined), speed (in terms of removing non-value-added steps),
and cost reduction. … [The ultra-low-cost Tata] Nano development also
was characterized by extensive supplier collaboration from the early stages
of product design with suppliers being given extensive design flexibility.”70
“The ultra-low-cost Tata Nano development also was characterized by
extensive supplier collaboration from the early stages of product design
with suppliers being given extensive design flexibility.”71
2.6.2 Vendor/Partnerships Lead to Lower Net Cost
Vendor/partnershps will result in a lower net cost because:
Having the vendor help design the part will greatly improve the manufacturability, quality, and lead time, thus resulting in lower manufacturing and quality costs, because vendors thoroughly understand the DFM
rules and guidelines for their process, in general, and for their equipment,
in particular.
Vendor partners who work with their customers from the beginning
will be able to charge less because they (1) understand the part requirement better, due to more thorough interactions, (2) are able work with
their customers to minimize cost, and (3) won’t have to add a “cushion”
to deal with an unknown customer. A leading expert on supplier relations said:
“Suppliers often add a risk premium to their pricing (thus raising the customer’s cost) to cover nondisclosed or unexplored customer requirements
or design flaws that may require later adjustments.”72
Concurrent Engineering • 67
Vendors can help avoid arbitrary decisions, which unnecessarily raise
cost, delay delivery, and compromise quality. One of the worst causes of
arbitrary decisions is styling, especially when the designer throws a pretty
shape over the wall to engineering, which then throws it over another
wall to manufacturing, which then throws it over yet another wall to the
vendor—so the tool maker is three walls away from the designer! When
designers work directly with tooling engineers, the results are designs that
both look good and are easily manufacturable.
Vendor partners will provide the lowest total cost because interacting
with the customer’s team results in vendors thoroughly understanding the
challenges and issues, sharing their experiences and their lessons learned
with similar applications, making “what if” suggestions early on that will
maximize manufacturability, and working with customers early on to
minimize total cost. Vendor partnerships benefit from learning relationships in which the customer and vendor learn from each other, thus making each job better and faster.
After preselecting vendors, the team can then benefit from more participation from their own purchasing people, who will now be able to help
the team make the best off-the-shelf decisions; find the best balance of
cost, quality, and delivery; optimize availability for the life of the product;
and so forth. When Motorola introduced concurrent engineering, it found
that bringing vendors onto the team proved to be a major contributor to a
project’s success.73
Without vendor partnerships, the design would be thrown over the wall
to the vendor. And unless the customer’s engineers thoroughly understand
the processes, which is rare, the design will not be optimized for manufacturability or, worse, it will be hard for the vendor to make changes to make
it more manufacturable because (1) there is usually no calendar time for
changes, (2) there is usually no budget for changes at either the customer’s
or the vendor’s end, and (3) by this point, most changes will be difficult
because of the reasons discussed in Section 6.11.
2.6.3 Vendor Partner Selection
Thoroughly evaluate potential vendors, and select them on the basis of:
• Capabilities, past relationships, and a proven record of performance—
not low bidding.74
• Financial stability: get Dunn & Bradstreet or similar reports.
68 • Design for Manufacturability
• Your business being an important share of theirs, especially if
there are any unusual requirements or variations from typical
operating procedures.
• Proximity: local vendors are preferred for contact and delivery.
• Similarities and synergies with vendors’ other work, especially with
respect to experience, parts used, fabrication/assembly machinery,
and test equipment. This will minimize learning curves, delays,
changeovers, part changes, and program rewriting, and, thus, minimize cost, quality problems, and delivery times.
• Willingness to work early with their customers to help design their
parts and convey their process capabilities and constraints.
• Ability to work well together, contribute ideas, and provide honest,
candid feedback.
“Toyota wants the suppliers to think for themselves, challenge the
requirements, and provide value-added ideas to the process.”75
Honda’s criterion for selecting suppliers is the attitude of their management.76 As a philosophy-driven company, Honda feels it is easier to
teach product and process knowledge than to find a technically capable
supplier with the right attitudes, motivation, responsiveness, and overall competence.77
2.6.4 Working with Vendor Partners
Vendor partnerships should be developed. Kiichiro Toyoda, founder of
Toyota’s automotive business, said: “First tier suppliers, in particular, must
be partners in research. We don’t just buy things from them. We have
them make things for us.”78
Don’t just throw a spec at a vendor and ask for a quote; work with the
vendor to optimize the design for manufacturability. Explore “what if”
scenarios. Understand the vendor’s processes, sensitivities, and process
capabilities. Direct interaction and visits are preferred.
Team members should interact directly with the appropriate people in
the vendor’s factory (being sure to include the team’s purchasing member),
not just the procurement department or the vendor’s reps, who may not
understand your products or even their processing.
Vendors should be willing and able to do the following (HP’s criteria):
(1) help design the product, (2) build quick-turn prototype parts and parts
for short-run projects, and (3) build production units.
Concurrent Engineering • 69
Don’t change vendors as volumes rise because this adds an additional
ramp and new sources of statistical variation at the worst time for unexpected problems to occur. Similarly, don’t change vendors for a “lower
cost” on parts because the total cost including the cost of the change will
most likely be higher. Don’t dump a vendor at the first hint of disappointment; work with them to improve. In general, don’t change vendors at all,
so as to preserve the learning relationship in which every job improves the
rapport, cooperation, dialogue, and feedback.
Don’t beat up vendors to lower cost. If they don’t know how to lower cost,
they will either cut corners or cut margins, neither of which is good for
the OEM (original equipment manufacturer). Rather, work together with
vendor partners early to proactively minimize total cost. Taiichi Ohno, the
father of the Toyota Production System, said:
“Achievement of business performance by the parent company through bullying suppliers is totally alien to the spirit of the Toyota Production System.”79
Here is how Toyota treats suppliers. A survey of suppliers found that
although Toyota is rated as “their most demanding customer,” it also
received the most favorable ratings overall: 415 out of 500 compared to
GM at 114 out of 500. Specifically, Toyota:
• Works with new or struggling suppliers to get up to speed
• Makes commitments to suppliers early in the product development
process and makes good on promises
• Constructs contracts that are simple and for the life of the product
• Is the best at balancing a focus on cost with a focus on quality
• Honors the contracts—does not renege on them
• Treats suppliers respectfully and respects the integrity of intellectual property
• Works with suppliers to achieve price targets80
2.7 THE TEAM LEADER
The product development team leader is key to success. There should be
a single team leader from the earliest stages through stable production,
responsible for all goals, activities, schedule, and deliverables.
70 • Design for Manufacturability
An MIT study provides insight into the most successful product development project managers, who serve as both a leader and a project champion:
“In the Japanese auto companies, each new product is assigned a program
manager who: acts as the product’s champion, carries great authority with
the firm, and along with his staff, stays with the product from conception
until well past the production launch.”81
In addition, a good product development team leader:
• Has the respect of the team and management and is more than an
administrator; in fact, excess focus on budgets and schedules will
stifle creativity and the crucial architecture phase optimization
• Provides the proper broad focus and resists the natural temptation to
think only about functionality and design parts prematurely
• Understands the importance of thorough concept/architecture, pursues optimization, and resists temptations and pressures from the
team or management to do otherwise
• Makes sure team members work together as a team, instead of just
retreating to their cubicles, and leads the team to do all the thorough
up-front work discussed in Chapter 3
• Forces the team to confront and resolve all issues and encourages team
members to bring up issues and pounce on the issue, not the messenger
• Ensures that the tasks in each phase are completed before moving on
Finally, if all the principles are not implemented company-wide, the team
leader creates a microclimate where the team can follow these principles
right away.
2.7.1 The Team Leader at Toyota
The characteristics of a good team leader at Toyota82 (called “chief
engineer”) are
•
•
•
•
An instinctive feel for what customers want
Exceptional engineering skills
Intuitive yet grounded in facts
Innovative yet skeptical of unproven technology
Concurrent Engineering • 71
• Visionary yet practical
• A hard-driven teacher, motivator, and disciplinarian, yet a patient
listener
• A no-compromise attitude to achieving breakthrough targets
• An exceptional communicator
• Always ready to get his or her hands dirty
“Key decisions, mentoring, lobbying for resources, building a shared
vision, pushing the product to higher levels, and achieving quality, safety,
cost, and timing targets all start with the chief engineer.”83
2.7.2 The Team Leader at Motorola
“A good project leader’s worst enemies are a chair and desk. Instead of sitting in an office, a project leader should visit the project team members at
least once a day. … Project leaders have to be tenacious and want to make
things happen. … They must be willing to make noise at the top and ask
embarrassing questions when obstacles arise. … [Project leaders] make sure
that communication among team members happens on an ongoing basis.”84
2.7.3 Team Leaders and Sponsors at Motorola
“Essentially, a cross-f unctional team is selected, dedicated, co-located, and
put under the direction of a general manager who serves as a full-time project leader for the duration of the effort.”85
Motorola teams have an executive sponsor, who is “an early champion
and supporter, as well as direct supervisor in selecting the project leader
and helping get the team underway.” In some cases, the executive sponsor
makes the investment proposal to the Board of Directors.86
2.8 CO-LOCATION
Concurrent engineering works best when the product development team
is in close proximity with manufacturing operations, so that the whole
team can meet frequently and, as a team, do all the tasks recommended
by this book. Separating manufacturing people geographically from the
72 • Design for Manufacturability
product development team will impair the team’s ability to design for
manufacturability, sometimes seriously. The main issues are
• Awareness. Design engineers will not be able to frequently observe
production operations firsthand and get direct face-to-face interactions with production personnel, and thus will be less able to concurrently engineer products and processes.
• Teamwork. The manufacturing team members’ contributions to the
teamwork will be compromised if distance decreases the number of
meetings and interactions. Greater distance makes face-to-face contact even less likely, thus diminishing the effectiveness of teamwork
and discouraging spontaneous interactions.
2.8.1 Effect of Onshoring on Concurrent Engineering
Outsourcing manufacturing far away compromises concurrent engineering even more, because employees of other companies are less accessible in
addition to the challenges of distance, time zones, languages, and cultural
differences (between both companies and countries). The effect of this separate engineering is discussed in Section 4.8 and in the articles on outsourcing87 and offshoring88 at the author’s website: www.HalfCostProducts.com.
2.8.2 The Project Room (The “Great Room” or Obeya)
Each multifunctional team should have a dedicated project room (Obeya
in Japanese) for each project to accommodate spontaneous huddles and
display the team’s charts, graphs, drawings, experiments, samples, models,
prototypes, and so forth. Not having this would discourage spontaneous
discussions simply because of the lack of availability of somewhere to
meet. Here is how the Obeya works in Toyota culture:
“The Obeya integrates various product development participants throughout the life of a program [facilitating meetings several times a week, which]
enable fast decision making and information sharing.”84
The team and the team leader (chief engineer) meet almost daily in the
Obeya to make decisions in real time, not waiting for periodic meetings:
“Usually, once every two days at least the whole team assembles there.”90
Concurrent Engineering • 73
At IDEO, “we have dedicated rooms for our brainstorming sessions, and
the rules are literally written on the walls.”91 “The simultaneous visibility
of these project materials helps us identify patterns and encourages creative synthesis to occur much more readily than when these resources are
hidden away in file folders, notebooks, or PowerPoint decks.”92
If project room space is not readily available, fully understand that:
The business model should determine the facilities planning, not the other
way around.
2.9 TEAM MEMBERSHIP AND ROLES
Design teams should consist of design engineers, manufacturing engineers,
service representatives, marketing managers, customers, dealers, finance
representatives, industrial designers, quality and testing personnel, purchasing representatives, suppliers, regulation compliance experts, factory workers, specialized talent, and representatives from other projects. First, this
helps to ensure that all the design considerations will be covered. Second,
such diversity can lead to a better design because of contributions from many
perspectives. This synergy results in a better design than could result from a
homogeneous team consisting only of design engineers or scientists.
Key tenets of the Honda product development process are trust, which
comes from teamwork and shared knowledge, and equality, which means
to “recognize, respect and benefit from individual differences.”93 Kaj
Linden, the research director at Nokia, says, “The common denominator
of Nokia’s R&D stems from concurrent engineering efforts in which product development, sales, and production units cooperate significantly.”94
It is very important that all team members are present and active early
so that they will make meaningful contributions to the design team.
Everyone on the team should work well together and be receptive to
everyone else’s contributions. Team members need not all be full time, but
they should not be so preoccupied with other tasks that they cannot make
meaningful contributions. All team members should actively participate
in the product development, not waiting for “designers” to design something and then reacting to their designs. Some of the key team members
are described here.
74 • Design for Manufacturability
2.9.1 Manufacturing and Service
The participation of manufacturing and service personnel is crucial to
ensure that the product development team designs manufacturability and
serviceability into the product. Manufacturing engineers have the responsibility of making sure that products are being designed for stable processes that are already in use or for new processes that will be concurrently
designed as the product is designed. Manufacturing and service representatives must not wait until the stage where there are drawings to mark up.
Their role is to help design the product and constantly influence the design
to ensure manufacturability and serviceability. Manufacturing representatives must be isolated from the daily emergencies and firefighting that
occur in manufacturing, because urgent matters usually take precedence
over important matters.
Problems can arise when manufacturing engineers view team participation as a career opportunity to migrate into engineering, designing one
portion of the product very well for manufacturability, while the remainder of the product has manufacturability ignored.
Valuable knowledge can be obtained from all manufacturing and service people by asking them to fill out survey forms for factory feedback
and field service feedback (see Appendix C).
2.9.2 Tooling Engineers
When new or custom processes and tooling are required, they should be
designed concurrently with the products. If current manufacturing procedures are inadequate for cost, time, or quality, then new processes may
need to be concurrently developed.
Look for opportunities to create innovative tooling that replaces slow,
costly, and poor-quality processing. Concurrently develop tooling and fixtures that are faster, more efficient, quick loading, more accurate, partially
mechanized, or automated.
2.9.3 Purchasing and Vendors
Purchasing agents should help design teams select parts for the best balance of cost, quality, and availability. Instead of just throwing a single spec
over the wall and telling purchasing to “just buy it,” engineers should provide a performance range so purchasing agents can look for the best price
Concurrent Engineering • 75
and availability within the entire range. Sometimes, a higher performance
part may have a lower price and better availability if it is mass-produced
and is in widespread use, as shown in Figure 5.6.
Purchasing’s other role should be to set up and manage vendor partnerships for custom parts, as discussed in Section 2.6. These partnerships
should be used instead of bidding, for reasons discussed in Section 6.11.
2.9.4 Marketing
Marketing is the link to the customer and must help the team define the
product so that it listens to the voice of the customer. Product definition
will be discussed in Section 2.11.
Cooperation between engineering and marketing is a key determinant
of product development success. A study of 289 projects found that when
there was “harmony” between engineering and marketing, there were only
13% failures. On the other hand, when there was “severe disharmony,” the
results were the opposite: only 11% of projects succeeded!95
2.9.5 Customers
Product development teams should be close to customers and understand how they use products. Toyota engineers spend months talking to
customers and dealers to understand what customers want in new product designs.96
A key aspect of Guidant’s product development process for surgical tools
is to have engineers observe surgical procedures and gain understanding
and get feedback directly from customers.
When Hewlett-Packard’s (now Philips) Medical Products Group develops ultrasound imaging systems, they construct full-size nonfunctional
models for doctors to evaluate usability in hospitals. This gives the product development team valuable early feedback on all aspects of the user
interface, including how well a doctor wearing gloves can grasp probes
and switches, extend and retract cords, read displays, move the system
from room to room, and so forth.
One reason for Rubbermaid’s early success was that its product development teams were so close to customers and products that they could
minimize market testing, which dramatically reduced the time-to-market
and made it harder for competitors to copy their products as clones or
knock-offs.97
76 • Design for Manufacturability
It is becoming more common to have customers themselves actually
participating on product development teams. When Boeing developed
the 777, they invited representatives of their customers, the airlines, to
help design the product. At first, Boeing engineers were apprehensive,
but they soon learned the value of hearing detailed customer input in the
design stage.98
Xerox does brainstorming or “dreaming with the customer” on its
product development efforts. The goal is “involving experts who know the
technology with customers who know the pain points.”99
Toymaker LEGO Group “went straight to its customers—namely
robot enthusiasts—several years ago to help guide product development
improvements to its Mindstorm product, creating a users’ panel and challenging them to improve the company’s robotics kit.”100
Half a century ago, the Swiss–Swedish corporation ABB (formerly ASEA
Brown Boveri) bought a minor US company that made electrical meters.
Their product development team brought in seven customers (utilities)
representing various types of rural and urban markets. The customers
signed nondisclosure agreements and these utilities got deals on the forthcoming product they helped develop. Because of this customer input, the
new meter took over the market and became the standard electrical meter.
In 1929, a consortium of 28 streetcar operators (customers) and 25 manufacturers spent 5 years to jointly develop the next-generation “PCC” car
for rapid acceleration, a quiet ride, aerodynamic styling, and regenerative
braking. It was an overwhelming success, with 5,000 sold in the United
States and 20,000 more in Europe. Hundreds still run today in cities such
as San Francisco, Philadelphia, and Boston.101
An added value to involving customers in the design process is that it
bonds them to the product and, thus, tends to make them more loyal customers when the new product comes out.
Industry Week’s “Best Plant” survey of the 25 top-performing candidate
companies indicated that 96% of the companies surveyed used customer
participation in product development efforts.102
2.9.6 Industrial Designers
These creative people need to be part of the design team so that product styling is not thrown over the wall to engineering, who must then
fit everything into a pretty enclosure. It is an encouraging trend that the
Concurrent Engineering • 77
leading industrial design firms are evolving away from a styling emphasis
to include engineering, manufacturability, and usability.103
2.9.7 Quality and Test
The need for diagnostic testing is dependent on the “quality culture” of
the company. If quality is designed into the product and then built in by
processes that are in control, then the “fall out” will be so low that diagnostic tests may not be needed. At IBM, products that were expected to
have higher than a 98.5% first-pass-accept rate could avoid diagnostic test
development and the expensive ATE (automatic test equipment) “bed-of-
nails” testers. Above this threshold, it was more cost effective to discard
defective printed circuit boards than to pay for the testers and test development. ATE testers cost millions of dollars, and for some printed circuit
boards, test development can exceed the cost and the calendar time of
product development!
2.9.8 Finance
Finance representatives can help decision making by providing relevant
cost data, which does not automatically come from most accounting systems. Implementing activity-based cost management, as discussed in
Chapter 7, can provide data based on total cost considerations, which will
lead to much more rational decision making (e.g., for tradeoff analysis of
quality/diagnostics, make/buy decisions, off-the-shelf parts, quantifying
quality costs, and quantifying overhead cost savings resulting from standardization and modularity).
2.9.9 Regulatory Compliance
Every design team needs representatives who can ensure that all applicable regulations are satisfied by the initial product design, not by costly and
time-consuming changes. Future regulations must also be considered,
because regulations sometimes change faster than manufacturers can
respond with another product development cycle. Some companies have
legislative or environmental lawyers on the design teams to anticipate the
impact of future regulations. Efficiently producing regional product variations, for instance, for many countries, is one promising application of
78 • Design for Manufacturability
mass customization (Section 4.3). This requires that the design team incorporate the regulations of every customer country into the design process.
2.9.10 Factory Workers
Factory workers are a valuable source of input, either from actual participation on the design team or from surveys like the factory feedback
form in Appendix C. Factory workers usually have no feedback channel for their vast amount of knowledge on past manufacturability issues.
Factory worker participation in the design process may have the added
benefit of improving labor relations and making the new product more
easily accepted as it is launched into manufacturing.
2.9.11 Specialized Talent
Design teams may need help from specialized talent for automation,
simulation, stress analysis, heat flow analysis, solid modeling, rapid prototyping, design of experiments, “robust” tolerancing, lab testing, safety,
product liability, patent law, and so forth.
2.9.12 Other Projects
Coordinating multiple product development projects is important to
maximize synergies, share work on common module design, and standardize parts, modules, tooling, and processes.
The success of product development projects is determined by how well
concurrent engineering is practiced: how complete the multifunctional
team is; how early the entire team is active; and how well the team is led.
Locating people very close together (co-location) also helps ensure the
success of product development teams.
The largest study of corporate failures, Why Smart Executives Fail: And
What You Can Learn from Their Mistakes, emphasized the importance of
multifunctional teams:
“Create crossfunctional teams and diverse work groups whose members
will see things differently. Such heterogenous groups have been shown to
be much better than homogeneous groups when it comes to developing
new knowledge.”104
Concurrent Engineering • 79
2.10 OUTSOURCING ENGINEERING
Many managers are intrigued with the prospect of outsourcing engineering as a way to “save cost” on product development with foreign engineers
whose wages are a fraction of domestic engineers. Further, there is the
allure of speeding up product development by keeping engineering working three shifts a day, with work passed off around the world every day.
This might work with independent activities such as call centers or
insurance or loan processing, but product development should be a highly
interactive and integrated team activity. Product development is most
effective and efficient when products are designed by complete multifunctional teams that are co-located with manufacturing operations and close
to customers and vendors, as discussed earlier.
Any proposals to save cost must be based on minimizing total cost.
Chapter 6 emphasizes the many costs that make up the total, of which
product development labor cost is just one element. Some of the consequences of chasing cheap manufacturing labor—lower labor efficiency
and poorer quality—might cancel out the labor rate savings; adding in
other costs could push results into a net loss.105
A Business Week article titled, “The Hidden Costs of IT Outsourcing,”
confirmed this phenomenon, saying that it applies even more so for software outsourcing: “Offshoring—sending work overseas—isn’t always all
it’s made out to be. Particularly with information technology, which can
be a lot more complicated than moving traditional manufacturing operations overseas.”106 The article also pointed out that IT quality is harder
to ascertain because it requires more communication and management.
When total cost was taken into account, the cost was generally comparable to domestic work. Further, some experts claim outsourced software
has 35% to 40% more bugs, and some outsourcers have experienced missing code and unconnected pages, which made updating a nightmare.
According to the article, the problems encountered are a “dirty little secret”
because companies don’t publicize the problems they have run into.
The best way to lower product development expenses is to maximize the
efficiency of the whole process through concurrent engineering (with co-
located teams) and design for manufacturability (with continuous interactions with manufacturing people), as discussed throughout this chapter.
A more efficient product development process consumes fewer labor
hours to (1) develop new products and (2) solve problems during product
80 • Design for Manufacturability
launches, ramping up to volume targets, achieving quality and productivity targets, implementing engineering change orders, and all the firefighting associated with these activities, which are really avoidable with an
efficient product development process, as discussed throughout this book.
Optimal product development practices not only minimize engineering costs but also can substantially reduce product costs, which is one of
product development’s primary goals. Spreading out teams geographically—with people who may not even be working at the same time—compromises the teamwork that is necessary to optimize product architecture,
which determines 60% of the product’s cost (Figure 1.1). Outsourcing subsystem and part design to remote engineers can produce products that
may be hard to integrate, have part interaction problems, or miss out on
synergistic system opportunities, as discussed in Chapter 3.
Physically integrated teamwork is even more important when products need to be designed for Lean Production and build-to-order. Design
teams need to work closely with manufacturing people to design around
standard materials and modules, design for no setup, design for CNC, and
concurrently design versatile product families and flexible processes, as
discussed in Chapter 4. For mass customization, engineers need to work
closely with manufacturing, marketing, and the sales force to establish
parametric CAD templates that can automatically generate CNC programs (see Chapter 4).
The transition to outsourced engineering incurs a certain cost and
may cause significant consequences. It will cost money to find engineers,
arrange to hire and pay them, and prepare and transfer documents, drawings, and CAD files. The effort to implement these changes will probably
consume most of the available change energy and preclude or compromise
other more valuable improvement efforts, such as DFM, robust design,
better CAD tools for domestic engineers, Six Sigma, build-to-order, and
so forth.
The consequences can be even more severe if the “cost savings” from
outsourcing engineering are to come from layoffs. In addition to the general consequences of layoffs,107 there are special consequences for product
development. Once word spreads, morale and efficiency will drop and the
best engineers may leave, thus weakening engineering efforts and making
product development even less efficient. Engineers who quit or are laid off
will probably take with them valuable skills and knowledge, some of which
may be unique, and thus weaken product development. If documentation
Concurrent Engineering • 81
is less than complete, which is usually the case, departures may create serious documentation gaps. Continuity may suffer for ongoing projects. The
remaining engineering capability will be less efficient with such losses.
Further, teamwork will be less effective because of missing talent, knowledge, and diversity.
2.10.1 Which Engineering Could Be Outsourced?
Certain engineering tasks could be outsourced, as long as they help rather
than hurt the overall product development effort. Research may be more
suitable than development. Outsourcing certain tasks could help new
product development efforts. Outsourcing certain other tasks could relieve
domestic engineers from distracting tasks and thus indirectly benefit new
product development efforts.
Tasks that support domestic new product development include: computational intensive research tasks, as long as they do not specify or imply
product architecture or part design; computational intensive analysis of
performance, strength, dynamics, heat flow, reliability, design of experiments, robust tolerances, etc.; materials research; structuring and adapting parametric CAD templates and CAD/CAM programs;108 and literature
or web searches in general.
Tasks that usually distract new product development efforts include the
following activities on current products: engineering change order processing; changing drawings; analyses of problems on current products;
cleaning up or converting documentation, drawings, or part numbers
for standardization efforts or absorbing acquired products; maintenance
engineering and conversions from obsolete materials for older legacy
products and spare parts; cleaning up documentation for outsourcing the
manufacturing of legacy, spare parts, and oddball products;109 conversion
of drawings into geometric dimensioning and tolerancing (GD&T) format; and conversion of drawings to metric or dual dimensioning.
Pfizer created a program to handle these types of tasks. Pfizer Works
“permits some 4,000 employees to pass off parts of their job to outsiders,”
including web searches, number crunching, market research, presentation
preparations, graphic design, data mining, and so forth. “They write up
what they need on an online form, which is sent to one of two Indian
service-outsourcing firms.” Pfizer estimates that it has freed up 66,500
employee hours in its first year.110
82 • Design for Manufacturability
Section 4.8 discusses the offshoring of manufacturing, why it will not
save money on a total cost basis, and its detrimental effects on product
development, Lean Production, and quality improvements.
2.11 PRODUCT DEFINITION
Before product development can begin, the product must be methodically defined with clear and realistic goals that will satisfy customers.
Sometimes products are defined as a hodgepodge of unrealistic ambitions.
2.11.1 Understanding Customer Needs
Understand customer needs and develop products to satisfy customer
needs rather than buying into the philosophy of “build it and they will
come.” Offer customers solutions instead of just products.
How do you understand customer needs? Ask customers what they
want with respect to functionality, cost, cost-of-ownership, reliability, and
so forth. Ask customers to rank what is most important and how well your
company does compared to the competition.
Understand customer root needs well enough to predict what customers may need but don’t realize. HP LaserJet Printer division has an
“imaginative understanding of user needs.” Procter and Gamble recommends “understanding your customers so well that you can predict what
they want but don’t know that they want.”
Understand what customers will need in the future; study trends
and develop versatile products that can adapt to future environments.
Understand new potential customer wants, which may be the basis for
new markets. Understand what customers would want if they knew all the
things that were possible. For example, the Sony Walkman “just wasn’t
an option that consumers fathomed would even be possible.”111 Another
example from Sony: “Sony’s dealers in the US and some of its engineers
balked at the idea of miniaturizing the transistor radio.”112
Henry Ford knew that if he asked people what they wanted, they would
have asked for faster horses! So he wrote to The Automobile magazine
in 1906 with his own product definition: “The greatest need today is a
light, low priced car with an up-to-date engine with ample horsepower,
and built of the very best material. … It must be powerful enough for
Concurrent Engineering • 83
American roads and capable of carrying its passengers anywhere that a
horse-drawn vehicle will go.”113
2.11.2 Writing Product Requirements
Make sure all customer/market needs are specified in the product requirements document, never adding to it or changing it after the product development has commenced. Avoid late changes by proactively bringing up early
all the requirements that historically were omitted in previous requirement documents and came in later as changes:
• Ask the customer: “What about this? … What about that?” Then
make sure all of the requirements are incorporated into the initial
requirements document.
• Base your questions on your experiences with previous changes
with this customer and this type of product, plotted in Pareto order,
ranked by the most difficult, most costly, most responsible for delays,
and most draining of resources.
• If probing questions are inconclusive or noncommittal, identify possible changes (with separate “trend research”) and proactively create
versatile designs that can easily handle anticipated changes.
Product requirements should be noted generically without specifying or
implying how they should be done. When providing requirements to customers or regulators, state them generically without constraining product
architecture, to keep it open for optimization. State “what will be done,”
not the “how we will do it.”
Write rational, objective, and appropriate product requirements. Avoid
temptations to base product requirements on enticing market opportunities, exciting technology, whims, attachments, aversions, prejudices,
competitive precedents, or the “next bench syndrome” (designing products for colleagues). Make sure the requirements are thoroughly written
for the current products. Avoid the temptation to base the requirements
on previous products or form-letter templates. Make sure all goals, targets, specs, and metrics are clearly delineated deliverables and are relevant
to customers.
Make sure the system architecture is optimized before writing component and subsystem-level specs. Having vendors on the team early to help
do this will (1) ensure this is done fast and correctly and (2), if this is not
84 • Design for Manufacturability
done well, avoid taking more calendar time to clear up an over-the-wall
spec and fix incorrect or suboptimal specs later.
Avoid feature creep and unnecessary complication. Philips Electronics
found that “at least half of returned products had nothing wrong with
them. Consumers just couldn’t figure out how to use them.”114
Think in terms of synergistic product families (platforms) and their evolution over time.
2.11.3 Consequences of Poor Product Definition
Time, money, resources, and opportunities are wasted when products
are developed that customers don’t want. Product development costs and
valuable resources are wasted and the project is delayed when product
design requirements have to change to reflect what the customer really
wanted in the first place.
2.11.4 Customer Input
First, create a list of factors that would be important to customers. A baseline list is shown in the first column of Figure 2.2. Second, ask customers for
the relative importance of their preferences, from a low of “1” to a high of
“10” (there may be more than one 10, etc.). Ask them to grade your product
(in the second column) compared to the leading competitor(s) in the third
Rating of Importance
_____Functionality
_____Purchase cost
_____Quality
_____Reliability/Durability
_____Delivery/Availability
_____Ergonomics; ease of use
_____Appearance/Aestetics
_____Service, repair, maintenace
_____Cost of ownership
_____Technical support
_____Customizability/Options
_____Safety
_____Environmental
_____Other____________________
FIGURE 2.2
Customer input form.
Grade
_______
_______
_______
_______
_______
_______
_______
_______
_______
_______
_______
_______
_______
_______
Compared to:
___________________________
___________________________
___________________________
___________________________
___________________________
___________________________
___________________________
___________________________
___________________________
___________________________
___________________________
___________________________
___________________________
___________________________
Concurrent Engineering • 85
Importance to Customers
High
Low
Best
Grade Compared to Competitors
Worst
High
Importance to Customers
Low
D
I
N
Best
C
G
E
J
L
P
A
B
F
O
M
H
K
Grade Compared to Competitors
Worst
FIGURE 2.3
Customer importance versus competitive grade.
column. Use the academic scale of A (best), B (above average), C (average),
D (below average), and F (worst). For plotting, use F = 0 through A = 5.
Next, prioritize customer preferences, which is valuable information
in itself. This will help neutralize misunderstandings or internal biases
toward existing technology, markets, or “pet” features. Finally, label each
at its appropriate numerical position on the vertical scale in Figure 2.3,
from a low of 1 to a high of 10. Then plot their positions against the competitive grade on the horizontal axis, as shown in the upper graph in
Figure 2.3. The graph can then be prioritized with diagonal zones (lower
graph), which quickly show where to place the most effort. The first zone,
with point “A,” presents the most opportunity because it is most important to customers but our company is ranked worst. The next zone, with
points “B” and “C,” is the next priority, and so forth through the zones to
86 • Design for Manufacturability
point “P,” at which our competitive grade is best on a factor that is least
important to customers.
2.11.5 Quality Function Deployment
Quality function deployment (QFD) is a tool for systematically translating the voice of the customer into product design specifications and
resource prioritizations.115 Its strength is to translate objective and
subjective customer wants and needs into objective specifications that
engineers can use to design products.
In the most general sense, the input to QFD is a set of customer preferences, and the outputs are product specifications and resource prioritization (Figure 2.4). The values in the “design specifications” rows are
the actual values that engineers will use to design products. The “resource
prioritization” row is the percent of the design team’s effort that should be
spent on each aspect of the design. Using this prioritization will ensure
that the design team devotes its efforts toward features that customers
Input
Customer
Preferences
Outputs:
Design Specifications
Resource Prioritization
FIGURE 2.4
QFD executive overview.
Concurrent Engineering • 87
want the most. And, thus, they will not waste effort “polishing the ruby”
more than the customer wants it polished. This can be a temptation when
engineers are personally excited about certain new technologies that are
being used in the product.
2.11.6 How QFD Works
Figure 2.5 shows the complete QFD “house of quality” chart, with each
area labeled according to its function in the methodology. The “customer
preferences” are listed, one per row, in words that are meaningful to the
customer, not in “specsmanship” jargon.
Two of the most valuable aspects of QFD are obtaining customer preferences and competitive grades that can be documented in the form shown
in Figure 2.2 and graphed in the format of Figure 2.3. The value of having
this information can be quickly demonstrated by surveying an internal
QFD “House of Quality”
Relative Importance
Conflict
Matrix
Measured
Specifications
Current Product
Competitor A
Competitor B
Competitor C
Outputs:
Design Specifications
Resource Prioritization
FIGURE 2.5
QFD “house of quality” chart.
Customer
Perceptions
Co
r
M rela
at tio
rix n
Input
Subjective
Customer
Preferences
Objective
Engineering
Specification
Measures
88 • Design for Manufacturability
group; for instance, a newly formed product development team. It is truly
amazing how much the results can vary—some answers for estimated customer importance vary the entire range from 1 to 10! In one workshop,
the team reaction was, “How can we design a product when even we can’t
agree on what’s most important?” Of course, the real input will have to
come from real customers themselves. The customer values (from 1 to 10)
are entered under the “chimney” of the house of quality and competitive
rankings are entered on the right of Figure 2.5.
The full QFD procedure uses these two sets of inputs to calculate the
optimal development budget allotments for various tasks. If a competitor
was ranked best about something important to the customer, the company
would be wise to analyze that product, using the data in the “measured
specifications” section, and try to understand how it achieved customer
satisfaction in this area. The things to measure would be the specifications
that appear under the columns labeled “objective engineering specification
measures.” These contain the objective measurements that will eventually
be the target numbers for discrete products or ranges for mass-customized
products.116 The objective measures would be in engineering units that
quantify dimensions, force, torque, energy, decibels, etc. All of those objective measurements are then measured for the current product and several
competitors and entered in the chart in the “measured specifications.”
The “correlation matrix” correlates which customer preferences are
affected by which engineering specifications. Symbols are placed in the
square to indicate the type of correlation. Usually rankings are “positive”
or “negative” correlation; “strong,” “some,” or “possible” correlation; or
“strong positive,” “medium positive,” “medium negative,” and “strong
negative” correlation. Roughly half the boxes should be checked. Results
become less valuable as one approaches either extreme of all boxes checked
or no boxes checked.
The “conflict matrix” tabulates any specifications that might be inherently in conflict with others, to aid in making tradeoffs of one feature versus another. An example would be a more powerful car engine that may
adversely affect mileage or handling because of its extra weight.
Various cells in a QFD chart are used to make calculations and normalize them to useful percentages. One of the bottom lines is the design target
row, labeled “design specifications.” The other is the “resource prioritization,” which can be given as a percentage of the engineering budget or
hours spent achieving the various design targets.
Concurrent Engineering • 89
Defining products to satisfy the voice of the customer is one way to
ensure customer satisfaction, which has an enormous effect on sales, profits, and shareholder value.117
NOTES
1. James P. Womack, Daniel T. Jones, and Daniel Roos, The Machine That Changed the
World: The Story of Lean Production (1991, Harper Perennial), Chapter 5, pp. 115–116.
2. For more information on customized in-house DFM seminars, see Appendix D or
www.design4manufacturability.com/seminars.htm.
3. James Morgan and Jeffrey K. Liker, The Toyota Product Development System (2006,
Productivity Press), Chapter 4, “Front-Load the PD Process to Explore Alternatives
Thoroughly.”
4. Pankaj Ghemawat, “Finding Your Strategy in the New Landscape: The Postcrisis World
Demands a Much More Flexible Approach to Global Strategy and Organization,”
Harvard Business Review, March 2010, pp. 54–60.
5. Jim Collins, Good to Great: Why Some Companies Make the Leap … and Others Don’t
(2001, Harper Business), Chapter 8, “The Flywheel and the Doom Loop.”
6. Aberdeen Group report, “Product Portfolio Management: Targeting and Realizing
Product Lifecycle Value.”
7. Richard Rumelt, Good Strategy, Bad Strategy: The Difference and Why it Matters (July
2011, Crown Business).
8. Michael L. George, et al., Fast Innovation (2005, McGraw-Hill), Chapter 7, “Spotlight
on Conquering the Cost of Complexity,” p. 167.
9. Tim Brown, Change by Design (2009, Harper Business), p. 77.
10. Cliff Edwards, “The Return on Research: HP’s R&D Productivity Index Shows Which
Projects Have the Biggest Payoff,” BusinessWeek, March 23 & 30, 2009, p. 45.
11. Matthew E. May, The Elegant Solution (2007, Free Press), p. 41.
12. Aberdeen Research, “NPD—The 2011 Growth Imperative” (2010), Chapter 2.
13. David M. Anderson, Build-to-Order & Mass Customization: The Ultimate Supply
Chain Management and Lean Manufacturing Strategy for Low-Cost On-Demand
Production without Forecasts or Inventory (2008, CIM Press), Chapter 8, “On-Demand
Lean Production.” See description in Appendix D.
14. Ibid., Chapter 7, “Spontaneous Supply Chains.”
15. See http://www.design4manufacturability.com/product_line_rationalization.htm or
Chapter 3 in Build-to-Order & Mass Customization.
16. Configurators can automate the processes of determining the feasibility, cost, and
time to do customizations, instead of the time-consuming and less accurate manual estimating. See Anderson, Build-to-Order & Mass Customization, Chapter 8,
“On-Demand Lean Production.”
17. Anderson, Build-to-Order & Mass Customization.
18. Ibid.
19. Anderson, Build-to-Order & Mass Customization, Chapter 8, “On-Demand Lean
Production.”
90 • Design for Manufacturability
20. Anderson, Build-to-Order & Mass Customization. Chapter 10 “Product Development
for BTO&MC.”
21. Ibid., Chapter 9, “Mass Customization,” p. 293.
22. Richard de Neufville and Stefan Scholtes, Flexibility in Engineering Design (2011,
MIT Press).
23. Ibid.
24. Michael McGrath, Michael Anthony, and Amram Shapiro, Product Development:
Success Through Product and Cycle-Time Excellence (1992, Butterworth-Heinemann),
Chapter 11, “Project Team Leadership.”
25. James P. Womack and Daniel T. Jones, Lean Thinking: Banish Waste and Create
Wealth in Your Corporation (1996, Simon & Schuster), Chapter 3, “Flow.”
26. From a study of 153 companies by Jim Brown, The Product Portfolio Management
Benchmark Report: Achieving Maximum Product Value, August 2006, the Aberdeen
Group, available at http://www.aberdeen.com/link/sponsor.asp?spid=30410396&cid
=3359.
27. Womack et al., The Machine That Changed the World, Chapter 6, “Coordinating the
Supply Chain.”
28. Morgan and Liker, The Toyota Product Development System, Figure 5.3, “Effect of
Overburdening Capacity on Development Lead Time.”
29. Satoshi Hino, Inside the Mind of Toyota: Management Principles for Enduring Growth
(2006, Productivity Press), Chapter 3, “Toyota’s System of Management Functions,”
p. 133.
30. John Teresko, “Recapturing R&D Leadership,” Industry Week, August 2006, p. 29.
31. From a 2005 Deloitte study, cited in an Industry Week article on management strategies, May 2005, p. 46.
32. Bill George, Authentic Leadership: Rediscovering the Secrets of Creating Lasting Value
(2003, Jossey-Bass), Chapter 4, “Missions Motivate, Dollars Don’t,” p. 65.
33. Ibid., Chapter 12, “Innovations from the Heart,” p. 137.
34. Ibid., p. 63.
35. “A Giant Awakens,” The Economist, September 11–17, 2010, pp. 81–83.
36. Financial Post, April 20, 2012, http://business.financialpost.com/2012/04/20/
ge-shares-rise-after-profit-revenue-top-wall-street-forecasts/
37. Jeffrey L. Cruikshank, The Apple Way (2006, McGraw-Hill), p. 26.
38. Lee Dongyoup, Samsung Electronics: The Global Inc. (2006, YSM Inc., Seoul, Korea),
Chapter 4, “Research & Development,” p. 83.
39. Morgan and Liker, The Toyota Product Development System, Chapter 4, “Front-Load
the PD Process to Explore Alternatives Thoroughly.”
40. Richard Koch, The 80/20 Principle: The Secret of Achieving More with Less (1998,
Currency/Doubleday), Chapter 4, “Why Your Strategy is Wrong.”
41. Anderson, Build-to-Order & Mass Customization.
42. Morgan and Liker, The Toyota Product Development System, Chapter 4, “Front-Load
the PD Process to Explore Alternatives Thoroughly.”
43. Mark Stefik and Barbara Stefik, Breakthrough: Stories and Strategies for Radical
Innovation (2004, MIT Press).
44. W. Chan Kim and Renee Mauborgne, Blue Ocean Strategy: How to Create Uncontested
Market Space and Make the Competition Irrelevant (2005, Harvard Business School
Press).
45. Anderson, Build-to-Order & Mass Customization, Chapter 9, “Mass Customization.”
Concurrent Engineering • 91
46. Peter Drucker, quoted in the cover story, “The Innovation Gap,” Fortune, December 2,
1991, p. 58. http://money.cnn.com/magazines/fortune/fortune_archive/1991/12/02/
75823/index.htm
47. Patricia Aburdene, Megatrends 2010 (2005, Hampton Roads Publishing), p. xv.
48. Jordan D. Lewis, The Connected Corporation: How Leading Companies Win Through
Customer–Supplier Alliances (1995, Free Press), Chapter 5, “Cooperating for More
Value,” p. 92.
49. Shu Shin Luh, Business the Sony Way (2003, John Wiley & Sons), Chapter 3, “Stay
Ahead: Feeding the Innovation Engine,” p. 94.
50. Patricia Panchak, “The Virtues of Vertical Integration,” Industry Week, September
2003, pp. 50–52.
51. Aberdeen Research, “NPD—The 2011 Growth Imperative.”
52. Brown, Change by Design, p. 26.
53. Joachim Ebert, Shiv Shivaraman, and Paul Carrannanto, http://www.industryweek.
com/companies-amp-executives/driving-growth-through-ultra-low-cost-product-
development, February 23, 2010.
54. Ibid.
55. Brown, Change by Design, p. 31.
56. “Putting Ford on Fast-Forward,” Business Week, October 26, 2009, pp. 56–57.
57. Brown, Change by Design, p. 90.
58. Ibid., p. 89.
59. Ibid., Chapter 6, “Outsourcing vs. Integration.”
60. Jeffrey Liker, The Toyota Way (2004, McGraw-Hill), p. 62.
61. Cruikshank, The Apple Way, p. 38.
62. Lewis, The Connected Corporation, Chapter 5, “Cooperating for More Value,” p. 93.
63. Robert W. Hall, “Medtronic Xomed: Change at ‘People Speed’,” Target, 2004, Vol. 20,
p. 14, http://www.ame.org/sites/default/files/target_articles/04-20-1-Medtronic_
Xomed.pdf.
64. Ibid.
65. George, Authentic Leadership, Chapter 7, “It’s Not Just the CEO,” p. 97.
66. “The New Heat on Ford,” Business Week, June 4, 2007, pp. 32–38.
67. Jim Collins, How the Mighty Fall, and Why Some Companies Never Give In (2009,
HarperCollins).
68. “The Complete Guide to America’s Best Plants,” Industry Week (1995, Penton
Publishing), p. 12.
69. Morgan and Liker, The Toyota Product Development System, p. 193.
70. Lewis, The Connected Corporation, Chapter 13, “Successful Alliance Practitioners,”
p. 273.
71. Joachim Ebert, Shiv Shivaraman, and Paul Carrannanto, http://www.industryweek.
com/companies-amp-executives/driving-growth-through-ultra-low-cost-productdevelopment,February 23, 2010.
72. Ibid., Chapter 4, “Practices for Joint Creativity,” p. 74.
73. Kim B. Clark and Takahiro Fujimoto, Product Development Performance (1991,
Harvard Business School Press), p. 349.
74. Womack et al., The Machine that Changed the World, Chapter 6, “Coordinating the
Supply Chain.”
75. Morgan and Liker, The Toyota Production Development System, p. 185.
92 • Design for Manufacturability
76. Jeffrey Pfeffer and Robert I. Sutton, The Knowing–Doing Gap: How Smart Companies
Turn Knowledge into Action (2000, Harvard Business School Press), p. 23.
77. John Paul MacDuffie and Susan Helper, “Creating Lean Suppliers: Diffusing Lean
Production Through the Supply Chain,” California Management Review, Summer
1997, pp. 118–150.
78. Satoshi Hino, Inside the Mind of Toyota: Management Principles for Enduring Growth,
(2006, Productivity Press), Chapter 1, “Toyota’s Genes and DNA.”
79. Morgan and Liker, The Toyota Product Development System, Chapter 10, “Fully
Integrate Suppliers into the Product Development System,” opening quote.
80. Ibid., p. 181.
81. Michael L. Dertouzos, Richard K. Lester, and Robert M. Solow, Made in America,
Regaining the Productive Edge, 1989, HarperPerennial, p. 71.
82. Morgan and Liker, Chapter 7, The Toyota Product Development System, “Create a
Chief Engineer System to Lead Development from Start to Finish.”
83. Ibid., p. 137.
84. McGrath et al., Product Development.
85. Kim B. Clark and Steven C. Wheelwright, Managing New Product Development and
Process Development: Text and Cases (1993, The Free Press), p. 391.
86. Ibid., p. 534.
87. See the outsourcing article at the author’s website: www.HalfCostProducts.com/
outsourcing.htm.
88. See the offshoring article at the author’s website: www.HalfCostProducts.com/
offshore_manufacturing.htm.
89. Morgan and Liker, The Toyota Product Development System, p. 308.
90. Liker, The Toyota Way, p. 62.
91. Ibid.
92. Ibid., pp. 33–34.
93. Micheline Maynard, The End of Detroit: How the Big Three Lost Their Grip on the
American Car Market (2003, Currency/Doubleday), Chapter 2 on Toyota and Honda,
p. 74.
94. Dan Steinbock, The Nokia Revolution: The Story of an Extraordinary Company That
Transformed an Industry (2001, AMACOM), Chapter 8, “Nokia’s R&D: Focusing and
Globalizing,” p. 209.
95. William Souder, Managing New Products (1987, Lexington-MacMillan).
96. Maynard, The End of Detroit, Chapter 2 on Toyota and Honda, p. 67.
97. Sydney Finkelstein, Why Smart Executives Fail, and What You Can Learn from Their
Mistakes (2003, Portfolio/Penguin Group), Chapter 3, “Innovation and Change,”
p. 60.
98. From a speech by Boeing President, Philip M. Condit, presented May 7, 1993, at the
Haas Graduate School of Business at the University of California at Berkeley.
99. Nanette Byrnes, “Xerox’ New Design Team: Customers,” Business Week, May 7, 2007,
p. 72.
100. Jill Jusko, “Customer Created: Open Innovation, Internet Help Put Customers in the
Product Development Drivers Seat,” Industry Week, March 2007, p. 44.
101. John Westwood and Ian Wood, The Historical Atlas of North American Railroads
(2007, Chartwell Books), “The Last Great Streetcar,” pp. 322–325.
102. “The Complete Guide to America’s Best Plants,” Industry Week (1995, Penton
Publishing), p. 12.
Concurrent Engineering • 93
103. Artemis March, “Usability: The New Dimension of Product Design,” Harvard
Business Review, September–October 1994, p. 144.
104. Sydney Finkelstein, Why Smart Executives Fail: And What You Can Learn from Their
Mistakes (2003, Portfolio/Penguin Group), Chapter 7.
105. Anderson, Build-
to-
Order & Mass Customization, Chapter 6, “Outsourcing vs.
Integration.” Also see the article on outsourcing at www.HalfCostProducts.com/
outsourcing.htm and a discussion of offshoring at www.HalfCostProducts.com/
offshore_manufacturing.htm.
106. Olga Kharif, Business Week Online, “The Hidden Costs of IT Outsourcing,”
October 26, 2003, http://www.businessweek.com/technology/content/oct2003/
tc20031027_9655_tc119.htm.
107. Anderson, Build-to-Order & Mass Customization, Chapter 13. See the section, “Don’t
Lay Off People,” pp. 442–445.
108. Parametric CAD is a key tool of mass customization that allows dimensions to “float,”
with customized data plugged in for various product variations. Once inserted, CAD
drawings can generate CNC machine tool programs through CAD/CAM software.
See Chapters 8 and 9 in Build-to-Order & Mass Customization.
109. Anderson, Build-
to-
Order & Mass Customization, Chapter 6, “Outsourcing vs.
Integration.” Also see the article on outsourcing at www.HalfCostProducts.com/
outsourcing.htmandoffshoringatwww.HalfCostProducts.com/offshore_manufacturing.
htm. Also see recommendations about outsourcing unusual products to free up
resources in Appendix A.
110. Jenna McGregor, “The Chore Goes Offshore,” Business Week, March 23 & 30, 2009,
pp. 50–51.
111. Shu Shin Luh, Business the Sony Way (2003, John Wiley & Sons), Chapter 3, “Stay
Ahead: Feeding the Innovation Engine,” p. 91.
112. Ibid., p. 95.
113. Robert H. Casey, “The Model T Turns 100! Henry Ford’s Innovated Design Suited the
Nation to a T,” American Heritage’s Invention and Technology, Winter 2009, pp. 36–41.
114. James Surowiecki, “Feature Presentation,” The New Yorker, 28 May 2007, p. 28.
115. John Hauser and Don Clausing, “House of Quality,” Harvard Business Review, May–
June 1988; reprint number 88307.
116. QFD for mass customization is presented in Chapter 10 of Build-to-Order & Mass
Customization, pp. 324–328.
117. Chris Denove and J. D. Power, IV, Satisfaction: How Every Great Company Listens to
the Voice of the Customer (Portfolio, 2006); interesting quotes and results summarized
at the end of Chapter 10.
3
Designing the Product
The primary focus of product development should be to develop products,
not the project management concerns that typically dominate product
development efforts, with:
• Early deadlines, which usually discourage thorough up-front work
• Cost “targets,” which can lead to much trouble if teams don’t know
how to meet the targets or if all costs are not included in the measured target
• Development budgets, which rarely include the costs of changes and
firefighting downstream; further, budget pressures can encourage
releasing unfinished or suboptimized designs to manufacturing
• Time-to-market, which is usually defined as the “release” (which
encourages throwing designs over the wall “on time”) or as “first-
customer-ship,” when the first unit that works gets shipped
If the actual product development is done right, it will naturally optimize
the deadlines, total cost, development budget, and time to stable production.
No matter how many times Tom Cruise shouted “Show me the money!”
in the title role of the movie, Jerry Maguire, he and his client weren’t shown
any money until they focused on the activity that achieved the goal instead
of the goal itself. The activity of product development that achieves the
goals is designing the product. This is a design activity, so the focus must be
on optimizing the design.
As discussed in the last chapter, the team must have early and complete
participation of all the specialties and an effective team leader who can
focus and lead the team to design the product to satisfy the voice of the customer and for manufacturability, in the broadest sense, as defined on the
opening page of Chapter 1. In order to design a successful product that satisfies the voice of the customer, the focus needs to be much greater than just
95
96 • Design for Manufacturability
designing something that “works” and then later dealing with cost, quality,
service, regulations, supply chain management, and customer satisfaction.
3.1 DESIGN STRATEGY
In addition to the design specification targets generated by the product definition phase (Section 2.11), design teams should establish optimal design
strategies. These usually focus on making big improvements in manufacturability, quality, delivery, etc.; starting early to solve major problems at
the concept/architecture level; adherence to certain rules and practices and
avoiding certain parts and practices altogether; and maximizing, minimizing, or otherwise optimizing certain practices.
Establishing optimal design strategies will maximize the chance that the
design team will produce a clean, optimized design. If these are not pro
actively established early, undesirable practices may slip into the design
because individual engineers (1) didn’t understand the importance, especially as it affects the big picture, (2) didn’t understand how their work
affects other subassemblies and the product as a whole, or (3) let themselves get boxed into a corner so that the only way out was to fall back on
some suboptimal practice that compromises the product. The following
are design strategy examples.
3.1.1 Designing around Standard Parts
Standard parts lists should be established or adopted early with predefined
goals and expectations for adherence. These standard parts should be
common across many products and readily available over the life of the
product (see Chapter 5).
Designing around standard raw materials can save a lot of money and
improve availability in the plant, especially for expensive or bulky raw
materials. The total cost will probably be less, even if some parts get better
materials than needed.
3.1.1.1 Sheet Metal
If sheet metal can be standardized on one type, then heavy users can buy
that grade in a coil, feed it through straightening rollers, and then cut each
Designing the Product • 97
piece on demand on a programmable shear, thus minimizing shearing
cost, material waste, handling/storing damage, and all the overhead costs
to inventory, and distribute many sheet metal pieces.
3.1.1.2 Bar Stock
If bar stock can be standardized on one type, then machine tools can be
more efficient by avoiding setup delays and costs to change bar stock. A
proliferation of types of stock can incur large inventory carrying costs
and waste valuable space. Many different remnants are hard to keep track
of in inventory management, which can result in perceived shortages,
unnecessary ordering of excess materials, and expensive expediting. In
addition, remnants may not retain identifying grade marks (usually at
the end of bar stock), which would either discourage use or risk use of the
wrong material.
3.1.2 Consolidation
Consolidation of expensive parts/modules will raise order volumes, increase
purchasing leverage, minimize setup changes, reduce inventory for multiple versions, and arrange steady flows or kanbans of the consolidated part
that will be used one way or another. Even if simpler products appear to get
“a more expensive part” than they need, there is great potential for a net
cost savings from greater economies of scale, better build efficiencies, and
less material overhead cost. Total cost measurements (Chapter 7) must be
used to justify consolidation or it may appear to raise material cost.
Consolidation may get the combined order volume over the threshold
that makes available more sophisticated processes, custom silicon, and
dedicated cells or lines. (See the graphs in Figure 5.3, “Standardization of
Expensive Parts.”)
3.1.3 Off-the-Shelf Parts
The off-the-shelf part utilization strategy should be optimized early. One
of the paradoxes of product development is that:
Designers may have to choose the off-the-shelf parts first and literally design
the products around them, or else they will probably make arbitrary decisions that will preclude their use.
98 • Design for Manufacturability
But incorporating off-the-shelf parts early into the design will greatly simplify the design and the design effort (see Section 5.19).
3.1.4 Proven Processing
Proven processing should be designed for. If this is not done properly, then
proven processing cannot be used and special processes will have to be
concurrently developed, with more cost, delays, and risk.
This may be necessary for leading-edge products—and be an element
of a company’s competitive advantage—but it is an unnecessary waste of
resources if it was needed only because designers didn’t know how to
design for existing processes, didn’t follow the design rules for the equipment, or exceeded the equipment’s capabilities.
3.1.5 Proven Designs, Parts, and Modules
Proven designs, parts, and modules should be specified early as a key
foundation of product architecture. A high percentage of complaints, field
failures, recalls, and lawsuits do not involve new features or new technology. Rather, they involve boilerplate functions that should be based on
proven designs, parts, and modules.
For instance, in the automobile industry, the most serious problems and
consequences involve fuel systems, seat belts, steering, brakes, suspension,
tires, and so forth—all subsystems for which wise companies reuse proven
subassemblies. Ironically, these are not the parts that companies are advertising or customers are clamoring for, which are more likely to be things like
styling, sound systems, navigation systems, safety systems, and hybrid drives.
The success of a reuse strategy will be maximized by making reuse a key
design strategy; designing versatile parts, modules, and subsystems that
can be used in many designs over time; encouraging receptivity to reuse
and discouraging the not-invented-here syndrome; and avoiding arbitrary
decisions that can exclude the use of proven design.
3.1.6 Arbitrary Decisions
Arbitrary decisions should be avoided because they will very likely preclude meeting goals, satisfying the design considerations, and taking
advantage of opportunities such as off-the-shelf parts and the reuse of
proven designs, parts, and modules. Avoid arbitrary part choice decisions
Designing the Product • 99
that unnecessarily proliferate part variety and needlessly complicate operations and supply chain management. Avoid the practice of independently
selecting parts for each situation, which leads to a crippling proliferation.
Instead, for each situation, select the best standard parts that have widespread applicability.
3.1.7 Overconstraints
Make sure there are no more constraints than the minimum necessary; for
instance, avoid situations where four points try to determine a plane, four
linear bearings try to guide precise movements, or two parts are aligned
with round pins/bolts in round holes. Overconstraints are costly and can
cause quality problems and compromise functionality because the design
will work only if all parts are fabricated to tight, maybe unrealistic, tolerances. Fortunately, overconstraints are easy to avoid in the architecture
stage by specifying the exact number of constraints that will do the job
(see Guideline A3 in Chapter 8).
One of the reasons for the phenomenal success of Henry Ford’s Model-T
was its ability to handle the uneven roads that existed a century ago. The
solution was an engine that mounted to the chassis on three points and a
chassis that was supported on three points: at both ends of the rear axle
and at the center of the front axle.1
3.1.8 Tolerances
Optimize tolerances by design by:
• Choosing the optimal tolerance, not relying on block tolerances or
arbitrary assumptions
• Specifying all tolerances to be the widest that will still ensure functionality, quality, and safety; don’t use automatic block tolerances
• Analyzing worst-case tolerance situations
• Methodically specifying tolerances with Taguchi Methods™ for a
robust design (see Section 10.2.5)
3.1.9 Minimizing Tolerance Demands
Eliminate the cost, quality, and performance problems of tight tolerances
by identifying tolerance sensitivities and creating designs that are not as
sensitive to tolerances.
100 • Design for Manufacturability
Avoid design approaches that depend on tight tolerances, calibration,
alignment, or parts that have to be matched, screened, or special ordered.
Avoid overconstraints (Guideline A3), which can increase tolerance demands.
Understand tolerance step functions for all contemplated processes to
avoid unknowingly specifying processes that are more expensive than
necessary (Guideline P23 in Chapter 9).
Combine parts (Section 9.5); design machined parts so all dimensions
are machined in the same setup (Guideline P14).
Avoid getting boxed into a corner and “rescuing” the design with tight-
tolerance parts.
Avoid cumulative tolerance stacks. When many stacked parts must
mate with another part or another stack, the tolerances of all parts will be
cumulative for the stack. Solutions include: (1) control the tolerances of all
parts on both sides of the stack; (2) eliminate parts by simplifying product
architecture and combining parts in the stack(s); or (3) drill, clamp, or
spot-weld one set of parts at assembly, assuming that those parts do not
need to be interchangeable; for instance, for structural assemblies.
3.1.10 System Integration
System integration should be optimized early, not after several subassemblies have been independently designed with little regard to how they integrate and interact in the product.
3.1.11 Optimizing All Design Strategies
Do it right the first time so the team will not have to make changes to
correct things. You’re most likely to do it right the first time when enough
time is allocated for thorough up-front work.
Reinventing the wheel can be avoided by cooperatively designing modules and reusing or sharing previous, proven engineering.
Avoid past mistakes by understanding lessons learned from previous
projects (Section 3.3.4). This will require an active effort to investigate,
summarize, and disseminate this information.
Avoid troublesome practices entirely, such as assembling with adhesives
or using liquid locking compound to retain fasteners instead of using easier and more consistent solutions. Instead, use screws or nuts coated with
Designing the Product • 101
retention compound, fasteners with deformed threads, or optimal use of
lockwashers. Be sure to keep in mind service needs and cycle limitations.
Develop a software debug strategy. The choices are (1) make embedded software upgradeable or patchable or (2) make software perfect using
object-oriented programming and basing subsequent code on previously
written and debugged modules (objects).
Vendor assistance is maximized by having preselected vendors on the
design team early to help the team design the product, or, when appropriate, by having the vendors design the parts they will be building.
Variety and customization strategies should be developed and implemented early. Product developments will not achieve their potentials if different efforts focus only on developing many discrete mass-produced products.
Options and upgrades should be designed to be easy to add. Sometimes
upgradeability can be enhanced by simple additions (that cost little more),
such as extra mounting holes, signal ports, power ports, utility capacity,
accessibility, and convenient mounting spaces.
Total cost should be used as the basis for measuring all costs and the
basis for all decisions involving cost.
Establish design practices for procedures, documentation, standards,
new design guidelines, and new design practices for designing for specific
processes. Follow the procedures on an ongoing basis; don’t wait until a
review to start considering procedures.
3.1.12 Design Strategy for Electrical Systems
Complete electrical systems should be optimized at the architecture level.
Wiring and cables are key elements of that architecture and should not be
left as an afterthought.
Optimize architecture for electrical systems by first considering higher
levels of integration (VLSI, custom silicon, FPGAs) to minimize connections between components, speed signal paths, reduce space, and thus
reduce the number of circuit boards.
3.1.13 Electrical Connections: Best to Worst
Maximize the best means to convey signals and power with the highest
reliability and lowest total cost:
102 • Design for Manufacturability
• Best: components are automatically soldered directly to traces on
printed circuit boards (PCBs), which are routinely produced at Six
Sigma quality levels. Examples:
• Components are automatically soldered to a single PCB.
• Multiple PCBs are connected by flex layers, which are actually
layers on all connected boards.
• Second best: PCBs are connected by a standard off-the-shelf card
cage, which also opens options for standard off-t he-shelf boards
for processing, control, I/
O, memory, etc. These have one
mechanical connection per pin, which could be gold plated for
better reliability.
• Third best: Connect PCBs and devices with off-the-shelf cables plugging into standard connectors automatically soldered onto PCBs.
These have two mechanical connections per wire. All connectors
should be polarized to prevent mistakes.
• Standardize all cable connectors throughout the product: one
cable type for each voltage and one type for each signal type, each
with its own unique pin configuration.
• Provide strain relief to protect cables and limit stress on
wires/contacts.
• Fourth best. Ribbon cables, which have four mechanical connections per wire and more failure modes. Ribbon cables should not be
plugged into even-pin-count headers on PCBs, unless a polarizing
feature is included.
• Next to worst. Lugs/pressed-in wires and terminal blocks, which are
time-consuming to wire and prone to manufacturing and installation errors. Further, lugs can loosen over time or cause short circuits
during service. If used, specify color-coded wires or print on wires
to prevent mistakes.
• Worst. Hand soldering. Quality is orders of magnitude worse than
the best.
Other innovative routing techniques include LAN cables for multiplexed signals or a power buss, like a buss bar, power layer on a back
plane, or a shared power cable instead of many individual routings from
the power supply to every power user. Interconnection reliability is even
more important when products are expected to perform with less local
service support.
Designing the Product • 103
Minimize or eliminate extra connections for modularity, shipping, and
service. Try to align necessary connections with module boundaries when
modules are shipped separately. If not possible, specify unbroken cables
and coil them for shipping, either shipped separately or connected at one
end. Concurrently engineer the product and its installation, service, and
repair to minimize the need for extra connections.
All decisions must be based on the total cost for the system; do not present
or review innovative parts and subassemblies outside the system context.
Optimize the trade-offs of serviceability and one-time ease of installation
versus total cost and long-term reliability.
3.1.14 Optimizing Use of Flex Layers
Flex layers consist of many traces in a flexible Kapton® encasement that is
also a layer on all connected boards with components automatically soldered to the traces in the flex layer. This is different than flex cables that
link connectors. Here is how to take full advantage of flex layers.
Early in the architecture stage, develop an optimal strategy to connect
boards to other boards and off-board components and other devices.
Thoroughly explore various interconnect concepts. Thoroughly evaluate
vendors that have experience in your regulatory environment. Preselect a
capable vendor who will work early with your team to optimize the interconnect design; do not try to design this alone and send out for bids.
Opportunities to implement flex layers are more limited after the product is designed. Do not compromise the attempt with inadequate effort,
resources, materials, samples, or vendors. Do not be discouraged by “tried
it; didn’t work” folklore; investigate previous attempts in the context of the
above commitment.
To justify, use total cost numbers for the entire assembly; until total costs
are available, use total cost thinking. Ensure team consensus and management support, including enough calendar time, resources, and budget. If
this is beyond the scope of a single project, spin it off as a research project.
3.1.15 Voltage Standardization
As a system architecture strategy, the number of different voltages should be
minimized and standardized to minimize power supply design complications and allow the use of reliable off-the-shelf power supplies or modules.
104 • Design for Manufacturability
3.1.16 DFM for Printed Circuit Boards
Obey all design rules for printed circuit boards for component placement,
spacing, and layout, and for proper geometries/spacing for pads, holes,
vias, traces, probes, test access, test fixtures, locating features, and stay-out
zones. Violating PC board design rules either induces quality/rework problems for automatic processing or prevents automatic placement/insertion
of components, which then requires hand placement or soldering, which
should not even be considered an option for surface-mounted components.
Avoid overcrowding PC boards by identifying functional density challenges early and proactively pursing solutions at the system architecture
level, such as higher levels of integration (VLSI, ASICs, FPGAs, etc.), more
space-efficient circuitry, more compact components, removing circuitry
that does not have widespread use or value to customers, and so forth.
Ensure automatic placement/insertion of all components possible to
maximize throughput, minimize assembly cost, and minimize the chances
of assembling the wrong component, wrong orientation, or bad insertions/
placements. No hand placement should be allowed for any surface-mount
components. Automatic assembly should be a criteria for component selection, even if auto-placeable components cost more to purchase.
No hand soldering should be allowed because automatic soldering
(reflow or wave soldering) is probably the most refined process in industry, with many operations routinely achieving Six Sigma performance
(around three defects per million). Hand soldering quality is inferior by
orders of magnitude; further, some hand-soldered joints can pass tests in
the plant but fail in the field. No hand soldering should be allowed at all
for surface-mount components.
Component selection criteria should include the ability to be automatically soldered and survive the heat of wave or reflow soldering and cleaning processes, even if these parts cost more to purchase.
Standardize PCB parts to prevent proliferation, because if part variety
exceeds circuit board equipment part capacity, then boards will have to go
through the machines twice with setup changes in between.
Avoid components that need to be screened, matched, calibrated, or
adjusted. These steps add labor cost, increase the manufacturing time, and
create supply chain challenges.
Avoid hand soldering on circuit boards for off-board wiring, bottom-
sided leaded connectors, unusual components, etc. Instead, find auto-
solderable components.
Designing the Product • 105
3.2 IMPORTANCE OF THOROUGH UP-FRONT WORK
The process of optimizing product architecture starts with an early balance of all design considerations by a complete multifunctional team.
Optimizing product architecture is the highest leverage activity in product development and has the greatest potential for ensuring success. But,
as with product definition, the importance of this stage is often ignored by
merely assuming that the product architecture will be the same as previous or competitive products.
One of the biggest causes of suboptimal product architecture starts with
the seemingly innocuous step of building a breadboard “just to see if it
works.” Breadboards are designed to prove functional feasibility and are
usually built with the materials on hand (not widely available production-
grade materials) in the most expedient way (not the most manufacturable
way). Further, breadboards are built by prototype technicians, who can
usually make a single unmanufacturable unit work as a matter of pride.
Product architecture optimization and manufacturability are rarely even
considered at the breadboard phase, based on the assumption that those
tasks will be done “later.”
Unfortunately, once the breadboard “works” and is demonstrated to
management or customers—you guessed it—there is a strong temptation
to “draw it up and get it into production.” The unfortunate result is the
company ends up mass-producing breadboards forever! Basing production designs on breadboard architecture misses the biggest opportunities
to make significant reductions in cost and development time.
As shown in Chapter 1, 60% of a product’s lifetime cumulative cost is
determined by the concept/architecture phase of a project (Figure 1.1). By
the time design is completed, 80% of the lifetime cumulative cost is determined. By the time the product reaches production, only 5% of the total
cost can be influenced. This is why cost reduction efforts can be so futile,
because cost is really determined by the design itself and is very difficult
to remove later.
Similarly, other important design goals, such as quality, reliability, serviceability, flexibility, customizability, and regulatory compliance are
most easily achieved by optimizing the product’s architecture.
Thorough up-front work greatly shortens the real time-to-market and
avoids wasting time and resources on firefighting, change orders, and
ramp problems, as shown in Figure 3.1.
106 • Design for Manufacturability
Typical Time Line
Firefighting & Change Orders
Ramp
Design
Concept
Architecture
Concurrent Engineering Time Line
Stable Production
in Half the Time
FIGURE 3.1
Traditional vs. front-loaded time lines.
The time to stable production can be cut in half because of the thorough
up-front work, which minimizes the need for firefighting and change
orders and makes the manufacturing ramp-up several times faster. Note
that the concept/architecture phase went from a trivial amount in the
traditional model to an order of magnitude more in the concurrent engineering model. More thorough up-front work decreases the post-design
activities from almost three-fourths to less than one-half of the product
development cycle. It is more efficient to incorporate a balance of design
considerations early than to implement them later as changes.
Figure 3.1 emphasizes one of the most important principles to reduce
the real time-to-market: thorough up-front work. This graphic, and its
profound implications, generate much discussion in the author’s in-house
DFM trainings.2 In fact, at one Fortune 50 company, we spent an hour
discussing this graphic at all four seminars.
While developing the Prius, the Toyota team avoided the temptation to
jump right into detailed design:
“With the extreme time pressure, the temptation would be to make a very
fast decision on the hybrid technology and get to work on it immediately.
Instead, the team reexamined all its options with painstaking thoroughness, … considering 80 hybrid types and systematically … narrowing it to
10 types. The team carefully considered the merits of each of these and then
selected the best four. Each of these four types was then evaluated carefully
through computer simulation. Based on these results, they were confident
enough to propose one alternative, … six months later.”3
Designing the Product • 107
As engineers and managers realize the importance of thorough architecture optimization, they ask what more should be done in the order-of-
magnitude increase in the concept/architecture phase shown in Figure 3.1
and how this can actually reduce the final timeline so much. The key elements of an optimal architecture phase are described here.
Product definition defines what the customer really wants and minimizes the chance that the product will be subject to change orders to
reflect new customer needs that were not anticipated in the beginning.
Lessons learned should be thoroughly investigated and understood to
learn what worked well and what caused problems in previous projects
(see Section 3.3).
Issues should be raised and resolved before proceeding further, thus
minimizing the chances that these issues will have to be resolved later
when each change is harder to implement and when each change may, in
turn, induce yet more changes.
Concepts should be simplified with clever, elegant designs, fewer parts,
part combinations, higher levels of silicon integration, modular opportunities, and so forth. Design efforts with ambitious cost goals may need
help from design studies to generate breakthrough ideas.4
The architecture should be optimized for the minimum total cost, for
designed-in quality and reliability, for manufacturability and serviceability, and for flexibility and customizability.
Don’t compromise the up-
front work by rushing into design for
the illusion of “early” progress because up-front work is unfamiliar, or
because of temptations or pressures to launch the first working prototype
into production.
3.2.1 Thorough Up-Front Work at Toyota
The 2006 book, The Toyota Product Development System, emphasized the
importance of thorough up-front work at a company that some say is four
times more efficient than the typical product development process.
“The ability to influence the success of a product development program
is never greater than at the start of a project. The further into the process, the greater the constraints on decision making. As the program progresses, the design space fills, investments are made, and changing course
becomes increasingly more expensive, time consuming, and detrimental
to product integrity.”5
108 • Design for Manufacturability
The book provides many details about “bringing together your brightest, most experienced engineers from all functional disciplines to work collaboratively, thoroughly thinking through all of the critical project details,
anticipating problems, applying lessons learned, creating precise plans,
and designing countermeasures from a total systems perspective… .”
3.2.2 Thorough Up-Front Work at Motorola
Motorola’s most effective product development projects “invested relatively large amounts of effort early in the initial design phase so that most,
if not all, of the problems that appeared later in the implementation phases
had already been considered.”6
3.2.3 Thorough Up-Front Work at IDEO
Contrary to the apparent paradox, IDEO firmly believes that if they build
many models early, it will “slow us down to speed us up. By taking the
time to [model] our ideas, we avoid costly mistakes such as becoming too
complex too early and sticking with a weak idea for too long.”7
3.2.4 Avoid Compromising Up-Front Work
Make sure the following problems do not compromise thorough up-
front work.
3.2.4.1 Slow Processes for Sales and Contracts
Make sure that a slow sales and contract process does not delay the start
of product development, especially for fixed delivery deadlines. Encourage
customers to decide quickly and order early. Streamline the sales and contract process. Avoid contractual delays because of cumbersome or onerous
terms and conditions. Plan ahead to start NPD as early as possible, even
before the formal signing of a likely contract or award.
3.2.4.2 Rushing NPD for Long-Lead-Time Parts
When designs are based on parts with long lead times, the product’s
up-front work may be shortened to make time for their delivery before
Designing the Product • 109
launch. The solution would be to eliminate long-lead-time parts with the
techniques described in Section 5.19.2.
3.2.4.3 Rushing NPD for Early Evaluation Units
Similarly, pressures for early evaluation units could shorten the early up-
front work. See solutions in the next section.
3.2.5 Early Evaluation Units
Early evaluation units are sometimes needed for qualifications, alpha tests,
beta evaluations, trade shows, contractual obligations, or test markets, but
hopefully not to get late customer feedback.
First, do all the thorough up-front work for the good of the overall project, but add the goal that some form of evaluation units can be delivered
early. Make sure there are enough resources available.
Avoid the temptation to compromise the up-front work just to get units
out early. Be careful that the structure of the early units does not specify or
imply suboptimal product architecture of the production units.
Prove the feasibility of the functionality with a physical evaluation unit
without necessarily achieving all the space, shape, interface, or weight
constraints while, for contracts, presenting plans to achieve these goals in
the production units
Maximize the proportion of time spent on the concept/architecture
phase by accelerating early the unit design and building process with parametric CAD, modular design, rapid prototyping, additive manufacturing,8
short-run vendors/partners, expedient tooling, or extensive “hogging” on
CNC machines that would be replaced with more cost-effective processes
in high-volume production. Two especially effective techniques are
• The SWAT team. Use skilled technicians to build, test, and validate
evaluation units quickly, making sure they feed back lessons learned
promptly to the design team.
• The parts store. If part delivery time for the evaluation units is so long
that it threatens to shorten thorough up-front work, order all the
possible part candidates before the BOM finalizes. These may appear
to add cost or may not have an obvious funding source. However,
getting these units out earlier will generate much more money in
110 • Design for Manufacturability
increased profits. Actually, many of the parts in the “store” might be
obtained at no cost as samples, which suppliers would gladly provide
for free just to have their parts considered.
Keep track of the total cost and resource demands and make sure these
provide the basis for planning and estimating, bidding, and negotiations
on subsequent projects.
3.3 OPTIMIZING ARCHITECTURE AND SYSTEM DESIGN
Figure 1.1 shows that 60% of the product’s lifetime cumulative cost is
committed by the concept/architecture phase. Similarly, this phase has
the most significant effect on quality, reliability, serviceability, flexibility,
customizability, etc. The graphs in Figure 2.1 show that thoroughly optimizing the architecture phase results in faster ramps and eliminates post-
release problem solving for volume, quality, and productivity. Similarly,
Figure 3.1 shows that the real time to market can be cut almost in half with
thorough up-front work, by spending a third of the timeline on optimizing architecture instead of rushing through that phase.
The following subsections detail important steps to take to optimize
product architecture.
3.3.1 Generic Product Definition
Thoroughly understand what customers want—the “voice of the customer”—with optimal design specifications and resource allocations
before starting the design process. Make sure the product definition
(requirements document) is generic and does not specify, imply, or limit
product architecture. Be sure to address and satisfy all aspects of the product requirements.
3.3.2 Team Composition and Availability
Make sure the product development team is complete, with all specialties
available for immediate and sustained deployment.
Designing the Product • 111
3.3.3 Product Development Approach
The team must understand and agree on the new product development
approach (presented herein), especially those aspects that are different
from the way things were done in the past.
3.3.4 Lessons Learned
Avoid past mistakes by understanding lessons learned from previous
projects and formulate appropriate action plans. Without this, the only
“lessons” considered may be from the memories of individuals who are
assigned to the design team.
The consequences of ignoring lessons learned are significant delays and
wasted resources, which in turn will delay other projects and deplete their
resources while expending more development cost for all projects.
The effort should focus on all relevant lessons, not limited to reactions to
high-profile issues. Thoroughly investigate and understand what worked
well and what caused problems in previous projects with respect to development time and effort, functionality, quality, ramps, and so forth.
3.3.4.1 Categories of Lessons Learned
• Product development lessons, such as causes of change orders, delays,
budget overruns, requalifications, and the quantification of all cost
categories (the total cost of the product)
• Build lessons, such as difficulties in fabrication, assembly, test, quality assurance, and delivery
• Performance and reliability lessons
Quality and reliability lessons can be visually prioritized by plotting issue
frequency versus severity using the format presented in Figure 10.1.
3.3.4.2 Methodologies for Lessons Learned
There are three methodologies to understand lessons learned: databases,
investigations, and presentations.
112 • Design for Manufacturability
Databases: The company should compile, manage, and distribute summaries of lessons learned in databases. Until then, a database expert
or a team member can investigate the data in company databases,
summarize the lessons, and present them to the team.
Toyota uses one-page summaries and engineering checklists to
accumulate “the knowledge base reflecting what a company
has learned over time about good and bad design practices,
performance requirements, critical design interfaces, critical
to quality characteristics, manufacturing requirements, as
well as standards that commonize design.”9
Investigations: Team members can investigate lessons learned about previous projects by interviewing people and acquiring data from past
projects. As follows, the team should (1) investigate, (2) present in Pareto
order, and then (3) formulate and implement prevention strategies:
What worked; what did not.
Causes of firefighting or change orders on the traditional timeline in Figure 3.1. For each cause, ask if it was preventable.
Causes of delays.
Summaries of cost of quality: defects, scrap, rework, field failures, etc.
Presentations: Presentations from in-
house people and vendors
10
involved with previous projects (arranged by the team to be presented to the team) from the following groups, who should show
parts that are examples of good and bad design practice:
Manufacturing engineering
Procurement and key off-the-shelf part suppliers
Vendors/partners, who are especially effective if they have built
your custom parts before
Quality/reliability
Field service/installation
Causes of change orders and firefighting
Based on all this, action plans are developed to leverage what was good
and avoid what was bad. Keep learning and improving all throughout
the project.
3.3.5 Raising and Resolving Issues Early
The MIT study, The Machine That Changed the World,11 summarized that
in the best Lean projects: “… the project leader’s job is to force the group
Designing the Product • 113
to confront all the difficult [issues] they’ll have to make to agree on the
project.” According to team-building expert Patrick Lencioni, team members must overcome any fear of conflict12 to openly and effectively raise and
resolve issues. And a Harvard Business Review article cited a survey that
stated that, “Surprisingly, the most common reason for withholding input
is a sense of futility rather than a fear of retribution.”13
3.3.5.1 Project Issues
Each design team should candidly ask the following questions:
• Is there a reasonable chance of achieving the project goals in the
scheduled time, given the allocated budget?
• Will the project receive enough resources to accomplish its goals?
Will they be allocated early enough?
• Are there any red flags? For instance, is the product definition stable
or does it keep changing?
• Are cost and time goals based on bottom-line metrics such as total
cost and time to stable production? If goals are based on the wrong
metrics, the design team may be encouraged to specify cheap purchased parts, go for low-bid vendors who won’t help teams design
their parts, let labor cost dominate sourcing and plant location decisions, or not optimize product architecture and throw the design
over the wall to manufacturing “on time.”
3.3.5.2 Team Issues
Each design team should address all the team issues. For instance, the
team should discuss lessons learned from previous projects and formulate
appropriate action plans. Team members should thoroughly understand
the risks from the lessons learned, including:
• Risks that were mitigated early. How was that done?
• Risks that could have been mitigated early. How could that be done now?
• Risks that were not mitigated. What were all the consequences and
associated costs?
Upon discovering unresolved issues, everyone should immediately raise them
to the appropriate level.
114 • Design for Manufacturability
3.3.5.3 Mitigating Risk
Discuss and mitigate risk issues, for instance:
• Are new product and process technologies proven enough and
refined enough to incorporate into new designs and production?
• Are there multiple sources of risk regarding new product technologies or new manufacturing processes?
• How much does success, cost, and time depend on entities and
developments not under the control of the development team, such
as partners, suppliers, outsourcing, regulations, etc.?
• Are there supply chain risks such as bidding or multiple sources versus vendor partnerships?
• Will “cost reduction” directives compromise part quality, early vendor participation for custom parts, resource availability to ensure a
complete team, or concurrent engineering itself if manufacturing is
done far away?
3.3.5.4 New Technologies
Raise and thoroughly investigate new, unproven, or historically troublesome technologies, parts, processes, features, user interfaces, and so forth.
Before deciding, thoroughly investigate all issues to ensure that all risk
can be mitigated before pursuing. Make sure there is enough time and
resources to do this.
Investigate and verify quality, reliability, manufacturability, usability,
total cost, and functionality in all user environments by the expected
range of users. Thoroughly investigate suppliers’ application guidelines; if
not well documented, contact suppliers’ application engineers. Investigate
the history, reputation, and financial strength of suppliers. Ensure availability of all parts throughout the life of the product.
3.3.5.5 Techniques to Resolve Issues Early
Some things you can do to resolve issues early include:
• Research. Make sure that technical feasibility studies do not specify
or even suggest suboptimal product architecture.
• Experiments with statistical significance ensured by design of experiments (DOE), which should also be used for prototype testing, first
article and beta test evaluations, pilot production, and tolerances.
Designing the Product • 115
• Enlist experts, such as those available from consulting associations
like PATCA.org (which has 350 technical experts in Silicon Valley)
or research services like Guideline.com (formerly TelTech), who can
do research and provide access to 3,000 consultants that are experts
on 30,000 specialties.
• Simulations, both for the product and the processing.
• Risk analysis and management.
• For critical applications, conduct failure modes and effects analyses (FMEAs).
• Make early models and rapid prototypes.
3.3.5.6 Contingency Plans
Formulate “Plan B” contingency plans to deal with the most likely changes,
setbacks, delays, shortages, or other problems regarding technology, processing, customers, markets, regulation, and so forth. For instance, products can be designed to readily accept the “Plan B” part if the “Plan A” part
doesn’t work out or is not available in time.
3.3.5.7 Achieving Concurrence before Proceeding
Another MIT study, Made in America: Regaining the Productive Edge, gave
additional insight into Japanese product development project management:
“A key task of the manager is to make sure that all disagreements are aired
and resolved at the outset. Achieving consensus takes a great deal of effort,
but by skillful management at this point it is possible to gain the full commitment of all members of the program team so that subsequent progress
is very rapid.”14
At the Xomed division of Medtronic, “Xomed works harder validating
process at each stage of a project, which forces them to ask the right questions
earlier and earlier, and wastes less overall project time by reducing the number of bad assumptions made to compensate for incomplete information.”15
3.3.6 Manual Tasks
High quality is hard to achieve by manual tasks, such as manual component placement and soldering, whereas automated processes, like PC board
assembly and CNC machining, routinely reach Six Sigma quality levels.
116 • Design for Manufacturability
Manual tasks are expensive for the assembly people and support people
to train them, develop work and quality standards and procedures, fix
quality problems, and implement change orders. These support demands
keep manufacturing and quality people from helping multifunctional
teams develop new products.
Manual tasks are hard to scale up quickly. People with the right skills
would have to be found, hired, and then trained how to build company
products. All these problems, costs, and delays rise exponentially with
higher levels of skill and judgment required, for incomplete documentation. Documentation shortcomings rely on operators’ memories, personal
notes, or verbal queries to compensate.
Before trying to implement the use of robots to perform manual tasks,
investigate ways to eliminate such tasks with standard CNC machine tools.
3.3.7 Skill and Judgment
There are two main risks with designs that need too much skill and
judgment:
1. Needing skill and judgment presents the possibility for errors, so
where that is possible, skill and judgment should be eliminated by
design with poka-yoke (Section 10.7).
2. If the design requires skilled, experienced people, it will be (1) hard
to ramp up and (2) hard to set up at new factories, especially in other
countries.
To eliminate the need for skill and judgment:
• Minimize parts by using simplified design; combined, monolithic
parts; and off-the-shelf assemblies that come assembled and ready
to go.
• Ensure instructions are obvious, intuitive, graphical, animated, and,
if text, in the language spoken on the floor.
• Ensure simple production machine–user interfaces that don’t require
computer skills; for instance, using bar codes to change machine settings.
• Avoid manual alignment, complicated procedures, calibration,
tricky tasks, etc.
• Incorporate self-locating parts, preferably not needing fixtures. If
necessary, concurrently design fixtures to ensure orientation, alignment, etc.
Designing the Product • 117
• Avoid liquid thread-lock; thoroughly pursue alternatives, such as
self-locking fasteners.
• Avoid liquid sealant (see Guideline A10 in Chapter 8) and any need
for tape, glue, etc.
• Avoid judgment needed on wire routing.
• Avoid blind assembly of fasteners.
• Incorporate poka-yoke to mistake-proof assembly (Section 10.7)
with standard parts and processes that can’t be confused, symmetrical parts that can’t be put in backwards, polarized connectors
(especially when headers with even numbers of pins are used as connectors on printed circuit boards), and readily available standard
tools and standard torque settings.
• Avoid screening or matching parts.
• Eliminate the skill demands and quality problems of hand soldering
and wiring lugs.
3.3.8 Technical or Functional Challenges
If there are significant challenges for new technology, functionality, or
regulatory compliance, the easiest way engineers can ensure DFM is to
avoid arbitrary decisions that might compromise manufacturability and
then require changing the solution for DFM, which, in turn, may compromise the solution that solved the challenges.
Ensure optimal manufacturability by design the first time to remove
that variable so that once the technical challenges are solved, the design
can go into production and won’t have to be redesigned for manufacturability, cost, quality, and so forth.
Given the value of solving challenges and the cost of troubleshooting,
start out with the highest quality components, to eliminate those variables.
Do not try to minimize BOM costs while solving difficult challenges. Even if
those parts appear to cost more, the total cost will be less. Understand the
challenges enough to commit enough money, resources, and time.
Thoroughly understand all ramifications of the technology for its
intended use in the anticipated environment. Explore many ways to achieve
the goals. Don’t limit thinking to just extending conventional approaches.
Big leaps forward may require research projects to develop next paradigm
solutions for many subsequent projects, rather than trying to handle escalating challenges with each product development project. Rather, commission research to proactively generate solutions—and commercialize
118 • Design for Manufacturability
them (see next section). A “best of both worlds” approach to introducing
innovation would be to develop new modules that can be introduced on
existing products and then become the basis of next-generation products.
When a breakthrough may come from new or innovative components or
materials, commit the time and effort to research alternatives, evaluate
samples, and qualify the components.
Thoroughly raise and resolve all relevant issues in the architecture
phase. More resources can be applied early if they do not have to fight fires
on other projects because they were not designed for manufacturability.
Don’t accept potentially naïve customer expectations for functionality,
cost, and deadlines. When appropriate, convey to the customer or prime
contractor how minor changes in the specs could significantly lower risk,
cost, and time. Look out for arbitrary decisions that would make your job
more difficult.
For major challenges, be sure a reasonable return can be expected based
on total cost numbers, and be sure to allot enough resources and calendar time.
3.3.9 Commercialization
Before anything can be launched into production, it may need to be
commercialized16 to preserve the “crown jewels” with the rest designed
for manufacturability. Commercialization may need to be applied to new
product designs, research, experiments, breadboards, prototypes, patents,
and acquired technologies.
The crown jewels are the technology that is the basic premise of the
innovation or the essence of what has been proven. Without changing
the proven functionality, the parts and subassemblies surrounding the
core technology and supporting systems are designed or redesigned for
the best manufacturability, cost, quality, and time-to-market while being
integrated into an optimal product architecture.
For key modules, commercialization should be done early, so remove
that from the product development timeline.
With this in mind, write a description of the functions that capture the
essence of the crown jewels, but are worded in generic language that leaves
everything else open for optimizing the design for lower cost and better
manufacturability, delivery, quality, and reliability.
Designing the Product • 119
3.3.10 Manufacturable Science
There is a temptation for scientists to specify the design or the process
which will “work” or may have been “optimized” only for functional
parameters and then throw it over the wall to the design engineers to build
products or machinery that perform the specified process. Although this
is common for experimental equipment at research labs or aerospace contractors (where equipment cost is buried in much larger research budgets),
this approach will rarely result in the lowest cost and quickest development for cost-sensitive commercial products.
Instead, scientists should (1) understand all the issues regarding manufacturability and how problems with manufacturability affect functionality, quality, reliability, purchase cost, cost-of-ownership, and, ultimately,
success; and (2) work closely with the multifunctional team members, from
the earliest stages, to develop the practical science and robust processes
that will work consistently in all anticipated environments and be easily
manufacturable from readily available components and materials. When
scientists specify parts, they should work with purchasing to look for a
range of potential solutions and then narrow the search to the ones with
the best cost, reliability, and availability.
3.3.11 Concept/Architecture Design Optimization
Concept/architecture design optimization is to be performed concurrently
with manufacturing and supply chain strategies (Section 3.3.14). Establish
design strategies with respect to design practices, such as standard parts,
off-the-shelf parts, proven processing, reuse, avoiding arbitrary decisions,
doing it right the first time, avoiding past mistakes, early vendor assistance, customization, and thorough concept/architecture optimization.
Thoroughly optimize the concept/architecture of the product, not just
a collection of parts and subsystems. This phase provides the greatest
opportunities for innovation and substantial cost reduction and ensures a
quick ramp to volume production.
Keep focusing on the architecture, without designing a lot of detail,
which may become obsolete as the architecture evolves. If necessary, keep
a list of “loose ends” to finish after the architecture is optimized. Both
engineers and managers need to avoid the trap of trying to “wrap up” certain parts or subsystems prematurely.
120 • Design for Manufacturability
Focus on generating many concepts, not making only a few detailed
designs or models. Document all ideas: save or print with meaningful
labels, file names, and layer names. For sketches, keep dated copies of all
ideas. If related ideas build on the same sketch, make a dark-line copy of
the sketch for the records and then change the sketch to the next idea.
Repeat as necessary.
Don’t ignore obvious aspects of the design, since all aspects affect the
system design. On the other hand, don’t ignore vague aspects of the design,
since again, all aspects affect the system design.
Build models, when applicable, to demonstrate or compare concepts.
Companies such as McMaster-Carr have vast arrays of parts and materials available from stock for model building. McMaster-Carr’s website
(www.McMaster.com) has hundred of links, each of which lets you narrow down the search by many parameters. However, never specify model
building or lab parts for production products. Make sure unsuitable parts in
prototypes never get into production bills-of-material.
3.3.12 Optimizing the Use of CAD in the Concept/
Architecture Phase
Lay out drawings for easy editing: Leave entities in forms that are easy to
edit. Defer tasks to join structural members (union, combine, etc.) until
the concept has finalized; you may want to modify or replace one of the
separate elements.
Optimize data and the drawing “origin” (0,0,0). Extend (extrude) cubes
and cylinders from the optimal plane so that the ones mostly likely to
change dimension can be easy to change later without redrawing. For
instance, a centered shaft would be drawn as two adjacent half shafts so
that each half shaft could then be lengthened or shortened and the overall
shaft would always remain centered.
Don’t be a purist about only using the most advanced technology; sometimes the fastest progress can be made by printing out what you have
drawn in CAD (parts, grids, boundaries, or dimension lines) and sketching the next detail, and then repeating.
Omit details (bolts, etc.) until the concept has finalized; keep a list of
what was omitted. Save “obsolete” details to an “extra parts” layer, which
is normally turned off. Leave “ghosted lines” and construction lines in;
concepts change often and you may need them for the next change.
Designing the Product • 121
3.3.13 Concept Simplification
Explore many potential concepts and approaches to optimize system
architecture. Use creativity (Section 3.6) and brainstorming (Section 3.7)
to generate many ideas.17 Don’t be limited by your current products or
competitors’ products. Don’t latch onto the first idea to come along.
Strive for design simplicity by minimizing the number of parts and process steps and optimizing decisions on part combinations, off-the-shelf
parts, and, in general, the simplest architecture.
Brainstorm for many ideas. Look for breakthrough ideas that would
revolutionize the industry, even if that is not the project’s stated goal.
“Toyota considers a broad range of alternatives and systematically narrows the sets to a final, often superior, choice.”18 At Sony, “thirty engineers
in Ibuka’s [Sony co-founder’s] team began exploring multiple approaches
to color simultaneously,” eventually converging on three electron beams
from a single gun, which became the revolutionary Trinitron.19
Try to simultaneously optimize all the goals and satisfy all the constraints. Sometimes considering multiple goals and constraints can overcome design paralysis and avoid arbitrary decisions. This results in faster
progress and better solutions than trying to solve one challenge at a time.
If a particular idea doesn’t work out, look for more ideas to make it work.
If that doesn’t work, go back and make the original idea better or generate a better idea. Obstacles to individual problems might be overcome by
expanding the scope of the idea to simultaneously solving several problems. For instance, a solution that appears to be too expensive to solve one
problem may be justified if it solves three.
At Toyota, generating many ideas presents patterns and possibilities.
This provides more opportunities to combine these ideas and multiply
them into bigger ones.20 And, contrary to popular belief, a steady stream
of incremental innovation is what is most likely to lead to “the big idea.”
A Fortune article about 3M noted, “3M has never been about inventing
the Next Big Thing. It is about inventing hundreds and hundreds of Next
Small Things, year after year.”21
Formulate the off-the-shelf strategy (Section 5.19) early because off-the-
shelf parts need to be chosen before arbitrary decisions preclude their use.
After the optimal set of off-the-shelf parts is selected, the rest of the design
will be designed around them. Optimal off-the-shelf utilization allows
the design team to focus on optimizing the architecture and designing the
remaining parts. It also helps the design team meet its goals for the lowest
122 • Design for Manufacturability
total cost, quickest development, best quality, proven reliability, and lowest risk of problems or delays.
Formulate the strategy of what to leverage from previous designs and
which designs, processes, and practices to avoid. This may require additional investigations and experiments.
Optimize integration of parts and their assembly, interfaces, wiring,
cabling, and part/subsystem interactions. Decide on the level of standardization; create or adopt standard parts lists. Formulate strategies for part
combinations and silicon integration (VSLI, ASICs) in support of strategies for product families and standardization.
Formulate the strategies for ensuring quality, reliability, mistake-proofing,
repair, service, and test, including optimizing test points. Formulate the
design strategy for variety, configurations, customization, derivatives,
foreign versions, and subsequent products.
Optimize software configurability, with all hardware installed and easily accessible ports. Add flash memory into slots or build in enough memory for the most demanding version. Use standardized parts big enough to
handle many product versions and variable parts or modules that can be
plugged into universal connectors, with enough connectors provided for
the most demanding version.
Structure architecture with variety provided by interchangeable modules. Adopt industry-standard interfaces or establish versatile interfaces.
Developing versatile products, with extra parts and capacity, costs less
than multiple versions. Ensure the product has enough space, connector
openings, and utility capability.
Use parametric CAD (Section 4.6.5). Universal parametric templates
can be created ahead of time for families of parts and structured so that,
when the customized dimensions are plugged in, the floating dimensions
are stretched and the drawing transforms into a customized assembly
drawing, which automatically updates customized part drawings and
documentation. Dimensional customization can be performed quickly
and cost-effectively using a combination of CNC machine tools and
parametric CAD. Another use of parametric CAD is to quickly show how
changing a parameter impacts the system.
3.3.14 Manufacturing and Supply Chain Strategies
The following manufacturing and supply chain strategies are to be done concurrently with concept/architecture design optimization (see Section 3.3.11):
Designing the Product • 123
• Formulate processing strategies, including the process selection and
the flows of parts and products, the manufacturing plan (what is manufactured where), and flexible cell/line design for product families.
• Formulate the resupply strategy for parts and raw materials:
MRP-based purchase orders or steady flows, kanban, min/max, or
breadtruck (free stock).22
• Optimize outsourcing and internal integration decisions23 and identify the supplier base for parts and materials.
• Formulate the vendor strategy for nonstandard parts and outsourcing; identify potential vendor partnerships early and arrange for
early participation on the design team.
• Formulate the strategies for quality and reliability assurance and test.
• Incorporate mistake-proofing (poka-yoke) into the design to prevent manufacturing errors by design features, and into the processing to make sure manufacturing errors don’t happen in fabrication
or assembly.
• Formulate the manufacturing strategy for customization, configurations, product variety, extensions, and derivatives.
• Arrange for relevant overhead allocations (if not automatic through
total cost accounting) to (1) prevent new products from having to
pay the high overhead charged to pay for less manufacturable products and (2) encourage behavior that further lowers overhead costs.
3.4 PART DESIGN STRATEGIES
Strategies for designing parts and subassemblies (hereafter called parts)
include:
• Ensure product architecture and the conceptual product design have
been optimized before designing any parts.
• Thoroughly pursue off-
the-
shelf (Section 5.19) and modularity
(Section 4.7) opportunities as explored in the architecture phase
before attempting to design any parts.
• Design the most pivotal and challenging parts first. Otherwise, the
design of less-challenging parts may result in arbitrary decisions
that may compromise the most challenging designs.
124 • Design for Manufacturability
• Design all parts to support the system design and work well together
by design. Don’t just design a collection of parts that may be hard to
integrate later. Don’t structure the project management into independent part or subassembly design efforts.
• Allocate appropriate effort to the design of various parts and sub
assemblies according to customer input, as graphed in Figure 2.3 and
calculated in one of the bottom lines of the QFD chart (Figure 2.5).
• Understand lessons learned about similar parts, including manufacturability issues and reliability track records.
• Understand the potential processes that will manufacture the parts. If
multiple processes are candidates, investigate and understand all the
processes; talk with appropriate vendors to help make the best decision.
• Collaboratively design parts with vendors who know the design rules
for those processes, in general, and the process capabilities of their own
equipment. For vendor-assisted design to be possible, vendors must be
chosen first based on reputations and relationships. The primitive paradigm of part bidding precludes vendor-assisted design, by definition,
because the part would have to be designed before potential vendors are
asked to bid on it (see Section 6.11 on the shortcomings of low bidding).
• Cost strategy should be focused on minimizing the total cost of the
product or product family. In some cases, seemingly more expensive
parts may result in better quality and be more standardized, thus
resulting in cost-saving synergies in supply chain management and
operations. Don’t compare new designs to previous designs on a part-
to-part basis, because that may discourage part combination strategies
where, for instance, two new parts replace five old parts (Section 9.5).
If the design of any part starts to run into trouble, immediately notify
the rest of the team, who are still designing the rest of the product around
that part. Then, the team can help get that part design back on track or
quickly adjust the system design to accommodate changes in that part
design. Toyota’s product development process emphasizes transparency, as
summarized by a senior executive: “If you have a problem, you’d better tell
somebody, because eventually you will be found out.”24 Phil Condit, when
he was chairman and CEO of Boeing, spoke on this problem of individual
engineers running into trouble, not telling anyone, and stubbornly trying
to fix it alone. The result, as Phil Condit postulated, might be that the airplane manufacturer would have to go to the airlines and say: “You know
Designing the Product • 125
that plane you wanted to fly nonstop to Sydney—well, its range is going to
come up about 500 miles short!”25
Complete all part designs and documentation. In the rush to get proto
types built, many companies use “expedient” documentation (e.g., sketches)
or no documentation at all (e.g., verbal instructions), which can result in
miscommunications and delay ramping into production where complete
documentation is needed. Further, not fully completing and submitting
CAD designs eliminates the opportunity to perform CAD assembly integration and error-checking, for instance, for interferences between parts.
In extreme cases, designers may leave certain details “to be determined”
by production workers! In one company, production line workers had to
go to the local Lowe’s hardware store to buy bolts for structural elements.
Of course, this type of situation can lead to significant variations from the
design intent, thus resulting in performance, quality, and even product
liability ramifications.
Be sure to adhere to the following documentation principles:
• Ensure all documents are 100% complete. Consequences of incomplete documentation include: Local production people seeking more
information from those who know, but information may be verbal
and thus not correct documentation deficiencies. Many companies
seem to get along with these documentation shortcomings until they
outsource, which is worse when going offshore. Communications to
offshore plants may be limited to only one email per day. Translations
and misunderstandings can add even more delays. Production people
may guess, interpret drawings, or make assumptions. If production is
at a contract manufacturer, then, in order to get paid, the CM must
“build to print” and their customer must pay, even if the parts don’t
work because of the customer’s documentation problems.
• Ensure all documents are 100% correct and accurate. Consequences
of incorrect or inaccurate documentation include: Astute local production people hopefully catching the errors and seeking correct
information. Offshore contract manufacturers probably won’t catch
errors and will simply “build to print,” ship, and expect payment.
Problems will not be discovered until shipments arrive. If OEM
rework isn’t feasible, then another expedited procurement cycle
begins (hopefully with correct documentation), followed by damage control.
126 • Design for Manufacturability
• Make sure all changes are updated immediately into all documents
to ensure subsequent work is based on the changes.
• For derivative products, implement procedures to ensure only relevant data carries through to subsequent designs. Structure data into
modules that change and modules that don’t change.
• Ensure drawings are complete and unambiguous and convey the
design intent with geometric dimensioning and tolerancing (see
Guideline Q13 in Section 10.1).
Implement effective product development methodologies, leadership,
and a culture that encourages complete and correct documentation, and
allow enough time for documentation, knowing that do-it-right-the-first-
time documentation results in a net savings in resources and time to stable production.
Follow the part design guidelines in Chapter 9.
3.5 DESIGN FOR EVERYTHING (DFX)
Engineers are trained to design for functionality and their CAD tools predominantly design for functionality. However, really good product development comes from designing for everything, which is sometimes called
DFX. This section details design considerations for DFX. The key is to
consider all goals and constraints early.
3.5.1 Function
While the product has to work properly, it must be kept in mind that,
although function is the most obvious consideration, it is far from being
the only one. A redesign to correct a purely functional problem will result
in another product development cycle, and another introduction. And
those can introduce new, unknown manufacturability problems which
can become an unexpected drain on manufacturing resources.
3.5.2 Cost
Cost has been the battleground of competition for decades. But the lowest product cost does not result from “cost reduction” measures per se. As
Designing the Product • 127
pointed out in Chapter 1, design determines more than three-fourths of a
product’s cost.
For example, one high-tech company appointed a “cost reduction manager” for a critical new product line, who managed to reduce the projected
cost to within the goal by buying the cheapest parts. However, the parts
came from 16 different countries and it took 9 months to deliver first articles. And this was on a leading-edge product! Furthermore, when production began, the part quality was so poor that plant production actually
ground to a halt, thus delaying delivery even further.
The subject of cost will be treated in more detail in Chapter 6.
3.5.3 Delivery
Delivery is greatly affected by the design because the design determines
how difficult the product is to build and assemble. The choice of the parts
determines how hard the parts will be to procure and how vulnerable
production will be to supply glitches. Standardization (Chapter 5) will
affect the effectiveness of Lean Production, which is the key to fast factory
throughput (see Chapter 4).
3.5.4 Quality and Reliability
Like cost, quality and reliability are determined more by the design than is
commonly realized. Designers specify the parts and, thus, the quality of the
parts. Designers determine the number of parts and so determine the cumulative effect of part quality on product quality, which is especially important for complex products (see Section 10.3). Designers are responsible for
the tolerance sensitivity. The processes specified by the designer determine
the inherent quality of the parts. Designers are responsible for ensuring
that parts are designed so that they cannot be assembled incorrectly, which
in Japan is called poka-yoke, or what we would call mistake-proofing (see
Section 10.7). These are very much manufacturability issues because quality
problems must be consistently corrected in the plant before a product can be
shipped. Quality and reliability are discussed further in Chapter 10.
3.5.5 Ease of Assembly
Ease of assembly is what comes to mind when most people think of DFM
because much attention has been focused on design for assembly (DFA),
128 • Design for Manufacturability
later renamed DFMA, and software to analyze designs to look for opportunities to improve the assembly of high-volume products. The DFM
techniques presented herein optimize the ease of assembly by design,
independent of production volumes. Chapters 8 and 9 present general
guidelines for designing products that can be easily assembled.
3.5.6 Ability to Test
Test strategy is very much affected by the company quality culture. At
companies with a good quality culture, quality is everyone’s responsibility, including designers! The TQM (total quality management) philosophy
is that, instead of being tested in, quality should be designed in and then
built in using process controls. Theoretically, products need not be tested if
all processes are 100% in control. However, few factories are that confident
in their processes, so they may elect to conduct at least a “go/no-go” functional test. Unsophisticated factories with higher fallout (failures) producing complex products may need tests to aid in diagnostics. Designers of
these products are responsible for devising a way to not only test the product but also diagnose any problems, to show the Rework Department how
to repair it. In complex products, test development costs can exceed product development costs and can even take more calendar time. Test guidelines are included in Chapter 8.
3.5.7 Ease of Service and Repair
Being able to repair a defective product is a manufacturability issue because
any product failing any test will have to be repaired, thus consuming valuable manufacturing resources. Service and repair in the field can be more
troublesome because field service centers usually have less sophisticated
equipment than factories. In extreme cases, field failures may be sent back
to the factory for repair, thus diluting manufacturing resources. Designers
should design in ease of service and repair (see Section 8.9).
3.5.8 Supply Chain Management
Supply chain management can be greatly simplified by the standardization
of parts and raw materials (Chapter 5), part selection based on adequate
availability over time, and product line rationalization (see Appendix A)
to eliminate or outsource the old, low-volume, unusual products that have
Designing the Product • 129
the most unusual parts. In many cases, this simplification, performed in
product portfolio planning and product development, will be essential to
the success of supply chain management initiatives as well as programs
to implement Lean Production, build-to-order, and mass customization.
3.5.9 Shipping and Distribution
The distribution of products will be revolutionized by build-to-order,26
which is the ability to build products on demand and shipping them
directly to customers, stores, or other factories instead of the mass production tradition of building large batches and then shipping them through
warehouses and distribution centers. Selling products from inventory
presents many problems: The whole system depends on forecasts, which
rarely come even close to predicting customer demands, especially when
markets are fast moving. Inventory costs money to carry, usually 25% of
its value per year!27 If forecasts were too high, then inventory will have to
be marked down to “move the merchandise.” If forecasts were too low,
then sales opportunities will be lost. Sometimes manufacturers try to
compensate for inadequate forecasts by expediting production, but this
can be expensive and can disrupt scheduled production.
3.5.10 Packaging
Packaging considerations should not be left until the first manufactured
product reaches the shipping dock. Packaging variety and its logistics
can be reduced with standard packaging that can be used for many products. Unique information can be added by printing on-demand labels or
directly onto the boxes. Environmentally friendly packaging materials
and recycled packages are becoming more important.
Designing inherent shock resistance into the product can reduce the size
and cost of protective packaging. Another packaging implication is that
returns due to shipping damage may come back to the factory, thus adding
cost, upsetting customers, and depleting manufacturing resources.
3.5.11 Human Factors
Human factors and ergonomics are social considerations that should be
considered at the very beginning, because ergonomic changes would be
difficult to implement after the design is complete. Good human factors
130 • Design for Manufacturability
design (Chapter 10) of the product and process will reduce errors and
accidents in use and during manufacture. In some industries (e.g., electronics), many service calls deal with usability issues. Philips Electronics
found that “at least half of returned products had nothing wrong with
them. Consumers just couldn’t figure out how to use them.”28
3.5.12 Appearance and Style
Appearance and style should be considered an integral part of the design,
not something that is added later. Sometimes, the style is dictated by an
early industrial design study. This can really hamper incorporating DFM
principles if they were not considered in the styling design. All factors of a
design, including styling, need to be considered simultaneously throughout the design.
3.5.13 Safety
Safety should not be considered only after a recall or lawsuit. Careful design
and simulations should be utilized to prevent safety problems before they
manifest. If a safety issue surfaces, the root of the problem must be determined and remedied immediately. Safety issues can create a major disruption to engineering, manufacturing, and sales, in addition to jeopardizing
the product’s and the company’s reputation. Designers should make every
effort to design safe products the first time as a moral and legal obligation.
3.5.14 Customers’ Needs
The ultimate goal in designing a product is to satisfy customer needs. In
order to do that, designers must thoroughly identify and understand customer needs (Section 2.11), and then systematically develop the product to
satisfy those needs.
3.5.15 Breadth of Product Line
Using the principles of Lean Production and build-to-order, discussed in
Chapter 4, products can be designed with standard parts and be produced
on flexible manufacturing lines or cells. Common parts, standard design
Designing the Product • 131
features, modular subassemblies, and flexible manufacturing can be combined to satisfy more customers.
3.5.16 Product Customization
Customized products can be built as quickly and efficiently as mass production if products and processes are designed for mass customization.29
For more on mass customization, see Section 4.3.
3.5.17 Time-to-M arket
Time-to-market is a major source of competitive advantage.30 In fast-
moving markets, being first to market can have major market share implications. Figure 3.2 shows the effect of an early product release on the revenue
profile. The shaded area represents the extra sales due to the early introduction.
However, because the product development and tooling costs were paid for
by the baseline sales profile, the shaded area is really extra profit.
3.5.18 Expansion and Upgrading
Designers should design products so that they are easy to expand or upgrade
by the plant or by the customer. This capability may allow the company
Extra Sales with
Early Introduction
Revenue
First
Upgrade
Second
Upgrade
Baseline
Sales Profile
Early
Release
Date
Baseline
Introduction
Date
Time
End of Life for
Single Product
Original
Product
Life Cycle
Extended Product Life Cycle
FIGURE 3.2
Increasing revenue with early introductions and upgrades.
End of Life
for First
Upgrade
End of Life
for Second
Upgrade
132 • Design for Manufacturability
to increase profits by extending the life of each product. Marketing and
finance representatives should be involved early to help formulate the product upgrading strategy and calculate its value. Crunching the numbers will
point out the high profit potential in the latter stages of the products’ lifetimes after development costs are paid off, as shown in the upgrade extensions in Figure 3.2. Again, the product development and tooling costs were
paid for by the baseline sales profile, so the shaded area is really extra profit.
Planning to extend a product’s lifetime with easy upgrades may be a very
worthwhile goal to consider in the initial phases of the product design.
3.5.19 Future Designs
Similarly, current products should be designed so subsequent products
can be based largely on current designs. This will save considerable time
and cost in the next design if maximum use can be made of current engineering, parts, modules, and software.
3.5.20 Environmental Considerations
3.5.20.1 Product Pollution
Environmental design considerations should not be left to the first time
the product or its process is fired up. Problems discovered at this stage may
require major changes or a redesign to correct. Designers should anticipate environmental trends and design products clean enough for future
environmental standards.
3.5.20.2 Processing Pollution
Product designers specify the process whether they realize it or not. Even
specifying the usual process may continue a process that is causing pollution from solvents, combustion products, chemical waste, and so forth.
Designers of new products have the opportunity to optimize the environmental cleanliness of the processes. This is much easier to do in the early
stages of the design than later. Do not wait until environmental activists or
a regulatory agency force your company to change your processes, which
would result in disruptive changes in the factory, costly penalties, engineering change orders, and maybe a product redesign.
Designing the Product • 133
3M Corporation formulated an environmental strategy called the 3P
program: “Pollution Prevention Pays.” The theme is prevention of pollution at its source. The three elements of the program are recycling,
redesigning products and equipment for less pollution, and creating products that do not pollute in the first place. Note that two out of the three
methods depend on the design to reduce pollution.
3.5.20.3 Ease of Recycling Products
Similarly, companies should be concerned about what happens to a product after its useful life is over. Can it be recycled into new products? Can
it be upgraded for extended life? The company may even be able to profit
in some manner from the recycling or extension of its products. If the
product must be disposable, it should degrade quickly and safely without aggravating solid waste disposal problems. These factors, like all the
others, must be considered throughout the design phase.
3.5.21 Summary
All these factors should be emphasized early by product development
teams because redesigns or major product design changes consume
a great deal of design and manufacturing resources to implement.
Remember that changes and redesigns consume engineering time and
money that should be invested in new product development. This leads
to one of the most important design principles for design in general, not
just for DFM: The further into a design, the harder it is to start satisfying
additional needs.
It is important to design with a balanced set of design considerations. Do
not let any considerations dominate the design or others will suffer. Many
people do not have a clear understanding of whose job is it to incorporate
these considerations into the design. Some may think that ease of assembly comes from the manufacturing department. Some may think ease of
service comes from the service department. Many think that quality is the
responsibility of the quality department. The correct view of responsibility
is a paraphrase of the motto of TQM programs:
It is everyone’s responsibility to incorporate all considerations early into
the design.
134 • Design for Manufacturability
The consequences of not considering everything early:
1. It is very difficult to integrate considerations later and results in
delays, extra cost, and depleted resources.
2. The considerations are never incorporated into the design, resulting
in a product that is (1) less competitive, (2) must be withdrawn from
the market, or (3) needs to be redesigned.
3.6 CREATIVE PRODUCT DEVELOPMENT
Inventing requires creativity. And designing an invention for manufacturability requires even more creativity. At Toyota, “Invention without practical application is no more than a hobby. Invention becomes innovation
only when stable duplication is achieved on a meaningful scale at a realistic cost.”31 This corresponds to when the stable target volume production
is achieved, as shown in the center graph in Figure 2.1.
The prerequisite for creativity is an open mind and a receptivity to ideas.
The chapter on “Innovation and Change” in the Dartmouth study on corporate success and failure stated: Innovation is not a “thing that just happens. It’s a natural outgrowth of a culture of open-mindedness.”32
3.6.1 Generating Creative Ideas
State the challenge generically without implying or excluding any solutions. For instance, in order to support electric cars and hybrids, the temptation would be to encourage development of better batteries. However,
the broadest generic description would be “energy storage devices,” which
would also include ultra-caps (large capacitors), compressed air, flywheels,
and hydrogen (which is an energy storage medium, not a fuel).
For new products, creative ideas should apply to all aspects of the design
and manufacture. For redesigns and derivatives, the search for ideas
could start with the most expensive part or subassembly or the hardest to
build or any other challenges. Identify fundamental flaws in conventional
designs and then think of new concepts that are inherently not flawed.
To get good ideas, ignore what has been done before and don’t be
deterred by obstacles. Ignore current designs and conventional thinking.
Designing the Product • 135
Rather, focus on what needs to be done. Pretend you are new to this industry. Ask: What would revolutionize the industry?
Don’t limit idea generation to thinking only in one setting. Look for
ideas in a wide range of situations, climates, and states of mind. Generate
many ideas to accomplish all the challenges and possibly more. Find the
best applications of various designs, in any industry. If possible, do teardowns and keep them available.
Consider idea triggers, even if they seem too expensive. If the concept
technically would work, use it as an inspiration to find or develop lower
cost versions.
Create an environment where people are encouraged to be creative and
are not inhibited by fears or a perception of not succeeding. Don’t limit
thinking by excluding innovative solutions, especially when previous conventional thinking says, “it won’t work” or “it’s not possible” or it’s “too
risky.” Tsuyoshi Kikukawa, former president of Olympus, said: “If you
don’t take a risk on a new idea, that in itself, becomes a risk.”33
Don’t limit the number of ideas by spending too much time modeling or
drawing each one. At the idea stage, sketching or discussing many creative
ideas is more important than presentation format.
Be aware of new developments that are relevant to the project, even if
they are outside your industry. Look for many relevant precedents in the
field that are lower cost or higher performance, as well as innovations outside the industry in product design, processing, etc. Read, do searches,
and attend trade shows on anything that might benefit your project.
When applicable, create a visual model that contains only the most challenging elements. This avoids limiting creativity by temporarily omitting
less challenging aspects, such as frames, enclosures, and so forth.
Continue to use creativity as the design progresses. “The output from
one creative process usually stimulates the need for more creativity.”34
3.6.2 Generating Ideas at Leading Companies
At Toyota, “The Toyota organization implements a million ideas a year.”35
Frank Nuovo, VP of Design at Nokia, said, “You cannot fall in love with
your first idea. You have to be able to explore openly and accept input from
lots of people. It is very important to be flexible.”36 And Sony co-founder
Akio Morita asserted, “If you go through life convinced that your way is
always best, all the new ideas in the world will pass you by.”37
136 • Design for Manufacturability
3.6.3 Encouraging innovation at Medtronic
In Authentic Leadership, Bill George, then-CEO of Medtronic, wrote:
“A growing bureaucracy is a huge barrier to innovative ideas and dampens
creativity, no matter how much it spends on research and development.
Leaders committed to innovation have to work hard to offset these tendencies, giving preference to the mavericks and the innovators and protecting
new business ventures while they are in the fragile, formative stage.”38
He encourages “walking through the labs and learning about creative
ideas before they get killed off” by the system.
3.6.4 Nine Keys to Creativity
From The Manager’s Pocket Guide to Creativity,39 here is the essence of the
nine keys of creativity, with a quote from each:
1. Ask a lot of questions: “Most of our social institutions seem designed
to limit, if not discourage, creative inquiry.”
2. Record all ideas: “When you need new ideas, you can start by
reexamining the old ones.”
3. Revisit ideas and assumptions: “When revisiting, you often find that
assumptions are more striking than ideas.” IDEO culture emphasizes: “Refine or rethink our assumptions rather than press onward
in adherence to an original plan.”40
4. Express ideas and follow through: “Most ideas are cut short by our
automatic self-censorship.”
5. Think in new ways: “You don’t get out of the box by doing what you’ve
always done.”
6. Wish for more. Stretch: “Creativity is nurtured by creative speculation.”
7. Everyone should try to be creative: “Most people feel they’re not creative and therefore don’t try to be.”
8. Keep trying: “The secret to incubation is revisiting the problem and
doing so often.”
9. Encourage creativity and ask for creative behavior all the time: Most
managers think that “if you aren’t visibly producing something tangible, then you’re wasting the company’s money.”
Designing the Product • 137
3.6.5 Creativity in a Team
For innovation, Gary Hamel asserts, “the real returns come from harnessing the imagination of every single employee every single day.”41 Start with
a creative, open-minded team that is stimulated by the challenge. The team
should be diverse in knowledge as well as cultural and thinking styles.
Fire up the team.42 Creativity is enhanced when people really want to
invent something. Howard Schultz, CEO of Starbucks, said, “When you’re
surrounded by people who share a collective passion around a common
purpose, there is no telling what you can accomplish.”43
Allocate the time to be creative; hopefully, the project manager will realize the importance of the concept/architecture phase and allocate enough
time to optimize this phase.
Put aside preconceived notions and conventional thinking and think
outside the box. It may help to brainstorm, possibly with an experienced
facilitator who comprehends the market and technical challenges but can
also offer an outside perspective.
Do benchmarking and teardowns on successful products that use these
parts. Don’t limit analyses to just your industry or competitors.
To promote creative thinking, co-locate team workers close together and
hold creative sessions in a permanent shared space or off site in a relaxed
atmosphere away from phones and distractions. Consider a site that has
some relevance to the project.
One of the goals of team building is to build up enough trust44 so that
people will open up and come forth with many creative ideas.
Build models, which IDEO says “is always inspirational—not in the
sense of a perfected artwork but just the opposite: because it inspires
new ideas. Model building should start early in the life of a project, and
we expect them to be numerous, quickly executed, and pretty ugly. Each
one is intended to develop an idea ‘just enough’ to allow the team to learn
something and move on.”45
Do not start creative product development with a discussion of administrative issues, especially deadlines and development budgets.
Backward compatibility may be important for minor improvements
that can be quickly implemented, even retrofitted into products in the
field. However, for major advances, innovation could be held back by pressures to be compatible with whatever it is replacing. In between, innovated
138 • Design for Manufacturability
advances can be implemented as new modules, and the modules can be
introduced on current products and then be applied to new products.
Use creative solutions for follow-through and implementation activities.
3.6.6 The Ups and Downs of Creativity
The very nature of creativity and invention means they have many cycles
of ups and downs, like a sinusoidal curve. Thinking of a good idea can be
an exhilarating experience, which is the first “high” on the curve. Then
you, or probably someone else, say, “What about … ?” Then the curve
hits the first “low,” and the idea could easily die without a culture that
encourages continued creativity and persistence. The down cycles are
when ideas are most vulnerable to discouragement or lack of support. To
proceed back up, new ideas and solutions will be required to solve problems encountered at each drop.
To get past obstacles, Toyota emphasizes, “the tenacity to bring ideas
to fruition even in spite of initial setbacks.”46 Toyota “removes anything
that stands in the way. That means looking at the target in a fundamentally different way. It means asking ‘what’s blocking perfection?’ instead of
what can we improve? That’s what differentiates their brand of continuous
improvement from all others.”47
Determination is important. When developing the first high-speed
train, Japan National Railroad used the Chinese motto, Yu fa zi, which
means, “There is a way.”
The book, Breakthrough, proposes radical research to get past obstacles,
follow the problem to the root, and then look for solutions:
“In applied research, if there is an obstacle, the group tries to get around it.
If stuck at an obstacle, the researchers look for a quick fix or give up.”
“In radical research, however, obstacles focus the research. Typically, a multidisciplinary team is deployed to find perspectives on the obstacle. As the
exploration deepens, more disciplines may be brought in as needed.”48
At Toyota, engineers are expected to “break the problem down to its
smallest definable elements and attack each one with ingenuity.” And “big
leaps forward are achieved not in one big swag but through the cumulative
effect of a multitude of much smaller hits.”49
Designing the Product • 139
3.7 BRAINSTORMING
Brainstorming is a technique, normally used in groups, that can generate many ideas. Stanford’s Institute of Design emphasizes the right setting: “The power of group brainstorming comes from creating a safe place
where people with different ideas can share, blend, and expand their
diverse knowledge.”50
The leader can organize a formal session or just steer a spontaneous discussion into brainstorming using the following rules:
• Criticism and judgment are not allowed. Criticism discourages the
generation of new ideas and inhibits everyone’s responses.
• Praise all ideas. Since judgment is not being applied, all ideas should
be praised to encourage the generation of many ideas. IDEO encourages building on the ideas of others.51
• Generate many ideas. Nobel laureate Linus Pauling once said, “The
secret to getting good ideas is to have a lot of ideas and some criterion
for choosing.” Further, one idea can lead to another.
• Think wild. What may seem to be a ridiculous idea might trigger the
thought process that ultimately leads to a useful solution. Think of the
mathematical process of using imaginary numbers (using the square
root of –1) to derive real answers. There are many calculations using
these imaginary numbers, but in the end, a real answer appears.
Then, after the brainstorming session:
• Sort all the candidate ideas. This is where judgment is applied. Try
to prioritize the ideas to a list of leading candidates. Some ideas may
seem promising but need more investigation.
• Choose the final solution. Choose the best solution based on all the
objectives, constraints, and resources.
After design ideas have been chosen and survived the initial follow-
through analysis, the team must perform a more thorough follow-through
effort to reduce the ideas to practice. This must be pursued ambitiously
until the design meets all its design goals. If the tentative design falls short,
the designers should iterate the above process until the product meets all
140 • Design for Manufacturability
the goals. Many DFM problems are caused when the manufacturability
goal is dropped because the design is having problems.
3.8 HALF- COST PRODUCT DEVELOPMENT
First, companies must ensure that their policies are not counterproductive to the best product development practices (Section 11.5). These
counterproductive policies include outsourcing production away from
engineering (Section 4.8), attempting cost reduction after design (Section
6.1), bidding custom parts (Section 6.11), and averaging overhead costs
(Chapter 7).
3.8.1 Prerequisites for Half-Cost Development
3.8.1.1 Total Cost
The more important cost is, the more important it is to measure it properly. For ambitious cost goals, cost measurements absolutely must quantify
all costs that contribute to the selling price (see Figure 6.3).
Until company-wide total cost measurements are implemented, the
half-cost team needs to make cost decisions on the basis of total cost thinking, or, for important decisions, manually gather all the costs. Since a large
portion of cost savings will be in overhead, the costing must ensure that
new products are not burdened with the averaged overhead charges, but
only the specific overhead charges that are appropriate.
3.8.1.2 Rationalization
Companies wanting to develop half-cost products will have to immediately rationalize their existing product lines to eliminate or outsource
(1) demanding products that take resources away from new product development and (b2 “loser” products that must be subsidized by more profitable products (Appendix A). The effects of rationalization on a half-cost
program are to ensure that (1) resources are always available for multifunctional teams and not pulled away to build fire-drill products or find
unusual parts; (2) resources are available for the other half-cost strategies;
Designing the Product • 141
and, (3) the new half-cost product will not have to pay the “loser tax” to
subsidize less-efficient products.
3.8.2 Designing Half-Cost Products
Half-cost products will not result just from setting an ambitious target (Section 1.4) or any other “show me the money” goal. If companies
want to develop products at half the cost, they must do everything right,
which includes implementing all the techniques presented in this book
and implementing the strategies presented at www.HalfCostProducts.com,
which presents a coordinated eight-point strategy to cut total cost in half
or better (this strategy is summarized in Section 6.3). This book will
describe how to accomplish the first point, which is product development,
plus some of the other half-cost strategies. Companies should implement
the other seven strategies to (1) help reduce the cost and (2) support product development by measuring total cost (Chapter 7), establishing vendor
partnerships (Section 2.6), standardizing parts (Chapter 5), and rationalizing products to free up resources (Appendix A). Thus, a half-cost product development will consist of implementing all the principles of this
book, with special emphasis on:
• Product definition. The product definition must reflect the voice
of the customer (Section 2.11) and yet be worded generically
(using words like means to) so as to maximize the design possibilities.
• Lessons learned. Thoroughly understand the total cost structure of
previous or related products to identify sources of excessive waste,
such as defects, rework, scrap, setups, warrantee costs, and other
inefficiencies, as discussed in Section 3.3.
• Breakthrough concept/architecture optimization. Since 60% of cost is
determined in this phase, half-cost product development must fully
explore every possible way to simplify concepts with breakthrough
ideas.52 The multifunctional team should schedule enough time to
creatively search for many ideas (Section 3.6) and conduct many
brainstorming sessions (Section 3.7) to search for low-cost design
approaches and manufacturing and sourcing strategies.
• Tolerances. A systematic approach to tolerancing may be a key element of a half-cost strategy. The architecture should be optimized
142 • Design for Manufacturability
to eliminate the need for tolerances that have to be so tight that they
add unnecessarily to the cost. Techniques to minimize tolerance
costs include:
• Avoid overconstraints (as discussed in Guideline A3 in Chapter 8)
and cumulative stacks (with techniques presented in Section 3.1).
• Use concurrently designed fixtures to precisely position parts and
then bolt members together or drill, pin, or spot-weld at assembly.
• Understand tolerance step functions for all contemplated processes to avoid unknowingly specifying processes that are more
expensive than necessary (see Figure 9.2).
• Use design of experiments and Taguchi Methods™ to methodically specify tolerances for a robust design to achieve “high quality
at low cost,” as practitioners say (see Guideline Q12 in Chapter 10).
• Combine parts (Section 9.5); design machined parts so all dimensions are machined in the same setup (Guideline P14, Section 9.2).
When products have dominant high-cost parts or subassemblies:
• Identify the most expensive potential parts or subassemblies.
• Look for a wide range of parts, as shown in Figure 5.6. In many cases,
higher performing mass-produced parts may cost less but would not
normally be considered if the engineer specifies only the one part
that meets the exact need.
• Consolidate expensive parts into a few standard parts using the logic
of Figure 5.3.
NOTES
1. Robert H. Casey, “The Model T Turns 100! Henry Ford’s Innovated Design Suited the
Nation to a T,” American Heritage’s Invention and Technology, Winter 2009, pp. 36–41.
2. For more information on customized in-house DFM seminars, see Appendix D of
this book or go to the seminar page of the website: www.design4manufacturability.
com/seminars.htm.
3. Jeffrey Liker, The Toyota Way (2004, McGraw-Hill), p. 57.
4. Dr. Anderson’s design studies that generate breakthrough concept ideas are described
in Appendix D.
5. James Morgan and Jeffrey K. Liker, The Toyota Product Development System (2006,
Productivity Press), Chapter 4, “Front-Load the PD Process to Explore Alternatives
Thoroughly.”
Designing the Product • 143
6. Stephen B. Rosenthal, Effective Product Design and Development (1992, Irwin),
Chapter 9, “The Quest for Six Sigma Quality at Motorola Corp.”
7. Tim Brown, Change by Design (2009, Harper Business), p. 105.
8. Terry Walters and Tim Caffrey, “Additive Manufacturing Going Mainstream,”
Manufacturing Engineering, June 2013.
9. Morgan and Liker, The Toyota Product Development System, Chapter 6, “Utilizing
Rigorous Standardization to Reduce Variation and Create Flexibility and Predictable
Outcomes.”
10. The feedback forms in Appendix C can be used to solicit valuable feedback from
factories, vendors, and field service.
11. Based on the MIT $5 million dollar five-year study on the future of the automobile;
James P. Womack, Daniel T. Jones, and Daniel Roos, The Machine That Changed the
World: The Story of Lean Production (1991, Harper Perennial).
12. Patrick Lencioni, Overcoming the Five Dysfunctions of a Team (2005, Jossey-Bass); see
the chapter on “Mastering Conflict,” pp. 37–50.
13. John R. Detert, Ethan R. Burris, and David A. Harrison, “Debunking Four Myths
About Employee Silence,” Harvard Business Review, June 2010, p. 26.
14. Michael L. Dertouzos, Richard K. Lester, and Robert M. Solow, Made in America:
Regaining the Productive Edge, from the MIT Commission on Industrial Productivity
(1989, Harper Perennial).
15. Robert W. Hall, “Medtronic Xomed: Change at ‘People Speed’,” Target, 2004, Vol.
20, p. 14, http://www.ame.org/sites/default/files/target_articles/04-20-1-Medtronic_
Xomed.pdf.
16. For more on commercialization, see the author’s web page: http://www.halfcostproducts.
com/commercialization.htm.
17. Dr. Anderson’s design studies that generate breakthrough concept ideas are described
in Appendix D.
18. Morgan and Liker, The Toyota Product Development System, “Set-Based Concurrent
Engineering,” p. 47.
19. John Nathan, Sony (1999, Mariner Books), p. 46.
20. Matthew E. May, The Elegant Solution (2007, Free Press), p. 50.
21. “3M’s Innovation Revival,” Fortune, September 24, 2010, http://money.cnn.
com/2010/09/23/news/companies/3m_innovation_revival.fortune/index.htm.
22. David M. Anderson, Build-to-Order & Mass Customization: The Ultimate Supply
Chain Management and Lean Manufacturing Strategy for Low-Cost On-Demand
Production without Forecasts or Inventory (2008, CIM Press), Chapter 7, “Spontaneous
Supply Chains.” See book description in Appendix D.
23. Ibid., Chapter 6, “Outsourcing vs. Integration.”
24. Micheline Maynard, The End of Detroit: How the Big Three Lost Their Grip on the
American Car Market (2003, Currency/Doubleday), Chapter 2 on Toyota and Honda,
p. 62.
25. From a speech by Boeing Chairman and CEO, Philip M. Condit, presented
May 7, 1993, at the Haas Graduate School of Business at the University of California
at Berkeley.
26. Anderson, Build-
to-
Order & Mass Customization. See book description in
Appendix D.
27. David M. Anderson, Agile Product Development for Mass Customization (1997,
McGraw-Hill), Chapter 3, “Cost of Variety.”
28. James Surowiecki, “Feature Presentation,” The New Yorker, 28 May 2007, p. 28.
144 • Design for Manufacturability
29. Anderson, Build-to-Order & Mass Customization.
30. George Stalk, Jr., and Thomas M. Hout, Competing Against Time (1990, Free Press).
31. Satoshi Hino, Inside the Mind of Toyota (2006, Productivity Press), Chapter 1,
“Toyota’s Genes and DNA,” p. 3.
32. Sydney Finkelstein, Why Smart Executives Fail, and What You Can Learn from Their
Mistakes (2003, Portfolio/Penguin Group), p. 73.
33. Norton Paley, Mastering the Rules of Competitive Strategy: A Resource Guide for
Managers (2007, Auerbach Publications/Taylor & Francis), p. 2.
34. Dorothy Leonard and Walter Swap, When Sparks Fly: Igniting Creativity in Groups
(1999, Harvard Business School Press), p. 15.
35. May, The Elegant Solution, p. xi.
36. Dan Steinbock, The Nokia Revolution: The Story of an Extraordinary Company That
Transformed an Industry (2001, AMACOM), p. 273.
37. Shu Shin Luh, Business the Sony Way (2003, Wiley), p. 103.
38. Bill George, Authentic Leadership: Rediscovering the Secrets of Creating Lasting Value
(2003, Jossey-Bass), Chapter 12, “Innovations from the Heart,” pp. 133–134.
39. Alexander Hiam, The Manager’s Pocket Guide to Creativity (1998, HRD Press).
Excerpted in The Futurist, October 1998, pp. 30–34.
40. Brown, Change by Design, p. 16.
41. David Kirkpatrick and Gary Hamel, “Innovation Do’s & Don’ts in Today’s Economy:
Good Ideas Aren’t Just Good for Business, They’re Essential for Growth.” http://
money.cnn.com/magazines/fortune/fortune_archive/2004/09/06/380347/index.htm
42. Leonard and Swap, When Sparks Fly.
43. Camine Gallo, “Inspire your Audience: 7 Keys to Influential Presentations,” white
paper, p. 3, www.caminegallo.com. Gallo also wrote, Fire Them Up: 7 Simple Secrets to
Inspire Colleagues, Customers, and Clients; Sell Yourself, Your Vision, and Your Values;
Communicate with Charisma and Confidence (2007, Wiley).
44. P. Lencioni, Overcoming the Five Dysfunctions of a Team; see the chapter on “Building
Trust,” pp. 13–35.
45. Brown, Change by Design, p. 106.
46. Satoshi Hino, Inside the Mind of Toyota, Chapter 1, “Toyota’s Genes and DNA,” p. 29.
47. May, The Elegant Solution, p. 42.
48. Mark Stefik and Barbara Stefik, Breakthrough: Stories and Strategies for Radical
Innovation (2004, MIT Press), pp. 23 and 32.
49. May, The Elegant Solution, Chapter 2, “The Pursuit of Perfection,” p. 49.
50. Robert I. Sutton, co-founder of the Hasso Plattner Institute of Design at Stanford
University, “The Truth About Brainstorming,” Business Week, September 2006, p. 17.
51. Brown, Change by Design, p. 78.
52. Dr. Anderson’s design studies that generate breakthrough concept ideas are described
in Appendix D.
Section II
Flexibility
4
Designing for Lean and Build-to-Order
In concurrent engineering, multifunctional product development teams
design products for the production environment or concurrently design
products and new processes. When companies embark on flexible manufacturing strategies, concurrent engineering is crucial to the success of
Lean Production, build-to-order (BTO), and mass customization.
Products not concurrently engineered for flexible environments may
impede implementations, diminish the payback, or even thwart success
entirely. The product portfolio may have too many unrelated products that
lack any synergy and, thus, too many different parts and processes. Even
within a focused product portfolio, there may be a needless and crippling
proliferation of parts and materials. The specified parts may be hard to get
quickly. The products and processes may have too many setups designed
in. Quality may not be designed into the product or process, which results
in disruptions in the flow when failures loop back for correction. The
product or process design may not make optimal use of CNC (computer
numerically controlled) machine tools, because most CNC equipment is
used in a batch mode, not flexibly. Before discussing how to design for
these environments, they are briefly summarized below.
4.1 LEAN PRODUCTION
Lean Production accelerates production while eliminating many types
of waste such as setup, excess inventory, unnecessary handling, waiting,
low equipment utilization, defects, and rework. Former MIT researchers
James P. Womack and Daniel T. Jones, authors of the definitive book on
the subject, Lean Thinking, say that Lean Production “is Lean because it
147
148 • Design for Manufacturability
provides a way to do more and more with less and less—less human effort,
less equipment, less time, and less space—while coming closer and closer
to providing customers with exactly what they want.” They summarize the
corporate benefits of Lean Production as follows:
“Based on years of benchmarking and observations in organizations
around the globe, we have developed the following simple rules of thumb:
converting a classic batch-and-queue production system to continuous
flow with effective pull by the customer will:
• double labor productivity all the way through the system (for
direct, managerial, and technical workers, from raw materials to
delivered product)
• cut production throughput times by 90 percent
• reduce inventories in the system by 90 percent
• cut in half errors reaching the customer and scrap within the production process
• cut in half job-related injuries
• cut in half time-to-market for new products
• offer a wider variety of products, within product families, at very
modest additional cost
• reduce capital investments required to very modest, even negative,
levels if facilities and equipment can be freed up or sold.
Firms having completed the radical realignment can typically double
productivity again through incremental improvements within two to
three years and halve again inventories, errors, and lead times during
this period.”1
4.1.1 Flow Manufacturing
A key element of Lean Production is flow, sometimes called “one-piece
flow.” This is especially important for build-to-order and mass customization where every piece may be different.
Flow manufacturing is achieved by reducing setup to the point where
products can be efficiently built in a one-piece flow instead of the customary batches. A key element of flow is “dock-to-line” delivery,2 in which
parts are pulled directly to all points of use without the delays and cost of
incoming inspection. To accomplish this, suppliers will need to be certified
to ensure quality at the source.
Another aspect of flow manufacturing is the dedicated cell or line,
which may be arranged to build any variation within a product family
Designing for Lean and Build-to-Order • 149
without any setup. Each cell has a compete set of “right-sized” inexpensive machines. Utilizing older machines that have been made obsolete by
centralized mega-machines can be a very cost-effective way of building
complete cells. It may be unlikely for contract manufacturers to commit to
dedicating equipment and floor space for cellular manufacture. Thus, this
can become an effective strategy for established companies to compete
with less savvy competitors who outsource batch production.
Flexible, or agile, product development is an essential enabler of Lean
Production that will ensure that flexible processes are concurrently
designed (Chapter 2), products are designed around standard parts
(Chapter 5), products are designed for easy manufacture (Chapters 8 and
9), and quality is designed into the product (Chapter 10). Specifically,
products and processes must be designed to be built in a “batch size of
one” by eliminating any setup delays to kit parts, find and load parts, position workpieces, adjust machine settings, change equipment programs,
and find and understand instructions.
4.1.2 Prerequisites
In general, Lean Production implementations will go faster and have
greater success if companies perform two prerequisites first. For companies seeking to implement cellular manufacture to flexibly build any product in the family on demand (called build-to-order), these prerequisites
may be required for success:
1. Rationalize products first to eliminate the most unusual products,
which have the most unusual parts and procedures, as discussed in
Appendix A. This will provide immediate benefits.
2. Standardize parts and materials so new products will be designed
with a fraction of the part and material types. Chapter 5 shows effective ways to standardize parts and materials.
4.2 BUILD-TO-ORDER
Spontaneous build-to-order is the capability to quickly build standard
products upon receipt of spontaneous orders without forecasts, inventory, or purchasing delays.3 These products may be shipped directly to
150 • Design for Manufacturability
individual customers, to specific stores, or as a response to industrial
customers’ “pull signals” (signals that specific parts are needed right away
for assembly).
Similarly, your suppliers may need to use spontaneous BTO to respond
to your pull signals. And yet, if suppliers cannot actually build parts on
demand, then they will be tempted to meter them out from inventory, in
essence, transferring your parts inventory to their finished goods inventory.
The basic strategies for implementing spontaneous BTO are supply
chain simplification, concurrent design of versatile products and flexible
processes, the mass customization of variety, and the development of a
spontaneous supply chain.4 Spontaneous BTO can actually build products
on demand at less cost than mass-produced batches, if “cost” is computed
as total cost. Therefore, total cost measurements should also be part of this
process (see Chapter 7).
4.2.1 Supply Chain Simplification
Although supply chain management is a much discussed topic today, most
implementations fail to apply the basic lessons of Industrial Engineering
101: “Simplify before automating or computerizing.” The simplification steps for supply chain management are standardization, automatic
resupply techniques like kanban, and rationalization of the product line
to eliminate or outsource the unusual, low-volume products that contribute to part variety way out of proportion to their profit generation ability
(see Appendix A). The goal of supply chain simplification is to drastically
reduce the variety of parts and raw materials to the point where these
materials can be procured spontaneously by automatic and pull-based
resupply techniques. Reducing the part and material variety will also
shrink the vendor base, further simplifying the supply chain.
4.2.2 Kanban Automatic Part Resupply
Figure 4.1 shows two rows of part bins that are set up for resupply by the
two-bin kanban system. Initial assembly starts with all bins full of parts.
When any part bin nearest the worker is depleted, the full bin behind
moves forward, as shown by the empty space in the illustration. The empty
part bin then is returned to its “source,” which could be the machine that
made the part, a subassembly workstation that assembled the part, or a
Designing for Lean and Build-to-Order • 151
Part Bins
FIGURE 4.1
Kanban part resupply.
supplier. The source fills the bin and returns it to this assembly workstation behind its counterpart, which is now dispensing parts.
The beauty of kanban part resupply is that the system automatically
ensures an uninterrupted supply of parts, without forecasts or complicated
ordering procedures. The number of parts in a bin is based on the highest
expected usage rate and the longest resupply time. The sizes of the bins
are determined by the bin quantity and size of the parts. For large parts,
some companies use two-truck kanbans, in which parts are drawn from
one truck trailer while the other trailer goes back to the supplier for more
parts. Alternative systems include kanban squares marked on the floor for
larger parts and a two-card system where the cards travel (or are faxed or
e-mailed) back to the source instead of the bins.
In order for kanban systems to work, there must be enough room to dispense all parts at the points of use. This, again, emphasizes the importance
of part standardization, as discussed in Chapter 5.
152 • Design for Manufacturability
4.3 MASS CUSTOMIZATION5
Mass production thrived in the bygone era of stable demand and little product variety. However, today, once-stable markets are now very dynamic
and product variety is increasing to the point where products may need
to be mass customized for niche markets or individual customers. Trying
to satisfy this volatility and variety in the mass production mode will
be a slow and costly ordeal. Because mass customization handles variety proactively, it is fast and cost-effective, with no extra cost or delays to
handle various models, options, configurations, and customizations.
Mass customizers can use their versatile design and manufacturing capabilities to offer new value-added products or services that expand the scope
of their markets. These offerings may cost little extra to add, especially if they
can be done in existing CNC operations. And yet, they may save customers
so much time and money that they would gladly pay for the options, even
at premium prices, especially if these features are difficult for customers to
obtain. For instance, one of the author’s clients, Hoffman Engineering, built
a plant in Lexington, Kentucky, that can spontaneously build-to-order a
wide variety of standard or mass-customized electrical enclosures. Its high-
profit, value-added opportunity is to use the very same CNC laser cutters
that make the boxes to also make the holes and cutouts that would have cost
their customers much time and money to do on their own.
There is a whole spectrum of ways that mass customization methodologies can benefit companies. At the most visible end of the spectrum, companies can mass customize products for individual customers.
Further along the spectrum is niche market customization. For
instance, a company that makes telephones has only a few customers
(telephone companies) who want several dozen models in many colors all
with specific phone company logos. Exporters have to deal with many
niche market products—usually a different set of products for each country exported. Even if the differences are minor, the sheer variety of SKUs
(stock keeping units) can have significant cost and flexibility implications.
Most companies could benefit from expansion into niche markets if they
could do it efficiently.
At the other end of the spectrum are companies that have tremendous varieties of “standard” products; for instance, industrial suppliers
of valves, switches, instruments, or enclosures, or any company with a
Designing for Lean and Build-to-Order • 153
catalog over a few dozen pages. As with product customization, there
is a great contrast between how mass producers and mass customizers
manufacture a variety of standard products. The mass producer has the
dilemma of trying to keep a large enough inventory to sell a wide variety
of products from stock or alternatively using the slow, reactive, costly process of ordering parts and building products in small batches after receipt
of orders. The mass customizer can use flow manufacturing and CNC-
programmable machine tools to quickly and efficiently make different
products in a “batch size of one”—either mass-customized products or
any standard product from a large catalog.
As with Lean Production and build-to-order, mass customization implementation also benefits from, and may even require, the prerequisites discussed in Section 4.1.2: rationalization of products to eliminate the most
unusual products and their unusual parts (Appendix A) and standardization of parts and materials (Chapter 5).
4.4 DEVELOPING PRODUCTS FOR LEAN,
BUILD-TO-ORDER, AND MASS CUSTOMIZATION
To be successful at designing products for Lean Production, build-to-
order, or mass customization, companies must proactively plan product
portfolios. Product development teams must design products in synergistic product platforms, design around aggressively standardized parts and
raw materials, make sure specified parts are quickly available, consolidate
inflexible parts into very versatile standardized parts, ensure quality by
design with concurrently designed process controls, and concurrently
engineer product platforms and flexible flow-based processes.
Further, product development teams need to eliminate setup by design
by specifying readily available standard parts and tools (cutting tools,
bending mandrels, punches, etc.), designing versatile fixtures at each
workstation that eliminate setup to locate parts or change fixtures, and
making sure part count does not exceed available part bins or space at
each workstation.
Finally, products must be designed to maximize the use of available programmable CNC fabrication and assembly tools, without expensive and
time-consuming setup delays.
154 • Design for Manufacturability
4.5 PORTFOLIO PLANNING FOR LEAN,
BUILD-TO-ORDER, AND MASS CUSTOMIZATION
For Lean Production, build-to-order, and mass customization, product
portfolio planning (Section 2.3) must expand its focus to ensure that products are developed in synergistic families that can be produced on demand
on flexible lines.
To accomplish this, product families need to be structured so that all
products use standard parts and materials on the same flexible equipment
without setup delays.
All the products within a flexible line—and possibly all the products
within a flexible plant—must be compatible with respect to part standardization, raw material standardization, part/material availability, spontaneous supply chains, modularity, setup elimination, and flexible processing,
including CNC machine tool operation.
Older generation products may not be compatible with flexible production lines and thus may have to be dropped, outsourced, redesigned, or, at
a minimum, have material substitutions. Old products worth saving may
have to be redesigned or upgraded and be added to the list of potential
product development projects.
The evolution of product portfolios needs to be coordinated with implementation efforts for Lean Production, build-to-order, and mass customization. Decision making should be based on total cost and contributions
to the overall business model.
4.6 DESIGNING PRODUCTS FOR LEAN,
BUILD-TO-ORDER, AND MASS CUSTOMIZATION
For Lean Production, build-to-order, and mass customization, products
and processes need to be designed so that:
• All the parts can be distributed at all points of use, which is accomplished by designing around standard parts and materials from
aggressively standardized lists (Chapter 5). Too many parts would
either clutter and confuse the work areas or force the parts to be kitted
for a batch of products to be made, which is contrary to the one-piece
Designing for Lean and Build-to-Order • 155
•
•
•
•
flow of all the flexible paradigms. An important aspect of part standardization is fastener standardization, which is usually the easiest to
do and can provide significant benefits. If screws can be standardized
to one type at each workstation, then auto-feed screwdrivers can be
utilized, which automatically orients screws and feeds them through
a flexible hose to a powered screwdriver (Guideline F4 in Section 8.3).
Of course, in order to designate a single type of fastener at each station, the design team will have to be concurrently designing the entire
production flow.
There will be no significant setup for any part or product in the family.6
This includes any setup to (1) find, kit, load, or replace parts or materials; (2) change and position dies, molds, or fixtures; (3) change tools;
(4) load, position, clamp, or calibrate workpieces; (5) adjust machine
settings or calibrate machinery; or, (6) change equipment programs.
Equipment programs can be located and downloaded instantaneously and manual instructions can be found, displayed, and
understood quickly.
Parts and materials can be resupplied spontaneously.7 This includes
specifying readily available parts and materials, designing around
aggressively standardized parts, and specifying raw materials to be
cut on demand from the same standard input stock sizes.8
All parts can be pulled quickly into assembly on demand. This includes
specifying suppliers who can build parts on demand or working with
in-house manufacturing to establish in-house capabilities.
4.6.1 Designing around Standard Parts
Standardization of parts (Chapter 5) is the most important design contribution to the feasibility of spontaneous supply chains. Aggressive
standardization can enable the easiest technique of the spontaneous supply chain: steady flows of very standardized parts and materials.9 If there
are too many different parts and material types, steady flows cannot be
arranged because of the variety and unpredictability of demand. The total
cost value of standardization and its contribution to the business model
should motivate engineers and procurement organizations to implement
such aggressive standardization.
Most part proliferation happens because engineers do not understand
the importance to supply chains and operations and, even if they did
appreciate this, do not know which parts are best to choose. The effective
156 • Design for Manufacturability
procedures presented in Chapter 5 show how to generate lists of standard
parts and materials.
The usual operational mode in a part-proliferated environment is to
order the parts ahead based on forecasts, either for scheduled batch production or to have forecasted parts available for on-demand assembly (the
Dell model). If part variety is truly unavoidable or parts are to be mass
customized, then they can be built on demand using the principles presented in the book, Build-to-Order and Mass Customization.10
4.6.2 Designing to Reduce Raw Material Variety
An important task in concurrent engineering is to specify not only the
functional specifications of materials but also the order size and how they
get cut into various parts. A company that made sheet metal products previously ordered 600 different shapes of sheet metal, which was a logistical
nightmare. The author advised them to convert to just a handful of standard types, which were then cut on demand as they were needed. Even
better would be to cut sheet metal on demand from a coil.
Another way engineers can reduce material variety is to specify a single
tolerance or grade, instead of multiple grades. As pointed out in Chapter 5,
any perceived cost increase of shifting all materials to the higher grade
will be more than compensated by the total cost savings and value of the
business model.
Families of parts should be designed so that every CNC machine tool
uses the absolute minimum of raw material types; hopefully, just one, so
there are no setup delays to change materials.
Multiple lengths of linear materials can be obtained by ordering reels or
long lengths, which are then cut to length on demand.11
Inflexible raw parts, such as castings, extrusions, custom silicon, and
bare printed circuit boards, should be consolidated into versatile parts that
can be used for many functions on a wide range of products (Section 5.12).
Programmable chips should all be programmed using the same “blank.”
4.6.3 Designing around Readily Available Parts and Materials
A spontaneous supply chain depends on parts and materials that are
always available. Therefore, it is an important aspect of engineers’ jobs
to specify parts and materials that are readily available. Usually, design
Designing for Lean and Build-to-Order • 157
engineers choose parts based on functionality and hopefully quality. But
for flexible operations, availability is equally important.
Parts and materials that can be obtained from multiple suppliers tend to
have better availability, in general, and are also more likely to be standard.
On the other end of the spectrum, parts and materials available from only
a single source may someday be hard to procure at all. On the lecture circuit, the author found several companies whose parts had become obsolete before their products were even released!
Rapid delivery is important for flexible operations, so design teams should
specify local suppliers who will be able to supply materials on demand.
Many companies preclude the ability to obtain parts and materials spontaneously by buying from supposedly low-cost suppliers on another continent, which take too long to arrive12 for spontaneous supply chains.13
Similarly, even local low-bidder suppliers probably are not going to be
able to deliver on demand and will most likely not have adequate quality
either (see Section 6.11).
The guiding principle is to select parts and material to be readily available, be delivered on demand, and have the lowest total cost, which
includes material overhead, ordering, expediting, routing, shipping, expedited shipping, incoming inspections, kitting, internal distribution, and
all the costs of locating alternative sources of supplies to counter availability problems.
4.6.4 Designing for No Setup
Products can be designed to eliminate the following setups in manufacturing:
• Part setup. Product design has a profound effect on part setup. Excess
proliferation of parts complicates internal part distribution and may
make it impossible to have all parts available at all points of use. Even
a moderate excess of part types will cause setup delays to distribute,
find, and load parts into manual or machine bins. A greater excess of
part types may make it necessary to kit parts for every batch, which
is a significant setup. Part prep (such as cutting or bending leads on
electronic components) is another setup that can be avoided by using
versatile equipment or specifying parts that are delivered properly
prepared for the product and the processing equipment.
X-stop bar
158 • Design for Manufacturability
Y-stop bar,
fixed on
machine tool
bed
Part A
Part B
Part C
Machine Tool Bed
FIGURE 4.2
Flexible fixture.
• Fixturing setup. Designers can eliminate fixturing setup by concurrently engineering families of parts and flexible fixturing, an example
of which is shown in Figure 4.2 for parts A, B, and C. All dimensions
in the part family are dimensioned from the X datum and Y datum,
which are shown in Figure 4.2. The Z datum is the machine tool bed.
All parts in the family will be positioned against the X-stop bar and
the Y-stop bar. The CNC machine tool then knows where each part
is located and can thus perform all operations it is programmed to
do, without any setup delays to reposition parts or change fixtures.
For a milling machine bed, four flexible fixtures can be mounted on
the four corners of the bed, leaving the center of the bed for general-
purpose machining. Alternatively, quick-
change fixtures can be
developed to minimize fixture changeover times.
• Tool setup. Designers can eliminate tool change setup by designing parts around common tools (cutting tools, bending mandrels,
punches, etc.); ideally, one tool that never has to be changed. If multiple tools are required, designers must keep tool variety well within
tool changing capacity for the whole product line.
• Instructions. Designers need to work with manufacturing engineers
to concurrently develop simple assembly procedures, with instructions that can be located and understood in a few seconds, either on
a computer screen or on paper.
4.6.5 Parametric CAD
A wide variety of machined dimensions (for mass-customized or standard
parts) can be performed quickly and cost-effectively using a combination
Designing for Lean and Build-to-Order • 159
of CNC machine tools and parametric CAD, which stretches “floating”
dimensions and then automatically creates CNC programs as they are
needed by CNC machine tools.
Universal parametric templates can be created ahead of time for families of parts and structured so that, when the customized dimensions are
plugged in, the drawing transforms into a customized assembly drawing
which automatically updates customized part drawings.
Dimensional customization14 can be performed quickly and cost-
effectively using a combination of CNC machine tools and parametric
CAD. Another use of parametric CAD is to quickly show how changing a
parameter impacts the system.
4.6.6 Designing for CNC
CNC machine tools offer vast opportunities to eliminate machining
setup.15 CNC machine tools include metal cutting equipment (mills,
lathes, etc.), laser cutters, punch presses, press brakes, printed circuit
board assemblers, and basically any production machine controlled by a
computer. Designers need to understand enough about CNC operation to
use the versatility of CNC to eliminate setup.
4.6.7 Grouping Parts
The first step in designing for CNC is to structure compatible groups of
parts to be processed in each CNC machine—this was originally labeled
group technology.16 Of course, this must be based on the overall manufacturing strategy and flow of parts and products. This evolves from a serious
concurrent engineering activity in which the grouping and flow of parts
are a key element of the design team’s responsibilities. The grouping may
determine the type of CNC needed, or existing machine tools may specify
the grouping.
4.6.8 Understanding CNC
Once they thoroughly understand the range of parts to be made by each
CNC machine, the designers will need to understand the capabilities
and limitations of the equipment. This can be accomplished by studying the equipment specifications and talking to CNC operators. In fact,
the CNC operators should be on the design team to optimize the design
160 • Design for Manufacturability
and processing plans. Of course, the ultimate understanding would come
from actual CNC operational experience, either through prior work or a
job rotation program.
4.6.9 Eliminating CNC setup
The versatility of CNC provides unique opportunities for eliminating
setup if parts are designed properly. Ideally, all operations should be able
to be performed on one machine in a single fixturing, as recommended in
Guideline P14 in Chapter 9. Multiple machines will require extra fixturing
setups. Even if multiple specialized machines have higher speed ratings,
the total flow time through all operations, including setup, is what counts.
The value of eliminating these setups may justify a more sophisticated
CNC machine, compared to more setups on many cheaper machines.
In order to process parts in a single fixturing, designers need to specify
a suitable datum17 in each plane, from which all dimensions are referenced and which is suitable for clamping to a milling machine table or
lathe chuck. The part also must be designed so that all the operations can
be done in this fixturing. If all operations cannot, it is important that the
most critical dimensions are cut in the same fixturing, which will routinely achieve the best tolerance of the machine tool, usually ±.001″ or
better. However, removing a part to reposition for a subsequent cutting
lowers the accuracy of these critical dimensions because the tolerance will
then depend on the accuracy of the second positioning, which is usually
much worse than machine tool accuracy.
4.6.10 Developing Synergistic Families of Products
Product families must be based on all the following criteria:
1. Customer/marketing feasibility, with the focus on profitability
over completeness
2. Operational flexibility, so any variation can be built without delays,
onerous setup costs, and inventory carrying costs, ideally on demand
3. Supply chain responsiveness, so family variations will not have to
wait too long for parts and materials to be delivered and distributed
4. Design versatility to enable the above
Designing for Lean and Build-to-Order • 161
The mass customization strategy is
1. Standardize everything that is feasible at the architecture level.
2. Design the remaining variety to be easy to build quickly using CNC
processes from standard parts and materials that, ideally, are always
available at all points of use.
4.6.11 Strategy for Designing Product Families
Design versatile standard platform(s) around standard parts. As with all
standardization, versatile platforms may appear to cost more when looking at just BOM lines, but this strategy will result in less cost on a total
cost basis. Similarly, standard parts, modules, and materials may appear
to cost more when looking at just BOM lines, but this strategy will result
in less total cost.
For installed equipment or machinery, determine the optimal capacity/
performance steps—somewhere between (1) one-size-fits-all and (2) a
unique product for every order.
The overhead savings from a platform strategy will allow the entire
range of most variations to sell for no more than the lowest capacity/
performance version (probably less), thus giving customers better value
and possibly increasing sales at the high end of the range. Alternatively,
each variation could be priced at what the market will bear, thus bringing
in more profit.
Do not “value engineer” individual versatile products, parts, modules, or
materials without taking into account all the overhead savings, or the versatility may be eliminated “to save cost.”
Such a strategy should be based on satisfying the most profitable customer
segments, in preference to hard-to-build orders (usually the least profitable).
4.6.12 Designing Products in Synergistic Product Families
Design around aggressively standardized parts and raw materials. As with
other standardization, some of these strategies may appear to raise a BOM
line, but the total cost will be less for the whole product family.
162 • Design for Manufacturability
• Standardize on the same raw materials for baseline products and
anticipated customized options to avoid supply chain delays, inventory costs, and engineering changes to convert to more available
materials. Select standard parts and materials that are readily available; ideally, always available at all points of use. Make sure specified
parts are readily available throughout the life of the product, even if
more available parts appear to cost more.
• Select off-the-shelf parts to be versatile enough for all anticipated
applications for the current and anticipated family; for instance,
with enough capacity, power, ratings, margins, and tight enough
tolerances for all variations. For high-variety parts, specify flexible
CNC processes, such as any computer-controlled process or machine
tool or PC board assembler, in preference to inflexible processes, such
as castings, forgings, extrusions, PC bare boards, etc.
• Concurrently engineer product families that can be built on a programmable process and flexible fixtures. Establish flexible cells that
can build on demand any standard part or anticipated custom part.
This means that any part in the family can be built on demand without setup changes. Maximize the number of custom features that can
be fabricated during the initial CNC operations. Design versatile bare
circuit boards that have all the traces, pads, holes, vias, and connectors
for all PCB assemblies in the family. A variety of finished PCBs could
be assembled on demand by CNC pick-and-place machine tools.
• Consider additive manufacturing18 for low-volume variations when
it avoids tooling costs. Add extra mounting holes, knock-outs, and
access openings in initial fabrication, when it is almost free, to avoid
trying to add these later, when it is slow, costly, and may look crude.
Ensure mounting versatility for modular parts that may come in various sizes with enough space, connections, power, and mounting holes.
• Specify the original part selections to higher ratings, margins, capacities, etc. For instance, if the original requirements specify 150-volt
rating, specify a higher voltage in the part selection.
• Make custom or high-variety parts easy to customize with mass customization19 techniques. These techniques include parametric CAD,
quick machine tool program generation and loading, flexible fixtures, and versatile CNC machine tools building custom and high-
variety parts from standard stock on flexible fixtures.
• Avoid expensive tooling and setup charges for inflexible processes
such as molding, casting, forging, stamping, extruding, or bare PC
Designing for Lean and Build-to-Order • 163
boards. Consolidate inflexible parts into very versatile standardized
parts that can be used in many products.
• Utilize a postponement strategy20 and develop a versatile “vanilla”
platform that can be configured by adding preplanned “flavor” modules. Another version of postponement is ordering versatile semifinished parts in quantity and then doing specific operations on demand,
such as hole drilling or machining specific optional features.
4.7 MODULAR DESIGN
Modular design is a design technique in which functions are designed in
modules that can be combined into subsequent designs. A related concept
is “reusable engineering,” where portions of previous designs become the
basis of new designs. It is easy to do in CAD by copying previous design
details and transferring them to other drawings.
The benefits of reuse and modular design are (1) less engineering effort;
(2) more commonality among models for simpler supply chains and more
flexible operations; and, (3) better reliability from using proven parts and
designs (Chapter 10).
When this concept is extended to manufacturing, products may actually be assembled from “building block” modules. Care should be taken in
engineering to design standard interfaces for optimal flexibility. Catalog
hardware often has standard interfaces; for example, for motor mounts,
shaft couplings, fluid power and electrical connections, and so forth.
An effective modular design strategy would be to intentionally create
portions of designs that have general usefulness for whole families of current and future products. For instance, machinery could have modular
bases, frames, drives, gearboxes, controls, and cabinetry that could be
combined with specific functional modules.
4.7.1 Pros and Cons of Modular Design
Time-to-market for new products can be quicker if existing modules have
already been designed, documented, debugged, and certified. Off-the-shelf
modules can be utilized, like off-the-shelf printed circuit boards. Delivery
may be quicker if products can be assembled from standard modules.
Modularity can lead to broader product lines and be the foundation of
164 • Design for Manufacturability
a proactive upgrade strategy. Further, modularity can simplify maintenance and field service when defective modules can be replaced and then
repaired off-line.
Modularity can lower inventory levels and overhead cost compared to
several different versions of the integrated part or product. Widely used
modules have less vulnerability to lead-time delays. Plug-together modularity may simplify some assembly and accept third-party plug-in modules, such as in personal computers.
Modularity may be a key element in a postponement strategy.21
Postponement is a mass customization technique that is applicable for
certain products that can have some variety postponed until just before
shipping.
The cost of modularity can be determined only on a total cost basis.
Engineering costs will be lower if existing modules can be utilized, but
they may be higher if new modules and interfaces have to be designed.
The cost of manufacturing the interfaces may be more than an integrated
product, but using versatile modules on many products may lower costs
through economies of scale. Selecting existing modules would save the
costs and delays of testing and debugging, compared to an entirely new
integrated design.
Similarly, product testing may be easier if existing modules have already
been tested, debugged, and certified. Diagnosis efforts may be easier with
less functionality on each module. However, if all the modules in the
product are new, then tests will have to be devised and all the modules will
have to be tested and, if necessary, repaired. After the modules are tested,
the entire assembly may have to be tested again.
It may be possible that, for modular products, new modules could be
developed (for lower cost or better performance) that could be introduced
on current products and maybe even retrofitted to products in the field.
Then the new modules could be the foundation for new products. This is
one of the benefits of modular product architecture.
Modularity has some drawbacks too. Product development expenses may
be increased by the necessity to design modular interfaces. Modularity
may not be feasible for inherently integrated products. Modular interfaces
may compromise functionality by adding weight, weakening structures,
slowing electrical signals, or even causing signal interruptions at low voltage. In electronics, the extra connectors needed for modularity may cause
reliability problems or degrade performance. Module interfaces may result
Designing for Lean and Build-to-Order • 165
in undesirable visual aesthetics (such as seams, joints, etc.) or undesirable
acoustics (such as squeaks and rattles).
4.7.2 Modular Design Principles
Companies should invest in the design of modules that are versatile
enough for many products and product families. Individual projects may
not have the budget or resources to develop modules for many products.
Modules should be versatile enough to have general usefulness for many
current and future products. Modular principles include:
• Total cost basis. Do not look at module cost at the level of one project; look only at the total cost of all the products that will utilize the
modules.
• Reusable engineering. Modular design is not limited to physical
modules, but also could be reusable engineering or software code.
• Interfaces and protocols must be optimized at the system architecture level.
• Standardization. For maximum usefulness, modules must have
standard interfaces. Use industry-standard interfaces, if available; if
not, develop very versatile interfaces. Toyota engineers have a strong
sense of the vehicle as a system and consequently focus a great deal
of skill and energy at the design interfaces.22
• Clean interfaces. All modular interfaces should be clean and consistently easy to integrate together.
• Documentation. Document for modularity, with optimal CAD layer segregation, bills-of-material, software object identification, and so forth.
• Debugging. Minimize debugging costs by using existing modules
that have already been debugged. Some leading companies, like
Hewlett-Packard, feel that this is the best way to produce bug-free
software. With a high percentage of reuse, debugging efforts can
focus on new aspects.
• Consistency. Resist the temptation to “improve” modules, unless the
improvement is substantial and justifies the cost and time of design
changes, production changes, evaluation, debugging, and recertification or requalification. Do not attempt cost reduction on modules
unless the total cost savings for all applications justifies the development of a new-generation module.
166 • Design for Manufacturability
4.8 OFFSHORING AND MANUFACTURABILITY23
In a vain attempt to save cost, many companies are offshoring—designing
products in the United States for sale in the United States, but manufacturing them overseas—because their primitive cost systems make it appear
that this will save money. If all they quantify are parts and labor, like the
pie chart in Figure 6.2, then moving production to a low labor rate country
will appear to lower labor cost. If no other costs are quantified, like the pie
chart in Figure 6.3, outsourcing would be pursued based on a back-of-the-
envelope calculation.
However, manufacturing offshore for sale in the United States rarely
results in a net cost savings24 when measured on a total cost basis (Chapter 7),
considering differences in labor efficiency and all the costs of shipping, quality, inventory, communications, travel, training, and transferring products, support, and complete sets of equipment needed for any manufacture.
Further, offshore manufacturing compromises six of the eight cost reduction strategies that are presented on the home page at www.HalfCostProduct.
com, the most important being product development.
4.8.1 Offshoring’s Effect on Product Development
As pointed out in Figure 1.1, 80% of a product’s lifetime cumulative cost
is determined by product design. Unfortunately, offshore production
compromises all future design opportunities because it prevents concurrent engineering teamwork, which is the most promising opportunity for
achieving truly low-cost products.
Offshoring prevents this teamwork because design engineers and manufacturing people are not in the same country and not even working at the
same time. Without manufacturing involvement, engineers will design
products alone, throw them over the ocean, and get back parts that will
only be as manufacturable as the individual engineer’s DFM expertise, and
whose knowledge of the design guidelines may be limited. Further, dealing with all the problems of offshoring (see below) will be a resource drain
that, when combined with other counterproductive practices discussed in
Section 11.5, can consume two-thirds of product development resources!
Designing for Lean and Build-to-Order • 167
4.8.2 Offshoring’s Effect on Lean Production and Quality
Further, offshore plants, especially contract manufacturers, amortize their
setup charges by building in batches (mass production) and then shipping
across the ocean in batches. It is difficult to respond to volatile market
conditions when so much forecasted inventory is at the plant and in the
long pipeline in ships traveling across the ocean.
Womack and Jones, writing in Lean Thinking,25 summarize it succinctly:
“Oceans and Lean Production are not compatible.” They go on to say that
smaller and less-automated plants close to assembly plants and markets
will yield lower total costs, considering the cost of shipping, the inventory
carrying costs, and the cost of obsolescence when products built weeks
ago no longer satisfy customers.
So the enormous potential cost savings from Lean Production (summarized in Section 4.1) will not be realized because products cannot be
pulled26 by customer demand across oceans, nor could they be built to-
order (Section 4.2). The distance and remoteness will prevent the company from setting up flexible plants that could mass customize products
for niche markets or individual customers (Section 4.3), and thus cause it
to miss out on those paradigm-shifting opportunities (Section 4.9).
Without Lean Production and the design-for-quality contribution of
good concurrent engineering teamwork, as discussed in Chapter 10, quality and reliability will not be designed in or built in, so the home office will
have to rely on strict, and expensive, testing of all products followed by
repair costs or scrap costs followed by extra setup cost to build replacement
products and expedited shipping costs. Worse, if contract manufacturers
are selected by low bidding, quality will suffer even more, for reasons cited
in Section 6.11.
4.8.3 Offshoring Decisions
Labor cost is actually a small percentage of the selling price, and yet offshoring decisions are usually based entirely on labor cost because it is the
only processing cost that is quantified. But, any perceived savings for labor
are usually exceeded by the following hidden costs. These costs would not
be “hidden,” and decisions would be more relevant, if all overhead costs
were quantified with total cost accounting (Chapter 7).
168 • Design for Manufacturability
Some of the total cost considerations that should determine offshoring decisions include: labor efficiency (which could cancel out labor cost
savings); difficulty controlling operations that are not working at the same
time; product introduction delays (usually months later because of the
additional ramp); supply chain vulnerabilities; and shipping costs and delays,
especially when expediting is used to compensate for the above problems.
Further, labor rates often rise and tax benefits only last so long, until
the company ups the ante and increases the commitment, for instance, by
moving engineering overseas as well.
The most ironic reason to move production offshore is that the designs
are labor intensive. However, implementing the principles of this book can
reduce labor input to the point where moving to low-labor-rate areas is no
longer needed and can no longer be justified.
“Hidden” costs, all of which should be quantified by total cost (Chapter 7),
would include: quality costs and the delays to fix them; training costs, which
are higher than expected for hard-to-build products or where turnover is
high; offshore setup and administration costs and resource drains; transfer efforts and ongoing indirect support, which take resources away from
product development; travel costs, which are always more than estimated;
and “other” local costs that pose ethical and legal dilemmas.
Unfortunately for product development, the cost of setting up offshore
manufacturing and dealing with these hidden costs is usually paid for by
support people at the company headquarters—otherwise, the business
case for offshoring would collapse! Ironically, these support costs make
headquarters look even less efficient, which, perversely, encourages yet
more offshoring, thus resulting in a downward spiral.
Sadly, the final hidden cost of offshoring is the cost to move operations
back to where the products are designed after realizing all the above costs
or realizing how offshoring distracts from real cost opportunities in product development, operations, and quality programs.
4.8.4 Bottom Line on Offshoring
Setting up and operating offshore manufacturing doesn’t save money on a
total cost basis, but just trying compromises quality, delivery, and product
development, which could otherwise provide real cost reduction and new
high-profit opportunities. Rather than weakening local operations with
the burdens of offshoring, or eliminating local operations entirely, local
operations could then pursue more effective cost reduction by helping to
Designing for Lean and Build-to-Order • 169
design low-cost products, eliminating waste through Lean Production,
lowering the cost of quality, and setting up a flexible factory that could
build standard products and mass-customized versions on demand without the costs and risks of inventory.
If all of this does not make good financial sense, you need a better cost
system, as presented in Chapter 7.
4.9 THE VALUE OF LEAN BUILD-TO-ORDER
AND MASS CUSTOMIZATION27
Extending Lean Production to build-to-order and mass customization
(BTO&MC) represents a business model that offers an unbeatable combination of superior responsiveness, cost, and what customers want when
they want it. It enables companies to build any product on demand without forecasts, batches, inventory, or working capital.
BTO&MC companies can grow sales and profits by expanding sales of
standard, customized, derivative, and niche market products while avoiding the commodity trap. BTO&MC companies are the first to market with
new technologies because distribution pipelines do not have to be emptied first.
BTO&MC substantially simplifies supply chains—not just “managing”
them—to the point where parts and materials can be spontaneously
pulled into production without forecasts, MRP, purchasing, waiting,
or warehousing.
Build-to-order is the best way to resupply stores who demand rapid
replenishment, low cost, and high order fulfillment rates without the classic inventory dilemma: too little inventory saves cost but creates out-of-
stocks, missed sales, expediting, and disappointed customers; too much
inventory adds cost and costly obsolescence risks. When inventory carrying costs are taken into account, profits are completely wiped out after
only five months of products sitting in finished goods inventory.28
Mass customization can efficiently customize products for niche markets, countries, regions, industries, and individual customers. There is a
natural synergy between build-to-order and mass customization. They
share the same batch-size-of-one operations and spontaneous supply
chain. Build-to-order and mass customization operations are equally efficient and very compatible, unlike situations where a mass customization
170 • Design for Manufacturability
experiment must be run separately from the batch-and-queue operations
of mass production. Manufacturing build-to-order and mass-customized
products on the same lines will often push the combined volume over the
critical mass threshold necessary to justify these implementations.
The following are several elements of the value of build-to-order and
mass customization.
4.9.1 Cost Advantages of BTO&MC
BTO&MC companies enjoy substantial cost advantages, which they can
use for competitive pricing, reinvestment, or enhancing profits. BTO&MC
principles attack several categories of total cost to achieve the absolute
lowest prices—or competitive prices with higher profits.
One of the greatest cost advantages of build-to-order is the elimination of
all the costs caused by inventory: inventory carrying costs (usually 25% of
value per year29), warehousing costs, administrative expenses, obsolescence
write-offs, and discounting to sell unsold or obsolete inventory. Incoming
just-in-time part deliveries minimize inventory costs for parts and materials. Flow manufacturing and setup/batch reduction efforts can virtually
eliminate work-in-process (WIP) inventory costs. Building to order and
shipping direct can virtually eliminate finished goods inventory costs.
Build-to-order minimizes or eliminates many other overhead costs for
forecasting, MRP, purchasing, expediting, scheduling, planning, setting
up production, and the extra sequence of activities required when forecasted inventory cannot satisfy demand: re-forecasting, re-purchasing,
re-expediting, re-scheduling, re-planning, and re-setting-up production.
Building without batches eliminates the costs of setup changes, kitting, and the loss of expensive machine time and valuable resources. The
rapid feedback aspect of flow production eliminates the cost of recurring
defects, which are more likely to happen with large batches.30
Lean Production eliminates many categories of waste and inefficiencies,
as discussed in Section 4.1. All the inefficiencies of mass production—lower
productivity and the lack of the ability to shift production between lines—
raise costs and cause the mass producer to need more overtime than the more
efficient and flexible BTO&MC company. Eliminating inventory, incoming
inspection, and kitting saves significant floor space cost, which can delay or
eliminate the need to build more factory or warehouse space for growth.
Customization and configuration costs are less because they are proactively planned and executed efficiently, instead of the very inefficient craft
Designing for Lean and Build-to-Order • 171
production and fire-drill activities used in most companies. Learning relationships make repeat orders more efficient.31
Concurrently engineering products for manufacturability generally results
in significant cost savings, but these are more profound for BTO&MC companies because of the greater opportunities to design out several categories of overhead cost.
Optimal utilization of flexible CNC automation saves labor cost. Flexible
fixturing and setup reduction makes CNC even more efficient.
Distribution costs are less for BTO&MC goods because shipping is more
direct, finished goods inventories are eliminated, and expediting is not
needed to rectify shortages.
Finally, using product line rationalization (Appendix A) and total cost
measurements (Chapter 7) to eliminate high-overhead/low-profit products eliminates the loser tax on cash cow products, thus letting them sell
for less or make more profit. This advanced business model eliminates the
need to discount or take low-margin sales.
4.9.2 Responsive Advantages of BTO&MC
BTO&MC companies build products on demand, instead of having to
forecast, order, wait, build, and stock. For phone and web sales, 100% of
orders can promptly be shipped directly from the BTO&MC factory. One
reason the “e-commerce revolution” didn’t live up to its expectations is
because of poor availability and delays. Poor availability is intrinsic in any
system that sells from forecasted inventory, which depends on inherently
unreliable forecasts. Delays will be common when shipping from inventory or trying to build to-order in a mass production environment.
If customers want to buy something right now off the retail shelf,
BTO&MC suppliers can resupply those shelves better than anyone can from
inventory, so a complete selection will always be available to customers.
Stores and dealers that order frequent shelf replacements from BTO&MC
suppliers will develop a good reputation for availability and eventually generate a loyal customer base that keeps coming back because they know that
they will always find what they want; for example, for clothing, customers
will always find the style they want in their size. Learning relationships
make repeat order fulfillment quicker with each order. BTO&MC companies are the fastest to adjust to changing market conditions.
New product development and introduction can be faster when new
products are just “variations on a theme” that are easier to develop because
172 • Design for Manufacturability
of modularity, parametric CAD, and flexible processing. Production
ramps can be faster on flexible lines that don’t have to be “tooled up” for
new products. A Wall Street Journal article reported that flexible automobile makers are able to release different versions of a car throughout the
year instead of the traditional single release in the fall.32
BTO&MC companies are the first to introduce new technologies into the
marketplace because they don’t have to first empty the pipeline of obsolete
products, which usually must be discounted to clear the pipeline. Even if
that was not an issue, shorter direct distribution channels can speed new
products faster to customers who can’t wait for the latest and greatest.
If new product introductions result in greater than expected growth,
the BTO&MC company can meet upsurge demands by transferring production to other flexible lines, as in Lean Production plants. BTO&MC
implementations free up floor space, which can then be used for growth.
Thus, growth will be less likely to be hampered by shortages of floor space.
Standard parts are available from more sources with more total capacity, so standard parts will be more readily available in times of rapid
growth. Optimal responsiveness is also assured by supply chains that
allow assemblers to pull parts quickly without lengthy hand-offs or dependence on forecasted parts inventory.
Distribution is more direct, and therefore faster, for built-to-order goods,
without delays caused by shuffling inventory from factories to warehouses
to distribution centers and then to customers or stores. Eliminating inventory and many nodes in the distribution chain is not only quicker but
also eliminates order aberrations and demand swings caused by the order/
response lag time inherent in slow, multi-node distribution chains. This
is the lesson taught in the supply chain simulation, developed at MIT,
called the beer game,33 which can be “played” by executives in a conference room34 or as a web-based game.35
For capital equipment companies, quicker product delivery itself may be a
competitive advantage. In addition, responding to RFQs (requests for quotations) will be quicker with configuration software and less susceptible to
subsequent delays due to order-entry errors and customer-induced changes.
4.9.3 Customer Satisfaction from BTO&MC
BTO&MC can provide unmatched customer satisfaction for industrial
clients or the ultimate consumers. Consumers will be satisfied by products always available at the best prices. OEM and industrial clients will
Designing for Lean and Build-to-Order • 173
be satisfied by receiving parts on demand to support their build-to-
order efforts.
Mass customization will enable even higher levels of customer satisfaction for customers who can quickly receive high-quality, low-cost products specifically customized to their individual needs. For customized
products, customers can make better choices and consider more “what-if
scenarios” with configuration software. Even if individual customization
is not appropriate, customer satisfaction will be enhanced when products
are customized for their culture, group, country, or region.
Certain aspects of BTO&MC enhance quality from supplier relationships emphasizing quality, continuous improvement (kaizen), and rapid
feedback that prevents recurring defects. A higher proportion of flexible
CNC operations improves quality with more consistent tolerances.
Learning relationships enable the BTO&MC company to learn and
adapt from each order, thus satisfying customers better on the next order
and progressively developing more committed customers.
4.9.4 Competitive Advantages of BTO&MC
Competition now is between business models—the company with the best
business model will be the best competitor. Ironically, the subjects of several best-selling business books, leadership and execution, will only drive
a company faster down the wrong path if they have the wrong business
model. Dartmouth Business School Professor Sidney Finkelstein, writing in Why Smart Executives Fail: And What You Can Learn from Their
Mistakes, concluded that, “The real causes of nearly every major business
breakdown are the things that put a company on the wrong course and
keep it there.”36
As a business model, build-to-order and mass customization will compete well against competitors both large and small because of a superior
combination of speed, cost, and customization. Without a superior business model, companies might have to compromise profits to enhance market share. BTO&MC avoids the worst-case competitive position, where
products revert to commodity status, with purchasing decisions made
solely on price.
BTO&MC company products can avoid commodity status with the
differentiation aspects of build-to-order (delivery, cost, quality, etc.) and
mass customizing products to better satisfy customers. Learning relationships result in greater customer loyalty with each order.
174 • Design for Manufacturability
BTO&MC companies have the agility to expand business into adjacencies, niche markets, derivatives, and so forth. Finally, all the above
advantages can create a reputation as a leader, which further improves
sales, impresses investors, and attracts the best talent.
4.9.5 Bottom Line Advantages of BTO&MC
Lower total cost results in increased profits or a lower selling price, or
both. Faster delivery, better quality, and lower cost can grow revenue and
market share. Agility allows expansions into new markets. Additional
value-added work offers high profit opportunities. With enough competitive advantage, premium prices may be possible.
Chapter 14 of the author’s Build-
to-
Order & Mass Customization
presents “The Business Case for BTO&MC.”37 Chapter 13 of the same
book is on implementation. The author’s customized in-house seminars
(Appendix D.5) and implementation workshops (Appendix D.6) show
businesses how to implement all aspects of on-demand Lean Production,
build-to-order, and mass customization.38
NOTES
1. James P. Womack and Daniel T. Jones, Lean Thinking: Banish Waste and Create
Wealth in Your Corporation (1996, Simon & Schuster), p. 27.
2. “Dock-to-line” may sometimes be referred to by the more ambiguous title of “dock-
to-stock,” which technically means parts go from the dock to some form of incoming
inventory “stock” area without inspection.
3. David M. Anderson, Build-to-Order & Mass Customization: The Ultimate Supply
Chain Management and Lean Manufacturing Strategy for Low-Cost On-Demand
Production without Forecasts or Inventory (2008, CIM Press). See description in
Appendix D.
4. Ibid., Chapters 3–9.
5. Ibid., Chapter 9, “Mass Customization.”
6. Ibid., Chapter 8, “On-Demand Lean Production”; see section on “Setup and Batch
Elimination.”
7. Ibid., Chapter 7, “Spontaneous Supply Chain.”
8. Ibid., Chapter 7, section on “Material Cut to Length.”
9. Ibid., Chapter 7, “Spontaneous Supply Chain.”
10. Ibid.
11. Ibid., see Figure 8.1, “Build-to-Order & Mass Customization for Fabricated Products.”
12. Ibid., Chapter 6, “Outsourcing vs. Integration.” Also see the article on outsourcing
at www.HalfCostProducts.com/outsourcing.htm and a discussion of offshoring at
www.HalfCostProducts.com/offshore_manufacturing.htm.
Designing for Lean and Build-to-Order • 175
13.
14.
15.
16.
17.
18.
19.
20.
21.
22.
23.
24.
25.
26.
27.
28.
29.
30.
31.
32.
33.
34.
35.
36.
37.
Ibid., Chapter 7, “Spontaneous Supply Chain.”
Ibid., Chapter 9, “Mass Customization.”
Ibid., Chapter 8, see the section, “CNC to Eliminate Machining Setup.”
Charles S. Snead, Group Technology: Foundation for Competitive Manufacturing
(1989, Van Nostrand Reinhold).
The datum concept is a key element of geometric dimensioning and tolerancing
(GD&T), from the ANSI Y14.5 standard.
Terry Walters and Tim Caffrey, “Additive Manufacturing Going Mainstream,”
Manufacturing Engineering, June 2013.
Anderson, Build-to-Order & Mass Customization, Chapter 9, “Mass Customization.”
Ibid., Chapter 9, “Mass Customization,” p. 293.
Ibid., Chapter 9, “Mass Customization.”
James Morgan and Jeffrey K. Liker, The Toyota Product Development System (2006,
Productivity Press), Chapter 4, “Front-Load the PD Process to Explore Alternatives
Thoroughly.”
Anderson, Build-
to-
Order & Mass Customization, Chapter 6, “Outsourcing
vs. Integration.” Also see the articles on outsourcing and offshoring at www.
HalfCostProducts.com/outsourcing.htm and also www.HalfCostProducts.com/
offshore_manufacturing.htm.
Anderson, Build-
to-
Order & Mass Customization, Chapter 6, “Outsourcing vs.
Integration.”
James P. Womack and Daniel T. Jones, Lean Thinking: Banish Waste and Create
Wealth in Your Corporation (1996, Simon & Schuster), p. 224.
Ibid., Chapter 3, “Pull.”
Anderson, Build-to-Order & Mass Customization, Chapter 14, “The Business Case for
BTO&MC.”
Ibid., Figure 2.2, “How Inventory Erodes Profits over Time When Selling from
Finished Goods Inventory,” which assumes 10% profit margin and 25% inventory
carrying cost per year.
Ibid., Figure 2.1, “Inventory Carrying Cost since 1961” which shows the average carrying cost at 25% of value per year.
Ibid., See the section in Chapter 2, “Defects by the Batch.”
B. Joseph Pine, II, Don Peppers, and Martha Rogers, “Do You Want to Keep Your
Customers Forever?” Harvard Business Review, March–April 1995, p. 103.
Jonathan Welsh, “A New Status Symbol: Overpaying for Your Minivan; Despite
Discounts, More Cars Sell Above the Sticker Price,” Wall Street Journal, July 23, 2003,
p. B1.
The beer game website is http://supplychain.mit.edu/games/beer-game.
The on-site beer game is usually led by an experienced facilitator who provides the
game boards and order tokens. This is a fun exercise that can be played in a few hours
with teams that represent stores, sales, distribution, and manufacturing, who quickly
experience the effects of unstable demand swings propagating throughout the distribution network.
The web-based beer game site is http://supplychain.mit.edu/games/beer-game.
Sydney Finkelstein, Why Smart Executives Fail: And What You Can Learn from Their
Mistakes (2003, Portfolio/Penguin), p. 138.
Anderson, Build-to-Order & Mass Customization, Chapter 14, “The Business Case for
BTO&MC.”
176 • Design for Manufacturability
38. The author offers in-house customized seminars on build-to-order and mass customization that summarize the shortcomings of mass production and how costs
rise exponentially with increasing variety and market volatility in a batch-and-
queue environment. The interactive seminar also shows how to establish spontaneous supply chains, build parts and products on-demand, eliminate setup, develop
flexible cells, mass customize products, develop products for BTO&MC, standardize parts, and rationalize products, and then how to implement all of the above,
with optional workshops focused on implementation. Also see the “seminars”
page at www.build-to-order-consulting.com/seminars.htm or inquire by email at
anderson@build-to-order-consulting.com.
5
Standardization
Standardization of parts and materials is a fundamental aspect of DFM
that can simplify product development efforts, lower the cost of parts
and materials, drastically reduce material overhead costs, simplify supply chain management, improve availability and deliveries, raise quality,
improve serviceability, and support Lean Production, build-to-order, and
mass customization. The standardization procedure presented herein is a
powerful tool that can achieve many positive results for new designs.
Standardization enables Lean Production, with deliveries that are
faster, more frequent, more dependable, and less affected by shortages.
Standard parts can be selected to eliminate the problems of long-lead-time
parts and materials by choice. Standardization also leads to more efficient
internal distribution—for fewer parts—with dock-to-line deliveries possible. Automatic resupply and steady flows will be possible (Section 4.2),
thus eliminating the dependence on forecasts, MRP, and purchase orders.
Standardization can reduce cost with better purchasing leverage and
economy-of-scale savings. Standardization will reduce inventory carrying
costs for parts and materials, saving 25% of the value of eliminated inventory per year. Widespread use of standard parts will result in less expediting
and fewer change orders to solve availability problems. Further, standardization can reduce material overhead to 1/10 of nonstandard parts, which
reflects savings in purchasing efforts and encourages engineers to specify
standard parts. Finally, aggressive standardization enables build-to-order
and mass customization, which reduce costs in many ways, as discussed
in Chapter 4.
Steady flows of standard parts can be ordered and projects will be able
to borrow from each other in emergencies. Minimum part variety will
allow compact workstation size to encourage flow, U-shaped lines, and
177
178 • Design for Manufacturability
kanban-supplied workstations (Figure 4.1). Standardization will minimize
work stoppages, shipping delays, fire drills, and penalties from parts being
out of stock. Finally, standardization will improve productivity.
Standardization improves product development, with less purchasing effort for purchasing, thus allowing more purchasing participation in
product development teams to establish vendor partnerships. This also
ensures that there will be more thorough searches for off-the-shelf parts
early before arbitrary decisions preclude their use. Standardization also
results in more thorough qualifications to ensure the highest quality, lowers quality costs, and eliminates change orders to replace inadequate parts.
More focused purchasing can also ensure availability throughout the life of
the product, thus avoiding expediting, out-of-stocks, missed sales, end-of-
life buys, and change orders to substitute more available parts.
With standardization, design teams can concurrently engineer Lean
workstations, with each designed around one procedure, one versatile fixture utilizing one standard fastener with one torque setting, one wrench,
one gauge, and so forth.
Standardization improves quality because procurement will have the
time and focus to (1) search for the best quality parts and (2) qualify them
before they can be specified. Keep in mind that high quality parts will
raise product quality, especially in complex products, where product quality degrades exponentially as part count rises (see Section 10.3). These
high-quality parts remove that variable from quality assurance and product development efforts.
Standardizing critical parts will focus more thorough efforts to select
those parts, evaluate them, and ensure processing will be consistent with
process capabilities. This avoids the design practice of “rescuing” designs
with unusual parts, which may be hard to get and may complicate supply
chains, put quality at risk, and thwart standardization, which is especially
important for critical parts.
Finally, standardization, employing poka-yoke (mistake-proofing) ensures
less chance of assembling the wrong part, as presented in Section 10.7.
This chapter presents a powerful, yet easy-to-implement standardization
procedure, which can reap enough benefits to be well worth the effort as a
stand-alone program. A more expanded treatment of standardization can
be found in Build-to-Order & Mass Customization, which has one chapter
on part standardization and another on material variety reduction.”1
Standardization • 179
Hereafter, the word “part” also includes material and subassembly. The
phrase “material overhead” includes all these categories.
5.1 PART PROLIFERATION
Competitive pressures are forcing manufacturers to look at all the ways to
lower total cost and improve flexibility. One of these thrusts is to investigate and reduce the cost of part and material variety.
An electronics company had 1,500 different types of resistors, including 120 different kinds, sizes, and tolerances of 1,000 ohm resistors.2
That company was able to reduce the 1,500 resistor types to less than 200
actively used for manufacturing.
One of the author’s clients that made consumer products discovered that
it was using the following numbers of different part types: 1,248 wire assemblies, 152 motors, 151 screws, 74 switches, 67 relays, 65 capacitors, 37 valves,
16 transformers, 62 types of tape, and 1,399 different “standard” labels.
Every company has similar “horror stories” with regard to part proliferation. One might ask, why?—especially considering the fact that part
proliferation raises part and overhead cost, impedes flexibility, and, as will
be shown later, is really unnecessary.
5.2 THE COST OF PART PROLIFERATION
Part proliferation is expensive. A Tektronix study determined that half
of all overhead costs related in some way to the number of different part
numbers handled.3 Most companies do not even know how much that cost
is in dollars. A survey of several Fortune 500 manufacturing companies
revealed that not a single company or division had an accurate estimate of
the cost of a part over its lifetime!4 According to Venkat Mohan of CADIS,
Inc., who markets parts management software, “intuitive estimates range
from $5,000 for a standard part to as high as $60,000 or even $100,000 per
part for custom parts.”5 James Shepherd, director of research for Advanced
Manufacturing Research (AMR), Boston, says that in electronics, the cost
of just entering new purchased components is between $5,000 and $10,000
per component.6 The Ernst & Young Guide to Total Cost Management
180 • Design for Manufacturability
states, “It is not surprising that manufacturers have estimated the annual
administrative cost of each part number to be $10,000 or more.”7
In addition to these official materials costs, excessive part proliferation
adds cost to field service and manufacturing in important, but rarely measured, ways related to setup, inventory, floor space, lower machinery utilization, and other flexibility issues.
Part proliferation also lowers assembly productivity. In a Wharton
Business School report about the automobile industry, Fisher, Jain, and
MacDuffie wrote that, “Part variety also appears to have the greatest negative impact on assembly plant productivity.”8
5.3 WHY PART PROLIFERATION HAPPENS
Part proliferation happens for the following reasons, which are all easily
avoidable:
• Engineers don’t understand. Most product designers do not understand the importance of part standardization and, therefore, do not
attempt to design around standard parts. An example of this attitude was discovered when the author was soliciting feedback from
engineers on a proposed standardization list (which was generated
by techniques described below) for resistors. One electrical engineer
commented, “Why are we standardizing on resistors? Aren’t they
cheap and aren’t they in the computer?” What this engineer did not
realize is that regardless of a part’s cost and the company’s ordering
and tracking sophistication, every part must be physically delivered
to the plant, possibly inspected and warehoused, and then distributed to each point of use. One solution to this perception problem
would be training and education that stresses the importance of part
standardization and connects it to corporate goals.
• “Not invented here.” Sometimes standardization is resisted because
of the not-invented-here syndrome. That mind-set can be countered, however, by teamwork, training, and encouraging engineers
to make the best choices for the product, for the customer, and for
the company.
• Arbitrary decisions. Product designers make many arbitrary decisions when specifying parts. They may arbitrarily specify a fine-pitch
Standardization • 181
⁄16 bolt with a button head that is 7⁄16″ long when a more common
course-pitch ⅜″ hex bolt that is ½″ long could have done the job just
as well. Section 1.8 discusses the general problem of arbitrary decisions in product development.
Electronic engineers at Intel’s Systems Group said that for digital
circuitry, they did not really need any resistor values between 1,000
and 2,000 ohms. From this feedback, those values were immediately
deleted from the approved parts list for new designs.
• Many versions of the same part to “save cost.” When product designers
are pressured to lower cost, and all that is measured is part cost, they
sometimes specify the cheapest version of a part for each application.
This may appear to lower the part cost by a few pennies, but such a
proliferation will generate much greater overhead costs. For example,
one manufacturer of medical equipment had 11 different versions of
1K resistors on a single circuit board! The engineers thought they were
saving cost by specifying the cheapest tolerance and wattage for each
application. However, not only did this practice cause rampant part
proliferation, it also forced the board to be run through the assembly machine twice because there were more parts than bins available
on the assembly machine. The standardization principles presented
herein encourage using the best single version for all applications.
• The minimum weight fallacy. A phenomenon that may be contributing to part proliferation is the fallacy that all parts have to be
sized “just right”—to have the minimum weight and be made of the
minimum amount of materials. Engineers may resist standardization because the standard part may be the next larger size to ensure
adequate strength and functionality. The following rules of thumb
may help guide engineers get past this obstacle:
5
If it doesn’t fly or accelerate quickly, use the next larger size standard part.
If it isn’t made of precious metals, use the next larger size standard part.
• Qualifying part families. A related cause of part proliferation is
the practice of qualifying (for entry on approved parts lists) entire
families of parts, such as fasteners, resistors, and capacitors. Intel’s
Systems Group discovered that out of 20,000 approved parts for
printed circuit boards and computer systems, 7,000 had never been
used! In other words, more than one-third of the approved parts
were not used on any product. And, yet, any engineer could have
182 • Design for Manufacturability
arbitrarily chosen one of those unused parts and entered a new part
into the system without any approval or authorization. In this case,
those unused parts were immediately deleted from the approved
parts list for new designs.
• Contract manufacturing. Sometimes, a shortsighted business strategy undermines standardization efforts. Some companies, in
response to downturns, respond to the pressure to “fill the factory”
by, in essence, becoming a contract manufacturer. This use-it-or-
lose-it approach may bring in some additional revenue, but it often
loses money in the long run. This loss would be understood if computations included total cost issues such as the overhead expense to
support such part diversity and, of course, the substantial learning
curve expense needed to gear up to build many new products.
• Mergers and acquisitions. Another cause of excessive internal variety is the merger of dissimilar products through corporate mergers
and the acquisition of companies, products, patents, and so forth.
Products that originated in different companies are likely to have very
different parts and processes. Thus, manufacturing flexibility should
be added to the list of primary factors that determine such decisions.
• Duplicate parts. When product designers do not know what parts
exist, they will often add a “new” part to the database, even when
the identical part already exists. Even if they suspect that the needed
part exists, they will probably specify a new purchased part if it takes
less time than finding an existing one. Similarly, they will probably
design a new part if it takes less time than finding an existing one.
Typically, engineers find it much harder to search through awkward
databases than to design new parts or purchase them.
Many companies have hundreds of incidents of duplicates, triplicates, or even several versions of the exact same part, existing under
different company part numbers, plus even more situations where
a close existing part could have been used instead of introducing a
new part.
Upon the author’s suggestion, one aerospace company investigated
this and found that it had 900 different types of spacers! Apparently,
it was easier to design number 901 than to search through all 900
existing spacers. So, every time engineers needed a spacer, they just
designed a new one! The fallacy in their thinking was that spacer
design appeared to be “easy,” but, in reality, the documentation,
Standardization • 183
procurement, manufacture, storage, and distribution of 900 spacers
were not “easy.”
When a large machine tool company investigated this phenomenon, it discovered that it had 521 very similar gears. They eventually
reclassified all those gears into 30 standard gears.9 There had been
17 times more gear types than necessary! Every gear had an average
of 17 duplicates.
5.4 RESULTS OF PART PROLIFERATION
The net result of part proliferation is that most companies have thousands or
even hundreds of thousands of different part types (unique part numbers).
Such internal variety is rarely necessary and is usually the result of careless—often rampant—proliferation of parts. The absence of any standardization goals or awareness allows designers to simply choose new parts for
new designs, without any consideration of prior usage of similar parts.
Every company can investigate the extent of part proliferation by simply looking up the total number of active part numbers for all part categories. In many cases, the proliferation will seem obvious, even to the
most casual observer. Another revealing investigation would be to summarize the materials budget for all the overhead expenses related to parts.
Hopefully, these investigations will provide the motivation to eliminate
existing duplicate parts and to substantially reduce part types for new
designs using the very effective procedures presented here.
5.5 PART STANDARDIZATION STRATEGY
5.5.1 New Products
Part standardization presents the greatest opportunities for new designs
or redesigns. Usually it would cost too much to convert existing designs,
part by part, and there may be issues with replacement part backwards
compatibility. In addition, changing existing designs may be precluded by
current qualifications of existing products.
184 • Design for Manufacturability
5.5.2 Existing Products
The main opportunities for existing products are for “better-than” substitutions. If this is an opportunity, then the standard parts and materials
lists would focus on the better grades. In most cases, the overhead savings
and supply chain benefits resulting from standardization would far exceed
any perceived cost increase for better materials.
As new products with standard parts and materials are phased in, manufacturing operations and procurement will realize more benefits. When
the products with the standard parts and materials reach a certain critical-
mass threshold, the factory will benefit from eliminating the remaining
unusual parts and materials. At this point, the old products can be redesigned around standard parts, outsourced out of the plant, or rationalized
away, using the procedures of Appendix A.
5.6 EARLY STANDARDIZATION STEPS
5.6.1 List Existing Parts
Many parts lend themselves to listing in a logical order, as examples
shown in Figure 5.1. For these parts, simply list all existing parts in order,
circulate the lists to the design community, and encourage engineers to
use existing parts whenever possible. This step should be done immediately to at least stop designers from adding new parts when they could
Part Type
Listing Order
Threaded fasteners
Washers/spacers
Gears
Gearboxes
Motors
Pumps
Power supplies
Resistors
Capacitors
Diameter, pitch, length, head type, grade
O.D., I.D., thickness, material, finish
Pitch, number of teeth, face width, material
Ratio, horsepower, shaft orientations, shaft diameters
Horsepower, voltage, phase, shaft diameter, mount
Pressure, flow rate
Output voltage, wattage
Ohms
Microfarads
FIGURE 5.1
Examples of part type listing orders.
Standardization • 185
use an existing one. A procedure will be presented below for determining
preferred part values from these lists.
5.6.2 Clean Up Database Nomenclature
It may be necessary to clean up part and material databases before proceeding further. If every part in a category does not have consistent
nomenclature, which is often the case for threaded fasteners, it may be
hard to sort and identify duplicates. So it may be necessary to convert
multiple labels to the most common or most logical label. If it is too hard
to convert the official database, then extract the information and change it
in a database used for the standardization effort.
5.6.3 Eliminate Approved but Unused Parts
Many parts are approved in families and entered into the approved parts
list en masse. Many of these parts have never been used. If they are left on
the list, any engineer could add a new part into manufacturing without
approval or authorization. So the first step would be to identify approved
parts that have never been used and immediately remove them from the
list for new designs.
5.6.4 Eliminate Parts Not Used Recently
It would be logical to assume that parts that have not been used recently
would not be good candidates for any standardization list for new designs.
For the standardization effort, eliminate for consideration any part or
material not ordered in the last few years—this could be two to five years,
depending on the product life cycles. This would not eliminate these parts
from the approved parts lists, which may be needed for spare parts or infrequently built products; however, operational flexibility can be improved if
these unusual products are rationalized to eliminate or outsource infrequently built parts and spare part production (see Appendix A).
5.6.5 Eliminate Duplicate Parts
The problem with multiple part numbers for the same part goes beyond
the obvious extra material overhead cost of carrying extra parts. Most
likely, the similar parts would be ordered separately for each product that
needed them. This would prevent purchasing from obtaining quantity
186 • Design for Manufacturability
discounts and just-in-time deliveries that would be possible with a consolidated order. Further, the smaller order quantities increase the chances
of shortages for a given part. Ironically, the missing part that delays production might be sitting in another bin under a different part number.
The problem becomes more severe for Lean Production, build-
to-
order, or mass customization if different products are using the same
part under different part numbers. Automated assembly equipment, such
as for printed circuit board assembly, may have to load the same part in
multiple bins. Even if the machine operator notices that some of the parts
seem similar, the operator does not have the time nor the authorization to
consolidate parts on the spot. This duplication alone may prevent flexible
operations if there are more parts (including duplicates) in the product
family than there are bins in the equipment. If this is the case, then parts
would have to be reloaded twice for each product, which is the type of
setup that must be eliminated for flexible operations.
Using part management software, Tektronix was able to deactivate
32,000 part numbers from an active base of 150,000. Bob Vance, Tektronix
VP and chief information officer, summarized the return on eliminating
excess parts: “There are few areas where a manufacturing company can
make such a significant impact to its bottom line with so little effort. We
want to invest our resources in product innovation and customer services,
not carrying an overburdened parts inventory.”10
An easy way to stop the introduction of duplicate parts is to make it easier to find existing parts than to release new ones, as shown in Figure 5.1.
Then, the duplicate parts should be eliminated and consolidated into a
shorter list of unique parts.
5.6.6 Prioritize Opportunities
Because the standardization procedure presented next must be performed
for every category of parts and materials, it is important to prioritize
opportunities and start with categories with the following characteristics:
• Unnecessary proliferation, which is typical for fasteners, resistors,
certain raw materials, and so forth
• Excessive parts/materials inventories
• Excessive material overhead costs to procure a proliferated variety
Standardization • 187
• Missed opportunities for automatic resupply, such as kanban and
breadtruck, because of the excessive variety
• Kitting parts required because there are too many parts to distribute
at all points of use
• Excessive setup changes if there are more part types than bins on
automatic assembly machines; for instance, for printed circuit boards
• Production delays caused by shortages
• Excessive expediting
In addition to these criteria, valuable insight can be gained simply by asking employees to rank the categories. Employees can be given a list of all
major categories and be asked to vote.
5.7 ZERO-BASED APPROACH
There is an easy-to-apply approach that is more effective than part type
reduction measures, which require tremendous efforts for their return.
Reducing active part numbers, say from 20,000 to 15,000 will, in fact,
lower material overhead somewhat, but it may not reach the threshold
(eliminating part-related setup) that would enable the plant to build products flexibly without delays and setups to get the parts, kit the parts, or
change the part bins.
Instead, the most effective technique to reduce the number of different
parts (part types) would be to standardize on certain preferred parts. This
usually applies to purchased parts but it could also apply to manufactured
parts and raw materials. The methodology is based on a zero-based principle that asks the simple question: “What is the minimum list of part types
we need to design new products?”
Answering this question can be made easier by assuming that the company, or a new competitor, has just entered this product line and is deciding which parts will be needed for a whole new product line. One of the
advantages of new competitors is the ability to start fresh, without the old
“baggage”: too many parts. Just imagine that a competitor simultaneously
designed the entire product line around standard parts. Now, imagine
doing the same thing internally. This is called the zero-based approach.
188 • Design for Manufacturability
The zero-based approach, literally, starts at zero and adds only what is
needed, as opposed to reducing parts from an overwhelming list. An analogous situation would be cleaning out the most cluttered drawer in a desk,
a purse, or a glove compartment: removing unwanted pieces would take
great effort and still not be very effective. The more effective zero-based
approach would be to empty everything from the cluttered drawer into a
box labeled “garbage” and add back to the drawer only the items that are
essential. The difference in these approaches is where the clutter ends up:
still in the drawer, purse, or glove compartment or in the garbage can.
Similarly, parts reduction efforts have to work hard to remove the clutter (excess part variety) in the system, whereas the zero-based approach
excludes the clutter from the beginning. The clutter is the unnecessary part
proliferation that would have not been needed if products were designed
around standard parts. Not only do these excess parts incur overhead
costs to administer them, they also lower plant efficiency and machine
utilization because of the setup caused by too many parts to distribute at
every point of use.
This approach determines the minimum list of parts needed for new
designs and is not intended to eliminate parts used on existing products,
except when the standard parts are functionally equivalent in all respects.
In this case, the new standard part may be substituted as an equivalent
part or a better-than substitution, where a standard part with a better tolerance can replace its lesser counterpart in existing products.
Even if part standardization efforts apply only to new products, remember that in these days of rapid product obsolescence and short product
life cycles, all older products may be phased out in only a few years, especially when companies rationalize away their fading products before they
become a drain on resources (see Appendix A).
5.8 STANDARD PART LIST GENERATION
To determine a standard parts list, the company must achieve a consensus
on the minimum number of parts necessary to design new products. It is
important that all engineering groups, in particular, agree on the list because
they will be the ones that will be designing products using the standard
parts. Consensus can be reached by forming a team of key representatives
from engineering, purchasing, quality, and manufacturing departments.
Standardization • 189
Volume Purchased Per Year
or
Number of Products Which Used Part
Part Numbers, Prioritized by Usage
FIGURE 5.2
Pareto chart of existing part usage.
The steps are listed as follows for each category of parts:
1. Determine usage histories. For each category of parts, start with a
baseline list based on usage history of existing products. It would
be counterproductive to create a standard parts list by adding even
more new parts. Usage history can be based on total quantity of all
parts purchased per year or the number of products that use the parts
(which can found by generating a “where used” report from MRP
systems). Exclude parts used in products that are near the end of
their lives and should be phased out soon anyway. The Pareto plot
would have a shape like Figure 5.2, but real-life plots usually have a
much steeper shape near the vertical axis.
2. Establish baseline list. The next step is to establish a baseline list that
will be based on the inherent commonality of the existing parts plotted above. Obviously, the “high runners” on the left of the curves
should be part of the baseline list and the low-usage parts on the right
should not. Where to draw the line (that separates common parts
from the rest) will require some judgment. This judgment should
come from a consensus of all engineering groups, manufacturing,
purchasing, and those who qualify parts and suppliers (quality or
materials engineering departments). Quality people should be interested because minimizing the number of part types has a positive
impact on procurement and quality activities, because fewer part
190 • Design for Manufacturability
types will mean that more attention can be focused on procurement,
supplier qualifications, and quality issues for the standard parts.
If the usage profile looked like Figure 5.2, the left third or forth
of the parts might qualify for the baseline list. Note that, when parts
proliferation has been more rampant, the low-usage and single-use
parts would extend much further to the right. In such a case, the
standard parts may be only the top 5% or 10% of the parts.
In some cases, there may be anomalies, such as parts used in low
volume but in many products. The widespread use, in itself, may
qualify that part for the list, despite the low volume. In other cases,
a part may be used on only one product but in high volume. This
may require some investigation to determine if the design team has
discovered a clever use for the part that may apply to future product designs.
These parts become the baseline list, which would then be arranged
in some appropriate order, as discussed in Section 5.6.
3. Develop procedures to add new parts. Proactively develop procedures
to add new parts (for instance, new-generation parts) to the baseline list. Ideally, this should be done by a material qualifying group,
sometimes called “materials engineering,” who should also qualify
the new parts and their suppliers. If this is not possible, new part
additions should be done by consensus of researchers and engineers
from advanced design and R&D groups, manufacturing, purchasing, and quality.
4. Consolidate duplicates. As discussed before, many duplicates get into
the system, and good parts management can eliminate the exact
duplicates. When companies start investigating duplications, they
often discover slight differences between the duplicate parts. This
presents an opportunity to select the part that could most likely
replace the others. This may involve choosing the “better” part, using
the procedure discussed next.
5. Consolidate parallel lines of parts. If whole families of parts are available in multiple tolerances, quality levels, thread pitches, material
finishes, or purity levels, the team should consolidate them into
one set of parts, even if it has to standardize on the more expensive parts. Usually, any increase in part cost, due to using the
“better” parts, will be dwarfed by the overhead savings from having
fewer parts overall. If the company cost accounting system cannot
quantify the value of this, then the company must recognize the
Standardization • 191
qualitative value to manufacturing flexibility and lowering material overhead costs (see Section 5.11, “Standardization of Expensive
Parts”). Various grades of bolt strength or resistor tolerance could
be consolidated, as indicated by the following example.
When the author was initiating a parts standardization program
at Intel’s Systems Group, there were two completely different families
of resistors: 5% (tolerance) carbon resistors and 1% metal film resistors. Using this approach, they were consolidated into one line of
exclusively 1% resistors, thus eliminating hundreds of part numbers
for new designs. These parts were also substituted in existing products because it was considered a “better-than” substitution. A few
years later in a public DFM seminar, one company reported that the
purchasing leverage resulting from making all resistor purchases the
same tolerance (1%) resulted in a net cost savings and each application in the factory got a better resistor.
Note that consolidation based on higher quality parts may, in
reality, raise product quality, even if the lower quality parts were
theoretically adequate.
6. Optimize availability. The availability and sourcing of all parts and
materials on the standard parts list should be investigated and optimized. Standard parts and materials should be selected to be readily
available from multiple sources and be available over the expected life
of the products. Investigations should include the number of sources,
the technical and business strengths of the sources, and the average
amount available at any time.
7. Structure lists. Structure the list into appropriate order, as shown
in Figure 5.1, by values of diameter, pitch, power, flow rate, voltage,
ohms, microfarads, and so forth.
8. Review the lists. Review the tentative baseline lists for each type of
part and feature by involving representatives of all relevant engineering departments for feedback and approval. This could be a formal process that is part of the procedures to generate standard parts
lists. Or, it could be an informal process that would solicit informal
feedback from some experienced engineers who could be assumed to
be representative of their departments. Earlier participation of representatives of these departments on the task force should minimize
surprises at this stage.
9. Circulate the lists. Circulate the tentative lists to all engineers with
an explanation of why the standardization is important to company
192 • Design for Manufacturability
goals to simplify product development efforts, lower part cost, reduce
material overhead costs, simplify supply chain management, improve
availability and deliveries, raise quality, improve serviceability, and, if
applicable, support Lean Production, build-to-order, or mass customization. Solicit feedback about whether the tentative baseline list has
the right parts for new designs. Query reviewers if any part on the list
is superfluous or if any important part was wrongly omitted.
10. Finalize the lists. Review feedback from all those reviewing the
lists. Investigate promising suggestions and add or subtract appropriate items to or from the lists. Finalize the lists and prepare for
implementation.
11. Determine scope of implementation. The scope of the standardization
effort should be matched to implementation resources and the general company awareness of the importance and value of designing
around standard parts. Some companies may choose to start with
the “low hanging fruit” first (e.g., fasteners or resistors). Success here
may then be leveraged to other types of parts. As companies embrace
operational flexibility, it becomes imperative to implement strong
standardization efforts.
12. Educate the design community. Before standard parts lists are issued,
the design community needs to be educated on the importance of
using standard parts in new designs. Point out how important this
is to manufacturing flexibility and lowering overhead costs. Another
educational and motivational technique is the “embarrassing
statistics” technique: reveal the scope of past part proliferations and
discuss their causes, which are usually designers who arbitrarily
chose a low-usage part when a high-usage part would have worked.
Design engineers need to realize that no matter how simple a
part appears, every part number incurs a material overhead burden
to document, procure, store, distribute, resupply, and, most significantly, to manufacture in low volume.
13. Determine the strictness of adherence. Generally, adherence from
90% to 95% should provide significant benefits without inhibiting
design freedom or generating resistance to standardization. For
instance, General Electric Lighting has established a goal of 90%
parts reuse in all new designs.11
Stricter adherence to the standard parts list may be necessary
for manufacturing flexibility, automation utilization, overhead cost
reduction, and ease of service. A high-volume, flexible plant with
Standardization • 193
expensive automation might require 100% adherence to the standard parts list so that the equipment would not have to stop to load
nonstandard parts. Lean Production, build-to-order, and mass customization environments may require 100% adherence for manufacturing flexibility. Companies contemplating adherence less than
100% need to analyze the effect of this “uncommonality” on the flexibility of their operations.
14. Issue the standardization lists. Designate the parts on the standard
lists officially as standard, common, or preferred parts and give them
special emphasis, with at least an asterisk or bold type on the larger
approved part lists. A more effective method is to present the preferred standard parts on a separate list, perhaps in the front of the
section containing that category of parts—on paper, on a company
database, or on an internal web page.
Intel’s Systems Group presented preferred parts on gold paper,
followed by the existing approved parts list on white paper. When
standard parts are to be used exclusively, the standard parts list
would be the only parts list issued to engineers.
5.9 PART STANDARDIZATION RESULTS
This part standardization approach was implemented by the author at
Intel’s Systems Group. Starting with 20,000 parts for printed circuit
boards and computers, this standardization approach generated a preferred parts list of 500 parts! For resistors, capacitors, and diodes, 2,000
values were reduced to 35 values, one set for leaded axials, and another set
for the surface-mount equivalents. Fasteners for computer systems were
standardized on one screw!
This is how the standardization process worked: Service wanted a
Phillips head so they, and customers, could keep using the same tools.
Quality wanted a captivated crest-cup washer to protect surface finishes
and yet still have a locking effect. Engineering wanted the 6-32 size screw
to be only ¼″ long. Manufacturing recommended that the screw be ⅜″
long so that it would not tumble as it was fed to auto-feed screwdrivers (see
Guideline F4 in Section 8.3).
Previous designs had so many different screws that manufacturing
could not use their auto-feed screwdriver at all. The next design used
194 • Design for Manufacturability
the standard screw in 40 locations. This, in addition to the correct screw
geometry, made use of the more efficient auto-feed screwdriver practical.
In order to feed the screw, it had to be ⅛″ longer, but this meant that the
screw would protrude beyond the fastened material. This violated a workmanship standard that prohibited such protrusions; some people even
thought the standardization was doomed. But the workmanship standard
was modified to allow the protrusion as long as it did not pose a safety
hazard or compromise product functionality in any way.
Intel’s enforcement goal was not 100%, as might be required for a totally
flexible operation, but they felt that even 95% usage would result in significant material overhead savings.
In general, it should be possible to generate a preferred parts list that is
2% to 3% of the proliferated list. For very standard parts, such as fasteners
or passive electronic components, it should be possible for the preferred
parts list to be less than 1% of the current list.
5.10 RAW MATERIALS STANDARDIZATION
If raw materials can be standardized, then processes can be flexible
enough to make different products without any setup to change materials,
fixturing mechanisms, or cutting tools. This is an extremely important prerequisite to build-to-order operations, which strive to make any product
on demand from standard raw materials without having to forecast and
order materials. Raw material standardization can apply to bar stock, tubing, sheet metal, molding plastics, casting metals, protective coatings, and
programmable chips:
• Bar stock and tubing. If raw materials can be standardized on one
size of bar stock or one size of tubing, then computer-controlled cutoff machines can be programmed to cut off required lengths from
the same stock. This flexibility may determine the feasibility of
“cut-to-fit” (dimensional) customization.12 For manual cutoff operations, material standardization would simplify instructions to the
length only. This would minimize the chances for mistakes related
to picking the wrong material.
• Sheet metal. If sheet metal can be standardized on one shape, thickness, and alloy, then computer-controlled laser cutting machines can
Standardization • 195
cut all the sheet metal parts needed without changing sheet types.
Automatic sheet feeders could reload the machine as needed. This
is even more important if the parts are so small that many parts
could be cut from the same sheet without having to change sheets.
Standardization of sheet metal would allow heavy users to save
money by ordering sheet metal in reels, maybe directly from the mill.
Some manufacturing operations can be eliminated by ordering
prefinished material that is prepainted, preplated, embossed, expanded,
anodized, or clad with a different surface alloy. Painting operations for
sheet metal can be eliminated by switching to stainless sheet metal.
This might be justifiable if the total cost of painting is considered.
Prefinished material can be ordered with the finished side protected by
adhesive-backed paper that can be peeled off after assembly.
• Molding and casting. Part of a flexible operation strategy may involve
offering a wide variety of molded or cast parts. Molding and casting operations will be more cost-effective if they can standardize on
the same raw material, so that many different parts could be made
in the same machine without changing over the equipment for raw
materials. It even may be possible to make many different parts in
the same mold, thus sharing processing time and tooling expense.
Standardizing materials avoids the setup of changing materials
and cleaning the equipment. If molds are designed with fixturing
standardization, they could be changed rapidly to minimize setup
time. With casting material standardization, several molds could be
filled with the same “pour” from a single “melt.”
• Protective coatings. Standardizing on protective coatings simplifies
processing and makes painting and coating operations more flexible by eliminating the setup to change coating materials and clean
equipment. As with parts standardization, coatings could be standardized on the better coating. Even if that coating appears to cost
more, the net result would be overall cost savings, considering the
process value of this standardization. The logic of this concept is discussed further in Section 5.11, “Standardization of Expensive Parts.”
Coating standardization could also apply to paint if the purpose of
the paint is purely functional, with little aesthetic considerations; for
instance, for industrial equipment or inside major appliances. In fact,
many industrial and agricultural products enjoy brand recognition
because of a standard paint color. For instance, farmers immediately
recognize a green tractor or combine as a John Deere product.
196 • Design for Manufacturability
• Programmable chips. Many integrated circuits (ICs) can be programmed separately or in the product. For programmable chips,
standardize on the fewest types of “blanks.” This allows the flexibility
to program these devices on demand by online programming stations as they are assembled into the product. Ideally, each programming station would be dedicated to one blank device to avoid setup
changes and errors. Thus, programmable chip standardization minimizes the number of programming stations and may make it possible
to program chips as they are inserted or placed onto circuit boards.
• Standardization for linear materials. Standardization can also be
applied to material purchased by length: wire, rope, plastic tubing,
cable, chain, and so forth. Linear material variety can be reduced in
the following ways:
• Cut as needed: Linear materials can be standardized by type,
with the length cut as needed. Available equipment will even cut
and strip the ends of wires. This approach would require a dispensing machine at each point of use.
• Kanban system: Alternatively, wire and tubing can be cut ahead of
time, but, to keep overhead low, not be given individual part numbers. The following system was developed by MKS Instruments,
Inc., makers of vacuum and flow measurement and control
instrumentation. Instead of issuing part numbers and treating many cut lengths as many different parts, a predetermined
amount (for instance, one day’s worth) of wire or tubing can
be cut to the needed lengths and placed in each of two adjacent
kanban bins at each point of use (see Figure 4.2). The kanban bins
are arranged one in front of the other, as shown in Figure 4.1.
When the front bin is emptied, it is sent to a central dispensing machine. The label on the bin tells the machine operator the
material type, length, and quantity and the bin’s return destination in the factory. After the bin is filled, it is returned to the
point of use and placed behind its counterpart so it can be moved
forward and used when the other bin is emptied. This simple
approach can eliminate hundreds or thousands of part numbers
from the plant, thus lowering costs, minimizing delays, improving flexibility, and encouraging flexible operations.
• Printing while dispensing: The number of types of linear materials can be reduced further by using equipment that prints on wire
and tubing as it is dispensed, so that many various colors of the
Standardization • 197
material need not be ordered and stocked. Printing on wire and
tubing can minimize mistakes in assembly and service, because
workers do not have to memorize or refer to color codes. Using
words rather than color also solves problems associated with
color blindness. Examples of printing opportunities: Ground,
+12 volts, Supply, Return, 100 psi, and so forth. For international
products, these codes can be printed in multiple languages,
which may reduce internal variety due to labeling differences.
Such printing and dispensing equipment could be utilized either
at each point of use or at a central location to feed kanban bins.
5.11 STANDARDIZATION OF EXPENSIVE PARTS
Usually, standardization programs for inexpensive parts, like fasteners,
do not meet serious resistance, because the standard parts are perceived
to cost no more than nonstandard parts (in reality, they cost less). But,
as the cost of the parts increases, standardization efforts confront more
resistance because of the perception that specifying the next larger (and
more expensive) standard component would cost more than one that just
satisfies its requirements in the product. However, consideration of the
total cost savings of standardization can encourage its use even for expensive components.
The following experience illustrates the resistance and the opportunities
involved in the standardization of expensive parts. While training a company that manufactured heating, ventilating, and air conditioning (HVAC)
equipment, the author discovered the company used 152 different types of
motors. When he challenged the designers, they insisted they needed every
size to specify “just the right” motor for every application. Then we asked
their supplier, GE Consumer Motor Division, “What would be the savings
if those 152 motors could be reduced to five or ten?” The one word answer
was “Massive!” Why? Because each of those five or ten motors would be
ordered in volumes that would be ten times their current order volumes,
thus resulting in greater economies of scale. Further, the five or ten chosen
would have been the most cost-effective in their line—the best-designed
motors that they produce in high volume for other customers too.
The upper graph in Figure 5.3 shows the apparent implication that
the standard parts would cost more than parts that have “just enough”
198 • Design for Manufacturability
Component Cost Step Functions
With Independent Purchasing Decisions
Cost
“Just Enough”
Sizing
Apparent
Standard
Sizing
Performance
Cost
Component Cost Step Functions
Considering the Lower Cost of Standard Components
Due to Greater Purchasing Leverage
and Lower Material Overhead
Real
Standard
Sizing
“Just Enough”
Sizing
Performance
FIGURE 5.3
Standardization of expensive parts.
performance for a given product. However, if all company products use
company standard parts, the cost of those parts will be less, due to purchasing leverage and material overhead savings. Thus, there would be a
net company savings for expensive parts, as shown in the lower graph in
Figure 5.3.
Some products may be forced to use a more expensive part than is
required (as shown for one size by black shading), but most products
would be able to use less-expensive standard parts (as shown by the
crosshatch shading). The result is a net cost savings for the company plus
the flexibility that is essential for Lean Production, build-to-order, and
mass customization.
Further, when a standardization task force standardizes on expensive
parts, it can select the most cost-effective parts made in large enough
quantities to take advantage of suppliers’ economies of scale. These parts
are usually the ones that have better availability and are more likely to
Standardization • 199
have better quality and reliability. Design engineers, however, may not be
aware of these nonlinear relationships between performance, price, availability, and quality.
5.12 CONSOLIDATION OF INFLEXIBLE PARTS
The logic of Section 5.11 can be applied to the consolidation of inflexible
parts. Inflexible raw parts, such as castings, moldings, stampings, extrusions, wiring harnesses, bare circuit boards, and so forth, can be consolidated into versatile common parts that can be used on many products.
The typical problem with these parts is that their processes are inherently
inflexible, with lengthy setups, so they are normally built in batches, which
complicates supply chain management, disrupts operations with frequent
setup changes, and incurs inventory carrying costs.
Several different raw parts can be consolidated in a single versatile part
with enough extra metal, features, functions, mounts, or circuitry to be
useful in many applications. If this type of consolidation is done throughout the product line, substantial reduction in raw part variety can occur.
This will result in greater purchasing leverage, less dependence on forecasting (with steady flows possible), less storage space needed, and simpler
supply chains and internal logistics.
Figure 5.4 tabulates the costs added and costs saved from consolidation
efforts that combine “N” parts into one part.
For example, water meter and gas regulator castings can be consolidated, with extra metal included on all castings for options such as test
ports. Similar logic applies to plastic moldings: all the features for many
products can be molded into a few versatile plastic parts. This will have all
the above advantages plus saving the cost of multiple molds.
Versatile bare printed circuit boards could contain all the traces and
holes or pads needed for several products, instead of the common practice
of designing a different bare board for every product or variation. Then,
steady flows of the versatile bare boards could be arranged, knowing
that they will be used one way or another. Widespread use of expensive
or long-lead-time parts can allow projects to borrow from each other in
emergencies. Automatic resupply techniques can be set up for these parts,
allowing them to be built in batches (Section 4.2). Material overhead and
floor space requirements will be less for fewer types of parts and materials.
200 • Design for Manufacturability
Cost added:
• Extra cost per part on some of the parts for extra material, wire, circuitry,
etc.
• One-time cost to implement the consolidation to existing products (does
not apply to new product developments)
Cost saved:
• Economy of scale savings (purchasing leverage) for ordering N times the
volume at 1/Nth of the number of part types
• Tooling cost cut by a factor of N if N fewer parts result from the
consolidation
• Material overhead savings on fewer parts
• Bill-of-materials and MRP expenses
• Ordering expenses
• Warehousing/stocking cost for raw materials inventory
• Setup cost saved by not having to set up the eliminated parts; the cost
savings include:
• Setup labor reduction
• Machinery utilization improvements
• WIP inventory savings from fewer types of part types
• Design cost saved by eliminating N parts in new designs
• Prototyping and debugging cost savings from fewer new parts
• Documentation and administration cost of the eliminated parts for new
and existing designs
• Value of fewer work stoppages due to part shortages
• Value of the consolidation’s contribution to flexible operations
FIGURE 5.4
Cost trade-offs for part consolidations.
Consolidated parts will be more likely to benefit from economies of scale
and arrange deliveries that are more frequent and more reliable.
Printed board assembly machines are CNC machine tools and can be
programmed to place or insert unique combinations of components onto
versatile standard bare boards. Automotive wiring harnesses are evolving
toward this principle, with a single wiring harness used regardless of the
number of options ordered. In the old paradigm, many different wiring
harnesses were manufactured so that a minimally optioned car would
not have extra, unused wires. However, when one considers total costs,
the excess variety costs of manufacturing and assembling multiple wiring
harnesses greatly exceeds the cost of the unused wires.
Standardization • 201
It may be hard to justify part consolidations if the cost system does
not quantify total cost. The “extra” features will show up immediately
and clearly as an “extra cost.” However, it may not be possible to quantify the substantial benefits in conventional cost systems. Until a total cost
accounting can be implemented, the criteria presented in Figure 5.4 may
help itemize the benefits of these consolidations and serve as a basis for
quantification or, at least, for educated leap-of-faith decisions.
5.12.1 Custom Silicon Consolidation
Smaller companies may not think they are “in the league” for custom
silicon. However, versatile ASICs (application-specific integrated circuits)
with widespread use may be viable. Custom silicon can be designed to be
versatile enough to be used in a wide range of products, even if each product uses a small portion of the chip. The increased volume for the versatile
chip spreads out the NRE (nonrecurring engineering) and tooling costs
to encourage custom silicon even on small- to medium-volume products.
Figure 5.5 compares the traditional analysis for ASICs (which usually
discourages their use) and the total cost analysis for widespread use.
5.12.2 VLSI/A SIC Consolidation
Hewlett-Packard offers a wide range of specialized calculators for many
niche markets, such as business analysis, engineering calculations,
mathematical analysis, and so forth. In the book, Product Juggernauts,13
Arthur D. Little consultants Jean-Philippe Deschamps and P. Ranganath
Nayak noted:
“Viewed in terms of functions offered, these calculators appear substantially different. However, HP has developed common architecture, subsystems, and components to an extreme degree. This strategy often means that
higher grade components find their way into low-end products. In these
cases, HP spends more than necessary on parts for low-end products in
the interest of minimizing component diversity. The payoff comes in the
efficiencies gained in production creation across the whole product line.”
Nokia designs it cellular phones with common custom silicon to gain
economies of scale, spread out the design investment, simplify supply
chain management, and eliminate setup changes in manufacturing.14
202 • Design for Manufacturability
Traditional Analysis for Independent Application
ASICs
Status Quo
High NRE charge/chip
High tooling charge/chip
High cost per ASIC in low volume
Lead time
No NRE
No tooling charges
Cost per several discrete chips
Analysis for Versatile ASIC with Widespread Application
Low NRE charge/chips
No NRE
Low tooling charge/chip
No tooling charges
Lower cost per ASIC in higher volume
Cost per several discrete chips
Lead time relevant only first time
Total Cost and Other Implications
Reduces variability = quicker development, more robustness, higher design
quality
Higher quality when dozens of discrete chips are replaced by one ASIC. This
avoids the cumulative degradation of product quality caused by the quantity
and quality of the parts (Figure 10.3).
Higher quality because fewer parts are left that could be replaced by lower
quality versions
Eliminate the quality costs incurred when too many components are crowded onto
PC boards
Better reliability with fewer interconnections
More compact; get these developed now to be ahead of the miniaturization
curve
Higher density = fewer circuit boards, maybe one, eliminating card cages
Faster performance coming from shorter signal paths for circuits in ASICs and
other chips brought closer together, especially if circuitry can be condensed onto
the same circuit board
Faster factory throughput with fewer components and fewer circuit boards
Better equipment utilization and lower equipment charges
Supports a strategy to simplify assembly with a few integrated modules
Versatility can be enhanced with “extra” code embedded for a wide range of
variation and customization
Simplified supply chain management
Better flexibility for quicker delivery and build-to-order
Scare off competition with your logo on custom chips
Thwart reverse engineering and better protect IP
Impress customers
FIGURE 5.5
Decisions for ASICs.
Standardization • 203
5.12.3 Consolidated Power Supply at Hewlett-Packard
HP’s staff of operations research PhDs used total cost analysis to prove
that money could be saved by utilizing one worldwide power supply for
HP laser printers. The part cost of the universal power supply appeared to
be higher and was thus resisted by engineers. But when worldwide logistic costs were figured in, they could see that the universal power supply
resulted in substantial total cost savings.
5.13 TOOL STANDARDIZATION
A subject related to part standardization is tool standardization, which
determines how many different tools are required for assembly, alignment,
calibration, testing, repair, and service. Tool standardization enhances
manufacturing flexibility by eliminating the setup to locate and change
tools needed in the manufacturing process. If adjustments are to be provided by dealers or users, ideally no tools should be required. But if tools
are required, the product should be designed around standard tools that
are easy to use and would be available to dealers or users. A single tool that
performs all repairs and adjustments could be supplied with the product.
Some designs may require several lengths of screws, but if they have
the same head geometry, then one screwdriver could be used for all of
them. Tool standardization becomes even more important if service people have to be mobile or have to perform service in awkward situations,
such as clean rooms, crawl spaces, catwalks, utility poles, under water, in
“space walks,” and so forth. Tool standardization can also help minimize
the expense of providing repair toolkits that usually come with complex
products to enable the user to perform more repairs.
Tool standardization should be based on standard, readily available
tools. Often, special tools are required because tool specification was not
part of the design process. Sometimes special tools are required because
tool access was not designed into the product.
Company-
wide tool standardization can be determined as follows:
First, analyze tools used for existing products. Prioritize usage histories to
determine the most common of existing tools. Work with people in manufacturing and service, in addition to dealers and users, if appropriate,
204 • Design for Manufacturability
to determine tool preferences. Coordinate standard tool selection with
standard part selection. Issue standard tool lists with standard parts lists.
5.14 FEATURE STANDARDIZATION
Features such as drilled holes, reamed holes, punched holes, and sheet metal
bend radii all require special tools, such as drills, reams, hole punch dies,
and bending mandrels. Unless there is a dedicated machine for each tool, the
tools will have to be changed, and this will result in a setup change for every
tool changed. Exceptions would be machines with automatic tool changing
capabilities, but they are limited in the number of tools they can store, and
that tool selection must be broad enough for all parts built in a flexible family.
Ironically, most sheet metal bends do not need to be any specific value
within a reasonable range. But designers must enter a bend radius value to
complete the drawing. Unfortunately, most designers specify an arbitrary
bend radius, which often requires the shop to locate and change mandrels
to bend the sheet metal to arbitrary radii. In the worse case, a special tool
would have to be fabricated for an arbitrary decision! Using feature standardization, designers would use the shop’s most common bend radii. At
an in-house DFM seminar15 at Hewlett-Packard, where key vendors had
been invited, the sheet-metal vendor stood up and said he could generate
only four bend radii for bending sheet metal. And then he identified the
one mandrel that was usually on the bend brake, so if designers used that
bend radius, there would be fewer setup delays and cost.
When designing parts for milling, designers should specify geometries
for the whole product family so that a single cutter or “end mill” may be
used. This ensures that all parts in the family can be milled without setup
changes and, thus, ensure flexibility and high machine tool utilization on
expensive equipment.
To implement feature standardization, standardize features around
standard production tools, making sure not to exceed the tool storage
capacity. Investigate the tools used by the plant and by key outside vendors
(whether currently used or not). A safe approach is to choose only features
that can be easily built by all (or at least most) potential production facilities and vendors. Based on the production tool availability and capabilities, compile a feature list and issue it with the standard parts lists, hand
tools, and raw materials.
Standardization • 205
5.15 PROCESS STANDARDIZATION
Standardization of processes results from the concurrent engineering of
products and processes to ensure that the processes are actually specified
by the design team, rather than being left to chance or “to be determined
later.” Processes must be coordinated and common enough to ensure that
all parts and products in the product families can be built without the
setup changes that would undermine flexible manufacturing.
One of the processes affected by part standardization is mechanized
screw fastening. The auto-feed screwdriver is a very cost-effective mechanized tool that orients and feeds a screw and then blows it down a tube to
the screwdriver head, where it waits for the operator to activate the power
drive by pushing down on the screwdriver handle (see Guideline F4 in
Section 8.3). A preset torque-limited mechanism makes sure the screw
is fastened consistently. This useful production tool can feed any style of
screw (machine threads, self-tapping, and so forth), but only one size and
type at a time. Changing screw sizes is possible but would cause too much
of a setup to be used in flexible operations. Thus, auto-feed screwdrivers
can be utilized effectively only if there is fastener commonality.
Another concurrent engineering issue is that the screw specified must
be longer than it is wide so that it will not tumble as it is blown down
the feed tube. Each manufacturer has detailed guidelines for specifying
these dimensions.
Similar devices, based on the same principle, can fasten screws automatically when mounted on robots or on assembly mechanisms specifically designed to dispense screws, such as those used in Hewlett-Packard’s
DeskJet factory in Vancouver, Washington.
5.16 ENCOURAGING STANDARDIZATION
Given the importance of standardization for cost, supply chain simplifi
cation, and optimizing current or future flexible operations, it is imperative
that manufacturing companies encourage standardization implementation as early as possible. This really means encouraging design engineers to
design around standard parts (even ones that might appear too expensive),
specify standard design features, select standard tools, base designs on
206 • Design for Manufacturability
standard materials, and concurrently design products to be built on standard processes. The author’s experience indicates that design engineers are
not naturally committed to these goals. In fact, engineers may be pushed
the other way by poorly conceived metrics, such as emphasizing part cost
and low bidding on individual projects instead of using standardization to
minimize total costs on all product families and all part-related expenses.
The following steps can be taken to encourage standardization. They
involve “discounting” material overhead rates for standard parts, prequalifying standard parts, making samples and specifications of standard parts
readily available, and emphasizing total cost thinking, preferably incorporated into total cost accounting systems. In addition to these procedural
steps, managers should take every opportunity to emphasize the importance
of standardization in goals, policies, directives, “pep talks,” and training.
1. Material overhead rate. The procurement of standard parts and their
distribution through the plant will incur less overhead burden than
the usual excessive internal variety. Therefore, the material overhead
rate for standard parts should be lower, to reflect the lower actual
overhead. In addition to being a more accurate reflection of overhead
costs, lower material overhead rates for standard parts should motivate engineers to specify standard parts.
This is a logical approach because standard parts really do consume less overhead expense, for the reasons pointed out throughout
this chapter. In order to compensate for a lower material overhead
rate for standard parts, the general material overhead rate may have
to be raised from the previous single rate. It is also logical to assign a
higher overhead rate to low-usage parts because of their higher overhead demands. Thus, if engineers choose standard parts, their design
will be “rewarded” with the lower material overhead rate. Conversely,
if they choose nonstandard parts, the overhead rate will be higher
than even the previous single rate. Section 6.16 shows that this difference could often be 10:1, so that standard parts should have one-
tenth the overhead of oddball parts. Consequently, the only “cost”
that designers should be shown is the part cost plus this material
overhead charge, which would steer them to the standard part.
Another method of establishing overhead rates for standard parts
would be a variable rate that would be inversely proportional to volume, so that a very high-usage part would have a very low material
overhead rate and a very low-volume part would have a much higher
Standardization • 207
2.
3.
4.
5.
6.
overhead rate. This approach was used by the Portable Instruments
Division of Tektronix as a “cost driver” to discourage engineers from
using low-volume parts.16
Prequalified standard parts. Companies using standard parts will use
many fewer types of parts for new designs than without standardization. Thus, these standard parts can be more thoroughly evaluated
and their suppliers can be more thoroughly scrutinized than is possible with many times the number of parts in the system. The standard parts can be prequalified for immediate use. This can accelerate
product development, because design teams would not have to wait
for this qualification.
Floor stock. Usually, the list of standard parts is small enough to
allow a floor stock to be kept in the engineering area, so that engineers always have samples of the standard parts available for evaluation. Having floor stock samples can help the design team visualize
concepts based on standard parts and, thus, encourage standard
part usage. Floor stocks can make standard parts readily available
for engineers to evaluate parts, conduct experiments, and build
breadboards. Floor stocks can also be mounted on display boards in
prominent places near the design team.
Personal display boards. For small, inexpensive parts, like fasteners, every engineer could be issued a personal display board with
the standard parts mounted with labels that list the generic value
plus the company part number. Hewlett-Packard, at the author’s
recommendation, followed the above procedure and reduced the
number of fasteners for large-format plotters from dozens to only
seven. Samples of these seven fasteners were mounted on an aluminum plate, with values and part numbers printed on paper that was
affixed to the plate. These personal display boards were issued to all
engineers to encourage them to use the standard fasteners.
Spec books. Part specifications for standard parts can be reproduced
and compiled into a single “spec book” or an easily accessible electronic form. This would encourage engineers to use the standard
parts because they can see all specifications in a single reference.
Cost metrics. If cost metrics are based on total cost for product families, they will encourage standardization, especially when material
overhead is included in what engineers see when they look up “part
cost.” If accounting systems cannot quantify total cost, then engi-
208 • Design for Manufacturability
neers should be encouraged to balance the costs that are reported
with the qualitative benefits of standardization, as addressed earlier.
7. Encourage designers to use standard parts and materials through
training, directives, policies, and procedures.
8. Determine targets for compliance. Usually, standardization percent
usages in the 90s can offer significant results. Automated or flexible
factories may have stricter criteria.
9. Avoid actions that are counterproductive to standardization:
• Avoid changing materials for “deals.” Purchasing departments
should avoid changing to different materials because of perceived
purchase cost savings. The value of flexibility—or the cost of
more material variety—would far exceed any perceived purchase
cost savings.
• Don’t merge dissimilar products in the same plant from mergers or
acquisitions. If so, acquisition expenses should include a budget
for the efforts to integrate the products and add or convert the
additional parts, so that this does not drain resources from product development or standardization efforts.
5.17 REUSING DESIGNS, PARTS, AND MODULES
How to avoid reinventing the wheel
The most obvious way to make parts more common is to use parts that
already are in production. In addition to the automatic standardization
benefits, existing parts have gone through the learning curve and have
been debugged and stabilized in production. Thus, products designed
around existing parts will have fewer introduction problems.
A key quality principle from Chapter 10 is reusing proven designs, parts,
modules, and processes to minimize risk and ensure quality, especially on
critical aspects of the design (Guidelines Q20 and Q21). This was one of
the design strategies presented in Section 3.1.
For product designers, one benefit of using existing parts is the time
saved from not having to “reinvent the wheel.” Before using previously
designed parts, the designer should check whether they are still in production, how easy they are to manufacture, and how well they perform in use.
Standardization • 209
If the exact part or design cannot be found, existing designs can be
modified to produce a new design with less effort than would be necessary starting from zero. Previous designs can be copied and modified
more easily using computer-aided design, which is easier if various details
are drawn on unique “layers” or “views.”
In addition to checking part history, designers should perform enough
analysis, as with any design, to ensure that the design will satisfy all its
design objectives.
In order to use existing parts, designers will need to know what has
already been designed. Comprehensive coding and classification schemes
have been devised by some companies, but such schemes are not generally available. However, most parts can be listed in some logical order, as
discussed in Section 5.6.
5.17.1 Obstacles to Reusable Engineering
Some engineers resist using previous engineering because of the not-
invented-here (NIH) syndrome. Others want to start with a “clean sheet
of paper” or a clear computer screen. Sometimes poor documentation
discourages reusing previous designs. Incomplete documentation is bad
enough, but incorrect documentation is even worse.
The NIH syndrome might be overcome by team training or more selective hiring. Documentation issues can be corrected by insisting on good
documentation as part of every project team’s responsibilities.
5.17.2 Reuse Studies
A survey of 53 companies that were using group technology indicated the
need for designing new parts was down by 50%:17
• 20% of their needs could be satisfied by an existing part.
• 18% required only slight modification of an existing part.
• 12% required extensive modification.
One aerospace company discovered that a virtually identical part had
been designed independently five times. The part had been purchased
from five suppliers at prices ranging from 22 cents to $7.50 each!
210 • Design for Manufacturability
5.18 OFF-THE-SHELF PARTS
For standard parts with little variety, designers can greatly reduce development time and cost, in addition to reducing product cost, by never designing
a part that is available out of a catalog. Rarely can a company save any money
or time by designing and building parts that are available off-the-shelf.
Designers are often misled by their own accounting systems into thinking that internally produced parts can be designed and built less expensively
than off-the-shelf hardware, because accounting systems rarely report the
total cost of parts (see Chapters 6 and 7). Usually, when designers look up part
cost in an accounting database, they are provided only the material cost and
labor cost, with very little “burden” (overhead). Considering the enormous
overhead in some companies, part costs may be substantially understated.
Using off-the-shelf parts has an inherent standardizing effect on a company’s parts list because many catalog parts are used broadly enough to
become de facto standards.
Paradoxically, designers should choose the off-the-shelf parts first and
design the product around them, or else they may make arbitrary decisions
that may preclude their use. By contrast, incorporating off-the-shelf parts
into the design early will greatly simplify the design and the design effort.
Off-the-shelf parts are less expensive to design, considering the cost of
design, documentation, prototyping, testing, and debugging, in addition
to the overhead cost of purchasing all the constituent parts and the cost of
non-core-competency manufacturing. Off-the-shelf parts save time when
one considers the time to design, document, administer, build, test, and
fix prototype designs.
Suppliers of off-the-shelf parts are more efficient at their specialty,
because they are more experienced with their products, continuously
improve quality, have proven track records on reliability, design parts
better for DFM, have dedicated production facilities, offer standardized
parts, and sometimes pick up warranty or service costs.
Off-the-shelf part utilization helps internal resources focus on their real
missions, which are designing and building products.
5.18.1 Optimizing the Utilization of Off-the-Shelf Parts
Make sure that off-the-shelf parts are thoroughly considered early in the
concept/architecture phase before arbitrary decisions limit the opportunities.
Standardization • 211
Conduct a thorough search of all potential parts, especially commonly available parts that are made in high volume on automated machinery, compared
to less-efficient in-house manufacture in small runs with high setup charges.
Look for parts that are used in your industry with your demands and life
spans. Strive to use standard off-the-shelf parts; specials may have availability and processing impacts, unless the supplier can mass customize them.
Be sure to base make versus buy decisions on total cost measurements,
because off-the-shelf part cost reflects the total cost, but in-house production cost may not include all the overhead.
Be careful when using off-the-shelf parts in unusual ways. The parts
may not be designed for that usage or the suppliers may change dimensions or features that they think will not affect their customers.
5.18.2 When to Use Off-the-Shelf Parts
Designers should specify off-the-shelf parts when the following conditions exist:
• Parts are standard. Off-the-shelf parts are especially applicable when
they are de facto standards, always available, and can be purchased
from multiple suppliers.
• Volumes are high. Standard parts can be manufactured in high
volumes. Even companies with small order quantities can benefit from suppliers’ economies of scale. High-volume parts may be
mass produced on dedicated lines, which further lowers cost and
improves quality.
• Quality and reliability are important. Good suppliers are able to focus
more on their products and thus achieve higher quality levels than
occasional production at an assembler’s plant, especially suppliers who
have been making them for a long time and are already “up the learning
curve.” Parts that have been produced for a while will have track records
that can be used to predict and ensure reliability targets will be met.
• Specialized skill, expertise, or costly equipment. Suppliers may have
specialized skill and expertise that may be hard to equal in house.
High-volume suppliers may have installed sophisticated equipment
that can make parts faster, at lower cost, and at higher quality.
• Different processing. If certain parts require different processing than
can be efficiently done in house, it will be better to get those parts
from off-the-shelf suppliers.
212 • Design for Manufacturability
• Growth or constrained capacity. If in-house capacity is limited or
growth is anticipated, off-the-shelf parts can relieve capacity constraints and make that capacity available for product growth.
• Lowest total cost. Off-the-shelf standard parts will usually have a
lower total cost, even though in some applications standard parts
may appear to cost more than the “just right” sizing in Figure 5.3.
But when the effects of purchasing leverage and material overhead
are included, the standard parts will be the lowest cost solution for
the company.
5.18.3 Finding Off-the-Shelf Parts
The first task in finding off-the-shelf parts is to search all the potential
sources for the type of parts needed. A common shortcoming here is to
execute a superficial search and then conclude that no one makes the
needed parts. Then the designer feels justified in designing and building
the part.
Many directories and other sources can show engineers where to find
off-the-shelf parts, including Internet searches, the Thomas Register, trade
journal annual “directory issues,” the yellow pages, and trade shows.
Purchasing agents know where to find parts, which is why they should be
early participants on teams.
Catalogs of off-the-shelf parts can be obtained on the Internet and from
company headquarters, local representatives, reader service cards (“bingo
cards”) in trade journals, trade shows, company libraries, and peers’ private collections. Many websites contain complete catalogs online; but if
the site is too cumbersome to navigate, the complete printed catalog may
be better at visually showing the range of parts available.
Company websites and catalogs contain a wealth of information, including specifications, selection guidelines, design guidelines, cross-references
to other brands, listings of local reps, and policies on specials or custom parts.
Typically, catalogs do not list prices. Prices for specific parts can be
obtained by asking the headquarters or local rep. Price lists for the entire
line are more useful for doing “what if” analyses. They can be obtained
with enough persistence. One method is to inform the supplier that in the
pricing stage of the design, you must use a catalog that has a price list and
that these tentatively chosen parts often end up in the final design.
Standardization • 213
Designers can get some indications of relative availability by cross-
referencing other brands to reveal which sizes or models are supplied by
the most suppliers. These are likely to be the most standard parts, with
greater availability than parts from only one or two sources. The best indication of availability is to find “quantity in stock” data. The size or model
with the highest quantity in stock is probably the most standard and has
the best availability, not to mention the best pricing.
After the needed part is located, the designer will want to evaluate the
actual part. The quickest way to get a part for evaluation is to ask for a
sample. Samples are usually sent out immediately, without charge, unless
the parts are very expensive or semi-custom in nature. This is quicker
than purchasing and saves administrative expense at both ends. To maximize success in obtaining samples, be sure to mention yearly or lifetime
projected consumption of the parts being considered.
Specify off-the-shelf parts from multiple suppliers that are interchangeable for functionality and quality. If not drop-in interchangeable, design
versatile mounts that can accept all or prepare adaptors. Extra mounting
holes are almost free if made on CNC machines.
If customers insist on one brand, emphasize that the optimal (or quoted)
delivery time is based on your supply chain versatility and specific brand
requests may result in extra costs and delivery delays.
For rare materials and potentially scarce parts, identify trends early and
proactively investigate alternative materials and parts.
If these solutions don’t work for critical parts, consider bringing back
outsourced production, learning how to build your own parts, establishing affiliations with the best supplier, or acquiring a captive supplier.
For projects with challenging cost and time goals, it is essential that off-the-
shelf opportunities be thoroughly pursued early.
5.19 NEW ROLE OF PROCUREMENT
5.19.1 How to Search for Off-the-Shelf Parts
For important parts and materials, don’t specify one spec and ask purchasing to buy it. Obtain data on a wide range of candidates and plot them
(cost vs. performance). In many cases, higher performing parts may cost
214 • Design for Manufacturability
Part Cost
Part cost vs. performance
Showing cost/performance variations
Customized “off-the-shelf ”
Exponentially steeper prices.
Avoid by using multiples of
lower cost/performance parts
The “what I need”
spec thrown over the
wall to Purchasing
Mass produced parts
in widespread use have
disproportionately
lower prices
Smaller mass-produced parts
used in high-volume products where
2 half size-parts may be cheaper
Performance
FIGURE 5.6
Searching for ranges of parts.
less but would not normally be considered. In some cases, two smaller
high-volume parts may cost less than a single large version for applications
where parts can be used in parallel. Plot all relevant parts for availability
and delivery (see Figure 5.6)
The procurement function needs to shift from just purchasing “the”
part that the engineers want to searching for ranges of parts to optimize
the following:
• Maximizing availability throughout the life of the product. Be prepared to pay for this availability; but any increase in BOM lines will
be saved many times over by avoiding change orders to solve availability problems.
• Standardizing on versatile parts for many applications. This may
raise a BOM line, but will save much more in total cost.
• Eliminating long lead times by selecting standard parts that are
quickly available.
• Finding suppliers whose other customers have similar challenges,
quality demands, and life spans.
Standardization • 215
• Prequalifying parts that will be available for engineers for immediate deployment.
• Qualifying suppliers and vendors for quality, ability to deliver,
and stability.
Given the importance of the above, companies need dedicated specialists to
do these tasks. To justify, quantify the value of the above and compile past
costs from not doing this.
5.19.2 Maximizing Availability and Minimizing Lead Times
Search thoroughly for parts with the best availability, even if their purchase
prices appear to be more expensive, knowing that more money would be
saved by avoiding expediting cost, customer dissatisfaction, delay penalties, lost sales, or, worst of all, compromising product development efforts.
For parts that still have long lead times, specify the most versatile version for many products, so that:
• Better delivery terms could be negotiated; for instance, a steady flow
that is used one way or another. This could avoid separate orders
waiting in queues.
• These standard parts could be inventoried because you know they
will be used one way or another, without the excessive cost and risk
of stocking many unusual versions.
• Various projects could borrow from each other in emergencies.
• Service and spare parts availability will be improved for the customer,
with fewer stocked parts that could service more products, better
uptime, simpler maintenance, easier training, and fewer availability
problems for the customer.
Do not let these versatile, short-lead-time parts be changed for “cost
reduction” or when switching to vendors who want to change your parts
to their parts from their supply chains.
Minimize cumulative queues from multiple sequential steps, such as preprocessing, multiple primary processors, or postprocessing. Prevent this by
eliminating the extra steps; for example, with more versatile machine shops
or with through-hardened materials and harder cutters. Another version of
216 • Design for Manufacturability
this is designing more with the supply chain’s process capabilities. If necessary, make quick turnaround a condition for all steps in the sequence.
Standardize those parts to economically enable a steady flow or stocking.
If queuing is because volumes are too low, setups too large, and parameters too unusual, consider upgrading in-house capabilities or bringing in
new capabilities. Make versus buy decisions must include the value of the
shorter lead time and all the costs of delays.
Consider arranging for a vendor/partner to run a “captive” operation
in your factory to overcome the above shortcomings and eliminate the
delays. This may appear to cost more but actually provide a net cost savings while improving responsiveness and competitiveness.
5.20 STANDARDIZATION IMPLEMENTATION
Standardization can be implemented by forming a standardization task
force, which would include key people from engineering, manufacturing,
purchasing, quality, and finance, plus appropriate managers and implementers. A key member of this effort would be a “database wizard”—
a designated person who has the skill and availability to quickly extract
data and generate many Pareto plots from various IT systems. The standardization steps are as follows:
• Generate interest in standardization by creating an overall Pareto
chart showing the periodic consumption of all parts (on the vertical
axis) in descending order, with only the descending count on the
horizontal axis, in the format of Figure 5.2 but without part numbers.
• Arrange training on standardization methodologies (or at least have
all implementers read this chapter) followed by workshops18 to standardize each category of parts and materials.
• Discuss any Pareto charts previously generated, including any anecdotal and documented consequences of standardization shortcomings.
• Start with the early steps: list existing parts (Figure 5.1) to immediately stop the proliferation, clean up database nomenclature (e.g., for
the many labels for bolts and screws), eliminate approved but unused
parts, eliminate parts not used recently, eliminate duplicate parts
Standardization • 217
•
•
•
•
•
•
•
•
•
•
•
(Section 5.6), combine parts with multiple grades and tolerances,
replace lower versions with better-than substitutions, and scrutinize
long-lead-time parts to see if they could be converted to standard
parts with better lead times.
Prioritize opportunities of what categories of parts to standardize
first and start from the top of the list, creating standard parts lists
using the procedures presented in Sections 5.7 and 5.8. This prioritization could be done with surveys or by having the workshop group
vote for their preferences.
Similarly, standardize raw materials (Section 5.10), tools (Section
5.13), features (Section 5.14), and processes (Section 5.15).
Determine related investigative tasks to identify standardization
issues, like backward compatibility, “copy-exact” policies, and the
implications of Lean/cellular manufacture.
Start the process of developing standardization implementation procedures. Discuss and assign tasks to change procedures or policies
that may hinder standardization.
Assign tasks to generate more Pareto plots.
Designate people to do the above.
In subsequent sessions, analyze new Pareto plots, specify additional
investigations, start creating lists of standard parts/materials, obtain
approvals, and issue the lists.
For the standardization of expensive parts (Section 5.11), quantify
the benefits of the standardization (in the format of Figure 5.3) for
specific cases and, in general, start the process of creating a financial model to help quantify the overall cost savings and overcome
resistance to some products getting what appears to be a better standard part.
Issue the standardization lists (Section 5.8, point 14) and incorporate
into subsequent DFM training.
Encourage standardization through appropriate material overhead
rates, prequalified standard parts, floor stock, personal display
boards, spec books, and cost metrics (Section 5.16).
Perform product line rationalization, ideally as a first step if time
permits, to eliminate or outsource the most unusual products, which
usually have the most unusual parts (see Appendix A).
218 • Design for Manufacturability
NOTES
1. David M. Anderson, Build-to-Order & Mass Customization: The Ultimate Supply
Chain Management and Lean Manufacturing Strategy for Low-Cost On-Demand
Production without Forecasts or Inventory (2008, CIM Press). Chapter 4, “Part
Standardization” and Chapter 5, “Material Variety Reduction.”
2. Brian H. Maskell, Software and the Agile Manufacturer (1994, Productivity Press),
p. 335.
3. Robin Cooper and Peter B. B. Turney, “Internally Focused Activity-Based Cost
Systems,” Measures of Manufacturing Excellence, edited by Robert S. Kaplan (1990,
Harvard Business School Press), p. 293.
4. Timothy Stevens, “Prolific Parts Pilfer Profits,” Industry Week, 244(11), June 5, 1995,
pp. 59–62.
5. Venkat Mohan, President and COO, CADIS Inc., Boulder, Colorado.
6. George Taninecz, “Faster In, Faster Out,” Industry Week, 244(10), May 15, 1995,
pp. 27–30.
7. Michael R. Ostrenga, Terrence R. Ozan, Robert D. McIlhattan, and Marcus D.
Harwood, The Ernst & Young Guide to Total Cost Management (1992, John Wiley &
Sons), p. 150.
8. Marshall Fisher, Anjani Jain, and John Paul MacDuffie, “Strategies for Product
Variety: Lessons From the Auto Industry,” The Wharton School, University of
Pennsylvania, October 9, 1992. Revised January 16, 1994.
9. Eric Teicholz and Joel N. Orr, Computer Integrated Manufacturing Handbook (1987,
McGraw-Hill), p. 96.
10. Stevens, Industry Week.
11. CADIS case study, CADIS, Inc., Boulder, Colorado.
12. Anderson, Build-to-Order & Mass Customization. (2008, CIM Press). Chapter 9,
“Mass Customization,” presents three ways to customize products: (1) modules or
building blocks, (2) adjustments or configurations, and (3) dimensional customization, which involves a permanent cutting-to-fit, mixing, or tailoring. See book
description in Appendix D.
13. Jean-
Philippe Deschamps and P. Ranganath Nayak, Product Juggernauts: How
Companies Mobilize to Generate a Stream of Market Winners (1995, Harvard Business
School Press), pp. 35–36.
14. David Pringle, “How Nokia Thrives by Breaking the Rules,” The Wall Street Journal,
January 3, 2003.
15. For more information on customized in-house DFM seminars, see Appendix D in
this book or www.design4manufacturability.com/seminars.htm.
16. Cooper and Turney, Measures for Manufacturing Excellence.
17. Urban Wemmerlöv and Nancy L. Hyer, “Cellular Manufacturing in the US Industry,
a Survey of Users,” International Journal of Product Research, 27(9) 1511–1530, 1989.
18. For more on the author’s customized in-house seminars (that all include standardization), as well as information on the author’s standardization workshops, see
Appendix D.6.4.
Section III
Cost Reduction
6
Minimizing Total Cost by Design
Cost must be designed out of the product and production processes,
because it is very difficult to remove cost through cost reduction measures
after the product has been designed. Many cost reduction efforts may not
even pay off the expense of the cost reduction effort, which may even lose
money on a total cost basis.
Most of this book shows how to lower parts cost (Chapters 5 and 9),
labor cost (Chapters 4 and 8), and system cost (Chapters 1, 2, 3, and 10).
This chapter focuses on how not to lower these costs and how to lower overhead cost.
The key to achieving the lowest product cost is to base all thinking
and decisions on a total cost perspective, as will be discussed further in
Chapter 7. Unfortunately, the typical company cost system reports only
material and labor costs. All other costs are called overhead, which is
spread across corporate activities according to some arbitrary allocation
(averaging) algorithm; for instance, proportional to material, labor, or processing cost. However, not all products have the same overhead demands.
In fact, much can be done to lower overhead costs by design, which makes
a rational allocation of overhead charges even more important.
This chapter will discuss two categories of cost: reported costs, such
as labor and materials, and overhead costs. It will show how the use of
advanced design techniques can minimize labor and material costs and
achieve significant reductions in overhead costs.
This chapter presents many ways to minimize total cost by design.
Chapter 7 will show how to think in terms of total cost and measure total
cost so that product development teams will make the best cost decisions
to minimize total cost.
221
222 • Design for Manufacturability
We need to reduce the cost
on the new product that just
went into production
We’ll need a metric.
How do we measure cost?
Well, we keep track
of parts and labor
How much is that of the total?
About a quarter
What about
the rest?
You mean
overhead?
Oh, that’s a
fixed cost.
Besides,we
can’t break
it down
anyway.
I’ve got it! We could just buy more
cheap parts. And we could move
more production overseas!
Now we’re
getting
somewhere!
Hey, where’s
Purchasing,
Quality, and
Operations?
Oh, they’re
always busy
expediting,
fixing defects,
or fighting
fires
FIGURE 6.1
Common cost reduction scenario.
6.1 HOW NOT TO LOWER COST1
First, let’s look at traditional cost reduction at Dysfunctional Engineering
Inc., as shown in Figure 6.1. What is wrong with this very common picture? The first shortcoming of this approach is that it begins cost reduction
efforts after the product is designed and already in production. In their
haste to rush early production units to market, many companies defer cost
concerns until later with “cost reduction” efforts. The first problem with
this strategy is that it probably will not happen because of competing priorities, and thus, costs remain high for the life of the product. The second
problem is that cost reduction simply cannot be very effective!
6.1.1 Why Cost Is Hard to Remove after Design
Cost reduction after the product is designed is an ineffective way to lower
cost because cost is designed into the product and is hard to remove later:
80% of the cumulative lifetime cost is committed by design, and by the time
the project gets to manufacturing, only 5% is left, as shown in Figure 1.1.
After the design phase, so much is cast in concrete and boxed into corners; thus, systematic cost reduction will be almost impossible because
system design determines 60% of costs.
Cost reduction efforts on one product will not have the time or bandwidth to reduce overhead costs, which may be more than half the cost.
Besides, overhead costs are not quantified unless the company has a total
cost program (Chapter 7).
Minimizing Total Cost by Design • 223
Thus, the focus usually shifts to specifying cheaper parts, cutting corners,
omitting features, beating up suppliers, switching to a new low bidder, or
letting labor costs dominate sourcing and plant location decisions.
The changes will cost money, which may not be paid back within the life
of the product. They will also take time, especially if requalifications are
required, which may delay the time-to-market.
Changes may induce more problems, thus requiring yet more changes,
thus expending more hours, calendar time, and money to make the subsequent changes and possibly compromising functionality, quality, and
reliability. Toyota believes that “late design changes… are expensive,
suboptimal, and always degrade both product and process performance”2
[emphasis added].
In addition to the above, cost reduction can’t be counted on because
it may just not happen due to competing priorities, such as mandatory
changes and designing new products. Committing valuable resources to
cost reduction after design takes them away from other more-effective
efforts in product development, quality, Lean Production, and elsewhere.
If too many resources are committed to cost reduction, then:
1. There will not be enough available for real cost reduction through
new product development. If this continues over time, the result will
be little, if any, real reduction in cost, while such a drain of resources
will impede new product development efforts.
2. It will prevent the transition from back-loaded efforts to the more-
effective front-loaded methodology that uses complete multifunctional teams to design low-cost products right the first time, as
discussed in Chapters 2 and 3.
3. The company will be lured into thinking it is doing all it can to lower
cost, when, in fact, costs are not really being reduced and opportunities for real cost reduction are not being pursued.
Finally, cost reduction attempts, coupled with incomplete cost data, may
discourage innovative ways to lower cost, maybe even thwarting promising attempts. While teaching DFM to companies, the author often suggests innovative ways to lower cost by design, only to be countered by a
chorus of “we looked into that, but it didn’t work out.” However, it is hard
to be innovative when so much is cast in concrete that there are very few
opportunities available.
224 • Design for Manufacturability
6.1.2 Cost-Cutting Doesn’t Work
Mercer Management Consulting analyzed 800 companies from 1987 to
1992. They identified 120 of these companies as “cost cutters.” Of those
cost-cutting companies, “68% did not go on to achieve profitable revenue
during the next five years.”3
There are also intangible impacts of an excessive focus on cost reduction: it absorbs effort and talent that could be applied to more productive
activities, such as developing better new products and improving operations. One division of a large international company did not have time for
the author’s training on low-cost product development because they were
too busy with 31 cost reduction efforts!
6.2 COST MEASUREMENTS
6.2.1 Usual Definition of Cost
Traditional cost systems provide the cost breakdown shown in Figure 6.2,
where only parts and labor are quantified. The rest of the costs are lumped
together in several categories, collectively called overhead, which is then
averaged (allocated) over all products. This practice results in the distortion of product costing, which leads to:
• Distorted pricing, because overhead costs vary4
• Cross-subsidies, where good products subsidize bad ones5 and standard products subsidize customs and specials
• Overpricing of good products = less competitive
Assembly
Parts
FIGURE 6.2
Typical cost breakdown.
Minimizing Total Cost by Design • 225
•
•
•
•
Underpricing of bad products = lose money6
Distorted profitability = poor product planning
Bad cost decisions when the focus is only on parts and labor7
Parts and labor “cost reductions,” which often raise other costs
This approach to cost encourages product development teams to focus
only on material, labor, and tooling costs. Considering only these costs
allows a limited perspective and might lead to shortsighted conclusions that
most of the product’s cost consists of parts (and tooling). Therefore, cost
reduction measures often focus only on minimizing parts costs, usually by
buying cheaper parts.
However, the following slogan states what is really important to customers: You don’t compete on cost; you compete on price. Customers don’t
care about your cost; they care only about their total cost, which is your
price. There, the only relevant pie chart is the selling price.
6.2.2 Selling Price Breakdown
Total cost measurements enable the creation of the selling price breakdown
chart shown in Figure 6.3 (for an integrated company) and encourage
Corporate
overhead
Equipment
& tooling
Profit
Off-the-Shelf
Parts, Mat’ls, &
Assemblies
Sale
Mar s &
keti
ng
Designed
Parts, Mat’l,
Assemblies
Product
Development
Parts/Raw Material
Inventory Carrying Costs
FIGURE 6.3
Selling price breakdown.
ization
Direct
Labor
Custo
m
Freight
Supply
Chain
Mgt.
WIP
Inventory
Cost of
Quality
Indirect
Labor
Customization
226 • Design for Manufacturability
everyone to make decisions that will minimize the total cost while maximizing profits.
6.2.3 Selling Price Breakdown for an Outsourced Company
Unlike an integrated company (see Figure 6.3), heavily outsourced companies buy a lot of parts (like the left-most pie in Figure 6.4) and therefore don’t think that they have to consider overhead costs. However, each
OEM’s part is a supplier’s product, which, in turn, has parts that are its
suppliers’ products, so the net result is a collection of pie charts (far right),
all with the same proportion of overhead costs of an integrated company.
Part Cost % Throughout
Outsourced Supply Chain
Parts &
Materials
Parts
Parts &
Materials
Parts &
Materials
Parts
O.E.M.
Assembler
Parts
Sub-Contractors
FIGURE 6.4
Part cost percentage throughout outsourced supply chain.
Parts &
Materials
Suppliers
Minimizing Total Cost by Design • 227
Many overhead costs, such as inventory, may be spread throughout the
supply chain (in the white spaces of all the pie charts). For the OEM to
have visibility and control of the overhead costs throughout an outsourced
supply chain, it must have either very good vendor relationships or an
ownership stake in its suppliers.
6.2.4 Overhead Cost Minimization Strategy
Total cost can be minimized by addressing all the costs that contribute
to the selling price. Figure 6.5 shows the overall strategy, with design for
manufacturability and Lean Production efficiencies minimizing direct
labor, indirect labor, and quality costs. Concurrent engineering, standardization, and product family synergies minimize material overhead, product development, shipping, and sales and marketing costs. On-demand
Lean Production, build-to-order, and mass customization (Chapter 4)
can virtually eliminate setup changeover costs, customization costs, raw
material inventory, work-in-process (WIP) inventory, and finished goods
inventory, both at the factory and in the distribution channels.
The remainder of this chapter discusses specific cost minimization
opportunities for the various elements of total cost.
Reduced by
Design for Manufacturability
& Concurrent Engineering
Profit
Reduced by
rationalization
standardization
and product
family synergies
Off-the-Shelf
Parts, Mat’ls, &
Assemblies
S
Ma ales &
rke
tin
g
Designed
Parts, Mat’l,
Assemblies
Product
Development
Direct
Labor
FIGURE 6.5
Programs that reduce specific costs.
Mat
’l
Custo
mizati
on
Raw
Lean production, BTO, &
mass customization can
greatly reduce these costs
W
IP
inv
en
tor
y
Supply
Chain
Mgt.
Cost of
Quality
Indirect
Labor
Reduced
through
quality
programs
and Lean
production
efficiencies
228 • Design for Manufacturability
6.3 STRATEGY TO CUT TOTAL COST IN HALF
The author’s book-length website, www.HalfCostProducts.com, presents
eight strategies for comprehensive cost reduction, each of which can offer
significant returns as a stand-alone program. When combined, these
coordinated cost saving strategies support each other synergistically for
a whole-is-better-than-its-parts effect, instead of the more common but
ineffective parts-and-labor-focused initiatives that can raise other costs,
compete for resources, and compromise longer-term cost reductions. The
site contains the equivalent of a 250-page book and 700 hyperlinks.
The eight half-cost strategies are summarized here:
1. Cost reduction by design. Product development determines 80%
of product cost (Figure 1.1). The concept/architecture phase alone
determines 60% of cost! Half-cost products depend on breakthrough
concepts. Sometimes these come from the brainstorming sessions in
workshops (Section 3.7). More ambitious cost goals may need innovative concept studies.8
Other strategies are enhanced by designing for quality, designing
for Lean Production and build-to-order, concurrent engineering with
vendors (Section 2.6), which saves more than bidding, and designing
around standard parts, which simplifies supply chain management.
2. Lean Production cost reduction. Lean Production benefits9 include
eliminating many forms of waste and the ability to double labor productivity, cut production throughput times by 90%, reduce inventories by 90%, and cut errors and scrap in half, thus lowering other
costs of quality, procurement, and inventory (see a summary of benefits in Section 4.1).
3. Overhead cost reduction. Build-to-order can build standard products to order without forecasts of inventory, which costs 25% of its
value to carry per year10 (see summary in Section 4.2). Specials can
be quickly and easily built by mass customization11 (see overview in
Section 4.3).
4. Standardization cost reduction. Standard part lists can be 50 times
smaller than proliferated lists, thus generating purchasing leverage, lowering material overhead and inventory costs, and improving
quality (see Chapter 5).
Minimizing Total Cost by Design • 229
5. Product line rationalization. Eliminating or outsourcing unusual,
high-overhead, low-volume products and options can lower total
cost immediately and free up valuable resources for other cost strategies. It eliminates the loser tax on cash cows to subsidize products
that have low margins or are losing money (see Appendix A).
6. Supply chain management cost reduction. Supply chain resources can
be most effective in reducing cost by supporting product development teams, establishing vendor partnerships, buying high-quality
parts, driving and encouraging standardization, rationalizing products (because the most unusual products have the most unusual
parts and materials), supporting Lean efforts and automatic resupply
of parts (which eliminates forecasts, purchase orders, inventory, and
expediting costs), and keeping control of local in-house manufacturing, which supports product development, Lean Production, build-
to-order, inventory reduction, and quality programs12 (some of these
are summarized in Sections 4.2.1 through 4.2.2).
7. Quality cost reduction. The cost of quality can be a significant proportion of revenue or selling price (see Section 6.9). Improvements are
supported by designing for quality, Lean Production, and rationalization because rationalizing away unusual products raises net factory
quality and avoids wasting quality resources on inherently lower quality products (see Section A.9 on how rationalization improves quality).
8. Total cost measurement to support, justify, and quantify the savings
of all cost reduction strategies. Until total cost can be quantified,
everyone should make decisions based on total cost thinking (see
Chapter 7).
6.4 MINIMIZING COST THROUGH DESIGN
As shown in Figure 1.1, 80% of the lifetime cumulative cost of a product is
determined by the product’s design. An even more important fact is that
60% of a product’s cost is determined by product architecture. Low-cost
product design is based on the premise that cost is designed into the product, especially by early concept decisions.
Tools such as design for manufacturability can help design products
that are easier, and thus less costly, to build. Concurrent engineering can
230 • Design for Manufacturability
ensure the lowest cost processing when the processes are concurrently
designed with the product. Quality can be designed into the product with
robust design techniques (Taguchi Methods,™ based on design of experiments) and then built into the product with process controls instead of
the more expensive inspection paradigm. Maximum utilization of off-
the-shelf parts can minimize part cost (Section 5.19). Involving vendors
early can result in lower cost outsourced parts. Total cost accounting
data (Chapter 7) can lead to decisions that result in the lowest total cost.
Applying all these DFM techniques should enable companies to develop
products at half the total cost, with special emphasis on the key points
discussed above and in Section 3.8.
The highest leverage opportunities for minimizing cost are in the architecture stage. And yet, this high-leverage opportunity is virtually ignored
in many product development projects, when designers make snap decisions or just assume that the product will have the same architecture
as previous or competitive products. The architecture phase of product
development (Section 3.3) abounds with opportunities to greatly lower
cost through creative concept simplifications using creativity (Section 3.6)
and brainstorming (Section 3.7).
6.5 MINIMIZING OVERHEAD COSTS
Engineers, purchasing agents, and cost reduction managers often expend
great effort trying to reduce reported costs, such as labor and materials.
They precisely calculate these costs and then multiply by three or four to
get the selling price. Yet they rarely challenge overhead charges, fittingly
called “burdens.”
Product development can have significant effects on overhead costs by
designing to minimize them. Overhead costs can be reduced by: concurrent engineering, which minimizes product development expense; designing in quality, which minimizes the “cost of quality”; designing for Lean
Production, which minimizes inventory and other factory overhead costs;
and standardization, which minimizes material overhead.
Overhead costs can be significantly lowered with concurrent product and process design, parts and process standardization, reuse of
engineering and software code, modular design, designing quality into
Minimizing Total Cost by Design • 231
the product, designing it right the first time, and designing to optimize
manufacturing flexibility.
6.6 MINIMIZING PRODUCT DEVELOPMENT EXPENSES
Advanced product development can significantly reduce product development and related expenses, as detailed below.
6.6.1 Product Portfolio Planning
Total cost is a key element of product portfolio planning. Before a company
can decide in which market segments to compete, it should understand the
true profitability of its existing products. However, the reported profitability of existing products is only as meaningful as the reported costs. As will be
discussed in Chapter 7, typical cost reporting systems are too aggregated
to distinguish the real cost differences between products, thus distorting
product costing.13 Distorted product costing leads to distorted perceptions
of profitability and, thus, to distorted decision making on which products
to develop. Developing products for truly profitable market segments will
result in the most efficient utilization of product development resources.
Developing products for market segments that are thought to be making money, but are really marginal or losing money, is a waste of product
development resources. Avoiding this waste will lower product development costs or provide more results from the same costs.
6.6.2 Multifunctional Design Teams
To minimize product development expenses, product development teams
must be efficient. They must do it right the first time because engineering change orders are expensive and redesigns are even more expensive.
Designing products right the first time requires good product development methodologies.
Using multifunctional teams to raise and resolve issues early will save
the considerable expense of trying to do it later, after things are “cast
under several layers of concrete.” Multifunctional teams can concurrently
design and select the optimal processes and vendors for the lowest total
cost. When manufacturing and vendors are involved early, the team will
232 • Design for Manufacturability
be better able to design low-cost products and make rational decisions
regarding tooling and automation.
Product development expenses can be minimized by utilizing the most
efficient designers, which may not always be in-house engineering working alone. The multifunctional team with active manufacturing or vendor
assistance would be more efficient than an isolated group of engineers
working alone. Working with vendors who make the parts will result in
the lowest part costs.
And remember, the most efficient part design effort is none at all! This
is accomplished with optimal use of off-the-shelf hardware (Section 5.18).
6.6.3 Methodical Product Definition
Similarly, product development expenses can be minimized by defining the
product right the first time, because it is very expensive to make product definition iterations at the prototype stage when the customer says, “that’s not
what I wanted.” Designing in unwanted features wastes product development
resources and causes the product to cost too much and thus be overpriced.
6.6.4 Total Cost Decision Making
All decisions must consciously be based on a total cost focus, even if total
cost cannot be quantified (Chapter 7). The product development culture
must support decisions that “just make sense” from a total cost perspective,
even if they cannot be justified quantitatively by the current cost system.
Arbitrary decisions must be avoided. Arbitrary decisions are based on
the assumption that all choices have the same cost impact, which is rarely
the case, so everyone must select the lowest-cost choice.
On the other hand, cost concerns can have a counterproductive effect if
decision makers are putting too much focus on reported costs, such as labor
and materials, and not enough focus on total costs. Sometimes product
development teams limit their opportunities by making major decisions
based on rough estimates of reported costs, instead of using good cost
models based on total costs for multiple approaches, ideas, and scenarios.
6.6.5 Design Efficiency
Reinventing the wheel can be avoided in product development with
maximum use of off-the-shelf parts, reusable engineering, and versatile
Minimizing Total Cost by Design • 233
modules (Section 4.7). There is a common tendency for product development projects to ignore previous work and completely start over, when
they could be more efficient by leveraging previous work (Section 5.18).
This can be facilitated by proper CAD practices: a good layer convention
will segregate designs into well-defined layers, so that subsequent development projects can easily find and reuse pervious engineering. Modular
design can allow new products to be derived from standard modules.
6.6.6 Off-the-Shelf Parts
Basing designs on off-the-shelf parts can eliminate the cost of designing
those parts and, at the same time, lower part cost and quality costs for
those parts (see Section 5.18).
6.6.7 Product Life Extensions
Extending product life can be accomplished through upgrades rather than
redesigns. Products can be designed to be easy to extend the product life
with upgrades (see Figure 3.2). Modular design can facilitate upgrading
if anticipated changes can be confined to the fewest number of modules.
Many common functions of a product can be reused for many iterations
of the product.
6.6.8 Debugging Costs
Minimizing debugging costs can be accomplished by using existing modules that have already been debugged. Some leading companies, such as
Hewlett-Packard, feel that this is the best way to produce bug-free software. With a high percentage of reuse, development and debugging efforts
can focus on new aspects.
6.6.9 Test Cost
Diagnostic test development can be avoided by designing quality into the
product and building it in with process controls. In such a quality environment, failures would be so low that diagnostic test development could be
avoided, because the cost of discarding failed parts would be less than the
cost of test development, test equipment, and repair efforts (as described
in Section 8.6). Avoiding diagnostic tests can have a significant effect on
234 • Design for Manufacturability
product cost because diagnostic test equipment for circuit boards can cost
up to $2 million and, for some products, diagnostic test development can
exceed the cost of product development!
6.6.10 Product Development Expenses
Development expenses can be paid off sooner because of quicker product development cycles. This lowers the interest or opportunity cost of the
money invested in product development. Similar logic applies to tooling
and research expenses for technology development.
6.6.11 More Efficient Development Costs Less
Advanced product development methodologies are more efficient because
the product is well defined and the architecture is optimized around creative
concepts. This thorough early development work means fewer false starts or
“looping back” to do things over, fewer changes, and fewer redesigns.
6.6.12 Product Development Risk
Faster developments have less obsolescence risk. Shorter product development cycles result in less chance of market shifts and technical obsolescence by the time the product reaches the market, thus resulting in fewer
changes and redesigns.
6.7 COST SAVINGS OF OFF-THE-SHELF PARTS
Specifying off-the-shelf parts and subassemblies (Section 5.19) offers several ways to minimize cost in product development, purchasing, manufacturing, quality, and reliability.
Off-the-shelf parts are less expensive to design if you consider the cost
of design, documentation, prototyping, testing, debugging, and, if necessary, change orders or redesign. Purchasing one off-the-shelf subassembly
is only one purchasing action, but it incurs less material overhead than the
effort to purchase all the constituent parts.
The cost of off-the-shelf parts will be lower because suppliers of off-
the-shelf parts are usually more efficient at their specialty because they
Minimizing Total Cost by Design • 235
are more experienced with their products, continuously improve quality,
design parts better for DFM, and may dedicate production lines. Further,
they are far up on the learning curve, so they don’t have to incur costs and
delays to learn how to make good parts.
Quality costs will be lower, often much lower, because good suppliers
have processes under control, with the best suppliers utilizing statistical
process controls and Six Sigma quality techniques. Suppliers who have
dedicated product lines can ensure higher quality than lower-volume suppliers that have to keep changing over lines for different products.
Reliability costs can be lower, especially if a supplier’s part has been in
production long enough to get feedback from the field and corrective action
has been taken. For these parts, suppliers can furnish reliability data.
6.8 MINIMIZING ENGINEERING CHANGE ORDER COSTS
Advanced product development methodologies result in a higher percentage of products designed right the first time and, thus, fewer engineering
change orders. Better product definition results in fewer changes to satisfy
customers. Early changes in the planning stage are less expensive than late
changes at the hardware stage.
Well-designed products can minimize a substantial overhead expense
that is not always included in change order cost reporting: firefighting or
problem solving. This is the often-considerable effort expended to solve
production problems, which is usually intense when a new product is
launched into production. The cost of changes rises exponentially as the
product progresses toward production, as shown in Figure 1.3.
6.9 MINIMIZING COST OF QUALITY
The cost of quality is really the cost of poor quality: the cost of finding and
repairing defects. Companies without strong Total Quality Management
programs can have quality costs equal to 15% to 40% of revenue.14
Advanced product development can design in quality. Concurrently engineered processes that are in control can build in quality. This dual approach
236 • Design for Manufacturability
to quality can substantially reduce both the internal and external costs of
quality, which are defined as follows:
Internal cost of quality includes the cost of non-value-added activities
such as testing, scrap, diagnostics, rework, reinspection of rework,
purchasing actions to procure replacements materials/parts, analysis
of quality problems, cost of corrective actions, change-induced quality costs, and change orders to correct the design.
External cost of quality includes the cost of dealing with customer complaints, refunds, returned goods, repair of returns, warranty claims,
patch costs, legal liabilities, recalls, damage control, penalties, and
corrective actions on the above. External costs also include hard-to-
quantify costs, such as bad publicity, damaged reputations, lost good
will, and lost sales.
Companies can have poor internal quality but, with a good “test screen,”
can keep defects within the factory and, thus, have a high external quality. Achieving external quality totally by testing and rework is expensive,
and depending on testing would result in a high cost of quality. Many
expensive products, such as luxury automobiles not made in Lean environments, may enjoy a quality reputation, but they are expensive because
quality is achieved at a high cost. Before TQM spread to this industry,
some luxury automobiles required several times more labor effort to fix
than a well-designed car requires to build!15
Another cost of quality is the “defects-by-the-batch” effect in which
large batches of parts are made with recurring defects that are not noticed
until the batches have traveled through many more workstations. By the
time the defects have been spotted in final inspection, hundreds or thousands of defective parts have been made, which then have to be reworked
or scrapped. In Lean Production, parts are made in a one-piece flow, with
immediate feedback at each handoff, so there should be very little chance
of recurring defects being produced.
A thorough list of cost of quality categories is presented in the
American Society of Quality’s book, Principles of Quality Costs: Principles,
Implementation, and Use.16
Continuous improvement, or kaizen in Japanese, is an effective technique to keep driving costs down with incremental improvements that
Minimizing Total Cost by Design • 237
can have significant cumulative effects. Continuous improvement can be
performed spontaneously by in-house workers,17 as a part of quality programs, or in cooperative efforts with suppliers.18,19
6.10 RATIONAL SELECTION OF LOWEST COST SUPPLIER
The rational selection of the lowest cost supplier encompasses both the
make versus buy decision and supplier selection. These decisions must be
made rationally on a total cost basis. As discussed throughout this chapter,
conventional cost systems can mislead decision makers if they report only
on labor and materials. Not quantifying and including all the overhead
costs for in-house manufacture creates a bias toward that option, because
purchases include all costs, by definition, and in-house production may not.
Regarding supplier selection, total costs can actually increase as a result
of choosing the supposedly low bidder if purchase cost is emphasized over
such subtle, but important, characteristics as quality, delivery, flexibility, and help with product development. Jordan Lewis, in his book about
customer–supplier alliances, The Connected Corporation, commented
about the effects of General Motors’ 1992 demands for double-digit price
cuts from suppliers, which were instituted by the now-infamous J. Ignacio
Lopez de Arriortua:
“By emphasizing price alone with its suppliers GM won immediate savings—and ignored total cost. At GM’s plant in Arlington, Texas, an
ill-fitting ashtray from a new, substandard supplier caused a six-week shutdown of Buick Roadmaster production.”
Another GM plant saved 5% by going with a low bidder; when the parts
were delivered, one-half failed quality tests. The other supplier, that had
originally lost the bid, had to gear up production in four days and fly parts
to GM by chartered plane. The second supplier commented that, “My
guess is that their 5 percent savings turned into a 15 percent loss.”20
Peter Drucker, writing in Managing in a Time of Great Change,21 encouraged lowering total cost by minimizing “interstitial” costs between suppliers and manufacturers or between manufacturer and distributor:
238 • Design for Manufacturability
“But the costs that matter are the costs of the entire economic process in
which the individual manufacturer, bank, or hospital is only a link in a
chain. The costs of the entire process are what the ultimate customer (or
the taxpayer) pays and what determines whether a product, a service, an
industry, or an economy is competitive.”
“The cost advantage of the Japanese derives in considerable measure
from their control of these costs within a keiretsu, the “family” of suppliers and distributors clustered around a manufacturer. Treating the
keiretsu as one cost stream led, for instance, to “just-in-time” parts
delivery. It also enabled the keiretsu to shift operations to where they
are most cost-effective.”
Early and active participation of vendors will result in a lower net cost,
because having the vendor help design the part will greatly improve the
manufacturability, quality, and lead time, thus resulting in lower manufacturing, quality, and supply chain costs. Further, vendor partners who
work with their customers from the beginning will be able to charge less
because they: (1) understand the part requirement better, (2) are able
work with their customer to minimize cost, and (3) won’t have to add a
“cushion” to deal with an unknown customer. The case for vendor partnerships is presented in Section 2.6.
6.11 LOW BIDDING
Going for the low bid is something management consultants have been
trying to discourage for years, but now it has seen a resurgence just because
it is easy to do on the Internet. This comes at a time when many purchasing functions are under heavy pressure to go for low bids,22 and directives
are coming in from as high as the chairman of the board at one company
with a $9 billion/year purchasing budget.
Bidding for the cheapest parts is not only an ineffective way to achieve
real cost reduction, but it can substantially raise less-obvious costs and
compromise other important goals, such as quality and delivery. Quality
usually takes a back seat when buying decisions are focused on purchase
cost, especially in bidding situations. Some say that quality standards can
be set for all bidders, but it is a dangerously naïve assumption to believe
that quality can be assured simply by setting a metric. Further, focusing
Minimizing Total Cost by Design • 239
cost reduction efforts on part bidding distracts attention from real cost
reduction opportunities, which are addressed throughout this book.
Dick Hunter, vice president of fulfillment and supply chain management for Dell Computer, says that online auctions are no “silver bullet”:
“Auctions and exchanges have fueled the thinking that price is everything.
But there is more to procurement of materials than just price. Quality, service, responsiveness, and the willingness to improve common processes
also are very critical to driving down the total cost of materials.”23
6.11.1 Cost Reduction Illusion
In old-paradigm companies, cost reduction efforts are focused primarily on parts and materials (hereafter called parts), because that is all that
most cost systems are able to quantify, besides labor. Many manufacturers, especially in the automobile business, beat up their part suppliers for
repeated cost reductions.
However, before manufacturers fall for a magic elixir, they should consider how part costs really would be lowered under such pressure. The
assumption seems to be that either purchasing agents have naïvely offered
to pay too much or cavalier part makers have been gouging their customers. Although this may have been true in sleepy industries of the past, it is
rarely true in today’s dynamic marketplaces.
Another assumption is that inefficiencies can be corrected by pressure
after a supplier wins a contract at a lower-than-usual price. However, soon
after a supplier wins a bid, it is expected to deliver the goods, and there will
not be time to implement a meaningful cost reduction program, as presented throughout this book. Thus, without a real means to lower costs, the
supplier will have to cut its margins (which will be resisted from the corner
office all the way to Wall Street), cut corners, or pressure its suppliers, who
may have the same difficulty achieving real cost reductions. Further, if suppliers are either making disappointing profits or struggling to reduce costs,
they will not be receptive nor cooperative when asked to help a customer in
a bind or to implement programs to build parts on demand for assemblers.
In some cases, suppliers will temporarily lose money to “buy into the
business,” with the expectation of raising costs later, once they are in. And
there are even suppliers out there whose strategy is to bid jobs at zero profit
and make all their money on the expected change orders.
240 • Design for Manufacturability
In other cases, low bidders “win” because they don’t understand the
problem and then are ultimately unable to deliver at all. In other cases,
winning bidders are “vapor” companies, whose goal is keep bidding down
until they win and then patch together a virtual network of alliances to
somehow fulfill the order. This phenomenon came out at an in-house seminar24 when the discussion topic was if anyone had noticed any problems
with online competitive bidding. Within seconds, the purchasing manager was jumping up and down waving both hands in the air. He related
how they had discovered that one low bidder was working out of an apartment, with the strategy to win the auction and then figure out later how
to deliver the goods! This purchasing manager also said that a corporate
dictate to do part bidding was alienating their valued suppliers with whom
they had good relationships.
6.11.2 Cost of Bidding
Bidding keeps purchasing so busy managing the bidding process that they
are not able to help their teams develop products, ensure availability, and
set up vendor partnerships. The Toyota Product Development System book
sums up the cost and wasted resources of bidding as follows:
“Searching the globe for the lowest cost means managing very large numbers of suppliers as well as introducing a steady stream of new suppliers
into your system. These suppliers are unfamiliar with your requirements
and demand a great deal of attention to get up and running. While administering complex contracts, managing global bidding wars, and overseeing
the constant introduction of new suppliers into the process, US automakers
must maintain mammoth purchasing organizations, deal with incredibly
cumbersome and slow sourcing processes, and live with constant variation
of supplier performance in the development process.”25
All of that to “save cost”!
Even after all that effort, problems often arise because low bidders may
not understand the problem or may be cutting corners, which raises other
costs, such as quality, expediting, delayed launches, warranty costs, or the
costs of recalls.
The biggest cost of bidding may be the value of the resources it takes
away from product development to support bidding (at both the customer
and vendor), to: (1) update/change documentation, CAD files, materials, tooling, and processing; (2) complete transfers; and (3) deal with
Minimizing Total Cost by Design • 241
new or ongoing problems related to ramps, delivery, quality, or getting
up the learning curve, sometimes through many iterations. All the above
problems are much worse when offshoring to another continent, the case
against which is presented in Section 4.8.
6.11.3 Pressuring Suppliers for Lower Cost
Beating up suppliers for drastic part cost reduction is what Lopez tried at
GM. This tactic not only failed to generate real, lasting cost savings, but
it also alienated the supplier base and drove the best suppliers to competitors. The suppliers that remained put their best people on Ford and
Chrysler projects and withheld their newest developments from GM,
because Lopez was using proprietary supplier information to press all suppliers for lower prices. Further, the so-called “savings” in purchasing cost
caused severe costs to be incurred elsewhere. The “cost-cutting campaign
of Lopez, whose heavy-handedness drove away many of the company’s
best suppliers … perversely, may have helped raise GM’s total costs.”26
When Rubbermaid first encountered cost pressures from powerful
retailers, such as Walmart, its first response as a leading company was to
make sure customers understood the necessity of price increases! When
they realized that they really had to reduce prices, they tried what didn’t
work for Lopez at GM and were similarly alienated by their supply base.
According to the largest research project ever devoted to corporate failures,
Why Smart Executives Fail: And What You Can Learn from Their Mistakes:
“With little talent in cutting costs in-house, Rubbermaid looked to shift
responsibility elsewhere. Suppliers were prodded to knock down their own
prices, alienating some of the best, low-cost vendors in the process.”27
Bidding creates a standoffish relationship between buyers and sellers that
inhibits cooperative cost reduction, which is the key to real cost reduction.
The book that started the Lean Production movement in America concluded this about the effects of bidding on suppler relations:
“A key feature of market-based bidding is that suppliers share only a single
piece of information with the assembler: the bid price per part. Otherwise,
suppliers jealously guard information about their operations, even when
they are divisions of the assembly company. By holding back information on
how they plan to make the part and on their internal efficiency, they believe
they are maximizing their ability to hide profits from the assembler.”28
242 • Design for Manufacturability
6.11.4 The Value of Relationships for Cost Reduction
Another common assumption is that if suppliers know they will have to bid,
they will implement effective long-term cost reduction efforts. However,
the most successful real progress in cost reduction has come from long-
term relationships, where manufacturers work together with suppliers.29,30
Again, citing The Machine That Changed the World, which said that
in Lean Production companies, suppliers “are not selected on the basis of
bids, but rather on the basis of past relationships and a proven record of
performance.”31
Honda’s criterion for selecting suppliers is the attitudes of their management.32 As a philosophy-driven company, Honda feels it is easier to
teach product and process knowledge than to find a technically capable
supplier with the right attitudes, motivation, responsiveness, and overall competence.33
Much of the real cost reduction opportunities are not just at the assembler or at the supplier, but rather in their relationship. In a thorough study
of Japanese Lean manufacturers, When Lean Enterprises Collide, Robin
Cooper stated that, “it is no longer sufficient to be the most efficient firm;
it is necessary to be part of the most efficient supplier chain.” The key to
accomplishing this is inter-company cooperation, summarized by Cooper
as follows:
“The blurring of organizational boundaries becomes critical as competition intensifies because it not only reduces the time it takes the entire
supplier chain to bring out new products with increased functionality but
also allows quality to be improved while reducing cost.”
Cooper recommends partner companies “create relationships that share
organizational resources, including information that helps improve the
efficiency of the interfirm activities.”34
Such inter-company cooperation offers significant cost reduction opportunities, especially if suppliers can build parts on demand for build-to-order
assemblers.35 In this way, both organizations avoid all the cost and risk of
parts inventory in addition to minimizing many categories of overhead for
procurement, material overhead, expediting, warehousing, internal distribution, and so forth.
Switching suppliers every time a competitor drops its price is incompatible with this strategy and can jeopardize ongoing relationships. A Fortune
magazine article by Jerry Useem, Director of the Center for Leadership
Minimizing Total Cost by Design • 243
and Change at the Wharton Business School, summarized the failure of
an online bidding site:
“For the bulk of spending, corporations have long been moving in precisely
the opposite direction, establishing deep relationships with a few favored
suppliers in a “total cost” approach. Under this approach, price is but one of a
host of criteria, which include quality, cycle time, service, and geography.”36
The same article also revealed some realities about the purchasing process
that question how welcome bidding would be for typical buyers:
“In retrospect, say analysts, most B2B efforts betrayed pronounced cluelessness about how industrial buying actually works. Start with the supposition that purchasing managers would be thrilled to take bids online from
dozens if not hundreds of suppliers each vying to be the lowest bidder.”
Another article that proclaimed low-bid auction sites as “yesterday’s
darlings,” said that: “Many companies just weren’t willing to dump the
networks of suppliers they had built up over the years and do all their buying through a new, unfamiliar medium.”37
6.11.5 Cheap Parts: Save Now, Pay Later
Actually, this phrase should be, more precisely: save a little now, pay a lot
later. Often, trying to save money on purchase cost has the unintended
effect of driving up other costs many times the assumed savings, like the
English adage: penny wise, pound foolish, or the more colloquial, you get
what you pay for. The chain reaction of consequences from cheap parts is
graphically shown in Figure 1.2.
Cheap parts are usually just that—cheap parts that usually earn the
stereotypical image of poor quality, which will add significant cost in
the plant and cost even more if bad products get out, not to mention
potential hazards to life and limb and loss of corporate reputations.
Even though quality disasters may be thought of as infrequent anomalies, these costs must be included in the company’s cost of quality metric, not just considered a one-time charge. Programs that aim to improve
quality should be justified in their ability to prevent all quality costs, from
an accumulation of many up to and including “the big one.”
In the 1990 J.D. Power ratings of automobile reliability, Mercedes-Benz
received the top rating. But by 2003, Mercedes had slipped to 26 out of the
244 • Design for Manufacturability
37 cars ranked.38 One of the reasons for the drop in quality was cited by
European analysts:
“Executives of what then was Daimler-Benz grew worried about escalating production costs in the early 90s. Executives then made a policy decision to start trimming costs by notching down specifications for many
components.”39
6.11.6 Reduce Total Cost Instead of Focusing on Cheap Parts
In addition to the cost ineffectiveness of part bidding and its detrimental
effects on relationships, there is the compelling argument that other cost
categories provide much greater opportunities for real cost reduction, as is
emphasized throughout this book. There are many ways to minimize total
cost; Chapter 7 presents easy ways to quantify total cost.
There are enormous opportunities to reduce total cost throughout the
supply chain, without any negative consequences, by designing for manufacturability, specifying off-the-shelf parts, eliminating the costs of setup,
inventory, and obsolescence, and substantially reducing the costs of quality, distribution, and material overhead.
6.11.7 Value of High-Q uality Parts
Receiving high-quality parts is especially important to Lean and build-to-
order operations because:
• Dock-to-line deliveries count on “quality assured at the source” so
that incoming inspections are not necessary and parts can go straight
to all the points of use. This not only saves on the cost of incoming
inspections, but also enables spontaneous resupply techniques.40
• One-piece-flow operations are more sensitive to failed parts looping
back and disrupting the flow.
• Testing large batches of identical parts is not compatible with flexible operations.
• Having part quality assured at the source plus the continuous quality feedback of one-piece flow will enable Lean plants to assure quality
by process controls rather than expensive and time-consuming testing—or risky low bidding.
• Raising the quality of parts improves product quality (Section 10.3).
Minimizing Total Cost by Design • 245
Fortunately, there are suppliers that practice kaizen continuous improvement and can provide high-quality products at a low price. Because of
their cooperative nature and big picture orientation, these companies
would naturally align with customers who value long-term relationships
instead of participating in the bidding process.
Another related trend is becoming apparent: The best suppliers are
shunning the bidding process. Philip L. Carter, professor of purchasing at
Arizona State University, Tempe, and executive director of the Center for
Advanced Purchasing Studies (CAPS), concluded that: “Manufacturers
that are tempted to source key parts and materials through a trading
exchange may find it difficult to connect with the most innovative, quality conscious vendors, since many likely will boycott the auction bidding
process, viewing it ‘as a margin-squeezing play’.”41
6.12 MAXIMIZING FACTORY EFFICIENCY
Rapid product development can more quickly phase out older, more costly
products with new-generation cost-effective products. The older, less-
efficient products, in addition to having higher direct costs for labor and
materials, have higher overhead demands for engineering change orders
and firefighting. More efficient production, from better designed products, can result in more output from existing plants and equipment. For
growing companies, this extra output might spare the company, or at least
defer, the expense of adding new equipment or expanding facilities.
6.13 LOWERING OVERHEAD COSTS WITH FLEXIBILITY
Flexibility can reduce overhead costs significantly. Some interesting parallels exist between flexibility and quality. Decades ago, it was commonly
believed that quality cost more. At that time, Philip Crosby wrote the
book, Quality Is Free,42 and showed that the gains from lowering the cost
of quality would pay for quality improvement efforts, thus making it free.
Similarly, the financial gains derived from flexible operations can more
than pay for the effort to make operations flexible. These gains will become
246 • Design for Manufacturability
a source of competitive advantage over companies that do not embrace
Lean Production, build-to-order, and mass customization.
There is a lot of working capital tied up in various forms of inventory: raw
materials and parts inventory; WIP inventory; and finished goods inventory in factory warehouses, at distributors, and at the dealers. Fortune
magazine estimates that, for Fortune 500 companies, working capital
averages an amount equal to 20% of sales.43
Ironically, inventory shows up on the balance sheet as an asset when, in
fact, inventory is really a liability to the operation of any manufacturing
plant, especially those needing to be flexible. This point was one of the
revelations presented in Eli Goldratt’s novel, The Goal, when managers of
the fictional plant, faced with extinction, realized that they had to focus
on the goal (making money) instead of letting their behavior be dictated by
irrelevant performance and cost accounting metrics.44
One progressive materials manager of a processing equipment company said that after much successful work to reduce inventory, he got a
call from the company controller, who was having trouble preparing the
annual report because the inventory had been reduced so much that it
was “lowering company assets,” according to their traditional accounting rules. Companies must make sure they are pursuing the real “goal”
instead of irrelevant metrics.45
The following discussion describes several opportunities to lower the
costs of inventory and other overhead costs by designing flexibility into
products and plants.
6.14 MINIMIZING CUSTOMIZATION/
CONFIGURATION COSTS
Many companies offer customized goods but do not do it cost-effectively.
By mass customizing products, the customization process is built into
the system—the product design and the manufacturing operation. For
more on mass customization, see Section 4.3 or read the companion
book for matching improvements in operations, Build-to-Order & Mass
Customization.46
Thus, the mass-customizer has cost advantage over companies that
are inefficient at customization and configuration. Two underreported
costs related to customization are custom engineering and changing or
Minimizing Total Cost by Design • 247
modifying standard designs and processes. Both of these activities usually
cost much more than is indicated by current cost systems. Many companies do not even keep track of engineering costs by project. In addition,
engineers often try to get a lot of “free” help from various support people
who are “just on overhead.”
The extra manufacturing cost to perform ad hoc customization and configuration reactively is much more than it would be for mass-customized
products. Reactive customization costs often include extra tooling, lengthy
setups for small runs, inefficient production control, low equipment utilization, special programming, slow and frequent learning curves, special
tests and inspections, and lots of fire drills to shove customized products
through mass production factories. Further, these low-volume customized products may disrupt the manufacture of the standard products, thus
increasing their cost. Thus, it is often the case, in companies with traditional accounting systems, that custom products are really being subsidized by the standard products.
6.15 MINIMIZING THE COST OF VARIETY
A large part of working capital is tied up in the cost of variety, which is
discussed in depth in Chapter 3 of Agile Product Development for Mass
Customization.47 Eliminating setup and reducing the batch size to one
eliminates most of the cost of variety.
The key element of Lean Production is setup elimination. If setup could
be eliminated, then operations would be flexible, meaning that every
product could be different and, yet, still reap mass production efficiencies. In low-volume operations, setup could be caused by any effort to do
something “different”; for instance, to get parts, change dies and fixtures,
download programs, find instructions, or any kind of manual measurement, adjustment, or positioning of parts or fixtures. Setup reduction
is discussed in Build-to-Order & Mass Customization, in Chapter 8,
“On-Demand Lean Production.”48
6.15.1 Work-in-Process Inventory
WIP inventory can be virtually eliminated by setup reduction, JIT, and
design commonality of parts and processes. WIP inventory costs rise
248 • Design for Manufacturability
proportional to batch size, except when the batch size is one, in which
case WIP inventory can be virtually eliminated. WIP inventory carrying cost could be 25% of its value per year.49 Thus, eliminating WIP inventory could result in substantial savings.
6.15.2 Floor Space
Floor space can be reduced because of reduced inventories, elimination of
the forklift aisles necessary to move large batches of parts, elimination
of kitting, and higher utilization of machinery and people. Appreciation of
the cost and value of floor space varies according to the need to expand manufacturing. But floor space reduction should be constantly pursued. The cost
of expanding manufacturing space is a large step function that may force
a company to move away from an area that is too crowded or expensive.
Reduction of the need for floor space can provide an attractive alternative
to expansion or relocation. Further, floor space requirements can be reduced
faster than new facilities can be built. The lead time for physical plant expansion is so large that such plans must be started well ahead of the anticipated
need, often based on inaccurate long-range marketing projections. Between
1991 and 1994, Compaq Computer quintupled production without increasing
factory space by implementing programs such as WIP inventory reduction.50
6.15.3 Internal Logistics
Internal transportation costs, such as forklift activity, can be reduced. In
fact, they can be eliminated when parts and products flow individually
between adjacent workstations, instead of in large, heavy bins between
distant workstations.
6.15.4 Utilization
Machine tool utilization is improved with less setup, thus reducing equipment cost. This has big cost savings potential for expensive equipment,
such as CNC machining centers, surface-mount printed circuit assembly
equipment, or expensive testers. Machine tool utilization can be as low
as 10%, which means the equipment is producing parts only 10% of the
time the machine is available for work; the remainder is setup or waiting. It is important to realize that doubling the utilization rate will double
output. If production equipment previously had utilization of 30%, the
Minimizing Total Cost by Design • 249
output could be doubled to a utilization of 60% and another 1.5 times to
90%. Utilization improvement is a cost-effective way to increase production output, and it is quicker, considering the lead time to procure and
install new production equipment.
6.15.5 Setup Costs
Setup labor expenses can be eliminated, including the labor cost to change
machine setups and to retrieve parts, tools, and drawings.
6.15.6 Flexibility
Flexibility can improve the balance of labor and machinery utilization in
sequential operations such as assembly lines. Products built in flexible lines
can be optimally ordered (a product with high demands on the A process
and low demands on the B process followed by a product with low A and
high B demands) to offset imbalances in the workloads of adjacent machinery or people, using a concept known as product complementarity.51
Production can quickly adapt to changing market conditions by building all the products on the same flexible line. Inflexible operations often
face a dilemma when the demand for “model A” has exceeded capacity,
while “model B” is having a sales slump. Manufacturing may have adequate
overall capacity, but the model A line or plant will not be able to satisfy
demand, while the model B line or plant is partly idle or laying off people.
A slightly more flexible approach would be to be able to move people from
the “B” line to the “A” line, but that assumes adequate equipment capacity on line “A.” Fully flexible operations would simply pull more model A
products, and fewer model B products, through the flexible line(s).
Operational flexibility can allow companies to transfer production from
one flexible line or plant to another to respond to changing market conditions, rather than the more expensive alternatives of overtime, rapidly
bringing contract labor up to speed, and spontaneous outsourcing to ease
production bottlenecks for the product that is in demand. Similarly, by
transferring production, companies can avoid layoffs at plants making
products that are in low demand. Mazda resolved such a dilemma by moving production of the popular Miata from its Hiroshima plant to the Hofu
plant, which was underutilized with Mazda 626 production. This manufacturing flexibility allowed Mazda to combine production of a niche sports
car with a family sedan in the same plant to balance output at both plants.52
250 • Design for Manufacturability
6.15.7 Kitting Costs
Kitting cost and space can be eliminated. Without flexibility, there are
labor costs and space requirements to gather all the parts for a batch, kit
them together, and deliver them to manufacturing.
6.16 MINIMIZING MATERIALS MANAGEMENT COSTS
Purchasing costs can be reduced if there are fewer purchasing actions for
fewer part types. Standardized parts will cost less because of the greater
purchasing leverage of higher volume parts. Automatic resupply techniques, such as kanban, min/max, and breadtruck, can resupply parts
with virtually no material overhead.53
Vendor fabrication and assembly are more feasible, and thus quicker
and less costly, if parts are well designed and documented, especially if
the vendor was part of the design team. Sometimes it may be more cost-
effective to have the vendor design the parts or subsystems, as is common
nowadays in the automobile industry.
Fewer part numbers means less material overhead for raw materials
and parts inventories, documentation, controls, etc. There will also be
less expediting cost for seldom-used parts that are difficult to obtain. In
every seminar, the author holds up a piece of paper, representing a standard parts list, and asks the most senior purchasing manager in the room
the question: “How much of your department’s activities are devoted to
ordering these standard parts?” The typical answer is 10%, which means
that material overhead for standard parts should be one-tenth that of the
remaining oddball parts.
6.17 MINIMIZING MARKETING COSTS
When manufacturers keep listening to customers’ wants and needs and
keep designing and manufacturing products to satisfy these evolving
needs, this results in learning relationships, which result in the ability
to keep customers forever.54 Not only is this good for generating revenue,
but it also saves the considerable cost of acquiring new customers to
Minimizing Total Cost by Design • 251
meet growth objectives. Studies such as the one done by the Technical
Assistance Resource Project for the US Office of Consumer Affairs have
shown that the price of acquiring new customers is five times greater than
the cost of keeping old ones.55
6.18 MINIMIZING SALES/DISTRIBUTION COSTS
There are considerable cost reduction opportunities in the warehousing
and distribution of products. The physical distribution system accounts
for about 10% of the gross national product.56
Designing modular products and concurrently engineering products and
production systems to build products on demand can save a lot of money
with respect to the way products are configured, packaged, shipped, distributed, and sold. In fact, build-to-order can eliminate most of the distribution
chain costs. Being able to build-to-order and ship from the plant eliminates
warehousing and associated costs of distribution from the plant to the customer. In industries where product variety is considerable, such as clothing,
this cost can be enormous, considering the number of sizes and styles.
6.19 MINIMIZING SUPPLY CHAIN COSTS
Supply chain management has become a strategic competitive advantage,
especially for companies like Hewlett-Packard.57 Peter Drucker points out the
opportunities to minimize cost in the supply chain: “Process-costing from
the machine in the supplier’s plant to the checkout counter in the store also
underlies the phenomenal rise of Wal-Mart. It resulted in the elimination
of a whole slew of warehouses and reams of paperwork, which slashed costs
by a third.”58 Sections 4.2.1 and 4.2.2 show how to simplify supply chains.
6.20 MINIMIZING LIFE CYCLE COSTS
An often neglected part of total costs is life cycle costs, which are those
costs that are incurred over time, such as service, repair, maintenance,
252 • Design for Manufacturability
field failures, warrantee claims, legal liabilities, changes over the life of
the product, and subsequent product developments. Products can be
designed to minimize life cycle costs. The cost of changes can be minimized by a methodical product definition and thorough product development. Change costs and subsequent product development costs can be
minimized with modular product architecture, where many modules can
remain unchanged as other modules are updated or redesigned.
6.20.1 Reliability Costs
Designing for reliability can minimize many costs related to product
reliability. Several techniques to maximize reliability are presented in
Chapter 10.
6.20.2 Field Logistics Costs
Spare parts logistics and field service can be greatly simplified, and thus
cost less, with part standardization and modular design. Products designed
around common parts have smaller spare parts kits. This could lower the
effective product price for savvy customers who add the cost of spare parts
kits to the product’s list price. Part standardization can also result in less
downtime due to part shortages. Service costs can be reduced if failed
modules can be quickly replaced and repaired in more efficient facilities.
6.21 SAVING COST WITH BUILD-TO-ORDER
If products and production processes can be designed to build products to
order, then many costs can be saved.
6.21.1 Factory Finished Goods Inventory
Factory finished goods inventory can be eliminated by building products
to order, instead of building to forecast and then holding products in a
warehouse until ordered by distributors or customers. Like WIP inventory, finished goods inventory may cost the same to carry, except that finished goods are completed and therefore are more valuable. Using 25%
of value per year, $10 million worth of finished goods in inventory would
Minimizing Total Cost by Design • 253
cost $2.5 million per year to carry. Build-to-order can eliminate factory
finished goods inventory and, thus, save its yearly inventory carrying cost.
6.21.2 Dealer Finished Goods Inventory
Dealer finished goods inventory can be almost eliminated if resupply
orders can be quickly filled and delivered to the customer. As with factory inventory, dealer inventory has a carrying cost. Even if the dealer or
distributor is separate from the manufacturer, the carrying cost will have
to be paid, ultimately by the customer.
For example, an automobile dealer with 200 vehicles in stock, with an
average value of $30,000, would have $6 million worth of inventory. Using
a yearly carrying cost of 25%, the carrying cost would be $1.5 million
per year. Put another way, if a car sits there for a year, its inventory carrying cost would be a quarter of $30,000 or $7,500, so it would have to
sell for that much more to pay for its inventory carrying costs! This cost
could be eliminated by build-to-order. The European automotive industry
sponsored a research project to investigate build-to-order for cars, which
resulted in the book, Build to Order: The Road to the 5-Day Car.59
When new car prices exceed customers’ ability to afford them, customers buy more used cars as a cost-effective alternative.60 Built-to-order
new automobiles could compete well against used cars, with lower prices,
because the new cars could avoid dealer inventory expenses, whereas used
cars must be stocked in inventory by definition.
6.21.3 Supply Chain Inventory
Supply chain inventory can be minimized because build-to-order products do not need to be stocked at various warehouses along the supply
chain: at distributors, consolidators, forwarders, and so forth. Similarly,
a build-to-order system pulls parts from suppliers on a just-in-time basis,
thus eliminating parts inventory along the supply chain. Regardless of
who pays for this inventory, the customer ultimately must pay a higher
price. Eliminating excessive supply chain inventory costs will allow customers to pay less for equivalent products.
Companies known for rapid deliveries, such as FedEx, are providing
companies with inventory-less direct deliveries of parts and products to
and from factories. Adding the value of increased sales from customer
satisfaction would make inventory-less distribution even more attractive.
254 • Design for Manufacturability
6.21.4 Interest Expense
Less interest expense will be incurred for expensive components in products that sell sooner because of the quicker throughput of flexible plants
and the elimination of finished goods inventory.
6.21.5 Write- O ffs
Inventory write-
offs can be eliminated because there would be no
products in inventory that could deteriorate, incur damage, or become
obsolete. If there is a substantial finished goods inventory of expensive
products, at the end of those products’ lives the obsolescence write-offs
could be enormous.
6.21.6 New Technology Introduction
Quicker transitions to new technology are possible if there are no older
technology products waiting in inventory that must be sold first. Dell
Computer is often the first to introduce new technology because they don’t
have large inventories that have to be sold first.
6.21.7 MRP Expenses
Bill-of-material and MRP (materials requirement planning) expenses could
be minimized. Build-to-order could minimize overhead expenses to translate forecasts into purchase orders using materials ordering requirements
with MRP systems. Mass customization can generate bills-of-material on
demand for products in families instead of writing and storing an individual BOM for each product variation.
6.22 EFFECT OF COUNTERPRODUCTIVE
COST REDUCTION
Companies will have a hard time achieving real cost reduction if they are
trying cost reduction attempts that are, in fact, counterproductive:
Minimizing Total Cost by Design • 255
• Manufacturing companies that offshore their manufacturing will
have a hard time implementing concurrent engineering when there
are no manufacturing people there with whom to be “concurrent.” In
many offshoring situations, people in engineering and manufacturing are not even working at the same time. For more, see Section 2.8
(co-location), Section 4.8 (offshoring), and the articles on outsourcing61 and offshoring62 at www.HalfCostProducts.com.
• Manufacturing companies that try to take cost out after the product
is designed will find it difficult and a waste of resources, for reasons
discussed in Section 6.1.
• Manufacturing companies who insist on bidding custom parts
are, in effect, precluding vendor partnerships and, thus, preventing those vendors from helping the company design the parts. The
benefits of vendor partnerships are discussed in Section 2.6. These
companies also encounter all the problems of low bidding discussed
in Section 6.11.
In companies that practice all three of the above, a high percentage of
product development resources will spend most of their time: making
change orders to try to implement DFM (because it couldn’t be done with
concurrent engineering); trying to take cost out using change orders after
the product is designed, converting documentation for outsourcing; getting
outsourcers up to speed; dealing with quality and delivery problems, and so
forth. In his travels, the author has encountered several companies that spend
two-thirds of product development resources on the above three activities
(which are cited at the bottom of the home page of www.HalfCostProducts.
com under the heading “How Not to Lower Cost”), which really puts their
future in doubt if that future depends on new product development. More
counterproductive policies are discussed in Section 11.5.
NOTES
1. See “How Not to Lower Cost” (and the linked articles) on the bottom of the home
page at www.HalfCostProducts.com.
2. James Morgan and Jeffrey K. Liker, The Toyota Product Development System (2006,
Productivity Press), Chapter 4, “Front-Load the PD Process to Explore Alternatives
Thoroughly.”
256 • Design for Manufacturability
3. Robert G. Atkins and Adrian J. Slywotzky, “You Can Profit from a Recession,” Wall
Street Journal, February 5, 2001, p. A22.
4. Robin Cooper and Robert S. Kaplan, “How Cost Accounting Distorts Product Costs,”
Management Accounting, April 1988.
5. H. Thomas Johnson and Robert Kaplan, Relevance Lost: The Rise and Fall of
Management Accounting (1991, Harvard Business School Press).
6. Douglas T. Hicks, Activity-Based Costing for Small and Mid-Sized Businesses: An
Implementation Guide (1992, John Wiley), p. 20.
7. Michael R. Ostren, Terrence R. Ozan, Robert D. McIlhattan, and Marcus D. Harwood,
The Ernst & Young Guide to Total Cost Management (1992, John Wiley & Sons),
p. 146.
8. Dr. Anderson facilitates product-specific workshops (Appendix D) after customized
in-house seminars. These workshops consist of many brainstorming sessions on concept simplification and architecture optimization. More challenging endeavors, such
as developing half-cost products, may need his concept studies (also in Appendix D),
in which he generates breakthrough ideas that concurrent engineering teams can
develop into manufacturable products.
9. James P. Womack and Daniel T. Jones, Lean Thinking: Banish Waste and Create
Wealth in Your Corporation, (1996, Simon & Schuster), p. 27.
10. David M. Anderson, Build-to-Order & Mass Customization: The Ultimate Supply
Chain Management and Lean Manufacturing Strategy for Low-Cost On-Demand
Production Without Forecasts or Inventory (2008, CIM Press), Figure 2.1, “Inventory
Carrying Cost Since 1961.” See book description in Appendix D.
11. Ibid., Chapter 9, “Mass Customization.”
12. Ibid., Chapter 7, “Spontaneous Supply Chains.”
13. Robin Cooper and Robert S. Kaplan, “How Cost Accounting Distorts Product Costs,”
Management Accounting, April 1988.
14. Philip B. Crosby, Quality Is Free (1979, Mentor Books).
15. James P. Womack, Daniel T. Jones, and Daniel Roos, The Machine That Changed the
World: The Story of Lean Production (1991, Harper Perennial).
16. Jack Campanella, editor, Principles of Quality Costs: Principles, Implementation, and
Use (1999, Quality Press, American Society for Quality).
17. Kiyoshi Suzaki, The New Manufacturing Challenge: Techniques for Continuous
Improvement (1987, Free Press).
18. Jordan D. Lewis, The Connected Corporation: How Leading Companies Win Through
Customer–Supplier Alliances (1995, Free Press), Chapter 8.
19. Womack, Jones, and Roos, The Machine That Changed the World, Chapter 6,
“Coordinating the Supply Chain.”
20. Lewis, The Connected Corporation, p. 38.
21. Peter F. Drucker, Managing in a Time of Great Change (1995, Truman Talley Books/
Dutton), p. 117.
22. Philip L. Carter, professor of purchasing at Arizona State University, Tempe, and
executive director of the Center for Advanced Purchasing Studies, was cited in
Industry Week (February 12, 2001, p. 43) as observing that “Many purchasing organizations are under heavy pressure form the corporate brass to implement some form
of e-commerce.”
23. John H. Sheridan, “Proceed with Caution,” Industry Week, February 12, 2001,
pp. 38–44. One of the cover stories on manufacturing exchanges.
Minimizing Total Cost by Design • 257
24. For more information on customized in-house DFM seminars, see Appendix D or
www.design4manufacturability.com/seminars.htm.
25. Morgan and Liker, The Toyota Product Development System, Chapter 10, “Fully
Integrate Suppliers into the Product Development System, p. 200.
26. “Smart Partners,” Business Week; review of The Connected Corporation by Jordan D.
Lewis, December 10, 1995.
27. Sydney Finkelstein, Why Smart Executives Fail: And What You Can Learn from Their
Mistakes (2003, Portfolio/Penguin), p. 62.
28. Womack, Jones, and Roos, The Machine That Changed the World, Chapter 6,
“Coordinating the Supply Chain,” p. 142.
29. Yasuhiro Monden, The Toyota Production System, Second edition (1993, Institute of
Industrial Engineers).
30. Womack, Jones, and Roos, The Machine That Changed the World, Chapter 6,
“Coordinating the Supply Chain.”
31. Ibid., p. 146.
32. Jeffrey Pfeffer and Robert I. Sutton, The Knowing–Doing Gap: How Smart Companies
Turn Knowledge into Action (2000, Harvard Business School Press), p. 23.
33. John Paul MacDuffie and Susan Helper, “Creating Lean Suppliers: Diffusing Lean
Production through the Supply Chain,” California Management Review, Summer
1997, pp. 118–150.
34. Robin Cooper, When Lean Enterprises Collide (1995, Harvard Business Press),
Chapter 9, “Interorganizational Cost Management Systems.”
35. Anderson, “Build-to-Order & Mass Customization.”
36. Jerry Useem, “Dot-Coms: What Have We Learned?” Fortune, October 30, 2000, p. 92.
37. “Lessons from the Dot-Com Crash,” Fortune, October 30, 2000, p. R8.
38. Lee Hawkins, Jr., “Finding a Car That’s Built to Last,” Wall Street Journal, July 9, 2003,
p. D1.
39. John O’Dell, “Even Mercedes Hits a Few Speed Bumps,” Los Angeles Times, July 13,
2003, pp. C1 and C4.
40. Anderson, Build-to-Order & Mass Customization, Chapter 7, “Spontaneous Supply
Chain.”
41. Carter., p. 43.
42. Crosby, Quality Is Free.
43. Shawn Tully, “Raiding a Company’s Hidden Cash,” Fortune, August 22, 1994, p. 82.
44. Eliyahu M. Goldratt, The Goal, Second revised edition (1992, North River Press),
Chapter 33, p. 268.
45. Goldratt’s The Goal makes this point often about the need to do “what makes sense”
to achieve “the goal,” rather than basing decisions and actions on attempts to satisfy
arbitrary performance metrics and cost measurements that only make a small part of
the system appear to look productive or cost-effective.
46. Anderson, Build-to-Order & Mass Customization, Chapter 9, “Mass Customization.”
47. David M. Anderson, with an introduction by B. Joseph Pine, II, Agile Product
Development for Mass Customization (1997, McGraw-Hill), Chapter 3, “Cost of
Variety.”
48. Anderson, Build-to-Order & Mass Customization, Chapter 8, “On-Demand Lean
Production.” See book description in Appendix D.
49. Ibid, Chapter 2, Figure 2.1.
50. Ronald Henkoff, “Delivering the Goods,” Fortune, November 28, 1994, p. 62.
258 • Design for Manufacturability
51. Marshall Fisher, Anjani Jain, and John Paul MacDuffie, “Strategies for Product
Variety: Lessons from the Automobile Industry,” Working paper from the Wharton
School, University of Pennsylvania, January 16, 1994, p. 26.
52. Ibid., p. 31.
53. Anderson, Build-to-Order & Mass Customization, Chapter 7, “Spontaneous Supply
Chain,” or see summary of spontaneous resupply techniques in Section 4.2.
54. B. Joseph Pine, II, Don Peppers, and Martha Rogers, “Do You Want to Keep Your
Customers Forever,” Harvard Business Review, March–April 1995, p. 103.
55. Wilton Woods, “After All You’ve Done for Your Customers, Why Are They Still Not
Happy,” Fortune, December 11, 1995, p. 180.
56. Robert V. Delaney, Sixth Annual State of Logistics Report, Cass Information Systems,
St. Louis, MO, June 5, 1995, Figure #8.
57. Dr. Corey Billington, “Strategic Supply Chain Management,” OR/MS Today, April
1994, pp. 20–27.
58. Drucker, Managing in a Time of Great Change, p. 117.
59. Glenn Parry and Andrew Graves, Editors, Build to Order: The Road to the 5-Day Car
(2008, Springer-Verlag, London).
60. Douglas Lavin, “Stiff Showroom Prices Drive More Americans to Purchase Used
Cars,” Wall Street Journal, November 1, 1994, p. 1.
61. See the outsourcing article at the author’s website: www.HalfCostProducts.com/
outsourcing.htm.
62. See the offshoring article at the author’s website: www.HalfCostProducts.com/
offshore_manufacturing.htm.
7
Total Cost
In order to appreciate all of the cost savings and revenue enhancements
cited in Chapter 6, it would be highly advantageous to be able to quantify
all costs. If costs were tracked on a total cost basis, then the cost-saving
potential of well-designed products could be known and products could
be assigned appropriate overhead charges and thus competitive prices.
However, if total cost is not tracked, then well-designed products may be
assigned the same overhead as loser products, which is an unfair burden
and may ultimately compromise the well-designed product’s success.
Most companies have such inadequate cost systems that it actually
hinders good product development and distorts product development
decisions. Merely reporting labor and material costs encourages (sometimes forces) engineers to specify cheap parts and low bidders to achieve
“cost targets” and move manufacturing offshore, away from engineering,
“to save cost,” which, in reality, thwarts concurrent engineering. Many
references cited in this chapter have been pointing out the deficiencies,
and the consequences, of traditional cost measurements for the last two
decades. The quotes from these authoritative sources may be helpful to
build interest in your own total cost program.
Products with too much setup, inventory, firefighting, engineering
change orders, excessive parts variety, low equipment utilization, and
high quality costs should have a higher overhead rate. Products that are
designed, using the methodologies presented herein, for quick and easy
manufacture should have a much lower overhead rate. Overhead rates
should be proportional to overhead demands, which vary by product.
The ability to quantify total cost is critical to designing for manufacturability. Let us consider the proverbial “Model-T plant”—a plant with
only one product and no variations. The Ernst & Young Guide to Total
259
260 • Design for Manufacturability
Cost Management discussed the cost management implications of a single-
product plant:
“If product variety were absent, the business environment would be simple. … In a world like this, you could do product costing literally on the
back of an envelope. You would simply divide the total production costs by
the total production volume to calculate a unit cost.”1
However, as Cooper and Kaplan2 pointed out in an article with the
profound title, “How Cost Accounting Distorts Product Costs,” overhead costs “vary with the diversity and complexity of the product line.”
And, product diversity and complexity have gotten out of hand as companies keep adding products but don’t rationalize any away, as discussed
in Appendix A. Thus, it is important to quantify overhead cost to assign a
product’s overhead charges proportional to all its overhead costs.
7.1 VALUE OF TOTAL COST
Total cost systems quantify all costs and, therefore, should be the basis of
all cost decisions. All costs should be attributed to some product or service. No varying costs should be averaged over all products, but in most
companies, overhead is “spread like peanut butter.” Total cost numbers
should be the foundation of relevant strategies that lower cost and encourage activities that actually reduce total cost.
7.1.1 Value of Prioritization and Portfolio Planning
Quantifying all costs is necessary to compute the real profitability of products. Knowing the relative profitability of all product variations will help
you prioritize:
• The highest return efforts in product development and improvement
initiatives in quality and operations
• The highest return orders to accept and which low-return orders to
turn down
For both the new product development portfolio and sales strategies,
quantifying all costs will help you:
Total Cost • 261
• Make the best decisions on which products to redesign to lower cost
• Decide which legacy products to drop, outsource, or improve
• Decide on investments to develop modules that can be used on many
current and future products
• Optimize the product portfolio of products, product lines, customers, and market segments
• Generate a profile to predict profitability at the estimating stage
• Determine sales incentives based on profitability instead of sales dollars or units sold
7.1.2 Value of Product Development
Better order prioritization will prevent draining of product development
resources on low-potential products. Knowing the real cost of cost reduction efforts can redirect resources so they can make more money through
product development, Lean Production, quality improvement programs,
and so forth. Investing now in the development of hardware and software
modules will benefit future product developments. Quantifying the cost of
quality will discourage selecting or substituting cheap parts to “save cost.”
7.1.3 Value of Resource Availability and Efficiency
Better prioritization and portfolio planning will prevent the waste of valuable
resources for hard-to-build orders and hard-to-customize variations. Total
cost numbers will help rationalize them away or justify profit-and-loss centers
for those items, as well as low-volume sales, legacy parts, and spare parts.
Quantifying benefits will also improve resource efficiency, by helping
to justify design tools, training, and other overhead reduction programs
such as Lean Production and Six Sigma quality improvements. Similarly,
it will help justify automation, production tools, versatile CNC machine
tools, and setup reduction efforts.
7.1.4 Value of Knowing the Real Profitability
Quantifying all costs will enable generation of the real profitability numbers for all products and product variations, which will identify low-profit
and money-losing products, so that you can:
• Implement more realistic pricing.
• Turn down orders in favor of more profitable endeavors.
262 • Design for Manufacturability
• Rationalize them away (Appendix A) and steer customers to newer,
better (more profitable) products that can be delivered quicker. The
sales force could say, “Sorry, that old model has been discontinued,
but we have a better one that we can get to you quicker at lower cost.”
• Build remaining products in self-supporting profit-and-loss centers
with dedicated people, not borrowed from product development efforts.
• Outsource to contract manufacturers specializing in low-volume
and legacy products.
7.1.5 Value of Quantifying All Overhead Costs
Quantifying all overhead will result in lower overhead charges allocated to
products designed to lower overhead costs. Quantifying the cost of quality
will encourage behavior that lowers quality costs and does not raise quality costs by trying to lower the usual quantified costs, such as parts costs.
Quantifying all costs will enable real cost reduction actions, which often
appear to raise a BOM line, but actually lower total cost. For instance, it
will encourage consolidation, standardization, modularity, and versatility.
Quantifying all costs will enable more realistic decisions on offshoring
versus integrated manufacture (discussed in Section 4.8).
7.1.6 Value of Supply Chain Management
Total cost will remove the biggest obstacles to standardization: the perception that a better part will cost more if it raises a BOM line. However, the
overhead savings will be much more.
Knowing all the costs of part and material availability problems (expediting, buying lifetime inventory, change orders to design in replacement parts,
and the resources to do these) will justify searching for more available
parts and even paying a little more to ensure that availability, knowing that
will save more on a total cost basis. Total cost numbers can lead to the best
decisions on designing and/or making parts versus buying them off-the-shelf.
7.2 QUANTIFYING OVERHEAD COSTS
The first step in quantifying overhead is to acknowledge the deficiencies
in the current cost system, which is the central theme of Johnson and
Total Cost • 263
Kaplan’s pivotal book, Relevance Lost: The Rise and Fall of Management
Accounting.3 Traditional cost accounting systems were designed to present operational results and the financial position of the organization as a
whole for investors and for agencies that tax or regulate. However, managers and engineers need relevant cost information to make good decisions.
Typical problems caused by conventional cost systems are discussed in
this section.
7.2.1 Distortions in Product Costing
This costing distortion is discussed at length in the Cooper and Kaplan
reference cited above. Johnson and Kaplan concurred:
“The management accounting system fails to provide accurate product
costs. Costs get distributed to products by simplistic measures, usually
direct-labor based, that do not represent the demands made by each product on the firm’s resources.”
The Guide to Total Cost Management asserts that product costs “are
distorted because each product typically includes an assignment of overhead that was allocated on some arbitrary basis such as direct labor, sales
dollars, machine hours, material cost, units of production, or some other
volume measure.”4
Distorted product costing results in distorted pricing that can underprice
some products so low that they actually lose money and overprice other
products to the point where they are uncompetitive.5 Distorted product
costing results in a distorted perception of the profitability of all the company’s products. This distorted view of profitability can cause managers to
“feed the problems and starve the opportunities,” with detrimental effects
on product development priorities. Understanding the real profitability will
allow companies to drop unprofitable products and focus on profitable ones.
7.2.2 Cross-Subsidies
Averaging overhead will cause cross-subsidies, where high-volume products subsidize low-volume products and standard products subsidize
custom products. Johnson and Kaplan have stated unequivocally, “The
standard product cost systems, which are typical of most organizations,
usually lead to enormous cross-subsidies across products.”6
264 • Design for Manufacturability
Cooper, Kaplan, et al., in their Institute of Management Accountants-
sponsored study, summarized what their eight case study manufacturing
organizations discovered after they implemented total cost measurements:
“The manufacturing companies generally found, as expected, that low-
volume, complex products tended to be much more expensive than had
been calculated by the existing standard cost system.”7
One of the most dangerous consequences of cross-subsidies is penalizing new-generation DFM products and programs such as build-to-order
and mass customization by making them pay the same overhead charges
as the products that have high overhead demands. Such unfair charges could
ultimately thwart new-generation products and programs.
7.2.3 Relevant Decision Making
Good decisions are the keys to success in any business venture, and this
especially applies to product development. Unfortunately, many managers and engineers try to make decisions by the numbers, when the numbers
are misleading or even irrelevant. Again, quoting Johnson and Kaplan:
“Ironically, as management accounting systems became less relevant and
less representative of the organization’s operations and strategy, many
companies became dominated by senior executives who believed they
could run the firm ‘by the numbers’.”8
And again quoting the Guide to Total Cost Management:
“If the costs are wrong, then all decisions about pricing, product mix, and
promotion could be undermining long-term profitability.”9
Johnson and Kaplan stated that accurate, relevant numbers, based on
total cost, can lead to much better decision making:
“The management accounting system also needs to report accurate product
costs so that pricing decisions, introductions of new products, abandonments
of obsolete products, and responses to the appearance of rival products can
be made with the best possible information on product resource demands.”10
Johnson and Kaplan also stated that accurate, relevant numbers are important to support improvement programs: “… An ineffective management
Total Cost • 265
accounting system can undermine even the best efforts in product development, process improvement, and marketing policy.”
7.2.4 Cost Management
Since one of the major challenges of design for manufacturability is to
produce products at low cost despite the other challenges of speed and
quality, cost management takes on a new level of importance. But conventional cost management systems are of little help here:
“Management accounting reports are of little help to operating managers
attempting to reduce cost and improve productivity.”11
7.2.5 Downward Spirals
Cost accounting distortions can create “reinforcing” behavior (reinforcing
loops) that can cause a business to “spiral down.” The concept of reinforcing loops was presented by Peter Senge in his book, The Fifth Discipline.12
Companies making both high-
volume and low-
volume products, as
pointed out by the above cost management references, really do have different overhead demands. However, if overhead is averaged, then the spiral
will occur, as shown in Figure 7.1.
Overhead allocations are averaged.
High-volume products are over-price
High-volume sales decrease.
Low-volume sales increase.
More overhead spreads
over fewer products.
Low-volume products are subsidized
Overhead demands go up.
Profits go down.
All prices go up.
Sales and profits go down.
Sales and profits go down further.
FIGURE 7.1
Cost distortion downward spiral.
Overhead demands go up further
and prices go up further.
266 • Design for Manufacturability
Thus, the loop reinforces itself and the company continues to spiral
down. This may drag a company down to the point of unprofitability or
weaken an otherwise strong company.
7.3 RESISTANCE TO TOTAL COST ACCOUNTING
Despite the deficiencies already noted about traditional cost systems,
many managers resist company-wide ABC (activity-based costing) implementation. This stems from a general resistance to change based on the
following misconceptions. Many managers:
1. Do not accept the deficiencies in the current system. This was the
topic of the first section of this discussion on total cost accounting.
Many of the books referenced in this section make thorough arguments about this point, especially Johnson and Kaplan’s Relevance
Lost: The Rise and Fall of Management Accounting.13
2. Underestimate the benefit. This chapter and Chapter 6 reinforce the
value of relevant cost numbers as a basis for good decision making,
in general, and specifically, for decisions governing product portfolio
planning, product line rationalization, standardization efforts,
implementing manufacturing flexibility, and many aspects of product development.
3. Overestimate the effort to make any improvements. Sometimes resistance comes from horror stories that some formal activity-based
costing programs have been so cumbersome that they have died
under their own weight. However, the low-hanging-fruit approach,
presented in Section 7.8, quickly generates benefits without consuming a lot of time and resources.
7.4 TOTAL COST THINKING
Even before any formal total cost accounting programs are implemented,
companies can improve some decisions subjectively by using total cost
thinking. The principles presented in this chapter can help individuals
make better subjective decisions by correcting many misconceptions
about cost and instilling the proper attitudes and beliefs.
Total Cost • 267
In order for this to happen, however, the corporate culture must encourage it. Management policies can either encourage or discourage this kind
of thinking. If all proposals must meet strict criteria for payback and ROI
(return on investment), this will govern the decision-making process. If
the criteria are based on traditional cost accounting, then the decisions
will be based only on projects for part and labor savings and many truly
good proposals will fail to win approval because much of their benefit
comes from savings that are not quantifiable by the current system. If companies rigidly adhere to criteria based on incomplete costs, then attempts
to inject subjective total cost decision making will fail, even if it is in the
best interest of the company and its customers.
One subjective approach to this dilemma was proposed by Robert
Kaplan in an article about justifying computer-integrated manufacture
(CIM), “Must CIM Be Justified by Faith Alone?”14 Kaplan’s technique to
work around deficiencies in accounting systems was to:
1. Compute how much the proposal fell short of the objective criteria:
the shortfall
2. Summarize the intangible benefits (including all the benefits that
could not be quantified)
3. Pose the question, “Is it worth the shortfall to gain all these intangible benefits?”
Another approach is abductive logic—the logic of what could be—which
can be used to get around the “prove it” obstacle. A Business Week article
recommended: “To use abduction, we need to creatively assemble the disparate experience and bits of data that seem relevant in order to make
inference—a logical leap—to the best possible conclusion.”15
One of the examples of part standardization, cited in Chapter 5,
was the author’s effort to standardize all resistors to 1% tolerance to
replace the previous duplication of resistors in both 1% and 5% tolerance
versions. There were no numbers available to justify the change. It “just
made sense” to cut in half the number of resistors in all three factories.
Subsequently, the author has learned of people who did the same part consolidation and concluded quantitatively that the purchasing power of the
combined orders offset the “cost” of the higher tolerance.
Sometimes, subjective decisions must be made in spite of the numbers.
One of the author’s clients, who makes water meters, consolidated seven
raw castings into three by adding extra brass (for test ports) to every product, whether or not they needed the optional tapped holes. This extra
268 • Design for Manufacturability
material appeared to add cost to some of the raw castings because the
extra brass was not needed for products without test ports. In fact, the person who initiated the change felt like he would be “beat up” for raising the
standard cost. Company management, however, supported the change,
knowing subjectively that it would lower the cost of variety enough to be a
net gain and make operations more flexible.
Management policies can encourage total cost thinking by empowering product development team leaders to make the best decisions, in their
judgment, instead of trying to limit bad decisions by making them pass
some predetermined threshold based on irrelevant numbers using incomplete criteria.
7.5 IMPLEMENTING TOTAL COST ACCOUNTING
Total cost accounting focuses on the activities performed to produce
products; thus, the formal programs were called activity-based costing,
although much-
easier-
to-
implement techniques are now available, as
presented in Section 7.8. Costs are assigned directly to either products or
to activities, which are then assigned to products based on how much of
these activity costs are incurred by each product.
Total cost measurement systems are not intended to replace the existing
finance system. In most cases, these implementations create independent
decision-making models. In the study that Cooper, Kaplan, et al., did for
the Institute of Management Accountants, this was the case:
“No modifications to existing financial systems were required, and companies continued to run all their existing systems in parallel with their new
ABC model.”
“The activity-based model was treated as a management information system, not as part of the accounting system.”16
The numbers from this model were more useful than those available from
the existing cost system:
“Managers found the numbers generated from the activity-based analysis
more credible and relevant than the numbers generated from the official
costing system.”
Total Cost • 269
7.6 COST DRIVERS
In any change process, there is always some “low-hanging fruit,” which
is always a good place to start to get some early results with little effort.
Success in these high-leverage areas can then generate interest and support
for more ambitious efforts. The low-hanging-fruit approach is also a good
way to start the change process if there is a lack of widespread support.
In ABC implementation, the low-hanging fruit is the identification and
implementation of simple cost drivers that make cost accounting more
accurate and relevant, and encouraging behavior to lower these costs. Cost
drivers are defined as the root causes of a cost—the things that drive cost.
Identifying cost drivers makes the root causes visible, which has two
important consequences:
1. Total cost can be measured.
2. The behavior that actually lowers total cost can be encouraged.
The cost driver approach identifies key drivers of cost that should be
quantified instead of lumped in with all other overhead. The cost driver
approach is easy to implement and starts with the most important overhead costs that need to be quantified. New data collection efforts are
focused on only a few key cost drivers. Cost drivers can be based on estimates, as long as there is universal consensus. Cost drivers can provide a
more rational basis for performance measures.
For example, the activities that incur the following costs could be analyzed for significant ranges beyond the averages that usually are the basis
for overhead allocation. Examples of cost drivers include:
• Relevant material overhead rates for standard parts and pulled,
spontaneous resupply
• Relevant overhead charges for specials, configurations, and
customizations
• Relevant overhead charges for new products that are designed to
minimize overhead costs
• Setup costs and equipment utilization, which are especially important for low-volume parts
• Inventory costs and inventory-related costs
• Engineering change order costs
270 • Design for Manufacturability
• Cost of quality (scrap, yield, rework, field service) and other non-
value-added activities17
• Cost of field service, repairs, warranties, claims, litigation, etc.
The activities that cause these costs should be analyzed to find out what
is causing the variation. Experienced managers will probably be able to
identify the key cost drivers that are driving differences in these activities;
for instance:
Volume: high volume or low volume
Degree of customization: standard or custom
Part standardization: the current list or the standard parts list
Part destination: for production products or spare parts for products
that are out of production
• Distribution costs: direct or through channels
• Product age: whether the product is launching, stabilized, aging,
or experiencing processing incompatibilities with newer products
and/or availability challenges for parts and raw materials
• Market niches: commercial, OEM, military, medical, and nuclear
markets have varying demands for quality, paperwork, proposals,
reports, certifications, traceability, etc.
•
•
•
•
Those activities that incur difference costs from the variations in these
cost drivers should be investigated. The costs of these activities should
be charged accordingly. For instance, if low-volume products do incur
more cost than high-volume products, then this should be reflected in the
overhead allocation. If standard parts incur less material overhead, then
they should be charged a lower overhead, as will be shown in the next
examples. If certain operations incur more overhead than others, then the
cost drivers should reflect this, as will be shown in the following examples.
7.6.1 Tektronix Portable Instruments Division
To encourage part commonality and assign accurate material overhead,
Tektronix assigned a material rate that was inversely proportional to
volume. Thus, a high-volume part had a very low overhead rate; conversely,
a “low runner” was assigned a very high rate.18
Total Cost • 271
7.6.2 HP Roseville Network Division (RND)
HP RND formerly had only two cost drivers for its printed circuit board
assembly: direct labor hours and the number of insertions. A special survey showed that axial insertions were about one-third the cost of DIP
(Dual In-line Package integrated circuit) insertions; manual insertion was
three times as expensive as automation; and low-availability parts had an
additional cost of ten times their materials cost. So they implemented the
following nine unit-based cost drivers:19
1.
2.
3.
4.
5.
Axial insertions
Radial insertions
DIP insertions
Manual insertions
Test hours
6.
7.
8.
9.
Solder joints
Board count
Part count
Number of slots
7.6.3 HP Boise Surface Mount Center
HP’s printed circuit board operation in Boise, Idaho, implemented the following ten cost drivers for surface-mount printed circuit board manufacture.20 Note driver number seven, which encourages part commonality:
Cost Pools
1. Panel operations
2.
3.
4.
5.
6.
Small component placement
Medium component placement
Large component placement
Thru-hole component insertion
Hand-load component placement
7. Material procurement and
handling
8. Scheduling
9. Assembly setup
10. Test and rework
Drivers
Percent of a whole panel; if one panel contains
four individual boards, then each board is
charged 25% of the panel rate
Number of “small” components placed
Number of “medium” components placed
Number of “large” components placed
Number of leaded components inserted
Minutes required to place all components that
must be hand loaded rather than
automatically placed on the board
Number of unique parts in the board
Number of scheduling hours during a
6-month period
Number of minutes of setup time during a
6-month period
Number of “yielded” minutes of test and
rework time per board
272 • Design for Manufacturability
Percent Cost Change
after ABC Implementation
100
80
60
40
20
0
0
4
16
23
46
52
57
–20 Products Manufactured at HP-Boise Surface Mount Center
FIGURE 7.2
Changes in cost after implementing ABC.
Figure 7.2 shows the changes in product costing after implementing these
cost drivers. Note that one-third of the products had their costs go down
and two-thirds had their costs go up, with one product doubling in cost!
The results as reported in a Management Accounting article:
“Accountants now provide important inputs into product design and
development decisions. Under the prior cost system, all overhead was
applied as a percent of direct material cost, and it was difficult to understand how changing a board’s design would change manufacturing costs.
Also, designers had little motivation to optimize the board for efficient
production. With ABC, however, the cost system attempts to mirror the
manufacturing process, so that engineers and production managers easily
can see how design changes will affect cost.”21
7.7 TRACKING PRODUCT DEVELOPMENT EXPENSES
Some companies fail to collect important information, such as tracking
product development expenses, because they feel that they cannot ask
engineers to keep track of which projects they work on. Many engineers
do, in fact, resist such rigor. However, such information is extremely
important for making good decisions about product development and
product costing. The solution to this apparent dilemma is as follows:
1. Emphasize the importance of the information, using all the reasoning presented herein and in the references. Some experts in the field
argue that “an organization’s cost accounting system can actually
make or break an otherwise sound business.”22
Total Cost • 273
2. Make it easy to keep track of engineering time. It is better to have
an approximate accountability than nothing at all. One division of
Hewlett-Packard used the “bowling score” method to track engineering effort. The engineers were provided a form with lines for all
the projects they may be working on. At the right of each line was a
square box. An engineer who worked all day on one project would
enter the bowling mark “X” for a “strike.” An engineer who worked
on two or more projects would enter the symbol “/” for “spare” on
each of them. Here is how the system worked in practice: Engineers
agreed to cooperate because the system was easy. However, because
engineers are inherently precise, they eventually “corrected” the
impreciseness of the system and voluntarily began to fill in more
precise entries, such as hours or percent time worked.
If firefighting is common, there should be enough categories to
capture these efforts by product or project, which will eventually be
assigned to products.
3. Make it required. Total cost measurements depend on adequate data
input. If senior management decides this is an important initiative,
then everyone in the company will have to participate. Emphasizing
the importance and making it easy will certainly make it easier to
implement any mandates and ultimately make it more effective.
7.8 “abc”: THE LOW-HANGING-FRUIT APPROACH
An excellent how-to book oriented toward easy total cost “abc” implementations is Douglas Hicks’ Activity-Based Costing. It is based on the valid premise that it is better to be approximately correct than to be precisely wrong;
accuracy is preferable to precision.23 Knowing that a product has a negative
profit margin between –55% and –65% is more valuable than thinking it
has a positive profit margin of exactly 10.89% (these actual numbers are
from the Harvard case study summarized in Appendix A, Section A.7).
Hicks claimed that the false pursuit of precision in product costing was
unrealistic: “No cost accounting system provides an organization with
precision. All product costing is approximate. All cost systems contain too
many estimates and allocations to be precise.”
With this focus on relevancy over precision, it is easier to implement
this approach than the full-blown ABC, especially for smaller companies.
274 • Design for Manufacturability
Hicks calls this “activity based costing” with the lower case acronym “abc”
(to distinguish it from big ABC implementations), which he describes as
follows:
“In abc, activities are defined as groups of related processes or procedures
that together meet a particular work need of the organization. Under this
definition, the activities of the Accounts Payable department would most
likely be Accounts Payable. Period.”
Hicks makes similar arguments for treating the entire purchasing
function as an activity, instead of identifying all the activities in purchasing. Many purchasing costs are avoided by kanban and breadtruck deliveries. In addition, fewer types of parts ordered in larger quantities reduces
purchasing costs and increases purchasing leverage. The study published
in Just-in-Time Purchasing reported that JIT users expected to cut expediting effort by a factor of three.24
7.8.1 Estimates
If good quantitative data is lacking, it would be preferable to implement
some of the following shortcuts than to continue with grossly inaccurate
allocations. One of these shortcuts is to estimate the percentage of an
activity’s cost caused by a particular cost driver; for instance, high-volume
products compared to low-volume products. Thus, instead of averaging
the cost allocation, where all products get the same charge, the low-volume
products would be charged, say, 80% and the high-volume products 20%
(for the typical Pareto effect).
An excellent example of estimates was mentioned in Chapter 6. When
procurement managers are asked what proportion of their staff’s activities
are devoted to buying standard parts, the typical estimate is 10%, which
means the material overhead rate for standard parts could be set at one-
tenth that of the oddball parts and the material overhead rate for oddball parts could be set at ten times that of the standard parts—all based
on that estimate. To encourage standardization, the only “cost” designers
should be shown is the part cost plus this material overhead charge, which
would thus steer them to the standard part.
7.8.2 Implementing “abc”
Understand the importance of total cost measurements for relevant
costing, pricing, and decision making. For any cost reduction program,
Total Cost • 275
the measurement of cost is just as important as the steps to reduce cost,
because total cost measurements:
• Help the company make the right strategic decisions that will be
most effective
• Keep directing behavior that will continually reduce cost
• Quantify the real cost savings (or losses), which then affect subsequent decisions
The drive for implementing “abc” should come from the most motivated
group, whereas the implementation could be done by the most willing and
able group, which may or may not be the finance department.
Approach and label the program in a way that mitigates resistance and
generates support. If “activity-based costing” is not an appropriate label,
you could call it a costing or decision-making model.
Identify the cost drivers of activities that should be quantified instead of
lumped in with other overhead. Roll the quantified cost driver data into
the total cost model. Keep it up to date. Make sure the total cost information is readily accessible, easily understood, used for all cost-based reporting, and as the basis for decision making.
Hicks presents a simplified approach to implementing “abc”, with the
emphasis on accuracy and relevance rather than precision. He proposes
an “abc” cost model in a format suitable for spreadsheets, such as Excel.
An alternative to creating a model on a spreadsheet would be software
specifically developed for ABC analysis. The eight case studies cited in the
Institute of Management Accountants’ ABC study all used such software
packages on PCs.25
7.9 IMPLEMENTATION EFFORTS
Most companies do not need a system as complex as would be needed for
a multinational mega-corporation, despite misconceptions to the contrary.
Implementing some degree of total cost measurement can be achieved with
modest resources. Of the eight companies in the Institute of Management
Accountants’ study, the companies that used “medium involvement” of outside consultants took an average 6.5 months with 2.1 FTEs (full-time equivalent workers) to implement the ABC model. Companies that used “active
involvement” of consultants took an average of 3 months with 1.6 FTEs.26
276 • Design for Manufacturability
One practitioner reported that efforts to implement “abc” have “ranged
from 80 hours for a small commercial printer to 500 hours for a large automotive supplier with very poor historical financial and operating records.”27
The implementation chapter of this book includes a section summarizing total cost measurement implementation (Section 11.9).
7.10 TYPICAL RESULTS OF TOTAL
COST IMPLEMENTATIONS
When ABC is implemented, companies start to see the real picture about
product cost, which is often surprising. Cooper, Kaplan, et al., refer to the
“typical ABC pattern,” where several offerings are shown to be highly profitable, most at or near breakeven profitability, and a few highly unprofitable.28 A Schrader-Bellows case study29 showed that, out of seven products
originally thought to be profitable, three actually were, one was barely
breaking even, and three were unprofitable, with one highly unprofitable.
And, the plant could not eliminate that unprofitable product until the
costing changed (see Section A.7).
Total cost analyses often adjust manufacturing costs up for most products, while lowering them only for a few “deserving” products. After HP
implemented the nine cost drivers cited above, they found that 72% of the
products were really costing more than assumed, as shown in Figure 7.2.
Cost adjustments ranged from slightly lower to double!30
When the author implemented a parts standardization effort at Intel’s
Systems Group using the procedure described in Chapter 5, the result was
that 500 “commonality” parts were identified as being preferred for new
designs. These common parts really did deserve lower material overhead
than the 13,000 remaining approved parts because they were purchased
in higher quantities and were easy reorder actions. The standardization
program wanted to encourage engineers to use these parts. To accomplish
both these goals, the accounting department structured material overhead into a two-tiered system: one rate for the 13,000 approved parts and a
lower rate for the 500 commonality parts. This reflected greater “material
world” efficiencies and encouraged usage.
Total Cost • 277
NOTES
1. Michael R. Ostrenga, Terrence R. Ozan, Robert D. McIlhattan, and Marcus D.
Harwood, The Ernst & Young Guide to Total Cost Management (1992, John Wiley
& Sons).
2. Robin Cooper and Robert S. Kaplan, “How Cost Accounting Distorts Product Costs,”
Management Accounting, April 1988.
3. H. Thomas Johnson and Robert Kaplan, Relevance Lost: The Rise and Fall of
Management Accounting (1991, Harvard Business School Press).
4. Ostrenga et al., Ernst & Young Guide.
5. Doug T. Hicks, Activity-Based Costing: Making It Work for Small and Mid-Sized
Companies (2002, Wiley).
6. Johnson and Kaplan, Relevance Lost.
7. Robin Cooper, Robert S. Kaplan, Lawrence S. Maisel, Eileen Morrissey, and Ronald
M. Oehm, Implementing Activity-
Based Cost Management (1992, Institute of
Management Accountants, Montvale, NJ), p. 4.
8. Johnson and Kaplan, Relevance Lost.
9. Ostrenga et al., Ernst & Young Guide, p. 146.
10. Johnson and Kaplan, Relevance Lost.
11. Ibid.
12. Peter M. Senge, The Fifth Discipline: The Art and Practice of the Learning Organization
(1990, Doubleday/Currency).
13. Johnson and Kaplan, Relevance Lost.
14. Robert S. Kaplan, “Must CIM Be Justified by Faith Alone?” Harvard Business Review,
March–April 1986, p. 87.
15. Roger L Martin and Jennifer Reil, “Innovation’s Accidental Enemies,” Business Week,
January 25, 2010, p. 72.
16. Cooper et al., Implementing Activity-Based Cost Management, p. 7.
17. For a complete list of quality costs, see Jack Campanella, Editor, Principles of Quality
Costs: Principles, Implementation, and Use (1999, Quality Press, American Society for
Quality).
18. Robin Cooper and Peter B. B. Turney, “Internally Focused Activity-Based Costing
Systems,” Measures of Manufacturing Excellence, edited by Robert S. Kaplan (1990,
Harvard Business School Press), pp. 292–293.
19. Ibid., pp. 294–296.
20. Mike Merz and Arlene Harding, “ABC Puts Accountants on Design Team at HP,”
Management Accounting, September 1993, pp. 22–27.
21. Ibid., pp. 22–27.
22. Hicks, Activity-Based Costing. Also see the article about the “abc solution” at Doug
Hicks’ website: www.dthicksco.com.
23. Ibid.
24. A. Ansari and B. Modarress, Just-in-Time Purchasing (1990, Free Press), p. 44.
25. Cooper et al., Implementing Activity-Based Cost Management, pp. 6, 25, and 256.
26. Ibid., p. 296.
27. Hicks, Activity-Based Costing.
278 • Design for Manufacturability
28. Cooper et al., Implementing Activity-Based Cost Management, p. 5.
29. The Schrader-Bellows case study is described in Harvard Business School Case Series
9-186-272; a summary of the findings appears in “How Cost Accounting Distorts
Product Costs,” by Robin Cooper and Robert S. Kaplan, Management Accounting,
April 1988.
30. Merz and Hardy, Management Accounting.
Section IV
Design Guidelines
8
DFM Guidelines For Product Design
This chapter lists some general guidelines for product design strategy and
presents assembly strategy, fastening strategy, assembly motions, and test
strategy. These strategies are important aspects of the concept/architecture
phase shown in Figure 3.1.
8.1 DESIGN FOR ASSEMBLY
All engineers should learn the lessons from equivalent assemblies from
relevant products and formulate action plans and deliverables to leverage the best and avoid the worst. This also involves raising and resolving
assembly issues based on lessons learned and DFM opportunities presented herein.
Simplify assembly with fewer parts, off-the-shelf parts that come assembled, and parts that are combined into monolithic circuit boards, castings,
stampings, extrusions, and molded parts. Design for assembly without need
for any skill or judgment and minimize manual tasks, for instance, by using
connectors instead of wiring lugs and hand soldering. Design teams should
strive to design products to eliminate the need to apply any liquids for fastening, bonding, or sealing. Eliminate the need for calibration or any kind
of tweaking.
Design easy assembly features with self-jigging parts or parts that are
aligned with pins, slots, or other features. Design symmetrical parts that
don’t have to be oriented. At each workstation, minimize part variety and
standardize on one fastener per workstation. At each workstation, minimize tool variety and standardize on only one torque setting, one sealant,
one type of glue, and a single procedure for each type of operation, to
281
282 • Design for Manufacturability
avoid mistakes. Concurrently engineer parts and fixturing to ease assembly and ensure correct assembly.
Eliminate the need to manually position families of parts in machine
tools by:
• Locating features on the part and adjacent parts of fixtures
• Tooling pins and bushings or a reamed hole on the part and fixture
(Guideline A3)
• Concurrently engineered fixtures that are versatile enough to quickly
and precisely load all parts in a family, using optimal datum dimensioning, as shown in Figure 4.2
8.1.1 Combining Parts
Combining parts is a technique that can be used to reduce the part count
and simplify assembly, provided the combined parts don’t get so big and
complex that they require expensive tooling or large mega-machine tools.
The combined parts could provide the following benefits: eliminate the
need to manufacture the interface features, hold their tolerances, and save
the time and cost of assembly. It may be possible to fabricate combined
parts on a single machine tool in a single setup. Examples include: many
parts combined into a monolithic plastic or machined part; many integrated circuits combined into VLSI or ASICs; and multiple circuit boards
combined into one, thus eliminating card cages and inter-board wiring operations.
The criteria for combining parts involves asking the following three
questions:
1. When the product is in operation, do adjacent parts move with
respect to each other?
2. Must adjacent parts be made of different materials?
3. Must adjacent parts be able to separate for assembly or service?
If all three answers are no, consider combining the parts into one. It is
important to remember that every interface between parts requires geometrical features to be designed and manufactured plus all interface tolerances need to be held.
Eliminating interfaces eliminates the need to create interface features and
hold their tolerances.
DFM Guidelines For Product Design • 283
8.2 ASSEMBLY DESIGN GUIDELINES
Guidelines throughout this book will use the following numbering system
for instructional clarity. Each company is encouraged to develop the numbering system optimal for its operations. The use of several categories of
guidelines allows addition of new guidelines to the appropriate category
rather than at the end of a single list. If new guidelines are added next to
related ones, they will be considered together when the designer is dealing with that subject. In this way, newer guidelines will be less likely to
be overlooked than if they were just added to the end of one long list of
general guidelines.
Prefix
A
F
M
T
S
P
H
Q
R
Category
Assembly strategy
Fastening
Motions of assembly
Test
Standardization
Part shape
Handling by automation
Quality and reliability
Repair and maintenance
If guidelines are to be used as checklists, they should be worded to optimize usefulness in checklists. Then the team and management would note
on the checklist whether the guideline has been obeyed or how much the
product deviates from a certain goal, say, zero or 100%.
A1) Understand manufacturing problems/issues of current, past, and
related products. In order to learn lessons from the past and not repeat
past mistakes (Section 3.3), it is important to understand all problems and
issues with current and past products with respect to manufacturability,
introduction into production, quality, repairability, serviceability, regulatory test performance, and so forth. This is especially true if previous
engineering is being leveraged into new designs. In a checklist, this could
be checked “completed” with a lessons learned report as a deliverable.
A2) Design for efficient fabrication, processing, and assembly; identify difficult tasks and avoid them by design. Concurrently engineer the
assembly sequence while designing the product. Designing for easy parts
284 • Design for Manufacturability
fabrication, material processing, and product assembly is a primary design
consideration. Even if labor cost is reported to be a small percentage of the
selling price, problems in fabrication, processing, and assembly can generate enormous overhead costs, cause production delays, and demand the
time of precious resources.
A3) Eliminate overconstraints to minimize tolerance demands. An
overconstraint happens whenever there are more constraints than the
minimum necessary; for instance, joining two rigid frames with four
bolts, guiding a rigid platform on four rigidly mounted bearings, or trying
to precisely align two parts with multiple round pins inserted into round
holes. (The solutions for these are shown below.)
Overconstraints are costly and can cause quality problems and compromise functionality because the design will work only if all parts are fabricated to tight, maybe unrealistic, tolerances. Fortunately, overconstraints
are easy to avoid by specifying the exact number of constraints that will
do the job: not enough constraints will result in an extra degree of freedom (something is loose); too many constraints will result in troublesome
overconstraints. Here are some solutions:
Mount bearing housings or rigid members to each other on three non-
collinear points, not four. Unless the tolerances are perfect for a four-
point mount, which is rare or expensive, three will determine the
position and the fourth will try to warp both structures.
For critical alignment of parts, use round and diamond pins. Use pairs
of inexpensive but tight-tolerance dowel pins to locate critical parts.
Matching tight-tolerance hole diameters shown in the rectangular
part in Figure 8.1 can be made easily with reamers. To eliminate the
tolerance match problem between holes, use one round pin to locate
in x and y dimensions and a diamond pin to locate the angle from
Round Pin
FIGURE 8.1
Alignment using round and diamond pins.
Diamond Pin
DFM Guidelines For Product Design • 285
the round pin. The two pins shown in Figure 8.1 are mounted on
the mating part (which is not shown). The diamond pin is precision
ground to locate in the angle direction, but is relieved in the direction of the hole spacing. Although this technique was developed to
locate tooling, it can also be useful for aligning parts for assembly, as
shown in Figure 8.1.
This assembly technique can be used to save material, weight, and cost
by pinning together machined parts to form constant stress assemblies in
which the thickness of each part is proportional to the loads. Such parts
can be made quickly and inexpensively on CNC machine tools that would
automatically machine the part shape and drill and ream the pinning
holes. Thus, there is no unnecessary material, as would be the case when
constant cross-section parts are sized for the highest loads (where they are
anchored or support other parts). Neither would there be wasted material,
if the part was “hogged out” from a single piece of metal, as is common in
the aerospace industry.
A4) Provide unobstructed access for parts and tools. Each part not
only must be designed to fit in its destination location, but also must have
an assembly path for entry into the product. This motion must not risk
damage to the part or product and, of course, must not endanger workers.
Equally important is access for tools and the tool operator, whether that
is a worker or robot arm, which usually requires more access room than
a worker’s hand. Access may be needed for screwdrivers, wrenches, welding torches, electronic probes, and so forth. Remember that workers may
be assembling these products all day, and having to go through awkward
contortions to assemble each product can lead to worker fatigue, slow
throughput, poor product quality, and even worker injury. Access is also
needed for field repair, where the tools may be simpler and possibly bulkier.
A5) Make parts independently replaceable. Products with independently replaceable parts are easier to repair because the parts can be
replaced without having to remove other parts first. The order of assembly
is more flexible because parts can be added in any order. This could be a
valuable asset in times of shortages, in which case the rest of the product
could be built and the hard-to-get part added when it arrives.
A6) Order assembly so the most reliable goes in first, the most likely
to fail goes in last. If parts must be added sequentially, make sure the
286 • Design for Manufacturability
most likely to fail are the easiest to remove. This is important for both factory assembly and field repair.
A7) Make sure options can be added easily. Another advantage of
independently replaceable parts is the ease of adding options later, either
in the factory or in the field. Future options should be anticipated, and
the product should be designed to accept these options. Considerations
include allowing space for added parts, mounting holes, part access, tool
access, software reconfiguration, extra utility capacity, and, of course, the
safety of those performing the upgrade.
A8) Ensure the product’s life can be extended with future upgrades.
Early consideration of the product-upgrading strategy could be crucial
to extending the life of a product. Advances in technology should be
anticipated so the product can be upgraded without a complete redesign.
Modular design concepts (Section 4.7) can be used to allow modules that
are prone to obsolescence to be replaced with upgraded ones. Extending
product life through upgrading allows products to generate even more
profit after the development and introduction costs have been paid off.
Figure 3.3 shows the value of upgrades.
A9) Structure the product into modules and subassemblies, as appropriate. The use of subassemblies can streamline manufacturing because
subassemblies can be built and tested separately. Subassemblies could
be built in specialized departments, which is especially advantageous if
those processes are different from those of the product; for instance, clean
room assembly (assembly in a dust-free room).
If the entire product consists of a collection of pretested subassemblies,
product testing may be eliminated or reduced to only a final go/no-go
test before product shipment. In designs where potential quality problems are concentrated in one subassembly, test and diagnostic attention
could be focused there. The remainder of the product may then rely on
process controls.
Products built from subassemblies are easier to repair in the factory and
in the field by simply replacing the defective subassembly, which can then
be sent back to its specialized assembly area for repairs. See the discussion
on modular design in Section 4.7.
DFM Guidelines For Product Design • 287
A10) Use liquid adhesives and sealants as a last resort. For fastening,
thoroughly pursue alternatives, such as screws or nuts coated with retention compound, fasteners with deformed threads, and optimal use of
lockwashers. Design to eliminate the need for liquid sealants; for instance,
with optimal enclosures and built-in seals. Long drying times can compromise flow manufacturing.
Design to eliminate the need to use sealants for arc prevention; for
instance, with optimal spacing or snap-in insulating barriers or partitions.
Seal with premeasured off-the-shelf or manufactured solutions, such as
rigid gaskets, compliant gaskets, custom-molded elastomeric gaskets, or
O-rings, all of which should be self-jigging in the product.
If liquid adhesives and sealants are justified, make a thorough selection;
be sure to optimize part alignment and repair strategy; standardize on the
same application procedure (to avoid procedural errors); standardize on
one adhesive per workstation (to avoid picking the wrong one); and avoid
gaps, cracking, or structural weakness when glue shrinks. If justified,
automate with robotic adhesive applicators or pick-and-place machines.
A11) Use press fits as a last resort. Press fits add tolerance challenges to
both parts, resulting in a high potential for things to go wrong. Successful
assembly and operation may be sensitive to temperature, cleanliness,
procedures, etc., and parts can’t be successfully taken apart for service
or recycling.
The first design step is to thoroughly pursue alternatives. If justified,
plan for the optimal alignment, guidance, pressing forces, etc.; ensure
mating parts do not scrape, gouge, or bind; ensure engaging surfaces are
free of contaminants; specify only one fixture and procedure per workstation; optimize interference/tolerance design; and ensure tolerances of
mating parts.
Mating parts for press (interference) fits and shrink fits must have proper
dimensions and tolerances.1 Fits that are too loose will not “hold” under
all service conditions; fits that are too tight may not be able to be assembled or disassembled (see general discussion on tolerancing in Section 10.2).
Make sure press fits will not impair servicing. Press fit tolerances can be
loosened by using “elastic” pins that are made by rolling spring steel sheet
metal into a “C” shape or spiral wound cylinder. More assembly guidelines
(on error prevention) are presented in Chapter 10.
288 • Design for Manufacturability
8.3 FASTENING GUIDELINES
F1) Use the minimum number of total fasteners. Fasteners may represent
only about 5% of the product’s direct material cost, but all the associated
labor costs can reach 75% of total assembly costs.2 For fastened assembly,
parts must be aligned before assembly, fasteners must be found and positioned, the tool has to be positioned, torque has to be applied properly, and
the tool may need to be changed for the next job. Further, fasteners have to
be ordered and delivered to the point of use. The fasteners themselves may
need to be assembled (e.g., bolts to washers, but washers can be ordered
captivated to bolts). In some cases, assembling with fasteners may be difficult or impossible for robots or other automation. Fasteners can be eliminated by combining parts, as discussed in Section 9.5.
F2) Maximize fastener standardization with respect to fastener part
numbers, fastener tools, and fastener torque settings. Fastener standardization is easy to implement and has enormous benefits to manufacturing:
fewer parts to order, receive, log in, stock, issue, load, assemble, and
reorder. Purchasing costs will be reduced and the increased order quantities of the standard fasteners will result in quantity discounts and better
deliveries, and the supplier can act like a “bread truck” and simply keep
all the factory bins full.3
Regardless of the delivery system, standard fasteners are much less likely
to run out and delay production. Further, standard fasteners are much
easier to stock in the field and they require fewer tools to service—an
important consideration when repairing complex products on the road.
The most effective technique for applying fastener standardization is simply discipline. The author redesigned a food processing machine that had
evolved over many years with 150 different types of fasteners. The toolbox
for field repair was quite cumbersome. The redesigned machine had no
nuts and only two bolt types: large and small.
Careful selection of bolts encourages widespread use. Multiple grades
(for strength or corrosion) could be consolidated into the better grade,
which could serve well for all applications. The difference in fastener cost
would be small compared to the benefits from part standardization.
F3) Optimize fastening strategy. Optimize the product fastener strategy by considering the guidelines in this section and specifying standard
DFM Guidelines For Product Design • 289
fasteners. Concurrently engineer workstations so that no more than a
single fastener is used at each workstation to:
• Simplify supply chains
• Mistake-proof assembly (Section 10.7)
• Enable the use of auto-feed screwdrivers
F4) Make sure screws are standardized and have the correct geometry so that auto-feed screwdrivers can be used. A special version of the
powered screwdriver feeds screws automatically from a hopper through
a hose so that they are positioned under the screwdriver bit. When the
screwdriver is positioned over the hole and activated, the screw is advanced
into the hole and torque is applied up to a preset limit.
Auto-feed screwdrivers are inexpensive and greatly improve productivity. For automatic fastening, they can be mounted on a robot or special
automation machinery. However, auto-feed screwdrivers are somewhat
bulky, so designers must plan for tool access, as in Guideline A4. The
geometry of the screws must meet the specifications of the equipment.
Usually the screw length below the head must be greater than the diameter of the head by a margin specified by the equipment manufacturer.
Auto-feed screwdrivers can feed only one type of screw. But they are too
bulky to allow more than one per workstation. Therefore, screws should be
standardized on one size for each workstation. The development team will
have to practice concurrent engineering and specify standard screws as
they are structuring the flow of the work and laying out each workstation.
F5) Design screw assembly for downward motion. Screws are easier to
apply from above, especially if downward force is needed to keep the tool
bit engaged with the screw. For manual operations, applying this force
from above is less fatiguing. Many robots can traverse only in a horizontal
plane and apply force vertically.
F6) Minimize use of separate nuts. Separate nuts usually require a
worker to position the nut while engaging the bolt. This will slow down
manual assembly, especially if the nut location is hard to see or find.
Semiautomatic operation of auto-feed screwdrivers will be far from optimal if the worker has to position a nut while activating the screwdriver.
Robots are not advised for positioning both bolt and nut because of the
expense of installing two robots. Separate nuts can be eliminated by using
threaded holes, self-tapping screws, or captive nuts that are retained on
the part to be fastened.
290 • Design for Manufacturability
F7) Consider captive fasteners when applicable. Captive fasteners are
retained in some way on the part by pressing into the part (for captive nuts
or studs), by forming around the part (for threaded rivets), or by welding to the part (for weld nuts or studs). They are available to function as
threaded holes (nuts) or as male threads (studs). Captive nuts or weld nuts
function like thread holes in the part, but they must be applied on the
opposite side from the bolt. There are hundreds of types of standard captive, riveted, and welded fasteners available off-the-shelf.
F8) Avoid separate washers. Separate washers increase the number of
parts to order, deliver, and assemble. If forgotten, they can cause quantity problems. They are often difficult for workers to apply with the nut
and are virtually impossible for automation to install. The washer can be
captivated on the bolt or nut so it can still spin with respect to the fastener.
Or the washer surface can be an integral part of a one-piece bolt or nut.
F9) Avoid separate lockwashers. The same arguments against separate
washers apply to lockwashers. There are many solutions to fastener retention that do not rely on separate lockwashers. Captivated lockwashers are
available with the lockwasher attached to the nut but free to spin. Locking
ribs on the surface of the nut or bolt are also available. Fastener suppliers
use many thread-locking techniques, including deformed threads, plastic
plugs or rings that bear on the threads, chemical locking agents, and part
of the nut that pinches against the thread while seating. Hundreds of different self-locking fasteners are available off-the-shelf. Be sure to coordinate fastener selection and repair strategy with respect to the number of
times self-locking fasteners can be reused safely.
8.4 ASSEMBLY MOTION GUIDELINES
M1) Design for easy, foolproof, and reliable alignment of parts to be
assembled, in order of most desirable first:
• No alignment needed, using symmetry, poka-yoke (mistake-proofing)
as discussed in Section 10.7, and other means
• Self-jigging parts, using clever geometries to align parts and hold
them in place for fastening, pressing, gluing, soldering, brazing, or
welding
DFM Guidelines For Product Design • 291
• Part features allow alignment by simple fixtures or automatic equipment
• Easy manual alignment with hands-free assembly allows air presses
to be used
Avoid scenarios in which parts must be positioned and held by hand during press operations.
M2) Products should not need any tweaking or any mechanical
or electrical adjustments unless required for customer use. Design
products so that no tweaking or adjustments are required in assembly.
Adjustments slow down the assembly process and can cause quality problems if not performed correctly. Zero adjustments should be a goal for
the product design, and the design team should use all the creativity at its
disposal to achieve that goal. If adjustments are required for customer use,
there should be a default setting that is easy to set during manufacture; for
instance, at a detent, clear mark, or optimal software setting.
M3) If adjustments are really necessary, make sure they are independent and easy to make. Make sure necessary adjustments are independent
of other adjustments and are easy to make consistently.
M4) Eliminate the need for calibration in manufacture; if not possible, design for easy calibration. Calibration is a form of adjustment that
is time consuming and usually requires special equipment and trained
personnel. Often, calibration can take place only after the product is fully
assembled, making correction more difficult. If calibration is necessary,
make sure it is easy to perform consistently.
M5) Design for easy independent test/certification. Design modules/
subassemblies and their processing for independent test and certification
to isolate corrective procedures at the lowest level. Final product certification may be avoided if modules can be designed so that if they pass certification, then the assembled product will be deemed to be certified.
M6) Minimize electrical cables; plug electrical subassemblies directly
together. Electrical cable assemblies are time consuming for workers to
build and install and almost impossible for automation to deal with. A
better alternative for assembly is to plug electrical subassemblies directly
together with the appropriate connectors designed into each part.
292 • Design for Manufacturability
M7) Minimize the number of types of cables and wire harnesses. If
cables must be used, minimize the number of pin types, lengths, and connector body styles. Standardize on wire harnesses with enough wires for
many products, even if some applications have unused wires. Standardize
on a few common lengths even if some applications have more length than
needed. Standardizing on connector body types will also minimize the
number of tools used for cable assembly.
8.5 TEST STRAGEDY AND GUIDELINES
Develop test strategies proportional to the need. Prioritize lessons learned
by plotting severity versus frequency, as in Figure 10.1. Determine the coverage and failure modes that need to be tested based on how much quality
can be designed in and built in. Decide if diagnostic testing is needed or if
processing quality is high enough to discard failures. Ensure testability at
the architecture level, which requires early involvement of test engineers.
This can minimize the time and cost of test development and test equipment through:
• Adequate test access, including test pads and room for test probe
access; this will have to be designed into circuit boards
• Standard or flexible test fixtures to minimize fixture cost and
changeover times
• Compatibility with standard test equipment, programs, connectors, etc.
• Test development that is concurrent with test equipment selection, with
special attention to test infrastructure needs for multiple production
sites, where each site needs a complete test infrastructure
• Versatile test programming to minimize test development and
changeover times
• Test ports and connectors that may have to be provided on circuit
boards and systems
• Built-in tests, with remote monitoring and diagnostics if necessary
and feasible
• Optimal datum dimensioning to facilitate dimensional inspections,
using geometric dimensioning and tolerancing (GD&T)
• Statistical significance ensured by design of experiments
DFM Guidelines For Product Design • 293
Quantify the total cost of past or anticipated testing to help justify efforts
to design for quality and build in quality and possibly avoid the equipment
and development costs of diagnostic tests.
T1)Product can be tested to ensure desired quality. If confidence in
process control and go/no-go functional test is not high enough to ship
products without complex testing, the product will need to be tested. The
product should be designed in such a way to allow efficient testing. Tests
may have to be developed to include diagnostics for complex products.
This could be avoided with high enough process quality (Section 8.6).
T2) Subassemblies and modules are structured to allow independent
testing. Guideline A9 encourages the use of modules and subassemblies to
streamline manufacturing. They should be structured to allow them to be
tested separately prior to assembly. The interaction between subassemblies
should be predictable enough to count on the product working properly
if all the subassemblies work separately. It may also be useful to be able to
test subassemblies separately after assembly into the product.
T3) Testing can be performed by standard test instruments. Tests
should be designed to be accomplished quickly by standard test instruments, which are easier to obtain and do not need to be designed, modified, or debugged, as may be necessary with custom test instruments.
Further, field repairs will be easier for the customer to perform with standard test instruments, which the customer may own and know how to
use. Consider built-in self-test in which the product can test itself without
external test instruments.
T4) Test instruments have adequate access. Just as parts and tools need
adequate access, as specified in Guideline A4, test instruments need to
have adequate access. On electronic products, test points will be needed
on printed circuit boards, and special test ports may be incorporated that
are accessible even when the product is assembled. Test instrument access
needs to be planned ahead if modules and subassemblies are to be tested
separately in the product.
T5) Minimize the test effort spent on product testing consistent with
quality goals. Because testing itself is not a value-added activity, product
294 • Design for Manufacturability
quality goals should be achieved with the minimum test effort. Process
controls may dispense with much testing. If the quality “fallout” is low
enough, simple go/no-go tests may suffice without the need for testing
with diagnostics (Section 8.6). Subassembly testing may reduce the testing requirements of the assembled product.
T6) Tests should give adequate diagnostics to minimize repair time.
If test fallout is high, the test should aid in diagnostics to minimize repair
time. If the product is complex, test diagnostics may be necessary to make
any repairs at all. However, manufacturing companies should strive to
have their processes so well controlled that diagnostics for repair are not
needed. In fact, if the fallout is low enough, it may be feasible to discard
products that do not pass the final go/no-go test and spare the expense of
diagnostic test development and the testing and repair itself.
8.6 TESTING IN QUALITY VERSUS
BUILDING IN QUALITY
8.6.1 Testing in Quality with Diagnostic Tests
Diagnostic testing (e.g., using automatic test equipment for printed circuit boards) is necessary if test fallout is high and many boards need to
be repaired. Diagnostic tests can pinpoint the problem component and
instruct rework people to replace it. However:
• Automatic test equipment is expensive, costing millions of dollars plus significant costs in training, tooling (test fixtures), and
infrastructure.
• Multiple plants require the same equipment and infrastructure, just
to be complete, even if they are not needed for capacity. Thus, million dollar testers would be needed in every plant building that type
of product.
• Test development, in many cases, can equal or exceed the cost and
calendar time of circuit board development. Those engineers could
benefit the company more by designing new products.
DFM Guidelines For Product Design • 295
8.6.2 Building in Quality to Eliminate Diagnostic Tests
Quality should be assured by robust design, by process controls, and by
ensuring part quality at the source (Chapter 10), in which case functional
test yields can reach a breakeven point at which the total cost of diagnostic
testing exceeds that of discarding failed products.
For printed circuit boards, IBM figured that if first-pass yields were above
98.5%, it could dispense with diagnostic tests and discard failed circuit boards.
If product testing is still required and diagnostic tests are not used, then
go/no-go functional tests and a built-in self-test would be needed to test all
functions used in service.
8.7 DESIGN FOR REPAIR AND MAINTENANCE
The more the product will need to be repaired in the factory or in the field,
the more important it will be to design for repair. Part of a repair strategy may be to simply replace parts or modules that are, themselves, either
repaired, discarded, or recycled.
The need for ease of maintenance depends on the reliability of the product and demands for “uptime” (how much time the product needs to be
available for use).
8.8 REPAIR DESIGN GUIDELINES
R1) Provide ability for tests to diagnose problems. The need for a consistent method of providing diagnostic information is proportional to product complexity and the probability of product failure in the factory or in
the field. Products with a high fallout after testing can bog down a manufacturing plant if they are difficult to repair. Diagnostic information can
specify where the problem is and recommend repair actions.
The need for building diagnostic capability into the tests is proportional
to the inherent difficultly of diagnosing problems independently. Some
296 • Design for Manufacturability
complex products may take hours to diagnose with normal diagnostic
tools and may need the advanced diagnostic capability available from
advanced testing technology.
R2) Make sure the most likely repair tasks are easy to perform.
Anticipate the most likely repair tasks and plan for ease of repair. This
applies to part removal, part reinstallation, tools needed, and skill required.
Ease of repair is especially important if customers perform repairs.
R3) Ensure repair tasks use the fewest tools. If fastener commonality has
been designed into the product, this should have provided an inherent tool
commonality also. When fasteners are selected, make sure the minimum
number of common tools is specified. Repairability may be important to
customers, and common tools may be part of their purchase criteria.
Avoid the need for special tools, unless the user needs to be precluded
from repair for skill requirement or safety reasons. Special tools increase
the number of tools that have to be supplied to repair facilities. In addition, users may be frustrated if repairs cannot be made with common
tools. Users and even factory workers might not have the special tools and
be tempted to use the closest common tool even if it damages a part or
results in incomplete reassembly. A small repair tool set may be important
if field repairs need to be made in remote sites where it would be difficult
to bring a large number of tools.
R4) Use quick disconnect features. If part replacement is likely and
must be done quickly, provide quick disconnect features to facilitate quick
removal; for example, quarter-turn fasteners. Electrical connectors and
fluid power quick disconnect fittings can be provided where quick separation is likely to be needed.
R5) Ensure that failure- or wear-prone parts are easy to replace with
disposable replacements. If some parts are likely to fail or wear out during
the useful life of the product, they should be easy to replace with disposable (or rebuildable) replacements. If an area is subjected to wear, cover it
with a replaceable wear strip or sheet. Automobile brake shoes and pads
are common examples of this principle, although ease of replacement varies from car to car.
R6) Provide inexpensive spare parts in the product. Spare parts that
are expected to be needed, lost, or wear out can actually be included in the
DFM Guidelines For Product Design • 297
product. This practice may not cost much for inexpensive parts, but it may
provide a major benefit to users. Examples of the practice are extra fuses
in electronic products, extra buttons sewn on clothing, extra nozzles on
spray paint cans, and extra light bulbs in flash lights, automobile tail light
assemblies, and overhead projectors. In fact, some overhead projectors
even allow lamp assemblies to be changed by moving an exterior lever.
High-wear parts are candidates for inclusion in products; for instance,
extra knife blades in retractable knives. The same principle can be applied
to nonwearing parts, like extra tool bits in screwdriver handles. If the
spare parts themselves cannot be included, at least provide a place to hold
spare parts supplied by the user.
R7) Ensure availability of spare parts. Make sure spare parts are
readily available. It is a risky business strategy to try to monopolize the
spare parts business, or inadvertently doing so by designing in parts that
are hard to find. Using industry standard parts greatly improves repairability. Customers will appreciate being able to get parts in a hurry from
local sources of supply. For parts that are available only from the product
manufacturer, recommend that the customer buy a “spare parts kit” for
situations when downtime is intolerable.
R8) Use modular design to allow replacement of modules. One of the
advantages of modular design is that it allows replacement of modules as a
repair strategy. Modules can then be returned to a repair facility or to the
factory for repair.
Modular repair is especially applicable when repair must be quick and
for modules that need specialized facilities for repair. It also removes the
actual repair function from the site of use, which is significant if the entire
product is too large to move and is in a place that precludes easy repair.
R9) Ensure modules can be tested, diagnosed, and adjusted while in
the product. Testing modules or subassemblies while still in the product
will save time and prevent handling damage. Ideally, modules should be
able to be tested from the controls or from software commands. If necessary, the module could be disconnected (if this is safe) and still be tested
in the product. If modules need to be adjusted, make sure adjustments can
be made while the module is in the product, preferably from the product’s controls. Make sure adjustments are independent and do not affect
other functions.
298 • Design for Manufacturability
R10) Sensitive adjustments should be protected from accidental
change. All adjustments should be protected from accidental change during servicing, repair, or maintenance. Adjustments and settings should be
locked in position. Dial adjustments could stop at detents or be covered to
prevent accidental change.
R11) The product should be protected from repair damage. The product should be protected from repair damage from workers, their tools, and
the removal of other parts. Partitions and barriers may help protect parts.
Subassemblies may need feet or guards to prevent handling damage after
removal. Removal aids may also help.
R12) Provide part removal aids for speed and damage prevention. If
it is likely that parts, modules, or subassemblies will be removed, make
it easy by providing removal aids such as tracks, slides, guides, hooks,
handles, and so forth. Many automobile engines have hooks installed over
the center of gravity to aid in factory assembly and removal for repair.
Inexpensive handles can be added where they would be most useful for
removal. Many standard slide assemblies are available for mounting subassemblies so that they may slide out for easy servicing. This is common
for many electronic systems. All of these measures not only make it easier
to remove parts but also make the removal process quicker and safer for
the repairer and the equipment.
R13) Protect parts with fuses and overloads. Some repair can be eliminated by protecting parts with fuses and overloads. Electrical fuses are
common devices for protecting electrical equipment. Mechanical overload
devices are available to protect mechanical machinery. In many applications, these devices may be necessary for safety.
R14) Ensure any module or subassembly can be accessed through
one door or panel. For larger systems, this will make repairs easier.
Subassembly removal should be possible through the single door.
R15) Access covers that are not removable should be self-supporting
in the open position. If the system has access covers or doors, they should
be self-supporting in the open position, like most car doors, hoods, and
trunk lids.
R16) Connections to modules or subassemblies should be accessible and easy to disconnect. If subassemblies need to be removed or
DFM Guidelines For Product Design • 299
disconnected, connections must be accessible (for tools and workers), easy
to disconnect, and easy to reconnect.
R17) Make sure repair, service, or maintenance tasks pose no safety
hazards. Anticipate all possible repair, servicing, and maintenance tasks
and make sure workers will not be exposed to any hazards from electrical
shock, heat, sharp edges, moving parts, chemical contamination, and so
forth. Anticipate the possibility of untrained users attempting service. Use
warning signs and interlocks that cut off power when doors are opened.
If unauthorized servicing may pose a safety hazard, prevent unauthorized
access with locks or special access tools.
For large products and production equipment, it is common practice
for repair personnel to use their own paddle lock on special “lockout”
switches (that are designed into the equipment) so no one can turn on
the machinery while repairs are underway. If multiple people are working
on the machinery, then each repair person will lock out the switch with
his or her own paddle lock; all paddle locks will have to be cleared for the
machine to be turned on.
R18) Make sure subassembly orientation is obvious or clearly marked.
If modules or subassemblies need to be removed for service, make sure orientation is obvious for correct reinstallation. Markings could be molded
in or signs applied that indicate which end is up or which side mates with
which other parts. Use polarized electrical connectors to avoid incorrect reconnection.
R19) Provide means to locate subassemblies before fastening. As recommended in Guideline M1, reinstallation of modules and subassemblies
will be easier and more precise if the subassemblies can be located before
fastening with guides, pins, tracks, stops, and so forth. This is especially
important where correct orientation is difficult to see.
Also relevant to repair, see assembly guidelines A4–A6, detailed in
Section 8.2.
8.9 DESIGN FOR SERVICE AND REPAIR
In addition to designing for repair in the factory, design teams should proactively design products for quick and easy service and repair in the field.
Designing for ease of field repair may be more challenging than for factory
300 • Design for Manufacturability
repair, because field repair may not have access to test and repair equipment that is as sophisticated as in the factory.
• Understand the lessons learned about serviceability from current
and past products, including which design features worked well and
which ones impeded service.
• Don’t try to make up for design shortcomings, incompleteness, or
low quality with heroic field service.
• Avoid “ignorance is bliss” (not giving enough attention to service).
• Avoid “management by folklore” (focusing on well-circulated, but
not statistics-based, service tales).
• Quantify the cost of service, repairs, warranties, legal, and related
costs; estimate how much of that could be prevented by good design
for service.
• Look up the customer importance rating and competitive grade of
reliability and serviceability (shown in Figure 2.2) to ascertain how
much effort should be applied to various issues of design for service.
• Gather service data and plot a priority chart that shows service
frequency versus severity (similar to Figure 10.1, which shows quality
issues in this format).
• Optimize the product concept/
architecture to minimize service
needs, with high enough quality and reliability designed in.
• Make sure people knowledgeable about service (yours, users, customers, and third parties) are early and active participants on product development teams.
• Focus efforts on the highest priority zones in the priority plot.
• Identify the highest priority service tasks and make them easy to do
by design, including: architecture designed for ease of service; helpful diagnostics that either avoid service or aid in subsequent service;
modules that are easy to open or disassemble quickly; parts that are
easy to repair or swap when defective; minimum or no recalibration
needed after service; and closures and reassembly strategies that are
quick, easy, and foolproof.
• Consider modularity as part of a service strategy to allow replacement of defective modules in the field.
• Don’t try to monopolize the spare parts business. Customers like
standard spare parts that are widely and locally available. Custom
DFM Guidelines For Product Design • 301
spare parts manufacture and distribution can drain resources from
product development and customer service.
• Consider a built-in self-test to quickly ascertain product status and
the service or repair approach.
• Consider remote diagnostics to monitor or ascertain product status
and make decisions about service calls.
8.10 MAINTENANCE
Maintenance can be performed either after something fails (unscheduled
maintenance) or at scheduled intervals to replace parts before they are
likely to fail (preventive maintenance).
• Unscheduled maintenance. Restoring operation after a failure.
Designing for ease of repair will greatly improve the ease of maintenance in general.
• Preventive or scheduled maintenance. If it is important to avoid
downtime, then preventive maintenance can be scheduled to replace
parts before they are expected to fail. The scheduling of such maintenance needs to be based on projected or measured failure histories
of suspected parts. Useful data may be available on many purchased
parts from historical performance. Critical applications require reliable parts, and maintenance programs need good reliability data.
8.11 MAINTENANCE MEASUREMENTS
8.11.1 Mean Time to Repair
The measurement of repair time is the mean time to repair (MTTR). This
represents the mean time it takes to repair the product. In reality, it may take
some time for repair personnel to respond before repairs can begin, which is
called the mean response time (MRT). Adding the MTTR to the MRT gives
the downtime during which the product is not available for use.
302 • Design for Manufacturability
8.11.2 Availability
Availability is the measure of time that the product is available in an operative state. This is called the uptime:
Availability =
Uptime
Uptime
=
Total time Uptime + Downtime
Uptime is measured by the mean time between failures (MTBF):
Uptime = MTBF
Downtime is measured by the mean time to repair plus the mean response
time:
Downtime = MTTR + MRT
Availability =
MTBF
MTBF + ( MTTR + MRT )
8.12 DESIGNING FOR MAINTENANCE GUIDELINES
Maintenance strategy is not something to be left until after the product
has been designed. Ease of maintenance should be designed into the product as one of the early design goals. Reliability studies should be able to
predict part failure modes and frequencies and, of course, be a criterion
for part selection. The usage environment should be identified early. These
are some of the inputs that help develop a product maintenance strategy.
R20) Design products for minimum maintenance. Design the need
for maintenance out of the product. Parts should be carefully selected for
optimal reliability. Automobiles have made great strides lately in designing for minimum maintenance by extending the maintenance periods
(e.g., for oil changes). Designs should have conservative factors of safety so
that parts will not be overstressed, even in worst-case conditions.
DFM Guidelines For Product Design • 303
R21) Design self-correction capabilities into products. Design products with capabilities to correct problems they sense. Critical applications,
like in aerospace, use design features that can automatically switch to
backup systems.
R22) Design products with self-test capability. The product should
have the capability to run its own built-in self-test to aid in diagnostics
and repair. Self-test data should be stored in some form so it is available to
repair personnel and new product development teams.
R23) Design products with test ports. Design the product with a test
port to make key electrical test points easily available. This is especially
useful if access to test points is difficult.
R24) Design in counters and timers to aid preventive maintenance.
Products designed for ease of preventive maintenance should have counters
and timers built in to determine when maintenance should be performed.
R25) Specify key measurements for preventive maintenance programs. Designers, working with service people, should be in the best position to know product weaknesses and so should be able to specify key
measurements to determine wear or deterioration. Key parts, such as
drive belts, should be measured periodically and replaced as necessary.
Mechanically complex products can be analyzed by measuring the frequencies and amplitude of the noise they emit (their “sound signatures”),
which may predict when parts are approaching failure.
R26) Include warning devices to indicate failures. The MRT can be
minimized by signals (e.g., red lights or buzzers) and other warning devices
so that repair can begin quicker. In sophisticated factories, central control
panels show machine status and can instantly alert when a machine is
“down.” Self-diagnostics capability also minimizes the response time.
As mentioned before, plug-in modules can greatly benefit field maintenance and allow modules to be repaired off-line, where there are better
repair and diagnostic facilities. The maintenance strategy may determine
the order of assembly, as specified in Guideline A6, which states that the
most likely parts to fail should be the easiest to remove.
304 • Design for Manufacturability
NOTES
1. For tables of press fits (also called forced or interference fits), see the section
“Allowances and Tolerances for Fits” in the chapter “Dimensioning, Gaging, and
Measuring” in the Machinery’s Handbook, 28th edition (2008, Industrial Press).
2. “The Best Engineered Part Is No Part at All,” Business Week, May 8, 1989.
3. David M. Anderson, Build-to-Order & Mass Customization: The Ultimate Supply
Chain Management and Lean Manufacturing Strategy for Low-Cost On-Demand
Production without Forecasts or Inventory (2008, CIM Press), Chapter 7, “Spontaneous
Supply Chain.” See book description in Appendix D.
9
DFM Guidelines for Part Design
This chapter lists some general guidelines for part design, including fabrication, part standardization, symmetry, tolerances, part shapes, and combining parts and functions. For critical parts, the part designer should be
an early and active participant in the system engineering of the product
or subassembly to help optimize the systems architecture concept that
determines the part’s requirements. The part designer must understand
the purpose of the part, how it fits in, how it relates to the whole, and the
relative importance of function and performance, cost, rigidity, weight,
and tolerances, especially stacks it is a part of:
“Toyota’s process does not focus on the speedy completion of individual
component designs in isolation, but instead looks at how individual designs
will interact within a system before the design is complete. In other words,
they focus on system compatibility before individual design completion.”1
Investigate past or similar parts to learn from their good or bad histories
with respect to function, quality, cost, manufacturability, ramps, etc. First
consider off-the-shelf parts. Thoroughly search for and investigate available candidates. Explore all the ways to design and make the part. Don’t
just jump at the first idea that comes to mind. Choose the optimal design
approach. Keep thinking about how the part is to be made throughout the
design process.
If the systems engineering has not been optimized, recommend ways
that better system engineering or integration could improve the part’s
design and the manufacturability of the product overall. This especially
applies to the rational apportionment of tolerances in stacks.
Understand all the candidate processes well enough to choose the best
process for the optimal cost, tolerance control, quality and consistency,
ramps, delivery time, compatibility with company operations and supply
305
306 • Design for Manufacturability
chains, equipment and vendor availability, tooling cost and lead time,
setup time, and appearance or finish. If you don’t understand all candidate processes, find colleagues who do, bring in outside experts, or call in
the appropriate vendor(s), being careful to explain the nature of the inquiry.
Work with the vendor, who should be preselected, to collaboratively
design the part. Decide if the vendor should design the part under careful
supervision and coordination.
Keep in mind the optimal balance of design considerations: for example,
function, performance, strength, weight, cost, quality, manufacturability,
etc. For large or complex structures, ensure that all dimensions of each
part can be made in the same operation (Guideline P14). Optimize part
combinations or partitioning into multiple parts in a way that they can be
accurately aligned with the techniques of Guideline A3.
Research and understand the specific design guidelines for the part and
its chosen processes to optimize the function, cost, quality, and manufacturability in general. Follow the part design guidelines that appear in the
next section.
9.1 PART DESIGN GUIDELINES
P1) Adhere to specific process design guidelines. It is important to use
specific design guidelines for parts to be produced by each process, such as
welding, casting, forging, extruding, forming, stamping, turning, milling,
grinding, powdered metallurgy (sintering), plastic molding, and so forth.
A good summary of design guidelines of several processes would be well
over a thousand pages and is thus beyond the scope of a general book on
DFM. Some reference books are available that give a summary of design
guidelines for many specific processes.2–5 Many specialized books devoted
to single processes are also available.6 Industrial organizations and suppliers of specific processes often, at no cost, furnish designers with design
guidelines for their process.7
P2) Avoid right- or left-hand parts; use parts in pairs. Avoid designing
right- or left-hand (mirror-image) parts. Design the product so the same
single part can function in both right- and left-hand modes. If parts cannot now perform both functions, add features to both right- and left-hand
DFM Guidelines for Part Design • 307
parts to make them the same. Another way of saying this is to use parts
in pairs instead of different parts for front and back, top and bottom, and
right and left.
Purchasing right/left parts or paired parts (plus all the internal material
supply functions) allows a company to obtain twice the quantity and half
the number of types of parts. For pairs of molded parts, or any other part
that is made in custom tooling, this principle can cut tooling costs in half.
At one time or another, everyone has opened a briefcase or suitcase upside-
down because the top looks like the bottom. The reason for this is that top
and bottom parts are identical parts used in pairs, which is done to cut the
tooling cost in half.
Consolidating similar parts to be the same part results in a fraction of
the part types and several times the purchasing leverage.
P3) Design parts with symmetry. Design each part to be symmetrical
from every possible “view” (in a drafting sense) so that the part does not
have to be oriented for assembly. Symmetrical parts cannot be installed
backwards, eliminating a major quality problem during manual assembly.
In automatic assembly, symmetrical parts do not require special sensors
or mechanisms to orient them correctly. The extra cost of making the part
symmetrical (the extra holes or whatever other feature is necessary) will
probably be saved many times over by not having to develop complex orienting mechanisms and by avoiding quality problems.
It is a little known fact that in felt-tipped pens, the felt is pointed on both ends
so that automatic assembly machines do not have to orient the felt.
P4) If part symmetry is not possible, make parts very asymmetrical;
polarize all connectors. The best part for assembly is one that is symmetrical. The worst part is one that is slightly asymmetrical and thus could be
installed wrong because the worker or robot could not discern the asymmetry. Or worse, the part may be forced in the wrong orientation by a worker
(who thinks the tolerance is off) or by a robot (that doesn’t know any better).
So, if symmetry cannot be achieved, make the parts very asymmetrical.
Then workers will be less likely to install the part wrong because it will not
fit wrong. Automation machinery may be able to orient the part with less
expensive sensors and intelligence. For example, very asymmetrical parts
may even be oriented by simple stationary guides over conveyor belts.
308 • Design for Manufacturability
P5) Design for fixturing; concurrently design fixtures. Understand
the manufacturing process well enough to be able to design parts and
dimension them properly for fixturing, using geometric dimensioning
and tolerancing (GD&T), as discussed in Guideline Q14 in Section 10.2.
Flexible operations require that whole families of parts be positioned
in a common fixture without any setup changes.8 An example of such a
fixture is illustrated in Figure 4.2.
Parts designed for automation or mechanization need registration features for fixturing. Machine tools, assembly stations, automatic transfers,
and automatic assembly equipment need to be able to grip or fixture the
part in a known position for each operation. This requires registration
locations (e.g., tooling pins or optical targets) on which the part will be
gripped or fixtured while it is being transferred, machined, processed,
or assembled.
Concurrently design fixtures for welding, assembly, and other processing steps to improve cost, time, and quality of both the parts being
fixtured and the subsequent assembly. Fixtures could be discrete for a
mass-produced part. For families of products, fixtures should be versatile
enough to accept any part or assembly in the family. Versatile fixtures
also could be adjusted by detents or stops, or positioned by programmable
servo mechanisms.
P6) Minimize tooling complexity by concurrently designing tooling. Use concurrent engineering of parts and tooling to minimize tooling
complexity, cost, and delivery lead time and maximize throughput, quality, and flexibility. Work with preselected vendor/partners, who should be
expected to bring their process engineer and tooling engineer to the team
to work early with design engineers and whoever is doing the styling.
P7) Make part differences very obvious for different parts. Different
materials or internal features may not be obvious to workers. Make sure
that part differences are obvious. This is especially important in rapid
assembly situations where workers handle many different parts. To distinguish different parts, use markings, labels, color, or different packaging if
they come individually packaged. One company uses different (but functionally equivalent) coatings to distinguish metric from English fasteners.
P8) Specify optimal tolerances for a robust design. Design of experiments can be used to determine the effect of variations in all tolerances on
part or system quality. The result is that all tolerances can be optimized to
DFM Guidelines for Part Design • 309
provide a robust design to provide high quality at low cost.9 See Section 10.2
for more on tolerancing.
P9) Specify quality parts from reliable sources. The “rule of ten” specifies that it costs 10 times more to find and repair a defect at the next stage
of assembly. Thus, it costs 10 times more to find a part defect at a subassembly; 10 times more to find a subassembly defect at final assembly;
10 times more in the distribution channel; and so forth. The point here is
that all parts should have reliable sources that can deliver consistent quality over time in the volumes required.
The Rule of 10
Level of Completion
Cost to Find and Repair Defect
The part itself
At subassembly
At final assembly
At the dealer/distributor
At the customer
X
10 X
100 X
1,000 X
10,000 X
9.2 DFM FOR FABRICATED PARTS
When building high-variety parts at low volumes, maximize the amount
of variety done by flexible CNC machine tools, which may override the
usual economic trade-offs for mass-produced parts.
P10) Choose the optimal processing. Use concurrent engineering to
proactively choose the optimal processes (machining, casting, forming,
molding, and so forth) for the minimum total cost and throughput time.
Versatile primary processes can eliminate or minimize certain secondary
operations, thus saving cost and throughput time. Design to avoid unnecessary operations. Understand how fabrication processes work and their
capabilities and limitations as you learn design guidelines.
Work with preselected vendor partners from the beginning to concurrently
design parts and processes and fixturing. Print 3D models early and often
(rapid prototypes) to help optimize the design and processing and fixturing.
P11) Design for quick, secure, and consistent work holding. Design parts
for quick, secure, and consistent work holding for clamps, collets, arbors,
vises, chucks, centers, jigs, and fixtures. Provide consistent parallel, conical,
310 • Design for Manufacturability
or circular clamping surfaces. Design parts to be rigid enough to withstand
a cutting tool and work holding forces without distortion or damage. Do
not plan to clamp on parting lines or other uneven or inconsistent surfaces.
Provide access room for cutting tools, clamps, and clamping tools.
P12) Use stock dimensions whenever possible. Design parts so that
noncritical dimensions can be provided by stock dimensions of standard
raw material, instead of requiring machining for these noncritical dimensions. For instance, if you need a bar that must be about half an inch thick,
specify “½ inch stock” instead of a decimal dimension (.500″), which may
have to be machined down from a larger stock size, like ⅝ inch stock.
P13) Optimize dimensions and raw material stock choices. Specify
dimensions and select the raw material for the best balance of fabricating
efficiency and raw material standardization for the lowest total cost. Raw
material standardization (Section 5.10) needs to be even more aggressive
for build-to-order and mass customization, as discussed in Chapter 4.
P14) Design machined parts to be made in one setup (chucking).
Having to reposition parts or move to another machine increases cost for
setups and machine time; increases the chance of errors for extra setups
and repositionings; lowers accuracy, compared to the precision of locating
all cuts on the same chucking; disrupts Lean flow and complicates machine
scheduling; and takes more processing hours, more labor hours, and
more calendar time. To take advantage of single setups, designers must:
• Make all dimensions from the most logical datum, which corresponds to the fixture, machine bed, or clamping surface.
• Concurrently design fixtures, locating features, clamping geometry, etc.
• Design geometries to minimize the number of cutting tools—ideally,
one.
• Use total cost measurements to justify one 5-axis operation instead
of multiple 3-axis operations by including all costs for setup, loading,
zeroing, machine time, error correction, scrap, and so forth.
Single setup machining is an effective way to achieve tight tolerances between
many features at low cost.
Figure 9.1 shows how the author’s consulting10 improved the manufacturability of a robot bearing holder. In the original design (on the left half
DFM Guidelines for Part Design • 311
Hole made from each side which
is hard to align and grind
Hole made in one operation which
guarantees alignment and easy grinding
Retaining (snap) ring
Original Design
Cylindrical sleeve
Improved DFM Design
FIGURE 9.1
Improvement design for easier and better machining.
of Figure 9.1), the bearing mount holes had to be machined from each end
after repositioning the part, so it was hard to align the bearing bores to the
±.001″ concentricity tolerance. Further, it was also hard to grind the bore
to the exact diameter needed for the bearing mounts. The new part (on
the right half of Figure 9.1) was designed so that the critical bearing bores
could be made in one operation, which guaranteed alignment and made it
easy to grind a tight-tolerance diameter. The bearing spacer function was
provided by an off-the-shelf snap ring (retaining ring) and an inexpensive
sleeve. Similar logic encourages doing all machining with a single cutting
tool to avoid setup delays to change tools and avoid introducing inaccuracies, both of which are more likely without automatic tool changers.
P15) Minimize the number of cutting tools for machined parts. For
machined parts, minimize cost and throughput by designing parts to
be machined with the minimum number of standard cutting tools; for
instance, end mills. Avoid tool proliferation and arbitrary decisions. Keep
tool variety within the capability of the tool changer for the entire product
family, or, ideally, all parts in a flexible plant.
312 • Design for Manufacturability
P16) Avoid arbitrary decisions that require special tools and thus slow
processing and add cost unnecessarily. Designers should avoid arbitrary
decisions when specifying dimensions that require unique tools, such as
bend mandrels, hole punches, and cutting tool bits for machine tools. Find
out what are the most common tools in the shop and design around them,
instead of arbitrarily requiring tools that may not be readily available.
P17) Choose materials to minimize total cost with respect to post-
processing. Optimal selection of materials can minimize the cost of, and
possibly eliminate altogether, post-processing steps for strengthening,
hardening, deburring, painting, surface coating, and so forth. Materials
that appear to cost more may actually have a lower total cost if all post-
processing costs are considered. For instance, choosing stainless steel can
avoid the painting costs and rusting problems of inferior metals.
As mentioned in Chapter 5, some post-processing operations can be
eliminated by ordering prefinished material that is prepainted, preplated,
embossed, expanded, anodized, or clad with a different surface alloy.
Painting operations for sheet metal can be eliminated by switching to
stainless sheet metal. This might be justifiable if the total cost of painting
is considered. Prefinished material can be ordered with the finished side
protected by adhesive-backed paper that can be peeled off after assembly.
P18) Design parts for quick, cost-effective, and quality heat treating.
It is the responsibility of the designer to specify the quickest, highest quality, and most cost-effective (from a total cost perspective) post-processing
for heat treating and any other post-processing step. Work with manufacturing and vendors to consider all the possible scenarios and then systematically choose the best one.
P19) Concurrently design and utilize versatile fixtures. Design families of machined parts to be processed in the same versatile fixture. If
multiple fixtures are to be used in the same machine tool, design the fixtures to have standardized mounts. Flexible fixtures can speed loading
and can minimize setup changes for different parts, thus improving flexibility while lowering cost. New flexible fixtures should be concurrently
engineered as the product is designed (Chapter 3).
P20) Understand workholding principles. Design parts to be gripped
tight enough for good machining and withstand forces from cutting tools
and also from jigs, fixtures, clamps, collets, arbors, vices, and chucks.11
DFM Guidelines for Part Design • 313
P21) Avoid interrupted cuts and complex tapers and contours.
Interrupted cuts occur when cutting tools encounter holes or other gaps
in the workpiece, which results in vibrations, excessive tool wear, and inferior dimensions and surface finish. Complex tapers and contours may be
difficult to manufacture and inspect.
P22) Minimize shoulders, undercuts, hard-to-machine materials,
specially ground cutters, and part projections that interfere with cutter
overruns. Designers should avoid features that are difficult to machine.
Specially ground cutters may not yield consistent results. Although
machinists are taught to grind their own cutting tools in training classes,
this practice should be discouraged in production to avoid inconsistency
from tool to tool. Instead, use appropriate inserts, which are standard cutting tools that have consistent cutting edges and can be mounted consistently into matching tool holders.
P23) Understand tolerance step functions. Understand tolerance step
functions and specify tolerances wisely. The type of process depends on
the tolerance. Each process has its practical limit of how close a tolerance
could be held for a given precision level on the production line. If the tolerance is tighter than the limit, the next most precise—and expensive—
process must be used. Designers must understand these step functions and
know the tolerance limits for each process (see Figure 9.2).
P24) Specify the widest tolerances consistent with function, quality,
reliability, safety, and so forth. Avoid choosing tolerances arbitrarily or
from overly tight tolerance blocks
P25) Be careful about too many operations in one part, especially if
the part must pass through multiple machines, to decrease the cost and
delays of multiple setups and to minimize the consequences of machining mistakes.
P26) Concurrently engineer the part and processes for the best manufacturability, cost, quality, and throughput time.
P27) Avoid sharp internal corners that require sharp cutting tools,
which can easily break.
P28) Proactively deal with burr removal and provide room for burrs
and their removal tools. In general, ensure parts do not have sharp edges,
314 • Design for Manufacturability
10X
10
9
8
Relative Cost
7
6X
6
5
4
3.5X
3
2X
2
1
1.0
0
Rough
Standard
Fine
Machining Machining Machining
± 0.030"
± 0.005"
± 0.001"
Grinding
± 0.0005"
Honing
± 0.0002"
FIGURE 9.2
Cost as a function of process.
points, or burrs, which could damage other parts or injure workers and
even customers.
P29) Specify 45 degree bevels instead of round external corners, to
avoid special/unusual tools and tool changes.
P30) Don’t overspecify surface finishes. Use “comparitors,” which are
gauges that show the look and feel of various surface finishes for machined,
molded, and cast surfaces.
P31) Reference each dimension to the best datum for the optimal
tolerance control, clear and unambiguous representation of the design
intent, ability to make all key dimensions in the same setup on the same
machine, ease of CNC programming, and ability to inspect first articles
on coordinate measuring machines (see GD&T discussion in Guideline
Q13 in Section 10.1).
DFM Guidelines for Part Design • 315
9.3 DFM FOR CASTINGS AND MOLDED PARTS
9.3.1 DFM Strategies for Castings
Understand that casting is an inflexible process where every different
shape requires a different die, and so versatile standard shapes should be
encouraged. This makes castings unsuitable for customizing products,
unless all versions are based on a standard raw casting. By contrast, metal
fabrication is a flexible process where CNC machine tools can machine
many different shapes flexibly.
P32) Obey all the guidelines for design of castings and molds/dies
using handbook guidelines or, preferably, with the help of the casting
vendor working with the team. Optimize draft angles, surface finish,
wall thickness, thickness transitions, ribbing, features, holes, corners,
parting planes, die filling, sprue/riser locations, ejection, cooling times,
and so forth while minimizing the effect of shrinkage, warpage, and surface variations.
P33) Standardize cast parts to minimize the number of parts and the
number and cost of the molds/dies.
P34) Design versatile raw castings that have all the shapes and features
for all versions of the casting to minimize the number of raw castings,
minimize the number of expensive dies, and allow these standard parts
to be inventoried knowing they will be used one way or another, without
the excessive cost and risk of stocking many different versions. The cost
of the extra metal (to make the part versatile) will probably be saved many
times over in die cost, setup costs, and inventory management for multiple
raw castings. For weight-sensitive applications, it may incur less total cost
to machine away any extra metal rather than specifying many different
raw castings.
P35) Capitalize on opportunities to avoid machining with “as cast”
shapes whenever possible. The comparitors mentioned in Guideline P30
will help you ascertain when this is feasible.
P36) Carefully plan out the sequence of machining castings starting
with the machining reference points so that the raw castings are properly
positioned in the machine tool.
316 • Design for Manufacturability
9.3.2 DFM Strategies for Plastics
Like casting, plastic molding is an inflexible process where every different shape requires a different mold. Thus, versatile standard shapes should
be encouraged.
P37) Obey all the guidelines for part design and mold design using
handbook guidelines or, preferably, with the help of the molding vendor
working with the team. Optimize draft angles, surface finish, wall thickness, thickness transitions, ribbing, features, holes, corners, parting planes,
mold filling, sprue/riser locations, ejection, cooling times, and so forth
while minimizing the effect of shrinkage, warpage, and surface variations.
P38) Standardize molded parts to minimize the number of parts and
the number and cost of the molds/dies.
P39) Design versatile molded parts that have all the shapes and features for all versions to minimize the number of designs and tooling. The
cost of any extra plastic will probably be saved many times over in mold/
die cost, setup costs, and inventory management for multiple plastic parts.
P40) Standardize raw materials for all parts, or at least all parts in a
product family. Even if it appears that some parts may be getting better
material than needed, the total cost to the company will be less because
of purchasing leverage (economies of scale), lower material overhead with
fewer types of materials to procure, and fewer setup changes at the molder
to change raw materials. In addition, delivery will be faster without setup
changes and procurement for multiple types.
P41) Choose raw materials commonly used, especially at the chosen
vendor or partner, to eliminate extra procurement cost and setup changes.
Try to choose common materials used throughout the vendor base. Be
sure these cost savings are factored into the vendor’s charges.
P42) Consider all adjacent parts when substituting plastics. Instead
of limiting thinking merely to one-for-one replacements when replacing
other materials with plastics, look for nearby opportunities to combine
several parts or functions into an optimal system.
P43) Optimize the number of functions in each part. Optimize decisions between part or mold complexity and the total cost savings in assembly and supply chain management:
DFM Guidelines for Part Design • 317
• Mold complexity/cost. Compare the cost of one complex mold to several simpler molds.
• Assembly labor. Compare the assembly cost of multiple parts to one
monolithic part.
• Material overhead. Compare the purchasing and logistics costs of
one versus multiple parts.
• Vendor base. Complex molds and unusual processing may limit the
vendor base.
• Tolerance control. Monolithic parts control tolerances between features and avoid tolerance stacks. On the other hand, precise part
alignment techniques (Guideline A3) may be able to ensure alignment tolerances between multiple parts.
• Appearance. Monolithic parts eliminate seams. However, clever
styling could mitigate this problem.
P44) Methodically choose tolerances for molded parts. Avoid unnecessarily tight tolerances and finishes. Understand tolerance step functions
(Section 9.2). Specify optimal tolerances for a robust design using the
Taguchi Method™ for Robust Design (Chapter 10, Section 10.2.5).
P45) Work with preselected vendors/partners from the beginning to
concurrently design parts and tooling.
P46) Print 3D models (rapid prototypes) to help optimize the design
and tooling. Order quick-turn parts before making tooling.
9.4 DFM FOR SHEET METAL
P50) Buy off-the-shelf sheet metal boxes by making this an early consideration in the architecture phase.
P51) Optimize sheet metal in the concept/
architecture phase.
Minimize demands on sheet metal manufacture by optimizing it as part
of system architecture instead of considering it after everything else is
designed. Minimize the need for skilled TIG welding; consider spot welding or roll seam welding. Consider tab-in-slot assembly, where small TIG
torch actions weld the tab to the slot. Consider self-jigging geometries.
318 • Design for Manufacturability
P52) Optimize sheet metal processing. Use CNC shearing and bending to automate sheet metal fabrication. Use CNC shears, laser cutters, or
plasma cutters to maximize the number of operations done in one setup
(Guideline P14). Such cutters may have slower cutting speeds than the
equivalent operations on shears or punch presses, but doing all operations
in one laser cutter setup may be quicker (including setups saved) and may
have a lower total cost.
Use optimal nesting software to minimize sheet metal waste, with small
parts nested between larger parts. This could be a kanban source for sheet
metal parts that could be nested into various sheets on a “space available”
basis. These could then be sent to their kanban stations, as described in
Section 4.2.
Sheet metal cost can be minimized by standardizing enough usage on
one thickness and grade to allow the purchase of coils, possibly directly
from the mill. This reduces waste even further if the sheet metal is fed
from the coil through straighteners directly into a CNC shear, laser cutter,
or plasma cutter, which will have much better nesting without a length
limit, as would be the case for an eight foot long sheet. As metal prices
and shipping costs rise, this greater material utilization—resulting in less
wasted metal—will become more attractive.
Sheet metal surfaces should be kept clean for subsequent welding, and
visible surfaces could be ordered with “papered” protective film that can
be removed after shipping and installation.
P52) Standardize sheet metal. All sheet metal pieces should be made
from one gauge and type to minimize supply chain costs and delays, in
addition to allowing the purchase in coils. Proactively, make this selection
correspond to the vendor’s operations. If sheet metal parts are made from
discrete sheets, minimize the number of different sheet size varieties and
keep sheet sizes within locally available stock.
P53) Standardize sheet metal tools. Standardize on the fewest types
of holes and slots, unless done by programmable plasma or laser cutters.
Standardize on one bend radius for all sheet metal to eliminate mandrel
setup changes. Choose the mandrel that is usually on the machine tools,
making sure the radius is not so sharp that it cracks the metal or so large
that it runs into something inside.
DFM Guidelines for Part Design • 319
For punched holes, slots, and louvers, avoid the cost and delays to have
special tools ordered or built by standardizing on shapes that correspond to
the tool sets already in use at both the intended local vendor and at other
suppliers in other potential manufacturing locations. Preferably, select the
shapes whose tooling is normally on the machine, to avoid setup changes.
Limit variety to the number of tool sets in the automatic tool changer for
the whole product family.
P54) Follow sheet metal design guidelines. Make sure sheet size and
forces needed are within process capabilities. For bends, allow room for
bending mandrels and avoid tight tolerances between two bends, which
are hard to hold.
Tolerances should not be too tight; generally, ±.020″ and no tighter than
±.010″. A flatness of .005” per inch is the best that can be achieved without
secondary straightening.
Obey spacing requirements between holes and edges or bends. Obey
all spot welding design guidelines, including tool access. Avoid welding
warpage to sheets by minimizing spans or using annealed sheet metal.
9.5 DFM FOR WELDING
9.5.1 Understanding Limitations and Complications
Before considering welding, understand the limitations and complications
of welding with respect to: warping; dimensional uncertainties; tolerances
issues for the whole weldment; appearance and finish; welder skill required;
torch and welder accessibility; cost-of-quality, including straightening,
touch-up, rework, scrap, etc.; extra assembly labor to position mounted
parts when weldment mounting features are not precise; reduced hardness
and strength to annealed levels in heat-affected zone; corrosion vulnerabilities in the heat-affected zone; outgassing issues; and total labor time,
including setup, welding, touch-up, grinding, rework, scrap, and so forth.
Using clamps and jacks to correct for warpage during welding adds more
cost, takes longer, and increases residual stresses, unless weldments are
annealed after welding.
320 • Design for Manufacturability
Formulate a strategy for mounting holes. First, ascertain if mounting
tolerances are wide enough to allow welding of pieces with predrilled
holes. If not, then devise strategies for mounting and alignment in slots.
9.5.2 Optimize Weldment Strategy for Manufacturability
Optimize trade-offs between monolithic weldments and various modular
strategies. A strategy for mounting holes should include considerations
such as:
• Ensuring tolerances are wide enough to allow welding pieces with
predrilled holes
• Strategies for mounting and alignment in slots
• Use of mega-machines that can machine mounting surfaces and
holes after welding
• Predrilling holes in small parts that are assembled precisely by DFM
techniques, as discussed in Section 9.6
9.5.3 Adhere to Design Guidelines
Adhere to welding design guidelines for: the dimension and tolerance strategy of the weldment; appearance demands; piece preparation (dimensions,
tolerances, and edge preparation); concurrently designed fixtures; pre-weld
fit-up and clamping; preheating of parts and fixturing; penetration specifications; the optimal welding sequence; distortion and warping control; tool and
welder access; post-weld straightening; post-weld machining; post-weld grinding; and quality control procedures. Be sure to minimize the combined cost
of welding labor and grinding labor, because less-skilled welding can increase
grinding cost. Consider making welders grind their own welds, which would
be a form of kaizen (continuous improvement), providing immediate feedback and correction and teaching the value of making better welds.
9.5.4 Work with Vendors/Partners
Work with preselected vendors or partners from the beginning to concurrently design the weldments and welding procedures and fixturing. This
teamwork will be aided by early 3D models (rapid prototypes) to help optimize the design, procedures, and fixturing.
DFM Guidelines for Part Design • 321
9.5.5 Print 3D Models
Printed 3D models (rapid prototypes), scaled if necessary, help optimize
the design and welding procedures and fixturing. Discuss with welders or
vendors/partners.
9.5.6 Learn How to Weld
Even one welding course from a community college or trade school will
help engineers design more manufacturable weldments. If you want to
make the best trade-offs between welding and alternatives, learn to operate machine tools too (as the author has done).
9.5.7 Minimize Skill Demands
Explore alternatives to manual TIG/MIG/stick welding, such as robotic
or automated MIG welding. Other alternatives include spot weld or roll
seam welding, both of which require less skill than hand welding. For
sheet metal weldments, consider tab-in-slot assembly where a TIG torch
can quickly weld the tab to the slot. To minimize setup costs, develop self-
jigging geometries that can be fabricated automatically on CNC machine
tools, hopefully in the same setup, to make the required features.
9.5.8 Thoroughly Explore Non-Welding Alternatives
For large or tight-tolerance assemblies, thoroughly explore non-welded
alternative concepts, such as bolted assemblies of machined parts that are
accurately aligned by the low-cost round and diamond pin technique presented in Guideline A3 in Section 8.2.
9.6 DFM FOR LARGE PARTS12
9.6.1 The Main Problem with Large Parts
For weldments, the heat of welding creates enough warpage to preclude
depending on the accuracy of holes predrilled in the constituent parts.
Similarly, for cast parts, precise holes cannot be cast in.
322 • Design for Manufacturability
Thus, mounting holes must be machined after welding or casting large
parts. If the weldment or casting is too large for an ordinary machine tool,
then the post-processing machining must be done on large mega-machine
tools, which:
• Have high hourly charges for setup, machining, repositionings,
and inspections
• Usually involve labor-intensive online setups, which adds to expensive machine time, especially if the weldment is too heavy to position manually
• May involve transportation and queuing delays
• May require lengthy workplace setups and tool changes
• May require the large parts to be repositioned for subsequent machining, which can be slow if they are too heavy to move manually, consumes expensive machine time, and violates DFM guideline P14
9.6.2 Other Costs
Welding requires skilled labor to make consistently good welds plus other
labor to position, fixture, clamp, straighten warpage, and grind. Casting
metal is labor intensive and time consuming and involves making the
molds, pouring the metal, letting it cool, and removing it from the mold.
9.6.3 Residual Stresses
Welding induces residual stresses. The choices are to:
• Live with residual stresses, which may require more metal if the
residual stresses lower the payload or cause structural failure modes.
Residual stresses may also cause warping after metal removal.
• Anneal the weldment after welding, which will require a large furnace that will also have expensive hourly charges and transportation
and queuing delays.
9.6.4 Loss of Strength
Welding causes loss of strength in the heat-affected zone from the welding
and annealing, thus requiring more steel compared to assembled steel,
which will be used at its full cold-rolled strength. Material used for castings usually has less strength than cold-rolled bar stock.
DFM Guidelines for Part Design • 323
9.6.5 Strategy
The strategy would be to commercialize proven parts with backward-
compatible replacements with the same functionality and strength
(possibly enhanced), but with much less total cost, weight, and material
consumption. This would provide cost reduction now on existing products. It would also encourage a leap-frog strategy where these low-cost
parts could then become the basis for new-generation products or the
approach could be applied to new products.
The specific strategy to eliminate the abovementioned costs would be to
create an optimized concept/architecture for constant-stress trusses and
structures (which, by definition, use the least material) utilizing the following approach.
9.6.6 Approach
The approach would be based on the following premises:
Fabrication: All machined parts would be small enough to be set up
and made quickly on ordinary CNC machine tools in a single setup
(Guideline P14). Welded or cost parts would be limited to those that
are small enough to be annealed and machined after welding by the
typical in-house machine tools and furnaces. This may be appropriate for bearing blocks and other junction parts if it is not possible to
machine them from a single block.
Assembly: Precise alignment of these assembled pieces would be
assured by DFM principles, such as DFM Guideline A3 (Section 8.2),
in which mating parts would be aligned to submill tolerances by
inexpensive pairs of round and diamond down pins in reamed holes.
Aligned parts would then be bolted or riveted together with appropriate bolts, torque settings, and retention strategies. The benefits
would be multiplied several times when applied to many large parts
and multi-part assemblies.
9.6.7 Procedure
The procedure to convert hard-to-build weldments and castings to manufacturable assemblies is as follows:
324 • Design for Manufacturability
• Identify all the parts that are attached to the current large part. These,
and the mounting feet, would represent the loads on the part.
• Identify the fastening interfaces for all the attached loads and the
mounting feet. These would represent the load points.
• Ascertain the maximum load values on each load point. When these
load values are drawn as 3D arrows on the CAD drawing, they represent the load paths. The lengths and directions of the arrows should
be roughly proportional to the load values.
• Arrange a workshop13 to do brainstorming (Section 3.7) to generate
several ideas of structural concepts; for instance, various concepts
for plates, bars, tubing, 2D trusses, or 3D space frames. The leading
candidate(s) would be explored further until a “winner” emerges. An
alternative would be to assign this to an experienced company designer
or commission a design study14 by an experienced practitioner who
would then turn it over to a company engineer for completion.
• Design structural members to correspond to the load paths and be
sized to carry the maximum loads along these paths. Smaller structures could be made from plates or bar stock, with all mounting and
aligning features machined in the same setup (P14) on ordinary
CNC machine tools. Larger structures could be trusses or 3D space
frames comprised of struts and nodes, where the struts are tubes or
rods and the nodes are machined blocks with all the fastening, alignment, and mounting holes premachined.
9.6.8 Results
The results would be much lower cost from:
• Quick machining on ordinary automated CNC machine tools
• Quick setup concurrently engineered to further reduce machine
setup time for whole part families that could include many nodes in
the same assembly
• Quick assembly with accuracy assured by the machined features
• Higher strength per weight (meaning higher strength per material cost) because (1) it is a more structurally efficient design (lower
part stresses to support a given applied load) and (2) stock material
(like bar stock) would be stronger than annealed weldments or cast
materials. Stock material would remain at cold-rolled strength and
DFM Guidelines for Part Design • 325
heat-treated strength could be preserved, which is not the case for
the heat-affected zones in weldments.
• Less material cost and better material availability, especially if many
pieces are made from readily available materials
• Reduced shipping costs with lighter-weight, maybe hollow, structures that, if needed for rigidity or vibrations, could be filled after
shipping with water, sand, concrete, or other fillers.
NOTES
1. James Morgan and Jeffrey K. Liker, The Toyota Product Development System (2006,
Productivity Press), Chapter 4, “Front-Load the PD Process to Explore Alternatives
Thoroughly.”
2. James G. Bralla, Editor, Design for Manufacturability Handbook (1998, McGraw-Hill).
3. R. Bakerjian, Editor, Tool and Manufacturing Engineers Handbook, Volume 6, Design
for Manufacturability, (1992, Society of Manufacturing Engineers, Dearborn, MI).
Chapter 1 is by David M. Anderson.
4. H. E. Trucks, Designing for Economical Production, 2nd edition (1987, Society of
Manufacturing Engineers).
5. G. Pahl and W. Beitz, Engineering Design: A Systematic Approach (1988, Springer-
Verlag), translated from German; 400 pages with 50 pages on DFM.
6. J. Hicks, Welded Design: Theory and Practice (2000, Woodhead Publishing), 160
pages.
7. John Campbell, Complete Casting Handbook: Metal Casting Processes, Techniques and
Design: (2011, Butterworth-Heinemann), 1220 pages.
8. David M. Anderson, Build-to-Order & Mass Customization: The Ultimate Supply
Chain Management and Lean Manufacturing Strategy for Low-Cost On-Demand
Production without Forecasts or Inventory (2008, CIM Press), Chapter 8, “On-Demand
Lean Production.” See book description in Appendix D.
9. Lance Ealey, Quality by Design (1998, ASI Press, Dearborn, MI).
10. For more on DFM consulting and design studies, see Appendix D or visit the
Consulting page at www.design4manufacturability.com. Dr. Anderson also offers
concept studies (Appendix D) that solve challenging design problems and address
major design opportunities.
11. “Workholding” DVD (2010; 28 minutes; DV09PUB6) by Society of Manufacturing
Engineers; www.sme.org. See also a thorough, but dated, book that shows a wide
range of off-the-shelf workholding products in one volume: Workholding (1982,
SME; ISBN 0-87263-090-0).
12. For more on converting hard-to-build large weldments and castings to more manufacturable machined assemblies, see http://www.design4manufacturability.com/steel-
reduction-workshop.htm.
13. Dr. Anderson has facilitated large parts conversion workshops (Appendix D.6.3) and
done consulting design studies for the following types of products: frames for underground mining vehicles; frames for power plant scale current inverters; 12-ft-high
326 • Design for Manufacturability
frames for large box-making machines; large filters for nuclear power plants; 400-ft-
long vacuum chambers for coating window glass; and multi-story framework structures for postal sorting facilities. He has also proposed these workshops for farm
machinery, large engine blocks, machine tool frames, large medical equipment
framework, utility-scale transformer enclosures, oil industry equipment, and large
vehicle frames. He can be reached at anderson@build-to-order-consulting.com.
14. See Appendix D for more on Dr. Anderson’s workshops, consulting, and design
studies.
Section V
Customer Satisfaction
10
Design for Quality
“One third of quality-control problems originate in the product design.”
— Dr. Joseph Juran
Design is more responsible for quality than most people realize, as noted
long ago by quality control guru Dr. Joseph Juran.1 Designers determine
the number of parts, decide which are purchased off-the-shelf, select the
purchased parts, design the rest of the parts (indirectly specifying how
they will be made), determine how the parts must be assembled, and specify how the parts function together. The product’s design determines the
factory processes, whether or not the designers realize it. If designers realized this, they might be more inclined to work with manufacturing as a
team to simultaneously design the product and its processing.
Manufacturing or quality departments are often held responsible for
quality. These groups may expend substantial effort to try to ensure high
quality to compensate for insufficient attention devoted to the inherent quality of the design. If diligent, the factory may be successful at keeping quality
problems from escaping the plant, but the company may be incurring a
high cost of quality, as discussed in Section 6.9 and quantified in Chapter 7.
Manufacturing, and often product development, can be seriously disrupted
by diagnostics, rework, excess inventory, firefighting, and quality control efforts.
Merely talking up quality or having a quality program is not enough, if
the product is not designed well for quality and there is a lack of understanding about how customers value quality. If the steps presented here
are not followed and the product has quality problems in manufacturing
or in the field, engineering resources will be depleted by excessive change
orders and factory troubleshooting. In the worse cases, quality problems
can force a redesign—the ultimate drain on engineering resources.
329
330 • Design for Manufacturability
As pointed out in Chapter 1, 80% of a product’s lifetime costs are determined by the first 8% of the process, which is the design. No matter how
hard the factory tries, it can affect only the remaining 20%. Similarly, a
large percentage of the product’s quality is determined by design.
10.1 QUALITY DESIGN GUIDELINES
The following is a list of proactive guidelines, procedures, and cultural
perspectives that product development teams can use to design quality
into products.
Q1) Establish a quality culture. This is a culture in which “quality is
everyone’s responsibility,” not just the quality department. Understand
that quality starts with product development.
Q2) Understand past quality problems and issues. Thoroughly understand the root causes of quality problems on current and past products
to prevent new product development from repeating past mistakes. This
includes part selection, design aspects, processing, supplier selection, and
so forth. It may be useful to have manufacturing, quality, and field service
people make presentations to newly formed product development teams,
showing, hopefully with some real-life examples, the past problems that
can be avoided in new designs.
Usually, there is so much quality data that it is hard to comprehend
all the lessons and prioritize which lessons are most important for new
product development. This problem can be solved by plotting quality issue
frequency versus severity, as shown in Figure 10.1.
The frequency would be the number of times per year each category of
issue appeared. The severity could be based on the costs incurred, product
downtime costs, resources consumed to fix the issue, resulting change-
order costs, product development delays, production delays, and other
quantified consequences. Severity could also include nonquantified issues
such as safety risks, injuries, and corporate liabilities; these could be
ranked on a subjective scale, say, from 1 to 5.
This will present a visual prioritization of quality and reliability issues
to help product development teams prioritize their efforts to solve quality
problems, with the most effort directed toward the most severe issues that
Design for Quality • 331
Plotting Quality Issue Frequency vs. Severity
with Priority Zones of Importance
High
A
B
F
Quality Freqency
D
G
E
J
L
N
O
Low
C
I
M
H
K
P
Low
Quality Issue Severity
High
FIGURE 10.1
Quality issue frequency vs. severity.
happen most often. For the graphing format, be sure to label each issue
within its zone for clarity.
Q3) Methodically define the product. Define the product so it will meet
the customer’s needs with quality function deployment (QFD), discussed
in Section 2.11. This ensures that the first design will satisfy the voice of
the customer without the cost and risk of changing the design.
Q4) Make quality a primary design goal. Proactively design in quality by
making sure that quality is a primary design goal as important as functionality, manufacturability, and all the considerations discussed in Chapter 2.
In older, reactive product development cultures, quality issues were dealt
with only after problems surfaced in manufacturing, or worse, in the field.
Q5) Use multifunctional teamwork. Break down the walls between
departments with multifunctional design teams (Deming’s 9th point) to
ensure that all quality issues are raised and resolved early and that quality
is indeed treated as a primary design goal.
Q6) Simplify the design and processing. Simplify the concept/
architecture with the fewest parts, interfaces, and process steps. Elegantly
332 • Design for Manufacturability
simple designs2 and uncomplicated processing result in inherently high-
quality products.
Q7) Select parts for quality. Too often, parts are selected only for functionality and cost. However, to ensure quality by design, parts must also
be selected for quality. If part cost goals seem to be at odds with quality goals, then cost is probably not being computed on a total cost basis
(Chapter 7), which would include quality costs, as discussed in Section 6.9.
When total cost is taken into account, product development teams would
never choose the proverbial lowest-bid part. Selecting parts and suppliers
on a total cost criterion that includes quality is Deming’s 4th point.
Q8) Optimize processing. Select or concurrently engineer manufacturing processes to ensure the highest quality production. Be careful to
make sure that new processes are robust enough to ensure high-quality
products in production quantities from production environments. Design
within process capabilities; design for processes that are in control and
can reliably produce quality parts.
Q9) Minimize cumulative effects. Understand the cumulative effect of
part quality on product quality, as discussed in Section 10.3. Product quality degrades exponentially as part count increases.
Q10) Thoroughly design the product right the first time. Use the techniques presented in Chapter 1 to ensure that the product is designed right
the first time. If quality is not assured by the initial design, then expensive
change orders (Section 1.10) will have to be carried out, wasting valuable
engineering resources and possibly inducing further quality problems in
the process. Be sure to comfortably satisfy all the design goals and constraints without having to compromise the product just to get it out the door.
Q11) Mistake-proof the design with poka-yoke. Proactively prevent
defects by design and in manufacture with poka-yoke, which is Japanese
for mistake-proofing or “idiot-proofing.” This is discussed in Section 10.7.
Q12) Continuously improve the product. Use continuous improvement, or kaizen, to make incremental improvements to the product and
processing. The old paradigm for tolerances was that quality would be
assured if each dimension was made “within spec” or within the specified tolerance band. If parts are made in a low-quality environment, a tight
Design for Quality • 333
tolerance will raise costs because parts outside the tolerance band must
be scrapped. However, this can become problematic when many parts
are rejected outside the acceptable tolerance range; when this happens, it
means that the parts that do pass will have a high percentage of parts at
either extreme of the tolerance range. This could result in problems when
they are combined with other mating parts that are skewed toward the
worst-case combinations.
Continuous improvement programs, on the other hand, strive to continuously tighten the accuracy of manufactured parts, so that the dimensions become closer and closer to the target. This results in the population
of parts being closer to the center of the range, with few, if any, parts near
the original limits.
Q13) Document thoroughly. In the rush to develop products, many
designers fail to document every aspect of the design thoroughly.
Documentation should be 100% complete, correct, and accurate, with
updates made immediately as changes occur.
Drawings sent to manufacturing or to vendors need to convey the design
unambiguously for manufacture, tooling, and inspection. Imprecise drawings invite misunderstandings and interpretation, which add cost, waste
time, and may compromise quality.
Geometric dimensioning and tolerancing (GD&T) is an unambiguous
methodology that can clearly convey the design intent, which then eliminates delays and quality problems due to documentation problems. In
GD&T, each dimension is dimensioned from the most logical and precise datum. For instance, several holes to be machined in a piece of metal
would be dimensioned from a single datum instead of from each other
(which would cause a cumulative error) or from various edges (in which
the edge tolerance would affect the hole spacing).
GD&T optimizes dimensioning for (1) function, ensuring the parts are
made as intended; (2) manufacturing, to optimize processing and fixturing; and, (3) inspection, allowing the use of coordinate measurement
machines. Proper datum referencing also allows the maximum number
of operations to be done in the same setup without repositioning the part
(Guideline P14).
Q14) Implement incentives that reward quality. In many organizations, individuals do what they are rewarded to do. If they are rewarded
for releasing a design “on time,” they will, effectively, throw it over the
334 • Design for Manufacturability
wall on time, ready or not! If they are rewarded for achieving “cost targets” without total cost accounting, they will do so by buying the cheapest
parts available, probably of inferior quality. Thus, reward systems must be
structured to include quality metrics.
10.2 TOLERANCES
Q15) Optimize tolerances for a robust design that is compatible with
manufacturing processes. Properly specifying tolerances is one the most
important steps to making designs manufacturable. Tolerances that are
unnecessarily too tight often force the use of a more precise process, which
results in more cost and delays. Designers must understand fabrication
processes so they will know the effect of tolerancing on processing.
Do not neglect to specify tolerances, leaving it to chance or interpretation. Do not let tolerances be determined by block tolerances in CAD
or drawing formats, especially for noncritical parts, like brackets. Do not
repeat inappropriate tolerances from previous work. Do not make tolerances too loose because of a lack of understanding. Do not make tolerances
unnecessarily tight “just to be sure.”
10.2.1 Excessively Tight Tolerances
If tolerances are perceived by manufacturing as excessively tight, many
undesirable things can happen. Manufacturing people who challenge the
tight tolerances may question why they are needed and if they really do
warrant a more expensive process. If they bring the concern to engineering, the designer who specified the tolerance should welcome the input
and adjust the tolerance accordingly. The worst thing that can happen
would be for the designer to act too busy or stubborn and refuse to make
changes when changes are warranted.
Unfortunately, what happens too often is that manufacturing receives
a verbal tolerance change without documenting the change for the next
build or for similar products. This only ensures that the problem will recur
and implies to manufacturing that the tight tolerance was not really necessary, thus eroding the credibility of tolerances in general.
In other cases, manufacturing people interpret tolerances because of
a perceived low credibility of the tolerances. This risky procedure can
Design for Quality • 335
backfire if some parts are made with inadequate tolerances on some really
critical dimensions. The tolerance problem is intensified when parts are
sent out to suppliers who do not have an understanding of which tolerances must be held precisely and which can be changed. The supplier will
(and should) bid on the basis of the stated tolerances on the drawing. The
unfortunate result of this double standard on tolerances might be improperly biased make/buy decisions in favor of internal manufacture that may
be getting by with looser tolerances for the same part.
If tolerances are specified (or interpreted) too loosely, the product may
fail functional tests, encounter random difficulty at assembly, have quality
problems, wear out prematurely, or pose a safety hazard in use.
10.2.2 Worst- C ase Tolerancing
A related problem is tolerance stack-up and worst-case tolerancing.
Tolerance stack-up refers to the cumulative effect of all the tolerances in a
“string” of dimensions (the combination of which affects the same overall
dimension). Worst-case tolerancing refers to combining the “worst” of all
the tolerances to analyze what the net effect will be. For instance, to do a
worst-case analysis on the clearance between a shaft and a hole, one would
consider the largest possible shaft in the smallest possible hole and the
smallest possible shaft in the largest possible hole. This analysis will yield
the extremes in clearance, which should conform to design requirements.
The product must be able to function reliably and safely in all worst-case
tolerance situations. Tolerance stack-up analysis should be done adequately
on relevant part stacks, modules, and subassemblies, as well as on the product itself.
When several dimensions combine to determine an overall dimension
(which has its own desired tolerance), the tolerances of all the elements
should be apportioned rationally based on the lowest total cost for holding all dimensions in the chain. If there is not a planned apportionment
of tolerances, the result may be that the last part designed ends up with
excessively tight tolerances because previously designed (and maybe built)
part tolerances have already been set.
10.2.3 Tolerance Strategy
The goal should be to optimize tolerances for a balance of function, quality,
safety, and manufacturability. Tolerances should have enough credibility to
336 • Design for Manufacturability
be respected as specified so manufacturing can then concentrate on meeting them. All tolerances specified need to be carefully thought out with
respect to the processes. Working with manufacturing engineers very early
in the design will help, but the best approach is for the designers to be thoroughly familiar with the processes and their limitations. Tolerances that are
changed on one build should be immediately documented for future builds.
Tolerances should be methodically specified by the Taguchi Method™
for robust design (Section 10.2.5).
10.2.4 Block Tolerances
Another problem is the block (or blanket) tolerance printed on the drawing: for instance, ±.005″ for linear dimensions and 63 RMS for surface
finish “on everything not otherwise specified.” This often results in many
tolerances that are tighter than necessary, and, if strictly enforced, would
prohibit the use of standard stock; say, ½” stock for a ½” dimension. Block
tolerances technically could even apply to chamfers and radii, which are
only needed for clearance, appearance, or safety.
If a company must use a tolerance block, it should specify several blanket tolerances for different needs; for instance:
• .XXX dimensions to indicate a ±.005″ or a ±.001″ tolerance
• .XX to indicate a ±.015″ or a ±.020″ tolerance
• Fractions to indicate a ±1/32″ tolerance.
Each company should determine its most common tolerances and specify
them in the tolerance block. Designers will need to realize that a two-digit
dimension of ⅝ inch will have to be specified as .62 or .63, not .625.
10.2.5 Taguchi Method™ for Robust Design
Proactively specify optimal tolerances for a robust design to ensure high
quality by design. The Taguchi Method™ for robust design is a systematic
way to optimize tolerances to achieve high quality at low cost.3 It does this
by using design of experiments to analyze the effect of all tolerances on
functionality, quality, and manufacturability to analyze tolerance stacks
and worse-case situations. The procedure can identify critical dimensions
that need tight tolerances and precision parts, which can then be toleranced methodically. The unique strength of this approach is that it can
Design for Quality • 337
minimize cost while ensuring high quality by identifying low-demand
dimensions that can have looser tolerances and cheaper parts.
Such a design would be considered robust, if it could be manufactured
predictably with consistently high quality and perform adequately in all
anticipated usage environments.
Without a methodical way to determine tolerances, the alternatives
would be to:
1. Make all tolerances tight just to be sure, which is expensive.
Tolerances that appear to be overly tight may have credibility problems and invite interpretation.
2. Inadvertently (or deliberately) make tolerances too loose, leading
to manufacturability and quality problems. Performance, quality,
and manufacturability problems may be inconsistent and thus hard
to troubleshoot and rectify.
10.3 CUMULATIVE EFFECTS ON PRODUCT QUALITY
It is important to understand the cumulative effect of the number and
quality of parts. Computations will be based on the assumption that any
single part failure will cause the product to fail. This is valid unless the
product has redundancy or backup features that are used in critical applications (like aerospace).
Statistically, this situation is similar to a series reliability model, which
states that the reliability of the system is computed by multiplying the individual reliabilities of all the parts of the system, assuming any single failure causes a system failure (in series):
n
R s = R 1 ⋅ R 2 ⋅ R 3 ⋅ R 4 ⋅⋅⋅ R n = Π R i
I=1
where
Rs = the reliability of the system
R n = the reliability of component n
The equivalent formula for product quality would represent the probability of the product functioning properly or having no defects, given the
individual probabilities of the parts are free from defects:
338 • Design for Manufacturability
n
Q p = Q1 ⋅ Q 2 ⋅ Q 3 ⋅ Q 4 ⋅⋅⋅⋅ Q n = Π Q i
I=1
where
Qp = the quality level of the product measured as the probability of
proper function, or being defect-free
Qn = the quality level of part n
The quality level of parts is easily measured in the percentage that are
defect-free. Quality levels have been rising so much that the “percent good”
is becoming a cumbersome number; for instance, 99.95%. In these cases
the quality level is expressed in defects per million (DPM), which, for 99.95%
would be 500 DPM—a more manageable number. The DPM measurement
psychologically fits in better with zero-defect programs because the goal is
0 DPM. When making these calculations, be sure to convert to the decimal
equivalent of percent (e.g., .9995 to represent 99.95%).
Product quality can be approximated by the average quality level of the
parts, using the formula:
Qp = (Qa)n
where
Qp = Quality level of the product
Qa = Average quality level of parts
n = Number of parts
10.3.1 Example
A product consists of 25 parts that are all 99% good, which some suppliers
might contend is adequate:
Qp = (Qa)n = (.99)25 = .78
This means that only 78% of products will be good because 25 parts are
only 99% good! And this assumes perfect processing quality.
If, in the above example, the parts had half the chance of defects (99.5%),
then the product quality level for 25 parts would be
Qp = (Qa)n = (.995)25 = .88
Design for Quality • 339
Product quality jumped to 88%—a significant change in product quality
just from specifying a higher grade of part.
10.3.2 Effect of Part Count and Quality on Product Quality
Figure 10.2 graphically shows how product quality varies with part quality
and part quantities. The lines are plots of the equation,
Qp = (Qa)n
for varying part quality levels. Note that each line represents twice as
“bad” a part as the one above it.
100%
99.975%
= 250 DPM
90%
99.95%
= 500 DPM
Product Quality Level, Qp (first pass accept rate)
80%
99.9%
= 1000 DPM
70%
60%
99.8%
= 2000 DPM
50%
40%
30%
99.6%
= 4000 DPM
20%
Qp = (Qa)n
10%
0%
0
99.2%
= 8000 DPM
100
200
300
400
500
Number of Parts in Product, n
Plotted lines are for average part quality levels, Qa cited as percent
good and DPM (Defects/Million)
FIGURE 10.2
Quality as a function of part count for average part quality levels.
340 • Design for Manufacturability
Printed circuit boards are built with several hundred components covering the whole range of lines on the graph. All designers should carefully
use these formulas to predict product quality degradation just from the
number of components.
10.3.3 Predictive Quality Model
For products with groups of parts with different quality levels, the formula
would be:
Qp = Qa1n1 · Qa2n2 · Qa3n3 · Qa4n4 . … and so forth
where
Qp = Quality level of the product
Qa1 = Quality level of the first group
n1 = Number of parts in the first group
This formula is an extremely powerful tool that can be used as a
predictive model to estimate product quality based on a parts list, which
may be available early enough to compare several product architectures.
This formula can easily be incorporated into a spreadsheet so that various
“what if” scenarios can be calculated.
It is important to realize that product quality drops exponentially with
increasing part count. Thus, unless part quality levels are very high,
approaching six sigma (about 3 DPM), an excessive number of components
will have an exponential degradation on product quality!
10.3.4 Quality Strategies for Products
Given the aforementioned part quality issues affecting product quality,
the following strategies can be developed.
Maximize (Qa)n by:
1. Maximizing the average part quality level, Qa
2. Minimizing the number of parts, n
3. Optimizing both of the above
Designers should continually think in terms of maximizing (Qa)n. When
doing a trade-off analysis on competing designs, they should choose the
solution with the highest (Qa)n.
Design for Quality • 341
If the product trend is toward more complexity, and thus higher part
count, and the part quality is the same, then the cumulative exponential
effective of part quality will cause the product quality to suffer. Senior
managers may be puzzled why quality for a more complex product drops
when the incoming part quality is the same.
Part of the solution involves continuous improvement4 of part quality
and factory process quality to compensate for this increase in complexity. Another solution is to keep trying to decrease the part count, despite
increasing product complexity. Designers of complex electronics circuitry
have the option of combining dozens of small integrated circuits into a single standard VLSI chip or custom ASIC (application-specific integrated circuit) device with about the same quality level as any of the chips it replaces.
This type of option can make a major improvement in product quality, or,
in some cases, may be the only way to achieve an acceptable level of product quality. Based on the total cost factors presented in Figure 5.5, it can be
seen how widespread use of versatile ASICs can be justified.
10.4 RELIABILITY DESIGN GUIDELINES
Reliability can be defined as quality in the time dimension. A product
with good reliability has freedom from failure in use. The classical definition is the probability that a product will perform satisfactorily for a
specified period of time under a stated set of use conditions. The elements
of reliability include probability, performance, time, and usage conditions.
Here are some guidelines for optimizing reliability by design.
Q16) Simplify the concept. Concept simplicity is the key to inherent
reliability, although this rarely is mentioned in statistically oriented reliability handbooks. Significantly reducing the number of parts, interfaces,
connectors, interactions, and complexity, in general, will greatly improve
product reliability.
Q17) Make reliability a primary design goal. Proactively design in reliability by making sure that reliability is a primary design goal as important as functionality, cost, manufacturability, and all the considerations
discussed in Chapter 3. In older, reactive product development cultures,
reliability issues were dealt with only after problems surfaced in the field.
342 • Design for Manufacturability
Q18) Understand past reliability problems from lessons learned.
Thoroughly understand the root causes of reliability problems on current
and past products from early lessons learned data (Section 3.3) to prevent
new product development from repeating past mistakes. This includes part
selection, design aspects, processing, supplier selection, usage conditions,
and so forth. It may be useful to have manufacturing, reliability, and field
service personnel make presentations to newly formed product development teams, showing what lasted and what caused past reliability problems
that can be avoided in new designs, hopefully with some real-life examples.
Investigate the reliability of similar products, and reliability challenges
in similar environments, to find out how other systems work, or don’t,
over time, and learn the keys to their successes or failures.
Use failure modes and effects analysis (FMEA) to understand reliability
failure modes and their consequences. Then generate strategies and action
plan deliverables to minimize failures and their consequences. FMEA can
also be used as a proactive design tool to help teams identify failure modes
and prevention strategies for a wide range of potential concepts. This may
be the deciding criterion among various product concepts.
Q19) Simulate early. Use simulations and computer models to simulate
and maximize reliability early to optimize early design decisions, which are
much easier and more effective to incorporate than any changes that would
be implemented later based on data from prototypes or results from the field.
Conduct FMEA early to predict most likely failure modes and develop
strategies to minimize failures and their consequences. Do early selective
experiments and accelerated reliability testing early on the most problematic aspects of the design.
Q20) Optimize part selection on the basis of substantiated reliability
data. Select parts on the basis of substantiated reliability data, not just
advertised claims. The lack of substantiated reliability data, which is more
common for new parts, may encourage greater use of proven parts.
Q21) Use proven parts and design features. Use proven standard parts
and design features that have been used successfully before and would be
most likely to provide reliable service. Past performance data can steer
designers quickly to the best parts and design features to help them maximize reliability. A key goal of design teams should be to reuse proven
designs, parts, and modules. Be careful of any reuse that may be less verified and may be below current quality and reliability thresholds.
Design for Quality • 343
As mentioned in Section 3.1, a high percentage of complaints, field failures, recalls, and lawsuits do not involve new features or new technology.
Rather, they involve “boilerplate” functions that should be based on proven
designs, parts, and modules. For instance, in electronics, many problems
arise from the mundane power supply. In the automobile industry, the
most serious problems and consequences involve fuel systems, seat belts,
steering, brakes, suspension, tires, and so forth. These are not the parts that
companies are advertising or customers are clamoring for, which are more
likely to be things like styling, cup holders, stereos, and navigation systems.
Q22) Use proven manufacturing processes that are in control and
have a history of producing reliable parts, so as to avoid the added variables encountered when new processes are introduced. Ironically, some
products cannot utilize existing proven processes because they are not
designed well enough for manufacturability for those specific processes.
Q23) Use precertified modules. Use proven, precertified modules that
can be individually certified. If the product’s architecture was optimized
for this, then it may be possible to consider the product certified if all the
modules were precertified.
Q24) Design to minimize errors with poka-yoke. Design to proactively minimize errors in fabrication, assembly, installation, maintenance,
and repair with poka-yoke, discussed in Sections 10.7 and 10.8.
Q25) Design to minimize degradation during shipping, installation,
or repair. Design products and packaging so that products do not suffer
any damage during shipping. Specify the installation process so that reliability is not degraded by all the steps involved in installation or repair.
Q26) Minimize mechanical electrical connections, especially for environments that are corrosive or subject to shock or vibration and for low-
voltage connections. A common illustration of this problem is the automatic
reflex of shaking a flashlight when it does not come on right away even
though the battery is touching both contacts. Some specific solutions to
avoid low-voltage mechanical connectors:
• Combine circuit boards to eliminate cables and connectors.
• Use a means of connection with the minimum mechanical connections, such as flex cable, which can connect different circuit boards
344 • Design for Manufacturability
with flexible traces (the conductors in circuit boards) that are soldered to components on both circuit boards.
• Minimize use of sockets.
Q27) Eliminate all hand soldering. Hand soldering is the least reliable
way to make electrical connections. The reliability people at Intel’s Systems
Group discovered disturbing data that hand-soldered joints can pass tests
in the factory and fail later in the field. In contrast, automatic soldering of
circuit boards (reflow or wave solder) is about the most refined industrial
process, with plants routinely achieving six sigma quality levels. Hand-
soldered joints can be avoided with three strategies:
1. Design out of the products the need for hand-soldered joints by combining circuit boards, using flex cable, and the proper use of connectors and cables.
2. Conduct a thorough search for auto-solderable components early
and base the design on them. Even if the part cost is slightly higher,
total cost will be lower and product quality will be higher.
3. Design within the DFM guidelines for printed circuit boards so that
component location rule violations will not force components to be
soldered by hand to circuit boards.
Q28) Establish repair limits for circuit boards. Most companies do not
have repair limits on the number of times components can be desoldered
and replaced. Excessive hand soldering can damage the circuit board pads
or holes and possibly adjacent components. Ray Prasad, author of Surface
Mount Technology, recommends a maximum of two repairs to prevent
internal thermal damage to printed circuit boards.5
Q29) Use burn-in wisely. Use burn-in or run-in to induce early failures
until the problem can be isolated. Then use this information to eliminate
the causes of the problems.
10.5 MEASUREMENT OF RELIABILITY
The measure of reliability is the mean time between failures, or
MTBF = 1/λ
where λ = the failure rate
Design for Quality • 345
What this measure means is that, on the average, one failure in operation
can be expected to occur after a period of time equal to the MTBF.
The reliability of a product can be numerically expressed as:
R(t) = e–λt
where t = time.
10.6 RELIABILITY PHASES
There are three phases in which products experience different reliability
behavior: the infant mortality, useful life, and wearout phases, shown in
Figure 10.3. The following lists causes of reliability failures in the infant
mortality and wearout phases. Note that many of these causes can be prevented proactively by optimal design of products and processes.
10.6.1 Infant Mortality Phase
This phase is characterized by early failures due to:
Failure Rate, λ
• Built-in flaws from processing:
• Poor welds or seals
• Cracks in castings
• Poor solder joints
Infant
Mortality
Wearout
Useful life, λ = constant
Time
FIGURE 10.3
Reliability phases.
346 • Design for Manufacturability
• Surface contamination
• Chemical impurities
• Handling or static damage
• Incorrect positioning of parts
• Transportation damage:
• Physical damage to parts
• Shock-sensitive parts overstressed
• Parts loosened during shipping
• Installation and setup errors:
• Factory errors
• Customer errors
10.6.2 Wearout Phase
The wearout phase is when the product failure rate begins to rise from
deterioration. Causes include:
•
•
•
•
•
•
•
Frictional wear
Fatigue
Creep
Corrosion or oxidation
Chemical changes
Insulation breakdown
Shrinkage or cracking in plastics
10.7 POKA-YOKE (MISTAKE-PROOFING)
Poka-yoke is a Japanese concept that originally evolved to prevent mistakes in manufacturing.6 Poka-yoke can be used as a design methodology to mistake-proof the design so parts cannot be assembled wrong or
products manufactured incorrectly. Although these clever design features
are created only once, they go on to prevent mistakes in manufacturing
for the life of the product. The following discussion presents the general
principles of poka-yoke applied to product development. After that, there
are several guidelines to minimize errors.
Design for Quality • 347
With parts standardization, there are fewer types of parts and, thus,
less chance of choosing the wrong part. Symmetrical parts cannot go
in backwards. Nonsymmetrical parts with exaggerated asymmetry will
not be assembled incorrectly or forced into a wrong orientation; this
avoids one of the most mistake-prone parts—one that is almost square.
Nonsymmetrical parts should have polarized connectors or mounts.
If different parts have different installation geometries, then the product can be designed so that the wrong parts cannot be installed, such as
unique shafts with unique diameters, unique gears with unique bores,
unique fasteners or valves with unique threads.
Avoid choosing the wrong part by indicating or presenting only the correct part, and by minimizing the number of part types with standardization, ideally with only one of each type of part at each workstation.
Features can be added to prevent incorrect assembly, such as alignment
pins or tabs, unique geometries and shapes, and markings to indicate correct assembly and aid in inspection. Potentially confusing assembly can
be avoided entirely by conceptual simplification, like combining parts or
eliminating them entirely.
10.8 POKA-YOKE PRINCIPLES
10.8.1 How to Ensure Poka-Yoke by Design
Avoid inserting parts backwards with:
•
•
•
•
Symmetrical parts (Guideline P3)
Exaggerated asymmetry for nonsymmetrical parts (Guideline P4)
Polarized connectors or mounts for nonsymmetrical parts
Adding a hole to a part and a pin to the tooling or mating part to
ensure correct insertion or loading
Avoid choosing the wrong part by:
• Minimizing the number of part types with standardization, ideally
with only one of each type of part at each workstation
• Indicating or presenting only the correct part
348 • Design for Manufacturability
Avoid assembling the part into the wrong position by:
• Unique mounting geometries
• Different hoses with matching fittings
• Unique fasteners for different parts
• Different shafts matching the proper gears
• Adding features to prevent incorrect assembly:
• Alignment pins or tabs
• Unique geometries and shapes
• Markings or templates to:
−− Indicate correct assembly
−− Aid in inspection
Avoid omitting parts when:
• Adjacent parts would not assemble without the missing part
• Printed outlines would show missing parts, wrong parts, and incorrect orientation
• Automatic sensors or scales detect products with missing or extra
pieces
Avoid assembly errors by:
•
•
•
•
Combining parts or eliminating them entirely
Eliminating procedures that depend on operator skill or memory
Generally eliminating choices, decisions, and judgment
Avoiding mistake-prone assembly procedures
Prevent damage by design. Avoid sequence errors by:
•
•
•
•
Designing the assembly process so that sequence doesn’t matter
Features that prevent the wrong sequence from happening
Making the sequence intuitively obvious
Clearly indicating the correct sequence
Avoid timing errors by:
• Designing products without the need for timed processes
• Eliminating operator-timed processes
Design for Quality • 349
• Making all timed operations the same
• Making different timings very different
10.8.2 Solutions to Error Prevention after Design
If error prevention is not addressed in the design, the factory will have
to compensate by hiring more skilled (and more expensive) workers,
training them more, and exercising constant vigilance with procedures
and inspections.
Design happens once. But hiring and training must be repeated
as new people become part of the system. And vigilance must be constant.
10.9 STRATEGY TO DESIGN IN QUALITY
The methodologies of this book can be used to proactively ensure high
quality and reliability by design using the following techniques:
• Understand past quality problems through lessons learned databases, research, and presentations from related project people.
• Obey quality design guidelines Q1 through Q29.
• Consider using quality function deployment (QFD) to define products to capture the voice of the customer (Section 2.11). QFD is one
of the techniques in the collection of tools known as “design for
Six Sigma.”
• Use multifunctional teamwork (Deming’s 9th point) to ensure that
quality is a primary design consideration and that all quality issues
are raised and resolved early, and quality is proactively designed in.
• Perform thorough up-front work to implement all the above early
and avoid significantly greater quality and ramp problems later.
• Simplify the design for inherently high quality and reliability.
• Minimize the exponentially cumulative effect of part quality and
quantity by specifying high-quality parts and simplifying the design
with fewer parts.
• Select the highest quality processing. Automated processing produces better and more consistent quality than manual labor.
350 • Design for Manufacturability
• Raise and resolve issues early by: learning from past quality problems; early research, experiments, and models; generating Plan B
contingency plans; and proactively devising and implementing plans
to resolve all issues early (Section 3.3).
• Optimize tolerances for a robust design using Taguchi Methods™
(Guideline Q12). Robust design is one of the techniques in the collection of tools known as “design for Six Sigma.”
• Choose materials for quality (Deming’s 4th point) not from auctions,
low bidding, or switching suppliers for price.
• Apply poka-yoke principles to product design to prevent mistakes
by design, in addition to concurrently engineering manufacturing
procedures to prevent incorrect manufacture (Section10.7).
• Reuse proven designs, parts, modules, and processes to minimize
risk and ensure quality, especially on critical aspects of the design.
• Rationalize product lines to raise corporate quality by eliminating
the unusual, low-volume products, which usually have the lowest
quality (see Appendix A).
• Implement big picture metrics and compensation to reward actions
that ensure quality and avoid compromising quality with cheap
materials to save cost, chasing cheap labor, or throwing a suboptimal
design over the wall on time.
• Use total cost, including quantifying the cost of quality, as the basis
for all part and processing decisions; all elements of cost of quality
are quantified.
Designing for quality is what gets quality from 5 sigma to 6 sigma.7
Design for Six Sigma (DFSS) is the product development element of the
Six Sigma quality program.8 Six Sigma is a management approach aimed
at eliminating mistakes, rework, and waste. The goal of DFSS is to prevent
defects by designing quality into the product.
Design for Six Sigma supports the DFM quality strategies presented
above by offering in-depth treatments of rigorous computational and
statistics-based methodologies, such as using QFD to capture the voice of
the customer, Taguchi Methods™ to optimize robust parameters and tolerances, the theory of inventive problem solving (TRIZ) to generate ideas,
and FMEA.
Design for Quality • 351
10.10 CUSTOMER SATISFACTION
Designing for quality is a key element of providing customer satisfaction, as is QFD (Section 2.11). The book, Satisfaction: How Every Great
Company Listens to the Voice of the Customer, from J.D. Power, shows
how good customer satisfaction dramatically improves sales, profits, and
shareholder value:
“Garner a reputation for providing great customer satisfaction and you can
charge a price premium that goes straight to the bottom line.”
“Saddle yourself with a reputation for marginal customer satisfaction and
the only way to build market share will be through discounts and other
incentives that will wreak havoc on your bottom line.”9
J.D. Power has correlated customer satisfaction with sales and shareholder value. For automobiles, sales of brands with low customer satisfaction dropped 4% over a 5-year period, whereas high satisfaction resulted
in a 44% rise in sales! Over the same period, companies with a drop in
customer satisfaction experienced a 28% decline in shareholder value,
whereas, for companies with improved satisfaction rankings, shareholder
value rose 52%!10
NOTES
1.
2.
3.
4.
5.
6.
7.
8.
9.
10.
Seth Godin and Chip Conley, Business Rules of Thumb (1987, Warner Books).
Matthew E. May, The Elegant Solution (2007, Free Press).
Lance A. Ealey, Quality by Design: Taguchi Methods and US Industry (1998, ASI Press).
Kiyoshi Suzaki, The New Manufacturing Challenge: Techniques for Continuous
Improvement (1987, Free Press).
Ray P. Prasad, Surface Mount Technology: Principles and Practice (1989, Van Nostrand
Reinhold), p. 547.
Poka-Yoke: Improving Product Quality by Preventing Defects (1989, Productivity
Press/Taylor & Francis); 295 pages with 240 examples.
Subir Chowdhury, “Design for Six Sigma” (2002, Dearborn Trade Publishing).
Ibid.
Chris Denove and J. D. Power, IV, Satisfaction: How Every Great Company Listens to
the Voice of the Customer (2006, Portfolio).
Denove and Power, Satisfaction, Chapter 1, “Show Me the Money.”
Section VI
Implementation
11
Implementing DFM
To paraphrase the punch line of the entertaining IBM commercials, There
is no magic tool to implement DFM—no magic software, no magic shrink-
wrapped solution, no magic trademarked models. To say this in a different
way, you can’t buy DFM.
Nor can companies simply manage their way to great product development. Project management techniques may allow management to track
progress and feel that things are “on schedule,” but these measures could
be counterproductive without an understanding of how products should be
developed, in general, and designed for manufacturability, in particular.
For instance, if intermediate deadlines are set arbitrarily or without knowing the importance of thorough up-front work, they may force engineers
to rush prematurely into part design and miss the greatest opportunities
to simplify concepts, optimize product architecture, and raise and resolve
issues early. The concept/architecture stage is when 60% of cost is committed (Figure 1.1) and is the key to the quickest time to stable production
(Figures 2.1 and 3.1).
Another popular way of managing product development is to “measure
performance,” but that, too, can produce counterproductive results if the
measures are not based on total cost and the time to stable production. If
teams are measured, judged, and evaluated on “cost,” but all that is quantified is part and labor costs, then they may be driven to specify cheap
parts, move production to low-labor-cost areas, and resist standardization, modularity, and off-the-shelf parts because of the false belief that
they will “raise cost” on one project. Similarly, if engineers are measured,
judged, and evaluated on meeting deadlines, then they will just throw it
over the wall on time.
In the world of the popular phases and gates, DFM is usually relegated
to a late step (sometimes focused on checking for DFM!). However, DFM
355
356 • Design for Manufacturability
is not a step in a phase—it is the way engineers should be designing for manufacturability throughout the design process. Good DFM does not come
from turning the proverbial crank on some tool, model, or procedure.
Somewhere in all those grandiose models, a team has to creatively design
for manufacturability. Good DFM does not focus on hitting numbers that
are poorly defined; it focuses on actually designing products for the lowest
total cost, the best quality, and the fastest time to stable production.
Successful DFM comes from a combination of education, teamwork,
diversity, leadership, commitment, creativity, big picture metrics, understanding customer needs, understanding manufacturing processes, and
management support and encouragement of all of that. The rest of this
chapter shows how to successfully implement DFM and concurrent engineering (hereafter denoted together by “DFM”).
11.1 CHANGE
Before implementing any changes, companies need to understand the
need to change and the benefits of changing. At this point, it might be a
good idea to read Section 1.1 again about the consequences of not having products designed for manufacturability and the survey comments
describing what it is like to work in a company that doesn’t practice DFM.
Identify how many of these points are routinely experienced. But before
changes can begin, the most common objections must be overcome.
• “Things aren’t so bad. There is no need to change.” This head-in-
the-sand approach ignores many realities about changes in markets,
customers, technology, workers, competition, and other changing
trends. The largest study ever conducted on business failures found
that: “There is one blind spot that appears somewhere near the center
of almost every major business disaster: a seriously inaccurate perception of reality among executives.”1
Dr. Deming said that companies are reluctant to change unless
there is a crisis. However, deferring change until a crisis hits is a poor
strategy, because meaningful change will be much more difficult to
implement in the face of dwindling sales, falling stock prices, shrinking market share, more demanding customers, threatening competition, changing regulation, negative publicity, credit downgrades, or
Implementing DFM • 357
quality problems flaring up. “Crisis management” usually tries to
bandaid the immediate symptoms rather than identify root causes
and implement systematic solutions. Product development can
be either the cause or the solution to many of these problems. But
because product development is a long-term endeavor, companies in
crises will have to live with the shortcomings of product designs until
they can be redesigned. To prevent such a predicament, companies
should start now to develop good products and, as necessary, change
the ways products are developed, built, sourced, and distributed.
• “I don’t understand it.” Although no one would admit it, many
people don’t understand or comprehend the challenges going on in
product development. And if they don’t understand the problems,
they probably won’t understand solutions like DFM, standardization, quality assurance, and designing products for Lean Production,
build-to-order, and total cost accounting.
• “We’re already doing it.” A combination of the first two objections
would be believing that the company is already implementing a proposed solution. Although one company confidently proclaims, “We
practice concurrent engineering,” upon further investigation, it is
discovered that what they mean is that a manufacturing engineer
was invited to the design release review!
• “The whole industry does it.” Many challenging practices occur
throughout an entire industry, such as the need to calibrate all products. The scenarios are as follows: If avoidable, significant competitive advantage goes to whoever can eliminate it, especially if that
improves cost, quality, and delivery. If truly unavoidable, competitive advantage goes to who does it best: the fastest, the most consistent, and/or at the least cost.
• “We’ve always done it this way.” Even if some vague need to change
is perceived, many companies run into the brick wall of historical
inertia.
Consider the following slogan:
If you do what you have always done, you will get what you always got.
In stable markets without competition, the status quo may be hard to
knock, but that is rare these days. Usually, companies have many challenges related to profits, sales, cost, changing markets, advancing technologies, and product developments that need to be better and faster.
358 • Design for Manufacturability
At Honda, managers are encouraged to respect sound theories but
not hesitate to challenge old habits with new ideas. Company literature encourages proceeding with “ambition and youthfulness, seeking out challenges with fresh, open-minded passion for learning.”2
• “We’ve never done it that way.” Change is often resisted because
the solutions are new. This can be overcome by understanding new
ways and learning how to implement them through books, articles,
classes, seminars, and bringing in outside experts to help. Many
companies (see the list in the Preface) have circulated multiple copies of the earlier editions of this book to familiarize decision makers
with solutions.
• “We’ve tried it; didn’t work.” Specific solutions may be shot down
because of perceptions about earlier unsuccessful experiences that
may have been:
• Not enough investment in research money, time, and talent
• Done at the part level, not at the system level; in fact, innovation
may affect or even determine product architecture
• Attempted in an existing product as a change order
• An inability to justify the proposal without quantified overhead
costs
• Using inadequate materials, samples, resources, or vendors
• Inadequately searching for off-the-shelf solutions, which should
be a serious search effort, for reasons presented in Section 5.19
• Not having enough support or consensus
• The wrong solution, or a good solution applied in the wrong way
• Not focused on customer needs, but rather on “a solution looking
for a problem”
• The victim of undocumented tales about previous “failures”
(management by folklore) without understanding the facts, which
can temporarily stymie inside innovators or outside consultants
in the short term—until the facts are revealed
A corollary of this objection is that someone else tried it and it didn’t
work. The main shortcoming of this objection is the verb “tried.”
Real change doesn’t come from trying; it comes from doing.
• “We don’t have time or resources.” The companies that use this
excuse are probably spending most of their engineers’ time and
efforts correcting deficiencies in previous products, as shown in the
top graph in Figure 2.1 and the top bar in Figure 3.1.
Implementing DFM • 359
In the distant past, many people believed that quality would cost
more, until Philip Crosby wrote the book, Quality Is Free, in which
he showed that the returns from better quality would more than
pay back the effort to achieve quality.3 Similarly, the “cost” of implementing concurrent engineering and DFM will be more than paid
back by better products, with cost designed out, quality designed in,
and rapid ramps into production, as shown in the lower graph in
Figure 2.1 and the lower bar in Figure 3.1.
• “We’ll just change the goals.” As pointed out in Section 1.6 on focus,
real change cannot be achieved simply by applying more pressure or
more ambitious goals. Many companies ignore the truism:
Trying to get much better results by doing things the same way is the definition of insanity.4
• “Do something. Anything.” If decision makers realize some kind
of change is in order but don’t understand the problems or the solutions, they may jump at whatever appears to be a solution. This could
happen at staff meetings (when members present pet projects) or at a
slick sales presentation for some “cure all” shrink-wrapped solution.
Many companies think they have responded to change by bringing
in some packaged “program” or “throwing software at it.”
The degree of the challenge dictates the degree of the changes
needed. Ambitious goals may require some fundamentally different
ways of doing things.
Ambitious results require ambitious changes.
11.1.1 Change at Leading Companies
As shown in the following examples, leading companies have embraced
change as the way forward. As stated by Sakichi Toyoda (1867–1930),
patriarch of the Toyota dynasty, “Although new behaviors always provoke opposition, those who are complacent will be left behind and
ultimately defeated.”5
At Medtronic, chairman and CEO Bill George says, “The entire organization is now embracing change and innovation as a way of life and
as a competitive advantage. These innovations have been a key factor in
changing Medtronic’s image from the pacemaker company of the 1980s to
360 • Design for Manufacturability
the innovative, high-growth leader in medical technology for the twenty-
first century.”6
And at Xomed, “upper management stressed culture change—no swift
transformation, but a gradual increase in empowerment to those doing
the work, making change fun, not a threat.”7
11.2 PRELIMINARY INVESTIGATIONS
11.2.1 Conduct Surveys
The first implementation step should be to understand how well the
current product development systems works—or understand its shortcomings. Conduct anonymous surveys of everyone in product development, asking questions such as:
• How do you rate our products for manufacturability compared to
competitors, the industry, and the best know in any industry?
• What are good examples of DFM?
• What are inadequate examples of DFM?
• What are the consequences of inadequate DFM?
• What are the hurdles to good DFM?
• What are the opportunities for good DFM?
The author has been conducting this poll for 15 years before his in-house
seminars8 and has found that this information is a valuable starting point
for implementation—hearing candid comments about the product development culture and its performance. This information is also very useful for customizing training. Further, presenting the results is a good way
to kick off DFM seminars and to get people discussing the issues raised.
Survey comments have a special impact because they refer to actual
company products and procedures. Some colorful survey comments are
presented in Section 1.1.2.
Figure 11.1 is a summary of the top eight responses regarding consequences, hurdles, and opportunities with regard to DFM, gleaned from
650 responses from 10 companies in several industries: two consumer
products; two OEM suppliers; two scientific instruments; two processing
equipment; and two aerospace.
Implementing DFM • 361
Consequences
Hurdles
Opportunities
Quality, 33%
Assembly hard, 18%
Cost problems, 12%
Time/ramps, 8%
Changes, 7%
Service/repair, 5%
Inflexible, 4%
Not competitive, 4%
Time, 19%
Lack of teamwork, 17%
Attitudes, 12%
Cultural, 12%
Communications, 7%
Resist change, 5%
Changes, 5%
Discipline, 4%
CE teams, 23%
Methodology, 13%
General, 9%
Vendor relations, 8%
Quality, 6%
Cultural changes, 6%
Resources/tools, 5%
Profit/success, 5%
FIGURE 11.1
Pre-seminar survey results.
11.2.2 Estimate Improvements from DFM
Next, summarize measures of corporate “bottom line” performance, such
as profits, revenue, growth, and stock price. Then identify the drivers for
those measures; in other words, the activities and programs that would
drive their achievement (e.g., cost reduction, shorter time-to-market, better quality, and better customer satisfaction).
Ascertain how well the product development process is performing and
what management’s goals are for improvement. Estimate how corporate
performance could be improved by DFM.
To estimate cost reduction, look at all the cost reduction techniques of
Chapter 6 and estimate how much could be saved with DFM in relevant
categories such as assembly, quality, change orders, inventory, material
overhead, and so forth. Scrutinize existing products to see how excess
costs may have been committed in the concept/architecture phase in the
same way the type of data in Figure 1.1 was generated.9
Ask assembly supervisors how much labor cost and assembly steps could
be saved by better DFM. Ask the manager of purchasing how much material overhead could be saved if new products were predominately designed
around standard parts. Talk to operations people to find out how designing products for Lean environments could reduce setup costs and improve
flow and machine tool utilization. Find out how much of the engineering
and manufacturing budgets are spent on firefighting and change orders.
Estimate how much of that cost could be saved by better design for manufacturability. Analyze completed feedback forms (see Appendix C).
To estimate quality gains, ascertain the main causes of quality problems and recommend design solutions, such as better parts, fewer parts
362 • Design for Manufacturability
(as shown in Figure 10.3), mistake-proofing, optimal tolerances, vendor
partnerships, and concurrent process design and selection.
To estimate time-to-market gains, analyze past product development
projects for their real time-to-market after all the revisions, iterations, and
ramp-up in Figure 3.1, and after targets have been reached for volume,
quality, and productivity, as graphed in Figure 2.1.
Here is what HP achieved when it implemented concurrent engineering
for a complex scientific instrument, compared to the pre-DFM product:
The performance was three times better, the price was 70% of the preDFM product, and the reliability was 3.4 times greater. The number of
parts was reduced to one-third and the floor space needed was two-thirds.
It took a quarter of the time to develop and the cost was one-half. So it
should be understandable that sales were 4.4 times and the profit tripled.
11.2.3 Get Management Buy-In
To implement DFM formally, structure and propose a DFM program.
Present the program to management with the intent of getting management support and buy-in for the program. Use the above estimates of
improvements and any other qualitative benefits. Such a program may
include a DFM implementation task force that would carry out the steps
recommended herein.
Less formal DFM implementations can be started at any level; for
instance, by individuals or product development teams practicing the
DFM principles presented in this book (Section 11.6) or in DFM training. Early successes can be leveraged for other projects and more formal programs.
11.3 DFM TRAINING
11.3.1 Need for DFM Training
Companies need to provide DFM training because DFM is taught in only
a few colleges.10 Engineers are almost exclusively taught to design for functionality, and engineering tools primarily help engineers design for
functionality. And years of work may have turned this focus into a habit.
Implementing DFM • 363
Therefore, product designers need to be taught to design for manufacturability. Further, besides the obvious learning benefits, offering DFM
training can be a catalyst to change behavior. Many companies use
DFM training to kick off DFM programs. The savings from the DFM benefits (Section 1.13) will far exceed any training expenses.
11.3.2 Don’t Do DFM Training “On the Cheap”
Don’t try to do DFM training “on the cheap,” because you only get one
chance at DFM training. If the training is bad, it will give the message,
or even confirm preconceived notions, that DFM is useless and therefore
engineers should continue to design only for function. If that happens, it
will be hard to get engineers to attend a better class later, not to mention
all the opportunities lost in the intervening time. Keep in mind that the
biggest expense of corporate training is the value of attendees’ time, so use
that time wisely and provide the best training possible.
11.3.3 Customize Training to Products
Schedule training for all product development personnel in DFM principles. DFM training should be customized to the company’s product line
and culture. Beware of bringing in training that is based only on generic
principles or “canned” presentations by staff trainers. Don’t limit training to only procedures or project management techniques. Be suspicious
of training that may really be based on software or some other tool that the
“trainers” might just happen to be selling. The danger of depending on a
tool is that managers and engineers may think product development goals
will be achieved by the tool, and then they think that they may not need
to implement real solutions, such as the concurrent engineering and DFM
principles recommended by this book.
Ask prospective trainers how much they will be customizing the material, on what will they base such customization (e.g., surveys or interviews), and how much relevant experience the actual presenter has with
your type of products—not just having similar products on the client
list of the training company. Beware of high-powered sales presentations
by experienced people, who will send less experienced people to do the
actual training.
364 • Design for Manufacturability
11.3.4 Trainer Qualifications
DFM training should be presented by someone thoroughly familiar
with DFM principles. The trainer should have enough experience to
answer all questions and engage the audience in discussions on how to
apply these principles in your company, and enough credibility to offer
better alternatives to the status quo. Experience in both design and manufacture will enable the trainer to speak from the perspective of designers
(with personal design examples) and manufacturing (relating personal
experiences with manufacturable and unmanufacturable designs).
DFM training by in-house personnel is a possibility, but only if the
trainer thoroughly understands DFM principles (which may require some
study), puts in enough effort to prepare the training, and has enough
experience and facilitation skills to answer questions, encourage discussions, and convey all the important principles. This book could be used as
a textbook for such a course.
With in-house trainers, position and title can be an asset or a liability.
DFM training from manufacturing people might appear to be “preachy,”
whereas trainers from design engineering might not fully understand
manufacturability issues. Senior managers would carry more authority
than “worker bees,” but they usually don’t have the time or bandwidth to
adequately prepare and present the training. Further, inside trainers may
not have as much credibility as outside experts. In fact, a common experience of outside trainers is the appreciation from insiders who have been
trying to emphasize similar points, but with little success, because they
lack the outside expert’s credibility and experience.
11.3.5 DFM Training Agenda
An excellent way to kick off a DFM seminar is to start with some rousing
opening comments by the president, vice president of engineering, or division general manager. These comments are important to convey management support and motivate everyone to learn the principles and then be
expected to put them into practice. Motivation emphases can range from
stressing opportunities to “we gotta do this for survival.”
As an example, one president kicked off a DFM seminar by relating
the experience of shipping a million dollar processing machine to a
semiconductor fabrication plant, where no one could understand why it
wouldn’t work, until they figured out that a light-sensitive enclosure was
Implementing DFM • 365
not sealed properly because someone grabbed the wrong screw from a
proliferated selection.
The kick-off executive should also introduce the trainer along with
a brief bio-sketch and then hopefully stay for at least the high-level topics,
which roughly correspond to the first three chapters of this book in addition to Sections 6.2 and 11.5.
An effective opening session will involve reviewing and discussing the
results of the survey, described above, which says in the attendees’ own
words what is wrong with the current product development culture and
details the opportunities for improvement.
It is recommended that the training start with the big picture topics, so
that senior managers can join the class to attend the first morning session,
which focuses on the importance and implementation of:
• Product line planning (Section 2.3), prioritizing, and rationalization
(Appendix A)
• Clear product definition to satisfy the voice of the customer
(Section 2.11)
• Thorough optimization of the crucial concept/architecture stage,
which determines 60% of a product’s cumulative lifetime cost
(Sections 1.3, 3.2, and 3.3)
• Cutting the real time-to-market in half through up-front optimization and design work (Sections 1.5, 2.1, and 3.2)
• Resource availability to ensure the formation of complete teams,
with all specializations active early (Sections 2.2 and 3.3)
• Preselection of vendors/partners who can help develop products
(Section 2.6)
• An effective team leader (Section 2.7)
• Ensuring teams have the proper focus (Section 1.6)
• Raising and resolving issues early (Section 3.3.5)
• Decision making, costing, product pricing, and performance measures based on total cost accounting (Chapter 7)
The remaining sessions should teach the following to engineers and
mid-level managers and senior managers who choose to remain:
• Motivation and overcoming resistance for DFM (Sections 1.7 and 11.1)
• Understanding manufacturing through experience and teamwork
(Section 11.6)
366 • Design for Manufacturability
• Optimizing product design by satisfying all design considerations
(Section 3.5)
• Avoiding arbitrary decisions (Section 1.8)
• Creative product development (Section 3.6) and brainstorming
(Section 3.7)
• Do it right the first time (Section 1.11) to minimize the costs and
delays of changes (Section 6.8)
• Considering off-the-shelf parts early (Section 5.18)
• Designing around standard parts (Chapter 5)
• Designing for Lean, build-to-order, and mass customization (Chapter 4)
• Follow appropriate design guidelines for products (Chapter 8) and
parts (Chapter 9)
• Design in quality and reliability (Chapter 10) to eliminate the cost of
quality (Section 6.9)
• Total cost minimization (Chapter 6) and measurement (Chapter 7)
• Change (Section 11.1)
• DFM implementation (Chapter 11)
• The importance and benefits of DFM (Sections 1.13 and 1.14)
As an example, the author’s baseline agenda for his in-house DFM seminars is shown in Appendix D.4.
11.3.6 “What Happens Next?”
As the final event in the training, poll the audience and ask, “What should
happen next?” The answers can be very helpful for formulating implementation strategies. For example, after in-house DFM seminars, this author
lists all the answers on several flip charts and has the audience vote for
what they think is the most important. The easiest way to arrange for voting is to issue each attendee eight votes, in the form of round sticky-back
dots, which everyone can affix to the zones for each point (the rules are
only one vote per point). Experience has shown that this is an invigorating way to wrap up the seminar, because most people hang around to
see the voting results unfold. The DFM “champion” should then prioritize the results and distribute to all attendees, management, and any DFM
task forces.
The following is a summary of the top 11 responses, representing 80% of
3,622 votes cast over the last few years of the author’s seminars:
Implementing DFM • 367
556
355
323
266
252
207
206
203
181
159
150
Teamwork and thorough up-front work
Standardization
Total cost
Product portfolio planning
Updating product development processes and procedures
Lessons learned
Vendors and partnerships
Resource availability
Management buy-in and support
Product definition, product requirements, and QFD
Training and management education
Many of these desired changes will require some degree of stopping bad
habits, which will be discussed in Section 11.5.
11.3.7 Training Attendance
Attendance for DFM training should include everyone involved in product development, so that it will not just be “preaching to the choir” of
manufacturing engineers or “DFM engineers” who, after training, would
attend design team meetings in the hopes of steering the team to more
manufacturable designs. That goes against the main principle of this book,
which is that DFM is designed into the product by the entire team. Thus, all
team members need to be trained in DFM.
Nor should DFM training be limited to engineers. Managers should
attend with the engineers. Senior managers should either attend an
“executive education” session or attend the first half-day of the seminar, which focuses on higher level topics, as shown in the first session in
Appendix D. Lack of management attendance creates two negative consequences: (1) management doesn’t learn their critical role in ensuring DFM
success, and, worse, (2) attendees interpret lack of attendance as lack of
management support.
DFM training benefits from a diverse audience, beyond the usual design
engineers and manufacturing engineers, so include purchasing agents,
materials managers, vendors, and key people from quality, field service,
and so forth.
The most important attendees would be current and potential team
leaders, who will need to understand all the DFM principles, know their
role as team leader (Section 2.7), campaign for resources (Section 2.2), insist
368 • Design for Manufacturability
on timelines that encourage thorough up-front work (Section 3.2), measure cost as total cost (Chapter 7), fight against counterproductive policies
(Section 11.5), and, as necessary, set up microclimates (Section 11.7.2) for
their teams until DFM principles are implemented company-wide.
11.4 DFM TASK FORCE
DFM can be implemented at many levels, including individual actions,
product development teams, and implementation task forces. A new product development effort can apply new DFM principles from the beginning
(Section 11.6). For the first DFM application, choose an appropriate product, consistent with product portfolio planning. The product should have
many open opportunities but not be an overwhelming challenge.
A more widespread implementation strategy would be to create a DFM
implementation task force, with the charter to implement DFM in general,
and specifically to:
• Form the task force with representatives from appropriate engineering groups, manufacturing engineering, supply chain management,
quality, management, and so forth. Multidivisional companies may
have a joint task force or corporate headquarters efforts. If the members are well respected, especially the leader, the results will be more
likely to be endorsed by management and followed by design teams.
• Summarize how well the current product development culture is
working, based on the pre-seminar survey and other investigations.
• Estimate improvements that will come from implementing DFM
(Section 11.2.2).
• Get management buy-in, support, and resources to implement DFM.
• Arrange DFM training; prioritize and circulate the post-seminar
voting (Section 11.3.6).
• As a team is just beginning to develop each product (after DFM training), arrange a product-specific workshop,11 led by an experienced
facilitator, to implement DFM on that specific product development
project. This is an effective way to get a new product development project “off on the right foot” and ensure that the team will design in
manufacturability, low-cost, flexibility, quality, and reliability. The
Implementing DFM • 369
•
•
•
•
agenda would consist of a series of planned brainstorming sessions
to encourage the team to explore many ways to implement the DFM
principles. These exercises themselves would be the start of many
actual tasks, which would be continued after the workshop.
Enhance or implement the development of vendor partnerships
ahead of time so that vendors will be willing to participate on product development teams and help the team design the parts to be
made in the vendors’ shops.
For product development methodologies and processes, decide what
to keep, what to modify, what to discard, and what to add, using the
principles of this book and the DFM training.
Compile relevant DFM guidelines for all relevant processes. A
starting point can be the 165 general design guidelines presented
in Chapters 8, 9, and 10, which are listed without discussion in
Appendix B.
Convert design rules and guidelines into checklists, if desired.
Checklists can remind design teams of all the things that need to
be done at various stages of the design process. Checklists also provide a quantitative way to measure compliance and rate products
for manufacturability, part count, and utilization of standard parts.
Checklists can also ensure and monitor that rules are not broken
and, if so, that proper exception procedures are followed.
However, care must be taken not to let checklists become the primary
focus of the product development process. Quantitative tools, such as project management software and checklists, can easily become the product
development process and draw attention away from “softer” qualitative
aspects, such as simplifying concepts and optimizing product architecture
(Chapters 1, 2, and 3).
11.5 STOP COUNTERPRODUCTIVE POLICIES
In a DFM seminar, someone once asked how long it would take to go from
the primitive typical timeline to the more advanced concurrent engineering
timeline in Figure 3.1. The short answer is, “How long will it take to stop
the bad habits?”
370 • Design for Manufacturability
Half the challenge to implement new methodologies may be getting rid
of existing counterproductive policies. For product development, here are
some of the worst, with corrective actions cited by section:
• Don’t bite off more than engineering can chew when planning product portfolios, as Motorola learned (Section 2.2.3). Don’t develop
products for all markets against all competitors. Prioritize the new
product development portfolio, as discussed in Sections 2.2.1–2.2.5.
Be sure to hire enough resources when the portfolio must expand.
• Don’t allow, or, worse, encourage, the sales force to take all orders
or accept all customizations. Instead, develop rational strategies to
accept only the most profitable orders, as discussed in Sections 2.2.5–
2.2.8. This will avoid polluting operations with low-volume, hard-to-
build products that drain resources away from product development
and other improvement programs. Rationalize product lines (see
Appendix A).
• Don’t “manage” product development to death with arbitrary early
intermediate deadlines that compromise the critical up-front work
(Section 3.2) just for the illusion of “early progress.”
• Don’t thwart concurrent engineering teamwork by underfunding
operations resources that help new product development, most typically manufacturing engineers, to keep overhead costs down. The
triple irony is that this prevents MEs from helping teams design
products (Section 2.5), then the products will be hard to launch,
which will not only raise costs but also reduce even further the ME
support available for other new product developments, thus further
reinforcing a downward spiral. A fourth irony is that the overhead
cost argument goes away (as recommended in Section 2.2) when
product development support is charged to the development project
and ultimately results in a net savings.
• Don’t quantify only labor and part cost and then allocate (average)
all other cost (overhead) over all products, good or bad (Chapter 7).
• Don’t move manufacturing offshore. Concurrent engineering is
difficult to practice when there are no manufacturing people around
with whom to be “concurrent.” In many offshoring situations, people in engineering and manufacturing are not even working at
the same time. For more, see Section 2.8 (co-location), Section 4.8
(outsourcing), and the articles on outsourcing12 and offshoring13 at
www.HalfCostProducts.com.
Implementing DFM • 371
• Don’t try to take cost out after the product is designed. It is a difficult
task and is a waste of resources, as shown in Section 6.1.
• Don’t go for the low bidder on custom parts, which precludes vendor
partnerships and, thus, prevents those vendors from helping the
company design the parts, for reasons presented in Section 2.6.
As pointed out in Section 6.22, companies that practice the last three
bullets (off-shoring, cost reduction after design, and low bidding) will have
to devote a high percentage of product development resources to: make
change orders to try to implement DFM (because it couldn’t be done with
concurrent engineering); try to take cost out after the product is designed,
with change orders; convert documentation for outsourcing; get outsourcers up to speed; deal with quality and delivery problems; and so forth.
In his travels, the author has encountered several companies that spend
two-thirds of product development resources on the last three activities
(off-shoring, cost reduction after design, and low bidding), which really
puts their future in doubt if that future depends on new product development. Ironically, these attempts thwart six of the eight half-cost strategies;
see www.HalfCostProducts.com/offshore_manufacturing.htm.14
11.6 COMPANY IMPLEMENTATION
These are actions that the company needs to take to transform product development to deliver the best results in the least time for the smallest development budget.
11.6.1 Optimize NPD Teams
Ensure resources are available to form complete teams early, with the right
mix of talent, throughout the duration of each project. Selectively hire to
provide the missing resources, as discussed in Section 2.2.15. Plan the
product portfolio for the maximum return from available resources.
Rationalize away unusual, oddball products or options that drain resources
away from NPD. Establish sales and marketing policies to prioritize sales
by profitability, not “take all orders” and fill all markets. Outsource legacy
products and spare parts production that are not compatible with operations and supply chain management.
372 • Design for Manufacturability
Correct critical resource shortages and deficiencies in multifunctional
teams by freeing them from activities such as building fire drill legacy
products and spare parts, building money-losing custom products, and
trying to do cost reduction by change order on existing products. Avoid
all other distractions from product development.
Encourage thorough up-front work, with enough resources to form complete teams early, and timelines structured to encourage learning lessons,
resolving issues early, simplifying concepts, and optimizing architecture,
which is the best way to ensure the lowest total cost and the fastest time to
stable production or customer acceptance.
Co-locate engineering and manufacturing for the best concurrent engineering interactions, which can save more money than distant outsourcing and much more than offshoring, for reasons presented in Sections 4.8.
Focus cost efforts on new product development, not “cost reduction” after
the design is cast in concrete and hard to change.
Encourage vendor partnerships so that vendors (that make custom parts)
are early and active participants on design teams, for the best cost, quality,
and time-to-market.
Do everything to ensure the success of the first project, as discussed in
Section 11.7.3.
11.6.2 Optimize NPD Infrastructure
Support the integration of DFM and concurrent engineering principles into
the product development process and organize and support other free-
standing programs; for instance, to standardize parts, properly capture
the voice of the customer, implement lessons learned databases, and quantify total cost.
Hire and/or develop great team leaders and team members with the right
balance of skills, talent, and experience, as discussed in Section 2.7.
Make available the right tools and training for design, model building,
prototyping, operations, and information technology.
Provide project rooms to encourage frequent, on-demand meetings and
maximize team efficiency in achieving project goals at the least cost in the
least time. Remember, the business model should determine facilities planning, not the other way around.
Quantify all costs, including overhead, and base all cost decisions and
pricing on total cost to: base portfolio decisions on total cost projections;
ensure that costs of custom configurations are quantified and staffing is
Implementing DFM • 373
paid for by customers or investments; make the best cost decisions for
the lowest total cost; encourage behavior that continues to minimize
cost; eliminate cross-subsidies; base pricing on total cost; and ensure that
better-designed products are not penalized by having to pay the loser tax
to subsidize less-manufacturable products.
Implement standardization as a company effort so that: design teams
can design products around standard products; blanket better-than substitutions can be made on existing products; and expensive parts and
subassemblies can be upgraded on existing products where change orders
are justified.
Establish incentives that support all of the above; eliminate incentives
that thwart the above.
11.6.3 Incorporating DFM into the NPD Process
Incorporate DFM and concurrent engineering principles into the company
product development process. Figure 11.2 shows the typical product “phase-
gate” process, with the product design phase enlarged. Some steps will
shift to an earlier point in the process, such as the typical late step called
“check for DFM,” wiring, and off-the-shelf parts which are points on the
far right ends of the long horizontal arrows in Figure 11.2. New steps and
deliverables may need to be added, such as lessons learned, raising and
New steps and deliverables added
Completion moved up
Early phases lengthen; later phases shorten
Some steps move earlier
Product Design Phase
Typical Product Development Process
FIGURE 11.2
Incorporating DFM into the NPD process.
374 • Design for Manufacturability
resolving issues, and the other up-front work and design strategies discussed in Chapter 3. The early steps will use a higher proportion of time
and the end of the timeline is compressed, as illustrated in Figure 3.1.
11.7 TEAM IMPLEMENTATION
Each team should develop products according to the principles of this book,
even if they have not yet been implemented company-wide. Regardless of
the level of implementation, be sure to do the following*:
• Get lessons learned from databases, investigations, or presentations.
• Hold discussions to thoroughly raise and resolve all issues early.
• Ensure availability of all specialties early. The team leader may have
to lobby for these.
• Push back on team member distractions and resource drains.
• Ensure access and availability for meaningful contributions from
manufacturing, purchasing, quality, service, etc.
• Ensure enough time for thorough up-front work; push back on early
deadlines as necessary.
• Secure concurrence for setting up vendor partnerships.
• Work with purchasing to arrange specific vendor partnerships.
• Find space for a dedicated project room (Obeya).
• Make all decisions based on total cost data; if not available:
• Use total cost thinking, seeking exceptions to metrics if the metrics (cost, profit, etc.) are not based on total cost.
• Campaign for relevant overhead allocations.
• Focus on minimizing cost by design; resist pressures to divert
resources away from this to less effective or counterproductive cost
reduction attempts (offshoring, bidding, cost reduction after design,
and others discussed in Section 11.5).
*
When these are not automatically forthcoming: (1) Summarize principles and justifications from
the seminars, books, articles, and experiences, both within and outside the company. (2) If necessary, use the following argument: “The only way we can achieve the goals of this project is for us to
have _____________ (fill in the blank).” (3) If what is needed is still not forthcoming, say: “OK,
let’s talk about how to scale back the project goals” (deadlines, functionality, feature sets, and so
forth).” (4) If still not forthcoming, say: “Then let’s wait until a time when the company can support
this development.”
Implementing DFM • 375
11.7.1 Importance for Challenging Projects
For projects that are important, pivotal, silver bullet, or challenging, the
team must:
• Practice all these DFM and concurrent engineering principles.
• Avoid habits, traditions, and policies that may stand in the way (see
Section 11.5).
• Create an environment where advanced product development can
thrive, with:
• All the needed specialties present and active early
• Members selected on the basis of talent, mix, availability, and
receptivity to new product development methodologies; slow
adopters may have to wait for subsequent projects
• A good product definition and stable product requirements documents, not subject to changes
• Its own dedicated project room; fortunately, the first project has
to find only one room
• A corporate sponsor, as discussed in Section 2.7.3
11.7.2 Microclimates
Even before change is implemented company-wide, these principles can
be implemented right away if a project creates its own microclimate. In the
extreme, a “skunkworks”-type project can create its own culture, which can
move quickly, eliminate bad habits, and bypass cumbersome constraints.
A microclimate project can even bypass or modify entrenched corporate policies (low bidding, counterproductive sourcing pressures, cost
reduction past the point of diminishing return) by seeking individual
exceptions “for the good of the project.” After a DFM seminar at a company that engaged in many of the counterproductive activities listed in
Section 11.5, attendees started an initiative called “DFM vs. Policy.”
11.7.3 Ensuring Success for the First Team Concurrent
Engineering Project
The first time DFM principles can have a major impact is on the next
product development project, without waiting for new practices to be
formally incorporated into company procedures. The company should
376 • Design for Manufacturability
do everything possible to ensure success for the first concurrent engineering project by “stacking the deck” or giving it “silver bullet” status to
make sure that the following principles of this chapter are implemented
by the team:
• The team is truly multifunctional and has all the needed specialties
present and active early.
• Team members are selected on the basis of talent, mix, availability,
and receptivity to new product development methodologies. Slow
adopters may have to wait for subsequent projects.
• Team members are protected from being sucked away into emergencies outside the project.
• The team has a great team leader, with the traits described previously.
• The team is able to apply all the principles of this book, especially the
right proportion of time for thorough up-front work.
• The team and team leader are empowered to implement these principles, even if not yet incorporated into company procedures.
• The project has a good product definition and stable product requirements documents (not subject to changes).
• The team has its own dedicated project room. Fortunately, the first
project has to find only one room.
• The team has all the tools it needs when it needs them.
• Decisions and overhead charges are based on total cost. If not implemented yet, decisions should be made on the basis of total cost
thinking, and overhead costs would have to be manually computed to
avoid paying the overhead charges of less manufacturable products.
• The team has a corporate sponsor to help the team overcome obstacles, cut through red tape, and streamline reporting to management
by avoiding the hours spent preparing presentations and the calendar delays to schedule formal reviews to management.
11.8 INDIVIDUAL IMPLEMENTATION
There are many things that individual engineers can do before DFM is
implemented company-wide:
Implementing DFM • 377
• Enthusiastically embrace new NPD principles, especially working
well in multifunctional teams.
• Cooperatively contribute to all team activities, especially discussing
issues and brainstorming.
• Be receptive to recommendations from other team members; proactively seek dialogue with others to optimize your work and the
project as a whole.
• Volunteer to work on or lead innovative endeavors.
• Implement whatever methodologies you can personally to improve
manufacturability within your sphere of influence.
• Keep thinking about how to optimize the product, not just your parts.
• Work interactively with other team members on whatever relates to
your work or how your work affects theirs.
• Initiate dialogue with manufacturing, purchasing, quality, service,
and others early on each design decision that affects manufacturability.
• Concurrently develop tooling, manufacturing, and supply chain
strategies for your parts.
• Remember the messages of this book as you work your way up and
gain more influence.
Either individuals or their teams can take the initiative on the following:
• Use feedback forms to understand the manufacturability of your
products (see Appendix C for forms to use with your plant, your vendors, and field service).
• Interact frequently with people in manufacturing, purchasing, quality, and service on an ongoing basis.
• Frequently observe manufacturing and vendors’ operations. Taiichi
Ohno, the father of the Toyota Production System, drew a circle on
the factory floor (the “Ohno circle”) and made people stand in it
all day to watch and question the process. His thinking was that
new thoughts and ideas come from observing and understanding
the processes.15
• Arrange shop demonstrations at your plant or at your vendors, who
would undoubtedly welcome the opportunity to show design engineers
how various design practices make it easier or harder to make parts.
• Learn the trades that build your parts.
378 • Design for Manufacturability
11.9 DFM FOR STUDENTS AND JOB SEEKERS
The ability to design products for manufacturability is a skill potential
employers will value. Be sure to mention your knowledge and experience
in the following areas on your résumé and in job interviews.
Books. Read this book thoroughly, along with others listed at the end of
each chapter and the “Books Cited” section of Appendix D on resources.
The best company-based book is The Toyota Product Development System,16
which corresponds well to the principles of this book. The most important
chapters of the Toyota Product Development book are Chapter 4 (on thorough up-front work), Chapter 7 (on the team leader), and Chapter 10 (on
early supplier involvement).
Classes. Prospective employers value relevant courses, ranging from
specific college courses to extension or continuing education seminars
throughout your career. Relevant courses should be listed on your résumé.
In your early career planning, map out which courses to take to support
your overall career goals. Find out which CAD program is used in your
target industry and take classes to learn that program. Most CAD software suppliers offer student or academic discounts to help students learn
how to use their software.
Industry events. Students and working engineers can learn a lot about
manufacturing by attending conferences, trade shows, and exhibitions.
And working engineers usually get paid to attend. Some conferences have
student discounts, and many exhibitions are free or charge only a nominal
fee. Students can learn about the latest design and manufacturing techniques by going to presentations at conferences and seeing equipment and
demonstrations at the exhibitions.
Experience. Most job experiences may be valuable in the next job. Your
career path should be planned to accumulate experience that ultimately
supports a strategic career goal. Job seekers should (1) look for jobs where
their previous experiences will be valued by prospective employers, and
(2) emphasize this previous experience in résumés and job interviews.
Students can gain experience through summer jobs and internships.
Any job in a given industry will count as exposure to that industry. For
instance, the author worked his way through college as a mechanic in
a cannery, which helped him get a job later designing food processing
machinery. When joining a new company, design engineers can request
Implementing DFM • 379
manufacturing experience before design assignments if the company does
not already have this policy, which was recommended in Section 1.6.
Learn the trades of the process that makes what you are designing or
want to design; for instance, machining, CNC programming, welding,
and so forth. Working designers can learn these skills by taking night
courses at local community colleges. Engineering students should take
these courses as part of their schooling or, if not available, enroll in nearby
community college courses. These shop courses are taught by practical
instructors and offer students hands-on experience. One general course in
each skill should be sufficient.
Companies should encourage their engineers to take these courses by
paying course fees and allowing time off for the classes. Companies with
in-house shops could hold shop classes for designers on site. The classes
could be taught by teachers from community colleges or by factory workers.
For students, being able to say, “I am a machinist,” “I am a welder,” or
“I can program a CNC machine,” should be valuable to manufacturing
companies that machine or weld parts. The author became proficient at
welding and machining by taking courses at local community colleges.
Even relevant hobbies count. The skills learned in, for instance, a welding class could turn into a fun hobby that may impress an interviewer, even
if you welded artwork with an easily affordable oxyacetylene gas welder
or basic arc welder. Experience with a home version of a programmable
plasma cutter or prototype milling machine may be relevant to companies
that use CNC machine tools.
The recommendations of Section 1.6, which advises companies to hire
design engineers with experience in manufacturing, would apply to both
work experience and trade skills.
Profiles. Section 2.3 on product portfolio planning recommends that
companies develop profiles to identify the best opportunities. Similarly,
anyone who wants to apply DFM in a new job should develop a profile of
favorable company characteristics, such as:
•
•
•
•
Use of multifunctional teamwork
Strategies to achieve low cost and quality by design
Manufacture their products at the same site, co-located with design
Utilize vendor partnerships so that vendors are willing and able to
help them design the products where both the vendor and manufacturer will learn from each engagement
380 • Design for Manufacturability
• Measure total cost, for the reasons cited in Chapters 6 and 7
• Investment in product development, where management encourages
and supports innovation
Conversely, profiles indicating a company will have a hard time implementing DFM, and thus offer an unrewarding job experience, would
include the counterproductive practices cited in Sections 6.22 and 11.5.
These best and worst profiles may help students and job seekers select the
most rewarding job opportunities.
11.10 KEY DFM TASKS, RESULTS, AND TOOLS
Figure 11.3 provides a summary of key DFM tasks, results, and tools.
11.11 CONCLUSION
DFM alone may make the difference between being competitive or not succeeding in the marketplace. Most markets are highly competitive, so slight
competitive advantages (or disadvantages) can have a significant impact.
DFM can offer enormous benefits to product cost, quality, and time-to-
market with very little investment. Practiced right, DFM actually takes
less effort because products are designed right the first time.
Implementing DFM • 381
Tasks
Results
Tools
Multi-functional team
formed with all
functions present &
active early
Products concurrently
designed right the first
time for
manufacturability
Teamwork, leadership,
resource availability
Raise & resolve issues
early.
All issues raised early; All
issues resolved early;
Avoid problems & delays
Strong team leadership;
Team consensus;
Up-front focus
Simplify product &
production concepts.
Inherently low product
cost; Inherently high
quality; Inherently high
reliability
Thorough up-front work;
Teamwork; Creative
culture; Up-front focus
Optimize product
architecture and process
design.
Ensure lowest cost;
Ensure quick
development; Ensure
trouble-free launch
Thorough up-front work;
Multi-functional team;
Architecture focus
Optimize product and
process design.
Manufacturable designs;
Optimized processing;
Quality designed in
Concurrent engineering;
Process guidelines;
Quality guidelines
Standardize materials &
processing.
Minimum material
overhead; Quicker
product designs; Less
setup, smaller batches
Standardization lists;
Motivation & discipline;
Cross-team cooperation
Quantify total costs.
Best decisions; Proper
costing/pricing; Lowest
possible total cost
Activity-Based Costing;
Total cost thinking
Optimize supply chain to
maximize quality &
responsiveness.
Lowest mat’l cost and
time; Quality assured at
the source; Minimum
batches & inventory
Supplier partnerships;
Total cost
measurements;
Teamwork
with suppliers
Measure & compensate to
encourage teamwork
and total goals.
Minimum total cost;
Minimum time-to-
market; Best decisions
Metrics & compensation
based on total cost and
the real time-to-market
Management supports
and understands
concurrent engineering.
Product development
becomes a potent
competitive advantage
Executive education
FIGURE 11.3
Key DFM tasks, results, and tools.
382 • Design for Manufacturability
NOTES
1. Sydney Finkelstein, Why Smart Executives Fail: And What You Can Learn from Their
Mistakes (2003, Portfolio/Penguin), p. 138.
2. Micheline Maynard, The End of Detroit: How the Big Three Lost Their Grip on the
American Car Market (2003, Currency/Doubleday), Chapter 2 on Toyota and Honda,
p. 75.
3. Philip B. Crosby, Quality Is Free: The Art of Making Quality Certain (1979,
McGraw-Hill).
4. This quote is attributed to both Benjamin Franklin and Albert Einstein.
5. Satoshi Hino, Inside the Mind of Toyota (2006, Productivity Press), Chapter 1,
“Toyota’s Genes and DNA,” p. 3.
6. Bill George, Authentic Leadership: Rediscovering the Secrets of Creating Lasting Value
(2003, Jossey-Bass), Chapter 12, “Innovations from the Heart,” p. 141.
7. Robert W. Hall, “Medtronic Xomed: Change at ‘People Speed’,” Target, 2004, Vol. 20,
p. 14, http://www.ame.org/sites/default/files/target_articles/04-20-1-Medtronic_Xomed.
pdf.
8. For more information on customized in-
house DFM seminars, see Appendix
D of this book, which has a baseline agenda, or see Dr. Anderson’s website: www.
design4manufacturability.com/seminars.htm.
9. This data was generated by DataQuest and presented in the landmark article that
started the concurrent engineering movement: “A Smarter Way to Manufacture:
How ‘Concurrent Engineering’ Can Invigorate American Industry,” Business Week,
April 30, 1990, p. 110.
10. The colleges that used various editions of this book for courses are listed in the preface of this book under “Preface for Instructors.”
11. Dr. Anderson facilitates product-specific workshops (Appendix D) after customized
in-house seminars. These workshops consist of many brainstorming sessions on concept simplification and architecture optimization. More challenging endeavors, such
as developing half-cost products, may need his concept studies (also in Appendix
D), in which he generates breakthrough ideas that concurrent engineering teams can
develop into manufacturable products.
12. See the outsourcing article at the author’s website: www.HalfCostProducts.com/
outsourcing.htm.
13. See the offshoring article at the author’s website: www.HalfCostProducts.com/
offshore_manufacturing.htm.
14. The first section of the offshoring article shows how cost reduction attempts thwart
six of the eight cost reduction strategies presented on the home page of www.
HalfCostProducts.com.
15. Matthew E. May, The Elegant Solution (2007, Free Press), p. 73.
16. James Morgan and Jeffrey K. Liker, The Toyota Product Development System (2006,
Productivity Press), Chapter 4, “Front-Load the PD Process to Explore Alternatives
Thoroughly.”
Section VII
Appendices
Appendix A: Product
Line Rationalization
Product line rationalization is a powerful technique to improve profits,
simplify operations and supply chains, and free valuable resources for
product development. It does this by rationalizing existing product lines
to eliminate or outsource products and product variations that are problem prone, have low sales, have excessive overhead demands, have limited
future potential, and may be losing money.
Rationalization can quickly improve profits by stopping the production of money-losing products and eliminating all of the excess overhead
costs associated with fire-drill products. This, in turn, will allow precious
resources to focus on the most profitable products instead of low-leverage
products, which will increase sales and further lower costs. After rationalization, the remaining products will cost less because they will no longer
have to subsidize the money losers or marginal products.
All these cost savings can be used to lower prices in price-sensitive markets or to increase profits. In fact, rationalization can raise profits enough
to be justified as a free-standing program. The following scenario will
show that, by simply eliminating the lowest leverage products, profits can
be tripled!
A.1 PARETO’S LAW FOR PRODUCT LINES
All companies experience some Pareto effect, typically with 80% of profits
or sales coming from the best 20% of the products. This happens because
almost all companies continuously add products to the portfolio without ever removing any. Further, sales incentives and emphases on growth
and market share encourage the sales mantra of “take all orders,” thus
overloading production operations and the supply chain with too many
low-volume products that have unusual parts and manufacturing procedures. This results in many setup changes, causes excessive overhead costs,
385
386 • Appendix A: Product Line Rationalization
lowers plant capacity, complicates supply chain management, and dilutes
engineering and manufacturing resources.
Few companies realize these problems exist because their cost systems
allocate (average) overhead costs, which implies that all products have the
same overhead costs—a very unlikely situation.
A.1.1 Focus
Product line rationalization encourages companies to focus on their
best products by eliminating or outsourcing the marginal products. The
resources that were being wasted on the low-leverage products can then
be focused on growing the cash cows.
Adrian Slywotzky (who coauthored the book cited in reference 8) later
wrote in an article with Robert Atkins that allocating resources evenly
among all products is not wise even in good times, and can be disastrous
in a recession.
In a 2010 Harvard Business Review issue with a spotlight on recession
recovery, one of the focus articles recommended: “In a postbubble world,
firms must be more ruthless about terminating loss makers.”1
A.1.2 Competitive Challenges without Rationalizing
Selling a lot of legacies and low-volume products generates much more
overhead cost per product than cash cows, so those overhead costs must
be subsidized by the cash cows. In other words, the loser products create
a “loser tax” on the cash cows, thus forcing them to sell at a higher price
(or lower profits) than that of more focused competitors. The sales force for
the cash cows should support rationalization when they realize this; the
sales force for the losers may resist, so sales assignments may have to
be adjusted.
Rationalization will reduce some costs (see Section A.3), more so in a
growing enterprise. In most companies, the liberated overhead resources
should be reinvested in new product development and other activities
listed in Section A.3.
As discussed in Section 2.3, portfolio proliferation places a double
whammy on new product development. Not only do new products
have to pay the loser tax (which impacts low-cost products even more
Appendix A: Product Line Rationalization • 387
percentage-wise), but resources are drained away from product development efforts to build oddball products, thus making the new products less
competitive than they could be.
Unrealized subsidies can be identified by total cost accounting
(Chapter 7). In fact, total cost has an automatic rationalizing effect when
all overhead costs are assigned appropriately to every product, thus raising
the cost of the losers, so the marketplace will then rationalize them away.
A.2 HOW RATIONALIZATION CAN TRIPLE PROFITS!
The following scenario shows the power of this methodology, using a
simple example illustrated in Figure A.1. The actual product line rationalization considers many more factors, but this example shows the profit-
increasing potential of rationalization.
If a company kept the 20% of the products that were making 80% of
the profits and dropped the other 80% of the product line, it would result
in only a 20% drop in revenue. The cost reduction can greatly exceed the
revenue drop because of the way cost is distributed. Direct costs, such as
materials, parts, and labor, would be proportional to revenue. In other
words, the more products sold, the more materials, parts, and labor would
$
80%
of
Profits
20% of the Products
FIGURE A.1
Pareto’s law for products.
Revenue
388 • Appendix A: Product Line Rationalization
80%
20%
Direct Cost: 80%
Indirect Cost: 20%
20%
80%
FIGURE A.2
Cost breakdown.
be consumed. However, overhead has the opposite effect. Indirect costs
(such as procurement, manufacturing engineering, and other support
functions) would be low on the cash cow products because they are better designed for manufacturability, parts are procured routinely, quality issues have been resolved, and processes have been stabilized due to
the focus that is usually applied to higher volume production. In contrast, overhead costs on the low-volume products are high, probably 80%
of the total, because of all the inefficiencies inherent in building many
low-volume, seldom-built products. Further, those products may be less
well designed for manufacturability and have much higher quality costs.
Thus, the breakdown of direct and indirect costs would be as shown in
Figure A.2.
In order to make this example relevant, Figure A.3 converts these percentages into dollars for a $100,000,000 business, which, according to the
common Pareto’s law effect experienced by most companies, generates
$80 million in revenue from cash cow products and $20 million from all
the others. The cost breakdown shows indirect (overhead) costs as half
the total cost, which is not an unreasonable assumption. In fact, in many
industries, overhead cost is greater than half of the total cost (as shown in
Figure 6.1), thus resulting in an even stronger case.
Now, to show the powerful effect of this procedure, simply eliminating
the 80% of the low-volume products and keeping the 20% cash cows will
have the effect shown in Figure A.4.
Appendix A: Product Line Rationalization • 389
Revenue:
$80 + $20
Direct Cost: 36
Indirect Cost: 9
=
+
+
$100
9
36
=
–45
=
–45
Profit: $ 10
FIGURE A.3
Cost distribution in dollars.
Revenue:
$80
Direct Cost: –36
Indirect Cost: –9
New Profit: $ 35 = 3.5 times the profit of the full product line
FIGURE A.4
Results after rationalization.
The bottom line: Although revenue drops 20% (this will be discussed
later), eliminating the high-overhead products eliminated most of the
indirect costs, so that profits are 3.5 times that of the full product line!
For this motivational scenario, overhead cost savings are assumed to be
eliminated to show the effect on profits. This could be realized in a rapidly
growing company where the focus shifts from current loser products to
upcoming growth products.
However, it would be a shortsighted strategy to lay off workers to realize
a short-term overhead cost savings.2 Rather, “liberated” workers should be
invested in growing the remaining aspects of the business. Breakdowns of
actual cost savings and reinvestments are discussed next.
390 • Appendix A: Product Line Rationalization
A.3 COST SAVINGS FROM RATIONALIZATION
The cost savings from rationalization comes in two forms: cash and human
resources. Rationalization, like Lean Production, effectively liberates many
types of resources, and their disposition should be planned ahead of time.
The ultimate Lean Production guide, Lean Thinking, has a section titled,
“Deal with Excess People at the Outset.”3
A.3.1 Short-Term Cash Savings
Product line rationalization results in many short-term cash savings and
resource investment opportunities. It enables the company to:
• Avoid the purchase of parts and materials for rationalized products,
which may have less purchasing leverage, higher procurement costs
to find, and higher than normal setup and expediting costs.
• Avoid quality costs of unusual products, which may be higher than
normal, for reasons discussed in Section A.10.
• Limit, postpone, or cancel hiring for growth and attrition replacement.
• Avoid overtime.
• Phase out temps (temporary workers) as long as they do not have
critical knowledge or skills.
• Bring in house services that are currently outsourced, especially
when co-location would provide better concurrent engineering.
• Delay facility expansion. Unusual products generally require more
space than those that have benefitted from continuous improvements by implementing space-saving Lean principles.
A.3.2 Investments
Cost savings allow for the following investments to be made:
• Focus on improving sales on the remaining products, which now
can sell at higher profits (or lower prices) without having to cross-
subsidize the “losers.”
• Improve quality and lower the cost of quality.
• Continuously improve operations and productivity.
• Expand into related services.
Appendix A: Product Line Rationalization • 391
• Get certified (ISO 9000, QS 9000, etc.) or win awards (Best Plants,
Baldridge, etc.) to improve operations and stature with customers.
• Upgrade CAD tools, information systems, and web presence.
• Upgrade skills with investments in training.
• Implement new capabilities, such as build-to-order and mass customization, to be able to build a wide variety of mass-customized
or standard products on demand without forecast or inventory
(Section 4.3).
• Invest in internal start-up ventures.
• Use liberated cash and resources to buy and transform related, supportive businesses up and down the supply chain (not competitors!).
Liberated cash can also be invested to transform other companies;
the book Lean Thinking cited an example: “Each time Wiremold’s
vacuum sucks up a batch-and-queue producer, it spits out enough
cash to buy the next batch-and queue producer!”4
• Improve product development. Without the daily fire drills in operations and procurement, manufacturing and purchasing people will
be more available to participate in product development teams,
which is a key element to successful product development.
A.4 SHIFTING FOCUS TO THE MOST
PROFITABLE PRODUCTS
As Figure A.5 shows, after product line rationalization, resources that
were being wasted on the low-leverage products (under the dashed line)
can now be focused on improving the remaining products.
One of the author’s clients, a telecom equipment company, reported that
after dropping their marginal products, they recovered their original revenue within two months!
This comes from focusing liberated resources (both personnel and
money) on the cash cow products, with improved efforts in advertising,
sales channels, product design, operations, and supply chain management. All of these efforts will be easier and more efficient with fewer products on which to focus. Operations and supply chain management will
benefit from a greatly reduced number of parts and processes, plus having
free time to make improvements.
392 • Appendix A: Product Line Rationalization
Revenue
Keys:
Cash cows
Products improved;
prices raised
Revenue increase
Ranked Products
Redirected Effort
FIGURE A.5
Redirecting focus to cash cows.
Multifunctional product development teams will make faster progress
and develop better products with more people available from operations
and purchasing. In addition, the money saved not having to subsidize
“the losers” can fund improvement activities, be used to lower prices, or
simply go to the bottom line to improve profitability.
In addition to improving the known cash cows, it may be possible to
“raise worthy dogs,” or focus improvement on selected worthy products,
especially if they are related to cash cow products. For instance, consider
raising their prices, if the market accepts them; they may survive and simply make more money. Look for products that have easy opportunities to
lower their total cost, but be wary of any cost reduction effort that does
not pay off the cost of the effort within the expected life of the product, as
discussed in Section 6.1.
Make sure good products are not unfairly burdened by inappropriate
overhead charges, like paying the loser tax to subsidize marginal products.
In addition to these techniques, selected products may also benefit from
all the above-mentioned improvements in advertising, sales efforts, product design, operations, and supply chain management.
Professor Kim Cameron of the University of Michigan Business School
recommends that during downturns companies should “exit from weak
businesses entirely.”5
Sometimes companies can profit from shifting the focus from products that are only good to those that would have the potential to be great.
Jim Collins, author of Good to Great, points out that “few executives have
Appendix A: Product Line Rationalization • 393
the guts to get rid of profitable businesses where their company can only
be good, but never great.”6
A.5 RATIONALIZATION STRATEGIES
A.5.1 What Is More Important: Volume or Profit?
Many managers still have trouble with the issue of dropping revenue 20%,
even if it triples profit. This brings up the issue of the goal of a business.
As Eli Goldratt7 and others have pointed out, the real goal of a for-profit
enterprise is to make money, not to optimize other common measures
such as productivity, market share, or “growth at any cost.”
The opening chapter in Slywotzky and Morrison’s book, The Profit Zone:
How Strategic Business Design Will Lead You to Tomorrow’s Profits,8 is
titled: “Market Share Is Dead,” in which are found the following quotes:
“The two most valuable ideas in the old economic order, market share and
growth, have become the two most dangerous ideas in the new order.”
“Paradoxically, the devout pursuit of market share may be the single greatest creator of no-profit zones in the economy.”
James Womack, author of Lean Thinking (cited in Chapter 4) and The
Machine That Changed the World (cited in Chapter 2), traces the origins
of Toyota’s 2010 safety and recall problems back to 2002, “when it set itself
the goal of raising its global market share from 11% to 15%.”9 That rapid
growth took priority and compromised Toyota’s adherence to its own
principles, which are still the benchmark for Lean Production (as often
stated by Womack and his Lean Enterprise Institute at www.lean.org) and
product development, as cited many times herein.
Similarly, the book about the largest research project ever devoted to
corporate failures, Why Smart Executives Fail: And What You Can Learn
from Their Mistakes,10 states that market share is the wrong scorecard
because “market share does not translate into profitability, since significant investments are typically needed to build share in the first place.”
One of the themes of Richard Koch’s book, The 80/20 Principle,11 is
“Successful firms operate in markets where it is possible to generate the
highest revenue with the least effort.”
394 • Appendix A: Product Line Rationalization
A.5.2 Profitable Growth
Another quote from The 80/20 Principle:
“The road to hell is paved with the pursuit of volume.”12
Of course, “pursuit of volume” here means a volume growth strategy.
Many companies that have been stumbling lately have volume growth
as the cornerstone of their corporate strategy, with quarterly and yearly
growth goals. But the underlying theme of Pareto’s law is that: All opportunities are not equal and do not make an equal contribution to profitability.
A volume growth strategy encourages the “take all orders” mantra.
Thus, when there is pressure to grow the business, the company ends up
taking any business it can—not just the most profitable. This behavior
is built into the system if sales incentives are based on volume growth,
instead of profit. This is the sales equivalent of the piece–part incentives
in manufacturing that were abandoned long ago because they favored one
metric (volume) over another (quality).
The key to profitable growth is to focus on the products with the most
potential, not to dilute resources on the most products.
A.5.3 Rationalization Prerequisite—Eliminating
Duplicate Products
Before undertaking the rationalization procedure, companies can take
certain first steps to simplify the process. Eliminate overlapping or duplicate products. Search out and eliminate or consolidate duplicate products,
overlapping products, and superceded products, even if some customers
are still using the older product. You may have to encourage or force customers to switch from the older, less-advanced products that they have
been ordering because of arbitrary decisions, inertia, or lack of awareness
about newer or better replacements.
A.6 THE RATIONALIZATION PROCEDURE
The rationalization procedure divides the product line into four zones, as
shown in Figure A.6. Most of the least profitable, lowest-volume products
would be dropped (Zone 4); exceptions might include products that are
Appendix A: Product Line Rationalization • 395
Revenue
Zone 1:
Keep
“Cash
Cows”
Zone 2:
Improve
Products
Zone 3:
Outsource;
Sell other
brands
Zone 4;
Drop
Products, Ranked by Revenue
FIGURE A.6
Rationalization procedure.
slight variations of higher-volume products and can be built in flexible cells.
Products that need to be in the catalog could be outsourced (Zone 3), thus
simplifying the in-house supply chain and manufacturing operations. Cash
cows would be kept (Zone 1). The remaining products could be improved
(Zone 2).
A more detailed breakdown follows:
Zone 1: Cash cow products should remain because they are probably
making 80% of the revenue and profits. Some may be just fine in
dedicated mass production lines. No change in production per se
may be required for some products, whereas others could be made
together on flexible lines.
Zone 2: These products could be improved and grow with the redirected efforts shown in Figure A.5.
Zone 3: This category consists of products that do not fit into either
Zone 1 or 2 but still need to be in the catalog for completeness, to
satisfy loyal customers, or for service obligations. These products
may remain in the catalog, but they do not have to be built in-house.
They could be outsourced and manufactured by a supplier under the
company name or label. Or the company catalog could simply carry
another source’s product to complete the product line, assuring customers about appropriate equivalency.
396 • Appendix A: Product Line Rationalization
Zone 4: This zone contains the products that should be dropped from the
product line. Sell off the rights to losing products, if possible; someone
else may be able to make money if they are a better fit with their products and operations. This certainly would not be a competitive threat,
because those products would not be making as much money as new
products designed with better focus using the techniques of this book.
A.7 TOTAL COST IMPLICATIONS
Chapter 7 discussed total cost measurements and their impact on business decisions. The cost accounting system has significant implications for
product line rationalization. Most companies average (allocate) overhead
costs so much that the reported “costs” of individual products do not reflect
reality. What happens is that good products usually subsidize bad products. And because profitability is based on cost, it will be distorted too.
When total cost measurements are implemented, the profitability of
products becomes more realistic, as shown in Figure A.7, and it becomes
apparent how many of the products are really losing money. These then
become the prime candidates for elimination, in Zone 4 of Figure A.6.
You cannot have a profitability strategy unless you can have total cost
measurements and can break down “corporate profits” into profits for specific products, market segments, and so forth.
Sometimes implementing total cost measurements can resolve a rationalization impasse. A Harvard case study13 analyzed seven products made
Profitability
+
Based on typical cost data
Prioritized Products
–
FIGURE A.7
Prioritized profitability: typical cost vs. total cost.
Based on total cost data
Appendix A: Product Line Rationalization • 397
by Schrader–Bellows. In a factory where most products had annual volumes of thousands per year, there was one product that they built only 53 of
per year. Of course, production management wanted to get rid of it because
they understood all the inefficiencies, but the current cost system said, quite
illogically, that it had the highest profit margin in the plant, so they had to
keep building it. However, after the total cost analysis was performed, the
product that originally was thought to have the highest profit margin of
the group was shown, in reality, to have a negative 59% “margin.”14
A.7.1 Margin Trap
Making decisions based on product profit margins can be a dangerous
practice when costs are not based on total cost accounting practices and
updated often. Low-profit or money-losing products will keep being sold if
there is a perception that they have high margins. Many misleading situations occur when products have margins computed after high-volume
builds and these numbers stay in the system, even though the order volumes have since decreased. Obsolete margin data can mislead decision
makers and may discourage rationalization efforts.
A.7.2 Seldom-Built Products
Products “revived from the dead” have high overhead costs despite their
reported “margins.” Another rationalization procedure is to investigate
which products have not been built recently; for instance, in the last year,
two years, three years, four years, and five years. These products that
are revived from the dead have high overhead demands because of the
effort to remember how to build them, find all the documentation, procure unusual materials, and find the tooling. In one company, tooling for
a seldom-built product had been sitting outside in the snow for months
and required much rehabilitation. Companies can simply implement a
policy that all products that have not been built in, say, three years, will
be dropped immediately, or at least discouraged or given special scrutiny.
A.7.3 Obsolescence Costs
When mass producers build too many low-volume products, it increases
the risk and cost of obsolescence due to market changes and engineering
change orders. An APICS article on “product proliferation” stated:
398 • Appendix A: Product Line Rationalization
“Low-volume products are particularly prone to [obsolescence] since batch
sizes are often increased to produce a six-month or more supply in order to
reduce the number of changeovers required in manufacturing. With this
amount of inventory on the shelf, the risk of becoming obsolete due to engineering changes or changing levels of demand increases dramatically.”15
A.8 OVERCOMING INHIBITIONS, FEARS,
AND RESISTANCE
Despite the fact that product line rationalization can easily raise profits,
free valuable resources, and simplify operations and supply chain management, many managers have inhibitions, fears, and resistance:
• Growth emphasis. When there is too much emphasis on revenue
growth, it may be hard to get companies to do what may appear to
reduce their revenue stream, even temporarily, in order to eliminate
the low-leverage products, improve the cash cows, improve profitability, and ultimately grow revenue.
• Cost system deficiencies. When overhead is allocated (averaged), all
products will appear to have close to equal profitability. Total cost measurements will then be necessary to flush out the low-profit products.
• Inertia. Many people resist change in general, especially if the cost
system or personal communications do not show them the big
picture—how product line rationalization can help free up resources
for product development.
• Departmentalism. Often resistance comes from those who have been
optimizing their department’s performance (e.g., sales) at the cost of
the company as a whole. Metrics may need to be changed to direct
behavior toward maximizing company goals.
• Unhealthy attachments. Every product at one time was the “baby”
of someone or several people. Remember, however, that the goal of a
business is to produce the most profitable products, not a collection
of favorites.
• Fears overstated. Fears about negative consequences often are overstated, especially the fear of losing customers, who, in reality, will
most likely switch to better equivalents from the same catalog. When
low-leverage products are eliminated:
Appendix A: Product Line Rationalization • 399
1. The company can increase sales on the remaining products, with
better focus in each of the following areas: research, product
development, manufacturing, quality, and marketing.
2. Without having to subsidize low-leverage products, the remaining products can generate more profit or be priced lower.
3. Customers can switch to remaining products from older, less-
advanced products that they have been ordering because of
arbitrary decisions, inertia, or lack of awareness about newer or
better replacements.
The following is a list of the most common questions that come up in the
author’s workshops, followed by the author’s answers:
Q: What about the “complete product line” argument?
A: If the catalog must really be complete (zone 3 in Figure A.6), that doesn’t
mean you have to manufacture all the products, options, or variations in your factories. Outsource or set up a separate profit and
loss center to build unusual products, options, or variations so
that the resources that were formerly squandered on them can
now be invested in developing a better portfolio of new products.
Q: Won’t customer satisfaction drop?
A: Overall customer satisfaction will actually be lower if you waste your
resources making low-leverage products instead of capitalizing
on opportunities to give customers better innovation, lower
cost, better quality, and better customer service. However, they
will probably miss the good deals you were giving them on your
money-losing products.
Q: Won’t we be limiting customer choice?
A: Often, customers keep ordering older or unusual products because of
arbitrary decisions, inertia, or lack of awareness about newer or
better replacements. Point out how the remaining products have
been improved. Rationalizing away the loser tax will allow the
remaining products to sell for less.
Q: What about loss leaders?
A: If low-leverage products are to be retained as loss leaders, then management should know how much money is really being lost,
including the opportunity losses of what those resources could
400 • Appendix A: Product Line Rationalization
be accomplishing. If loss leaders are still a valid strategy after
implementing total cost accounting, then the loss-leader products should be outsourced to avoid distracting the factory from
its most efficient tasks.
Q: But our profits are so high that selling a few losers won’t drop profits
much, will it?
A: The total cost of all the losers will probably be greater than a typical cost
system indicates. The real impact of rationalization will be freeing up resources to develop better new products. If a prosperous
company wants to keep building high-overhead money losers,
then it should set up a profit and loss operation and hire enough
people to run it without taking any resources away from NPD.
Q: But what about the perception that we have to sell some oddball
products to get the big sales?
A: First of all, customers may have been spoiled by years of unnecessary
concessions made by salespeople, who may not know or care
about the trauma that low-volume products cause in operations
and supply chain management. Customized products would fall
into this category if not done efficiently through mass customization (Section 4.3).
Second, ask objectively if the customer will really terminate
a long and viable relationship over a few low-volume products.
Third, point out that if customers continue to buy older products, they will become increasingly vulnerable to product obsolescence and part availability problems.
Finally, if customers still insist on package deals, the manufacture of oddball products could be done by outsourcing, so
those sales do not distract from new product development. The
portfolio planning aspects of the package deal were discussed in
Section 2.2.8.
If all of these arguments are not convincing, then consider “competitive
scenarios.”
A.8.1 Competitive Scenarios
Savvy competitors would not blindly compete against your entire product
line. They would offer only the most profitable products. Not burdened by
Appendix A: Product Line Rationalization • 401
your low-leverage products, they would be able to make the rationalized
product line quicker, better, and at lower cost.
Another competitive scenario is “cherry picking,” when an existing or
new competitor skims off the most profitable products.16 Thus, competitors could steal your cash cows, leaving you with the “dogs.”
A.8.2 Role Playing
It may be a valuable exercise to role-play competitor scenarios, pretending
you, or your brainstorming group, are a well-financed new competitor.
Ask the following questions:
Which products would you want to have in your product line?
How would you group products and structure production lines for the
greatest efficiencies?
How could a concise product line benefit from standardization?
What is the minimum list of parts and materials needed?
How would you build them flexibly to be able to reach the broadest possible markets?
What would you like to do that you cannot do because of existing product line limitations?
Here is what Larry Downes and Chunka Mui reported in their book,
Unleashing the Killer App:17
“One organization had teams of executives play the role of well-funded
outsiders, both new entrants and existing competitors, and asked them to
devise business plans that attacked the organization’s prime markets and
stole away its most profitable customer segments. Knowing the blinders of
the organization, and the exposed flanks of its offerings, these teams easily put together alliances and business propositions that realistically challenged the status quo.”
Similarly, General Electric uses “destroy-your-business” exercises to identify business threats.18
The Dartmouth Business School study that produced a book on corporate failures, cited earlier, recommended as a high-return activity the
practice of “convening ‘devil’s advocate’ groups that are assigned the task
of spotting vulnerabilities in past and current policies.”19
402 • Appendix A: Product Line Rationalization
Three years after Quaker lost $1.4 billion acquiring Snapple, which was
a complete mismatch with Quaker’s operations, the CEO admitted, “We
should have had a couple of people arguing the ‘no side’ of the evaluation.”20
A.8.3 Rationalization Synergy with Other
Improvement Programs
A stand-alone rationalization effort may be perceived as limiting the
sales offerings without (1) any compensating benefits, (2) any way to
“make up the lost sales,” or (3) understanding total cost enough to prioritize opportunities.
To be supportive of rationalization, everyone must have some motivation.
That may take more than a “benefits” page in a presentation. The real benefit
would be to support divisional innovation strategies by freeing up enough
resources (in engineering as well as manufacturing and supply chain management) to (1) enable the company to develop innovative products and (2)
establish the capabilities to quickly build even more variety—but focused
on “good variety”—variations of versatile product families built by flexible
processing, which are concurrently engineered, as discussed in Chapter 4.
Such a rationalization strategy would not just be taking away products
that are perceived as lowering sales, but really focusing on eliminating the
money losers and then adding back products that are better in every way,
including a wider variety of profitable products.
Therefore, rationalization efforts should be synergistically linked with
implementation efforts for DFM and/or build-to-order and mass customization to enable quick and easy manufacture of an optimal portfolio of
product families built in flexible factories.
A.9 IMPLEMENTATION AND CORPORATE STRATEGY
The rationalization approach depends on the business model.
A.9.1 Approach for Mass Production
For mass production, which builds batches of products for inventory based
on forecasts, individual product decisions are made independently. Be
sure to quantify the total cost of all setup, inventory, and other overhead
Appendix A: Product Line Rationalization • 403
costs to identify which low-volume products are making the least profit.
Generally, the company should drop low-volume products with high
ratios of setup-to-run-times.
If there is pressure to retain some products at any cost, keep in mind
that manufacturing will have to live with costly setups; live with delays
on those and delays to interrupt production for more setups; and build
low-volume products for inventory, which is risky and ineffective for a
wide variety of products.
One alternative for retained products would be to outsource them
to free in-house people for new product development. Note that the
“cost” will go up if those products were subsidized before, because outsourcers will charge the true total cost. The other alternative would be to
set up a separate self-supporting profit and loss center to build unusual
products, options, or variations.
A.9.2 Approach for Mass Customization and Build-to-Order
Flexible cells can build a range of any product in a family (or platform)
with minimal setup costs and delays. In such an environment, some low-
volume products can be retained if they can be grouped into a product
family and quickly and cost-effectively built on either dedicated mini-lines
or flexible lines or cells. Products that do not fit into any family group
should be removed from all flexible operations and either eliminated or
outsourced. Thus, a flexible (Lean, build-to-order) plant will be able to
retain more products than an inflexible mass production plant.
Rationalization will steer customers toward products that fit with this
model through better deliveries (because of the flexibility) and lower
prices, because the remaining products will not have to pay the loser tax
to subsidize the losers.
A.9.3 Implementation Steps
Rationalization should proceed with the following steps:
1. Gather data. Create Pareto plots by plotting revenue (or sales units)
against ranked products in the format of Figure A.6. First, plot all
products; this is for motivation and buy-in, so it does not have to be
rigorous. Then plot each product family, market segment, or other
logical grouping with product-identifying numbers displayed.
404 • Appendix A: Product Line Rationalization
2. Consolidate redundant variation. Look for redundant versions of
products and consolidate them into a single product: the best one;
the most advanced; the most manufacturable; the easiest to build;
the most common; and the one that fits best into a product family
and manufacturing cells in a flexible manufacturing environment.
After the redundant versions are discontinued, customers should be
steered to the better product and told why it is better.
3. Conduct polls and surveys. Polls and surveys can quickly identify
difficult-to-build products for scrutiny. Just ask the following question to everyone involved in building products, procuring their parts,
and performing custom engineering or configurations: “What products or variations cost us more, and delay us more, than we think?”
Then plot the results and start scrutinizing from the top of the list.
4. Arrange seminars and workshops.21 Arrange for training on product
line rationalization for all people that will be involved. The training
should be interactive enough to discuss principles, address concerns,
and get buy-in to proceed. The workshop phase of this event should
start the rationalization process based on preliminary data gathered
in the previous steps.
5. Create profiles. Profiles can be quickly created to red flag certain
products for special scrutiny. The profile could be based on any criteria that should raise red flags: low volume, infrequent manufacture,
special materials, hard-to-get parts, unusual processing, difficult
customizations, or any other unusual demands. Profiles are valuable
because they can be created immediately, before the rationalization
process is complete, based on anecdotal criteria in addition to available data. If neither of these is available, conduct polls and ask everyone in operations to vote on which products they think are making
less money than assumed and which are distracting them from their
jobs and from participation on new product development teams. At
first, red-flagged products would receive special scrutiny and, before
the order could be accepted, would require signatures from manufacturing, purchasing, engineering, and so forth. A senior manager
may need to be appointed to quickly arbitrate disputes. As profiles
mature, they could automatically block unacceptable orders.
6. Utilize configurators. Profiles can be built into a configurator, which
is order-entry software that has the added ability to:
Appendix A: Product Line Rationalization • 405
a. Contain all the rules, profiles, data, and formulas to certify a
valid order and provide customers with instant cost quotes and
delivery schedules.
b. Quickly provide customers with many “what if” scenarios, showing the cost and delivery time for standard or custom orders.
c. Transmit the data needed for processing the order, doing engineering work, procuring the materials, setting up production,
and launching the product.
7. Analyze data. Segregate Pareto plots as shown in Figure A.6.
Scrutinize the low-selling products to see which should be dropped
or, if necessary to be in the catalog, which should be outsourced.
Look for opportunities to shift resources to improve worthy products, as shown in Figure A.5.
8. Implement total cost measurements. Improve the costing system (as
discussed in Chapter 7) to the point where all costs are quantified for
all product variations, so that:
a. All product variations can be plotted by true profitability, which
will greatly improve corporate strategy, product portfolio planning, and product line rationalization.
b. Pricing can be objectively based on the total cost for all product variations, which will result in an automatic and enduring
rationalizing effect. The result of this will be that previously subsidized products with high overhead costs will have their prices
raised, so the market will rationalize away products that do not
provide a good value to customers. On the other hand, efficient
products will have their prices lowered (or profit raised) because
(1) they will no longer have to subsidize the losers and (2) their
price will reflect increased efficiencies in manufacturing and
supply chain management, which will become even more effective as inefficient products are removed from the system.
9. Adjust responsibilities, incentives, and compensation immediately for
people and groups associated with discontinued products to minimize disruptions and resistance now and in the future. This will be
easier if total cost measurements can quantify the poor financial performance of the eliminated products.
10. Implement recommendations. Get necessary approvals and implement the recommendations on which products to drop, outsource,
consolidate, or improve and how these actions should be executed.
406 • Appendix A: Product Line Rationalization
A.10 HOW RATIONALIZATION IMPROVES QUALITY
Quality metrics are a summation of the quality of all products.
Rationalization will raise corporate quality by eliminating the unusual,
low-volume products, which usually have the lowest quality because:
• Unusual, lower volume products get less kaizen focus (continuous
improvement) and may have less sophisticated tooling and procedures.
• Infrequently built products may have missing or vague instructions, procedures, and “know-how”; rusty or damaged tooling; or
missing or discarded tooling, build fixtures, test fixtures, or repair
tools, resulting in costly and error-prone manual or “Plan B” procedures. More difficult setups generate more scrap before first good
units can be successfully built.
• Older products may have worn tooling; less sophisticated diagnostics, tests, and repair tools; less effective design for manufacturability
and quality; and old materials that may have deteriorated, which is
especially likely after “end-of-life buys” (buying a lifetime supply of
parts before they go out of production).
Not only will rationalization raise the quality of existing products, it
will also make quality improvement programs, such as Six Sigma, more
effective and easier to implement because (1) quality improvement efforts
can be better focused on the remaining products, (2) these efforts will not
have to deal with products that have inherently lower quality for reasons
cited above, and (3) program results will not be pulled down by those
products with inherently low quality and little prospects for improvement.
A.11 VALUE OF RATIONALIZATION
Eliminating or outsourcing low-leverage products will immediately:
• Increase profits by avoiding the manufacture of products that have
low profit or are losing money because of their (unreported) high
overhead demands and inefficient manufacture or procurement.
Appendix A: Product Line Rationalization • 407
• Improve operational flexibility and make Lean Production implementations quicker and more successful, because, typically, low-leverage
products are inherently different, with unusual parts, materials, setups,
and processing. Often, these are older products that are built infrequently with less common parts on older equipment using sketchy
documentation by a workforce with little experience on those products.
Rationalization had the following effect on a drill bit manufacturer:
“Efforts to convert to cellular manufacturing using small batch flow
became immeasurably easier. By eliminating the very low volume product line, the company was able to set up a simple kanban system between
finished goods and the manufacturing cells, which eliminated the need
to operate a complicated, computer-based work order system.”22
• Simplify supply chain management. Eliminating the products with
the most unusual parts and materials will greatly simplify supply
chain management. For example, rationalization enabled the same
drill bit manufacturer to reduce bar stock from 24 different types to
only 6.
• Free up valuable resources to improve operations and quality, implement better product development practices, and introduce new capabilities. One of the author’s clients (Jon Milliken, VP of Engineering,
Fisher Controls Division, Emerson Electric) summarized the
resource gains as follows: “Product line rationalization freed up a lot
of people!”
• Improve quality by eliminating older, infrequently built products,
which inherently have more quality problems than current, high-
volume products that have benefitted from continuous improvement
and current quality programs and techniques.
• Focus on the most profitable products in product development, manufacturing, quality improvement, and sales emphases. Focusing
on the most profitable products can increase their growth and the
growth of similarly profitable products. According to Richard Koch,
writing in The 80/20 Principle,23 “If you focus on the most profitable segments, you can grow them surprisingly fast—nearly always
408 • Appendix A: Product Line Rationalization
at 20 percent a year and sometimes even faster. Remember that the
initial position and customer franchise are strong, so it’s a lot easier
than growing the business overall.”
• Better quality. Similarly, getting rid of the worst products raises
existing quality and enables quality improvements to focus efforts
better, as discussed in Section A.10.
• Protect the most profitable products from cherry picking (launching a competitive attack on the most profitable products), which
can be a threat when agile competitors skim off the most profitable products.24
• Stop cross-subsidizes. Remaining products will no longer have to
subsidize the “dogs,” so they can generate more profits or offer more
competitive selling prices.
• Ensure resource availability to ensure that multifunctional product
development teams have all the specializations available early to
design products well for manufacturability.
NOTES
1. Pankaj Ghemawat, “Finding Your Strategy in the New Landscape: The Postcrisis World
Demands a Much More Flexible Approach to Global Strategy and Organization,”
Harvard Business Review, March 2010, pp. 54–60.
2. David M. Anderson, Build-to-Order & Mass Customization: The Ultimate Supply
Chain Management and Lean Manufacturing Strategy for Low-Cost On-Demand
Production Without Forecasts or Inventory (2008, CIM Press); see “Downturn
Strategies,” on why not to lay off workers, in Chapter 13. This book is described in
Appendix D.
3. James P. Womack and Daniel T. Jones, Lean Thinking: Banish Waste and Create
Wealth in Your Corporation, (1996, Simon & Schuster), p. 257.
4. Ibid., p. 147.
5. Jon E. Hilsenrath, “Many Say Layoffs Hurt Companies More Than They Help,” Wall
Street Journal, February 21, 2001.
6. Jim Collins, “Beware of the Self-Promoting CEO,” Wall Street Journal, November 26,
2001.
7. Eliyahu M. Goldratt, The Goal, Second edition (1992, North River Press).
Appendix A: Product Line Rationalization • 409
8. Adrian J. Slywotzky and David J. Morrison, The Profit Zone: How Strategic Business
Design Will Lead You to Tomorrow’s Profits (1997, Times Business/Random House),
Chapter 1, “Market Share is Dead.”
9. “The Machine That Ran Too Hot,” The Economist, February 27–March 5, 2010, p. 74.
10. Sydney Finkelstein, Why Smart Executives Fail: And What You Can Learn from Their
Mistakes (2003, Portfolio/Penguin), p. 142.
11. Richard Koch, The 80/20 Principle: The Secret of Achieving More with Less (1998,
Currency/Doubleday), p. 53.
12. Ibid., p. 93.
13. The Schrader-Bellows case study is described in Harvard Business School Case Series
9-186-272; a summary appears in “How Cost Accounting Distorts Product Costs,”
by Robin Cooper and Robert S. Kaplan, Management Accounting (April 1988).
14. Robin Cooper and Robert Kaplan, “How Cost Accounting Distorts Product Costs,”
World-Class Accounting for World-Class Manufacturing, Edited by Lamont F. Steedle
(1990, Institute of Management Accountants), p. 122.
15. C. Karry Kouvelas, “Getting a Grip on Product Proliferation,” APICS—The Performance
Advantage, April 2002, pp. 26–31.
16. Larry Downes and Chunka Mui, Unleashing the Killer App (1998, Harvard Business
School Press), p. 140.
17. Downes and Mui, Unleashing the Killer App, p. 171.
18. Thomas H. Davenport and Laurence Prusak with H. James Wilson, What’s the Big
Idea? Creating and Capitalizing on the Best Management Thinking (2003, Harvard
Business School Press), p. 37.
19. Finkelstein, Why Smart Executives Fail, p. 185.
20. Ibid., pp. 79 and 98.
21. The author offers in-house customized seminars on product line rationalization
(Appendix D.6.5) that present the principles and implementation strategies with
lively interactive sessions on the issues of Appendix A.8. Rationalization workshops
start with reviewing and discussing Pareto charts, identifying rationalization opportunities, developing strategies, and making implementation recommendations. Also
see http://www.build-to-order-consulting.com/S-PLR-Std.htm. The rationalization
seminar is also included in the author’s BTO&MC seminar, which is described in the
last endnote in Chapter 4 of this book.
22. Kouvelas, “Product Proliferation,” pp. 26–30.
23. Koch, The 80/20 Principle, p. 90.
24. Downes and Mui, Unleashing the Killer App, p. 140.
Appendix B: Summary
of Guidelines
To help with the creation of company-specific guidelines, all 140 guidelines presented in the text are repeated below in guideline number order,
without explanation.
B.1 ASSEMBLY GUIDELINES FROM CHAPTER 8
A1) Understand manufacturing problems/issues of current, past, and
related products.
A2) Design for efficient fabrication, processing, and assembly; identify
difficult tasks and avoid them by design.
A3) Eliminate overconstraints to minimize tolerance demands.
A4) Provide unobstructed access for parts and tools.
A5) Make parts independently replaceable.
A6) Order assembly so the most reliable part goes in first, the most likely
to fail goes in last.
A7) Make sure options can be added easily.
A8) Ensure the product’s life can be extended with future upgrades.
A9) Structure the product into modules and subassemblies, as appropriate.
A10) Use liquid adhesives and sealants as a last resort.
A11) Use press fits as a last resort.
B.2 FASTENING GUIDELINES FROM CHAPTER 8
F1) Use the minimum number of total fasteners.
F2) Maximize fastener standardization with respect to fastener part
numbers, fastener tools, and fastener torque settings.
F3) Optimize fastening strategy.
411
412 • Appendix B: Summary of Guidelines
F4) Make sure screws are standardized and have the correct geometry
so that auto-feed screwdrivers can be used.
F5) Design screw assembly for downward motion.
F6) Minimize use of separate nuts.
F7) Consider captive fasteners when applicable.
F8) Avoid separate washers.
F9) Avoid separate lockwashers.
B.3 ASSEMBLY MOTION GUIDELINES FROM CHAPTER 8
M1) Design for easy, foolproof, and reliable alignment of parts to be
assembled.
M2) Products should not need any tweaking or any mechanical or electrical adjustments unless required for customer use.
M3) If adjustments are really necessary, make sure they are independent
and easy to make.
M4) Eliminate the need for calibration in manufacture; if not possible,
design for easy calibration.
M5) Design for easy independent test/certification.
M6) Minimize electrical cables; plug electrical subassemblies directly
together.
M7) Minimize the number of types of cables and wire harnesses.
B.4 TEST GUIDELINES FROM CHAPTER 8
T1) Product can be tested to ensure desired quality.
T2) Subassemblies and modules are structured to allow independent
testing.
T3) Testing can be performed by standard test instruments.
T4) Test instruments have adequate access.
T5) Minimize the test effort spent on product testing consistent with
quality goals.
T6) Tests should give adequate diagnostics to minimize repair time.
Appendix B: Summary of Guidelines • 413
B.5 REPAIR GUIDELINES FROM CHAPTER 8
R1)
R2)
R3)
R4)
R5)
R6)
R7)
R8)
R9)
R10)
R11)
R12)
R13)
R14)
R15)
R16)
R17)
R18)
R19)
Provide ability for tests to diagnose problems.
Make sure the most likely repair tasks are easy to perform.
Ensure repair tasks use the fewest tools.
Use quick disconnect features.
Ensure that failure- or wear-prone parts are easy to replace with disposable replacements.
Provide inexpensive spare parts in the product.
Ensure availability of spare parts.
Use modular design to allow replacement of modules.
Ensure modules can be tested, diagnosed, and adjusted while in the
product.
Sensitive adjustments should be protected from accidental change.
The product should be protected from repair damage.
Provide part removal aids for speed and damage prevention.
Protect parts with fuses and overloads.
Ensure any module or subassembly can be accessed through one
door or panel.
Access covers that are not removable should be self-supporting in
the open position.
Connections to modules or subassemblies should be accessible and
easy to disconnect.
Make sure repair, service, or maintenance tasks pose no safety
hazards.
Make sure subassembly orientation is obvious or clearly marked.
Provide means to locate subassemblies before fastening.
B.6 MAINTENANCE GUIDELINES FROM CHAPTER 8
R20)
R21)
R22)
R23)
R24)
Design products for minimum maintenance.
Design self-correction capabilities into products.
Design products with self-test capability.
Design products with test ports.
Design in counters and timers to aid preventive maintenance.
414 • Appendix B: Summary of Guidelines
R25) Specify key measurements for preventive maintenance programs.
R26) Include warning devices to indicate failures.
B.7 PART DESIGN GUIDELINES FROM CHAPTER 9
P1)
P2)
P3)
P4)
P5)
P6)
P7)
P8)
P9)
Adhere to specific process design guidelines.
Avoid right- or left-hand parts; use parts in pairs.
Design parts with symmetry.
If part symmetry is not possible, make parts very asymmetrical;
polarize all connectors.
Design for fixturing; concurrently design fixtures.
Minimize tooling complexity by concurrently designing tooling.
Make part differences very obvious for different parts.
Specify optimal tolerances for a robust design.
Specify quality parts from reliable sources.
B.8 DFM FOR FABRICATED PARTS FROM CHAPTER 9
P10)
P11)
P12)
P13)
P14)
P15)
P16)
P17)
P18)
P19)
P20)
P21)
P22)
Choose the optimal processing.
Design for quick, secure, and consistent work holding.
Use stock dimensions whenever possible.
Optimize dimensions and raw material stock choices.
Design machined parts to be made in one setup (chucking).
Minimize the number of cutting tools for machined parts.
Avoid arbitrary decisions that require special tools and thus slow
processing and add cost unnecessarily.
Choose materials to minimize total cost with respect to
post-processing.
Design parts for quick, cost-effective, and quality heat treating.
Concurrently design and utilize versatile fixtures.
Understand workholding principles.
Avoid interrupted cuts and complex tapers and contours.
Minimize shoulders, undercuts, hard-to-machine materials, specially
ground cutters, and part projections that interfere with cutter overruns.
Appendix B: Summary of Guidelines • 415
P23) Understand tolerance step functions.
P24) Specify the widest tolerances consistent with function, quality, reliability, safety, and so forth.
P25) Be careful about too many operations in one part.
P26) Concurrently engineer the part and processes.
P27) Avoid sharp internal corners that require sharp cutting tools.
P28) Proactively deal with burr removal.
P29) Specify 45 degree bevels instead of round external corners.
P30) Don’t overspecify surface finishes.
P31) Reference each dimension to the best datum.
B.9 DFM STRATEGIES FOR CASTINGS FROM CHAPTER 9
P32)
P33)
P34)
P35)
P36)
Obey all the guidelines for design of castings and molds/dies.
Standardize cast parts.
Design versatile raw castings.
Capitalize on opportunities to avoid machining with “as cast” shapes.
Carefully plan out the sequence of machining castings.
B.10 DFM STRATEGIES FOR PLASTICS FROM CHAPTER 9
P37)
P38)
P39)
P40)
P41)
P42)
P43)
P44)
P45)
P46)
Obey all the guidelines for part design and mold design.
Standardize molded parts.
Design versatile molded parts.
Standardize raw materials for all parts.
Choose raw materials commonly used.
Don’t limit thinking to one-for-one replacements when substituting
plastics for other materials.
Optimize the number of functions in each part.
Methodically choose tolerances for molded parts.
Work with preselected vendors/partners.
Print 3D models to help optimize the design.
416 • Appendix B: Summary of Guidelines
B.11 DFM FOR SHEET METAL FROM CHAPTER 9
P50)
P51)
P52)
P52)
P53)
P54)
Buy off-the-shelf sheet metal boxes.
Optimize sheet metal in the concept/architecture phase.
Optimize sheet metal processing.
Standardize sheet metal.
Standardize sheet metal tools.
Follow sheet metal design guidelines.
B.12 QUALITY GUIDELINES FROM CHAPTER 10
Q1)
Q2)
Q3)
Q4)
Q5)
Q6)
Q7)
Q8)
Q9)
Q10)
Q11)
Q12)
Q13)
Q14)
Q15)
Establish a quality culture.
Understand past quality problems and issues.
Methodically define the product.
Make quality a primary design goal.
Use multifunctional teamwork.
Simplify the design and processing.
Select parts for quality.
Optimize processing.
Minimize cumulative effects.
Thoroughly design the product right the first time.
Mistake-proof the design with poka-yoke.
Continuously improve the product.
Document thoroughly.
Implement incentives that reward quality.
Optimize tolerances for a robust design.
B.13 RELIABILITY GUIDELINES FROM CHAPTER 10
Q16)
Q17)
Q18)
Q19)
Q20)
Simplify the concept.
Make reliability a primary design goal.
Understand past reliability problems.
Simulate early.
Optimize part selection on the basis of substantiated reliability data.
Appendix B: Summary of Guidelines • 417
Q21)
Q22)
Q23)
Q24)
Q25)
Q26)
Q27)
Q28)
Q29)
Use proven parts and design features.
Use proven manufacturing processes.
Use precertified modules.
Design to minimize errors with poka-yoke.
Design to minimize degradation during shipping, installation, or
repair.
Minimize mechanical electrical connections.
Eliminate all hand soldering.
Establish repair limits for circuit boards.
Use burn-in wisely.
Appendix C: Feedback Forms
This appendix contains forms that can be used to solicit valuable feedback
from customers, the factory, vendors, and field service, to help develop
better products. The procedure is as follows:
1. Circulate to target audiences with an introduction that asks for their
help in making “our products” better, easier to build, and so forth.
Emphasize the importance of this input and how it will be acted
upon. The customer feedback form should be filled out by customers, as discussed in Section 2.11. The factory feedback form should
be circulated to all manufacturing personnel, from supervisors to
assembly-line workers. The vendor feedback form should be circulated to all vendors that make parts that your company has designed.
The field service form should be circulated to field service personnel
that are employed by the company, the customer, or third-party service providers.
2. Analyze feedback thoroughly. Follow up and interview sources.
Investigate causes, propose solutions, and implement proposals.
3. Get back to respondents. At a minimum, thank them for the feedback. State what is being done, even if this is just the beginning of the
process. Let them know about any specific solutions that are going to
be implemented. Consider some form of recognition and/or reward
system for valuable suggestions.
4. Follow up with those who indicated a willingness to provide input
to new product development teams (the last question on the forms).
Solicit their input at the appropriate times or invite them to participate in design team activities.
419
420 • Appendix C: Feedback Forms
Customer Feedback Form
Date__________________
(For Importance and Competitive Grades, see instructions in Section 2.11)
Rating of Importance
_____Functionality
_____Purchase cost
_____Quality
_____Reliability/Durability
_____Delivery/Availability
_____Appearance/Aestetics
_____Service, repair, maintenance
_____Cost of ownership
_____Technical support
_____Customizability/Options
_____Safety
_____Environmental
_____Other____________________
Grade
_______
_______
_______
_______
_______
_______
_______
_______
_______
_______
_______
_______
_______
Compared to:
___________________________
___________________________
___________________________
___________________________
___________________________
___________________________
___________________________
___________________________
___________________________
___________________________
___________________________
___________________________
___________________________
In which areas do our products need to be improved?
Q more on back
Q more attached
Which features or functions of our competitors’ products do you most appreciate?
Q more on back
Q more attached
If we completely re-designed our products, which features would you most value in the new
products? Mention features you value, even if they are not available on any product in the
market.
Q more on back
Q more attached
Name
Title/Position
Company/Division
e-mail address:
Phone:
Address
Would you be willing to provide input to New Product Development teams? Q yes, contact
me
Appendix C: Feedback Forms • 421
Factory Feedback: What Would Make Our Products Better and Easier to Build?
(One problem/issue per form) Return to:
Date:__________________
1. Problem Type (Quality. Assembly, Cost, Throughput, Delivery etc.) List all that apply.
2. On which Products, Sub-Assemblies, Parts, Drawings, or Procedures?
3. What is the problem or Issue?
Q more on back
Q more attached
4. Speculate as to the Real Cause:
Q more on back
Q more attached
5. Potential Solutions (optional):
Q more on back
Q more attached
Name (optional)
Department
Mailstop/Location:
Phone:
Would you be willing to give input to New Product Development teams? Q yes Q maybe Q no
422 • Appendix C: Feedback Forms
Vendor Feedback: What Would Make Our Products Better and Easier to Build?
(One problem/issue per form) Return to:
Date:__________________
1. Problem Type (Fabrication, Assembly, Cost, Quality. Tolerances, Time, Documentation, etc.)
2. On Which Products, Sub-Assemblies, Parts, Drawings, Liaisons, or Procedures?
3. What is the Problem or Issue?
Q more on back
Q more attached
4. Speculate as to the Real Cause:
Q more on back
Q more attached
5. Potential Solutions (optional):
Q more on back
Q more attached
Name (optional)
Company/Division
Mailstop/Location:
Phone:
Would you be willing to give input to New Product Development teams? Q yes Q maybe Q no
Appendix C: Feedback Forms • 423
Field Service Feedback: What Would Make Our Products Better and Easier to Build?
(One problem/issue per form) Return to:
Date:__________________
1. Problem Type (Service, Repair, Maintenance, Reliability, Customer Satisfaction, etc.)
2. On Which Products, Sub-Assemblies, Parts, Drawings, Liaisons, or Procedures?
3. What is the Problem or Issue?
Q more on back
Q more attached
4. Speculate as to the Real Cause:
Q more on back
Q more attached
5. Potential Solutions (optional):
Q more on back
Q more attached
Name (optional)
Organization
Mailstop/Location:
Phone:
Would you be willing to give input to New Product Development teams? Q yes Q maybe Q no
Appendix D: Resources
D.1 BOOKS CITED
The Toyota Product Development System, by James Morgan and Jeffrey K. Liker (2006,
Productivity Press). This is cited 17 times because Toyota’s design process, especially
Chapters 4, 7, and 10, closely parallels DFM and concurrent engineering principles.
The Machine That Changed the World: The Story of Lean Production, by James Womack,
Daniel Jones, and Daniel Roos (1991, Harper Perennial). Cited 12 times in this book.
Change By Design, by Tim Brown (2009, Harper Business). Cited 9 times.
Why Smart Executives Fail: And What You Can Learn from Their Mistakes, by Sydney
Finkelstein (2003, Portfolio/Penguin Group). Cited 9 times.
The Connected Corporation: How Leading Companies Win Through Customer–Supplier
Alliances, by Jordan D. Lewis (1995, Free Press). Cited 9 times.
The Elegant Solution, by Matthew E. May (2007, Free Press). Cited 7 times.
Lean Thinking: Banish Waste and Create Wealth in Your Corporation, by James P. Womack
and Daniel T. Jones (1996, Simon & Schuster). Cited 7 times.
Authentic Leadership: Rediscovering the Secrets of Creating Lasting Value, by Bill George
(2003, Jossey-Bass). Cited 4 times.
D.2 COMPANION BOOK FOR MATCHING
IMPROVEMENTS IN OPERATIONS
Build-
to-
Order & Mass Customization: The Ultimate Supply Chain
Management and Lean Manufacturing Strategy for Low-Cost On-Demand
Production Without Forecasts or Inventory, by David M. Anderson (2008,
CIM Press).
D.2.1 Book Description
Build-to-order and mass customization represent a business model that
offers an unbeatable combination of responsiveness, cost, and products that
customers want when they want them. It enables companies to build any
product—standard or custom—on demand without forecasts, batches,
inventory, or working capital.
425
426 • Appendix D: Resources
Build-to-order companies enjoy substantial cost advantages from eliminating inventory, forecasting, expediting, kitting, setup, and inefficient
fire-drill efforts to customize products. BTO results in more efficient utilization of people, machinery, and floor space.
Build-to-order substantially simplifies supply chains—not just “managing” them—to the point where parts and materials can be spontaneously
pulled into production without forecasts, MRP, purchasing, waiting, or
warehousing inventory.
Build-to-order is the best way to resupply parts to OEMs or products to
stores who demand rapid replenishment, low cost, and high order fulfillment rates. BTO avoids the classic inventory dilemma: too little inventory saves cost but increases out-of-stocks, missed sales, expediting, and
disappointed customers; too much inventory adds carrying costs and
risks obsolescence.
BTO companies can grow sales and profits by expanding sales through
faster delivery of standard products in addition to customized, derivative,
and niche market products, while avoiding the commodity trap. Build-
to-order companies are the first to market with new technologies because
distribution pipelines do not have to be emptied first.
The mass customization capabilities of build-to-order can quickly and
efficiently customize products for niche markets, countries, regions, industries, stores, and individual customers.
D.2.2 Which Companies Need This
Manufacturing companies with the following challenges need this book:
• Product variety, with too many SKUs to build in batches
• Unreliable forecasts that get worse with more product variety and
market volatility
• Inventory dilemmas, with too many SKUs to stock, but sales are
missed without enough inventory
• Customization drains resources and costs too much on inflexible lines
• Response time is too slow to order parts, wait, setup, and build in batches
A full description can be found at http://www.build-to-order-consulting.
com/books.htm.
Appendix D: Resources • 427
D.3 WEBSITES
www.HalfCostProducts.com [cited 18 times in this book]
Home page: Eight-step half-cost reduction strategy (with links to related articles)
followed by “How Not to Lower Cost” (with links articles on bidding,
offshoring, and cost reduction after design)
Statistics:
Content equivalent to 250 page book; 700 hyperlinks
Articles:
Build-to-Order
Build-to-Order Future
Cost of Quality
Cost Reduction; How Not to
Designing for Build-to-Order
Designing for Lean
Designing for Manufacturability
Designing for Mass Customization
Designing for Quality
Low-Bidding
Mass Customization
Mass Production, end of
Mergers & Acquisitions
Lean Production
Off-Shore Manufacture
Outsourcing
Rationalization
Standardization
SCM Cost Reduction
Total Cost
www.build-to-order-consulting.com
Pages: Home page (with summaries and links), Seminar page (with comments from attendees), Consulting, Implementation, Articles, Books,
Credentials, Client List, Site Map
Articles:
Build-to-Order
Mass Customization
Shortcomings of Mass Production
Business Model for BTO & MC
Achieving Growth with BTO & MC
On-Demand Lean Production
Standardization
Kanban resupply
Hoffman case study
Rationalization
Training for BTO&MC
www.design4manufacturability.com
Pages: Home page (with summaries and links), Seminar page (with comments from attendees), Consulting, Relevance, Applicability,
Implementation, Books, Credentials, Client List, Site Map
Articles:
DFM
Designing Low-Cost Products
Half the Time to Stable Production
Mass Customization
Product Line Rationalization
Build-to-Order
Designing in Quality
Large Part Conversion
Standardization
Vendor/Partnerships
428 • Appendix D: Resources
D.4 DFM SEMINAR
Dr. Anderson has been providing customized in-house training on DFM and
Concurrent Engineering for the last 25 years and has honed the two-day seminar into
a very effective program. He personally prepares and presents all his seminars during which he encourages questions and engages in discussions based on his extensive
experience both training companies and designing and building products. The typical
baseline agenda includes:
Product
Development
Strategy.
Managers and Executives join the class
for this session on how to raise product
development effectiveness to the highest
level. Topics include ensuring the early
availability of resources to form complete
multifunctional teams early, thorough upfront work, how to cut time-to-market in
half, and how to greatly lower total cost.
Multifunctional Teams. This concurrent
engineering session shows how to optimize
product development by creatively simplifying concepts, methodically optimizing
product architecture, raising and resolving
issues early to avoid later changes, concurrently planning manufacturing strategies,
optimizing the utilization of existing engineering, modules, and off-the-shelf parts,
and doing it right the first time.
Designing for Low Cost. The seminar will show how to minimize cost by
design with thorough architecture optimization, designing for easy fabrication
and assembly, designing to minimize the
cost of quality, designing products rightthe-first-time without costly changes,
quantifying total cost, and focusing on
designing to minimize all the elements of
total cost.
Designing in Quality & Reliability.
The seminar will show how quality and
reliability can be assured by design through
integrated product/process design, concept
simplicity, optimizing tolerances, selecting
parts for quality, minimizing cumulative
effects, and mistake-proofing the design with
poka-yoke.
Designing for Lean. Dr. Anderson is in
a unique position to show how to develop
products for Lean Production, BTO, and
Mass Customization, having written two
books on the subject. His 2008 BTO&MC
book is described next.
Design Guidelines. The seminar will
present dozens of design guidelines for
assembly, part fabrication, quality, and
reliability.
Standardization. This session presents a
practical and effective procedure he developed to generate standard parts lists that
are only a few percent of proliferated parts
lists that are common in most companies.
What Happens Next. The seminar concludes with class discussions on “What
happens next,” in which attendees suggest what should change and then vote on
their choices, which provides a prioritized
list which can be used as a good starting
point for his facilitated implementation
meeting.
Contact: 805-924-0100 or anderson@)build-to-order-consulting.com
Appendix D: Resources • 429
D.5 SEMINAR ON BTO & MASS CUSTOMIZATION
Introduction. The seminar will begin
with discussions of the challenges and
opportunities facing the company with
respect to responsiveness, cost, product
variety, growth, and profits.
Shortcomings of Mass Production. Mass
production was the ideal way to make
Model T’s in the 1920s, but is not suitable
for today’s environment of increasing product variety and market volatility.
Supply Chain Simplification. Rather
than just “managing” complex supply
chains with an unnecessary proliferation
of parts and suppliers, this seminar will
show how to rationalize product Jines,
standardize parts and materials, establish a spontaneous supply chain which
can pull in standard parts and materials
automatically.
Outsourcing
vs.
Integration. Dr.
Anderson will show how excessive outsourcing to far-flung supply chains hampers
responsiveness while not really reducing
cost on a total cost basis. Instead, he will
show how the optimal level of integration
greatly improves product development and
enables manufacturers to quickly and cost
effectively build parts on-demand and then
assemble them to-order.
On-demand Lean Production extends
the proven principles of Lean Production,
setup elimination, cellular manufacture,
and flow production to enable operations to build any product any time in any
quantity in a truly batch-size-of-one mode
without forecasts or inventory.
Mass customization. The same operations and supply chain employed for
standard products can efficiently mass
customize a wide range of products for
many niche markets, countries, regions,
industries, dealers, stores, and individual
customers.
Product development for BTO&MC. Dr.
Anderson draws on 25 years experience
teaching DFM to show how to concurrently engineer families of products and
versatile processes for build-to-order and
mass customization.
Cost Reduction Strategies. BTO and
mass customization offer many opportunities to substantially reduce total cost
by eliminating all the costs of setup and
inventory while minimizing overhead
costs for customization, quality, distribution, and material overhead.
Implementation. Practical implementation strategies will be presented for several
independently justifiable and self-supporting implementation steps. Then Dr.
Anderson will facilitate discussions about
over all strategies, implementation scenarios, roadmaps, and subsequent implementation initiatives.
The Business Case. Finally, the seminar
will present the business case for build-toorder and mass customization, itemizing
all the advantages for cost, responsiveness,
and customer satisfaction, including strategies for growth of sales and profits.
Contact Dr. Anderson at: 805-924-0100 or
anderson@build-to-order-consulting.com.
430 • Appendix D: Resources
D.6 WORKSHOPS FACILITATED BY DR. ANDERSON
D.6.1 Product-Specific Workshop
After a DFM seminar, a new team immediately applies DFM principles to a
new product development project. The workshop focuses on thorough up-
front work, including lessons learned, concept innovations, and architecture
optimization. These exercises themselves would be the start of many actual
tasks, which would be continued after the workshop. The timing would be
after a new team is formed but before any design decisions are cast in concrete.
D.6.2 Commercialization Workshop
This workshop shows companies how to commercialize ideas, experiments, breadboards, research, proofs-of-principle, prototypes, patents, or
acquired technology. Commercialization may be necessary for the commercial success of innovations coming from startup ventures or company
research efforts to retain the desired functionality (the crown jewels) while
designing everything else to be readily manufacturable at low cost and
ramped up quickly with high quality designed in. For small companies or
startups, this can be offered as a stand-alone workshop.
D.6.3 DFM Replacements of Large Weldments and Castings
The goal of this workshop is to demonstrate how to develop more manufacturable replacements for large weldments and castings that are expensive to build
because mounting holes must be drilled into the raw casting or weldment
on large mega-machine tools with high hourly charges for setup, machining,
repositionings, and inspections. DFM principles would be applied to replace
these hard-to-build large parts with assemblies of readily manufacturable
parts that can be machined on ordinary CNC machine tools and assembled
precisely and rigidly by DFM techniques, resulting in low-cost parts that
could replace their high-cost counterparts on existing products and become
the foundations for new products. The approach is discussed in Section 9.5.
D.6.4 Standardization Workshop
This workshop presents standardization principles, summarizes all the
benefits, and starts with the early steps, such as issuing lists of all existing
Appendix D: Resources • 431
parts to immediately stop parts proliferations and eliminate approved
but unused parts. Then a standardization task force would prioritize categories to standardize and start the standardization steps discussed in
Chapter 5. This procedure enables Lean Production and BTO, improves
product development, ensures availability, and reduces part cost, expediting, and inventory while reducing material overhead costs an order of
magnitude for standard parts.
D.6.5 Product Line Rationalization Workshop
This workshop presents product line rationalization principles, converges
on products to investigate, and starts the rationalization process to identify the high-profit products to keep and the money-losers to either drop,
outsource away, improve, or combine into synergistic product families.
Rationalization frees up resources for complete product development
teams and enables spontaneous supply chains and on-demand production to enable build-to-order and mass customization, summarized in
Chapter 4.
D.7 DESIGN STUDIES AND CONSULTING
D.7.1 Half-Cost Design Studies
Half-cost products depend on breakthrough concepts. Sometimes these
come from the brainstorming sessions that Dr. Anderson facilitates in
workshops. More challenging endeavors may require his concept studies,
in which he generates breakthrough concepts that concurrent engineering
teams can develop into manufacturable products. Dr. Anderson is particularly effective with complex products that could benefit from simplified concepts, clever architecture, easy-to-build structures, and ingenious
ways of controlling and guiding part motions.
D.7.2 Design Studies on Mechanisms
Dr. Anderson has expertise on linkage and mechanism design, starting
with his doctorate thesis and spanning 35 years of industrial experience,
four patents, and numerous kinematics and design studies for robots,
manipulators, material handling products, production equipment, feeding
432 • Appendix D: Resources
mechanisms, and low-cost, lightweight motion guidance and mechanical coupling.
D.7.3 Design Studies on Large Part Conversions
Dr. Anderson’s DFM principles, years of experience, and skills in both
machining and welding enable him to deliver design studies to convert
hard-to-build weldments and castings to more manufacturable assembled
structures, as discussed in Section 9.5. For large structures, he can execute
conceptual design of lightweight, low-cost trusses and 3D space frames in
which the nodes both connect low-cost struts and provide precision holes
for all the attachment points.
D.7.4 Consulting
After DFM training and possibly workshops, companies will benefit from
ongoing consulting interactions with product development teams to help
them apply DFM principles, optimize designs, and make the best strategic
decisions throughout their projects.
Dr. Anderson’s e-mail: anderson@build-to-order-consulting.com.
Prod uct Developm e nt
Design for Manufacturability: How to Use Concurrent Engineering to Rapidly
Develop Low-Cost, High-Quality Products for Lean Production shows how to
use concurrent engineering teams to design products for all aspects of manufacturing with the lowest cost, the highest quality, and the quickest time to stable
production. Extending the concepts of design for manufacturability to an
advanced product development model, it explains how to simultaneously make
major improvements in all these product development goals, while enabling
effective implementation of Lean Production and quality programs.
Illustrating how to make the most of lessons learned from previous projects, the
book proposes numerous improvements to current product development
practices, education, and management. It outlines effective procedures to
standardize parts and materials, save time and money with off-the-shelf parts,
and implement a standardization program. It also spells out how to work with the
purchasing department early on to select parts and materials that maximize
quality and availability while minimizing part lead-times and ensuring desired
functionality.
• Describes how to design families of products for Lean Production,
build-to-order, and mass customization
• Emphasizes the importance of quantifying all product and overhead
costs and then provides easy ways to quantify total cost
• Details dozens of design guidelines for product design, including
assembly, fastening, test, repair, and maintenance
• Presents numerous design guidelines for designing parts for
manufacturability
• Shows how to design in quality and reliability with many quality
guidelines and sections on mistake-proofing (poka-yoke)
Describing how to design parts for optimal manufacturability and compatibility
with factory processes, the book provides a big picture perspective that emphasizes designing for the lowest total cost and time to stable production. After
reading this book you will understand how to reduce total costs, ramp up quickly
to volume production without delays or extra cost, and be able to scale up
production rapidly so as not to limit growth.
K21414