/


Text
Performance Comparison of Various
Feature Extraction Methods for Object
Recognition on Caltech-101 Image
Dataset
Check for
updates
Monika, Munish Kumar, and Manish Kumar
Abstract Object recognition system helps to find the label of the object in an image.
The identification of the object depends on the features extracted from the image.
Features play a very important role in the object recognition system. The more rele-
vant features an object has, the better the recognition system will be. Object recog-
nition system mainly works in two major phases—feature extraction and image
classification. Features may be the color, shape, texture, or some other information
of the object. There are various types of feature extraction methods used in object
recognition. These methods are classified as handcrafted feature extraction methods
and deep learning feature extraction methods. This article contains a comprehen-
sive study of various popular feature extraction methods used in object recognition
system. Various handcrafted methods used in the paper are scale invariant feature
transformation (SIFT), speeded-up robust feature (SURF), oriented FAST and rotated
BRIEF (ORB), Shi-Tomasi comer detector, and Haralick texture descriptor. The
deep learning feature extraction methods used in the paper are ResNet50, Xcep-
tion, and VGG19. In this article, a comparative study of various popular feature
extraction methods is also presented for object recognition using five multi-class
classification methods—Gaussian Naive Bayes, k-NN, decision tree, random forest,
and XGBoosting classifier. The analysis of the performance is conducted in terms of
recognition accuracy, precision, Fl-score, area under curve, false positive rate, root
mean square error, and CPU elapsed time. The experimental results are evaluated
on a standard benchmark image dataset Caltech-101 which comprises 8677 images
grouped in 101 classes.
Keywords Object recognition • Feature extraction • Image classification • Deep
learning
Monika
Department of Computer Science, Punjabi University, Patiala, India
M. Kumar (ES)
Department of Computational Sciences, Maharaja Ranjit Singh Punjab Technical University,
Bathinda, Punjab, India
M. Kumar
Department of Computer Science, Baba Farid College, Bathinda, Punjab, India
© The Author(s), under exclusive license to Springer Nature Singapore Pte Ltd. 2021 289
A. Choudhary et al. (eds.), Applications of Artificial Intelligence and Machine Learning,
Lecture Notes in Electrical Engineering 778,
https://doi.org/10.1007/978-981-16-3067-5_22
Performance Comparison of Various Feature ...
295
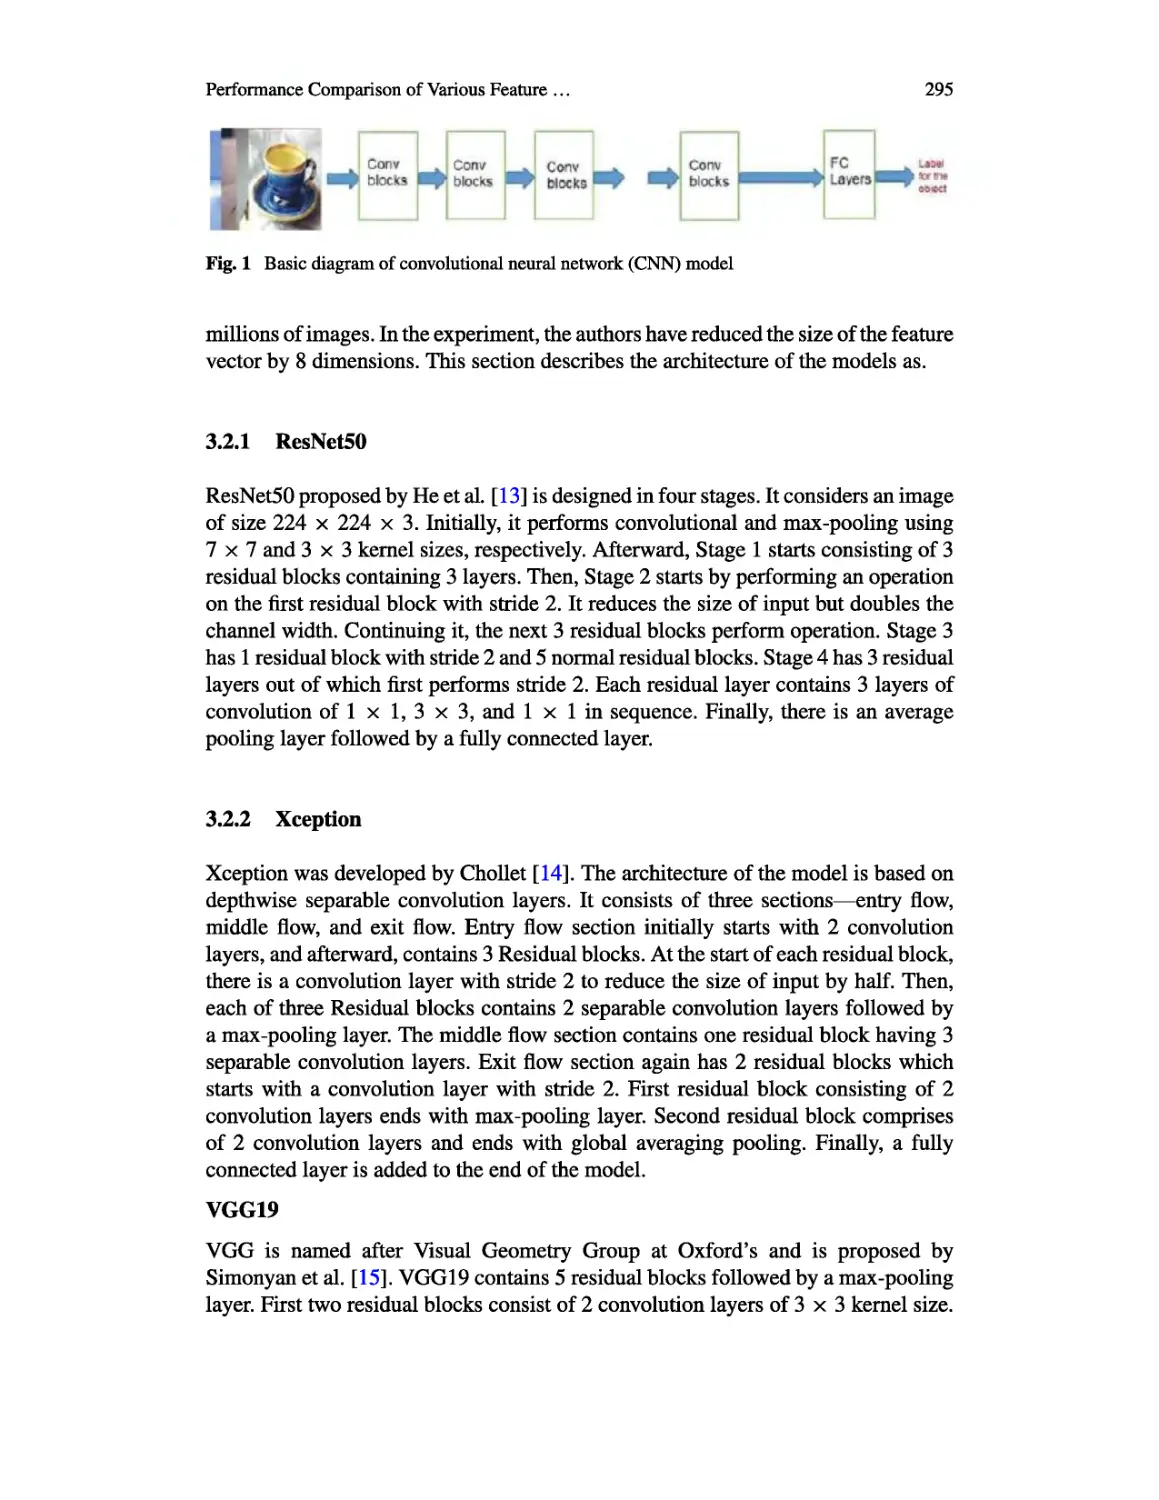
Fig. 1 Basic diagram of convolutional neural network (CNN) model
millions of images. In the experiment, the authors have reduced the size of the feature
vector by 8 dimensions. This section describes the architecture of the models as.
3.2.1 ResNet50
ResNet50 proposed by He et al. [13] is designed in four stages. It considers an image
of size 224 x 224 x 3. Initially, it performs convolutional and max-pooling using
7x7 and 3x3 kernel sizes, respectively. Afterward, Stage 1 starts consisting of 3
residual blocks containing 3 layers. Then, Stage 2 starts by performing an operation
on the first residual block with stride 2. It reduces the size of input but doubles the
channel width. Continuing it, the next 3 residual blocks perform operation. Stage 3
has 1 residual block with stride 2 and 5 normal residual blocks. Stage 4 has 3 residual
layers out of which first performs stride 2. Each residual layer contains 3 layers of
convolution of 1 x 1, 3 x 3, and 1 x 1 in sequence. Finally, there is an average
pooling layer followed by a fully connected layer.
3.2.2 Xception
Xception was developed by Chollet [14]. The architecture of the model is based on
depthwise separable convolution layers. It consists of three sections—entry flow,
middle flow, and exit flow. Entry flow section initially starts with 2 convolution
layers, and afterward, contains 3 Residual blocks. At the start of each residual block,
there is a convolution layer with stride 2 to reduce the size of input by half. Then,
each of three Residual blocks contains 2 separable convolution layers followed by
a max-pooling layer. The middle flow section contains one residual block having 3
separable convolution layers. Exit flow section again has 2 residual blocks which
starts with a convolution layer with stride 2. First residual block consisting of 2
convolution layers ends with max-pooling layer. Second residual block comprises
of 2 convolution layers and ends with global averaging pooling. Finally, a fully
connected layer is added to the end of the model.
VGG19
VGG is named after Visual Geometry Group at Oxford’s and is proposed by
Simonyan et al. [15]. VGG19 contains 5 residual blocks followed by a max-pooling
layer. First two residual blocks consist of 2 convolution layers of 3 x 3 kernel size.
Performance Comparison of Various Feature ...
299
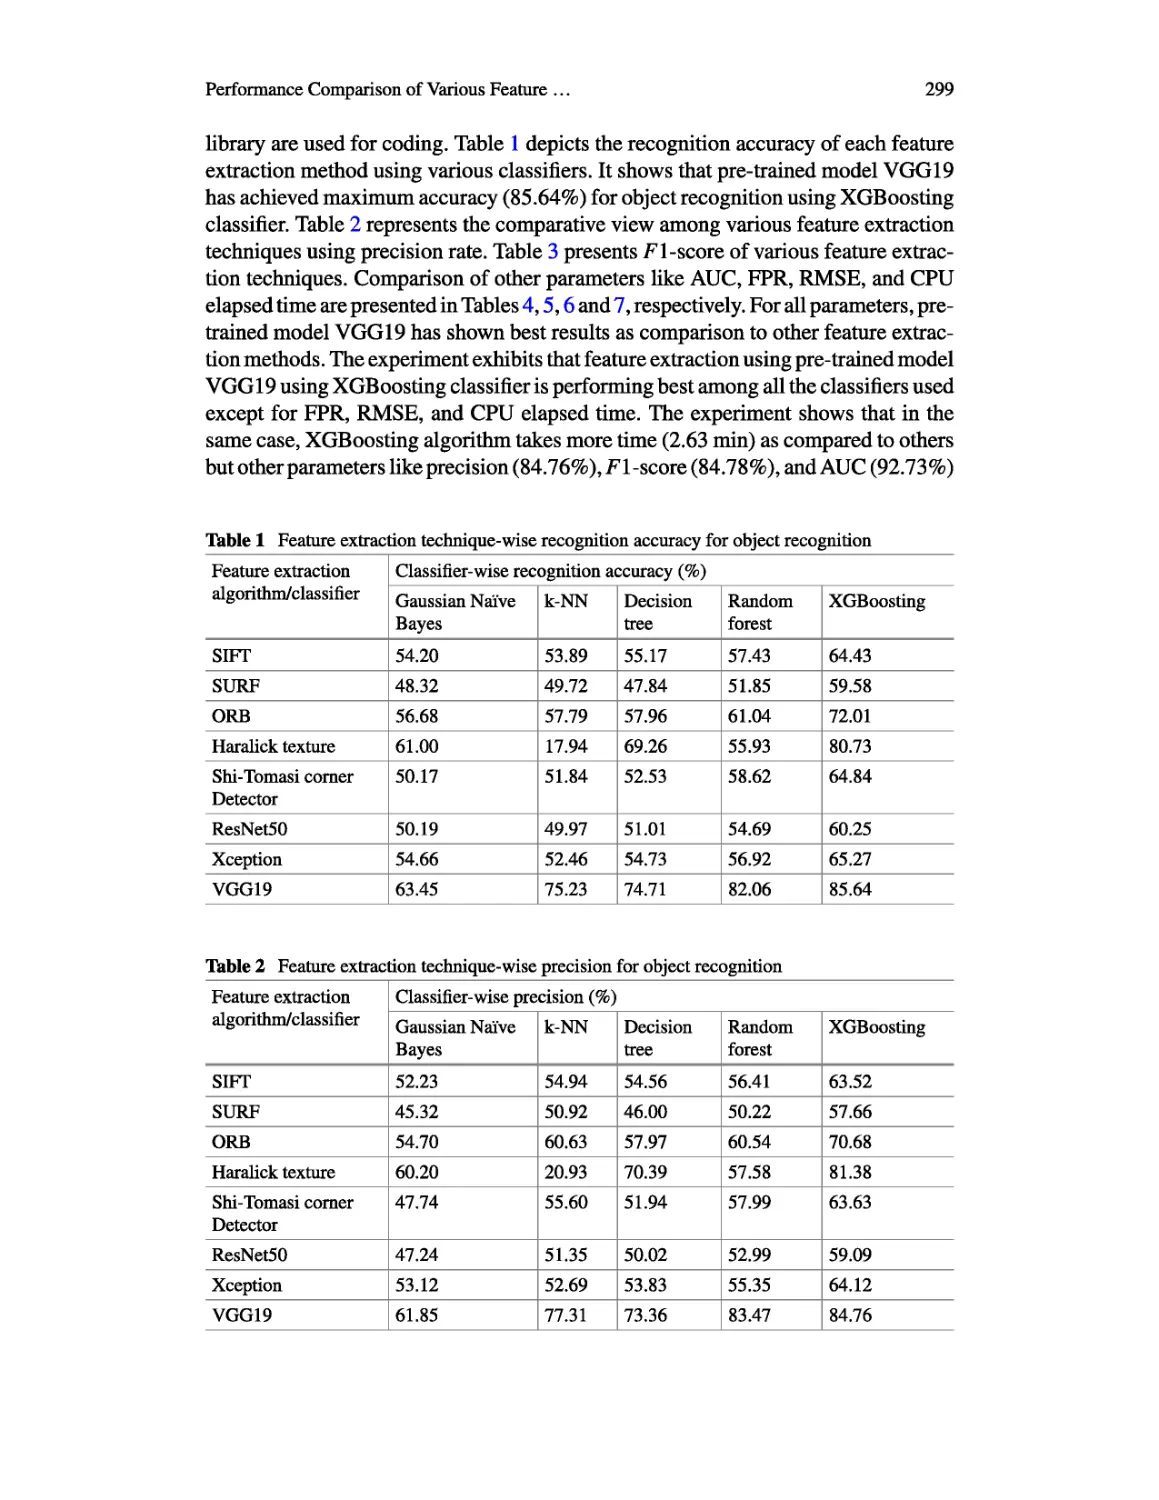
library are used for coding. Table 1 depicts the recognition accuracy of each feature
extraction method using various classifiers. It shows that pre-trained model VGG19
has achieved maximum accuracy (85.64%) for object recognition using XGBoosting
classifier. Table 2 represents the comparative view among various feature extraction
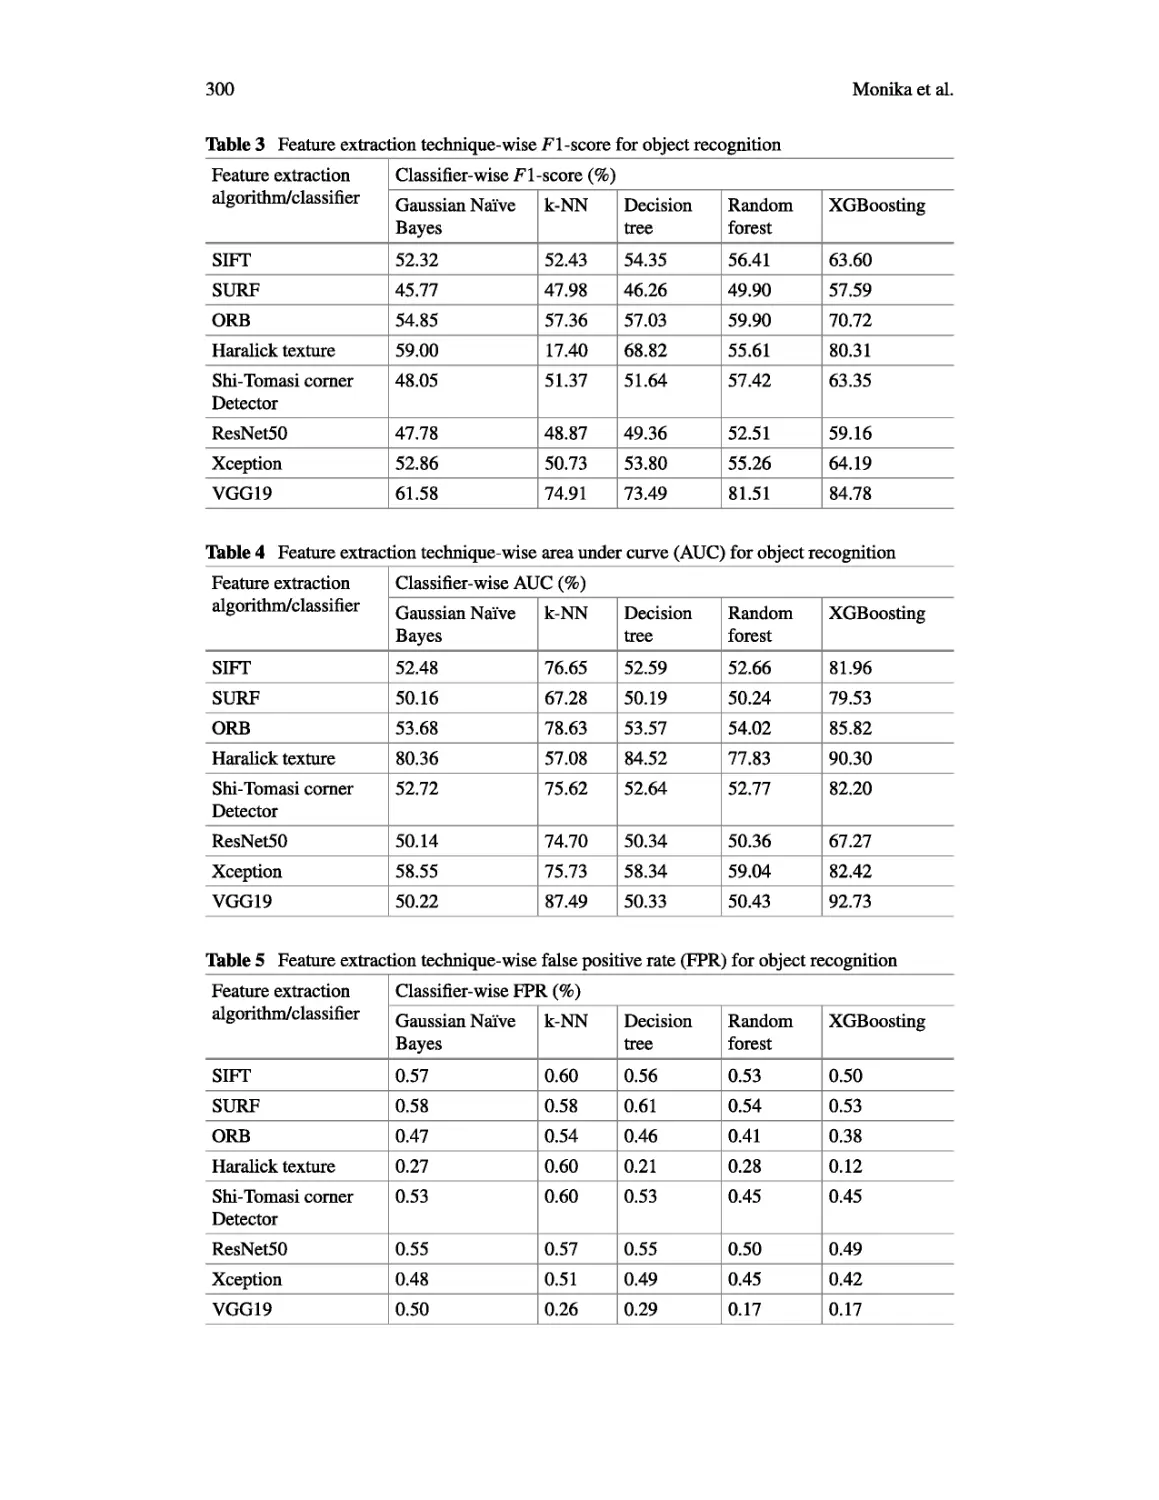
techniques using precision rate. Table 3 presents Fl-score of various feature extrac-
tion techniques. Comparison of other parameters like AUC, FPR, RMSE, and CPU
elapsed time are presented in Tables 4,5,6 and 7, respectively. For all parameters, pre-
trained model VGG19 has shown best results as comparison to other feature extrac-
tion methods. The experiment exhibits that feature extraction using pre-trained model
VGG19 using XGBoosting classifier is performing best among all the classifiers used
except for FPR, RMSE, and CPU elapsed time. The experiment shows that in the
same case, XGBoosting algorithm takes more time (2.63 min) as compared to others
but other parameters like precision (84.76%), Fl-score (84.78%), and AUC (92.73%)
Table 1 Feature extraction technique-wise recognition accuracy for object recognition
Feature extraction algorithm/classifier Classifier-wise recognition accuracy (%)
Gaussian Naive Bayes k-NN Decision tree Random forest XGBoosting
SIFT 54.20 53.89 55.17 57.43 64.43
SURF 48.32 49.72 47.84 51.85 59.58
ORB 56.68 57.79 57.96 61.04 72.01
Haralick texture 61.00 17.94 69.26 55.93 80.73
Shi-Tomasi comer Detector 50.17 51.84 52.53 58.62 64.84
ResNet50 50.19 49.97 51.01 54.69 60.25
Xception 54.66 52.46 54.73 56.92 65.27
VGG19 63.45 75.23 74.71 82.06 85.64
Table 2 Feature extraction technique-wise precision for object recognition
Feature extraction algorithm/classifier Classifier-wise precision (%)
Gaussian Naive Bayes k-NN Decision tree Random forest XGBoosting
SIFT 52.23 54.94 54.56 56.41 63.52
SURF 45.32 50.92 46.00 50.22 57.66
ORB 54.70 60.63 57.97 60.54 70.68
Haralick texture 60.20 20.93 70.39 57.58 81.38
Shi-Tomasi comer Detector 47.74 55.60 51.94 57.99 63.63
ResNet50 47.24 51.35 50.02 52.99 59.09
Xception 53.12 52.69 53.83 55.35 64.12
VGG19 61.85 77.31 73.36 83.47 84.76
300
Monika et al.
Table 3 Feature extraction technique-wise Fl-score for object recognition
Feature extraction algorithm/classifier Classifier-wise Fl-score (%)
Gaussian Naive Bayes k-NN Decision tree Random forest XGBoosting
SIFT 52.32 52.43 54.35 56.41 63.60
SURF 45.77 47.98 46.26 49.90 57.59
ORB 54.85 57.36 57.03 59.90 70.72
Haralick texture 59.00 17.40 68.82 55.61 80.31
Shi-Tomasi comer Detector 48.05 51.37 51.64 57.42 63.35
ResNet50 47.78 48.87 49.36 52.51 59.16
Xception 52.86 50.73 53.80 55.26 64.19
VGG19 61.58 74.91 73.49 81.51 84.78
Table 4 Feature extraction technique-wise area under curve (AUC) for object recognition
Feature extraction algorithm/classifier Classifier-wise AUC (%)
Gaussian Naive Bayes k-NN Decision tree Random forest XGBoosting
SIFT 52.48 76.65 52.59 52.66 81.96
SURF 50.16 67.28 50.19 50.24 79.53
ORB 53.68 78.63 53.57 54.02 85.82
Haralick texture 80.36 57.08 84.52 77.83 90.30
Shi-Tomasi comer Detector 52.72 75.62 52.64 52.77 82.20
ResNet50 50.14 74.70 50.34 50.36 67.27
Xception 58.55 75.73 58.34 59.04 82.42
VGG19 50.22 87.49 50.33 50.43 92.73
Table 5 Feature extraction technique-wise false positive rate (FPR) for object recognition
Feature extraction algorithm/classifier Classifier-wise FPR (%)
Gaussian Naive Bayes k-NN Decision tree Random forest XGBoosting
SIFT 0.57 0.60 0.56 0.53 0.50
SURF 0.58 0.58 0.61 0.54 0.53
ORB 0.47 0.54 0.46 0.41 0.38
Haralick texture 0.27 0.60 0.21 0.28 0.12
Shi-Tomasi comer Detector 0.53 0.60 0.53 0.45 0.45
ResNet50 0.55 0.57 0.55 0.50 0.49
Xception 0.48 0.51 0.49 0.45 0.42
VGG19 0.50 0.26 0.29 0.17 0.17
Performance Comparison of Various Feature ...
301
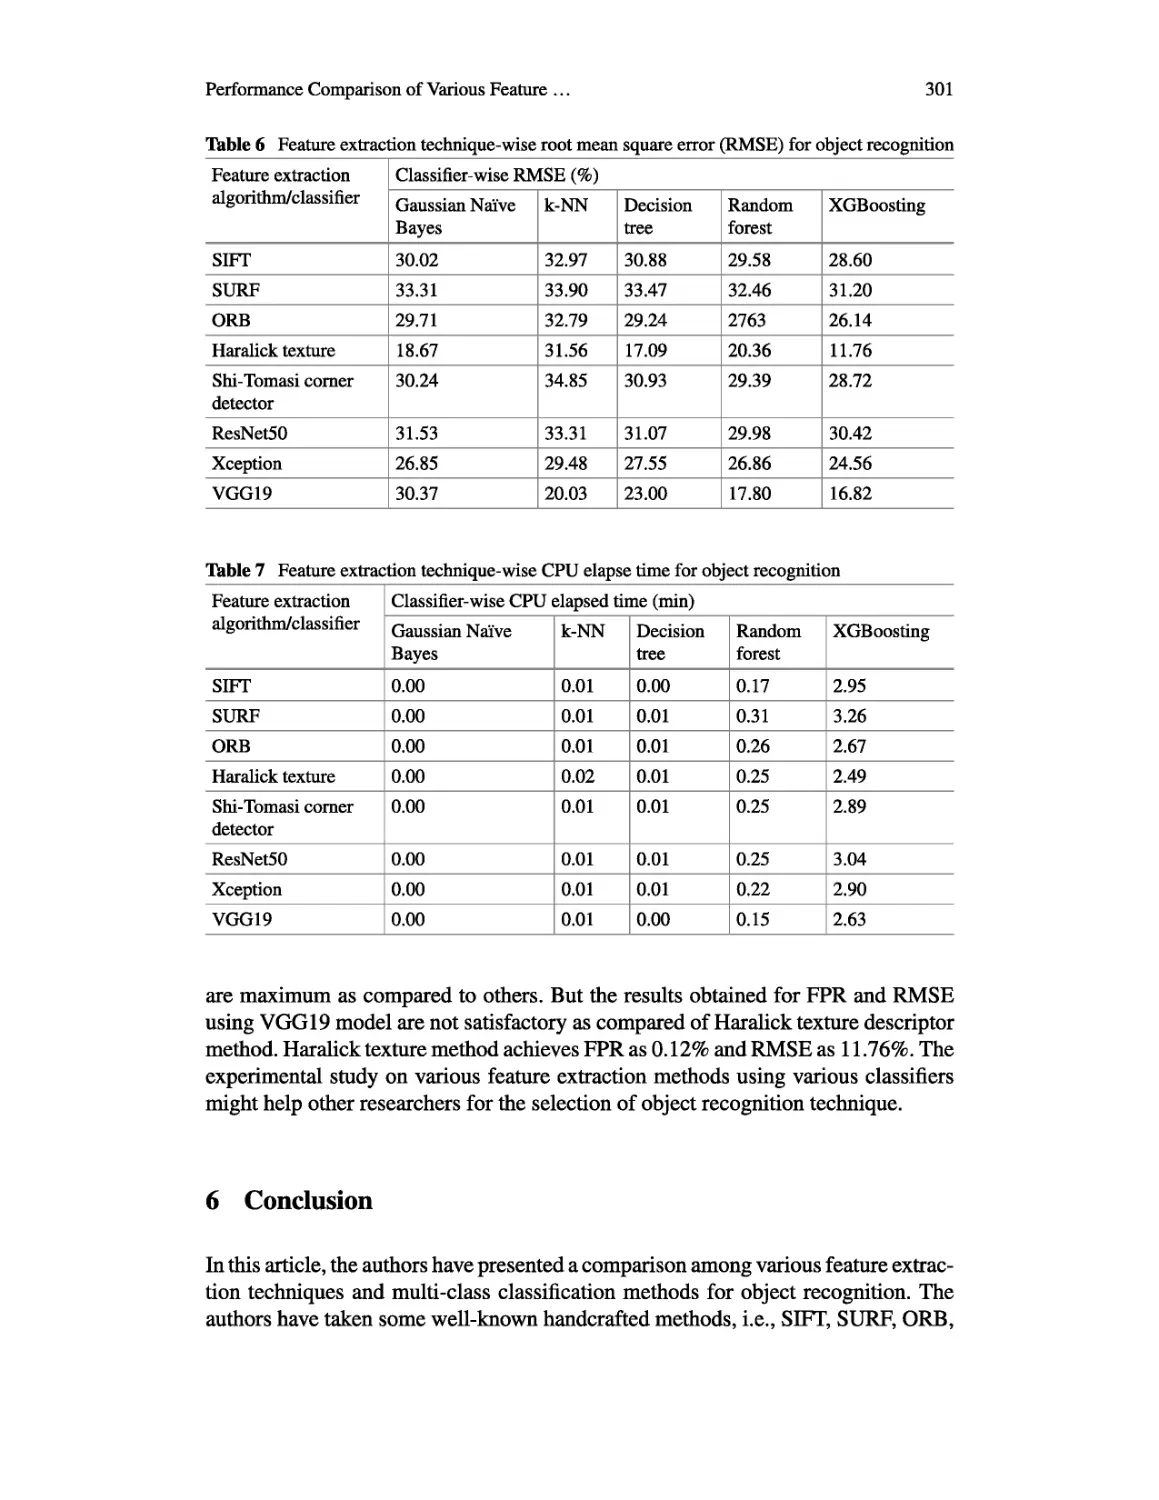
Table 6 Feature extraction technique-wise root mean square error (RMSE) for object recognition
Feature extraction algorithm/classifier Classifier-wise RMSE (%)
Gaussian Naive Bayes k-NN Decision tree Random forest XGBoosting
SIFT 30.02 32.97 30.88 29.58 28.60
SURF 33.31 33.90 33.47 32.46 31.20
ORB 29.71 32.79 29.24 2763 26.14
Haralick texture 18.67 31.56 17.09 20.36 11.76
Shi-Tomasi comer detector 30.24 34.85 30.93 29.39 28.72
ResNet50 31.53 33.31 31.07 29.98 30.42
Xception 26.85 29.48 27.55 26.86 24.56
VGG19 30.37 20.03 23.00 17.80 16.82
Table 7 Feature extraction technique-wise CPU elapse time for object recognition
Feature extraction algorithm/classifier Classifier-wise CPU elapsed time (min)
Gaussian Naive Bayes k-NN Decision tree Random forest XGBoosting
SIFT 0.00 0.01 0.00 0.17 2.95
SURF 0.00 0.01 0.01 0.31 3.26
ORB 0.00 0.01 0.01 0.26 2.67
Haralick texture 0.00 0.02 0.01 0.25 2.49
Shi-Tomasi comer detector 0.00 0.01 0.01 0.25 2.89
ResNet50 0.00 0.01 0.01 0.25 3.04
Xception 0.00 0.01 0.01 0.22 2.90
VGG19 0.00 0.01 0.00 0.15 2.63
are maximum as compared to others. But the results obtained for FPR and RMSE
using VGG19 model are not satisfactory as compared of Haralick texture descriptor
method. Haralick texture method achieves FPR as 0.12% and RMSE as 11.76%. The
experimental study on various feature extraction methods using various classifiers
might help other researchers for the selection of object recognition technique.
6 Conclusion
In this article, the authors have presented a comparison among various feature extrac-
tion techniques and multi-class classification methods for object recognition. The
authors have taken some well-known handcrafted methods, i.e., SIFT, SURF, ORB,