/


Text
THE ROLE OF
TRACE METALS IN PETROLEUM
THE ROLE OF
TRACE METALS IN PETROLEUM
T. F. Yen
Associate Professor of Chemical Engineering, Environmental Engineering Sciences, and Medicine (Biochemistry) University of Southern California, Los Angeles
■ ann arbor science publishers inc.
P.O. BOX 1425 e ANN ARBOR, MICHIGAN 48106
Copyright© 1975 by Ann Arbor Science Publishers, Inc. P. 0. Box 1425, Ann Arbor, Michigan 48106
Library of Congress Catalog Card No. 74-77404 ISBN 0-250-40061-8
Manufactured in the United States of America All Rights Reserved
PREFACE
Petroleum has been known since the dawn of modern civilization. Although large quantities have been recovered and consumed, the basic science of petroleum is still developing. Specifically, very little is known about the role of metals in petroleum. Although the amount of metals present in petroleum is trace, the impact of successful industrial processing on clean environmental control is immense.
Trace metals present in petroleum are important both in the genesis of petroleum and its refining. Furthermore, the consequence of emission and erosion is directly related to metals. An understanding of this nature will increase the knowledge of the scientists as well as of the energy-concerned public.
This book is a general survey of the nature of trace metals in petroleum, followed by the analytical methods for determination of metals in petroleum. The topics of the metals present in by-rpoducts of petroleum are then discussed. Basic information on geochemistry, bondings, demetallation and newly discovered metals such as molybdenum is presented. Finally, the important problem of recovery of these trace metals for resource use is raised.
This book developed from the symposium on "The Role of Trace Metals in Petroleum" sponsored by the American Chemical Society, Chicago, August 1973, of which the present editor was the chairman. Through this period, the zeal and interest of many authors never diminished, and for this I am grateful. I also thank Mrs. Darlene Baxter and many other students for their help.
T. F. Yen May, 1975
v
CONTENTS
1. Chemical Aspects of Metals in Native
Petroleum 1
T. F. Yen
2. The Nature of Metals in Petroleum .... 31
R. H. Filby
3. Determination of Trace Metals in
Petroleum—General Considerations .... 59
J. Eppolito and H. A. Braier
4. Determination of Trace Metals in
Petroleum—Instrumental Methods 65
H. A. Braier and J. Eppolito
5. Neutron Activation Methods for Trace
Elements in Crude Oils 89
R. H. Filby and K. R. Shah
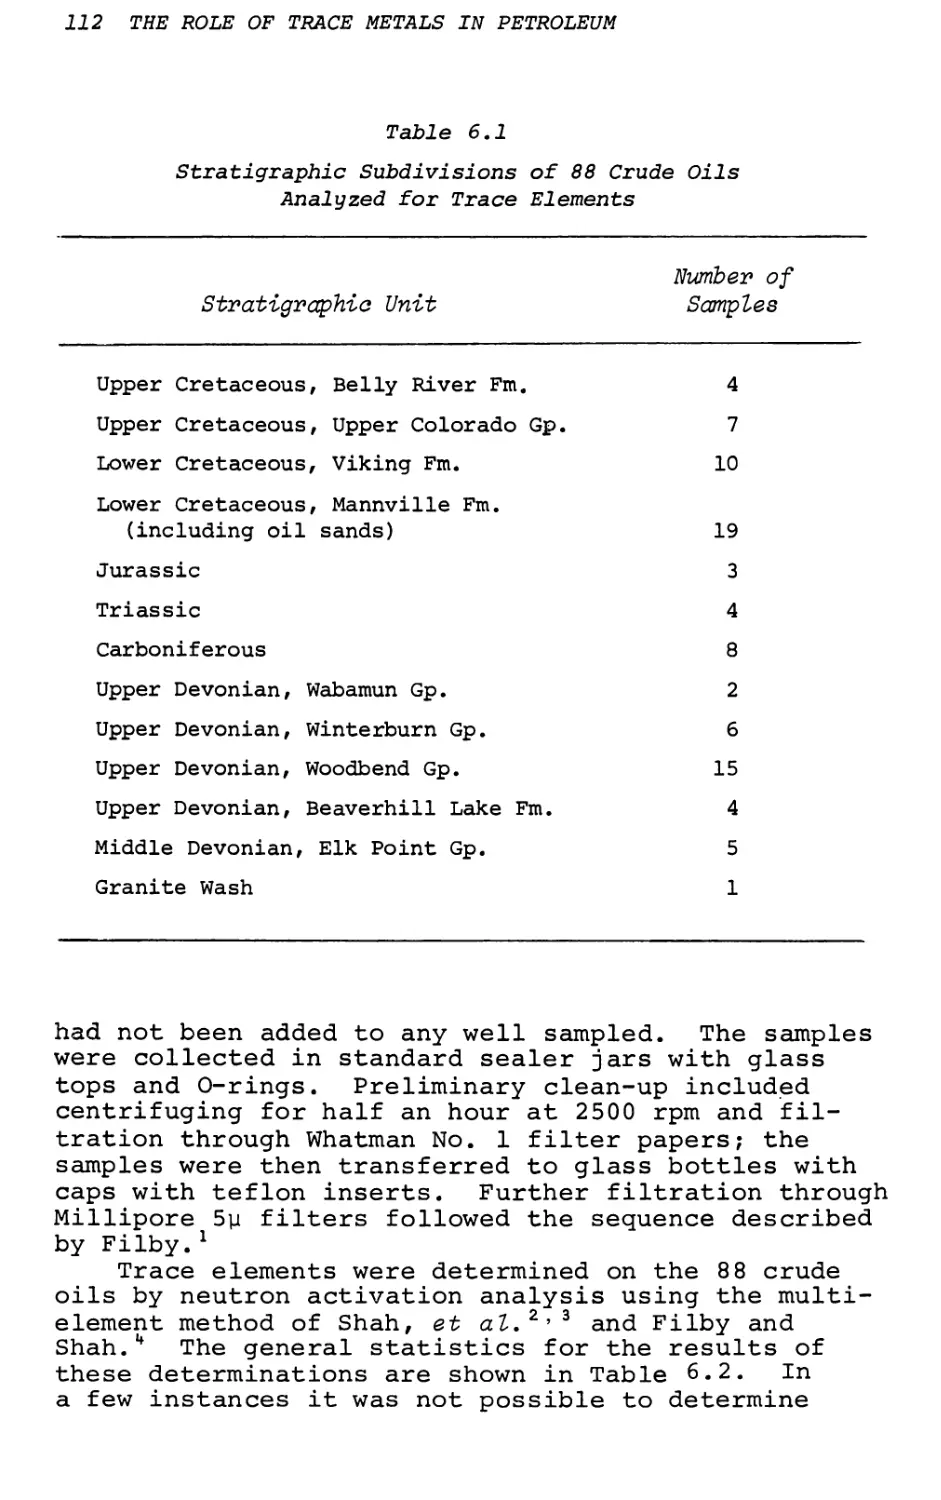
6. Geochemistry of Trace Elements in Crude
Oils, Alberta, Canada Ill
B. Hitchon, R. H. Filby and K. R. Shah
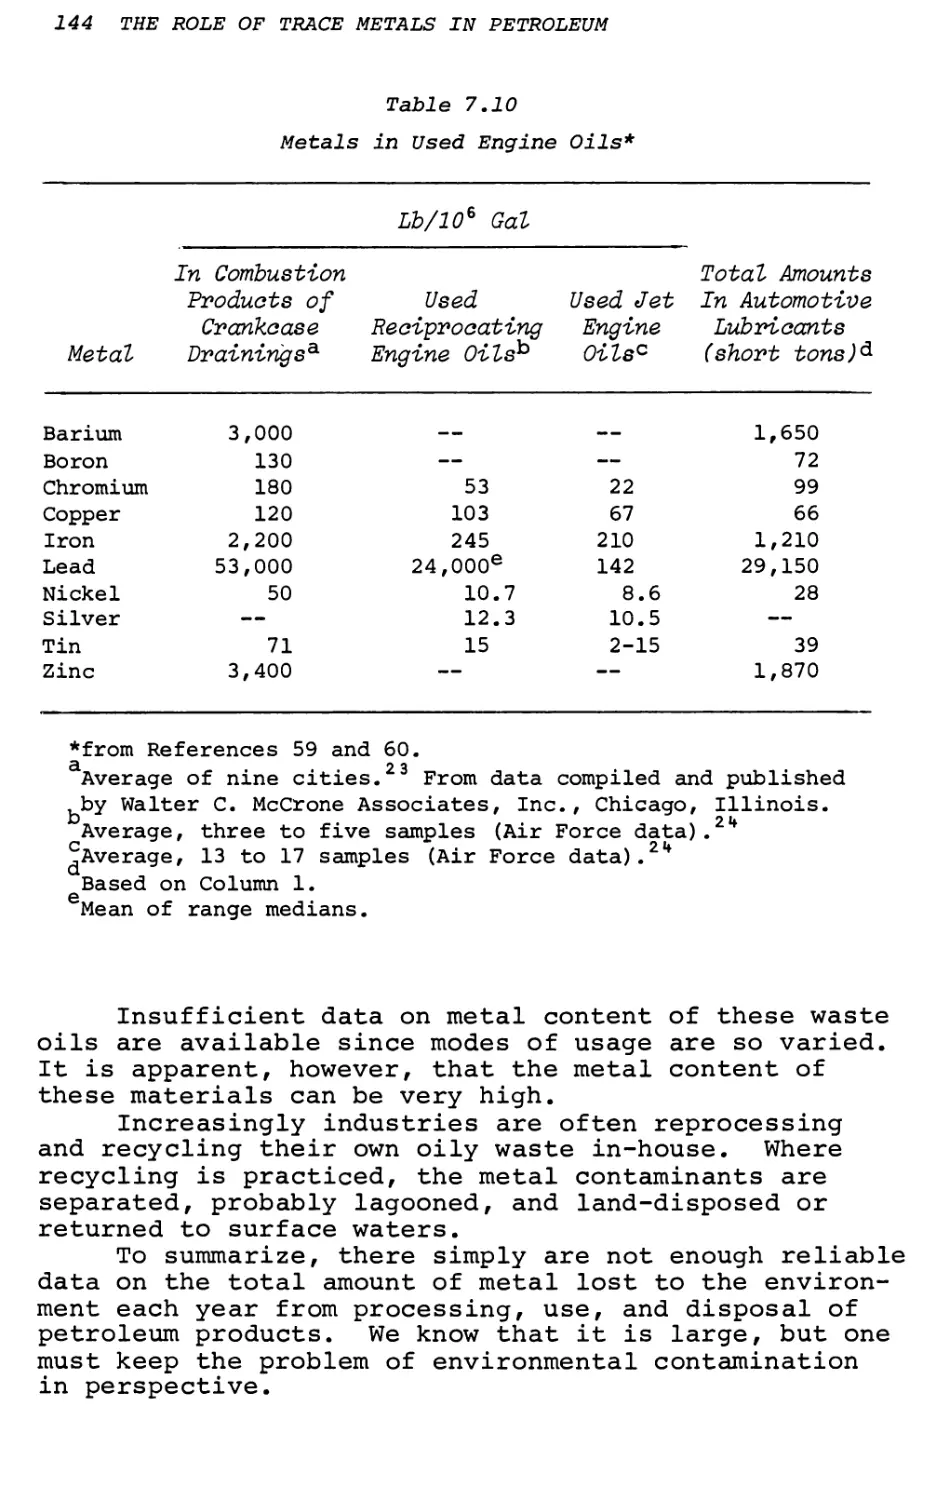
7. Metals in New and Used Petroleum Products
and By-Products—Quantities and Consequences 123
I. C. Smith, T. L. Ferguson and B, L. Carson
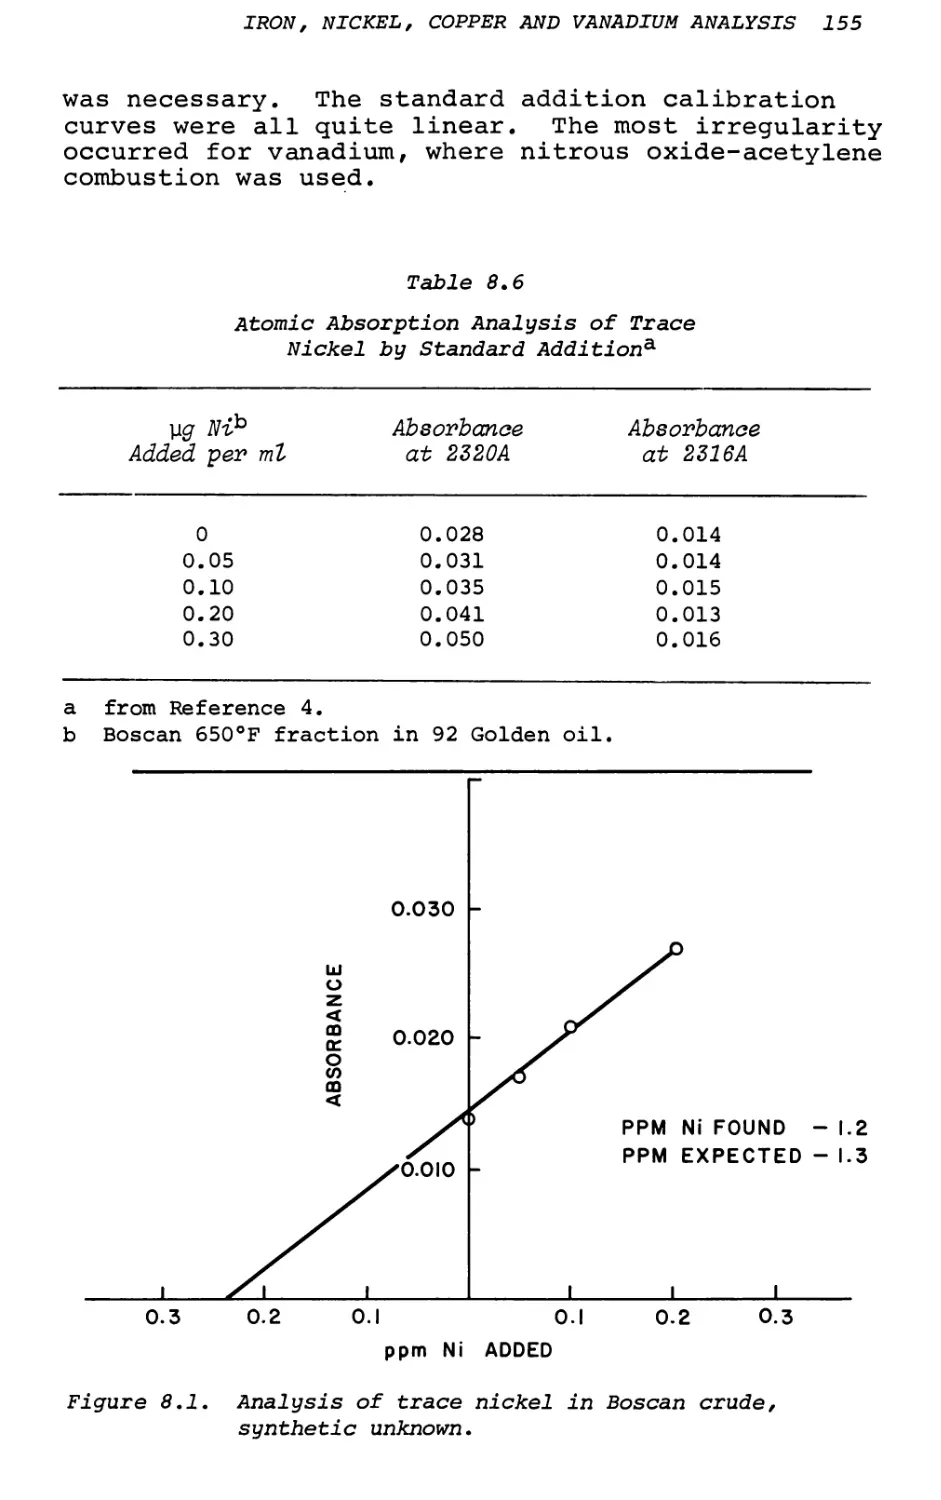
8. Trace Analysis of Iron, Nickel, Copper
and Vanadium in Petroleum Products . . . 149
A. J. Smith, J. 0. Rice, W. C. Shaner, Jr. and C. C. Cerato
9. The Occurrence of Molybdenum in
Petroleum 161
W. K. T. Gleim, J. G. Gatsis and C. J. Perry
vii
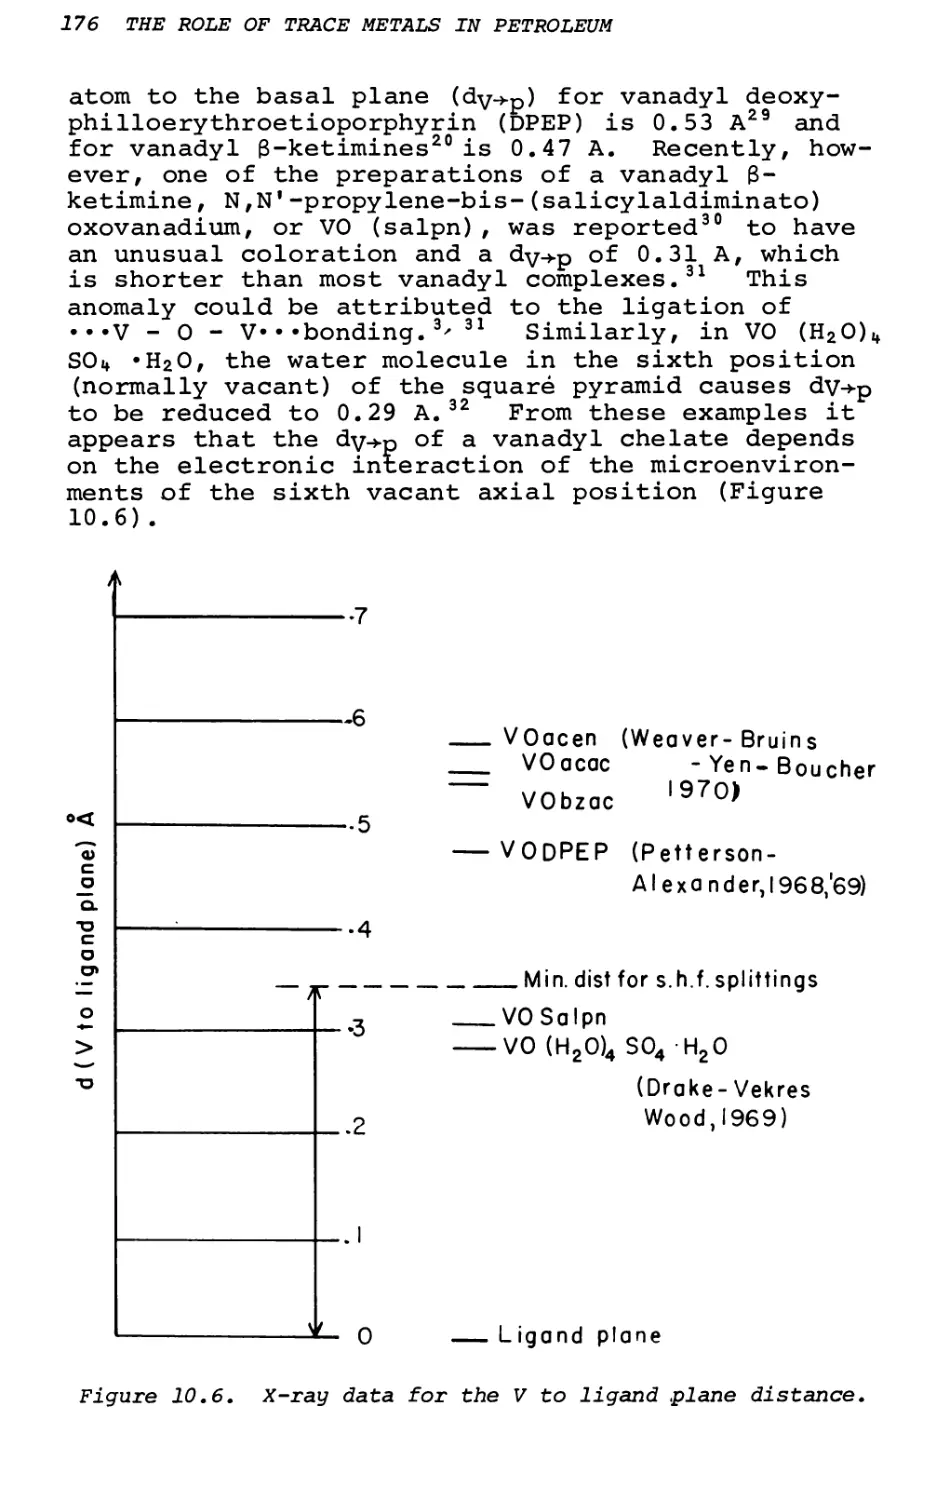
167
10. Vanadium and Its Bonding in Petroleum . .
T. F. Yen
11. Oxidative Demetallation of Oxovanadium(IV)
Porphyrins 183
J. Af. Sugihara, J. F. Branthaver and
K. w. Willcox
12. Kinetics Studies of Demetallation of
Metalloporphyrins by Acids 195
B. Don and T. F. Yen
13. American Oil Refineries: Can They Yield
Vanadium? 201
J?. P. Fischer
14. Free World Supply and Demand for Vanadium
From 1973 Through 1980 207
F. J. Shortsleeve
INDEX
215
CHAPTER 1
CHEMICAL ASPECTS OF METALS IN NATIVE PETROLEUM
T. F. Yen
Departments of Chemical Engineering Environmental Engineering, and Medicine (Biochemistry) University of Southern California Los Angeles, California 90007
The following is a status report of the metals present in native petroleum. First, the occurrence of the metals is discussed with two important topics- metalloporphyrins and nonporphyrin metals—presented. At present, no review of nonporphyrin is available. Highlights of this review center on the topics of biogenesis of porphyrins and also vanadium and nickel. Finally a few remarks are made on the applications. The objective of this chapter is to illustrate the fact that as basic knowledge of these metals is acquired, intelligent use and a novel, practical method will be developed for the processing as well as exploration of petroleum. Trace metal in petroleum is the link between its formation from basins and its refinement into the final products. Understanding the true nature of the role of trace metals in petroleum will help the progress of petroleum industries.
Native petroleum falls into the class of raw fuel, which itself is not "clean." Aside from "clean" hydrocarbons, petroleum contains the following contaminants:
(a) nonhydrocarbons, which are heterocyclics containing sulfur, nitrogen, and oxygen
(b) minerals such as silica and metals
(c) high molecular weight, large asphaltic molecules.
The concentrations of these contaminants may be minor, but they are the source of environmental pollutants and the cause of corrosion of equipment and poisoning of processing catalysts. The refining
1
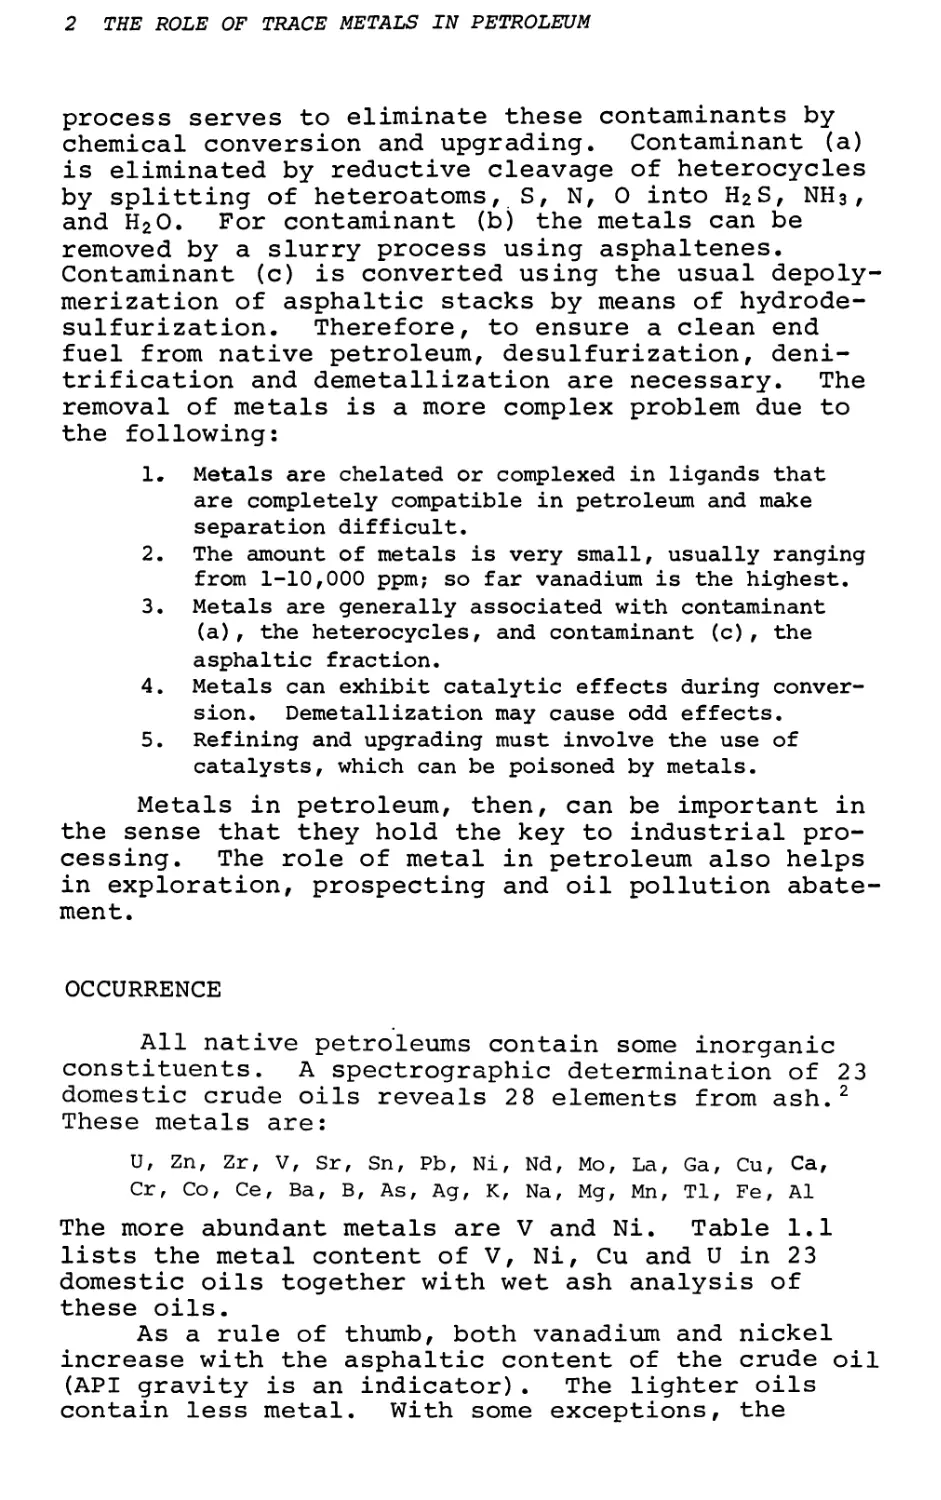
2 THE ROLE OF TRACE METALS IN PETROLEUM
process serves to eliminate these contaminants by chemical conversion and upgrading. Contaminant (a) is eliminated by reductive cleavage of heterocycles by splitting of heteroatoms, S, N, 0 into H2S, NH3, and H20. For contaminant (bj the metals can be removed by a slurry process using asphaltenes. Contaminant (c) is converted using the usual depolymerization of asphaltic stacks by means of hydrodesulfurization. Therefore, to ensure a clean end fuel from native petroleum, desulfurization, denitrification and demetallization are necessary. The removal of metals is a more complex problem due to the following:
1. Metals are chelated or complexed in ligands that are completely compatible in petroleum and make separation difficult.
2. The amount of metals is very small, usually ranging from 1-10,000 ppm; so far vanadium is the highest.
3. Metals are generally associated with contaminant
(a), the heterocycles, and contaminant (c), the asphaltic fraction.
4. Metals can exhibit catalytic effects during conversion. Demetallization may cause odd effects.
5. Refining and upgrading must involve the use of catalysts, which can be poisoned by metals.
Metals in petroleum, then, can be important in the sense that they hold the key to industrial processing. The role of metal in petroleum also helps in exploration, prospecting and oil pollution abatement.
OCCURRENCE
All native petroleums contain some inorganic constituents. A spectrographic determination of 23 domestic crude oils reveals 28 elements from ash.2 These metals are:
U, Zn, Zr, V, Sr, Sn, Pb, Ni, Nd, Mo, La, Ga, Cu, Ca,
Cr, Co, Ce, Ba, B, As, Ag, K, Na, Mg, Mn, Tl, Fe, A1
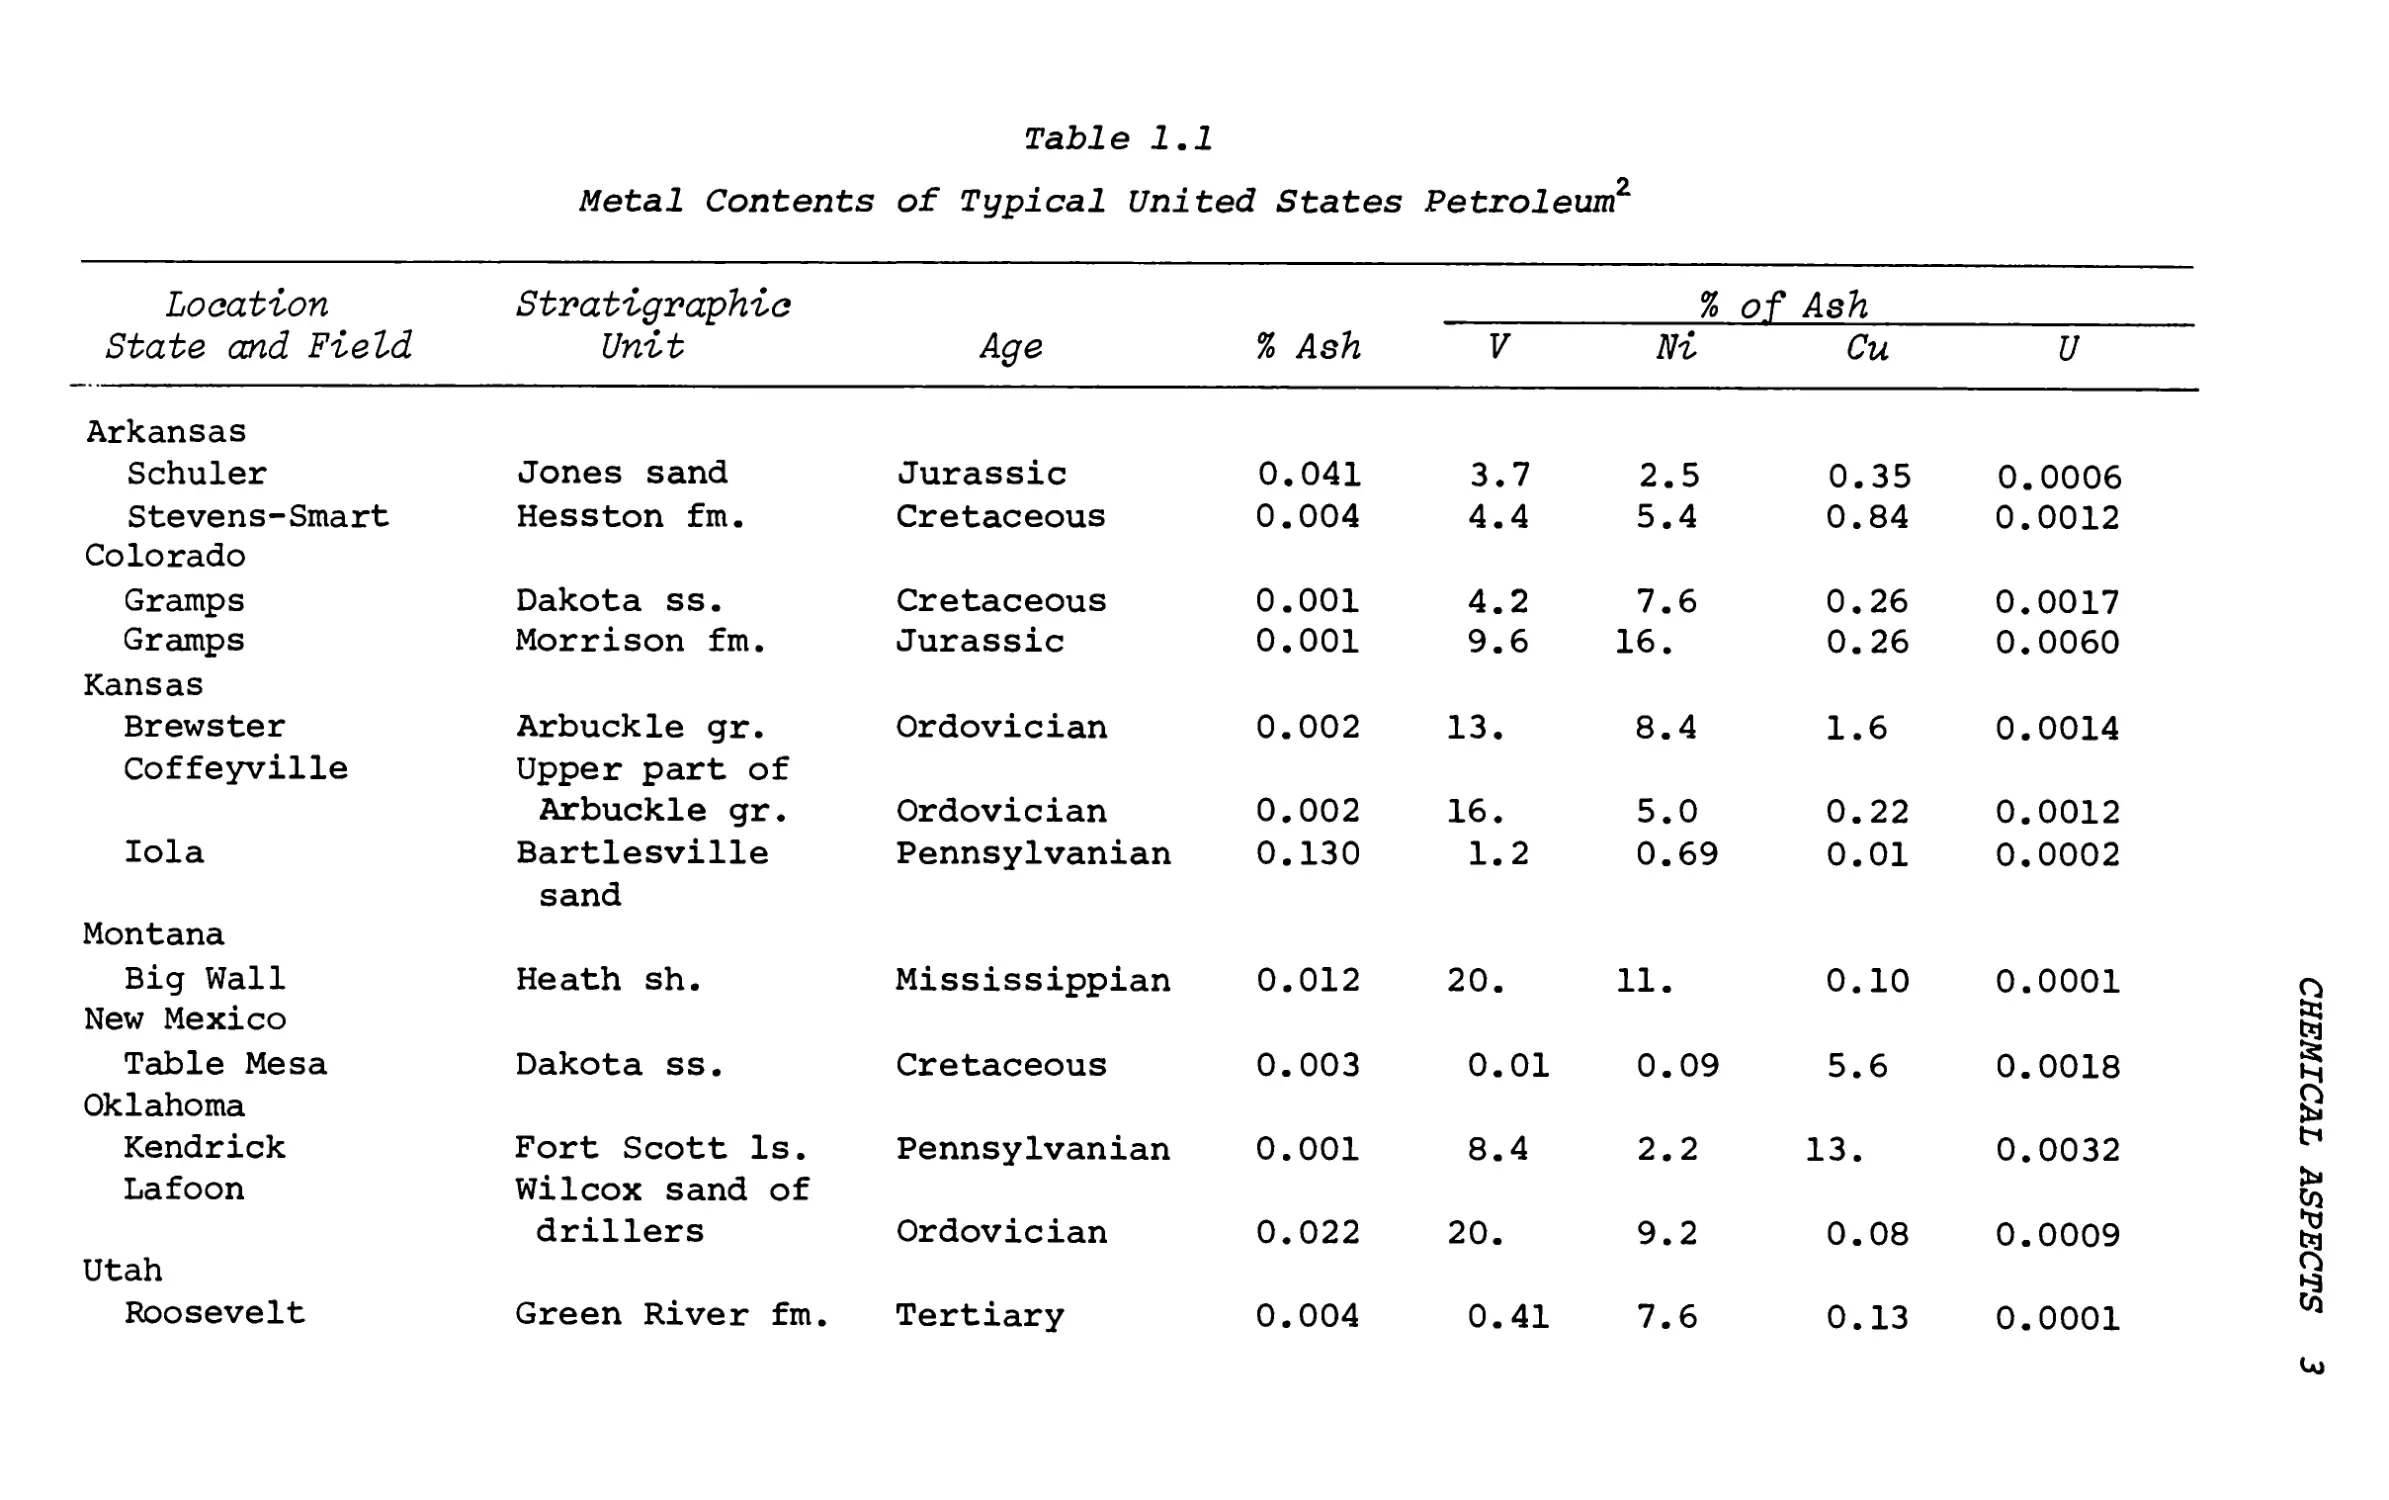
The more abundant metals are V and Ni. Table 1.1 lists the metal content of V, Ni, Cu and U in 23 domestic oils together with wet ash analysis of these oils.
As a rule of thumb, both vanadium and nickel increase with the asphaltic content of the crude oil (API gravity is an indicator). The lighter oils contain less metal. With some exceptions, the
Table 1.1
Metal Contents of Typical United States Petroleum2
Location State and Field
Stratigraphic
Unit
Age
% Ash
V
%
Ni
of Ash Cu
U
Arkansas
Schuler
Jones sand
Jurassic
0.041
3.7
2.5
0.35
0.0006
Stevens-Smart
Hesston fm.
Cretaceous
0.004
4.4
5.4
0.84
0.0012
Colorado
Gramps
Dakota ss.
Cretaceous
0.001
4.2
7.6
0.26
0.0017
Gramps
Morrison fm.
Jurassic
0.001
9.6
16.
0.26
0.0060
Kansas
Brewster
Coffeyville
Arbuckle gr. Upper part of
Ordovician
0.002
13.
8.4
1.6
0.0014
Arbuckle gr.
Ordovician
0.002
16.
5.0
0.22
0.0012
Iola
Bartlesville
sand
Pennsylvanian
0.130
1.2
0.69
0.01
0.0002
Montana
Big Wall
Heath sh.
Mississippian
0.012
20.
11.
0.10
0.0001
New Mexico
Table Mesa
Dakota ss.
Cretaceous
0.003
0.01
0.09
5.6
0.0018
Oklahoma
Kendrick
Lafoon
Fort Scott Is. Wilcox sand of
Pennsylvanian
0.001
8.4
2.2
13.
0.0032
drillers
Ordovician
0.022
20.
9.2
0.08
0.0009
Utah
Roosevelt
Green River fm.
Tertiary
0.004
0.41
7.6
0.13
0.0001
CHEMICAL ASPECTS
Table 2.2/ continued
Location
Stratigraphic
Unit
% of Ash
State and Field
Age
% Ash
V
Ni
Cu
U
Wyoming Elk Basin
Tensleep ss.
Pennsylvanian
0.010
LO
00
•
9.2
0.16
0.0003
Grass Creek
Curtis fm.
Triassic
0.038
28.
6.4
0.10
0.0004
Halfmoon
Embar fm.
Pennsylvanian
and Triassic
0.058
17.
4.8
0.26
0.0003
Halfmoon
Tensleep ss.
Pennsylvanian
0.023
22.
0.10
0.10
0.0003
Hamilton Dome
Curtis fm.
Triassic
0.038
28.
6.4
0.10
0.0004
Hamilton Dome
Embar fm.
Pennsylvanian
and Triassic
0.012
46.
7.6
0.16
0.0003
Hamilton Dome
Madison Is.
Mississippian
0.038
28.
7.0
0.07
0.0003
Lost Soldier
Wall Creek
ss. mbr.
Cretaceous
0.001
5.6
7.2
0.26
0.0024
Oregon Basin, N
Embar fm.
Pennsylvanian
and Triassic
0.015
40.
7.6
0.03
0.0043
Oregon Basin, N
Madison Is.
Mississippian
0.035
22.
6.4
0.03
0.0022
Oregon Basin, N
Tensleep ss.
Pennsylvanian
0.018
40.
8.2
0.22
0.0075
THE ROLE OF TRACE METALS IN PETROLEUM
CHEMICAL ASPECTS 5
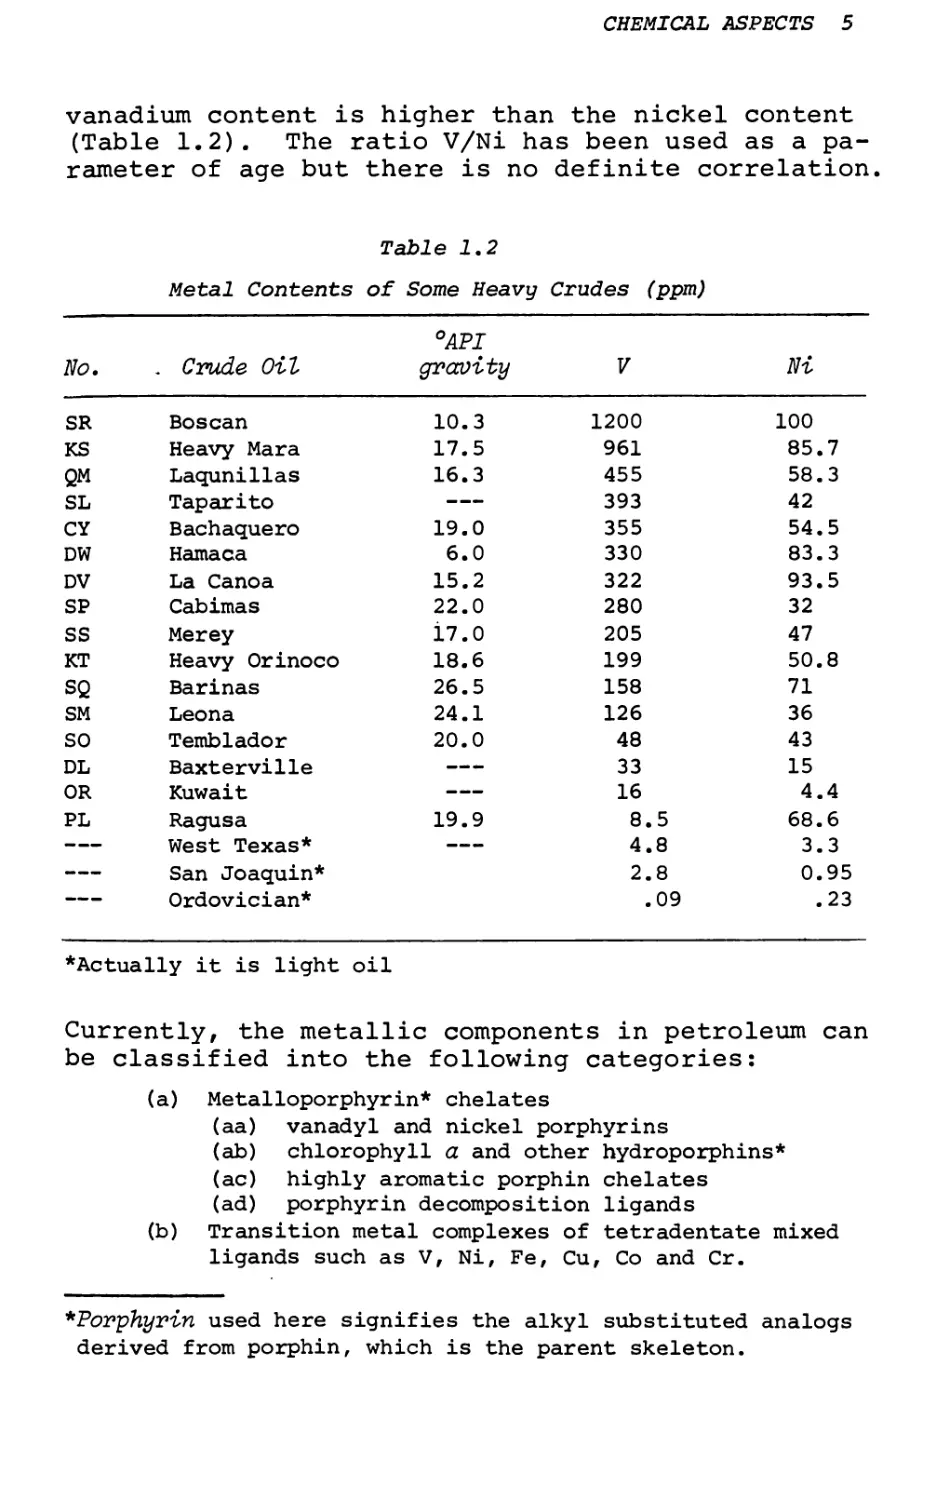
vanadium content is higher than the nickel content (Table 1.2). The ratio V/Ni has been used as a parameter of age but there is no definite correlation.
Table 1.2
Metal Contents of Some Heavy Crudes (ppm)
Ho.
, Crude Oil
°API
gravity
V
Hi
SR
Boscan
10.3
1200
100
KS
Heavy Mara
17.5
961
85.7
QM
Laqunillas
16.3
455
58.3
SL
Taparito
—
393
42
CY
Bachaquero
19.0
355
54.5
DW
Hamaca
6.0
330
83.3
DV
La Canoa
15.2
322
93.5
SP
Cabimas
22.0
280
32
ss
Merey
i7.0
205
47
KT
Heavy Orinoco
18.6
199
50.8
SQ
Barinas
26.5
158
71
SM
Leona
24.1
126
36
so
Temblador
20.0
48
43
DL
Baxterville
—
33
15
OR
Kuwait
—
16
4.4
PL
Ragusa
19.9
8.5
68.6
—
West Texas*
—
4.8
3.3
—
San Joaquin*
2.8
0.95
Ordovician*
.09
.23
*Actually it is light oil
Currently, the metallic components in petroleum can be classified into the following categories:
(a) Metalloporphyrin* chelates
(aa) vanadyl and nickel porphyrins
(ab) chlorophyll a and other hydroporphins*
(ac) highly aromatic porphin chelates
(ad) porphyrin decomposition ligands
(b) Transition metal complexes of tetradentate mixed ligands such as V, Ni, Fe, Cu, Co and Cr.
*Porphyrin used here signifies the alkyl substituted analogs derived from porphin, which is the parent skeleton.
6 THE ROLE OF TRACE METALS IN PETROLEUM
(ba) simple complexes* from resin molecules
(bb) chelates* from asphaltene sheets
(c) Organometallic compounds such as Hg, Sb and As.
(d) Carboxylic acid salts of the polar functional groups of resins, such as Mo and Ge.
(e) Colloidal minerals, such as silica and NaCl.
There are only two major classes of metals of primary importance in the above list—the porphyrin metals and the nonporphyrin metals. The porphyrin metals belonging to (aa) have been studied widely. The nonporphyrin metals have not yet been explored. The nonporphyrin metals could be (ab), (ac), and (ad) because in these categories the porphin skeleton has lost the physical properties of a typical porphyrin due to either interrupted conjugation or increased aromaticity. The more important types of nonporphyrin metals are those of the (b) category. In summary, the following definition is applied:
Porphyrins (aa)
Nonporphyrins (ba)
(bb)
(ab) —only to very little con¬
tributions
(ac)
(ad)
In the following section we will concentrate more on exploring the present status of metal complexes of porphyrins and nonporphyrins, whereas for categories (c), (d), and (e) only a passing remark
is made. For (c) both alkyl and aryl can be possible, although the sandwich type of 7r-complexes for arenes is also possible. For (d) categories, the germanium and molybdenum in coals can be complexed with o-dihydroxyl groups of catechol. There are also other possibilities, such as thiocarboxylic acids and other nitrogen ligands:
*-Complexes here refers to the condition when the ligand molecule to a single metal atom is plural, whereas for chelates the ligand molecule can only be one.
CHEMICAL ASPECTS 7
Finally the (e) category is always carried over by formation waters and other fluids during recovery. The size usually is submicron and is difficult to remove.
METALL0P0RPHYR1NS
Just 40 years ago, Treibs3 found that metallo- porphyrins exist in bitumens, coals and shales.
In these petroporphyrins he identified vanadium as well as iron. He established the well-known chemical association between chlorophyll in marine plants and the process of petroleum formation. It was not until 1948 that the second major metallic components in nickel were established. ** In the intervening years, a number of investigators have found that petroporphyrins are concentrated in the gas oil, resin and asphaltene fractions.5-8 Baker, et at. determined the yields of petroporphyrins from a number of asphaltenes of native crudes and other bituminous materials.9 Data of ten sources of crude oil as well as tar sands, oil shale and gilsonite are listed in Table 1.3.
Table 1.3
Yields and Sources of Petroporphyrins
Asphaltene or Bitumen
Location
Age
Yields
ppm
Agha Jari
Iran
L. Miocene
120
Baxterville
Mississippi
M. Cretaceous
28
N. Belridge
California
Pleistocene-
Boscan
Zulia, Venezuela
Pliocene
Eocene-
3100
1800
Burgan
Kuwait
L. Oligocene M. Cretaceous
220
Mara
Zulia, Venezuela
M. Cretaceous
300
Melones
Anzoategui, Venezuela
U. Oligocene
17
Rozel Point
Utah
Recent
17
Santiago
California
U. Miocene
38
Wilmington
California
Miocene
570
Athabasca tar sands
Alberta
L. Cretaceous
145
Green River oil shale
Colorado
Eocene
55
Gilsonite
Utah
L. Eocene
40
8 THE ROLE OF TRACE METALS IN PETROLEUM
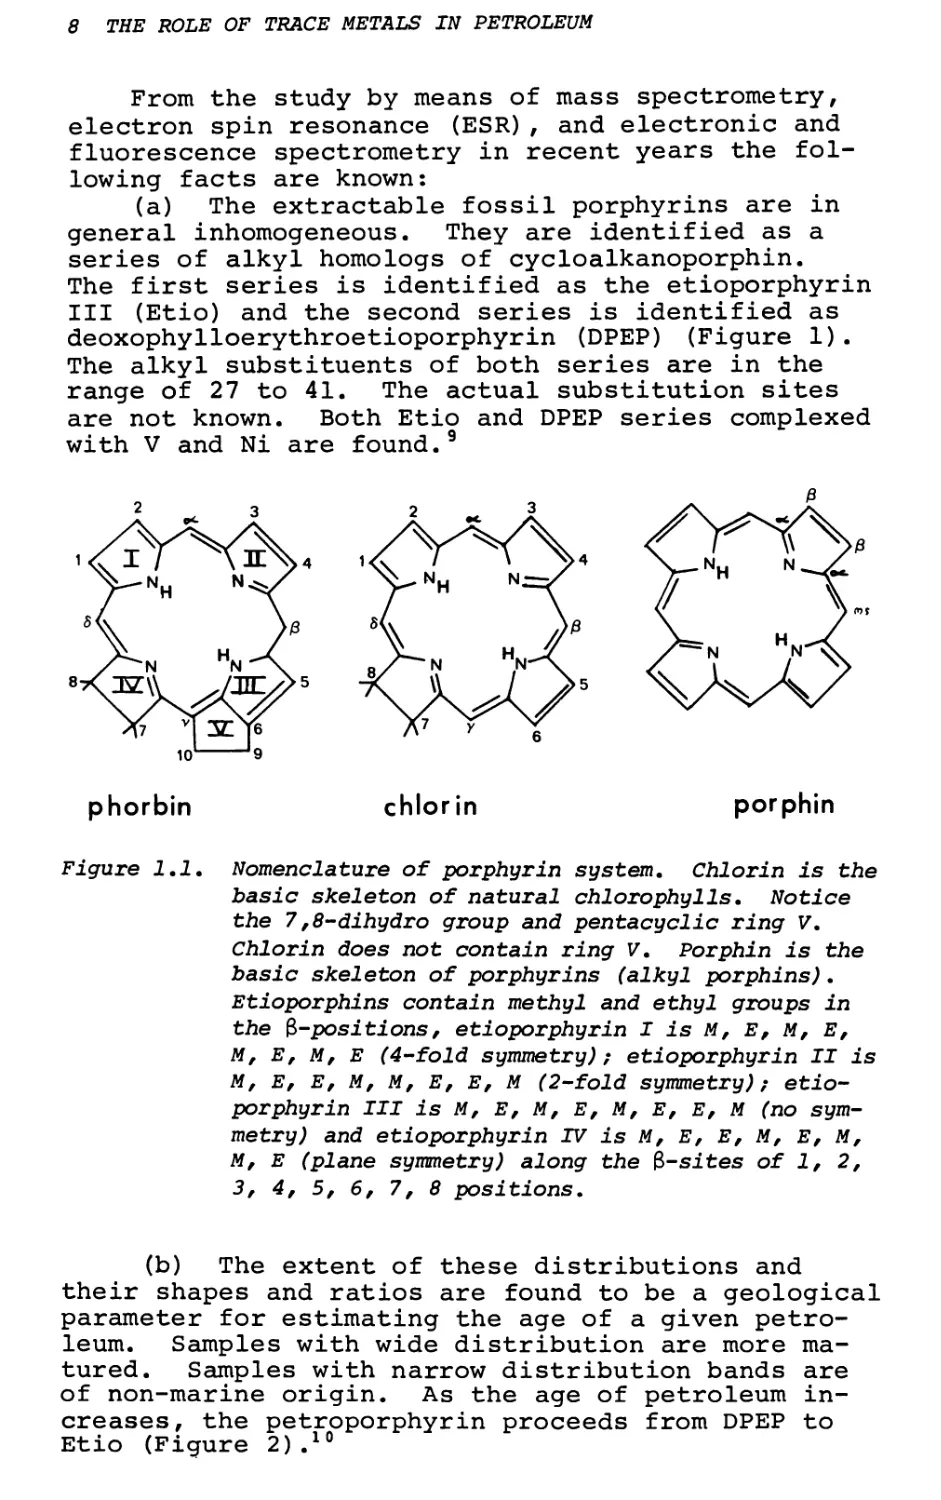
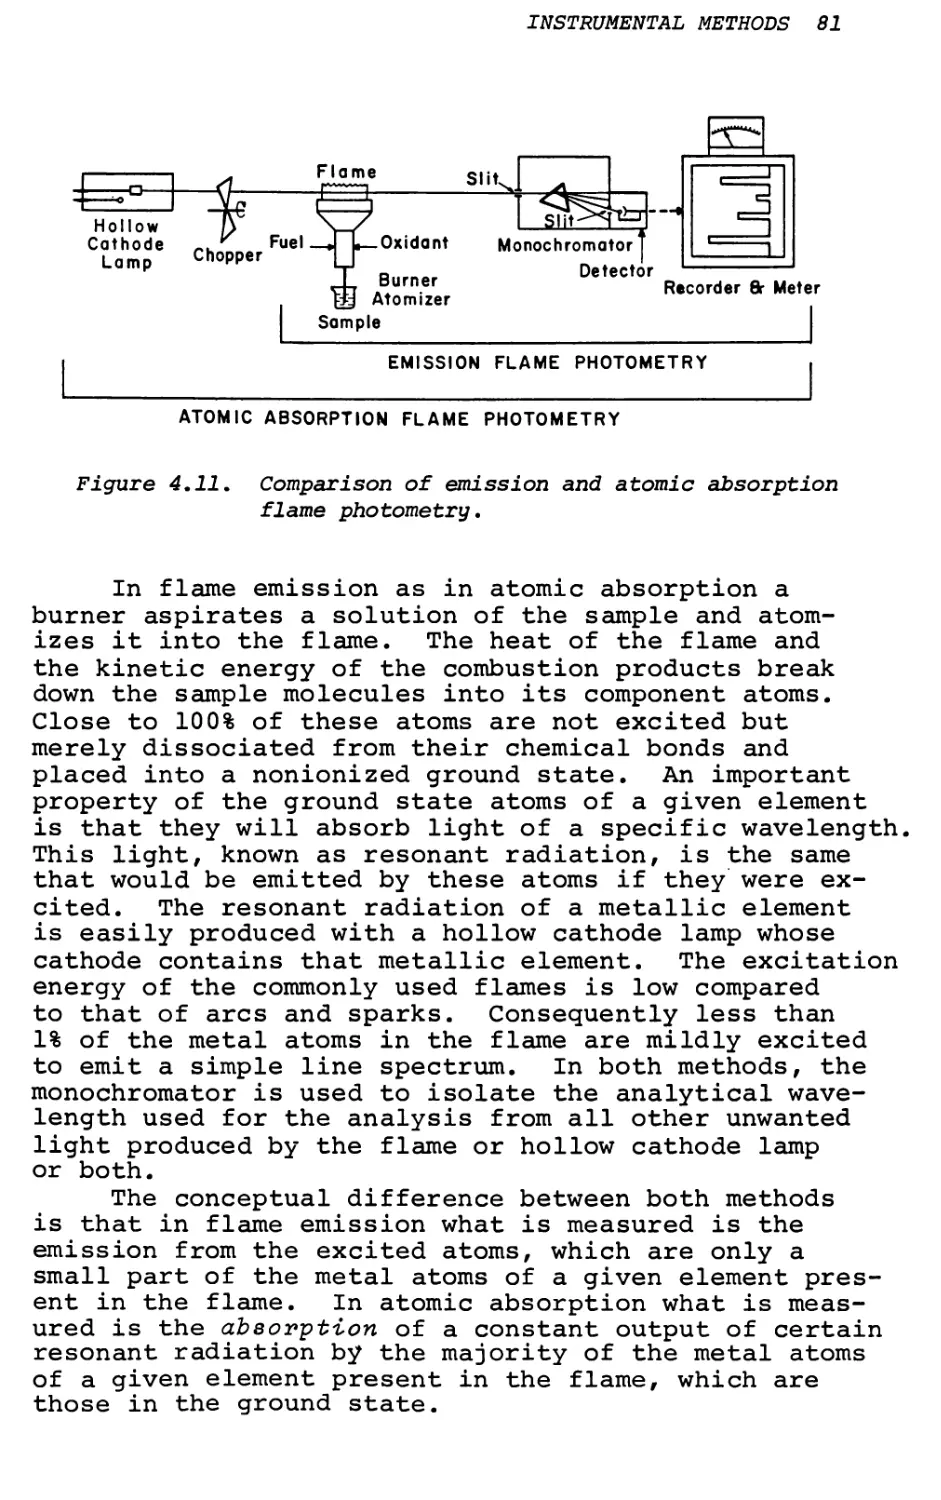
From the study by means of mass spectrometry, electron spin resonance (ESR), and electronic and fluorescence spectrometry in recent years the following facts are known:
(a) The extractable fossil porphyrins are in general inhomogeneous. They are identified as a series of alkyl homologs of cycloalkanoporphin.
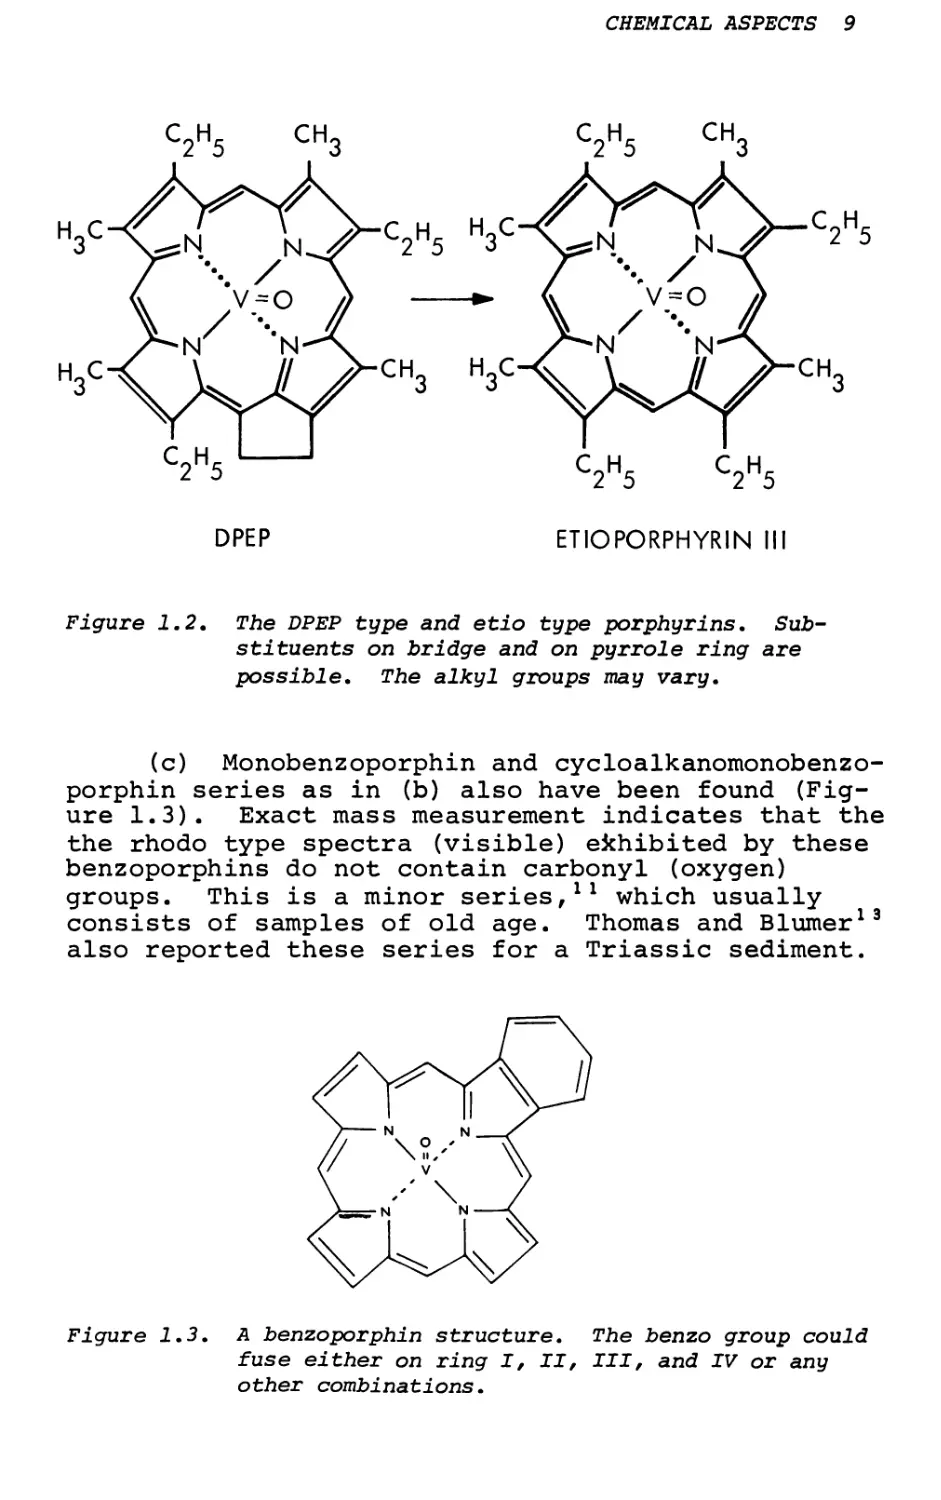
The first series is identified as the etioporphyrin III (Etio) and the second series is identified as deoxophylloerythroetioporphyrin (DPEP) (Figure 1). The alkyl substituents of both series are in the range of 27 to 41. The actual substitution sites are not known. Both Etio and DPEP series complexed with V and Ni are found.9
Figure 1.1. Nomenclature of porphyrin system. Chlorin is the basic skeleton of natural chlorophylls. Notice the 7,8-dihydro group and pentacyclic ring V. Chlorin does not contain ring V. Porphin is the basic skeleton of porphyrins (alkyl porphins). Etioporphins contain methyl and ethyl groups in the ^-positions, etioporphyrin I is M, E, M, E,
M, E, M, E (4-fold symmetry); etioporphyrin II is M, E, E, M, M, E, E, M (2-fold symmetry); etioporphyrin III is M, E, M, E, M, E, E, M (no symmetry) and etioporphyrin IV is M, E, E, M, E, M, M, E (plane symmetry) along the 3-sites of 1, 2, 3, 4, 5, 6, 7, 8 positions.
(b) The extent of these distributions and their shapes and ratios are found to be a geological parameter for estimating the age of a given petroleum. Samples with wide distribution are more matured. Samples with narrow distribution bands are of non-marine origin. As the age of petroleum increases, the petroporphyrin proceeds from DPEP to Etio (Figure 2).10
CHEMICAL ASPECTS 9
c2h5 ch3 c2h5 ch3
Figure 1.2. The DPEP type and etio type porphyrins. Substituents on bridge and on pyrrole ring are possible. The alkyl groups may vary.
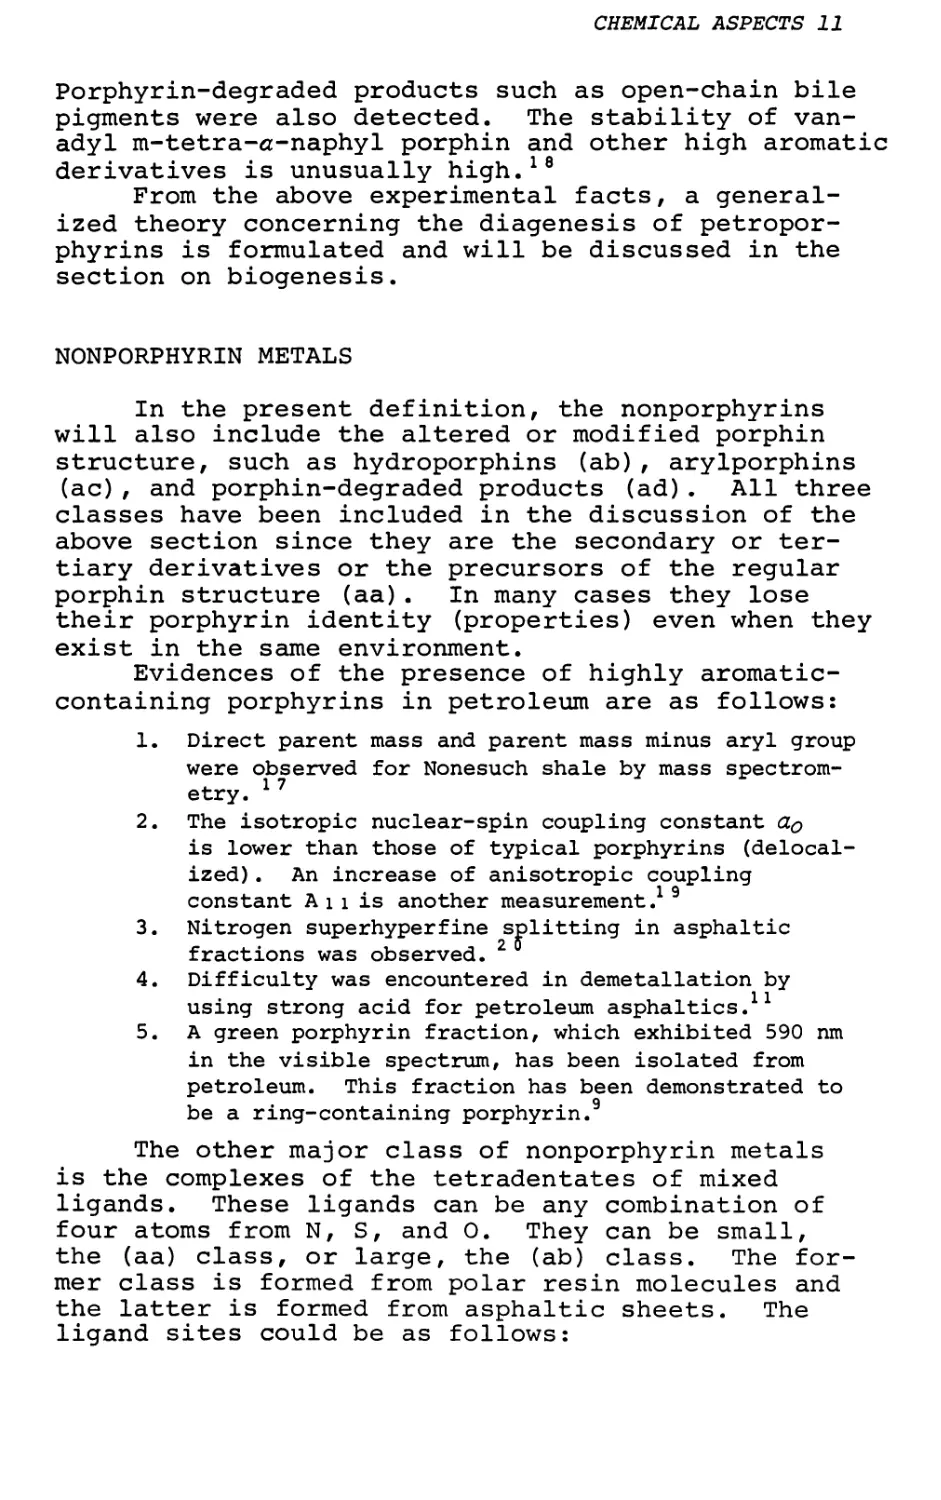
(c) Monobenzoporphin and cycloalkanomonobenzo- porphin series as in (b) also have been found (Figure 1.3). Exact mass measurement indicates that the the rhodo type spectra (visible) exhibited by these benzoporphins do not contain carbonyl (oxygen) groups. This is a minor series,11 which usually consists of samples of old age. Thomas and Blumer13 also reported these series for a Triassic sediment.
Figure 1.3. A benzoporphin structure. The benzo group could fuse either on ring I, II, III, and IV or any other combinations.
10 THE ROLE OF TRACE METALS IN PETROLEUM
(d) Another minor series of porphin was found in which the same porphin nucleus bears two isocy- clic C-5 rings. This skeleton is unknown in nature.11 In order to account for this, it is possible that more than one bridge-substitution can occur in chlorines, 2 and a. The vinyl group
at 2 of pheophobin as can undergo hydration and condensation at a-bridge (see Figure 1.4).
Figure 1.4. Porphin structure with two cycloalkano rings.
Besides ring V there is another ring linking the 2 and a positions.
(e) Chlorophyll a is detected in sediments from the Dead Sea. 2 This may be a very limited and unique case. Usually chlorophylls will demetallize near the sediment-water interface. For example pheophytin a was found in marine sediments27 and dihydropheophytin a in deep sea core.15
(f) Phylloerythrin, which is with carbonyl functional groups, is present in recent sediments such as Rozel Point tar of Utah.1 ** Other intermediates are also present: the intact ester has been reported, e.g., methylpheophobide from Eocene coal.16
(g) Chlorins and mesochlorins are found in a number of deep ocean sediments.15 For the DPEP and Etio type of porphins isolated, only nickel porphyrins were found.
(h) For Precambrian Nonesuch shale the porphins found were highly aryl type.17 They include the benzo, tolyl and a-naphyl substituents.
CHEMICAL ASPECTS 11
Porphyrin-degraded products such as open-chain bile pigments were also detected. The stability of vanadyl m-tetra-a-naphyl porphin and other high aromatic derivatives is unusually high.18
From the above experimental facts, a generalized theory concerning the diagenesis of petropor- phyrins is formulated and will be discussed in the section on biogenesis.
NONPORPHYRIN METALS
In the present definition, the nonporphyrins will also include the altered or modified porphin structure, such as hydroporphins (ab), arylporphins (ac), and porphin-degraded products (ad). All three classes have been included in the discussion of the above section since they are the secondary or tertiary derivatives or the precursors of the regular porphin structure (aa). In many cases they lose their porphyrin identity (properties) even when they exist in the same environment.
Evidences of the presence of highly aromatic- containing porphyrins in petroleum are as follows:
1. Direct parent mass and parent mass minus aryl group were observed for Nonesuch shale by mass spectrometry. 1 7
2. The isotropic nuclear-spin coupling constant a0
is lower than those of typical porphyrins (delocalized) . An increase of anisotropic coupling constant A i i is another measurement.1 9
3. Nitrogen superhyperfine splitting in asphaltic fractions was observed. 2
4. Difficulty was encountered in demetallation by using strong acid for petroleum asphaltics.11
5. A green porphyrin fraction, which exhibited 590 nm in the visible spectrum, has been isolated from petroleum. This fraction has been demonstrated to be a ring-containing porphyrin.9
The other major class of nonporphyrin metals is the complexes of the tetradentates of mixed ligands. These ligands can be any combination of four atoms from N, S, and 0. They can be small, the (aa) class, or large, the (ab) class. The former class is formed from polar resin molecules and the latter is formed from asphaltic sheets. The ligand sites could be as follows:
12 THE ROLE OF TRACE METALS IN PETROLEUM
4N*, porphyrins 3N10
2N20*, 3-ketimines
1N30, N(2-hydroxyphenyl)salicylidenimine
40, 3-diketones
301S*
202S, monothio-3-diketones 103S
4S* dithiocarbonates 3S1N*
2S2N*
1S3N
S02N
SN20
N02S
Of the above combinations, the ones with an asterisk are already found in resin molecules, e.g.> in a Baxterville resin fraction by mass spectrometry.21 A number of 2N20 model complexes of vanadium have been synthesized,52~5k correlations of these complexes have been made, and a method for identification of the mixed ligand type has been developed. 5 5-57 The following additional facts indicate that there exist quadridentate-mixed ligands in petroleum.
1. A fraction of the vanadium complex from Sdom crude does not give Soret absorption peaks, and is easily demetallated.22 Most oxovanadium(IV) complexes exhibit d-d transitions (dXy+dx2"y2(transition II) and dXy+dz2 (transition III) at much lower (103 less) extinction coefficients when compared with that of the Soret peak (a]_u->eg*) . Vanadium complexes devoid of the Soret peak would suggest there is no extreme conjugation. In the case of mixed donor tetradentates, demetallation proceeds with ease. Therefore it is plausible that there
are tetradentates in Sdom crude.
2. Certain fractions of Boscan vanadium petro- porphyrins only give even masses by mass spectrometry.23 The only possibility is that these fractions contain odd numbers of nitrogen atoms in the donor system. Furthermore, Boscan and Baxterville resin fractions exhibit intense parent masses at odd numbers.
3. Magnetic susceptibility measurement on a Boscan (SR) vanadium petroporphyrin extract indicates Curie-Weiss dependence. 1 V-V interaction or
CHEMICAL ASPECTS 13
V-O-V super exchange may indicate a monomeric vanadium complex of one or three nitrogen atoms.
4. Asphaltenes can have a fixed capacity for complexing metals.2h This fact is demonstrated with washing cycles and with increments of scattering by small angle scattering experiments.25 These sites may be defect centers from the aromatization of S, N, and O-containing hydrocarbon skeletons'.26
BIOGENESIS
Petroporphyrins originate from chlorophylls. There are two questions that arise immediately: How is the magnesium in chlorophylls removed and how are vanadium and nickel introduced?
MP + 2H+1 PH2 + M2+
MP here is metalloporphyrin and PH2 is free base porphyrin. In general, the forward equation is demetallation and the reverse is metallation. The dissociation of metalloporphyrins is governed by chemical stability.
water dil. HC1 cone. H2SO1+
HBr-acetic acid trichloroacetic acid
Ag(I), K(I), Na(I), Pb(IIf Hg(II) Zn (II), Cd (II), Mg (II) , Fe(II) Cu(II), Mn (II) , Co (II) , Nidi),
Fe (III)
VO(IV)
VO(IV)*
From the above data, it is obvious that pheophytini- zation (removal of magnesium) is easy, whereas devanadylation (removal of VO) is difficult. It is also foreseeable that pheophytinization can be accomplished in natural conditions, perhaps soon after decaying and possibly before burying.
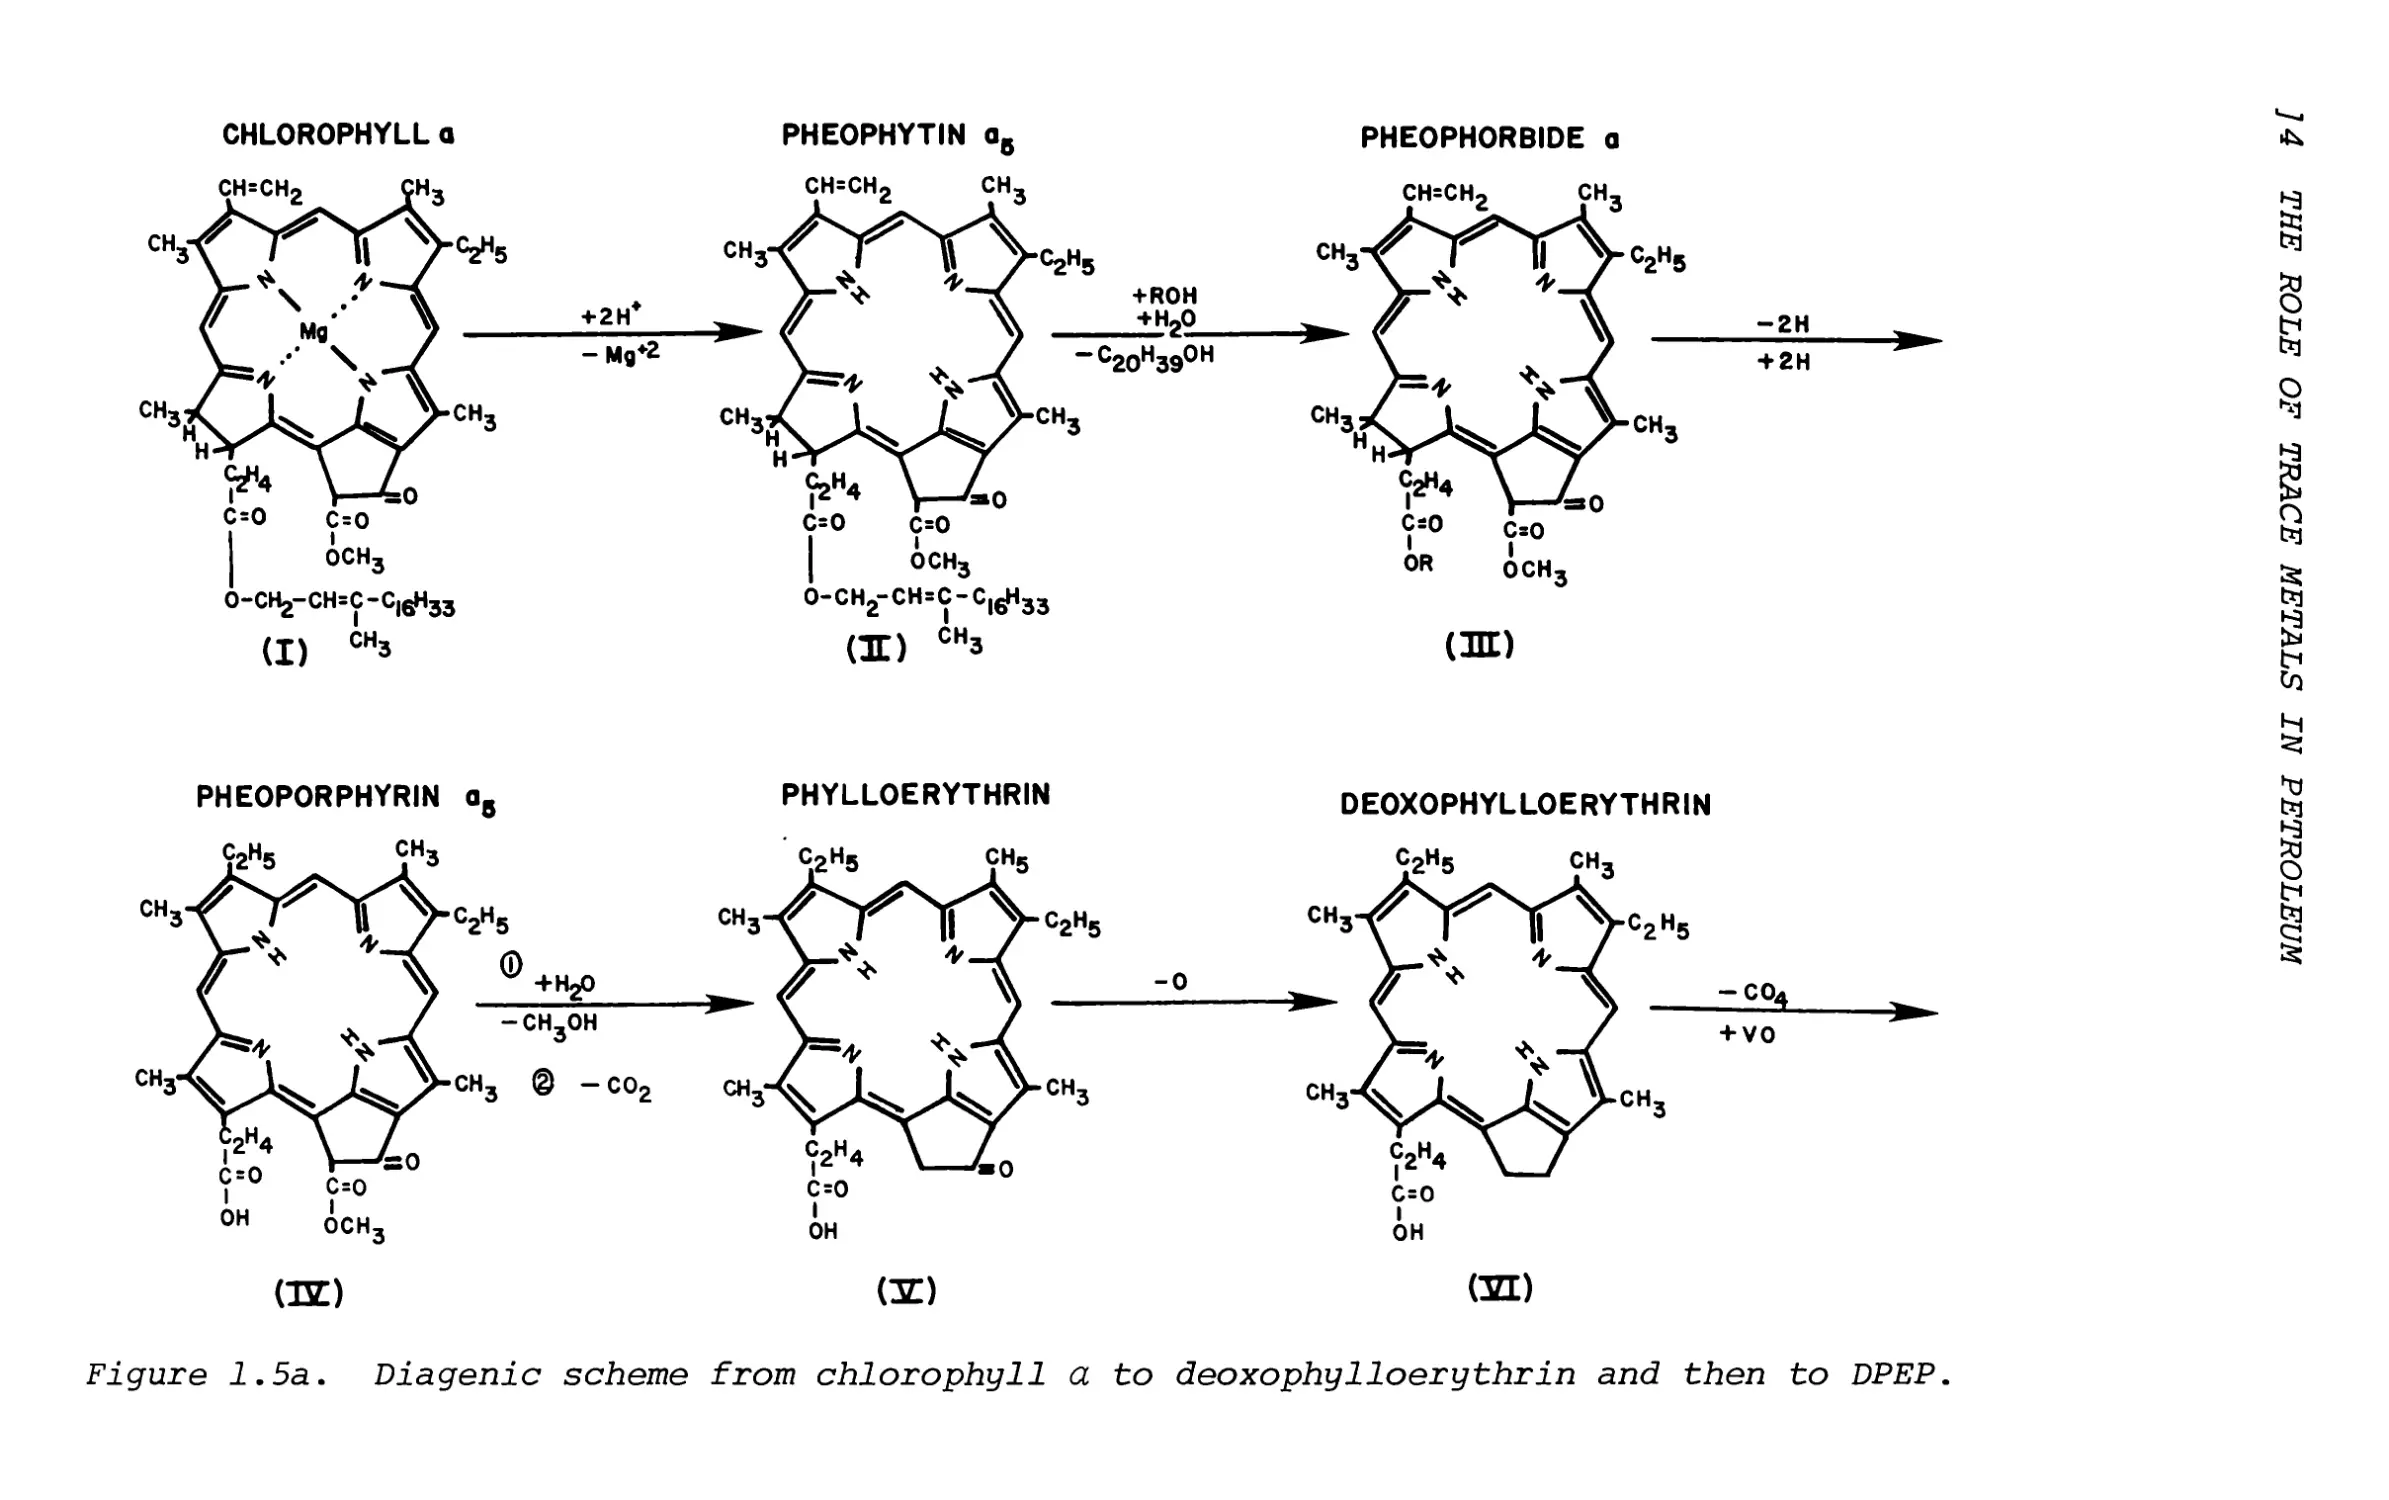
In supporting this, chlorophyll a is only observed in limited cases, yet pheophytin a as well as other intermediates such as pheoporphyrin and phylloerythrin have been identified in recent sediments. This scheme may be represented in Figure 1.5 where chlorophyll a is gradually changed to deoxo- phylloerythrin. ll+ Again the origin of porphyrin in sediments is chlorophyll pigment only, such as chlorophyll a, chlorophyll b, Chlorobium chlorophillys
*Porphyrin is tetra-ms-4-biphenylporphin.
Figure 1.5a. Diagenic scheme from chlorophyll a to deoxophylloerythrin and then to DPEP.
]4 THE ROLE OF TRACE METALS IN PETROLEUM
DPEP
ETIO (ETIOP0RPNYRIN3H)
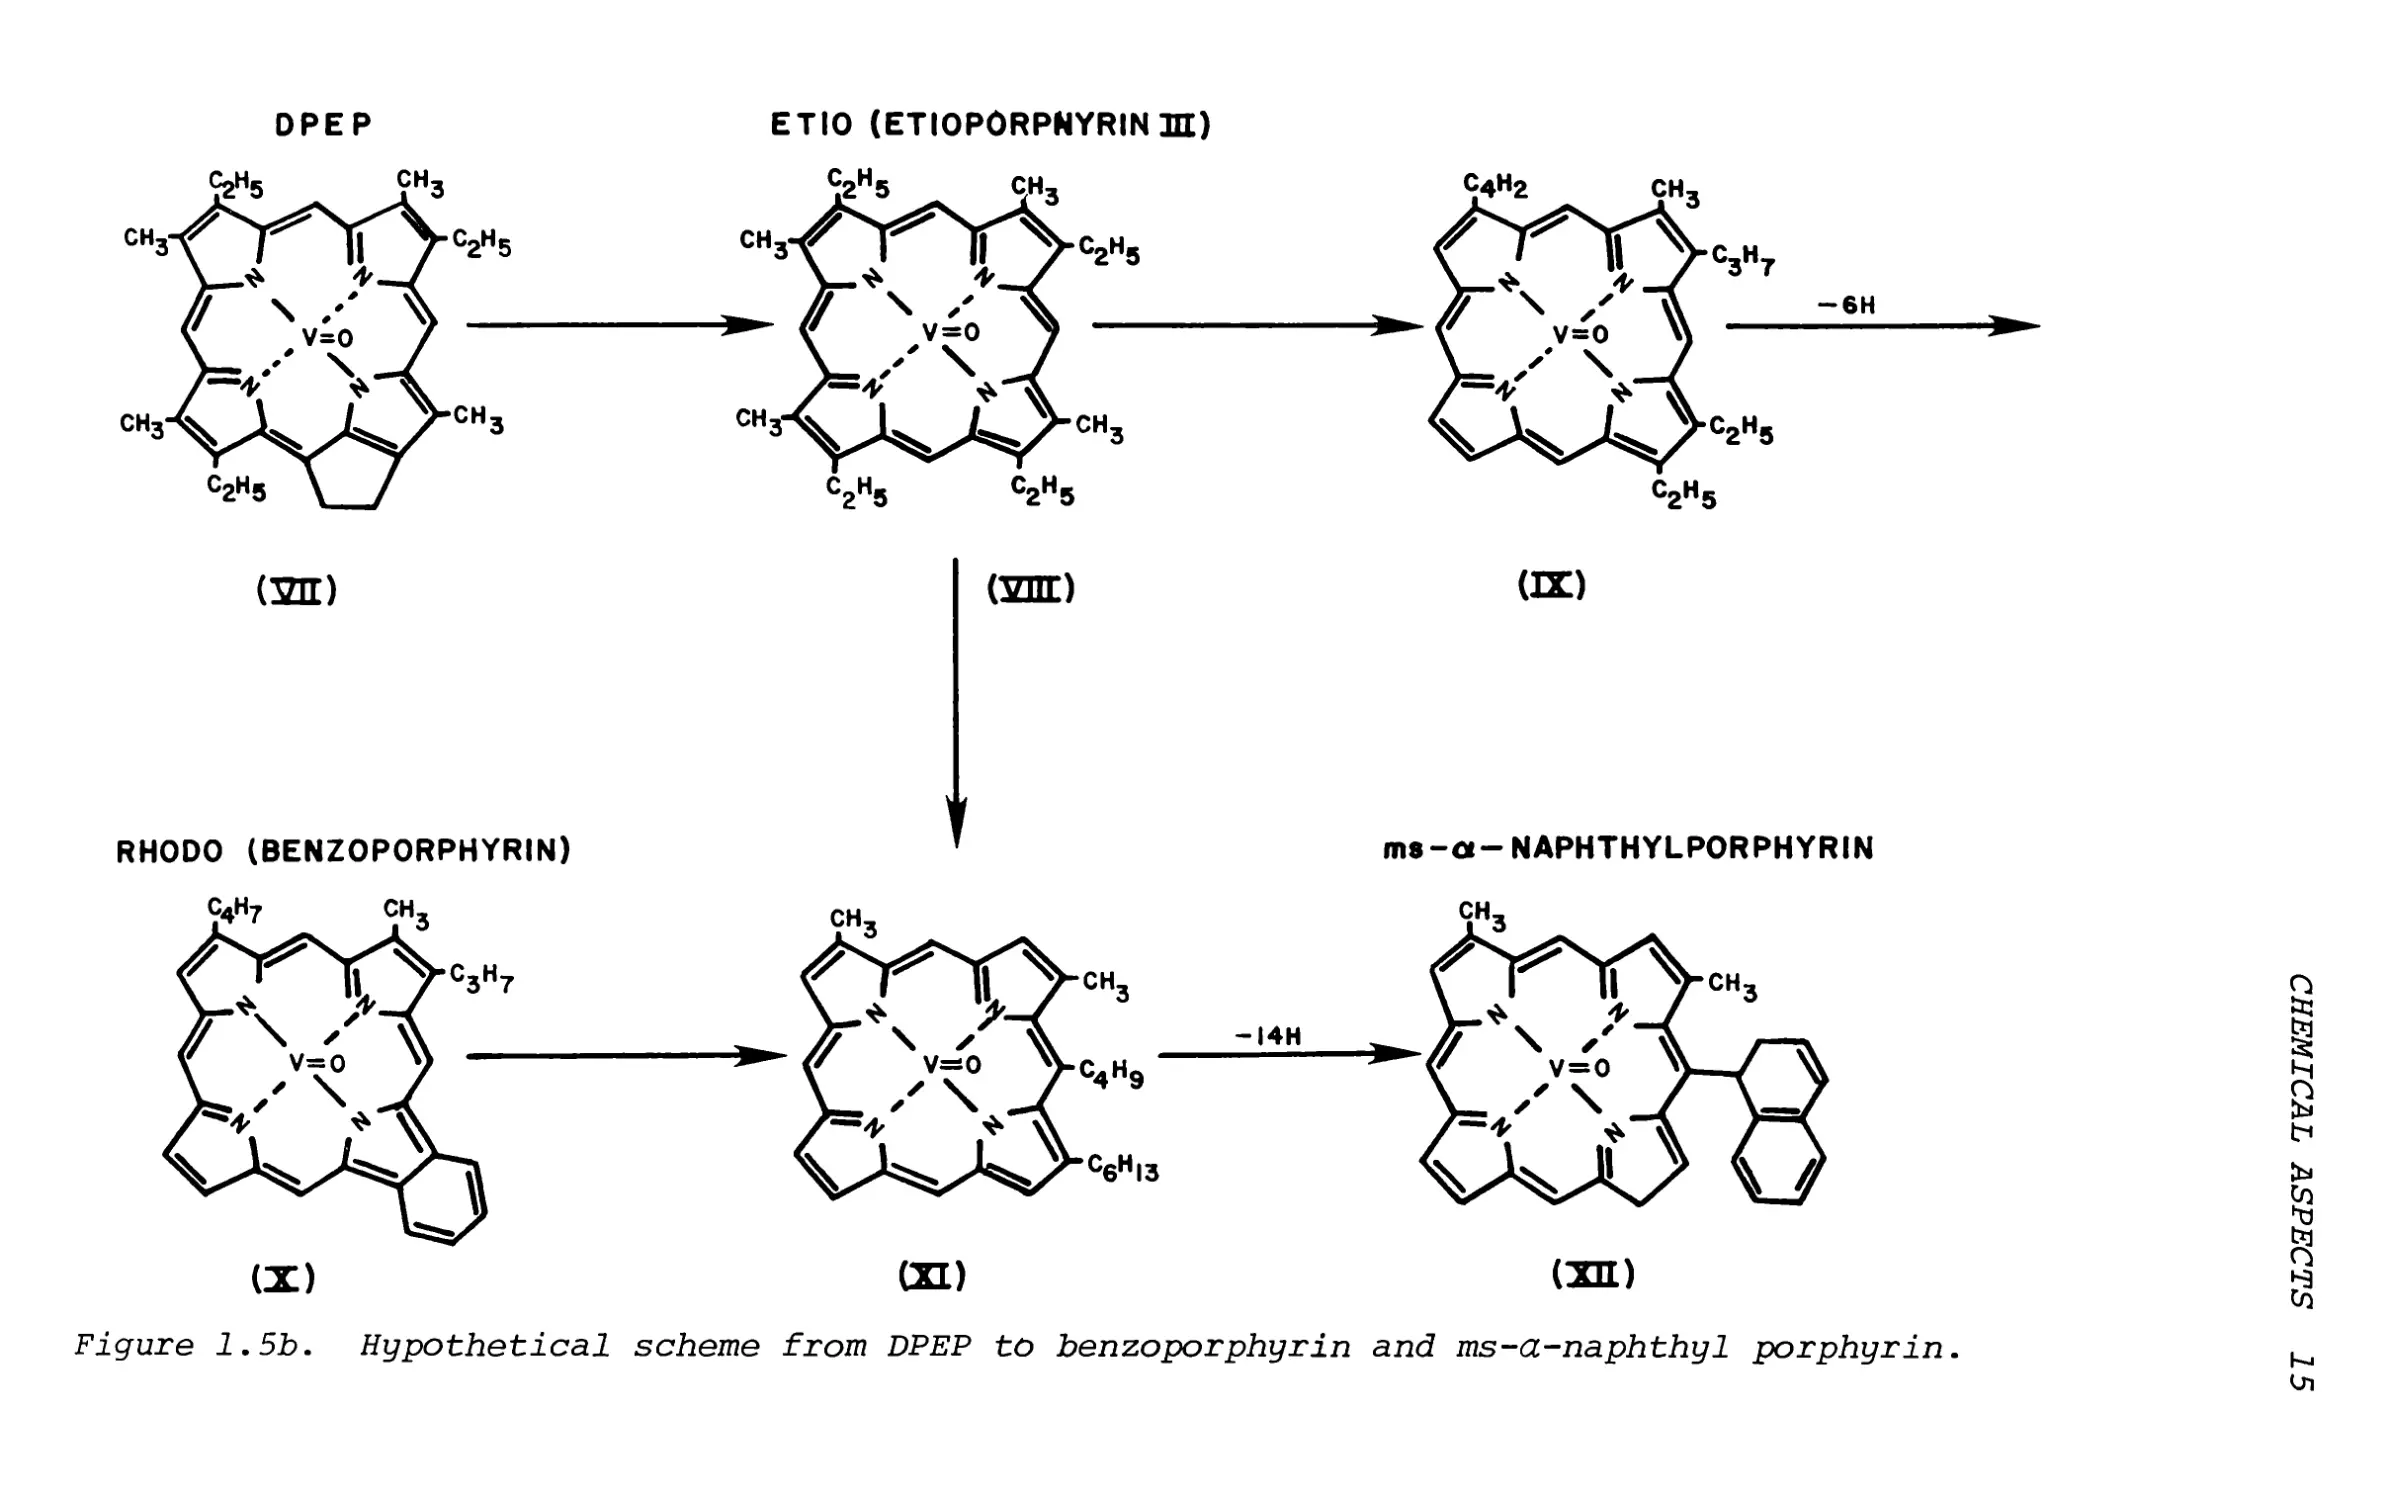
Figure 1.5b. Hypothetical scheme from DPEP to benzoporphyrin and ms-a-naphthyl porphyrin.
CHEMICAL ASPECTS 15
16 THE ROLE OF TRACE METALS IN PETROLEUM
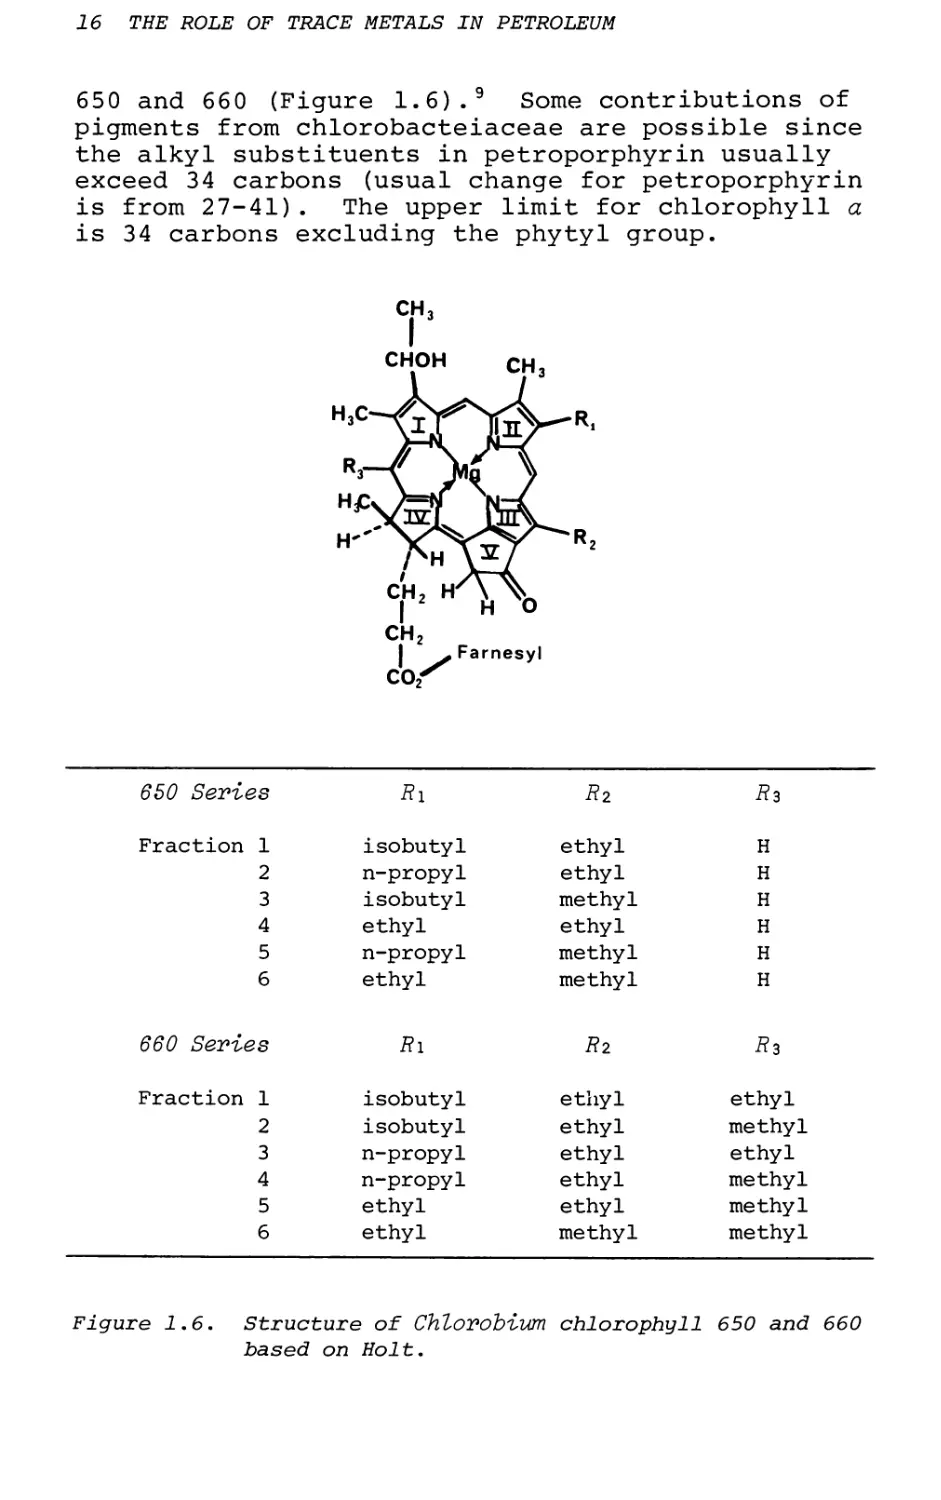
650 and 660 (Figure 1.6).9 Some contributions of pigments from chlorobacteiaceae are possible since the alkyl substituents in petroporphyrin usually exceed 34 carbons (usual change for petroporphyrin is from 27-41). The upper limit for chlorophyll a is 34 carbons excluding the phytyl group.
650 Series
Ri
Ri
Rs
Fraction 1
isobutyl
ethyl
H
2
n-propyl
ethyl
H
3
isobutyl
methyl
H
4
ethyl
ethyl
H
5
n-propyl
methyl
H
6
ethyl
methyl
H
660 Series
Ri
Ri
*3
Fraction 1
isobutyl
ethyl
ethyl
2
isobutyl
ethyl
methyl
3
n-propyl
ethyl
ethyl
4
n-propyl
ethyl
methyl
5
ethyl
ethyl
methyl
6
ethyl
methyl
methyl
Figure 1.6. Structure of Chlorobiwn chlorophyll 650 and 660 based on Holt.
CHEMICAL ASPECTS 17
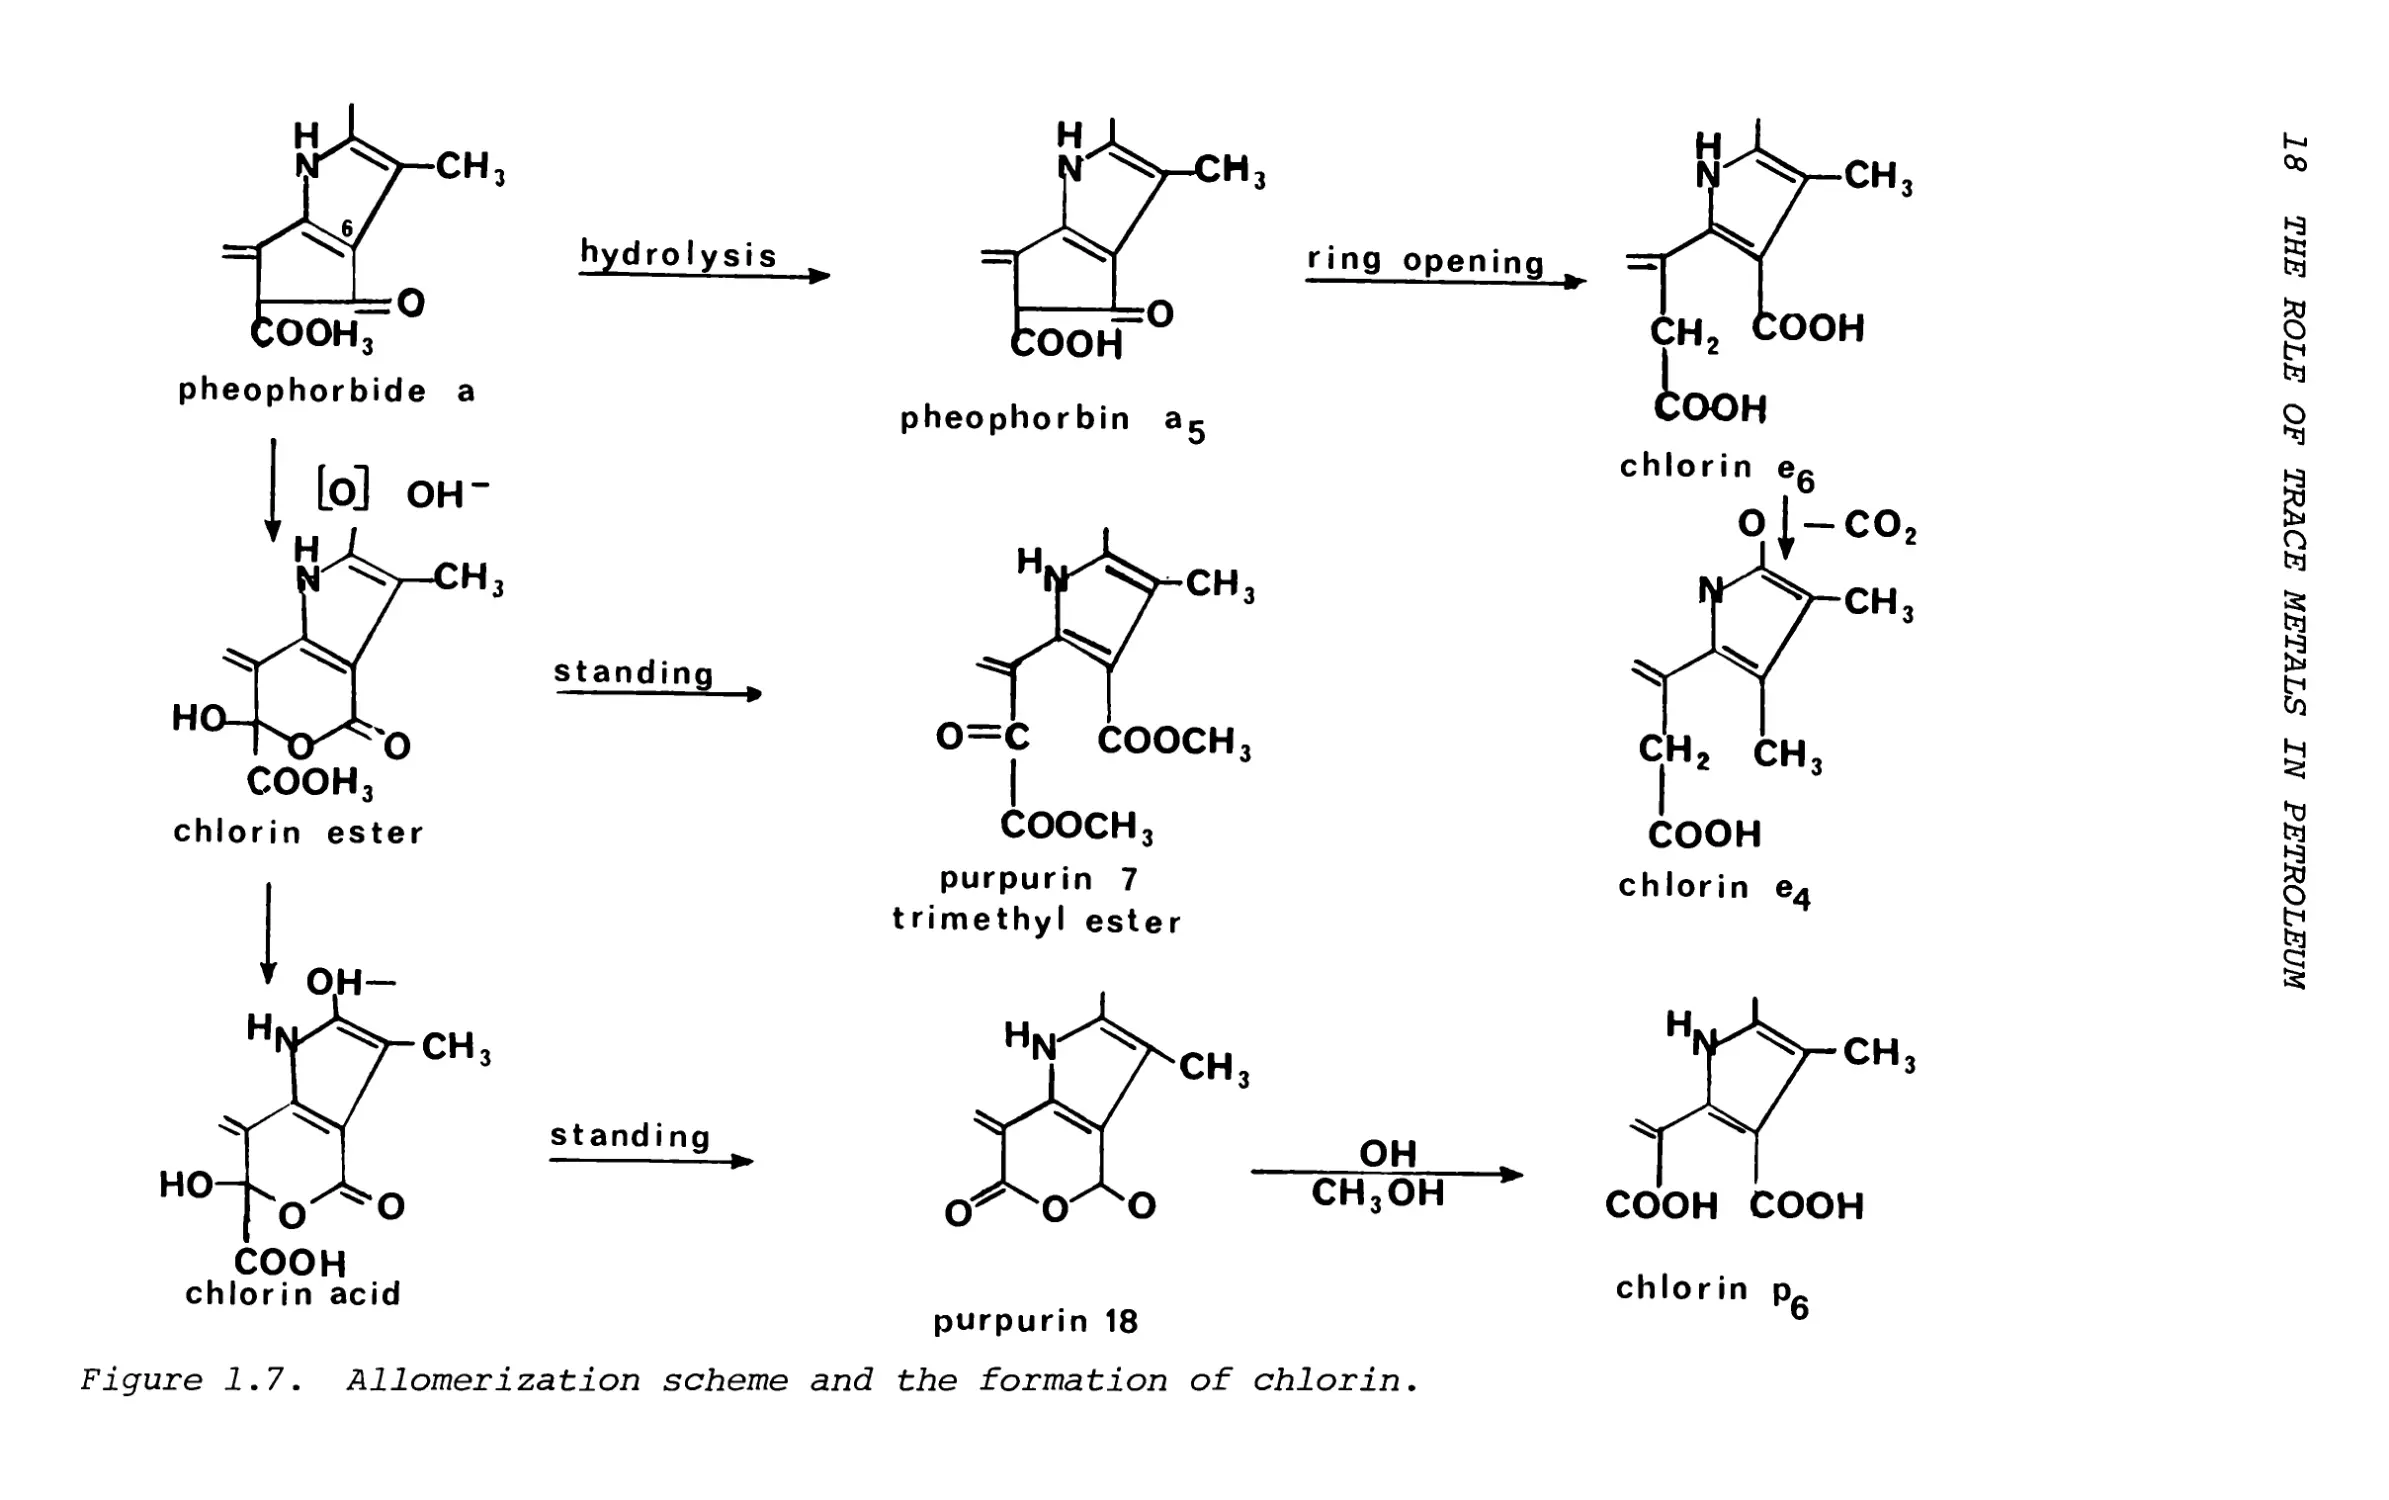
The isolation of chlorin P6 and mesochlorin P6 and possibly the purpurin 18 intermediates15 suggests that allomerization is an important process for chlorin formation by oxidative ring opening (Figure 1.7). It is also possible that petroporphyrins of the etio and phyllo type can be derived from these chlorins.
Largely the marine depositional environment is reducing; therefore, one has to consider the reducing sites of chlorophyll a, namely the 2-vinyl, 9-keto and the phytyl double bond. Under reducing environments, removal of phytyl groups can be accomplished by elimination rather than by hydrolysis. 15 Both phytol and neophytadiene have been isolated. In the sequence outlined in Figure 1.8, under conditions of geological time spans, the 2- vinyl, 9-keto will undergo reduction. Products of phytyl double bond reduction have already been reported.15 Furthermore, epimerization of 10- position is possible. These stepwise structural changes do have significant geochemical implications and could be further explored.
Under drastic geological conditions, the decarboxylation of 7-CH2-CH2COOH and the ring scission of cyclopentane ring can be realized, i.e.3 the conversion to DPEP. The conditions can only be realized when the biostratinomy and fossilization processes are at depths where geothermal temperatures are elevated (150°C). If age can be traded with temperature,28 certainly this conversion of decarboxylation has already taken place in recent sediments.15
The next important questions are when and why the vanadium and nickel are introduced. Answering the second part is easier? it has already been found that the segregation of metal in freshwater shale is different from those of marine shale.29 For example, in freshwater shale, the metals are Cu, Pb, Zn and Sn, whereas in marine shale the metals are Ni and V. This concentration of Ni and V in marine shale has been interpreted to be due to the accumulation of marine organisms. Selective metals in the aquatic organisms of both brown algae and marine animals are enriched from 10-280,000 times (Table 1.4). The case of V and Ni should be noticed in particular. For example, in ascidia and holothurians, vanadium pigments are found in blood cells or vanadocytes. Vanadium content in various forms of ascidia was found to contain from 1-6520 ppm on a dry basis.30 Also in Phaleusia manillata
hydrolysis
chlorin ester
CH3
standing
purpurin 7 trimethyl ester
COOH
chlorin e^
purpurin 18
chlorin p^
Figure 1.7. Allomerization scheme and the formation of chlorin.
18 THE ROLE OF TRACE METALS IN PETROLEUM
CHEMICAL ASPECTS 19
(a) -Hi
R.
CH
/
CH
neophytad iene
| -HtO
(b)
+
OH
I
C\
£ (CHa)t -Chi
HtO
pheophorbide a
Phytol
Figure 1.8. Pheophytimization scheme.
Table 1.4
Enrichment Factors of Marine Organisms
Brown Algae (Fresh Weight)
Marine Animals (Dry Weight)
l0'
I.^
I
II
Ni
200-1000
1600-1800
5,000
41,000
V
10-300
>160-5000
17,000
>280,000
Zn
400-1400
400-1400
32,500
32,500
Co
(>4500)
(13,000)
>7,000
21,000
Mn
17,000c
—
Fe
10,700°
—
Cu
330-880C
—
aData from W. A. P. Black and R. C. Mitchell (Ref. 60, excluding c.
Liata from I. Noddack and W. Noddack (Ref. 61) .
CData from E. D. Goldberg (Ref. 62). The values are the average for Fucus sorratus and F. vesiculosus.
80% of total V is in blood, whereas in Ascidia mentula only 10% is in blood.31 Clams, scallops and oysters are rich in NI; for example, Cordium edule (common edible cockle) contains 20 ppm on a dry basis.33 Peleypoda have been found in some beds in the Carboniferous era.
20 THE ROLE OF TRACE METALS IN PETROLEUM
At present it is without doubt that petroleums originate from marine organisms.33 The introduction of nickel should be easier (under less drastic conditions) than that of vanadium, due to the relative stability. Recent sediments are richer in nickel than the ancient sediments. This certainly is valid when comparing the stability of the metalloporphyrins. At this stage it is more likely that the vanadyla- tion and nickelation of porphyrins occurs during the diagenic process. It is unlikely that a process will be introduced via formation water by secondary migration. The subsurface water during migration contains no appreciable amount of vanadium and nickel, regardless if the source of water is vadose, connate, or juvenile. On the other hand, traces of alkali and alkaline earth metals may be derived from contacting these waters through the migration process.
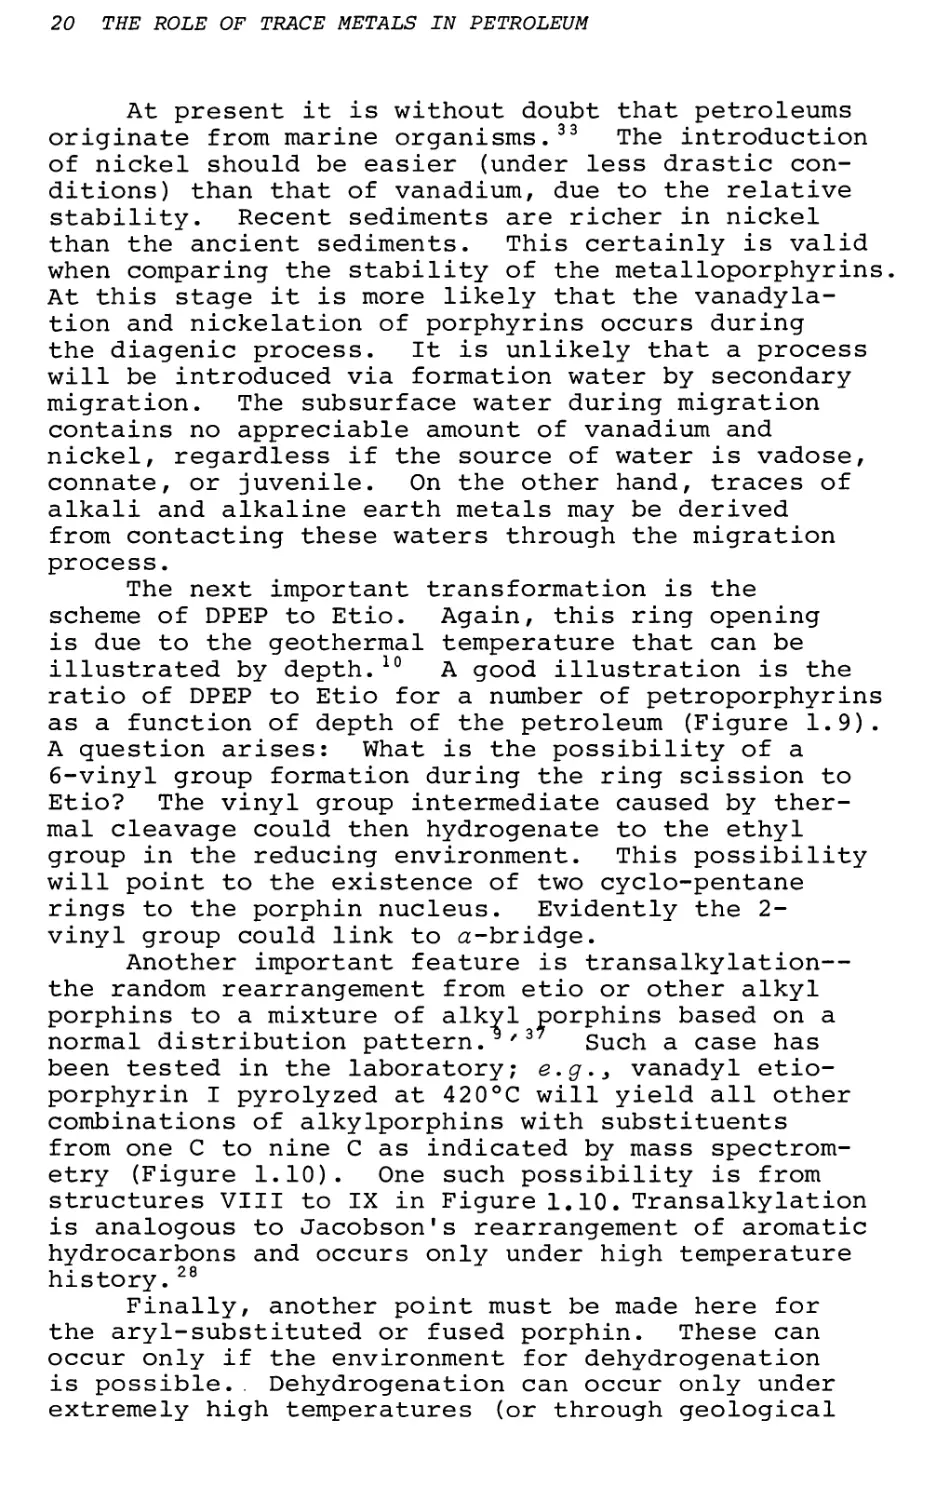
The next important transformation is the scheme of DPEP to Etio. Again, this ring opening is due to the geothermal temperature that can be illustrated by depth.10 A good illustration is the ratio of DPEP to Etio for a number of petroporphyrins as a function of depth of the petroleum (Figure 1.9).
A question arises: What is the possibility of a
6-vinyl group formation during the ring scission to Etio? The vinyl group intermediate caused by thermal cleavage could then hydrogenate to the ethyl group in the reducing environment. This possibility will point to the existence of two cyclo-pentane rings to the porphin nucleus. Evidently the 2- vinyl group could link to a-bridge.
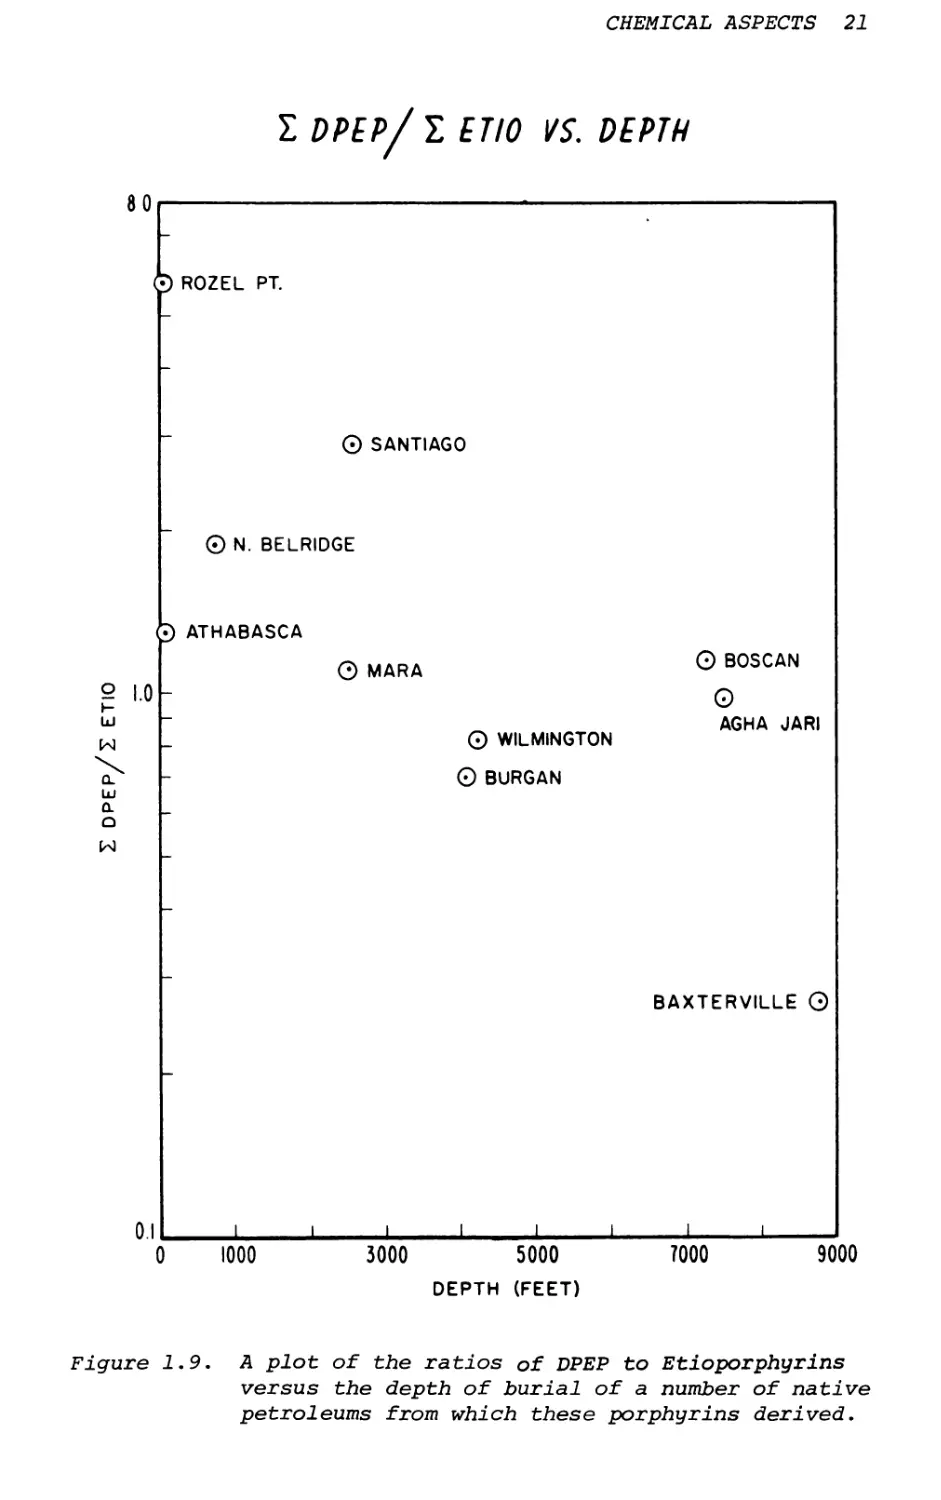
Another important feature is transalkylation— the random rearrangement from etio or other alkyl porphins to a mixture of alkyl porphins based on a normal distribution pattern. '3* Such a case has been tested in the laboratory; e.g.j vanadyl etio- porphyrin I pyrolyzed at 420°C will yield all other combinations of alkylporphins with substituents from one C to nine C as indicated by mass spectrometry (Figure 1.10). One such possibility is from structures VIII to IX in Figure 1.10. Transalkylation is analogous to Jacobson*s rearrangement of aromatic hydrocarbons and occurs only under high temperature history. 28
Finally, another point must be made here for the aryl-substituted or fused porphin. These can occur only if the environment for dehydrogenation is possible.. Dehydrogenation can occur only under extremely high temperatures (or through geological
1 DPEP/Z ET10
CHEMICAL ASPECTS 21
l DPEP/ I ETIO VS. DEPTH
80
ROZEL PT.
© SANTIAGO
© N. BELRIDGE
3 ATHABASCA
1.0 -
© MARA
© WILMINGTON © BURGAN
_L
© BOSCAN
O
AGHA JARI
BAXTERVILLE ©
0 1000
3000 5000
DEPTH (FEET)
7000
9000
Figure 1.9. A plot of the ratios of DPEP to Etioporphyrins
versus the depth of burial of a number of native petroleums from which these porphyrins derived.
22 THE ROLE OF TRACE METALS IN PETROLEUM
5
Figure 1.10. Mass spectra of pyrolyzed vanadyl etioporphrin I indicating transalkylation. The products contain 1 to 9 methylene groups in a distribution pattern of which the 5-methylene one is the richest.
eons if time can trade temperature). Precambrian shale and ancient sediments contain such porphins.
It should also be noted that dehydrogenation of tetra-ms-9-anthryl porphin would yield highly aromatic porphins such as of 24-ring system illustrated in Figure 1.11.58 These porphins may exhibit graph- ite-like properties such as electric conduction. Actually, the vanadium associated with natural graphite may be of this nature.
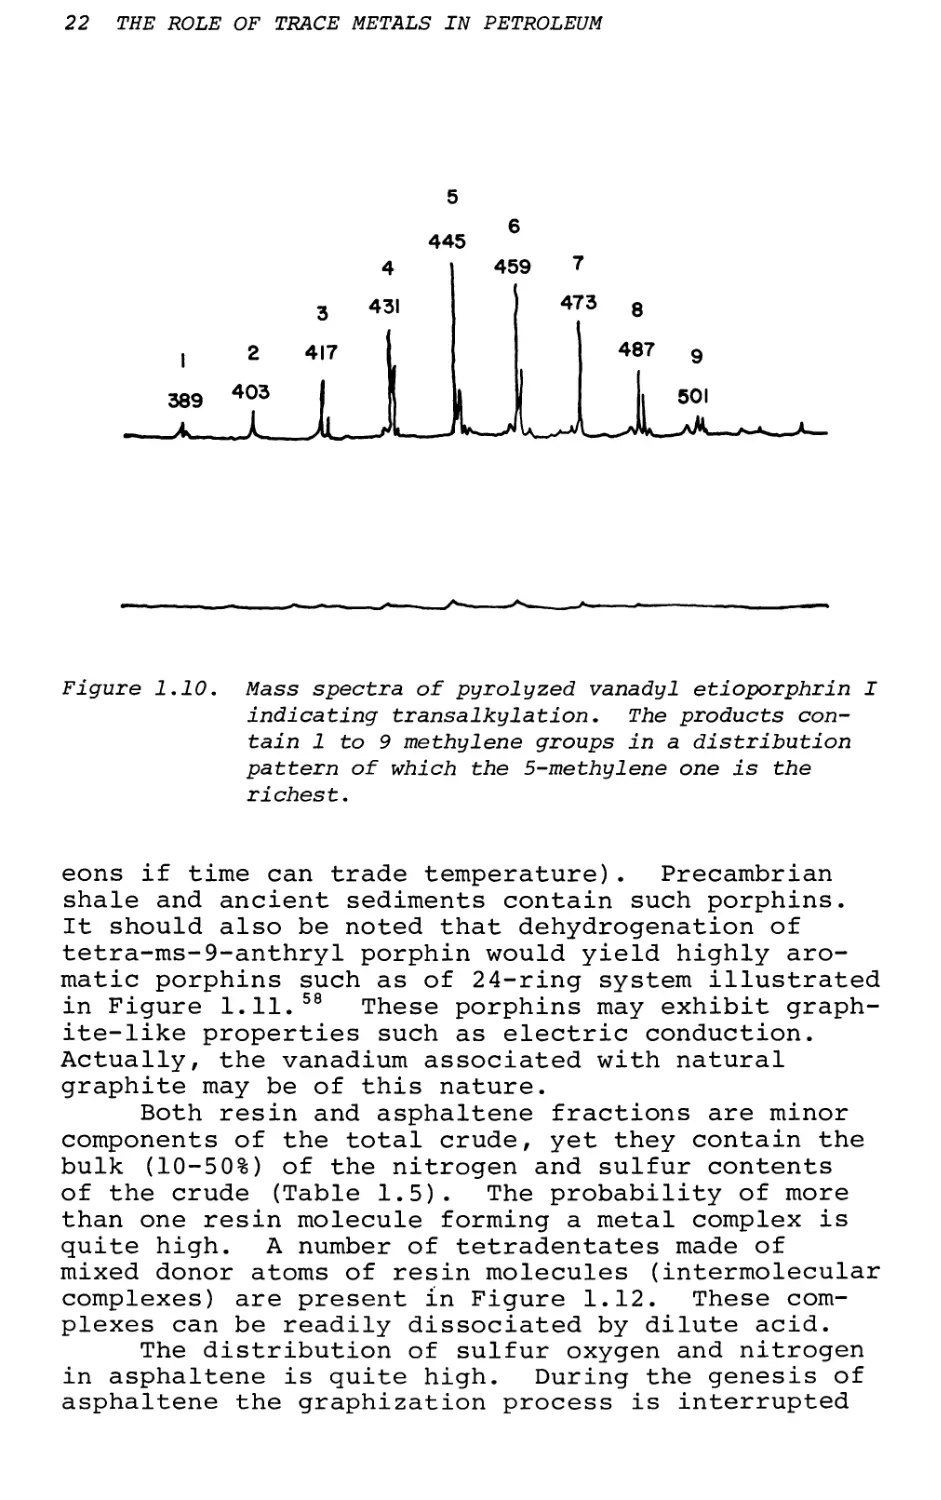
Both resin and asphaltene fractions are minor components of the total crude, yet they contain the bulk (10-50%) of the nitrogen and sulfur contents of the crude (Table 1.5). The probability of more than one resin molecule forming a metal complex is quite high. A number of tetradentates made of mixed donor atoms of resin molecules (intermolecular complexes) are present in Figure 1.12. These complexes can be readily dissociated by dilute acid.
The distribution of sulfur oxygen and nitrogen in asphaltene is quite high. During the genesis of asphaltene the graphization process is interrupted
CHEMICAL ASPECTS 23
Figure 1,11, Formation of highly-fused aromatic porphyrin system under high temperature.
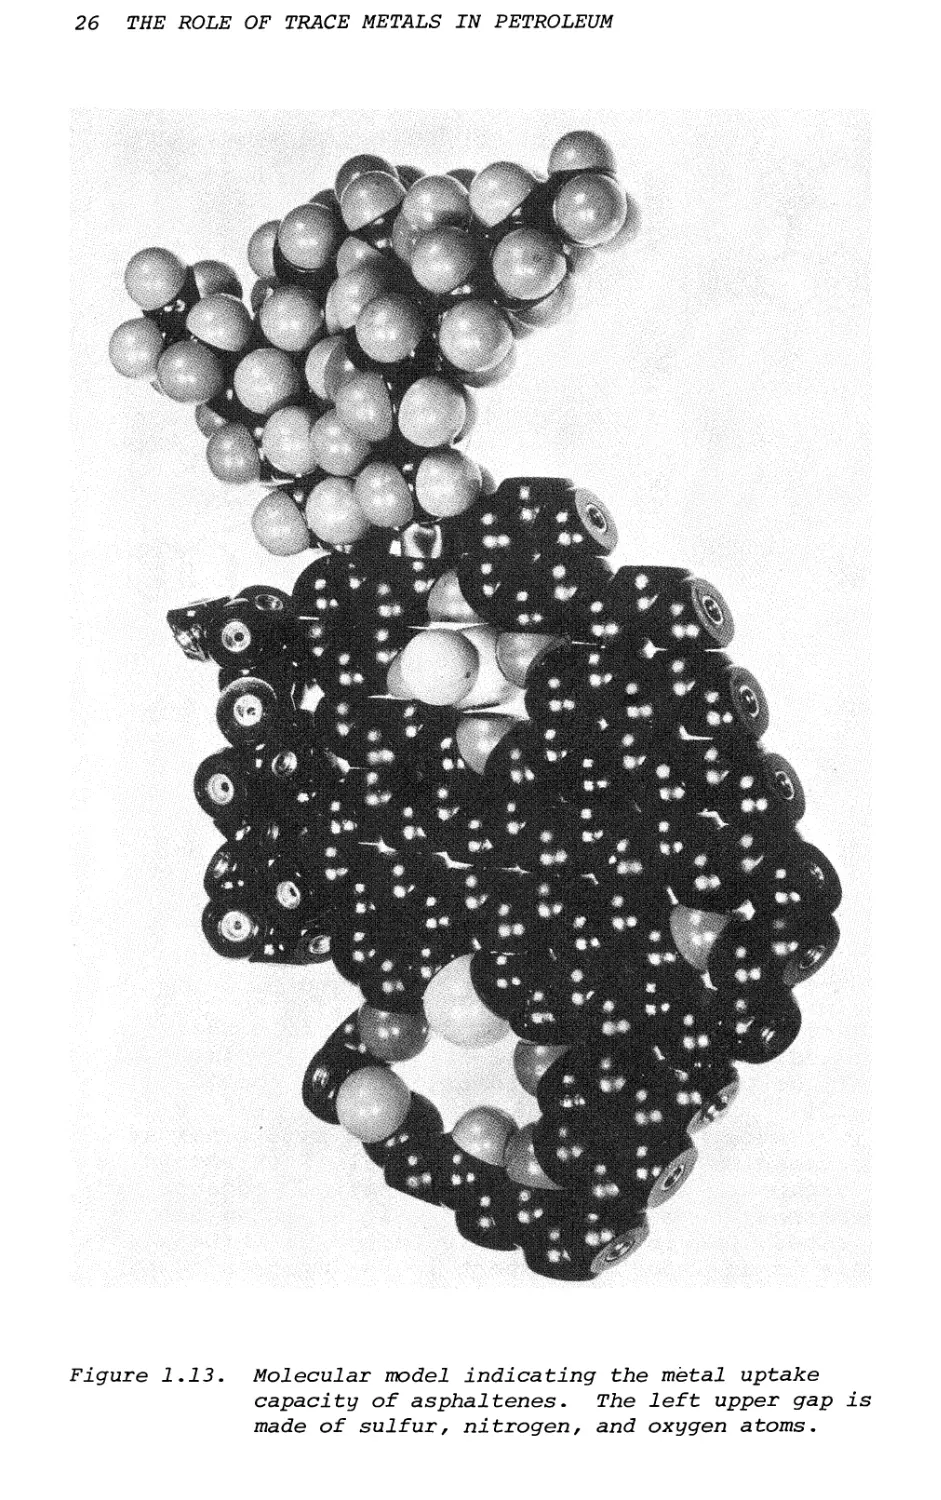
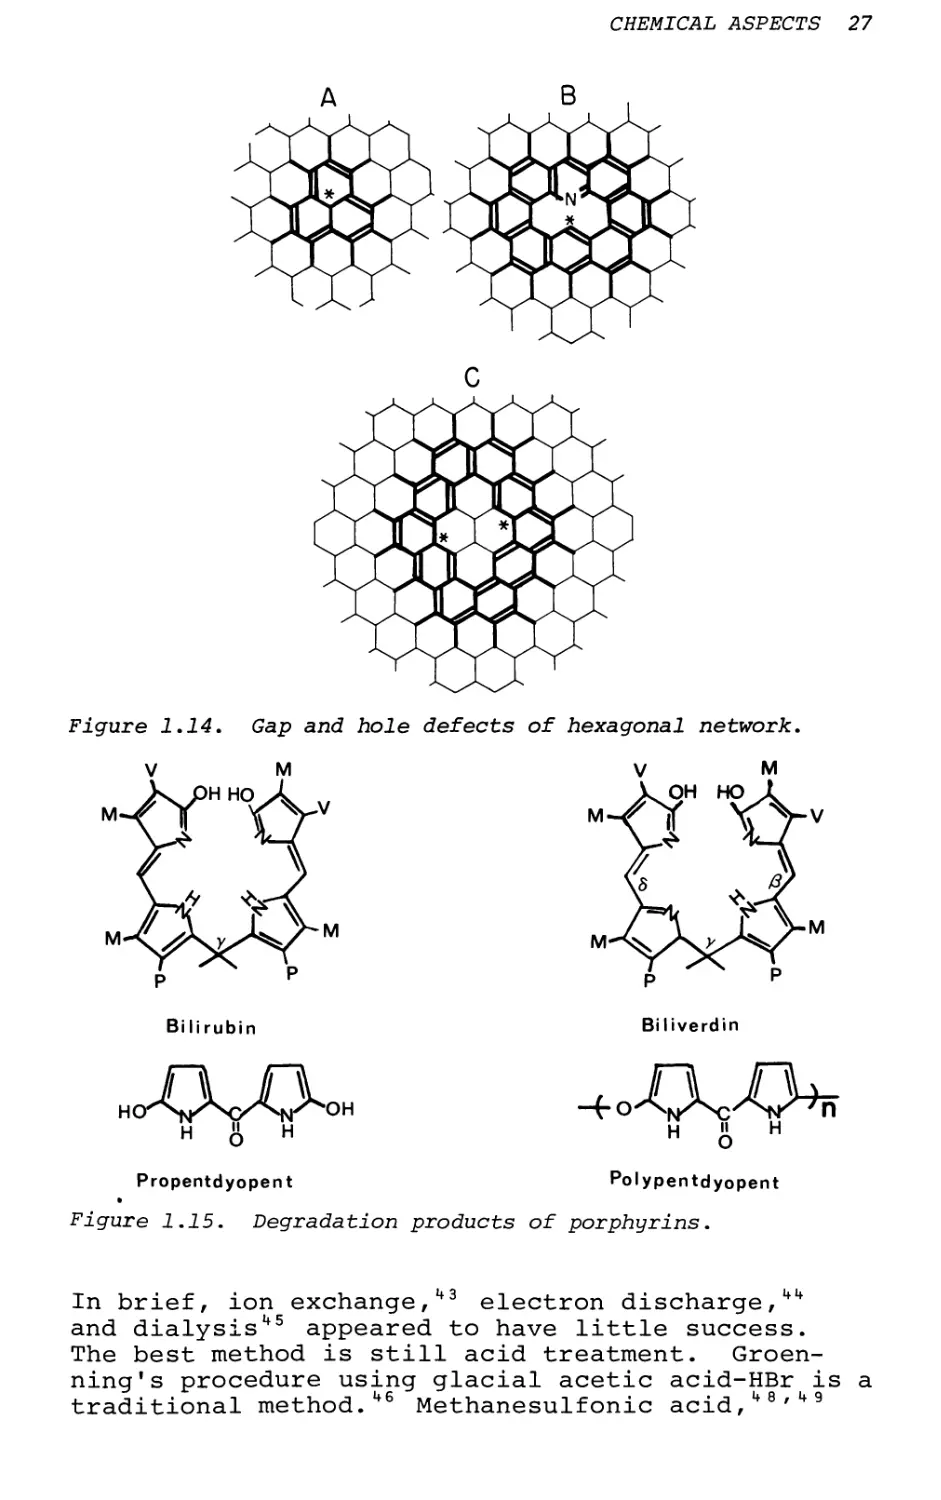
due to the divalent nature of S and 0 and the tri- valent nature of N. In this instance, the incomplete formation of tessellations of hexagons will prevent the complete aromatization of fused benzene network. In this case "gaps" or "holes" will be formed and these centers are expected to be the sites of donor atoms (Figure 1.13). Metals will be able to complex into these sites (Figure 1.14) and cannot be removed by aqueous acid washings.24
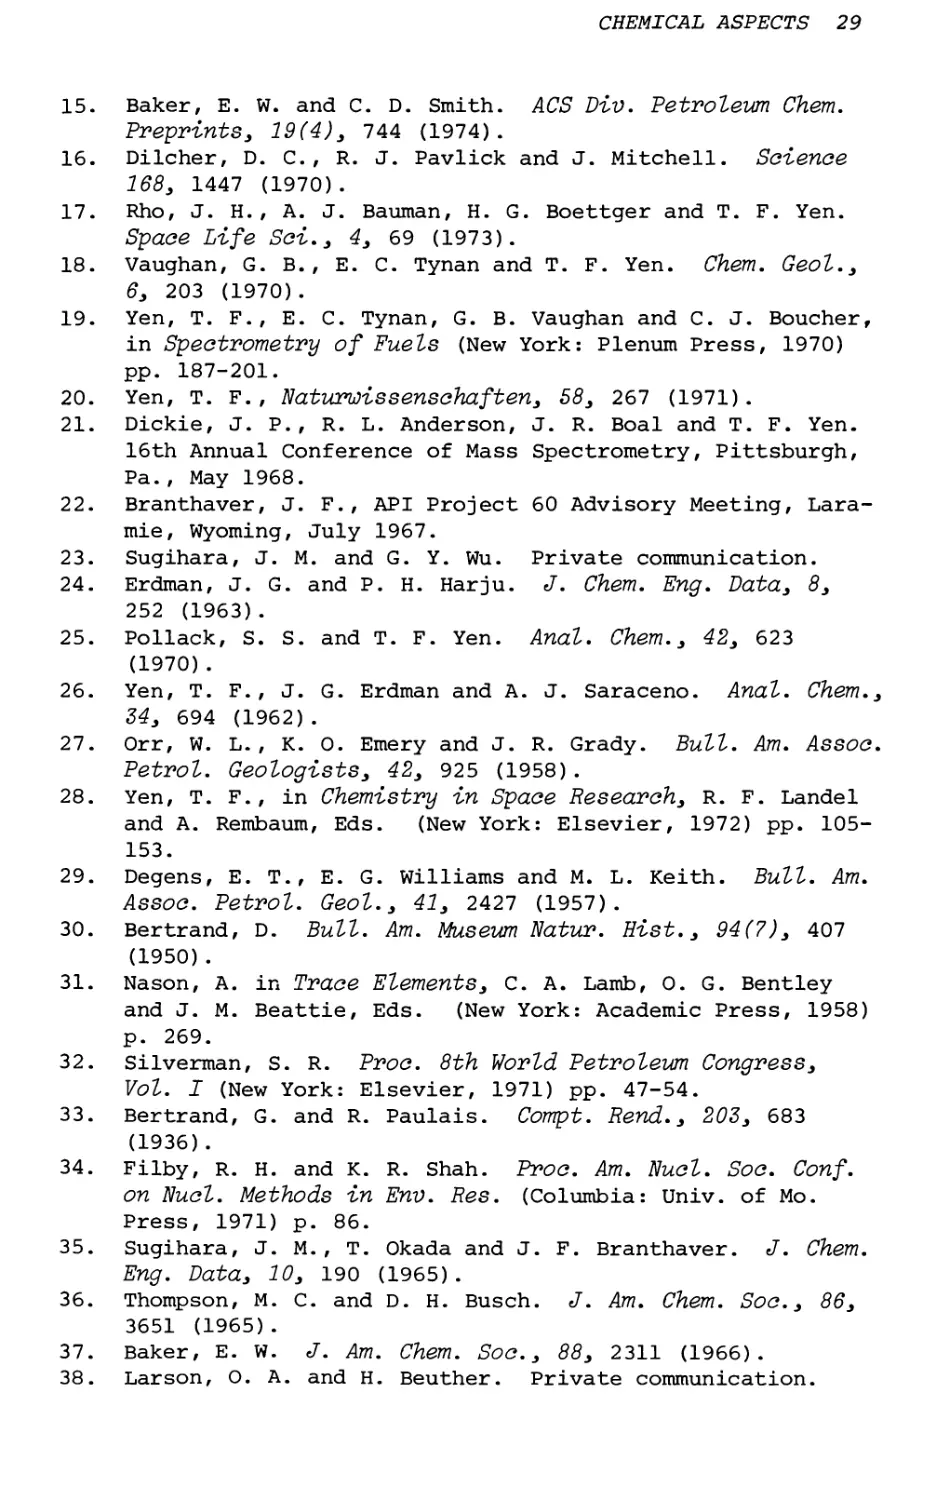
Porphyrin is known to undergo degradation in the presence of air or light. Although this is less likely in native petroleum, it still remains as a possibility. Photooxidation as well as photoreduction occurs readily in the scission of ring, which leads to open-chain analogs such as propendyopent- like derivatives. 6-Radiations are known to cause the loss of a-methane carbon to form bile pigments (Figure 1.15).
APPLICATIONS
As discussed above, there are a number of parameters from the study of the biogenesis of porphyrin that can yield important insights in exploration and prospecting. With some of these parameters, e, g. j, the ratio of DPEP to Etio, the bandwidth already is useful in approximating age in organic geochemistry.10 Other parameters such as V/Ni ratio have been used for correlation, although
Table 1.5
Distribution of Percentage of Total Nitrogen of Crude in Resins and Asphaltenes
Crudes
JoResin
%Asphaltenes
%N
%S
in Resins
in Asphaltenes
in Resins
in Asphaltenes
Mara-La Lune
9.1
4.1
30.0
27.5
20.5
10.5
Oficina
3.9
1.1
18.3
12.8
33.3
13.8
Ragusa
9.2
0.28
—
48.2
—
24.3
Wilmington
14.2
5.1
30.5
15.6
22.9
8.5
North Belridge
18.0
5.1
25.8
14.8
23.9
7.8
Boscan
29.4
18.0
20.4
41.0
35.1
23.0
Sandhills
4.4
0.44
8.5
3.2
9.1
3.1
Abell-Ellenburger
4.2
0.24
39.3
3.1
33.8
3.9
South Waddell
3.9
0.39
50.0
10.0
17.4
3.1
Keystone
2.2
0.22
40.0
10.0
15.1
0.34
South Ward
1.2
0.80
14.4
3.9
6.7
2.3
Hiseville
0.97
0.19
53.0
4.1
12.2
0.7
Athabasca
24.2
19.4
21.8
49.7
28.2
29.5
24 THE ROLE OF TRACE METALS IN PETROLEUM
CHEMICAL ASPECTS 25
Figure 1.12. Metal complexes (tetradentates) of mixed donor atoms.
there is a conflicting trend. A profile analysis including all trace metal for a "fingerprint" is very helpful, e.g.j in identification for oil- spill. 34
Since sulfur is known to bond as a donor atom to vanadium35 as well as to nickel,36 it should be anticipated that dehydrosulfurization proceeds proportional to metal removal.38 It has been demonstrated that in reality this turns out to be so.39'4 This is an important aspect in the processing of heavy oils, but a detailed discussion is not in the scope of this paper.
Metals in charge stocks are known to poison catalysts for further refining and cracking.41'112 Methods are developed for removal of these metals.
THE ROLE of
trace metals
in PETROLEUM
Figure 1-13-
,cular model indicating icity of asphaltenes. s of sulfur, nitrogen,
the metal uptake The left upper gap and oxygen atoms.
CHEMICAL ASPECTS 27
Figure 1.14. Gap and hole defects of hexagonal network.
H r> H
-f
H 'X H
Propentdyopent Polypentdyopent
Figure 1.15. Degradation products of porphyrins.
In brief, ion exchange,1+3 electron discharge,1+11 and dialysis'45 appeared to have little success.
The best method is still acid treatment. Groen- ning's procedure using glacial acetic acid-HBr is a traditional method. 1+6 Methanesulfonic acid, 4 8,1+9
28 THE ROLE OF TRACE METALS IN PETROLEUM
p-toluenesulfonic acid,k7 sulfuric acid,50 and phosphoric acid59 can be used for the demetallation of metalloporphyrins.
Finally, Edler51 suggests the following: In
order to eliminate the difficulties encountered during processing of high vanadium-containing petroleum, the use of a vanadium-containing cracking catalyst for heavy fractions or distillation residues must be sought. Such contacts would avoid the poisoning suffered by conventional cracking catalysts
ACKNOWLEDGMENT
Partial support of this work by PRF No. 6272-AC2 is acknowledged.
REFERENCES
1. Yen, T. F. Energy Sources, 1(1), 117 (1973).
2. Ball, J. S., W. J. Wenger, H. J. Hyden, C. A. Horr and A. T. Myers. ACS Petroleum Chem. Div. Preprints, 1 241 (1956).
3. Treibs, A. Ann. der chem., 510, 42 (1934).
4. Glebovskaya, E. A. and M. V. Vol'kenshtein. J. Gen.
Chem. (USSR), 18, 1440 (1948).
5. Skinner, D. A. Ind. Eng. Chem., 44, 1159 (1952).
6. Corwin, A. H., W. S. Caughey, A. M. Leone, J. E. Danieley and J. F. Bagli. ACS Div. Petroleum Chem. Preprints, 2, A-35 (1957).
7. Dunning, H. N., J. W. Moore, H. Bieber, and R. B. Williams. ACS Div. Petroleum Chem. Preprints, 5, 169 (1960).
8. Eldib, C. A., H. N. Dunning and R. J. Bieber. ACS Div. Petroleum Chem. Preprints, 5, 31 (1960).
9. Baker, E. W., T. F. Yen, J. P. Dickie, R. E. Rhodes, and L. F. Clark. J. Am. Chem. Soc., 89, 3631 (1967).
10. Yen, T. F. and S. R. Silverman. ACS Div. Petroleum Chem. Preprints, 14(3), E32-E39 (1969).
11. Yen, T. F., L. J. Boucher, J. P. Dickie, E. C. Tynan, and G. V. Vaughan. Proc. Inst. Petroleum, 55, 87 (1969).
12. Nissenbaum, A., M. J. Baedecker and I. R. Kaplan. Geo- chim. Cosmochim. Acta, 36, 709 (1972).
13. Thomas, D. W. and M. Blumer. Geochim. Cosmochim. Acta, 28, 1147 (1964).
14. Yen, T. F. in Trace Substance in Environmental Health, Vol. VI, D. D. Hemphill, Ed. (Columbia: Univ. of Missouri Press, 1973) pp. 347-353.
CHEMICAL ASPECTS 29
15. Baker, E. W. and C. D. Smith. ACS Div. Petroleum Chem. Preprints, 19(4), 744 (1974).
16. Dilcher, D. C., R. J. Pavlick and J. Mitchell. Science 168, 1447 (1970).
17. Rho, J. H., A. J. Bauman, H. G. Boettger and T. F. Yen.
Space Life Sci., 4, 69 (1973).
18. Vaughan, G. B., E. C. Tynan and T. F. Yen. Chem. Geol.,
6, 203 (1970).
19. Yen, T. F., E. C. Tynan, G. B. Vaughan and C. J. Boucher, in Spectrometry of Fuels (New York: Plenum Press, 1970) pp. 187-201.
20. Yen, T. F., Naturwissenschaften, 58, 267 (1971).
21. Dickie, J. P., R. L. Anderson, J. R. Boal and T. F. Yen. 16th Annual Conference of Mass Spectrometry, Pittsburgh, Pa., May 1968.
22. Branthaver, J. F., API Project 60 Advisory Meeting, Laramie, Wyoming, July 1967.
23. Sugihara, J. M. and G. Y. Wu. Private communication.
24. Erdman, J. G. and P. H. Harju. J. Chem. Eng. Data, 8,
252 (1963).
25. Pollack, S. S. and T. F. Yen. Anal. Chem., 42, 623 (1970).
26. Yen, T. F., J. G. Erdman and A. J. Saraceno. Anal. Chem., 34, 694 (1962).
27. Orr, W. L., K. 0. Emery and J. R. Grady. Bull. Am. Assoc. Petrol. Geologists, 42, 925 (1958).
28. Yen, T. F., in Chemistry in Space Research, R. F. Landel and A. Rembaum, Eds. (New York: Elsevier, 1972) pp. 105- 153.
29. Degens, E. T., E. G. Williams and M. L. Keith. Bull. Am. Assoc. Petrol. Geol., 41, 2427 (1957).
30. Bertrand, D. Bull. Am. Museum Natur. Hist., 94(7), 407 (1950).
31. Nason, A. in Trace Elements, C. A. Lamb, O. G. Bentley and J. M. Beattie, Eds. (New York: Academic Press, 1958) p. 269.
32. Silverman, S. R. Proc. 8th World Petroleum Congress,
Vol. I (New York: Elsevier, 1971) pp. 47-54.
33. Bertrand, G. and R. Paulais. Compt. Rend., 203, 683 (1936).
34. Filby, R. H. and K. R. Shah. Proc. Am. Duel. Soc. Conf. on Fuel. Methods in Env. Res. (Columbia: Univ. of Mo. Press, 1971) p. 86.
35. Sugihara, J. M., T. Okada and J. F. Branthaver. J. Chem. Eng. Data, 10, 190 (1965).
36. Thompson, M. C. and D. H. Busch. J. Am. Chem. Soc., 86, 3651 (1965).
37. Baker, E. W. J. Am. Chem. Soc., 88, 2311 (1966).
38. Larson, O. A. and H. Beuther. Private communication.
30
THE ROLE OF TRACE ELEMENTS IN PETROLEUM
39. Ebel, R. H. ACS Div. Petroleum Chem. Preprints, 17(3),
C46 (1972).
40. Drushel, H. V. ACS Div. Petroleum Chem. Preprints, 17(4) F92 (1972).
41. Mills, G. A. Ind. Eng. Chem., 42, 182 (1950).
42. Mills, G. A. and H. H. Shabaker. Pet. Refiner, 30, 97 (1951).
43. McClintock, T. L. MS Thesis, Rensselaer Polytechnic Institute, June 1950.
44. Harju, P. H. and T. J. Hardwick. Private communication, 1961.
45. Wolsky, A. A. and F. W. Chapman, Jr. Midyear Meeting API Div. Refinery, May 1960.
46. Groenning, S. Anal. Chem., 25, 938 (1953).
47. Kotova, A. V., S. V. Emelyanova and V. G. Ben'kovskii. Khim. Tekhnol. Topliv. i Masel, 10, 29 (1965).
48. Rho, J. H., A. J. Bauman, T. F. Yen and J. Bonner. Science 167, 754 (1970).
49. Erdman, J. G. U. S. Pat. 3,190,829 (1965).
50. Dean, R. A. and R. B. Girdler. Chem. Ind., 100 (1960).
51. Edler, E. Abstract Paper D, Section IV, International Symposium on Vanadium and Other Metals in Petroleum, Universidad del Zulia, Maracaibo, Venezuela, Aug., 1973.
52. Boucher, L. J., E. C. Tynan and T. F. Yen. Inorg. Chem., 7, 731 (1968).
53. Boucher, L. J. and T. F. Yen. Inorg. Chem., 7, 2665
(1968) .
54. Boucher, L. J. and T. F. Yen. Inorg. Chem., 8, 689
(1969) .
55. Boucher, L. J., E. C. Tynan and T. F. Yen, in Electron Spin Resonance of Metal Complexes, T. F. Yen, Ed. (New York: Plenum, 1969) pp. 111-130.
56. Yen, T. F. Papers presented at Gordon Research Conferences on Geochemistry, Plymouth, New Hampshire, Aug. 1970.
57. Dickson, F. E., C. J. Kunesh, E. L. McGinnis and L. Petra- kis. ACS Div. Petroleum Chem. Preprints, 16(1), A37 (1971).
58. Yen, T. F. Papers delivered at Joint Conference on Possible Organic Superconductors, Jet Propulsion Laboratory, Pasadena, Calif., March 1970.
59. Baker, E. W. in Organic Geochemistry, G. Eglinton and M. T. J. Murphy, Eds. (Berlin: Springer-Verlag, 1969) pp. 464-497.
60. Black, W. A. P. and R. L. Michell. J. Marine Biol.
Assoc., 30, 575 (1952).
61. Noddack, I. and W. Noddack. Arkiv. zool.,32A(4) (1939).
62. Goldberg, E. E. in Chemical Oceanography, Vol. I, J. P. Riely and G. Skirrow, Eds. (New York: Academic Press, 1965) pp. 163-196.
63. Holt, A. S. in The Chlorophylls, L. P. Vernon and G. R. Seely, Eds. (New York: Academic Press, 1966) pp. 111-118.
CHAPTER 2
THE NATURE OF METALS IN PETROLEUM
R. H. Filby
Department of Chemistry and Nuclear Radiation Center Washington State University Pullman, Washington
Although petroleum consists predominantly of hydrocarbons, most petroleums contain measureable quantities of many metals. Nickel and vanadium are commonly the most abundant metals but Fe, Zn, Cr,
Cu, Mn, Co, and others are almost always present in concentrations ranging from less than 1 ng/g to more than 100 yg/g. The nature of these metals and their abundances in crude oils can give information on the origin, migration, and maturation of petroleum as well as providing a basis for regional geochemical prospecting. Also, the question of at what stage and how metals were incorporated during petroleum genesis is an intriguing geochemical problem, one that is far from being solved. The nature of metals in crude and residual oils is also of interest to the refinery operator and to environmentalists concerned with emissions from oil-fired power plants.
Several early studies reported the presence of trace elements in the ashes of oils1'2 but the first quantitative data were presented by Shirey3 who determined 13 metallic elements in the ashes of 7 oils. Most of the work published since World War II has concerned the geochemical significance of trace element distributions within oil fields and related rocks or the nature of Ni and V in petroleum as these elements cause problems in refining processes.
Bonhamanalyzed 60 U.S. oils for V, Cu and Ni by a spectrographic technique, and Erickson, Myers and Horr5 analyzed crude-oil ashes for V, Ni, Cu,
As, Co, Mo, Pb, Cr, U and Mn by a semiquantitative procedure. In both studies, the authors concluded
31
32 THE ROLE OF TRACE METALS IN PETROLEUM
that the elements detected occurred in an oil-soluble form. Bonham ** showed that oils from certain basins contain distinctive trace element suites but that correlations of producing strata from pool to pool could not be made.
Hodgson6 in a study of the oils of Western Canada measured Ni, V, and Fe and concluded that the V/Ni ratio decreased with increasing maturation as indicated by the sequence of asphaltic shallow oils (Cretaceous) to deeper less asphaltic oils (Devonian). Hodgson6 interpreted the data to indicate that the
V porphyrin complex was less stable than the Ni complex and that that the contents of Ni, V, and Fe
were derived from the original source organic material. Hyden7 and Ball, et al.jB however, have presented data to show that the V/Ni ratio increased with age of the host rock. Similar conclusions were used by Al-Shahristani and Al-Atyia9 to show vertical migration from deeper Cretaceous formations to shallow Tertiary formations in Iraqi fields. Other authors10/11 have concluded that the V/Ni ratio does not correlate with age.
In recent years several studies of the distribution of trace elements in U.S.S.R.petroleums and correlations with geochemical properties have been made.12 16 Kotova, et at.showed that V, Ni, Cu,
Ge and Ga varied as a function of depth and age of reservoir rock and that the metals were concentrated in the asphaltic fraction of the oils. Similar conclusions were reached by Katchenkov and Flegentova,13 Botneva,11* Mileshina, et al.15 and Nurev and Dzhab- harova16 but Gilmanshin, et at.11 concluded that V,
Ni, Fe and Cu were not related to the asphaltene or resin contents of oils of the Pashiisk region.
For valid geochemical interpretation of trace element data in crude oils it is necessary to know in what forms the trace elements occur, and except for Ni and V such knowledge is largely lacking.
The metals may be present in oils as inorganic particulate matter (such as mineral grains or absorbed on clay minerals), in emulsified formation waters, introduced as drilling fluids or corrosion inhibitors or present as organometallic complexes. Only if the metals are present in an oil-soluble form as true complexes can meaningful geochemical information be obtained from trace element data.
Nickel and vanadium in crude oils have been studied extensively because of the presence of Ni and
V porphyrins, which are thought to have been derived from chlorophyll (or hemoglobin), thus indicating a biogenic origin for petroleum. It is now recognized17/18
THE NATURE OF METALS 33
that significant amounts of Ni and V, which cannot be accounted for by free metalloporphyrins, are present in crude oils. The nonporphyrin Ni and V is present in the asphaltic component of crude oils and either occupies sites bounded by hetero-atoms (N, S, 0) or is present in metalloporphyrins strongly associated by 7T-7T bonding to the asphaltene aromatic sheets.19 The origin of this nonporphyrin Ni and V is not known. It may have been incorporated in the asphaltene structure from the original organic source material, replaced other metal cations in the asphaltenes, or incorporated by complexation from aqueous or solid phases during the migration or maturation of petroleum. Sugihara, et at.18 have postulated that the nonporphyrin V in asphaltenes was the source of V introduced into the porphyrin structure during the conversion of chlorophyll in the source material to the metalloporphyrins found in oil. The fact that V and Ni may occur in porphyrin and non-porphyrin forms may explain some of the conflicting data concerning the correlations of V/Ni ratios with age of reservoir rock.
Very little is known of the nature of metals other than Ni and V in crude oils. In several studies cited previouslylf /518 /1 2 it was demonstrated that the metals occurred in oil soluble form, and some authors have noted the association of metals with the asphaltic fraction of petroleum.12-16 Erdman and Harju19 have thrown doubt on these conclusions and consider that, except for Ni and V, the trace element contents of crude oils can be reduced to insignificant levels by centrifuging or other procedures designed to remove suspended particulate matter or a dispersed aqueous phase.
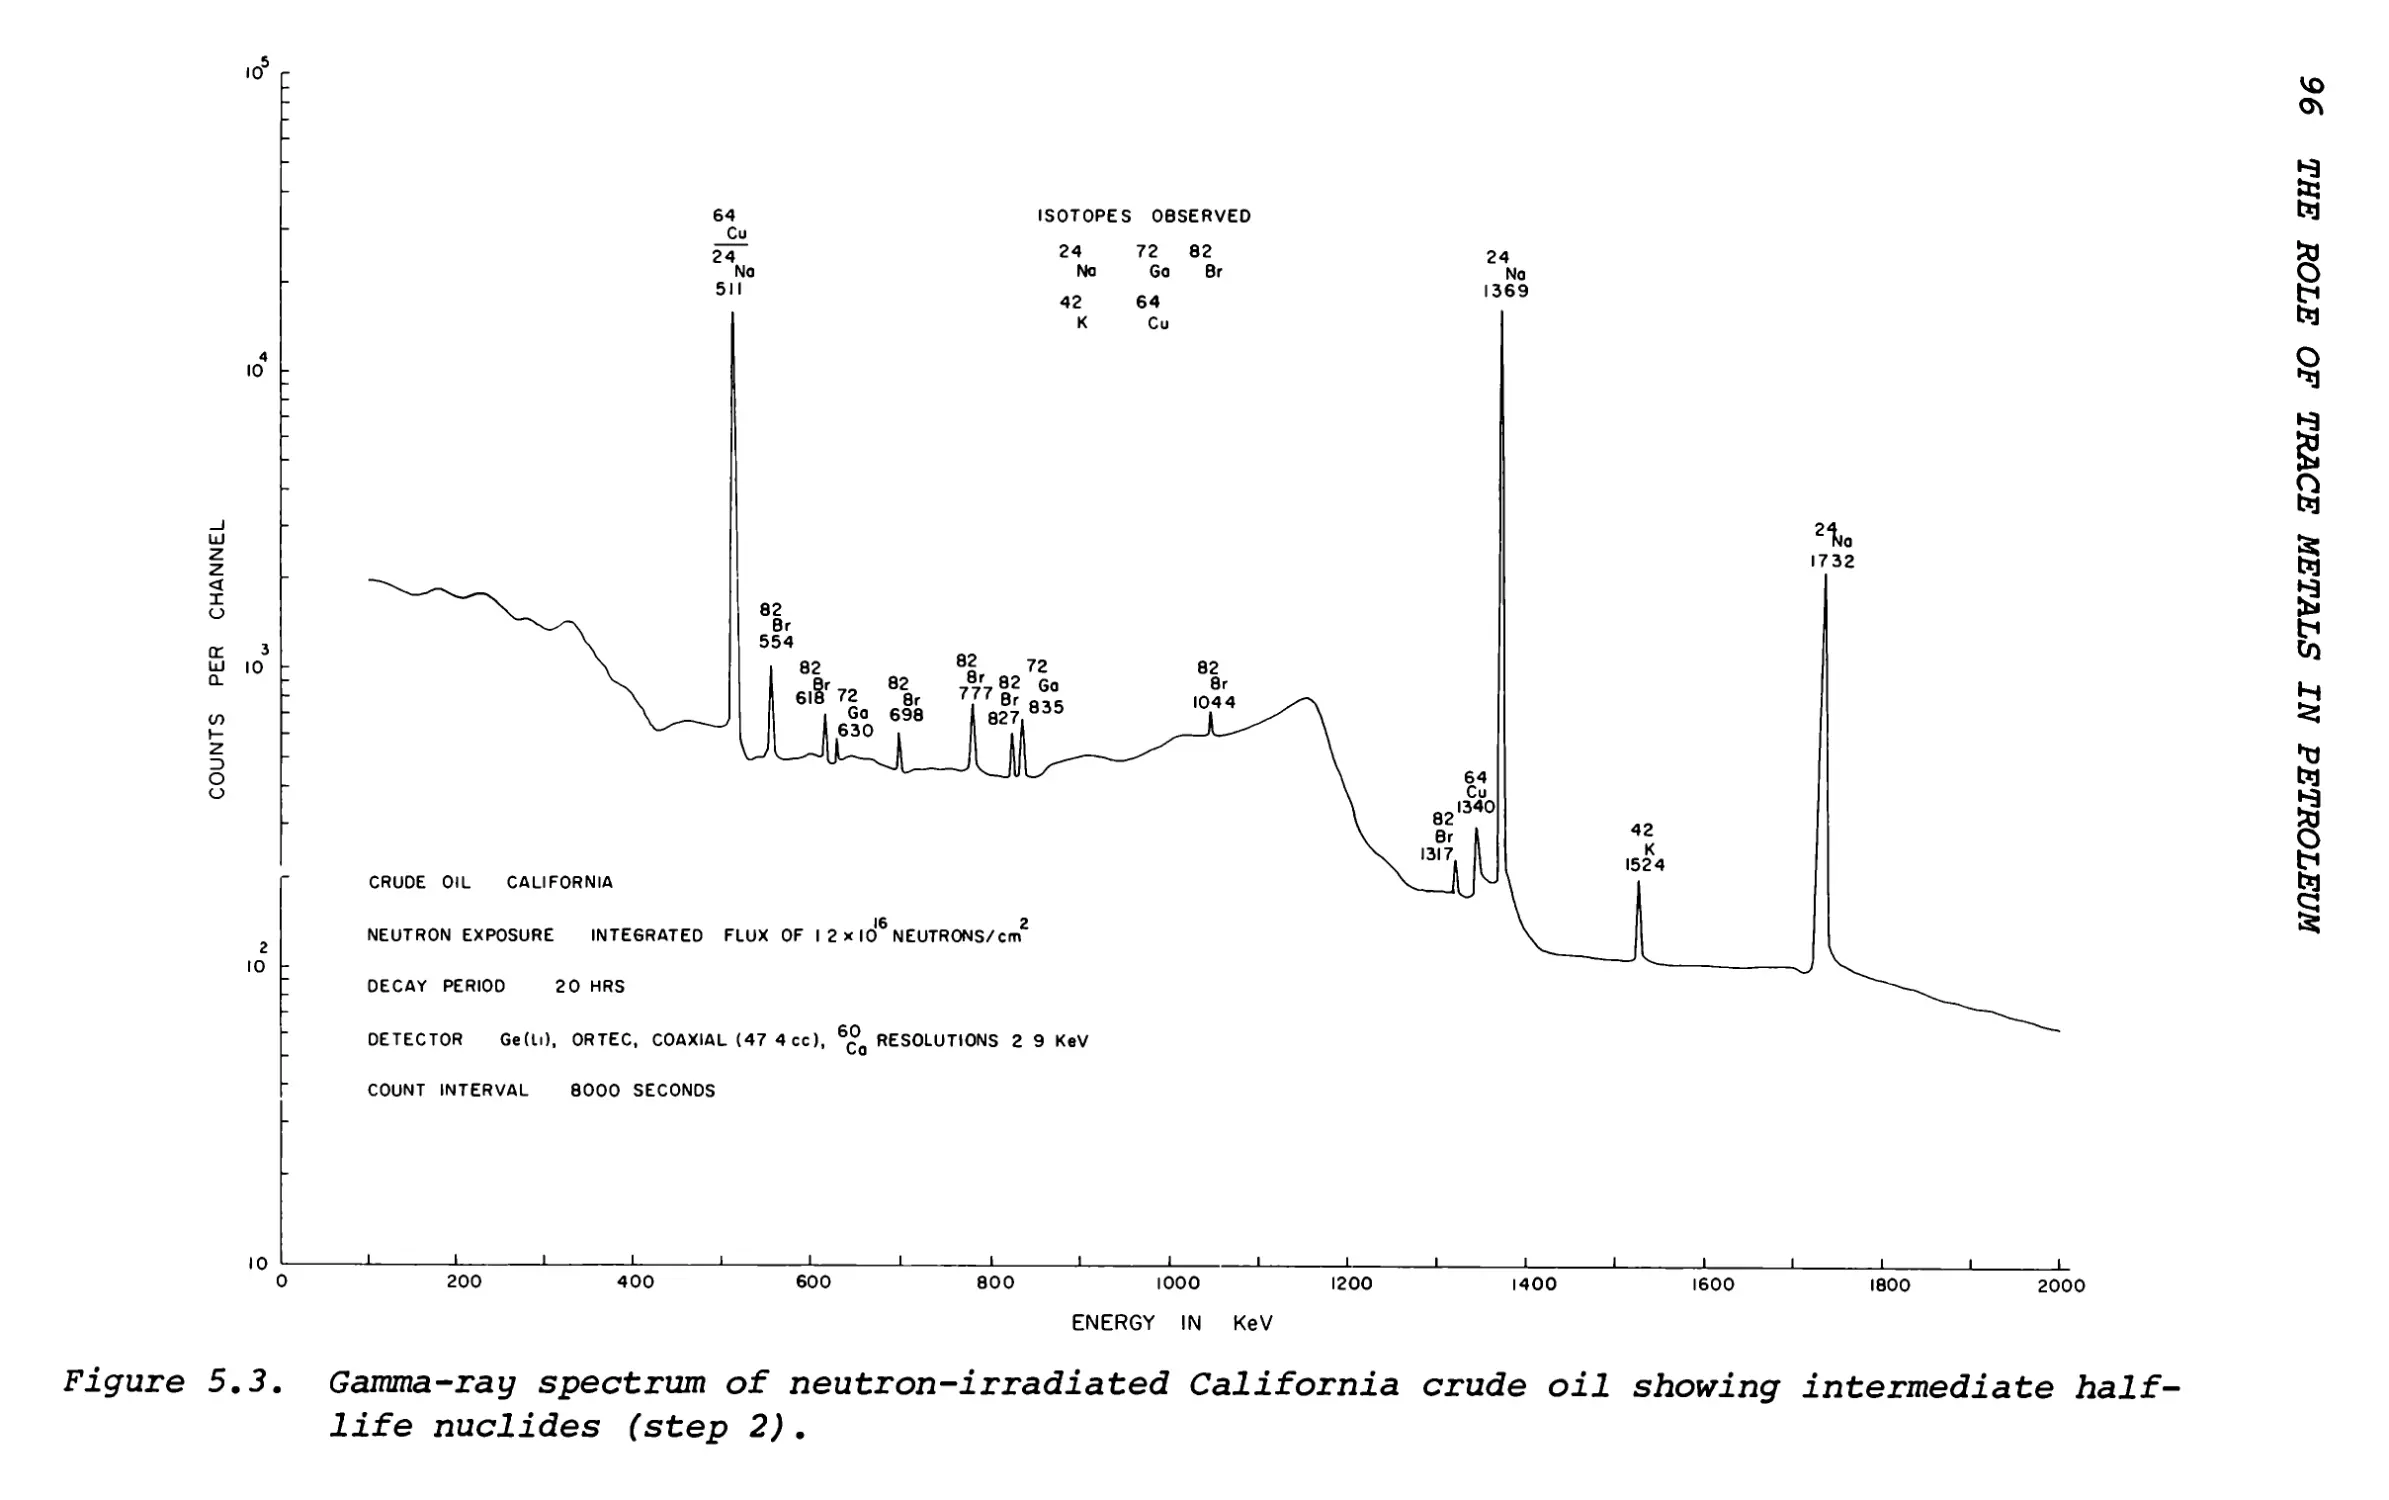
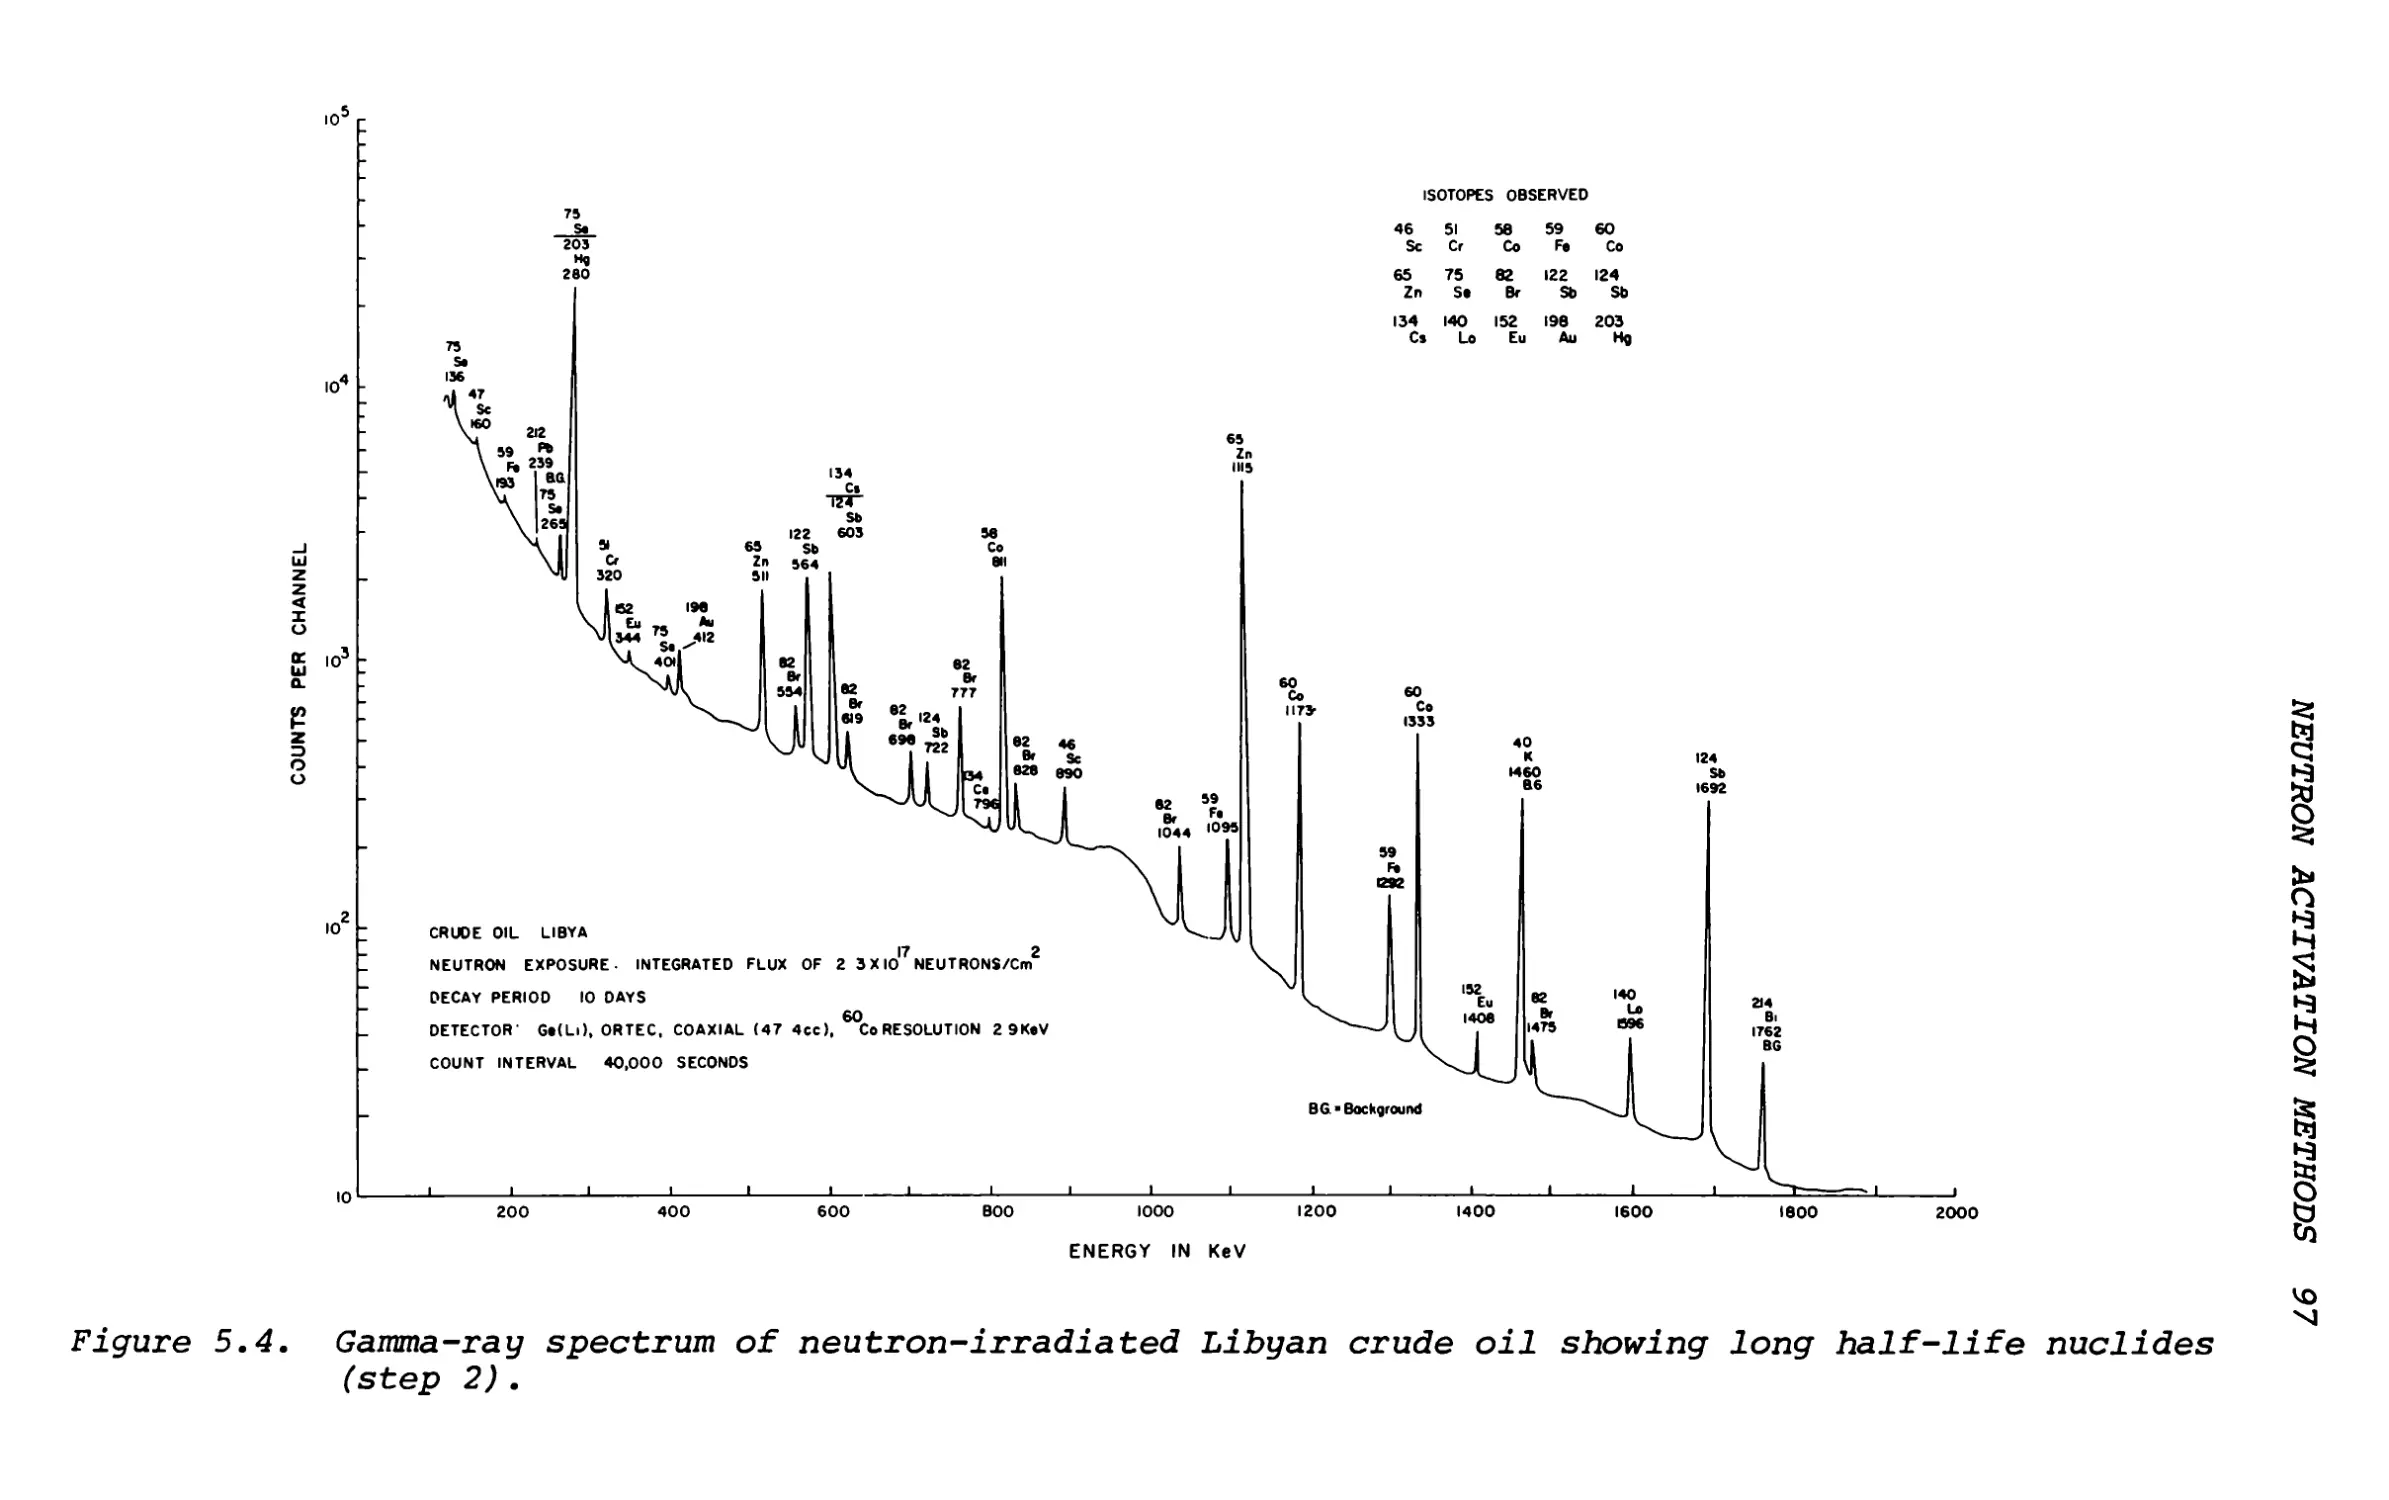
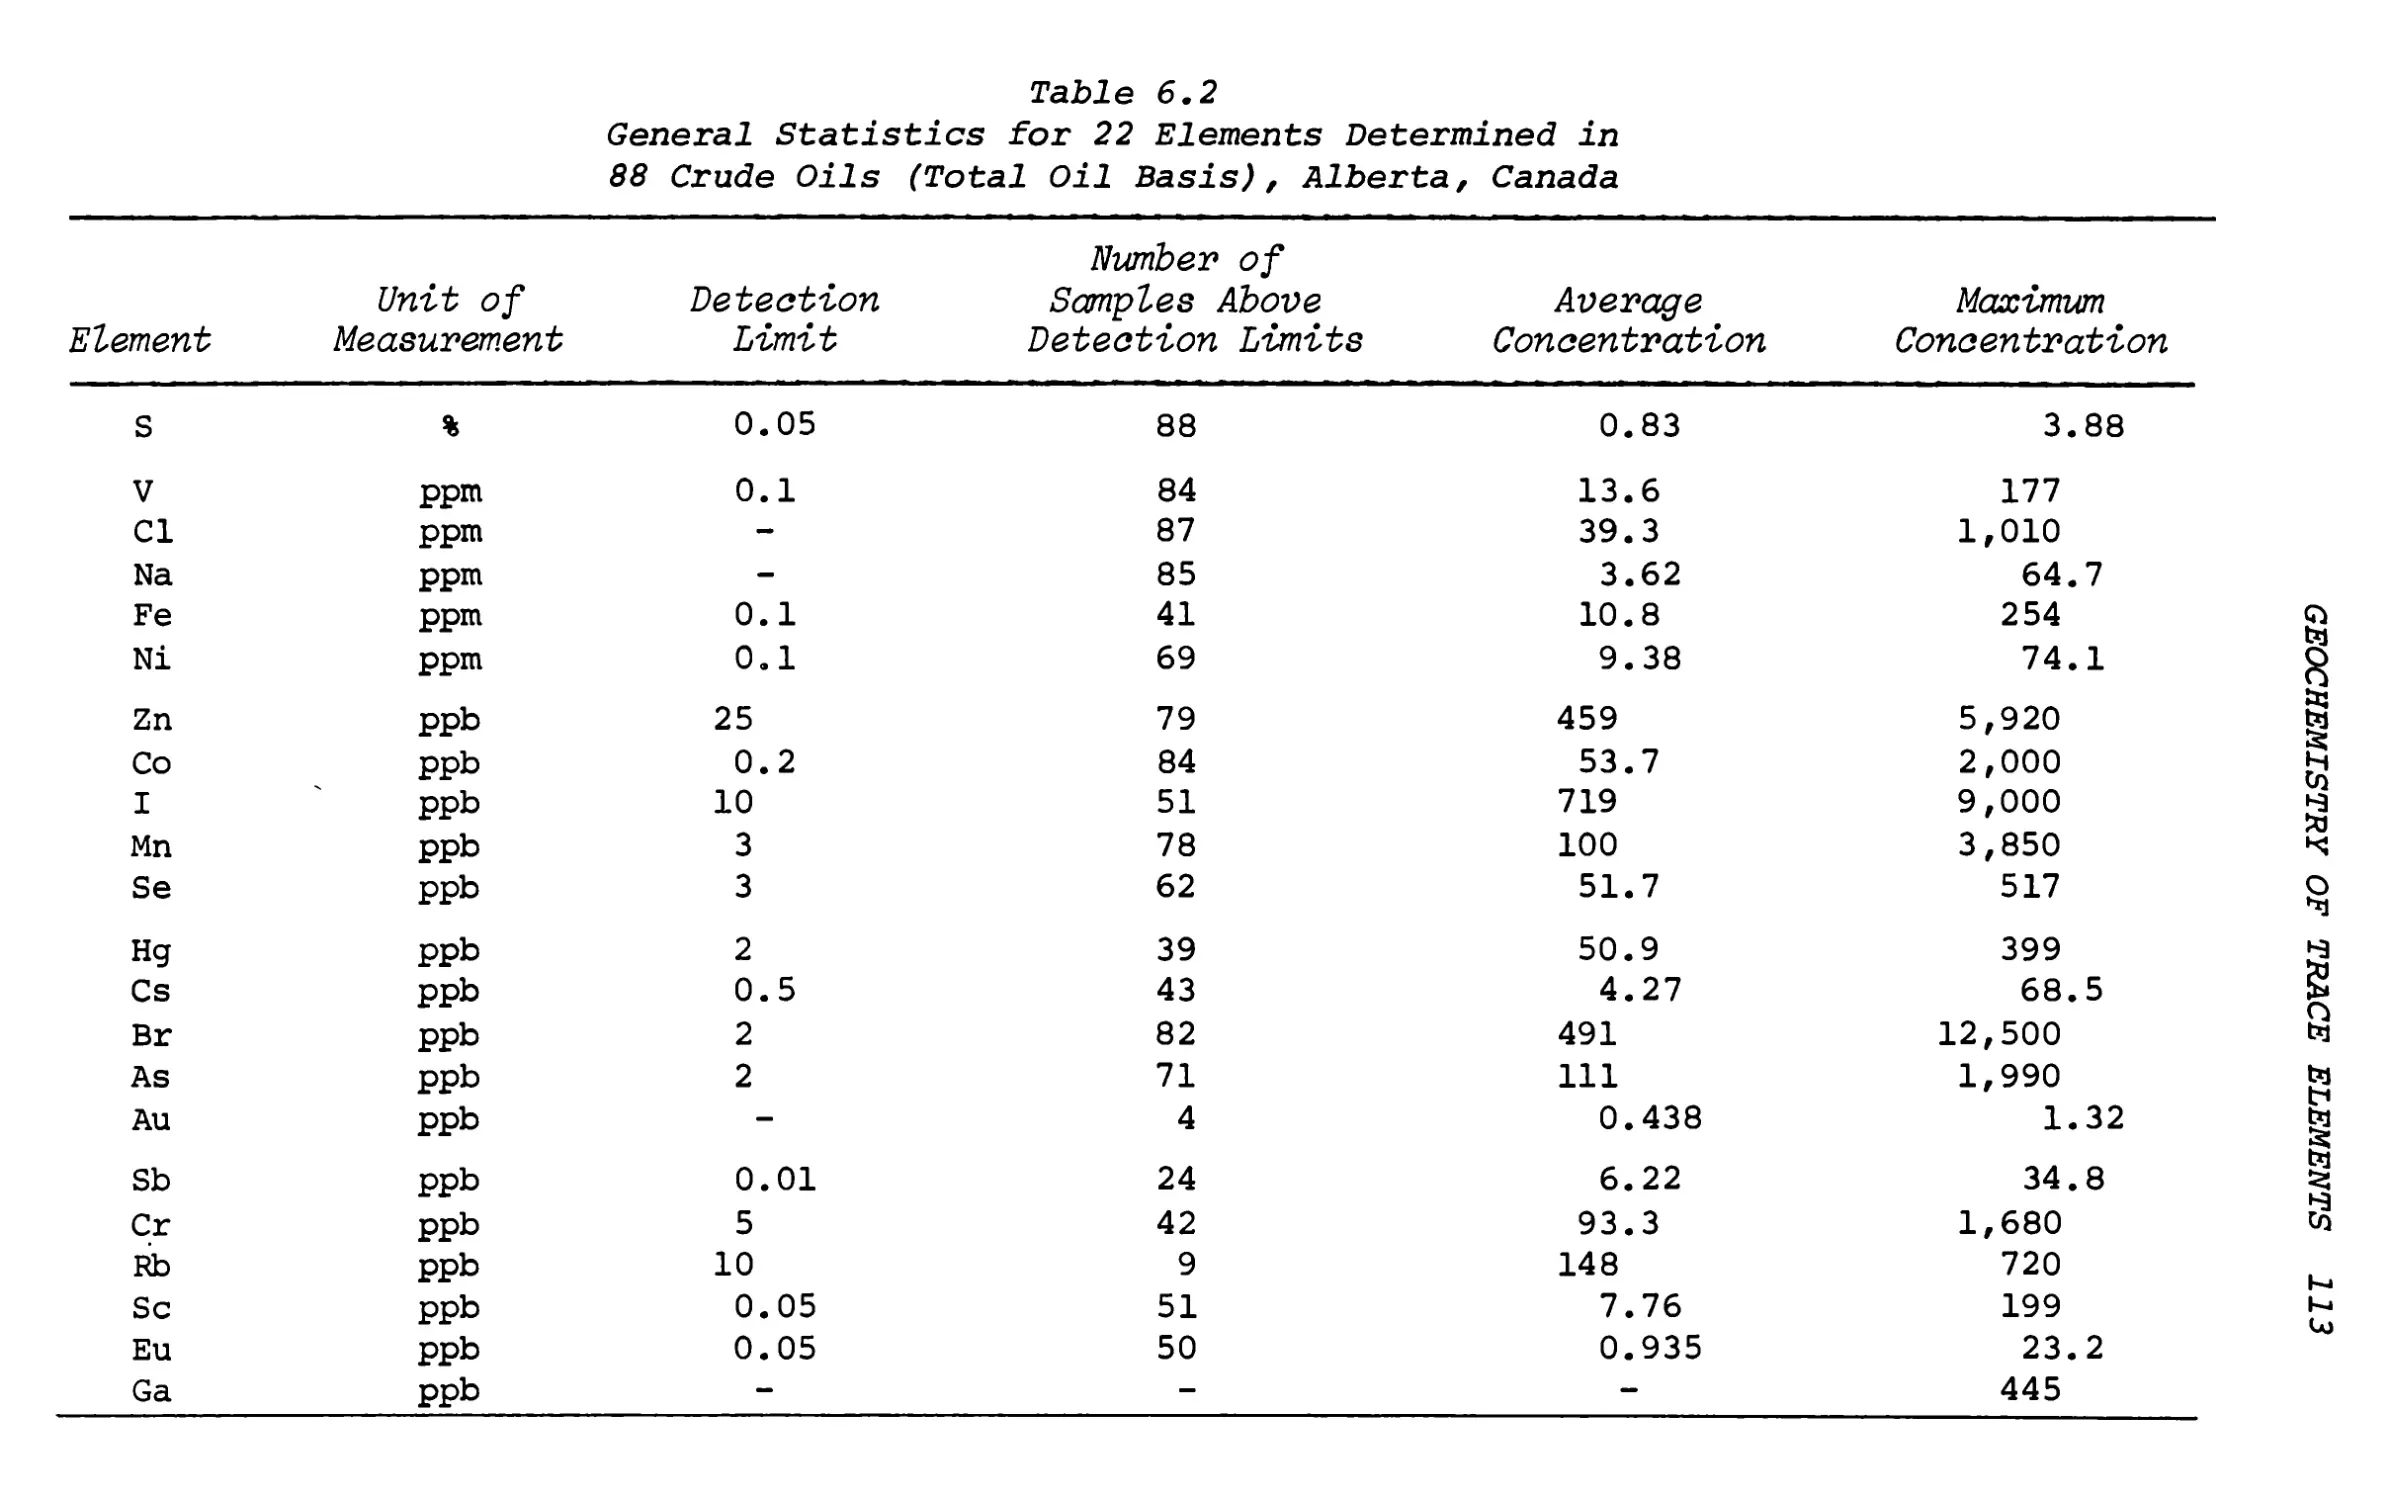
The paucity of information on metals, other than Ni and V, in crude oil is due principally to the poor sensitivity of most common analytical techniques for trace metals in oil. Neutron activation analysis has been used for trace element measurement in crude oils by several workers20-21* and allows detection of many elements at the sub-ppm level in small samples (0.1-1.0 g). Shah, et al.22r23 have developed an instrumental neutron activation analysis method for the determination of 23 elements in crude oils and Hitchon, et at.25 have used this method for a detailed study of the trace element geochemistry of Alberta crude oils. A review of the application of neutron activation analysis to trace metals in petroleum is included in this book.26
The preliminary study reported here is part of an investigation of the abundances and nature of trace- element species in crude oils. Neutron activation
34 THE ROLE OF TRACE METALS IN PETROLEUM
analysis was used to determine whether the trace elements of a California Tertiary oil were present in oil-soluble form or in an associated aqueous or solid phase. The California oil (C-l) selected was previously shown to have anomalously high concentrations of several trace elements, including Ni, Cr, Co, Zn, Fe, Hg, Cu and As. The distribution of trace elements in the oil was determined by separating the oil into three components—a methanol soluble fraction, a methanol insoluble-n-pentane soluble fraction ("resin") and an n-pentane insoluble fraction (asphaltenes). Each fraction was separated into molecular-weight fractions by gel permeation chromatography (GPC), and liquid chromatography on AI2O3 or SiO* was used to separate porphyrin concentrates in an attempt to determine whether porphyrins, other than those of Ni and V, were present in the oil.
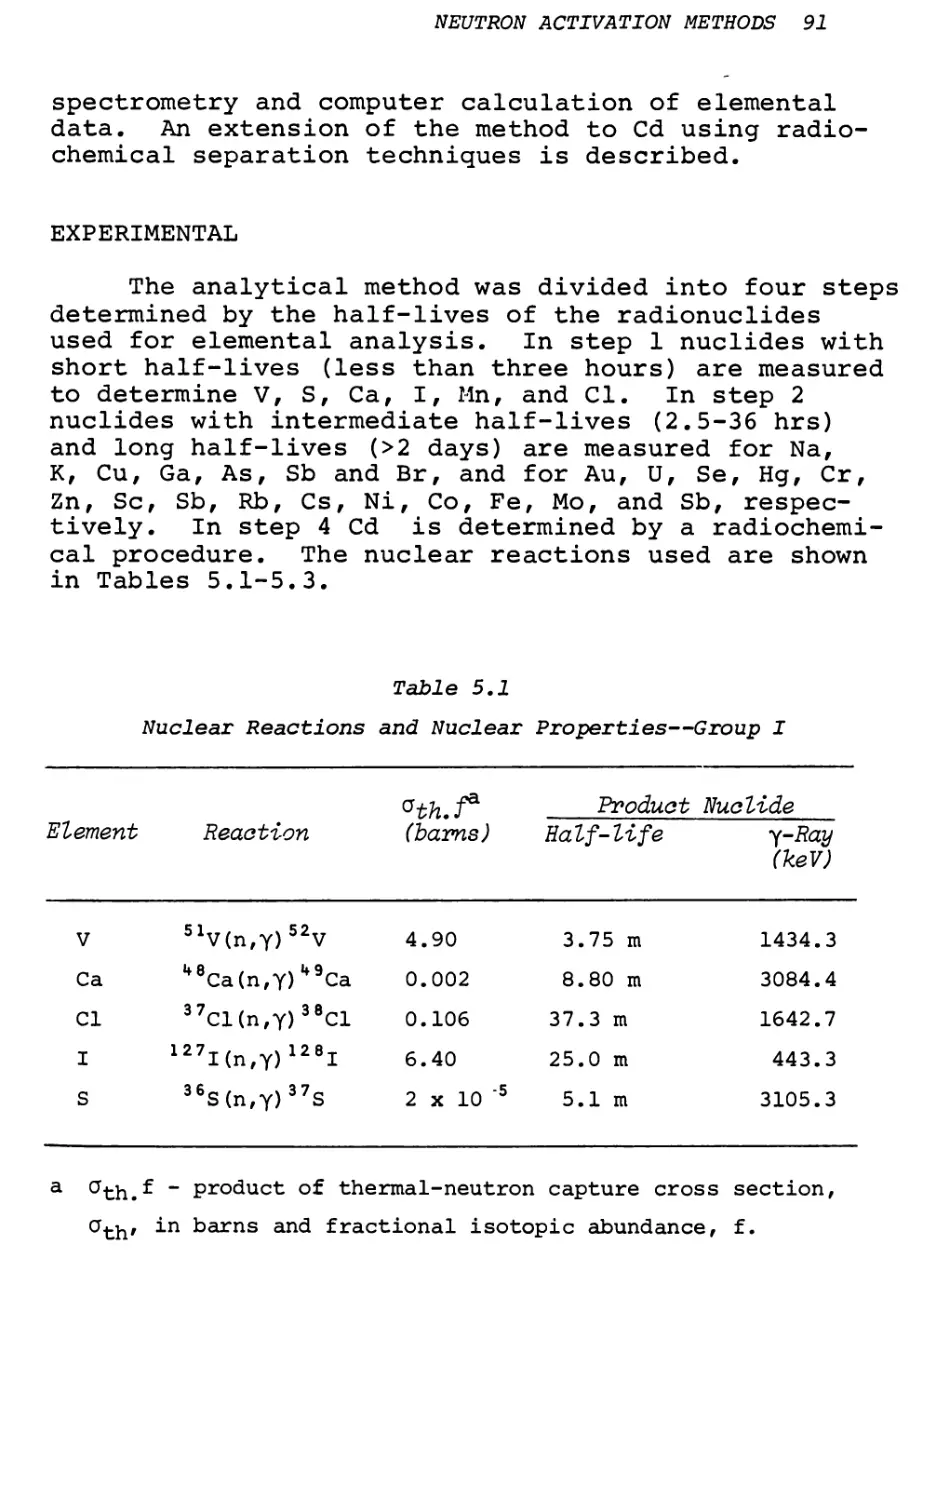
EXPERIMENTAL
Separation of Oil Components
Several crude oils were examined for use in the distribution study. It was necessary to choose an oil with no aqueous phase or observable mineral matter dispersed in the organic matrix. In addition the fact that small fractions isolated from the oil were to be analyzed required that the oil selected have a high asphaltene content (>5%) and a high content of trace metals. The oil chosen was a Tertiary California oil which had been analyzed previously by neutron activation analysis.2k
The oil chosen for detailed analysis was too viscous for direct centrifuging and was diluted 1:1 with benzene (Baker "Analyzed" Reagent). The oil was then centrifuged for 2 hours and the supernate filtered through a Whatman #42 filter paper. (In later experiments a final filtration step through a 5 y Millipore filter was used.) After removal of benzene by vacuum evaporation, the oil (1-10 g) was weighed into a 250-ml polyethylene bottle. 200-ml n-pentane (Baker Reagent) was then added and the bottle shaken for 4 hr at 25°C to precipitate the asphaltenes. The solution was centrifuged and the asphaltenes were washed several times with n-pentane until the wash solution was clear. The asphaltenes were then dried at 45°C to remove the solvent and the precipitation with n-pentane repeated. The small amount of asphaltenes precipitated was combined with
THE NATURE OF METALS 35
the bulk of the asphaltenes. The maltenes were recovered by evaporation of the n-pentane and were then extracted with 75 ml of anhydrous methanol (Baker "Analyzed") for 8 hr. The solution was centrifuged and the precipitated resins extracted twice with methanol. The methanol was evaporated to give the methanol-soluble fraction. The resins, asphaltenes and methanol-soluble fraction were weighed and the proportions of the three fractions determined.
Gel Permeation Chromatography Separations
Gel permeation chromatography (GPC) of the petroleum fractions was carried out on Sephadex LH- 20 (Pharmacia Fine Chemicals), with an approximate exclusion limit of molecular weight 1500, and Styragel 1000 (Waters Associates) with an approximate exclusion limit of molecular weight 32,000. A standard GPC column (Sephadex SR 25/45) was filled with LH- 20, preswollen with benzene methanol (90:10 v/v); the final column dimensions were 35 x 2.5 cm. The interstitial volume of the column (30.1 ml) was determined by the breakthrough of a high molecular weight asphaltene fraction (MW > 8,000) and the column was calibrated using mesoporphyrin dimethyl ester and phaeophytin (a+b) as described by Blumer and Snyder.27 The Sephadex GPC separation was carried out using 100-250 mg of the asphaltene, and the absorbance at 526 nm was used to monitor the separation. Material of molecular weight greater than 1500 was excluded from the resin.
The Styragel 1000 column (1.0 x 42 cm) was prepared from resin swollen with benzene-methanol (90:10 v/v). Polystyrene standards were used for molecular weight calibration, and an exclusion limit of 28,000 was determined. The Sephadex-excluded asphaltene fraction was chromatographed on the Styragel 1000 column and a continuous elution curve was obtained from molecular weight 22,000 to 1000.
The eluates from the Sephadex and Styragel experiments were combined to give four arbitrary molecular weight fractions: (a) <1000, (b) 1000-4000, (c) 4000-
8000 and (d) 8000-22000. The relative proportions of the four fractions were determined by weighing after evaporation of the solvent. Similar separations were carried out on the resins and the methanol- soluble component.
36 THE ROLE OF TRACE METALS IN PETROLEUM
Determination of Metalloporphyrin Contents of Oil Fractions
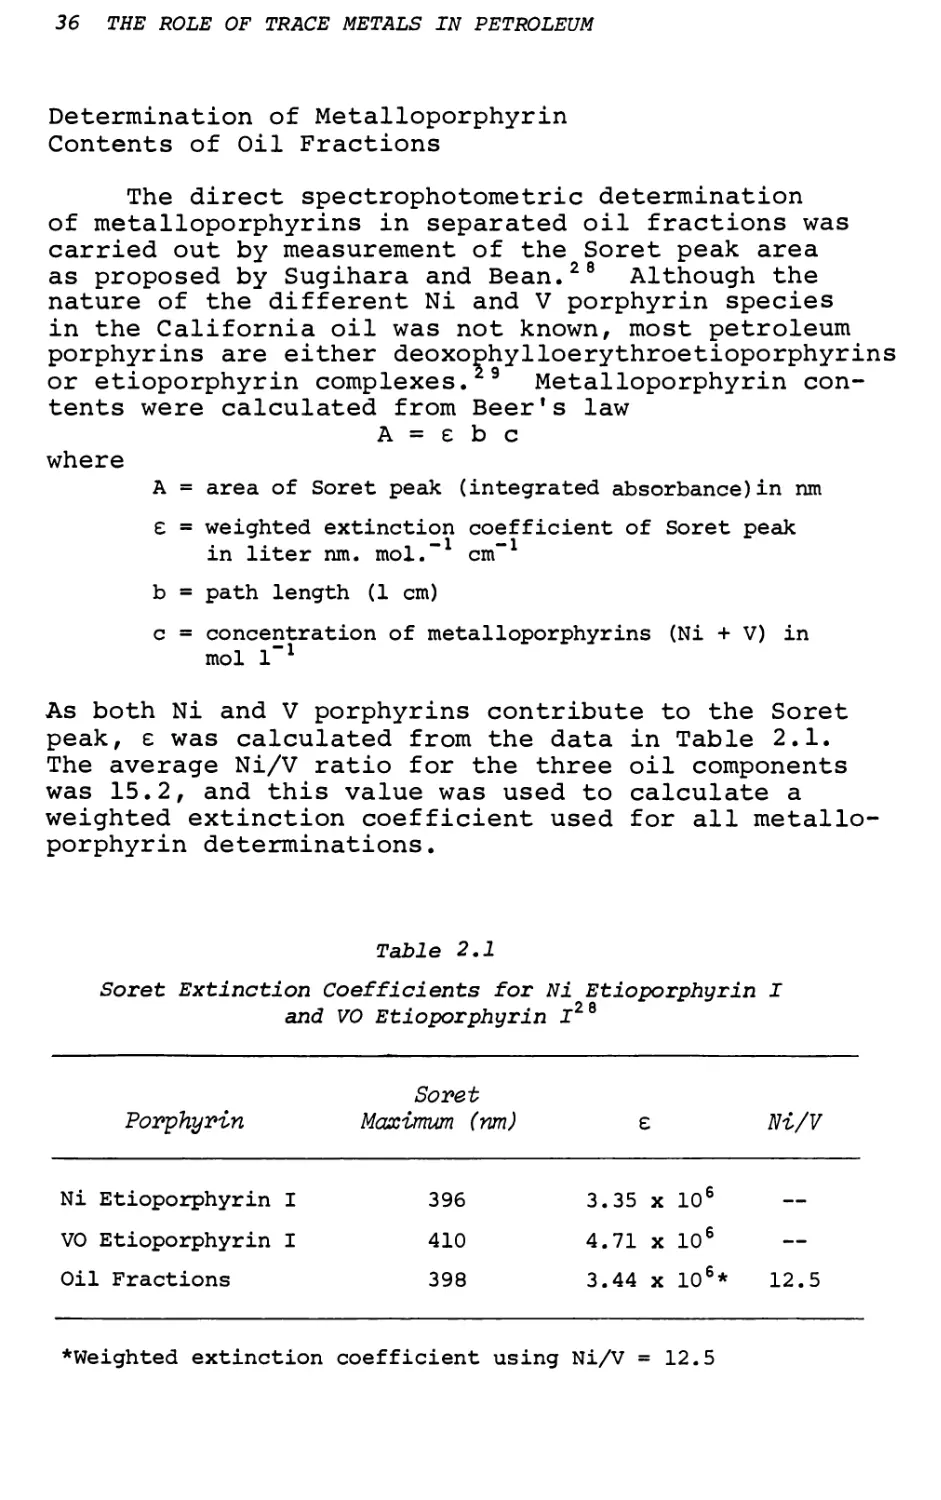
The direct spectrophotometric determination of metalloporphyrins in separated oil fractions was carried out by measurement of the Soret peak area as proposed by Sugihara and Bean.28 Although the nature of the different Ni and V porphyrin species in the California oil was not known, most petroleum porphyrins are either deoxophylloerythroetioporphyrins or etioporphyrin complexes.29 Metalloporphyrin contents were calculated from Beer's law
A = e b c
where
A = area of Soret peak (integrated absorbance)in nm
E = weighted extinction coefficient of Soret peak in liter nm. mol.”1 cm”1
b = path length (1 cm)
c = concentration of metalloporphyrins (Ni + V) in mol l”1
As both Ni and V porphyrins contribute to the Soret peak, e was calculated from the data in Table 2.1.
The average Ni/V ratio for the three oil components was 15.2, and this value was used to calculate a weighted extinction coefficient used for all metalloporphyrin determinations.
Table 2.1
Soret Extinction Coefficients for Ni Etioporphyrin I and VO Etioporphyrin I26
Porphyrin
Soret
Maximum (nm)
£
Ni/V
Ni Etioporphyrin I
396
3.35 x
106
—
VO Etioporphyrin I
410
4.71 x
106
—
Oil Fractions
398
3.44 x
10s*
12.5
♦Weighted extinction coefficient using Ni/V = 12.5
THE NATURE OF METALS 37
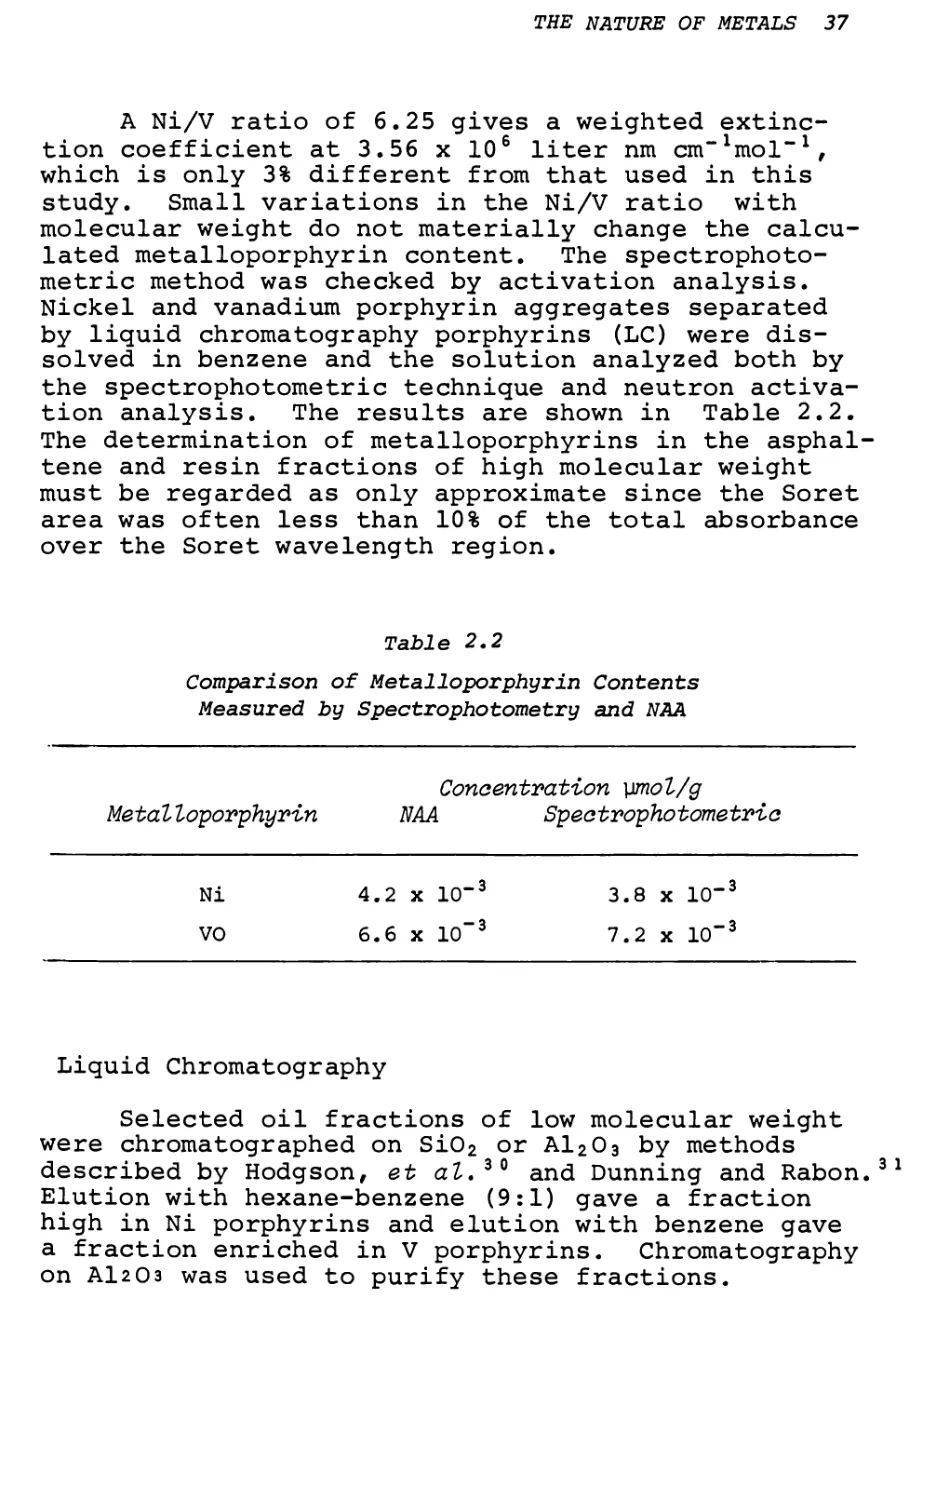
A Ni/V ratio of 6.25 gives a weighted extinction coefficient at 3.56 x 10⁶ liter nm cm“1mol“1f which is only 3% different from that used in this study. Small variations in the Ni/V ratio with molecular weight do not materially change the calculated metalloporphyrin content. The spectrophoto- metric method was checked by activation analysis. Nickel and vanadium porphyrin aggregates separated by liquid chromatography porphyrins (LC) were dissolved in benzene and the solution analyzed both by the spectrophotometric technique and neutron activation analysis. The results are shown in Table 2.2. The determination of metalloporphyrins in the asphaltene and resin fractions of high molecular weight must be regarded as only approximate since the Soret area was often less than 10% of the total absorbance over the Soret wavelength region.
Table 2.2
Comparison of Metalloporphyrin Contents Measured by Spectrophotometry and NAA
Concentration ymol/g
Metalloporphyrin
NAA
Spectrophotometric
Ni
4.2 x 10⁻³
3.8 x 10⁻³
VO
6.6 x Id-3
7.2 x 10"3
Liquid Chromatography
Selected oil fractions of low molecular weight were chromatographed on Si02 or A1203 by methods described by Hodgson, et at.30 and Dunning and Rabon.3 Elution with hexane-benzene (9:1) gave a fraction high in Ni porphyrins and elution with benzene gave a fraction enriched in V porphyrins. Chromatography on AI2O3 was used to purify these fractions.
38 THE ROLE OF TRACE METALS IN PETROLEUM
Determination of Elemental Concentrations
The determination of Ni, V, Fe, Co, Ni, Cr, Cu, As, Sb, Hg and Zn was carried out by neutron activation analysis. The separated fractions and crude oils were analyzed by the methods of Shah, et al.22*2 and Filby and Shah.2* To determine the contributions of the solvents used in separations to the trace element contents of the oil fractions, neutron activation analysis was used to measure the pentane, methanol and benzene trace element values.
RESULTS AND DISCUSSION
Table 2.3 shows the contents of Ni, V, Co, Fe, An, Cr, Sb, As and Na in the crude oil C-l before and after centrifuging and filtering. Filtration of the oil produced a very fine black deposit on the filter, but analysis of the filter showed only background values of the trace elements measured. Also included in Table 2.3 are results of filtration and centrifugation of another California Tertiary oil (C—2) and Boscan crude oil of Venezuela. The table indicates that the oil C-l shows no sifnificant differences in trace element content between the treated and untreated oil. The relative standard deviations of the results in Table 2.3 are approximately 5-10%. The oil C-2, however, shows significant decreases in As and Na, and the Boscan oil has lower values of Hg, Fe, As and Na in the filtered oil.
An aqueous phase (0.025 g/g) and a black solid phase (0.4 mg/g) were separated from oil C-2. The aqueous phase contained 2800 yg/g Na, 21.3 yg/g Fe and 18.2 yg/g As and appeared to be residual formation water. The solid phase contained 120 yg/g Na and 1496 yg/g Fe and some organic material. The aqueous phase contributed 0.34 yg/g As and 53.0 yg/g Na to the unfiltered crude oil As and Na concentrations, but negligible amounts of other elements could be ascribed to the aqueous phase. The solid phase contributed negligible amounts of all trace elements to the bulk crude oil. The results indicate that trace element data on crude oils should be interpreted with caution and that only centrifuged and filtered oils should be analyzed if geochemical information is desired.
The oil C-l was also extracted for 4 hr with double-distilled water, and the extracted oil and water were analyzed to determine whether water- soluble metal compounds were present. The results,
Table 2.3
Elemental Concentrations in Filtered and Centrifuged Oils
Nature
Elemental Concentrations (\ig/g)
Ni V Co Eg Fe Zn Cr As Sb Na
California C-l
Crude
93.5
7.5
12.7
21.2
73.1 9.32
0.634
0.656
0.0517
11.1
Filtered
98.4
7.7
13.5
23.1
68.9 9.76
0.640
0.655
0.056
13.2
California C-2
Crude
113.0
6.0
13.9
1.49
77.2 19.5
0.685
1.63
0.061
65.2
Filtered
117.0
5.8
14.4
1.41
70.1 21.5
0.608
1.09
0.059
10.0
Bos canj Venezuela
Crude
117.0
1120.0
0.198
0.139
16.9 0.619
0.380
1.20
0.273
25.0
Filtered
109.0
1110.0
0.178
0.0269
4.77 0.692
0.430
0.284
0.303
20.3
THE NATURE OF METALS 39
40 THE ROLE OF TRACE METALS IN PETROLEUM
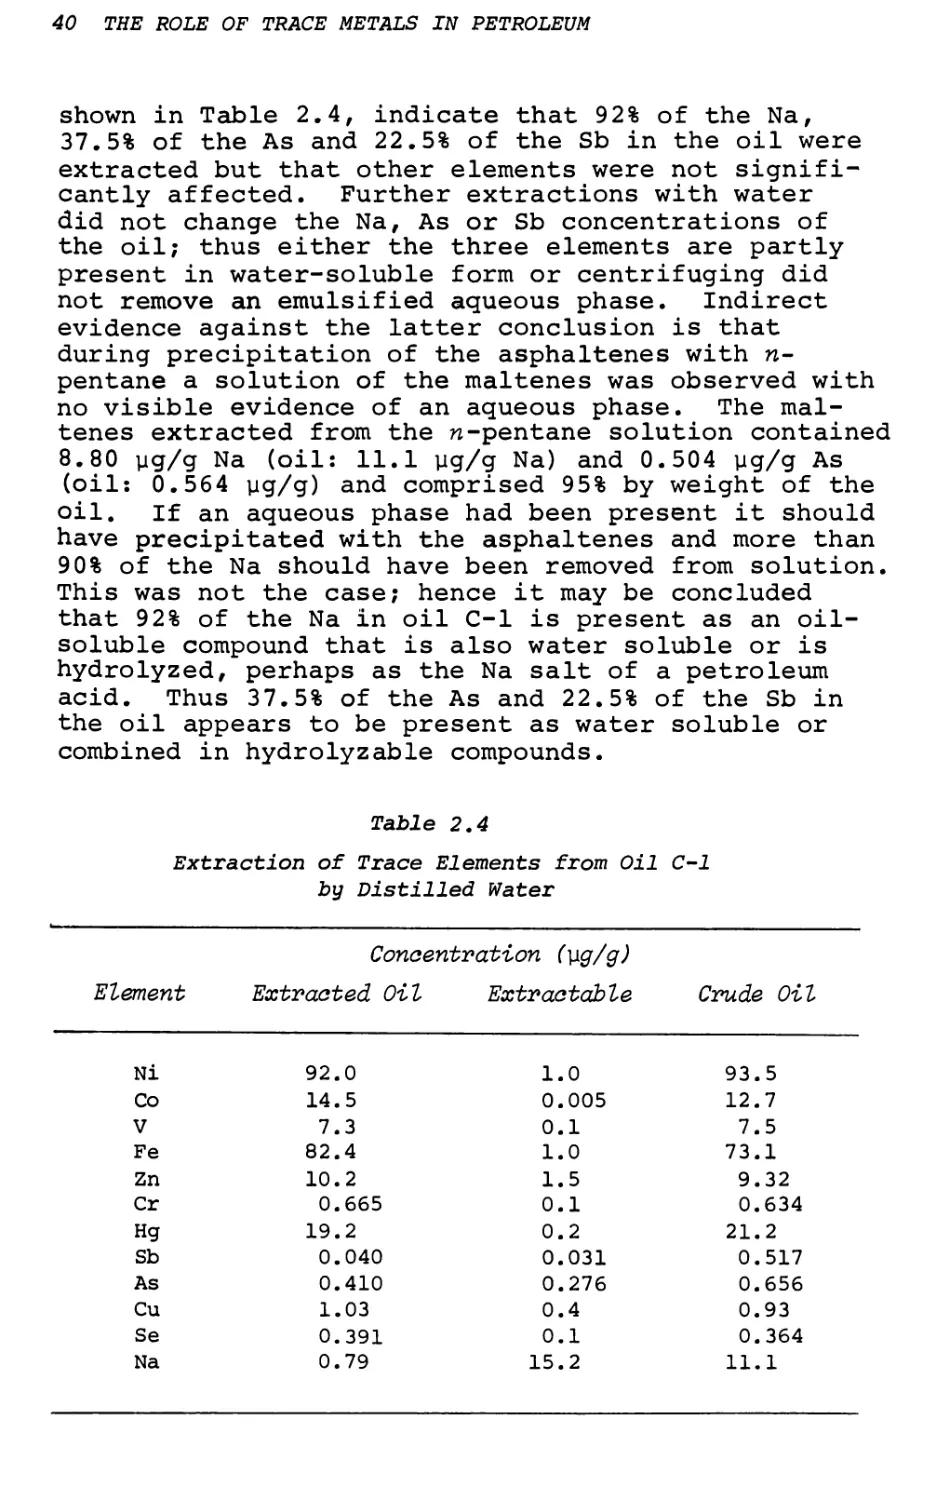
shown in Table 2.4, indicate that 92% of the Na,
37.5% of the As and 22.5% of the Sb in the oil were extracted but that other elements were not significantly affected. Further extractions with water did not change the Na, As or Sb concentrations of the oil; thus either the three elements are partly present in water-soluble form or centrifuging did not remove an emulsified aqueous phase. Indirect evidence against the latter conclusion is that during precipitation of the asphaltenes with n- pentane a solution of the maltenes was observed with no visible evidence of an aqueous phase. The maltenes extracted from the n-pentane solution contained 8.80 yg/g Na (oil: 11.1 yg/g Na) and 0.504 yg/g As (oil: 0.564 yg/g) and comprised 95% by weight of the oil. if an aqueous phase had been present it should have precipitated with the asphaltenes and more than 90% of the Na should have been removed from solution. This was not the case; hence it may be concluded that 92% of the Na in oil C-l is present as an oil- soluble compound that is also water soluble or is hydrolyzed, perhaps as the Na salt of a petroleum acid. Thus 37.5% of the As and 22.5% of the Sb in the oil appears to be present as water soluble or combined in hydrolyzable compounds.
Table 2.4
Extraction of Trace Elements from Oil C-l by Distilled Water
Element
Concentration (]ig/g) Extracted Oil Extractable
Crude Oil
Ni
92.0
1.0
93.5
Co
14.5
0.005
12.7
V
7.3
0.1
7.5
Fe
82.4
1.0
73.1
Zn
10.2
1.5
9.32
Cr
0.665
0.1
0.634
Hg
19.2
0.2
21.2
Sb
0.040
0.031
0.517
As
0.410
0.276
0.656
Cu
1.03
0.4
0.93
Se
0.391
0.1
0.364
Na
0.79
15.2
i—i
i—i i—i
THE NATURE OF METALS 41
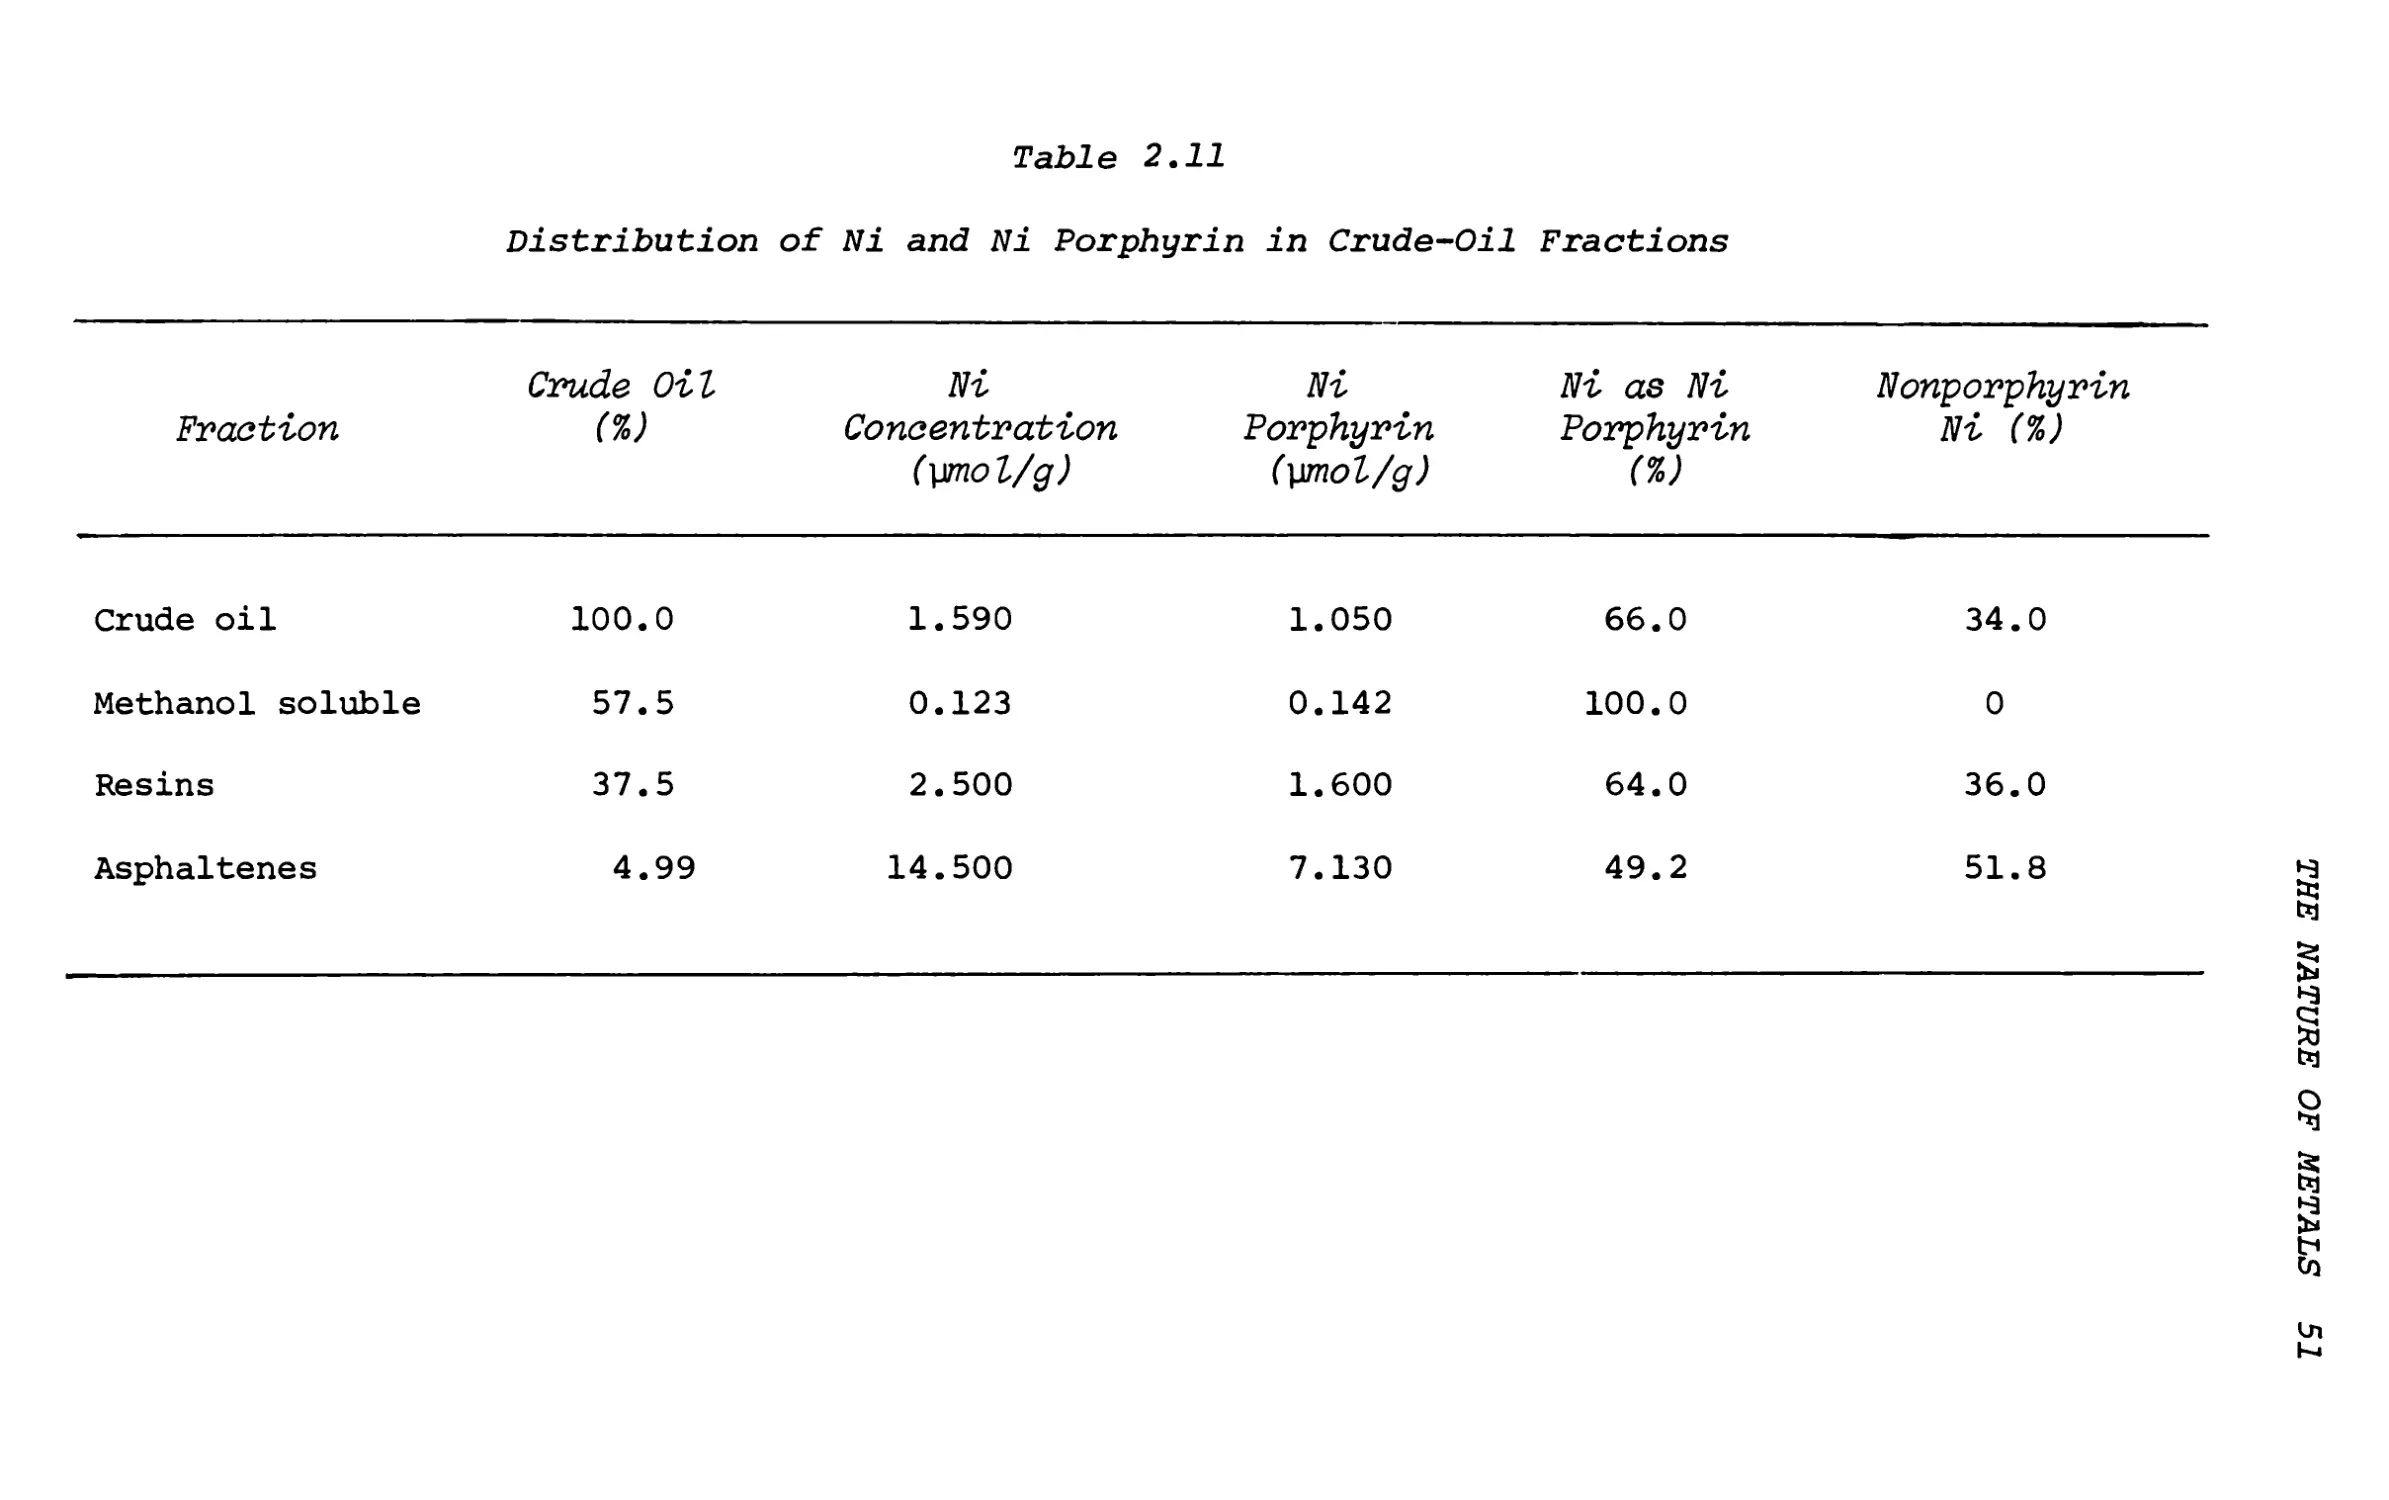
Table 2.5 shows the distribution of trace elements among the three components separated from the crude oil, the relative proportions of each component, and the elemental ratios of asphaltene/crude oil and resins/crude oil. The results show that the asphaltenes contain the highest concentrations of all elements and that the asphaltic component of the oil (resins + asphaltenes) accounts for the major part of the trace elements, V, Ni, Co, Fe, Hg, Zn,
Cr and Sb. Calculations show that 48% of the As is present in the methanol-soluble fraction of the oil, which suggests a low-molecular-weight compound, possibly an alkyl or aryl arsine. The asphaltene/ crude elemental ratios show that Ni, V, Co, Fe, Cr,
Hg and Zn have similar fractional patterns. Antimony is strongly concentrated in the asphaltenes and As shows the lowest enrichment of the elements studied. The asphaltenes and resins exist in the oil in colloidal form,32 and the crude oil system may be regarded as a transition from the polar aromatic micelle of the asphaltenes to the less polar resins to the nonpolar hydrocarbons of the bulk crude oil. The trace elements concentrated in the asphaltenes may be present in small highly polar molecules, which would precipitate with the asphaltenes or might complex in the asphaltene sheet structure at sites bounded by hetero atoms such as 0, N, or S. Gel permeation chromatography was used to investigate this.
To determine the distribution of the trace elements in the oil components as a function of molecular weight, GPC was used on the methanol- soluble component, resins and asphaltenes. The weight distributions of the four arbitrary molecular- weight fractions in the components are shown in Table 2.6. The high-molecular-weight fraction of the methanol-soluble component (>1500) was not further separated because of the small amount of sample recovered. As expected, the relative amounts of the four molecular-weight fractions are different for the three components. The methanol-soluble fraction contains only 6.2% high-molecular-weight material whereas the resins and asphaltenes contain 70.6% and 89.0% high-molecular-weight material respectively. For both resins and asphaltenes the 4000-8000 molecular- weight fraction is the most abundant, and the heaviest molecular-weight fraction (8000-22000) was found only in the asphaltenes (15.2%).
These findings are consistent with the nature of the asphaltenes and resins as described by Yen19
Table
Distribution of Trace Elements in
2.5
Components
of Crude Oil C-Ia
Concentration
Methanol
R
A
(vg/g)
Crude Oil
Soluble
Resins
Asphaltenes
C
C
% crude oil
100.0
57.5
37.5
4.99
V
7.5
0.82
12.4
61.6
1.65
8.2
Ni
93.5
7.21
147.0
852.0
1.57
9.1
Co
12.7
0.8.
10.7
122.0
0.84
9.6
Fe
73.1
1.95
66.4
895.0
0.91
12.2
Hg
21.2
0.686
29.6
140.0
1.40
6.6
Cr
0.634
0.300
0.894
7.540
1.41
11.9
Zn
9.32
0.74
8.86
109.
0.95
11.7
Sb
0.0517
0.0033
0.0130
1.22
0.25
23.6
As
0.656
0.546
0.290
2.25
0.44
3.4
a R , . - — = ratio of C
concentration
in
resins to that
in crude
A
— = ratio of
concentration
in
asphaltenes to
that in crude
42 THE ROLE OF TRACE METALS IN PETROLEUM
THE NATURE OF METALS 43
Table 2.6
Distribution of Molecular-Weight Fractions of Oil Compounds
Molecular Weight Fraction
Percentage of Fraction
Methanol Solublea
Resins
Asphaltenes
(i)
300-1,000
93.8
29.4
11.0
(2)
1,000-4,000
6.2
21.2
23.2
(3)
4,000-8,000
• • • •
49.4
50.6
(4)
8,000-22,000
....
0
15.2
Total
100.0
100.0
100.0
a The higher-molecular-weight component of the methanol fraction was not separated into smaller fractions.
and others.32 The asphaltenes contain 11% of low molecular-weight material, which is consistent with the idea that small polar molecules are associated with the asphaltene micelles during precipitation but are separated in the GPC procedure. The fact that the resins and the asphaltenes contain material of the same molecular weight range indicates the similar nature of these materials, and the difference in precipitation behavior may be attributed to the higher polarity of the asphaltenes as suggested by Witherspoon and Winneford.32
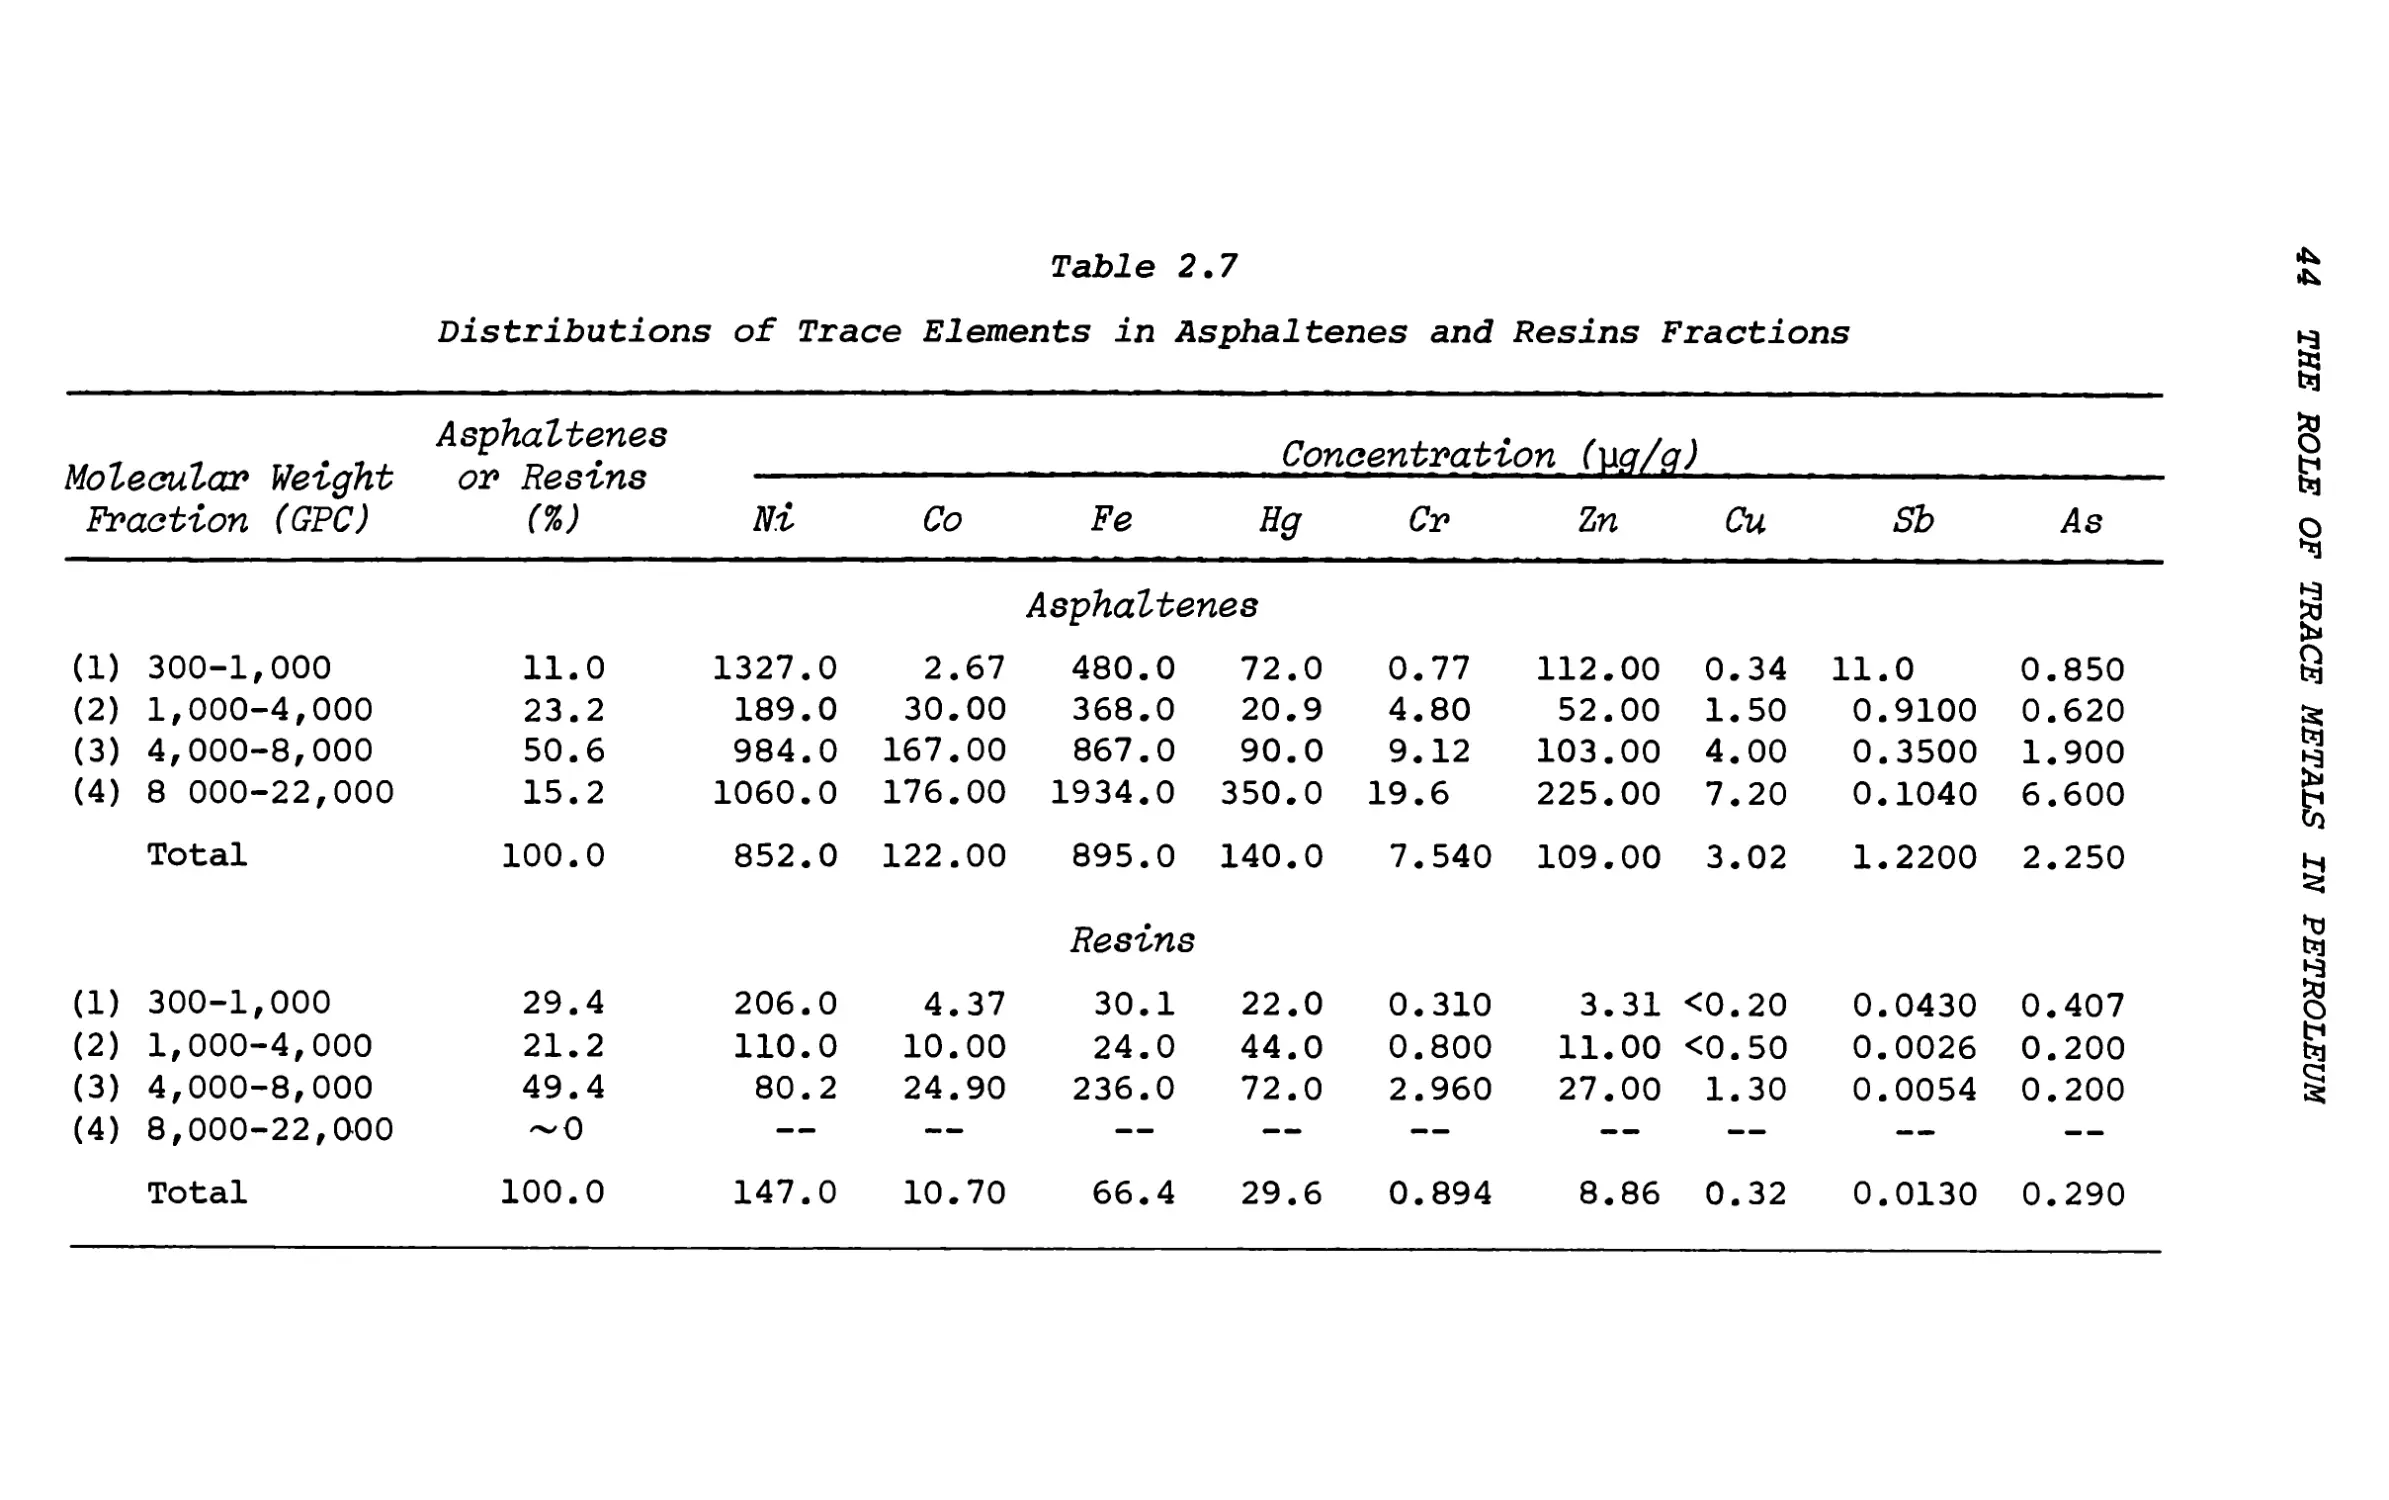
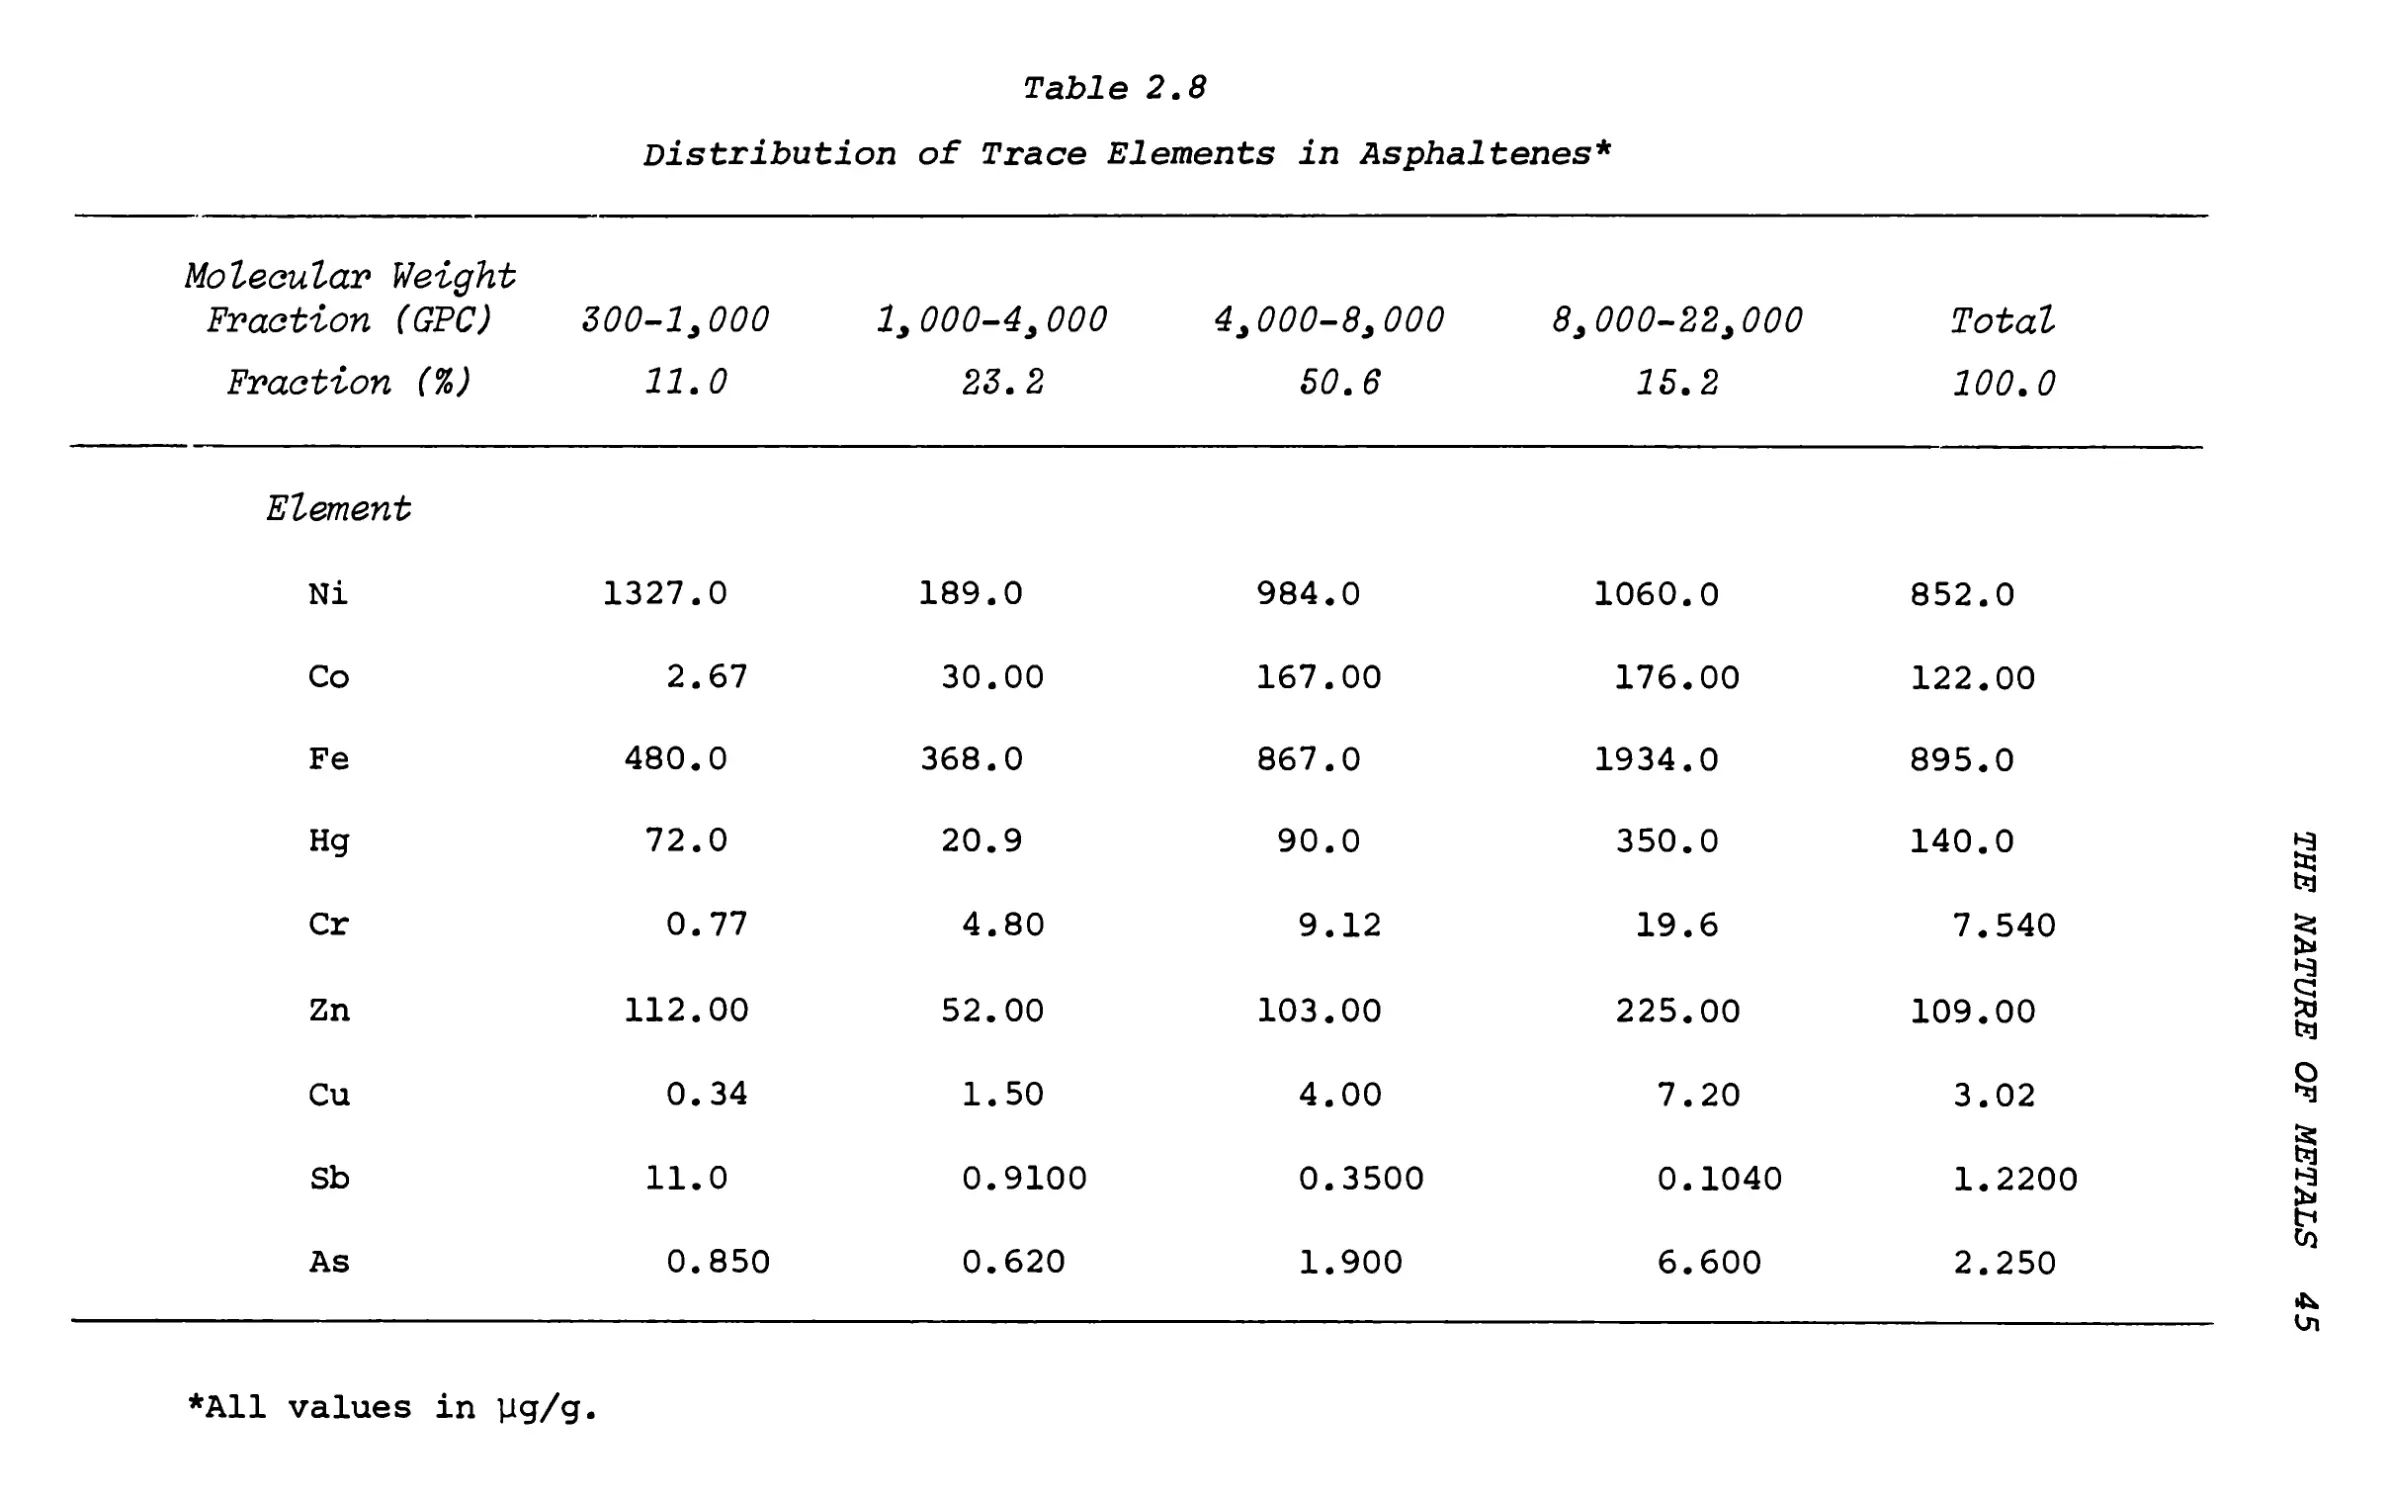
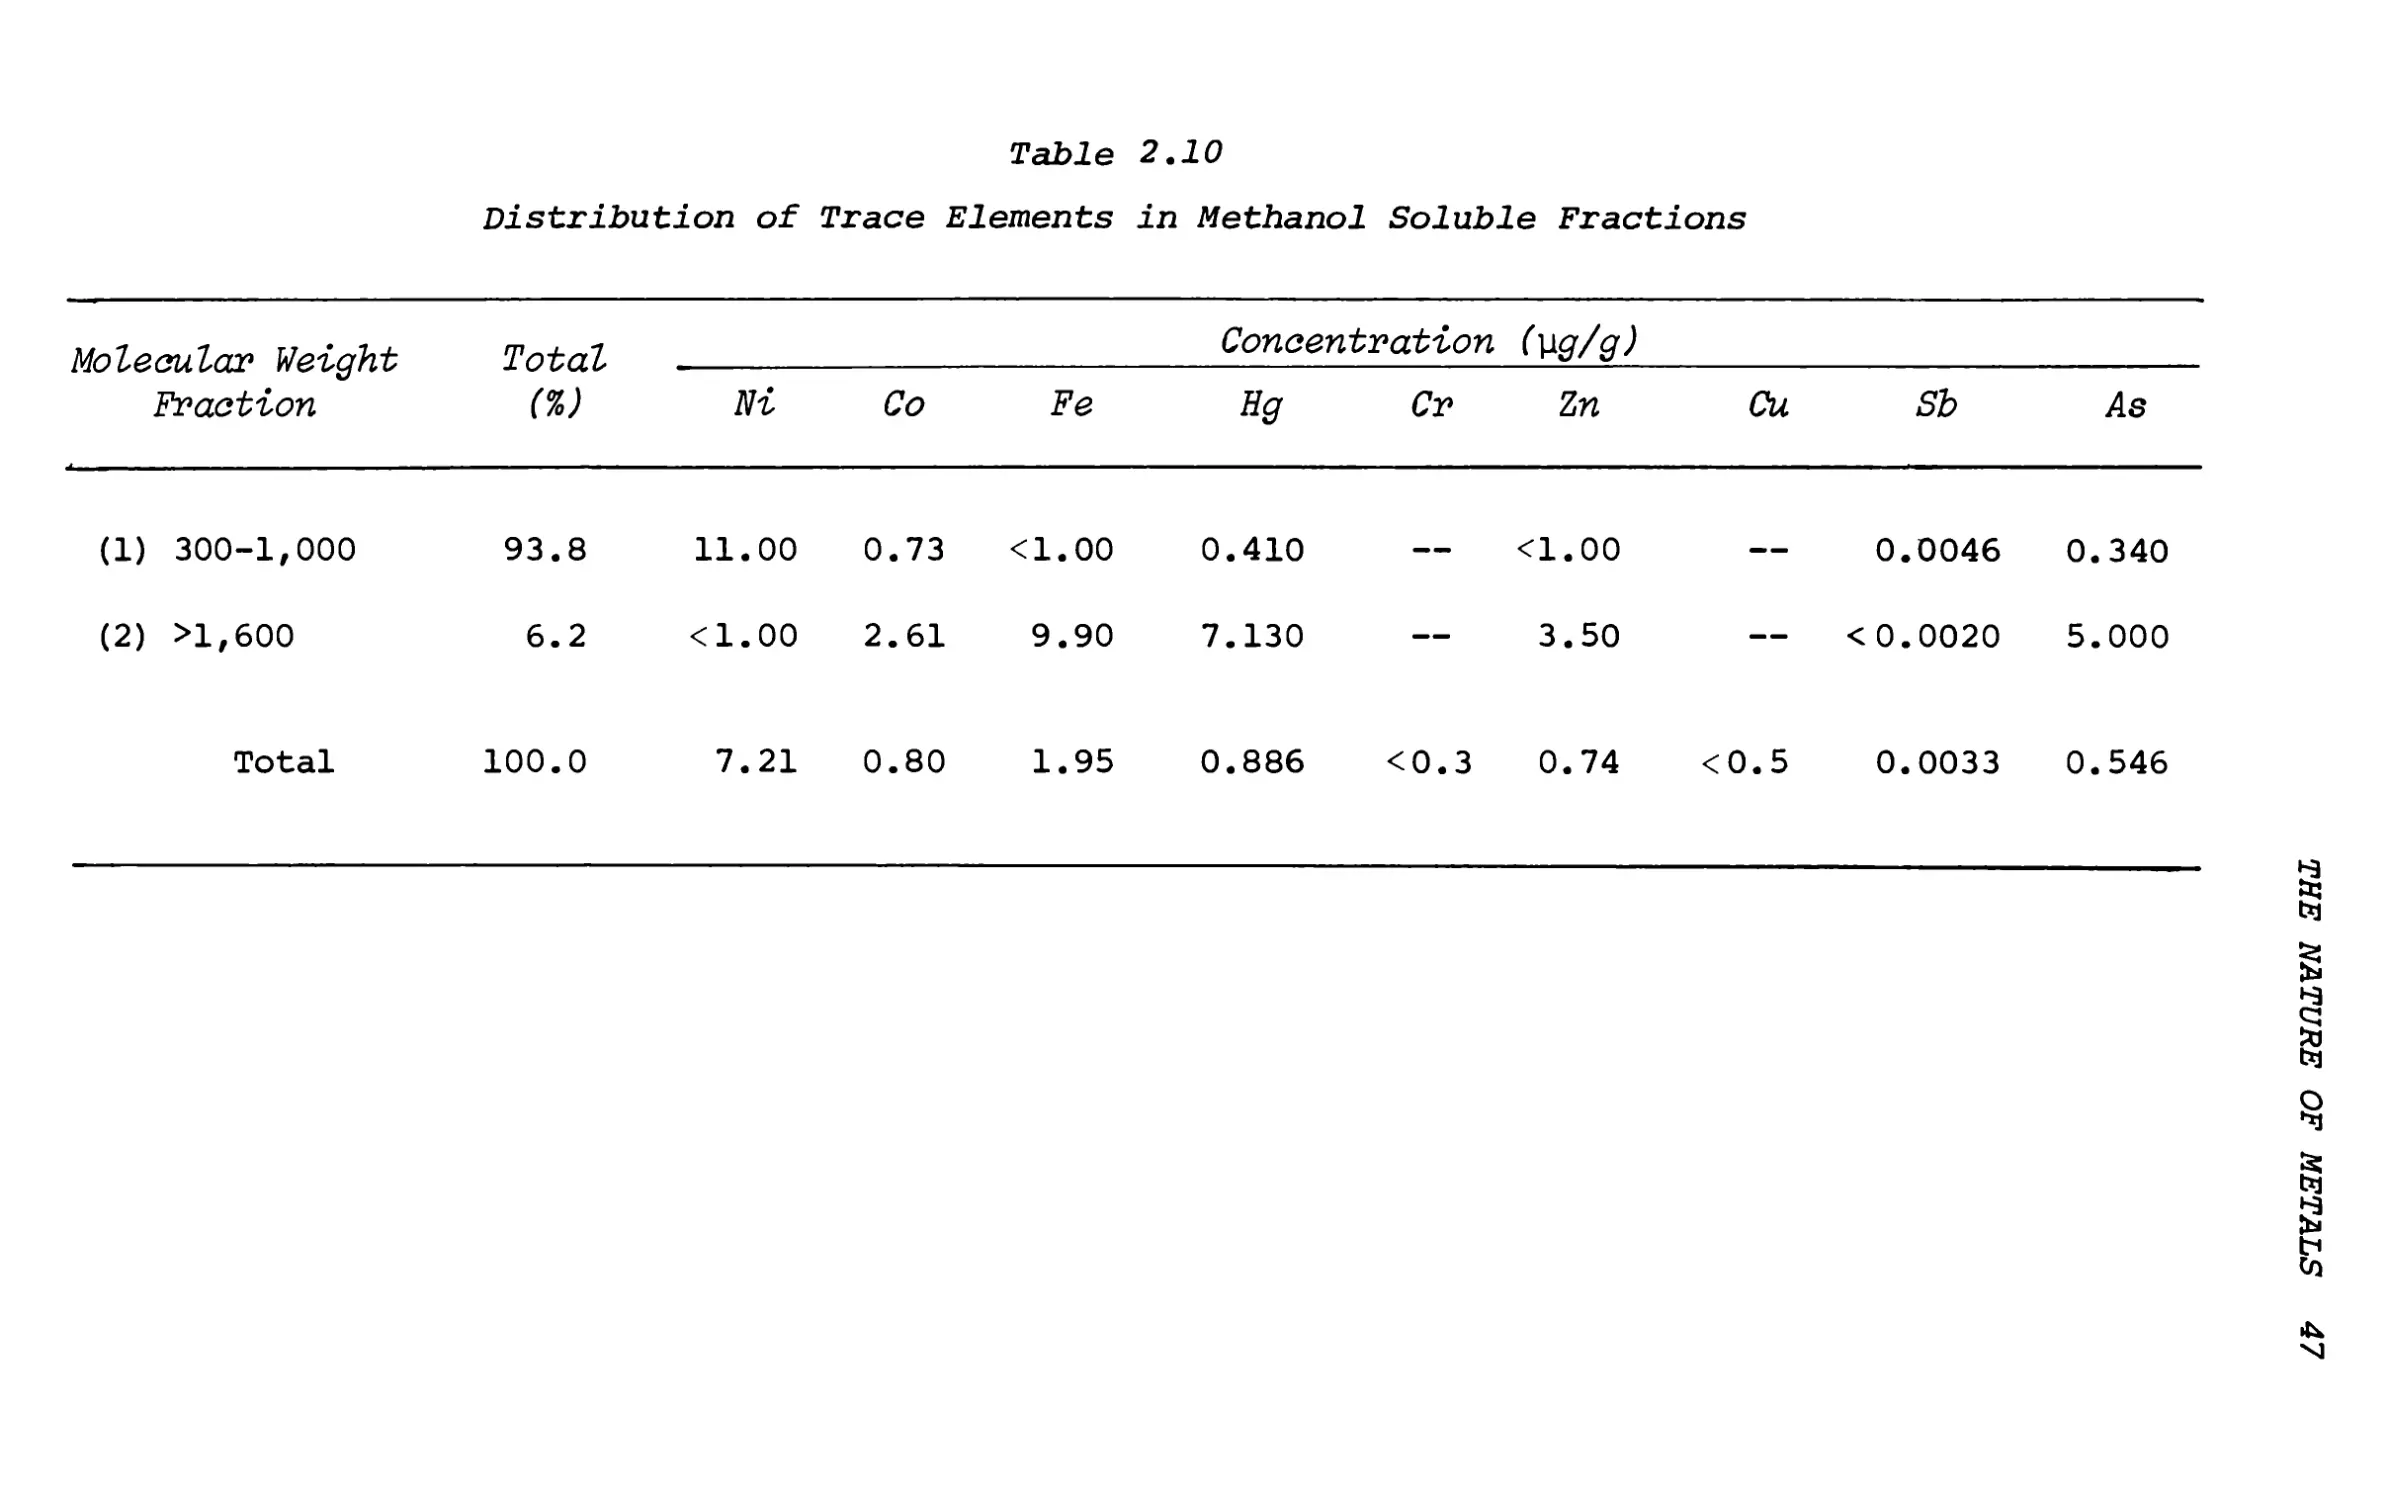
The concentrations of nine trace elements in each of the molecular-weight fractions of the resins and the asphaltenes are shown in Tables 2.7 and 2.9 and the data for the methanol-soluble component are given in Table 2.10. Vanadium was not determined in the separated molecular-weight fractions because of the small amount of material available for analysis. For the asphaltenes, the highest trace-element concentrations, with the exception of Ni and Sb, are found in the highest-molecular-weight fraction. The highest Ni was found in the 300-1000 fraction but this is due entirely to Ni porphyrins, which are associated with the asphaltenes. Antimony exhibits a behavior contrary to that of all the other elements studied.
Table 2.7
Distributions of Trace Elements in Asphaltenes and Resins Fractions
Molecular Weight Fraction (GPC)
Asphaltenes or Resins (%)
Concentration (w/c)
Ni
Co
Fe
Hg
Cr
Zn
Cu
Sb
As
Asphaltenes
(i)
300-1,000
11.0
1327.0
2.67
480.0
72.0
0.77
112.00
0.34
11.0
0.850
(2)
1,000-4,000
23.2
189.0
30.00
368.0
20.9
4.80
52.00
1.50
0.9100
0.620
(3)
4,000-8,000
50.6
984.0
167.00
867.0
90.0
9.12
103.00
4.00
0.3500
1.900
(4)
8 000-22,000
15.2
1060.0
176.00
1934.0
350.0
19.6
225.00
7.20
0.1040
6.600
Total
100.0
852.0
122.00
895.0
140.0
7.540
109.00
3.02
1.2200
2.250
Resins
(1)
300-1,000
29.4
206.0
4.37
30.1
22.0
0.310
3.31
<0.20
0.0430
0.407
(2)
1,000-4,000
21.2
110.0
10.00
24.0
44.0
0.800
11.00
<0.50
0.0026
0.200
(3)
4,000-8,000
49.4
80.2
24.90
236.0
72.0
2.960
27.00
1.30
0.0054
0.200
(4)
0
§
CM
CM
1
O
o
o
CO
~0
—
—
—
—
—
—
—
—
—
Total
100.0
147.0
10.70
66.4
29.6
0.894
8.86
0.32
0.0130
0.290
44 THE ROLE OF TRACE METALS IN PETROLEUM
Table 2.8
Distribution of Trace Elements in Asphaltenes*
Molecular Weight Fraction (GPC)
Fraction (%)
300-1,000
11.0
1, 000-4,000 23.2
4,000-8, 000 50.6
8,000-22,000 15.2
Total
100.0
Element
Ni
1327.0
189.0
984.0
1060.0
852.0
Co
2.67
30.00
167.00
176.00
122.00
Fe
480.0
368.0
867.0
1934.0
895.0
Hg
72.0
20.9
90.0
350.0
140.0
Cr
0.77
4.80
9.12
19.6
7.540
Zn
112.00
52.00
103.00
225.00
109.00
Cu
0.34
1.50
4.00
7.20
3.02
Sb
11.0
0.9100
0.3500
0.1040
1.2200
As
0.850
0.620
1.900
6.600
2.250
*A11 values in yg/g
THE NATURE OF METALS 45
Table 2.9
Distribution of Trace Elements in Resins*
Molecular Weight Fraction (GPC)
Fraction (%)
300-1,000
29.4
1,000-4,000
21.2
4, 000-8,000 49.4
8,000-22,000
<^o
Total
100.0
Element
Ni
206.0
110.0
80.2
—
147.0
Co
4.37
10.00
24.90
—
10.70
Fe
30.1
24.0
236.0
—
66.4
Hg
22.0
44.0
72.0
—
29.6
Cr
0.310
0.800
2.960
—
0.894
Zn
3.31
11.00
27.00
—
8.86
Cu
<0.20
<0.50
1.30
—
0.32
Sb
0.0430
0.0026
0.0054
—
0.0130
As
0.407
0.200
0.200
—
0.290
*A11 values in pg/g
46 THE ROLE OF TRACE METALS IN PETROLEUM
Table 2.10
Distribution of Trace Elements in Methanol Soluble Fractions
Molecular Weight Total Concentration (yg/g)
Fraction
(%)
Ni
Co
Fe
Hg
Cr
Zn
Cu
Sb
As
(1) 300-1,000
93.8
11.00
0.73
<1.00
0.410
—
<1.00
—
0.0046
0.340
(2) >1,600
6.2
<1.00
2.61
9.90
7.130
—
3.50
—
<0.0020
5.000
Total
100.0
7.21
0.80
1.95
0.886
<0.3
0.74
<0.5
0.0033
0.546
THE NATURE OF METALS 47
48 THE ROLE OF TRACE METALS IN PETROLEUM
The highest Sb content is found in the lowest-molecular- weight fraction (11.0 yg/g) and the Sb concentration decreases with increasing molecular weight of the asphaltene fraction. This suggests that Sb is contained in small molecules of high polarity that are insoluble in n-pentane and that precipitate with the asphaltenes. The nature of the Sb compounds is unclear and further work is necessary. Possible compounds are the alkyl and aryl stibines RxSbH3-x .
Of the other elements in the asphaltene fractions, Cr, Cu and Co show increasing concentrations with increasing molecular weight of the fraction, indicating that these elements are associated with the large asphaltene molecules. The highest concentrations of Fe, Hg, Zn, and As are found in the highest-molecular- weight fraction of the asphaltenes but these elements show higher concentrations in the 300-1000 molecular- weight fraction than in the 1000-4000 fraction. For Fe, Hg and Zn this may indicate the presence of porphyrin complexes or other organometallic compounds.
Iron porphyrins have been identified in shale oil,33 and Zn coproporphyrin occurs in animal feces.3**
Neither of these metalloporphyrins has been found in crude oil, however. Mercury forms porphyrin complexes with mesoporphyrin3 ** but the complexes are decomposed by water. The extraction of crude oil C-l with distilled water removed insignificant amounts of Hg, thus indicating that Hg is not present in the oil as a porphyrin complex. Arsenic also shows a higher concentration in the low-molecular-weight fraction than in the 1000-4000 fraction. This is consistent with the previous conclusion that part of the As in crude oil is present in low-molecular-weight compounds such as alkyl or aryl arsines.
The resin fractions show trace-element patterns similar to those observed for the asphaltenes, although the elemental concentrations in the resin fractions are lower than in the corresponding asphaltene fractions.
The methanol-soluble component of. the oil yielded only 6.2% high-molecular-weight material. The trace- element data show that only Ni and Sb have higher concentrations in the low-molecular-weight fraction. Nickel is present in this fraction entirely as Ni porphyrins. Antimony is probably present in the low- molecular-weight fraction as a low-molecular-weight organoantimony compound as discussed previously.
The nature of the small amounts of Fe, Hg, Zn and Co in the low-molecular-weight fraction is not known but porphyrin complexes, although not identified in the oil> cannot be ruled out.
THE NATURE OF METALS 49
The association of the typical porphyrin absorption spectra with high-molecular-weight compounds in crude oil 27'28 has led to the assumption that either the porphyrin conjugated system preserves its spectral identity even in such large molecules as the asphaltenes or that simple metalloporphyrin molecules are associated with the asphaltene sheet structures, Sugihara, et al.18 have separated a number of Ni and V porphyrins (phyllo, etio, etc.) from Boscan asphaltenes and concluded that the metalloporphyrins in the high-molecular-weight fraction of the asphaltenes were associated with much larger molecules and thus appeared to be of much higher molecular weight in the GPC separations. Other evidence for the association of metalloporphyrins with high-molecular- weight compounds has been provided by Hodgson, et al.35 A number of authors have pointed out that most crude oils contain insufficient porphyrins to account for the Ni and V content of the oil; thus these elements are also present in crude oils as nonporphyrin Ni and V.19,36 The nature of the nonporphyrin metal compounds is not known but several studies of V in crude oils indicate that the metal compounds are associated with the high-molecular-weight asphaltenes.27/18 Sugihara, et al.16 have noted that nonporphyrin Ni and V are associated with the high-molecular-weight fraction of the Boscan asphaltenes and are absent from the low-molecular-weight fraction.
Metalloporphyrins were sought in the oil C-l, which contains relatively high concentrations of Fe,
Zn, Hg, Co, Cr and Ni. Examination of the absorption spectra of the methanol-soluble, resin, and asphaltene fractions of the oil showed the presence of porphyrin complexes in all fractions. Liquid chromatography on silica and alumina was used to separate the metalloporphyrins in the low-molecular fractions of the three oil components. Only Ni porphyrins and very small amounts of V porphyrins were identified in the chromatographic fractions. The absorption spectrum of the separated Ni porphyrins corresponds to Ni deoxophyl- loerythroetioporphyrin.29 The V porphyrin was identified as VO deoxophylloerythroetioporphyrin. No metalloporphyrins other than the Ni and V complexes were identified spectrophotometrically, but the possibility exists that small amounts of Zn, Fe, Co, Hg,
Cr, and Cu porphyrins escaped detection. The low- molecular-weight fraction of the asphaltenes contained 480 yg/g Fe, 72 yg/g Hg, 112 yg/g Zn, and 2.67 yg/g Co. These concentrations are sufficiently high to make the detection of porphyrin complexes, if present,
50 THE ROLE OF TRACE METALS IN PETROLEUM
relatively easy. The spectrophotometric detection limit for Ni porphyrins was calculated to be 10"k mol/g which corresponds to 6 x 10"3 yg Ni/g. The sensitivities for the other metal complexes should be similar so that if metalloporphyrins other than those containing Ni and V are present in the low- molecular-weight fraction of the asphaltenes they must account for less than 0.1% of the total metal content.
The Ni porphyrin contents were calculated from the total metalloporphyrin contents (Ni + V) by assuming a Ni/V ratio of 12:5. The concentrations of the nonporphyrin Ni in the various oil fractions were calculated from the Ni porphyrin contents and the total Ni content of the fractions. The distribution of Ni as Ni porphyrin and nonporphyrin Ni in the components of the crude oil is shown in Table 2.11.
The concentrations of Ni in the GPC-separated molecular- weight fractions of the different components of oil RF-1 are shown in Table 2.12. The data in Table 2.11 indicate that 66% of the Ni in the crude oil occurs as Ni porphyrin. In the methanol-soluble fraction all the Ni occurs as Ni porphyrin. For the resins and asphaltenes the Ni porphyrin percentages are 64% and 49.2% respectively. The results presented in Table 2.12 show that the Ni porphyrin contents of the low- molecular-weight fractions of both asphaltenes and resins account for all the Ni in these fractions.
In both the resins and the asphaltenes the percentage of Ni present as nonporphyrin Ni increases as the molecular weight of the fraction increases. In the highest-molecular-weight fraction of the oil (fraction 4 of the asphaltenes) the nonporphyrin Ni content accounts for 72.1% of the total Ni. Similar results were obtained for V in Boscan asphaltenes by Sugihara, et aZ.18 The data for the elements Co, Fe, Zn, Cr and Hg suggest that metalloporphyrins of these elements are absent and that their behavior is similar to that of the nonporphyrin Ni.
Origin of Metal Compounds
The metals bound in the organic matrix of crude oils may have originated in several ways:
(a) through incorporation and diagenesis of metal complexes of the original biological material
(b) through incorporation into the organic matrix during diagenesis of the biological material in the source rocks either from clay minerals or interstitial aqueous solution
Table 2.11
Distribution of Ni and Ni Porphyrin in Crude-Oil Fractions
Fraction
Crude Oil (%)
Ni
Concentration
(ymol/g)
Ni
Porphyrin
(]mol/g)
Ni as Ni Porphyrin (%)
Nonporphyrin Ni (%)
Crude oil
100.0
1.590
1.050
66.0
34.0
Methanol soluble
57.5
0.123
0.142
100.0
0
Resins
37.5
2.500
1.600
64.0
36.0
Asphaltenes
4.99
14.500
7.130
49.2
51.8
THE NATURE OF METALS 51
Table 2.12
Distribution of Ni and Ni Porphyrin in Asphaltenes and Resins of C-l
Molecular Weight Fraction (GPC)
Asphaltenes or Resins (%)
Ni Concentration (ymol/g)
Ni Porphyrin (\mol/g)
Ni as Ni Porphyrin (%)
Nonporphyrin Ni (%)
Asphaltenes
1
11.2
22.6
23.10
100.0
0
2
23.2
3.2
1.56
49.0
51.0
3
50.6
16.8
5.80
34.5
65.5
4
15.2
18.1
5.04
22.9
72.1
Total
100.0
14.5
7.13
49.2
50.8
Resins
1
29.4
3.50
3.79
100.0
0
2
21.2
1.87
0.44
38.6
61.4
3
4
49.4
0
1.36
0.72
32.0
68.0
Total
100.0
2.50
1.60
64.0
36.0
52 THE ROLE OF TRACE METALS IN PETROLEUM
THE NATURE OF METALS 53
(c) through uptake from an aqueous phase or mineral phases during primary or secondary migration
(d) from formation waters or from reservoir rock minerals.
Most authors have concluded that the metals in petroleum were derived from the primary biological material. Metal-organic complexes derived from biological material have been shown to occur in many types of sediments37 but it should also be noted that a non- biological origin of the metals in the organic matter of sediments is also likely as indicated by the high sequestering ability of such compounds as humic acid for metal ions.38 Hodgson6 in his study of V, Ni and Fe in West Canada oils deduced that the metals entered the oil early in its history, and that the original organic matter was the source of the metals. He considered that loss or gain of metal during migration was unlikely. Hyden, however, concluded that only Ni and V reflect the composition of the organic material, and that other elements (e.g.> U, Cu) were introduced from the source rock, the reservoir rock, or during migration. Gulyaeva and Punanova39 have studied the distribution of 25 elements in Russian petroleum ashes and compared the data with the concentrations of these elements in living organisms and argillaceous rocks. They showed that the petroleum concentrations of Si, Al, Fe, Ca, Mg, Na, Ti,
Ba, Mn, Sr, Zn, Cu, Sn, As, Br and Mo are much lower than in marine organisms, that the B, Cr, Pb, Ag, Ni,
Co and I concentrations of petroleum and marine organisms were similar, and that V occurred in petroleum at much higher concentrations than in organisms. They concluded that, except for V, living organisms could account for the concentrations observed in petroleum.
A similar conclusion was reached by Kasymov.1*0 Although all of the metals present in petroleum do occur in living organisms it is difficult to explain the great differences in trace element suites observed in oils without attributing the variation to different conditions of petroleum genesis.15
The observation that the trace elements observed in the California oil occur in oil-soluble form and are predominantly associated with the asphaltic component of the oil (except As) suggests that the origin of the trace elements is related to the origin of the asphaltenes and related resins. The fact that both Ni and V occur in at least two forms, porphyrin and nonporphyrin, suggests that two distinct processes may have occurred. Theories of the origin of porphyrin
54 THE ROLE OF TRACE METALS IN PETROLEUM
complexes in petroleum have been summarized by Hodgson, et al.19 If porphyrins originated through degradation of chlorophylls with loss of labile Mg followed at a later time by metallation with Ni and V, then the source of Ni and V may have been the source-rock organic material or the nonporphyrin Ni and V present in the asphaltenes. The work reported here has shown that the trace elements Fe, Cr, Zn,
Cr, Hg, Cu are similar in behavior to nonporphyrin Ni and V. Yen, et al. 17 have suggested that nonporphyrin Ni and V occupy "holes" bordered by S, N, or 0 atoms in the asphaltene sheets. Erdman and Harju19 have shown that asphaltenes are undersaturated with metal ions and that sites in the sheets are available for metal-ion complexing. They showed that V, and to a lesser extent Ni and Cu, was taken up from aqueous solution by asphaltenes. The authors concluded that coordinating sites were formed slowly during asphaltene genesis, and while the oil was dispersed in the source rock these sites would be rapidly filled by Ni2+ and V02+ ions. Migration could also result in metal uptake, in which case the metals incorporated into the asphaltene structure would reflect the mineralogical and chemical composition of the migration pathways rather than that of the source organic material.
Uptake of metals other than V. Ni and Cu was not considered by Erdman and Harju19 but complexing of Fe, Zn, Co, Cr, and Hg would be possible as these elements all form complexes with N. S, or O-containing ligands. Gulyaeva and Lositskaya1* * studied uptake of V (V) by petroleum from aqueous solution. They showed that uptake would only occur when the oil contained asphaltene and that it was inhibited by high concentrations of NaCl, indicating that formation waters could not be the source of V in petroleum. It should be noted, however, that these experiments were carried out with V (V) and not with V (IV), the form present in both porphyrin and nonporphyrin V in oil. Lositskaya and Gulyaeva1*2 showed that Ni and Zn were taken up by petroleum from aqueous solution, but they inferred that napthenic acids were responsible and not ligands in the asphaltenes although evidence was not presented. In a recent study in this laboratory1*3 asphaltenes were shown to absorb up to 300 ppm Cu (II) from aqueous solution, confirming the results of Erdman and Harju.19
In uptake of metals from aqueous solution, equilibration with an aqueous phase and adsorption of metal ions on mineral surfaces may be important. Brindley26 has discussed the role of organic molecules
THE NATURE OF METALS 55
in metal complex formation on clay mineral surfaces, and this mechanism may be important in incorporation of metals in asphaltenes. The mechanism proposed by Erdman and Harju19 would also explain the increased concentration of Fe, Zn and Hg in the 300-1000 molecular-weight fraction because in the maturation process the degradation of the asphaltenes would lead to simpler organometallic molecules (porphyrins or other complexes). Only Ni and V porphyrins would be likely to survive due to their high thermodynamic stability, but other complexes of Fe, Zn and Hg, which would not show porphyrin spectra, might be formed. These complexes would eventually be decomposed, leaving only Ni and V porphyrins as the metal species in highly paraffinic oils. The possibiltiy of uptake of metals by asphaltenes in the reservoir rock also exists. Indirect evidence for this is provided by the anomalously high concentration of Mo, Dy, and Eu in the Athabasca tar sand oil, which may be related to the presence of minerals, such as molybdenite in the sand.1*5
The incorporation of Sb and As into the asphaltenes may involve a different mechanism from that of the metals as these elements may replace S in the asphaltenes. Degradation of the asphaltenes would possibly reduce alkyl or aryl arsines RxAsH3_x or stibines, RxSbH3-X/ several of which are water soluble.
CONCLUSIONS
The following conclusions may be drawn from this study:
1. Oil-soluble compounds of Ni, V, Fe, Co, Cr, Hg, Zn, As, Sb, Cu and Na are present in a California Tertiary crude oil.
2. Nickel is present in the oil as Ni porphyrin and nonporphyrin Ni. Nickel porphyrin was found in all fractions of the crude oil and accounted for 100% of the Ni in low-molecular-weight fractions of the three oil components. The proportion of nonporphyrin Ni and the resins and asphaltenes increased with molecular weight.
3. The elements Fe, Co, Zn, Hg, Cr, and Cu occur in the oil as a nonporphyrin form similar to that of Ni and V. Porphyrin complexes of these elements, if present, were not observed.
4. The elements Fe, Co, Hg, Zn, Cr and Cu apparently are incorporated into the asphaltene sheet structure through complexing at "holes" bordered by atoms of N, S, or O.
56 THE ROLE OF TRACE METALS IN PETROLEUM
5. Arsenic and antimony appear to be present partly as low-molecular-weight compounds such as alkyl or aryl arsines and stibines. In the case of Sb, these compounds are strongly associated with the asphaltenes.
6. The origin of the Fe, Co, Hg, Zn, Cr, and Cu in the asphaltenes may involve complexing from an aqueous or solid phase during maturation of petroleum in the source rocks or during migration.
The question of how and when trace metals were introduced into petroleum is far from resolved and the problem presents some extremely interesting avenues for future research. When more information on such mechanisms is available, the use of trace element data in petroleum geochemistry will rest on a sounder theoretical basis.
REFERENCES
1. Hackford, J. E. J. Inst. Petrol. Teohnol., 6, 193 (1922).
2. Ramsay, A. J. Inst. Petrol. Teohnol., 10, 87 (1924).
3. Shirey, W. B. Ind. Eng. Chem., 23, 1151 (1931).
4. Bonham, L. C. Bull. Amer. Assoo. Petrol. Geol., 40*
897 (1956).
5. Erickson, R. L., A. T. Myers and C. A. Horr. Bull.
Amer. Assoo. Petrol.<Geol., 38, 2200 (1954).
6. Hodgson, G. W. Bull. Amer. Assoo. Petrol. Geol., 38,
2537 (1954).
7. Hyden, H. J. U.S. Geol. Survey Bull. 1100-B (1961).
8. Ball, J. S., W. J. Wenger, H. J. Hyden, C. A. Horr and A. T. Myers. J. Chem. Eng. Data, 5, 5533 (1960).
9. Al-Shahristani, H. and M. J. Al-Atiya. Geoohim. Cosmoohim Aota, 36j 929 (1972).
10. Demenkova, P. Y., L. N. Zakharenkova and A. P. Kurtalskaya Tr. Vses. Neft. Nauk. Issled. Geol. Inst. No. 123, 59 (1958).
11. Gilmanshin, A. F., M. G. Gazinov and E. N. Baturina.
Tr. Tater. Neft. Nauk. Issled. Inst. No. 18, 113 (1971).
12. Kotova, A. V., L. N. Tokareva and V. G. Berkovskii.
Tr. Inst. Khim. Prir. Solei. Akad. Nauk. Kuz. SSR No. 1,
83 (1970).
13. Katchenkov, S.' M. and E. I. Flegentova. Vest si. Akad. Naouk. Belarus. SSR. Ser. Khim. Naouk., 95 (1970).
14. Botneva, T. A. Chem. Abstr., 78, 138768 (1973).
15. Mileshina, A. G., S. A. Punanova and N. M. Chekhovskikh Geol. Neft. Gaza, 15, 41 (1971) .
Nurev, A. N. and Z. A. Dzabharova. Issled. Obi. Neorg. Fiz. Khim. (1970), p. 33.
16.
THE NATURE OF METALS 57
17. Yen, T. F., T. G. Erdman and A. J. Saraceno. Preprints,
Div. Petrol. Chem. ACS, 6 (3), B53 (1961).
18. Sugihara, J. M., J. F. Branthaver, G. Y. Wu and C. Weather- bee. Preprints, Div. Petrol. Chem. ACS, 15 (2) C5 (1970).
19. Yen, T. F. Preprints, Div. Petrol Chem. 17 (4)
F120 (1972).
20. Colombo, V. P., G. Sironi, G. B. Fasalo and R. Malvano.
Anal. Cfcem. 30, 802 (1964).
21. Patek, P. and H. A. Bildstein. Anal. Chem., 231, 187 (1967).
22. Shah, K. R., R. H. Filby and W. A. Haller. J. Radioanal. Chem., 6, 185 (1970).
23. Shah, K. R., R. H. Filby and W. A. Haller. J. Radioanal. Chem., 6, 413 (1970).
24. Filby, R. H. and K. R. Shah. Proc. American Nuclear Society Topical Meeting Nuclear Methods in Environmental Re¬
search, University of Missouri,Columbia, Mo., August 23-24, 1971, p. 86.
25. Hitchon, B., R. H. Filby and K. R. Shah. Preprints, ACS Div. Petrol. Chem., 18, 623 (1973).
26. Filby, R. H. and K. R. Shah. The Role of Trace Metals
in Petroleum, T. F. Yen, Ed. (Ann Arbor, Mich.: Ann
Arbor Science Publishers, 1974).
27. Blumer, M. and W. D. Snyder. Chem. Geol., 2, 35 (1967).
28. Sugihara, J. M. and R. M. Bean. J. Chem. Eng. Data, 5,
106 (1960).
29. Hodgson, G. W., B. L. Baker and E. Peake in Fundamental Aspects of Petroleum Geochemistry, B. Nagy and u. Colombo, Eds., (Amsterdam: Elsevier, 1967), Chapter 5.
30. Hodgson, G. W., E. Peake and B. L. Baker. Research Council of Alberta Information Series 45, 75 (1963).
31. Dunning, H. N. and N. A. Rabon. Ind. Eng. Chem., 48,
951 (1956).
32. Witherspoon, P. G. and R. S. Winniford in Fundamental Aspects of Petroleum Geochemistry, B. Nagy and U. Colombo, Eds. (Amsterdam: Elsevier, 1967), Chapter 6.
33. Moore, J. W. and H. N. Dunning. Ind. Eng. Chem., 47,
1440 (1955).
34. Falk, J. E. Porphyrins and Metalloporphyrins. (Amsterdam: Elsevier, 1964).
35. Hodgson, G. W., J. Flores and B. L. Baker. Geochim. Cosmochim. Acta, 33, 532 (1969).
36. Dunning, H. N., H. Baker, R. B. Williams and J. W. Moore. Preprints, Div. Petrol. Chem. ACS, 5 (1) 169 (1960).
37. Saxby, J. D. Rev. Pure and Appl. Chem., 19, 131 (1969).
38. Stevenson, F. J. and M. S. Ardakani in Micronutrients in Agriculture, J. J. Mordtvedt, Ed. (Madison, Wis.: American Society of Agronomy), Chapter 5.
Gulyaeva, L. A. and S. A. Punanova. Izv. Nauk. SSSR Ser. Geol. 1973, 112 (1973).
39.
58 THE ROLE OF TRACE METALS IN PETROLEUM
40. Kasymov, K. K. Vop. Geol. Neftgazonos. Uzb. No. 35
(1966).
41. Gulyaeva, L. A. and I. F. Lositskaya. Geochemistry International (Eng. tr) 1967 (7j, 699 (1967).
42. Lositskaya, I. F. and L. A. Gulyaeva. Uch. Zap. Azerb. Gos. Univ. Ser. Khim. Nauk. No. 4, 44 (1966).
43. Shah, K. R. Personal communication.
44. Brindley, G. w. Reunion-Gelga de Minerales de la Ardlla^ (Madrid, 1970), p. 55.
45. Filby, R. H. and K. R. Shah. Unpublished results.
CHAPTER 3
DETERMINATION OF TRACE METALS IN PETROLEUM GENERAL CONSIDERATIONS
James Eppolito and H. A. Braier Gulf Research & Development Company Pittsburgh, Pennsylvania
GENERAL CONSIDERATIONS ON TRACE ANALYSIS Introduction
In recent years analytical methods have increased sensitivity, thereby developing a growing awareness of the significance of trace elements and the importance of detecting them accurately. The demands of research and the availability of modern instrumentation led to the development of new and specialized methods for the measurement of elemental composition at the ppm or ppb levels. Thus the distinctive field of trace analysis emerged within the realm of analytical chemistry.
The main feature of trace analysis is not the determination of a minute quantity of a substance, which in general is not a difficult task, but the determination of a small quantity in the presence of an overwhelming amount of other substances. These other substances, which are generally part of the sample matrix, may seriously affect the behavior of the trace constituent. A trace is generally and arbitrarily accepted as a constituent present in samples below a concentration of 100 parts per million.
The modern approach to elemental trace analysis is by means of physical methods. These methods are generally fast and require small samples that may need little or no processing. In most cases the elements are determined regardless of their oxidation state and chemical combination, and usually many elements can be determined simultaneously. In general, physical methods produce some permanent record on
59
60 THE ROLE OF TRACE METALS IN PETROLEUM
photographic film or strip chart, which can be used for future reference or verification. But there are no universal methods. Every technique has its peculiar advantages and limitations.
SELECTION OF AN ANALYTICAL METHOD
The solution of a trace analytical problem lies in the selection of the analytical approach that will produce the quality of information required and the limitations of which are unimportant to the solution of that particular problem. Considerable compromising is involved in the selection of an appropriate analytical technique.
Fundamental requirements such as the sensitivity and accuracy needed must be clearly established before looking for a solution to the problem. Sensitivity refers to the ability to see a small change in concentration. A closely related term is "detection limit," which is the lowest concentration that can be determined with a given degree of confidence. Accuracy refers to the reliability of the result, or how close it is to the true value. Precision refers to the repeatability of the result. Obviously it is possible to have good precision with bad accuracy but good accuracy implies good precision.
After one or more methods have been selected on the basis of their sensitivity and accuracy, its specificity must be established as satisfactory. Specificity refers to the ability of measuring one element with no significant effects from other elements present in the system. In general the conditions under which a method is specific are met by proper regulation of the chemical system and instrumental parameters. However, due to the nature of certain samples, these modifications cannot always be successfully applied.
Caution should be exercised when using information available in the technical literature about the terms described above. Terms such as sensitivity3 precision and specificity3 as generally given by instrument manufacturers, are measured when the element being determined is present in a pure solvent. This is an ideal situation, far from what is found in real samples. As a rule of thumb, limits of detection given by instrument manufacturers should be multiplied by a factor of 2 to 10. The same applies to analysis time. In 1933, G. E. F. Lundell1 published a paper entitled "The Chemical Analysis of Things as They Are" in
GENERAL CONSIDERATIONS FOR DETERMINATION 61
which he complained that many talks and articles on analytical matters dealt with "the chemical analysis of things as they are not." The situation has not changed.
The following are considerations of variable importance in the selection of an instrumental method. Is the instrument available in our laboratory? If not, how much does it cost? What kind of space and utilities does it require? Can this instrument determine one element at a time or various elements simultaneously? How is the sample to be presented to the instrument? Will our particular type of sample require processing? Can the instrument be operated by a technician? Can the data be directly transformed into concentration or must it be processed or interpreted? Useful information concerning reliability, frequency of adjustments, calibration and repairs can be obtained from users whose names are usually provided by the manufacturer. And finally an often forgotten consideration: is there in town a factory representative qualified to service the instrument?
PRECAUTIONS IN TRACE ANALYSIS Contamination
Contamination in trace analysis may be a serious source of error, especially in the determination of common and widespread elements. A specimen exposed to atmospheric dust, for example, may gain as much sodium as was originally present. Contamination may occur from the moment of sampling to the last stage of the analytical procedure. It may be introduced by unclean containers, laboratory ware, reagents, atmospheric dust or distilled water. Even dandruff, perspiration, fingerprints and cosmetics are known to cause contamination in the trace analysis of some elements. If the sample must be chemically processed, a properly run blank will correct for contaminants contributed by laboratory ware and reagents. However, contamination experienced during sampling, transfer and storage will affect the sample before its analysis and will not be accounted for by the blank.
Sampling
Sampling, which normally precedes analysis, should be carefully planned and executed because its quality regulates the value of everything that follows.
62 THE ROLE OF TRACE METALS IN PETROLEUM
Generally a laboratory sample is removed from the bulk product to be analyzed, and this sample is then divided into analytical subsamples. The quantitative result generated from an analytical subsample is limited by how well the subsample represents the bulk. Of course, the bulk may be only a portion of a larger volume.
Trace elements are generally not uniformly distributed in solids or nonhomogeneous materials like most fuel oils. Trace elements of interest in a fuel oil may be associated with the particulate matter or sediment, with the solution, or both. Highly sensitive instrumental techniques often require a very small specimen, thereby increasing the danger that the specimen being analyzed may not constitute a representative portion of the original sample.
Sample and Standard Storage
Standards and laboratory samples are usually stored for variable periods of time. During storage, precautions must be taken to minimize changes such as particulate segregation, precipitation, oxidation, polymerization and other slow reactions. Exposure to light, heat, air and vibration should be avoided. Plastic containers should not be used to store liquid samples, especially if they are of organic nature. Containers should be tightly closed to avoid the evaporation of light components that will leave a concentrated sample. Also, trace metals can be adsorbed on the walls of the containers or contamination may occur from desorption of previously adsorbed contaminants.
Sample Processing
As mentioned previously, many instrumental methods can handle a sample as it is. Sometimes processing is called for to comply with standardized procedures or to create conditions for the specific determination of a substance. In trace analysis, sample processing is performed to concentrate a trace constituent to a level at which it can be determined by a given instrumental technique or to eliminate interfering constituents, or both. Some of the techniques used are solvent extraction, evaporation, distillation, precipitation and ashing.
GENERAL CONSIDERATIONS FOR DETERMINATION 63
EVALUATION OF EXPERIMENTAL DATA
Finally there is the task of evaluating the experimental data through the use of statistics.
The reliability of an experimental observation must be measured by comparing it to an estimate of its error. This is referred to by statisticians as a "test of significance."
The first approach for the evaluation of a body of observations is the calculation of the simple mean. About this mean there can be calculated the average deviation, a figure offering a false sense of security. It is not a very accurate measure of precision, giving a bias measurement and appearing to be more precise than it actually is.
Another approach is the calculation of the variance and the standard deviation about the average. These are the most efficient measurements for precision, upon which are based all other statistical analyses.
The principal reason for making an elemental analysis is to estimate the true value of the amount of a trace metal or element. Every refined analytical method has an inherent error; hence the precision of the analysis can be improved by replication. The efficiency of the mean so determined increases with the number of replicates.
There exists an interval on each side of the mean wherein lies this true value. This interval is referred to as the confidence limits, and its width is determined by (a) the number of replicates,
(b) the variability of the analytical method, and
(c) the probability level desired.
If we wish to compare the precision of two different methods for determining a given element, or a method after it has been modified, we employ the variance ratio statistic, called the F distribution. The ratio of the larger variance over the smaller is compared with a critical value at the desired probability as a test of significance.
The test of significance for several variances, whereby an analytical method is applied to several samples or where several methods are to be compared after analyzing the same sample, is generally known as Bartlett*s test. Specifically we wish to know whether the several variances could reasonably exist in the same population.
The last statistical technique to be mentioned is the chi-square distribution. Is the drift in a piece of electronic apparatus, for example, greater
64 THE ROLE OF TRACE METALS IN PETROLEUM
than is expected? Observing the ratio of the square of deviations from the mean of a measured element, and the square of the population standard deviation, we can accept or reject the hypothesis that the data and expectations are consistent. This could lead to a study on the influence of apparatus effect on the data quality.
CONCLUSION
In chemical analysis, and especially in trace analysis, every step, no matter how simple, is important, from sampling to the writing of the final report. Each operation contributes certain variabilities to the final result. A completed analysis can properly be compared to a chain, in the sense that no chain is stronger than its weakest link.
REFERENCES
1. Lundell, G. E. F. Ind. Eng. Chem. > Anal. Ed. 5, 442 (1933).
CHAPTER 4
DETERMINATION OF TRACE METALS IN PETROLEUM INSTRUMENTAL METHODS
H. A. Braier and James Eppolito Gulf Research & Development Company Pittsburgh, Pennsylvania
INTRODUCTION
As mentioned in the previous chapter, the modern approach to elemental trace analysis is by means of physical methods. What follows is a review of the general principles of some instrumental methods that can be used to determine trace metals in petroleum.
It is emphasized that there are no universal methods? each one exhibits its own advantages and disadvantages , which are listed for each technique described.
Some who have worked with these techniques may disagree with what, in the context of this presentation, is considered to be advantageous or detrimental. Of necessity, those who have worked for a long time in a given analytical field will sometimes favor their familiar approach at the expense of other good possibilities. The writer of this paper does not claim to be different and will not be surprised if he too is found in the predicament just described.
NEUTRON ACTIVATION ANALYSIS
Neutron activation is a well-established method of elemental analysis capable of attaining very low limits of detection for most elements. It is not as widely used as other methods because large installations or complex machines are needed to achieve low limits of detection, although this is now changing with the advent of the californium-252 isotopic neutron sources.
65
66 THE ROLE OF TRACE METALS IN PETROLEUM
Advantages
There is little or no sample preparation and there is a very high sensitivity for most elements. Interferences, if observed, can be eliminated by instrumental or chemical means or by the application of proper corrections. Analysis time can be very short, but this depends on the element to be determined and other factors. Neutron activation analysis on a service basis is available from a number of private and government laboratories throughout the country.
Disadvantages
Because of the use of radiation, special licensing, training of personnel and controls are required. To achieve high sensitivities, high neutron fluxes are required, which are expensive.
Cost and Space Needed
Cost and space needs can vary widely. About $35,000 and a medium-sized room are needed for a one milligram californium-252 source system. Several hundred thousand dollars and a building are needed for a nuclear reactor. Particle accelerators are of intermediate cost and space requirements.
Principle
In neutron activation analysis, a sample is irradiated or bombarded with neutrons. Each atom that captures a neutron undergoes a nuclear reaction and could be transformed into an unstable or radioactive element. This unstable element, called radionuclide, becomes stable by releasing energy in the form of radiation. Each radionuclide is characterized by its rate of radioactive decay or half life, the type of radiation emitted, and the energy of the radiation. These characteristics, like nuclear fingerprints, unambiguously identify the artificially created element, and by inference the element in the sample that gave origin to it.
Once the sample has been irradiated, two main approaches can be followed: chemical separation
or instrumental analysis. Chemical separation, which requires sample processing after irradiation, is time-consuming and can be quite involved but it
INSTRUMENTAL METHODS 67
provides the lowest limit of detection afforded by activation analysis. Instrumental activation analysis, which is widely practiced because it is fast and nondestructive, involves the use of gamma-ray spectrometry to study the gamma radiation emitted by the activated sample.
Instrumental neutron activation lends itself to on-stream applications. Figure 4.1 shows a schematic representation of on-stream and discrete sample instrumental activation analysis. In the on-stream example the sample flows through an irradiation coil and then through a counting coil. In the discrete sample application, the sample, in a suitable container, is first irradiated and then taken close to the radiation- detector. The radiation detectionanalyzing system shown here is similar to the one described for energy dispersive X-ray spectrometry.
IRRADIATION 1
COUNTING
I
1
Figure 4.1 Discrete sample and on-stream neutron activation analysis.
68 THE ROLE OF TRACE METALS IN PETROLEUM
Neutron Sources
Neutrons are easy to produce. Being electrically neutral they easily invade the nuclear domain. For these reasons and because they react with most elements, neutrons are almost exclusively used in activation analysis. Neutrons can be obtained by means of nuclear reactors, particle accelerators, and from isotopic sources.
Nuclear reactors are large and expensive to build and maintain but they produce high neutron fluxes that facilitate the attaining of low limits of detection. Service irradiations and analysis can be obtained from a number of government-, industry- and university-owned reactors.
Particle accelerators are machines in which high speed charged particles collide with suitable target materials, inducing nuclear reactions with the production of neutrons or other particles. Van de Graaff and Cockroft-Walton machines are typical of this group. The complexity of some of these machines can be realized by inspecting Figure 4.2, which shows the 3-Mev Van de Graaff electron accelerator installation at Gulf Research and Development Company.
Notice the four large rooms needed and the five-foot thick solid concrete shielding wall.
Isotopic neutron sources have the advantages of compactness, simplicity and lack of moving parts.
Also their neutron output is uniform, stable and predictable. These characteristics make them ideal for on-stream applications. Until a few years ago the known sources of this type produced low neutron fluxes unsuitable for most applications*
Californium-252 Neutron Sources
For isotopic sources the picture has changed with the discovery in 1955 of californium-252, an artificial radionuclide that decays by spontaneous fission with an intense neutron production. Figure 4.3 shows the californium-252 source holder used at Gulf Research and Development Company. It is about four inches long and can contain several milligrams of the radionuclide. About one milligram of californium-252, surrounded by an appropriate moderator, will produce approximately the same useful neutron flux as can be produced with the installation shown in Figure 4.2. Californium-252 is commercially available from the United States Atomic Energy Commission.
COUNTING ROOM
INSTRUMENTAL METHODS 69
70 THE ROLE OF TRACE METALS IN PETROLEUM
Figure 4.3. Californium-252 source holder used at Gulf Research and Development Company.
Figure 4.4 depicts an on-stream californium-252 irradiator in which space and radiation shielding requirements are reduced to a minimum by an underground location. Stream inlet and outlet are at ground level, while the irradiation coil surrounding the californium-252 source is about two feet below ground. A similar analyzer in an above-the-ground design can be seen in Figure 4.5/ which also shows the counting electronics/ readout system, and inlet- outlet pipes on top of the tank. The three-foot diameter steel barrel is filled with water for radiation shielding purposes. These on-stream irradiators can be easily adapted for the analysis of discrete samples. Figure 4.6 shows a calibration curve for vanadium in crudes obtained with the above the-ground on-stream analyzer just described. The chart paper readout in Figure 4.7 indicates how rapidly this analyzer reacts to a sudden change in vanadium concentration from 2.3 ppm to 1.7 ppm. By changing operational parameters, vanadium can be determined from fractional ppm to per cent concentra tions.
12” Sch. 40 Pipe / As Casing
Figure 4.4. On-stream californium-252 irradiator in a below-ground configuration.
INSTRUMENTAL METHODS 71
72 THE ROLE OF TRACE METALS IN PETROLEUM
Figure 4.5. Above-the-ground on-stream vanadium analyzer featuring a californium-252 source.
X-RAY FLUORESCENCE
X-ray fluorescence is a well-known and widely used method of elemental analysis. It is directly applicable to solid or liquid samples of organic or inorganic nature.
Advantages
X-ray fluorescence analysis can be performed using- rapid and simple techniques with little sample
INSTRUMENTAL METHODS 73
IOOK
w
I-
z
o
o
o
z
3
1000
.0 10.0 VANADIUM CONCENTRATION (PPM.)
100
Figure 4,6
preparation for concentrations above 0.01%. It is an excellent method when applied to routine run-of- the-mill samples.
Disadvantages
To determine low or fractional parts per million levels, most samples must be processed to concentrate the trace elements. The technique is not sensitive for sodium and lighter elements. Matrix effects are important and affect accuracy unless appropriate standards or corrections or both are used.
o
A
PM“
0i
-j—T"!
L3'P
/ANA
DlUfc
€
6:NA[
>IUM
r-uf
?~P F
M~V
L
p
o
vo
Q
U)
SAIV
PLE
OF
:har
T P /
iPER
REA
DOU'
r of
THE
DIG
ITA^
. RA
TEM£
TER
SFT
FO
? fir
0 SF
r.pM
^ SA
MP.1,1
£ ,C0
UNT|
NO ‘
'IMF
SHC]
WIN(
7 Of
PPW
>
/ANA
DIUN
1—LE
VEL-
-CH/
lNGE
1 -1 1 vv
\
' . =
IQO
or 01
3S -1
—V ,
IOC
o- e:
<P _
A°/o.
OBS
ex
>
X
o
Figure 4.7. Recorder readout of a vanadium level change.
74 THE ROLE OF TRACE METALS IN PETROLEUM
INSTRUMENTAL METHODS 75
Cost and Space Needed
The price ranges from $20,000 to $40,000 for a good instrument. The cost can be easily doubled by the addition of automatic features, computer operation, etc. For safety considerations it is desirable to have these instruments in a separate room.
Principle
When atoms are excited by X-ray bombardment, inner shell electrons are ejected. The vacancies thus created are immediately filled by outer shell electrons. These outer shell, energetic electrons move toward the lower energy inner shells by discrete jumps from energy level to energy level. The resulting decrease in their energy appears as X-ray photons with wavelengths that are characteristic for each element.
When a specimen is bombarded with X-rays, the elements present will emit their characteristic X-rays. For analytical purposes these must be resolved and their intensity measured. This is accomplished with an X-ray spectrometer of which there are two fundamental types, namely the wavelength dispersive and the energy dispersive. Figure 4.8 shows a schematic diagram of these spectrometers.
The wavelength dispersive spectrometer is the conventional optical instrument in which the photons are spatially dispersed by diffraction by means of a crystal goniometer. For each position of the goniometer, the detector sees only a narrow wavelength band. These spectrometers have good resolution, but can determine only one element at a time.
In energy dispersive instruments, all the characteristic X-rays from the specimen are first detected by a high resolution solid state detector. The detector output consists of electrical pulses of amplitude proportional to the energy of the detected photons. These pulses, once linearly amplified, are electronically sorted according to their amplitude by means of a pulse height analyzer. An advantageous consequence of this detection mode is that analysis of all chemical elements can be performed simultaneously. Since it eliminates the use of crystal goniometers and the X-rays are not spatially dispersed, this type of spectrometer is also sometimes referred to as nondis- persive.
VI
ON
Figure 4.8. Comparison of wavelength dispersive and energy dispersive X-ray spectrometers.
THE ROLE OF TRACE METALS IN PETROLEUM
INSTRUMENTAL METHODS 77
ATOMIC EMISSION SPECTROSCOPY
There are different techniques in atomic emission spectroscopy that are based upon the types of excitation and detection used. Under this heading arc and spark excitation and photographic and multiphotometric detection will be discussed. Flame photometry, although by principle belonging to this group, will be discussed together with atomic absorption spectrometry.
Advantages
There is qualitative or quantitative determination of about 70 elements, all or most of which can be simultaneously determined. Analysis time can be very short, as is the case with direct readers.
Disadvantages
There is a strong matrix effect and poor sensi-* tivity for volatile elements. Involved calibration is required for precise quantitative analysis.
Cost and Space Requirements
The cost varies from about $30,000 for a relatively simple spectrograph and accessories to $100,000 for more sophisticated instruments. A medium-sized room is the minimum space required to house this equipment.
Principle
In atomic emission spectrosopy the atoms are excited by thermal or electrical means or both. The excited atoms and atomic ions emit their excess energy in the form of light of definite wavelengths. The emitted radiation is resolved by optical means in its individual wavelengths, which are recorded photographically or photoelectrically as a definite pattern of spectral lines. The position of the spectral lines gives a qualitative indication of which elements are present. The intensity of the spectral lines gives a quantitative indication of the amount of each element in the sample.
Figure 4.9 shows the fundamental parts of an emission spectrograph: a means to excite the sample, a dispersive element and a detection system.
78 THE ROLE OF TRACE METALS IN PETROLEUM
Figure 4.9. Schematic diagram of an optical emission spectrograph.
Sample Excitation
There are three sources commonly used to vaporize and excite the elements in a sample: the flame, the
electric arc and electric spark discharge. Flames possess the lowest excitation energy, producing a rather simple line spectra. Flame excitation will be discussed when dealing with flame photometry and atomic absorption.
In arc excitation vaporization occurs from the heating caused by the passage of electrical current.
It produces a complex line spectrum due mostly to excited neutral atoms. The DC arc is widely used because it can be applied to almost any kind of solid sample and because it exhibits the highest sensitivity for trace element detection. Its lack of stability results in somewhat poor precision.
The high voltage AC spark gives higher excitation energies than the DC arc with much less heating effect. It produces a complex line spectrum due mostly to excited atomic ions. Because it is a stable source, it is preferred when high precision rather than high sensitivity is required. It is easily applicable to liquid samples and solutions.
INSTRUMENTAL METHODS 79
Dispersion
The most important component of a spectrograph is the dispersive element, which can be either a prism or a diffraction grating. It sorts out by wavelength the radiant energy coming from the excited atoms.
Detection
The dispersed radiation is photographically recorded on film or plate providing a permanent record for analysis. The slowness of the photographic process and subsequent evaluation led to the development of instruments known as direct-reading spectrometers.
Direct-Reading Spectrometers
In a typical instrument, schematically shown in Figure 4.10, the photographic film is replaced with an opaque barrier that has several slits located at wavelengths appropriate to the elements to be analyzed. Behind each slit is mounted a photomultiplier tube, which directly converts radiant energy into electrical energy, permitting a rapid readout. Direct readers are very useful in high speed routine quantitative work. From few to many elements can be determined simultaneously.
ATOMIC EMISSION FLAME PHOTOMETRY AND ATOMIC ABSORPTION FLAME PHOTOMETRY
Although these spectroscopic techniques are conceptually different, they have some points in common and will be discussed together to emphasize their similarities and differences. Both are well-known, widely used, and relatively inexpensive instrumental methods for the determination of metallic elements in organic or inorganic samples.
Advantages
The flame emission technique has a very high sensitivity for some elements and is rapid, simple and inexpensive.
The atomic absorption technique has good sensitivity for most metallic elements, is rapid, simple, and specific, with few interferences.
80 THE ROLE OF TRACE METALS IN PETROLEUM
Figure 4.10. Schematic diagram of a direct reading optical emission spectrometer .
Disadvantage s
Flame emission has spectral interferences, and flame fluctuations affect precision and accuracy.
One element is determined at a time, and the sample must be in solution.
Atomic absorption can determine one element at a time. The sample must be in solution, although new flameless techniques like the carbon rod may change this requirement.
Cost and Space Needs
Prices range from $5,000 to $15,000 for an instrument that can perform both techniques, and considerably less for a flame emission spectrometer. Only a few feet of bench space are needed for either instrument.
Principle
As can be seen in Figure 4.11, both methods use a burner, a flame, a monochromator, and a detector that generally is a phototube. A hollow cathode lamp and a chopper are added for atomic absorption.
INSTRUMENTAL METHODS 81
EMISSION FLAME PHOTOMETRY
ATOMIC ABSORPTION FLAME PHOTOMETRY
Figure 4.11. Comparison of emission and atomic absorption flame photometry.
In flame emission as in atomic absorption a burner aspirates a solution of the sample and atomizes it into the flame. The heat of the flame and the kinetic energy of the combustion products break down the sample molecules into its component atoms.
Close to 100% of these atoms are not excited but merely dissociated from their chemical bonds and placed into a nonionized ground state. An important property of the ground state atoms of a given element is that they will absorb light of a specific wavelength. This light, known as resonant radiation, is the same that would be emitted by these atoms if they were excited. The resonant radiation of a metallic element is easily produced with a hollow cathode lamp whose cathode contains that metallic element. The excitation energy of the commonly used flames is low compared to that of arcs and sparks. Consequently less than 1% of the metal atoms in the flame are mildly excited to emit a simple line spectrum. In both methods, the monochromator is used to isolate the analytical wavelength used for the analysis from all other unwanted light produced by the flame or hollow cathode lamp or both.
The conceptual difference between both methods is that in flame emission what is measured is the emission from the excited atoms, which are only a small part of the metal atoms of a given element present in the flame. In atomic absorption what is measured is the absorption of a constant output of certain resonant radiation by the majority of the metal atoms of a given element present in the flame, which are those in the ground state.
82 THE ROLE OF TRACE METALS IN PETROLEUM
In flame emission, spectral interferences are common and affect accuracy. Spectral interferences occur because the different elements excited emit their radiation simultaneously and the monochromator may not have the resolution to isolate an analytical line from the effect of a very intense or a very close interfering line. Precision also suffers because the population of excited atoms is affected by flame fluctuations that are difficult to control. Flame emission is extremely sensitive for the determination of the alkali metals, the alkaline earth metals, and a few other metallic elements.
Due to a combination of factors, spectral interferences are much less prevalent in atomic absorption than in flame emission. For example, by means of a chopper or other suitable device, the continuous output of the hollow cathode lamp is transformed into a modulated analytical signal. This signal is then separated electronically and measured independently from the continuous and interfering signal produced by the flame. Also, the lines from a hollow cathode lamp are few and narrow and are specifically absorbed. Therefore, a given element can only be determined when the lamp and the monochromator setting are both matched to the element analysis. Precision is not significantly affected by flame fluctuations because these have little effect on the population of ground state atoms. Atomic absorption is by no means free of interferences, but they are uncommon and in most cases can be recognized and overcome by the use of standard techniques.
New flameless methods for sample presentation to the instrument, like the graphite rod and the . tantalum boat, are expanding the use and applications of atomic absorption spectrometry. In the first technique the burner is replaced by a graphite rod with a small well where a few microliters of sample are deposited and electrically heated by means of a controlled power supply. Important advantages of this procedure are that a very small sample is needed and the dilution of viscous samples is not required.
Also, the absence of interfering flame background helps to obtain better sensitivity for many elements.
In the boat technique, the liquid sample is deposited in a narrow, boat-shaped container and carefully dried. The container is made of tantalum or other high- melting-point metal. The boat is placed under the light path of the hollow cathode lamp and the dried sample is vaporized by electrical heating or with a conventional acetylene-oxygen flame. This technique, although simple, is not free from interferences and offers better sensitivity for a few elements only.
INSTRUMENTAL METHODS 83
SPARK SOURCE MASS SPECTROMETRY
This is not a common or well-known technique of elemental analysis. Nevertheless it has reached the point of refined development; instrumentation is commercially available and the technique has attractive features.
Advantages
It is the only method that offers high and uniform sensitivity for all elements with the exception of hydrogen and helium. Typical precisions are ±2-5% above the 1 ppm level and ±10-20% from 1 to 0.001 ppm. All elements can be determined simultaneously.
Disadvantages
It is a sophisticated instrument requiring the services of a professional, and the technique is a relatively slow one. Barring any difficulty, about ten oil samples a day can be analyzed. The instrument is expensive, costing about $120,000 and requiring considerable floor space.
Principle
As the name implies, this is a mass spectrometric technique. The principle of mass spectrometry can be explained briefly with the aid of Figure 4.12, showing the diagram of a double-focusing instrument that is the type used in spark source mass spectrometry.
Mass Spectrometry in General
The mass spectrometer is an instrument that sorts out molecular or atomic ions according to their masses and electrical charges. Several methods of producing mass spectra have been devised, and all of them have the following five parts in common: (1) The inlet
sample system. This provides the means for sample introduction. It is generally suited for gaseous and liquid samples and is usually heated to help vaporize the sample in the high vacuum of the instrument.
(2) The ion source. In this part the gaseous molecules are ionized and fragmented by electron bombardment. (3) The accelerating system, which consists of a series of slits charged at decreasing potentials
84 THE ROLE OF TRACE METALS IN PETROLEUM
Figure 4.12. Double-focusing mass spectrometer.
through which the ions formed at the ion source are accelerated. (4) The mass analyzer separates and focuses the ions on a curved or plane surface according to their mass-to-charge ratio. The main difference among the different types of mass spectrometers lies in the design of the mass analyzer. (5) The detection system detects the individual ion beams by means of an ion collector-amplifier-readout system.
A photographic plate can also be used to detect and record the mass spectrum. The position of the spectral lines gives a quantitative indication of the amount of each element or molecule present in the sample.
Spark Source Mass Spectrometry
This is a technique adapted to the determination of elemental rather than molecular composition. The main difference between the instrument described above and the kind needed for this technique lies in.the design of the sample inlet and ion source. The regular inlet is replaced with a rather large door, which provides access to the ion source area, and the ion source is replaced with electrodes made with the sample to be analyzed. If the sample is liquid, it is frozen on the outside surface of hollow metal electrodes through which liquid nitrogen is constantly circulated. In this manner, a film of frozen sample remains on the electrode's surface even during excitation. A high voltage radio frequency spark, which provides energetic and cool excitation, is used to vaporize and ionize the elemental components of the sample. These
INSTRUMENTAL METHODS 85
elemental ions are then accelerated, analyzed and detected as described above. Because of the characteristics of the spark excitation, the ion output varies little from element to element. This is why all elements can be determined with about the same sensitivity.
CONCLUSION
Table 4.1 represents an attempt to compare some characteristics of the instrumental techniques just described. It would be unfair and difficult to assign other than general values to these characteristics because they depend on many variables, such as the nature of the sample, the element to be determined, the particular instrument and perhaps, most important, the ability of the analyst.
Some of the described instrumental techniques are complex and uncommon but offer very low limits of detection. Others are simple and widely used. Nevertheless, they may become sophisticated and restricted if pushed to give the ultimate detection limits of which they are theoretically capable.
As new specifications establish lower tolerances, exotic instrumentation and involved handling, not available elsewhere, may be needed to analyze petroleum for trace metals. In this regard the investigator should be prepared to send samples for analysis to laboratories far from his own location. If so, analytical results should not be expected sooner than a few days, or in some cases a few weeks.
Oo
Table 4.1
Comparison of Instrumental Methods
Neutron Spark Source
Activation X-Ray Emission Flame Atomic Mass
Characteristic Analysis Fluorescence Spectroscopy Emission Absorption Spectrometry
Scope
most elements
elements heavier than Si
Sensitivity
ppb, element & neutron flux dependent
ppm, element and matrix dependent
Accuracy
good
good
Specificity
good
good
Contamination
good
good
Analysis time
fast-slow
fast
Several elements simultaneously
yes
yes: E. Disp. no: W. Disp.
Instrument
cost
$30 K UP
$30 - 50K
Space Needed
room-bldg.
room
Operation
simple to complex
simple
Interpreta¬
tion
simple to complex
simple to complex
On-stream
yes
no
capability
most metals
many metals
most metals
most elements
ppm, metal
ppb for few
ppb for few
ppb for most
and matrix
metals, ppm
metals, ppm
elements
dependent
for many
for most
good-poor
good-poor
good
good-poor
good
good-poor
good
good
good
poor
poor
good
fast
fast
fast
slow
yes
no
no
yes
$30 K UP
$2 - 4K
$4 - 15 K
$120 K
room
bench
bench
room
simple
simple
simple
complex
simple to
simple
simple
complex
complex
no
no
no
no
THE ROLE OF TRACE METALS IN PETROLEUM
INSTRUMENTAL METHODS 87
REFERENCES
1. Addink, N. w. in Trace Characterization, W. w. Meinke and B. F. Scribner, Eds., NBS Monograph 100 (Washington, D.C.: U.S. Government Printing Office, 1967), pp. 121-147.
2. Ahearn, A. J. in Trace Characterization, W. W. Meinke and B. F. Scribner, Eds., NBS Monograph 100 (Washington, D.C.: U.S. Government Printing Office, 1967), pp. 347-374.
3. Birks, L. S. X-ray Spectrochemical Analysis (New York: Interscience, 1969).
4. Cornu, A. in Advances in Mass Spectrometry, Vol. 4 (New York: The Elsevier Publishing Co., 1968), pp. 401-418.
5. Guinn, V. P. in Treatise on Analytical Chemistry, I. M. Kolthoff and P. J. Elving, Eds. (New York: Wiley, 1971), Part I, Vol. 9, Chapter 98, pp. 5585-5641.
6. Kahn, H. L. in Trace Inorganics in Water, R. F. Gould, Ed., Advances in Chemistry Series No. 73 (Washington, D.C.: American Chemical Society, 1968), Chapter 11, pp. 183-229.
7. Owens, E. B. Appl. Spectros. 21(1), 1-8 (1967).
8. Ricci, E. and T. H. Handley. Anal. Chem, 42, 378 (1970).
9. Smales, A. A. in Trace Characterization, W. W. Meinke and B. F. Scribner, Eds., NBS Monograph 100 (Washington, D.C.: U.S. Government Printing Office, 1967), pp. 307-326.
10. Williar, H. H., L. L. Merritt, Jr., and J. A. Dean. Instrumental Methods of Analysis, 4th Ed. (New York:
D. Van Nostrand, 1965).
11. Yoakum, A. M. in Developments in Applied Spectroscopy,
Vol. 8, E. L. Grove, Ed. (New York: Plenum Press, 1970), pp. 3-17.
This Page Intentionally Left Blank
CHAPTER 5
NEUTRON ACTIVATION METHODS FOR TRACE ELEMENTS IN CRUDE OILS
R. H. Filby and K. R. Shah
Department of Chemistry and Nuclear Radiation Center Washington State University Pullman, Washington
Trace elements in petroleum have received increased attention in recent years because of the value of trace element data in understanding petroleum geochemistry and origin. Data on metal compounds in crude oils are also important to the refinery operator because several elements such as S, V, Cu, and As cause problems in petroleum cracking and refining. In recent years the composition of such fuels as residual fuel oil has been of concern to environmentalists evaluating emissions from industrial concerns (e.gthe presence of vanadium in urban atmospheres from residual fuel burning).1
A variety of techniques are available for the determination of trace elements in crude oils, and chemical methods of analysis have been summarized by Milner2 and McCoy.3 Most geochemical studies of metals in petroleum have used emission spectrography of petroleum ashes because of the multielement nature of the method.1*"8 In recent years techniques such as polarography,9’10 colorimetric analysis,11 X-ray fluorescence,12^ESR,13 flame atomic absorption,11*"15^ and flameless atomic absorption16-17 have been used for the analysis of crude oils. Many of the techniques require preconcentration of the metals, usually by ashing techniques and consequently involve the risk of loss of volatile compounds or contamination by reagents. For many elements at very low concentrations (<1 ug/g) the risk of contamination is very high. Most of the applications cited above involve the determination of one or a few specific elements and are not suitable for multielement analysis.
89
90 THE ROLE OF TRACE METALS IN PETROLEUM
Neutron activation analysis for the determination of trace elements has been used extensively in inorganic geochemistry18-20 and the technique is well suited to petroleum analysis for the following reasons:
1. The high sensitivity of the method for many elements obviates the use of preconcentration procedures, for example, wet or dry ashing,
2. Small samples may be analyzed because of the high sensitivity of the method.
3. The loss of volatile elements is avoided because samples are not heated above 40°C.
4. Nondestructive multielement analysis is possible.
5. Preirradiation processing is not necessary and extraneous contamination can be reduced to a minimum.
6. Interferences and matrix effects are of minimal importance.
Guinn, et at. 21 Jester and Klaus,22 and Braier and Mott23 have surveyed the potential utility of neutron activation analysis in the petroleum field.
A number of investigators21f’ 25 have used Nal(Tl) spectrometry after radiochemical separation to determine several elements in petroleum. Ordogh, et at.26 determined I, Br and V in Hungarian crudes by a nondestructive technique, and Palmai27 used a similar method to determine V, Na, Mn, and A1 in products from refinig of crudes. Several Russian papers28"31 report the use of nondestructive activation analysis and Nal(Tl) gamma-ray spectrometry for such trace elements as V, Ni, Cu, Co and Na. Mast, et at.32 and Arroyo and Brune33 have used nondestructive techniques for the determination of V in crude oils.
Most studies cited above have not utilized the great potential of neutron activation analysis for multielement analysis. The introduction of high-resolution Ge(Li) gamma-ray detectors makes instrumental neutron activation analysis (INAA) possible for many elements. Bryan, et al.3k have used INAA to determine 17 elements in crude and residual fuel oils in a study on fingerprinting crude oils and oil spills. Shah, et al.35,3S and Filby and Shah37 have described detailed schemes of INAA for 23 elements, and Filby38 and Hitchon, et at. 39 have applied these techniques to the trace element geochemistry of petroleum.
The objective of this paper is to describe a comprehensive sequential method for 25 elements in crude oils using high resolution Ge(Li) gamma-ray
NEUTRON ACTIVATION METHODS 91
spectrometry and computer calculation of elemental data. An extension of the method to Cd using radiochemical separation techniques is described.
EXPERIMENTAL
The analytical method was divided into four steps determined by the half-lives of the radionuclides used for elemental analysis. In step 1 nuclides with short half-lives (less than three hours) are measured to determine V, S, Ca, I, Mn, and Cl. In step 2 nuclides with intermediate half-lives (2.5-36 hrs) and long half-lives (>2 days) are measured for Na,
K, Cu, Ga, As, Sb and Br, and for Au, U, Se, Hg, Cr, Zn, Sc, Sb, Rb, Cs, Ni, Co, Fe, Mo, and Sb, respectively. In step 4 Cd is determined by a radiochemical procedure. The nuclear reactions used are shown in Tables 5.1-5.3.
Table 5.1
Nuclear Reactions and Nuclear Properties—Group I
Element
Reaction
Qth.f3'
(bams)
Product Nuclide Half-life y-Ray (keV)
V
51v(n,y)S2v
4.90
3.75 m
1434.3
Ca
1,eCa(n,Y) lf9Ca
0.002
8.80 m
3084.4
Cl
37Cl(n,y)38C1
0.106
37.3 m
1642.7
I
127l(n,y)128i
6.40
25.0 m
443.3
s
36S(n,y)37S
2 x 10 5
5.1 m
3105.3
a ath.f “ product of thermal-neutron capture cross section, ath, in barns and fractional isotopic abundance, f.
92 THE ROLE OF TRACE METALS IN PETROLEUM
Table 5.2
Nuclear Reactions and Nuclear Properties—Group II
Element
Reaction
(barms)
Product Nuclide Half-life J-Ray (key)
Mn
55Mn(n,y)56Mn
13.30
2.58 h
846.7
Na
23Na(n,y)21tNa
0.53
15.00 h
1368.0
K
1,1K(n,Y) **2K
0.08
12.4 h
1524.7
Cs
13 3Cs (n,Y) 13l,Cs
28.0
2.05 y
797.0
Rb
85Rb(n,Y)86Pb
0.65
18.7 d
1078.8
Cu
6 3Cu (n,Y) 61*Cu
3.10
12.80 h
511.0
As
7SAs(n,Y)76As
4.50
26.40 h
559.1
Au
197Au(n,Y)198Au
97.80
74.70 h
411.8
Mo
98Mo(n,Y) "Mo
12.10
66.70 h
140.0b
Cr
50Cr (n,Y) 51Cr
0.73
27.80 d
320.1
Fe
58Fe(n,Y)59Fe
0.003
45.60 d
1292.0
Hg
202Hg(n,Y)203Hg
1.19
46.90 d
279.1
Sb
123Sb (n,Y) 121*Sb
1.41
60.30 d
1691.0
Ni
58Ni(n,p)S8Co
0.10b
71.30 d
811.1
Sc
l*5Sc(n,Y)‘*6Sc
23.00
83.90 d
889.3
Zn
sl,Zn(n,Y) 65Zn
0.23
243.00 d
1116.0
Co
59Co(n,Y)60Co
37.00
5.26 y
1333.0
U
238U(n,Y)239U
0.05
23.5 m
106.4b
a ath f - product of thermal-neutron capture cross section, ath, in barns and fractional isotopic abundance, f. b Daughter-nuclide gamma ray.
NEUTRON ACTIVATION METHODS 93
Table 5.3
Nuclear Reactions and Nuclear. Properties—Group III
Product Nuclide
Element
Reaction
(bams)
Half-life
Y-Ray (keV)
Cd
1 lltCd(n,y)115Cd
0.087
53.5 h
528
a ath.f “ product of thermal-neutron capture cross section, c?th' in barns and fractional isotopic abundance, f.
All irradiations were performed in the Washington State University TRIGA Mark-Ill fueled research reactor at a thermal neutron flux of 8 x 10¹² neutrons cm-2 sec-1. High efficiency (>15% relative to a 3" x 3" Nal(Tl) detector and 25 cm at 1333 keV) Ge(Li) detectors (FWHM 2.3 keV at 1333 keV at 1333 keV) and a Nuclear Data Model ND 2200 4096-channel analyzer with IBM compatible magnetic tape output were used for gamma-ray spectra measurement. A schematic diagram of the gamma-ray spectrometer is shown in Figure 5.1* Data analysis was performed on an IBM 360/67 computer.
ADC MEMORY
"7771 PREAMP I LIN.AMP. I Nunc.L»R channel PRINTER
65Cm3 CANBERRA TENNELEC DATA ^CLEAR HP-5050A
65Cm 1408C TC202BLR 50 mhz NUn„jR
ND 2200 DATA
ND 2200
H.V.
-3000v
MAG. TAPE KENNEDY 1400R
_r
I
IBM 360/67
Figure 5.1. Schematic diagram of gamma-ray spectrometer system.
94 THE ROLE OF TRACE METALS IN PETROLEUM
Procedure
All oil samples were centrifuged and filtered through Whatman No. 1 or 5y Millipore filters prior to analysis. For viscous oils it was necessary to dilute the oils with benzene before clean-up. The benzene was removed from the filtered oils by vacuum evaporation. Polyethylene or quartz vials used for irradiation were washed with double distilled nitric acid followed by double-distilled water and acetone to remove surface impurities.
Step 1
The oil (0.5-1.0 g) was weighed out into a 2/5- dram polyethylene vial and the vial was heat-sealed. Aqueous solution standards for V, I, Cl, S, Mn and Ca were sealed in similar vials. The samples and standards were irradiated for 15 mins in the reactor and allowed to decay for 5 mins after irradiation. Gammy-ray spectra of samples and standards were measured 5-15 mins after irradiation for 52V. 37S, and **9Ca and again after 30 mins for 128I, a6Cl and 56Mn. The y-ray spectrum of a California Tertiary oil is shown in Figure 5.2.
Step 2
A second aliquot of the oil (1-2 g) was weighed into a 5-ml quartz vial, which was then sealed in a 2-dram polyethylene vial. Multielement aqueous solution standards were sealed in 2/5-dram polyethylene vials.
The standard solutions used contained Na, Br, K? Se, Ni, Sc, Rb; Cr, Fe, Co, Zn, Cs; and Au, Mo, U,
Sb, Hg, as individual standards. Samples and standards were irradiated for 8 hours in the reactor and allowed to decay for 24-48 hours. Samples and standards were prepared for counting by transferring the sample to a 3"-dia glass petri dish, mixing with benzene and silica to make a 3" x 0.5" disc. Gamma- ray spectra were then measured for 2**Na, 6lfCu, lf2K, 72Ga, 76As and 82Br. After 4-10 days Y-ray spectra were measured for *98Au, 121tSb, l3lfCs, *6Rb,
51Cr, 7 5Se. 2 0 3Hg, 5 8 Co (for Ni) , 60Co, 65Zn, lf6Sc, 99Mo, and S39Np (for U). Gamma-ray spectra for the intermediate half-life group and the long half-life group are shown in Figures 5.3 and 5.4, respectively.
COUNTS PER CHANNEL
ENERGY IN KeV
Figure 5.2 Gamma-ray spectrum of neutron-irradiated California crude oil showing short half-life nuclides (step 1).
NEUTRON ACTIVATION METHODS 95
COUNTS PER CHANNEL
ISOTOPES OBSERVED
IOOO
ENERGY IN KeV
Figure 5.3. Gamma-ray spectrum of neutron-irradiated California crude oil showing intermediate half- life nuclides (step 2).
96 THE ROLE OF TRACE METALS IN PETROLEUM
COUNTS PER CHANNEL
ISOTOPES OBSERVED
Figure 5.4
Gamma-ray spectrum of neutron-irradiated Libyan crude oil showing long half-life nuclides (step 2).
NEUTRON ACTIVATION METHODS 97
98 THE ROLE OF TRACE METALS IN PETROLEUM
All y-ray spectra were collected on 7-track magnetic tape, and the spectra analyzed by FOURIER, a computer program for computing nuclide activities, elemental concentrations and statistical parameters of the analytical results.1*0 Corrections for the 75Se interference in the 203Hg 280 KeV y-ray were made as described by Filby, et al.hl The 6*Cu activity was measured using the positron 511 keV annihilation radiation after correction for the contribution from pair production of the 21*Na 2754 keV y-ray.
Step 3
An aliquot of the oil (1-10 g) was weighed into a clean quartz vial and sealed in a polyethylene irradiation vial. A solution of Cd(N03)2 in 0.1 M HNO3 containing 35.0 yg Cd/ml was used as a standard. Samples and standards were irradiated for 4-16 hours and allowed to decay for 4-8 hours after irradiation. Each oil sample was transferred to a 200-ml beaker, and the oil remaining in the irradiation vial was then washed out with benzene.
The benzene was evaporated off on a hot plate, 25 mg of Cd2+ carrier in 15 ml of 18 M H2SOi* added and the solution charred for 2 hours on the hot plate until the appearance of S03 fumes.
After charring, a 5-ml aliquot of 16 M HN03 was added to oxidize organic matter and the solution evaporated to S03 fumes. The oxidation step was repeated until a clear solution was obtained. In some cases H2O2 oxidation was used after HN03 oxidation. When the solution was oxidized, 1 ml of cone. HBr and 5 ml 30% H202 were added. The solution was then evaporated to dryness. This step removes Sb, As, and Se as volatile bromides.
The residue was dissolved in 5 ml 6 M HC1 and the solution was passed through a Dowex-1 anion exchange column. The column was then washed with 25 ml 1 M HC1 to remove Fe, Ni, Co, Cu and Na. Zinc was eluted from the column with 10 ml 0.01 M HC1.
The Cd was then eluted from the column with 20 ml 0.5 M NH3 into a 150-ml beaker. The solution was heated almost to boiling, 5 ml of cone. NH3 and 1 ml of 0.1 M FeCl3 added and the precipitate of Fe(OH)3 allowed to coagulate. The solution was made acid with 6 M HC1 and evaporated to approximately 15 ml vo lume.
NEUTRON ACTIVATION METHODS 99
The solution was transferred to a 60-ml counting bottle and allowed to stand for 24 hours to establish the 115Cd-115mIn equilibrium. When equilibrium was attained the sample was counted for 10,000-40,000 seconds on the y-ray spectrometer. The irradiated standard solution was quantitatively transferred to the 60-ml counting bottle and diluted with water to give the same volume as that of the sample solution. The 336 keV y-ray of 11 5ItlIn in radioactive equilibrium with 115Cd was used to estimate the 115mCd activity.
RESULTS AND DISCUSSION
Table 5.4 shows values for trace elements in four crude oils selected to show a wide range of trace elements. Similar ranqes of values are seen in the data Hitchon, et at.3* obtained using the technique described here. The Cd concentrations of nine crude oils and two asphaltenes are shown in Table 5.5 and the standard deviations listed are based on counting statistics. The detection limits for the technique vary from element to element and are also dependent on the composition of the matrix analyzed (except for Cd). An estimate of practical detection limits has been made by taking a "typical" crude oil trace element composition similar to the Libyan oil included in Table 5.4. The elemental concentration corresponding to a peak area of the nuclide used equal to 3 standard deviations of the background under the peak was taken as the detection limit for that matrix. The calculated results are shown in Table 5.6. It should be stressed that the actual detection limit for a given element in an oil may be higher or lower than the values in Table 5.6 depending on the contents of other trace elements.
Sources of Error
Fast neutron reactions are a possible source of error in the results. For example, 60Co, used to determine Co, may be produced by the fast neutron reactions
6 °Ni(n,p)6 °Co 6 3Cu(n,a)6 °Co
Shah, et al35' 36 have evaluated these interfering nuclear reactions and have shown that the most serious interference is the 6°Ni(n,p)6°Co reaction,
100 THE ROLE OF TRACE METALS IN PETROLEUM
Table 5.4
Trace Element Contents of Some Crude Oils by Neutron Activation Analysis
Concentration in Crude Oila
Element California Libya Venezuela Alberta
(Tertiary) (Boscan) (Cretaceous)
V
7.5
8.2
Cl
T
1.47
1.81
1
s
9.90
4694
Na
13.2
13.0
K
—
4.93
Mn
1.20
0.79
Cu
0.93
0.19
Ga
0.30
0.01
As
0.655
0.077
Br
0.29
1.33
Mo
—
—
Cr
0.640
0.0023
Fe
68.9
4.94
Hg
23.1
—
Se
0.364
1.10
Sb
0.056
0.055
Ni
98.4
49.1
Co
13.5
0.032
Zn
9.76
62.9
Sca
8.8
0.282
u
—
0.015
1100
0.682
—
25.5
—
1.36
—
1450
20.3
2.92
0.21
0.048
0.21
—
0.284
0.0024
—
0.072
7.85
—
0.430
—
4.77
0.696
0.027
0.084
0.369
0.0094
0.303
—
117
0.609
0.178
0.0027
0.692
0.670
4.4
—
a Values in yg/g, except Sc, ng/g
Table 5.5
Cadmium Contents of Nine Crude Oils and Two Asphaltenes
Cd Content (ng/g)a
Sample Location Age Determination 1 Determination 2
Crude
California
Tertiary
4.09
+
0.33
3.83
±
0.36
Crude
California
Tertiary
<0.5
<0.5
Crude
Nigeria
—
1.22
+
0.33
1.77
±
0.41
Crude
Sumatra
Miocene
17.5
±
0.51
16.8
±
0.61
Crude
Alaska
—
0.32
+
0.09
0.20
+
0.11
Crude
Louisiana
U. Cretaceous
0.39
±
0.07
0.35
+
0.06
Crude
Utah
Eocene
0.60
±
0.10
0.50
+
0.11
Crude
Alberta
U. Devonian
9.6
+
0.82
9.9
+
0.91
Asphaltene
Alberta
U. Devonian
208
±
22
241
+
31
Crude
Alberta
U. Devonian
25.2
±
0.49
29.1
+
0.70
Asphaltene
Alberta
U. Devonian
1700
±
300
1520
+
290
a Error limits are standard deviations based on counting statistics.
NEUTRON ACTIVATION METHODS 101
102 THE ROLE OF TRACE METALS IN PETROLEUM
Table 5.6
Detection Limits for Different Elements in a "Typical" Crude Oil Matrix (in ng/g)
Element
Detection Limit
Element
Detection Limit
Cl
10
Ni
30
s
1000
Co
0.02
v
2
Se
23
Na
20
Hg
4*
As
6
Zn
90
Ca
4000
Cr
23
Mn
15
Fe
400
Cu
100
Sb
1.0
Ga
25
Sc
0.1
Br
1.5
U
100
I
5
Mo
500
♦assumes Se absent.
and that even for a Ni/Co ratio in the oil of 570, the error in the Co determination is only 6.7%. Fast neutron interferences are thus negligible except for Co in oils of high Ni/Co ratios. All results for Co in Table 5.4 have been corrected for Ni interference.
Another possible source of error is loss of volatile compounds during irradiation due to radiolysis of the petroleum matrix in a high y-radiation field. It was found that loss of light hydrocarbons occurred during irradiation but examination of the gases evolved showed no traces of Cl, Br, I, Hg, Ni, or other trace elements measured in this study.
NEUTRON ACTIVATION METHODS 103
Precision and Accuracy
The precision of the neutron activation method for 18 elements can be seen from the data in Table 5.7. The standard deviations listed have been calculated from replicate determinations of these elements in a California oil. Except for Au, the relative standard deviation for all elements is less than 12%. The value of 57.1% for the relative standard deviation of the Au concentration is due possibly to adsorption of 198Au on the container walls during irradiation because 198Au was observed in some of the irradiation vials after removal of the sample.
For this reason, Au contents of crude oils should be interpreted with caution.
No well-characterized natural petroleum standards calibrated for trace metals exist and thus it is difficult to evaluate the accuracy of the method.
As a check on the method, however, the National Bureau of Standards Standard Reference Material SRM 1571 Orchard Leaves is analyzed with each batch of crude oils analyzed. The results obtained for the Orchard Leaves analyzed with a particular batch of oils are shown in Table 5.8. The results obtained for the elements listed in Table 5.8 show excellent agreement with the National Bureau of Standards Certified Values, **2 except for As. The NBS value of 14 yg/g for As is currently being reevaluated and is expected to be closer to 10 yg/g.
In an attempt to provide a trace element standard for use in petroleum analysis the National Bureau of Standards and the Environmental Protection Agency recently distributed a Residual Fuel Oil (and other materials) for analysis to more than 40 laboratories. The results obtained and a discussion of the results has been presented by La Fleur and Van Lehmden.1*3 The data present a disturbing picture of the state of trace analysis of petroleum. Tables 5.9 and 5.10 show the results of the interlaboratory comparison of Ni and V in the Residual Fuel Oil (RFO). The largest range (13.6-52.4 yg/g) of Ni values was obtained by atomic absorption. Smaller ranges were shown by other methods.
The data for V are more disturbing and the range for atomic absorption is 22.4-444 yg/g which is clearly unsatisfactory. For both Ni and V the neutron activation values are very good and the results obtained in this study agree well with provisional values established by the NBS. Table 5.11 shows results for As, Cd, Crf Hg, Mn, Pb, Se and Zn.
104 THE ROLE OF TRACE METALS IN PETROLEUM
Table 5.7
Replicate Determinations of 18 Trace Elements in Crude Oil
Element
No. of Replicates
Concentration (\±g/&) Mean S.D.
Relative S.D. (%)
Ni
5
93.5
2.4
2.5
V
10
7.5
0.6
8.0
Co
5
12.7
0.26
2.1
Hg
5
21.2
0.36
1.7
Fe
5
73.1
5.5
7.5
Zn
4
9.32
0.48
5.2
Cr
5
0.634
0.033
5.2
Mn
10
2.54
0.22
8.7
As
5
0.656
0.074
11.3
Au
5
2.8 x 10~6
1.6 x 10 ~6
57.1
Sb
5
0.0517
0.0011
2.1
Se
5
0.364
0.038
10.4
Sc
4
8.8 x 10~3
6.7 x 10'h
7.6
Cu
5
0.93
0.08
8.6
Na
5
11.1
0.33
3.0
Ca
10
192.0
14.0
7.3
Ga
9
0.346
0.006
1.7
Cl
9
2.35
0.16
6.8
NEUTRON ACTIVATION METHODS 105
Table 5.8
Comparison of Trace Element Results Obtained for SRM 1571 Orchard Leaves
Elementa
Concentration
Determined
ms Certified15 Value*%
Other Values^
Ni
1.6
1.3
Fe
278
295
Zn
27.5
25
Co
0.160
0.16
As
9.83
14*
10
Na
80.0
82
Fb
11.4
12
Br
11.1
(10)
Cr
2.76
(2.3)
Se*
81.7
80
Cs*
61.0
—
<60
Sc*
80.0
—
200
Cd*
115
110
a Elemental concentrations in yg/g except for * concentrations in ng/g
b Values in parentheses not certified * Value to be revised to 10 yg/g
106 THE ROLE OF TRACE METALS IN PETROLEUM
Table 5.9
Interlaboratory Study of Ni in Residual Fuel Oil
Element
Method
No. Labs
Range (ppm)
Mean (ppm)
Ni
AAS
9
13.6-52.4
34.7
Ni
NAA
4
30.8-39.5
34.9
Ni
OES
3
34.5-60.4
44.1
Ni
XRF
5
22.0-40.4
32.7
Ni
other
2
35.5-39.0
37.3
NBS Certified Value: 37 ± 3 ppm
WSU Results: 37.4 ± 1.5 ppm
Table 5.10
Interlaboratory Determinations of V in Residual Fuel Oil
Element
Method
No. Labs
Range (ppm)
Mean (ppm)
V
AAS
8
22.4-444
264
V
NAA
5
261-312
284
V
OES
2
150-299
225
V
XRF
5
230-313
277
V
other
2
287-310
299
NBS Certified Value: (315 ± 5) ppm
WSU Results:
312 ± 16 ppm
NEUTRON ACTIVATION METHODS 107
Table 5.11
Interlaboratory Determinations of Trace Elements in Residual Fuel Oil
Element
Method
No. Labs
Range (ppm)
Mean (ppm)
Certified*
Value
As
NAA
3
0.029-0.057
0.04
0.06
Cd
AAS
3
0.199-2.34
0.93
—
Cd
0ES
2
2.72 -6.60
4.66
—
Cr
AAS
3
0.037-1.00
0.59
—
Cr
NAA
2
0.092-0.123
0.11
—
Cr
0ES
2
0.079-0.197
0.14
—
Hg
AAS
6
0.021-0.399
0.15
0.002
Mn
AAS
5
0.145-0.305
0.27
0.121
Mn
NAA
2
0.120-0.251
0.19
0.121
Mn
OES
2
0.059-0.133
0.10
0.121
Pb
AAS
3
0.249-3.56
1.51
0.041
Se
NAA
2
0.172-0.191
0.18
0.138
Zn
NAA
2
0.320-0.483
0.40
0.17
*Probable certified or information values by NBS
Although the number of laboratories reporting is small, the ranges of values for each element show that there is little agreement among methods or laboratories. The neutron activation values show the smallest ranges and agree well with probable certified values except for Zn. Results for 14 elements obtained in this laboratory by the neutron activation method are shown in Table 5.12.
108 THE ROLE OF TRACE METALS IN PETROLEUM
Table 5.12
Average Elemental Concentration in "Fuel Oil"a (values are in ppb)
No.
Element
Mean
Standard
Deviation
Number of Determinations
1
Chromium
92.6
9.60’
9
2
Antimony
9.52
0.837
9
3
Cobalt
301.0
14.0
9
4
Selenium
172.0
18.4
9
5
Bromine
39.1
5.3
9
6
Nickel*3
37.4
1.50
9
7
Zinc
320.0
30.0
9
8
Iron*3
23.9
1.08
7
9
Sodium*3
11.2
0.654
9
10
Arsenic
57.8
4.51
8
11
Mercury
<12
9
12
Manganese
252.0
9.49
8
13
Chlorine*3
7.80
0.506
8
14
Vanadium*3
312.0
16.4
8
a Mean
and standard
deviation
values are
given to three sig-
nificant figures, b These values are in ppm.
CONCLUSIONS
The neutron activation method for the determination of up to 25 elements in crude oils provides an accurate and precise method for use in geochemical studies of trace elements in petroleum. The method suffers from few interferences, and results obtained with an NBS Standard Reference Material agree well with certified values. Methods of trace element analysis of crude oils need to be evaluated for accuracy and precision because there are serious
NEUTRON ACTIVATION METHODS 109
discrepancies in the results obtained by different laboratories for several trace elements in a proposed trace element petroleum standard.
REFERENCES
1. Gordon, G. E. Private communication.
2. Milner, 0. I. Analysis of Petroleum for Trace Elements. (New York: Macmillan, 1963).
3. McCoy, J. w. The Inorganic Analysis of Petroleum.
(New York: Chemical Publishing Co., 1962).
4. Bonham, L. D. Bull. Amer. Assoc. Petrol. Geol., 40,
897 (1956).
5. Erickson, R. L., A. T. Myers and C. A. Horr. Bull. Amer. Assoc. Petrol. Geol., 38, 2200 (1954).
6. Hyden, H. J. U. S. Geol. Survey Bull. 1100-B (1961).
7. Hodgson, G. W. Bull. Amer. Assoc. Petrol. Geol., 38,
2537 (1954).
8. Katchenkov, S. M. and E. I. Flegentova. Vestsi. Akad. Belarus. SSR Ser. Khim. Nauk. 95 (1970).
9. Chu-Kang, C. C., E. W. Kell, and E. Solomon. Anal. Chem., 32, 221 (1960).
10. Sinko, I., S. Gomiscek and M. Span. Nafta (Zagreb),
23, 115 (1972).
11. Sandell, E. B. Colorimetric Determination of Trace Metals, 3rd ed. (New York: Interscience, 1959).
12. Smith, A. J., J. 0. Rice, W. C. Shaner and C. C. Cerato. Preprints Amer. Chem. Soc. Div. Petrol. Chem., 18, 609 (1973).
13. Dickson, F. E., C. J. Kunesh, E. L. McGinnis and L. Petrakis. Anal. Chem., 44, 978 (1972).
14. Billings, G. K. and P. C. Ragland. Can. Spectrosc., 14,
8 (1969) .
15. Gomiscek, S., M. Span and J. Sinko. Nafta (Zagreb), 23,
29 (1972).
16. Alder, J. F. and T. s. West. Anal. Chim. Acta., 61,132 (1972).
17. G. Hall, M. P. Bratzel and C. L. Chakrabarti. Talanta,
20, 155 (1973).
18. Filby, R. H., K. R. Shah and W. A. Haller. J. Radioanal. Chem., 5, 211 (1970).
19. Gordon, G. E., K. Randle, G. G. Goles, J. B. Corliss,
H. M. Beeson and S. S. Oxley. Geochim. Cosmochim. Acta,
32* 369 (1968).
20. Rey, P., H. Wakita and R. A. Schmitt. Anal. Chim. Acta,
51, 163 (1970).
21. Guinn, V. P., R. A. Johnson and G. C. Mull. Sixth World. Cong. Proc. Sec. V Paper 20 (1963).
Jester, W. A. and E. E. Klaus. Nucl. Appl. 3, 37 (1967).
22.
110 THE ROLE OF TRACE METALS IN PETROLEUM
23. Braier, H. A. and W. E. Mott. Nuol. Appl. 2*44 (1966).
24. Guinn, V. P. and S. C. Bellanca. NBS Spec. Publ. 312,
Vol. 1, 93 (1969).
25. Patek, P. and H. Sorantin. Allg. Prakt. Chem. 24,87 (1973)
26. Ordogh, M., A. Balasz, S. Reti and E. Szabo. Banyasz. Kohasz. Lapok. Koolag. Foldgaz., 6, 86 (1973).
27. Palmai, G. Banyasz. Kohasz. Lapok. Koolaj. Foldgaz., 5,
161 (1972).
28. Babaev, A. and M. u. Umarov. Doklad. Akad. Nauk. Tadzh. SSSR 11, 33 (1968) .
29. Berkuptva, I. D., I. M. Zlotova, S. A. Punanova and
K. I. Yakubson. Neftegazov. Geol. Geofiz. 1970* 19 (1970).
30. Lobanov, E. M., M. U. Umarov, I. M. Numanov and N. A. Azizov. Doklad. Akad. Nauk. Tadzh. SSR 12, 33 (1969).
31. Doklad. Akad. Nauk. Tadzh. SSR 12 (6),33 (1969).
32. Mast, R. F., R. R. Ruch and E. Atherton. III. Geol.
Survey Petrol., to 05,111 (1971).
33. Arroyo, A. and D. Brune. Mikroohim. Acta 1972,239 (1972).
34. Bryan, E. D., V. P. Guinn, R. P. Hackleman and H. R. Lukens Gulf General Atomic Report GA-9889 UC-2 (1970).
35. Shah, K. R., R. H. Filby and W. A. Haller. J. Radioanal. Chem. , 6, 185 (1970).
36. J. Radioanal. Chem., 6, 413 (1970).
37. Filby, R. H. and K. R. Shah. Proc. Amer. Nucl. Topical Meeting Nucl. Methods in Environment, Columbia, Mo.,
Aug. 23-24, 1971. Univ. Missouri Press, p. 86 (1971).
38. Filby, R. H. Unpublished data.
39. Hitchon, B., R. H. Filby and K. R. Shah. Unpublished data.
40. Shah, K. R. and R. H. Filby. Internal Report, 1971.
41. Filby, R. H., A. I. Davis, K. R. Shah and W. A. Haller. Mikroohim. Acta, 1970, 1130 (1970).
42. National Bureau of Standards Certificate of Analysis SRM 1571 Orchard Leaves, Washington, D. C., 1971.
La Fleur, P. D. and D. Von Lehmden. Material distributed at Symposium on Trace Analysis of Coal, Fly Ash, Fuel Oil and Gasoline, Research Triangle Park, N.C., May 16-17,
1973.
43.
CHAPTER 6
GEOCHEMISTRY OF TRACE ELEMENTS IN CRUDE OILS, ALBERTA, CANADA
Brian Hitchon Alberta Research Edmonton, Alberta, Canada
and
R. H. Filby and K. R. Shah Nuclear Radiation Center Washington State University Pullman, Washington
INTRODUCTION
This chapter reports preliminary results from a comprehensive, on-going study of the relations between trace elements and the organic components, specifically asphaltenes, in a large suite of crude oils and oil sands from Alberta, Canada. We report here only the results of the initial examination of the interrelations among 22 trace elements in a limited sample of 88 crude oils from stratigraphic units ranging in age from the Upper Cretaceous,
Belly River Formation, to the Middle Devonian, Elk Point Group, and underlying Granite Wash. They are representative of all major petroleum-producing stratigraphic units in Alberta and range geographically throughout the province. In type, they include condensates, crude oils, and two samples of the heavy oil from the McMurray Formation at the Athabasca deposit. Table 6.1 shows the number of samples examined from specific stratigraphic units.
The crude oils were fresh samples from cold separators, or cold treaters, or from a cold tank recently produced into from a cold separator or cold treater, and without the addition of emulsion breakers. As far as is known, downhole corrosion inhibitors
111
112 THE ROLE OF TRACE METALS IN PETROLEUM
Table 6.1
Stratigraphic Subdivisions of 88 Crude Oils Analyzed for Trace Elements
Number of
Stratigraphic Unit Samples
Upper Cretaceous, Belly River Fm. 4
Upper Cretaceous, Upper Colorado Gp. 7
Lower Cretaceous, Viking Fm. 10
Lower Cretaceous, Mannville Fm.
(including oil sands) 19
Jurassic 3
Triassic 4
Carboniferous 8
Upper Devonian, Wabamun Gp. 2
Upper Devonian, Winterburn Gp. 6
Upper Devonian, Woodbend Gp. 15
Upper Devonian, Beaverhill Lake Fm. 4
Middle Devonian, Elk Point Gp. 5
Granite Wash 1
had not been added to any well sampled. The samples were collected in standard sealer jars with glass tops and O-rings. Preliminary clean-up included centrifuging for half an hour at 2500 rpm and filtration through Whatman No. 1 filter papers; the samples were then transferred to glass bottles with caps with teflon inserts. Further filtration through Millipore 5y filters followed the sequence described by Filby.1
Trace elements were determined on the 88 crude oils by neutron activation analysis using the multielement method of Shah, et al. 2,3 and Filby and Shah.1* The general statistics for the results of these determinations are shown in Table 6.2. In a few instances it was not possible to determine
Table 6.2
General Statistics for 22 Elements Determined in 88 Crude Oils (Total Oil Basis), Alberta, Canada
Element
Unit of Measurement
Detection
Limit
Number of Samples Above Detection Limits
Average
Concentration
Maximum
Concentration
S
%
0.05
88
0.83
3.88
V
ppm
0.1
84
13.6
177
Cl
ppm
-
87
39.3
1,010
Na
ppm
-
85
3.62
64.7
Fe
ppm
0.1
41
10.8
254
Ni
ppm
0.1
69
9.38
74.1
Zn
PPb
25
79
459
5,920
Co
ppb
0.2
84
53.7
2,000
I
PPb
10
51
719
9,000
Mn
PPb
3
78
100
3,850
Se
PPb
3
62
51.7
517
Hg
PPb
2
39
50.9
399
Cs
PPb
0.5
43
4.27
68.5
Br
PPb
2
82
491
12,500
As
PPb
2
71
111
1,990
Au
PPb
-
4
0.438
1.32
Sb
PPb
0.01
24
6.22
34.8
Cr
PPb
5
42
93.3
1,680
Rb
PPb
10
9
148
720
Sc
PPb
0.05
51
7.76
199
Eu
PPb
0.05
50
0.935
23.2
Ga
PPb
-
-
-
445
GEOCHEMISTRY OF TRACE ELEMENTS 113
114 THE ROLE OF TRACE METALS IN PETROLEUM
sulfur in some samples, and values from chemical determinations were substituted in the statistical study. Further, gallium was not determined on all samples and so average concentrations have not been given in Table 6.2.
The results of these determinations for 22 elements on 88 crude oils were subjected to factor analysis, which is a statistical technique designed to explain complex relations among many variables in terms, of a few factors which themselves represent simpler relations among fewer variables. Factor analysis only determines the relations; it does not explain them. The explanation of the factors must be in the context of known information about the variables. Hitchon and Gawlak5 have used factor analysis in the study of aromatic hydrocarbons in gas condensates from Alberta and their paper includes pertinent background information with particular application to geochemical problems.
RESULTS OF FACTOR ANALYSIS Q-Mode
Q-mode factor analysis consists of a comparison of the samples in terms of the variables. This technique essentially evaluates the homogeneity of the sample or population being studied. Most elements essentially exhibited a lognormal distribution and so the logarithmic transforms of the geochemical data were factored and not the raw data. It is not essential to carry out the transformation, although it is desirable if sound conclusions are required based on significance testing.6 Where a large number of determinations for a specific element were below detection limits, that particular element could not be used in the factor study. Further, to enable the logarithmic transformation to be made, determinations below detection limits were arbitrarily assigned values one-tenth that of the respective detection limit (Table 6.2), Accordingly, only eleven elements (S, V, Cl, Na, Ni, Zn, Co, Mn, Se, Br and As) were used in the general factor analysis.
The Q-mode varimax factor score matrix of the trace element data is shown in Table 6.3. The first factor has high positive scores for Br, As, Zn, V,
Ni, Se, Co and Mn; the second factor has high positive scores for Ni, V and S opposed by high negative scores for Mn, Zn and Br; and the third factor has
GEOCHEMISTRY OF TRACE ELEMENTS 115
Table 6.3
Q-Mode Varimax Factor Score Matrix of Trace Element Data for 88 Alberta Crude Oils
Variable
1
Factor
2
3
s
0.20
0.77
0.38
V
1.09
1.71
-0.25
Cl
0.69
-0.53
CM
in
0
1
Na
0.18
0.57
0.22
Ni
1.03
1.81
-0.31
Zn
1.24
-1.07
-1.87
Co
0.90
0.22
-0.08
Mn
0.83
-1.16
-0.37
Se
0.95
0.39
-0.95
Br
1.59
-0.88
1.01
As
1.30
-0.38
2.19
Percent of Information Explained by Factor
43.7 30.6 9.6 Cumulative Percent of Information
43.7 74.3 83.9
a very high positive score for As, a high positive score for Br, and low negative scores for Zn and Se. The varimax factor components for these three factors may be normalized and the data points plotted on a ternary diagram (Figure 6.1). Only a few selected series of points have been plotted to illustrate the main features. With only five exceptions , the data points fall in the region with a less than 40% component of factor 3 (dashed line in Figure 6.1), and essentially form a binary series between factor 1 and factor 2. The arrows indicate present hydrodynamic flow paths based on published information from Hitchon7 and include data from the Viking Formation with its well-marked hydraulic
116 THE ROLE OF TRACE METALS IN PETROLEUM
FACTOR 1
Figure 6,1. Ternary diagram of normalized varimax factor components for Q-mode on crude oils from Alberta, Canada, showing relation of factor loadings to hydrodynamic flow path for three selected series of crude oils.
head low at Gilby. Factor 1 represents the shallower , less mature crude oils with high contents of a wide variety of trace elements. Factor 2 includes the deeper, more mature crude oils in which there are lower contents of trace elements but in which Ni, V and S are still important, relative to the other trace elements, even though in total quantity they are generally lower than in the shallower crude oils. This observation is true for all stratigraphic units, including the Viking Formation in which reverse, down-dip flow has been demonstrated. It thus appears that the binary system represented by factors 1 and 2 is essentially a maturation and not a migration phenomenon. This implication must be weighed in the context of variable amounts of the asphaltene fractions of these 88 crude oils, which range from essentially zero to about 17%,8 and taking into account the fact that a large fraction of the trace elements is present in the asphaltene
GEOCHEMISTRY IN TRACE ELEMENTS 117
fraction of crude oils, as observed by many workers. With this caution in mind, it would appear that the 88 crude oils represent a single population, as far as the total trace elements are concerned, which has been subjected to differentiation of the trace elements through maturation, but not through migration—at least as evidenced by the present flow paths. Only detailed examination of the trace elements in the asphaltene fraction will resolve this problem. The result of the Q-mode analysis implies that we are justified in examining all the samples as one population by R-mode analysis.
R-Mode
R-mode factor analyses using both the varimax and biquartimin solutions were carried out on the same data used for the Q-mode. In the varimax analysis, the communalities were all greater than 0.8, indicating that most of the variance of each component is explained by the seven factors extracted. These seven factors were subjected to the oblique biquartimin solution, and the loadings of the variables on the factors are illustrated in Figure 6.2.
1 2 3 4 5 6 7
Figure 6.2. Diagrammatic representation of factors from R-mode biquartimin solution of trace element data for 88 crude oils from Alberta, Canada.
118 THE ROLE OF TRACE METALS IN PETROLEUM
The rectangular boxes represent the factors, and the center line of each box is a zero loading for the component. Positive loadings (to a maximum +1.0) occur above the center line and negative loadings (to a maximum -1.0) below. The further a component from the center line the higher is its loading. Loadings less than 0.2 have been omitted from the figure since they correspond, approximately, to less than 5% of a variable. The seven factors account for over 90% of the total variance among the variables.
A correlation matrix between the primary factors indicates that the factors are uncorrelated, with no correlation coefficient exceeding 0.24.
More than one quarter of the cumulative variance is accounted for by factor 1, which has high loadings for S, V, Se and Ni. Essentially all the variance of V and much of the variance of Ni is loaded onto factor 1. This, together with the well documented occurrence of vanadyl and nickel porphyrins in crude oils and the fact that the major portion of the sulfur in crude oils occurs as organic compounds, suggests that factor 1 represents trace elements present as metallo-organic compounds. The known close geochemical association of Se and S would account for the high loading of Se on factor 1 and, by analogy, imply that Se occurs in crude oils in the form of Se-organic compounds. It is interesting that Na and Cl are loaded on separate factors, since it indicates that the crude oils have been separated successfully from any entrained formation waters—which are essentially sodium chloride solutions in most cases in Alberta. However, it leaves unresolved a reasonable explanation for the loadings observed for factors 2 and 3.
Due to the large number of samples in which Fe and Cr were below detection limits it was not possible to include them in the general R-mode analysis. However, a smaller suite of 20 crude oils was selected in which V, Fe, Ni, Co, Mn and Cr were all found at concentrations above detection limits. A separate R-mode analysis was run on these 20 samples and the results of the biquartimin solution are shown in Figure 6.3. The four factors extracted account for nearly 95% of the total variance among the variables. The correlation coefficient between Fe and Co in 38 crude oils in which both elements were above detection limits was 0.42, and the correlation coefficient between Fe and Mn in 36 crude oils in which both elements were above detection limits was 0.18. From these various facts we can state, with some confidence, that Fe is unrelated to either Co or Mn in
GEOCHEMISTRY OF TRACE ELEMENTS
119
12 3 4
Figure 6.3. Diagrammatic representation of factors from
R-mode biquartimin solution of 6 trace elements (Fe, Co, Ni, V, Mn, Cr) for 20 selected crude oils from Alberta, Canada.
Alberta crude oils; nor is it related to V, Ni or Cr. This suggests that Fe in the Alberta crude oils is probably not present as iron porphyrins—which, as far as we are aware have never been detected in crude oils, although they have been reported from the Colorado oil shale* and a variety of argillaceous rocks.10 Filby1 has shown that Fe-porphyrins, if present, account for a negligible fraction of the Fe in a California Tertiary oil containing 68.9 ppm Fe. The two orders of magnitude between the average content of Fe and those of Mn and Co in the Alberta crude oils (Table 6.2) might suggest that these metals were present as a result of the incorporation of corrosion products from well casing, tubing, separators, treaters or storage tanks. We believe that the demonstrated relations revealed by the factor analyses and correlation coefficients effectively negate this supposition. In oils studied from other parts of the world, Filby1 also found much higher Fe contents than Mn or Co. However, again, it leaves unresolved a reasonable explanation for the loadings for Fe, Mn and Co in the two factor studies.
Factor 6 represents an essentially unique factor for As. In factor 4, the small opposed loading of S against Zn could be interpreted as preferential com- plexing of Zn by N- or O-containing ligands.
120 THE ROLE OF TRACE METALS IN PETROLEUM
This preliminary factor analysis leaves many questions unanswered concerning the relations among the trace elements in the total crude oils. But, as pointed out previously, the fact that most trace elements are associated with the asphaltene fraction of crude oils, together with the facts that the contents of asphaltenes vary widely and hence that many elements were below detection limits, indicates that examination of trace elements in the asphaltenes should resolve many of the uncertainties posed by the present study. Furthermore, EPR, NMR and elemental (C, H, N, 0, S) analysis of the asphaltene fraction may help link the factors controlling the organic and inorganic components in these Alberta crude oils.
CONCLUSIONS
Within the limitations imposed by the determination of trace elements in the total crude oil, when their concentration is essentially confined to a variable portion of the total crude oil, we may conclude that the contents of the trace elements S, V, Cl, Na, Ni, Zn, Co, Mn, Se, Br and As are controlled by maturation processes rather than migration processes, though this may simply reflect maturation of the asphaltene fraction of the crude oils. S, V, Se and Ni account for more than one quarter of the cumulative variance and represent metallo-organic compounds. The factor analyses further demonstrate not only the -efficacy of our separation systems between crude oil and entrained formation water, but show that it is most unlikely that the Fe present in the crude oils originates from corrosion products incorporated during production. Four elements, Fe, Mn, As and Co represent essentially unique factors. Finally, it is clear that considerably more work.is justified on trace elements in crude oils, particularly in relation to their distribution within the various fractions and in relation to interactions between organic and inorganic components.
GEOCHEMISTRY OF TRACE ELEMENTS 121
REFERENCES
1. Filby, R. H. ACS Symposium "Role of Trace Metals in Petroleum," Chicago (August 26-31, 1973).
2. Shah, K. R., R. H. Filby and W. A. Haller. J* Radioanal. Chem., 6, 185, (1970).
3. Shah, K. R., R. H. Filby and W. A. Haller. J. Radioanal. Chem., 6, 413, (1970).
4. Filby, R. H. and K. R. Shah. Proc. Amer. Nucl. Soc. Topical Conference on Nuclear Methods in Environmental Research, University of Missouri, Columbia, Mo. (August 23-24, 1971). p. 86.
5. Hitchon, B. and M. Gawlak. Geochim. et Cosmochim. Acta 36, 1043, (1972).
6. Harmon, H. H. Modem Factor Analysis (Chicago: Univ. of Chicago Press, 1967) , p. 374.
7. Hitchon, B. Water Resources Research, 5, 460,(1969).
8. Speight, J. G. Alberta Research, personal communication.
9. Moore, J. W. and H. N. Dunning. Ind. Eng. Chem., 47, 1440, (1955).
10. Hodgson, G. W., B. Hitchon, K. Taguchi, B. L. Baker and E. Peake. Geochim. et Cosmochim. Acta, 32, 737 (1968).
Contribution No
693 from Alberta Research.
This Page Intentionally Left Blank
CHAPTER 7
METALS IN NEW AND USED PETROLEUM PRODUCTS AND BY-PRODUCTS
QUANTITIES AND CONSEQUENCES
Ivan C. Smith, Thomas L. Ferguson and Bonnie L. Carson Midwest Research Institute 425 Volker Boulevard Kansas City, Missouri 64110
PHYSIOLOGICAL EFFECTS AND MODES OF TRANSPORT OF METALS
A more accurate definition of the role of metals in human health is needed if we are to relate health or physical-disorder patterns to the human intake of metals. Almost all the stable metals are found in living matter. Fossil fuels contain many of these metals, some in relatively large quantities. Petroleum products, which supply about 43% of the nation*s energy requirement,1 are therefore a potential source of man-made environmental contamination by metals.
Trace metals can be divided into three categories: those known to be dietary essentials, those possibly essential, and nonessentials. Metals known to be essential to higher animals include: chromium, cobalt,
copper, iron, manganese, molybdenum, selenium, tin, vanadium, and zinc. Several additional metals considered as possibly essential on the basis of suggestive but inconclusive evidence include: arsenic,
barium, cadmium, nickel, and strontium. The other metals are presently classified as nonessential.
Many of the trace metals occur in animals in quantities that reflect the contact of the animal with its environment. It has been suggested that the essential elements can be distinguished from nonessential elements by observing the distribution patterns
123
124 THE ROLE OF TRACE METALS IN PETROLEUM
in tissue. Some researchers have postulated that internal mechanisms control the levels of essential trace metals in tissue, whereas nonessential metals occur in distribution patterns that reflect the environment.2
Some trace metals are classified as toxic. There is, perhaps, justification for this classification for such metals as arsenic, lead, and mercury. In addition, extended exposure of mammals to small amounts of cadmium, lead, selenium, antimony, and nickel carbonyl can shorten life or cause cancer, and lead, nickel, antimony, cadmium, and mercury in small amounts cause human health problems.3 However, all metals are toxic if ingested at sufficiently high levels. Frequently, the effects of a toxic metal are increased by nutritional deficiencies.1*
It is also becoming increasingly apparent that the specific chemical form of a metal is a factor in its toxicity. Water-lipid partitioning, cell-wall permeability, and metabolic transport are just a few of the factors influenced by chemical form which, in turn, influence toxicity. Hexavalent chromium, pentavalent vanadium, divalent manganese, arsine, and methylmercury are more toxic than other forms of the corresponding metal.1*
Synergistic effects such as those of cadmium and cyanide or of lead and chromium are just beginning to be recognized.5 Antagonistic effects such as those between selenium and arsenic, fluoride, mercury, or lead; cadmium and zinc or selenium? copper and zinc or molybdenum? and iron and manganese or zinc have only recently been observed. 5-8
Table 7.1 summarizes some of the known physiological effects of metals that are found in crude oils, refinery products, and used petroleum products.
In appraising the potential environmental hazards of metals found in petroleum, it is necessary to consider where they enter the environment, how they move in the environment, and how they might enter the food chain.
Metals applied to land are relatively immobile, particularly if the soil has a high pH and high organic content. Many complex physical-chemical processes affect metal mobility in soil. Lead and mercury, which form strong complexes, move very slowly. Zinc, cadmium, and copper move a little faster. Metal profiles in highly contaminated soil penetrate little below the 4-8 inch region even after 60 years.38
Accumulation of metals by plants grown on these highly contaminated soils depends on plant variety and soil conditions. In most cases, plants will not
PETROLEUM PRODUCTS AND BY-PRODUCTS 125
concentrate sufficient metal to pose a serious human or animal health problem. There are some exceptions, such as selenium. Often the metal uptake by plants can be reduced by proper soil management.
Metals introduced into surface waters again pose an unknown hazard. Water-quality criteria have been established to protect the populace (Table 7.2), but in many cases these standards are based on inadequate scientific data.
Most metals disposed of in surface water are rapidly removed from the aqueous phase at a rate largely dictated by the amount of sediment or suspended solids and eventually settle out. Once trapped in the sediment, they are relatively immobile; however, there will always be some freedom of movement of the metals between the sediment and the overlying water. Aquatic plants such as algae are excellent scavengers and concentrators of metals in surface waters. These plants are important to the lower end of the food chain, and serve as a source of metals; they can be passed up the food-chain ladder to the point where they ultimately serve man as a food. Contamination of groundwater is usually not a problem unless surface water enters the groundwater supply directly, e.g*> through a surface fault.
Metals lost to the environment as air pollutants pose a direct health hazard if inhaled or ingested; otherwise, they eventually enter soil or water and their mode of transport is dictated by these media.
We know that metals lost to the environment will not degrade. We also know they affect plant, animal, and human health; yet we are just beginning to relate environmental trace metals levels to health and disease patterns.
Relatively few recognized incidents of human- health problems have been attributed to metal contamination of the environment. Consumption of rice grown in cadmium-contaminated irrigation water is generally assumed to be the cause of the Japanese Itai-itai disease, but other factors such as nutritional deficiencies may have been important.1* Cadmium dissolved from galvanized-iron water pipes in soft-water areas has been linked to a higher incidence of hypertension and heart attacks.3 The Minamata Bay incident in Japan was caused by environmental organomercury contamination. Natural selenium contents of some alkaline soils are associated with many disease symptoms in humans and livestock.1*0 Vanadium air pollution is implicated by statistical studies in deaths from heart disease, hypertension, and digestive-system cancer.3 Nickel contamination is of concern because of its possible role in the higher incidence of lung cancer in urban populations.1*
Table 7.1
Physiological Effects of Metals Found in Petroleum Products Metal Unman Effects Animal Effects Plant Effects Toxicity Data
Antimony
Dermatitis, keratitis, conjunctivitis, and nasal septum ulceration by contact fumes or dust.9
Shortens lifespan when fed to rats and mice.10 Sb oxide caused pneumonitis and heart and liver damage.11
>0.1 g lethal oral dose in humans.
Arsenic
Dermatitis, bronchi-
1 3
tis, skin cancer. Damages the heart,llf kidney, nerves, and possibly the liver.16 GI symptoms in acute systemic poisoning.15
Counteracts the toxic effects of Se in rats and chickens.17 As(V) is nontoxic.18 Morphol. changes in blood? kidney damage.16
0.1 ppm AsC>2 reduces heterotrophic activity of freshwater micro-flora.19
Normal ingestion 0.1 mg/day. Toxic level 5-50 mg/day.20 Smallest fatal dose recorded 130 mg.12
Barium
Baritosis, a benign pneumoconiosis.21 Soluble salts highly toxic orally.12 Soluble salts are skin and mucous membrane irritants.15
Full strength Ba lubricant dispersant is a mild eye irritant.22 BaO and BaC03 caused paralysis.11
Poisonous to most plants.12 0.1 ppm Ba2 reduces heterotrophic activity of freshwater microflora. 19
LD50 diesel exhaust solids >10 g/kg (animals).21 LD50 (oral) Ba sulfonates,
3- 10 gAg.22 ld5o
(oral) Ba phenolates
4- 5 g/kg.2 Fatal
dose in humans >0.55 g BaCl2.23
126 THE ROLE OF TRACE METALS IN PETROLEUM
Boron
Cadmium
Chromium
Therapeutic use of H3BO3 and borax has caused fatalities.
CNS depressant and GI irritant. Boranes highly toxic. Cumulative poison.11
12
Cumulative poison. Pulmonary emphesema, hypertension, kidney damage.13 Cardiovascular disease.26 Interferes with Zn and Cu metabolism. Inhalation of 0.OS- 35 mg/m3 significantly reduced children's weight.16 GI symptoms.11
Dermatitis,15 ulceration of skin,11 perforation of nasal septum, chronic catarrh, emphysema, carcinogenesis when inhaled.13> 23 Cr(VI) extremely toxic.30 Not cumulative. Apparently essential in
17
glucose metabolism.
2, 500 mg/liter in drinking water inhibited animal growth.16
1 ppm present in many plant and animal tissues.12 Caries, anemia
and retarded growth in 17
rat. Maximum concentration in earthworms
near a highway, 115 2 7
ppm.
100 ppm recommended limit for fisheries.30
0.5-1.0 ppm in soil required for growth of fruit trees. 2.0
2
ppm possibly toxic. Prevents pitting of apples.3 Most B fertilizer used on al- falfa.2 5
Stunts growth of let-
9 o
tuce, radish, bean and turnip plants. Tomatoes, barley and cabbage more tolerant. Leaves accumulate excessive amounts when
solutions contain a 2 9
few tenths pg/ml.
5 ppm Recommended limit for irrigation water.30 Soils contg. 0.2-0.4% Cr are infertile.12 Toxic to some aerobic microbes at ppb level. A micronutrient. 31
H3BO3 fatal dose in adults 15-20 g and in infants 5-6 g.11
LD (oral) for rabbits 200-600 mg. LD50 CdO fume 500 mg/m3 for rats to 1,500 mg/m3 for monkeys.12
Normal ingestion 0.05 mg/day. Toxic level 200 mg/day.20 No ill effects from well water with 1.0-25.0 mg/ liter.16 LD (oral) K chromate in rabbits 1.9 g within 2 hr.12
PETROLEUM PRODUCTS AND BY-PRODUCTS 127
Table 7.1, continued
Metal Human Effects Animal Effects Plant Effects Toxicity Data
Cobalt Goitrogenic. Lung effects disputed. Dermatitis. No injury from Co2 (CO) s.1 * Affects heart and GI tract.ll* ^7Mg/day beneficial.2 Liver
2 9
and kidney damage.
Copper Antagonistic to Zn
toxicity.7 Not cumulative. Require 1-2 1 2
mg/day. Inhalation of Cu-contg. dust
causes lung and GI 12
disturbances.
Affects erythrocytes and liver. ** Skin and mucous membrane irritants.15
Essential nutrient. Polycythemia. Bone hyperplasia. Metaplasia in spleen, liver and kidneys. Hyperglycemia due
to reversible pan- 12
creatic damage.
Ingestion or inhalation caused hemochromatosis and lung and liver injury. 2 Limits: irrigation water, saltwater organisms, and freshwater organisms,
0.1, 0.05, and 0.02 3 0
ppm, respectively.
Essentiality not established.2 **
A micronutrient.31 Toxic to some aerobic microbes at ppb level.31 0.05 M Cu2+ inhibits root growth and 0.1 M stops germination of lettuce.32
Normal ingestion 0.002 mg/day; toxic level 500 mg/day.20 Co metal dust more toxic than salts in lung irritation; lethal dose of either relatively high.12 LD C02 (CO) 8 in ani^- mals by inhalation 100 ppm.12
Normal ingestion 2-5 mg/day; 65-130 mg CuSOif dangerous and 648-972 mg highly toxic.12 27 g CuSO^
fatal.11
128 THE ROLE OF TRACE METALS IN PETROLEUM
Iron
Siderosis (a pneumoconiosis due to Fe inhalation) .1 3
A micronutrient.31
Lead
Brain damage, convulsions, behavioral dis- 2 6
orders, death.
Pb naphthenate kills rabbits by skin absorption (death due to pneumonia).22
Cumulative poison in 3 0
vertebrates. Renal and vascular poison.12
2 +
0.1 ppm Pb reduces heterotrophic activity in microflora.19
Oral toxicity of Pb naphthenate 3.5-5.1 g/kg.22 Normal Pb ingestion 0.4 mg/day.12
Mangan¬
ese
Chronic Mn poisoning and/or Mn pneumonitis.13 Reduces Fe absorption.1** Requirement 3-9 mg/day. 2 Primarily a nerve toxin.12 CNS symptoms often result in permanent disability.15
Pathological effects on nerve cells and the liver.12 1.9-9.9 mg is thyroid inhibitor in rats.16
A key role in photosynthesis. 31
Mercury
Nerve damage and death.26
Detrimental to aquatic ecosystems at 0.005 ppm. 0
2 +
0.1 ppm Hg reduces heterotrophic activity of microflora.19
Normal ingestion 0.005-0.2 mg/day? toxic level 10 mg/ day.12
PETROLEUM PRODUCTS AND BY-PRODUCTS 129
Table 7,1, continued
Metal Human Effects Animal Effects
Molyb¬
denum
No indication of even
1 2
an industrial hazard. Not cumulative.11
Appears to have a reciprocal antagonism with Cu. Requirement in rats <0.5 mg/day.12 Low order of toxicity.15 No fatalities from molybdic oxide fumes for 25 one- hour exposures at 1.5 mg/ft air. Toxic to ruminants when fed in excess.3 3
Nickel
Rarely gives systemic toxic effects even from therapeutic doses (65-195 mg NiSOi* and 324-454 mg NiBr2). Dermatitis, respiratory disorder, carcinogenesis (nose and lung).13
Moderately toxic to . . 3 0
aquatic organisms.
Maximum Ni concentration in earthworms near a highway 38 ppm.27 Inhibits enzyme systems. Kidney damage (calf).17 1-3 mg/kg Ni compound causes intestinal disorders, convulsions, and asphyxia in dogs.11
Plant Effects
Toxicity Data
Essential to higher plants.12 Possible role in photosynthesis. 31
Ingestion of <500 mg/ day M0S2 nontoxic to animals. 8.1 mg M0S2/ ft3 nontoxic to guinea pigs. M0O3 at 5.8 mg/ ft3 very irritating with high mortality. M0O3 dust more toxic than fume.12
Can be very toxic depending on its chemical form.30 A micronutrient.31 0.01 ppm reduces the hetero- trophic activity of freshwater microflora. 19
Normal ingestion 0.3- 0.5 mg/day.12 30-73 mg NiSOif 6H2O toxic in humans.2 3
130 THE ROLE OF TRACE METALS IN PETROLEUM
2 6
Sele- May cause caries, nium Prevents teratogenic effects of Cd and As Affects kidneys, liver, marrow, and CNS. 3 ** Se compounds are potent skin and mucous membrane irritants. 1 5
Carcinogenic in large
doses in rats.26 Essen l ^
tial to mammals and
2 6
chicks in low doses. Teratogenic in chicks. "Blind staggers" and "alkali disease" in cattle and "white muscle disease" in sheep.12
Silver Argyria (impregnation of the tissues with Ag) following absorption from the GI tract or lung. I.v. injections of colloidal Ag fatal.12
Affects immunological capacity. Histopatho- logical changes in tis sues of encephalon and medulla of rabbits.16
2.5 mg/liter Se inhibits the BOD and growth of aquatic saprophytic micro- flora. 31*
Industrial selenosis symptoms when Se in air <0.2 ppm. 31f Liver damage in humans from 5-7 mg/liter in food.16 Liver cancer in animals from food containing 10 ppm Se.36 H2Se and Se02 more toxic than S analogs. ld by inhalation of SeOz 10 ppm for 2 hr.36 Normal ingestion 0.2 mg/day; toxic level 5 mg/day.20 Extreme tolerance limit in food (dry weight)
20 ppm.20
0.0001 ppm Ag+ reduces the heterotro- phic activity of microflora.1
PETROLEUM PRODUCTS AND BY-PRODUCTS 131
Table 7.1, continued
Metal Human Effects Animal Effects Plant Effects Toxicity Data
Tin
Little absorbed when ingested. Affects GI tract and CNS.1If Sn oxide dust produces benign pneumoconiosis. 37 Ingestion of organ- otin compounds causes acute cerebral edema and often death.15
Decreases longevity slightly when fed to rats and mice for life.
l o
Toxic to some aerobic microbes at ppb levels.31
500 mg/kg/day of SnCl2 for 14 months paralyzed a dog.16 LD50 (i.v.) R2SnCl2 (where R = <. Cs alkyl) 5-40 mg/kg rats. Trialkyltin salts are more toxic.11
Vana¬
dium
Cardiovascular disease, carcinogene-
• 13
sis. Mam toxic effects on respiratory system.12 V2O5 residues from fuels irritating to those who clean oil- fired burners, renew firebrick linings, and clean heat- exchanger tubes (dusts contain 6-20% V).12
Feeding 5 mg/liter V*** for life to rats gave no significant reduction in growth or longevity.16 Not carcinogenic in rats and mice.10
Essential for green algae. Stimulates higher green plants in small amounts.12
10 mg/kg fatal to rat.16 Sublethal doses 92-368 ppm. 49 yg/ml drinking water highly toxic.
0.205 mg/liter causes lung changes in animals. LD (i.v.) in humans 30 mg V2O5 as tetravana- date.12
132 THE ROLE OF TRACE METALS IN PETROLEUM
30
Zinc
Dermatitis, hypertension, arteriosclerotic 1 3
and heart diseases. 675-2,280 mg/liter is
emetic.
Causes min¬
eral loss from bones. Most Zn compounds not particularly toxic at
moderate concentra- 1 2
tions orally. Zn inhibits the teratogenic, embryocidal, and neo-plastic effects of Cd.
Essential.
16
i*f
Zn dithiophosphates are severe eye irritants.22 0.1-1.0 ppm lethal to fish and other aquatic animals.
Essential. 0.1 ppm Zn2+ reduces hetero- trophic activity of microflora.19
LDso (oral) Zn dithiophosphates 2.13-3.7 g/kg. LD50 (skin)
11.3 g/kg for rabbits (24-hr contact).
Mixed Mg-Zn phenolate LD50 (oral) 9.5 mg/ kg.22 LD50 (oral) ZnCl2 in guinea pigs, rats, and mice 200-350 mg/ kg. Normal ingestion Zn 10-15 mg/day.12
PETROLEUM PRODUCTS AND BY-PRODUCTS 133
134 THE ROLE OF TRACE METALS IN PETROLEUM
Table 7.2
Surface Water Criteria for Public Water Supplies*
Metal
Permissible Criteria (mg/l)
Arsenic
0.05
Barium
1.0
Boron
1.0
Cadmium
0.01
Chromium (hexavalent)
0.05
Copper
1.0
Iron (filterable)
0.3
Lead
0.05
Manganese (filterable)
0.05
Selenium
0.01
Silver
0.05
Zinc
5.0
*from Reference 39.
Complete assessment of the effects of chronic human exposure to low concentrations of physiologically active metals cannot be made until all the synergistic and antagonistic relations between metals and between metals and other environmental factors have been identified and understood.
There are two routes to developing the informational needs on the role of trace metals in health and disease. The first is to conduct fundamental studies on the physiological effects of metals and metal combinations. Such studies are extremely expensive and time-consuming and would require an almost infinite number of combinations of metals and chemical forms of metals if this approach were used.
The second approach is to use epidemiological studies to relate health and disease patterns statistically to known environmental contamination. Although this approach is fraught with possible misinterpretations, it is a valuable tool for identifying the important relations between environmental contamination and health and disease. Such studies would, however, take many years to complete and would require the use of virtually all available analytical resources
PETROLEUM PRODUCTS AND BY-PRODUCTS 135
to develop the needed data. Alternatively, a more practical method for obtaining needed information on environmental contamination is to identify sources and quantities of metals entering the environment and where they enter the environment.
METALS IN. CRUDE PETROLEUM AND PETROLEUM PRODUCTS
Efforts to develop standardized analytical procedure for measuring the metal content of petroleum products have been only partially successful; the literature is replete with inaccurate data. However, even allowing for substantial errors, available data indicate that petroleum products contain substantial quantities of metals.
Crude oil contains varying amounts of metals, depending on the source of the crude. As a general rule, the heavier the crude, the more metal is present. Table 7.3 identifies the elements found in crude oil and their range in concentration. Using the medians of the concentration ranges, one can calculate the total pounds of metal that may enter the environment each year in the United States as a result of crude-oil uses. The various products derived from crude oil are shown in Table 7.4.
The ultimate fate of metals in crude petroleum has never been determined. An assessment of available information indicates that the majority of the metal in the crude oil is retained in the bottoms that remain after distillation. A small amount of the metals is carried over in the various distillate fractions. The ranges of concentrations of metals found in five distillate fractions are shown in Table 7.5. Data recently reported for gasoline show ppm concentrations of silver (0.01-0.1), cadmium (0.01-0.05), copper (0.01-5), manganese (0.01-0.1), zinc (0.1-10), and lead (10-1,000) ppm.1*8
The gas-oil fraction, which is the last distillate fraction of crude oil that is recovered, is the feed to catalytic crackers. Metals such as iron, copper, nickel, and vanadium contained in this
Table 7.3
Metal Content in Crude Oils '
Meana or Median*
Concentration Range (ppm) Concentration (ppm)
Tons/Year (calculated from previous column)
Antimony
0.030-0.107
0.055 + 0.003a
31
Arsenic
0.046-1.11
0.263 + 0.007a
148
Barium
Small amounts in Texas crudes**3
—
—
Cadmium
—
0.03C
17
Chromium
0.0016-0.017
0.008 + 0.003a
4.8
Cobalt
0.032-12.751
1.71 + 0.11a
963
Copper
0.13-6.33
1.32 + 0.013
743
Iron
3.365-120.84
40.67 + 2.48a
22,900
Lead
0.17-0.31****
" 0.24b
135
Manganese
0.63-2.54
.1.17 ± 0.04a
659
Mercury
0.023-30
3.24 + 0.01b
1,820
Molybdenum
0.008-0.053**5
0.031b
17
Nickel
49.1-344.5
165.8 + 7.la
93,400
Selenium
0.026-1.396
0.53 + 0.044a
300
Silver
Traces in many crudes**3
—
Tin
Identified in Mexican crudes
—
Vanadium
4.0-298.5
88.55 + 0.42a
49,900d
Zinc
3.571-85.80
29.80 + 1.27a
16,800
Total
187,837.8
a
^from references 41 and 42.
from references in concentration range column.
^estimated from zinc content.
W. E. Davis estimated 17,000 tons/year emissions from burning residual fuel oil.**6
136 THE ROLE OF TRACE ELEMENTS IN PETROLEUM
PETROLEUM PRODUCTS AND BY-PRODUCTS 137
Table 7.4
Percentage Yields of Refined Petroleum Products From Crude Oil in the U.S. (1970)1
Product
%
Gasoline
45.3
Jet fuel
7.5
Ethane (including ethylene)
0.2
Liquefied gases
3.0
Kerosine
2.3
Distillate fuel oil
22.4
Residual fuel oil
6.4
Petrochemical feedstocks
2.5
Special naphthas
0.8
Lubricants
1.6
Wax
0.2
Coke
2.7
Asphalt
3.6
Road oil
0.3
Still gas
4.1
Miscellaneous
0.3
Shortage
-3.2
Table 7.5
Trace Metals
in Distillate
Fuels1*7
Fuel
V
Pb
Cu
Kerosines
0.0-3
0
CO
1
o
0-4
Diesel fuels
<0.01-0.5
<0.01-5.0
<0.01-1.0
Burner fuels
0-0.07
0-3.5
0.002-0.42
Aviation turbine fuels
<0.01-0.05
<0.05-2.0
<0.01-0.10
Gas turbine fuels
<0.01-0.10
<0.02-2.0
<0.01-0.10
138 THE ROLE OF TRACE METALS IN PETROLEUM
fraction poison the cracking catalysts•It9 A nickel equivalent* of <0.3 ppm is desired to insure good catalyst life and performance.
It appears that only a fraction of the metals found in the distillates comes from the crude oil.
A substantial portion is likely introduced during storage and handling.
Although the metals that could be added to the environment from distillates would appear to be substantial, the annual contribution to natural background levels would be small. A simple calculation, based on (a) the estimates of metal contents of crude oils consumed in the U.S. given in Table 7.3,
(b) the assumption that metals accumulate in only the top inch of soil/ and (c) the assumption that the metal is uniformly introduced over the geographical area of the U.S./ shows an increase in the soil metal content of 0.4 ppm.
The limited information available indicates/ however/ that probably 90% of the metals in crude oil are retained in the distillate bottoms/ residual
fuel oil and asphalt. These materials are a much more concentrated source/ and are distributed and used in a much smaller geographical area.
Approximately 38% of the residual fuel oil produced annually is burned in power plants.50 The remainder is used for a variety of other industrial and private uses. In industrial facilities a substantial fraction of the metals found in residual fuel oil is collected in the bottom ash and in fly ash produced during its combustion. Some of the more volatile metals and metal oxides are lost to the environment as vapors together with some of the very fine particulates/ which are difficult to collect. Again/ however/ no data presently available describe the ultimate fate of metals in residual fuel oils.
The bottom ash is used largely as aggregate for road construction/ concrete production/ and other similar purposes. Fly ash is of less commercial value and often is discarded directly to the environment.
The metals found in ash occur predominantly as the
*"Nickel equivalent" is a multiplier factor that describes the relative effect of iron, copper, nickel, and vanadium on cracking catalysts. The multipliers for the metals are nickel 1.0, copper 1.0, vanadium 0.2, and iron 0.1. Thus, a nickel equivalent of 0.3 ppm indicates that the sum of the metal concentrations times their multiplier factor should not exceed 0.3.
PETROLEUM PRODUCTS AND BY-PRODUCTS 139
oxides. Since these compounds are generally very susceptible to solubilization and leaching/ they have a ready mode of transport to surface waters.
Residual fuel oil, which can be characterized as a "liquid coal," has a much lower sulfur content than coal and, consequently, is in increasing demand as an energy source. Catalytic processes are being developed to reduce further the sulfur content of this material. These processes reportedly remove a large fraction (perhaps as much as 75%) of the residual metals.
Nickel and vanadium removed during catalytic processing will constitute a high-grade ore and could supply a substantial amount of the domestic demand for these metals. The U.S. consumption of nickel and vanadium in 1970 was estimated at 155,719 and 5,134 short tons, respectively.1 Crude oil, barsed on our estimate, contains up to 60% of the annual U.S. demand for nickel and nine times the annual demand for vanadium.
The largest percentage of metals in crude oil apparently collects in the asphalt fraction. This material is used primarily in road construction and for roofing. The available data on the metal contents of asphalt are shown in Table 7.6. The minimum and maximum amounts of metals per inch of asphalt per mile of two-lane highways are also shown in Table 7.6.
No data have been found on the amount of metal that leaches out of asphalt to enter the environment. Urban runoff, even from highly domestic areas, contains unexpected large quantities of metals.
Studies are needed to determine whether abrading of asphalt streets and roofs is a significant source of these metals.
USED PETROLEUM PRODUCTS
Although crude petroleum contains substantial quantities of metals, the largest sources of metals entering the environment from petroleum products are tetraethyl lead added to gasoline, metal compounds added to lubricants, and wear metals that accumulate in used lubricants. The fate of lead in gasoline has been studied extensively and will not be discussed here.
Lubricants produced in a refinery are high-grade products that retain little or no residual metal from the crude oil. The demand for improved performance characteristics for lubricants has been met by
140 THE ROLE OF TRACE METALS IN PETROLEUM
Table 7.6
Metal Content of Asphalt and Asphalt Concrete
Metal
Concentration in Asphalt1*5 (ppm)
Metal Content (Ib/in) of Thickness/Mile of Asphalt Concrete of Highwaya
Antimony
O'. 04-11.0
0.004-1.0
Chromium
0.5-3.6
0.04-0.3
Cobalt
0.05-0.14
0.004-0.01
Copper
0.5-11.1
0.04-1.0
Manganese
0.3-0.4
0.03-0.04
Molybdenum
2.8-10.1
0.2-0.9
Nickel
86-104
7.7-9.3
Vanadium
14-200
1.2-17.8
Zinc
0.4-1.8
0.4-0.2
aBased on 24-ft. wide asphalt pavement containing 6% asphalt (94% aggregate) with a pavement density of 140 lb/ft.3
developing additives that prolong the useful life of lubricants. These additives encompass a wide range of chemical compounds, including metal salts added to reduce wear, resist oxidation, inhibit corrosion, and function as detergents, bactericides, antistatic agents, etc.
We were not able to develop complete data on how much of each compound is added to lubricants.
The additives are sold as a package by a few firms and are designed for an individual consumer.
Table 7.7, however, shows some of the types of metal- containing additives now in use.
The other major sources of metals in waste lubricants are those resulting from wear or use. The disposal of waste lube oils has been recognized as a potential pollution problem for many years. However, not until 1966 was the first attempt made to bring the problem into focus: service stations throughout
the United States were surveyed to determine how they disposed of their waste automotive oils. The results of that survey led to a better awareness of the pollution potential of used lubricants and to the eventual formation of an American Petroleum Institute Task Force on Used Oil Disposal.
Table 7.7
Lubricant Additives*
Metal
Representative Compounds
Purpose
Antimony
Sb dialkyl dithiocarbamates
Antiwear, extreme pressure, and antioxidant additives in conventional and low-ash-type automotive crankcase oils, industrial and automotive gear oils, greases (amounts <_1-3%)
Barium
Ba diorgano dithiophosphates Ba petroleum sulfonates Ba phenolates
Ba phosphonates or thiophosphonates
Corrosion inhibitors, detergents, rust inhibitor, automatic transmission fluids, greases
Boron
Borax, boric acid esters
Antiwear agents, antioxidant, deodorant cutting oils, greases, brake fluid
Cadmium
Cd dithiophosphates
Steam turbine oils
Chromium
Cr salts
Grease additive
Lead
Pb naphthenate
Extreme pressure additive, greases, gear oils
Mercury
Organic mercury compounds
Bactericide, e.g.j cutting oil emulsions
Molyb¬
denum
M0S2-M0 dibutyl dithiocarbamate and phosphate
Greases, extreme pressure additives
Nickel
Cyclopentadienylnickel complexes
Antiwear agents, minimize carbon deposits, improve lubrication and combustion
Selenium
Selenides
Oxidation and bearing corrosion inhibitors
Tin
Organotin compounds
Antiscuffing additive, metal deactivators
Zinc
Zn diorgano dithiophosphates Zn dithiocarbamates Zn phenolates
Antioxidant, corrosion inhibitors, antiwear additives, detergent, extreme pressure additives, in crankcase oils, hypoid gear lubricants, greases, aircraft piston-engine oils, turbine oils, automatic transmission fluids, railroad diesel engine oils, differential and wet brake lubricants
*from References 51-54
PETROLEUM PRODUCTS AND BY-PRODUCTS 141
142 THE ROLE OF TRACE METALS IN PETROLEUM
Each year some 2.5 billion gallons of lubricants are sold in the United States.55 Table 7.8 gives a breakdown of lubricant uses. Eventually, large quantities of these lubricants are disposed of as. wastes, although how much, exactly, is hard to determine. One American Petroleum Institute estimate is that about 450 million gallons of waste automotive oils are disposed of annually in the United States; other estimates range as high as 750 million gallons per year.55 The disposal of so much material, whatever the exact figure, is obviously important because of its pollution potential.
Table 7*8
U.S. Consumption of Lubricating and Oils and Greases: 1971*
Industrial
Greases (lb)
Oils (gal)
Automotive
456,104,000
1,084,819,000
Aviation
15,950,000
Industrial lubricating
503,270,000
734,792,000
Other industrial oils
390,872,000
Total (excludes exports)
959,374,000
2,226,433,000
*from reference 56
Only one comprehensive study of waste lubricant disposal has apparently been done.57 This study, by Arthur D. Little, Inc., showed the ultimate fate of used automobile oil in the State of Massachusetts (Table 7.9).
Reprocessed oil includes used oil re-refined and oil partially cleaned and used for fuel oil.
The data on reprocessed oil, if accurate for Massachusetts, are not representative of national practices. It is estimated that the 1972 U.S. re-refining capacity was only 100 million gallons,55 or less than 4% of the U.S. consumption.
PETROLEUM PRODUCTS AND BY-PRODUCTS 143
Table 7.9
Disposal of Waste Automobile Oil*
Means of Disposal
Percentage
Reprocessed for fuel oil
36.6
Road oil use
11.4
Taken out of state
8.1
Dumped on ground at source
22.8
Dumped into sewer at source
0.8
Farm use
2.4
Fate unknown
17.9
. *from Reference 57
Disposal of used lubricants on roads or on parking lots continues to be a wide practice, even though the Environmental Protection Agency has recently demonstrated that waste lubricants are only marginally effective as a means of dust control on dirt or gravel roads. Of more environmental importance, however, is the fact that this material is high in emulsifiers and resistant to oxidation under atmospheric conditions.12 Thus, during storms it is often washed off the road into the ground.
If waste-lubricant disposal is subdivided into two general categories—dumping and reprocessing—it appears that as much as three-fourths of the nation’s used automotive oils may be disposed of by dumping.
Table 7.10 shows the typical metal content of used automobile engine oil. On the basis of an estimate of 1.1 billion gallons of lubricant used for this purpose,61 we have calculated the quantity of metals entering the environment from waste automotive oil. The 29,000 tons of lead calculated to be found in waste lubricants amounts to only 10% of the lead added to gasoline each year.39
About the same amount of lubricant is used by industry for such purposes as machining oil (grinding, milling, cutting, and turning); hydraulic lifts; and lubricants in cold strip rolling. Many of these industrial lubricants also serve as coolants. These materials run the gamut from high water-to-oil emulsions to esoteric water-soluble oils. These oils are commonly used several times and have life cycles varying from a few days to several weeks.
144 THE ROLE OF TRACE METALS IN PETROLEUM
Table 7.10
Metals in Used Engine Oils*
Lb/10* Gal
In Combustion
Total Amounts
Products of
Used
Used Jet
In Automotive
Crankcase
Reciprocating
Engine
Lubricants
Metal Drainingsa
Engine Oilsb
Oilsc
(short tons)&
Barium
3,000
—
—
1,650
Boron
130
—
—
72
Chromium
180
53
22
99
Copper
120
103
67
66
Iron
2,200
245
210
1,210
Lead
53,000
24,000e
142
29,150
Nickel
50
10.7
8.6
28
Silver
—
12.3
10.5
—
Tin
71
15
2-15
39
Zinc
3,400
—
1,870
*from References 59 and 60. a 23
Average of nine cities. From data compiled and published ^by Walter C. McCrone Associates, Inc., Chicago, Illinois.
Average, three to five samples (Air Force data).2** ^Average, 13 to 17 samples (Air Force data).2**
Based on Column 1.
@
Mean of range medians.
Insufficient data on metal content of these waste oils are available since modes of usage are so varied. It is apparent, however, that the metal content of these materials can be very high.
Increasingly industries are often reprocessing and recycling their own oily waste in-house. Where recycling is practiced, the metal contaminants are separated, probably lagooned, and land-disposed or returned to surface waters.
To summarize, there simply are not enough reliable data on the total amount of metal lost to the environment each year from processing, use, and disposal of petroleum products. We know that it is large, but one must keep the problem of environmental contamination in perspective.
PETROLEUM PRODUCTS AND BY-PRODUCTS 145
We are still in the early stage of understanding the relationship of most metals to human health.
Until we have greater knowledge, we must be cautious about contaminating the environment with any metals until we gain a better understanding of their physiological role, their mode of transport in the environment, and their pathways to the food chain.
REFERENCES
1. Bureau of Mines Staff, Minerals Yearbooks Vol. I, Metals, Minerals, and Fuels 1970, Bureau of Mines, U.S. Department of the Interior (Washington, D.C.: U.S. Government Printing Office, 1972), pp. 783, 822, 888, and 1163.
2. Underwood, E. J., Trace Elements in Human and Animal Nutrition (New York: Academic Press, 1971).
3. Shroeder, H. A., Pollution, Profits and Progress (Brattle- boro, Vermont: The Stephen Green Press, 1971).
4. Lee, D. H. K., ed., Metallic Contaminants and Human Health (New York: Academic Press, 1972).
5. Stokinger, H. E., Am. Ind. Hyg. Assoc. J., 30 (3), 195 (1969) .
6. "Huge Check on Chemicals as Carcinogens," Chem. Eng. Hews, 50 (2), 6 (1972).
7. O'Dell, B. L. in Proceedings, University of Missouri rs 1st Annual Conference on Trace Substances in Environmental Health, Columbia, Missouri, July 10-11, 1967 (1968),
pp. 134-140.
8. Snively, W. D., Jr., and B. Becker, Ann. Allergy, 26,
233 (1968).
9. Stecher, P., M. J. Finkel, 0. H. Siegmund, and B. M. Sza- franski, eds. The Merck Index of Chemicals and Drugs, 7th ed. (Rahway, New Jersey: Merck and Company, Inc., 1960).
10. Schroeder, H. A., Arch. Environ. Health, 21,19Q (1970).
11. Sax, N. I. Dangerous Properties of Industrial Materials,
2nd ed. (New York: Reinhold Publishing Corporation, 1963).
12. Browning, E., Toxicity of Industrial Metals (London: Butterworths & Company, 1961).
13. Hwang, J. Y., Anal. Chem., 44 (14), 20A (1972).
14. Louria, D. B., M. M. Joselow, and A. A. Browder, Ann. Internal Med., 76, 307 (1972).
15. Gafafer, W. M., ed., Occupational Diseases, A Guide to Their Recognition, U.S. Department of Health, Education, and Welfare, Public Health Service (Washington, D.C.:
U.S. Government Printing Office, 1964).
16. Arthur D. Little, Inc., Water Quality Data Book, Vol. 2, Inorganic Chemical Pollution of Freshwater, Water Pollution Control Research Series, Environmental Protection Agency (Washington, D.C.: U.S. Government Printing Office, 1971).
146
THE ROLE OF TRACE METALS IN PETROLEUM
17. Lisk, D. J., in Advan. Agron., Vol. 24 (New York: Academic Press, 1972), pp. 267-325.
18. Scanlon, J., Clin. Pediatrics (Philadelphia), 11, 135 (1972).
19. Albright, L. J., J. W. Wentworth, and E. M. Wilson, Water Res., 6, 1589 (1972).
20. Bowen, H. J. M.> Trace Elements in Biochemistry, (London: Academic Press, 1966).
21. Miner, S., "Air Pollution Aspects of Barium and Its Compounds," National Technical Information Service Document PB 188 083, 1969.
22. Dooley, A. E., Arch. Environ. Health, 6, 30 (1963).
23. Taylor, F. B., J. American Water Works Assoc., 63 (11),
728 (1971).
24. Sauchelli, V., Trace Elements in Agriculture (New York:
Van Nostrand Reinhold, 1969).
25. Murphy, L. S., and L. M. Walsh, in Micronutrients in Agriculture, J. J. Mortvedt, P. M. Giordano, and W. L. Lindsay, eds. (Madison, Wisconsin: Soil Science Society of America, Inc., 1972), p. 347.
26. "Trace Metals: Unknown, Unseen Pollution Threat," Chem.
Eng. News, 49 (29), 29 (1971).
27. "Earthworms High in Metals," Chem. Eng. News, 50 (41), 60 (1972).
28. John, M. K., C. J. VanLaerhoven, and H. H. Chuah, Environ. Sci. Technol., 6 (12), 1005 (1972).
29. Page, A. L., F. T. Bingham, and C. Nelson, J. Environ. Quality, 1 (3), 288 (1972).
30. Sartor, D., and G. B. Boyd, "Water Pollution Aspects of Street Surface Contaminants," Environmental Protection Technology Series, EPA-R2-72-081 (November 1972).
31. Lanford, C. E., Oil Gas J., 67 (13), 82 (1969).
32. Mukherji, S., and B. D. Gupta, Physiol. Plant., 27, 126 (1972).
33. Bunch, L. D., and C. S. Reusch, J. Kansas Med. Soc., 69 (7), 339 (1968).
34. Pletnikova, I. P., Gig. Sanit., 35 (2), 14 (1970); Hygiene and Sanitation, 35 (1-3), 176 (1970).
35. Lemley, R. E., and M. P. Merryman, J. Lancet, 59 (11 New Series), 435 (1941).
36. Hoffman, I. (Symposium Chairman), "International Symposium on Identification and Measurement of Environmental Pollutants," National Research Council, Ottawa, Canada (1971).
37. Pendergrass, E. P., and A. W. Pryde, J. Ind. Hyg. Toxicol., 30 (2), 119 (1948).
38. Lagerwerff, J. V., U.S. Department of Agriculture, personal communication, 1973.
39. Hall, S. K., Environ. Sci. Technol., 6 (1), 31 (1972).
40. "And Now, Cadmium," Time, 97 (10), 35 (1971).
41. Shah, K. R., R. H. Filby, and W. A. Haller, J. Radioanal. Chem., 6, 185 (1970).
PETROLEUM PRODUCTS AND BY-PRODUCTS 147
42. Shah, K. R., R. H. Filby, and W. A. Haller, J. Radioanal. Chem., 6, 413 (1970).
43. Thomas, w. H., Inorganic Constituents of Petroleum,, Science and Petroleum, Vol. 2, A. E. Dunstan, ed. (New York:
Oxford University Press, 1938) p. 1053.
44. Bratzel, M. P., Jr., and C. L. Chakrabarti, Anal. Chim.
Acta, 61 (1), 25 (1972).
45. Colombo, U. P., G. Sironi, G. B. Fasolo, and R. Malvano, Anal. Chem., 36 (4), 802 (1964).
46. Davis, W. E., and Associates, "National Inventory of Sources and Emissions. Arsenic, Beryllium, Manganese, Mercury and Vanadium. 1968. Vanadium. Section V,"
Report for Environmental Protection Agency, Office of Air Programs (1971).
47. Ward, C. C., "Survey of Trace Metals in Distillate Fuels," presented at the Symposium of Gas Turbine Fuel Requirements, Handling and Quality Control, June 28-29, 1972, Los Angeles, California.
48. Lee, R. E., Jr., and D. J. von Lehmden, J. Air Pollution Control Assoc., 23 (10), 853 (1973).
49. John Winters, American Oil Company, personal communication (August 1973).
50. Davis, W. E., and Associates, "National Inventory of Sources and Emissions, Arsenic, Beryllium, Manganese,
Mercury and Vanadium 1969. Selenium. Section IV,"
Report for Environmental Protection Agency, Office of Air Programs, 1971.
51. Smalheer, C. V., and R. Kennedy Smith, Lubricant Additives (Cleveland, Ohio: Lezius-Hiles, 1967).
52. Farmer, H. H., B. W. Malone, and H. F. Tompkins, Lubrication Eng., 23 (2), 57 (1967).
53. Sullivan, R. J., "Air Pollution Aspects of Nickel and Its Compounds," National Technical Information Service, PB 188 070, 1969.
54. Asseff, Peter A., Lubrication Eng., 23 (3), 107 (1967).
55. American Petroleum Institute, "Waste Oil Roundup, No. 1," Committee on Disposal of Waste Products, Division of Marketing, API, Washington, D.C. (1972).
56. Bureau of the Census, "Sales of Lubricating and Industrial Oils and Greases, 1971," in "Current Industrial Reports," U.S. Department of Commerce (October 1972).
57. Arthur D. Little, Inc., "A Study of Waste Oil Disposal Practices in Massachusetts," A Report to the Commonwealth of Massachusetts, Division of Water Pollution Control, January 1969.
58. Pendleton, Harold E., Manager, Environmental Services Committee on Public Affairs, American Petroleum Institute, Washington, D.C., personal communication (December 7, 1972). Booth, G. T., Jr., "The Oil Company's Partner in Proper Service Station Waste Oil Disposal—the Collector and Rerefiner," Presented at the National Fuels and Lubricants Meeting, September 14-15, 1972, New York, N.Y.
59.
148 THE ROLE OF TRACE METALS IN PETROLEUM
60. Reeves, R. D., C. J. Molnar, M. T. Glenn, J. R. Ahlstrom and J. D. Winefordner, Anal. Chem. > 44 (13), 2205 (1972)
61. "Waste Lube Oils Pose Disposal Dilemma," Environ. Soi. Tedhnol.y 61 (1), 25 (1972).
CHAPTER 8
TRACE ANALYSIS OF IRON, NICKEL, COPPER AND VANADIUM IN PETROLEUM PRODUCTS
A. J. Smith, J. 0. Rice, W. C. Shaner, Jr. and C. C. Cerato
Sun Oil Company P.O. Box 1135 Marcus Hook, Penn.
The significant effect of traces of iron, nickel, copper and vanadium in petroleum feedstocks on processing economics has been responsible for the continuing attention focused on improvements in trace metal analytical procedures. This interest has intensified in our company because of the wide variety of crude oils now processed coupled with the need to meet more stringent contamination factors. These needs have increased demands on our laboratories for routine analyses at levels of less than 1 ppm. As a consequence our group was asked to evaluate requirements for trace metal analysis and to determine to what extent methods presently described in the literature could be adapted to our needs.
Since a standard Philips X-ray spectrograph and a Perkin-Elmer 403 Atomic Absorption spectrophotometer were available to us, we evaluated procedures using these techniques after incorporating a number of improvements suggested in the literature. It should be noted at this point, however, that these instrumental techniques did not always yield the quality of analytical results that might be expected. Our purpose in presenting somewhat imperfect data is to give a realistic view of what might be expected when the samples do not conform to the techniques at hand.
Attention was first given to possible improvement of our routine XRF methods. Of the number of methods in the literature dealing with XRF analysis the work of three groups shown in Table 8.1 was of particular interest. The first paper by the group from Gulf1
149
150 THE ROLE OF TRACE METALS IN PETROLEUM
Table 8.1
Analysis of Three XRF Analytical Methods
Author
Metals
Sample Preparation
XRF Measurement
J. E. Shott,
Ni,
V
Ash 10-g sample with
Measure NiKa/CoKB
et al.
3 g benzene sulfonic
and VKa/CoKg in
acid and Co internal
ash on filter
standard.
disk.
W. A. Rowe,
Ni,
V
Ash 50-g sample with
Paste ash to
et al.
Fe,
Cu
xylene sulfonic acid
mylar film and
and cobalt internal
measure Ka first
standard.
order line of Co, Cu, Fe, Ni and V.
J. G. Bergmann,
Ni,
V
Ash 10-g sample with
Count each ele¬
et al.
Fe
sulfur. Dissolve
ment for 100 sec
residue and absorb metals on ion exchange disk.
using Ka line.
served as an excellent starting point for the analysis of trace metals by XRF. These workers reported that losses of volatile porphyrins could be obviated by ashing in the presence of benzene sulfonic acid, and they suggested that addition of cobalt as an internal standard for ashing would enhance reproducibility.
The next paper by Rowe and Yates2 described an extension of the above method that included Cu and Fe as well as Ni and V with improved precision for the analysis of nickel.
In a more recent account Bergmann3 and co-workers adapted the use of sulfur as a reagent to reduce porphyrin loss during combustion, thus obviating iron contamination from benzene sulfonic acid. Also described was a procedure for the concentration of metals on a suitable disk of ion exchange paper.
This technique offered a distinct advantage in that the thin layer gives a high yield of secondary emission. Also the background scatter is reduced because the sample consists of metals only on the disk. Using XRF further refined with curved crystal optics they reported good accuracy and precision for nickel and vanadium in synthetic unknowns ranging from 0.1 to 1 ppm.
IRON, NICKEL, COPPER AND VANADIUM ANALYSIS 151
In this paper we will describe our effort to evolve a method that would incorporate such features as:
1. applicability to standard instrumentation
2. applicability to Fe, Ni, Cu and V
3. use of an internal standard
4. use of a 10-g sample
Initially for routine work we adopted the Bergmann method. Table 8.2 shows the results of our analysis of a synthetic unknown prepared by diluting Boscan crude 650 bottoms in 94 Golden oil. Considering that the calculated value was based on the average of analyses from a number of laboratories that used a variety of methods for analysis we found the agreement with the expected value reasonable. However, we thought that our precision might possibly be improved if mechanical loss due to ashing could be compensated by the use of an internal standard.
Table 8.2
XRF Analysis of Boscan Crude 650 Bottoms Diluted with Transformer Oil
Metal
Expected
Found
a
DF
Fe
1.76
1.52
0.35
4
Fe
3.44
2.72
0.35
4
Ni
1.56
1.82
0.15
4
V
1.65
1.54
0.33
5
Cu
1.50
1.76
0.33
5
Cu
1.40
1.16
0.33
5
Ni
0.34
0.48
0.28
4
V
0.37
0.21
0.05
4
Cu
0.30
0.50
0.08
3
Table 8.
3 demonstrates the use
of an
internal
standard when
the X-ray
intensities
of Fe,
Ni, Cu
and V are measured relative to cobalt on ion exchange disks. These samples were derived from solutions of pure salts prepared for calibration. The half disk measurements give an indication that the ratios do not change significantly when only one- half the amount of metal is available for measurement. If these measurements were derived from 10-g samples, agreement would be quite adequate.
Table 8.3
Effect of Internal Standard on Ion Exchange Separation
vg*
Added
__ Fe
Ni
C&L- _
Ratio ]ig
V
Ratio
W
Ratio
vg
Ratio
vg
Whole disk
4
0.145
5.2
0.246
3.5
0.695
3.7
0.550
4.1
Half disk
0.154
7.3
0.305
4.9
0.902
6.8
0.743
7.2
Whole disk
12
0.232
12.5
0.569
11.0
1.196
11.3
1.041
12.1
Half disk
0.243
13.4
0.590
11.6
1.321
13.2
1.131
13.6
Whole disk
20
0.329
20.8
0.931
19.6
1.777
19.8
1.314
20.2
Half disk
0.307
17.0
0.817
17.0
1.864
21.1
1.609
21.8
*Added as solutions of pure salts
152 THE ROLE OF TRACE METALS IN PETROLEUM
IRON, NICKEL, COPPER AND VANADIUM ANALYSIS 153
Table 8.4 shows the results that were obtained by analyzing trace metals on ion exchange disks. Since these disks were prepared by treatment with solutions of metal salts of known concentration, the precision data give an estimate of the error associated entirely with the ion exchange and measurement steps of the method.
Table 8.4
Recovery of Metals on Ion Exchange Disk Using Internal Standard
Level Ni Cu V Fe
\ig Added*
X
a
X
a
X
a
~T
a
4
3.94
0.069
4.39
0.71
4.28
0.094
3.90
0.52
Q
8.29
0.25
8.35
0.86
8.29
0.22
7.70
0.75
12
12.40
0.25
12.82
0.82
12.26
0.24
11.84
1.20
16
16.32
0.35
16.43
0.58
16.08
0.37
15.14
2.16
20
20.01
0.53
20.63
0.73
17.88
0.26
18.97
2.14
*Added as solutions of pure salts.
X = mean values from five determinations expressed in micrograms.
Table 8.5 shows the results that were obtained by analyzing a synthetic unknown prepared by diluting a Conostan D-20 standard in a mixture of 94 and 96 Golden oil. We chose this system because we felt that we could evaluate the accuracy of our data with greater reliability. As it turned out, we determined that the method becomes insensitive around the 0.1 ppm level. We also noted that the vanadium results were much lower than expected. Since we expected that the vanadium might be volatilized during the ashing step, we prepared a synthetic unknown using our analyzed sample of Boscan 650 bottoms. Our results showed better recovery of vanadium, which to us indicated that Conostan vanadium might be somewhat volatile.
Our results also serve as a reminder that although the use of an internal standard can offer some protection against mechanical losses, it cannot compensate for losses of metal due to the volatility of
154 THE ROLE OF TRACE METALS IN PETROLEUM
the compound itself. Our results give further support to the axiom that the principal sources of error are always associated with combustion.
Table 8.5
XRF Analysis of a Synthetic Unknown* Using an Ion Exchange Disk with an Internal Standard
1.00 ppm Level
a
0.5 ppm Level
a
Ni
0.77
0.24
0.45
0.12
Cu
1.22
0.45
0.66
0.26
Fe
0.61
0.21
0.34
0.10
V
0.36
0.14
0.26
0.16
*Conostan D-20 Standard in a mixture of 94 and 96 Golden oil.
ATOMIC ABSORPTION
Because atomic absorption enables direct analysis without the need of a concentration step it held promise for metals ranging from 0.1 to 1 ppm. Table 8.6 shows the absorbances obtained for nickel in a synthetic unknown prepared from Boscan crude by the method of Slavin and Trent.1* An air-acetylene flame afforded convenient combustion, and absorption at the 2316 non-absorbing line was subtracted from the sample absorbance observations to correct for background absorption. The observations were made at the 100 average mode using the Nixie tube digital readout.
Figure 8.1 shows how these data were used to calculate the nickel content of the synthetic unknown by the standard addition procedure. Although these data gave adequate results we found that the experiment was difficult to repeat since the background absorbance has a tendency to increase with the amount of nickel added.
Table 8.7 shows the results of our analysis of Fe, Ni, Cu and V in MIBK. These solutions were prepared by diluting Conostan standards in MIBK only.
The precision and the accuracy of these analyses indicate the optimum since no correction for background
IRON, NICKEL, COPPER AND VANADIUM ANALYSIS 155
was necessary. The standard addition calibration curves were all quite linear. The most irregularity occurred for vanadium, where nitrous oxide-acetylene combustion was used.
Table 8.6
Atomic Absorption Analysis of Trace Nickel by Standard Additiona
]ig NiP
Added per ml
Absorbance at 2320A
Absorbance at 2316A
0
0.028
0.014
0.05
0.031
0.014
0.10
0.035
0.015
0.20
0.041
0.013
0.30
0.050
0.016
a from Reference 4.
b Boscan 650°F fraction in 92 Golden oil.
Figure 8.1. Analysis of trace nickel in Boscan crude, synthetic unknown.
156 THE ROLE OF TRACE METALS IN PETROLEUM
Table 8.7
AA Analysis of Fe, Ni, Cu and V in MIBK by Standard Addition
ppm Expected*
Fe
Ni
Cu
V
0.25
0.20,0.18
0.25,0.20
0.23,0.20
0.18,0.25
0.50
0.38,0.40
0.40,0.25
0.45,0.45
0.25,0.45
0.75
0.70,0.70
0.55,0.50
0.70,0.70
0.65,0.60
1.00
1.00,0.90
0.75,1.00
0.95,0.93
1.00,1.00
*Conostan D-20 Standard diluted in MIBK.
Table 8.8 shows the background absorption of three hydrocarbons considered as matrixes for the preparation of synthetic unknowns. This study came about as a result of an attempt to analyze Fe, Ni,
Cu and V in polyisobutylene from 0.1 to 1.0 ppm.
All the results were low except vanadium. Samples containing only the matrix and solvent showed a negative absorbance at the Fe, Ni, and Cu wavelengths. The vanadium setting (nitrous oxide flame) showed a zero absorbance.
Table 8.9 shows the analysis of the synthetic unknowns prepared in polyisobutylene. All four metals were analyzed using a nitrous oxide-acetylene flame. All the standard addition curves were linear; since combustion of the petroleum matrixes with nitrous oxide showed no effect we felt justified in not including a background correction at the non-absorbing line.
Table 8.10 shows the results obtained using the nitrous oxide combustion techniques. For the Boscan sample there was a pronounced difference in the quality of data between the iron and copper analyses. The linearity of the standard addition curves for copper is reflected by the precision and the agreement with the expected value. The absorbance value obtained for iron, on the other hand, yielded erratic data points when plotted for the standard addition calculation.
We are not able to explain the value of 0.05 ppm for nickel except to say that the data points of the calibration curve from which the value was derived were much more irregular than was the case for the 0.40 and 0.48 values.
Table 8.8
Atomic Absorption Background Effects of Petroleum Compounds
Fe
NI
Cu
V
Wavelength
Wavelength
Wavelength
Wavelength
= 2483A
= 2320A
= 3247A
= 3184A
MIBK Xylene
MIBK Xylene
MLBK Xylene
MIBK Xylene
Propylene tetramer
-0.005
-0.052
-0.011
-0.048
-0.001
0.018
0.000
0.000
Polyisobutylene
-0.003
-0.036
-0.010
-0.036
0.000
-0.012
0.000
0.000
SunVis 7
0.000
-0.045
-0.008
-0.039
0.003
-0.010
0.000
0.000
IRON, NICKEL, COPPER AND VANADIUM ANALYSIS 157
158 THE ROLE OF TRACE METALS IN PETROLEUM
Table 8.9
Atomic Absorption Analysis of Fe, Ni, Cu and V in Polyisobutylene by Nitrous Oxide Combustion
Expected
Value*
Fe
Ni
Cu
V
0.25
0.50
0.75
1.00
0.10,0.30
0.38,0.60
0.70,0.68
0.93,0.90
0.05,0.30
0.45,0.65
0.50,0.65
0.95,1.00
0.10,0.20
0.48,0.45
0.70,0.75
0.88,1.00
0.30,0.18
0.40,0.43
0.60,0.65
0.75,0.88
♦Trace metals
added as Conostan Standard.
Table 8.10
Atomic Absorption Analysis of Fe, Ni, Cu and Petroleum Products Using Nitrous Oxide Combustion
V in
Bosoan ppm Fe
u
ppm Cu
650
ppm Ni
BTMS*
ppmV
1
0.10
0.45
0.40
0.25
2
0.00
0.55
0.48
0.25
3
0.05
0.50
0.05
0.30
X
0.05
0.50
0.31
0.28
Exp
0.26
0.46
0.50
0.90
*Neill S/Odom Line Crude
The precision of the vanadium results was acceptable. The standard addition curves were linear, and since the expected value is based on a single determination its accuracy is suspect.
IRON, NICKEL, COPPER AND VANADIUM ANALYSIS 159
CONCLUSION
An attempt has been made to give a realistic account of our recent experience with AA and XRF for the analysis of Fe, Ni, Cu and V at the sub ppm level in typical petroleum products. While other workers have reported more precise results determined under certain restricted conditions, our results indicate that precise analysis at low levels is still not always possible. For XRF the concentration step still is a predominant source of error, while for atomic absorption matrix interference continues to impede sensitive metal detection. We call attention to these shortcomings first to encourage other workers to bring about improvement and second to alert those who are recipients of such analyses to be aware of the sources of error associated with such data.
REFERENCES
1. Shott, J. E., Jr., T. J. Garland and R. 0. Clark. Anal. Chem. 33, 507 (1961).
2. Rowe, W. A. and K. P. Yates. Anal. Chem. 35, 368 (1963).
3. Bergmann, J. G., et al. Anal. Chem. 39, 1258 (1967).
4. Trent, D. and w. Slavin. Atomic Absorption Newsletter,
3, 131 (1964).
This Page Intentionally Left Blank
CHAPTER 9
THE OCCURRENCE OF MOLYBDENUM IN PETROLEUM
William K. T. Gleim, John G. Gatsis and Chester J. Perry Universal Oil Products Company Des Plaines, Illinois
Molybdenum occurs in petroleum, and has been found in some crudes, atmospheric tower bottoms and vacuum tower bottoms by emission analysis. We used this method in the beginning, but later switched to atomic absorption, which is more reliable. The small est amount of molybdenum that can be determined by this method is 0.4 ppm. Therefore, it can be found more readily in vacuum or atmospheric tower bottoms of crudes with a low content of molybdenum. The analytical methods are described at the end of this chapter.
The data presented in Table 9.1 are the averages of five determinations. We have found molybdenum in four crudes—Athabasca Tar Sand Oil, Cold Lake, Lloydminster and Boscan. The first three are probably related geologically, the amount of molybdenum found in them decreasing with the increase in depth at which these crudes are found. By far the highest concentration occurs in Athabasca Tar Sand Oil, where most of the molybdenum seems to occur organically bound, as evidenced by the recovery of 70% of the molybdenum in the organic soluble fraction (see Figure 9.2). We have not investigated the nature of the organic complexing compounds complexing the molybdenum. Its presence in marine deposit1 has been documented recently.
The occurrence of molybdenum in petroleum is too low to be of any consequence to refining. Molybdenum accompanies iron in several enzyme systems xanthine oxidase, aldehyde oxidase, nitrate reductase and nitrogenase. These enzyme systems catalyze electron transfer. The most probable source
161
162 THE ROLE OF TRACE METALS IN PETROLEUM
Table 9.1
Molybdenum Determinations
ppm Mo
Crudes
Athabasca Tar Sand Oil
10
Cold Lake
7.3
Lloydminster
3.3
Boscan
4.6
Atmosphere Bottoms
Lagunas
0.7
Minas
-
Souedieh
3.9
Kuwait
<0.4
Vacuum Bottoms
Wyoming Pipeline
1
West Texas
0.5
Poza Rica
4
Murbane
<0.4
Gach Saran
<0.4
of these enzyme systems is the nitrogen-reducing bacteria, which were carried in the oil-bearing strata by surface water percolating through the surface oil. The deeper the oil layer, the more the water was filtered and freed of bacteria by absorption through the soil; and the fewer the bacteria carried into the oilbearing formation, the lower the molybdenum content of the oil. That is the reason why the Athabasca Tar Sands, which are close to the surface, contain the highest amount of molybdenum. Whether the nitrogenfixing bacteria contributed to the nitrogen content of the oils by nitrogenation has to be left to future investigation.
OCCURRENCE OF MOLYBDENUM 163
The prosthetic groups of these enzyme systems contain flavin nucleotides, Figure 9.1. The flavin nucleotides contain the isoalloxazine and the purine ring system. Both of these ring systems are nitrogen heterocycles and are quite heat stable. Therefore it should be possible to find both isoalloxazines and purines among the nitrogenous compounds of crude oils. It might be these compounds that complex the molybdenum in oil. Of course even isolation of these compounds could not prove if nitgrogen-fixing bacteria are involved in the petroleum maturation process.
Figure 9.1. Flavin adenine dinucleotide (FAD).
DETERMINATION OF MOLYBDENUM BY ATOMIC ABSORPTION SPECTROPHOTOMETRY (AAS)
Sample Preparation
To insure that all the molybdenum in the oil whether present in an organically soluble form or in varying forms as particulate matter would be recorded by AAS, a sulfuric and nitric acid wet digestion process was selected for sample preparation. This process differs from the wet ashing procedure in that the former is carried out in a liquid acid medium from start to finish at a relatively low temperature (280°C), whereas in the wet ashing procedure after acid charring the oil, the char is subjected to a 600°C muffling step.
i i
-p—o—p-
I I
N
0
164 THE ROLE OF TRACE METALS IN PETROLEUM
Separating Athabasca Tar Sand Oil
Three hundred grams of warm Athabasca Tar Sand Oil were poured into 900 ml agitated n-heptane and stirred 30 minutes. The mixture was warmed in a steam bath to 70°C, stirred again and centrifuged for 30 minutes at 3500 rpm. The insolubles were restirred with n-heptane and centrifuged. The liquids were combined and the solvents removed on a rotary flash evaporator. The solids were dried, then refluxed with 300 ml benzene for 1.5 hours, stirred for 30 minutes, and centrifuged. The solids were reslurried three times with benzene as above, then dried in a vacuum oven at 50°C at 20 torr. The benzene extracts were combined and the solvent removed on rotary flash evaporator (Figure 9.2).
Procedure
Two portions of oil, 55 g ± 0.1 g, were wet- digested separately with sulfuric and nitric acids in a new in-house glass laboratory digestion apparatus. Prior to wet digestion, 1000 y of a Conostan molybdenum sulfonate was added to one of the portions of the oil. After digestion, these two portions of the digested oil would now represent a modification of the classical AAS method of standard additions with one added desirable feature: the added molybdenum standard would be subjected to the same harsh acidic treatment as any of the molybdenum present in the original oil. We refer to this procedure as the "cooked" method of standard additions, and find it to be the ultimate in matching atomic absorption response between the sample and the sample plus the added standard. A blank acid digest solution was also carried along.
The sulfuric acid in the finished digest solution was fumed off to approximately 10 ml and, after water dilution and heating, was quantitatively transferred to a 100-ml flask. This produced a digested 55-g sample in one flask and, in the other flask produced a similar 55—g sample plus an added concentration of 10 y/ml of molybdenum standard. These solutions without any further treatment were aspirated into AAS flame.
OCCURRENCE OF MOLYBDENUM 165
Figure 9.2. Separation of Athabasca Tar Sand Oil.
166 THE ROLE OF TRACE METALS IN PETROLEUM
Instrumental Parameters
A Jarrell-Ash Model 82-532 MV spectrophotometer equipped with a Perkin Elmer nebulization system and a Leeds-Northrup Type W calibrated AZAR Recorder was used for the molybdenum analysis. The 3133 A primary molybdenum absorption wavelength coupled with an acetylene-nitrous oxide flame were the basic parameters of the instrument. The recorder was set for a 5-fold signal expansion along with the amplifier at 3/4 damped position.
The blank acid digestion solution was checked for response and found to produce a less than 0.2% absorption; therefore deionized water was aspirated as a zero reference. The 100-ml digest solutions were then aspirated and their responses recorded.
The minimum signal accepted for calculation was 0.5% absorption, or slightly more than twice the noise observed while aspirating the digest solutions. Ionization supressant agents, such as sodium or potassium, were not employed because we wanted to observe if different crudes upon digestion recorded varying absorption responses for the molybdenum standard that was added.
Results and Conclusions
Almost all the digested crudes produced absorption responses between 33 and 40% for the 10 ppm of molybdenum added. One exception was Souedieh Reduced Crude— its response for the 10 ppm Mo added was 18% absorption. No two crudes produced identical responses. It was apparent from some digested crudes that larger than 55-g samples could be digested, which would lower detection limits. The addition of sodium or potassium at a 1000 y/ml level also would increase response.
The digested "cooked" method of standard additions appears to be the proper method for AAS sample preparation especially if unfamiliar reduced crudes are to be analyzed for trace amounts of molybdenum (<10 ppm) for the first time.
REFERENCES
1. Bertine, K. K. and K. K. Turekian. Geochim. Cosmoohim. Acta Z7, 1415 (1973).
CHAPTER 10
VANADIUM AND ITS BONDING IN PETROLEUM
T. F. Yen
Department of Chemical Engineering University of Southern California Los Angeles, California 90007
INTRODUCTION
Vanadium is ubiquitous in nature. All types of igneous rocks and soils contain an average of 100 ppm vanadium, although its concentration in sea water is much lower—about 0.002 ppm. All living organisms contain vanadium from 0.15 to 2 ppm; certain land plants such as Amanita musoaria and marine animals such as Pleurobranohas plumula contain vanadium in concentrations as high as 0.65% on a dry weight basis.1 Biochemically vanadium serves as an essential pigment in blood and is involved in processes ranging from nitrogen fixation to inhibition of cholesterol synthesis. Its importance is further supported by the fact that vanadium is linked to RNA and DNA, the latter being essential to the life process.
Vanadium is known to associate with the heavy end fractions of crude oil in amounts ranging from 1 to 6,000 ppm. Since these vanadium sites are extremely stable, they become the centers for catalyzing oxidation reactions (transformation and diagenesis) in petroleum as well as adverse effects in the refining processes such as catalytical cracking. Vanadium contributes to harmful physiological effects, such as lung disease, arising from the industrial combustion of fuels and the resultant ejection of vanadium derivatives into the atmosphere. Heterocyclic atoms at the vanadium sites are essential in keeping the homogeneity of petroleum oil. Many
167
168 THE ROLE OF TRACE METALS IN PETROLEUM
physical properties, such as flow and viscosity, depend on the geometrical arrangement of the vanadium sites.
There are a number of types of vanadium complexes in petroleum, the commonest being the porphyrins. Much work has been directed to detect their presence since they are readily separated by extraction. Other types of complexes, such as mixed ligands, pseudoaromatic pheophorbides and highly aromatic porphyrins, comprise 1-50% of the total vanadium.2 These complexes are held tightly in the organic matrix and thus exert strong influence on the properties of petroleum samples. In this important aspect, few studies have been made (see Figure 10.1 for details).
Vanadium macrocycles could serve as geochemical tracers that link geo- and biosystems. Vanadyl porphyrins have been identified both in Precambrian shale^ as well as in extraterrestrial meteorites. Although there are reports of the presence of either vanadium or porphyrin-like molecules in many types of recent and ancient sediments, the nature of vanadium bonding in all these samples is not known. Once this knowledge is acquired, an insight into the structure of these natural resources will facilitate their intelligent applications in energy conversion and environmental control.
METHOD
Electron spin resonance (ESR) is an important tool in the exploration of the microenvironment where there are large molecules in their natural state without chemical decomposition or physical deformation. Furthermore, solubilization of the substance is unnecessary, thus allowing spectra to be taken in situ. This technique appears to be most desirable for the proposed study. Previously this investigator has employed ESR techniques to study the nature of free radicals and vanadyl porphyrin complexes in various petroleum fractions of different geological origin.2' I*~7 Considerable insight has been gained from these findings.
ESR methods can be applied to reveal three of the most important types of information concerning the vanadium bonding of petroleum:
1. Nature of ligand types: ESR correlation techniques
can pinpoint the composition of heteroatoms coordinated to vanadium; for example, possible combinations
VANADIUM AND ITS BONDING ]69
Figure 10.1. Key types of vanadium complexes in petroleum: (a) porphyrins, (b) mixed ligands such as N2O2 type, the $-ketimines, (c) pseudoaromatic pheophorbides such as a bacterio-chlorophyll (the outer conjugation is interrupted, but still belong to the diaza-18-annulene system), and (d) highly aromatic porphins such as the dehydrogenated product of m-a-naphylporphyrin, which was identified in Nonesuch shale. Type (a) is found in all petroleum. Types (b), (c) and (d) are commonly referred to as the nonporphyrin type of vanadium
of four ligands may include: all nitrogen (Ni+),
half nitrogen, half sulfur (N2S2), or "odd" nitrogen compositions (NX3 or N3X, where X is 0 or S) (Figure 10.2).
2. Distortion of complexes: Usually vanadyl complexes
are square pyramidal; the four donor atoms are coplanar in the basal planes. Reduction of symmetry from the axial to rhombohedral can be detected.
170 THE ROLE OF TRACE METALS IN PETROLEUM
Figure 10.2. Vanadyl quadrivalent ligand types: (a) 2S20
type, (b) 2N2S type, (c) 3N10 type, and (d) IN30 type. Types (c) and (d) belong to the odd nitrogen class. For the 2N20 type, see Figure 10.1 (b).
3. Association with 7T-systems: The influence of donor-
acceptor properties of a large aromatic TT-system exerted on the vanadium system will change the vertical distance of vanadium atoms to the approximate ligand plane of the heterocyclic atoms (Figure 10.3).
Information obtained from the above studies will help not only to elucidate the structures of bitumens, kerogens and other naturally occurring substances but also to clarify the mechanisms of biogenesis, transformation and metamorphism of all fossil remains existing in nature. A better understanding of the interactions of vanadium complexes
VANADIUM AND ITS BONDING 171
Figure 10.3. Possible structure of vanadyl association:
(a) v-09m*V type, (b) 0-V*N type, and (c)
0—V* • *7T type. For type (c) , the tt-system could be either from the nonporphyrin highly aromatic porphins (Figure 10.1, d), or from the host aromatic sheets of asphaltic system.
in these bituminous materials will allow the improved control of petroleum refining, processing, cracking, and conversion processes as well as the development of more effective methods for desulfurization and denitrification of fuels for environmental pollutants abatement.
172 THE ROLE OF TRACE METALS IN PETROLEUM
EXPERIMENTAL
The isolation of vanadium complexes from fossil remains adapted the protocol established for the Lunar fines, which was developed by this investigator.8-10 The conventional scheme for further separation by column and gel-permeation chromatography of these grossly separated species was attempted.
A successive solvent elution with hexane-benzene- ether-methanol series of increasing polarity, with either neutral aluminum or the Sephadex as the stationary phase, was followed.
Each individual fraction was examined by ESR for the isotropic region of the g0 vs. a0. From the correlation of g0 and a0, comparative information concerning the ligand heteroatoms was obtained.
Samples also were examined for the presence of an anisotropic spectra to detect any splitting of the g± into gxandgy. Degrees of reduction of symmetry were evaluated for a number of low-symmetry complexes. Parameters such as A, spacing differences, and p, axial to the equatorial crystal field were obtained.6'36
The nature of nitrogen superhyperfine (shf) splittings of the vanadyl groupings within these samples was examined. In this manner, the interaction caused by the donor-acceptor associations is accessed and the environment of the ligand atoms is revealed (such as equivalence of donor atoms),sixth vacant position coordination, and large tt-tt association) . This is especially important for the aryl- substituted or 7T-fused porphyrins.
DATA TREATMENT
ESR studies can yield two types of information on bitumens and related substances: (a) free radi¬
cal absorption, and (b) absorptions due to naturally occurring vanadium and synthetic vanadium chelate model systems. The studies prior to 1968 have been summarized in a review by this investigator.6 Recently, considerable ESR work concerning fossil remains has been carried out by this investigator and his associates: g-value correlation,7 temperature-dependence studies,11 stability,12 transformation,13 nitrogen superhyperf ine splittings,11* ligand types and correlations,15 anisotropy-isotropy,5 model chelate systems, 16-20 spectral calculation,21 synthesis,22 and enhancement and separation of vanadium signals. 23
VANADIUM AND ITS BONDING 173
The ligand correlation of the vanadyl environment was reexamined.21* The basis for the analysis is the correlation of g0, center of signal, and aQ, hyperfine constant of an isotropic spectra:15
-aQ = P (ge - g0) + PK
where P is the direct dipolar term and K is the Fermi contact term. For a series of vanadyl complexes P = 136 G and the variation of K is small: Thus, when a0 vs. gQ was plotted, an approximately linear relation was obtained for ligands made of varying compositions (Figure 10.4). The correlation becomes a more useful method when recent data including sulfur is available (Figure 10.5).25' 26 This method is applicable to any sharp fractions of petroleum.
Figure 10.4. An approximately linear relation of vanadyl complexes of varying compositions.
The problem concerning small distortion or deviation from axial symmetry has been elucidated.20 Coordination of the sixth vacant position was also
174 THE ROLE OF TRACE METALS IN PETROLEUM
Figure 10.5. Correlation of ligand types of vanadyl complexes with ESR determinations (a) Sh, (b) Nk, (c) OzSz, (d) N2O2, and (e) Oi*.
studied.16 Calculation of spectra was developed22 in order to detect small differences of the x,y splitting.
The superhyperfine (shf) lines due to the coupling of unpaired spins to 14^ nuclei in both native asphaltenes derived from Boscan and Bachaquero crude oils were observed.6 These patterns usually consisted of nine equally spaced lines with intensity ratios of 1:4:10:16:19:16:10:4:1 yielding aN of 2.75 G. In addition, shf splittings were observed14 when an oxovanadium (IV) macrocycle was added to a host consisting of a fused-ring aromatic system6 {e.g.j perylene, 9,10-phenanthroline, phenanthrene polymer, and vanadium-free asphaltene).
Other than this recent finding, many researchers have studied different vanadyl complexes with ESR and have failed to observe positively nitrogen shf structures except one porphyrin (tetraphenyl- porphin) under one set of special conditions (low temperature, chloroform or CS2 glasses).27 Nitrogen shf splittings obtained at these conditions have not been explained.
VANADIUM AND ITS BONDING 175
DISCUSSION
The ligands of biotic vanadyl complexes can take on a number of different forms, e.g** hemo- vanadium is N2O2 (2 nitrogens and 2 oxygens), whereas cellular vanadium takes the N»t form, although all the N's are not necessarily identical. After these biotic complexes had undergone fossili- zation, those remaining were the more thermodynamically stable forms. Usually the resulting mixture consists of heterogeneous components. Literature reported to date2' 28 indicates that the vanadium compounds in fossil fuels are not all homogeneous; they consist mostly of porphyrins (including pheo- phorbides of cycloalkanoporphin), arylporphins (rhodoporphyrins), complexes of interrupted conjugation (pseudoaromatic ligands), and mixed ligands (nonporphyrins).
Often in sediments vanadyl groups are associated as ligands with the etioporphyrins although virtually nothing is known about the nature of the remaining ligands. This is due to the fact that a limited number of vanadyl etioporphyrin species are loosely bound to the matrix of fossil remains (if the sample is washed with methanol, the etio- species are extracted). Therefore, work reported in this area is generally concerned only with the etioporphyrin types contained in the fossil remains. In this regard, it may be stated that vanadium, as an element, is easy to detect, but that the structure of the vanadium sites in fossil remains is difficult to elucidate.
With drastic variations in sediments, composition as well as types of vanadium complexes vary. Even within a series of samples there is a noticeable variation of the vanadium complexes. For example, as the age or the depth of the fossil remains increases,1 ' 12 a transformation of the porphyrin types from philo to etio takes place. This is merely one example of the large variety of reactions and transformations occurring in petroleum as well as other bituminous substances. The study of such effects would reveal much knowledge concerning the migration, maturation, and transformation of a diversity of fossil remains.
All known X-ray diffraction data indicate that in penta-coordinated pyramidal vanadium chelates the vanadium atom lies out of the basal plane of the ligand macrocycle, i.e.> the plane of the four pyrrole nitrogen atoms. The distance from vanadium
176 THE ROLE OF TRACE METALS IN PETROLEUM
atom to the basal plane (dy+p) for vanadyl deoxy- philloerythroetioporphyrin (DPEP) is 0.53 A29 and for vanadyl 3-ketimines20is 0.47 A. Recently, however, one of the preparations of a vanadyl $- ketimine, N,N*-propylene-bis-(salicylaldiminato) oxovanadium, or VO (salpn), was reported30 to have an unusual coloration and a dy+p of 0.31 A, which is shorter than most vanadyl complexes.31 This anomaly could be attributed to the ligation of •••V - 0 - V« • •bonding.3' 31 Similarly, in VO SOtt *H20, the water molecule in the sixth position (normally vacant) of the square pyramid causes dv->p to be reduced to 0.29 A.32 From these examples it appears that the dy+p of a vanadyl chelate depends on the electronic interaction of the microenvironments of the sixth vacant axial position (Figure 10.6) .
VOacen (Weaver-Bruins
VOacac -Yen-Boucher
VObzac *970)
— VODPEP (Petterson-
Al exa nder,l968,'69)
Min. dist for s.h.f. splittings
VO Salpn
VO (H20)4 S04 h2o
(Drake- Vekres Wood,1969)
Ligand plane
Figure 10.6. X-ray data for the V to ligand ,plane distance.
VANADIUM AND ITS BONDING 177
A molecular orbital calculation33 (Figure 10.7) has shown that the antibonding coefficients, ($i*)2 and (eir*)2, of vanadyl porphyrins vary as a function of dy-^p (Figure 10.8). Since the spin-orbital coupling constant 5 and the anisotropic g± and g^ tensors for a given vanadyl chelate are constant, and from the first order approximation,
AEi = 85(3i*)2 (32*)2/(ge - g„>
AE2 = 25(32*)2 (eir*)2/(ge - g±)
thus, the d-d transitions, AEi and AE2, are also functions of dy+p (in this case, where (32*)2 is constant through the range studied. As the vanadium atom approaches the plane of the macrocycle, the transition due to 7r-orbital in-plane will increase, whereas that due to the 7r-orbital out-of-
j/y »,
O® N V N ®0
/ o.
eft**
/
d«*-y*
d„, dyi
® Solvent
^(b2) = 02«%y) + + P,2 - Ph-PH)
Mb,) = 0, (dx2_y2) + ££,'(0j - <r2+ <t3- a4) + €fr V? ^ ^21 ” ^22^
Ma,) = a,(df + s0) + o\a5
Figure 10.7.
Molecular orbital scheme of vanadyl complexes.
178 THE ROLE OF TRACE METALS IN PETROLEUM
Figure 10.8. Variations of antibonding coefficients with V to ligand plane distance.
plane will decrease. For porphyrins, the strong 7T-7T transition will mask the weak d-d transitions and consequently make the latter ones difficult to observe directly.
At this stage, the unknown factor is whether AE]_ and AE2 can be influenced by the aromatic system axially at the sixth position of porphyrins. However, it is known that porphyrins and phthalocy- amines behave like azaannulenes and azaarenes, in which the tt-tt overlap is significantly large in the presence of other fused-ring 7r-systems. Even for the mesomorphic asphaltene molecules, an extensive charge-transfer process among the large condensed- ring system was observed.11' 31+' 35 Apparently, a large 7T-system close to the back side of the chelate will exert an influence on AEi and AE2, but this requires further experimental support. In this connection it is worthy to note that for vanadyl 3- diketones both AEi and AE2 are extremely solvent- dependent due to back coordination (Table 10.1)37
VANADIUM AND ITS BONDING 179
Figure 10.9. Relation of d-d transition energies to V to ligand plane distance.
Table 10.1
Experimental Bank Maxima for Vanadyl |
^-Diketones
(kk)
Sixth Ligand
I
II
III
DII.I
Methanol
13.03
17.45
25.63
4,
,42
n-Propylamine
12.94
17.30
24.69
4.
,36
Ethanol
12.98
17.24
(24.99)
4.
,18
Pyridine
12.99
17.22
23.80
4,
,21
Dimethylsulfooxide
12.85
17.03
24.99
4.
,18
n-Butanol
13.2
17.3
25.4
4.
,1
Dioxane
13.83
17.85
—
4.
,02
Piperidine
13.28
17.30
—
4,
,02
Dime thylformamide
13.03
16.97
25.12
3.
,94
n-Pentanol
13.3
17.1
25.2
3.
,8
Formic acid
13.28
16.52
—
3.
,25
Tetrahydrofuran
13.66
16.80
—
3,
.14
Acetonitrile
14.20
16.80
25.80
2,
,60
Nitromethane
14.57
16.83
(25.37)
2,
,26
Nitrobenzene
14.71
16.66
—
1,
,95
Chloroform
14.92
16.86
25.97
1.
,94
Benzene
15.31
16.89
25.70
1.
.58
m-Tylene
15.22
16.72
25.31
1,
.50
Carbon tetrachloride
15.79
16.86
25.97
1,
.07
180 THE ROLE OF TRACE METALS IN PETROLEUM
On the basis of the above arguments, it is imperative that the following questions be answered:
1. Do aromatic hosts shorten dy+p?
2. Can one control the nature of the hosts to obtain desirable d-d transitions and therefore a desirable
dv-+p?
3. What is the maximun dy that will permit the observation of nitrogen shf?p
ACKNOWLEDGMENT
The financial support provided by ACS-PRF grant-in-aid through No. 6272-AC2 is gratefully acknowledged.
REFERENCES
1. Yen, T. F. in Trace Substances in Environmental Health, vol. 6, D. D. Hemphill, Ed. (Columbia, Missouri:
Univ. of Missouri, 1973) pp. 347-353.
2. Yen, T. E., L. J. Boucher, J. P. Dickie, E. C. Tynan and G. B. Vaughan. J, Inst, Petroleum, 55, 87 (1969).
3. Rho, J. H., A. J. Bauman, H. G. Boetteger,and T. F. Yen. Space Life Sci,, 4, 69 (1973).
4. Yen, T. F., J. G. Erdman and A. J. Saraceno. Anal, Chem., 34, 694 (1962).
5. Tynan, E. D. and T. F. Yen. Fuel (London), 43, 191
(1969).
6. Yen, T. F., E. C. Tynan, G. B. Vaughan and L. J. Boucher in Spectrometry of Fuels, R. A. Friedel, Ed. (New York: Plenum Press, 1970) Chapter 14, pp. 187-201.
7. Yen, T. F. and S. Sprang. Preprints, Div, of Petrol. Chem,, ACS, 15, No. 3, A65 (1970).
8. Rho, J. H., A. J. Bauman, T. F. Yen and J. Bonner.
Science, 167, 754 (1970).
9. Rho, J. H., A. J. Bauman, T. F. Yen and J. Bonner.
Proc, Apollo 11 Lunar Sci, Conf., vol. 2, A. A. Levinson, Ed. (New York: Pergamon Press, 1970) pp. 1929-1932.
10. Rho, J. H., A. J. Bauman, J. F. Bonner and T. F. Yen, in Proc, 2nd Lunar Sci, Conf,, vol. 2, A. A. Levinson,
Ed. (Cambridge, Massachusetts: MIT Press, 1971) pp. 1875-1878.
11. Yen, T. F. and D. K. Young. Carbon 11, 33 (1973).
12. Yen, T. F. in Chemistry in Space Research, R. F. Landel and A. Rembaum, Eds. (New York: Elsivier Publishing Co., 1972) pp. 105-153.
Yen, T. F. and S. a. Silverman. Preprints, Div, of Petrol Chem,, ACS, 14, No. 3, E32 (1969).
13.
VANADIUM AND ITS BONDING 181
14. Yen, T. F. Naturu)isy 58y 267 (1971).
15. Boucher, L. J., E. C. Tynan and T. F. Yen in Electron Spin Resonance of Metal Complexes, T. F. Yen, Ed. (New York: Plenum Press, 1969) pp. 111-130.
16. Boucher, L. J., E. C. Tynan and T. F. Yen. Inorg. Chem. y 7y 731 (1968) .
17. Boucher, L. J. and T. F. Yen. Inorg. Chem. y 7y 2665
(1968).
18. Vaughan, G. B., E. C. Tynan and T. F. Yen. Chem. Geol.y 6y 203 (1970) .
19. Boucher, L. J. and T. F. Yen. Inorg. Chem. y 8y 689 0-969).
20. Boucher, L. J., D. E. Bruins, T. F. Yen and D. L. Weaver.
J, Chem. Cos. D Chem. Comm. y 7y 363 (1969).
21. Makey, J. H., M. Kopp, E. C. Tynan and T. F. Yen in Electron Spin Resonance of Metal Complexes y T. F. Yen,
Ed. (New York: Plenum Press, 1969) pp. 111-130.
22. Tynan, E. C. and T. F. Yen. J. Magnetic Resonancey Zy 327 (1970).
23. Beasely, J. E., R. L. Anderson, J. P. Dickie, F. R. Dollish, E. C. Tynan and T. F. Yen. Spectros. Lett.y 2(5) y 149 (1969).
24. Yen, T. F., L. J. Boucher, J. P. Dickie, E. C. Tynan and G. B. Vaughan. Preprints, Div. of Petrol. Chem. y ACSy lZy No. 1, 59 (1968).
25. Yen, T. F. "Electron Spin Resonance of Vanadyl Porphyrins and other Chelates," Gordon Research Conferences on Geochemistry, Plymouth, New Hampshire, Aug. 31, 1970.
26. Dickson, F. E., C. J. Kunesh, E. L. McGinnis and L. Petrakis. Preprints, Div. of Petrol. Chem. y ACSy 16y No. 1, A37 (1971).
27. Kivelson, D. and S. K. Lee. J. Chem. Phys.y 41y 1896 (1964).
28. Baker, E. W., T. F. Yen, J. P. Dickie, R. E. Rhodes and L. F. Clark. J. Amer. Chem. Soc.y 89y 3631 (1967).
29. Peterson, R. C. and L. E. Alexander. J. Amer. Chem.
Soc.y 90y 3873 (1968).
30. Mathew, M., A. J. Corty and G. J. Palenik. J. Amer.
Chem. Soc. y 92y 3197 (1970).
31. Bruins, D. E. and D. C. Weaver. Inorg. Chem.y 9y 139
(1970) .
32. Ballhausen, C. J., Djurinskij, and K. L. Watson.
J. Amer. Chem. Soc. y 90y 3305 (1968).
33. Zerner, M. and M. Gouterman. Inorg. Chem.y 5y 1699 (1966).
34. Yen. T. F. Preprints, Div. Fuel Chem. y ACSy 15y 93
(1971) .
35. Sill, G. A. and T. F. Yen. Fuel (London), 4Zy 61 (1969).
36. Kuska, H. A. and M. T. Rogers. Inorg. Chem. 5y 313 (1966).
37. Selbin, J. Chem. Rev.y 65y 153 (1965).
This Page Intentionally Left Blank
CHAPTER 11
OXIDATIVE DEMETALLATION OF OXOVANADIUM(IV) PORPHYRINS
James M. Sugihara, J. F. Branthaver and K. W. Willcox
Department of Chemistry, North Dakota State University Fargo, North Dakota 58102
The presence of vanadium in petroleum crudes is well documented. Much analytical data1"3 have been compiled because the metal brings about unfavorable effects in poisoning cracking and other catalysts in the standard refinery operations. Furthermore, presence of vanadium in residual fuels at high levels results in damage to furnace components.
Vanadium is found as a chelate of porphyrins and in other forms, presently ill-defined. Of these metal-containing compounds, only the metalloporphyrins are volatile. Thus these species are potentially more deleterious than the nonporphyrin vanadium compounds .
A variety of methods has been established to effect metal removal from vanadium porphyrins. For the most part the procedures described require the use of strong acids and are applied as a mear^s of determining porphyrin content. The common reagents are hydrogen bromide in acetic acid,1* hydrogen bromide in formic acid,5 sulfuric acid.® methane- sulfonic acid,7 and hydrogen fluoride. Unfortunately in all instances these reagents cause marked changes to petroleum materials and thus are not satisfactory for purposes of metal removal. A reductive procedure in a basic medium9 also brings about deep- seated changes to a petroleum sample.10
In some recent studies, certain oxidative reagents were found to effect rapid demetalation of vanadium porphyrins under mild conditions without
183
184 THE ROLE OF TRACE METALS IN PETROLEUM
apparent serious alteration to the rest of the petroleum materials. These observations and those on synthetic vanadyl porphyrins are described herein.
EXPERIMENTAL
Most of the studies were carried out on Boscan crude and fractions derived from it because these materials are rich in vanadium and metalloporphyrins. Boscan asphaltenes were obtained by pentane precipitation. The asphaltenes were further separated by dissolving in benzene and subjecting to gel permeation chromatography, using an 80 A gel of polystyrene cross-linked with divinylbenzene, and a column of 120 cm height and 2.1 cm radius. The charge consisted of 3.0 g asphaltenes in 30 ml benzene, with the elution rate maintained at 6 ml/min. Breakthrough occurred at 450 ml, the first 120 ml of dark-colored eluate was collected as Fraction I, the next 180 ml of eluate was not used in this study, and the final 600 ml was collected as Fraction II. Metallopor- phyrin11 and vanadium12 contents of these materials were determined; data are given in Table 11.1.
Table 11.1
Vanadium and Metalloporphyrin Contents in Boscan Crude and its Fractions
V
(]i Moles/g
Metalloporphyrin (]i Moles/g)
Boscan crude
22.3
10.4
Asphaltenes
70.0
29.1
Fraction I
75.0
15.0
Fraction II
72.0
79.0
Reagents found to have varying capabilities in effecting vanadium removal are given in a descending order of reactivity: chlorine - sulfuryl chloride > t-butyl hypochlorite > dinitrogen tetroxide > t-butyl hydroperoxide - benzoyl peroxide * azobisisobutyronitrile >
OXIDATIVE DEMETALLATION OF OXOVANADIUM(IV) PORPHYRINS 185
bromine. In a typical run 1.25 g of petroleum material was dissolved in 50 ml of methylene chloride (or toluene) and placed in a 500-ml three-necked flask equipped with a dropping funnel, stirrer, and drying tube. The contents were cooled to -78°C when the reactive reagents, chlorine and sulfuryl chloride, were used? in other instances 0°C, ambient temperatures, and temperatures up to 110°C were maintained to effect reactions. The crude oil was also treated neat with no added solvent. Small amounts of reagent, usually dissolved in methylene chloride, were added into the stirred mixture. A minimum of 10 moles of reagent per mole of metalloporphyrin was required. Reaction was allowed to continue for varying periods of time, as short as one minute for chlorine and sulfuryl chloride. Reactions using chlorine or sulfuryl chloride were quenched by addition of phenol or ammonium hydroxide. Other reactions were terminated by cooling the reaction mixture. The reaction mixture was extracted with 5% aqueous sodium hydroxide and then with water. Vanadium and metalloporphyrin determinations were then made. Some of the data are given in Table 11.2.
Etioporphyrin I was synthesized13 and converted1 ** into its oxovanadium(IV) complex. Tetraphenyipor- phine was made by condensation of pyrrole and ben- zaldehyde,15 octaethylporphine was prepared,1* and both were converted1' into their oxovanadium(IV) complexes. Reactions on the synthetic porphyrins and their vanadyl complexes were carried out in much the same fashion as the petroleum fractions.
RESULTS
Some of the data obtained in observing vanadium removal and metalloporphyrin destruction are given in Table 11.2. Chlorine and sulfuryl chloride were very effective under surprisingly gentle reaction conditions. The experiment using Fraction II is particularly noteworthy because this material has all of its metal content accountable as metalloporphyrins, 72.0 yM/g vanadium and 7.0 yM/g nickel. Following reaction with chlorine, vanadium content was decreased from 79.0 yM/g to 5 yM/g, and metalloporphyrin content was reduced to a nondetectable point. Nonporphyrin metal contents were not reduced nearly to the same extent, though they were significantly altered.
In order to interpret better the nature of the reactions involved in these reactions involving vanadium removal and metalloporphyrin destruction, extensive studies have been made on synthetic porphyrins
Table 11.2
Vanadium and Metalloporphyrin Contents Following Reactions
Material
Reagent
Conditions
V
(vM/g)
Metalloporphyrin (nM/g)
Asphaltenes in
Chlorine
-78°C,
1 hr.
35
0
toluene
Fraction I in
Chlorine
-78°C,
1 hr.
39
0
toluene
Fraction II in
Chlorine
-78°C,
1 min.
5
0
methylene chloride
Boscan crude in
methylene chloride
Chlorine in
methylene chloride
-780C,
1 min.
—
0
Boscan crude in
methylene chloride
Sulfuryl chloride in methylene chloride
-78°C,
5 min.
9
0
Boscan crude in
methylene chloride
Sulfuryl chloride in methylene chloride
-78°C,
1 min.
14
-1
Boscan crude
Chlorine in
methylene chloride
-78°C,
1 min.
—
< 1
Boscan crude
t_-Butyl hydroperoxide
-110°C,
22 hrs.
—
4.7
186 THE ROLE OF TRACE METALS IN PETROLEUM
OXIDATIVE DEMETALLATION OF OXOVANADIUM(IV) PORPHYRINS 187
and their oxovanadium(IV) complexes. Interestingly, all the synthetic vanadyl porphyrins were found to be less reactive than the petroporphyrins in Boscan crude. The vanadyl complex of any given porphyrin was observed to be more reactive than the parent porphyrin, which in turn was more reactive than the diprotonated species. Vanadyl tetraphenylporphine was determined to be much less reactive than vanadyl etioporphyrin I or vanadyl octaethylporphine.
Light accelerated all reactions, but the order found for reactivity in the dark, chlorine - sulfuryl chloride > t-butyl hypochlorite > dinitrogen tetroxide > t-butyl hydroperoxide - benzoyl peroxide - azobisiso- butyronitrile > bromine, was still maintained. When light entering the reaction mixture was filtered through a solution of vanadyl etioporphyrin I, the resulting radiation produced no acceleration.
The reactivity of fluorine toward synthetic vanadyl porphyrins, Boscan crude, and fractions derived therefrom was surprisingly benign.1* The halogen was actually less reactive than chlorine toward metallo- porphyrins. Though the crude and its fractions did react with the formation of hydrogen fluoride, the processes did not exhibit explosive violence at ambient and even higher temperatures.
Several approaches were applied in attempting to establish the nature of the products formed in these reactions. When synthetic vanadyl porphyrins were treated with chlorine in the presence of hydrogen chloride, the diprotonated porphyrin could not be trapped, although reactivity of the metalloporphyrin is appreciably greater than that of the diprotonated porphyrin. Product analysis was made on a run involving 300 mg of vanadyl octaethylporphine and 5 molar equivalents of sulfuryl chloride in methylene chloride in the dark at -78°C. Reaction was quenched with ammonium hydroxide. The resulting material was washed with water, dried, and then chromatographed on Silicar-CC-7/9 using benzene and benzene-methanol as eluants. Unreacted vanadyl octaethylporphine was recovered from the benzene eluant as well as a green fraction, which exhibited an absorbance near 450 nm and contained chlorine and vanadium at a level that would be expected for chlorinated vanadyl octaethylporphine. The green fraction from the benzene-methanol eluate also exhibited an absorbance near 450 nm and contained very little vanadium. The metal content was low enough that a proton nuclear magnetic resonance spectrum was obtainable. This spectrum demonstrated the disappearance of methine, a decrease in methylene, and essentially no change in methyl protons.
188 THE ROLE OF TRACE METALS IN PETROLEUM
DISCUSSION
The unexpected order of reactivity of the halogens , namely chlorine > fluorine > bromine, suggests that an initial interaction of vanadyl porphyrins and these reagents occurs, which influences the course of the process. This interaction may involve formation of a 7r-complex (charge-transfer complex) with the metalloporphyrin functioning as an electron donor to the electron-deficient halogen molecule. Of the common halogens, iodine would be the best acceptor, presumably because of its greater ease of polarizability, and fluorine a poor acceptor. Loss of an electron from the metalloporphyrin would lead to a cation-radical. Cation-radicals have been shown to be intermediates in reactions of metalloporphyrins with benzoyl peroxide,20’21 bromine, 22-2If hydrogen peroxide,25-2 or by electrochemical oxidation.28-32 Indeed, cation- radicals have been proposed33"35 to be involved in electrophilic aromatic substitution reactions.
The observation that light accelerates these reactions can be rationalized in the framework of the above interpretation. Since light passed through a solution of vanadyl etioporphyrin I without effect on the system, it would appear that photochemically excited species of metalloporphyrins are responsible for the faster reactions as a consequence of their enhanced capability of interaction with halogens and the other reagents.
The metalloporphyrin cation-radical would likely react with the radical derived from the reagent, with substitution occurring at a meso-position, leading to the formation of a resonance-stabilized carbonium ion of the metalloporphyrin. That substitution occurs in the meso-positions is suggested by the observation that one of the major fractions obtained from the reaction of vanadyl octaethylporphine with sulfuryl chloride contained no methine protons, as demonstrated by the nmr spectrum. The site of substitution being meso is further supported by the fact that reactions of metalloporphyrins with peroxides20, 21» 25-27 and bromine 22-2** provide meso-substituted products. Electrophilic reagents in general react with porphyrins and metalloporphyrins with meso-substitution. 6-tf2 The possibility that some type of direct attack occurred on the central metal, leading to its ejection, seems very unlikely since the protonated porphyrin, much less "reactive than the metalloporphyrin, could not be trapped in the reaction mixture in the presence of added hydrogen chloride.
OXIDATIVE DEMETALLATION OF OXOVANADIUM(IV) PORPHYRINS 189
Figure 11.1
It would appear logical that the metalloporphyrin cation could then undergo reaction by two different paths, one involving proton ejection to yield the product of substitution and one involving combination with an anion to form the product of addition. Polynuclear aromatic hydrocarbons frequently undergo reaction with halogens to give products of both substitution and addition. The driving force leading to the product of substitution is restoration of resonance stabilization. The formation of the product of addition from the metalloporphyrin cation would yield a product that would have its macrocyclic, conjugated structure disturbed. Such a species should be an appreciably poorer ligand towards the metal, allowing for the loss of vanadium by a displacement process. Thus the two fractions obtained in the reaction of vanadyl octaethylporphine with sulfuryl
190 THE ROLE OF TRACE METALS IN PETROLEUM
chloride may be those products obtained by a substitution process retaining vanadium and those by an addition mechanism with loss of vanadium.
A molecule formed by the substitution path could undergo further reaction until all meso-positions are substituted. The product obtained by addition may undergo a variety of reactions beyond metal loss, since the molecule is merely an alkylated pyrrole and reactive to electrophilic reagent.
The greater lability toward vanadium removal and porphyrin destruction for the vanadyl petroporphyrins over the synthetic vanadyl porphyrins is a fortunate circumstance. This difference can be rationalized based upon structural differences of the porphyrins involved. Phyllo-type petroporphyrins all contain a cyclopentane ring, fused to one of the pyrrole rings with the methine carbon one of the units of the carbo- cyclic structure. Etio- and rhodo-type petroporphyrins appear1*3 to have alkyl substitution at one or more methine positions, as based upon nmr spectral data. Should all petroporphyrins have a carbon substituent on one or more methine carbons, the carbonium ion formed by the reaction would tend to have more charge localization on those methine carbons. These ions are a more stable species by an order of magnitude over those porphyrins without methine substitution.
Such a carbonium ion would offer a better opportunity for the addition path over the elimination path.
The fact that vanadyl tetraphenylporphine was less reactive is not inconsistent with this rationalization although in this instance all four methine carbons have phenyl substituents. It is likely that the formation of the mono-substituted carbonium ion would be inhibited because of steric interactions at the methine position involved. However, a more important consideration is that the benzene ring attached to the methine carbon is not coplanar with the macrocyclic porphyrin ring.1*1* The extent of deviation from planarity is enough that a positive charge generated on the methine carbon would receive no resonance stabilization but considerable inductive destabilization as a consequence of the unsaturated substituent.
The reactions, particularly of the chlorine- containing reactants, offer a new approach to metal- removal from crudes and heavy residues. High reactivity of metalloporphyrins was exhibited even at low concentrations and at low temperatures. Changes in the petroleum material are likely to be minimal. Treatment of the crude or any of its fractions with
OXIDATIVE DEMETALLATION OF OXOVANADIUM(IV) PORPHYRINS 191
chlorine or sulfuryl chloride did not alter separation characteristics on the gel permeation column, other than effect loss of the color in that fraction, normally heavily laden with metalloporphyrins.
The observation that metallopetroporphyrins could be removed completely with retention of considerable nonporphyrin vanadium provides one further piece of evidence that nonporphyrin vanadium does not exist as metal chelated with high molecular weight porphyrins. Indeed, this approach provides the means of obtaining petroleum material containing nonporphyrin vanadium, free from porphyrins.
ACKNOWLEDGMENT
Financial support from the American Petroleum Institute (Research Project 60B) is gratefully acknowledged.
REFERENCES
1. Whisman, M. L., and F. D. Cotton. Oil and Gas J.
(Dec. 27, 1971), p. 111.
2. Horr, C. A., A. T. Myers, P. J. Dunton, and H. J. Heyden. "Uranium and Other Metals in Crude Oils," U.S. Geological Survey Bulletin 1100 (Washington, D.C.: U.S. Government Printing Office, 1961).
3. Bonham, L. c. Bull. Am. Assoc. Petroleum Geol., 40,
897 (1956).
4. Groennings, S. Anal. Chem., 25, 938 (1953).
5. Sugihara, J. M., and R. G. Garvey. Anal. Chem. 36,
2374 (1964).
6. Barnes, J. W. and G. D. Dorough. J. Amer. Chem. Soc.,
72, 4045 (1950).
7. Erdman, J. G. U.S. Patent 3,190,829 (1965).
8. Kimberlin, C. N., Jr., H. G. Ellert, C. E. Adams and G. P. Hamner. U.S. Patent 3,203,892 (1965).
9. Eisner, U., and M. J. C. Harding. J. Chem. Soc., 4089 (1964).
10. Sugihara, J. M., T. Okada and J. F. Branthaver. J. Chem. Eng. Data, 10, 190 (1965).
11. Bean, R. M. and J. M. Sugihara. J. Chem. Eng. Data, 7,
269 (1962).
12. Bean, R. M. Ph.D. Thesis, University of Utah, Salt Lake City, Utah, 1961.
13. Rislove, D. J., A. T. O'Brien and J. M. Sugihara.
J. Chem. Eng. Data, 13, 588 (1968).
DeRemer, C. M. M.S. Thesis, North Dakota State University, Fargo, N.D., 1973.
14.
192
THE ROLE OF TRACE METALS IN PETROLEUM
15.
16.
17.
18.
19.
20. 21.
22.
23.
24.
25.
26.
27.
28.
29.
30.
31.
32.
33.
34.
35.
36.
37.
38.
39.
40.
41.
Adler, A. D., F. R. Longo, J. D. Finarelli, J. Goldmacher, J. Assour and L. Korsakoff. J. Org. Chem., 32, 476 (1967) Samuels, E., R. Shuttleworth and T. S. Stevens. J.. Chem. Soc., Seat. C, 145 (1968).
Adler, A. D., F. R. Longo, F. Kampas and J. Kim. J. Inorg Nucl. Chem., 32, 2443 (1970).
Kowanko, N., J. F. Branthaver and J. M. Sugihara, 1973, unpublished observations.
A product of Mallinckrodt Chemical Co.
Pedersen, C. J., J. Org. Chem., 22, 127 (1957).
Bonnett, R. and A. McDonagh. Chem. Commun., 337 (1970). Felton, R. H., D. Dolphin, D. C. Borg and J. Fajer.
J. Amer. Chem. Sou., 91, 196 (1969).
Fajer, J., D. C. Borg, A. Forman, D. Dolphin and R. H. Felton. J. Amer. Chem Soe., 92, 3451 (1970).
Fuhrhop, J. H., P. Wasser, D. Riesner and D. Mauzerall.
J. Amer. Chem Soe., 94, 7996 (1972).
Bonnett, R., M. J. Dimsdale and G. F. Stephenson, J. Chem. Soc., Seat. C, 564 (1969).
Bonnett, R. and M. J. Dimsdale. Tetrahedron Lett., 731 (1968) .
Bonnett, R., and M. J. Dimsdale. J. Chem Soe., Perkin Trans. 1, 2540 (1972).
Fuhrhop, J. H. and D. Mauzerall. J. Amer. Chem Soc., 90 3875 (1968).
Fuhrhop, J. H. and D. Mauzerall. J. Amer. Chem Soe., 91 4174 (1969).
Fuhrhop, J. H., K. M. Kadish and D. G. Davis. J. Amer. Chem. Soe., 95, 5140 (1973).
Wolberg, A. and J. Manas sen. J. Amer. Chem. Soc., 92, 2982 (1970).
Ferguson, J. A., T. J. Meyer and D. G. Whitten. Inorg. Chem., 11, 2767 (1972).
Brown, R. D. J. Chem. Soe., 2224, 2232 (1959).
Nagakura, S. Tetrahedron, 19, Suppl. 2, 361 (1963). Pedersen, E. B., T. E. Petersen, K. Torsell, and S. 0. Lawesson. Tetrahedron, 29, 579 (1973).
Bonnett, R. and G. F. Stephenson. Proc. Chem. Soc., 291
j
*
(1964).
Bonnett, R. and G. F. Stephenson. J. Org« Chem., 30, 2791 (1965).
Bonnett, R., I. A. D. Gale and G. F. Stephenson. J. Chem. Soc., Sect. C, 1600 (1966).
Bonnett, R., I. A. D. Gale and G. F. Stephenson. J. Chem. Soc., Sect. C, 1168 (1967).
Paine, J. B., Ill and D. Dolphin. J. Amer. Chem. Soc., 93, 4080 (1971).
Johnson, A. W. and D. Oldfield. Tetrahedron Lett.,
1549 (1964).
OXIDATIVE DEMETALLATION OF OXOVANADIUM(IV) PORPHYRINS 193
42. Grigg, R., A. Sweeney and A. W. Johnson. Chem. Commun. , 1237 (1970).
43. Branthaver, J. F. and J. M. Sugihara. 1972, unpublished observations.
44. Hoard, J. L., M. J. Hamor and T. A. Hamor. J. Amer. Chem. Soc*, 85, 2334 (1963).
This Page Intentionally Left Blank
CHAPTER 12
KINETICS STUDIES OF DEMETALLATION OF METALLOPORPHYRINS BY ACIDS
Betsey Don and T. F. Yen
Departments of Chemistry and Chemical Engineering University of Southern California Los Angeles, California
The occurrence of porphyrin metallo complexes in any ancient sediment can be taken as a biologi- cal marker, and their presence in meteorites,1 • 2 interstellar space3 or lunar samples1*'5 would suggest the presence of life. Porphyrins present in petroleum are not homogeneous6'7'8 and vary greatly depending on geological ages.9 The diagenic process points to the low temperature biological origin of petroleum.
The porphyrin metallo complexes in crude oils, asphaltenes and other natural bitumens are chiefly those of vanadium and nickel10 although copper, iron and even uranium have been suggested.11 Recently in a Precambrian shale, porphins were found to chelate with iron, zinc and copper in addition to vanadium and nickel.12 The origin of these complexes is still uncertain, although several theories have been advanced.13 Some of these theories could be verified or possibly even disproved if the porphyrin type bound to each metal was known. Furthermore, since these heavy metals are harmful to both health and catalysts, a systematic study of demetallation of metalloporphyrins should prove useful.
The demetallation of metalloporphyrins by acid is a reversible one and can be represented in a generalized form by the following equation:
PM + HX i PH + MX
The kinetics of this can be conceivably described as:
195
196 THE ROLE OF TRACE METALS IN PETROLEUM
d [PM] dt
k PM m [HX]n
where k is the demetallation reaction rate.
Caughey and Corwin11* have found that the demetallation of Cu-Etio II(copper etioporphyrin II) with sulfuric acid in acetic acid follows the above equation with m=2 and n=5. In the presence of excess acid, the right to left reaction is suppressed; in as much as [HX] remains essentially constant throughout the reaction, the kinetic equation can be reduced to the following form:
d [PM] dt
kobs[PM]
where kobs = k[HX]n. The values of n and k are obtained from the following relationship:
ln kobs = In k + n In [HX]
The present study was made in a nonaqueous medium using glacial acetic acid, which provided a good polar medium. Work was done on two porphyrins, Cu-TPP (copper ms-tetraphenylporphyrin) and Cu- Etio I (copper etioporphyrin I), with three acids— hydrochloric,sulfuric, and methanesulfonic.
Cu-Etio I was found to be more susceptible to demetallation than Cu-TPP. In a 0.4 N acid medium, Cu-Etio I underwent an appreciable conversion over 2.5 hr, whereas Cu-TPP remained essentially unchanged-. However, work was concentrated on Cu-TPP due to its greater availability.
Hydrochloric acid proved to be inferior to the other two acids used. Not only was its solubility in acetic acid low (continuous bubbling of HC1 gas through glacial HOAc for 5 hr gave a solution of acid strength of 0.951 N), offering a limited acid strength range, but also it was not stable in solution, rendering difficulty in controlling the acid strength. Sulfuric acid provided a limited range due to its immiscibility with benzene at an acid concentration above 4 N. Methanesulfonic acid offered the widest workable range, was easiest to handle, and proved to be the most useful demetallation reagent.
All absorbance data were obtained on a Beckman DU-2 spectrophotometer, and quartz cells of 1 cm path length were used. The apparatus used was essentially a three-necked round-bottomed flask fitted with an electric stirrer and a thermometer; the third neck was left unoccupied for addition of
DEMETALLATION OF METALLOPORPHYRINS BY ACIDS 197
reagents. Most of the flask was submerged in a constant-temperature bath maintained at a temperature of 24± 0.5°C.
Acetic acid and metalloporphyrin solutions were added to the flask in quantities to give final porphyrin concentration of approximately 10”1* M.
It was found that the reaction rate was not very sensitive to minor changes in porphyrin concentration. The mixture was stirred for several minutes to insure complete mixing, and a sample was removed for readings of initial porphyrin concentrations. When the temperature of the solution in the flask had stabilized, acid was delivered through a volumetric pipette to make up the final volume, and at the same time the timer was started. Aliquots were removed at different noted times from the reaction flask and quenched with a 2:1:1 pyridine: ethanol:water mixture. This specific combination was chosen to insure a phase system in which ethanol would hold benzene in solution, and water would dissolve any acid-pyridine salts. The quantities used were 1 ml sample aliquots to 4 ml quenching solution to insure the presence of excess base and the dilution of porphyrin to give a convenient absorb- ence reading range (below 1). The final total porphyrin concentration (metallo + free) was kept in the neighborhood of 2 x 10”5 M.
Assuming the reaction to be 1st and 2nd order respectively, the following relationships can be derived:
1st order: In [PM] = -kobs t
2nd order: 1 r__,, , . , ,
jpjjj— [PM]o kQbs t + 1
where [PM]Q is the total porphyrin concentration that is the initial metalloporphyrin concentration.
Plots for both orders were sketched for CH3SO3H and it was found that the 1st order plot (Figures 12.1, 12.2, 12.3) gave a far better fit.
nth order: 1 , ,. .
(n-1) [PM] 0 (n-1) kobs t
1
+ [PM]0 (n-2)
The 2nd order plots (Figure 12.1) are concave, signifying that for higher n's, the graph would deviate more rapidly from a straight line; therefore m must be equal to 1.
From Figure 12.4, n and k were determined to be 4 and 1.0 x 10”6 sec”1 for sulfuric acid and 6.6
198 THE ROLE OF TRACE METALS IN PETROLEUM
Figure 12.1. Second order reaction plot for CH3SO3H.
TIME (sec)
Figure 12.2. Demetallation kinetics of CuTPP by CH3SO3H at various acid strengths.
DEMETALLATION OF METALLOPORPHYRINS BY ACIDS 199
Figure 12.3. Demetallation kinetics of CuTPP by HiSOi*.
Figure 12.4. Plot of log iC0£s vs. log acid to determine acid order and rate constant.
200 THE ROLE OF TRACE METALS IN PETROLEUM
and 2.2 x 10“8 sec”1 for methanesulfonic acid, respectively. The two graphs intersect at around 4.4 N, signifying that at concentrations below that sulfuric acid is a more efficient demetallation reagent than methanesulfonic acid. The reverse is true for concentrations above 4.4 N.
ACKNOWLEDGMENT
The authors acknowledge Mr. Avak Minnasian for preparation of the copper porphyrins used in this experiment. Partial support from PRF Grant No. 6272-AC2 and JPL-Cal Tech subcontract under NASA NAS 7-100 is also acknowledged.
REFERENCES
1. Yen, T. F. in Chemistry in Space Research, R. F. Landel and A. Rembaum, Eds. (New York: Elsevier Pub. Co.,
1972) pp. 105-153.
2. Hayes, J. M. Geochim. Cosmochim. Acta,, 31, 1395 (1967).
3. Johnson, F. H. Pacific Conf. on Chemistry and Spectroscopy, Anaheim, 1971.
4. Rho, J. H., A. J. Bauman, T. F. Yen and J. Bonner.
Science 167, 754 (1970).
5. Rho, J. H., A. J. Bauman, T. F. Yen and J. Bonner in Proceedings of the Second Lunar Science Conference,
A. A. Levenson, Ed. 3, Vol. 2 (Cambridge, Mass.: MIT Press, 1971) pp. 1875-1878.
6. Baker, E. W. J. Am. Chem. Soc., 88, 2311 (1966).
7. Baker, E. W., T. F. Yen, J. P. Dickie, R. E. Rhodes and
L. F. Clark. J. Am. Chem. Soc., 89, 3631 (1967).
8. Vaughan, G. B., E. C. Tynan and T. F. Yen. Chem. Geol.
6, 203 (1970).
9. Yen, T. F. and S. R. Silverman. ACS Div. Petrol. Chem., Preprints, 14(3), E32-E39 (1969).
10. Yen, T. F., L. J. Boucher, J. P. Dickie, E. C. Tynan and G. B. Vaughan. J. Inst. Petrol., 55, 87 (1969).
11. Ball, J. s. et al. ACS Div. Petrol. Chem., Preprints, 1(1), 241 (1956).
12. Rho, J. H., A. J. Bauman, T. F. Yen and H. Boelteger. Space Biol. Conf., Houston, 1971.
13. Yen, T. F. in Role of Trace Metals in Petroleum. (Ann Arbor, Michigan: Ann Arbor Science Publishers, 1975).
14. Caughey, W. S. and A. H. Corwin. J. Am. Chem. Soc., 77, 1509 (1955).
CHAPTER 13
AMERICAN OIL REFINERIES: CAN THEY YIELD VANADIUM?
R. P. Fischer U.S. Geological Survey Denver Federal Center Denver, Colorado
This paper presents an idea that might not have occurred to some people in the petroleum industry, namely, the possibility of marketing significant amounts of vanadium recovered from the refining of oil. Contemplation of any commercial venture of this sort requires consideration of the supply-and-demand situation, the technology of recovery, and the economics of recovery. As the vanadium commodity geologist for the Geological Survey, I can attest that the supply of vanadium from domestic producing sources is expected to be short relative to the future expected domestic demand. The problems of the technology and economics of recovery of vanadium from oil, however, are outside my field of competence. Nevertheless, on the basis of a few minor vanadium-recovery operations reported in literature, it would seem reasonable to think that the principles of vanadium recovery are available and that the economics of recovery might be favorable, especially if vanadium is removable with constituents that must be removed to avoid pollution.
VANADIUM SUPPLY AND DEMAND
Currently the bulk of the world's vanadium is recovered as a by-product from deposits that are relatively low in vanadium; resources in deposits of this kind are large.1 Deposits that can be mined profitably for vanadium alone must contain at least 1% V20sf but not many deposits of this kind are known.
Most of the foreign supplies of vanadium are recovered as a by-product from iron ores. As large supplies of these ores are available, foreign vanadium
201
202 THE ROLE OF TRACE METALS IN PETROLEUM
production probably will continue at a substantial level and the foreign market will be highly competitive.
Figure 13.1 is a generalized graph showing vanadium production from the principal sources for every tenth year from 1910 to 1970. Its purpose is to show the large increase in production, in response to demand, since 1950.
Figure 13.1. Generalized graph showing the principal sources of vanadium, 1910-70. Data from published figures of U.S. Geological Survey, 1910 and 1920, and U.S. Bureau of Mines, 1930-7, except U.S.S.R. data for 1960 and 1970, which are estimates by R. P. Fischer.
Domestic supplies of vanadium are obtained from a deposit in Arkansas that is mined for vanadium alone, from some deposits in the western states that yield coproduct uranium and vanadium, and from slags derived from making elemental phosphorus from phosphate rock mined in Idaho. The vanadium-production potential of these deposits does not appear to be adequate to satisfy long-range domestic requirements.
Figure 13.2 shows domestic vanadium production and consumption, 1960 to 1968, and the domestic maximum and minimum forecast demand for vanadium from 1968 to the year 2000, as estimated by Griffith.2 Cumulative requirements at the maximum demand rate from 1968 to 2000 are 520,000 short tons of vanadium,
CAN AMERICAN OIL REFINERIES YIELD VANADIUM? 203
and 420,000 tons at the minimum rate. Griffith2 also estimated cumulative production from currently producing domestic sources from 1968 to 2000 to be 115,000 tons of vanadium; the dotted line on Figure 13.2 is my estimate of the yearly rate of this production. If the cumulative figures are correct, they show a domestic vanadium deficiency of some 300,000 to 400,000 tons between 1968 and 2000. If we do not find new domestic sources of vanadium to make up this deficiency, we will have to buy and import this vanadium. At the current price of $1.50 per pound V2O5 (about $5,400 per ton vanadium), this deficient vanadium would be worth at least $1.5 billion.
Figure 13.2. Graph showing domestic vanadium production
and consumption, 1960-68, and domestic forecast demand and estimated production from currently producing sources, 1968-2000.
VANADIUM IN PETROLEUM AND ITS POTENTIAL
Many crude oils contain little or no vanadium, but some contain as much as several hundred ppm (parts per million).3’ h This vanadium tends to
204 THE ROLE OF TRACE METALS IN PETROLEUM
accumulate in the residues resulting from the natural or industrial distillation or combustion of these oils. Many asphaltites contain about 1% vanadium.5 The ash and soot from some oil-burning furnaces have long been a minor commercial source of vanadium.
Since 1965, the refinery of Canadian Petrofina, Ltd., Montreal, Canada, has recovered vanadium commercially from ash obtained by burning residual oil ("fluid coke");6 the crude oil used contains only about 130 ppm V. The recovery of vanadium from the fly ash of burning a similar residual oil obtained from refining Athabasca tar sands, Alberta, Canada, has been proposed;7 the extracted oil contains about 200 ppm V.8
Vanadium is recovered, or its recovery is proposed, by similar practices in the U.S.S.R. and Hungary. ’ 10 Perhaps some vanadium could be recovered profitably by similar practices in some refineries in the United States; antipollution controls needed in the future might enhance the recovery of the vanadiumbearing ash.
The total amount of vanadium in residual fuel oil is probably greater than in any other product of petroleum refining. About 668 million barrels of fuel oil were consumed in the United States in 1968, and this material is estimated to have contained nearly 19,000 tons of vanadium.11 At the current price, this amount of vanadium is worth about $100 million. Desulfurization of fuel oil can reduce the vanadium content about proportionate to the reduction of sulfur.12 If fuel oil is desulfurized to reduce atmospheric pollution, can a significant amount of vanadium be recovered profitably from the catalysts used in the desulfurizing process or at some other stage in this process?
CONCLUSIONS
The need for new domestic sources of vanadium to meet future demands warrants consideration of recovering vanadium from petroleum products. The need to reduce other pollutants in petroleum products might enhance the technology and economics of vanadium recovery.
This chapter is not copyrighted by the publisher as it was prepared by the author as part of his employment by the U.S. government.
CAN AMERICAN OIL REFINERIES YIELD VANADIUM 205
REFERENCES
1. Fischer, R. P. in United States Mineral Resources, u.s. Geol. Surv., Prof. Paper 820 (1973), p. 679-688.
2. Griffith, R. F. Mineral Facts and Problems, u.s. Bureau of Mines, Bull. 650 (1970), p. 417.
3. Whisman, M. L. and F. 0. Cotton. Oil Gas J., 69 (52),
111 (1971).
4. Nelson, W. L. Oil Gas J., 70 (32), 48 (1972).
5. Abraham, H. in Historical Review and Natural Raw Materials, Vol. 1, 6th ed. (Princeton, N.J.: Van Nostrand Co.,
1960), p. 370.
6. Whigham, W. Chem. Eng., 72 (5), 64 (1965).
7. "Athabasca Crude to Hit Pipeline Soon," Oil Gas J., 65 (41), 76 (1967).
8. Scott, J., G. A. Collins and G. W. Hodgson. Can. Inst. Mining Met., Trans., 47, 36 (1954).
*9. Volkova, P. I., N. A. Vatolin, A. A. Ryzhov and N. N. Belyaeva. Tr. Inst. Met. Sverdlovsk, 17, 118 (1969)?
Chem. Abs., 73 (4), abs. no. 17611e (1970).
10. Lovasi, J., M. Miskei, L. Tomcsanyi, P. Siklos and L. Farkas. Hungarian patent, Teljes 1113 (Cl. C. Olg), October 24, 1970? Chem. Abs., 74 (20), abs. no. 101219m (1971).
11. Davis, W. E., and Associates. "National Inventory of Sources and Emissions. Arsenic, Beryllium, Manganese, Mercury and Vanadium," Report for Environmental Protection Agency, Contract No. CPA 70-128, 1971, p. 47.
12. Radford, H. D. and R. G. Rigg. Hydrocarbon Process, 49 (11), 187 (1970).
This Page Intentionally Left Blank
CHAPTER 14
FREE WORLD SUPPLY AND DEMAND FOR VANADIUM FROM 1973 THROUGH 1980
F. J. Shortsleeve
Mining and Metals Division, Union Carbide Corporation 270 Park Avenue, New York, New York 10017
Union Carbide has recently completed a study of the Free World supply and demand for vanadium.1 The conclusions of the study are substantially different from those conducted earlier due to changing market demand and because of recently announced plans by, the basic producers of the Free World to expand production capacities. This paper presents the results of the recent study.
Consumption of vanadium has increased steadily since the early 1960s due principally to the increased demand for vanadium-bearing high strength, low alloy (HSLA) steels; furthermore, it is expected that the construction of thousands of miles of large diameter vanadium steel pipelines, along with increasing use of high strength structural steels, will continue to improve the demand for vanadium. Consequently, Free World demand is expected to increase from 38 million pounds of vanadium in 1973 to 51.7 million pounds in 1980.
On the other hand, throughout that period Free World milling capacity is expected to be well in excess of Free World demand. The milling capacity of the present Free World basic vanadium producers is estimated as 42.5 million pounds* for 1973 and is expected to increase to 58.8 million pounds in
♦Vanadium values are the calculated quantities of vanadium recoverable from vanadium-bearing slags and from V205, assuming 85% recovery of V205 from slag and 92% recovery in conversion of V205 to FeV type products.
207
208 THE ROLE OF TRACE METALS IN PETROLEUM
1980. New producers have announced plans to install 13.1 million pounds of additional capacity, bringing the estimated 1980 production to 71.9 million pounds of vanadium, representing 139% of projected demand.
Within the United States milling capacity is estimated at 19 million pounds of vanadium. A new producer has announced plans to enter the business in 1976, bringing domestic production capacity to 21.1 million pounds. These figures are well in excess of the 1973 estimated demand of 12.5 million pounds for the United States and Canada, and the production is adequate to satisfy the projected demand of 16.1 million pounds in 1980. In addition to basic vanadium oxide producers, a major domestic converter of ferro- vanadium is now producing millions of pounds of vanadium per year for sale in the United States from imported, duty free, steel slags.
The need to reduce pollutants in petroleum products may provide still another source of vanadium; however, in view of present and projected milling capacities of basic producers, the relative economics of recovery of vanadium from petroleum products should be carefully assessed before capital investments are seriously considered.
SOURCES OF VANADIUM
Vanadium is found widely in nature and is more plentiful than copper, zinc or lead. The known, commercially viable ore deposits are very extensive compared with present and projected world demand.
The major sources are:
1. vanadium-uranium coproduct carnotite ores of the Colorado Plateau
2. vanadiferous clays in Arkansas
3. titaniferous vanadium-bearing magnetites in South Africa, Russia, Norway and Finland.
Other sources of vanadium are the vanadium-bearing phosphate ores of Idaho, by-product slags of lead mining operations in South West Africa, and bauxite operations in France. Significant quantities of vanadium are also available in boiler scale and other residues resulting from the combustion of vanadiumbearing fuels for power generation.
Vanadium is usually produced as a by-product or coproduct along with uranium, phosphorus, iron, titanium and, in one instance, copper, lead and zinc.
VANADIUM SUPPLY AND DEMAND 209
Only the Arkansas vanadiferous clays and a portion of the titaniferous magnetites of the Bushveld complex of South Africa are worked for vanadium values only.
At present, magnetites of South Africa, Russia, Norway and Finland account for a substantial portion of the world vanadium supply, yielding slags containing 15% to 27% V205. The reserves of present working deposits contain sufficient vanadium to supply world requirements many times over for decades to come.
Very extensive, nonproducing, vanadium-bearing magnetite deposits exist in Australia, New Zealand, Canada and India similar to those now being worked.
The deposits in the Singhbhum area, Bihar and Orissa, India are reported to have 20 million tons of ore reserves averaging perhaps 2% V205,2 a quantity sufficient to supply the total requirements of the Free World for many years.
Slags, rich in vanadium oxide, from magnetite operations are transported to major industrial areas of the Free World to be processed to vanadium oxide, which is converted to ferrovanadium by aluminothermic or electric furnace reduction. In some instances, the slags are reduced directly to iron-vanadium steelmaking additives by duplex electric furnace processing. Ferrovanadium products containing 25% to 85% vanadium are used for steelmaking throughout the world, and the impurity elements, Al, Si, Mn, P, S and 0, are maintained at required levels. In the United States a product made by carbon reduction of pure vanadium oxide in vacuum is used extensively. It contains about 84% vanadium and 12% carbon.
FREE WORLD MARKETS
The steel industry accounts for over 90% of the present Free World demand for vanadium, and increasing demand in steel applications is responsible for most of the projected growth. Vanadium is used also as an alloying element in titanium-base alloys and as vanadium catalysts by the chemical industry. Table 14.1 displays estimated vanadium usage in 1973 by major end use for the Free World.
In steel applications, vanadium is used in the production of KSLA steels, tool and die steels, open die forgings and to some extent as a strengthening agent in plain carbon steels. The titanium industry employs vanadium as an alloy addition to titanium- base alloys used principally in air-frame and gas
210 THE ROLE OF TRACE METALS IN PETROLEUM
Table 14.1
Estimated 1973 Free World Vanadium Consumption by Major End Uses
Consumption Total Free World
End Use
lb., V 10s
Total %
Steel
Alloy steel
5.6
16
Tool steel
9.0
26
Carbon steel (rebar, piling)
2.2
6
HSLA (incl. line pipe),
castings, forgings
15.8
45
Total steel uses
32.6
93
Other
Titanium, chemicals
2.3
7
Total-all uses
34.9
100
Exports to Communist nations
3.1
Consumption
38.0
turbine engine construction, and usage in the United States approaches one million pounds of vanadium per year. In the chemical industry, vanadium is used chiefly as a catalyst in the production of sulfuric acid, maleic anhydride, phthalic anhydride and adipic acid.
FREE WORLD CONSUMPTION
Table 14.2 shows estimated 1973 and forecast 1980 vanadium consumption in Free World markets.
Total Free World demand is 34.9 million pounds of vanadium in 1973 and is projected to increase at 4.6% per year to 47.8 million pounds in 1980. Exports to Communist countries are estimated at 3.1 million pounds in 1973 and 3.9 million pounds in 1980. The total Free World market, therefore, is 38.0 million pounds in 1973 and is expected to grow to 51.7 million pounds in 1980.
VANADIUM SUPPLY AND DEMAND 211
Table 14.2
Vanadium Consumption by Major Free World Markets (In Millions of Lbs. Vanadium)
V Consumption
Average Annual
Major Market Areas
1973
1980
Growth Rate %
Canada and U.S.A.
12.5
16.1
3.7
Western Europe
14.9
19.9
4.2
Other Free World nations
7.5
11.8
6.3
Total Free World
34.9
47.8
4.6
Export to Communist nations
3.1
3.9
3.3
Total Free World Market 38.0
51.7
4.5
The consumption of
vanadium
in Western Europe
is forecast to increase
at a rate
of 4
.2% per year
from 14.9 million pounds
in 1973
to 19
.9 million
pounds in 1980. The growth in demand is due principally to the anticipated use of vanadium steel for the construction of gas and petroleum pipelines and the emergence of strong national steel industries in certain countries of Western Europe. Furthermore, consumption of vanadium-bearing tool and die steels is expected to increase the demand for vanadium by the specialized steel industries of Austria and Sweden.
Demand for vanadium in the United States and Canada is nearly equal to that of Western Europe.
The steel industry in the United States has not yet installed the equipment necessary to fabricate the new large diameter (over 42" O.D.) line pipe being specified for many major line pipe projects. On the other hand, Canada, Japan, West Germany and Italy are well equipped to produce the pipe and are expected to be the major recipients of line pipe orders. As a result, increasing demand for vanadium in the United States is expected to be modest and, in the absence of other major developments, such as automotive HSLA use, will remain at 3% per year through 1980. The potential application of HSLA steels to automobile bumpers, frames, engine mounts, etc., could increase United States vanadium consumption by 10-15% or 1 to 1.5 million pounds per year. However, competition from other materials precludes an accurate appraisal at this time.
212 THE ROLE OF TRACE METALS IN PETROLEUM
FREE WORLD PRODUCTION
The Free World production capability of present producers is expected to increase from 42,5 million pounds of recoverable vanadium in 1973 to 58.8 million pounds in 1980. The projection includes the expansion of Union Carbide1s South African facility to a level of 6.2 million pounds of recoverable vanadium in 1976 and 10.3 million pounds in 1978. Furthermore, the production capability of new basic producers is estimated as 13.1 million pounds in 1980, bringing total Free World production capacity to 71.9 million pounds at that time.
Several vanadium properties are being evaluated as additional sources of vanadium, but firm determinations have yet to be made relative to economic viability. Substantial vanadium reserves are indicated for many of these properties, and a decision to put any one into production would result in a significant addition to the projected capacity.
SUPPLY VERSUS DEMAND
The projected Free World supply and demand are compared in Figure 14.1 and in Table 14.3. Production capacity is estimated at 42.5 million pounds of vanadium in 1973 and consumption at 38 million pounds, a surplus of 4.5 million pounds or 12%. In fact,
1973 production capability is sufficient to supply Free World needs through 1975. The projected mill capacity of the present producers is adequate to satisfy the expanding demand for vanadium through 1980, and the additional production anticipated by new producers is likely to result in a supply well in excess of Free World demand.
Mill capacity within the United States is estimated at 19.0 million pounds of vanadium for 1973 through 1980. The United States capacity is well in excess of the 1973 demand for 12.5 million pounds for the United States and Canada and is adequate to satisfy the projected demand of 16.1 million pounds in 1980. Furthermore, a new producer has announced plans to produce vanadium' oxide in the United States, bringing the total production capacity to 21.1 million pounds of vanadium by 1976. In addition to the basic United States V205 production capability, a major domestic converter is now producing millions of pounds of ferrovanadium per year from duty free steel slags imported from South Africa, a source, that if further developed, could satisfy the entire projected domestic demand for vanadium.
VANADIUM SUPPLY AND DEMAND 213
80
70
60
50
40
z
o
30
1 1 1 EXISTING PRODUCERS ^ PLUS NEW PRODUCERS ,
/
L^ex
r PROI
ISTING
DUCERS
PRC
IDUCTIOIS
1 CAPACI1
/
ty
7s
1973 i /!
Y**
vjr
v
ROJECTE
GR
\
D CONSUP 4.5%/YR OWTH RA
OPTION*
,TF
i)-@r*
/
\gr
ACTUi
30NSUMP
I 1
AL
TION*
20”
1966 1968 1970 1972 1974 1976
•INCLUDES EXPORTS TO COMMUNIST NATIONS.
1978
1980
Figure 14.1. Vanadium supply/demand—Free World 1973-1980.
Table 14.3
Free World Supply and Demand (In Millions of Pounds of V)
Free World Production Capacity
Free World demand
Supply as a % of Demand
1973
42.5
38.0
112
1974
46.0
39.7
116
1975
52.9
41.5
127
1976
62.4
43.4
144
1977
66.2
45.3
146
1978
70.9
47.4
150
1979
71.9
49.5
145
1980
71.9
51.7
139
214 THE ROLE OF TRACE METALS IN PETROLEUM
CONCLUSIONS
In the foregoing, it may be seen that the milling capacity of the domestic facilities and, indeed, throughout the Free World will be more than adequate to satisfy the projected demand for vanadium. The recovery of vanadium from petroleum products may represent still another source of vanadium that may or may not be suitable for processing through existing mills. Under the circumstances, the relative economics of recovery of vanadium from petroleum products should be carefully assessed before capital investments are seriously considered.
REFERENCES
1. Brown, C. M., L. C. Johnston and G. J. Goetz. "Vanadium— Present and Future," Union Carbide Corporation, Mining and Metals Division, presented before the Canadian Institute of Mining and Metallurgy on August 28, 1973.
2. Fischer, R. P. "Vanadium," U.S. Geol. Survey Prof. Paper 820.
INDEX
This Page Intentionally Left Blank
INDEX
acetic acid 197 acids 195 acid treatment 27 allomerization 17,18 analytical method selection 60 (see also trace analysis) anisotropy-isotropy 172 antimony 38,40,43,48,92,113 as a lubricant additive 141 content in asphalt 140 content in crude oils 136 physiological effects 126 (see stibines) antioxidant additives 141 (see also lubricant additives)
antiwear agents 141 arsenic 31,38,48,92,113,114 content in crude oils 136 physiological effects 126 Asoidia mentula 19 asphalt 138-140 concrete 140
asphaltenes 7,13,22,33,35,40, 41,43,44,45,48,54, 55,99,111,120
Athabasca tar sands 164,165, 204
atmospheric tower bottoms 161 (see also molybdenum) atomic absorption
analysis 154,156-159,161 background effects 157 flame photometry 79,81 spectrophotometry 163 (see also instrumental methods)
atomic emission
flame photometry 79,81,82 spectroscopy 77 (see also instrumental methods)
Bachaquero crude 174 barium
as a lubricant additive 141 content in crude oils 136 physiological effects 126 bauxite 208 Baxterville resin 12 bitumens 170 boron
as a lubricant additive 141 physiological effects 127 Boscan crude 38,151,155,174, 187
bromine 113,114
cadmium 93,101,135
as a lubricant additive 141 content in crude oils 136 physiological effects 127 californium 68 carboniferous era 19 cation-radicals 188 cesium 92,113 chlorine 10,113,114 chlorophyll 10,13 chromium 31,38,92,113,118 as a lubricant additive 141 content in asphalt 140 content in crude oils 137 physiological effects 127
217
218 THE ROLE OF TRACE METALS IN PETROLEUM
cobalt 31, 92,113,114,118 content in asphalt 140 content in crude oils 136 physiological effects 128 colorimetric analysis 89 connate 2 0
(see also subsurface water) copper 31,38,92,135,195 analysis by AA and XRF 156-159
content in asphalt 140 content in crude oils 136 physiological effects 128 trace analysis in petroleum products 149
copper, etioporphyrin I 196 copper, ms-tetraphenyl- porphyrin 196 Covdium edule 19 corrosion inhibitors 141 corrosion products 119 crude oils 2,31,34,38,96,99, 100,104,111-120 asphaltene fraction 116 heavy 5,45 metal content 136 separation of components 34 Curie-Weiss dependence 12
demetallation kinetics 195 of metalloporphyrins 28, 195-200 reagents 196 denitrification 171 deoxophy1loerythroetiopor- phyrin 8
(see also porphyrins) desulfurization 2,171,204 detection limits 102 detergents 141 devanadylation 13 dialysis 27
direct dipolar term 173
(see also vanadyl complexes) distillate fractions 135,138 distillate fuels 137
electron discharge 27 electron spin resonance 89,168
emission spectrography 89 energy dispersive X-ray spectrometers 75,76 engine oils 144 etioporphyrins 8,21,36,175, 185,188
(see also porphyrins, vanadyl complexes) europium 113
extreme pressure additives 141
factor analysis 114 Fermi contact term 173
(see also vanadyl complexes) flame atomic absorption 89 flameless
atomic absorption 89 methods 82 formation waters 118
gallium 32,113 gamma-ray spectrometer 93 gas-oil fraction 135 gel permeation chromatography (GPC) 34,35,43,172,184 geochemical prospecting 31 geothermal temperature 20 germanium 6,32 glacial acetic acid 196 gold 92,113 graphization 22
heterocycles 2 hydration 10 hydrocarbons 1
(see also petroleum) hydrodynamic flow 115 hydrolysis 17
industrial oils and greases 142
instrument precision 60 instrumental methods 65,86 internal standards 151,152 iodine 113
ion exchange 27,151,152 iron 31,38,92,113,118,135,195 analysis by AA and XRF 156-159
content in crude oils 136
INDEX 219
petroleum products, trace analysis of 149 physiological effects 129 porphyrins 119 (see also porphyrins)
kerogens 170 kinetic studies 195
lead 31,135
as a lubricant additive 141 content in crude oils 136 mining 208
physiological effects 129 ligands
correlation 173 oxygen-containing 119 (see also vanadyl complexes) liquid chromatography 34,37, 49
lubricants 139,142 additives 141 industrial 143 waste 140,142,143 magnetite deposits 209 manganese 31,92,113,114,118, 135
content in asphalt 140 content in crude oils 136 physiological effects 129 mass spectrometry 83,84 spark source 84 maturation phenomena 116 mercury 34,48,92,113
as a lubricant additive 141 content in crude oils 136 physiological effects 129 mesochlorins 10 mesoporphyrin 48 metals
abundance in crude oils 31 compounds 50 contamination 125 content in petroleum 1-28, 65-85
content in petroleum products 31,123-145 origin of compounds 50 physiological effects 123, 126-133
removal 183 toxicity 124 transport 125 metal-ion complexing 54 metallo-organic compounds 118 (see metalloporphyrins) metalloporphyrins 1,7-11,28, 36,37,48,49,183, 186,189,191 demetallation 28,195 solutions 198 metamorphism 170 methanesulfonic acid 196 methanol 47 MIBK 156
migration phenomena 116 mixed ligands 11 molecular orbital calculation 177
molybdenum 6,31,92 analysis 164
as a lubricant additive 141 content in asphalt 140 content in crude oils 136 determination 162,163 occurrence in petroleum 161-166
physiological effects 130 (see also atomic absorption, petroleum)
neutron activation analysis
33,37,38,65,89,90,
100,108,112
radiochemical separation 90,91
neutron sources 68 nickel 31,38,51-53,92,106, 113,114,118,135, 139,149,155,195 analysis by AA and XRF 156-159
as a lubricant additive 141 content in asphalt 140 content in crude oils 136 physiological effects 130 porphyrins 36,43,51 trade analysis in petroleum products 149 nitrogenation 162
220 THE ROLE OF TRACE METALS IN PETROLEUM
nitrogen-containing ligands 119
nitrogen superhyperfine splittings 172 nitrous oxide combustion techniques 156,158 nonporphyrin metals 1,6, 11-13,54
nuclear reactors 68,92
octaethylporphine 185 oil refineries 201 oxidation reactions 167 oxidative demetallation 183 of oxovanadium porphyrins 183-191
peleypoda 19 petroleum 1,53,56,203
biogenic origin 20,32,90 contamination 1,2,61 crudes 183
geochemistry 31,89,90 hydrocarbons 1 products 208
used petroleum products 139 petroporphyrins 7,16,20,187, 190
biogenesis 13 etio-type 190 phyllo-type 190 rhodo-type 190 Phaleusia manillata 17 pheophorbides 168 pheophytinization 13 phosphate ores 208 photooxidation 23 photoreduction 23 phylloerythrin 10 polarography 89 porphyrins 8,11,23,49-55, 163,183,188 aromatic 168 iron 119 nickel 118 vanadyl 118,177,188 potassium 92 Precambrian shale 22,168
Q-mode factor analysis 114
radiochemical separation 90, 91
(see also neutron activation analysis)
re-refining capacity (US) 142 residual fuel oil (RFO) 103, 106,107,138,139 resins 22,41
R-mode factor analysis 117 rubidium 92,113
sample
excitation 78 processing 61,62 storage 62 scandium 92,113 Sdom crude 12 sediments 20,22 selenium 113,114
as a lubricant additive 141 content in crude oils 136 physiological effects 131 silver 131,135
content in crude oils 136 sodium 92,113,114 spectrographic determination 2 standard addition calibration 155,156
stibines alkyl 48 aryl 48
subsurface waters connate 20 vadose 20 sulfur 113,114 sulfuric acid 196,200 surface waters 125,138
tessellations 23 tetradentates of mixed ligands 11
(see also nonporphyrin metals)
tetraphenylporphine 185 tin
as a lubricant additive 141 content in crude oils 136 physiological effects 132
toxicity 124
INDEX 221
trace analysis 59,65,149-159 method selection 60 precautions 61 trace elements 31,62 contents of crude oils 89-109,136 determination 59 distribution in crude oils 42
geochemistry 111-120 sampling 62 trace metals 59,65 transalkylation 20,22 transition energies 178,179 transport of metals 123
uranium 31,208 urban runoff 139
vacuum tower bottoms 161 vadose 20
(see also subsurface water) vanadiferous clays 208 vanadium 25,31,38,53,106,113, 114,118,135,139, 167,183,186,190, 191,201
analysis by AA and XRF 156-159
bonding in petroleum 167-180
consumption 201-203,207,
210,211
content in asphalt 140 content in crude oils 136 content in residual fuel oil 204
domestic supplies 202 economics of recovery 201
free world markets 209 free world milling capacity 207,208
free world supply and demand 207
in petroleum 203 physiological effects 132 porphyrins 32,36 production 201-203,212 removal 184 sources 208,209 trace analysis in petroleum products 149
vanadium/nickel ratio 32,37 vanadium porphyrin complex 32 (see vanadyl complexes) vanadium-uranium 208 vanadyl complexes 168,169, 172-177 biotic 175 viscosity 168
waste automotive oils 140,143 wavelength dispersive X-ray spectrometers 75,76 wear metals 139
X-ray
bomb ardmen t 75 diffraction 175 fluorescence 72,89,156-159 spectrometers 76
zinc 31,38,92,113 >114,135 as a lubricant additive 141 content in asphalt 140 content in crude oils 136 physiological effects 133
j* ' T. F. YEN holds a joint appointment ig®^. * at the University of
Jp Southern California
? 41 as Associate Pro-
; y fessor of Chemical
and Environmental Engineering, and of Medicine (Biochemistry). Dr. Yen received his early education in China, graduating with a BS from Central China University in 1947. He then earned both an MS in Chemistry and Chemical Engineering from West Virginia University in 1953 and a PhD in Organic Chemistry and Biochemistry from Virginia Polytechnic Institute in 1956. He has been senior research chemist for Goodyear Tire and Rubber Co. and senior fellow and section head on a petroleum fellowship at the Mellon Institute of Carnegie- Mellon University.
Dr. Yen serves as a consultant for two major oil firms and on the editorial boards of four international journals covering the fields of medicine, chemistry and energy. In recent years he has chaired symposia, panels and workshops dealing with new energy sources, including oil shale, and served on federal subcommittees on energy and environmental improvement.
Dr. Yen has published nearly 100 articles and is editor of three books, including Recycling and Disposal of Solid Wastes, published by ANN ARBOR SCIENCE in 1974. Future books edited by Dr. Yen to be published by ANN ARBOR SCIENCE include The Science & Technology of Oil Shale and Chemistry of Marine Sediments.
THE ROLE OF
TRACE METALS IN PETROLEUM
T. F. YEN,
Associate Professor of Chemical Engineering, Environmental Engineering Sciences, and Medicine (Biochemistry), Editor
Petroleum is an important source of products such as gasoline, fuel oils, lubricants, textiles and chemicals—yet there is still much to be learned about the basic science of this resource, specifically the role of trace metals. Trace metals in petroleum are of vital interest to environmental scientists because of their implications in emission and erosion. Further, improved industrial processing of trace metals would make a significant contribution to a cleaner environment.
This book is a general survey of the nature of trace metals in petroleum and includes analytical methods for their determination. Vanadium, iron, nickel, cadmium, copper, and molybdenum—their nature, determination, chemical aspects, geochemistry, occurrence in new and used petroleum byproducts and their recovery for resource use—are dealt with in detail by the expert authors in this volume. Among the methods covered are instrumental analysis, neutron activation, activation analysis, oxidative demetallation and kinetic studies. Includes 54 figures and 60 tables.
This work provides new and valuable information for mining and petroleum engineers, resource managers, pollution control engineers, metallurgists, geologists and government officials concerned with this topic.
MORE air water solid waste sewage energy BOOKS from ANN ARBOR SCIENCE
Energy Production and Thermal Effects > Gallagher 1974
Fusion Reactor Physics-Principles and Technology Kammash 1975
Fuels, Minerals and Human Survival Reed 1975
The Role of Trace Metals in Petroleum Yen 1975
Solar Energy Technology and Applications Williams 1974
Industrial Odor Technology Assessment Cheremisinoff, Young 1975
Management of Industrial Particulates: Corporate, Government, Citizen Action Heikoff 1975
Solid Waste Treatment and Disposal Kirov 1972
Waste Management, Control, Recovery & Reuse Kirov 1975 Analysis of Organic Pollutants in Water Leithe 1973 Extraction of Minerals and Energy Deju 1974
Fuel and the Environment Institute of Fuel, London 1974 Combustion—Formation and Emission of Trace Species Edwards 1974
Emissions from Combustion Engines and Their Control Patterson, Henein 1972 Recycling and Disposal of Solid Wastes Yen 1974 Disposal of Sewage and Other Waterborne Wastes imhoff 1971
Industrial Source Sampling Brenchley, Turley, Yarmac 1973 Understanding and Controlling Air Pollution, 2nd Edition Hesketh 1974
The Analysis of Air Pollutants Leithe 1972
Controlled Test Atmospheres Nelson 1971
Detection and Determination of Trace Elements Pinta
Trace Metals and Metal-Organic Interactions in Natural Waters Singer 1973 Applied Chemistry of Wastewater Treatment (8 vols) Mancy, McClelland, Pohland 1973
Mathematics for Water and Wastewater Treatment Plant Operators (2 vols) Kirkpatrick 1973
Bioassay Techniques and Environmental Chemistry Glass 1973
Instrumental Analysis for Water Pollution Control Mancy 1971
Pollution Engineering Practice Handbook Cheremisinoff, Young 1975
Wastewater Treatment Technology Patterson 1975
Water Resourcesjnstrumentation (2 vols) IWRA 1975
Science and Engineering for Pollution-Free Systems Krofchak, Stone 1975
Water and Community Development Field, Barron, Long 1974
Recycling and Disposal of Solid Wastes Yen 1974
Leading Professional Environmental Book Publisher
ANN ARBOR SCIENCE
PUBLISHERS INC
P.O. BOX 1425 • ANN ARBOR, MICH. 48106