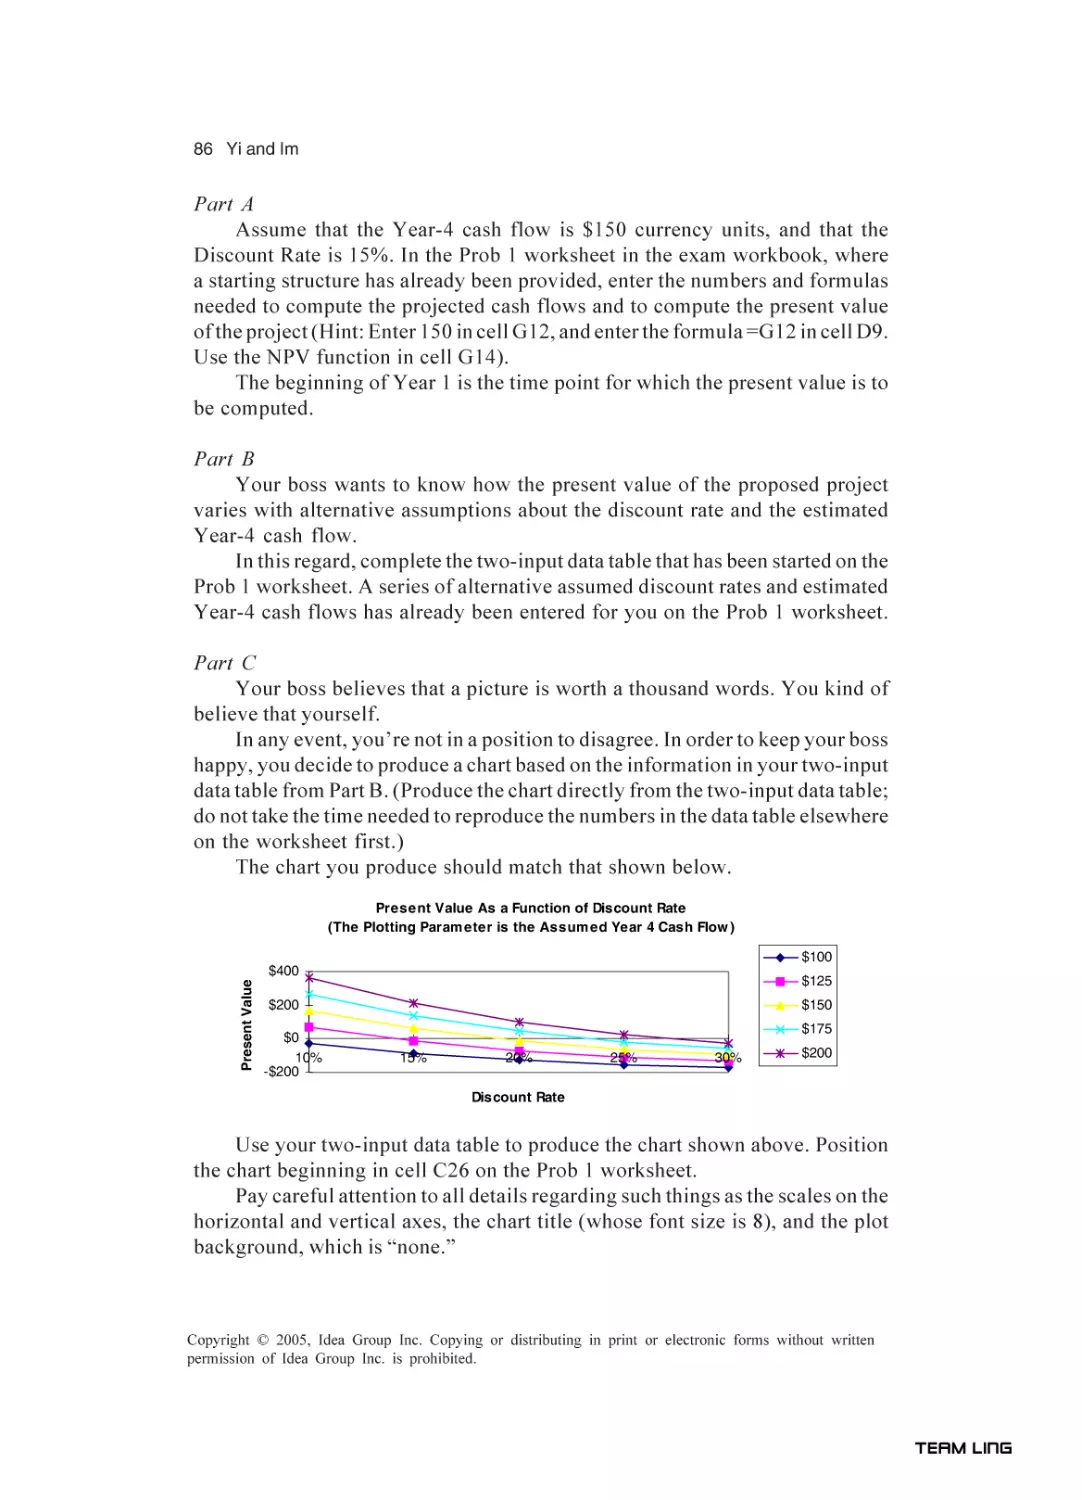
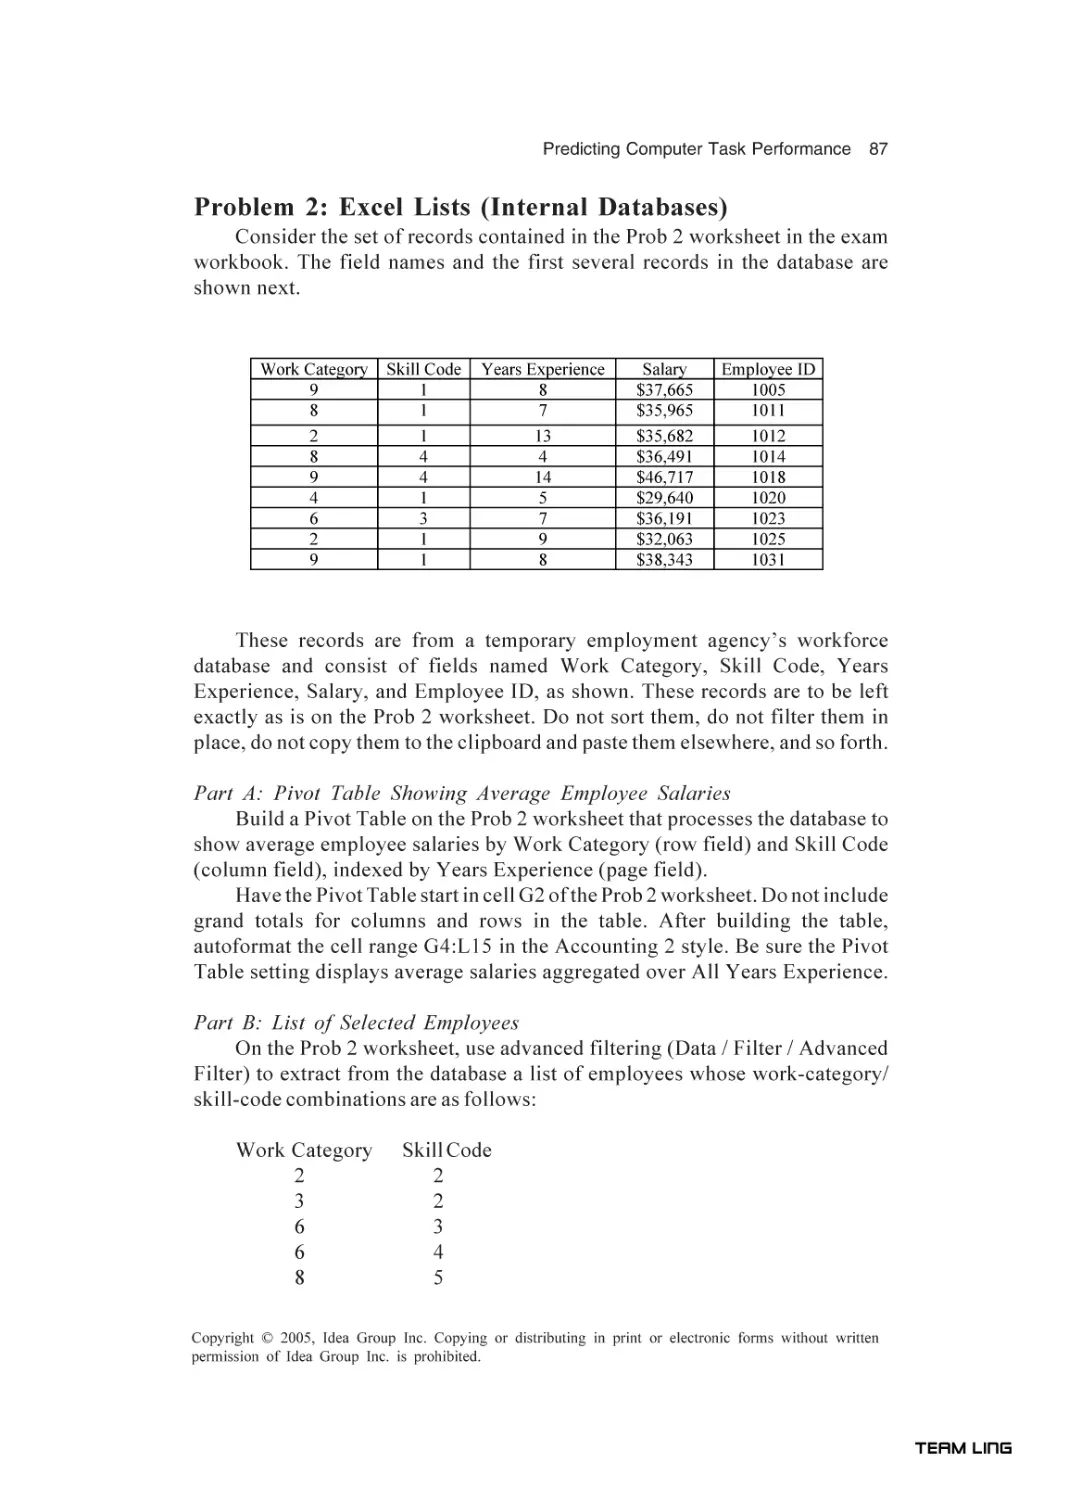
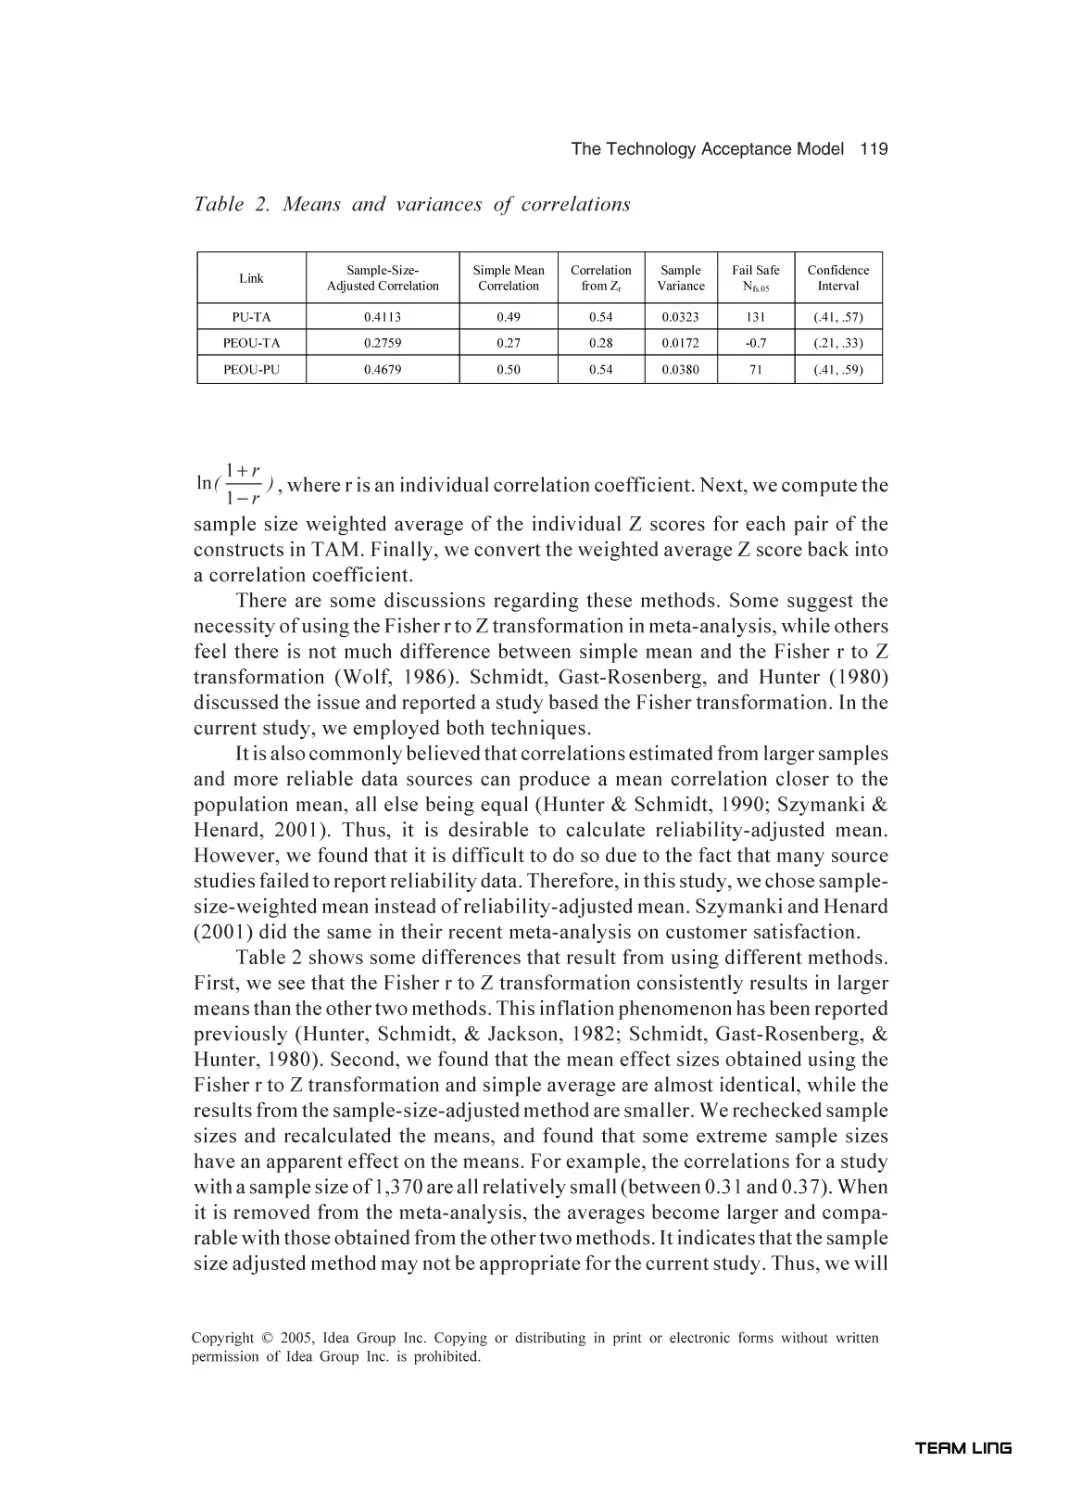
/

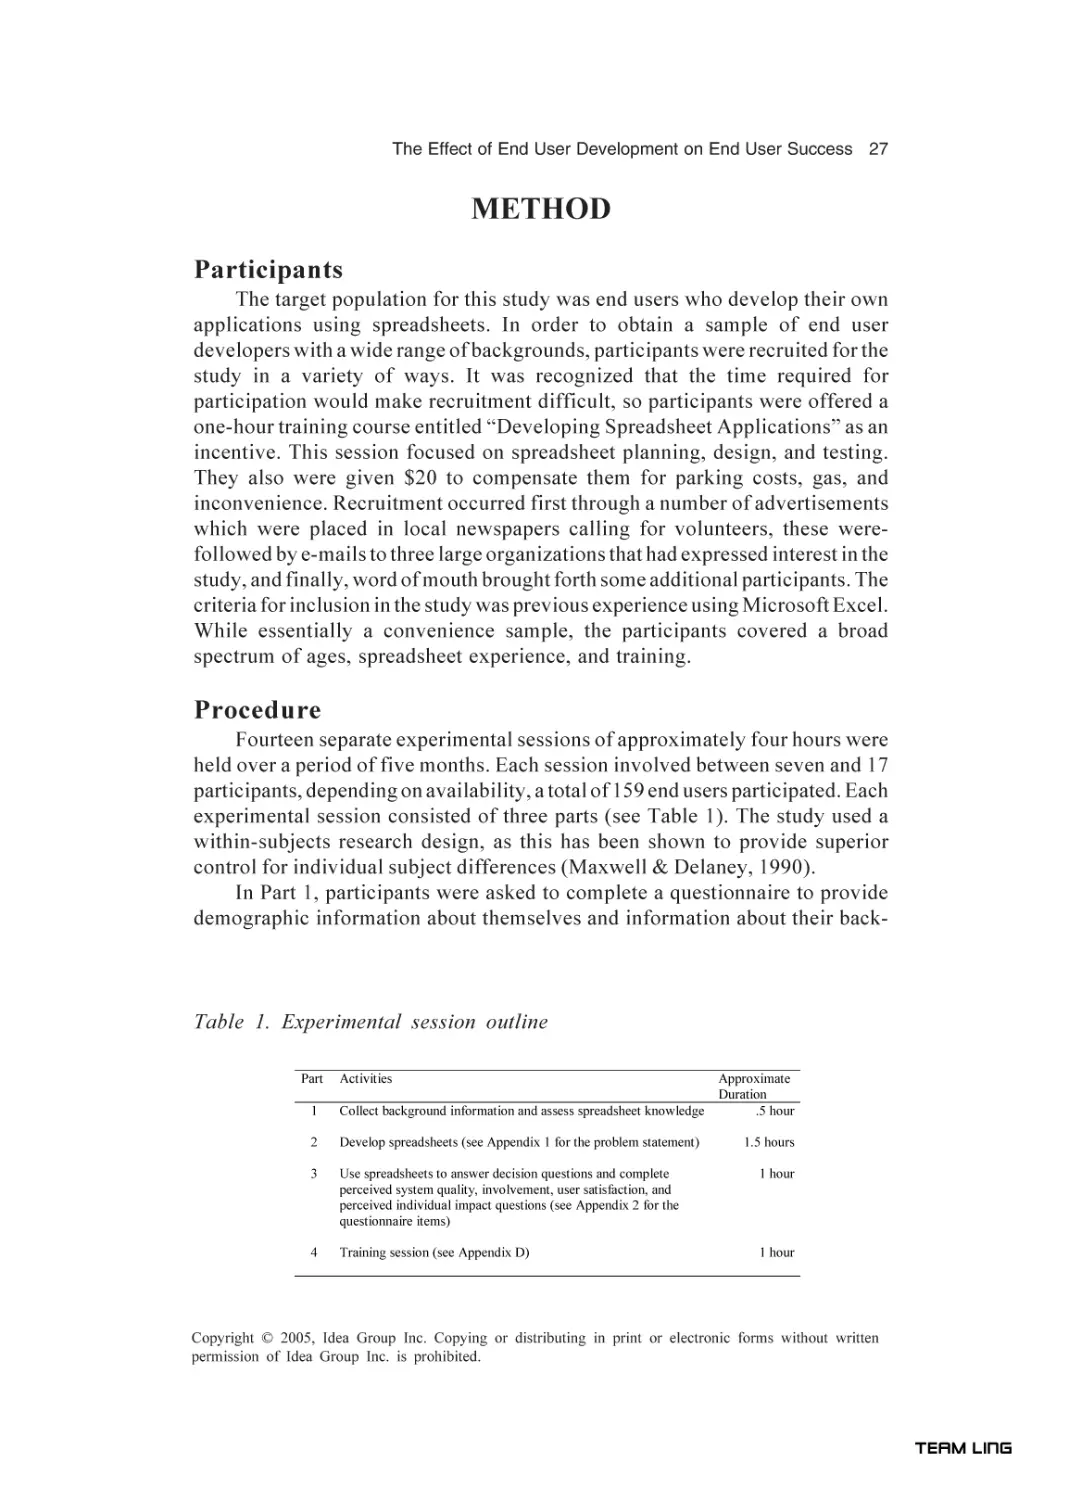
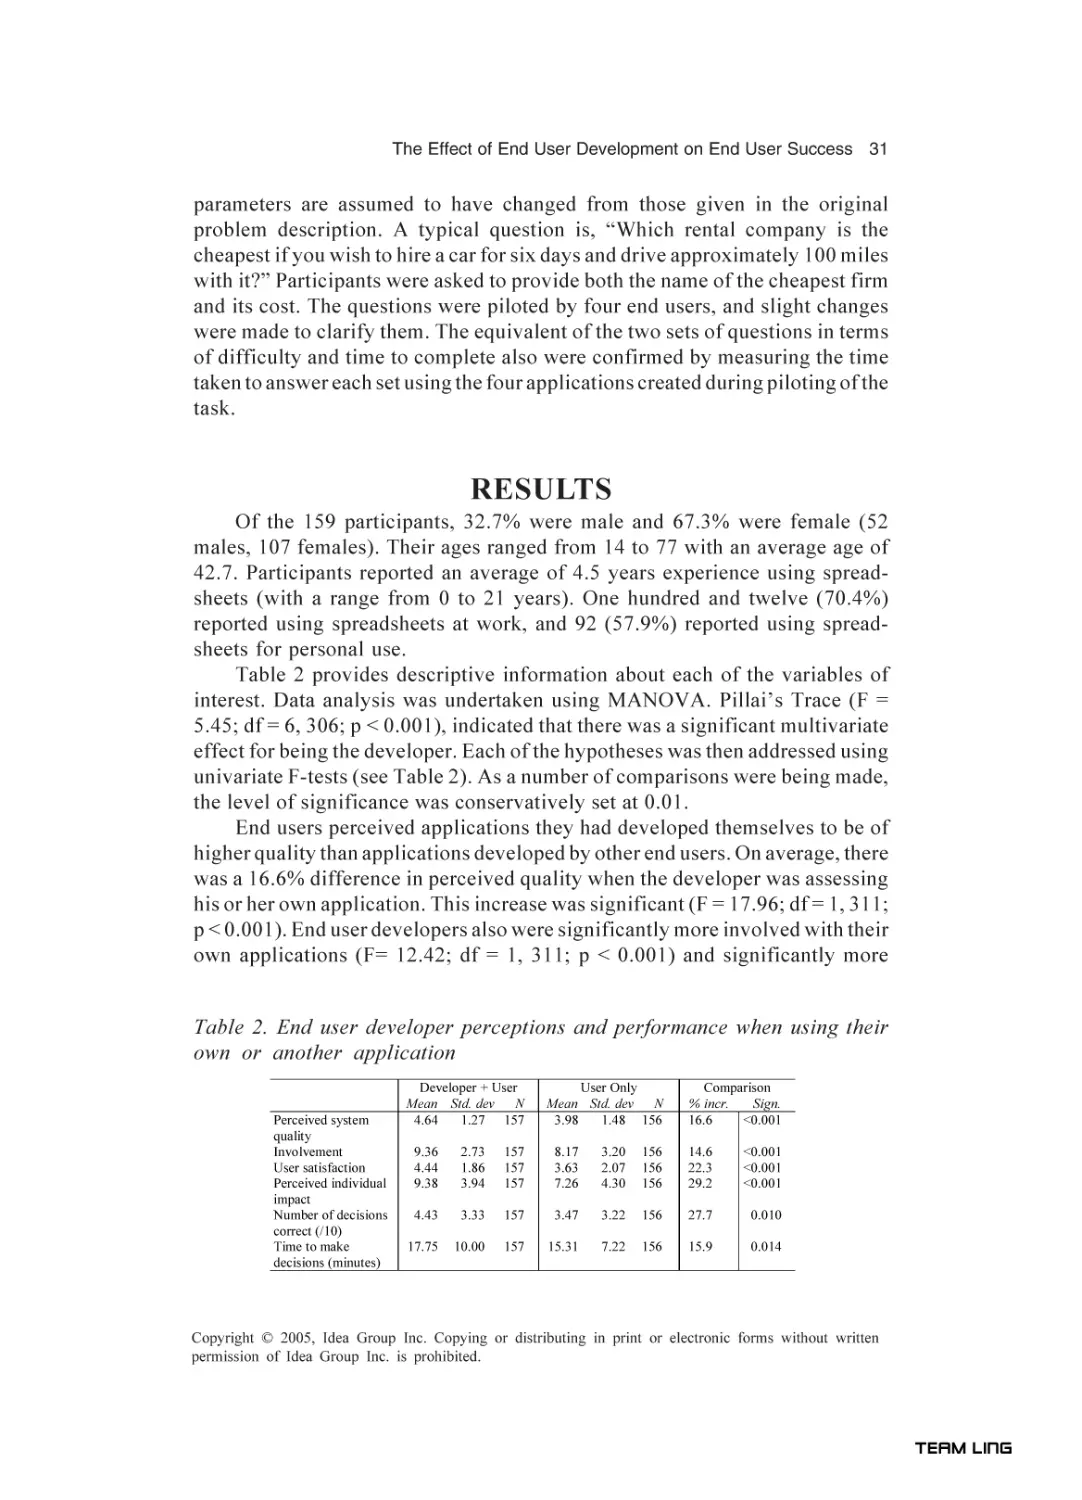
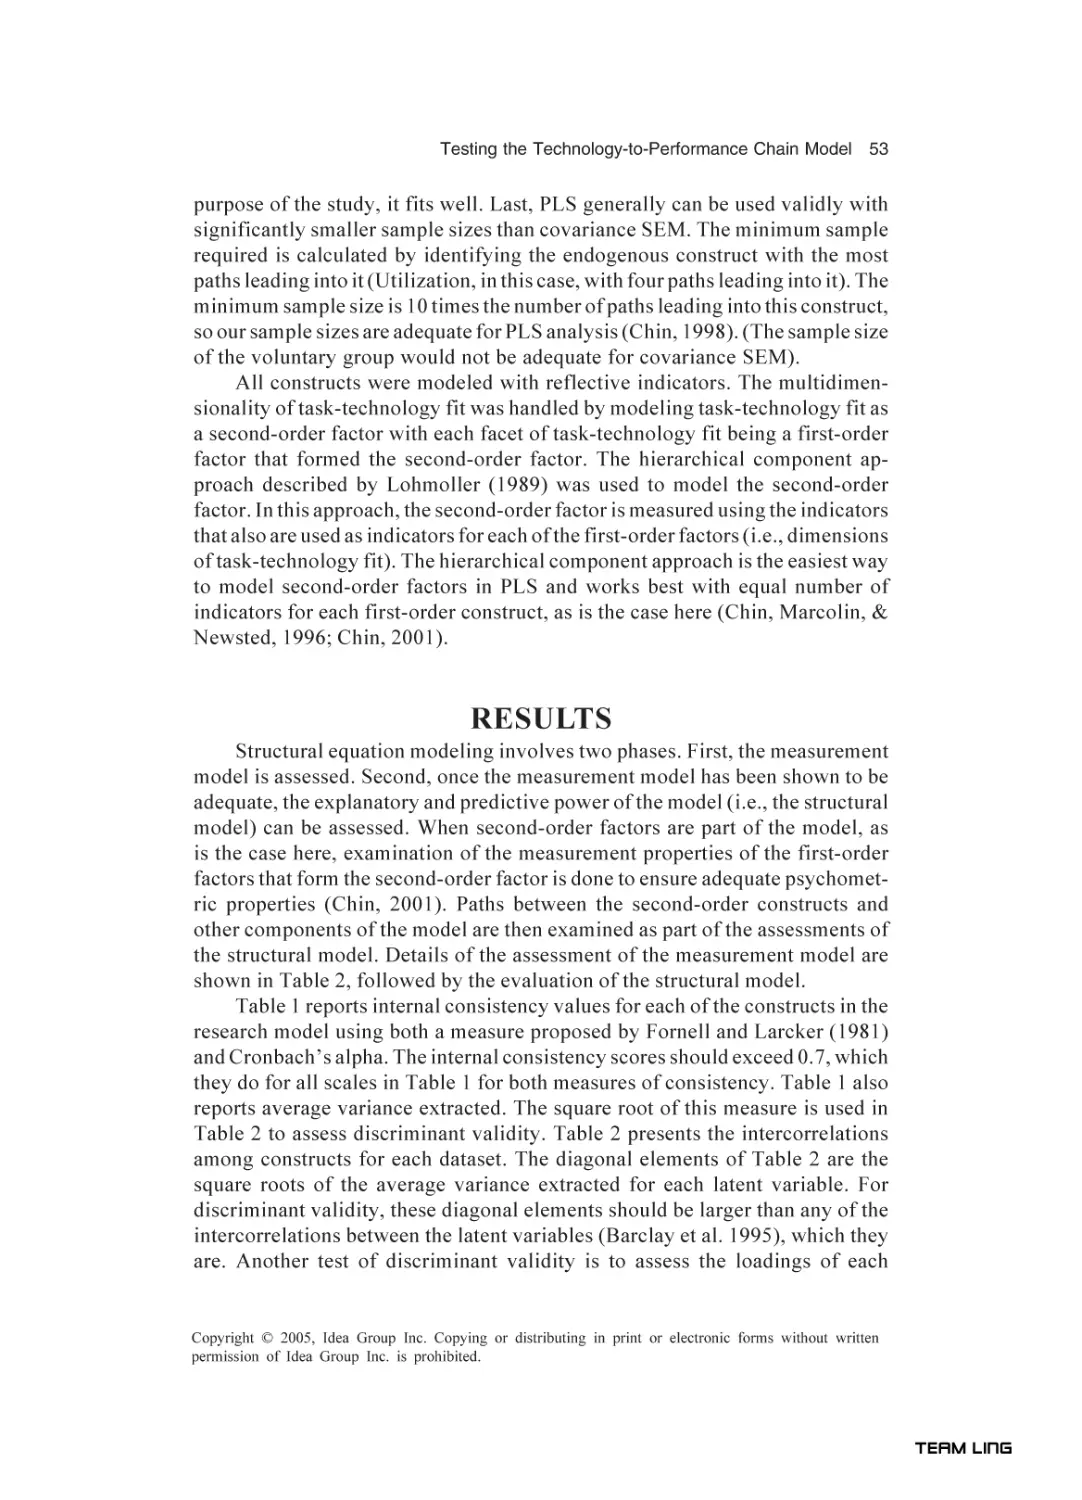


Text
TEAM LinG
Advanced Topics in
End User Computing
Volume 4
M. Adam Mahmood
University of Texas, El Paso, USA
IDEA GROUP PUBLISHING
Hershey • London • Melbourne • Singapore
TEAM LinG
Acquisitions Editor:
Development Editor:
Senior Managing Editor:
Managing Editor:
Copy Editor:
Typesetter:
Cover Design:
Printed at:
Renée Davies
Kristin Roth
Amanda Appicello
Jennifer Neidig
Sue VanderHook
Cindy Consonery
Integrated Book Technology
Integrated Book Technology
Published in the United States of America by
Idea Group Publishing (an imprint of Idea Group Inc.)
701 E. Chocolate Avenue, Suite 200
Hershey PA 17033
Tel: 717-533-8845
Fax: 717-533-8661
E-mail: cust@idea-group.com
Web site: http://www.idea-group.com
and in the United Kingdom by
Idea Group Publishing (an imprint of Idea Group Inc.)
3 Henrietta Street
Covent Garden
London WC2E 8LU
Tel: 44 20 7240 0856
Fax: 44 20 7379 3313
Web site: http://www.eurospan.co.uk
Copyright © 2005 by Idea Group Inc. All rights reserved. No part of this book may be reproduced, stored or distributed in any form or by any means, electronic or mechanical, including
photocopying, without written permission from the publisher.
Product or company names used in this book are for identification purposes only. Inclusion of the
names of the products or companies does not indicate a claim of ownership by IGI of the
trademark or registered trademark.
Advanced Topics in End User Computing, Volume 4 is part of the Idea Group Publishing series
named Advanced Topics in End User Computing Series (ISSN: 1537-9310).
ISBN: 1-59140-474-6
Paperback ISBN: 1-59140-475-4
eISBN: 1-59140-476-2
British Cataloguing in Publication Data
A Cataloguing in Publication record for this book is available from the British Library.
All work contributed to this book is new, previously-unpublished material. The views expressed in
this book are those of the authors, but not necessarily of the publisher.
TEAM LinG
Advanced Topics in
End User Computing
Volume 4
Table of Contents
Preface ............................................................................................................ vi
M. Adam Mahmood, University of Texas at El Paso, USA
SECTION I: ORGANIZATIONAL AND END U SER COMPUTING ISSUES,
PERFORMANCE, PRODUCTIVITY
Chapter I
End User Computing Research Issues and Trends (1990-2000) ...... 1
James P. Downey, University of Central Arkansas, USA
Summer E. Bartczak, Air Force Institute of Technology, USA
Chapter II
The Effect of End User Development on End User Success ........... 21
Tanya McGill, Murdoch University, Australia
Chapter III
Testing the Technology-to-Performance Chain Model ...................... 42
D. Sandy Staples, Queen’s University, Canada
Peter B. Seddon, The University of Melbourne, Australia
Chapter IV
The Role of Personal Goal and Self-Efficacy in Predicting
Computer Task Performance ................................................................... 65
Mun Y. Yi, University of South Carolina, USA
Kun S. Im, Yonsei University, South Korea
TEAM LinG
Chapter V
Measurement of Perceived Control in Information Systems ........... 90
Steven A. Morris, Middle Tennessee State University, USA
Thomas E. Marshall, Auburn University, USA
Chapter VI
The Technology Acceptance Model: A Meta-Analysis of
Empirical Findings ................................................................................... 112
Qingxiong Ma, Central Missouri State University, USA
Liping Liu, University of Akron, USA
SECTION II: C OLLABORATIVE TECHNOLOGIES AND IMPLEMENTATION ISSUES
Chapter VII
Success Factors in the Implementation of a Collaborative
Technology and Resulting Productivity Improvements in a
Small Business: An Exploratory Study .................................................. 1 2 9
Nory B. Jones, University of Maine, USA
Thomas R. Kochtanek, University of Missouri in Columbia,
USA
Chapter VIII
Supporting the JAD Facilitator with the Nominal Group
Technique ................................................................................................... 1 5 1
Evan W. Duggan, University of Alabama, USA
Cherian S. Thachenkary, Georgia State University, USA
Chapter IX
Applying Strategies to Overcome User Resistance in a Group of
Clinical Managers to a Business Software Application:
A Case Study .............................................................................................. 1 7 4
Barbara Adams, Cyrus Medical Systems, USA
Eta S. Berner, University of Alabama at Birmingham, USA
Joni Rousse Wyatt, Norwood Clinic, USA
Chapter X
Responsibility for Information Assurance and Privacy:
A Problem of Individual Ethics? ........................................................... 1 8 6
Bernd Carsten Stahl, De Montfort University, UK
Chapter XI
Organizational Knowledge Sharing in ERP Implementation:
Lessons from Industry ............................................................................ 2 0 8
Mary C. Jones, University of North Texas, USA
R. Leon Price, University of Oklahoma, USA
TEAM LinG
SECTION III: E-COMMERCE PROCESSES AND PRACTICES
Chapter XII
Electronic Banking and Information Assurance Issues:
Survey and Synthesis ............................................................................... 2 3 3
Manish Gupta, State University of New York, USA
Raghav Rao, State University of New York, USA
Shambhu Upadhyaya, State University of New York, USA
Chapter XIII
Computer Security and Risky Computing Practices:
A Rational Choice Perspective ............................................................. 2 5 7
Kregg Aytes, Idaho State University, USA
Terry Connolly, University of Arizona, USA
Chapter XIV
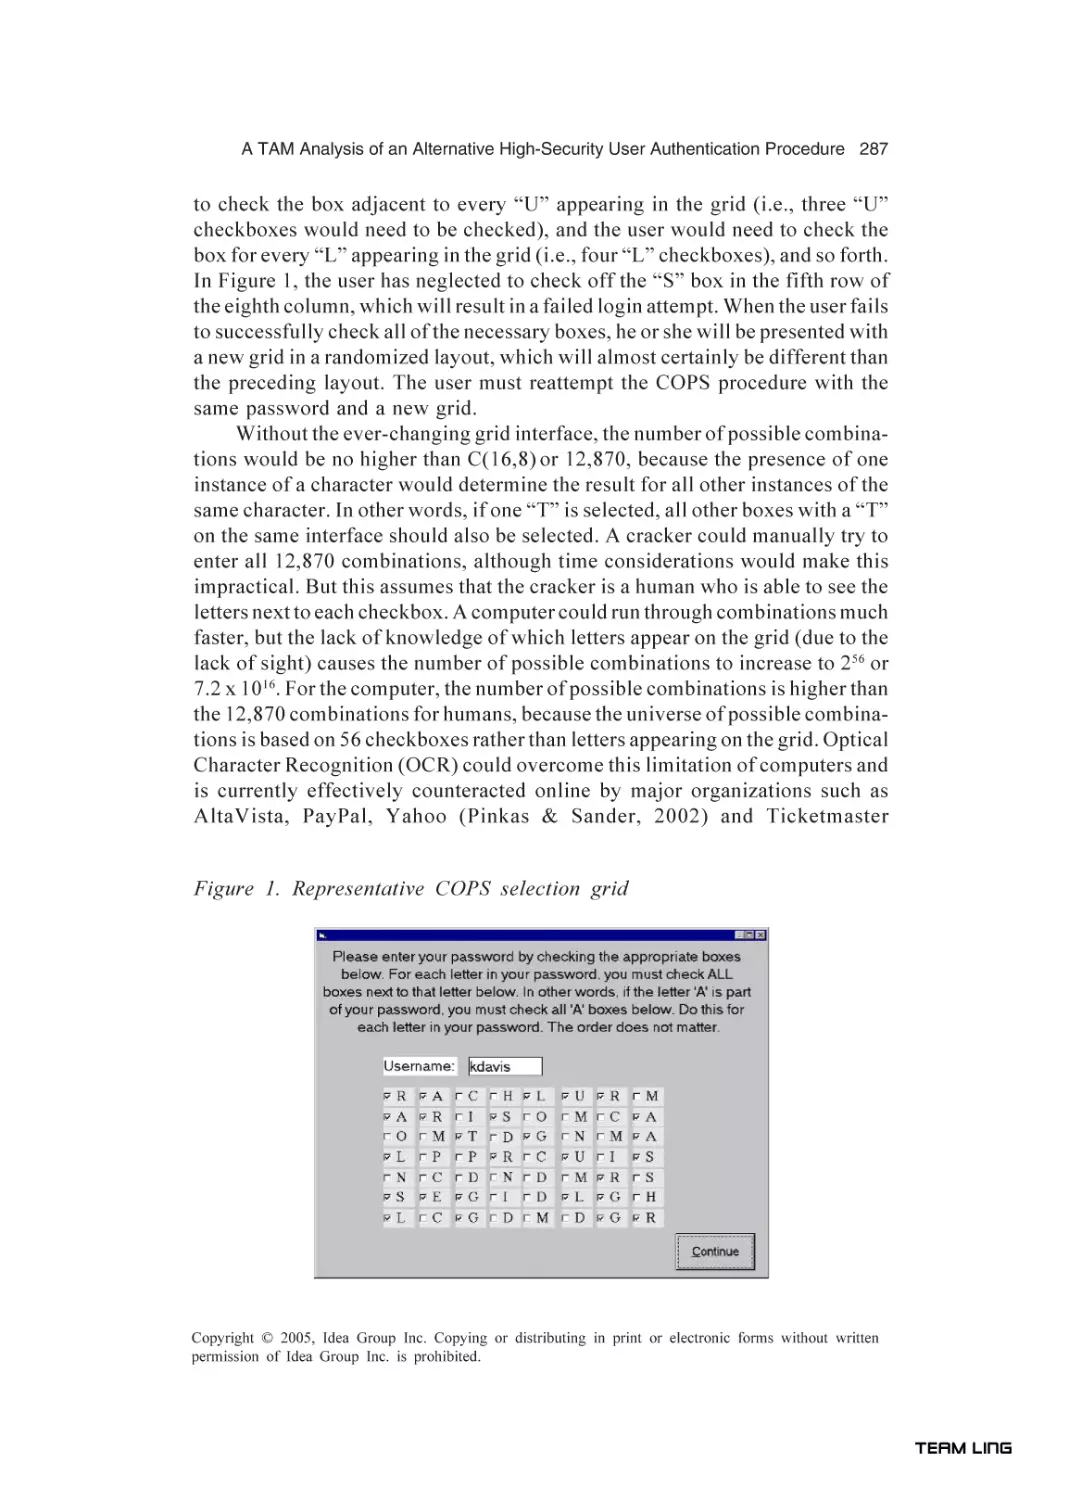
A TAM Analysis of an Alternative High-Security User
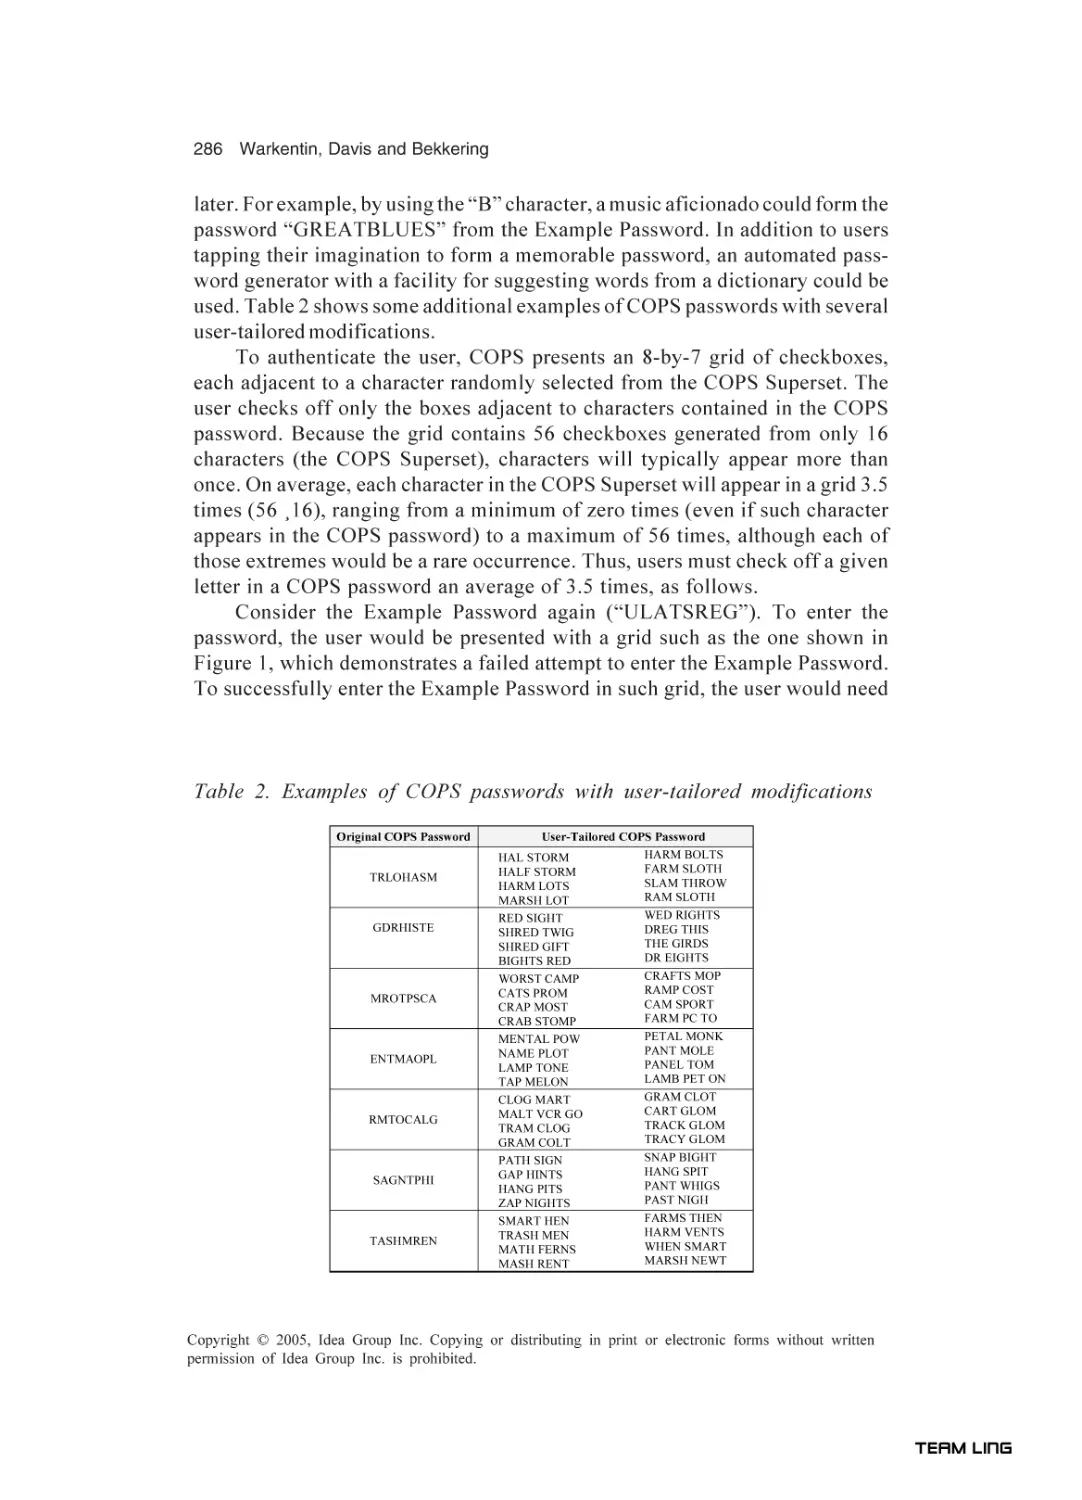
Authentication Procedure ...................................................................... 2 8 0
Merrill Warkentin, Mississippi State University, USA
Kimberly Davis, Mississippi State University, USA
Ernst Bekkering, Northeastern State University, USA
Chapter XV
A Blended Approach Learning Strategy for Teacher
Development ............................................................................................. 3 0 1
Kalyani Chatterjea, Nanyang Technological University,
Singapore
About the Editor ....................................................................................... 3 2 2
About the Authors ................................................................................... 3 2 3
Index ........................................................................................................... 3 3 1
TEAM LinG
vi
Preface
This scholarly book is a collection of some of the best manuscripts published in the Journal of Organizational and End User Computing. This introduction is mainly a collection of abstracts provided by the authors for their
manuscripts. The book is divided into three segments: Section I, which covers
organizational and end user computing issues, trends, and success; Section II,
which addresses collaborative technologies and implementation issues; and
Section III, which discusses e-commerce processes and practices.
Section I consists of six chapters. Chapter 1, by Downey and Bartczak,
starts the section by providing a comprehensive framework for research that
allows one to examine the trends and issues in end user computing. It is based
on a comprehensive review of research articles from some of the leading journals in the information systems area. The review is precipitated, according to
the author, by the fact that during the 1980s and early 1990s, end user computing was reported to be among the key concerns facing managers and organizations. The authors claim that the framework is parsimonious and allows a comprehensive classification of three major dimensions of end user computing: end
user, technology, and organization. The authors conclude by discussing emerging trends, important themes, and journal differences in the area.
Chapter II of this scholarly volume is penned by McGill. She discusses the
contribution of systems developed by users on systems success. Her contention is that since end user systems development is a significant part of organizational systems development, it deserves attention. She investigated the role an
application developed by the user developer plays on the eventual success of
the application itself. The results of her study are intuitive but very important.
She suggest that end users are likely to be more satisfied with systems they
develop than with ones developed by others. More interestingly, the author found
that end users also perform better with these systems.
TEAM LinG
vii
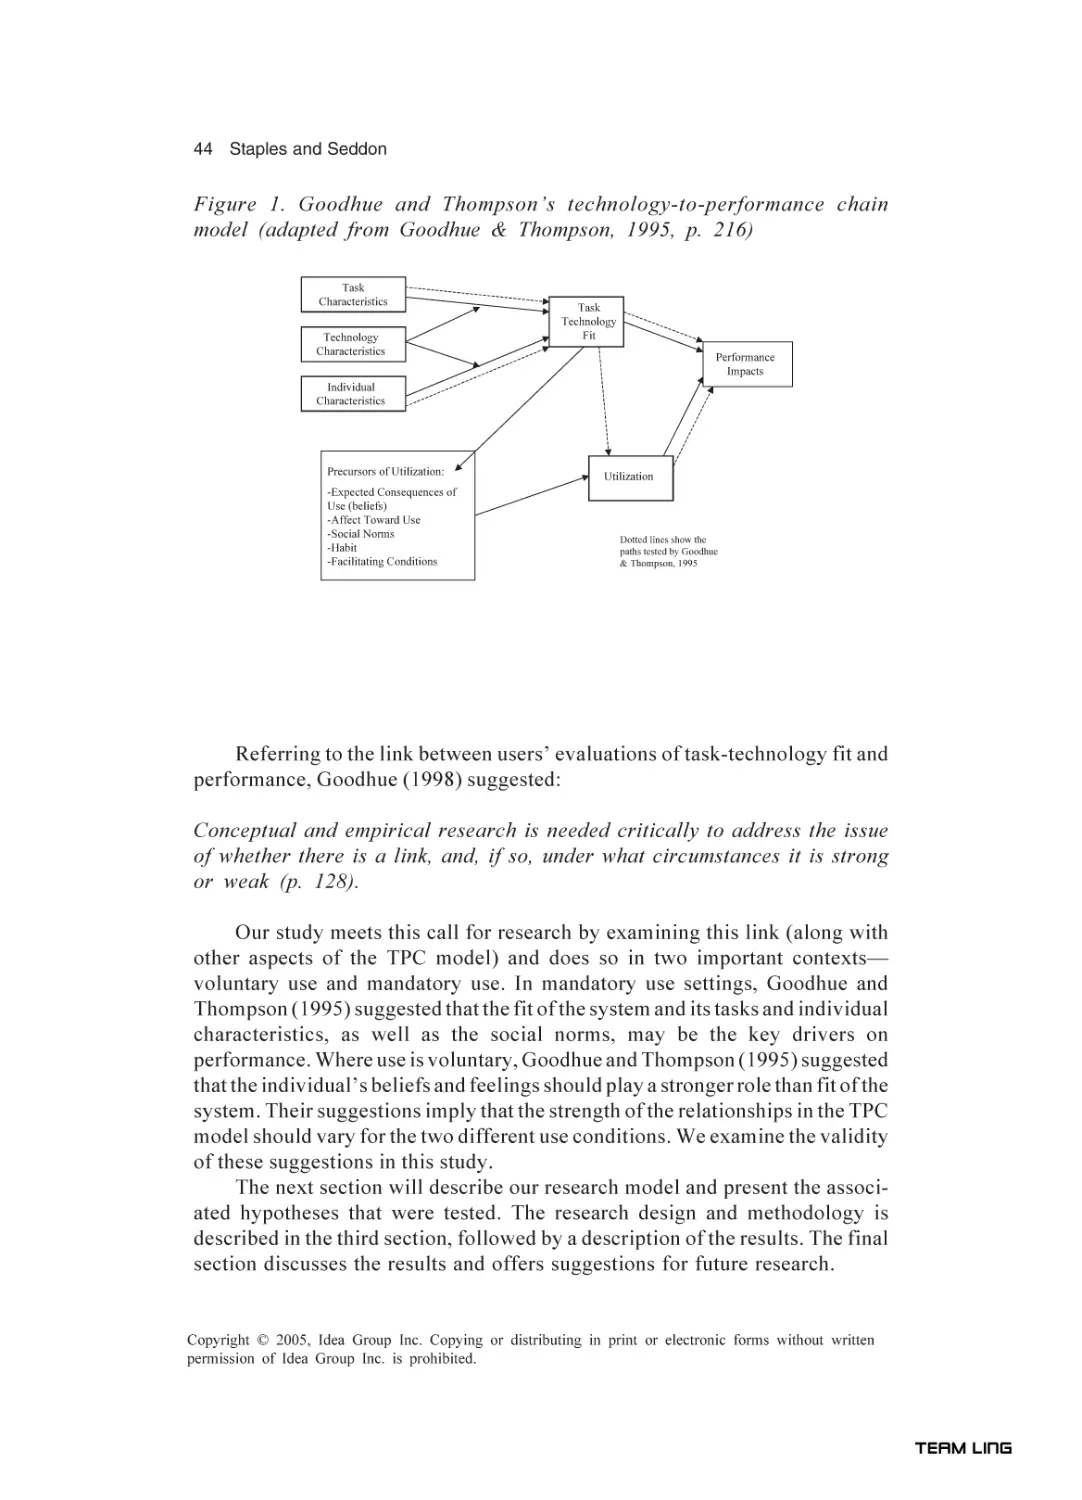
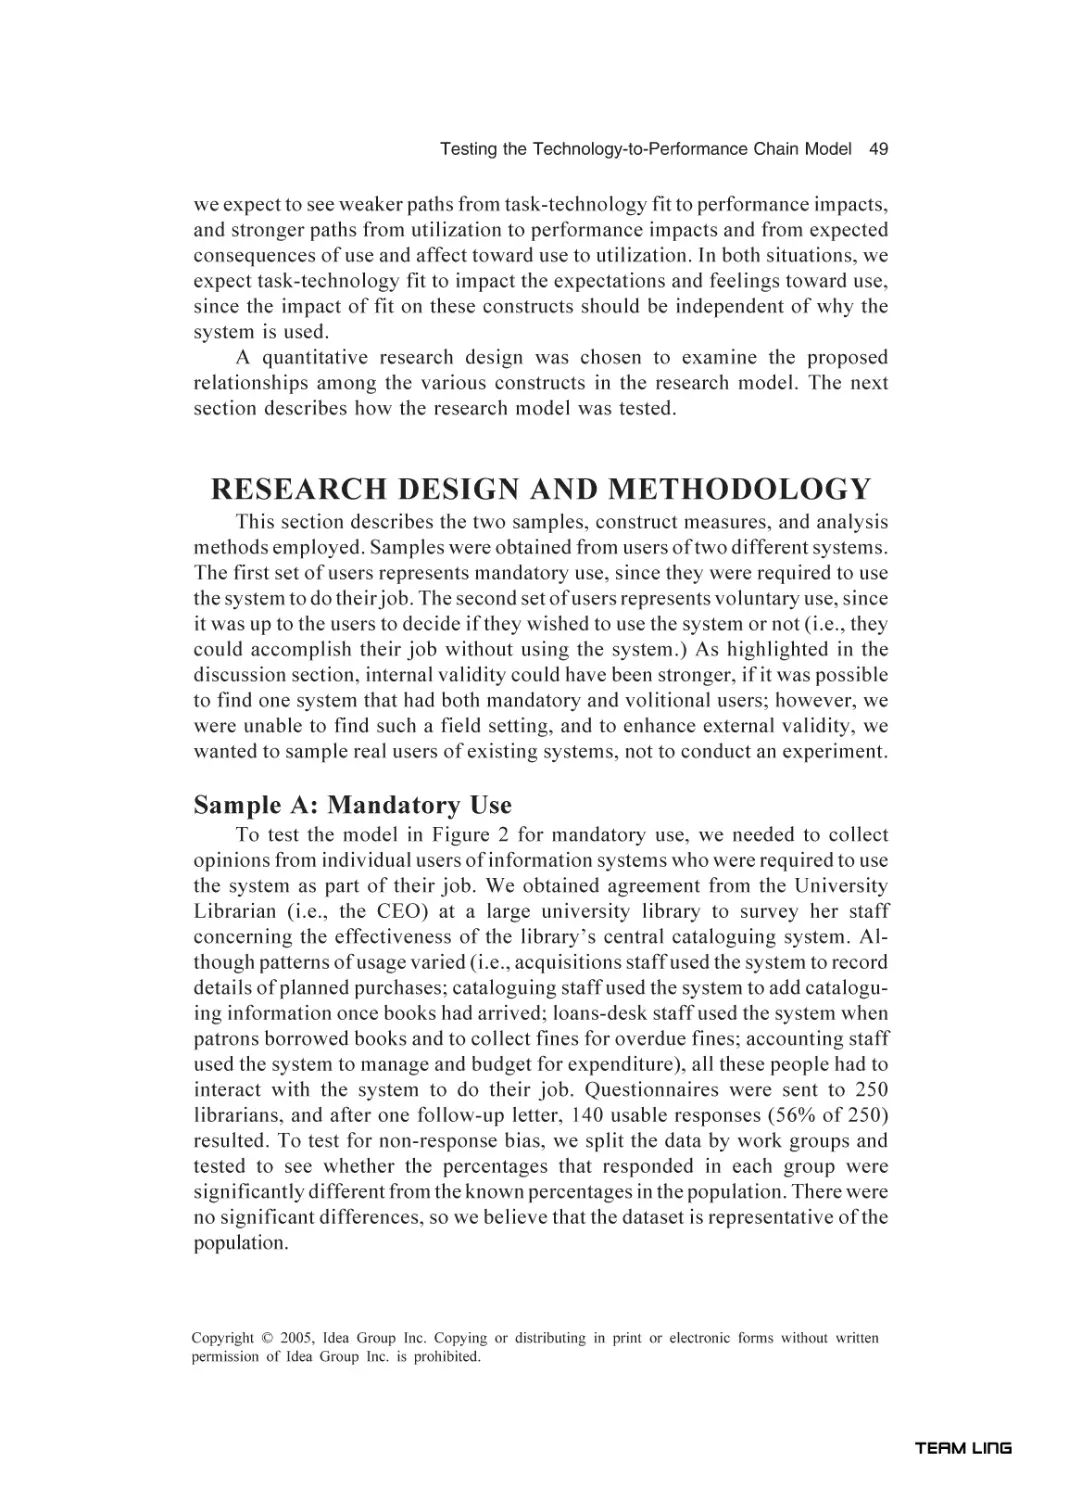
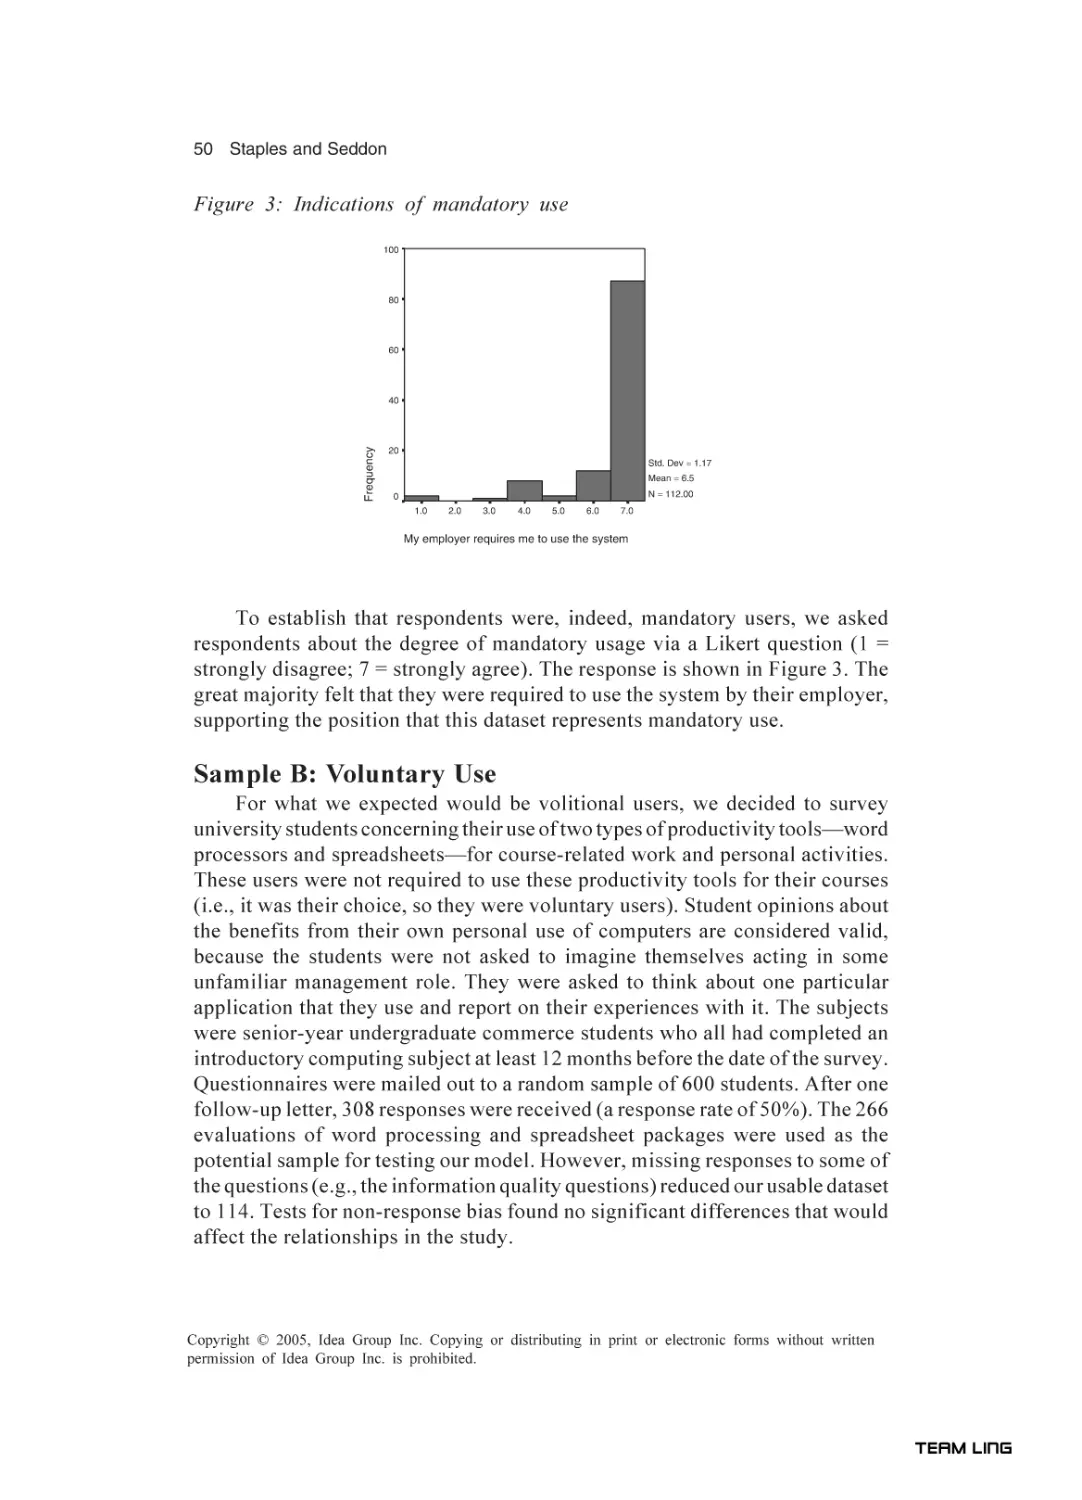
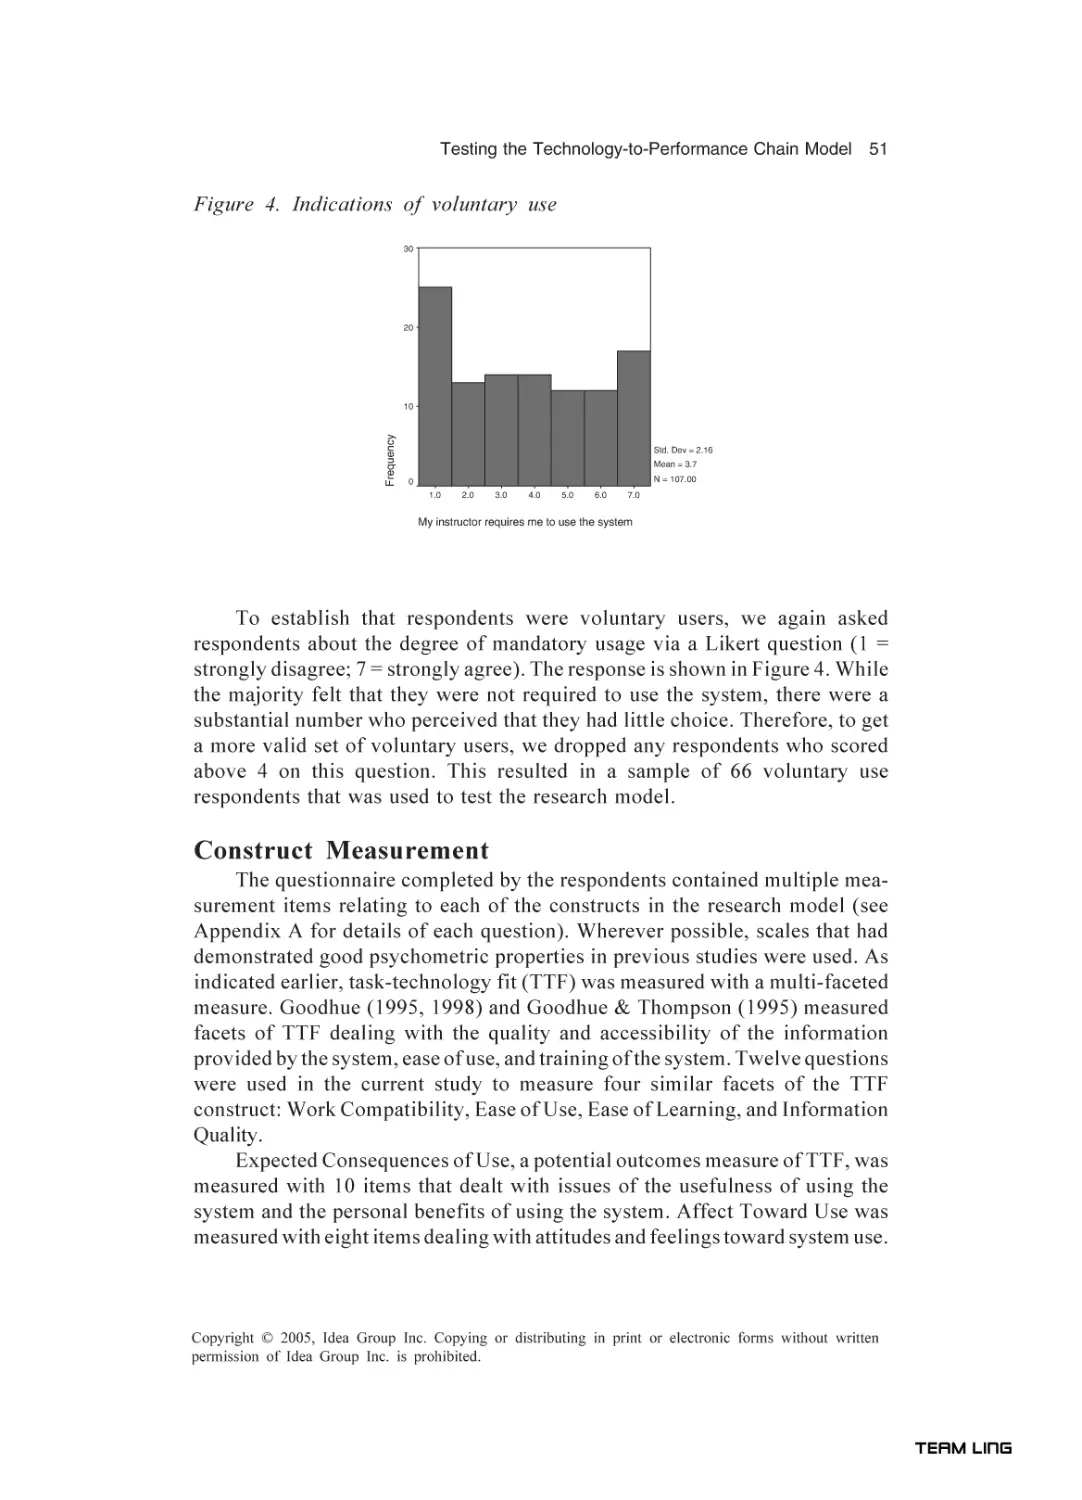
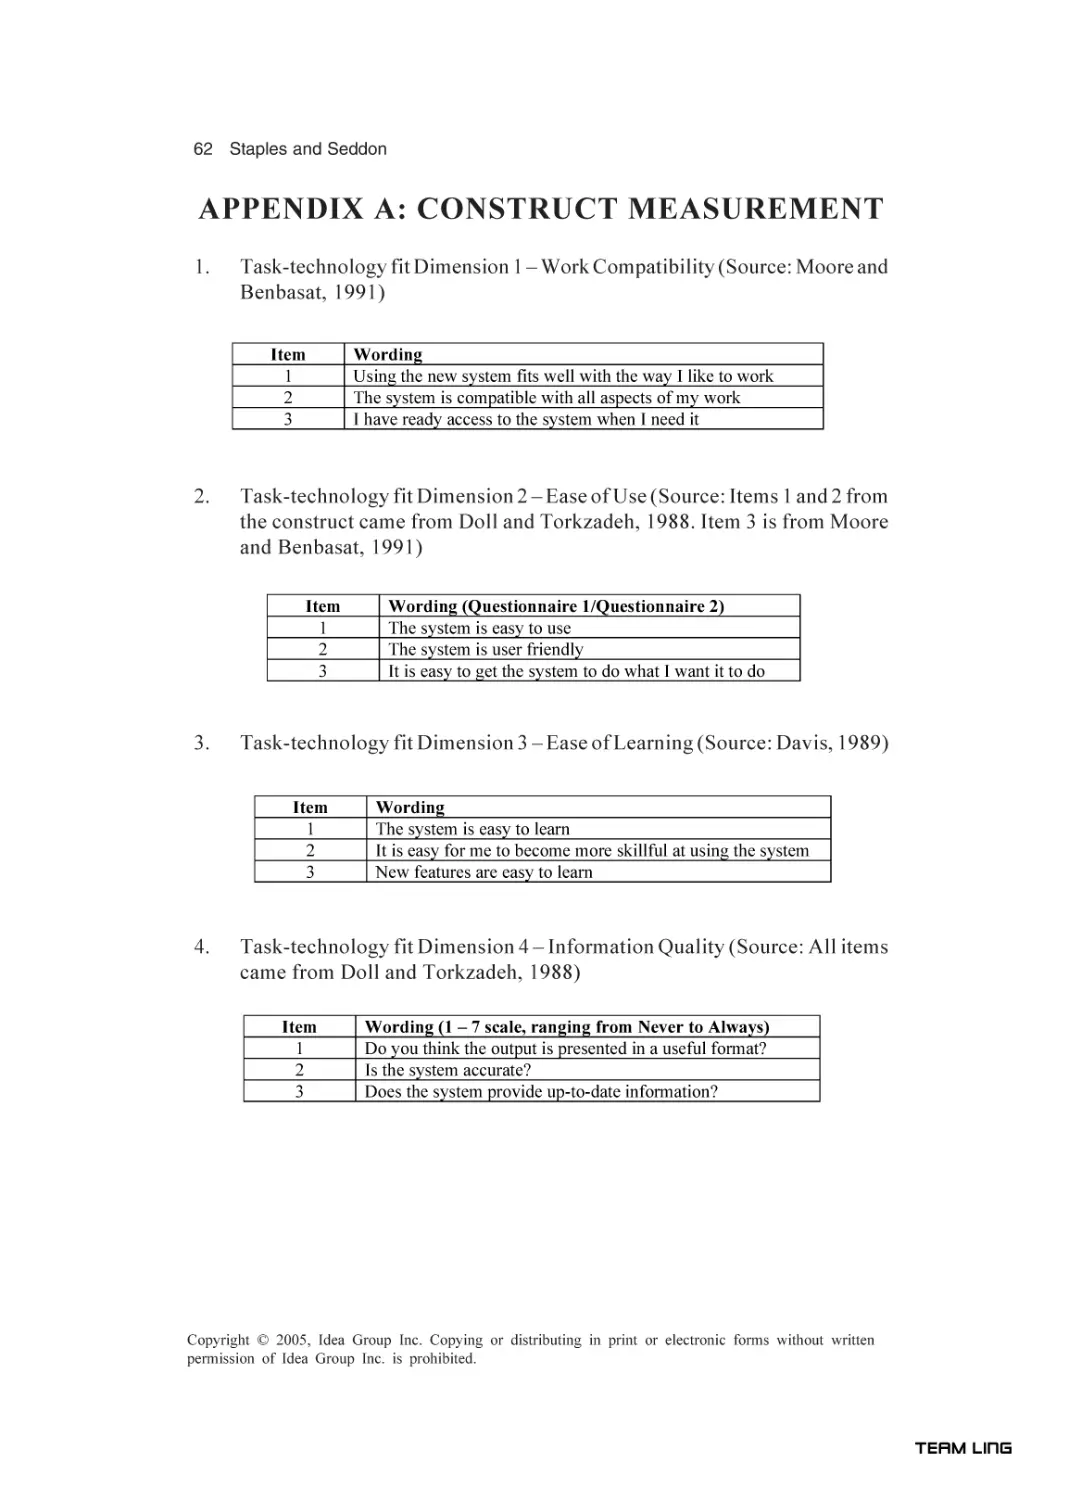
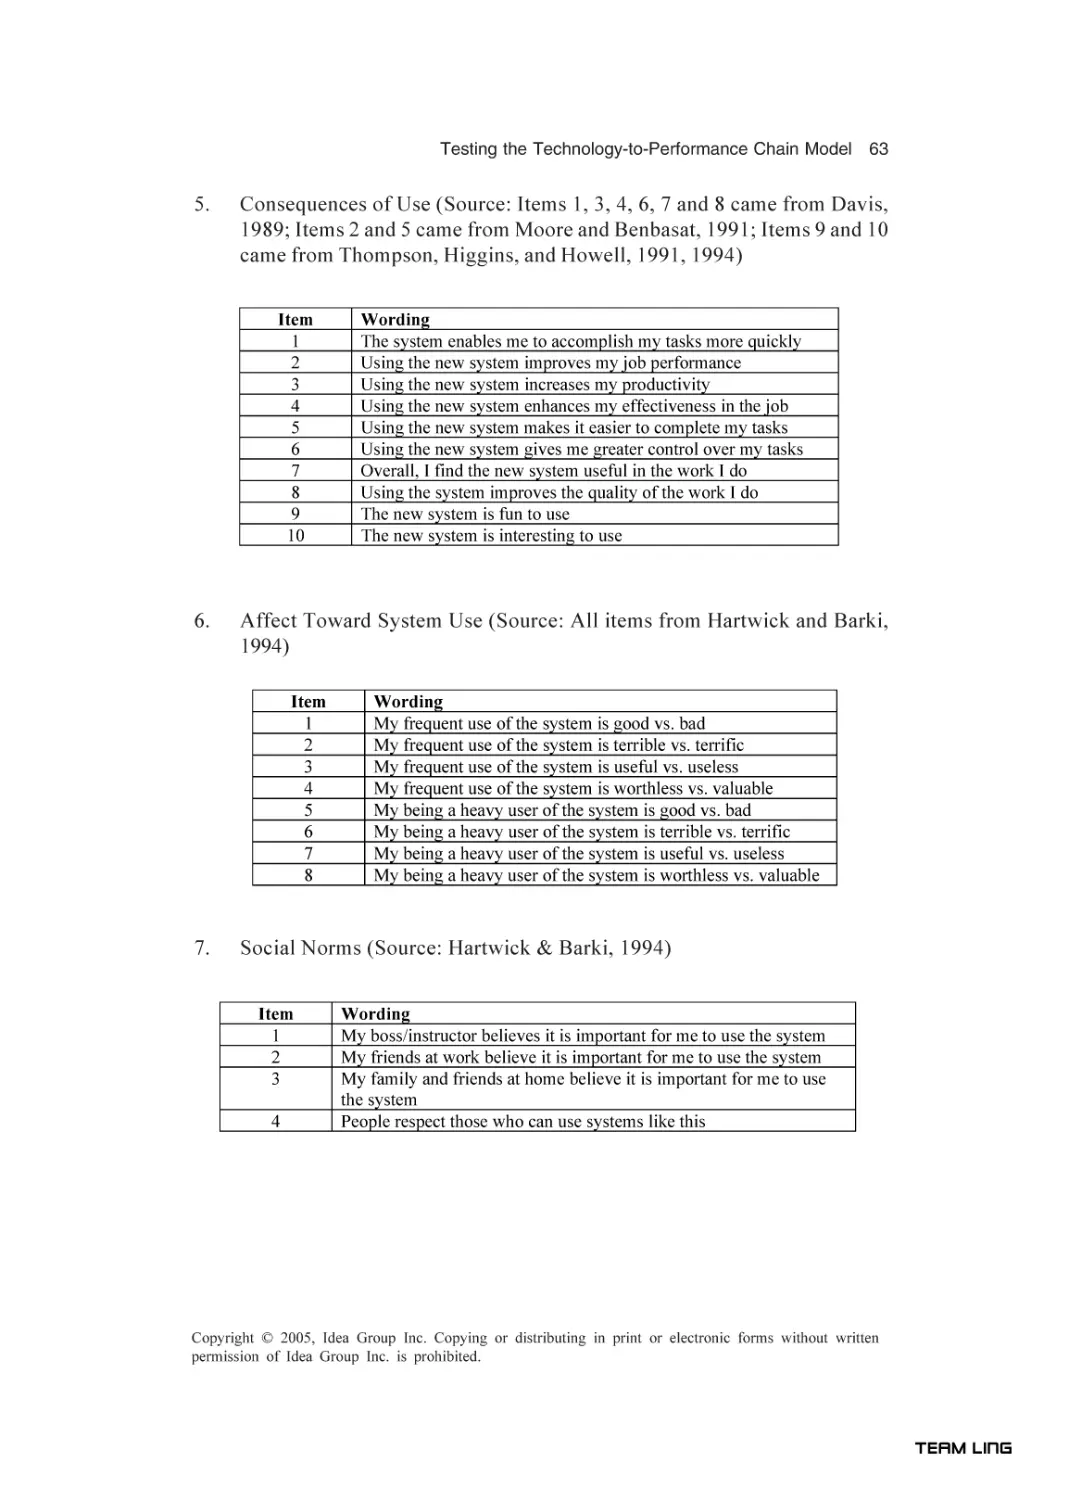
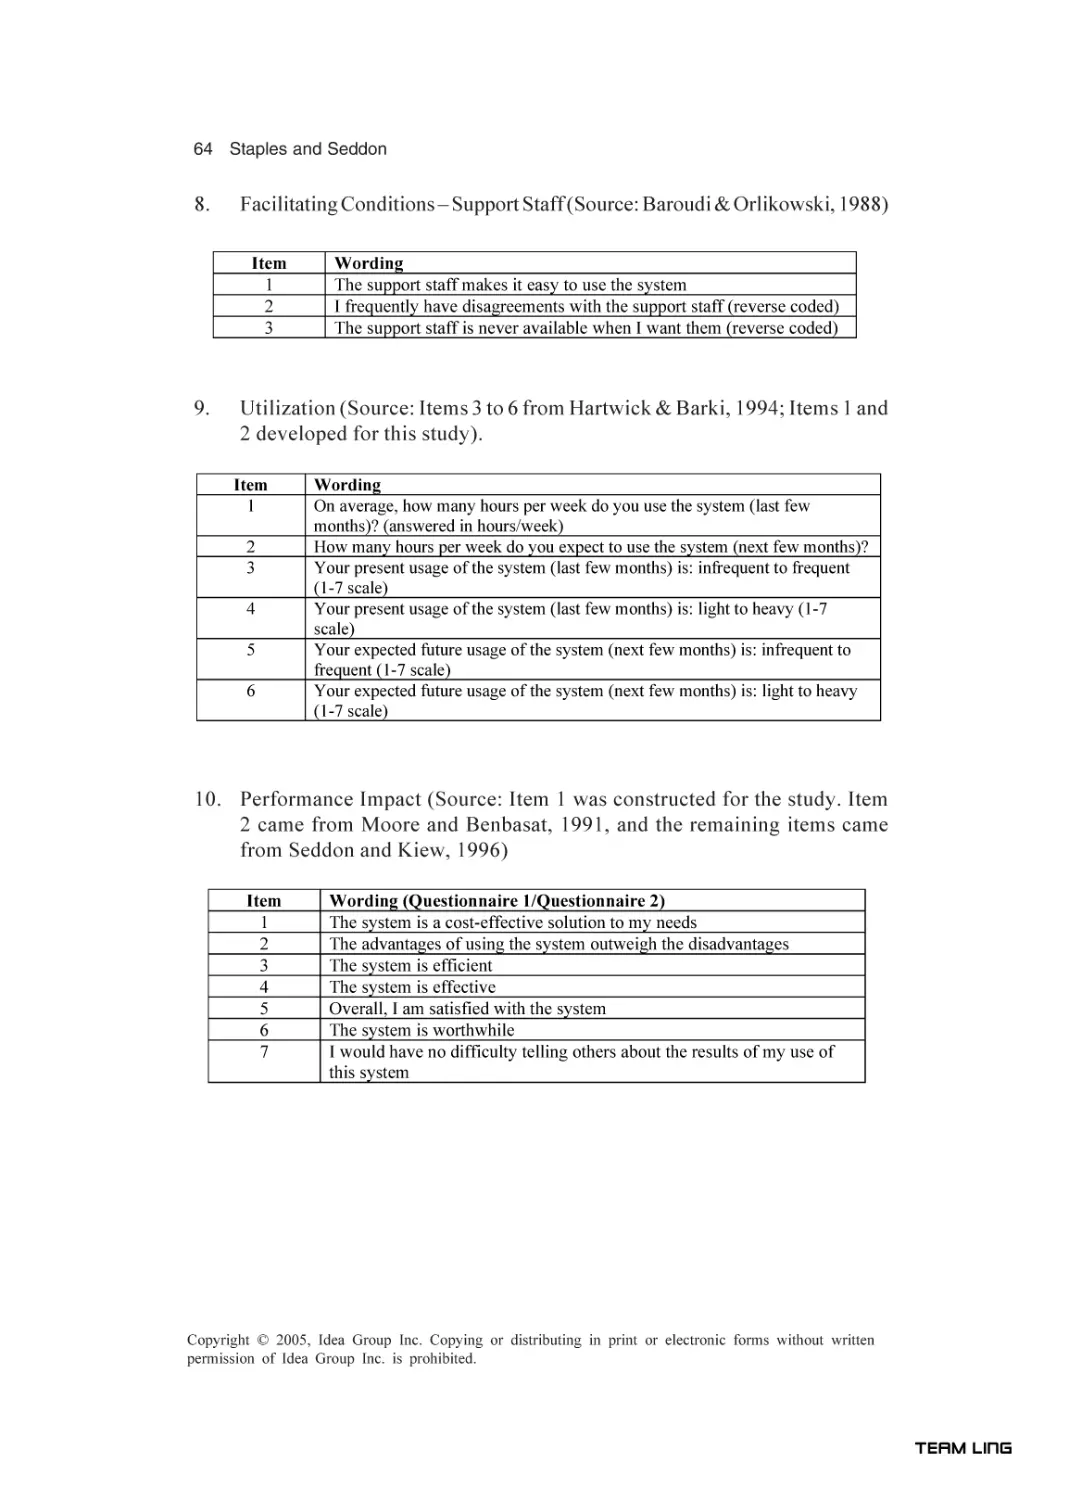
To help end users and organizations understand and make more effective
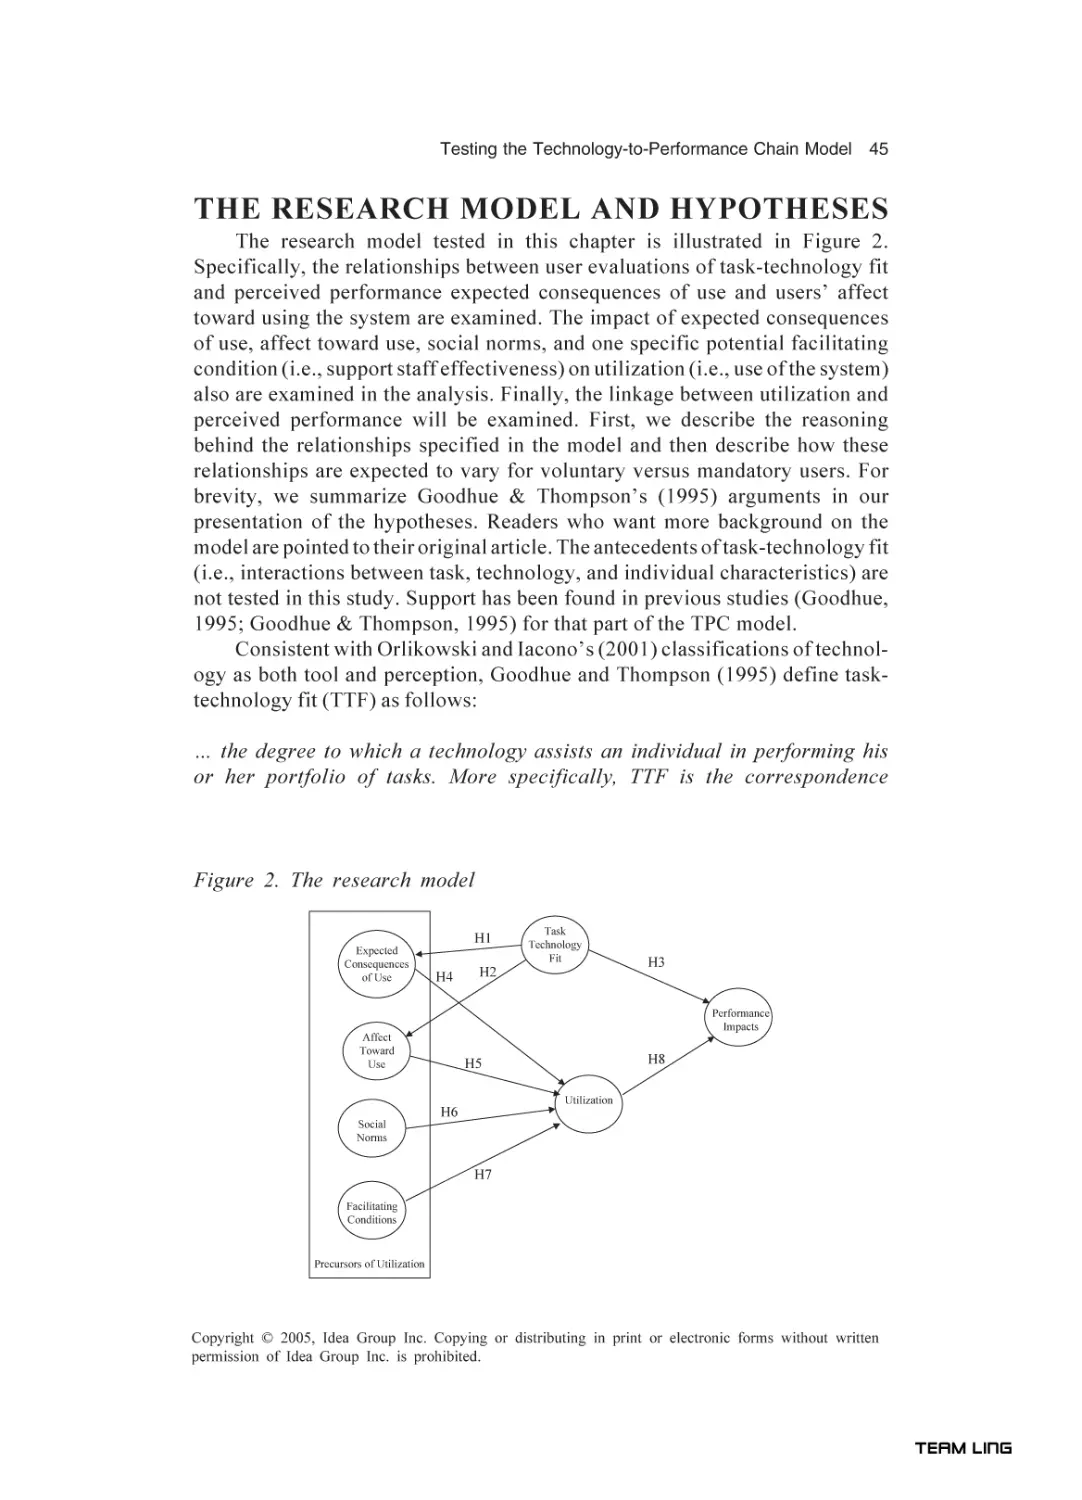
use of information technology, Staples and Seddon proposed the Technologyto-Performance Chain (TPC) model in 1995. According to the authors, the TPC
model combines insights from research on user attitudes as predictors of utilization and insights from research on task-technology fit as a predictor of performance. In Chapter III of this scholarly book, the same authors tested the
TPC model in two settings—voluntary use and mandatory use. In both settings,
they found strong support for the impact of task-technology fit on performance,
as well as on attitudes and beliefs about use. Social norms also had a significant
impact on utilization in the mandatory use setting. They also found that beliefs
about use only had a significant impact on utilization in the voluntary use setting. Overall, the authors found support for the predictive power of the TPC
model.
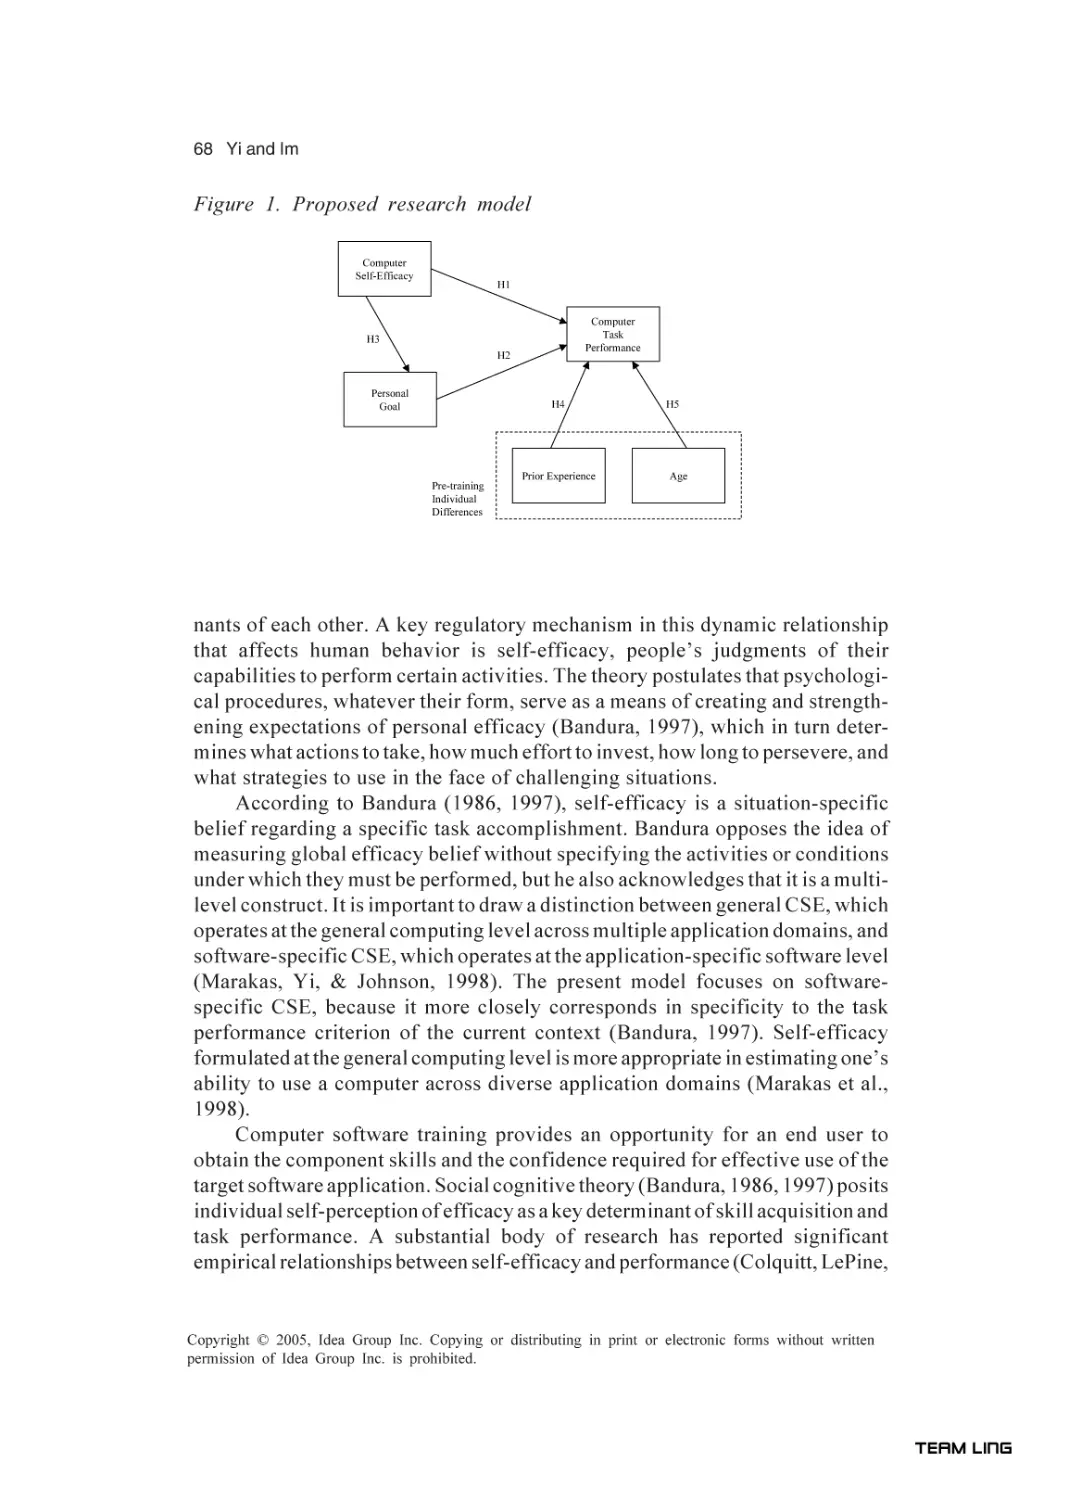
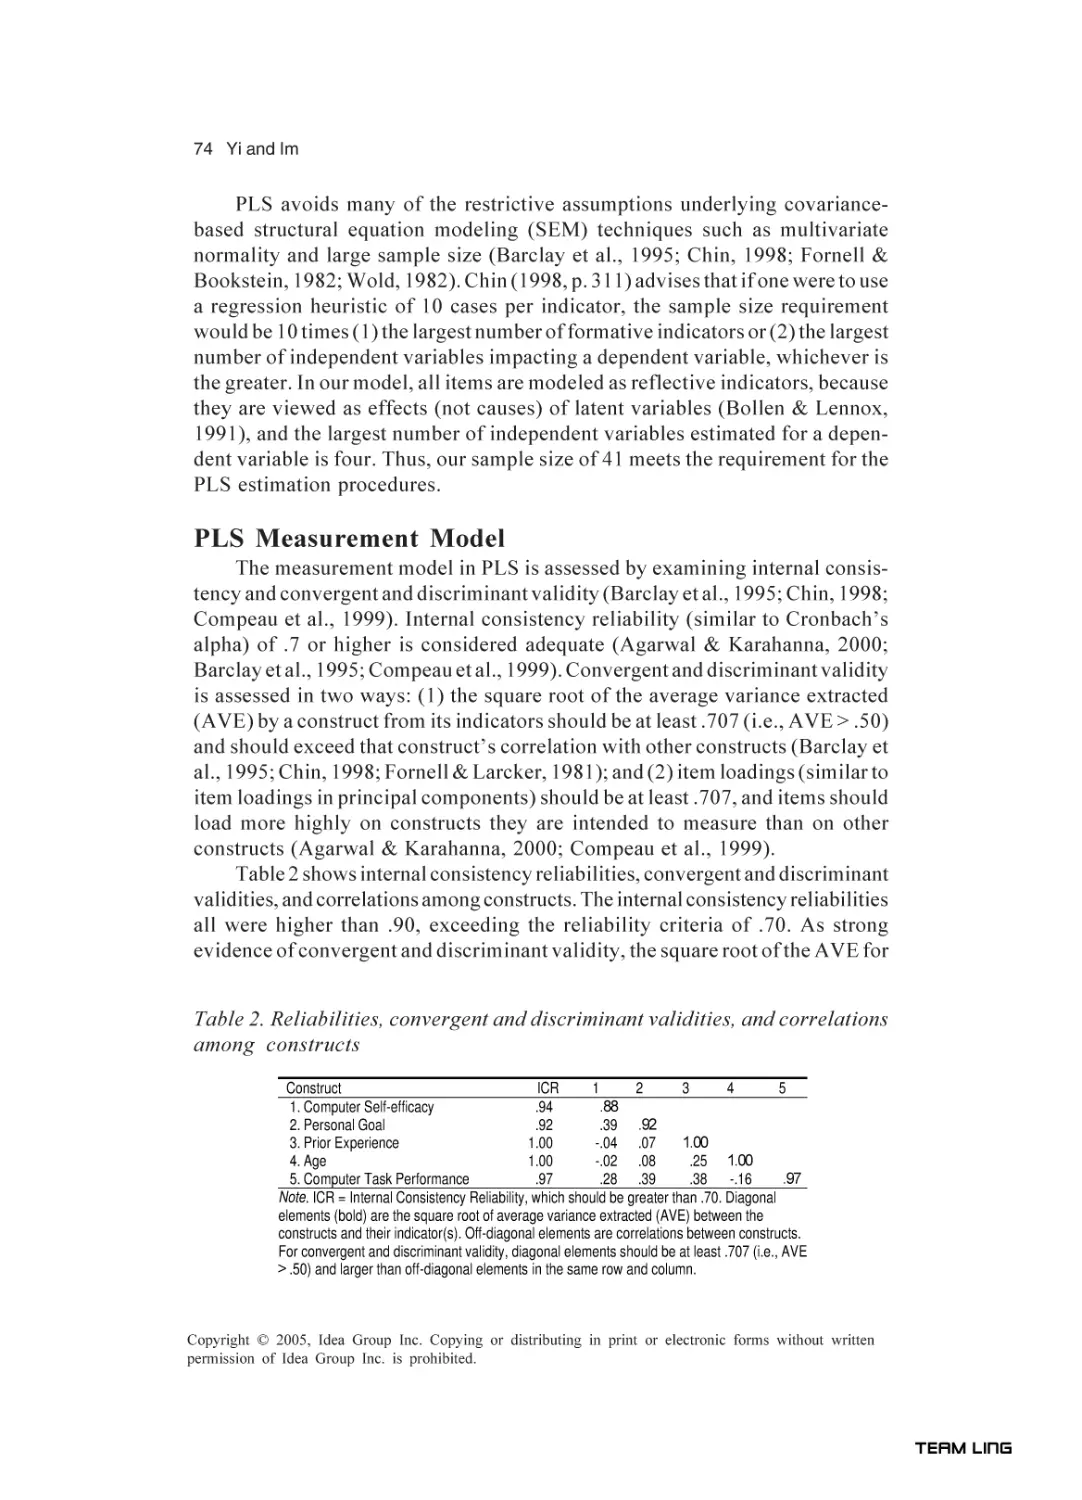
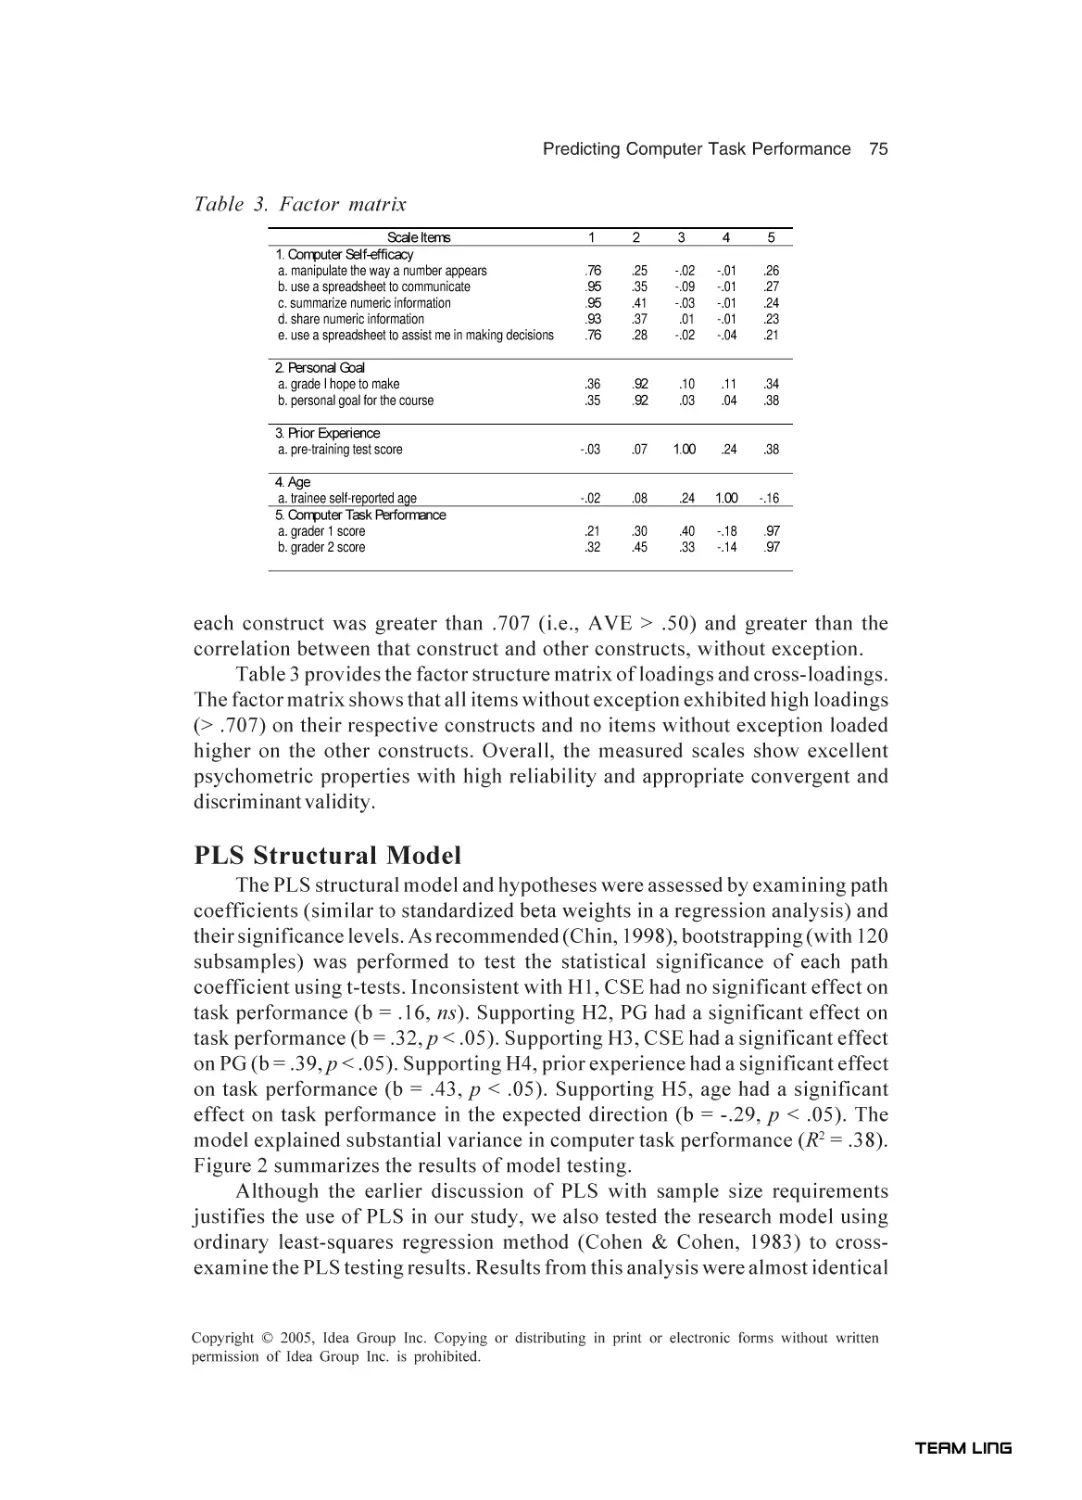
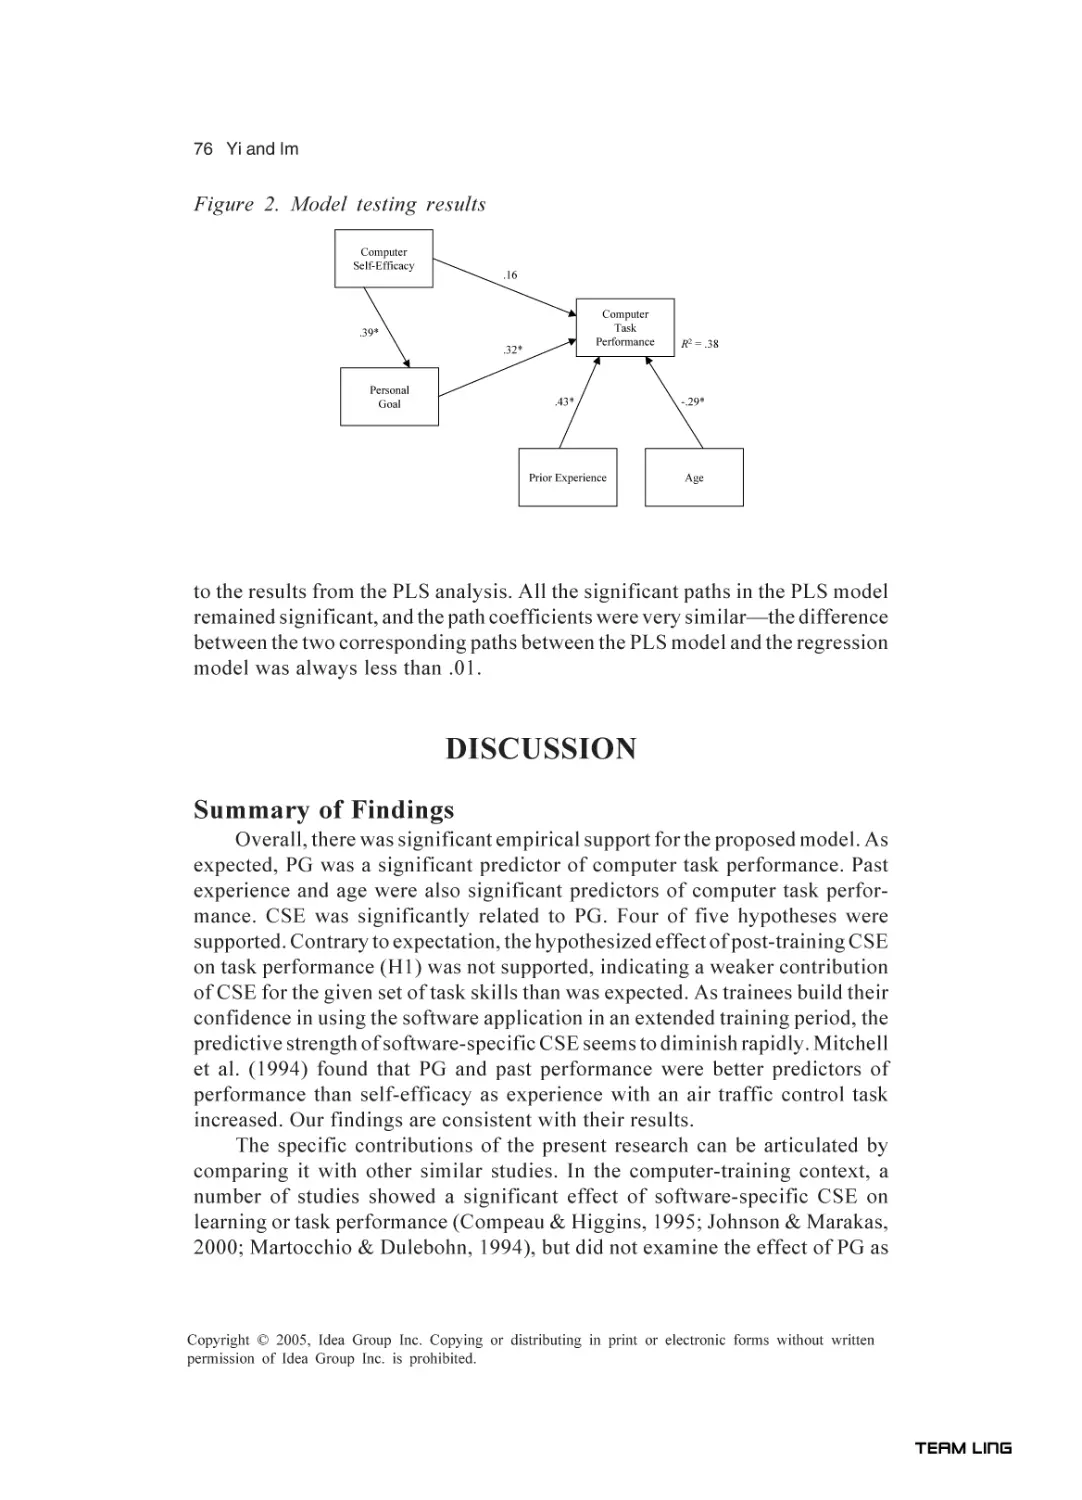
In Chapter IV, Yi and Im suggest that computer task performance is an
essential driver of end user productivity. Recent research, according to the
authors, indicates that computer self-efficacy (CSE) is an important determinant of computer task performance. They argue that understanding the role of
personal goal (PG) is also important in predicting and determining computer
task performance. Employing CSE, PG, age, and experience, the authors developed a theoretical model that predicts individual computer task performance.
They validate this model using PLS on data derived from a Microsoft Excel
training class of 41 MBA students. They found PG, along with past experience
and age, play a significant role in predicting computer task performance. Interestingly, the authors found no significant relationship between post-training CSE
and task performance.
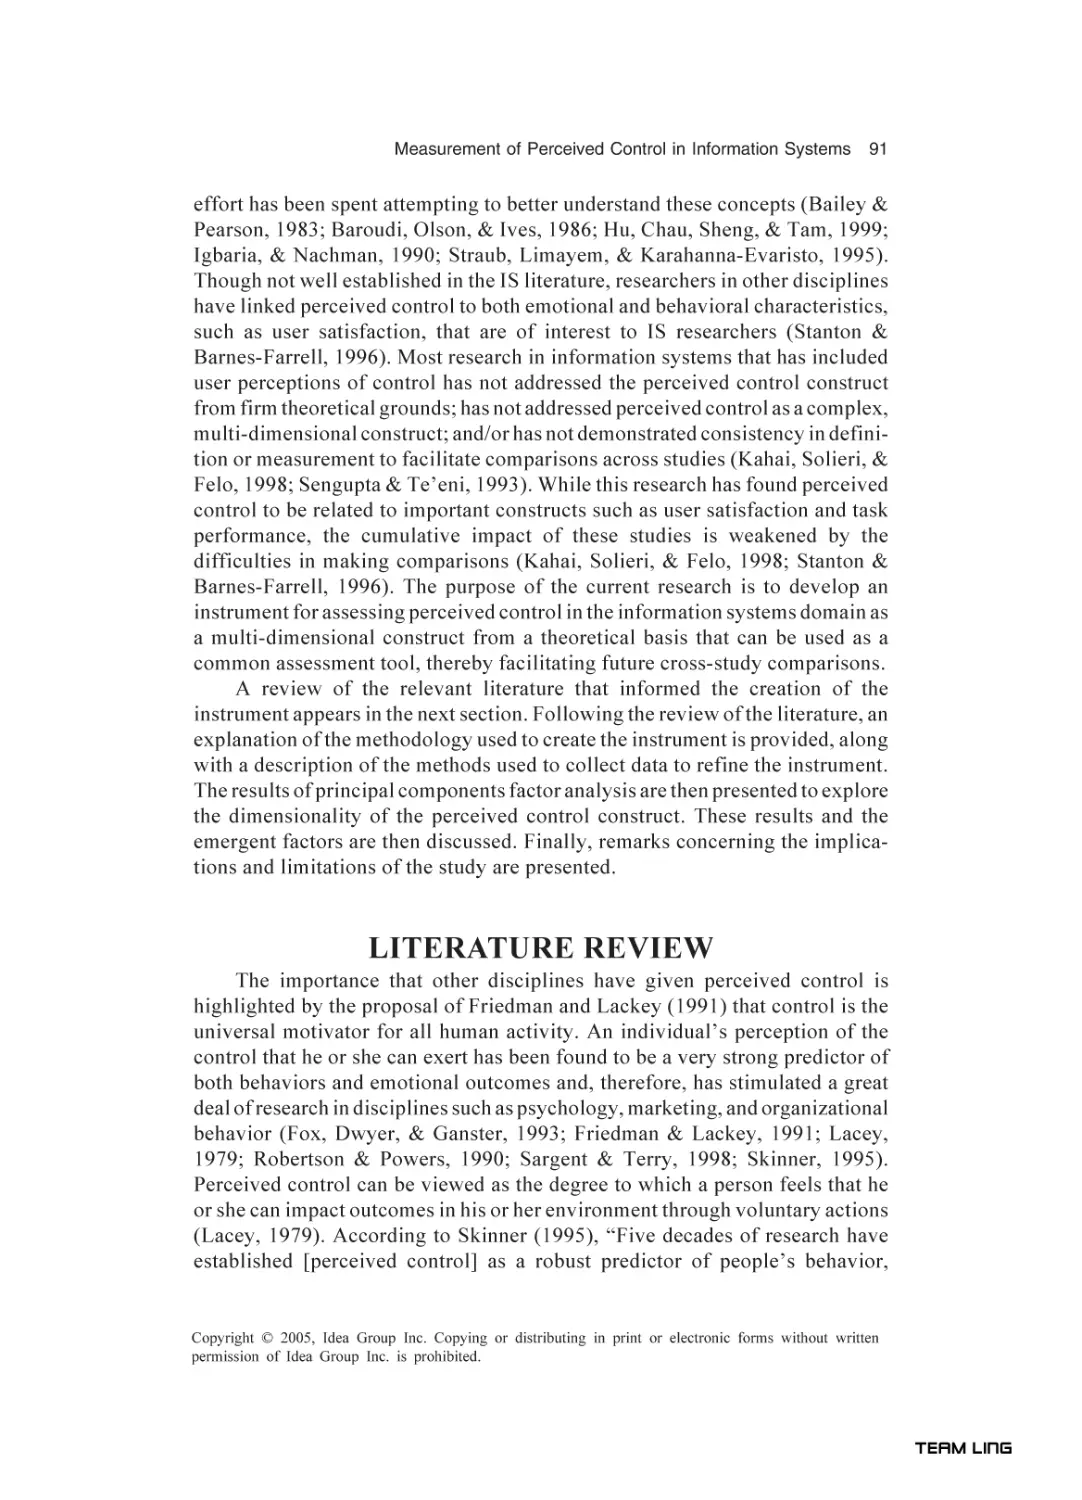
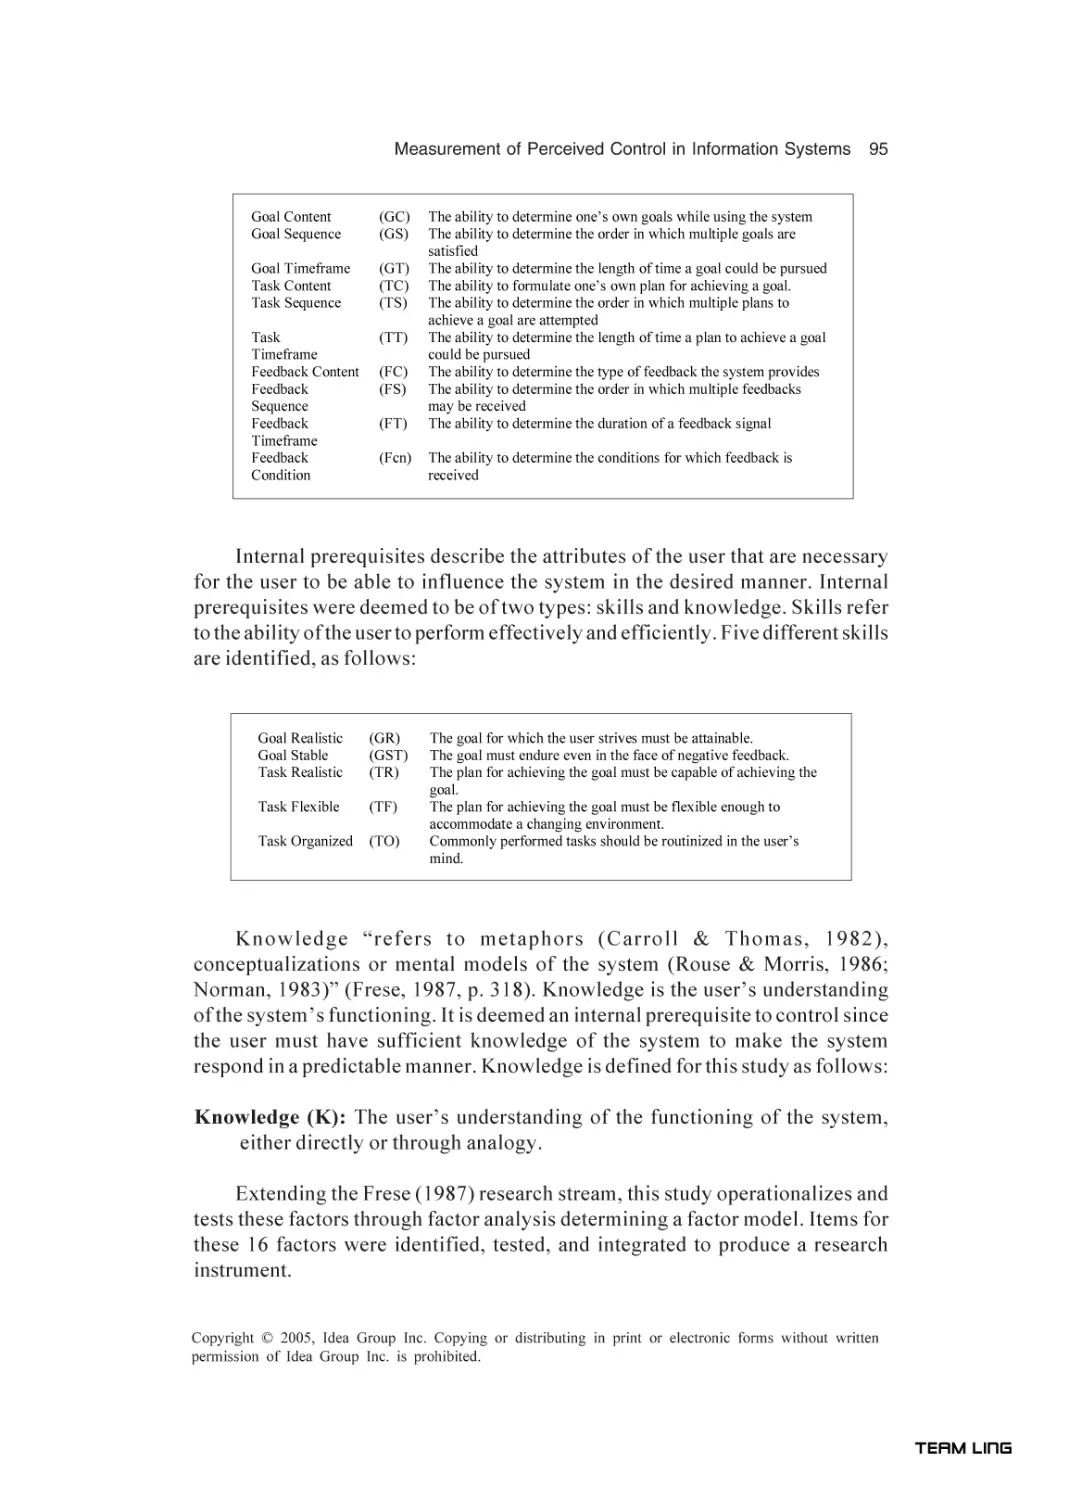
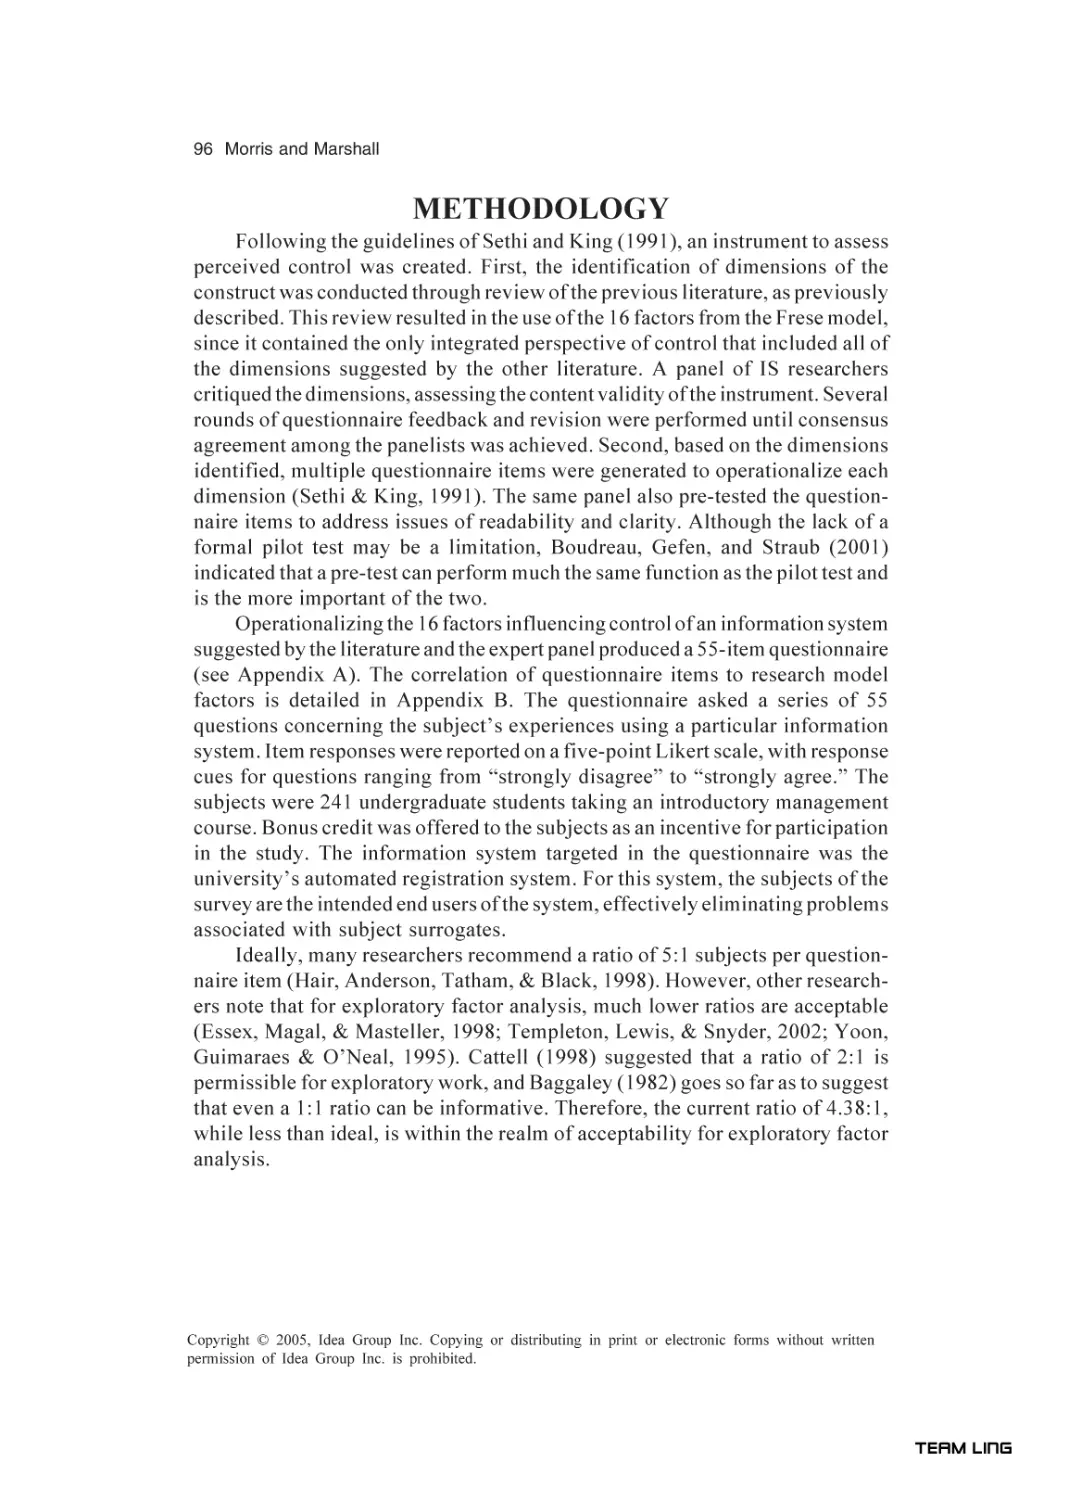
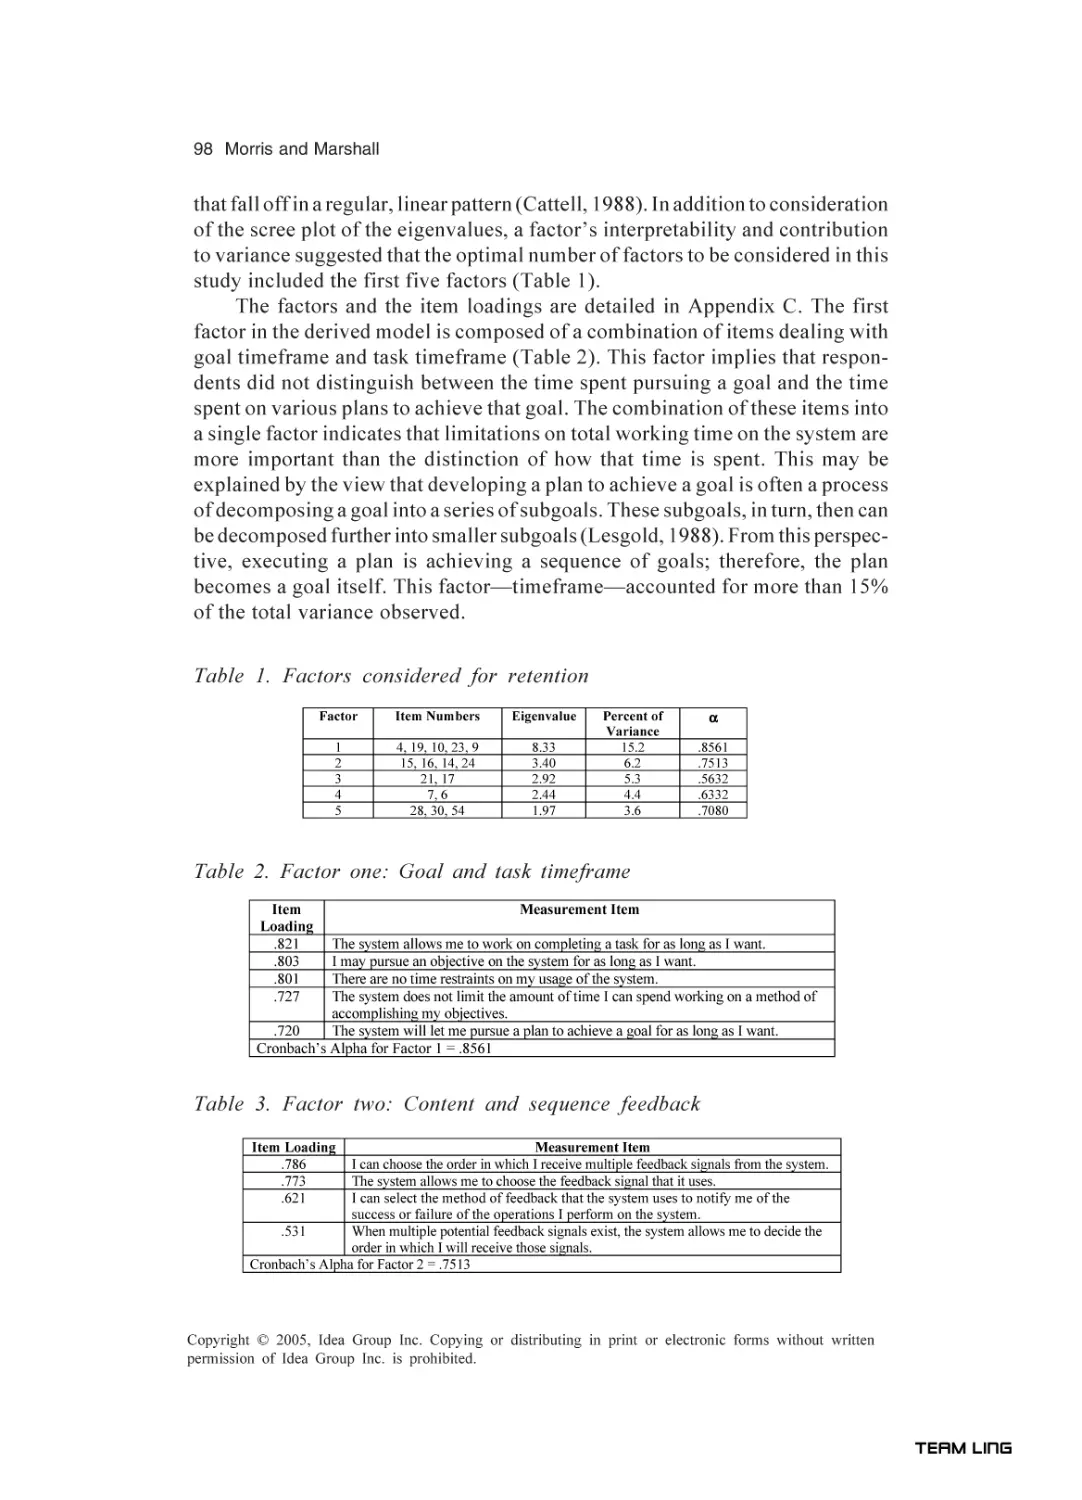
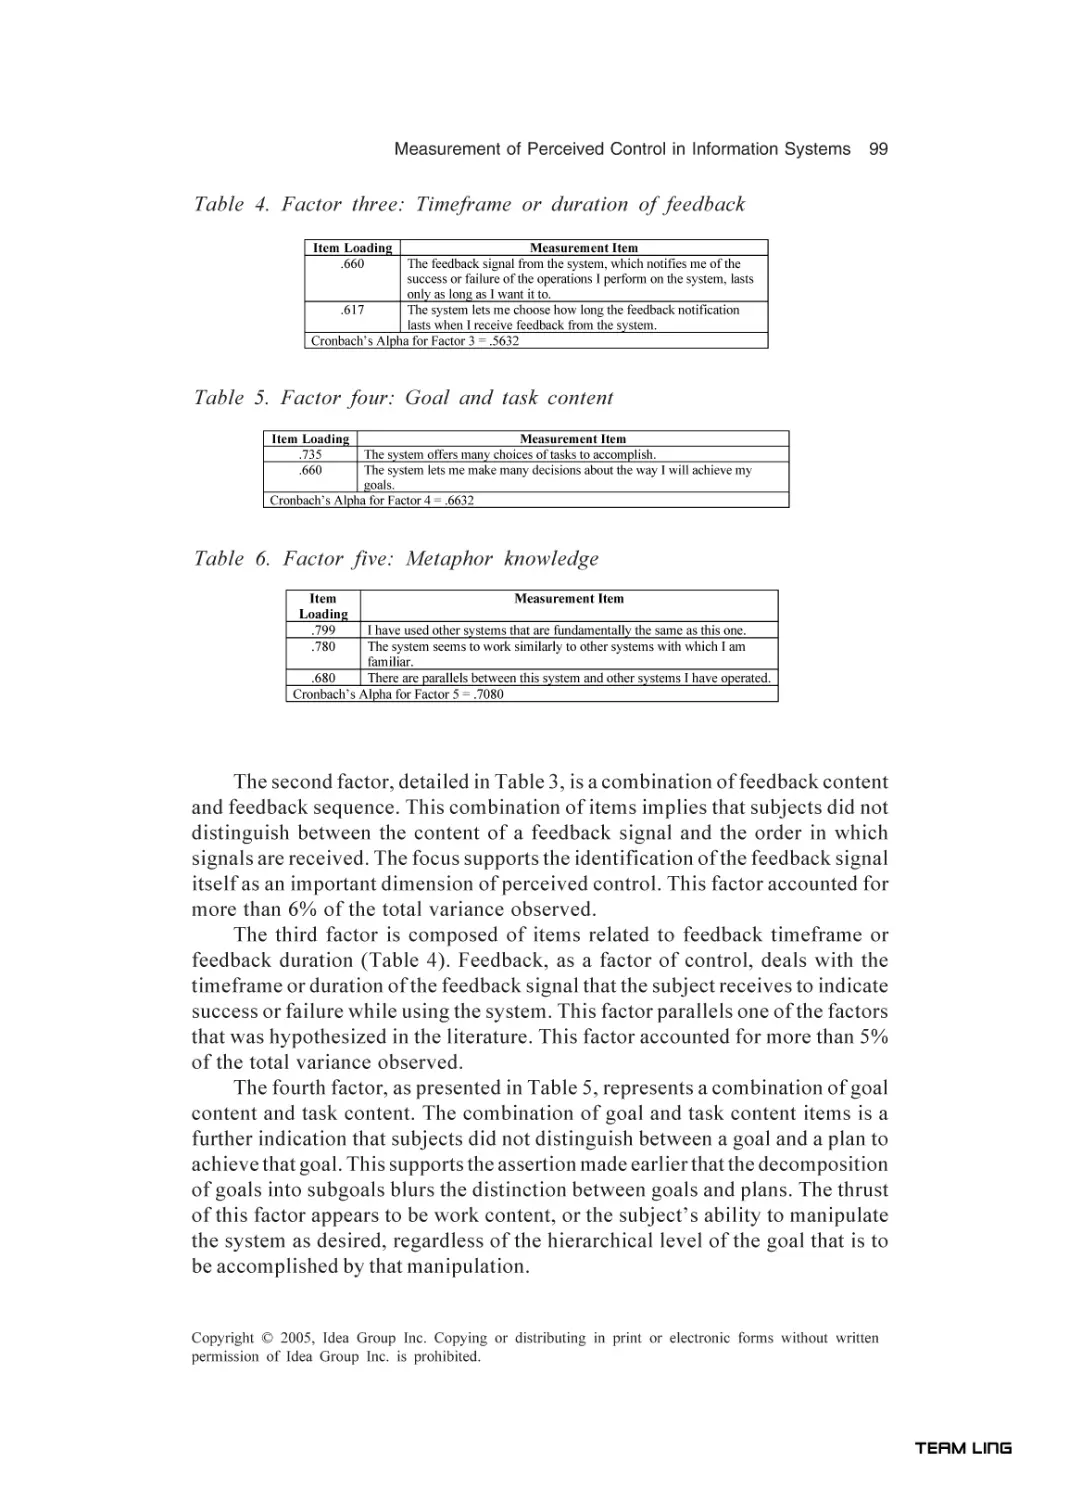
In Chapter V, Morris and Marshall claimed that several disciplines have
already identified and validated the importance of control in explaining human
behavior and motivation. They report an exploratory investigation that assesses
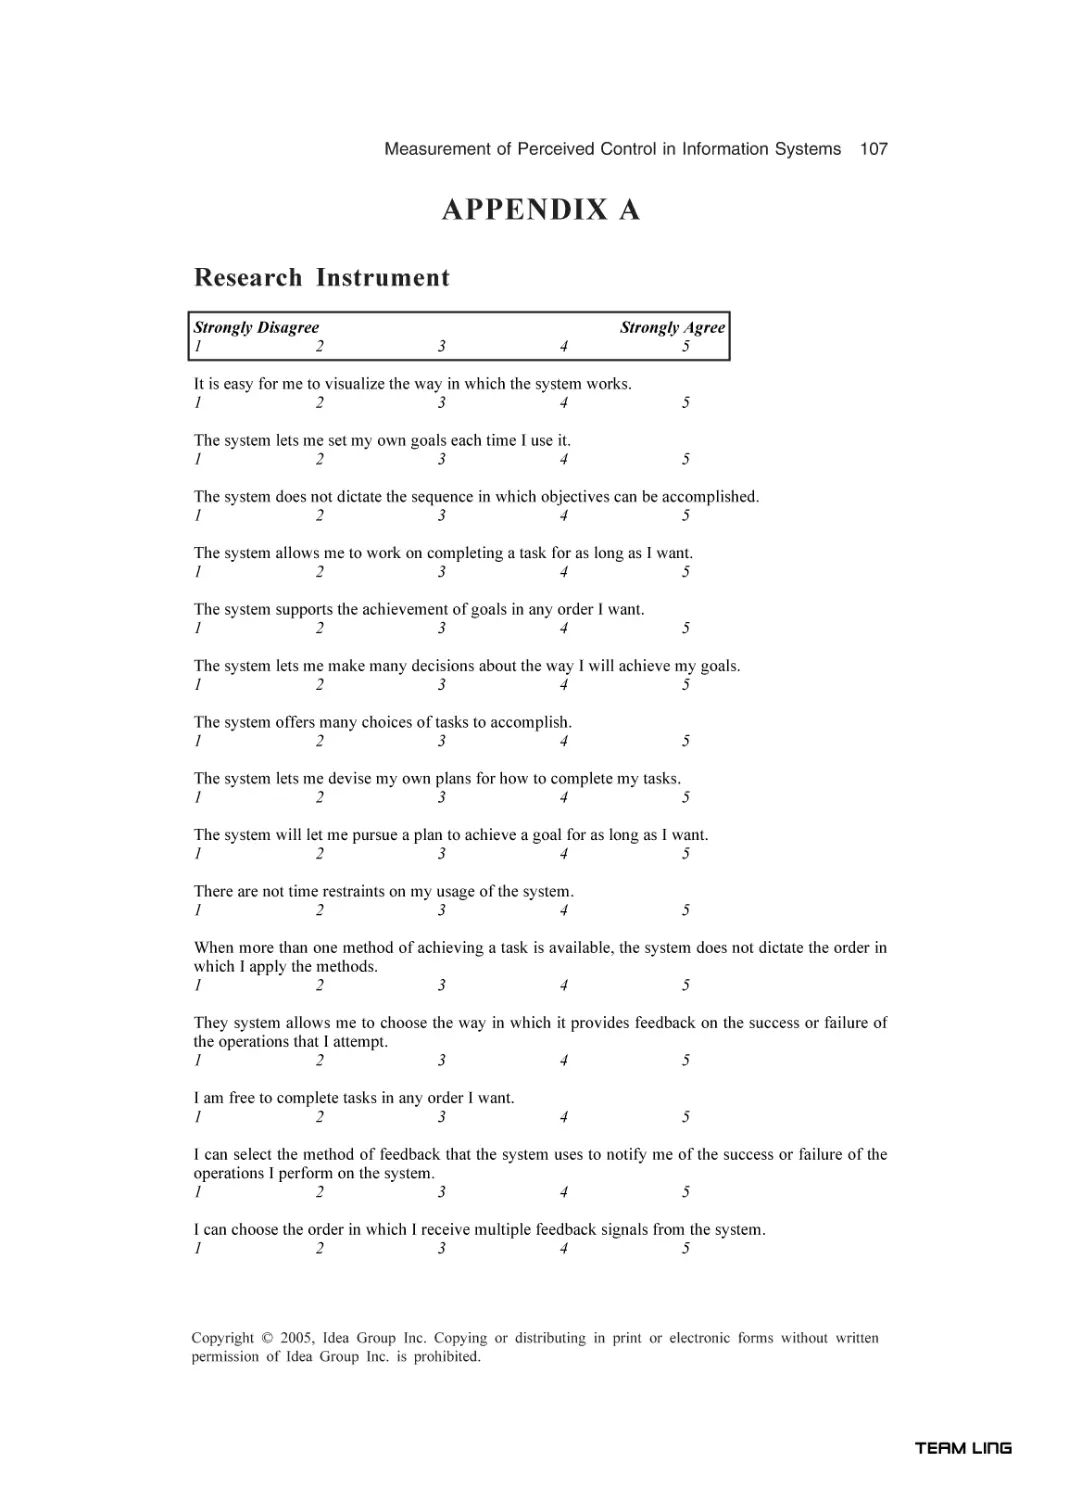
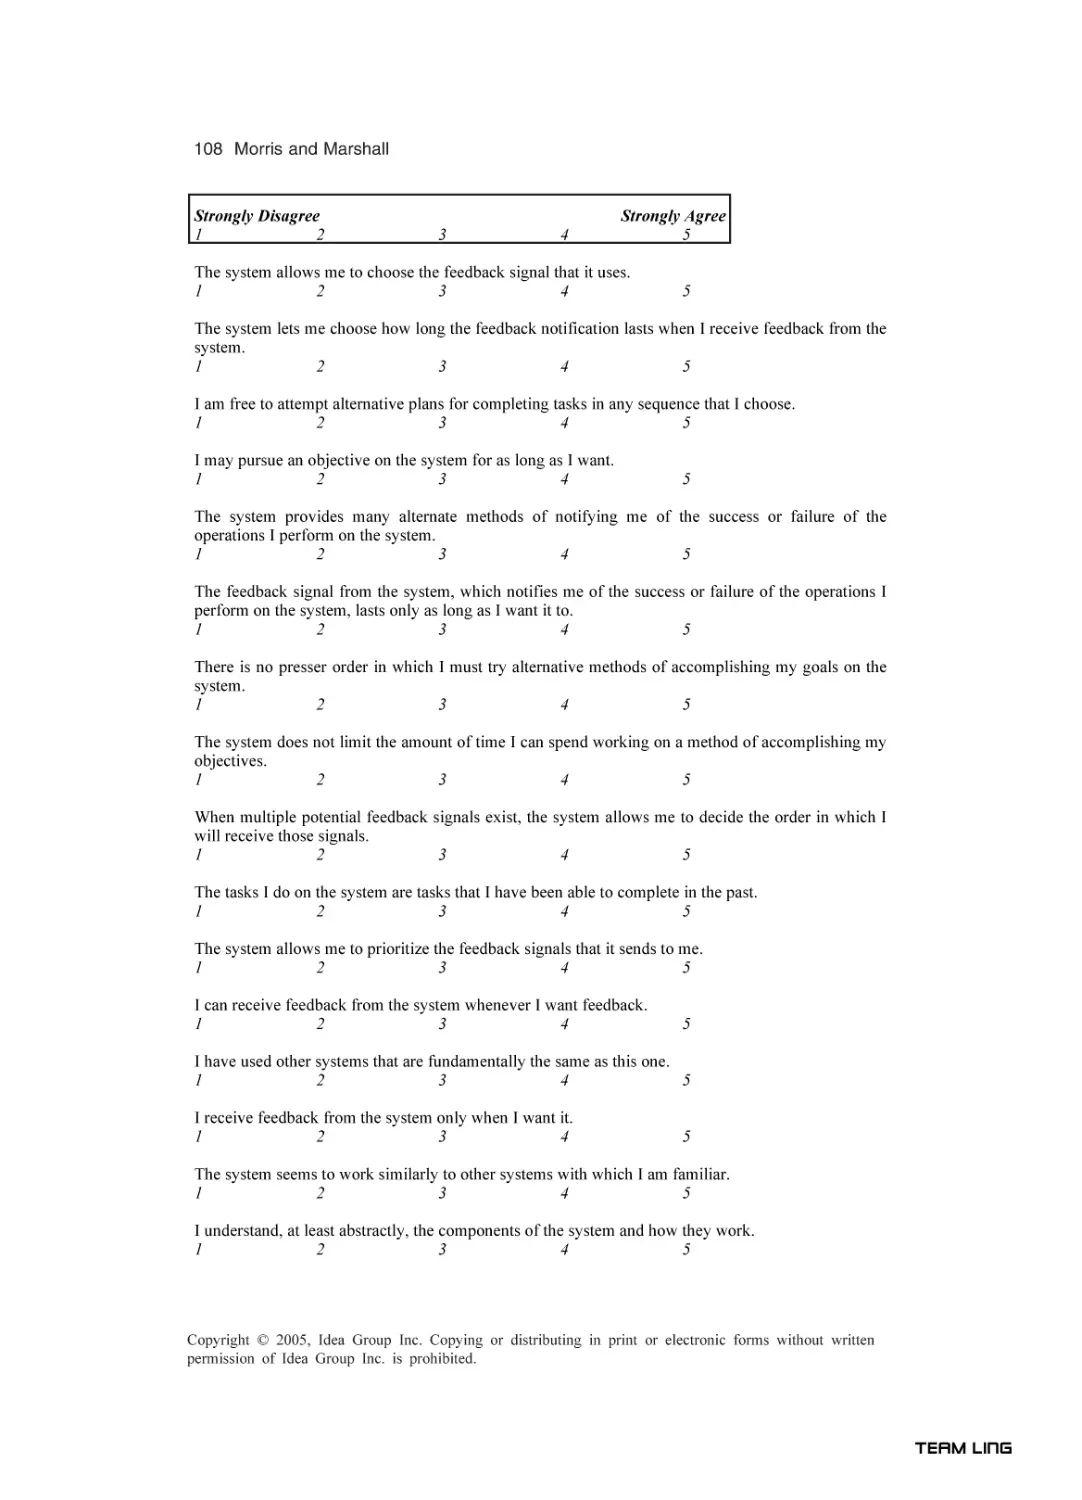
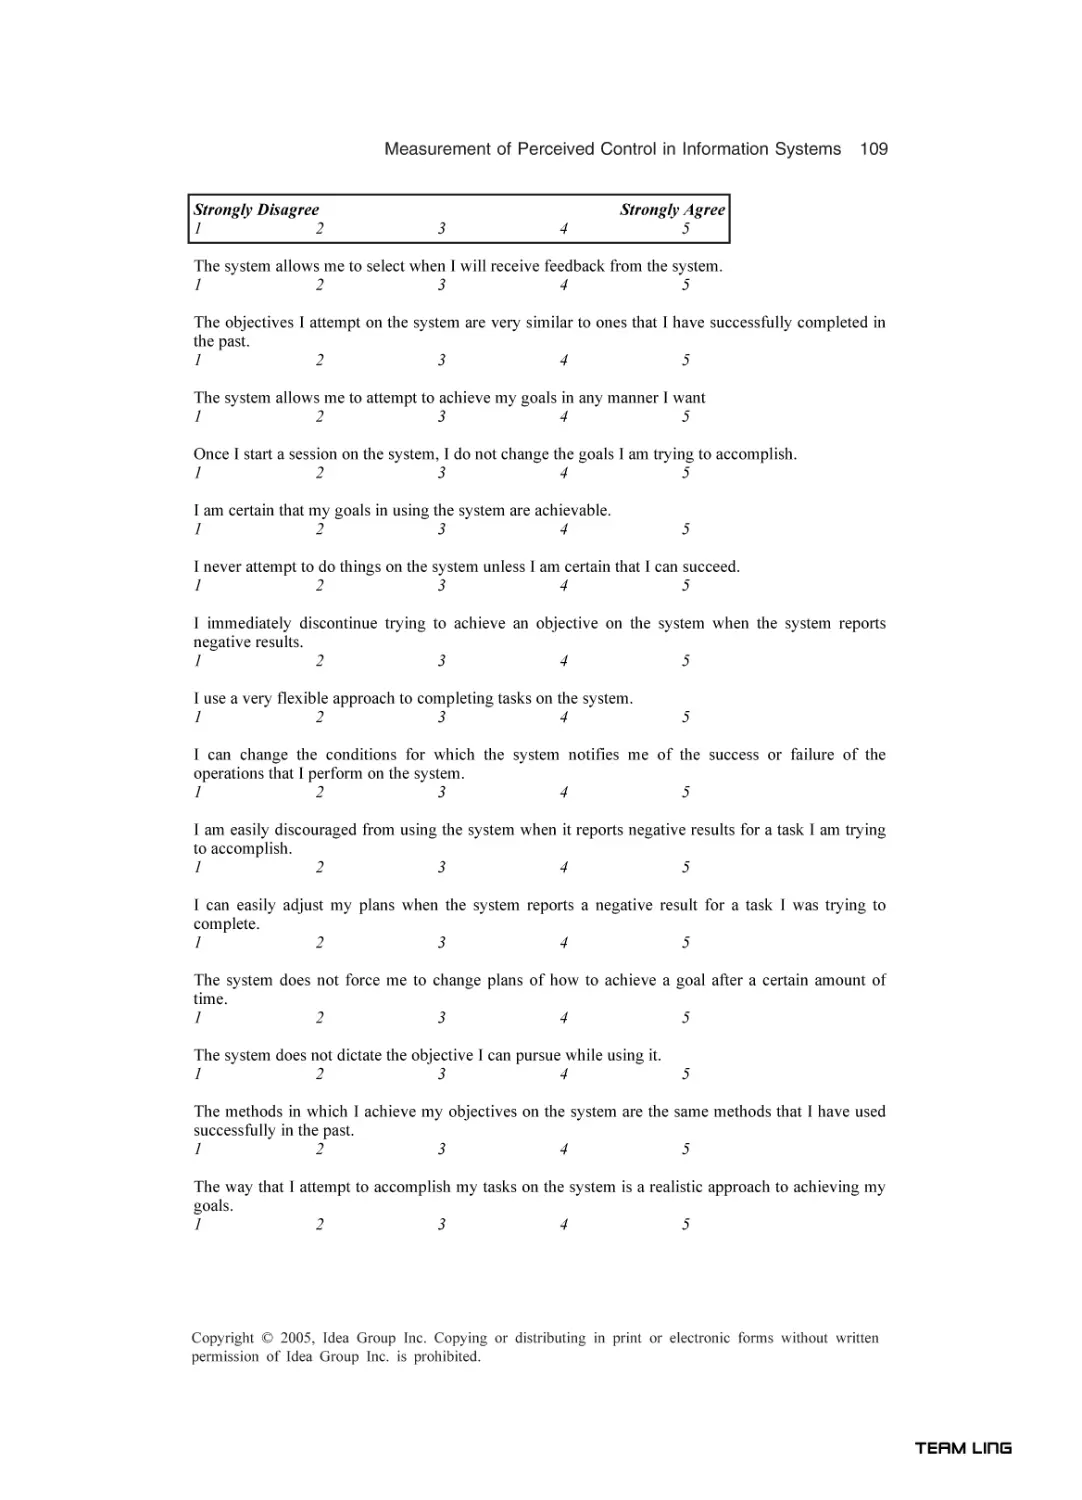
perceived control within the information systems (IS) area. The authors developed a survey instrument, based on the research literature in the IS area, to
assess perceived control as a multi-dimensional construct. They validated this
instrument using 241 subjects. They analyzed their results to produce a set of
five factors that represent a user’s perceptions of control when working with
an interactive information system: timeframe, feedback signal, feedback duration, strategy, and metaphor knowledge.
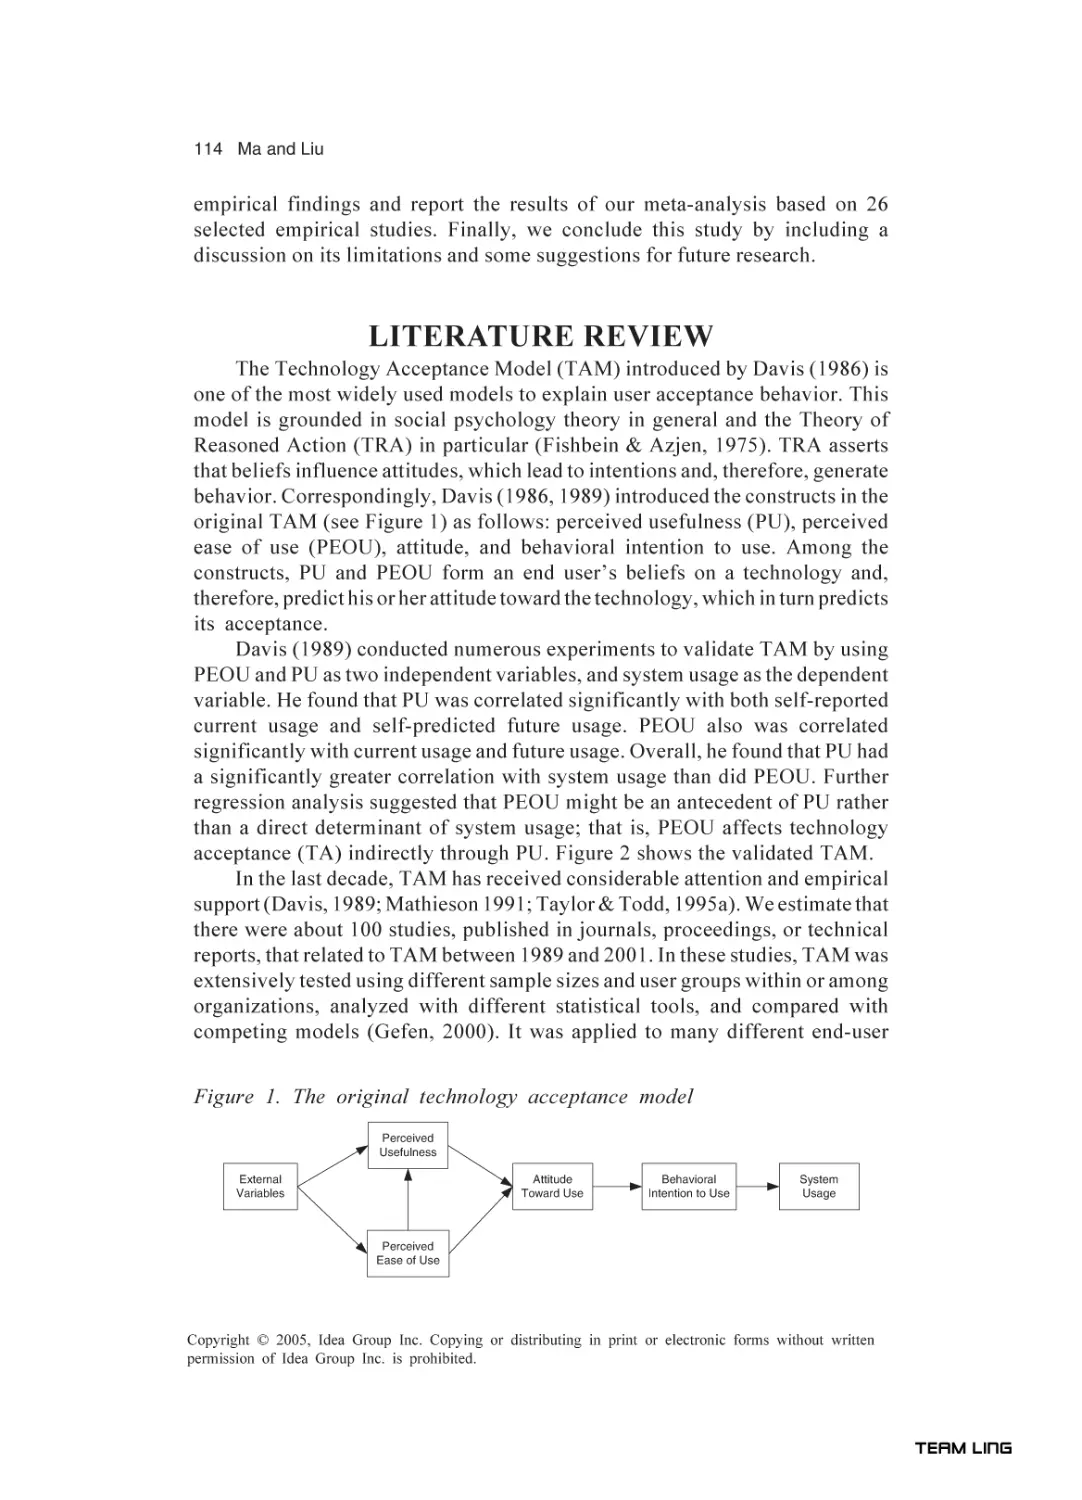
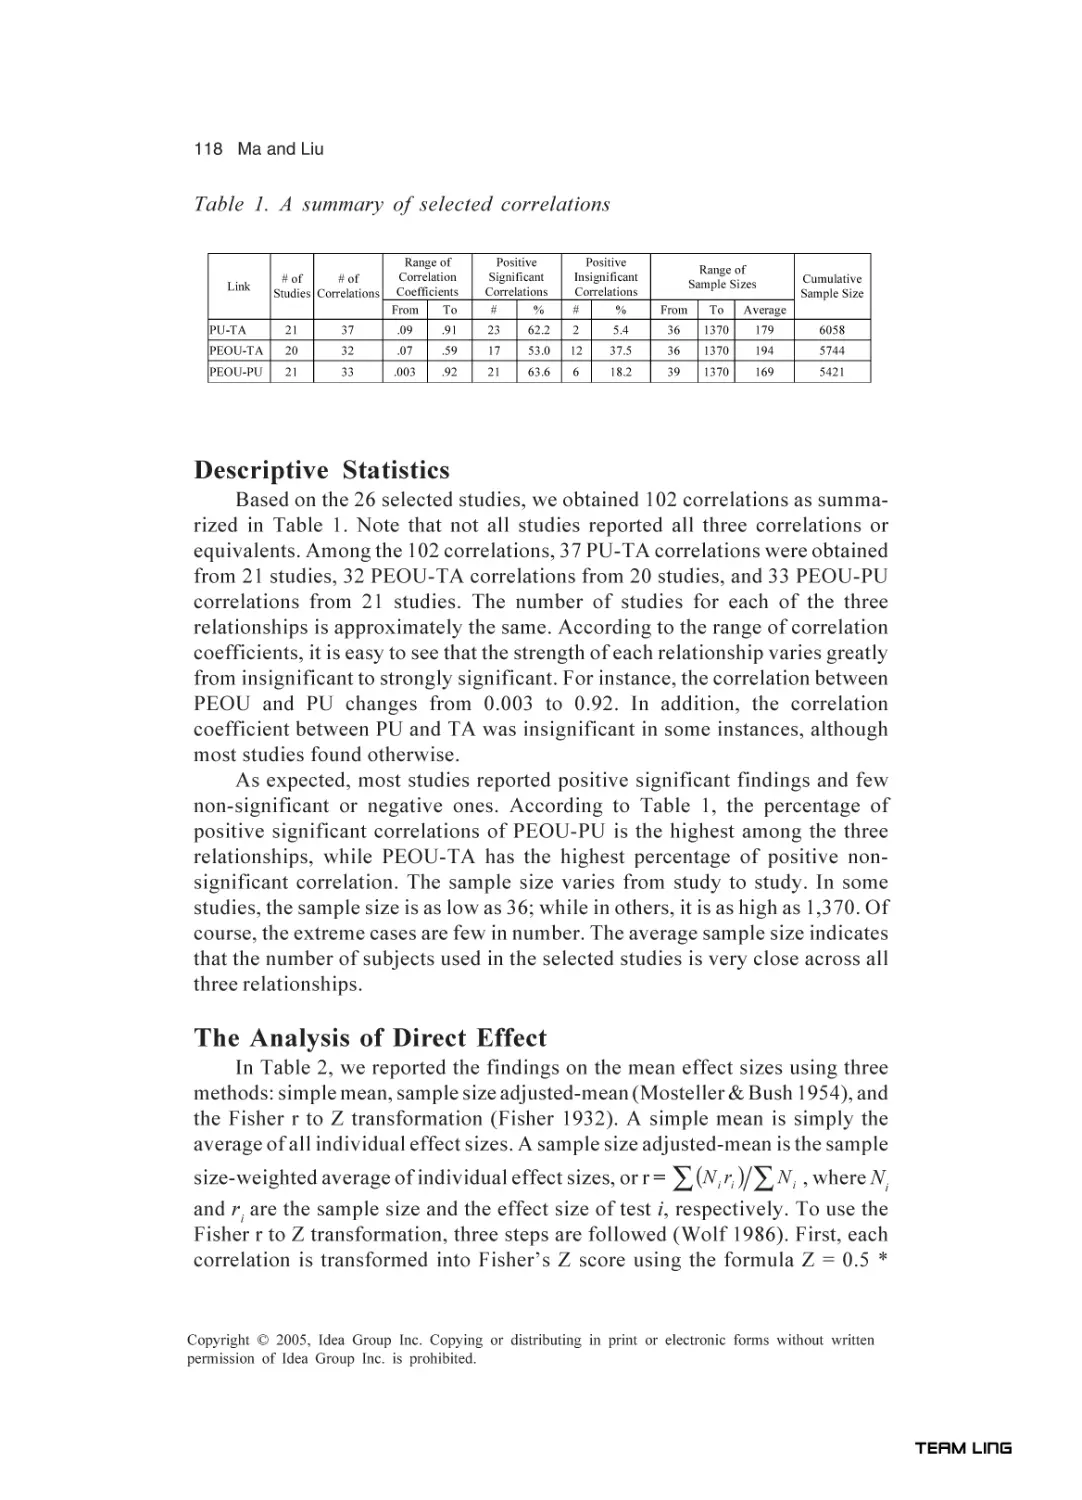
In Chapter VI, the final chapter in this section, Ma and Liu conducted a
meta analysis to synthesize and summarize the findings of 26 prior research
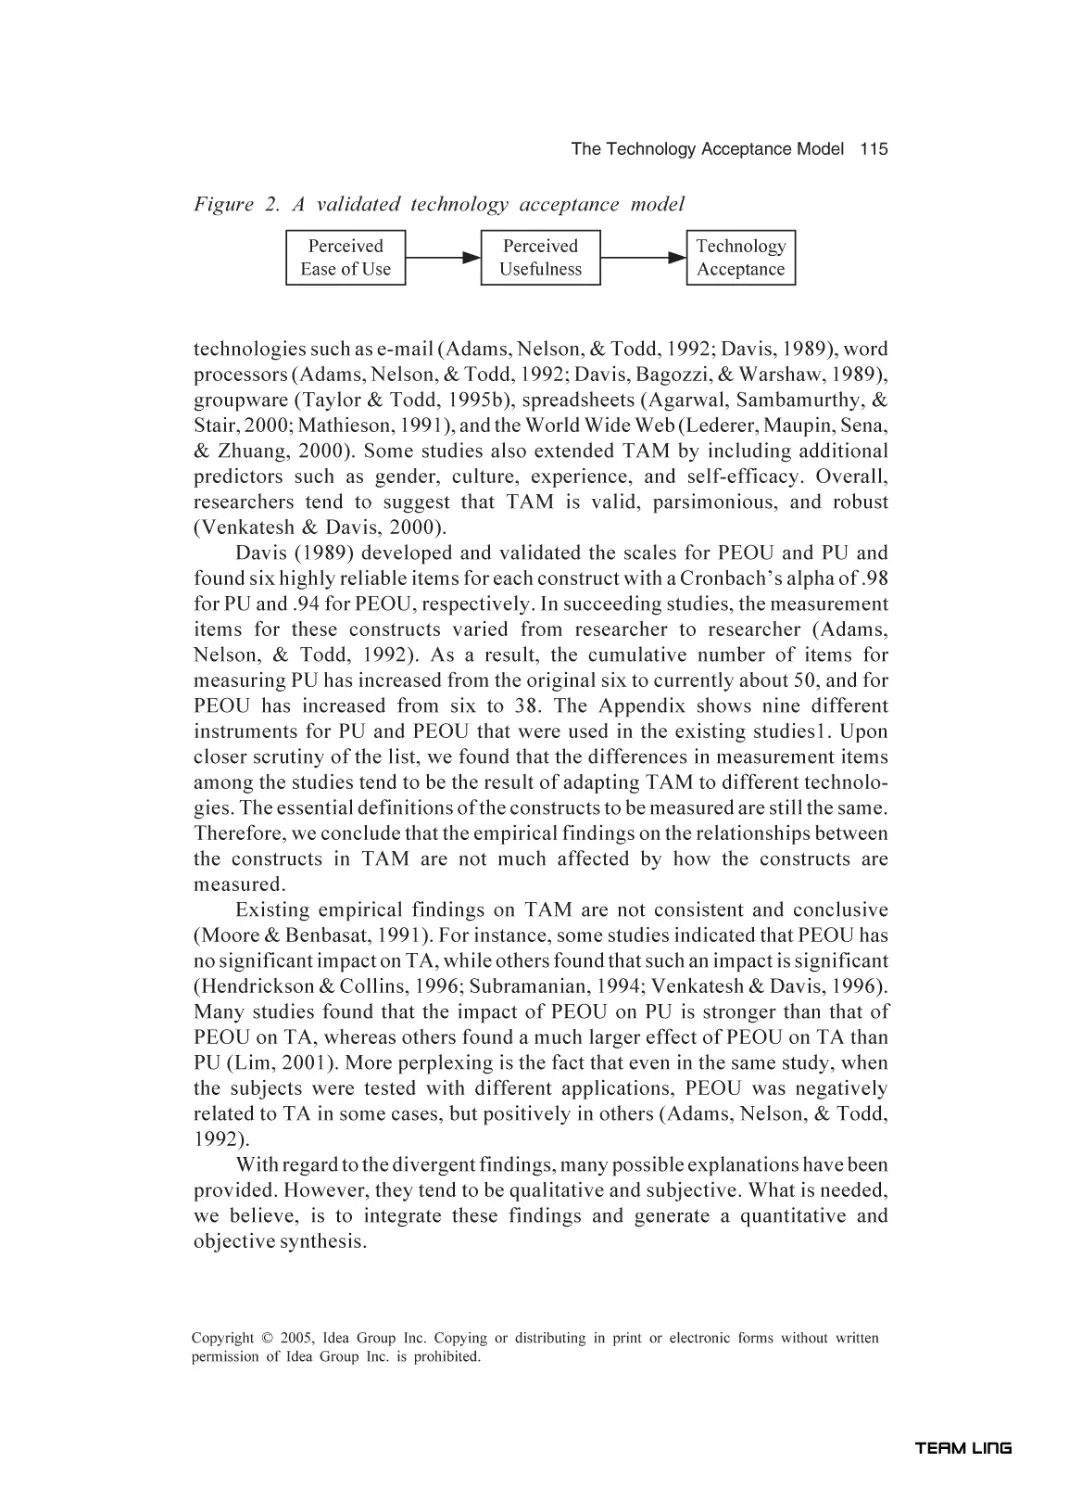
studies on perceived ease of use and usefulness that used the technology acceptance model (TAM) as a framework to predict the acceptance of information technology. A number of past studies have empirically investigated these
relationships, but, as the authors indicated, the findings of these research studies are mixed. The authors found that both the correlations between usefulness
and acceptance, and between usefulness and ease of use are somewhat strong.
TEAM LinG
viii
They found the relationship between ease of use and acceptance as weak.
As stated earlier, Section II addresses collaborative technologies and implementation issues. It consists of five chapters: Chapters VII, VIII, IX, X, and
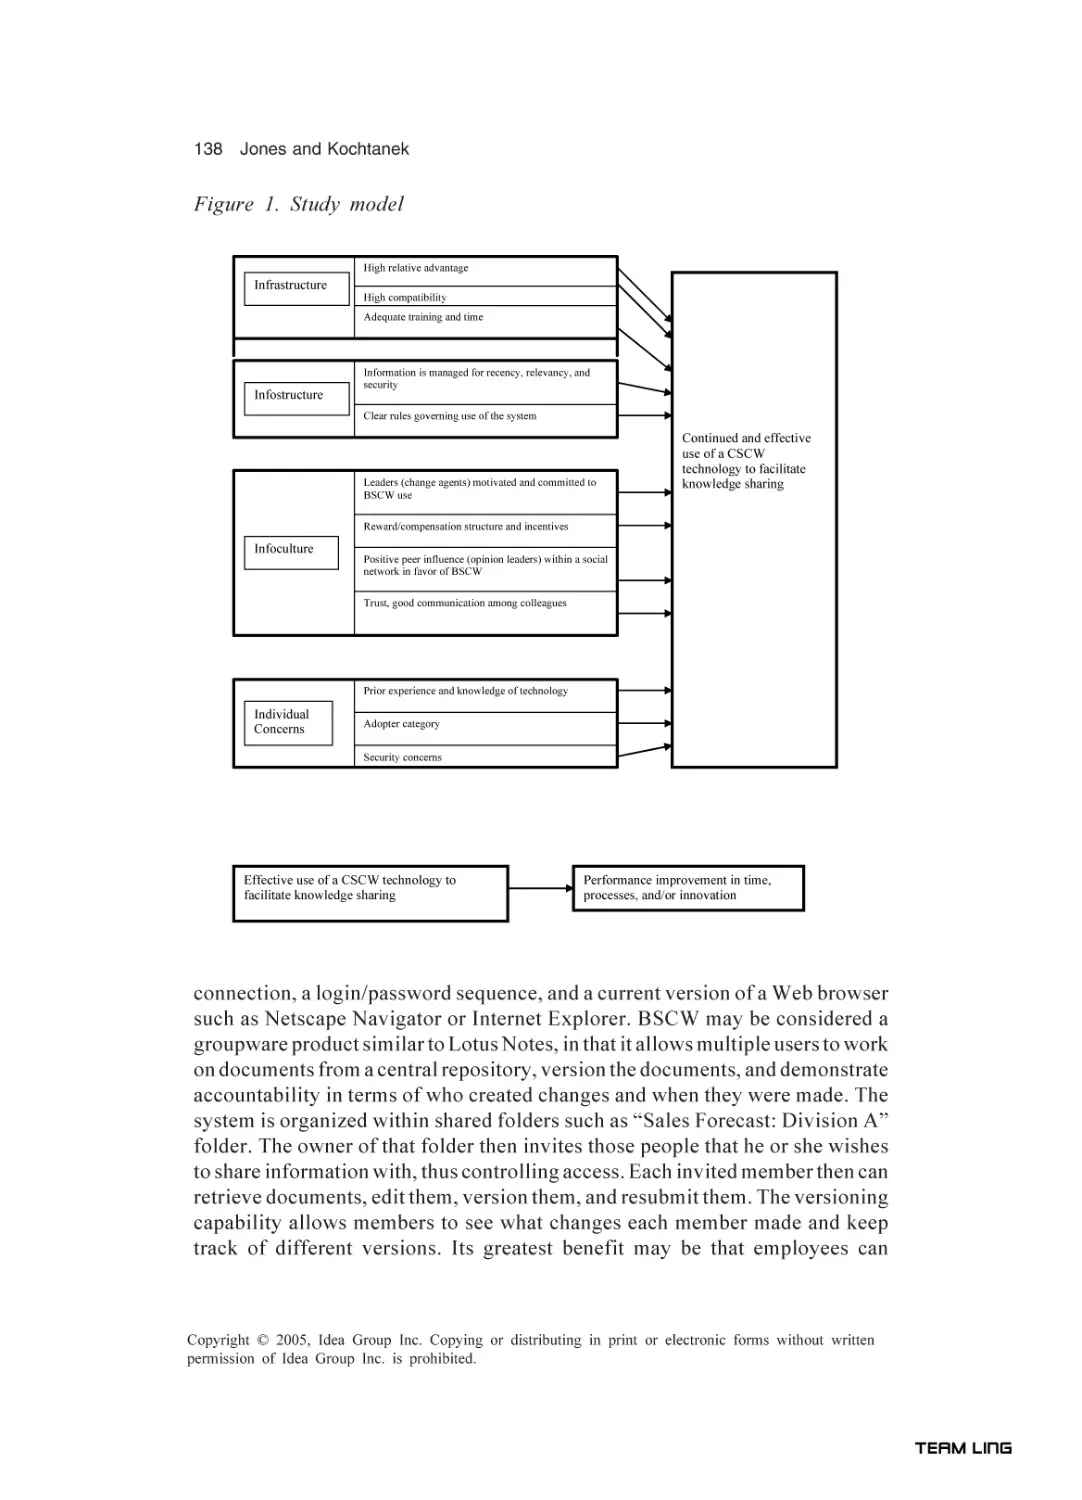
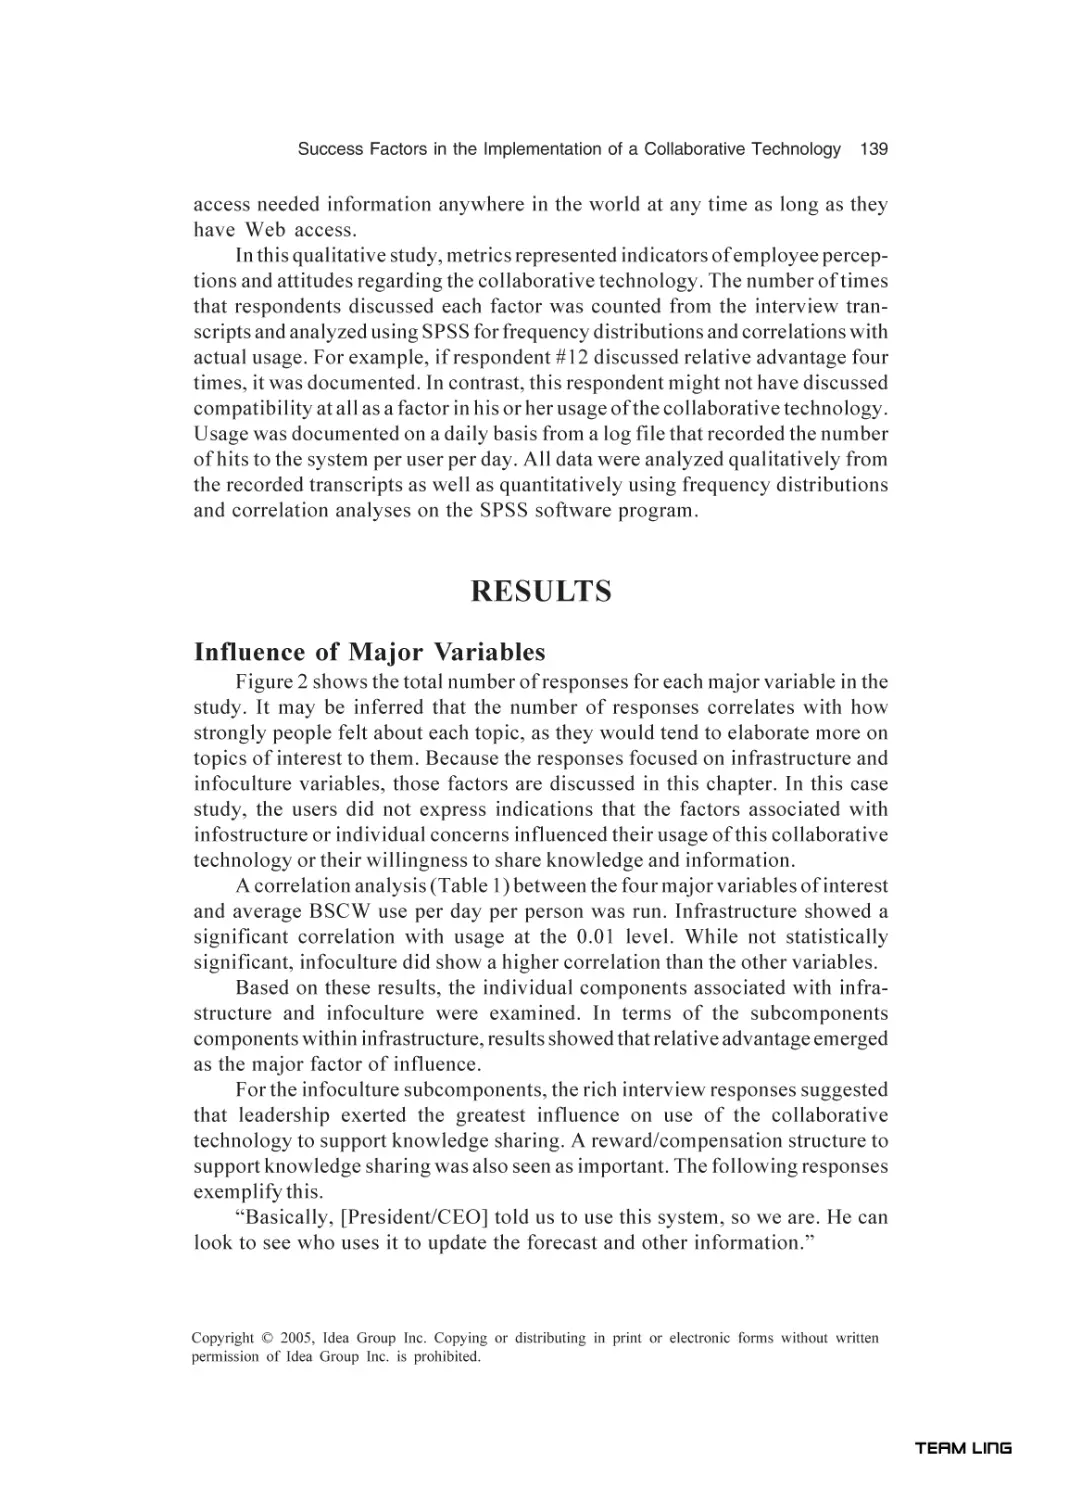
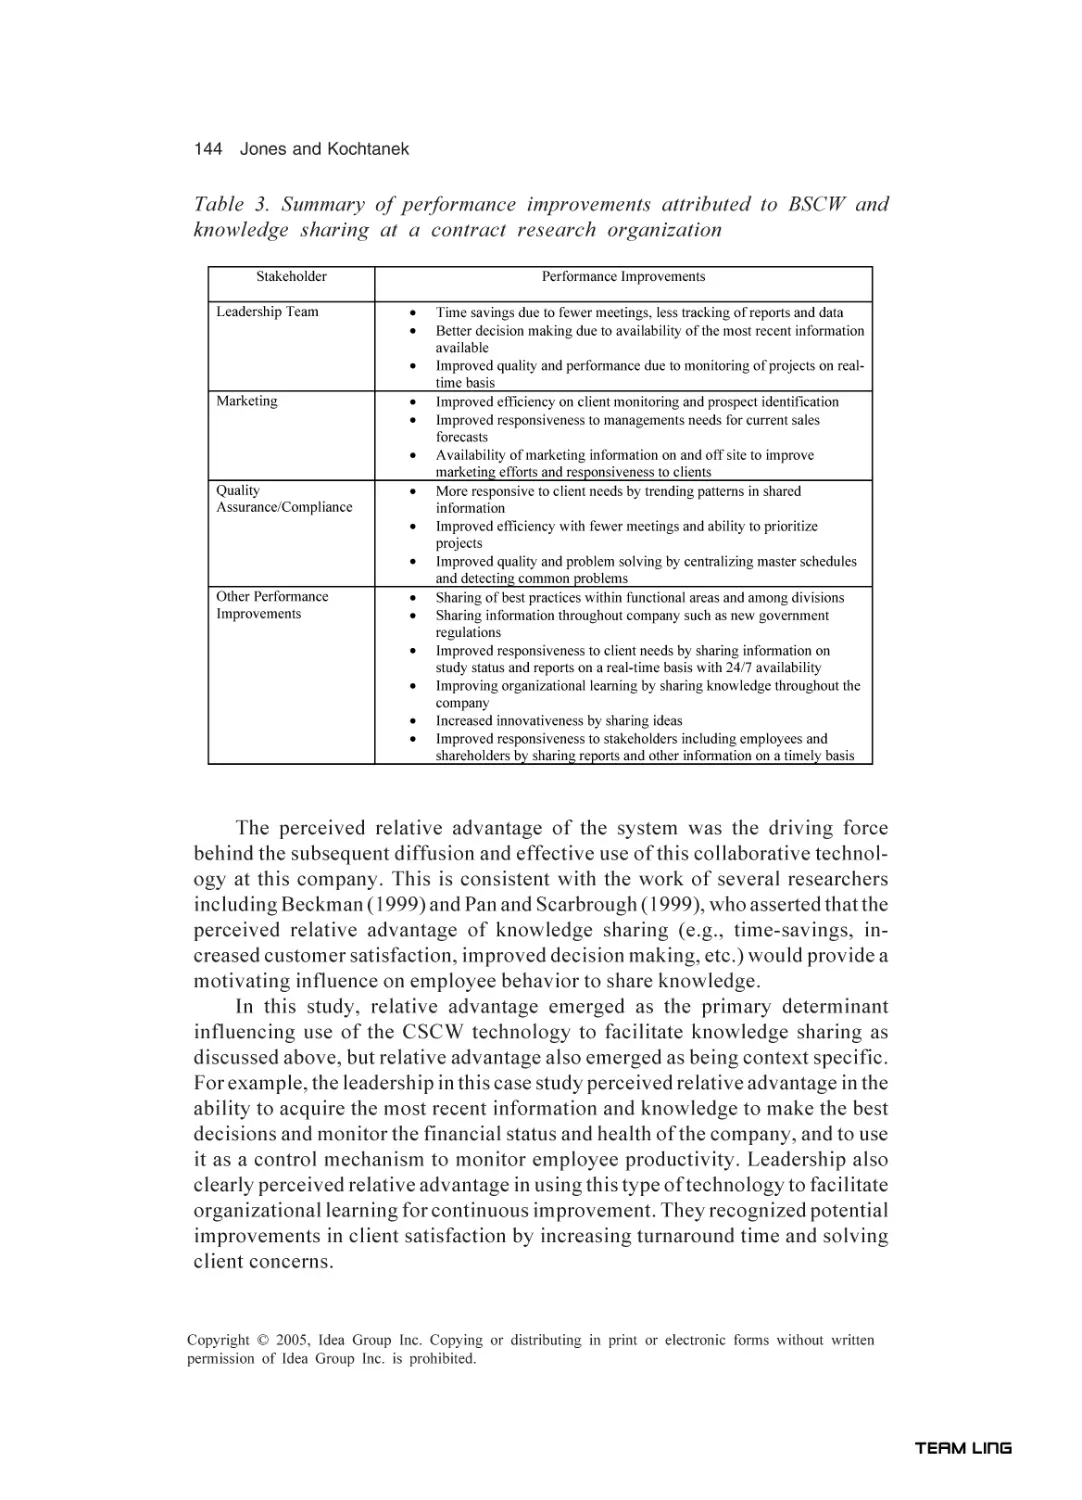
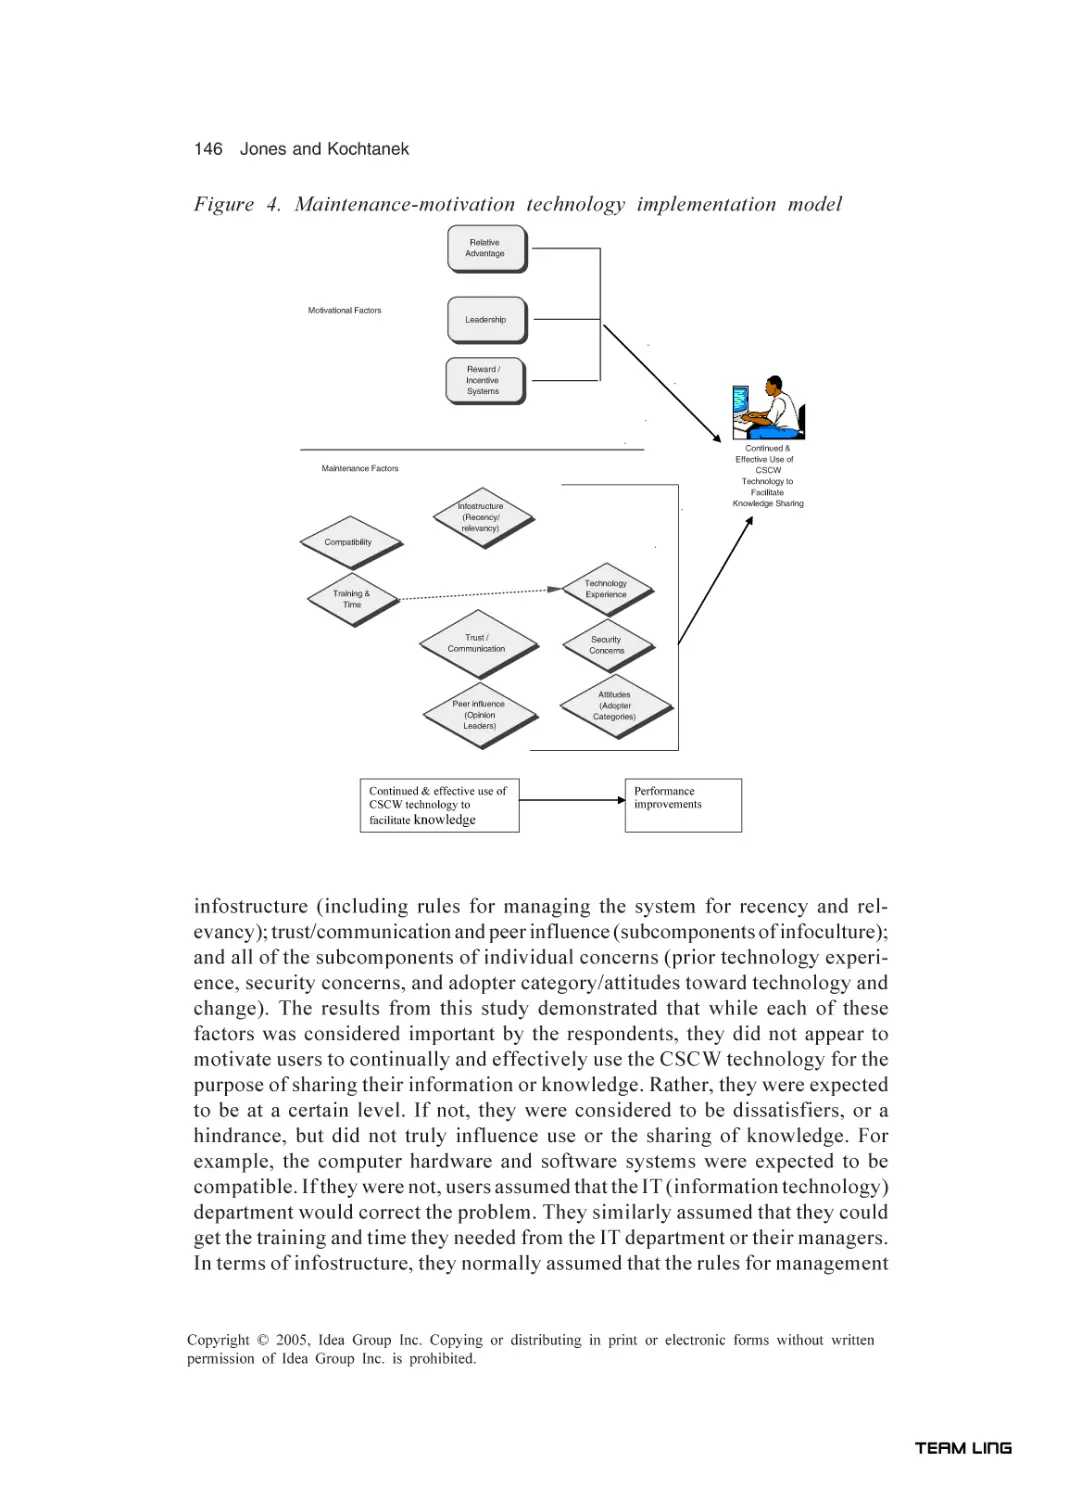
XI. In Chapter VII, Jones and Kochtanek recognize that literature provides
many examples of performance improvements resulting from adoption of different technologies. The authors, at the same time, claim that they found very
little evidence demonstrating specific and generalizable factors that contribute
to these improvements. The authors’ qualitative study examined the relationship between four classes of potential success factors on the adoption of a
collaborative technology and whether they are related to performance improvements in a small service company. They interviewed the users of a newly adopted
collaborative technology to explore which factors contributed to the users’ initial adoption and subsequent effective use of this technology. Their results showed
that several factors were strongly related to adoption and effective implementation. They further explored the impact on performance improvements. Their
results showed a qualitative link to several performance improvements, including time savings and improved decision-making.
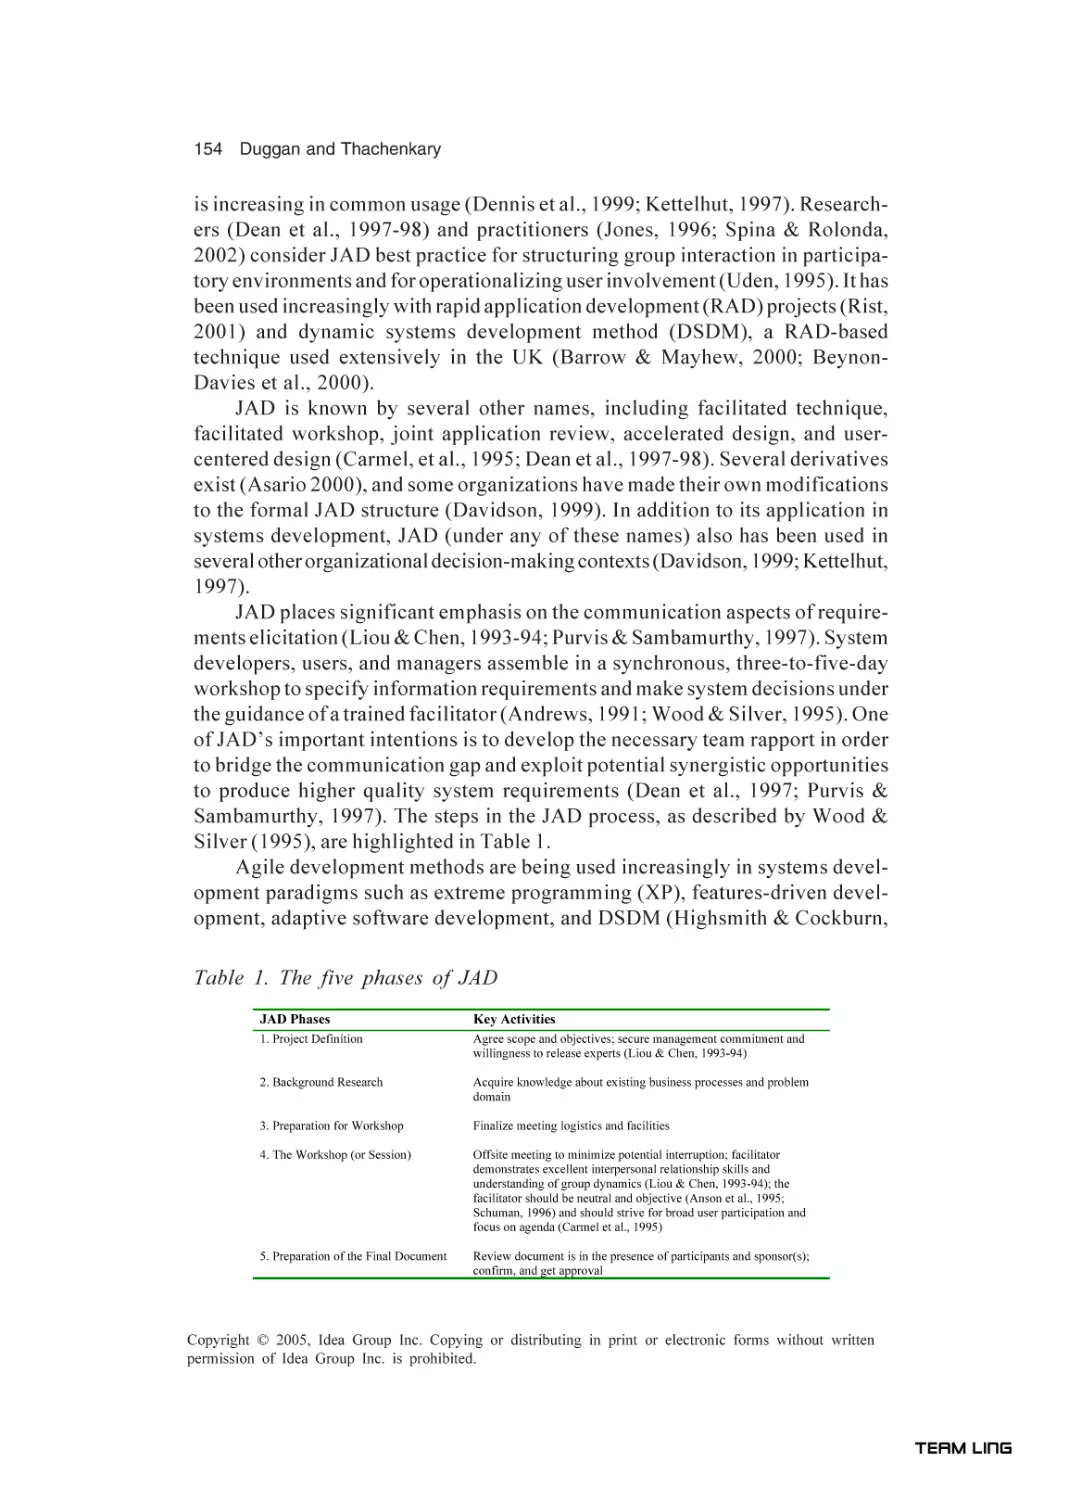
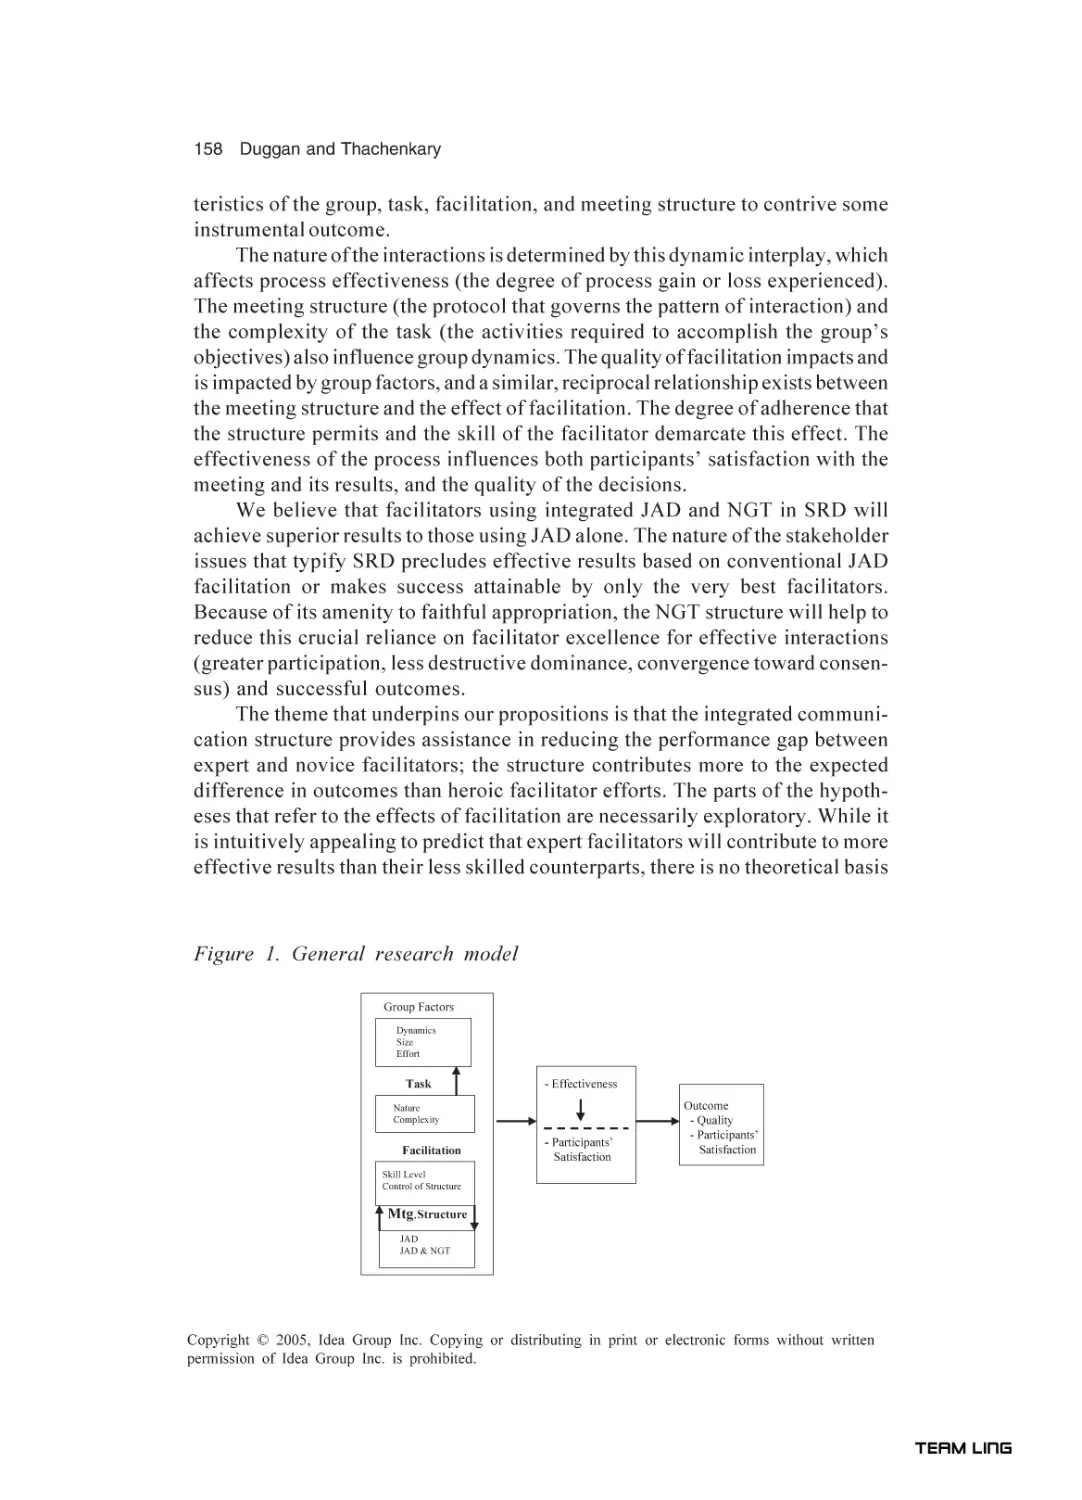
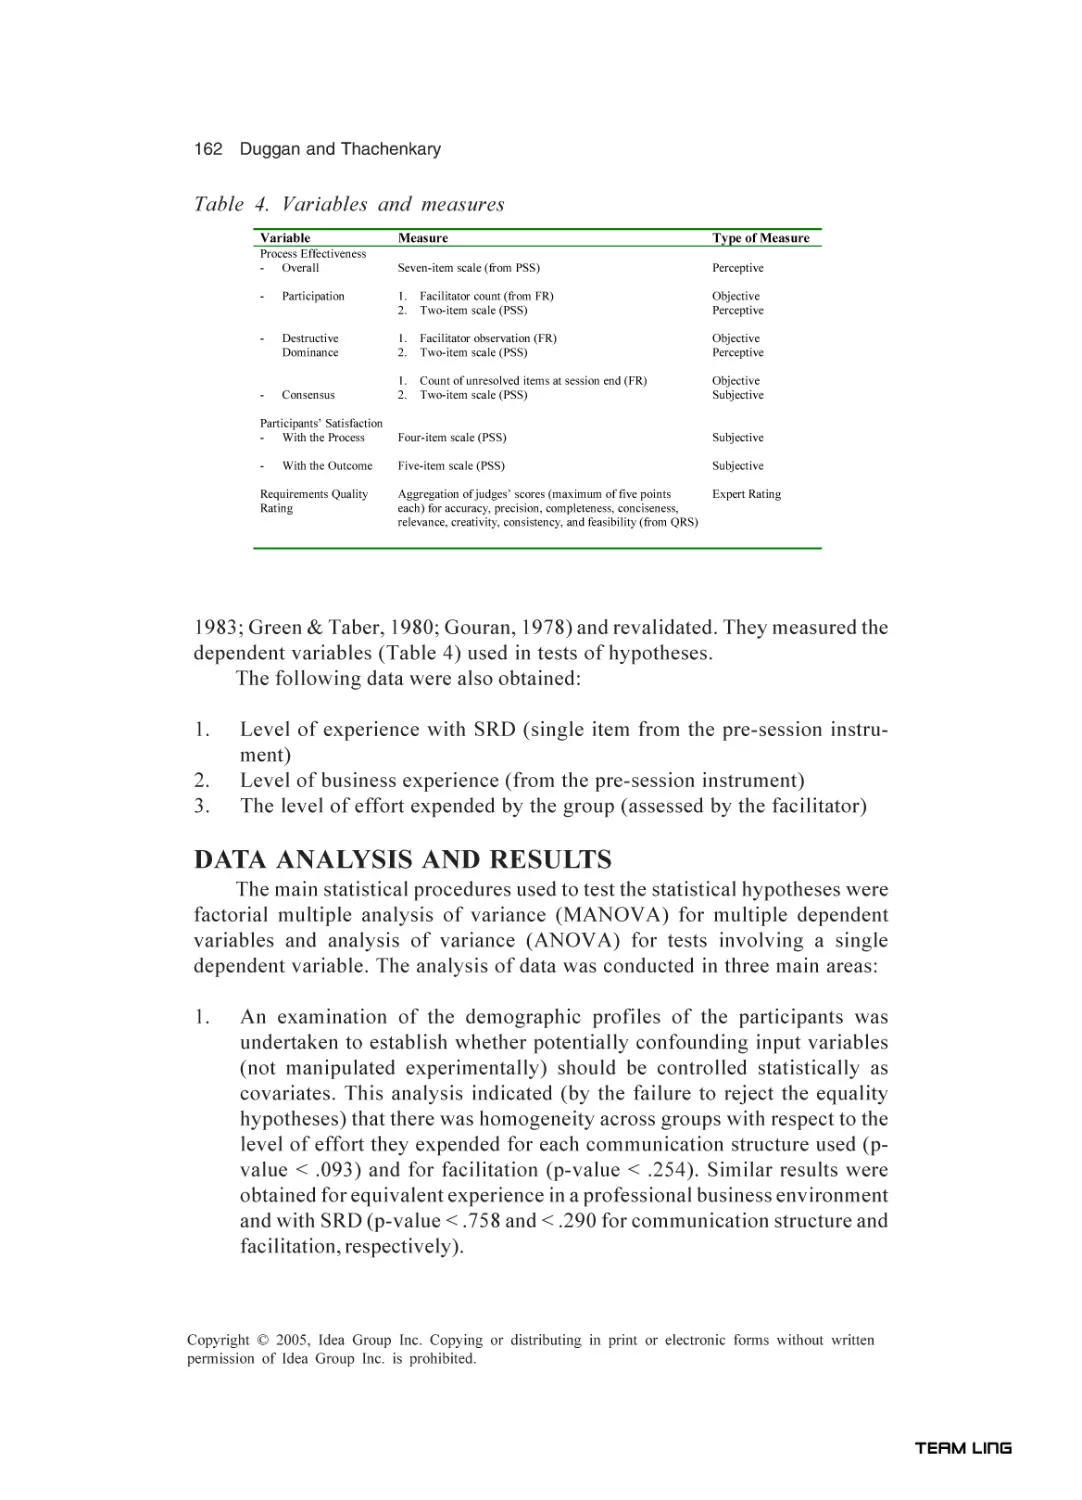
In Chapter VIII, Duggan and Thachenkary start by suggesting that the
Joint Application Development (JAD) was introduced to solve many of the
problems system users experienced with the conventional methods used in determining systems requirements. They recognize that JAD helped produce noteworthy improvements over these methods. They suggest that a JAD session
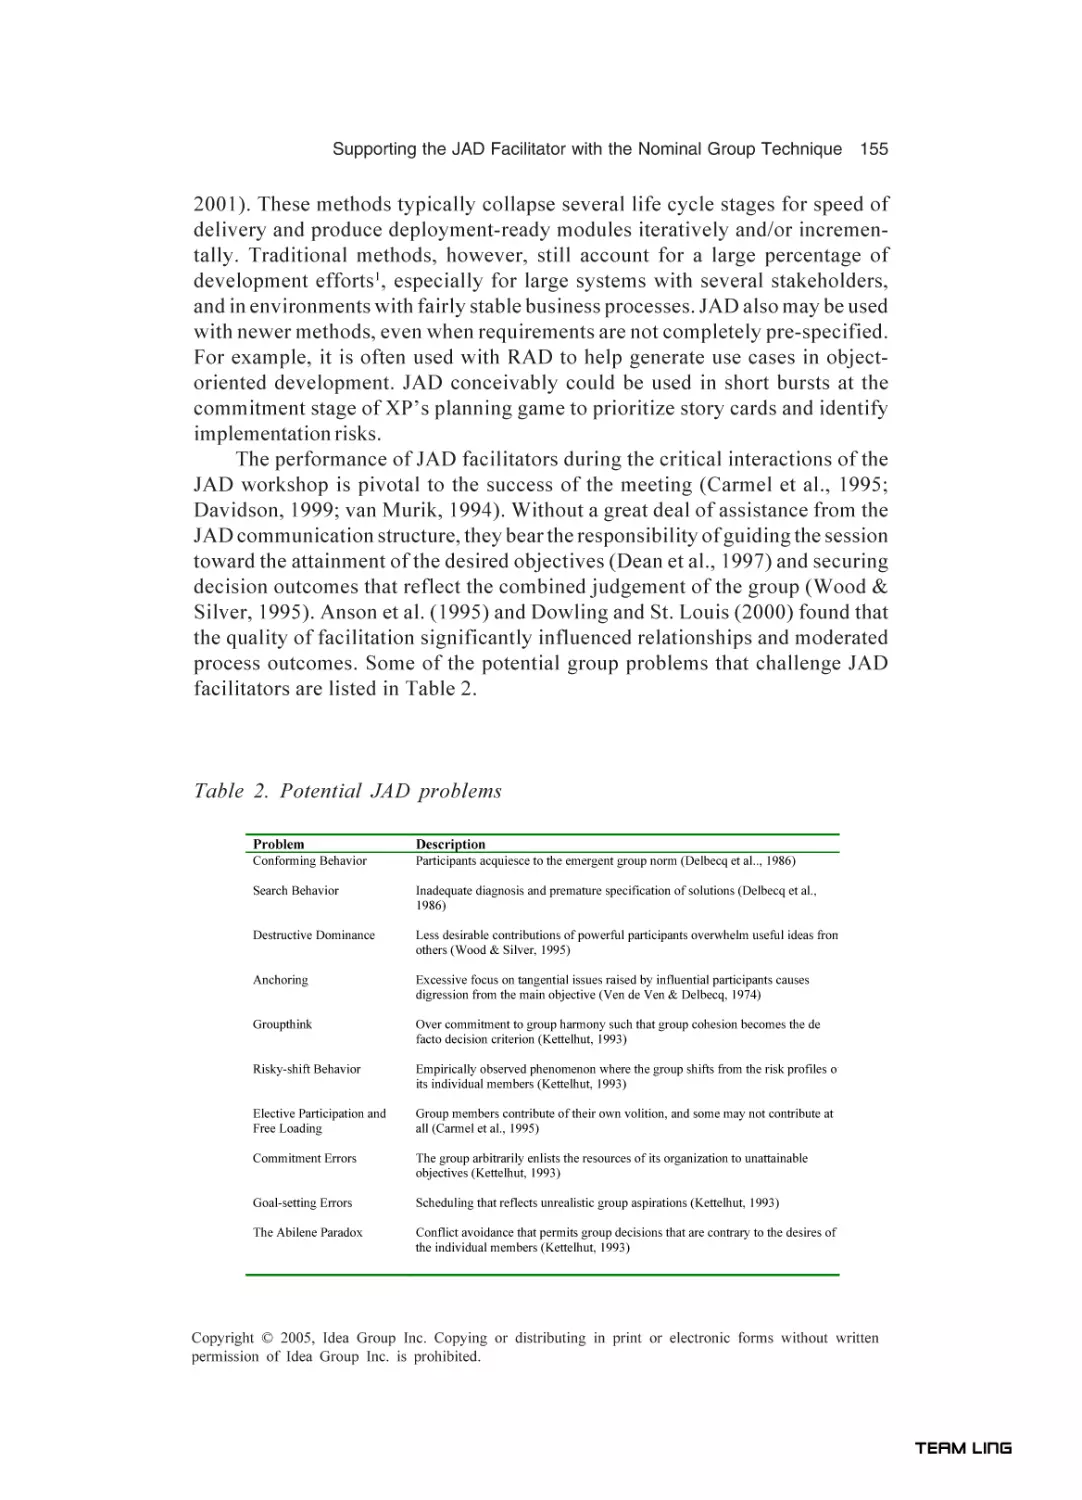
conducted with freely interacting groups is susceptible, however, to some problems that may curtail the effectiveness of groups. They further suggest that
JAD outcomes are also critically dependent on excellent facilitation for minimizing dysfunctional group behaviors, and many JAD efforts fail because some
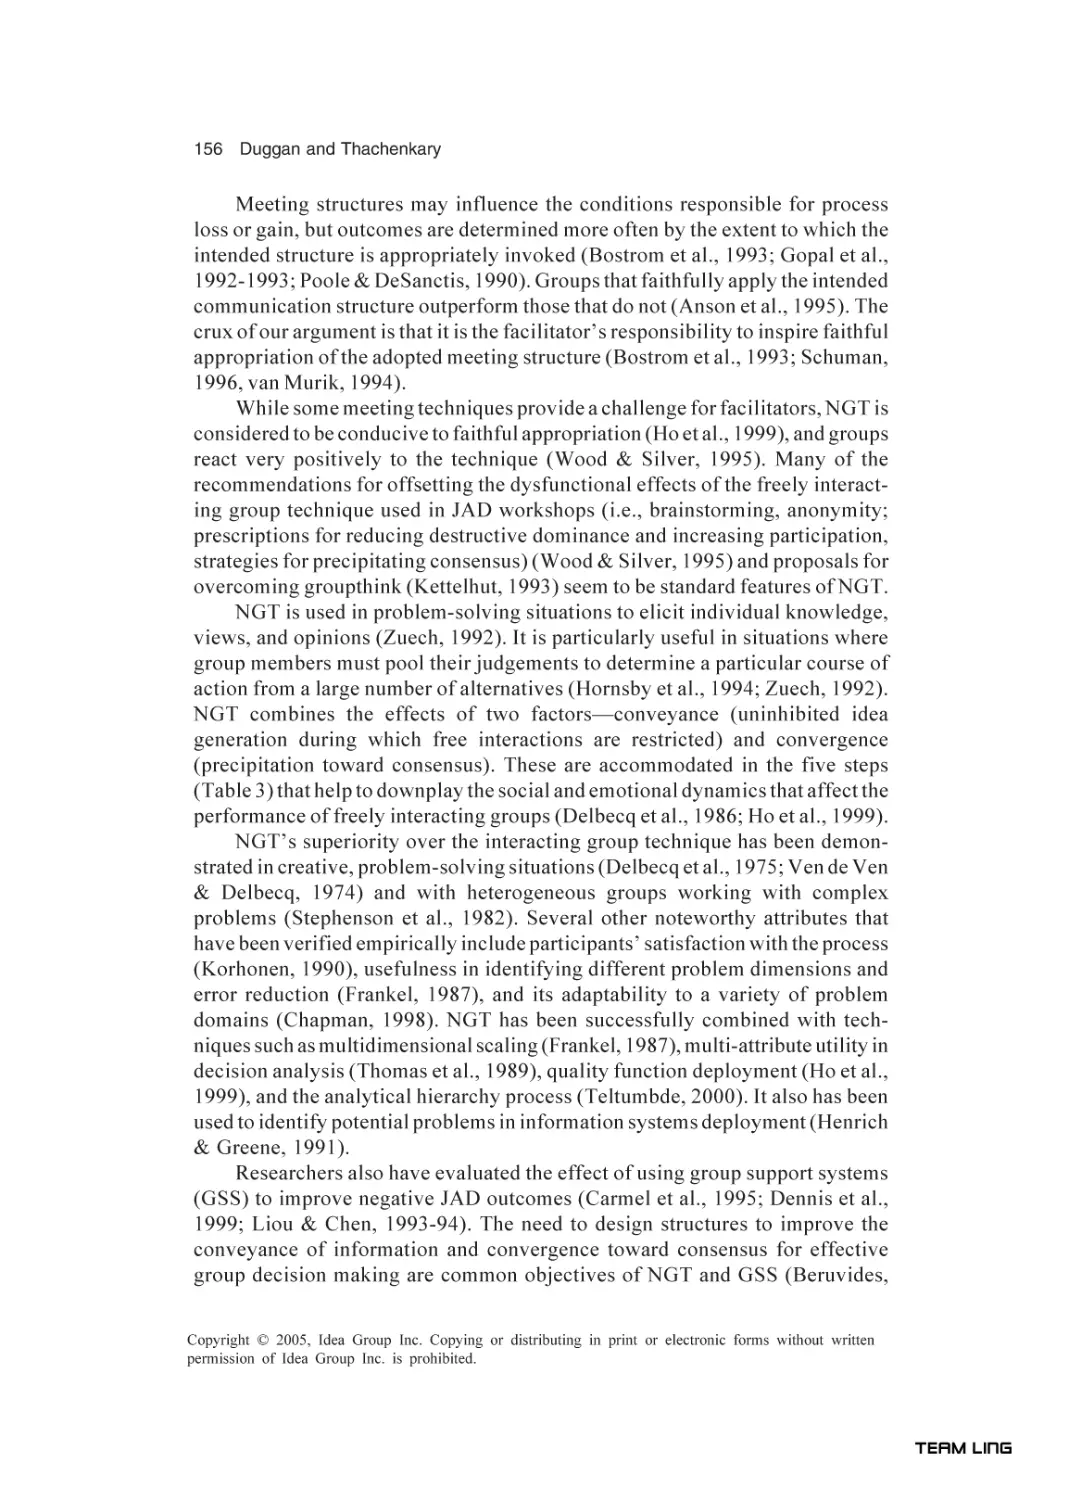
group members are often unavailable. According to the authors, the nominal
group technique (NGT) was designed to reduce the impact of negative group
dynamics. The authors integrate JAD and NGT to reduce the burden of the
JAD facilitator in controlling group sessions for determining systems requirements. They empirically tested their approach, which was found to outperform
JAD in the areas tested and seemed to contribute to group outcomes even
without excellent facilitation.
Adams, Berner, and Wyatt in Chapter IX suggest that user resistance is a
common occurrence when new information systems are introduced to health
care organizations. They further suggest that individuals responsible for overseeing the implementation process of these systems in the health care environment may encounter more resistance than facilitators in other environments.
The authors claim that proper training of end users is an important strategy for
minimizing this resistance. Their research reviews the literature on the reasons
for user resistance to health care information systems and the implications of
this literature on the design of training programs. They illustrate principles for
reducing user resistance (e.g., communication, user involvement, strategic use
TEAM LinG
ix
of consultants) using a case study that involved training clinical managers on
business applications. The authors recommend that individuals responsible for
health care information system implementations should recognize that end user
resistance can lead to system failure and should employ these best practices
when embarking on new implementations.
In Chapter X, Stahl suggests that decisions regarding information assurance, IT security, and privacy can affect individuals’ rights and obligations. The
author explores the question of whether individual responsibility is a useful construct to address ethical issues of this complexity. After introducing a theory of
responsibility, he discusses the conditions that an individual typically is assumed
to fulfill in such an environment. The author argues that individuals lack some
of the essential preconditions necessary for handling responsibility. According
to the author, individuals have neither the power, the knowledge, nor the intellectual capacities to successfully deal with the ethical challenges in the tension
of privacy and information assurance. The author ends by suggesting that the
concept of responsibility may be useful nevertheless in this setting, but it will
have to be expanded to allow collective entities as subjects.
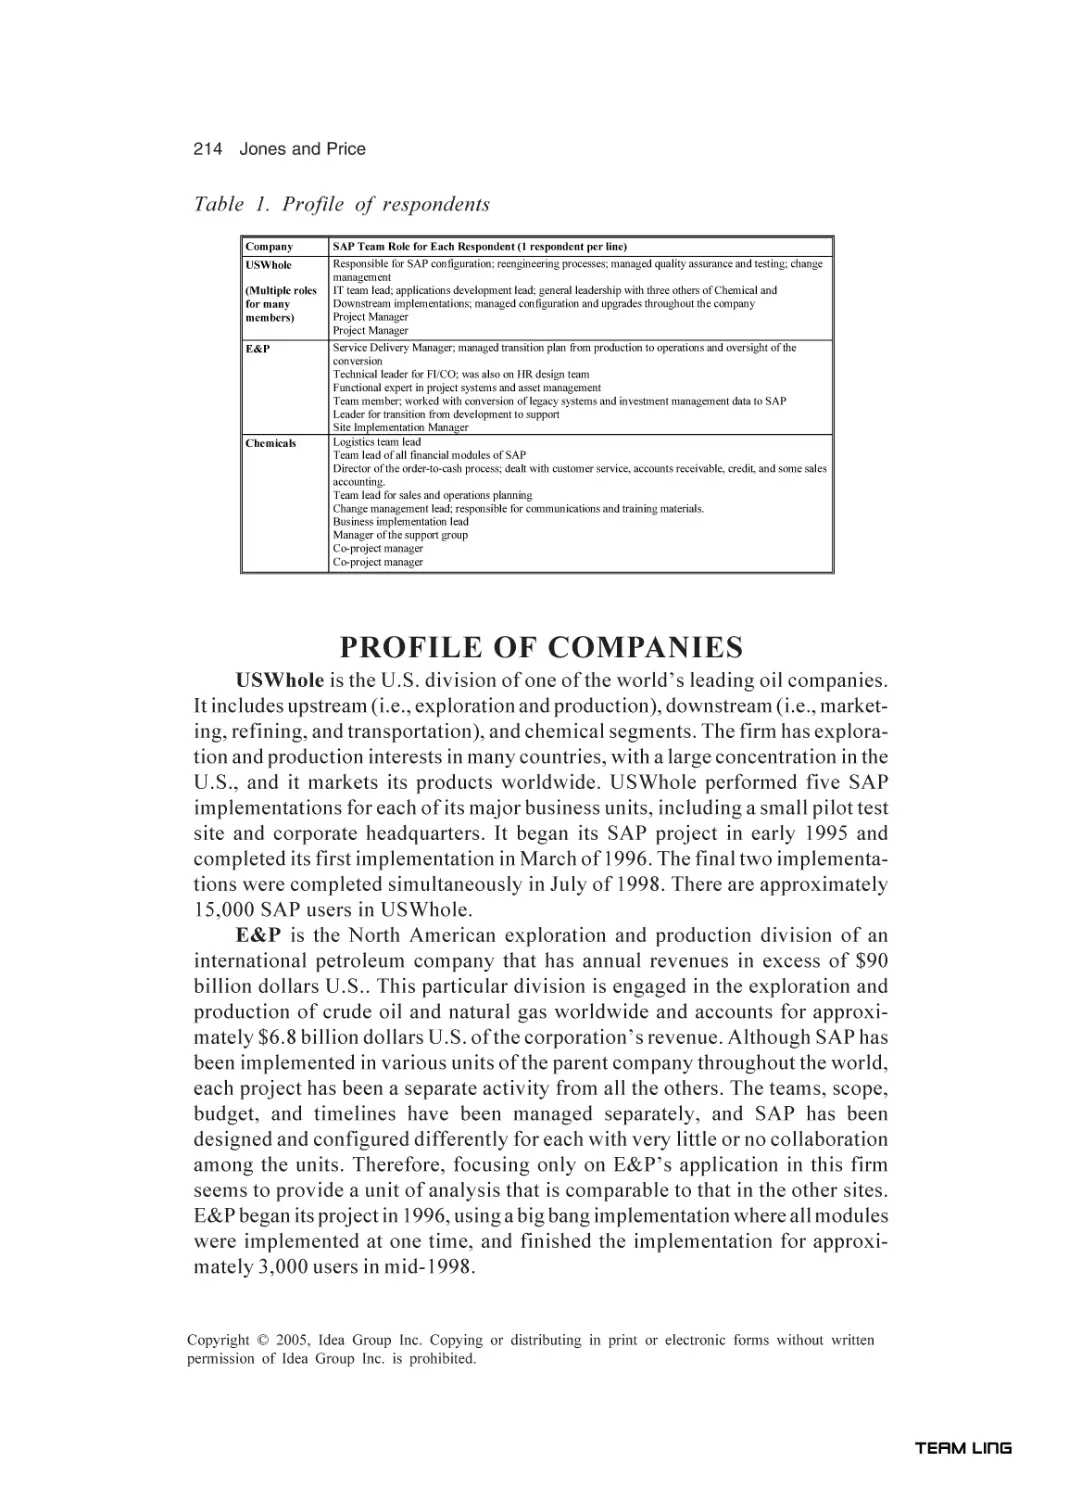
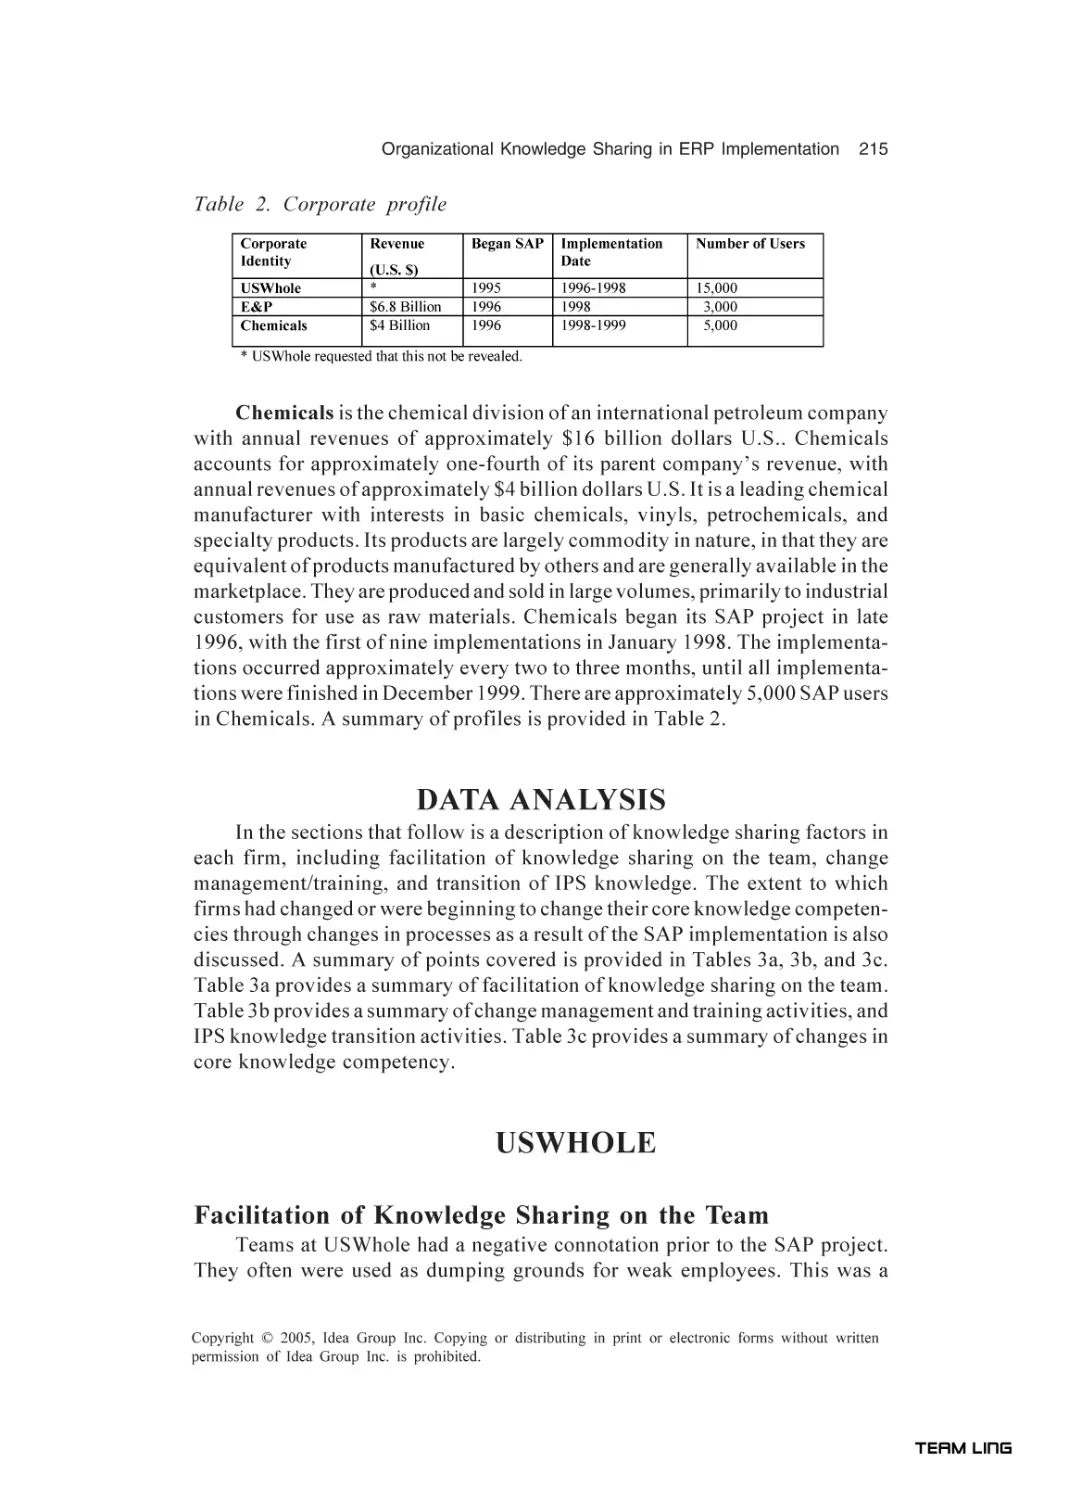
In Chapter XI, Jones and Price put forth that knowledge sharing in ERP
implementation is somewhat unique, because ERP requires end users to have
more divergent knowledge than is required in the use of traditional information
systems. They claim that, because of the length of the time and commitment
that ERP implementation requires, end users often are more involved in ERP
implementations than they are in more traditional information systems implementations. Their study presents findings about organizational knowledge sharing during ERP implementation in three firms. They collected data through interviews using a multi-site case study methodology. The authors analyzed the
findings in an effort to provide a basis on which practitioners can more effectively facilitate knowledge sharing during ERP implementation.
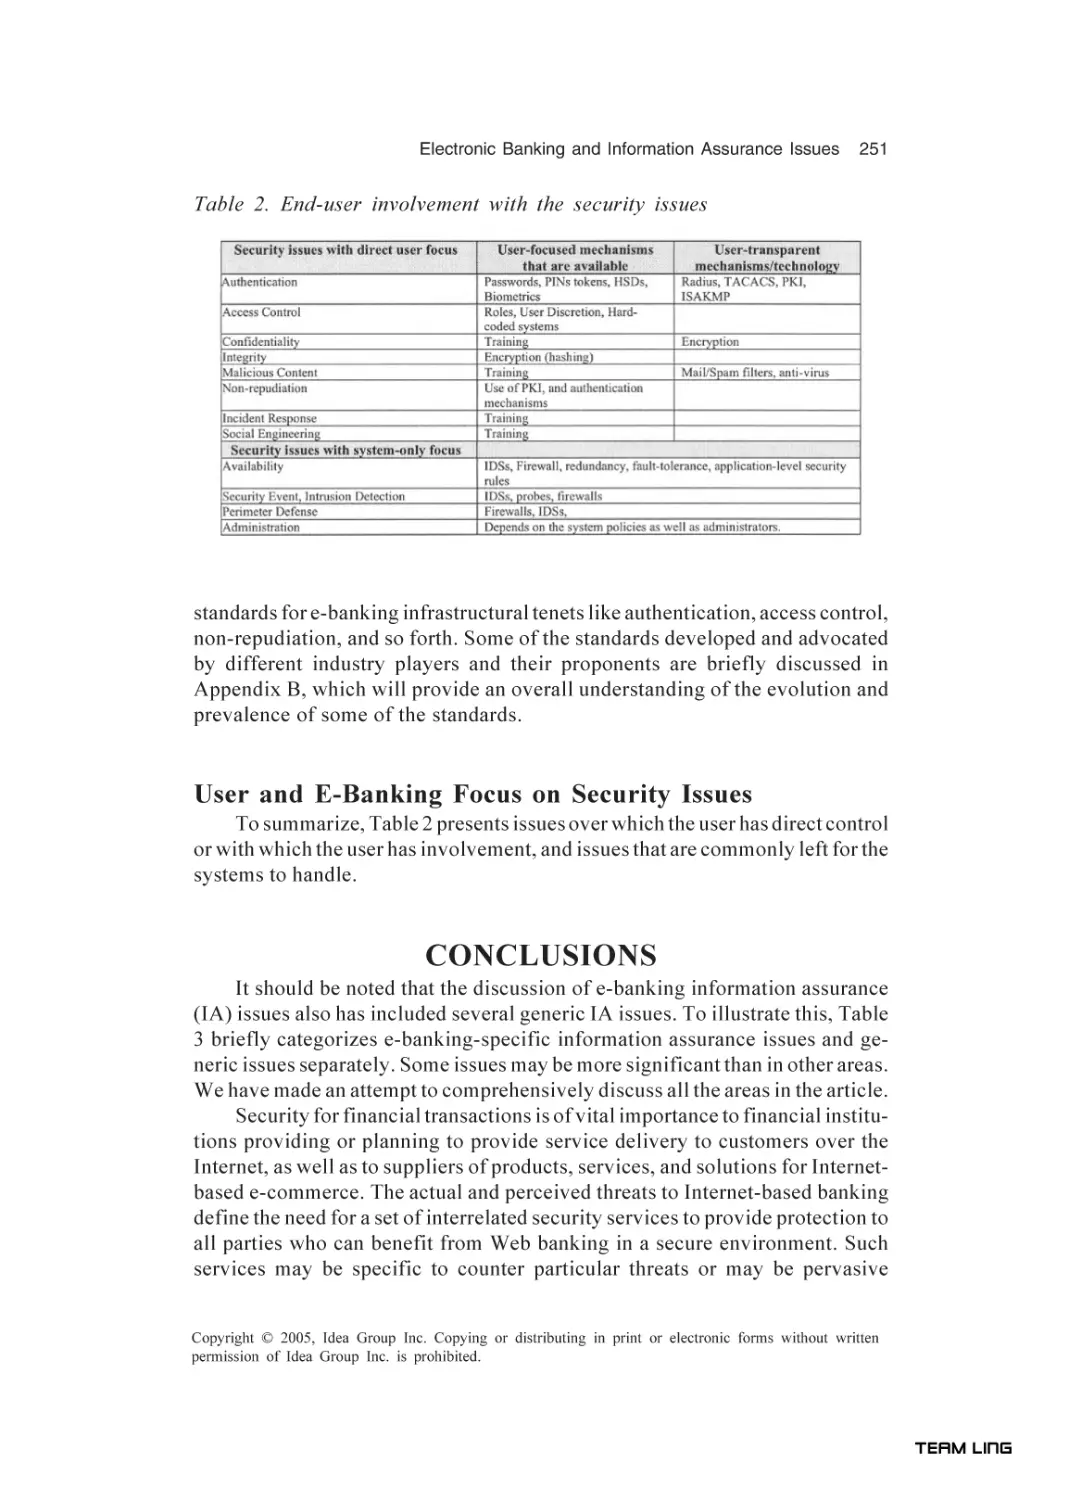
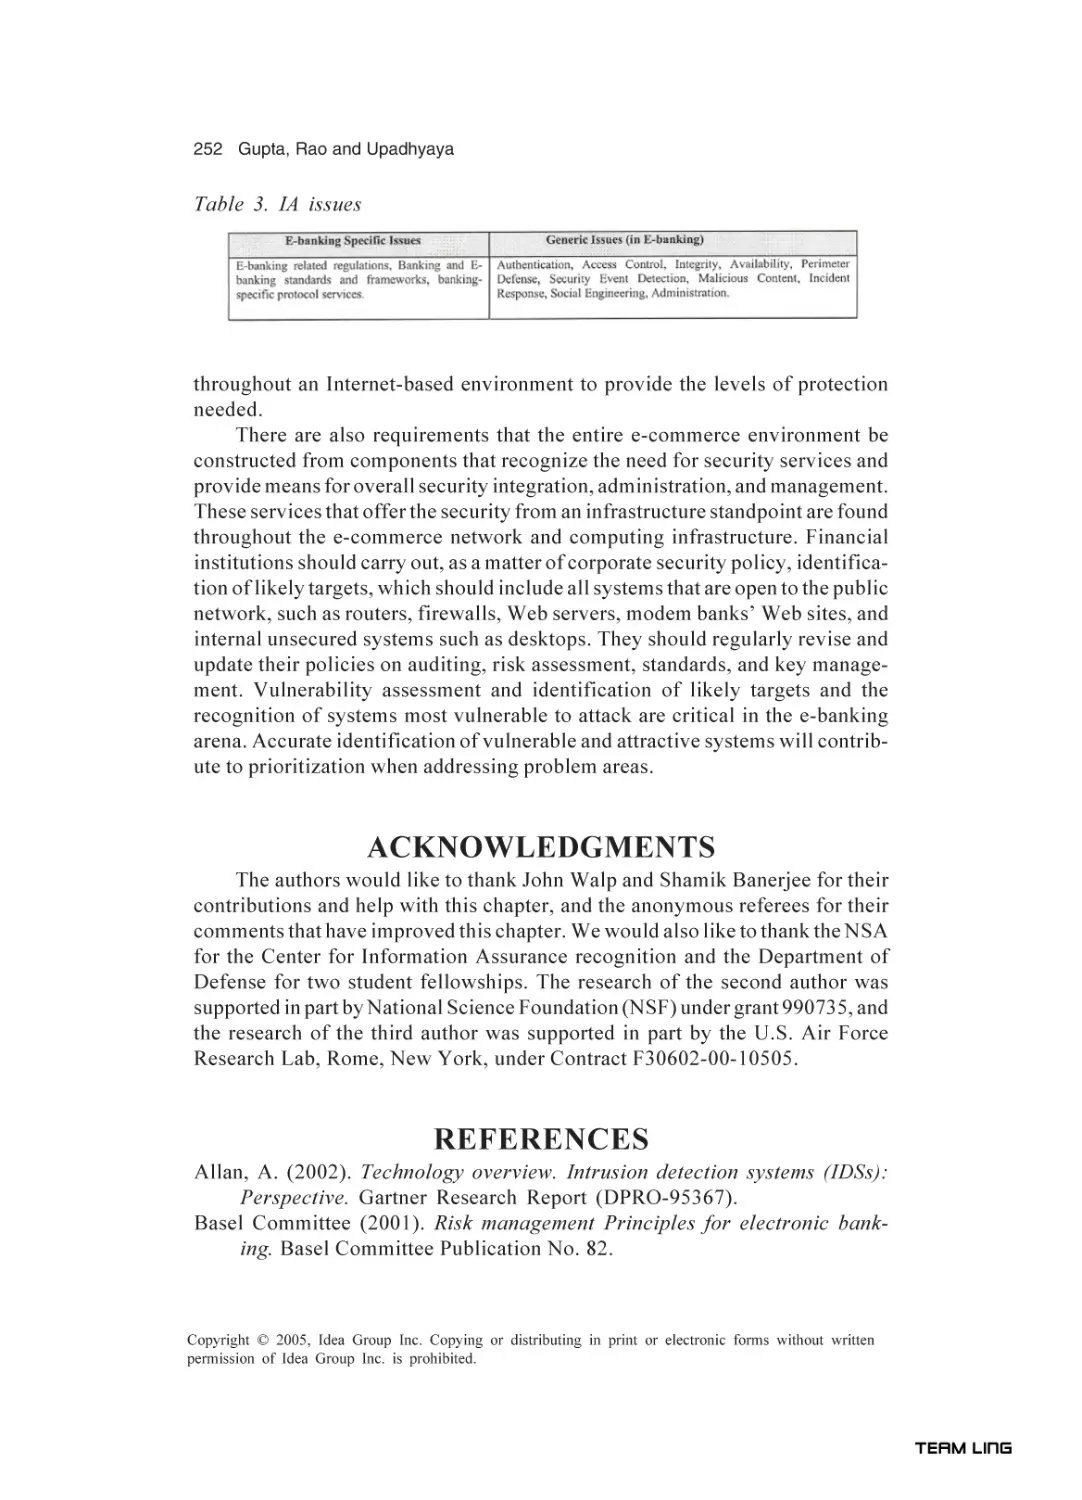
The last and final section in this compiled volume deals mainly with ecommerce processes and practices. It includes four chapters: Chapters XII,
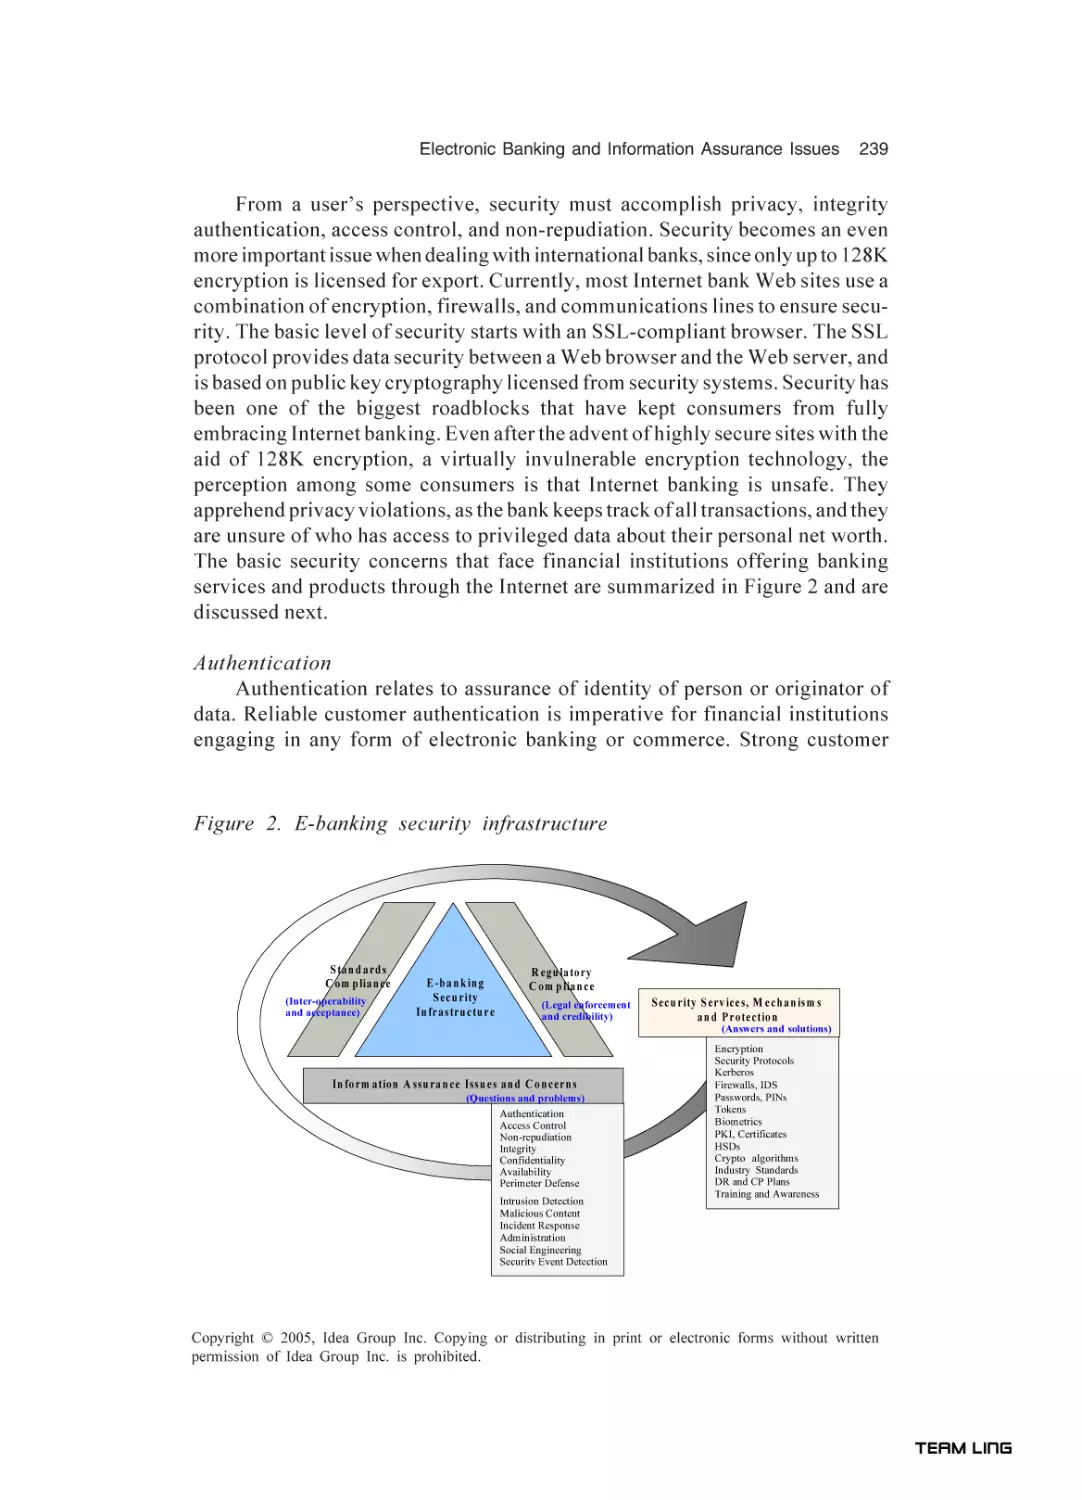
XIII, XIV, and XV. In Chapter XII, Gupta, Rao, and Upadhyaya assert that
information assurance is a key component in e-banking services. They investigate the information assurance issues and tenets of e-banking security that
would be needed for the design, development, and assessment of an adequate
electronic security infrastructure. They present the technology terminology and
frameworks with an understanding to equip the reader with a glimpse of the
state-of-art technologies that may help toward making better decisions regarding electronic security.
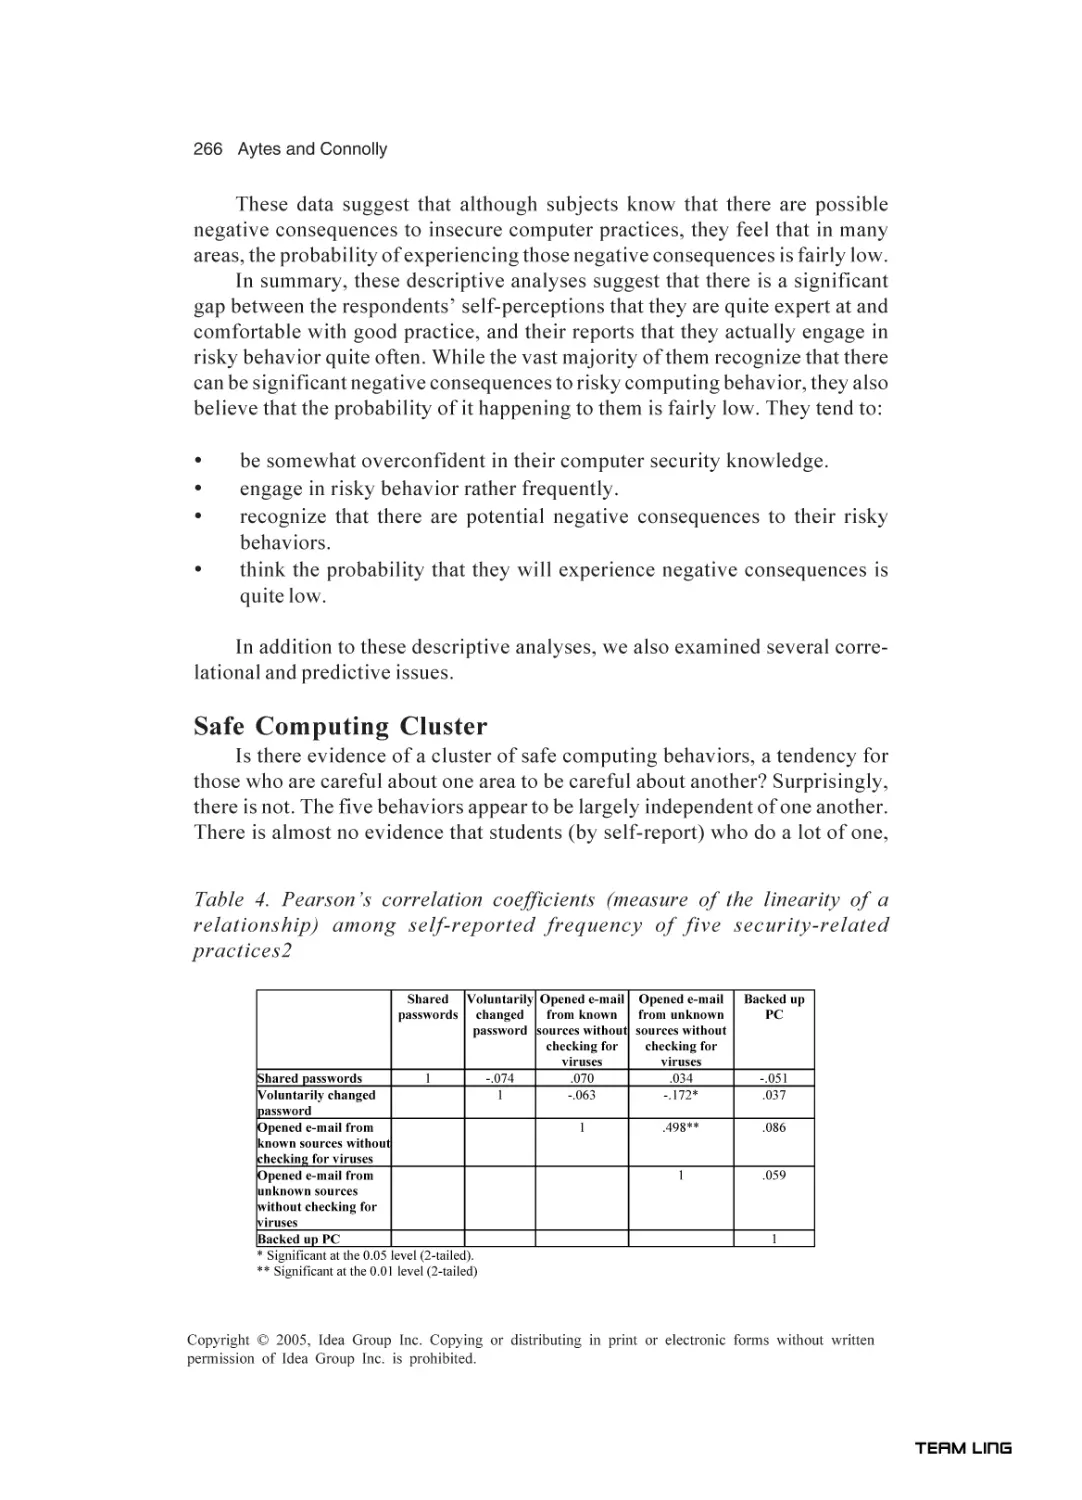
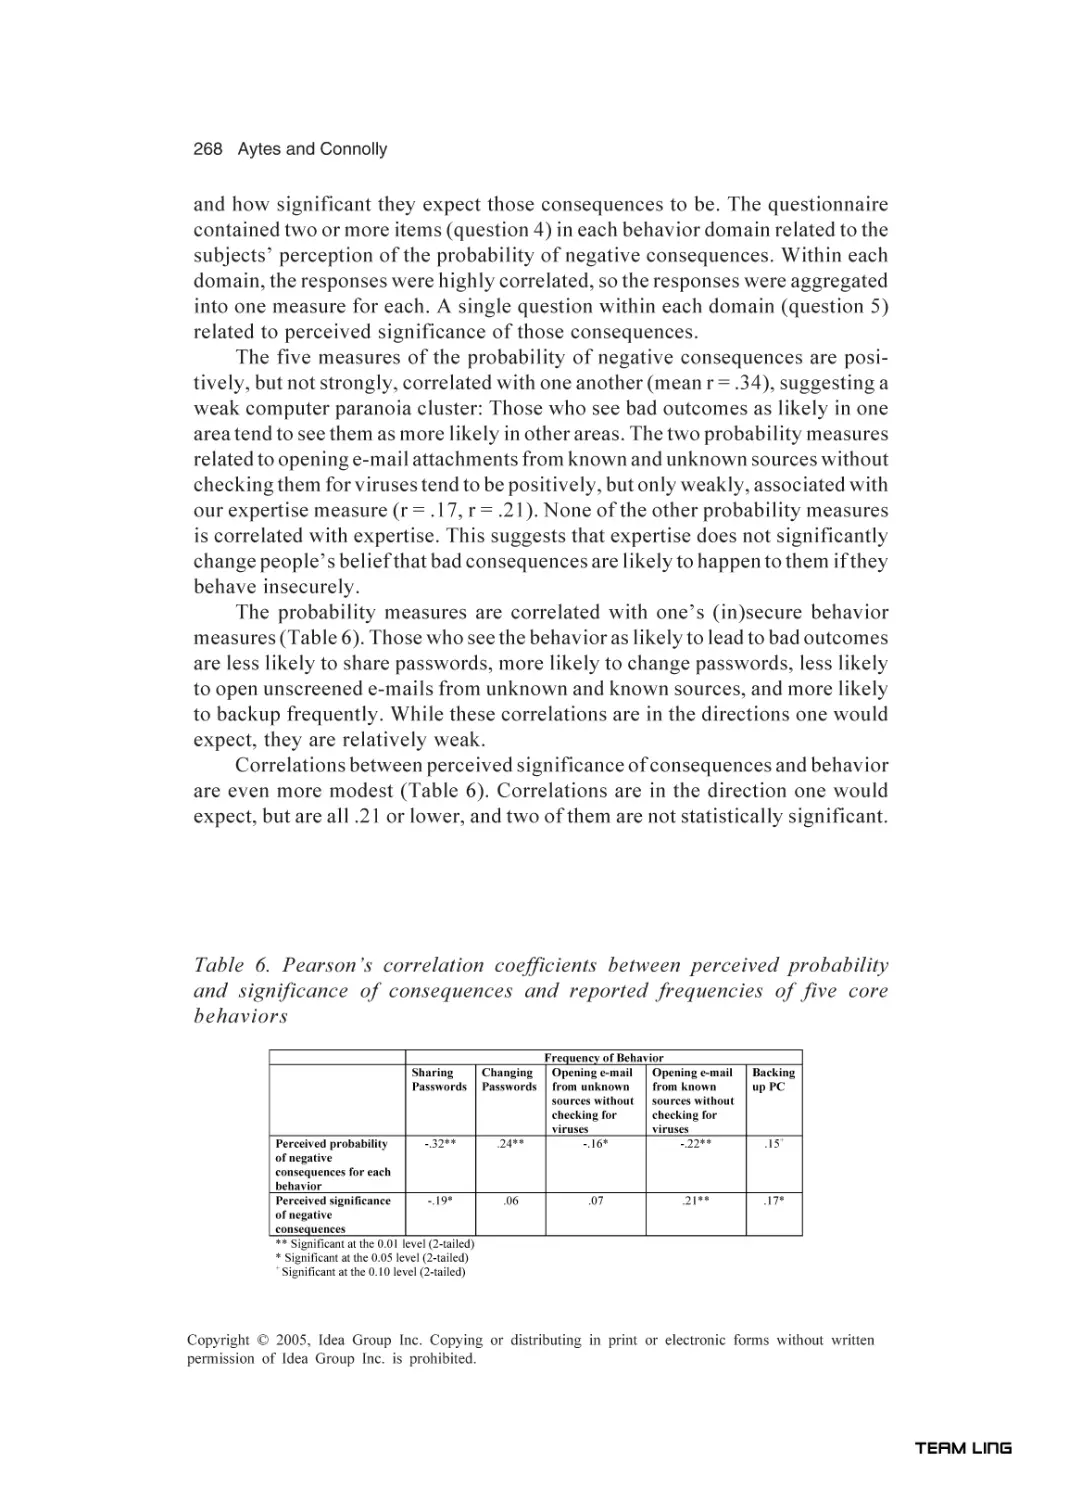
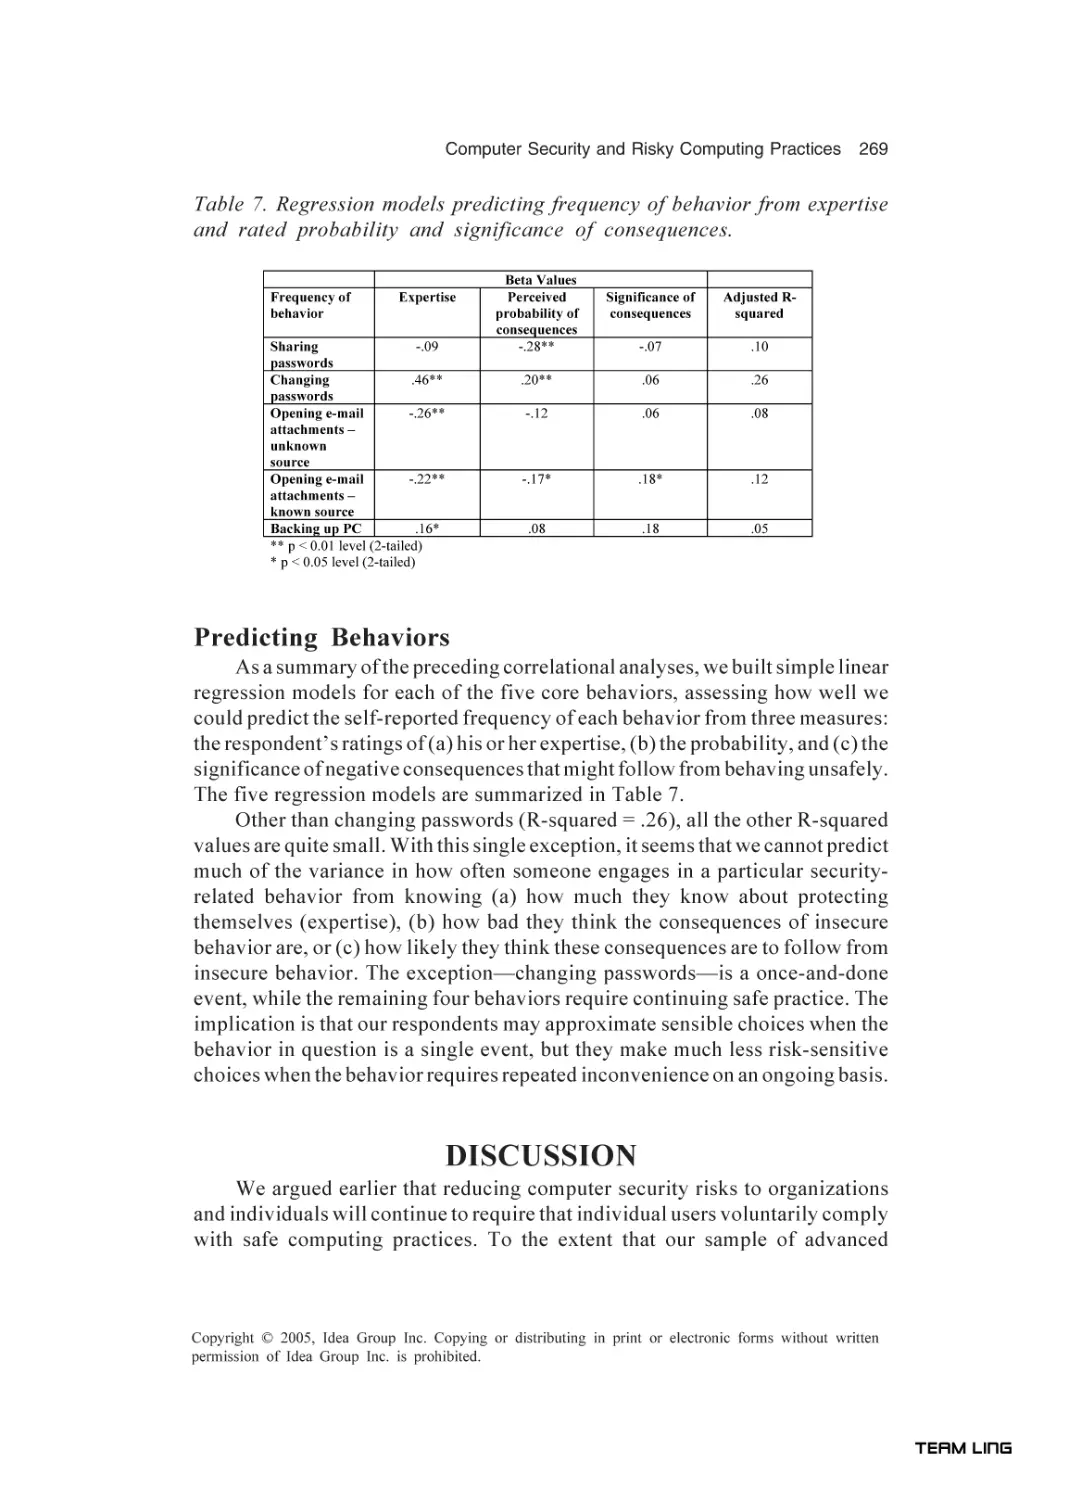
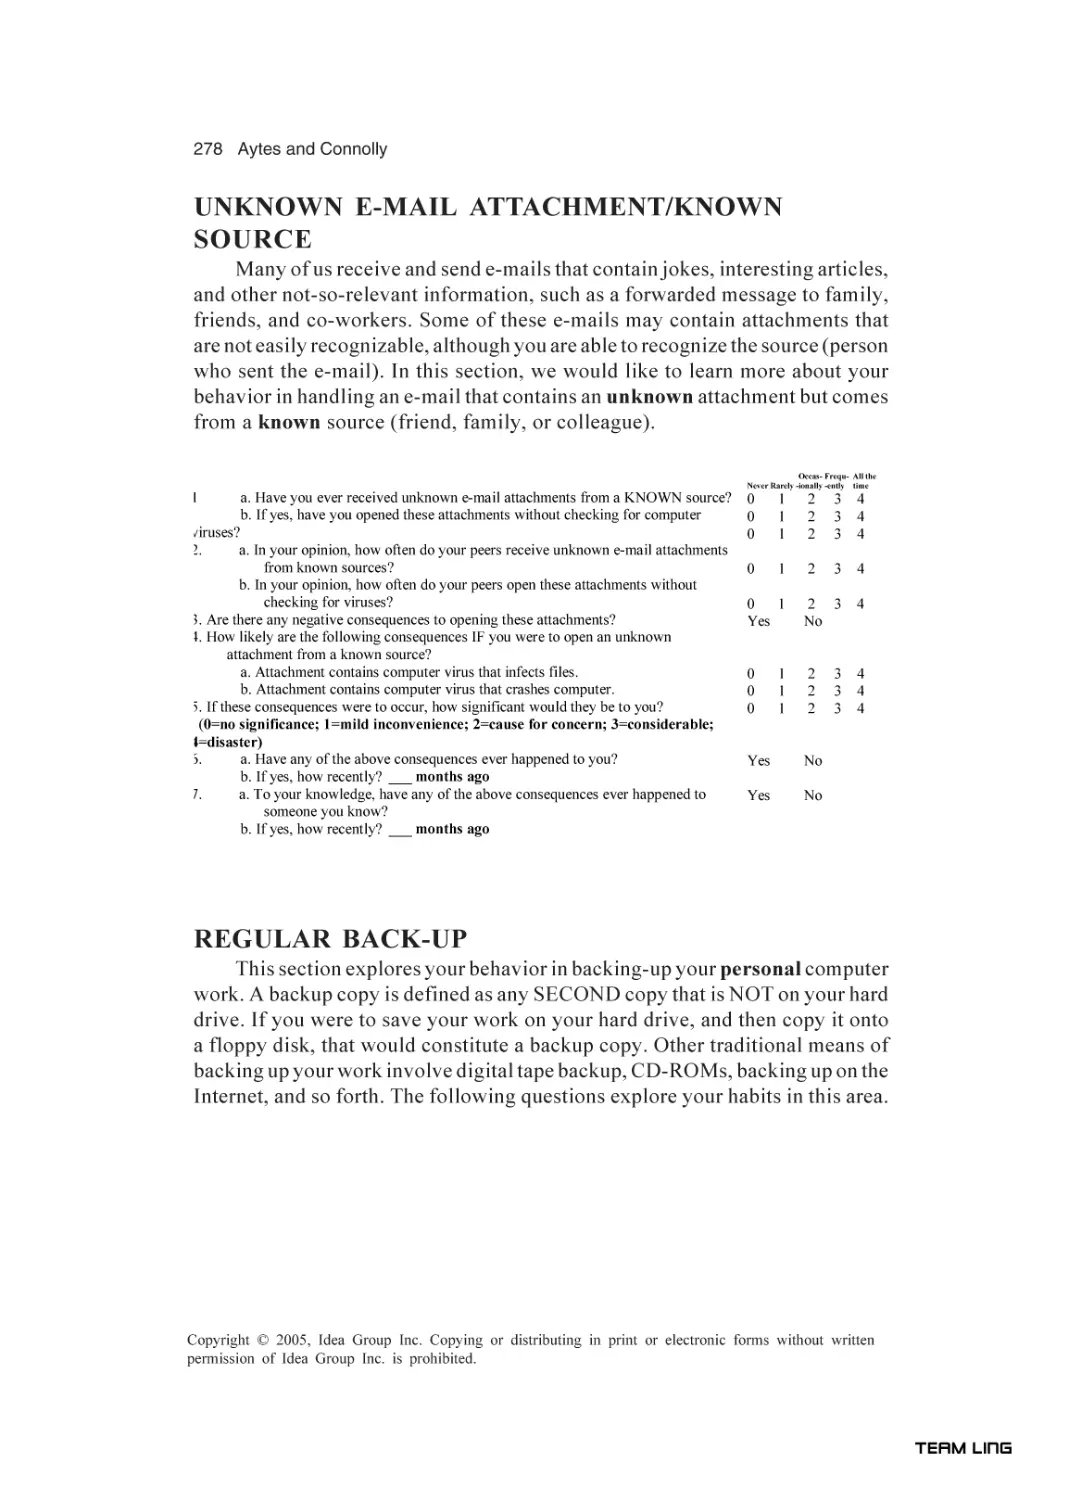
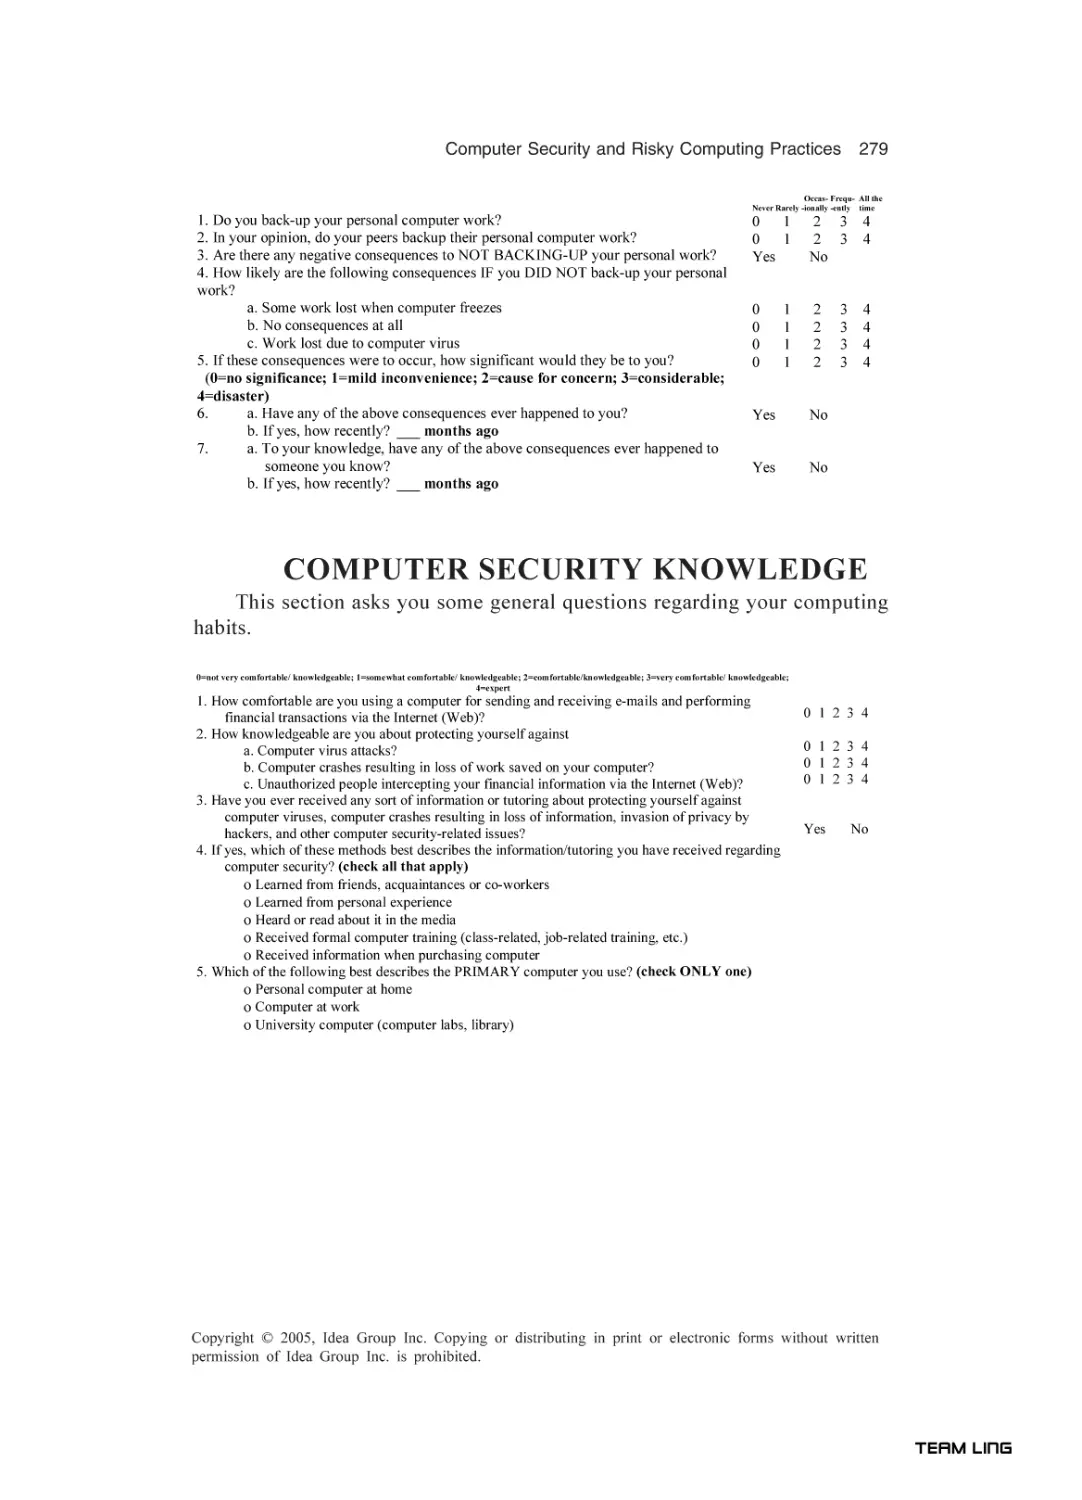
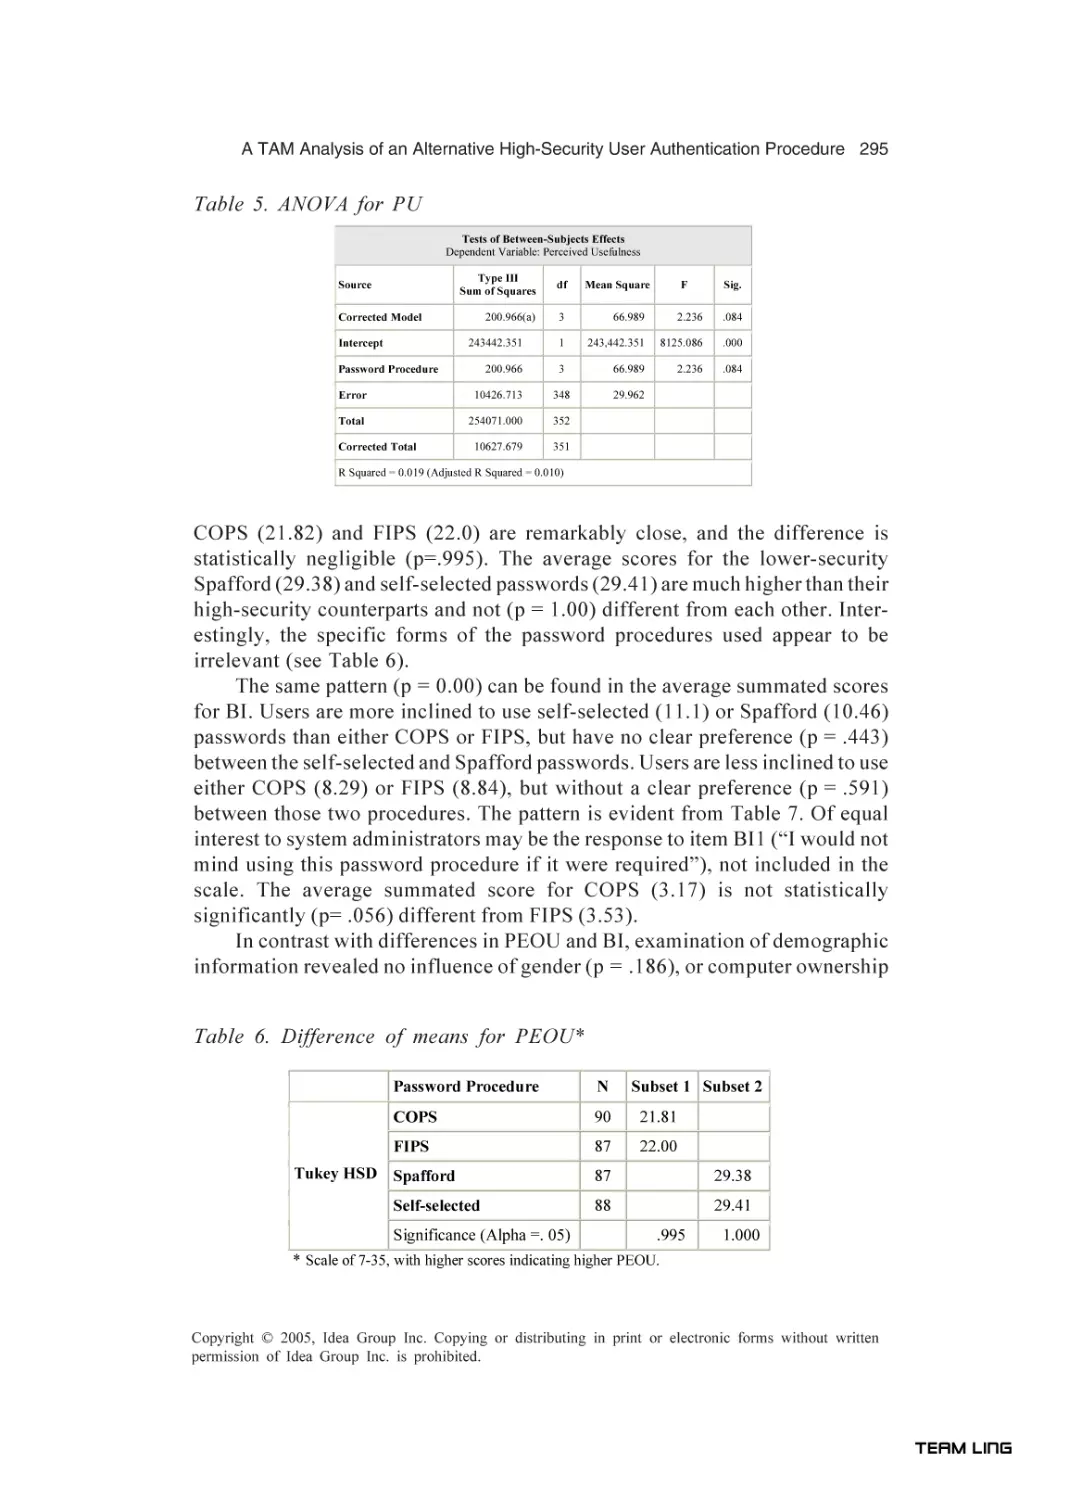
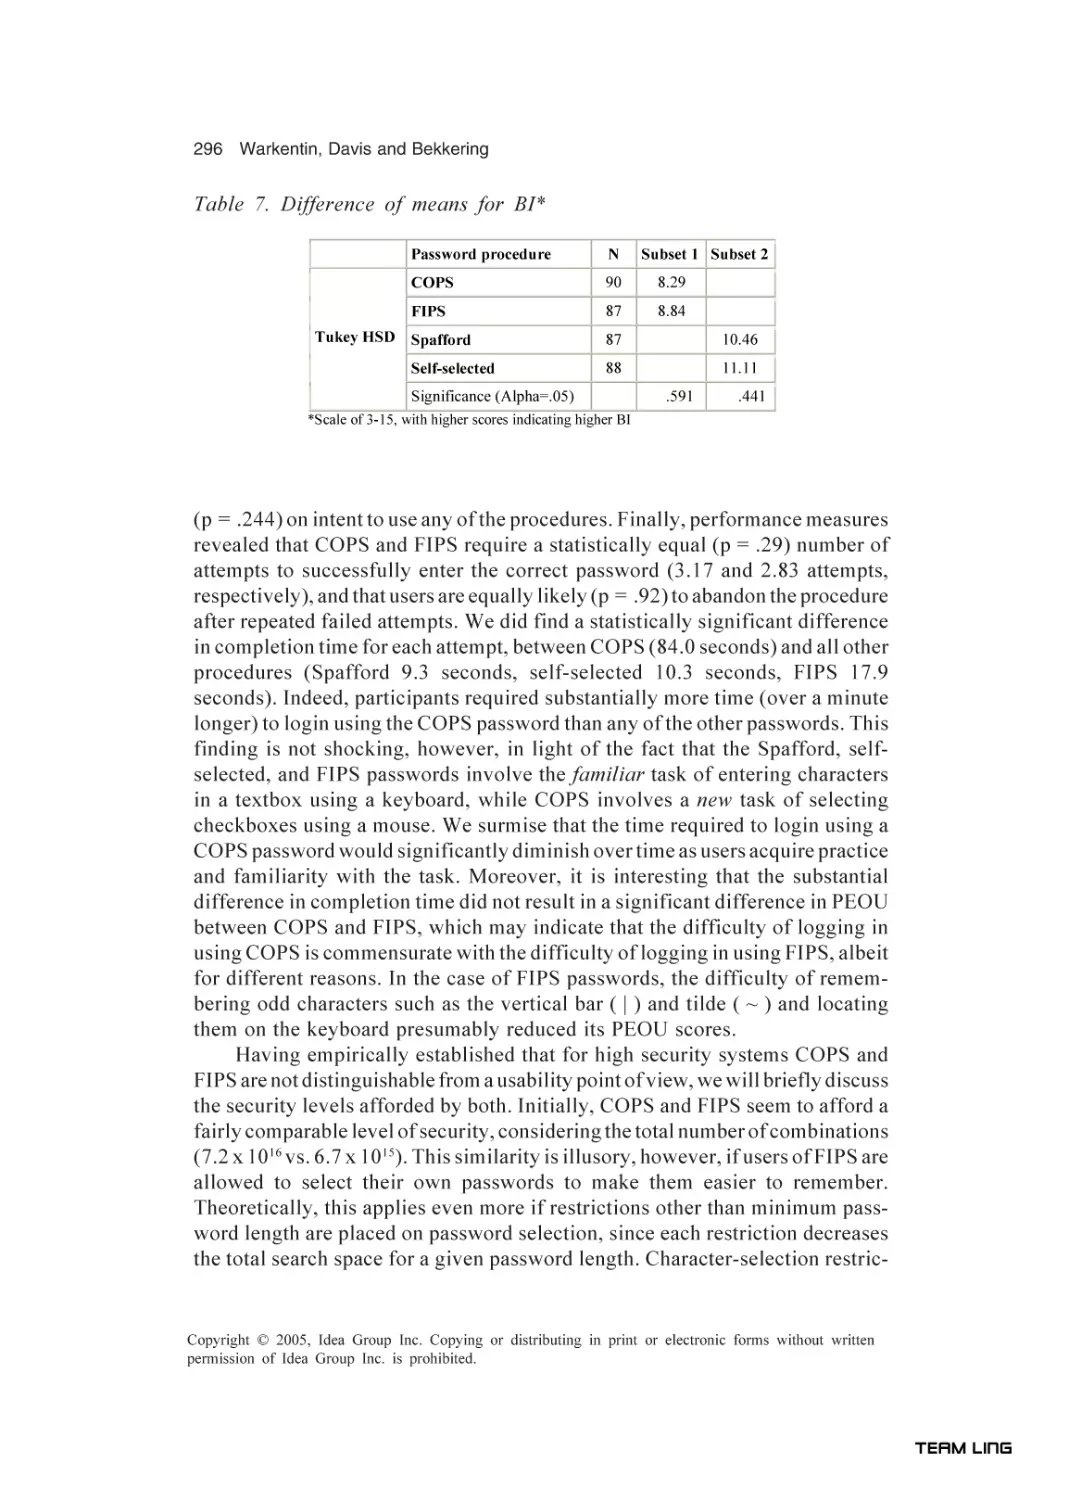
In Chapter XIII, Aytes and Connolly present the Check-Off Password
System (COPS) for entering passwords that combines a high level of security
with easy recall features for end users. They claim that COPS is more secure
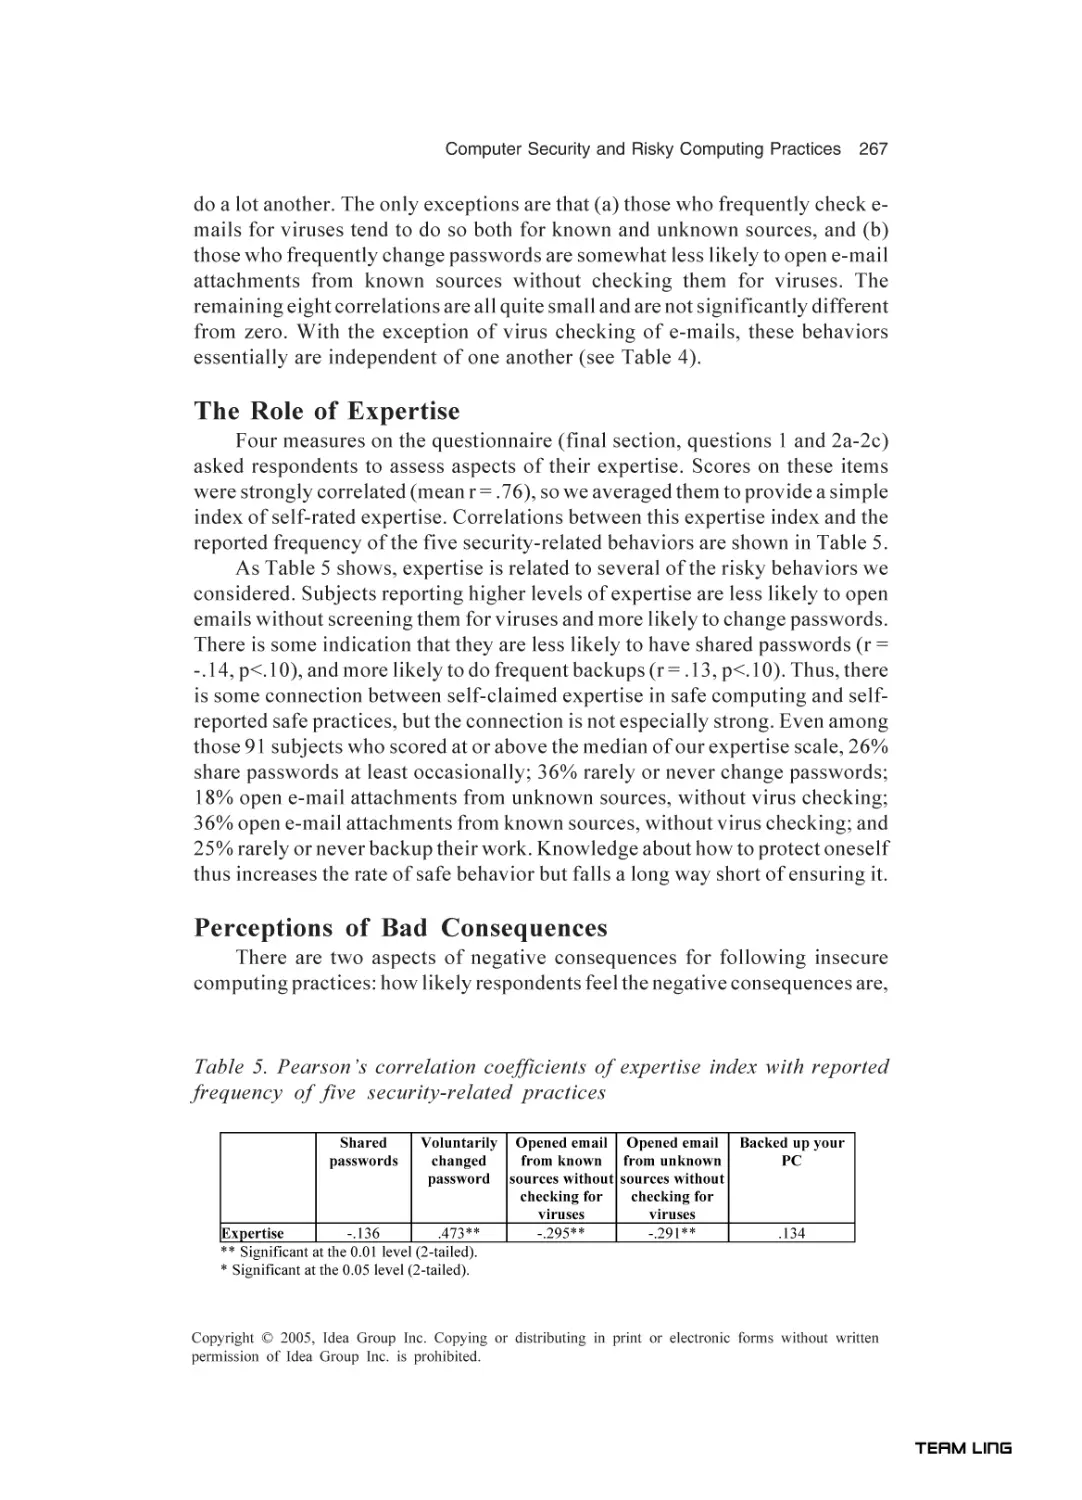
than self-selected passwords as well as high-protection assigned-password procedures (FIPS). The authors provide a preliminary assessment of the efficacy
TEAM LinG
x
of COPS by comparing COPS with three traditional password-assigning procedures. They showed that end users perceive all password-assigning procedures
tested to have equal usefulness, but the perceived ease of use of COPS equals
that of an established high-security password. They claim that the COPS interface does not negatively affect user performance compared with that of highsecurity passwords generating systems.
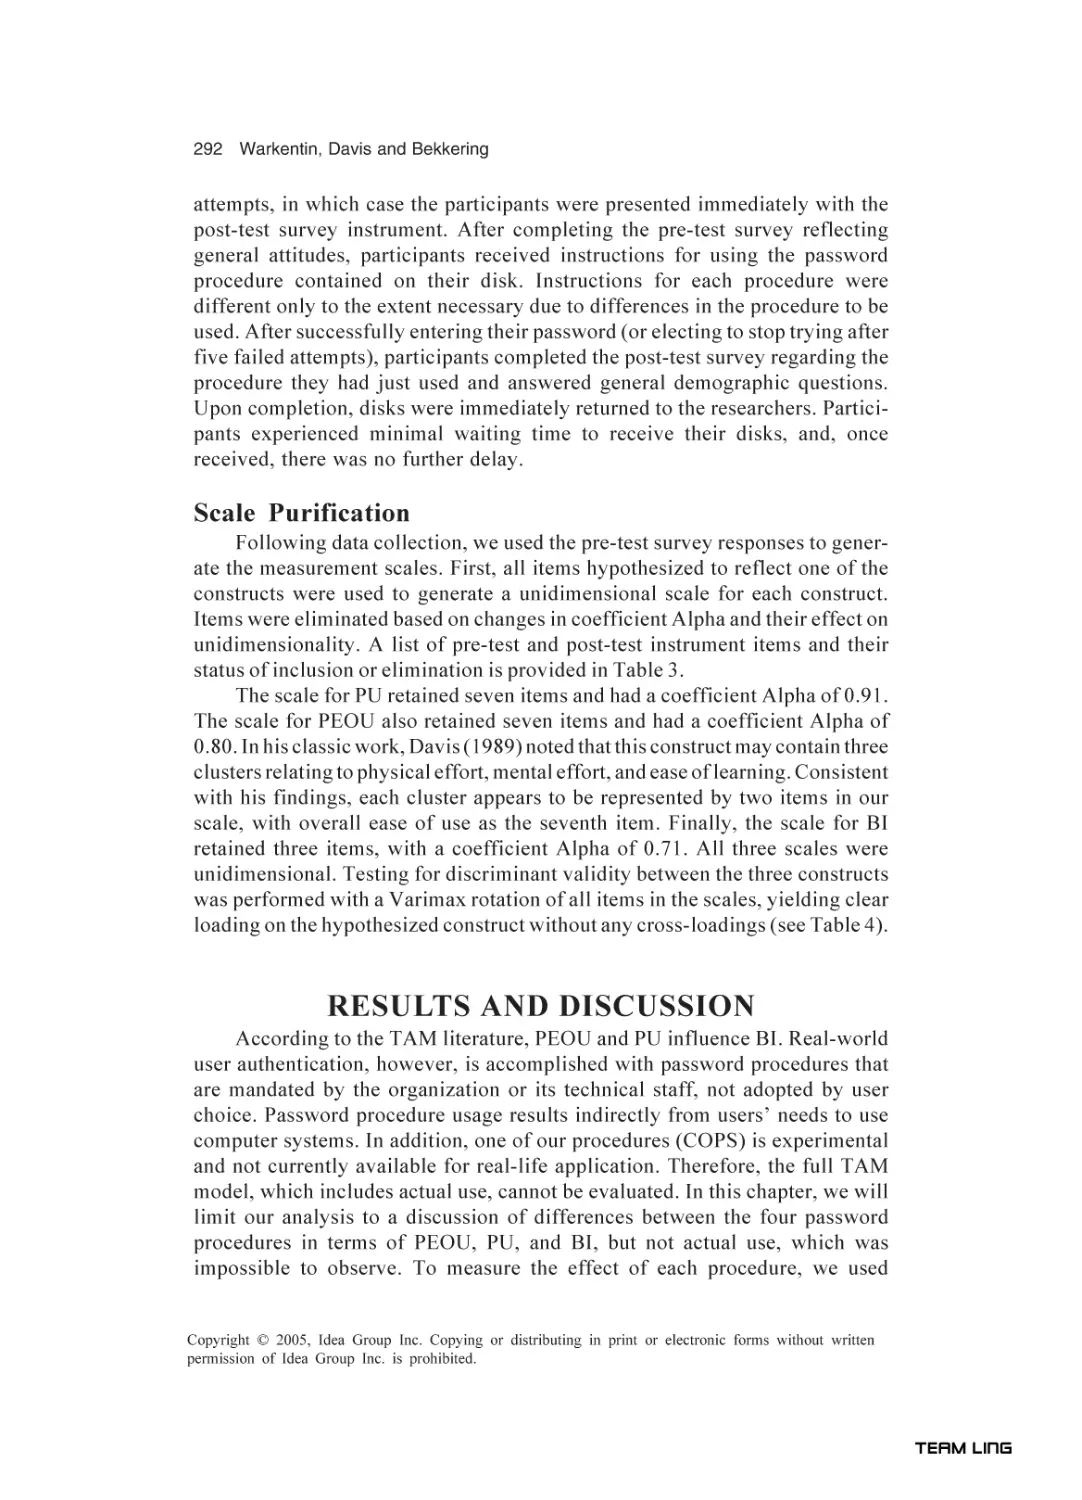
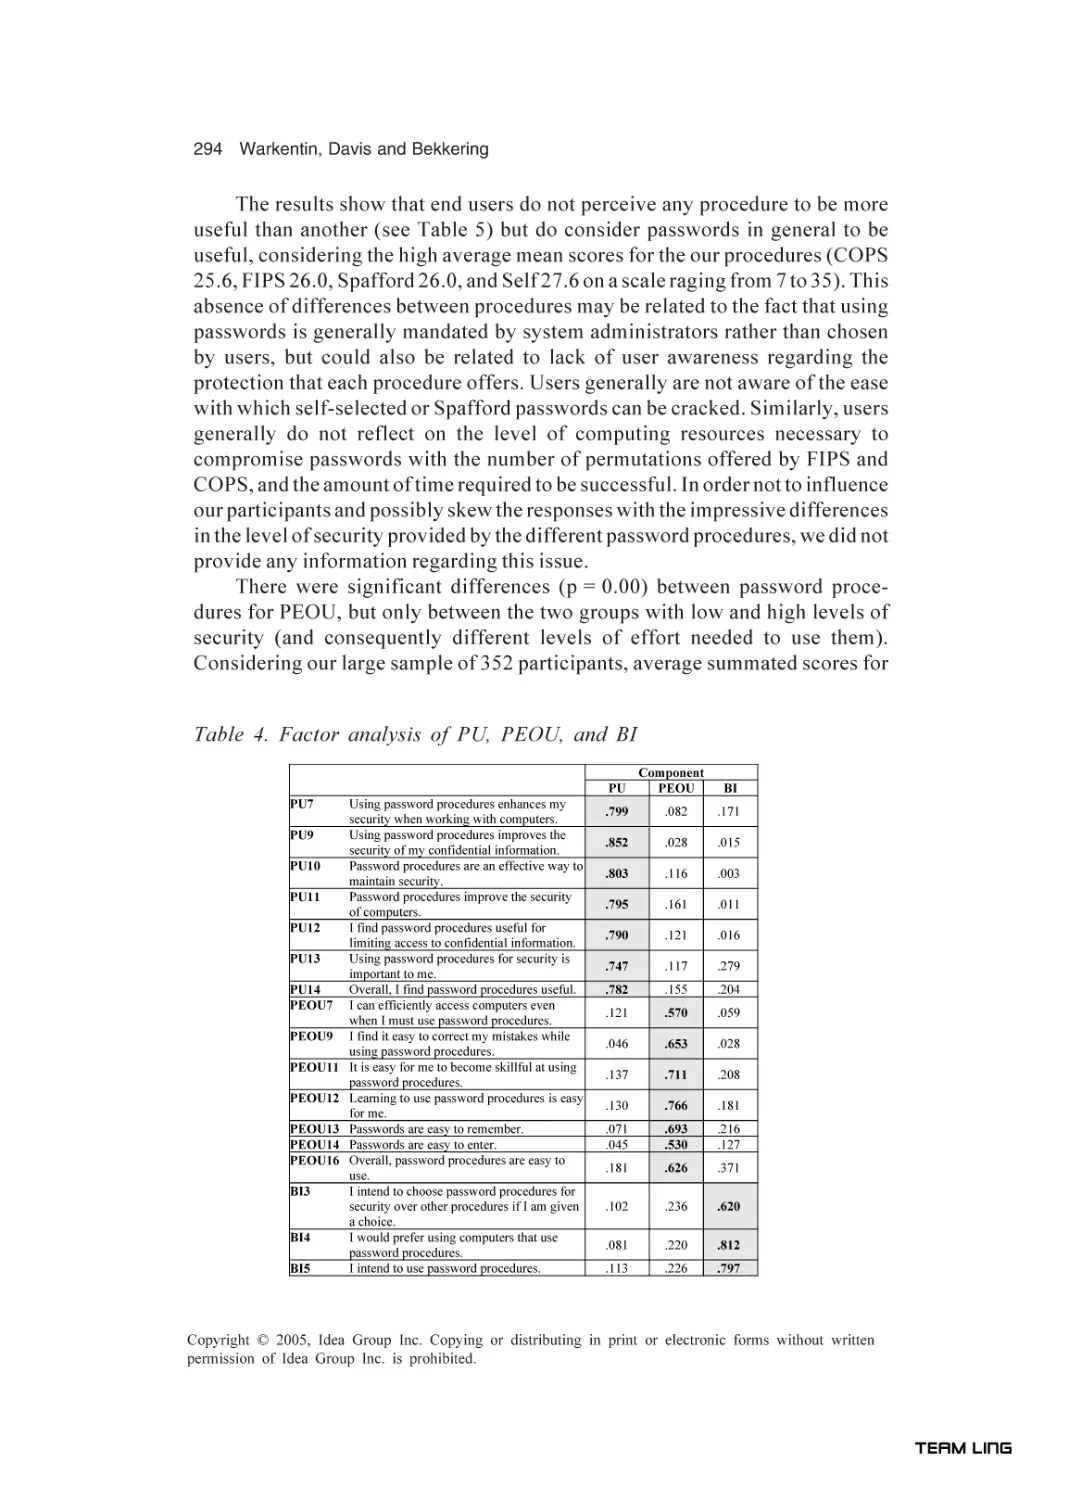
In Chapter XIV, Warkentin, Davis, and Bekkering state that the main objective of information system security management is information assurance.
The authors claim that user authentication is an important means toward achieving this objective, and password procedures have historically been the primary
method for user authentication. As expected, the authors found an inverse relationship between the level of security provided by a password procedure and
ease of recall for users. Also, as expected, the authors found the longer the
password and the more variability in its characters, the higher the level of security provided by such a password. They state that such a password, however,
tends to be more difficult for end users to remember, particularly when the
password does not spell a recognizable word. Conversely, when end users select their own passwords that are easier to memorize and recall, the passwords
may also be easier to crack.
In Chapter XV, the last chapter in this scholarly volume, Chatterjea states
that in-service upgrading has been provided for retraining teachers in Singapore
to help them keep abreast of changing curriculum requirements as well as a
way of infusing information technology in teaching and learning. She further
states that upgrading courses are offered to the teachers primarily asynchronously, using the Internet platform, with some integrated synchronous sessions.
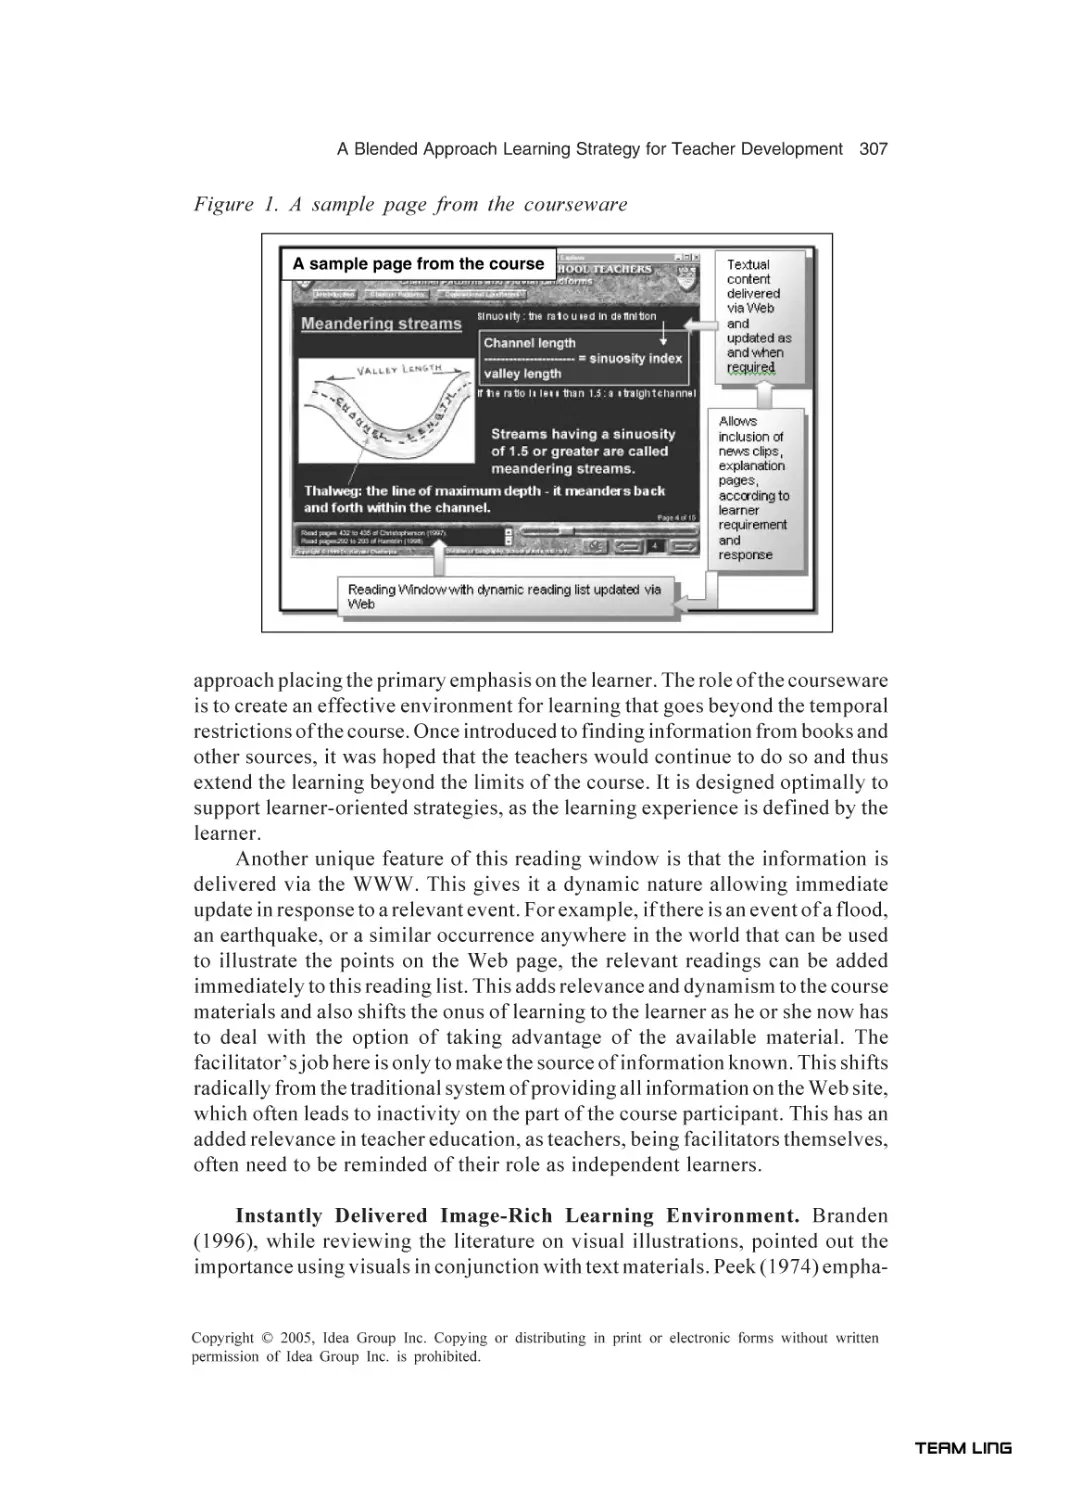
The author provides rationales for the development of such Web-based teacherupgrading systems and discusses the developmental issues related to such systems. She also addresses issues of adult learning in a learner-controlled adaptive learning environment that provides the much-needed freedom to the participants for managing their own time. The author concludes by discussing the
participants’ responses to such an upgrading system.
TEAM LinG
xi
Acknowledgments
I wish to recognize contributions made by the reviewers and associate
editors in bringing this scholarly book to fruition. I thank them for diligently and professionally reviewing the manuscripts included in this volume. My thanks go to the authors for being highly responsive to reviewers’ and associate editors’ comments and promptly meeting the
deadline imposed on them. They have made outstanding contributions
to this volume.
I express my special thanks to Hettie Houghton in the Department of
Information and Decision Sciences at the University of Texas at El
Paso. She was extremely diligent in keeping the project on track. Her
effort toward the project is truly appreciated. I also want to thank Jan
Travers for her help with the project.
M. Adam Mahmood
University of Texas at El Paso, USA
TEAM LinG
Section I:
Organizational
and
End User Computing
Issues,
Performance,
Productivity
TEAM LinG
End User Computing Research Issues and Trends (1990-2000)
1
Chapter I
End User Computing
Research Issues and Trends
(1990-2000)
James P. Downey, University of Central Arkansas, USA
Summer E. Bartczak, Air Force Institute of Technology, USA
ABSTRACT
During the 1980s and into the early 1990s, end user computing (EUC) was
reported to be among the key concerns facing managers and organizations.
Is EUC still an important topic? This study examines academic research
during this period. A research-focused framework is offered to provide a
conceptual structure for examining the trends and issues in EUC. This
framework is parsimonious and also allows a comprehensive classification
of end user computing’s three major dimensions: end user, technology, and
organization. The study examines every article from five leading information
systems (IS) journals (ISR, MISQ, JMIS, I&M, and JEUC) for the 11 years
1990-2000. The results indicate that there has been no diminishing of EUC
interest and studies during this time, either overall or in any journal or
dimension. A discussion of emerging trends, important themes, and journal
differences concludes this examination.
INTRODUCTION
EUC has been evolving since the appearance of mainframe end users in the
late 1960s; it was mainstreamed with the introduction of the personal computer
more than 20 years ago. As organizations and individuals discovered the
Copyright © 2005, Idea Group Inc. Copying or distributing in print or electronic forms without written
permission of Idea Group Inc. is prohibited.
TEAM LinG
2 Downey and Bartczak
advantages and capabilities of personal computing technology, new competencies and efficiencies were developed that transformed the workplace. The
academic study of EUC grew out of an attempt to provide direction and control
to managers, executives, and knowledge workers who persisted in using this new
technology.
The importance of EUC was evident early on as academics and practitioners consistently rated it as one of the key areas of concern. In a list of the most
important managerial issues, Dickson, Leitheiser, Wetherbe, and Nechis (1984)
reported EUC as the second-most important. Brancheau and Wetherbe (1987)
placed it at number six. More recently, EUC has been ranked high in a number
of different settings and nations. Managers of small businesses ranked training
and education of end users as no. 2 and end user support as no. 4 (Riemenschneider
& Mykytyn, 2000). U.S. multinational corporations ranked EUC as no. 4 of 32
top issues (Deans, Karwan, Goslar, Ricks, & Toyne, 1990-91), while U.S. public
sector organizations ranked it no. 4, with office automation no. 5 (Caudle, Gorr,
& Newcomer, 1991). Taiwanese managers ranked communications with end
users no. 2 (Yang, 1996), while a similar study in China listed the same issue no.
1 (Wang, 1994).
The importance of EUC, however, is not reflected in other studies. In the
last few years, for example, the relative importance of EUC in the workplace has
reportedly been diminishing, particularly in the U.S. Niederman, Brancheau, and
Wetherbe (1991) reported that facilitating and managing EUC was the no. 18
most important managerial issue. Four years later Brancheau, Janz, and Wetherbe
(1996) placed it as no. 16, as did Lee, Trauth, and Farwell (1995) in their study
of critical IS activities. Clearly, there are some inconsistencies present regarding
EUC’s importance.
Part of the reason for these conflicting studies is the lack of concurrence
as to what comprises EUC today. It is important to note that there is a distinction
between managerial EUC and EUC as used in academic literature. To the
manager in the organizational setting, end user computing comprises the functions of planning, managing, and supporting the computer needs of end users. As
organizations gain computing experience and expertise, EUC becomes less
important as a management issue, as is evident in some of the larger or more
technologically advanced organizations (Essex, Magal, & Masteller, 1998;
Guimaraes & Igbaria, 1994).
To the IS academic community, however, EUC covers a wide range of
themes and research, from investigations into the nature of individual attitudes
and behaviors toward IT to organizational strategies for project development. In
fact, there is disagreement as to what should be included in such research. In
more than 20 years of research in EUC, there is no consensus as to what EUC
success means or how organizations should assess their EUC needs (Harris,
2000). Despite this lack of agreement as to what constitutes EUC, a comprehensive examination of relevant EUC research reveals some consistent patterns and
Copyright © 2005, Idea Group Inc. Copying or distributing in print or electronic forms without written
permission of Idea Group Inc. is prohibited.
TEAM LinG
End User Computing Research Issues and Trends (1990-2000)
3
themes. This study specifically examines all EUC articles from five leading IS
journals for the years 1990-2000. The research indicates that EUC is still a wellresearched and relevant topic for practitioners and academics alike.
The objectives of this book are (1) to examine the nature and characteristics
of EUC and end users; (2) to present a comprehensive framework for the study
of EUC based on the dimensions of end user, technology, and organization; (3)
to assess how this framework characterizes the various themes of EUC as
present in the literature between 1990 and 2000; and (4) to explore the position
of EUC within the IS academic community by detecting and establishing EUC
research trends and issues.
END USER COMPUTING AND END USERS
EUC as a subset of IS has been examined since before 1980. In an early
study, Benson (1983) noted the shift from mainframe computing to microcomputers and reported on relevant management issues concerning this change. As
computing became available and useful to users and managers outside the data
processing centers, it evolved along three paths: growth in number of users,
growth in the hardware and software technologies, and growth in computer skills
of users (Harris, 2000).
Disagreement persists over what EUC actually is and even the identity of
end users (Rainer & Harrison, 1993). There exist two widespread views or
definitions of EUC, one broad and one that focuses on applications development.
The more restricted definition states that EUC is the adoption and use of
information systems by users outside the IS department to develop software
applications to support organizational tasks and decision making (Aggarwal,
1994; Brancheau & Brown, 1993; Shah & Lawrence, 1996; Shayo, Guthrie, &
Igbaria, 1999).
Others define EUC more generally. Ein-Dor and Segev (1992) characterize
it as any hands-on use of PCs. Essex, Magal, and Masteller (1998) describe it
as the direct use of information technology by end users. Barker (1995) defines
EUC as the application of computing resources for the purpose of producing
information. Rainer and Harrison (1993) define EUC as the direct, individual use
of computers encompassing all the computer-related activities required or
necessary to accomplish one’s job. These definitions clearly recognize a more
ubiquitous end user. Recent evidence suggests a rapidly closing gap between the
typical end user and the data processing professional of 10 years ago (Aggarwal,
1996; McLean & Kappelman, 1992-93).
As depicted in IS literature, end users are individuals who develop and/or
use IS. In one of the earliest and most influential taxonomies of end users,
Rockart and Flannery (1983) categorize users according to their skills and use
of IS. Subsequently, users have been described as managers, professionals, and
Copyright © 2005, Idea Group Inc. Copying or distributing in print or electronic forms without written
permission of Idea Group Inc. is prohibited.
TEAM LinG
4 Downey and Bartczak
supervisors (Aggarwal, 1994), software developers (Brancheau & Brown,
1993), and those who develop, interact, and otherwise utilize application systems
(Glorfeld & Cronan, 1993).
For the purpose of this study, EUC is defined as the use and/or development
of computing technology and software applications by end users to solve
organizational problems and assist in decision making. End users are non-IS
department individuals who directly use and/or develop computing technology
and application systems in an organizational setting. Thus, end users are direct
(not indirect) IS users, using a variety of technologies that include group support
systems, decision support systems, executive information systems, and a host of
common software application systems such as word processing, spreadsheets,
and databases.
EUC RESEARCH-FOCUSED FRAMEWORK
A framework should partition and organize a topic into manageable parts to
enable the user to easily traverse the subject (Kochen, 1985-86). In order to
examine applicable EUC studies, a research-focused framework was developed
to provide a conceptual structure for EUC literature that is parsimonious yet
allows a comprehensive classification of its themes. This framework was
adopted after careful examination of those available in the literature. Three in
particular were used as a basis: the IS success framework of DeLone and
McLean (1992), the EUC management research framework of Brancheau and
Brown (1993), and the general framework of Harris (2000), which divided IS
success into three factors—behavioral, technological, and organizational.
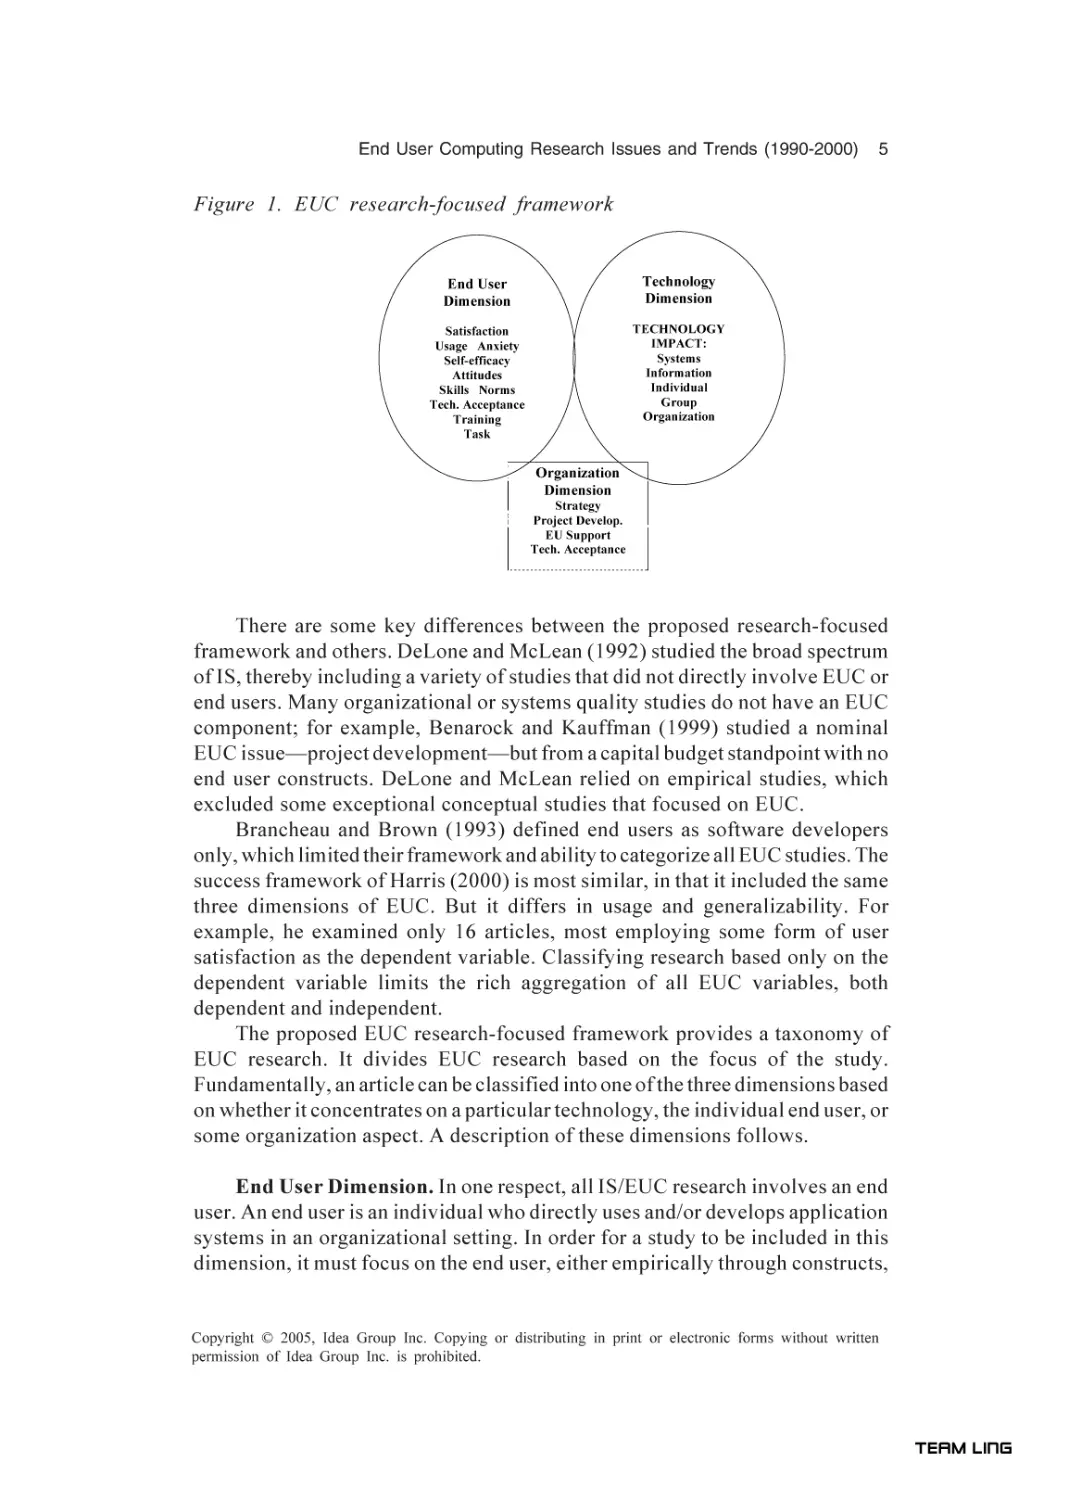
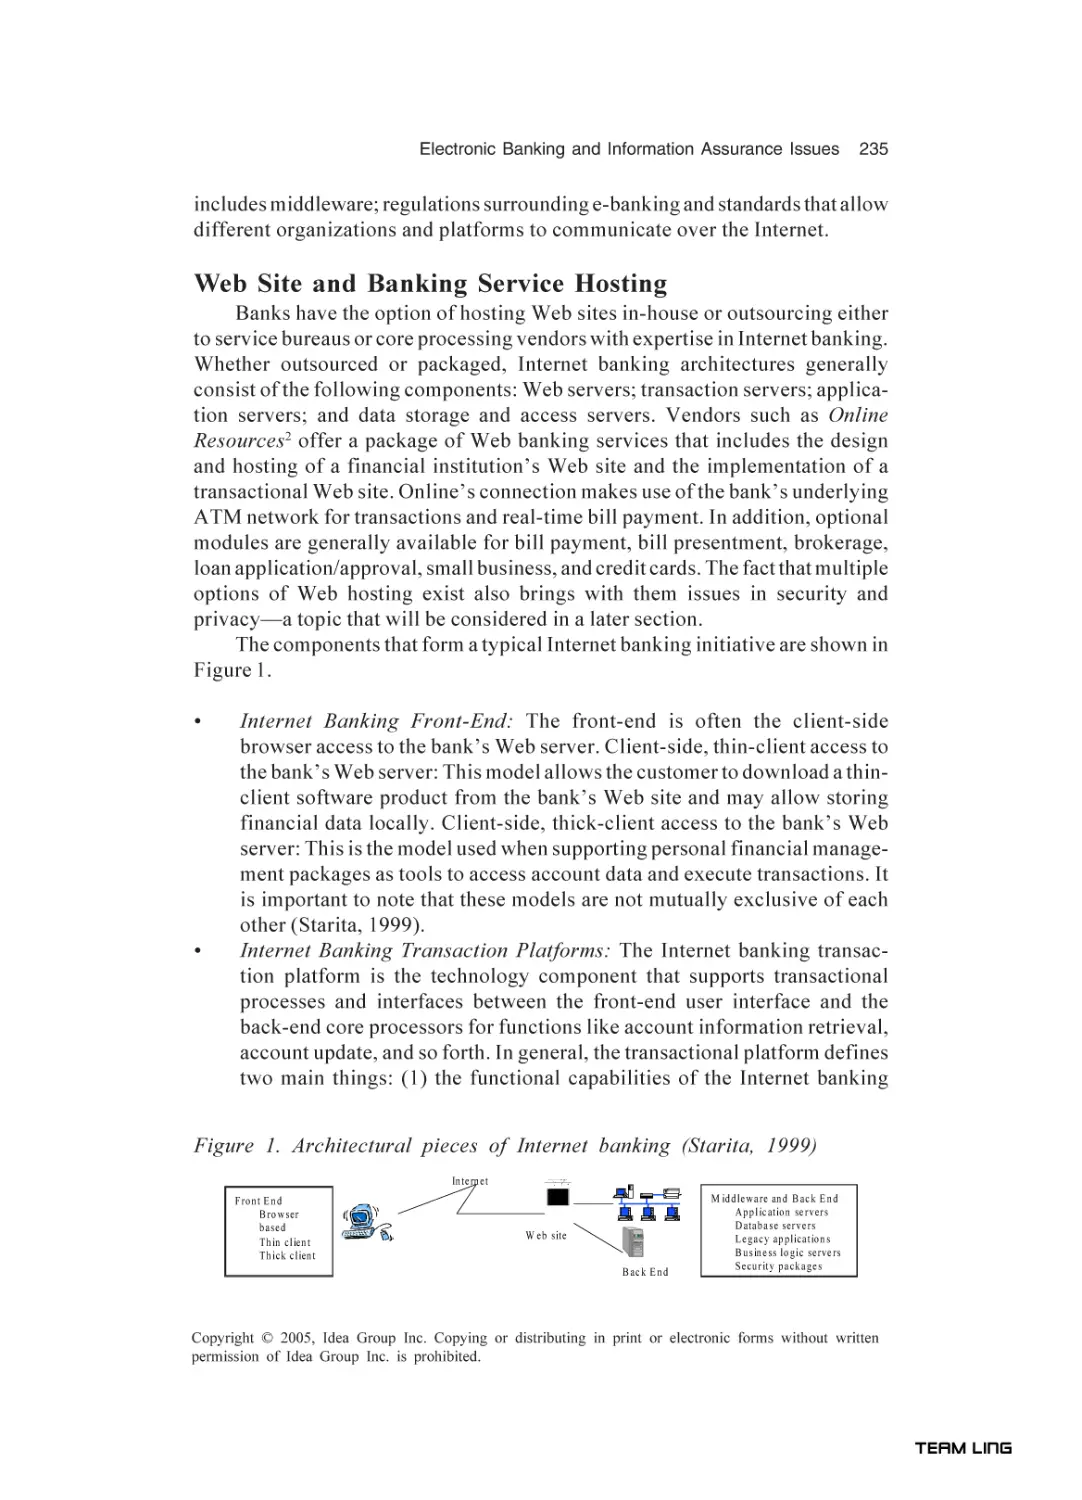
As shown in Figure 1, EUC research can be divided logically into three
dimensions, depending on the focus of the study.
These three dimensions are the end user, the technology, and the organization. Although derived from the three frameworks mentioned, these three
dimensions have, in fact, been used in the past in IS/MIS literature. For example,
in one of the early frameworks for MIS, Mason and Mitroff (1973) recognized
that the information system (application) consisted of a person attempting to
solve a problem within an organizational context. Nolan and Wetherbe (1980)
introduced a process model through which personnel transform inputs using MIS
technology within an organizational context. Galliers and Land (1987) submitted
a taxonomy of IS approaches that divides research into society, organization (or
groups within the organization), individual, technology, and methodology. In a
survey of academic and business practitioners, Aggarwal (1994) categorized
their responses concerning IT into three categories: technical, organizational,
and people. The division of IS/EUC research into the three areas of end user,
technology, and organization has been a useful technique to describe and
categorize IS and end user computing.
Copyright © 2005, Idea Group Inc. Copying or distributing in print or electronic forms without written
permission of Idea Group Inc. is prohibited.
TEAM LinG
End User Computing Research Issues and Trends (1990-2000)
5
Figure 1. EUC research-focused framework
End User
Dimension
Technology
Dimension
Satisfaction
Usage Anxiety
Self-efficacy
Attitudes
Skills Norms
Tech. Acceptance
Training
Task
TECHNOLOGY
IMPACT:
Systems
Information
Individual
Group
Organization
Organization
Dimension
Strategy
Project Develop.
EU Support
Tech. Acceptance
There are some key differences between the proposed research-focused
framework and others. DeLone and McLean (1992) studied the broad spectrum
of IS, thereby including a variety of studies that did not directly involve EUC or
end users. Many organizational or systems quality studies do not have an EUC
component; for example, Benarock and Kauffman (1999) studied a nominal
EUC issue—project development—but from a capital budget standpoint with no
end user constructs. DeLone and McLean relied on empirical studies, which
excluded some exceptional conceptual studies that focused on EUC.
Brancheau and Brown (1993) defined end users as software developers
only, which limited their framework and ability to categorize all EUC studies. The
success framework of Harris (2000) is most similar, in that it included the same
three dimensions of EUC. But it differs in usage and generalizability. For
example, he examined only 16 articles, most employing some form of user
satisfaction as the dependent variable. Classifying research based only on the
dependent variable limits the rich aggregation of all EUC variables, both
dependent and independent.
The proposed EUC research-focused framework provides a taxonomy of
EUC research. It divides EUC research based on the focus of the study.
Fundamentally, an article can be classified into one of the three dimensions based
on whether it concentrates on a particular technology, the individual end user, or
some organization aspect. A description of these dimensions follows.
End User Dimension. In one respect, all IS/EUC research involves an end
user. An end user is an individual who directly uses and/or develops application
systems in an organizational setting. In order for a study to be included in this
dimension, it must focus on the end user, either empirically through constructs,
Copyright © 2005, Idea Group Inc. Copying or distributing in print or electronic forms without written
permission of Idea Group Inc. is prohibited.
TEAM LinG
6 Downey and Bartczak
through variables at the individual level, or through a conceptually relevant
theme. This includes identifying end users and their behaviors, attitudes, skills,
and applicable antecedents.
The end user themes identified in the literature include the two most
common dependent variables—satisfaction and usage (DeLone & McLean,
1992). Other themes in the end user dimension include attitudes (toward a
technology), skills, self-efficacy, anxiety, and technology acceptance and diffusion. They commonly measure cognitive or affective attributes of the end user.
Technology Dimension. This component is reserved for those studies that
focus on the technology itself. These articles typically include research on newer
technologies of interest, such as group support systems (GSS), decision support
systems (DSS), group decision support systems (GDSS), expert systems,
executive information systems, and databases. The focus of such research is
always on methods to assess and/or improve the effectiveness or efficiency of
the technology.
Merely focusing on such a technology is not enough for an article to be
labeled as an EUC study. In order to be included in this study, the reference to
the end user must be clearly established through a measured construct or
variable, or other data that is unmistakable (such as may be present in a case or
field study). An article that studies only the technology and not its relationship
with an end user cannot be included in EUC. This end user relationship with
technology is generally incorporated in these studies through an assessment of
the impact on the end user. This impact assessment, or end user component, is
what distinguishes the study as belonging to EUC literature.
Levels of Technology Dimension Impact
Information systems (technologies) make an impact at four different levels
(Brancheau & Brown, 1993; DeLone & McLean, 1992; Harris, 2000; Powell &
Moore, 2002; Seddon, 1997): system or information level, individual level, group
level, and organizational level. These are summarized below:
•
•
•
System or Information Level: Studies of the relationship between end user
and the impact on system or information quality (i.e., impact of distortion
effects by end users in Sussman and Sproull, 1999).
Individual Level: Impact of technology on individual performance (such as
decision-making time or accuracy).
Group Level: Because end users may be members of groups, the effectiveness and/or efficiencies of group performance impacts the end user.
DeLone and McLean (1992) fuse group impact into departmental performance, one of the descriptions of individual impact.
Copyright © 2005, Idea Group Inc. Copying or distributing in print or electronic forms without written
permission of Idea Group Inc. is prohibited.
TEAM LinG
End User Computing Research Issues and Trends (1990-2000)
•
7
Organizational Level: Although there are many studies that examine the
organizational and IS relationship, those in this category are constrained in
that the article’s focus must be on the technology while simultaneously
including an explicit end user and organizational measure. An example of
this type of article is a field study by Vandenbosch and Huff (1997) that
examined the factors affecting executive retrieval behavior using EIS
technology and the impact of that behavior on organizational performance.
It is useful to note the distinction between this subcategory and the
organizational component covered next. Here, the focus is on the technology, with organizational measures to support this effect.
Organizational Dimension. As DeLone and McLean (1992) point out,
there is inherent difficulty in assessing the “business value of information
systems” (p. 80). Even so, there are several research streams that examine EUC
in its organizational context. These studies do not necessarily measure IS
success, but other facets of the relationship, including management, support, and
planning. To be included in the organizational dimension of EUC, the article must
have an explicit end user association. Measuring this end user relationship is
frequently done through satisfaction and usage.
The following subcategories are identified from the literature:
•
•
•
Project and Applications Development: These articles focus on the
management of systems or project development. Measures include satisfaction with the development process and usage of the developed system,
as well as user participation in the process and the degree participation
affects the developmental outcome. Because development typically remains an organization guided and managed function, and to promote
parsimony, project and applications development studies (with explicit end
user variables) will be categorized in this subgroup.
End User Support: The information center (and other support mechanisms) and its effects have been the topic of much research in terms of
EUC (Bowman, Grupe, Lund, & Moore, 1993; Guimaraes & Igbaria, 1992).
These studies typically measure effectiveness at the individual level.
EUC Strategy and Management: There is a plethora of strategy and
management studies; in fact, in one respect almost all IS and EUC articles
are management-directed. What distinguishes an EUC study, however, is
its explicit end user measure(s).
In categorizing EUC studies along these three dimensions of end user,
technology, and organization, an attempt was made to place them in only one
dimension. So, for example, if the focus of the article was on applications
development, it was placed in organizational project development, even though
Copyright © 2005, Idea Group Inc. Copying or distributing in print or electronic forms without written
permission of Idea Group Inc. is prohibited.
TEAM LinG
8 Downey and Bartczak
it may have used satisfaction (with the process) as a dependent variable and
end user skills as an independent variable. Likewise, a study of effective GSS
systems, focusing on the technology, is placed in the technology dimension,
even though group satisfaction with the system may be one of the dependent
variables.
METHODOLOGY
In order to examine the frequency, types, and themes of EUC research, five
leading IS journals were scrutinized in their entirety for the years 1990-2000.
Every article in each journal during these 11 years was examined and either was
included as EUC-related or eliminated. For those articles labeled EUC, a
subsequent assessment was conducted to categorize each.
The journals selected included the following: Information Systems Research (ISR), MIS Quarterly (MISQ), Journal of Management Information
Systems (JMIS), Information and Management (I&M), and Journal of End
User Computing (JEUC)1. In selecting the journals, two criteria were used.
The first was its reputation as reported in five recent reviews (Gillenson & Stutz,
1991; Hardgrave & Walstrom, 1997; Holsapple, Johnson, Manakyan, & Tanner,
1994; Walstrom & Hardgrave, 2001; Walstrom, Hardgrave, & Wilson, 1995). In
each of these reviews, MISQ and ISR were in the top three in overall ratings
(excepting ISR in the 1991 and 1994 studies, when it was a relatively new
publication). In the five ratings, JMIS was rated between 3 and 7, while I&M was
rated between 8 and 20. JEUC, rated 44 in 1997 and 34 in 2001, was included
not only because of its reputation, but also because it is one of the only pure-EUC
journals.
The second criteria was based on IS emphasis; (i.e., whether a journal
published primarily IS research or not). Because EUC research is a subset of IS
research, it was considered important that the journals be recognized for top
quality IS research. As ranked in Walstrom and Hardgrave (2001), the top four
“pure” IS journals were ISR, JMIS, MISQ (all tied at number one) and I&M,
rated no. 4. JEUC was rated no. 8 in this list. Some leading journals, such as
Management Science and Communications of the ACM, were listed as
“hybrid” or “partial” IS journals (p. 122) and were, therefore, not considered in
this report.
Examining each article in each journal for the given years was a meticulous
process. The first step involved reading the abstract and checking the included
variables (for empirical articles). If, at this point, the article did not involve EUC,
it was eliminated from consideration. If the article was not eliminated, it was
further examined and then categorized in a number of ways. Categorization
involved examining each variable, dependent and independent, as well as themes
for non-empirical articles.
Copyright © 2005, Idea Group Inc. Copying or distributing in print or electronic forms without written
permission of Idea Group Inc. is prohibited.
TEAM LinG
End User Computing Research Issues and Trends (1990-2000)
9
Any classification of previous literature involves a certain amount of
arbitrariness (DeLone & McLean, 1992). Steps were taken to reduce this by
following some consistent procedures. If an article clearly pertained to just one
dimension, it was categorized as such. This was determined by noting the focus
of the article, which was usually ascertained by the dependent variable(s). For
conceptual articles, the major theme determined the focus. Through this examination, the articles were categorized as end user, technology, or organizational.
The themes or variables then were recorded. All variables were included (except
demographics) in order to provide an accurate account of measures.
When EUC articles appeared to belong in multiple dimensions, a different
procedure was used. Generally, this resulted when an article had variables that
measured multiple dimensions (such as organizational and end user variables).
Placing it in more than one dimension required either a second dependent
variable (in another dimension) or two or more independent variables in another
dimension. There turned out to be only 15 articles (out of 463) classified in
multiple dimensions.
RESULTS
The examination of the five journals for the years 1990-2000 yielded a total
of 463 EUC articles. Of these, 414 (89.4%) were empirical in nature. I&M had
the highest number of EUC articles, a total of 179, due primarily to an increased
number of articles per issue and shorter article length. The other four journals
averaged 71 articles for the 11 years.
To assess the findings, the results include an analysis of the three dimensions and a comparison of journals. Based on these findings, the discussion
section addresses EUC trends found in the literature.
Dimensions of EUC
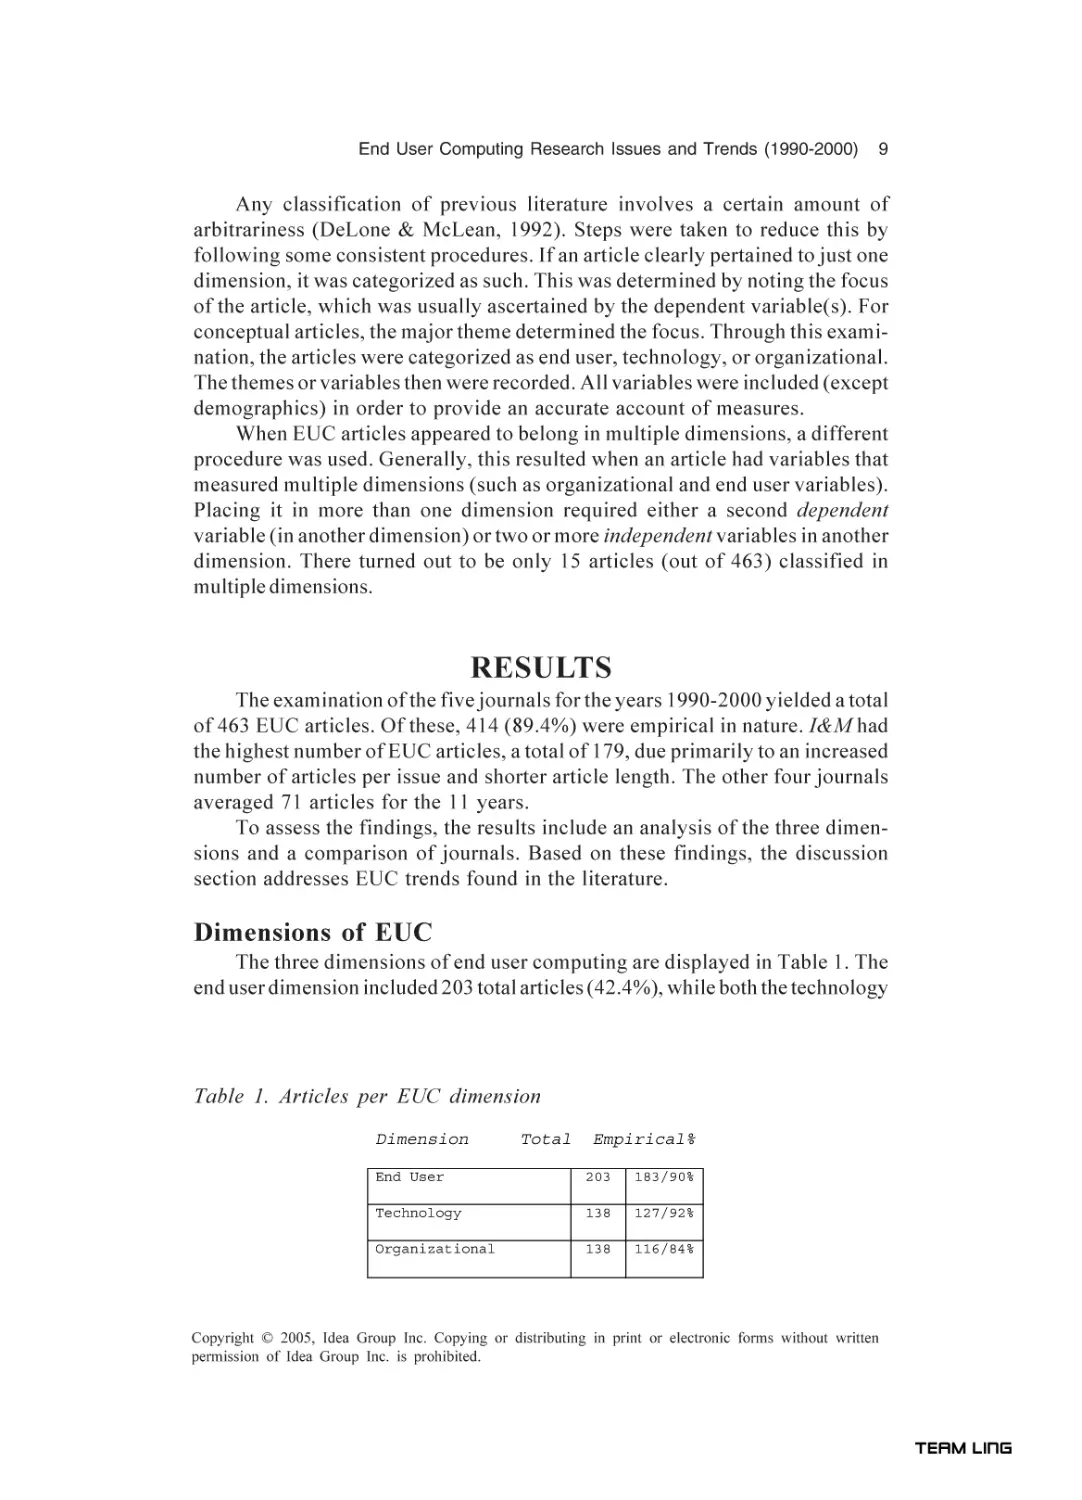
The three dimensions of end user computing are displayed in Table 1. The
end user dimension included 203 total articles (42.4%), while both the technology
Table 1. Articles per EUC dimension
Dimension
Total
Empirical%
End User
203
183/90%
Technology
138
127/92%
Organizational
138
116/84%
Copyright © 2005, Idea Group Inc. Copying or distributing in print or electronic forms without written
permission of Idea Group Inc. is prohibited.
TEAM LinG
10 Downey and Bartczak
and organizational dimensions had 138 total articles (28.8%). Although there
were 463 total articles, the 479 presented below includes fourteen articles
classified in two dimensions, and one article placed in all three dimensions. The
percentage and number of empirical articles within each dimension are included.
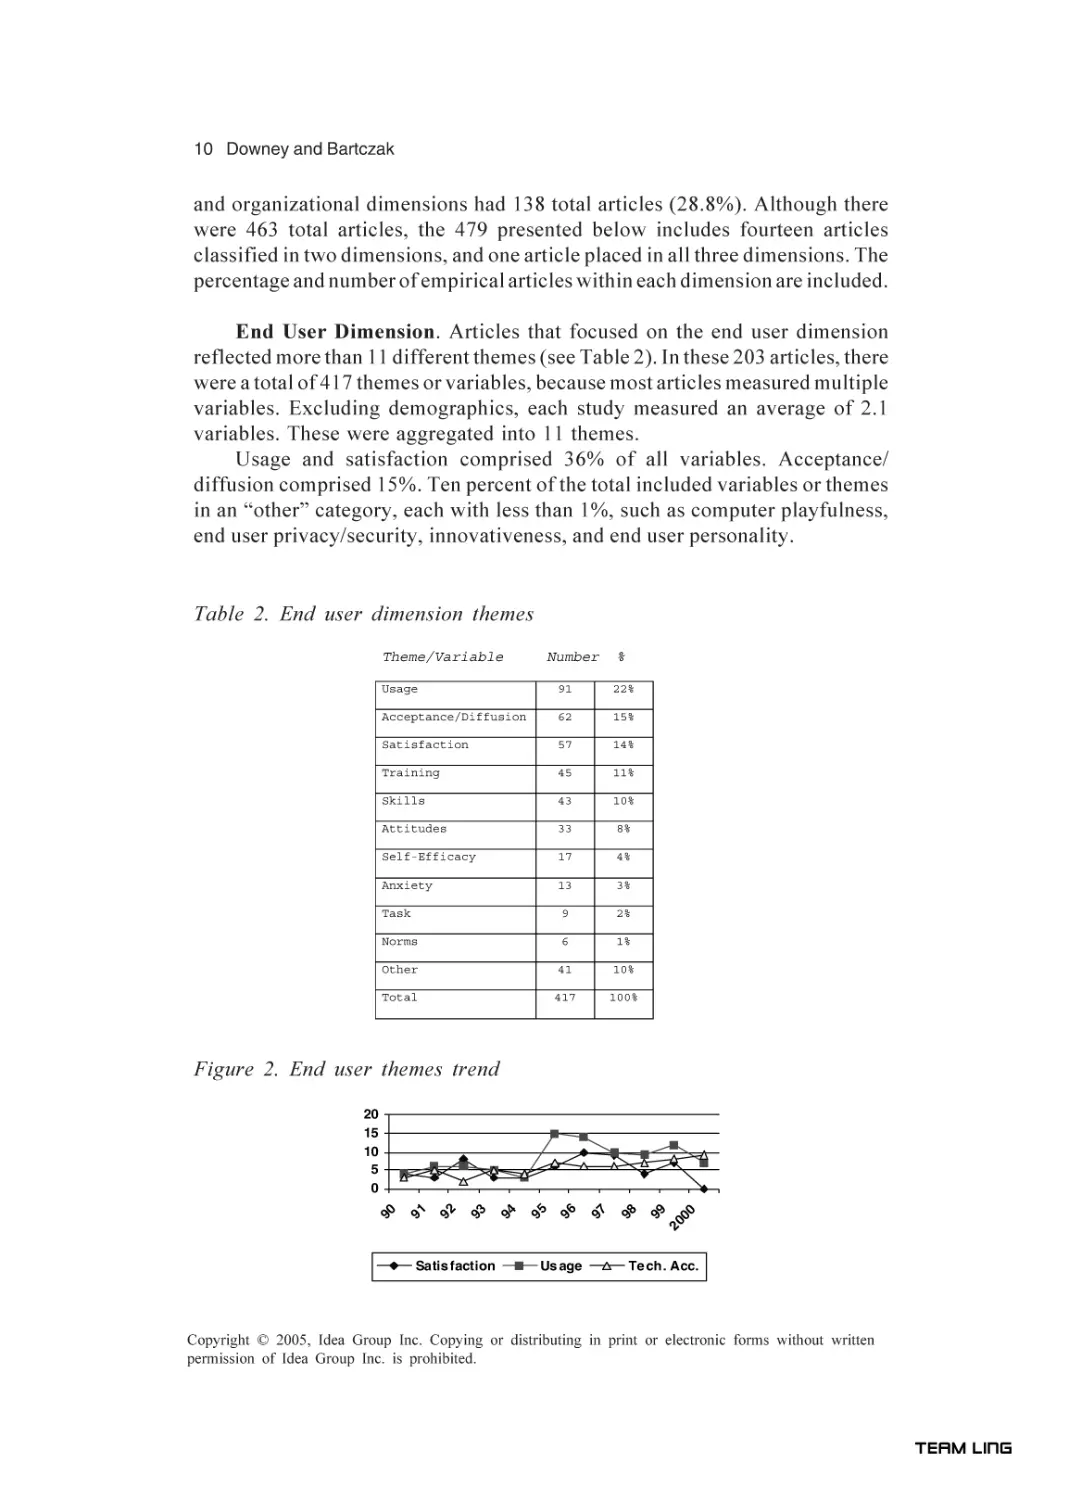
End User Dimension. Articles that focused on the end user dimension
reflected more than 11 different themes (see Table 2). In these 203 articles, there
were a total of 417 themes or variables, because most articles measured multiple
variables. Excluding demographics, each study measured an average of 2.1
variables. These were aggregated into 11 themes.
Usage and satisfaction comprised 36% of all variables. Acceptance/
diffusion comprised 15%. Ten percent of the total included variables or themes
in an “other” category, each with less than 1%, such as computer playfulness,
end user privacy/security, innovativeness, and end user personality.
Table 2. End user dimension themes
Theme/Variable
Number
Usage
%
91
22%
Acceptance/Diffusion
62
15%
Satisfaction
57
14%
Training
45
11%
Skills
43
10%
Attitudes
33
8%
Self-Efficacy
17
4%
Anxiety
13
3%
9
2%
Task
Norms
6
1%
Other
41
10%
Total
417
100%
Figure 2. End user themes trend
Satis faction
Us age
99
20
00
98
97
96
95
94
93
92
91
90
20
15
10
5
0
Te ch. Acc.
Copyright © 2005, Idea Group Inc. Copying or distributing in print or electronic forms without written
permission of Idea Group Inc. is prohibited.
TEAM LinG
End User Computing Research Issues and Trends (1990-2000)
11
Figure 2 indicates the trends of the top three themes within the end user
dimension. Usage, the most common variable in this dimension, averaged 8.3 per
year and shows a crest in 1995. Satisfaction, with an average of 5.2 articles per
year, was notable only in that there were no articles in 2000 (significant at p <
.10). Technology acceptance, with an average of 5.6 per year, shows a slow
steady rise from 1996-2000. However, none of the differences in these three
themes for the 11 years was significant at p < .05.
Most of the remaining themes also were consistent during this time period.
Only two points are noteworthy. In 1995, there were eight articles on computer
skills, significantly (p < .05) more than any other year. Likewise, the number of
self-efficacy articles in 2000 was significantly higher than in other years (p < .05).
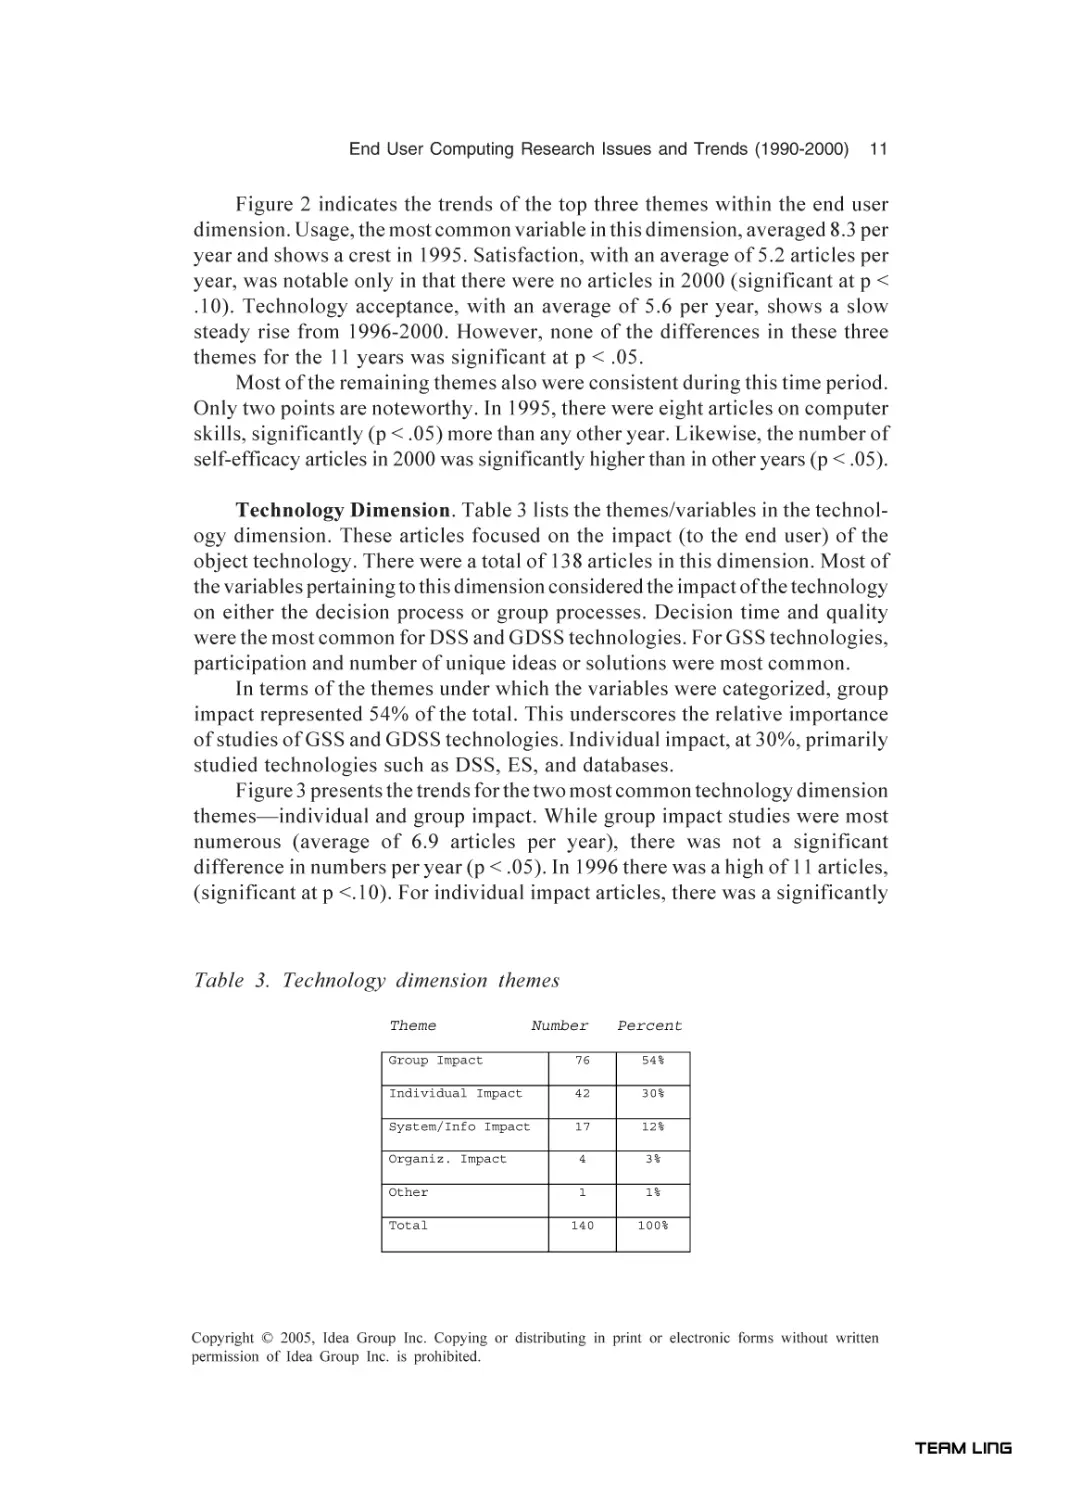
Technology Dimension. Table 3 lists the themes/variables in the technology dimension. These articles focused on the impact (to the end user) of the
object technology. There were a total of 138 articles in this dimension. Most of
the variables pertaining to this dimension considered the impact of the technology
on either the decision process or group processes. Decision time and quality
were the most common for DSS and GDSS technologies. For GSS technologies,
participation and number of unique ideas or solutions were most common.
In terms of the themes under which the variables were categorized, group
impact represented 54% of the total. This underscores the relative importance
of studies of GSS and GDSS technologies. Individual impact, at 30%, primarily
studied technologies such as DSS, ES, and databases.
Figure 3 presents the trends for the two most common technology dimension
themes—individual and group impact. While group impact studies were most
numerous (average of 6.9 articles per year), there was not a significant
difference in numbers per year (p < .05). In 1996 there was a high of 11 articles,
(significant at p <.10). For individual impact articles, there was a significantly
Table 3. Technology dimension themes
Theme
Number
Percent
Group Impact
76
54%
Individual Impact
42
30%
System/Info Impact
17
12%
Organiz. Impact
4
3%
Other
1
1%
Total
140
100%
Copyright © 2005, Idea Group Inc. Copying or distributing in print or electronic forms without written
permission of Idea Group Inc. is prohibited.
TEAM LinG
12 Downey and Bartczak
Figure 3. Technology themes trend
15
10
5
Individual
99
20
00
98
97
96
95
94
93
92
91
90
0
Gr oup
higher number in 1995 (p < .05), a total of nine. Individual impact articles
averaged 3.82 articles per year.
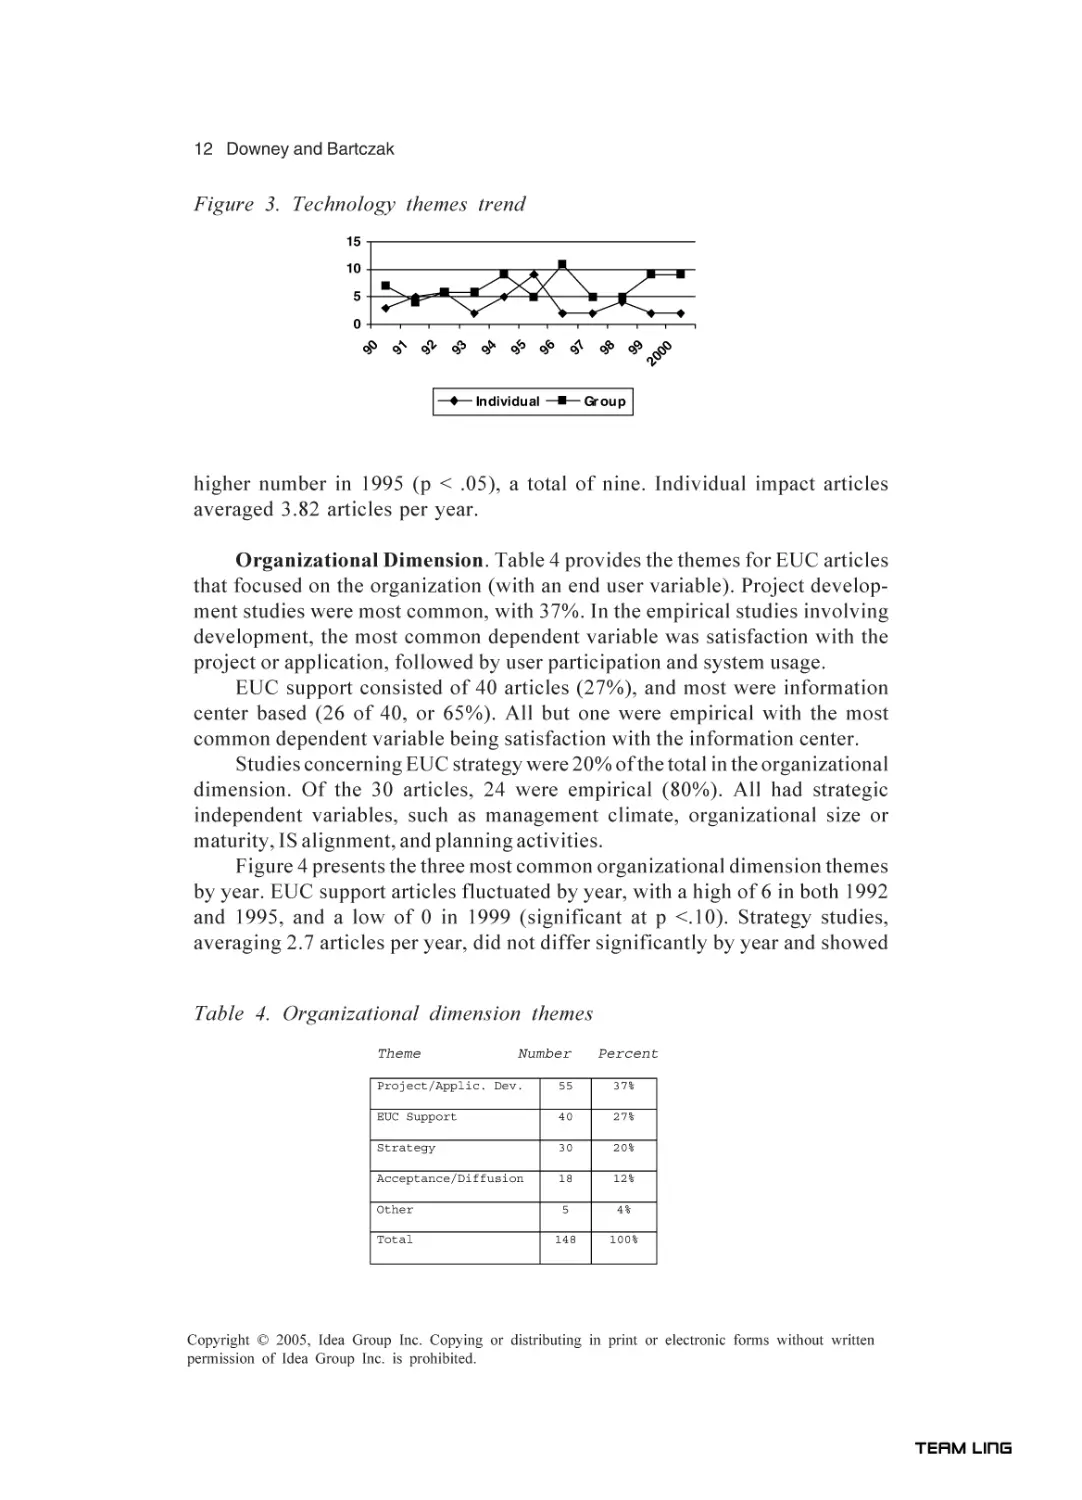
Organizational Dimension. Table 4 provides the themes for EUC articles
that focused on the organization (with an end user variable). Project development studies were most common, with 37%. In the empirical studies involving
development, the most common dependent variable was satisfaction with the
project or application, followed by user participation and system usage.
EUC support consisted of 40 articles (27%), and most were information
center based (26 of 40, or 65%). All but one were empirical with the most
common dependent variable being satisfaction with the information center.
Studies concerning EUC strategy were 20% of the total in the organizational
dimension. Of the 30 articles, 24 were empirical (80%). All had strategic
independent variables, such as management climate, organizational size or
maturity, IS alignment, and planning activities.
Figure 4 presents the three most common organizational dimension themes
by year. EUC support articles fluctuated by year, with a high of 6 in both 1992
and 1995, and a low of 0 in 1999 (significant at p <.10). Strategy studies,
averaging 2.7 articles per year, did not differ significantly by year and showed
Table 4. Organizational dimension themes
Theme
Number
Percent
Project/Applic. Dev.
55
37%
EUC Support
40
27%
Strategy
30
20%
Acceptance/Diffusion
18
12%
Other
5
4%
Total
148
100%
Copyright © 2005, Idea Group Inc. Copying or distributing in print or electronic forms without written
permission of Idea Group Inc. is prohibited.
TEAM LinG
End User Computing Research Issues and Trends (1990-2000)
13
Figure 4. Organizational themes trend
8
6
4
2
Proj. Dev
Support
99
20
00
98
97
96
95
94
93
92
91
90
0
Strategy
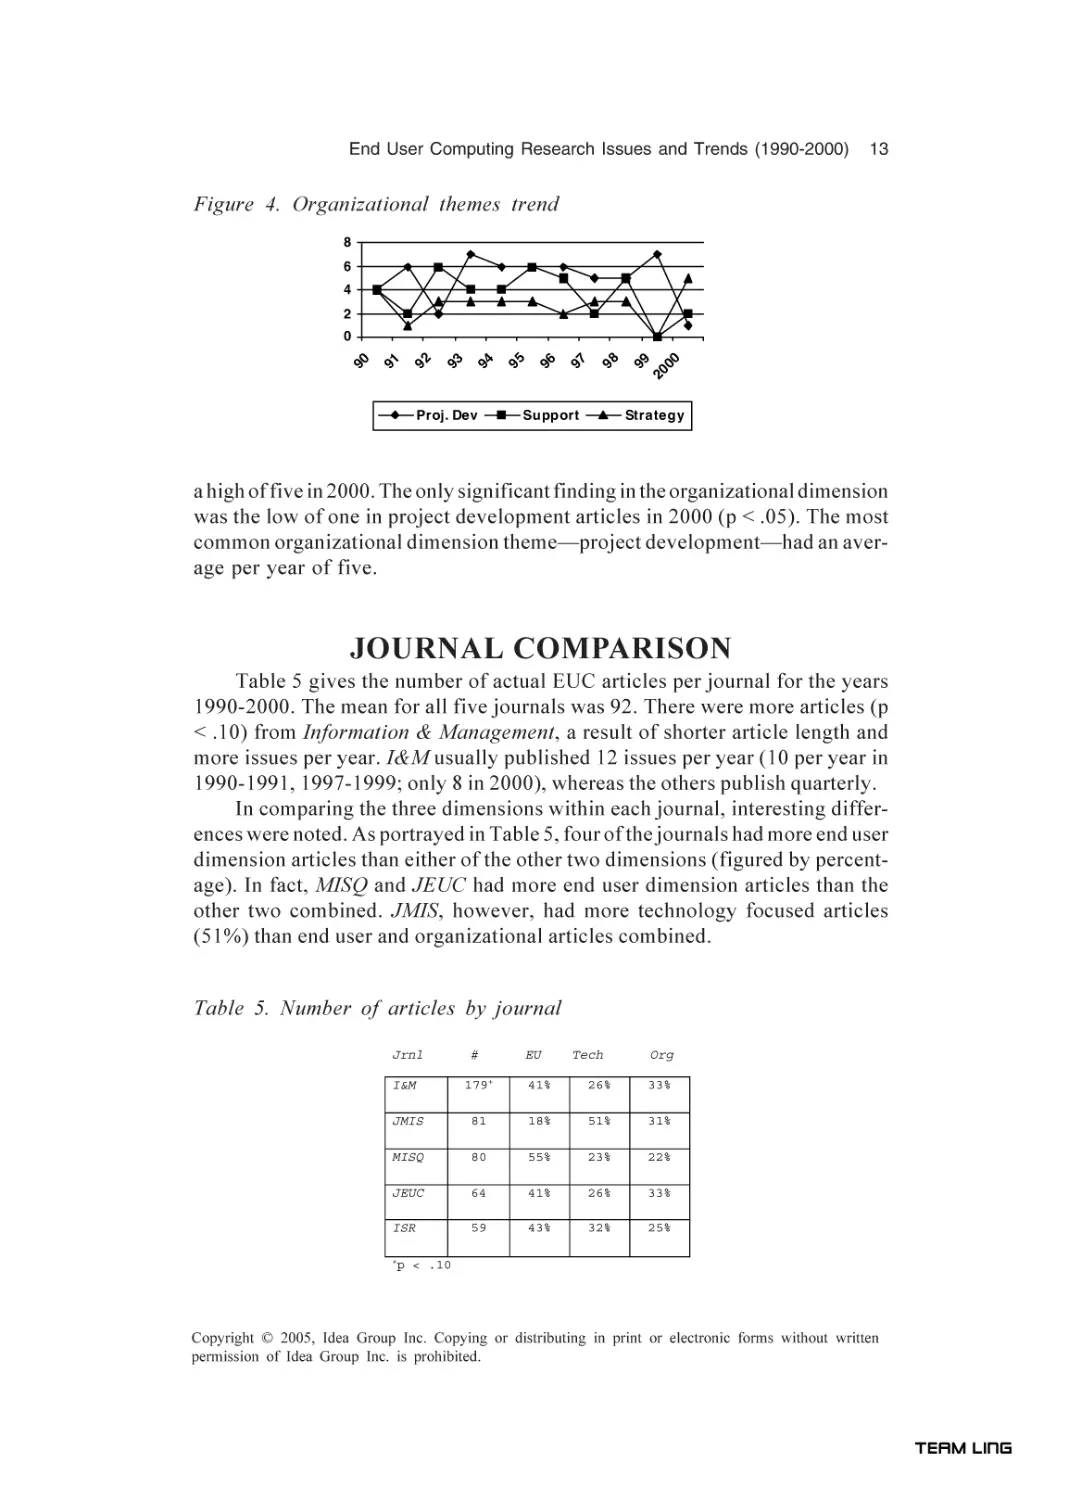
a high of five in 2000. The only significant finding in the organizational dimension
was the low of one in project development articles in 2000 (p < .05). The most
common organizational dimension theme—project development—had an average per year of five.
JOURNAL COMPARISON
Table 5 gives the number of actual EUC articles per journal for the years
1990-2000. The mean for all five journals was 92. There were more articles (p
< .10) from Information & Management, a result of shorter article length and
more issues per year. I&M usually published 12 issues per year (10 per year in
1990-1991, 1997-1999; only 8 in 2000), whereas the others publish quarterly.
In comparing the three dimensions within each journal, interesting differences were noted. As portrayed in Table 5, four of the journals had more end user
dimension articles than either of the other two dimensions (figured by percentage). In fact, MISQ and JEUC had more end user dimension articles than the
other two combined. JMIS, however, had more technology focused articles
(51%) than end user and organizational articles combined.
Table 5. Number of articles by journal
Jrnl
#
EU
Tech
Org
179+
41%
26%
33%
JMIS
81
18%
51%
31%
MISQ
80
55%
23%
22%
JEUC
64
41%
26%
33%
ISR
59
43%
32%
25%
I&M
+
p < .10
Copyright © 2005, Idea Group Inc. Copying or distributing in print or electronic forms without written
permission of Idea Group Inc. is prohibited.
TEAM LinG
14 Downey and Bartczak
DISCUSSION
The evidence gathered from the 11 years between 1990-2000 clearly
indicates that EUC is still a prevalent research topic. With an average of 42
articles per year in just these five journals, there is still wide academic and
practitioner interest in the themes of EUC. This section examines the top themes
and trends, and discusses limitations to this study.
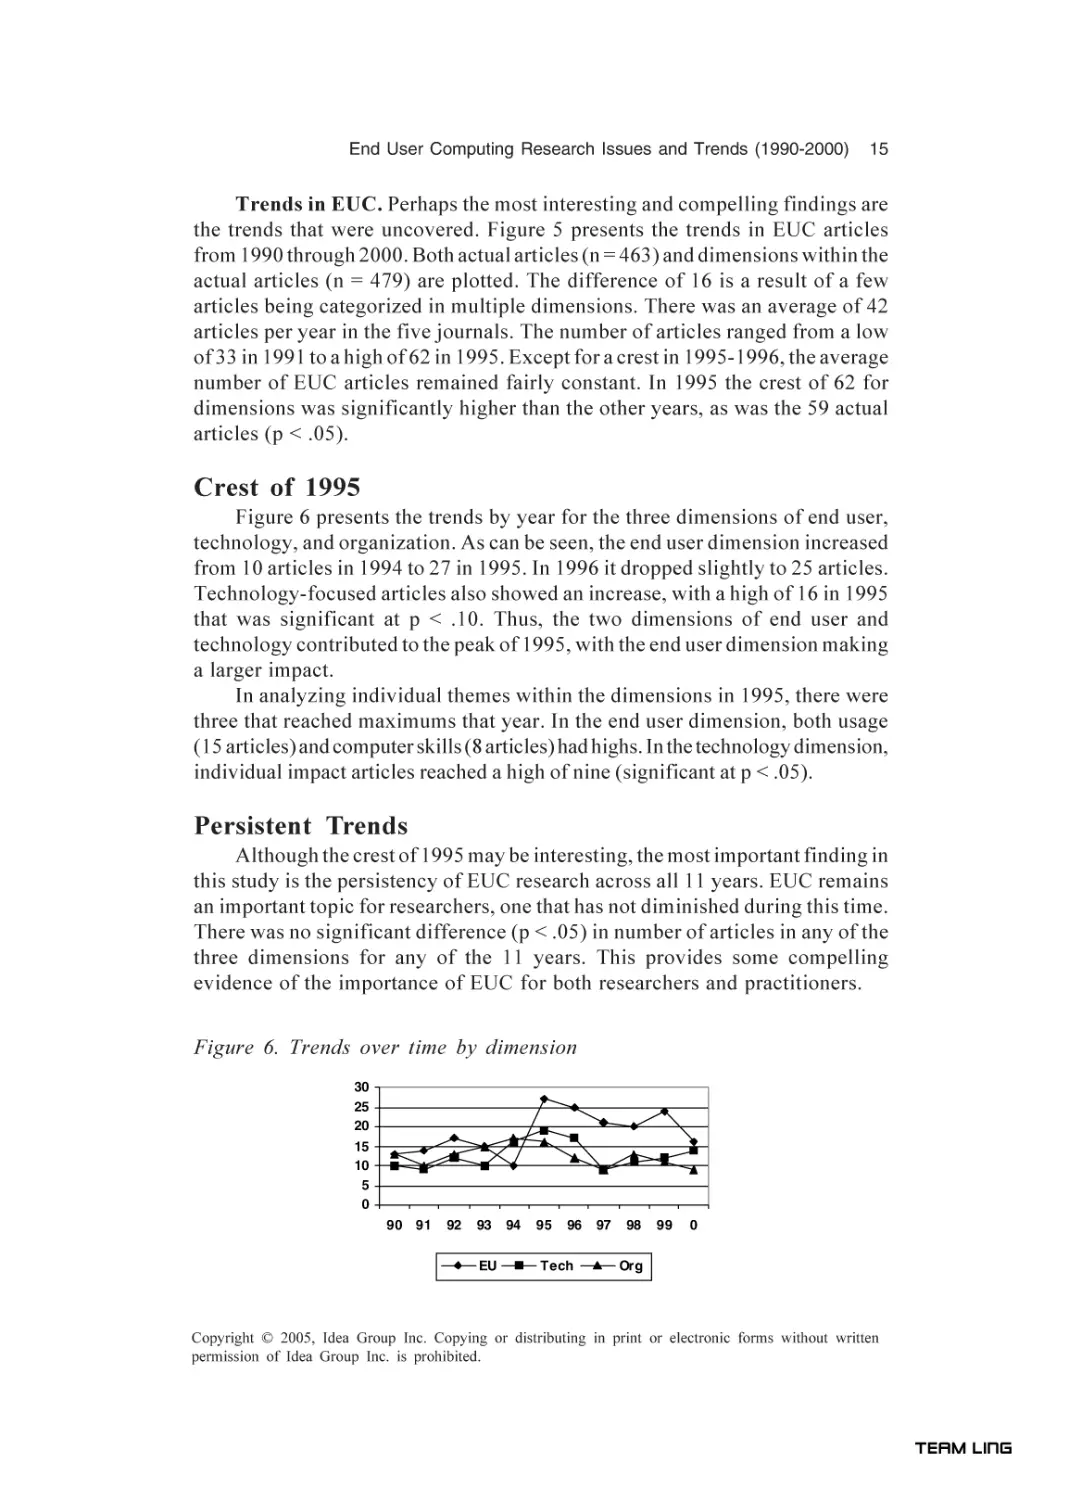
Table 6 lists the top 10 themes or variables in EUC. Six of the themes were
in the end user dimension, with two each in technology and organization. This list
provides a keen insight into the state of EUC research for these 11 years. Usage
and satisfaction, the most common dependent variables (DeLone & McLean,
1992) in 1992, remain almost a decade later in the forefront of research (at no.
1 and no. 4). Group impact articles were at no. 2, with 16% of the total.
Surprisingly, technology acceptance was no. 3, documenting the importance
throughout the 1990s of promoting and studying users and their technology.
Table 6. Top ten themes in EUC: 1990-2000
Theme
Dimension
#
%
Usage
End User
91
19%
Group Impact
Technology
76
16%
Tech. Aceptnce
End User
62
13%
Satisfaction
End User
57
12%
Project Dev.
Organiz.
55
11%
Training
End User
45
9%
Skills
End User
43
9%
Indiv. Impact
Technology
42
9%
EUC Support
Organiz.
40
8%
Attitudes
End User
33
7%
Figure 5. Trend by year of EUC: articles/dimension
80
60
40
20
0
90
91
92
93
94
95
96
97
98
99
0
Article s
33
32
43
40
44
59
53
37
41
46
35
Dim e ns ions
36
33
43
40
44
62
54
39
43
47
38
Copyright © 2005, Idea Group Inc. Copying or distributing in print or electronic forms without written
permission of Idea Group Inc. is prohibited.
TEAM LinG
End User Computing Research Issues and Trends (1990-2000)
15
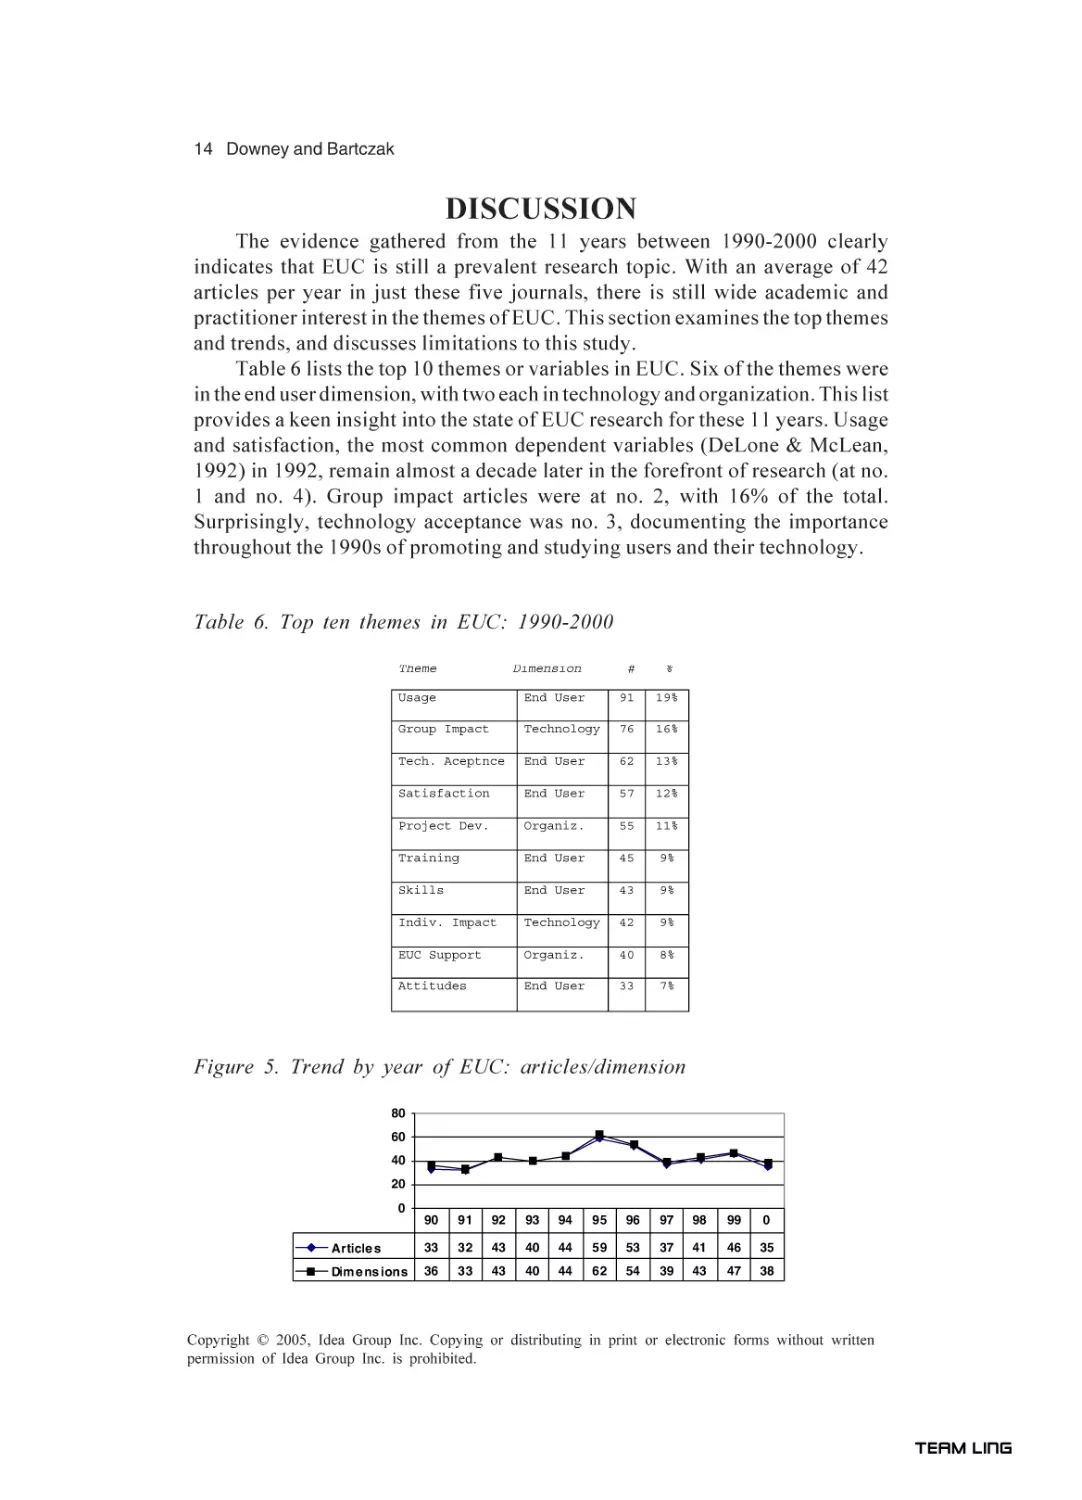
Trends in EUC. Perhaps the most interesting and compelling findings are
the trends that were uncovered. Figure 5 presents the trends in EUC articles
from 1990 through 2000. Both actual articles (n = 463) and dimensions within the
actual articles (n = 479) are plotted. The difference of 16 is a result of a few
articles being categorized in multiple dimensions. There was an average of 42
articles per year in the five journals. The number of articles ranged from a low
of 33 in 1991 to a high of 62 in 1995. Except for a crest in 1995-1996, the average
number of EUC articles remained fairly constant. In 1995 the crest of 62 for
dimensions was significantly higher than the other years, as was the 59 actual
articles (p < .05).
Crest of 1995
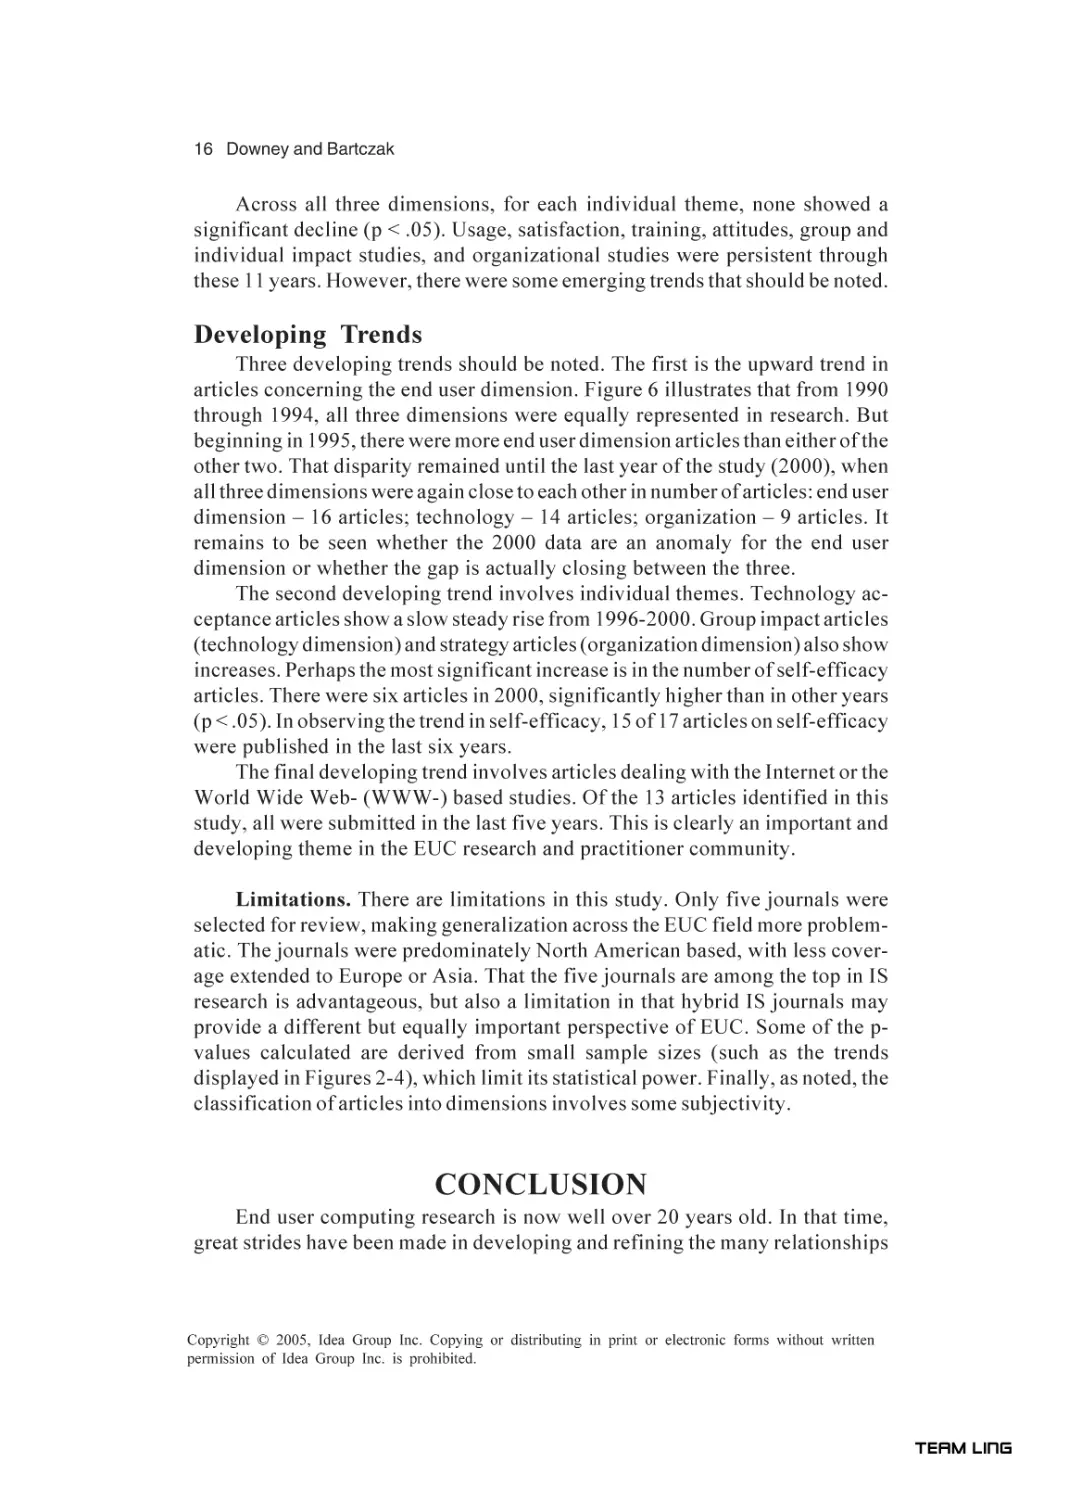
Figure 6 presents the trends by year for the three dimensions of end user,
technology, and organization. As can be seen, the end user dimension increased
from 10 articles in 1994 to 27 in 1995. In 1996 it dropped slightly to 25 articles.
Technology-focused articles also showed an increase, with a high of 16 in 1995
that was significant at p < .10. Thus, the two dimensions of end user and
technology contributed to the peak of 1995, with the end user dimension making
a larger impact.
In analyzing individual themes within the dimensions in 1995, there were
three that reached maximums that year. In the end user dimension, both usage
(15 articles) and computer skills (8 articles) had highs. In the technology dimension,
individual impact articles reached a high of nine (significant at p < .05).
Persistent Trends
Although the crest of 1995 may be interesting, the most important finding in
this study is the persistency of EUC research across all 11 years. EUC remains
an important topic for researchers, one that has not diminished during this time.
There was no significant difference (p < .05) in number of articles in any of the
three dimensions for any of the 11 years. This provides some compelling
evidence of the importance of EUC for both researchers and practitioners.
Figure 6. Trends over time by dimension
30
25
20
15
10
5
0
90 91
92
93
EU
94
95
96
Tech
97
98
99
0
Org
Copyright © 2005, Idea Group Inc. Copying or distributing in print or electronic forms without written
permission of Idea Group Inc. is prohibited.
TEAM LinG
16 Downey and Bartczak
Across all three dimensions, for each individual theme, none showed a
significant decline (p < .05). Usage, satisfaction, training, attitudes, group and
individual impact studies, and organizational studies were persistent through
these 11 years. However, there were some emerging trends that should be noted.
Developing Trends
Three developing trends should be noted. The first is the upward trend in
articles concerning the end user dimension. Figure 6 illustrates that from 1990
through 1994, all three dimensions were equally represented in research. But
beginning in 1995, there were more end user dimension articles than either of the
other two. That disparity remained until the last year of the study (2000), when
all three dimensions were again close to each other in number of articles: end user
dimension – 16 articles; technology – 14 articles; organization – 9 articles. It
remains to be seen whether the 2000 data are an anomaly for the end user
dimension or whether the gap is actually closing between the three.
The second developing trend involves individual themes. Technology acceptance articles show a slow steady rise from 1996-2000. Group impact articles
(technology dimension) and strategy articles (organization dimension) also show
increases. Perhaps the most significant increase is in the number of self-efficacy
articles. There were six articles in 2000, significantly higher than in other years
(p < .05). In observing the trend in self-efficacy, 15 of 17 articles on self-efficacy
were published in the last six years.
The final developing trend involves articles dealing with the Internet or the
World Wide Web- (WWW-) based studies. Of the 13 articles identified in this
study, all were submitted in the last five years. This is clearly an important and
developing theme in the EUC research and practitioner community.
Limitations. There are limitations in this study. Only five journals were
selected for review, making generalization across the EUC field more problematic. The journals were predominately North American based, with less coverage extended to Europe or Asia. That the five journals are among the top in IS
research is advantageous, but also a limitation in that hybrid IS journals may
provide a different but equally important perspective of EUC. Some of the pvalues calculated are derived from small sample sizes (such as the trends
displayed in Figures 2-4), which limit its statistical power. Finally, as noted, the
classification of articles into dimensions involves some subjectivity.
CONCLUSION
End user computing research is now well over 20 years old. In that time,
great strides have been made in developing and refining the many relationships
Copyright © 2005, Idea Group Inc. Copying or distributing in print or electronic forms without written
permission of Idea Group Inc. is prohibited.
TEAM LinG
End User Computing Research Issues and Trends (1990-2000)
17
of end user technology in some organizational setting. This study confirms that
EUC research is prevalent and important.
Missing was a simple yet practical framework to help organize and
compartmentalize the broad dimensions and themes of EUC. The EUC research-focused framework provides that structure and allows an examination of
the trends and important themes still being studied.
The importance of this study is not that it adds yet another framework for
consideration; rather, it is to assess and categorize the themes of EUC and the
important issues still remaining. This study provides some compelling conclusions. The themes of EUC, including the end user, technology, and the organization, remain important and pervasive. EUC research remains predominantly
empirical in nature; almost 90% of the articles during this timeframe were
empirical. The upward trend in the end user dimension suggests that many
unanswered questions remain on how and why individuals respond and use
technology. The persistence of usage and satisfaction, along with the rise in
technology acceptance and computer self-efficacy, clearly indicates that the
research focus on the individual remains. The Internet brings a new dimension
to individuals and organizations, and is moving to the vanguard in EUC research.
New technology in the future will continue to provide both researchers and
practitioners with opportunities. But the critical link between the technology and
the user remains one of the most viable interests in EUC.
REFERENCES
Aggarwal, A.K. (1994). Trends in end user computing: A professional’s
perspective. Journal of End User Computing, 6(3), 32-33.
Aggarwal, A.K. (1996). End user computing: Revisited. Journal of End User
Computing, 8(1), 31-32.
Barker, R.M. (1995). The interaction between end user computing levels and job
motivation and job satisfaction: An exploratory study. Journal of End User
Computing, 7(3), 12-19.
Benarock, M., & Kauffman, R.J. (1999). A case of using real options pricing
analysis to evaluate information technology project investments. Information Systems Research, 10(1), 70-86.
Benson, D.H. (1983). A field study of end user computing: Findings and issues.
MIS Quarterly, 7(4), 35-45.
Bowman, B., Grupe, F.H., Lund, D., & Moore, W.D. (1993). An examination of
sources of support preferred by end user computing personnel. Journal of
End User Computing, 5(4), 4-11.
Brancheau, J.C., & Brown, C.V. (1993). The management of end-user computing: Status and directions. ACM Computing Surveys, 25(4), 437-482.
Copyright © 2005, Idea Group Inc. Copying or distributing in print or electronic forms without written
permission of Idea Group Inc. is prohibited.
TEAM LinG
18 Downey and Bartczak
Brancheau, J.C., Janz, B.D., & Wetherbe, J.C. (1996). Key issues in information
systems management: 1994-1995 SIM Delphi results. MIS Quarterly,
20(2), 225-242.
Brancheau, J.C., & Wetherbe, J.C. (1987). Key issues in information systems
management. MIS Quarterly, 11(1), 23-45.
Caudle, S.L., Gorr, W.L. & Newcomer, K.E. (1991). Key information systems
management issues for the public sector. MIS Quarterly, 15(2), 23-45.
Deans, P.C., Karwan, K.R., Goslar, M.D., Ricks, D.A., & Toyne, B. (19901991). Identification of key international information systems issues in
U.S.-based multinational corporations. Journal of Management Information Systems, 7(3), 27-50.
DeLone, W.H., & McLean, E.R. (1992). Information systems success: The
quest for the dependent variable. Information Systems Research, 3(1),
60-95.
Dickson, G.W., Leitheiser, R.L., Wetherbe, J.C., & Nechis, M. (1984). Key
information systems issues for the 1980’s. MIS Quarterly, 8(3), 135-159.
Ein-Dor, P., & Segev, E. (1992). Information resources management for end
user computing: An exploratory study. Journal of End User Computing,
4(3), 14-20.
Essex, P.A., Magal, S.R., & Masteller, D.E. (1998). Determinants of information center success. Journal of Management Information Systems,
15(2), 95-117.
Galliers, R.D., & Land, F.F. (1987). Choosing appropriate information systems
research methodologies. Communications of the ACM, 30(11). 900-902.
Gillenson, M.L., & Stutz, J.D. (1991). Academic issues in MIS: Journals and
books. MIS Quarterly, 15(4), 447-452.
Glorfeld, K.D., & Cronan, T.P. (1993). Computer information satisfaction: A
longitudinal study of computing systems and EUC in a public organization.
Journal of End User Computing, 5(1), 27-36.
Guimaraes, T., & Igbaria, M. (1992). Determinants of turnover intentions:
Comparing IC and IS personnel. Information Systems Research, 3(3),
273-303.
Guimaraes, T., & Igbaria, M. (1994). Exploring the relationship between IC
success and company performance. Information & Management, 26(3),
133-141.
Hardgrave, B.C., & Walstrom, K.A. (1997). Forums for MIS scholars. Communications of the ACM, 40(11), 119-124.
Harris, R.W. (2000). Schools of thought in research into end-user computing
success. Journal of End User Computing, 12(1), 24-34.
Holsapple, C.W., Johnson, L.E., Manakyan, H., & Tanner, J. (1994). Business
computing research journals: A normalized citation analysis. Journal of
Management Information Systems, 11(1), 131-140.
Copyright © 2005, Idea Group Inc. Copying or distributing in print or electronic forms without written
permission of Idea Group Inc. is prohibited.
TEAM LinG
End User Computing Research Issues and Trends (1990-2000)
19
Kochen, M. (1985-1986). Are MIS frameworks premature? Journal of Management Information Systems, 2(3), 92-100.
Lee, D.M.S., Trauth, E.M., & Farwell, D. (1995). Critical skills and knowledge
requirements of IS professionals: A joint academic/industry investigation.
MIS Quarterly, 19(3), 313-340.
Mason, R.O., & Mitroff, I.I. (1973). A program for research on management
information systems. Management Science, 19(5), 475-487.
McLean, E.R., & Kappelman, L.A. (1992-1993). The convergence of organizational and end-user computing. Journal of Management Information
Systems, 9(3), 145-155.
Niederman, F., Brancheau, J.C., & Wetherbe, J.C. (1991). Information systems
management issues for the 1990s. MIS Quarterly, 15(4), 475-500.
Nolan, R.L., & Wetherbe, J.C. (1980, June). Toward a comprehensive framework for MIS research. MIS Quarterly, 1-19.
Powell, A., & Moore, J.E. (2002). The focus of research in end user computing:
Where have we come since the 1980s? Journal of End User Computing,
14(1), 3-22.
Rainer, R.K., & Harrison, A.W. (1993). Toward development of the end user
computing construct in a university setting. Decision Sciences, 24(6),
1187-1202.
Riemenschneider, C.K., & Mykytyn, Jr., P.P. (2000). What small business
executives have learned about managing information technology. Information & Management, 37(5), 257-269.
Rockart, J.F., & Flannery, L.S. (1983). The management of end user computing.
Communications of the ACM, 26(10), 776-784.
Seddon, P.B. (1997). A respecification and extension of the DeLone and
McLean model of IS success. Information Systems Research, 8(3), 240253.
Shah, H.U., & Lawrence, D.R. (1996). A study of end user computing and the
provision of tool support to advance end user empowerment. Journal of
End User Computing, 8(1), 13-21.
Shayo, C., Guthrie, R., & Igbaria, M. (1999). Exploring the measurement of end
user computing success. Journal of End User Computing, 11(1), 5-14.
Sussman, S.W., & Sproull, L. (1999). Straight talk: Delivering bad news through
electronic communication. Information Systems Research, 10(2), 150166.
Vandenbosch, B., & Huff, S.L. (1997). Searching and scanning: How executives obtain information from executive information systems. MIS Quarterly, 21(1), 81-107.
Walstrom, K.A., & Hardgrave, B.C. (2001). Forums for information systems
scholars: III. Information & Management, 39(2001), 117-124.
Copyright © 2005, Idea Group Inc. Copying or distributing in print or electronic forms without written
permission of Idea Group Inc. is prohibited.
TEAM LinG
20 Downey and Bartczak
Walstrom, K.A., Hardgrave, B.C., & Wilson, R.L. (1995). Forums for management information systems scholars. Communications of the ACM, 38(3),
93-107.
Wang, P. (1994). Information systems management issues in the Republic of
China for the 1990s. Information & Management, 26(6), 341-352.
Yang, H.L. (1996). Key information management issues in Taiwan and the US.
Information & Management, 30(5), 251-267.
ENDNOTE
1
From its inception in 1989 until 1992, this journal was named Journal of
Microcomputer Systems Management.
Copyright © 2005, Idea Group Inc. Copying or distributing in print or electronic forms without written
permission of Idea Group Inc. is prohibited.
TEAM LinG
The Effect of End User Development on End User Success 21
Chapter II
The Effect of End User
Development on
End User Success
Tanya McGill, Murdoch University, Australia
ABSTRACT
End user development of applications forms a significant part of
organizational systems development. This study investigates the role that
developing an application plays in the eventual success of the application
for the user developer. The results of this study suggest that the process of
developing an application not only predisposes an end user developer to
be more satisfied with the application than they would be if it were
developed by another end user, but also leads them to perform better with
it. Thus, the results of the study highlight the contribution of the process of
application development to user developed application success.
INTRODUCTION
An end user developer is someone who develops applications systems to
support his or her work and possibly the work of other end users. The applications
developed are known as user developed applications (UDAs). So, while the
technical abilities of user developers may vary considerably, they are required
basically to analyze, design, and implement applications. End user development
of applications forms a significant part of organizational systems development
with the ability to develop small applications forming part of the job requirements
Copyright © 2005, Idea Group Inc. Copying or distributing in print or electronic forms without written
permission of Idea Group Inc. is prohibited.
TEAM LinG
22 McGill
for many positions (Jawahar & Elango, 2001). In a survey to determine the types
of applications developed by end users, Rittenberg and Senn (1990) identified
more than 130 different types of applications. More than half of these were
accounting related, but marketing, operations, and human resources applications
also were represented heavily. The range of tasks for which users develop
applications has expanded as the sophistication of both software development
tools and user developers has increased, which has led to a degree of convergence with corporate computing so that the tasks for which UDAs are developed
are less distinguishable from tasks for corporate computing applications (McLean,
Kappelman, & Thompson, 1993). In addition to the traditional tasks that UDAs
have been developed to support, Web applications are becoming increasingly
common (Nelson & Todd, 1999; Ouellette, 1999).
Much has been written in the end user computing literature about the
potential benefits and risks of end user development. It has been suggested that
end user development offers organizations better and more timely access to
information, improved quality of information, improved decision making, reduced
application development backlogs, and improved information systems department/user relationships (Brancheau & Brown, 1993; Shayo, Guthrie, & Igbaria,
1999). In the early UDA literature, the proposed benefits of UDA were seen to
flow mainly from a belief that the user has a superior understanding of the
problem to be solved by the application (Amoroso, 1988). This superior understanding then should enable end users to identify information requirements more
easily and to thus create applications that provide information of better quality.
This, in turn, should lead to better decision making. Other proposed benefits also
should flow from this; that is, user development of applications should allow the
information systems staff to focus more on the remaining and presumably larger
requests and hence reduce the application development backlog. This, in turn,
should improve relationships between information systems staff and end users.
Despite the potential benefits to an organization of user development of
applications, there are many risks associated with it that may lead potentially to
dysfunctional consequences for the organization’s activities. These risks result
from a potential decrease in application quality and control as individuals with
little information systems training take responsibility for developing and implementing systems of their own making (Cale, 1994) and include ineffective use of
monetary resources, threats to data security and integrity, solving the wrong
problem (Alavi & Weiss, 1985-1986), unreliable systems, incompatible systems,
and use of private systems when organizational systems would be more
appropriate (Brancheau & Brown, 1993).
As end user development forms a large proportion of organizational systems
development, its success is of great importance to organizations. The decisions
made by end users using UDAs influence organizational performance every day.
Organizations carry out very little formal assessment of fitness for use of UDAs
(Panko & Halverson, 1996); therefore, they have to rely very heavily on the
Copyright © 2005, Idea Group Inc. Copying or distributing in print or electronic forms without written
permission of Idea Group Inc. is prohibited.
TEAM LinG
The Effect of End User Development on End User Success 23
judgment of end users, both those who develop the applications and others that
may use them, as end user developers are not the only users of UDAs. Bergeron
and Berube (1988) found that 44% of the end user developers in their study had
developed applications that were used by more than two people, and Hall (1996)
found that only 17% of the spreadsheets contributed by participants in her study
were solely for the developer’s own use. Therefore, it is essential that more be
known about UDA success, including whether end users are disadvantaged
when they use applications developed by other end users. This chapter explores
the contribution of the development process to UDA success and, hence,
highlights differences between the success of UDAs when used by the developer and when used by other end users.
The literature on user participation and involvement proposes benefits that
are thought to accrue from greater inclusion of users in the system development
process. The benefits that have been proposed include higher levels of information system usage, greater user acceptance of systems, and increased user
satisfaction (Lin & Shao, 2000). The end user’s superior knowledge of the
problem to be solved is certainly one factor influencing these benefits, but the
process of participating, per se, also is thought to have benefits. Those who have
participated in systems development have a greater understanding of the
functionality of the resulting application (Lin & Shao, 2000); a greater sense of
involvement with it (Barki & Hartwick, 1994); and, hence, a greater commitment
to making it successful. User development of applications has been described as
the ultimate user involvement (Cheney, Mann, & Amoroso, 1986). Thus, it could
be expected to lead to systems that gain the benefit of a better understanding of
the problem and to end users with a better understanding of the application and
greater commitment to making it work.
This study was designed to isolate the effect of actually developing a UDA
on the application’s eventual success for the user developer, and to measure that
success in terms of a range of possible success measures. There has been little
empirical research on user development of applications (Shayo et al., 1999), and
most of what has been undertaken has used user satisfaction as the measure of
success because of the lack of direct measures available (Etezadi-Amoli &
Farhoomand, 1996). User satisfaction refers to the attitude or response of an end
user toward an information system. While user satisfaction has been the most
widely reported measure of success (Gelderman, 1998), there have been
concerns about its use as the major measure of information systems success
(Etezadi-Amoli & Farhoomand, 1996; Galletta & Lederer, 1989; Melone, 1990;
Thong & Chee-Sing, 1996).
The appropriateness of user satisfaction as a measure of system effectiveness may be even more questionable in the UDA domain. Users who assess their
own computer applications may be less able to be objective than users who
assess applications developed by others (McGill, Hobbs, Chan, & Khoo, 1998).
The actual development of an application, which may involve a significant
Copyright © 2005, Idea Group Inc. Copying or distributing in print or electronic forms without written
permission of Idea Group Inc. is prohibited.
TEAM LinG
24 McGill
investment of time and creative energy, may be satisfying other needs beyond the
immediate task. User satisfaction with a UDA, therefore, could reflect satisfaction with the (highly personal) development process as much as with the
application itself.
Other proposed measures of information systems success that might be
appropriate for UDAs include system quality, information quality, involvement,
use, individual impact, and organizational impact (DeLone & McLean, 1992;
Seddon, 1997). System quality refers to the quality of an information system, as
opposed to the quality of the information it produces. It is concerned with issues
such as reliability, maintainability, ease of use, and so forth. As this study relates
to the success of a UDA for the eventual user, the user’s perception of system
quality is considered important. Information quality relates to the characteristics
of the information that an information system produces. It includes issues such
as timeliness, accuracy, relevance, and format. As discussed above, improved
information quality has been proposed as one of the major benefits of user
development of applications.
Involvement is defined as “a subjective psychological state, reflecting the
importance and personal relevance of a system to the user” (Barki & Hartwick,
1989, p.53). Seddon and colleagues (Seddon, 1997; Seddon & Kiew, 1996)
included involvement in their extensions to DeLone and McLean’s (1992) model
of information systems success. Use refers to how much an information system
is used. It has been widely used as a measure of organizational information
systems success (Gelderman, 1998; Kim, Suh, & Lee, 1998) but is only
considered appropriate if use of a system is not mandatory (DeLone & McLean,
1992).
Individual impact refers to the effect of an information system on the
behavior or performance of the user. DeLone and McLean (1992) claimed that
individual impact is the most difficult information systems success category to
define in unambiguous terms. For example, the individual impact of an UDA
could be related to a number of measures such as impact on performance,
understanding, decision making, or motivation. Organizational impact refers to
the effect of an information system on organizational performance. According
to DeLone and McLean’s model, the impact of an information system on
individual performance should have some eventual organizational impact. However, the relationship between individual impact and organizational impact is
acknowledged to be complex. Organizational impact is a broad concept, and
there has been a lack of consensus about what organizational effectiveness is
and how it should be measured (Thong & Chee-Sing, 1996). DeLone and
McLean (1992) recognized that difficulties are involved in “isolating the effect
of the I/S effort from the other effects which influence organizational performance” (p. 74). Again, this issue likely is to be magnified in the UDA domain,
where system use may be very local in scope.
Copyright © 2005, Idea Group Inc. Copying or distributing in print or electronic forms without written
permission of Idea Group Inc. is prohibited.
TEAM LinG
The Effect of End User Development on End User Success 25
The fact that vital organizational decision making relies on the individual end
user’s perception of fitness for use suggests that more insight is needed into the
role of application development in the success of applications and that, as well
as user satisfaction, additional measures of success should be considered. This
chapter reports on a study designed to address this need by considering a range
of both perceptual and direct measures of UDA success in the same study and
by isolating the role that actually developing an application plays in the eventual
success of the application.
RESEARCH QUESTIONS
The primary research question investigated in this study was:
Does the process of developing an application enhance the success of that
application for the user developer?
In order to isolate the effect of actually developing an application on its
success for the user, this study compares end user developers using applications
they have developed themselves with end users using applications developed by
another end user, on a number of key variables that have been considered in the
information systems success literature. Spreadsheets are the most commonly
used tool for end user development of applications (Taylor, Moynihan, & WoodHarper, 1998). Therefore, in this study, a decision was made to focus on end
users who develop and use spreadsheet applications.
In a study that investigated the ability of end users to assess the quality of
applications they develop, McGill (2002) found significant differences between
the system quality assessments of end user developers and independent expert
assessors. In particular, the results suggested that end users with little experience might erroneously consider the applications they develop to be of high
quality. If this is the case, then end user developers also may consider their
applications to be of higher quality than do other users. Therefore, it was
hypothesized that:
H1: End user developers will perceive applications they have developed themselves to be of higher system quality than applications developed by another
end user with a similar level of spreadsheet knowledge.
Doll and Torkzadeh (1989) found that end user developers had much higher
levels of involvement with applications than did users who were involved in the
development process, but where the application was primarily developed by a
systems analyst or by another end user. Therefore, it was hypothesized that:
Copyright © 2005, Idea Group Inc. Copying or distributing in print or electronic forms without written
permission of Idea Group Inc. is prohibited.
TEAM LinG
26 McGill
H2: End user developers will have higher levels of involvement with applications they have developed themselves than with applications developed by
another end user with a similar level of spreadsheet knowledge.
End user developers have been found to be more satisfied with applications
they have developed themselves than with applications developed by another end
user (McGill et al., 1998) or with applications developed by a systems analyst
(despite involvement in the systems development process) (Doll & Torkzadeh,
1989). Therefore, it was hypothesized that:
H3: End user developers will have higher levels of user satisfaction when using
applications they have developed themselves than when using applications
developed by another end user with a similar level of spreadsheet knowledge.
Increased user satisfaction has been shown to be associated with increased
individual impact (Etezadi-Amoli & Farhoomand, 1996; Gatian, 1994; Gelderman,
1998; Igbaria & Tan, 1997). As end user developers are believed to be more
satisfied with applications they have developed than are other users of these
applications, it is to be expected that they will also perceive that these applications
have a greater impact on their work. Therefore, it was hypothesized that:
H4: End user developers will have higher levels of perceived individual impact
when using applications they have developed themselves than when using
applications developed by another end user with a similar level of spreadsheet knowledge.
As previously discussed, the end user computing literature has claimed that
end user development leads to more timely access to information, improved
quality of information, and improved decision making (Brancheau & Brown,
1993; Shayo et al., 1999). While this may be partially due to end users having a
better understanding of the problems to be solved by information systems
(Amoroso, 1988), the actual process of developing an application also may lead
to benefits resulting from a superior knowledge of the application. Hence, it was
hypothesized that:
H5: End user developers will make more accurate decisions when using
applications they have developed themselves than when using applications
developed by another end user with a similar level of spreadsheet knowledge.
H6: End user developers will make faster decisions when using applications
they have developed themselves than when using applications developed by
another end user with a similar level of spreadsheet knowledge.
Copyright © 2005, Idea Group Inc. Copying or distributing in print or electronic forms without written
permission of Idea Group Inc. is prohibited.
TEAM LinG
The Effect of End User Development on End User Success 27
METHOD
Participants
The target population for this study was end users who develop their own
applications using spreadsheets. In order to obtain a sample of end user
developers with a wide range of backgrounds, participants were recruited for the
study in a variety of ways. It was recognized that the time required for
participation would make recruitment difficult, so participants were offered a
one-hour training course entitled “Developing Spreadsheet Applications” as an
incentive. This session focused on spreadsheet planning, design, and testing.
They also were given $20 to compensate them for parking costs, gas, and
inconvenience. Recruitment occurred first through a number of advertisements
which were placed in local newspapers calling for volunteers, these werefollowed by e-mails to three large organizations that had expressed interest in the
study, and finally, word of mouth brought forth some additional participants. The
criteria for inclusion in the study was previous experience using Microsoft Excel.
While essentially a convenience sample, the participants covered a broad
spectrum of ages, spreadsheet experience, and training.
Procedure
Fourteen separate experimental sessions of approximately four hours were
held over a period of five months. Each session involved between seven and 17
participants, depending on availability, a total of 159 end users participated. Each
experimental session consisted of three parts (see Table 1). The study used a
within-subjects research design, as this has been shown to provide superior
control for individual subject differences (Maxwell & Delaney, 1990).
In Part 1, participants were asked to complete a questionnaire to provide
demographic information about themselves and information about their back-
Table 1. Experimental session outline
Part
Activities
Approximate
Duration
.5 hour
1
Collect background information and assess spreadsheet knowledge
2
Develop spreadsheets (see Appendix 1 for the problem statement)
3
Use spreadsheets to answer decision questions and complete
perceived system quality, involvement, user satisfaction, and
perceived individual impact questions (see Appendix 2 for the
questionnaire items)
1 hour
4
Training session (see Appendix D)
1 hour
1.5 hours
Copyright © 2005, Idea Group Inc. Copying or distributing in print or electronic forms without written
permission of Idea Group Inc. is prohibited.
TEAM LinG
28 McGill
ground with computers and spreadsheets. The questionnaire also tested their
knowledge of spreadsheets. They were not told the objective of the study.
In Part 2, the participants were given a problem statement and asked to
develop a spreadsheet to solve it using Microsoft Excel. The problem related to
making choices between car rental companies (see Appendix 1 for the problem
statement). Participants were provided with blank paper to use for planning, if
they wished, but otherwise were left to develop the application as they wished.
They were encouraged to treat the development exercise as they would a task
at work rather than as a test. Participants could use online help or ask for
technical help from the two researchers present in the laboratory during each
session.
Once all participants in the session had completed their spreadsheet, they
undertook Part 3 of the session. Each participant was given a floppy disk
containing both the spreadsheet they had developed and a spreadsheet from
another participant in the session. Matching of participants was done on the basis
of the spreadsheet knowledge scores from Part 1 in the expectation that
participants with a similar level of spreadsheet knowledge would develop
spreadsheets of similar sophistication.
To control for presentation order effects, each participant was randomly
assigned to use either the participant’s own spreadsheet or the other participant’s
spreadsheet first. Then, they used the spreadsheet to answer 10 questions
relating to making choices about car rental hire. The time taken to answer these
questions was recorded. Then, they completed a questionnaire containing items
to measure (i.e., perceived system quality, involvement, user satisfaction, and
perceived individual impact). Once the questionnaire and their answers to the car
rental decision questions were collected, the participants then repeated the
process with the other spreadsheet on their floppy disk. A different but
equivalent set of car rental decision questions was used. Eighty participants
ended up using the application they had developed first, and 79 participants used
the other application first.
Instruments
The development of the research instruments for this study involved a
review of many existing survey instruments. To ensure the reliability and validity
of the measures used, previously validated measurement scales were adopted
wherever possible. Factor analysis of the items used to measure the constructs
that were not directly measured was undertaken to examine discriminant validity
of the constructs. Discriminant validity appeared to be satisfactory for all
operationalizations except for user satisfaction and perceived individual impact,
which were highly correlated (r = 0.95, p < 0.000). However, as these
instruments were used in a closely related study on end user success (McGill,
Copyright © 2005, Idea Group Inc. Copying or distributing in print or electronic forms without written
permission of Idea Group Inc. is prohibited.
TEAM LinG
The Effect of End User Development on End User Success 29
Hobbs, & Klobas, 2003) and discriminant validity demonstrated for that study, a
decision was made to accept these operationalizations.
Spreadsheet Application Development Knowledge
Spreadsheet application development knowledge relates to the knowledge
that end user developers make use of when developing UDAs. The instrument
used to measure spreadsheet development knowledge was based upon an
instrument used by McGill and Dixon (2001). That instrument was developed
using material from several sources, including: Kreie’s (1998) instrument to
measure spreadsheet features knowledge; spreadsheet development methodologies from Ronen, Palley, and Lucas (1989), and Salchenberger (1993); and
Rivard et al.’s (1997) instrument to measure the quality of UDAs. The final
instrument contained 25 items. Each item was presented as a multiple-choice
question with five options. In each case, the 5th option was “I don’t know” or “I
am not familiar with this feature.” Nine of the items related to knowledge about
the features and functionality of spreadsheet packages; eight items related to
development process; and eight items related to spreadsheet quality assurance.
The instrument was shown to be reliable with a Cronbach’s alpha of 0.78
(Nunnally, 1978).
Involvement
The involvement construct was operationalized using Barki and Hartwick’s
(1991) instrument. They developed the scale for information systems based on
the general involvement scale proposed by Zaichkowsky (1985). The resulting
scale is a seven-point bi-polar semantic differential scale with 11 items. See
Appendix 2 for a list of the questionnaire items used to measure involvement.
The instrument, as used in this study, was shown to be reliable with a
Cronbach’s alpha of 0.95, and involvement was created as a composite variable
using the factor weights obtained from a measurement model development using
AMOS 3.6.
Perceived System Quality
The items used to measure perceived system quality were obtained from the
instrument developed by Rivard et al. (1997) to assess the quality of UDAs.
Rivard et al.’s instrument was designed to be suitable for end user developers
to complete yet sufficiently deep to capture their perceptions of components of
quality. For this study, items that were not appropriate for the applications under
consideration (e.g., specific to database applications) were excluded. Minor
adaptations to wording were also made to reflect the environment in which
application development and use occurred. The resulting perceived system
quality scale consisted of 20 items, each scored on a Likert scale of 1 to 7 where
Copyright © 2005, Idea Group Inc. Copying or distributing in print or electronic forms without written
permission of Idea Group Inc. is prohibited.
TEAM LinG
30 McGill
1 was “strongly agree” and 7 was “strongly disagree” (see Appendix 2 for a list
of the questionnaire items used to measure perceived system quality).
The instrument was shown to be reliable with a Cronbach’s alpha of 0.94,
and perceived system quality was created as a composite variable using the
factor weights obtained from measurement model development using AMOS
3.6.
User Satisfaction
Given the confounding of user satisfaction with information quality and
system quality in some previous studies (Seddon & Kiew, 1996), items measuring
only user satisfaction were sought. Seddon and Yip’s (1992) four-item sevenpoint semantic differential scale that attempts to measure user satisfaction
directly was used in this study. A typical item on this scale is “How effective is
the system?” measured from 1 as “effective” to 7 as “ineffective” (see
Appendix 2 for a list of the questionnaire items used to measure user satisfaction).
The instrument was shown to be reliable with a Cronbach’s alpha of 0.96,
and user satisfaction was created as a composite variable using the factor
weights obtained from a one-factor congeneric measurement model developed
using AMOS 3.6.
Individual Impact
In this study, it was explicitly recognized that an individual’s perception of
the impact of an information system on the individual’s performance might not
be consistent with other direct measures of individual impact, and, hence, three
measures of individual impact were included in the study. These were individual
impact as perceived by the end user, accuracy of decision making, and time taken
to answer a set of questions.
Perceived individual impact was measured using items derived from Goodhue
and Thompson (1995) in their study on user evaluations of systems as surrogates
for objective performance. The instrument was shown to be reliable with a
Cronbach’s alpha of 0.96 (see Appendix 2 for a list of the questionnaire items
used to measure perceived individual impact).
In addition to the end user’s perception of individual impact, two direct,
easily quantifiable aspects of individual impact were also measured. These
aspects—decision accuracy and time taken to answer a set of question—also
were used by Goodhue, Klein, and March (2000) in their study on user
evaluations of systems.
Two sets of 10 different but equivalent questions involving the comparison
of costs of car rental companies under a variety of scenarios were created. The
questions ranged from comparison of the three firms when no excess mileage
charges are imposed to questions where excesses are applied and basic
Copyright © 2005, Idea Group Inc. Copying or distributing in print or electronic forms without written
permission of Idea Group Inc. is prohibited.
TEAM LinG
The Effect of End User Development on End User Success 31
parameters are assumed to have changed from those given in the original
problem description. A typical question is, “Which rental company is the
cheapest if you wish to hire a car for six days and drive approximately 100 miles
with it?” Participants were asked to provide both the name of the cheapest firm
and its cost. The questions were piloted by four end users, and slight changes
were made to clarify them. The equivalent of the two sets of questions in terms
of difficulty and time to complete also were confirmed by measuring the time
taken to answer each set using the four applications created during piloting of the
task.
RESULTS
Of the 159 participants, 32.7% were male and 67.3% were female (52
males, 107 females). Their ages ranged from 14 to 77 with an average age of
42.7. Participants reported an average of 4.5 years experience using spreadsheets (with a range from 0 to 21 years). One hundred and twelve (70.4%)
reported using spreadsheets at work, and 92 (57.9%) reported using spreadsheets for personal use.
Table 2 provides descriptive information about each of the variables of
interest. Data analysis was undertaken using MANOVA. Pillai’s Trace (F =
5.45; df = 6, 306; p < 0.001), indicated that there was a significant multivariate
effect for being the developer. Each of the hypotheses was then addressed using
univariate F-tests (see Table 2). As a number of comparisons were being made,
the level of significance was conservatively set at 0.01.
End users perceived applications they had developed themselves to be of
higher quality than applications developed by other end users. On average, there
was a 16.6% difference in perceived quality when the developer was assessing
his or her own application. This increase was significant (F = 17.96; df = 1, 311;
p < 0.001). End user developers also were significantly more involved with their
own applications (F= 12.42; df = 1, 311; p < 0.001) and significantly more
Table 2. End user developer perceptions and performance when using their
own or another application
Perceived system
quality
Involvement
User satisfaction
Perceived individual
impact
Number of decisions
correct (/10)
Time to make
decisions (minutes)
Developer + User
Mean Std. dev
N
4.64
1.27 157
User Only
Mean Std. dev
N
3.98
1.48 156
Comparison
% incr.
Sign.
16.6
<0.001
9.36
4.44
9.38
2.73
1.86
3.94
157
157
157
8.17
3.63
7.26
3.20
2.07
4.30
156
156
156
14.6
22.3
29.2
<0.001
<0.001
<0.001
4.43
3.33
157
3.47
3.22
156
27.7
0.010
17.75
10.00
157
15.31
7.22
156
15.9
0.014
Copyright © 2005, Idea Group Inc. Copying or distributing in print or electronic forms without written
permission of Idea Group Inc. is prohibited.
TEAM LinG
32 McGill
satisfied with them (F = 13.22; df = 1, 311; p < 0.001). The average difference
in involvement if the user was also the developer was 14.6%, and the average
difference in user satisfaction was 22.3%. Thus, Hypotheses 1 through 3 were
supported.
End users perceived applications they had developed themselves as having
a significantly greater impact on their decision performance (F = 20.65; df = 1,
311; p < 0.001), which was confirmed as they made a significantly larger number
of correct decisions (F = 6.70; df = 1, 311; p = 0.010). The average difference
in perceived individual impact of the application was 29.2%, and the average
difference in the number of decisions correct was 27.7%. Thus, Hypotheses 4
and 5 were supported. It was also hypothesized that end user developers would
make faster decisions when using the application they had developed themselves. However, this hypothesis was not supported. End users took longer on
average to answer the questions using their application (F = 6.10; df = 1, 311; p
= 0.014). On average, the difference in decision time was 15.8%.
DISCUSSION
The results of this study suggest that the process of developing an
application predisposes an end user developer to be more satisfied with the
application than if it were developed by another end user, and also leads them to
perform better with the application than if it were developed by another end user.
While previous research has established the positive impact of the process of end
user development on subjective measures such as involvement (Doll & Torkzadeh,
1989) and user satisfaction (Doll & Torkzadeh, 1989; McGill et al., 1998), its
impact on directly measured performance previously has not been established.
The results of this study highlight the contribution of the process of application
development to application success. This contribution appears to be beyond the
advantages achieved by an increased knowledge of the problem situation, as, in
this study, the effects of domain knowledge were controlled for by the withinsubjects design. Thus, end user developers benefit not only from better understanding of the problem to be solved (Amoroso, 1988), but also from the process
of application development.
The end user developers in this study had significantly higher levels of
involvement, user satisfaction, and perceived individual impact when using
applications they had developed themselves than they did when using applications developed by another end user with approximately the same levels of
spreadsheet development knowledge. They also perceived their applications to
be of higher system quality. These results are consistent with the results in the
literature on user involvement in the development of organizational systems. For
example, Doll and Torkzadeh (1988) found user participation in design to be
positively correlated with end user computing satisfaction, and Lawrence and
Copyright © 2005, Idea Group Inc. Copying or distributing in print or electronic forms without written
permission of Idea Group Inc. is prohibited.
TEAM LinG
The Effect of End User Development on End User Success 33
Low (1993) found that the more users felt involved with the development
process, the more satisfied they were with the system. The results are also
consistent with McGill et al.’s (1998) study in the end user developer domain,
where end user developers were found to be more satisfied with their own
applications.
The results also strongly support Cheney, Mann, and Amoroso’s (1986)
claim that end user development can be considered as the ultimate user
involvement. The higher levels of perceived system quality for end users’ own
applications highlight the subjectivity of system quality for end users. This issue
has been raised by Huitfeldt and Middleton (2001) who argued that the standard
system quality criteria are oriented toward information technology maintenance
staff rather than toward end users and that “it is still difficult for an end user, or
software development client, to evaluate the quality of the delivered product” (p.
3). Although the instrument used to measure perceived system quality in this
study was designed specifically for end users (Rivard et al., 1997), informal
feedback from participants suggests that they found quality assessment a
difficult task. In contrast to software engineering definitions of system quality
(Boehm et al., 1978; Cavano & McCall, 1978), Amoroso and Cheney (1992)
implicitly acknowledge this difficulty by defining UDA quality as a combination
of end user information satisfaction and application utilization. This, however,
ignores the underlying necessity for the more technical dimensions of system
quality to be taken account of in order to have reliable and maintainable
applications.
End user developers made significantly more correct decisions when using
their own applications than when using an application developed by another end
user. In this study, all participants had been provided with the same problem
statement, and all had spent time considering the problem in order to develop an
application. All participants also had used both the application they had developed and another application, so domain knowledge was not a factor. The
improved performance could be due to a greater familiarity with the application
itself, achieved through the development process. Successful use of user
developed spreadsheet applications appears to require substantial end user
knowledge because of the lack of separation of data and processing that is
commonly found (Hall, 1996; Ronen et al., 1989). Users of UDAs usually do not
receive formal training in the particular application; yet training is associated with
successful use (Nelson, 1991). Developing an application allows the user to
develop a robust understanding of it that makes it easier to use and makes it
possible for them to successfully adjust aspects of it when necessary. The
development process can be seen as a form of training for future use of the
application and can circumvent problems that might otherwise occur because of
lack of training and/or documentation.
The improved performance also could be due to a greater determination to
achieve the correct answers because of the higher levels of involvement. This
Copyright © 2005, Idea Group Inc. Copying or distributing in print or electronic forms without written
permission of Idea Group Inc. is prohibited.
TEAM LinG
34 McGill
explanation receives support from the additional time user developers spent
making the decisions. On average, the user developers spent an extra two and
a half minutes trying to answer the 10 questions. This was unexpected, as it
would be logical to expect end users to spend less time using the applications they
understand best, but it may be due to the end user developer’s greater
commitment to succeeding with his or her own application. Comments from
participants during the sessions support this possible explanation. In addition,
many participants continued working on their applications, once the formal part
of the experiment was completed; some even continued to adapt their applications over a number of days.
McGill et al. (1998) questioned the usefulness of user satisfaction as a
measure of UDA success after finding that developers of UDAs were significantly more satisfied with applications that they had developed than other end
users were with the same applications. They speculated that increased satisfaction might be a reflection of the role of attitude in maintaining self- esteem, and
expressed concerns that this increased satisfaction might blind end user developers to problems that exist in the applications that they have developed.
However, no measures of performance were included in that study. This study
suggests that the raised levels of user satisfaction and other perceptual variables
were appropriate, as they were consistent with better levels of performance.
Both subjective and direct measures of UDA success have an important
role to play in research on user development of applications. Shayo et al. (1999)
noted that subjective measures are less threatening and easier to obtain, thus
making end user computing research easier to conduct. Subjective measures
also can reflect a wider range of success factors than can be captured using
direct measures such as decision accuracy. However, exclusive use of subjective measures can be problematic, because users are asked to place a value on
something about which they may not be objective. By including both types of
measures, this study has demonstrated a range of benefits attributable to end
user development and has provided a measure of confidence that increases in
subjective measures that also are associated with increases in some direct
measures.
The results of this comparison between end user developers using their own
applications and end users using applications developed by other end users has
implications for staff movement in organizations. If an end user develops an
application for his or her own use, and its use has a positive impact on
performance, this does not guarantee that the same will be true if another end
user starts to use it. Organizations should recognize that the use of UDAs by end
users other than the developer may carry with it greater risks. If an end user
developer has developed an application for his or her own use and then leaves
the position or organization, it cannot be assumed that another end user
necessarily will be able to use it successfully. In addition, if users are developing
Copyright © 2005, Idea Group Inc. Copying or distributing in print or electronic forms without written
permission of Idea Group Inc. is prohibited.
TEAM LinG
The Effect of End User Development on End User Success 35
applications for others to use, particular attention must be paid to ensure that
these applications are of sufficient quality for successful use not to rely on
additional insight gained during the development process. As previously discussed, the development process provides a form of preparation for future use
of an application and may reduce dependence on training and documentation.
However, users of a UDA who were not involved in its development still rely
heavily on documentation and training, and the importance of them must be
emphasized.
Several limitations of the research are apparent and should be considered
in future investigations of end user development success. First, the only
application development tool considered was spreadsheets. While spreadsheets
have been the most commonly used end user application development tool
(Taylor et al., 1998), the generalizability of the results to users of other
development tools (i.e., database management systems and Web development
tools) needs to be investigated in future research. A second limitation of the
research was the constraints resulting from the use of a laboratory experiment
research approach. The spreadsheets that participants developed were probably
smaller than the majority of spreadsheets developed by users in support of
organizational decision making (Hall, 1996). In addition, because of the finite
nature of the experiment, end users did not have the same incentive to succeed
as would be expected in a work situation. The artificial nature of the environment
and task may have influenced the results. While the research situation chosen
provided the benefit of control of external variability and, hence, internal validity,
it was not ideal in terms of providing external validity. It would be valuable to
undertake a field study in a range of organizations to extend the external validity
of the research.
CONCLUSION
In conclusion, this study suggests that the process of developing an
application leads to significant advantages for the end user developer. In the past,
the proposed benefits of user development of applications have been attributed
mainly to a belief that the user has a superior understanding of the problem to be
solved by the application system (Amoroso, 1988). In this study, all end users
should have had equal knowledge and understanding of the problem when using
both the application they had developed and the other application, so any
differences in domain knowledge were not a factor.
The relative success of the end user developers when using their own
applications in this study may flow from their superior knowledge of their own
applications, thus confirming one of the proposed advantages of user involvement in organizational information systems development. The advantage of
superior knowledge of the application is likely to be particularly important with
Copyright © 2005, Idea Group Inc. Copying or distributing in print or electronic forms without written
permission of Idea Group Inc. is prohibited.
TEAM LinG
36 McGill
spreadsheet applications where data and processing are usually integrated (Hall,
1996; Ronen et al., 1989). Future research should investigate whether these
findings also hold when other application development tools are used and with
other groups of end user developers.
There have been concerns expressed in the literature about user development of applications as an inefficient use of personnel time, distracting end users
from what they are supposed to be doing (Alavi & Weiss, 1985-1986; Davis &
Srinivasan, 1988; O’Donnell & March, 1987). However, this study suggests that
the potential risk of inefficient use of personnel time may be compensated for by
superior decision making later, based upon insights gained from system development. While development of applications by more experienced user developers
or by information systems professionals may ensure a more reliable and
maintainable application (Edberg & Bowman, 1996), end user development
currently is a pervasive form of organizational system development, and it is
encouraging to identify this benefit of it. However, the findings relating to
differences in end user success between those who have developed the
application they are using and those who haven’t emphasize that organizations
should recognise that the use of UDAs by end users other than the developer may
carry with it greater risks, and that these must be addressed by particular
attention to documentation of applications and training for other users. It is not
appropriate that successful use relies on insight gained during the development
process. UDAs must be sufficiently robust and reliable to be used by a wide
range of users.
REFERENCES
Alavi, M., & Weiss, I.R. (1985-1986). Managing the risks associated with enduser computing. Journal of Management Information Systems, 2(3), 5-20.
Amoroso, D.L. (1988). Organizational issues of end-user computing. Data
Base, 19(Winter/Fall), 49-57.
Amoroso, D.L., & Cheney, P.H. (1992). Quality end user-developed applications: Some essential ingredients. Data Base, 23(1), 1-11.
Barki, H., & Hartwick, J. (1989). Rethinking the concept of user involvement.
MIS Quarterly, 13(March), 52-63.
Barki, H., & Hartwick, J. (1991). User participation and user involvement in
information system development. Proceedings of the Twenty-Fourth
Annual Hawaii International Conference on System Sciences, 4, 487492.
Barki, H., & Hartwick, J. (1994). Measuring user participation, user involvement, and user attitude. MIS Quarterly, 18(1), 59-79.
Bergeron, F., & Berube, C. (1988). The management of the end-user environment:
An empirical investigation. Information & Management, 14, 107-113.
Copyright © 2005, Idea Group Inc. Copying or distributing in print or electronic forms without written
permission of Idea Group Inc. is prohibited.
TEAM LinG
The Effect of End User Development on End User Success 37
Boehm, B.W., Brown, J.R., Caspar, H., Lipow, M., MacLeod, E.J., & Merritt,
M.J. (1978). Characteristics of software quality. Amsterdam: NorthHolland.
Brancheau, J.C., & Brown, C.V. (1993). The management of end-user computing: Status and directions. ACM Computing Surveys, 25(4), 450-482.
Cale, E.G. (1994). Quality issues for end-user developed software. Journal of
Systems Management (January), 36-39.
Cavano, J.P., & McCall, J.A. (1978). A framework for the measurement of
software quality. Proceedings of the Software Quality and Assurance
Workshop, 133-140.
Cheney, P.H., Mann, R.I., & Amoroso, D.L. (1986). Organizational factors
affecting the success of end-user computing. Journal of Management
Information Systems, 3(1), 65-80.
Davis, J., & Srinivasan, A. (1988). Incorporating user diversity into information
system assessment. In N. Bjorn-Andersen & G. Davis (Eds.), Information
systems assessment (pp. 83-98). New York: Knowledge Industry.
DeLone, W.H., & McLean, E.R. (1992). Information systems success: The quest
for the dependent variable. Information Systems Research, 3(1), 60-95.
Doll, W.J., & Torkzadeh, G. (1988). The measurement of end-user computing
satisfaction. MIS Quarterly, 12(2), 259-274.
Doll, W.J., & Torkzadeh, G. (1989). A discrepancy model of end-user computing
involvement. Management Science, 35(10), 1151-1171.
Edberg, D.T., & Bowman, B.J. (1996). User-developed applications: An empirical study of application quality and developer productivity. Journal of
Management Information Systems, 13(1), 167-185.
Etezadi-Amoli, J., & Farhoomand, A.F. (1996). A structural model of end user
computing satisfaction and user performance. Information & Management, 30, 65-73.
Galletta, D.F., & Lederer, A.L. (1989). Some cautions on the measurement of
user information satisfaction. Decision Sciences, 20, 419-438.
Gatian, A.W. (1994). Is user satisfaction a valid measure of system effectiveness? Information & Management, 26, 119-131.
Gelderman, M. (1998). The relation between user satisfaction, usage of information systems and performance. Information & Management, 34, 1118.
Goodhue, D.L., Klein, B.D., & March, S.T. (2000). User evaluations of IS as
surrogates for objective performance. Information & Management, 38,
87-101.
Goodhue, D.L., & Thompson, R.L. (1995). Task-technology fit and individual
performance. MIS Quarterly, 19(2), 213-236.
Hall, M.J.J. (1996). A risk and control oriented study of the practices of
spreadsheet application developers. Proceedings of the Twenty-Ninth
Hawaii International Conference on System Sciences, 364-373.
Copyright © 2005, Idea Group Inc. Copying or distributing in print or electronic forms without written
permission of Idea Group Inc. is prohibited.
TEAM LinG
38 McGill
Huitfeldt, B., & Middleton, M. (2001). The assessment of software quality from
the user perspective: Evaluation of a GIS implementation. Journal of End
User Computing, 13(1), 3-11.
Igbaria, M., & Tan, M. (1997). The consequences of information technology
acceptance on subsequent individual performance. Information & Management, 32(3), 113-121.
Jawahar, I.M., & Elango, B. (2001). The effect of attitudes, goal setting and selfefficacy on end user performance. Journal of End User Computing,
13(3), 40-45.
Kim, C., Suh, K., & Lee, J. (1998). Utilization and user satisfaction in end-user
computing: A task contingent model. Information Resources Management Journal, 11(4), 11-24.
Kreie, J. (1998). On the improvement of end-user developed systems using
systems analysis and design. Unpublished Ph.D, University of Arkansas.
Lawrence, M., & Low, G. (1993). Exploring individual user satisfaction within
user-led development. MIS Quarterly, 17(2), 195-208.
Lin, W.T., & Shao, B.B.M. (2000). The relationship between user participation
and system success: A simultaneous contingency approach. Information
& Management, 37, 283-295.
Maxwell, S.E., & Delaney, H.D. (1990). Designing experiments and analyzing data. Belmont, CA: Wadsworth Publishing Company.
McGill, T., Hobbs, V., & Klobas, J. (2003). User developed applications and
information systems success: A test of DeLone and McLean’s model.
Information Resources Management Journal, 16(1), 24-45.
McGill, T.J. (2002). User developed applications: Can end users assess quality?
Journal of End User Computing, 14(3), 1-15.
McGill, T.J., & Dixon, M.W. (2001). Spreadsheet knowledge: An exploratory
study. Proceedings of the 2001 IRMA International Conference:
Managing Information in a Global Economy (pp. 621-625).
McGill, T.J., Hobbs, V.J., Chan, R., & Khoo, D. (1998). User satisfaction as a
measure of success in end user application development: An empirical
investigation. In M. Khosrowpour (Ed.), Proceedings of the 1998 IRMA
Conference (pp. 352-357). Boston, MA: Idea Group Publishing.
McLean, E.R., Kappelman, L.A., & Thompson, J.P. (1993). Converging enduser and corporate computing. Communications of the ACM, 36(12), 7992.
Melone, N.P. (1990). A theoretical assessment of the user-satisfaction construct in information systems research. Management Science, 36(1), 7691.
Nelson, R.R. (1991). Educational needs as perceived by IS and end-user
personnel: A survey of knowledge and skill requirements. MIS Quarterly,
15(4), 503-525.
Copyright © 2005, Idea Group Inc. Copying or distributing in print or electronic forms without written
permission of Idea Group Inc. is prohibited.
TEAM LinG
The Effect of End User Development on End User Success 39
Nelson, R.R., & Todd, P. (1999). Strategies for managing EUC on the Web.
Journal of End User Computing, 11(1), 24-31.
Nunnally, J.C. (1978). Psychometric theory. New York: McGraw-Hill.
O’Donnell, D., & March, S. (1987). End user computing environments—Finding
a balance between productivity and control. Information & Management,
13(1), 77-84.
Ouellette, T. (1999, July 26). Giving users the keys to their Web content.
Computerworld, 66-67.
Panko, R.R., & Halverson, R.P. (1996). Spreadsheets on trial: A survey of
research on spreadsheet risks. Proceedings of the Twenty-Ninth Hawaii
International Conference on System Sciences, 2, 326-335.
Rittenberg, L.E., Senn, A., & Bariff, M. (1990). Audit and control of end-user
computing. Altamonte Springs, FL: The Institute of Internal Auditors
Research Foundation.
Rivard, S., Poirier, G., Raymond, L., & Bergeron, F. (1997). Development of a
measure to assess the quality of user-developed applications. The DATA
BASE for Advances in Information Systems, 28(3), 44-58.
Ronen, B., Palley, M.A., & Lucas, H.C. (1989). Spreadsheet analysis and
design. Communications of the ACM, 32(1), 84-93.
Salchenberger, L. (1993). Structured development techniques for user-developed systems. Information & Management, 24, 41-50.
Seddon, P.B. (1997). A re-specification and extension of the Delone and
McLean model of IS success. Information Systems Research, 8(3), 240253.
Seddon, P.B., & Kiew, M.Y. (1996). A partial test and development of Delone
and McLeans model of IS success. Australian Journal of Information
Systems, 4(1), 90-109.
Seddon, P.B., & Yip, S.K. (1992). An empirical evaluation of user information
satisfaction (UIS) measures for use with general ledger accounting software. Journal of Information Systems, 6(1), 75-92.
Shayo, C., Guthrie, R., & Igbaria, M. (1999). Exploring the measurement of end
user computing success. Journal of End User Computing, 11(1), 5-14.
Taylor, M.J., Moynihan, E.P., & Wood-Harper, A.T. (1998). End-user computing and information systems methodologies. Information Systems Journal, 8, 85-96.
Thong, J.Y.L., & Chee-Sing, Y. (1996). Information systems effectiveness: A
user satisfaction approach. Information Processing and Management,
12(5), 601-610.
Zaichkowsky, J.L. (1985). Measuring the involvement construct. Journal of
Consumer Research, 12, 341-352.
Copyright © 2005, Idea Group Inc. Copying or distributing in print or electronic forms without written
permission of Idea Group Inc. is prohibited.
TEAM LinG
40 McGill
APPENDIX 1
The Problem Statement Given to Participants in Part 2
of the Experimental Session
CAR RENTAL PROBLEM
Deciding which car rental company to choose when planning a holiday can be quite difficult. A local
consumer group has asked you to set up a spreadsheet to help people make decisions about car rental
options. The spreadsheet will enable users to determine which company provides the cheapest option for
them, given how long they need to hire a car and how much driving they intend to do.
After investigating the charges of the major companies, you have the following information about the
options for hiring a compact size car in Australia.
•
•
•
Advantage Car Rentals charges $35 per day for up to 50 miles per day. Extra driving beyond 50 miles
per day is charged at $0.25/mi.
OnRoad Rentals charges $41 per day. This rate includes 100 free miles per day. Extra miles beyond
that are charged at the rate of $0.30/mi.
Prestige Rent-A-Car charges $64 per day for unlimited miles.
Your task is to create a spreadsheet that will allow you or someone else using it to type in the number of
days they will need the car and the number of miles they expect to drive over the time of the rental. The
spreadsheet should then display the rental cost for each of the above three companies.
APPENDIX 2
Items Included in Questionnaire to Measure End User
Perceptions
Perceived system quality
strongly
disagree
1 2
Using the spreadsheet would be easy, even after a long period of not
using it
Errors in the spreadsheet are easy to identify
The spreadsheet increased my data processing capacity
The spreadsheet is easy to learn by new users
Should an error occur, the spreadsheet makes it straightforward to perform
some checking in order to locate the source of the error
The data entry sections provide the capability to easily make corrections to
data
The same terminology is used throughout the spreadsheet
This spreadsheet does not contain any errors
The terms used in the spreadsheet are familiar to users
Data entry sections of the spreadsheet are organized so that the different bits
of data are grouped together in a logical way
The data entry areas clearly show the spaces reserved to record the data
The format of a given piece of information is always the same, whereever it
is used in the spreadsheet
Data is labeled so that they can be easily matched with other parts of the
3
4
5
strongly
agree
6 7
1
1
1
1
2
2
2
2
3
3
3
3
4
4
4
4
5
5
5
5
6
6
6
6
7
7
7
7
1
2
3
4
5
6
7
1
1
1
1
2
2
2
2
3
3
3
3
4
4
4
4
5
5
5
5
6
6
6
6
7
7
7
7
1
1
2
2
3
3
4
4
5
5
6
6
7
7
1
2
3
4
5
6
7
Copyright © 2005, Idea Group Inc. Copying or distributing in print or electronic forms without written
permission of Idea Group Inc. is prohibited.
TEAM LinG
The Effect of End User Development on End User Success 41
Data is labeled so that they can be easily matched with other parts of the
spreadsheet
The spreadsheet is broken up into separate and independent sections
Use of this spreadsheet would reduce the number of errors you make when
choosing a rental car
Each section has a unique function or purpose
Each section includes enough information to help you understand what it is
doing
Queries are easy to make
The spreadsheet provides all the information required to use the spreadsheet
(this is called documentation)
Corrections to errors in the spreadsheet are easy to make
1
2
3
4
5
6
7
1
1
2
2
3
3
4
4
5
5
6
6
7
7
1
1
2
2
3
3
4
4
5
5
6
6
7
7
1
1
2
2
3
3
4
4
5
5
6
6
7
7
1
2
3
4
5
6
7
Involvement
This car rental spreadsheet is:
unimportant
not needed
nonessential
trivial
insignificant
meaningless to me
unexciting
of no concern to me
not of interest to me
irrelevant to me
not making a
difference to me
1
1
1
1
1
1
1
1
1
1
1
2
2
2
2
2
2
2
2
2
2
2
3
3
3
3
3
3
3
3
3
3
3
User Satisfaction
How adequately do you feel the
spreadsheet meets your information
processing needs when answering car
rental queries?
How efficient is the spreadsheet?
How effective is the spreadsheet?
Overall, are you satisfied with the
spreadsheet?
Perceived Individual Impact
The spreadsheet has a largely positive
impact on my effectiveness and
productivity in answering car rental queries.
The spreadsheet is an important and
valuable aid to me in answering car rental
queries.
4
4
4
4
4
4
4
4
4
4
4
5
5
5
5
5
5
5
5
5
5
5
6
6
6
6
6
6
6
6
6
6
6
7
7
7
7
7
7
7
7
7
7
7
inadequately 1
inefficient 1
ineffective 1
dissatisfied 1
important
needed
essential
fundamental
significant
meaningful to me
exciting
of concern to me
of interest to me
relevant to me
making a
difference to me
2 3 4 5 6 7 adequately
2 3 4 5 6 7 efficient
2 3 4 5 6 7 effective
2 3 4 5 6 7 satisfied
disagree 1 2
3 4 5 6 7 agree
disagree 1 2
3 4 5 6 7 agree
Copyright © 2005, Idea Group Inc. Copying or distributing in print or electronic forms without written
permission of Idea Group Inc. is prohibited.
TEAM LinG
42 Staples and Seddon
Chapter III
Testing the
Technology-to-Performance
Chain Model
D. Sandy Staples, Queen's University, Canada
Peter B. Seddon, The University of Melbourne, Australia
ABSTRACT
Goodhue and Thompson (1995) proposed the Technology-to-Performance
Chain (TPC) model in 1995 to help end-users and organizations understand
and make more effective use of information technology. The TPC model
combines insights from research on user attitudes as predictors of utilization
and insights from research on task-technology fit as a predictor of
performance. In this chapter, the TPC model was tested in two settings—
voluntary use and mandatory use. In both settings, strong support was
found for the impact of task-technology fit on performance as well as on
attitudes and beliefs about use. Social norms also had a significant impact
on utilization in the mandatory use setting. Beliefs about use only had a
significant impact on utilization in the voluntary use setting. Overall, the
results found support for the predictive power of the TPC model; however,
the results show that the relationships among the constructs in the model
will vary, depending on whether or not the users have a choice to use the
system.
Copyright © 2005, Idea Group Inc. Copying or distributing in print or electronic forms without written
permission of Idea Group Inc. is prohibited.
TEAM LinG
Testing the Technology-to-Performance Chain Model 43
INTRODUCTION
The purpose of the study reported in this chapter was to test the TPC
proposed by Goodhue and Thompson (1995) in their 1995 paper published in MIS
Quarterly. The TPC model seeks to predict the impact of an information system
on an individual user’s performance. One of the main objectives of information
systems research is to help end users and organizations make more effective use
of information technology. Understanding and measuring the success of investments in information systems is important to both researchers and practitioners.
Practitioners naturally want to learn about ways to make their investments more
effective and ways to improve their decision making about which investments to
make. Researchers desire to build and test theories that explain and predict
performance. The TPC model potentially helps us do that; however, it has not
been tested fully. Contributing to the understanding of the predictive validity of
the TPC is our goal in this chapter.
Goodhue and Thompson’s (1995) TPC model (see Figure 1) combined
insights from research on user attitudes as predictors of utilization and insights
from research on task-technology fit as a predictor of performance. Past
research on user attitudes as predictors of utilization is largely based on theories
of attitudes and behavior (Fishbein & Ajzen, 1975; Triandis, 1980). Aspects of
information technology lead to user attitudes about the system, and these
attitudes, along with social norms and other situational factors, lead to utilization.
Task-technology fit theory suggests that information systems affect performance, depending on the fit or correspondence between the task requirements
of the users and the functionality of the system. Task-technology fit theory also
suggests that the impact on performance depends on the fit between individual
characteristics of the users and functionality of the system. The basic argument
of the model is that for an information technology to have a positive impact on
individual performance, the technology must fit with the tasks it is supposed to
support, and it has to be used (Goodhue & Thompson, 1995).
Goodhue (1995) and Goodhue and Thompson (1995) tested part of the TPC
model (see the dotted paths in Figure 1). They found support for the link between
task-technology fit and performance impacts, as well as some support for the
proposed antecedents of task-technology fit. They did not test the linkages proposed
in their model between task-technology fit and the precursors of utilization, which
is one of the main objectives of our chapter. Our chapter builds on Goodhue’s
work and adds to it by investigating additional links in the TPC that have not been
explored previously. Although the impact of task-technology fit has been
investigated by several researchers in various settings (Dishaw & Strong, 1998a,
1998b; Ferratt & Vlahos, 1998; Goodhue, Klein, & March, 2000; Goodhue,
Littlefield, & Straub, 1997; Kanellis, Lycett, & Paul, 1999; Lim & Benbasat,
2000; Pendharkar, Rodger, & Khosrwopour, 2001; Shirani, Tafti, & Affisco,
1999), no one of whom we are aware has tested directly the proposed TPC model.
Copyright © 2005, Idea Group Inc. Copying or distributing in print or electronic forms without written
permission of Idea Group Inc. is prohibited.
TEAM LinG
44 Staples and Seddon
Figure 1. Goodhue and Thompson’s technology-to-performance chain
model (adapted from Goodhue & Thompson, 1995, p. 216)
Task
Characteristics
Technology
Characteristics
Task
Technology
Fit
Performance
Impacts
Individual
Characteristics
Precursors of Utilization:
-Expected Consequences of
Use (beliefs)
-Affect Toward Use
-Social Norms
-Habit
-Facilitating Conditions
Utilization
Dotted lines show the
paths tested by Goodhue
& Thompson, 1995
Referring to the link between users’ evaluations of task-technology fit and
performance, Goodhue (1998) suggested:
Conceptual and empirical research is needed critically to address the issue
of whether there is a link, and, if so, under what circumstances it is strong
or weak (p. 128).
Our study meets this call for research by examining this link (along with
other aspects of the TPC model) and does so in two important contexts—
voluntary use and mandatory use. In mandatory use settings, Goodhue and
Thompson (1995) suggested that the fit of the system and its tasks and individual
characteristics, as well as the social norms, may be the key drivers on
performance. Where use is voluntary, Goodhue and Thompson (1995) suggested
that the individual’s beliefs and feelings should play a stronger role than fit of the
system. Their suggestions imply that the strength of the relationships in the TPC
model should vary for the two different use conditions. We examine the validity
of these suggestions in this study.
The next section will describe our research model and present the associated hypotheses that were tested. The research design and methodology is
described in the third section, followed by a description of the results. The final
section discusses the results and offers suggestions for future research.
Copyright © 2005, Idea Group Inc. Copying or distributing in print or electronic forms without written
permission of Idea Group Inc. is prohibited.
TEAM LinG
Testing the Technology-to-Performance Chain Model 45
THE RESEARCH MODEL AND HYPOTHESES
The research model tested in this chapter is illustrated in Figure 2.
Specifically, the relationships between user evaluations of task-technology fit
and perceived performance expected consequences of use and users’ affect
toward using the system are examined. The impact of expected consequences
of use, affect toward use, social norms, and one specific potential facilitating
condition (i.e., support staff effectiveness) on utilization (i.e., use of the system)
also are examined in the analysis. Finally, the linkage between utilization and
perceived performance will be examined. First, we describe the reasoning
behind the relationships specified in the model and then describe how these
relationships are expected to vary for voluntary versus mandatory users. For
brevity, we summarize Goodhue & Thompson’s (1995) arguments in our
presentation of the hypotheses. Readers who want more background on the
model are pointed to their original article. The antecedents of task-technology fit
(i.e., interactions between task, technology, and individual characteristics) are
not tested in this study. Support has been found in previous studies (Goodhue,
1995; Goodhue & Thompson, 1995) for that part of the TPC model.
Consistent with Orlikowski and Iacono’s (2001) classifications of technology as both tool and perception, Goodhue and Thompson (1995) define tasktechnology fit (TTF) as follows:
… the degree to which a technology assists an individual in performing his
or her portfolio of tasks. More specifically, TTF is the correspondence
Figure 2. The research model
Expected
Consequences
of Use
H1
H4
H3
Performance
Impacts
Affect
Toward
Use
Social
Norms
H2
Task
Technology
Fit
H8
H5
Utilization
H6
H7
Facilitating
Conditions
Precursors of Utilization
Copyright © 2005, Idea Group Inc. Copying or distributing in print or electronic forms without written
permission of Idea Group Inc. is prohibited.
TEAM LinG
46 Staples and Seddon
between task requirements, individual abilities, and the functionality of the
technology. (Goodhue & Thompson, 1995, pp. 216-218)
Fitness for task can be assessed in two ways. One is to identify important
facets of the task requirements and assess whether the proposed tool—in the
hands of the intended user—meets each of these facet-of-task requirements.
We call this the facets-of-fit approach to assessing task-technology fit. The other
is to predict the outcomes of tool use—again, in the hands of the intended user—
and see if they are as desired. We call this the predicted-outcomes approach to
assessing fit. The following example illustrates these two approaches to measuring fit. Suppose the task is to cook spaghetti, and three sets of tools are being
considered. Potential Toolset One is a large metal pot and a gas cooker; Toolset
Two is a small metal pot and flame thrower; Toolset Three is a large plastic bowl
and an open fire. The facets-of-fit approach to assessing fit would involve asking
whether certain key facets of the task requirements are met. For cooking
spaghetti, these might be (a) the container should hold sufficient water; (b) there
should be a strong, reliable, controllable heat source available; and (c) the
proposed container should withstand the heat as the water boils for 10-15
minutes. Toolset One meets all three requirements, so it is fit for the task. Toolset
Two fails the first test (it would not hold sufficient water) and the second test (the
heat source is hard to control). Toolset Three fails the third requirement (the
plastic bowl would melt or burn), so it, too, is unfit for the task. By contrast, the
predicted-outcomes approach to assessing task-technology fit asks: Would this
toolset, in the hands of this user, lead to the desired outcome? To answer this
question, the respondent imagines using the toolset and attempts to predict the
outcome. Using this approach, since Toolset One seems likely to produce cooked
spaghetti, there is a good fit between Toolset One and this particular task. By
contrast, because the outcomes from Toolset Two and Toolset Three seem
unlikely to result in cooked spaghetti, fit would be low in each case.
This example makes it clear that there are two ways to assess tasktechnology fit: facets-of-fit and predicted outcomes. If the facets of TTF are
correctly identified, both measures should be highly correlated. From this
perspective, Davis’ (1989) famous questionnaire on perceived usefulness and
perceived ease of use contains two measures of TTF—a facets-of-fit measure
and a predicted-outcomes measure. Specifically, the six ease-of-use questions
(e.g., “I would find CHART-MASTER easy to use”) ask about one aspect of
facets-of-fit; namely, ease of use. By contrast, the six perceived-usefulness
questions (e.g., “Using CHART-MASTER in my job would increase my
productivity”) ask respondents to assess TTF based on predicted outcomes.
Goodhue and Thompson (1995) used eight facets of fit (relationship, quality,
timeliness, compatibility, locatability, ease/training, reliability, and authority) to
explain the variance in performance 1, an outcomes measure of task-technology
fit. Curiously, they did not attempt to combine scores for the various facets of fit
Copyright © 2005, Idea Group Inc. Copying or distributing in print or electronic forms without written
permission of Idea Group Inc. is prohibited.
TEAM LinG
Testing the Technology-to-Performance Chain Model 47
into some overall measure of facet-based task-technology fit. They simply used
their eight facets-of-fit measures in three regression equations that explained
variance in performance. Like Goodhue and Thompson (1995), in this study we
use four facets of fit to explain variance in two potential outcomes indicators of
fit—Expected Consequences of Use and Performance Impacts. But, unlike
Goodhue and Thompson (1995), we use the formative-indicators technique in
PLS (Chin, 1998, 2001) to create a second-order factor called Task-Technology
Fit (TTF). That second-order factor is depicted at the top of Figure 2.
Precursors of utilization (see the box on the left of Figure 2) include beliefs
about the consequences of using a system. The logic behind Goodhue and
Thompson’s (1995) TPC model’s links between TTF and Expected Consequences of Use and Affect Toward Use (i.e., beliefs and feelings about the
consequences of using a system) is based on the assumption that TTF should be
one important determinant of beliefs about the usefulness and importance of a
system and the advantage obtained from using a system (see Goodhue &
Thompson [1995] for fuller justification and logic behind their model). The better
the fit between the capabilities of the system, the task, and the individual, the
more positive the expected consequences and the higher users’ affect toward
using the system. Thus, we hypothesize:
H1: Task-Technology Fit will be associated positively with Expected Consequences of Use.
H2: Task-Technology Fit will be associated positively with Affect Toward Use.
If the system matches the needs of the users (i.e., their tasks) and their
abilities, then it should have a positive impact on performance, since it is more
useful to achieve the required task. The positive relationship between tasktechnology fit and performance has been examined and supported by previous
research. Goodhue and Thompson (1995) found support for this hypothesis in
their study of 25 different technologies in two organizations. Benbasat, Dexter
and Todd (1986) found support for the impact of system design fit with the task
on task performance, as did Dickson, DeSanctis and McBride (1986). Vessey
(1991) and Jarvenpaa (1989) also found strong support for the relationship
between cognitive fit and performance in their laboratory experiments. Therefore, we hypothesize:
H3: Task-Technology Fit will be positively associated with Performance Impacts.
Hypotheses 4 through 7 refer to the relationships between antecedents of
utilization and use (i.e., utilization). These hypotheses are based on theories of
attitudes and behaviors such as the Theory of Reasoned Action (TRA) (Fishbein
& Ajzen, 1975). TRA has been found to have strong predictive power in many
Copyright © 2005, Idea Group Inc. Copying or distributing in print or electronic forms without written
permission of Idea Group Inc. is prohibited.
TEAM LinG
48 Staples and Seddon
studies and in a meta-analysis done by Sheppard, Hartwick, and Warshaw
(1988). In an information systems context, Davis (1989) developed the Technology Acceptance Model (TAM), which was adapted from TRA (Szajna, 1996).
The validity of TAM also has been demonstrated in many information systems
contexts (see Mathieson, Peacock, & Chin, 2001; Venketash, 1999; Venketash
& Davis, 2000 for recent reviews of TAM research), such that it is now a wellaccepted belief that attitudes of the users can influence use of systems. Social
norms and other situational factors also can influence utilization (Hartwick &
Barki, 1994; Moore & Benbasat, 1992). Thus, consistent with TRA, TAM, and
Goodhue and Thompson’s (1995) TPC model, we hypothesize:
H4: Expected Consequences of Use will be positively associated with Utilization.
H5: Affect Toward Use will be positively associated with Utilization.
H6: Social Norms will be positively associated with Utilization.
H7: Facilitating Conditions will be positively associated with Utilization.
Finally, use of a system or non-use of a system can impact performance
(i.e., accomplishment of some task or group of tasks). If the system is designed
well, then more use should have a positive impact on performance. Non-use of
a well-designed system should have a negative impact on potential performance,
since efficiency and effectiveness gains are lost by non-use. Hence, it is
hypothesized:
H8: Utilization will be positively associated with Performance Impacts.
Although Goodhue and Thompson (1995) intended the TPC model to be a
general model, they note, “to the extent that utilization is not voluntary, performance impacts will depend increasingly upon task-technology fit rather than
utilization” (p. 216). This implies that the strengths of the relationships in the
model should vary, depending on whether use is voluntary or not (i.e., mandatory). By testing the TPC model in both mandatory- and volitional-usage
situations, we are able to examine if the expected patterns described next
emerge. Under mandatory use, we expect strong paths from task-technology fit
to performance impacts, and from social norms to utilization. In mandatory use,
the users’ expectations and feelings toward use should not play as strong a role
as when they have a choice (i.e., in a voluntary use situation). In mandatory
usage, social norms also should play a strong role, since these would reflect the
expectations of others that the system is to be used (Goodhue & Thompson,
1995). The findings of Venkatesh and Davis (2000) support this compliance
effect. They found subjective norm had a significant direct effect on usage
intentions for mandatory users but not for voluntary users. Under voluntary use,
Copyright © 2005, Idea Group Inc. Copying or distributing in print or electronic forms without written
permission of Idea Group Inc. is prohibited.
TEAM LinG
Testing the Technology-to-Performance Chain Model 49
we expect to see weaker paths from task-technology fit to performance impacts,
and stronger paths from utilization to performance impacts and from expected
consequences of use and affect toward use to utilization. In both situations, we
expect task-technology fit to impact the expectations and feelings toward use,
since the impact of fit on these constructs should be independent of why the
system is used.
A quantitative research design was chosen to examine the proposed
relationships among the various constructs in the research model. The next
section describes how the research model was tested.
RESEARCH DESIGN AND METHODOLOGY
This section describes the two samples, construct measures, and analysis
methods employed. Samples were obtained from users of two different systems.
The first set of users represents mandatory use, since they were required to use
the system to do their job. The second set of users represents voluntary use, since
it was up to the users to decide if they wished to use the system or not (i.e., they
could accomplish their job without using the system.) As highlighted in the
discussion section, internal validity could have been stronger, if it was possible
to find one system that had both mandatory and volitional users; however, we
were unable to find such a field setting, and to enhance external validity, we
wanted to sample real users of existing systems, not to conduct an experiment.
Sample A: Mandatory Use
To test the model in Figure 2 for mandatory use, we needed to collect
opinions from individual users of information systems who were required to use
the system as part of their job. We obtained agreement from the University
Librarian (i.e., the CEO) at a large university library to survey her staff
concerning the effectiveness of the library’s central cataloguing system. Although patterns of usage varied (i.e., acquisitions staff used the system to record
details of planned purchases; cataloguing staff used the system to add cataloguing information once books had arrived; loans-desk staff used the system when
patrons borrowed books and to collect fines for overdue fines; accounting staff
used the system to manage and budget for expenditure), all these people had to
interact with the system to do their job. Questionnaires were sent to 250
librarians, and after one follow-up letter, 140 usable responses (56% of 250)
resulted. To test for non-response bias, we split the data by work groups and
tested to see whether the percentages that responded in each group were
significantly different from the known percentages in the population. There were
no significant differences, so we believe that the dataset is representative of the
population.
Copyright © 2005, Idea Group Inc. Copying or distributing in print or electronic forms without written
permission of Idea Group Inc. is prohibited.
TEAM LinG
50 Staples and Seddon
Figure 3: Indications of mandatory use
100
80
60
Frequency
40
20
Std. Dev = 1.17
Mean = 6.5
N = 112.00
0
1.0
2.0
3.0
4.0
5.0
6.0
7.0
My employer requires me to use the system
To establish that respondents were, indeed, mandatory users, we asked
respondents about the degree of mandatory usage via a Likert question (1 =
strongly disagree; 7 = strongly agree). The response is shown in Figure 3. The
great majority felt that they were required to use the system by their employer,
supporting the position that this dataset represents mandatory use.
Sample B: Voluntary Use
For what we expected would be volitional users, we decided to survey
university students concerning their use of two types of productivity tools—word
processors and spreadsheets—for course-related work and personal activities.
These users were not required to use these productivity tools for their courses
(i.e., it was their choice, so they were voluntary users). Student opinions about
the benefits from their own personal use of computers are considered valid,
because the students were not asked to imagine themselves acting in some
unfamiliar management role. They were asked to think about one particular
application that they use and report on their experiences with it. The subjects
were senior-year undergraduate commerce students who all had completed an
introductory computing subject at least 12 months before the date of the survey.
Questionnaires were mailed out to a random sample of 600 students. After one
follow-up letter, 308 responses were received (a response rate of 50%). The 266
evaluations of word processing and spreadsheet packages were used as the
potential sample for testing our model. However, missing responses to some of
the questions (e.g., the information quality questions) reduced our usable dataset
to 114. Tests for non-response bias found no significant differences that would
affect the relationships in the study.
Copyright © 2005, Idea Group Inc. Copying or distributing in print or electronic forms without written
permission of Idea Group Inc. is prohibited.
TEAM LinG
Testing the Technology-to-Performance Chain Model 51
Figure 4. Indications of voluntary use
30
20
Frequency
10
Std. Dev = 2.16
Mean = 3.7
N = 107.00
0
1.0
2.0
3.0
4.0
5.0
6.0
7.0
My instructor requires me to use the system
To establish that respondents were voluntary users, we again asked
respondents about the degree of mandatory usage via a Likert question (1 =
strongly disagree; 7 = strongly agree). The response is shown in Figure 4. While
the majority felt that they were not required to use the system, there were a
substantial number who perceived that they had little choice. Therefore, to get
a more valid set of voluntary users, we dropped any respondents who scored
above 4 on this question. This resulted in a sample of 66 voluntary use
respondents that was used to test the research model.
Construct Measurement
The questionnaire completed by the respondents contained multiple measurement items relating to each of the constructs in the research model (see
Appendix A for details of each question). Wherever possible, scales that had
demonstrated good psychometric properties in previous studies were used. As
indicated earlier, task-technology fit (TTF) was measured with a multi-faceted
measure. Goodhue (1995, 1998) and Goodhue & Thompson (1995) measured
facets of TTF dealing with the quality and accessibility of the information
provided by the system, ease of use, and training of the system. Twelve questions
were used in the current study to measure four similar facets of the TTF
construct: Work Compatibility, Ease of Use, Ease of Learning, and Information
Quality.
Expected Consequences of Use, a potential outcomes measure of TTF, was
measured with 10 items that dealt with issues of the usefulness of using the
system and the personal benefits of using the system. Affect Toward Use was
measured with eight items dealing with attitudes and feelings toward system use.
Copyright © 2005, Idea Group Inc. Copying or distributing in print or electronic forms without written
permission of Idea Group Inc. is prohibited.
TEAM LinG
52 Staples and Seddon
Table 1. Internal consistency of the constructs
Construct/Scale
First order indicators of tasktechnology fit
Work Compatibility
Ease of Use
Ease of Learning
Information Quality
Expected Consequences of Use
Affect toward Use
Social Norms
Facilitating Conditions
Utilization
Performance Impacts
Number of
Items
Internal
Consistency
Cronbach’s
Alpha
Average
Variance
Extracted
3
3
3
3
10
8
4
3
6
7
0.875
0.907
0.952
0.896
0.952
0.934
0.878
0.793
0.917
0.918
0.762
0.840
0.921
0.822
0.941
0.917
0.822
0.720
0.717
0.886
0.702
0.766
0.868
0.743
0.668
0.638
0.645
0.571
0.649
0.621
The Social Norms construct was measured with four questions dealing with
pressures and expectations from others (i.e., boss, coworkers, family, and
friends) to use the system. One specific type of facilitating condition was
investigated—relationship with support staff (three questions) for the mandatory
use setting only (information on support staff help was not relevant for the
voluntary usage setting). Utilization was measured with both self-reported
estimates of the number of hours respondents used the system in the past and
expected to use it in the future, along with Likert scale measures of whether they
felt they were light/heavy users and infrequent/frequent users. The Performance Impacts construct was measured with seven self-reported questions
(consistent with Goodhue and Thompson’s [1995] way of measuring Performance Impacts) of the overall net benefit of the system to the respondent,
including efficiency and effectiveness issues, overall advantages versus disadvantages, cost-effectiveness, and overall satisfaction.
The number of items used to measure each construct, along with indicators
of internal consistency, are provided in Table 1. As discussed in the results
section, internal consistency of all constructs was acceptable.
Analysis Method
Partial Least Squares (PLS), a structural equation modeling (SEM) technique, was chosen for analyzing relationships between variables in the research
model (for more information on PLS, see Barclay, Higgins, & Thompson, 1995;
Gefen, Straub, & Boudreau, 2000; Hulland, 1999). PLS was chosen as the
analytical tool over a covariance SEM approach (e.g., LISREL or AMOS) for
several reasons. PLS makes no assumptions about the distribution of the
variables (i.e., it is non-parametric), so it is more robust than a parametric
modeling approach, which assumes multi-variate normality. The purpose of PLS
is to explain variance in the model (similar to regression), and since that is the
Copyright © 2005, Idea Group Inc. Copying or distributing in print or electronic forms without written
permission of Idea Group Inc. is prohibited.
TEAM LinG
Testing the Technology-to-Performance Chain Model 53
purpose of the study, it fits well. Last, PLS generally can be used validly with
significantly smaller sample sizes than covariance SEM. The minimum sample
required is calculated by identifying the endogenous construct with the most
paths leading into it (Utilization, in this case, with four paths leading into it). The
minimum sample size is 10 times the number of paths leading into this construct,
so our sample sizes are adequate for PLS analysis (Chin, 1998). (The sample size
of the voluntary group would not be adequate for covariance SEM).
All constructs were modeled with reflective indicators. The multidimensionality of task-technology fit was handled by modeling task-technology fit as
a second-order factor with each facet of task-technology fit being a first-order
factor that formed the second-order factor. The hierarchical component approach described by Lohmoller (1989) was used to model the second-order
factor. In this approach, the second-order factor is measured using the indicators
that also are used as indicators for each of the first-order factors (i.e., dimensions
of task-technology fit). The hierarchical component approach is the easiest way
to model second-order factors in PLS and works best with equal number of
indicators for each first-order construct, as is the case here (Chin, Marcolin, &
Newsted, 1996; Chin, 2001).
RESULTS
Structural equation modeling involves two phases. First, the measurement
model is assessed. Second, once the measurement model has been shown to be
adequate, the explanatory and predictive power of the model (i.e., the structural
model) can be assessed. When second-order factors are part of the model, as
is the case here, examination of the measurement properties of the first-order
factors that form the second-order factor is done to ensure adequate psychometric properties (Chin, 2001). Paths between the second-order constructs and
other components of the model are then examined as part of the assessments of
the structural model. Details of the assessment of the measurement model are
shown in Table 2, followed by the evaluation of the structural model.
Table 1 reports internal consistency values for each of the constructs in the
research model using both a measure proposed by Fornell and Larcker (1981)
and Cronbach’s alpha. The internal consistency scores should exceed 0.7, which
they do for all scales in Table 1 for both measures of consistency. Table 1 also
reports average variance extracted. The square root of this measure is used in
Table 2 to assess discriminant validity. Table 2 presents the intercorrelations
among constructs for each dataset. The diagonal elements of Table 2 are the
square roots of the average variance extracted for each latent variable. For
discriminant validity, these diagonal elements should be larger than any of the
intercorrelations between the latent variables (Barclay et al. 1995), which they
are. Another test of discriminant validity is to assess the loadings of each
Copyright © 2005, Idea Group Inc. Copying or distributing in print or electronic forms without written
permission of Idea Group Inc. is prohibited.
TEAM LinG
54 Staples and Seddon
Table 2. Discriminant validity analysis
1. Expected Consequences
of Use
2. Affect toward Use
3. Social Norms
4. Facilitating Conditions
5. Utilization
6. Performance Impacts
7. Task-Technology Fit
(TTF) Factor 1: Work
Compatibility
8. TTF Factor 2: Ease of
Use
9. TTF Factor 3: Ease of
Learning
10. TTF Factor 4:
Information Quality
1
0.818
2
3
4
5
6
7
8
9
0.663
0.372
0.398
0.353
0.751
0.687
0.799
0.384
0.459
0.288
0.691
0.622
0.803
0.218
0.433
0.244
0.225
0.755
0.084
0.390
0.396
0.806
0.183
0.193
0.788
0.675
0.838
0.753
0.569
0.219
0.329
0.225
0.717
0.602
0.875
0.624
0.457
0.184
0.236
0.187
0.551
0.531
0.778
0.932
0.593
0.498
0.286
0.321
0.326
0.603
0.674
0.572
0.430
10
0.862
The bold diagonal elements are the square roots of the variance shared between the constructs
and their measures (i.e., the square root of the average variance extracted) from Table 1. Offdiagonal elements are the correlations between latent constructs. For strong discriminant validity,
the diagonal elements should be larger than any other corresponding row or column entry
(Barclay et al., 1995; Hulland, 1999).
individual item. The items should load highest on their targeted construct and
have relatively low loadings on all the other constructs2. All the items loaded
highest on their target construct. Overall, the statistics in Tables 1 and 2, along
with the examination of the individual items, suggest that the measurement model
is adequate.
Details of evaluation of the structural model are reported in Figure 5.
Evaluation of the structural model also involves two parts. First, predictive power
of the model is assessed. Second, the strength of hypothesized relationships
among the constructs is analyzed.
The predictive power of the model for both datasets is summarized by the
R2s on the endogenous variables in Figure 5. For mandatory use, the model
predicts 58% of Performance Impacts, 64% of Expected Consequences of Use,
41% of Affect Toward Use, and 24% of the Utilization construct. For voluntary
use, the model predicts 48% of Performance Impacts, 43% of Expected
Consequences of Use, 7% of Affect Toward Use, and 17% of the Utilization
construct. High path coefficients are to be expected between TTF and both
Expected Consequences of Use and Performance Impacts, if the facets-of-task
requirements have been correctly identified in measuring TTF. In Figure 5, these
path coefficients are high for both mandatory and voluntary use. Overall, the
amount of variance explained in Performance Impacts, our last endogenous
variable, appears reasonable, given that there certainly would be other contextual variables affecting the respondents’ net benefit beliefs.
Table 3 contains a summary of the hypotheses tested, the path coefficients
obtained from the PLS analysis, and t-values for each path obtained through
bootstrapping, for both datasets. At the 5% confidence level, the statistically
significant paths (i.e., significantly different from zero) in the mandatory use
Copyright © 2005, Idea Group Inc. Copying or distributing in print or electronic forms without written
permission of Idea Group Inc. is prohibited.
TEAM LinG
Testing the Technology-to-Performance Chain Model 55
Figure 5. Research model analysis results
Expected
Consequences
of Use
a R2 = 0.64
b R2 = 0.43
Affect
Toward Use
a R2 = 0.41
b R2 = 0.07
H1
a = 0.798***
Task
b = 0.657*** Technology
Fit
H2
Performance
Impacts
a R2 = 0.58
b R2 = 0.48
a = 0.233
b = 0.412***
a = 0.048
b = -0.110
H8
Utilization
Social
Norms
H6
H7
Facilitating
Conditions
a = 0.770***
b = 0.638***
a = 0.641***
b = 0.266
H4
H5
H3
a = 0.351**
b = -0.216
a = -0.107
b = n/a
a = -0.029
b = 0.181
a R2 = 0.24
b R2 = 0.17
a = mandatory use dataset
b = voluntary use dataset
dataset were found to support Hypotheses 1, 2, 3, and 6. The paths from tasktechnology fit to the three constructs—Consequences of Use (H1), Affect
Toward Use (H2), and Performance Impacts (H3)—were all highly significant.
The only antecedent of Utilization that had a significant path was Social Norms
(H6). In the voluntary use dataset, support was found again for hypotheses 1 and
3 (task-technology fit to Expected Consequences of Use and Performance
Impacts). A significant relationship was also found from Expected Consequences of Use to Utilization, supporting H4. These results are discussed in the
next section.
DISCUSSION
We see three main contributions of our study. First, strong support was
found for the impact of facets-based task-technology fit on perceived performance (H3), consistent with previous research results. The amount of variance
explained by the model in both datasets, along with an examination of the
statistical significance and strength of the individual paths, shows that most of the
explanatory power comes from the task-technology fit (TTF) construct.
Our results were somewhat similar to those obtained by Goodhue and
Thompson (1995) in that both our study and their study found that more
explanatory power came from task-technology fit than from utilization (utilization added .02 in explained variance in Goodhue and Thompson’s study).
However, Goodhue and Thompson did not discuss the issue of voluntariness with
respect to their respondents, so we can’t comment on whether or not that could
have been an influence on their results (the influence of voluntariness on our
results are discussed later).
Copyright © 2005, Idea Group Inc. Copying or distributing in print or electronic forms without written
permission of Idea Group Inc. is prohibited.
TEAM LinG
56 Staples and Seddon
Second, strong support also was found for the part of the TPC model linking
facets-based TTF with Expected Consequences for Use and, for mandatory
users, Affect Toward Use (Hypotheses 1 and 2). Goodhue and Thompson (1995)
did not test these links. Instead, they assumed that the relationships existed and,
therefore, tested an indirect path from TTF to Utilization. They found little
empirical support for this path, raising questions about the validity of the H1 and
H2 part of the Technology Performance Chain model. By contrast, our results
support H1 and for mandatory users, H2 and demonstrate that individuals’
perceptions of the fit of the system with their task and individual characteristics
are important influences on their beliefs about the usefulness, importance, and
potential advantages to be obtained from using a system.
Third, the results do demonstrate that the relationships in the TPC model
vary under the two usage situations (i.e., voluntary and mandatory). As
expected, the relationships between beliefs and affects toward use in a mandatory setting were non-significant. The data confirm that when users do not have
a choice about system use, their beliefs and feelings about such use may be
largely irrelevant in predicting utilization. By contrast, as suggested by Goodhue
and Thompson (1995), the fit of the system and its tasks and individual
characteristics, as well as the social norms, may be the key drivers of performance. If social norms are strong, in a situation where mandatory use exists, the
norms may overpower beliefs about expected consequences of use and affect
toward use. That appears to be the pattern observed in this study. For voluntary
use, it was expected that beliefs and feelings toward use (H4 and H5) would be
Table 3. Summary of path coefficients and significance levels
Hypotheses and Corresponding
Path(s)
H1:
Mandatory
Use
Path
t-value
Support
Coefficient
for H ?
(degrees of
freedom = 498)
Path
Coef.
Task-technology fit to
Expected consequences
YES
.657
.798
20.87***
of use
H2:
Task-technology fit to
Affect toward use
.641
10.41***
YES
.266
H3:
Task-technology fit to
Performance impacts
.770
19.19***
YES
.638
H4:
Expected consequences
of use to Utilization
.233
1.78
NO
.412
H5:
Affect toward use to
Utilization
.048
0.38
NO
-.110
H6:
Social norms to
Utilization
.351
3.10**
YES
-.216
H7:
Facilitating conditions
not
to Utilization
-.107
-1.08
NO
tested 1
H8:
Utilization to
Performance impacts
-.029
-0.44
NO
.181
* p < .05; ** p < .01; ***p < .001 (2 tailed test)
- t-statistics were calculated using bootstrapping
1
information on support staff help was not relevant for the voluntary usage setting
Voluntary
Use
t-value
Support
(d.f. = 493) for H ?
7.04***
YES
1.54
NO
9.74***
YES
3.78***
YES
-0.47
NO
-1.10
NO
1.72
NO
Copyright © 2005, Idea Group Inc. Copying or distributing in print or electronic forms without written
permission of Idea Group Inc. is prohibited.
TEAM LinG
Testing the Technology-to-Performance Chain Model 57
associated significantly with use; social norms would not play a strong role (H6);
and the impact of use on performance would be stronger than in a mandatory
setting (H8). We did see this pattern, in that H4 was supported, and H6 was not
for the voluntary dataset. However, as will be discussed, H8 was not supported.
The hypothesized (H8) association of Utilization with Performance Impacts
in our study was found to be non-significant for both datasets. However, the path
for the voluntary users was very close to being significant (i.e. t = 1.72 for a path
of 0.181), and would be, if the p-value was relaxed to 0.10 or if a one-tail test was
used. This lends some support to Goodhue and Thompson’s (1995) suggestion
that in a voluntary use setting, the impact of utilization on performance impacts
should be stronger than in a mandatory use situation. Future research should
investigate this link more closely with a larger dataset, since the statistical power
of the voluntary-use dataset was somewhat limited. Also, future researchers
should be clear about the usage context being studied, so that the results can be
interpreted and can add to our understanding of the predictive power of the TPC
model.
The purpose of the current chapter was a simple one—to test the Technology Performance Chain model in both mandatory use and voluntary use
situations. The TPC model was proposed approximately eight years ago. Since
that time, the general level of computer literacy of end-users has increased
considerably. Future research could help identify the most critical predictors of
performance, and perhaps examine if the TPC model needs to be revised for
today’s users. Although many aspects of the TPC model have been examined
and potentially validated in other studies of technology acceptance and impact
(e.g., TAM, TRA), there could be additions to the TPC model that would
enhance its explanatory power. A valuable effort for future research would be
to investigate the TPC model and compare and contrast it with current other
research in the area of technology acceptance, use, and performance impacts.
Since 1995, there has been considerable research in some of these areas, so it
would be useful to compare the explanatory power of competing models in both
mandatory and voluntary use settings.
As with all studies, our results should be interpreted in light of the limitations
of the study. The empirical results apply for the specific types of systems
investigated. We deliberately chose two different systems, because we wanted
to test the TPC model in the field with actual users, and it was not possible to find
a system that had a suitable number of both mandatory and volitional users. Using
practitioners adds external validity to our findings, but we realize that using two
different systems potentially decreased internal validity by adding another factor
into the situation. Therefore, TPC needs to be tested across a broader collection
of systems before we can confidently generalize to information systems in
general. Testing the effect of mandatory versus volitional use on the TPC model
in an experimental setting would be valuable future research, since the type of
system could be controlled.
Copyright © 2005, Idea Group Inc. Copying or distributing in print or electronic forms without written
permission of Idea Group Inc. is prohibited.
TEAM LinG
58 Staples and Seddon
Another limitation was that only one type of facilitating condition was
examined (support staff) in this study, and this was only tested in the mandatory
use setting. No support was found for a relationship between this type of
facilitating condition and utilization; however, there are many other types of
facilitating conditions that could have a stronger impact on utilization. Other
types of facilitating conditions that could be examined in future studies include
things such as ease of access to the system itself (hardware and software).
Training is another important facilitating condition that could be examined in
future studies.
Our measurement of performance impacts was based on the respondent’s
perception of how the system affected his or her work and the worth of the
system to them. Future research to test the model and voluntary/mandatory use
using more objective measures of individual performance would enhance the
internal validity of the findings.
In conclusion, this study found support for some parts of the Technology
Performance Chain model and for the argument that task-technology fit increases in predictive power of performance as utilization become mandatory.
We did find support for the impact of task-technology fit on beliefs and attitudes
regarding use of a system, relationships that Goodhue and Thompson (1995)
proposed but did not test. This, along with direct effect of task-technology fit on
performance, suggests that even in voluntary use settings (where beliefs and
attitudes regarding use of a system have a stronger impact on utilization), a good
fit between the task, technology, and user characteristics is very important, if
users are to achieve desired performance outcomes from system use. Overall,
our results suggest that the Technology Performance Chain model is a useful tool
for understanding the potential impact of a system on task performance.
However, the relationships within the model appear to vary, depending upon
whether usage is mandatory or voluntary.
REFERENCES
Barclay, D., Higgins, C., & Thompson, R. (1995). The partial least squares
(PLS) approach to causal modeling: Personal computer adoption and use as
an illustration. Technology Studies, 2(2), 285-309.
Baroudi, J.J., & Orlikowski, W.J. (1988). A short-form measure of user
information satisfaction: A psychometric evaluation and notes on use.
Journal of MIS, 4(Spring), 44-59.
Benbasat, I., Dexter, A.S., & Todd, P. (1986). An experimental program
investigating color-enhanced and graphical information presentation: An
integration of the findings. Communications of the ACM, 29(11), 10941105.
Copyright © 2005, Idea Group Inc. Copying or distributing in print or electronic forms without written
permission of Idea Group Inc. is prohibited.
TEAM LinG
Testing the Technology-to-Performance Chain Model 59
Chin, W.W. (1998). The partial least squares approach to structural equation
modeling. In G.A. Marcoulides (Ed.), Modern methods for business
research (pp. 295-336). New Jersey: Erlbaum Associates.
Chin, W.W. (2001, March). Partial least squares for researchers: An overview
and presentation of recent advances using the PLS approach [presentation
notes]. Proceedings of the Workshop on PLS, Kingston, Canada.
Chin, W.W., Marcolin, B.L. & Newsted, P.R. (1996). A partial least squares
latent variable modeling approach for measuring interaction effects: Results from a Monte Carlo simulation study and voice mail emotion/adoption
study. In J.I. DeGross, S. Jarvenpaa, & A. Srinivasan (Eds.), Proceedings
of the Seventeenth International Conference on Information Systems,
21-41. Cleveland, Ohio.
Davis, F.D. (1989). Perceived usefulness, perceived ease of use, and user
acceptance of information technology. MIS Quarterly, 13(3), 319-342.
Dickson, G.W., DeSanctis, G. & McBride, D.J. (1986). Understanding the
effectiveness of computer graphics for decision support: A cumulative
experimental approach. Communications of the ACM, 29(1), 40-47.
Dishaw, M.T., & Strong, D.M. (1998a). Assessing software maintenance tool
utilization using task-technology fit and fitness-for-use models. Journal of
Software Maintenance Research and Practice, 10(3), 151-179.
Dishaw, M.T., & Strong, D.M. (1998b). Supporting software maintenance with
software engineering tools: A computed task-technology fit analysis. The
Journal of Systems and Software, 44, 107-120.
Doll, W.J., & Torkzadeh, G. (1988, June). The measurement of end-user
computer satisfaction. MIS Quarterly, 12, 259-274.
Ferratt, T.W., & Vlahos, G.E. (1998). An investigation of task-technology fit for
managers in Greece and the US. European Journal of Information
Systems, 7(2), 123-136.
Fishbein, M., & Ajzen, I. (1975). Belief, attitude, intentions and behavior: An
introduction to theory and research. Boston: Addison-Wesley.
Fornell, C., & Larcker, D. (1981). Evaluating structural equation models with
unobservable variables and measurement error. Journal of Marketing
Research, 18, 39-50.
Gefen, D., Straub, D.W., & Boudreau, M.C. (2000). Structural equation
modeling and regression: Guidelines for research practice. Communications of the Association for Information Systems, 4(7). Retrieved from
http://cais.isworld.org/articles/default.asp?vol=4&art=7
Goodhue, D.L. (1995). Understanding user evaluations of information systems.
Management Science, 41(12), 1827-1844.
Goodhue, D.L. (1998). Development and measurement validity of a tasktechnology fit instrument for user evaluations of information systems.
Decision Sciences, 29(1), 105-138.
Copyright © 2005, Idea Group Inc. Copying or distributing in print or electronic forms without written
permission of Idea Group Inc. is prohibited.
TEAM LinG
60 Staples and Seddon
Goodhue, D.L., Klein, B.D., & March, S.T. (2000). User evaluations of IS as
surrogates for objective performance. Information & Management,
38(2), 87-101.
Goodhue, D.L., Littlefield, R., & Straub, D. W. (1997). The measurement of the
impacts of IIC on the end-users: The survey. Journal of the American
Society for Information Science, 48(5), 454-465.
Goodhue, D.L., & Thompson, R.L. (1995). Task-technology fit and individual
performance. MIS Quarterly, 19(2), 213-236.
Hartwick, J., & Barki, H. (1994). Explaining the role of user participation in
information system use. Management Science, 40(4), 440-465.
Hulland, J.S. (199)9. Use of partial least squares (PLS) in strategic management
research: A review of four recent studies. Strategic Management Journal, 20(2), 195-204.
Jarvenpaa, S.L. (1989). The effect of task demands and graphical format on
information processing strategies. Management Science, 35(3), 285-303.
Kanellis, P., Lycett, M. & Paul, R. J. (1999). Evaluating business information
systems fit: From concept to practical application. European Journal of
Information Systems, 8(1), 65-76.
Lim, K.H., & Benbasat, I. (2000). The effect of multimedia on perceived
equivocality and perceived usefulness of information system. MIS Quarterly, 24(3), 449-471.
Lohmoller, J. (1989). Latent variable path modeling with partial least
squares. New York: Springer-Verlag.
Mathieson, K., Peacock, E. & Chin, W.W. (2001). Extending the technology
acceptance model: The influence of perceived user resources. Database
for Advances in Information Systems, 32(3), 86-112.
Moore, G.C., & Benbasat, I. (1991). Development of an instrument to measure
the perceptions of adopting an information technology innovation. Information Systems Research, 2(3), 192-222.
Moore, G.C., & Benbasat, I. (1992). An empirical examination of a model of
the factors affecting utilization of information technology by end
users [working paper]. University of British Columbia, Vancouver, B.C.
Orlikowski, W.J., & Iacono, C.S. (2001). Research commentary: Desperately
seeking the IT in IT research—A call to theorizing the IT artifact.
Information Systems Research, 12(2), 121-134.
Pendharkar, P.C., Rodger, J.A., & Khosrwopour, M. (2001). Development and
testing of an instrument for measuring the user evaluations of information
technology in health care. Journal of Computer Information Systems,
41(4), 84-89.
Seddon, P.B., & Kiew M-Y. (1996). A partial test and development of DeLone
and McLean’s model of IS success. Australian Journal of Information
Systems, 4(1), 90-109.
Copyright © 2005, Idea Group Inc. Copying or distributing in print or electronic forms without written
permission of Idea Group Inc. is prohibited.
TEAM LinG
Testing the Technology-to-Performance Chain Model 61
Sheppard, B.H., Hartwick, J. & Warshaw, P.R. (1988). The theory of reasoned
action: A meta-analysis of past research with recommendations for modifications and future research. Journal of Consumer Research, 15, 325343.
Shirani, A.I., Tafti, M. H. A. & Affisco, J.F. (1999). Task and technology fit: A
comparison of two technologies for synchronous and asynchronous group
communication. Information & Management, 36(3), 139-150.
Szajna, B. (1996). Empirical evaluation of the revised technology acceptance
model. Management Science, 42(1), 85-92.
Thompson, R.L., Higgins, C. & Howell, J.M. (1991). Personal computing:
towards a conceptual model of utilization. MIS Quarterly, 15(1), 125-143.
Thompson, R.L., Higgins, C. & Howell, J.M. (1994). Influence of experience on
personal computer utilization: Testing a conceptual model. Journal of
Management Information Systems, 11(1), 167-187.
Triandis, H.C. (1980). Values, attitudes and interpersonal behavior. In H. E.
Howe (Ed.), Nebraska symposium on motivation, 1979: Beliefs, attitudes and values (pp. 195-259). Lincoln, NE: University of Nebrasksa
Press.
Venkatesh, V. (1999). Creation of favorable user perceptions: Exploring the role
of intrinsic motivation. MIS Quarterly, 23(2), 239-260.
Venkatesh, V., & Davis, F.D. (2000). A theoretical extension of the technology
acceptance model: Four longitudinal field studies. Management Science,
46(2), 186-204.
Vessey, I. (1991). Cognitive fit: A theory-based analysis of the graphs vs. tables
literature. Decision Sciences, 22(2), 219-240.
ENDNOTES
1
2
Their two questions to assess performance were (p.236): (A) The company
computer environment has a large positive impact on my effectiveness and
productivity in my job. (B) IS computer systems and services are an
important and valuable aid to me in the performance of my job.
A table of loadings and cross-loadings is available from the authors.
Copyright © 2005, Idea Group Inc. Copying or distributing in print or electronic forms without written
permission of Idea Group Inc. is prohibited.
TEAM LinG
62 Staples and Seddon
APPENDIX A: CONSTRUCT MEASUREMENT
1.
Task-technology fit Dimension 1 – Work Compatibility (Source: Moore and
Benbasat, 1991)
Item
1
2
3
2.
Task-technology fit Dimension 2 – Ease of Use (Source: Items 1 and 2 from
the construct came from Doll and Torkzadeh, 1988. Item 3 is from Moore
and Benbasat, 1991)
Item
1
2
3
3.
Wording (Questionnaire 1/Questionnaire 2)
The system is easy to use
The system is user friendly
It is easy to get the system to do what I want it to do
Task-technology fit Dimension 3 – Ease of Learning (Source: Davis, 1989)
Item
1
2
3
4.
Wording
Using the new system fits well with the way I like to work
The system is compatible with all aspects of my work
I have ready access to the system when I need it
Wording
The system is easy to learn
It is easy for me to become more skillful at using the system
New features are easy to learn
Task-technology fit Dimension 4 – Information Quality (Source: All items
came from Doll and Torkzadeh, 1988)
Item
1
2
3
Wording (1 – 7 scale, ranging from Never to Always)
Do you think the output is presented in a useful format?
Is the system accurate?
Does the system provide up-to-date information?
Copyright © 2005, Idea Group Inc. Copying or distributing in print or electronic forms without written
permission of Idea Group Inc. is prohibited.
TEAM LinG
Testing the Technology-to-Performance Chain Model 63
5.
Consequences of Use (Source: Items 1, 3, 4, 6, 7 and 8 came from Davis,
1989; Items 2 and 5 came from Moore and Benbasat, 1991; Items 9 and 10
came from Thompson, Higgins, and Howell, 1991, 1994)
Item
1
2
3
4
5
6
7
8
9
10
6.
Affect Toward System Use (Source: All items from Hartwick and Barki,
1994)
Item
1
2
3
4
5
6
7
8
7.
Wording
The system enables me to accomplish my tasks more quickly
Using the new system improves my job performance
Using the new system increases my productivity
Using the new system enhances my effectiveness in the job
Using the new system makes it easier to complete my tasks
Using the new system gives me greater control over my tasks
Overall, I find the new system useful in the work I do
Using the system improves the quality of the work I do
The new system is fun to use
The new system is interesting to use
Wording
My frequent use of the system is good vs. bad
My frequent use of the system is terrible vs. terrific
My frequent use of the system is useful vs. useless
My frequent use of the system is worthless vs. valuable
My being a heavy user of the system is good vs. bad
My being a heavy user of the system is terrible vs. terrific
My being a heavy user of the system is useful vs. useless
My being a heavy user of the system is worthless vs. valuable
Social Norms (Source: Hartwick & Barki, 1994)
Item
1
2
3
4
Wording
My boss/instructor believes it is important for me to use the system
My friends at work believe it is important for me to use the system
My family and friends at home believe it is important for me to use
the system
People respect those who can use systems like this
Copyright © 2005, Idea Group Inc. Copying or distributing in print or electronic forms without written
permission of Idea Group Inc. is prohibited.
TEAM LinG
64 Staples and Seddon
8.
Facilitating Conditions – Support Staff (Source: Baroudi & Orlikowski, 1988)
Item
1
2
3
9.
Wording
The support staff makes it easy to use the system
I frequently have disagreements with the support staff (reverse coded)
The support staff is never available when I want them (reverse coded)
Utilization (Source: Items 3 to 6 from Hartwick & Barki, 1994; Items 1 and
2 developed for this study).
Item
1
2
3
4
5
6
Wording
On average, how many hours per week do you use the system (last few
months)? (answered in hours/week)
How many hours per week do you expect to use the system (next few months)?
Your present usage of the system (last few months) is: infrequent to frequent
(1-7 scale)
Your present usage of the system (last few months) is: light to heavy (1-7
scale)
Your expected future usage of the system (next few months) is: infrequent to
frequent (1-7 scale)
Your expected future usage of the system (next few months) is: light to heavy
(1-7 scale)
10. Performance Impact (Source: Item 1 was constructed for the study. Item
2 came from Moore and Benbasat, 1991, and the remaining items came
from Seddon and Kiew, 1996)
Item
1
2
3
4
5
6
7
Wording (Questionnaire 1/Questionnaire 2)
The system is a cost-effective solution to my needs
The advantages of using the system outweigh the disadvantages
The system is efficient
The system is effective
Overall, I am satisfied with the system
The system is worthwhile
I would have no difficulty telling others about the results of my use of
this system
Copyright © 2005, Idea Group Inc. Copying or distributing in print or electronic forms without written
permission of Idea Group Inc. is prohibited.
TEAM LinG
Predicting Computer Task Performance
65
Chapter IV
The Role of Personal Goal
and Self-Efficacy in
Predicting Computer
Task Performance
Mun Y. Yi, University of South Carolina, USA
Kun S. Im, Yonsei University, South Korea
ABSTRACT
Computer task performance is an essential driver of end user productivity.
Recent research indicates that computer self-efficacy (CSE) is an important
determinant of computer task performance. Contrary to the significant
interest in understanding the role of CSE in predicting computer task
performance, little attention has been given to understanding the role of
personal goal (PG), which can be as powerful as or more powerful than
CSE in predicting and determining computer task performance. Employing
CSE and PG, the present research develops and validates a theoretical
model that predicts individual computer task performance. The model was
tested using PLS on data from an intensive software (Microsoft Excel)
training program, in which 41 MBA students participated. Results largely
support the theorized relationships of the proposed model and provide
important insights into how individual motivational beliefs influence computer
skill acquisition and task performance. Implications are drawn for future
research and practice.
Copyright © 2005, Idea Group Inc. Copying or distributing in print or electronic forms without written
permission of Idea Group Inc. is prohibited.
TEAM LinG
66 Yi and Im
INTRODUCTION
Computer task performance is a major contributor to end-user productivity.
Most organizational activities are becoming increasingly dependent on computers and computer-based information systems (IS). The expected productivity
gains from the use of IS cannot be realized unless users are equipped with the
requisite computer skills. Many people experience substantial difficulty in
learning to use computers (Carroll & Rosson, 1987; Landauer, 1995; Wildstrom,
1998) and often abandon or underuse multi-million-dollar computer-based systems due to their lack of ability to use the systems effectively (Ganzel, 1998;
McCarroll, 1991). IS researchers have long recognized computer training as one
of the critical factors responsible for ensuring the success of end-user computing
(Bohlen & Ferratt, 1997; Cheney, Mann, & Amoroso, 1986; McLean, Kappelman,
& Thompson, 1993; Nelson & Cheney, 1987). A recent industry survey shows
that 99% of U.S. organizations teach their employees how to use computer
applications (Industry Report, 2001). Understanding the key mechanisms that
govern computer skill acquisition and task performance is a critical issue that has
a significant impact on daily employee functions, return on IS investment, and
ultimate organizational success.
Prior research examined a number of individual variables by which computer learning and task performance could be predicted. (Bostrom, Olfman, &
Sein, 1990; Evans & Simkin, 1989; Marcolin, Munro, & Campbell, 1997;
Martocchio & Judge, 1997; Webster & Martocchio, 1992). Lately, an increased
focus on the variables related to computer learning and task performance has
included a construct called computer self-efficacy (CSE), perception of one’s
capability to use a computer. In addition to being an important variable that
influences an individual’s decision to accept or use information technology
(Compeau & Higgins, 1995b; Hill, Smith, & Mann, 1987; Taylor & Todd, 1995;
Venkatesh, 2000), CSE has been found to significantly influence task performance in various training settings (Compeau & Higgins, 1995a; Gist, Schwoerer,
& Rosen, 1989; Johnson & Marakas, 2000; Martocchio & Dulebohn, 1994).
Contrary to the significant interest in understanding the role of CSE in
predicting computer learning and task performance, little attention has been
given to understanding the role of personal goal (PG), which is defined as the
performance standard an individual is trying to accomplish on a given task
(Locke & Latham, 1990). Goal setting theory (Locke & Latham, 1984, 1990)
views the constructs of both PG and self-efficacy as key determinants of task
performance that have powerful direct and independent effects. In various
studies conducted outside of the computer training domain, PG has been found
as powerful as and, in many cases, more powerful than self-efficacy in predicting
task performance (Bandura & Cervone, 1986; Earley & Lituchy, 1991; Locke
& Latham, 1990; Mitchell, et al., 1994; Wood & Locke, 1987). The joint effects
of self-efficacy and PG on performance indicates that performance is deter-
Copyright © 2005, Idea Group Inc. Copying or distributing in print or electronic forms without written
permission of Idea Group Inc. is prohibited.
TEAM LinG
Predicting Computer Task Performance
67
mined not only by how confident one is of being able to do the task at hand, but
also by how much one is trying to achieve. Goal setting theory also theorizes that
self-efficacy indirectly can influence task performance through its effect on PG.
Within the computer training domain, it is unknown how powerful PG is in
predicting trainee performance or how significantly CSE is linked to PG. Very
few studies, if any, have examined either the relative predictive power of CSE
and PG with regard to computer task performance or the relationship between
CSE and PG.
In an overview of past research on computer training, Gattiker (1992)
pointed out that many reports were based on studies of very short duration (less
than four hours), while literature suggested more extended hours of training and
skill practice for relatively complex tasks (Ackerman, 1992). In fact, most IS
training studies have focused on understanding the underlying mechanisms
behind only an initial skill set of a computer application. In sum, employing CSE
and PG, the present research develops a theoretical model that predicts
individual computer task performance and empirically validates the model in an
intensive computer software training program that lasted more than a month.
The rest of the chapter is organized as follows: Section 2 develops the
proposed theoretical model; Section 3 describes the study method employed for
this research; Section 4 presents the test of the proposed model using PLS; and
Section 5 discusses findings and concludes the paper by suggesting future
research directions and practical implications.
CONCEPTUAL BACKGROUND
AND RESEARCH MODEL
Figure 1 presents the research model. On the basis of social cognitive theory
(Bandura, 1977, 1986) and goal setting theory (Locke & Latham, 1984, 1990),
the model theorizes CSE and PG as the key determinants of computer task
performance. CSE is also hypothesized to influence computer task performance
through its effects on PG. The model includes two potentially relevant pretraining variables, prior experience and age, to isolate and control for pre-training
individual differences, thereby more precisely evaluating the theorized effects of
CSE and PG on computer task performance. Each element of the proposed
model and the specific hypotheses relating them are further described below.
Computer Self-Efficacy
Social cognitive theory (Bandura, 1977, 1986) posits that people are driven
neither by inner forces nor external stimuli only. Instead, human behavior is
explained by a model of triadic reciprocality in which behavior, cognitive and
personal factors, and environmental events all operate interactively as determi-
Copyright © 2005, Idea Group Inc. Copying or distributing in print or electronic forms without written
permission of Idea Group Inc. is prohibited.
TEAM LinG
68 Yi and Im
Figure 1. Proposed research model
Computer
Self-Efficacy
H1
Computer
Task
Performance
H3
H2
Personal
Goal
H4
Pre-training
Individual
Differences
Prior Experience
H5
Age
nants of each other. A key regulatory mechanism in this dynamic relationship
that affects human behavior is self-efficacy, people’s judgments of their
capabilities to perform certain activities. The theory postulates that psychological procedures, whatever their form, serve as a means of creating and strengthening expectations of personal efficacy (Bandura, 1997), which in turn determines what actions to take, how much effort to invest, how long to persevere, and
what strategies to use in the face of challenging situations.
According to Bandura (1986, 1997), self-efficacy is a situation-specific
belief regarding a specific task accomplishment. Bandura opposes the idea of
measuring global efficacy belief without specifying the activities or conditions
under which they must be performed, but he also acknowledges that it is a multilevel construct. It is important to draw a distinction between general CSE, which
operates at the general computing level across multiple application domains, and
software-specific CSE, which operates at the application-specific software level
(Marakas, Yi, & Johnson, 1998). The present model focuses on softwarespecific CSE, because it more closely corresponds in specificity to the task
performance criterion of the current context (Bandura, 1997). Self-efficacy
formulated at the general computing level is more appropriate in estimating one’s
ability to use a computer across diverse application domains (Marakas et al.,
1998).
Computer software training provides an opportunity for an end user to
obtain the component skills and the confidence required for effective use of the
target software application. Social cognitive theory (Bandura, 1986, 1997) posits
individual self-perception of efficacy as a key determinant of skill acquisition and
task performance. A substantial body of research has reported significant
empirical relationships between self-efficacy and performance (Colquitt, LePine,
Copyright © 2005, Idea Group Inc. Copying or distributing in print or electronic forms without written
permission of Idea Group Inc. is prohibited.
TEAM LinG
Predicting Computer Task Performance
69
& Noe, 2000; Kraiger, Ford, & Salas, 1993; Salas & Cannon-Bowers, 2001).
Previous research, specifically on computer training, has found post-training,
software-specific CSE to be a significant predictor of task performance (Compeau
& Higgins, 1995a; Gist et al., 1989; Johnson & Marakas, 2000; Martocchio &
Judge, 1997). However, our understanding of CSE in relation to task performance is limited, because most studies examined the predictive validity of CSE
with regard to a fairly simple task performance, focusing on the initial use of a
software program or one specific feature within the program. Extending prior
research, the present study examines the effect of post-training CSE on a
complex task performance, which requires the use of a comprehensive set of
software features, and hypothesizes that:
H1: Computer self-efficacy will positively influence computer task performance.
Personal Goal
The basic premise of goal setting theory (Locke & Latham, 1984, 1990) is
that conscious human behavior is purposeful and regulated by the individual’s
goal. Focusing on the question of why some individuals perform better on work
tasks than others, even when they are similar in ability and knowledge, the theory
seeks the answer from their differing levels of goals. Given that the person has
requisite ability and knowledge, the theory asserts that there is a positive linear
relationship between the level of goal and performance. That is, individuals with
more challenging goals exert more effort in line with the demands of the higher
performance standards (Bandura & Cervone, 1986; Terborg, 1976) and maintain
effort over more extended time (Sales, 1970; Singer, Korienek, Jarvis, McCloskey,
& Candeletti, 1981) than individuals with less challenging goals, thereby producing higher performance.
Although it is unknown specifically how PG is related to task performance
in the context of computer training, there is empirical evidence that PG affects
task performance over and above self-efficacy in a training or education context.
For example, Wood and Locke (1987) examined the relationship between PG
and performance in college courses. They found that grade goals were significantly related to academic course performance over and above the effects of
self-efficacy in three studies. In a meta-analysis based on the results of 13
studies, which measured each of the relationships between PG, self-efficacy,
and performance, Locke and Latham (1990) found the mean of the relationship
between PG and performance (r = .42) to be slightly higher than that of the
relationship between self-efficacy and performance (r = .39). These findings
suggest that PG can be a significant determinant of task performance in a
computer-training program. Thus, we hypothesize that:
Copyright © 2005, Idea Group Inc. Copying or distributing in print or electronic forms without written
permission of Idea Group Inc. is prohibited.
TEAM LinG
70 Yi and Im
H2: Personal goal will positively influence computer task performance.
In addition to the direct effects of PG and self-efficacy on individual
performance, goal setting theory (Locke & Latham, 1984, 1990) posits that selfefficacy affects performance through PG. That is, other things being equal,
individuals with higher self-efficacy perceptions tend to set higher goals and
subsequently achieve superior performance. In a meta-analysis, Locke and
Latham (1990) found the link between self-efficacy and PG (r = .39) to be as
strong as the link between self-efficacy and performance (r = .39). Earley and
Lituchy (1991) compared three motivational models that described the relationships among self-efficacy, PG, and performance in alternative ways and found
the study results to support consistently the mediating role of PG in the relation
of self-efficacy and performance as proposed by Locke and Latham (1990).
Based on these findings, we hypothesize the following:
H3: Computer self-efficacy will positively influence personal goal.
Individual Differences: Prior Experience and Age
Even when trainees have the same levels of goals and self-efficacy, they
may not perform at the same level due to their pre-training individual differences.
Studies on goal setting theory and self-efficacy have found that prior experience
(sometimes called past performance) with the task was a significant predictor of
performance over and above PG and self-efficacy (Mitchell et al., 1994; Wood
& Bandura, 1989; Wood & Locke, 1987). Colquitt et al. (2000) conducted a
meta-analytic review of training literature for the past 20 years and showed that
the effect of age on training outcomes was mediated only partially by selfefficacy and other motivational variables. In the context of end-user training,
several researchers have confirmed the significant role of prior experience (Bolt,
Killough, & Koh, 2001; Compeau & Higgins, 1995a; Johnson & Marakas, 2000;
Martocchio & Dulebohn, 1994; Olfman & Bostrom, 1991; Webster & Martocchio,
1993) and age (Martocchio, 1994; Martocchio & Webster, 1992; Webster &
Martocchio, 1995) in determining training outcomes. In those studies, training
outcomes were related positively to prior experience, but negatively to age. By
controlling for potentially relevant pre-training individual difference variables
and accounting for variance in task performance that is unrelated to CSE and PG,
which would otherwise increase error variance, the present research model
seeks to provide a more precise evaluation of the CSE and PG effects on task
performance. Thus, we hypothesize that:
H4: Prior experience will positively influence computer task performance.
H5: Age will negatively influence computer task performance.
Copyright © 2005, Idea Group Inc. Copying or distributing in print or electronic forms without written
permission of Idea Group Inc. is prohibited.
TEAM LinG
Predicting Computer Task Performance
71
METHOD
Procedure
A training program over a period of four weeks on an electronic spreadsheet
program (Microsoft Excel for Windows) was set up at a large university in the
eastern United States. Participants included 41 MBA students (41.5% female
and 58.5% male). The participant ages ranged from 24 to 48, with the average
of 29.4. Most participants (90.2%) reported using a spreadsheet program not
more than 10 hours a week. All the participants had work experience, with an
average of three to five years.
The training program started with the basic features of Excel and progressively covered more advanced features such as business modeling, charting and
graphing, financial and statistical analysis, database structuring and querying,
and development of complete business applications with macro programming
and interface design. The trainees met on four consecutive Saturdays and two
half-days—one half-day on the Friday just before the first Saturday, and the
other half-day on the Monday after the last Saturday. During the first half-day
session, trainees filled out a questionnaire that included demographic information, took a hands-on test designed to assess prior experience with Excel (25
minutes), and received a brief introductory lecture about basic spreadsheet
features. On the last Saturday, trainees again filled out a questionnaire that
included post-training software-specific CSE and PG measures. Two days later,
which was the last half-day, trainees took a comprehensive hands-on test for
computer task performance (150 minutes).
On each of the four Saturdays, trainees met from 9:00 A.M. to 5:00 P.M.
attending two lectures and two workshop sessions. Each lecture (one in the
morning and one in the afternoon) lasted for 90 minutes and introduced key
concepts, examples, and applications at a conceptual level to provide a frame of
reference within which the more detailed hands-on material could be assimilated.
The class was co-taught by two instructors, including one of the authors. The
instructors took turns covering different topics. The hands-on workshop session
lasted 90 minutes in the morning and 120 minutes in the afternoon. Trainees were
asked to solve assigned problems, from highly guided and detailed step-by-step
instruction to increasingly integrative case examples that required the trainees to
apply the newly acquired expertise in novel ways. Correct answers were
provided to allow trainees to self-check their own progress. To further reinforce
the training material, trainees were asked to solve a number of problems outside
of the training workshop. Table 1 summarizes the training procedures and
elements.
Copyright © 2005, Idea Group Inc. Copying or distributing in print or electronic forms without written
permission of Idea Group Inc. is prohibited.
TEAM LinG
72 Yi and Im
Table 1. Training procedures and elements
Week
1
Day
Fri.
1
2
3
4
Sat.
Sat.
Sat.
Sat.
5
Mon.
Training Elements
Pre-training Questionnaire
Prior Experience Assessment (25 min.)
Lecture & Workshop (1): Introduction to Excel
Lecture & Workshop (2 & 3): Building & Using Business Models
Lecture & Workshop (4 & 5): Analyzing & Managing Business Data
Lecture & Workshop (6 & 7): Developing Business Applications
Lecture & Workshop (8 & 9): Integrating with Other Applications
Post-training Questionnaire
Computer Task Performance Assessment (150 min.)
MEASURES
Computer Task Performance
The dependent variable of the study—computer task performance—was
measured by a comprehensive set of problems designed to evaluate the trainees’
overall competencies gained during the training (see Appendix A). Each problem
started typically with a description of a business problem, which was followed
by a list of computer tasks to be completed. The tasks required the use of
software functions such as present value analysis, two-input data table construction, charting, database filtering, pivot table analysis, interface design, and macro
programming. Upon completion of the test, the trainees submitted their results
on a provided diskette. Two graders independently graded the answers using a
scoring key on a scale from 0 to 100. The correlation between the grader scores
was high at .89 (p < .001). Each grader’s scores were used as indicators of the
task performance construct.
Computer Self-Efficacy
CSE was measured at the spreadsheet application level by five items
adopted from Johnson and Marakas (2000). Trainees were asked to indicate the
extent to which they agreed or disagreed with the following statements: “I
believe I have the ability to manipulate the way a number appears in a
spreadsheet;” “I believe I have the ability to use a spreadsheet to communicate
numeric information to others;” “I believe I have the ability to summarize
numeric information using a spreadsheet;” “I believe I have the ability to use a
spreadsheet to share numeric information with others;” and “I believe I have the
ability to use a spreadsheet to assist me in making decisions.” The self-efficacy
measure captured the magnitude (yes or no) and strength (on a scale from 1 to
10, where 1 = quite uncertain and 10 = quite certain) of each individual’s selfefficacy. For further analysis, the magnitude scale was converted to 0 (no) or 1
(yes), and then multiplied by the strength items per Lee and Bobko (1994).
Copyright © 2005, Idea Group Inc. Copying or distributing in print or electronic forms without written
permission of Idea Group Inc. is prohibited.
TEAM LinG
Predicting Computer Task Performance
73
Personal Goal
The measure consisted of two items adopted from prior research (Locke &
Bryan, 1968; Wood & Locke, 1987). The items were (1) the grade the trainee
hoped to make in the course, and (2) the personal goal the trainee had for the
course grade.
Prior Experience
Each subject’s prior experience with the target computer program was
measured using a hands-on skill test designed to assess basic spreadsheet skills
with 12 computer tasks (Johnson & Marakas, 2000; Yi & Davis, 2001). The test
included entering a formula in multiple cells, using functions to calculate total and
average amounts, computing year-to-date sales and % change of sales, copying
the format of a cell, and changing the formats of numbers (see Appendix B).
Each trainee saved the test result in a diskette and submitted the diskette at the
end of the test. The grading of the answers was handled by the spreadsheet
program module developed through several stages of programming and accuracy
verification. Each task was scored with 1 point for totally correct answers, .5
points for partially correct answers, and 0 for incorrect or missing answers. The
percentage of correct answers was calculated from the total scores and used as
the prior experience measure.
Demographics
Age, sex, length and frequency of computer use and spreadsheet program
use, and work experience were measured by the pre-training questionnaire. Only
age was a significant predictor of the task performance among these demographic variables.
RESULTS
Cronbach alpha measures of internal consistency reliability were all high
and acceptable at .92 for CSE, and .80 for PG. Further measure validation and
model testing were conducted using PLS (Partial Least Squares) Graph Version
2.91.03.04 (Chin & Frye, 1998), a structural equation modeling tool that utilizes
a component-based approach to estimation. The PLS approach (Agarwal &
Karahanna, 2000; Barclay, Higgins, & Thomson, 1995; Chin, 1998; Compeau,
Higgins, & Huff, 1999; Falk & Miller, 1992; Wold, 1982), like other structural
equation modeling (SEM) techniques such as LISREL (Jöreskog & Sörbom,
1993) and EQS (Bentler, 1985), allows researchers to simultaneously assess
measurement model parameters and structural path coefficients. Whereas
covariance-based SEM techniques such as LISREL and EQS use a maximum
likelihood function to obtain estimators in models, the component-based PLS
uses a least squares estimation procedure.
Copyright © 2005, Idea Group Inc. Copying or distributing in print or electronic forms without written
permission of Idea Group Inc. is prohibited.
TEAM LinG
74 Yi and Im
PLS avoids many of the restrictive assumptions underlying covariancebased structural equation modeling (SEM) techniques such as multivariate
normality and large sample size (Barclay et al., 1995; Chin, 1998; Fornell &
Bookstein, 1982; Wold, 1982). Chin (1998, p. 311) advises that if one were to use
a regression heuristic of 10 cases per indicator, the sample size requirement
would be 10 times (1) the largest number of formative indicators or (2) the largest
number of independent variables impacting a dependent variable, whichever is
the greater. In our model, all items are modeled as reflective indicators, because
they are viewed as effects (not causes) of latent variables (Bollen & Lennox,
1991), and the largest number of independent variables estimated for a dependent variable is four. Thus, our sample size of 41 meets the requirement for the
PLS estimation procedures.
PLS Measurement Model
The measurement model in PLS is assessed by examining internal consistency and convergent and discriminant validity (Barclay et al., 1995; Chin, 1998;
Compeau et al., 1999). Internal consistency reliability (similar to Cronbach’s
alpha) of .7 or higher is considered adequate (Agarwal & Karahanna, 2000;
Barclay et al., 1995; Compeau et al., 1999). Convergent and discriminant validity
is assessed in two ways: (1) the square root of the average variance extracted
(AVE) by a construct from its indicators should be at least .707 (i.e., AVE > .50)
and should exceed that construct’s correlation with other constructs (Barclay et
al., 1995; Chin, 1998; Fornell & Larcker, 1981); and (2) item loadings (similar to
item loadings in principal components) should be at least .707, and items should
load more highly on constructs they are intended to measure than on other
constructs (Agarwal & Karahanna, 2000; Compeau et al., 1999).
Table 2 shows internal consistency reliabilities, convergent and discriminant
validities, and correlations among constructs. The internal consistency reliabilities
all were higher than .90, exceeding the reliability criteria of .70. As strong
evidence of convergent and discriminant validity, the square root of the AVE for
Table 2. Reliabilities, convergent and discriminant validities, and correlations
among constructs
Construct
ICR
1
2
3
4
5
.88
1. Computer Self-efficacy
.94
2. Personal Goal
.92
.39 .92
1.00
3. Prior Experience
1.00
-.04 .07
4. Age
1.00
-.02 .08
.25 1.00
.97
5. Computer Task Performance
.97
.28 .39
.38 -.16
Note. ICR = Internal Consistency Reliability, which should be greater than .70. Diagonal
elements (bold) are the square root of average variance extracted (AVE) between the
constructs and their indicator(s). Off-diagonal elements are correlations between constructs.
For convergent and discriminant validity, diagonal elements should be at least .707 (i.e., AVE
> .50) and larger than off-diagonal elements in the same row and column.
Copyright © 2005, Idea Group Inc. Copying or distributing in print or electronic forms without written
permission of Idea Group Inc. is prohibited.
TEAM LinG
Predicting Computer Task Performance
75
Table 3. Factor matrix
Scale Items
1. Computer Self-efficacy
a. manipulate the way a number appears
b. use a spreadsheet to communicate
c. summarize numeric information
d. share numeric information
e. use a spreadsheet to assist me in making decisions
1
2
3
4
5
.76
.95
.95
.93
.76
.25
.35
.41
.37
.28
-.02
-.09
-.03
.01
-.02
-.01
-.01
-.01
-.01
-.04
.26
.27
.24
.23
.21
2. Personal Goal
a. grade I hope to make
b. personal goal for the course
.36
.35
.92
.92
.10
.03
.11
.04
.34
.38
3. Prior Experience
a. pre-training test score
-.03
.07
1.00
.24
.38
-.02
.08
.24
1.00
-.16
.21
.32
.30
.45
.40
.33
-.18
-.14
.97
.97
4. Age
a. trainee self-reported age
5. Computer Task Performance
a. grader 1 score
b. grader 2 score
each construct was greater than .707 (i.e., AVE > .50) and greater than the
correlation between that construct and other constructs, without exception.
Table 3 provides the factor structure matrix of loadings and cross-loadings.
The factor matrix shows that all items without exception exhibited high loadings
(> .707) on their respective constructs and no items without exception loaded
higher on the other constructs. Overall, the measured scales show excellent
psychometric properties with high reliability and appropriate convergent and
discriminant validity.
PLS Structural Model
The PLS structural model and hypotheses were assessed by examining path
coefficients (similar to standardized beta weights in a regression analysis) and
their significance levels. As recommended (Chin, 1998), bootstrapping (with 120
subsamples) was performed to test the statistical significance of each path
coefficient using t-tests. Inconsistent with H1, CSE had no significant effect on
task performance (b = .16, ns). Supporting H2, PG had a significant effect on
task performance (b = .32, p < .05). Supporting H3, CSE had a significant effect
on PG (b = .39, p < .05). Supporting H4, prior experience had a significant effect
on task performance (b = .43, p < .05). Supporting H5, age had a significant
effect on task performance in the expected direction (b = -.29, p < .05). The
model explained substantial variance in computer task performance (R2 = .38).
Figure 2 summarizes the results of model testing.
Although the earlier discussion of PLS with sample size requirements
justifies the use of PLS in our study, we also tested the research model using
ordinary least-squares regression method (Cohen & Cohen, 1983) to crossexamine the PLS testing results. Results from this analysis were almost identical
Copyright © 2005, Idea Group Inc. Copying or distributing in print or electronic forms without written
permission of Idea Group Inc. is prohibited.
TEAM LinG
76 Yi and Im
Figure 2. Model testing results
Computer
Self-Efficacy
.16
Computer
Task
Performance
.39*
.32*
Personal
Goal
R2 = .38
.43*
-.29*
Prior Experience
Age
to the results from the PLS analysis. All the significant paths in the PLS model
remained significant, and the path coefficients were very similar—the difference
between the two corresponding paths between the PLS model and the regression
model was always less than .01.
DISCUSSION
Summary of Findings
Overall, there was significant empirical support for the proposed model. As
expected, PG was a significant predictor of computer task performance. Past
experience and age were also significant predictors of computer task performance. CSE was significantly related to PG. Four of five hypotheses were
supported. Contrary to expectation, the hypothesized effect of post-training CSE
on task performance (H1) was not supported, indicating a weaker contribution
of CSE for the given set of task skills than was expected. As trainees build their
confidence in using the software application in an extended training period, the
predictive strength of software-specific CSE seems to diminish rapidly. Mitchell
et al. (1994) found that PG and past performance were better predictors of
performance than self-efficacy as experience with an air traffic control task
increased. Our findings are consistent with their results.
The specific contributions of the present research can be articulated by
comparing it with other similar studies. In the computer-training context, a
number of studies showed a significant effect of software-specific CSE on
learning or task performance (Compeau & Higgins, 1995; Johnson & Marakas,
2000; Martocchio & Dulebohn, 1994), but did not examine the effect of PG as
Copyright © 2005, Idea Group Inc. Copying or distributing in print or electronic forms without written
permission of Idea Group Inc. is prohibited.
TEAM LinG
Predicting Computer Task Performance
77
a determinant of task performance. The current study shows that PG is a more
powerful determinant of computer task performance than CSE. Evans & Simkin
(1989) examined 34 independent variables to find that those individual difference
variables, while the number was considerable, could explain only 23% of the
variance in computer proficiency. The results, which were similar to the results
of other studies, show that the task of finding effective predictors of computer
proficiency and task performance is elusive. Using only four variables, the
current research model explained considerable variance in post-training handson task performance (R2 = .38) designed to measure trainee competencies
gained over a one-month period of computer software training in a field study
setting. Outside of the computer-training domain, Wood and Locke (1987)
examined self-efficacy, PG, and ability, explaining 25% to 28% variation in
academic performance. The current study model outperforms those models in
accounting for individual task performance.
The present study introduces a new variable—PG—which has been shown
to be an important determinant of task performance in other domains into the
computer-training domain. The findings show that PG affects computer task
performance over and above self-efficacy, prior experience, and age. The study
results support the applicability of goal-setting theory (Locke & Latham, 1990)
to an end-user training program and identify an important underlying mechanism
that governs an individual’s computer task performance. Despite the significant
amount of interest on self-efficacy, most computer training studies have demonstrated the predictive validity of CSE in relation to performance for fairly simple
tasks. Our findings suggest that PG plays a more important role in acquiring
complex computer skills. Also, it should be noted that the present study was
conducted in a longitudinal field study setting that lasted more than a month,
covering a full range of skills required for the effective use of a sophisticated
software program. Most previous studies on computer training were conducted
in a relatively short period of time (typically less than a day or two), focusing on
an initial skill set of a computer application. Consequently, our understanding of
the mechanisms that govern the process of computer skill acquisition (in
particular, beyond the initial phase) has been limited. The current study demonstrated that for complex computer skill acquisition, PG is a more powerful
predictor of task performance, and that self-efficacy has no significant effect on
task performance over and above PG. Instead, a self-efficacy belief with regard
to a specific software program is a significant determinant of PG, influencing
task performance indirectly via PG. Although future research should further
compare the relative effects of these two constructs under varying training
conditions, the current study extends prior work by empirically demonstrating the
predictive validity of PG in a computer-training context and testing the theorized
causal chains among CSE, PG, and task performance.
Copyright © 2005, Idea Group Inc. Copying or distributing in print or electronic forms without written
permission of Idea Group Inc. is prohibited.
TEAM LinG
78 Yi and Im
Limitations and Future Research Implications
Several limitations of the present study should be noted. One of the trainers
was the principal investigator who was aware of the study hypotheses. However, this study did not involve any treatments or manipulations. In addition,
trainees were fully informed that the content of their questionnaire responses
would not affect their grade in any way. The post-training variables were not
available during training, and the performance assessments were handled either
by a computer program or human graders who were not aware of the hypotheses. Thus, the possible threats of hypothesis guessing, evaluation apprehension,
and experimenter expectations to internal validity (Cook & Campbell, 1979)
were avoided or minimized for this study.
Recent motivation research has found that self-efficacy and PG are
influenced by certain personal factors such as goal orientation (Ford, Smith,
Weissbein, & Gully, 1998; Phillips & Gully, 1997; Steele-Johnson, Beauregard,
Hoover, & Schmidt, 2000), locus of control (Phillips & Gully, 1997), self-esteem
(Pilegge & Holtz, 1997; Tang & Sarsfield-Baldwin, 1991), cognitive abilities
(Kanfer & Ackerman, 1989; Kanfer, Ackerman, & Heggestad, 1996), and
achievement motivation (Mathieu, Martineau, & Tannenbaum, 1993; Phillips &
Gully, 1997). Also, many studies have demonstrated that self-efficacy and PG
affect the development and use of effective task strategies to solve problems
(Chesney & Locke, 1991; Gilliland & Landis, 1992; Wood & Bandura, 1989).
These antecedent and consequent variables have not been incorporated into our
current research model. Given that the model received empirical support in the
context of computer training, further relations between these variables and the
study variables of PG and CSE should be examined by future research in order
to properly extend the current model and develop more in-depth understanding
of the processes governing computer skill acquisition.
With regard to external validity, support for the study model should be tested
in different contexts. The present study was conducted with MBA students, all
of whom had work experience. The chosen software was a popular spreadsheet
program, highly useful in the workplace. The length of the training program was
more than a month, which is longer than most prior computer training studies. The
assessed performance outcomes included skills that can be used directly in real
work settings. Thus, the current study maintains many important characteristics
similar to organizational training settings. However, the findings should be
validated in other settings by future research beyond the specific conditions of
this study to ensure generalizability of the study findings.
Implications for Practice
The present study demonstrates the important roles PG and self-efficacy
play in the process of computer skill acquisition. Organizational or training
Copyright © 2005, Idea Group Inc. Copying or distributing in print or electronic forms without written
permission of Idea Group Inc. is prohibited.
TEAM LinG
Predicting Computer Task Performance
79
interventions that positively influence these variables are likely to produce
significant improvements in computer task performance, which is the main driver
of end-user productivity in the workplace. Over the past decades, prior studies
identified several interventions to enhance CSE such as behavior modeling
(Compeau & Higgins, 1995a; Gist et al., 1989), positive performance feedback
(Martocchio & Webster, 1992), induced conception of ability (Martocchio,
1994), and management support (Henry & Stone, 1994). Outside of the
computer-training context, the goal-setting research has identified a number of
interventions that can affect PG, including assigned goals (Meyer & Gellatly,
1988), group goals (Matsui, Kakuyama, & Onglatco, 1987), role modeling
(Rakestraw & Weiss, 1981), and normative information (Earley & Erez, 1991).
Although the specific effects of such an intervention on self-efficacy and PG and
subsequent task performance in the context of computer skill training still need
to be examined by future research, these interventions have the potential to
substantially improve an end user’s computer task performance.
We have found that prior experience and age have positive and negative
significant effects respectively on the development of computer skill acquisition.
People who enter a training program with relatively little or no prior exposure to
the target software should be given extra attention in order to be successful in
acquiring computer skills, and older trainees should be supported with more care
than younger trainees. Given that the effects of prior experience and age on task
performance were in the opposite directions, providing more hands-on experience with the software before training should help older trainees become
successful in acquiring computer skills.
CONCLUSION
In conclusion, this research developed a theoretical model that predicts
individual task performance in an end-user computer training context using the
central constructs of goal-setting theory (Locke & Latham, 1984, 1990) and
social cognitive theory (Bandura, 1977, 1986), and empirically validated the
proposed model in a longitudinal field setting. The model has received significant
empirical support. The present study extends previous research on end-user
training by introducing a new variable—PG—and empirically demonstrating its
importance in mediating the effect of CSE and predicting computer task
performance. Organizational or training interventions that make positive impacts
on these motivational variables should contribute to an end user’s improved
computer task performance, leading to increased work productivity.
Copyright © 2005, Idea Group Inc. Copying or distributing in print or electronic forms without written
permission of Idea Group Inc. is prohibited.
TEAM LinG
80 Yi and Im
REFERENCES
Ackerman, P.L. (1992). Predicting individual differences in complex skill
acquisition: Dynamics of ability determinants. Journal of Applied Psychology, 77(5), 598-614.
Agarwal, R., & Karahanna, E. (2000). Time flies when you’re having fun:
Cognitive absorption and beliefs about information technology usage. MIS
Quarterly, 24(4), 665-694.
Bandura, A. (1977). Social learning theory. Englewood Cliffs, NJ: PrenticeHall.
Bandura, A. (1986). Social foundations of thought and action: A social
cognitive theory. Englewood Cliffs, NJ: Prentice-Hall.
Bandura, A. (1997). Self-efficacy: The exercise of control. New York: W.H.
Freeman and Company.
Bandura, A., & Cervone, D. (1986). Differential engagement of self-reactive
influences in cognitive motivation. Organizational Behavior and Human
Decision Processes, 38, 92-113.
Barclay, D., Higgins, C., & Thompson, R. (1995). The partial least squares
approach to causal modeling: Personal computer adoption and use as an
illustration. Technology Studies, 2(2), 285-309.
Bentler, P.M. (1985). Theory and implementation of EQS: A structural
equations program. Los Angeles: BMDP Statistical Software.
Bohlen, G.A., & Ferratt, T.W. (1997). End user training: An experimental
comparison of lecture versus computer-based training. Journal of End
User Computing, 9(3), 14-27.
Bollen, K.A., & Lennox, R. (1991). Conventional wisdom on measurement: A
structural equation perspective. Psychological Bulletin, 110, 305-314.
Bolt, M.A., Killough, L.N., & Koh, H.C. (2001). Testing the interaction effects
of task complexity in computer training using the social cognitive model.
Decision Sciences, 32(1), 1-20.
Bostrom, R.P., Olfman, L., & Sein, M.K. (1990). The importance of learning
style in end-user training. MIS Quarterly, 14, 101-117.
Carroll, J.M., & Rosson, M.B. (1987). Paradox of the active user. In J. M.
Carroll (Ed.), Interfacing though: Cognitive aspects of human-computer interaction (pp. 80-111). Cambridge, MA: MIT Press.
Cheney, P.H., Mann, R.I., & Amoroso, D.L. (1986). Organizational factors
affecting the success of end-user computing. Journal of Management
Information Systems, 3(1), 65-80.
Chesney, A.A., & Locke, E.A. (1991). Relationships among goal difficulty,
business strategies, and performance on a complex management simulation
task. Academy of Management Journal, 34(2), 400-424.
Chin, W.W. (1998). The partial least squares approach to structural equation
modeling. In G. A. Marcoulides (Ed.), Modern methods for business
research (pp. 295-336). Mahwah, NJ: Lawrence Erlbaum Associates.
Copyright © 2005, Idea Group Inc. Copying or distributing in print or electronic forms without written
permission of Idea Group Inc. is prohibited.
TEAM LinG
Predicting Computer Task Performance
81
Chin, W.W., & Frye, T.A. (1998). PLS-Graph (Version 2.91.03.04).
Cohen, J., & Cohen, P. (1983). Applied multiple regression/correlation
analysis for the behavioral sciences (2nd ed.). Hillsdale, NJ: Lawrence
Erlbaum Associates.
Colquitt, J.A., LePine, J.A., & Noe, R.A. (2000). Toward an integrative theory
of training motivation: A meta-analytic path analysis of 20 years of
research. Journal of Applied Psychology, 85, 678-707.
Compeau, D., Higgins, C.A., & Huff, S. (1999). Social cognitive theory and
individual reactions to computing technology: A longitudinal study. MIS
Quarterly, 23(2), 145-158.
Compeau, D.R., & Higgins, C.A. (1995a). Application of social cognitive theory
to training for computer skills. Information Systems Research, 6(2), 118143.
Compeau, D.R., & Higgins, C.A. (1995b). Computer self-efficacy: Development of a measure and initial test. MIS Quarterly, 19(2), 189-211.
Cook, T.D., & Campbell, D.T. (1979). Quasi-experimentation design and
analysis issues for field settings. Boston, MA: Houghton Mifflin.
Earley, P.C., & Erez, M. (1991). Time-dependency effects of goals and norms:
the role of cognitive processing on motivational models. Journal of
Applied Psychology, 76(5), 717-724.
Earley, P.C., & Lituchy, T.R. (1991). Delineating goal and efficacy effects: A
test of three models. Journal of Applied Psychology, 76, 81-98.
Evans, G.E., & Simkin, M.G. (1989). What best predicts computer proficiency?
Communications of the ACM, 32(11), 1322-1327.
Falk, R.F., & Miller, N.B. (1992). A primer for soft modeling. Akron, OH: The
University of Akron.
Ford, J.K., Smith, E.M., Weissbein, D.A., & Gully, S.M. (1998). Relationships
of goal orientation, metacognitive activity, and practice strategies with
learning outcomes and transfer. Journal of Applied Psychology, 83(2),
218-233.
Fornell, C., & Bookstein, L. (1982). Two structural equation models: LISREL
and PLS applied to consumer exit-voice theory. Journal of Marketing
Research, 19, 440-452.
Fornell, C., & Larcker, D.F. (1981). Evaluating structural equations models with
unobservable variables and measurement error. Journal of Marketing
Research, 18(1), 39-50.
Ganzel, R. (1998, April). Feeling squeezed by technology? Training, 62-70.
Gattiker, U. (1992). Computer skills acquisition: A review and future directions
for research. Journal of Management, 18(3), 547-574.
Gilliland, S.W., & Landis, R.S. (1992). Quality and quantity goals in a complex
decision task: Strategies and outcomes. Journal of Applied Psychology,
77(5), 672-681.
Copyright © 2005, Idea Group Inc. Copying or distributing in print or electronic forms without written
permission of Idea Group Inc. is prohibited.
TEAM LinG
82 Yi and Im
Gist, M.E., Schwoerer, C., & Rosen, B. (1989). Effects of alternative training
methods on self-efficacy and performance in computer software training.
Journal of Applied Psychology, 74(6), 884-891.
Henry, J.W., & Stone, R.W. (1994). A structural equation model of end-user
satisfaction with a computer-based medical information system. Information Resources Management Journal, 7(3), 21-33.
Hill, T., Smith, N.D., & Mann, M.F. (1987). Role of efficacy expectations in
predicting the decision to use advanced technologies: The case of computers. Journal of Applied Psychology, 72(2), 307-313.
Industry Report. (2001). Training, 38(10), 40-75.
Johnson, R.D., & Marakas, G.M. (2000). The role of behavior modeling in
computer skill acquisition—Toward refinement of the model. Information
Systems Research, 11, 402-417.
Jöreskog, K.G., & Sörbom, D. (1993). LISREL 8: User’s reference guide.
Chicago: Scientific Software, Inc.
Kanfer, R., & Ackerman, P.L. (1989). Motivation and cognitive abilities: An
integrative/aptitude-treatment interaction approach to skill acquisition.
Journal of Applied Psychology—Monograph, 74, 657-690.
Kanfer, R., Ackerman, P.L., & Heggestad, E.D. (1996). Motivational skills &
self-regulation for learning: A trait perspective. Learning and Individual
Differences, 8(3), 185-209.
Kraiger, K., Ford, J.K., & Salas, E. (1993). Application of cognitive, skill-based,
and affective theories of learning outcomes to new methods of training
evaluation. Journal of Applied Psychology, 78(2), 311-328.
Landauer, T.K. (1995). The trouble with computers: Usefulness, usability,
and productivity. Cambridge, MA: MIT Press.
Locke, E.A., & Bryan, J.F. (1968). Grade goals as determinants of academic
achievement. Journal of General Psychology, 79, 217-228.
Locke, E.A., & Latham, G.P. (1984). Goal-setting: A motivational technique
that works. Englewood Cliffs, NJ: Prentice-Hall.
Locke, E.A., & Latham, G.P. (1990). A theory of goal setting and task
performance. Englewood Cliffs, NJ: Prentice-Hall.
Marakas, G.M., Yi, M.Y., & Johnson, R.D. (1998). The multilevel and multifaceted character of computer self-efficacy: Toward clarification of the
construct and an integrative framework for research. Information Systems Research, 9(2), 126-163.
Marcolin, B.L., Munro, M.C., & Campbell, K.G. (1997). End user ability: Impact
of job and individual differences. Journal of End User Computing, 9(3),
3-12.
Martocchio, J.J. (1994). Effects of conceptions of ability on anxiety, selfefficacy, and learning in training. Journal of Applied Psychology, 79(6),
819-825.
Copyright © 2005, Idea Group Inc. Copying or distributing in print or electronic forms without written
permission of Idea Group Inc. is prohibited.
TEAM LinG
Predicting Computer Task Performance
83
Martocchio, J.J., & Dulebohn, J. (1994). Performance feedback effects in
training: The role of perceived controllability. Personnel Psychology, 47,
357-373.
Martocchio, J.J., & Judge, T.A. (1997). Relationship between conscientiousness and learning in employee training: Mediating influences of selfdeception and self-efficacy. Journal of Applied Psychology, 82(5), 764773.
Martocchio, J.J., & Webster, J. (1992). Effects of feedback and cognitive
playfulness on performance in microcomputer software training. Personnel Psychology, 45, 553-578.
Mathieu, J. E., Martineau, J.W., & Tannenbaum, S.I. (1993). Individual and
situational influences on the development of self-efficacy: Implications for
training effectiveness. Personnel Psychology, 46, 125-147.
Matsui, T., Kakuyama, T., & Onglatco, M.L. (1987). Effects of goals and
feedback on performance in groups. Journal of Applied Psychology, 72,
407-415.
McCarroll, T. (1991). What new age? Time, 138, 44-46.
McLean, E.R., Kappelman, L.A., & Thompson, J.P. (1993). Converging enduser and corporate computing. Communications of the ACM, 36(12), 7992.
Meyer, J.P., & Gellatly, I.R. (1988). Perceived performance norm as a mediator
in the effect of assigned goal on personal goal and task performance.
Journal of Applied Psychology, 73, 410-420.
Mitchell, T.R., Hopper, H., Daniels, D., George-Falvy, J., & James, L.R. (1994).
Predicting self-efficacy and performance during skill acquisition. Journal
of Applied Psychology, 79(4), 506-517.
Nelson, R.R., & Cheney, P.H. (1987). Training end users: An exploratory study.
MIS Quarterly, 11(4), 547-559.
Olfman, L., & Bostrom, R. P. (1991). End-user software training: An experimental comparison of methods to enhance motivation. Journal of Information Systems, 1, 249-266.
Phillips, J.M., & Gully, S.M. (1997). Role of goal orientation, ability, need for
achievement, and locus of control in the self-efficacy and goal-setting
process. Journal of Applied Psychology, 82(5), 792-802.
Pilegge, A.J., & Holtz, R. (1997). The effects of social identity on the self-set
goals and task performance of high and low self-esteem individuals.
Organizational Behavior and Human Decision Processes, 70, 17-26.
Rakestraw, T.L., & Weiss, H.M. (1981). The interaction of social influences and
task experience on goals, performance, and performance satisfaction.
Organizational Behavior and Human Decision Processes, 27, 326-344.
Salas, E., & Cannon-Bowers, J.A. (2001). The science of training: A decade of
progress. Annual Review of Psychology, 52, 471-499.
Copyright © 2005, Idea Group Inc. Copying or distributing in print or electronic forms without written
permission of Idea Group Inc. is prohibited.
TEAM LinG
84 Yi and Im
Sales, S.M. (1970). Some effects on role overload and role underload. Organizational Behavior and Human Decision Processes, 5, 592-608.
Singer, R.N., Korienek, G., Jarvis, D., McColskey, D., & Candeletti, G. (1981).
Goal-setting and task persistence. Perceptual and Motor Skills, 53, 881882.
Steele-Johnson, D., Beauregard, R.S., Hoover, P.B., & Schmidt, A.M. (2000).
Goal orientation and task demand effects on motivation, affect, and
performance. Journal of Applied Psychology, 85(5), 724-738.
Tang, T.L., & Sarsfield-Baldwin, L. (1991). The effects of self-esteem, task
label, and performance feedback on goal setting, certainty, and attribution.
The Journal of Psychology, 125, 413-418.
Taylor, S., & Todd, P.A. (1995). Understanding information technology usage:
A test of competing models. Information Systems Research, 6(2), 144176.
Terborg, J.R. (1976). The motivational components of goal setting. Journal of
Applied Psychology, 61, 613-621.
Venkatesh, V. (2000). Determinants of perceived ease of use: Integrating
control, intrinsic motivation, and emotion into the technology acceptance
model. Information Systems Research, 11(4), 342-365.
Webster, J., & Martocchio, J.J. (1992). Microcomputer playfulness: Development of a measure with workplace implications. MIS Quarterly, 16(2),
201-226.
Webster, J., & Martocchio, J.J. (1993). Turning work into play: Implications for
microcomputer software training. Journal of Management, 19(1), 127146.
Webster, J., & Martocchio, J.J. (1995). The differential effects of software
training previews on training outcomes. Journal of Management, 21(4),
757-787.
Wildstrom, S.H. (1998). They’re mad as hell out there. Business Week, 3600,
32-33.
Wold, H. (1982). Systems under indirect observation using PLS. In C. Fornell
(Ed.), A second generation of multivariate analysis, volume I: Methods
(pp. 325-347). New York: Praeger.
Wood, R.E., & Bandura, A. (1989). Social cognitive theory of organizational
management. Academy of Management Review, 14, 361-384.
Wood, R.E., & Locke, E.A. (1987). The relation of self-efficacy and grade goals
to academic performance. Educational and Psychological Measurement, 47, 1013-1024.
Yi, M.Y., & Davis, F.D. (2001). Improving computer training effectiveness for
decision technologies: Behavior modeling and retention enhancement.
Decision Sciences, 32(3), 521-544.
Copyright © 2005, Idea Group Inc. Copying or distributing in print or electronic forms without written
permission of Idea Group Inc. is prohibited.
TEAM LinG
Predicting Computer Task Performance
85
ENDNOTE
1
This chapter is based on the authors’ prior work that appeared in Journal
of Organizational and End User Computing, 16(2), pp. 20-37.
APPENDIX A:
COMPUTER TASK PERFORMANCE
Problem 1: Present Values, Data Tables, and Charts
A company is considering whether or not to undertake a project. If the
project is undertaken, there will be development costs during the first three years,
and then there will be projected positive cash flows for the next six years. (It is
estimated that after six years, the project will end.)
Development costs can be estimated with relative certainty. The estimated
development costs in Years 1, 2, and 3 are $150, $250, and $100, respectively.
(All dollar figures are in units of millions of dollars; that is, the currency unit is
$1,000,000. All costs are assumed to occur at the end of the year.)
Projected cash flows are relatively uncertain. In particular, the size of the
market for the product is uncertain, so the cash flow at the end of Year 4 (the
year the product will be launched) is uncertain.
Whatever the cash flow turns out to be in Year 4, it is estimated that the
Year-5 cash flow will exceed that in Year 4 by 20%; the cash flow in Year 6 will
exceed that in Year 5 by 15%; the cash flow in Year 7 will equal that in Year
6; the cash flow in Year 8 will be 10% less than that in Year 7; and the cash flow
in Year 9 will be 20% less than that in Year 8. (After Year 8, it is assumed the
project will be at an end.) These estimates are summarized in the following table:
Year
4
5
6
7
8
9
Cash Flow Relative to Preceding Year
Not Applicable
Up by 20%
Up by 15%
No Change
Down by 10%
Down by 20%
All cash flows are realized at the end of the corresponding year. Your goal
is to estimate the present value of the project under alternative assumptions about
the Year-4 cash flow (note that all subsequent cash flows are linked to the Year4 cash flow) and the Discount Rate (i.e., the interest rate). Details are described.
Copyright © 2005, Idea Group Inc. Copying or distributing in print or electronic forms without written
permission of Idea Group Inc. is prohibited.
TEAM LinG
86 Yi and Im
Part A
Assume that the Year-4 cash flow is $150 currency units, and that the
Discount Rate is 15%. In the Prob 1 worksheet in the exam workbook, where
a starting structure has already been provided, enter the numbers and formulas
needed to compute the projected cash flows and to compute the present value
of the project (Hint: Enter 150 in cell G12, and enter the formula =G12 in cell D9.
Use the NPV function in cell G14).
The beginning of Year 1 is the time point for which the present value is to
be computed.
Part B
Your boss wants to know how the present value of the proposed project
varies with alternative assumptions about the discount rate and the estimated
Year-4 cash flow.
In this regard, complete the two-input data table that has been started on the
Prob 1 worksheet. A series of alternative assumed discount rates and estimated
Year-4 cash flows has already been entered for you on the Prob 1 worksheet.
Part C
Your boss believes that a picture is worth a thousand words. You kind of
believe that yourself.
In any event, you’re not in a position to disagree. In order to keep your boss
happy, you decide to produce a chart based on the information in your two-input
data table from Part B. (Produce the chart directly from the two-input data table;
do not take the time needed to reproduce the numbers in the data table elsewhere
on the worksheet first.)
The chart you produce should match that shown below.
Present Value As a Function of Discount Rate
(The Plotting Param eter is the Assum ed Year 4 Cash Flow )
$100
Present Value
$400
$125
$200
$0
10%
-$200
$150
$175
15%
20%
25%
30%
$200
Discount Rate
Use your two-input data table to produce the chart shown above. Position
the chart beginning in cell C26 on the Prob 1 worksheet.
Pay careful attention to all details regarding such things as the scales on the
horizontal and vertical axes, the chart title (whose font size is 8), and the plot
background, which is “none.”
Copyright © 2005, Idea Group Inc. Copying or distributing in print or electronic forms without written
permission of Idea Group Inc. is prohibited.
TEAM LinG
Predicting Computer Task Performance
87
Problem 2: Excel Lists (Internal Databases)
Consider the set of records contained in the Prob 2 worksheet in the exam
workbook. The field names and the first several records in the database are
shown next.
Work Category
9
8
2
8
9
4
6
2
9
Skill Code
1
1
1
4
4
1
3
1
1
Years Experience
8
7
13
4
14
5
7
9
8
Salary
$37,665
$35,965
$35,682
$36,491
$46,717
$29,640
$36,191
$32,063
$38,343
Employee ID
1005
1011
1012
1014
1018
1020
1023
1025
1031
These records are from a temporary employment agency’s workforce
database and consist of fields named Work Category, Skill Code, Years
Experience, Salary, and Employee ID, as shown. These records are to be left
exactly as is on the Prob 2 worksheet. Do not sort them, do not filter them in
place, do not copy them to the clipboard and paste them elsewhere, and so forth.
Part A: Pivot Table Showing Average Employee Salaries
Build a Pivot Table on the Prob 2 worksheet that processes the database to
show average employee salaries by Work Category (row field) and Skill Code
(column field), indexed by Years Experience (page field).
Have the Pivot Table start in cell G2 of the Prob 2 worksheet. Do not include
grand totals for columns and rows in the table. After building the table,
autoformat the cell range G4:L15 in the Accounting 2 style. Be sure the Pivot
Table setting displays average salaries aggregated over All Years Experience.
Part B: List of Selected Employees
On the Prob 2 worksheet, use advanced filtering (Data / Filter / Advanced
Filter) to extract from the database a list of employees whose work-category/
skill-code combinations are as follows:
Work Category
2
3
6
6
8
Skill Code
2
2
3
4
5
Copyright © 2005, Idea Group Inc. Copying or distributing in print or electronic forms without written
permission of Idea Group Inc. is prohibited.
TEAM LinG
88 Yi and Im
Caution: As indicated, the advanced filtering approach is to be taken in
building the extracted list. No credit will be given for using approaches other than
that of advanced filtering.
1.
2.
3.
4.
Details:
Locate the criteria range beginning in cell G18 of the Prob 2 worksheet.
(Field names for the criteria range will be in row 18, the first criteria record
will be in row 19, and so forth.)
Position the extracted records beginning in cell G29 of the Prob 2 worksheet.
Row 29 should contain the field names for the extracted records; row 30
should contain the first extracted record, and so forth.
The extracted records should be composed of the following fields in this
left-to-right order:
Skill Code; Work Category; Employee ID; Salary
After extracting the records, sort them in descending order on Skill Code.
Break Skill Code ties by sorting on Work Category in descending order.
Break Work Category ties by sorting on Salary in ascending order.
Problem 3: Macro Programming
Your goal is to create a form to sear a list of names. Include two buttons on
your form—Search and Cancel. The user provides the input of a last name. After
specifying the last name, when the user clicks on Search, your VBA-based
macro should search the list provided to you in Sheet Prob3 and print the person’s
first name, phone number, and office location in three separate labels on the same
form. Your search should work, irrespective of case. If no match is found, the
dialog box should say, “No match found.” Assume there are no duplicate entries
of last name. Cancel should close the form. You are not required to create any
custom menu items to make this form appear.
Hint: Use the function UCase() in Visual Basic to make your search case
insensitive.
APPENDIX B: PRIOR EXPERIENCE TEST
Using Excel, complete the following tasks. You have 30 minutes for the test.
1.
2.
3.
Enter a formula to compute profits (=sales - expenses) for each season in
cells B8:E8.
Using an appropriate function, compute the total amounts of sales, expenses, and profits. The computed amounts should be located in cells F6:F8.
Compute YTD (year to date) profits. The computed amounts should be
located in cells B9:E9.
Copyright © 2005, Idea Group Inc. Copying or distributing in print or electronic forms without written
permission of Idea Group Inc. is prohibited.
TEAM LinG
Predicting Computer Task Performance
89
4.
Calculate percent change of sales from the previous season. The computed
amounts should be located in cells C11:E11. The percent change of sales
is computed as current sales – previous sales / previous sales.
5. Change the spring sales amount in cell B6 from 320 to 390. Verify that the
numbers related to this cell have been updated correctly.
6. Using the MAX function, find the largest amounts of sales, expenses, and
profits. The computed amounts should be located in cells H6:H8.
7. Copy the format of the cell E5 to F5, G5, and H5.
8. Format all the numbers in the 6th row so that the numbers are displayed with
dollar signs, commas (when the numbers are greater than or equal to one
thousand), and two decimal places. Make sure all the numbers are
readable.
9. Format all the numbers in the 7 th, 8th, and 9th rows so that the numbers are
displayed with commas (when the numbers are greater than or equal to
1,000) and two decimal places. Make sure all the numbers are readable.
10. Format all the percent sales change numbers in the 11th row so that the
numbers are displayed with % symbols and one decimal place.
11. If there are any negative numbers in the worksheet, change their colors to
red.
12. Align the title “ABC Corporation” to the center of the screen. Change the
font of the title to Times New Roman.
Copyright © 2005, Idea Group Inc. Copying or distributing in print or electronic forms without written
permission of Idea Group Inc. is prohibited.
TEAM LinG
90 Morris and Marshall
Chapter V
Measurement of
Perceived Control in
Information Systems
Steven A. Morris, Middle Tennessee State University, USA
Thomas E. Marshall, Auburn University, USA
ABSTRACT
The importance of perceptions of control in explaining human behavior
and motivation has been identified, investigated, and found to be significant
in several disciplines. This study reports on an exploratory investigation
assessing perceived control within the information systems domain. A
survey instrument was developed based on the research literature to assess
perceived control as a multi-dimensional construct. The survey was
administered to 241 subjects. The results were analyzed to produce the
following five factors that represent a user’s perceptions of control when
working with an interactive information system: (1) timeframe, (2) feedback
signal, (3) feedback duration, (4) strategy, and (5) metaphor knowledge.
INTRODUCTION
While one of the ongoing efforts in information systems (IS) research is an
attempt to define the dependent variable in concrete terms, various attempts
have produced some widely accepted surrogates (DeLone & McLean, 1992;
Keen, 1980). Among these are user satisfaction and system usage, and much
Copyright © 2005, Idea Group Inc. Copying or distributing in print or electronic forms without written
permission of Idea Group Inc. is prohibited.
TEAM LinG
Measurement of Perceived Control in Information Systems
91
effort has been spent attempting to better understand these concepts (Bailey &
Pearson, 1983; Baroudi, Olson, & Ives, 1986; Hu, Chau, Sheng, & Tam, 1999;
Igbaria, & Nachman, 1990; Straub, Limayem, & Karahanna-Evaristo, 1995).
Though not well established in the IS literature, researchers in other disciplines
have linked perceived control to both emotional and behavioral characteristics,
such as user satisfaction, that are of interest to IS researchers (Stanton &
Barnes-Farrell, 1996). Most research in information systems that has included
user perceptions of control has not addressed the perceived control construct
from firm theoretical grounds; has not addressed perceived control as a complex,
multi-dimensional construct; and/or has not demonstrated consistency in definition or measurement to facilitate comparisons across studies (Kahai, Solieri, &
Felo, 1998; Sengupta & Te’eni, 1993). While this research has found perceived
control to be related to important constructs such as user satisfaction and task
performance, the cumulative impact of these studies is weakened by the
difficulties in making comparisons (Kahai, Solieri, & Felo, 1998; Stanton &
Barnes-Farrell, 1996). The purpose of the current research is to develop an
instrument for assessing perceived control in the information systems domain as
a multi-dimensional construct from a theoretical basis that can be used as a
common assessment tool, thereby facilitating future cross-study comparisons.
A review of the relevant literature that informed the creation of the
instrument appears in the next section. Following the review of the literature, an
explanation of the methodology used to create the instrument is provided, along
with a description of the methods used to collect data to refine the instrument.
The results of principal components factor analysis are then presented to explore
the dimensionality of the perceived control construct. These results and the
emergent factors are then discussed. Finally, remarks concerning the implications and limitations of the study are presented.
LITERATURE REVIEW
The importance that other disciplines have given perceived control is
highlighted by the proposal of Friedman and Lackey (1991) that control is the
universal motivator for all human activity. An individual’s perception of the
control that he or she can exert has been found to be a very strong predictor of
both behaviors and emotional outcomes and, therefore, has stimulated a great
deal of research in disciplines such as psychology, marketing, and organizational
behavior (Fox, Dwyer, & Ganster, 1993; Friedman & Lackey, 1991; Lacey,
1979; Robertson & Powers, 1990; Sargent & Terry, 1998; Skinner, 1995).
Perceived control can be viewed as the degree to which a person feels that he
or she can impact outcomes in his or her environment through voluntary actions
(Lacey, 1979). According to Skinner (1995), “Five decades of research have
established [perceived control] as a robust predictor of people’s behavior,
Copyright © 2005, Idea Group Inc. Copying or distributing in print or electronic forms without written
permission of Idea Group Inc. is prohibited.
TEAM LinG
92 Morris and Marshall
emotion, motivation, performance, and success and failure in many domains of
life” (p. 3). Within these reference disciplines, control has been addressed as a
multi-dimensional construct.
Averill (1973) noted three dimensions of the control construct—cognitive
control, behavioral control, and decisional control. Decisional control addresses
the ability to choose among different courses of action. Cognitive control
addresses the interpretation of an event into a cognitive model or plan. Behavioral control deals with the existence of some means to exert influence over an
event. Behavioral control has been addressed in numerous studies involving
Azjen’s (1991) theory of planned behavior (Cordano & Frieze, 2000; Flannery
& May, 2000; Morris & Venkatesh, 2000; Venkatesh, Morris & Ackerman,
2000). Karasek (1979) investigated decisional control as decision authority and
decision latitude (Karasek & Theorell, 1991; Schaubroeck, Xie, & Lam, 2000).
Various scales to assess this perspective of control as a unidimensional construct
and as a multi-dimensional construct have been developed (Smith, Tisak, Hahn,
& Schmieder, 1997). Cognitive control has been investigated with less frequency, perhaps due to the difficulty in assessing this aspect of control (Faranda,
2001). Averill (1973) identified two facets of cognitive control—information
gathering and appraisal. Faranda (2001) used a multiple study approach to
develop a scale that would assess both of these facets as a unidimensional
measure of cognitive control and found support for the perspective of cognitive
control as a unidimensional construct. Figure 1 illustrates the three facets of
perceived control and indicates examples of the research that have addressed
each facet.
Within the field of experimental social psychology, control has been
suggested as the foundation of a new paradigm for understanding human
behavior. Historically, the Skinnerian paradigm for understanding behavior in
terms of stimulus–response has been the underpinning for much of the
behavioral research (Skinner, 1971). The new feedback–control paradigm
advocated by researchers such as Robertson and Powers (1990) shifts the
perspective of human behavior from being externally motivated to being internally motivated. Figure 2 depicts this perspective of human behavior. This
Figure 1. Facets of perceived control and sample research
Perceived
Control
Cognitive
Control
Sengupta & Te’eni (1993)
Faranda (2001)
Decisional
Control
Karasek (1979)
Schaubroeck, et al (2000)
Behavioral
Control
Azjen (1991)
Cordano & Frieze (2000)
Copyright © 2005, Idea Group Inc. Copying or distributing in print or electronic forms without written
permission of Idea Group Inc. is prohibited.
TEAM LinG
Measurement of Perceived Control in Information Systems
93
Figure 2. Illustration of feedback-contol paradigm
Environment
Reference Point:
Ideal Environment
Feedback
Comparison of
Environment to Ideal
Change
Ideal
Change
Environment
Cognitive
Control
Perceived Control
Decisional
Control
Behavioral
Control
Action
paradigm for explaining behavior posits that an individual sets an internal
reference point that represents the ideal state of his or her environment. Through
interaction with the environment, he or she receives feedback on the actual state
of the environment. A comparison is made of the feedback with the reference
point. If the environment varies significantly from the reference point, the
individual will assess his or her ability to change the environment in order to bring
it into alignment with the reference point. Based on the individual’s perceptions
of his or her ability to exercise control, the individual will take action either to
change the environment, change the reference point, or both. This perception of
control is a function of cognitive control, decisional control, and behavioral
control, as previously defined. This sequence of events iterates until either the
environment is aligned with the reference point (through changes in the environment, the reference point, or both), or the individual deems action to be futile,
potentially resulting in negative cognitive, emotional, or behavioral consequences
for the individual (Seligman, 1975).
Little has been done, however, to integrate the control aspect of human
behavior into the information systems arena. Nord and Nord (1994), in an
investigation of end-user computing (EUC), cite direct control of the system as
one of the benefits of EUC, yet no attempt to measure that control is made.
Williams and Nelson (1990) report frustration in users of decision support
systems (DSS) within petroleum companies when the users lack control of
certain system variables; however, no measure of the user’s perceived degree
of control is taken. Sengupta and Te’eni (1993) investigated the effects of
Copyright © 2005, Idea Group Inc. Copying or distributing in print or electronic forms without written
permission of Idea Group Inc. is prohibited.
TEAM LinG
94 Morris and Marshall
cognitive feedback in a group decision support system (GDSS) on cognitive
control and strategy convergence. They found that cognitive feedback increases
cognitive control, and, over time, cognitive feedback produces a uniformly high
level of cognitive control. Control in the investigation was limited to “the extent
to which the decision maker controls the execution of his or her decision
strategy” (Sengupta & Te’eni, 1993, p. 90). While the execution of decision
strategy is certainly an important dimension of control, other dimensions such as
the internal, cognitive aspects of control are absent in their study. Luconi,
Malone, and Scott-Morton (1986) implicitly included control in their framework,
delineating types of information systems. Their framework uses individual
versus computer control of system activity to distinguish between types of
information systems, but they fail to provide an in-depth analysis of the construct
of user’s perceived control.
The only attempt at integrating the various aspects of control into the
information systems domain is provided by Frese (1987), who provides conceptual discourse on the aspects of control from an information systems perspective.
The model produced by Frese (1987) is grounded theoretically in the cumulative
development of the control construct and represents an extension of the
psychological view of control as developed by Glass and Singer (1972), Seligman
(1975), and Frese (1982) that has been applied to the information systems
context. The model posits factors, both internal and external, that influence the
ability to exert control. These factors, described below, correspond with the
aspects of behavioral, decisional, and cognitive control. Behavioral control
represents the individual’s belief that he or she is free to take actions that will
influence the system. Behavioral control is addressed through the factors that
deal with sequence and timeframe for completing tasks. These factors deal
directly with the individual’s ability to execute actions to change his or her
environment. Decisional control is the ability to make plans and decisions that will
lead to effective action to change the environment. In the Frese model, decisional
control is addressed by factors that deal with the individual’s ability to set goal
content and make decisions about the sequence of attempting goal fulfillment.
Cognitive control is the individual’s ability to interpret the functioning of the
system within his or her current understanding of the way the system works.
Within the Frese model, cognitive control is addressed by internal factors such
as knowledge, which considers the individual’s ability to conceptualize the
functioning of the system within his or her mental model of the system. The Frese
(1987) model combines these aspects into a single framework and addresses a
person’s degree of control that he or she can impose on an information system.
Frese (1987) postulates that there are both internal and external prerequisites for control. External prerequisites describe attributes of the system and the
environment that are external to the user but may impact the user’s ability to
influence the system in the desired manner. Ten external factors were identified
(Frese, 1987) as follows:
Copyright © 2005, Idea Group Inc. Copying or distributing in print or electronic forms without written
permission of Idea Group Inc. is prohibited.
TEAM LinG
Measurement of Perceived Control in Information Systems
Goal Content
Goal Sequence
(GC)
(GS)
Goal Timeframe
Task Content
Task Sequence
(GT)
(TC)
(TS)
Task
Timeframe
Feedback Content
Feedback
Sequence
Feedback
Timeframe
Feedback
Condition
(TT)
(FC)
(FS)
(FT)
(Fcn)
95
The ability to determine one’s own goals while using the system
The ability to determine the order in which multiple goals are
satisfied
The ability to determine the length of time a goal could be pursued
The ability to formulate one’s own plan for achieving a goal.
The ability to determine the order in which multiple plans to
achieve a goal are attempted
The ability to determine the length of time a plan to achieve a goal
could be pursued
The ability to determine the type of feedback the system provides
The ability to determine the order in which multiple feedbacks
may be received
The ability to determine the duration of a feedback signal
The ability to determine the conditions for which feedback is
received
Internal prerequisites describe the attributes of the user that are necessary
for the user to be able to influence the system in the desired manner. Internal
prerequisites were deemed to be of two types: skills and knowledge. Skills refer
to the ability of the user to perform effectively and efficiently. Five different skills
are identified, as follows:
Goal Realistic
Goal Stable
Task Realistic
(GR)
(GST)
(TR)
Task Flexible
(TF)
Task Organized
(TO)
The goal for which the user strives must be attainable.
The goal must endure even in the face of negative feedback.
The plan for achieving the goal must be capable of achieving the
goal.
The plan for achieving the goal must be flexible enough to
accommodate a changing environment.
Commonly performed tasks should be routinized in the user’s
mind.
Knowledge “refers to metaphors (Carroll & Thomas, 1982),
conceptualizations or mental models of the system (Rouse & Morris, 1986;
Norman, 1983)” (Frese, 1987, p. 318). Knowledge is the user’s understanding
of the system’s functioning. It is deemed an internal prerequisite to control since
the user must have sufficient knowledge of the system to make the system
respond in a predictable manner. Knowledge is defined for this study as follows:
Knowledge (K): The user’s understanding of the functioning of the system,
either directly or through analogy.
Extending the Frese (1987) research stream, this study operationalizes and
tests these factors through factor analysis determining a factor model. Items for
these 16 factors were identified, tested, and integrated to produce a research
instrument.
Copyright © 2005, Idea Group Inc. Copying or distributing in print or electronic forms without written
permission of Idea Group Inc. is prohibited.
TEAM LinG
96 Morris and Marshall
METHODOLOGY
Following the guidelines of Sethi and King (1991), an instrument to assess
perceived control was created. First, the identification of dimensions of the
construct was conducted through review of the previous literature, as previously
described. This review resulted in the use of the 16 factors from the Frese model,
since it contained the only integrated perspective of control that included all of
the dimensions suggested by the other literature. A panel of IS researchers
critiqued the dimensions, assessing the content validity of the instrument. Several
rounds of questionnaire feedback and revision were performed until consensus
agreement among the panelists was achieved. Second, based on the dimensions
identified, multiple questionnaire items were generated to operationalize each
dimension (Sethi & King, 1991). The same panel also pre-tested the questionnaire items to address issues of readability and clarity. Although the lack of a
formal pilot test may be a limitation, Boudreau, Gefen, and Straub (2001)
indicated that a pre-test can perform much the same function as the pilot test and
is the more important of the two.
Operationalizing the 16 factors influencing control of an information system
suggested by the literature and the expert panel produced a 55-item questionnaire
(see Appendix A). The correlation of questionnaire items to research model
factors is detailed in Appendix B. The questionnaire asked a series of 55
questions concerning the subject’s experiences using a particular information
system. Item responses were reported on a five-point Likert scale, with response
cues for questions ranging from “strongly disagree” to “strongly agree.” The
subjects were 241 undergraduate students taking an introductory management
course. Bonus credit was offered to the subjects as an incentive for participation
in the study. The information system targeted in the questionnaire was the
university’s automated registration system. For this system, the subjects of the
survey are the intended end users of the system, effectively eliminating problems
associated with subject surrogates.
Ideally, many researchers recommend a ratio of 5:1 subjects per questionnaire item (Hair, Anderson, Tatham, & Black, 1998). However, other researchers note that for exploratory factor analysis, much lower ratios are acceptable
(Essex, Magal, & Masteller, 1998; Templeton, Lewis, & Snyder, 2002; Yoon,
Guimaraes & O’Neal, 1995). Cattell (1998) suggested that a ratio of 2:1 is
permissible for exploratory work, and Baggaley (1982) goes so far as to suggest
that even a 1:1 ratio can be informative. Therefore, the current ratio of 4.38:1,
while less than ideal, is within the realm of acceptability for exploratory factor
analysis.
Copyright © 2005, Idea Group Inc. Copying or distributing in print or electronic forms without written
permission of Idea Group Inc. is prohibited.
TEAM LinG
Measurement of Perceived Control in Information Systems
97
RESULTS
Instrument validity was addressed along multiple dimensions as suggested
by Boudreau, Gefen, and Straub (2001). Content validity, ensuring that the
instrument is representative of the pool of potential content, was addressed by
a combination of a thorough review of the literature and using an expert panel
(previously described), as recommended by Straub and Carlson (1989). Construct validity was addressed through the use of a principal components factor
analysis (Cattell, 1988). The results of the factor analysis, described later,
indicated a number of factors. Reliability was assessed using Cronbach’s alpha
for each of the factors and will be presented with the discussion of the respective
factors.
The responses were statistically analyzed to obtain a reduced set of factors
using exploratory principal components factor analysis. The data were examined
using both a varimax and a promax (oblique) rotation. Since the oblique rotation
produced the same factors as the varimax rotation, and the component correlation matrix indicated only modest correlation, the data were assumed to be
orthogonal (Bernstein, 1988). The remaining discussion will address only the
varimax rotation, since it tends to produce a simplified, interpretable factor
structure (Katchigan, 1982; Kim & Mueller, 1982; Sethi & King, 1991). Criteria
for selecting factors were utilized to eliminate weak or implausible factors. In
order to be retained, a factor must have an eigenvalue of 1.00 or greater.
Additionally, for an item to be considered as part of a factor, it must have a
minimum loading of 0.50 in its primary factor and not load higher than 0.30 in any
other factor. This rigorous standard was suggested by the literature and
produced conceptually sound factors with a clean separation of items (Cattell,
1988; Templeton, et al., 2002; Yoon, et al., 1995). Appendix C provides a list of
the survey question numbers (Number), proposed factor from the literature
(Item), and principal factor loading.
While the literature used to develop this instrument was based on 16
hypothesized factors (Frese, 1987), the factor analysis yielded 17 factors with
convergence in 31 iterations. Further, these 17 factors in all cases did not parallel
the hypothesized factors. A multiple criteria approach, including eigenvalue,
interpretability, and Scree-test, was used to evaluate and identify relevant
research factors within the data set (Ford et al., 1986; Cattell, 1988). In general,
the approach identifies the first factors that account for most of the observed
variance while eliminating non-relevant factors by using a multiple-criteria
evaluation. According to Ford, et al. (1986), the multiple criteria approach is
advised, because considering eigenvalues alone tends to overestimate the
relevant number of factors. Cattell (1988) recommends evaluation of the scree
plot of eigenvalues in addition to consideration of the eigenvalues themselves.
Evaluation of the scree plot is used to identify error factors by eliminating factors
Copyright © 2005, Idea Group Inc. Copying or distributing in print or electronic forms without written
permission of Idea Group Inc. is prohibited.
TEAM LinG
98 Morris and Marshall
that fall off in a regular, linear pattern (Cattell, 1988). In addition to consideration
of the scree plot of the eigenvalues, a factor’s interpretability and contribution
to variance suggested that the optimal number of factors to be considered in this
study included the first five factors (Table 1).
The factors and the item loadings are detailed in Appendix C. The first
factor in the derived model is composed of a combination of items dealing with
goal timeframe and task timeframe (Table 2). This factor implies that respondents did not distinguish between the time spent pursuing a goal and the time
spent on various plans to achieve that goal. The combination of these items into
a single factor indicates that limitations on total working time on the system are
more important than the distinction of how that time is spent. This may be
explained by the view that developing a plan to achieve a goal is often a process
of decomposing a goal into a series of subgoals. These subgoals, in turn, then can
be decomposed further into smaller subgoals (Lesgold, 1988). From this perspective, executing a plan is achieving a sequence of goals; therefore, the plan
becomes a goal itself. This factor—timeframe—accounted for more than 15%
of the total variance observed.
Table 1. Factors considered for retention
Factor
Item Numbers
Eigenvalue
1
2
3
4
5
4, 19, 10, 23, 9
15, 16, 14, 24
21, 17
7, 6
28, 30, 54
8.33
3.40
2.92
2.44
1.97
Percent of
Variance
15.2
6.2
5.3
4.4
3.6
α
.8561
.7513
.5632
.6332
.7080
Table 2. Factor one: Goal and task timeframe
Item
Loading
.821
.803
.801
.727
Measurement Item
The system allows me to work on completing a task for as long as I want.
I may pursue an objective on the system for as long as I want.
There are no time restraints on my usage of the system.
The system does not limit the amount of time I can spend working on a method of
accomplishing my objectives.
.720
The system will let me pursue a plan to achieve a goal for as long as I want.
Cronbach’s Alpha for Factor 1 = .8561
Table 3. Factor two: Content and sequence feedback
Item Loading
.786
.773
.621
Measurement Item
I can choose the order in which I receive multiple feedback signals from the system.
The system allows me to choose the feedback signal that it uses.
I can select the method of feedback that the system uses to notify me of the
success or failure of the operations I perform on the system.
.531
When multiple potential feedback signals exist, the system allows me to decide the
order in which I will receive those signals.
Cronbach’s Alpha for Factor 2 = .7513
Copyright © 2005, Idea Group Inc. Copying or distributing in print or electronic forms without written
permission of Idea Group Inc. is prohibited.
TEAM LinG
Measurement of Perceived Control in Information Systems
99
Table 4. Factor three: Timeframe or duration of feedback
Item Loading
.660
Measurement Item
The feedback signal from the system, which notifies me of the
success or failure of the operations I perform on the system, lasts
only as long as I want it to.
.617
The system lets me choose how long the feedback notification
lasts when I receive feedback from the system.
Cronbach’s Alpha for Factor 3 = .5632
Table 5. Factor four: Goal and task content
Item Loading
.735
.660
Measurement Item
The system offers many choices of tasks to accomplish.
The system lets me make many decisions about the way I will achieve my
goals.
Cronbach’s Alpha for Factor 4 = .6632
Table 6. Factor five: Metaphor knowledge
Item
Loading
.799
.780
Measurement Item
I have used other systems that are fundamentally the same as this one.
The system seems to work similarly to other systems with which I am
familiar.
.680
There are parallels between this system and other systems I have operated.
Cronbach’s Alpha for Factor 5 = .7080
The second factor, detailed in Table 3, is a combination of feedback content
and feedback sequence. This combination of items implies that subjects did not
distinguish between the content of a feedback signal and the order in which
signals are received. The focus supports the identification of the feedback signal
itself as an important dimension of perceived control. This factor accounted for
more than 6% of the total variance observed.
The third factor is composed of items related to feedback timeframe or
feedback duration (Table 4). Feedback, as a factor of control, deals with the
timeframe or duration of the feedback signal that the subject receives to indicate
success or failure while using the system. This factor parallels one of the factors
that was hypothesized in the literature. This factor accounted for more than 5%
of the total variance observed.
The fourth factor, as presented in Table 5, represents a combination of goal
content and task content. The combination of goal and task content items is a
further indication that subjects did not distinguish between a goal and a plan to
achieve that goal. This supports the assertion made earlier that the decomposition
of goals into subgoals blurs the distinction between goals and plans. The thrust
of this factor appears to be work content, or the subject’s ability to manipulate
the system as desired, regardless of the hierarchical level of the goal that is to
be accomplished by that manipulation.
Copyright © 2005, Idea Group Inc. Copying or distributing in print or electronic forms without written
permission of Idea Group Inc. is prohibited.
TEAM LinG
100 Morris and Marshall
The fifth factor, as detailed in Table 6, is the initial factor dealing with the
internal prerequisites to control. The four preceding factors, with the greatest
explanative power, all deal with factors that were identified as being external
prerequisites. The items included in the fifth factor belong to the hypothesized
factor, knowledge. As noted earlier, however, knowledge is defined as being
composed of metaphors and mental models. Metaphor, in this case, refers to the
comparability of the current system to other systems with which the user has had
experience (Staggers & Norcio, 1993). Mental models are the cognitive constructs the subject has developed to understand the system functions. The items
that deal with the metaphor aspect of knowledge were clustered as the fifth
factor, suggesting that in terms of their degree of control of an information
system, individuals in this study use metaphor knowledge to achieve cognitive
control.
DISCUSSION
The current study has identified five factors that represent a subject’s
perceived degree of control when working with an interactive information
system. Although the factors hypothesized in the literature did not all hold in this
case, many hypothesized factors were supported. There was a trend in several
of the identified factors to aggregate goal- and task-oriented items that deal with
the external prerequisites for control, or the factors in the environment that
influence the user’s ability to impact the system. Viewing these factors in terms
of the feedback-control paradigm, which was previously discussed and presented graphically in Figure 2, supports an explanation of user’s perceived
degree of control and allows the following conclusions to be drawn.
Accepting control as the general motive, as proposed by Friedman and
Lackey (1991), a user motivated by a desire to control his or her environment will
set a reference point (Figure 2). This reference point represents the ideal
environment in which this user would prefer to exist. When the user receives
feedback that something in the environment is not in accord with the reference
point, the user will attempt to manipulate, or control, the environment to bring the
environment back in line with the reference point. Since the general motive is
control, and our paradigm dictates that all behavior is an effort to gain or maintain
control, then the goal of all activity, including information system usage, is control
(Robertson & Powers, 1990). This would explain the noted trend of users to view
external goals and tasks in a similar manner. The reason for this is that if the goal
of all activity is control, then any goals the user would set in regard to the external
environment (the system) are, in fact, tasks, or plans, for achieving the true,
internal goal—control. The findings of the current study help to indicate the
factors that the user believes are important to the success of this control activity.
Copyright © 2005, Idea Group Inc. Copying or distributing in print or electronic forms without written
permission of Idea Group Inc. is prohibited.
TEAM LinG
Measurement of Perceived Control in Information Systems
101
Factor 1—timeframe—indicates that the user believes that it is important to
have sufficient time to develop a plan and to enact the required change on the
environment. This is consistent with the findings of other researchers who have
noted a relationship between time pressure and control (Doef & Maes, 1999;
Olson & Sarter, 2000; Yagil, 2001). For users to perceive that they have control
of the system, it must allow them enough time to create a plan for reducing the
deviation (decisional control). After a plan for returning the environment to the
reference point has been devised, the user requires sufficient time to perform the
activity (behavioral control). Additionally, if multiple plans are required, the user
needs time to create and to implement various plans until success is achieved.
From a temporal perspective, users do not seem to distinguish between decisional
and behavioral control, which means that once a variation from the reference
point is detected (factor two), the user needs adequate time to manipulate the
system so that the variation can be reduced to an acceptable level.
Factor 2—feedback signal—would be necessary to detect that the environment has deviated from the reference point, indicating that activity is necessary.
Additionally, the signal would be needed to determine when the environment has
been successfully manipulated, indicating that activity is no longer necessary.
Therefore, the signal prompts the user into action, and a feedback signal is
needed so that the user can judge the success of his or her activities. User
concerns with the feedback signal indicate that the signal must have sufficient
meaning to the user to detect and gauge any deviation. Related to this is factor
3—feedback duration. While factor 2 implies that the signal must be meaningful,
factor 3 suggests that the duration of the feedback must be sufficient for it to be
properly received and interpreted.
Factor 4 deals with the actual action of the user aimed at reducing the
deviation of the environment from the reference point. Once the deviation has
been detected, the user needs the ability to manipulate the environment in order
to reduce the deviation. The user must devise a means (strategy) of bringing the
environment back to the reference point (decisional control). Decision latitude
is constrained by the limitations of the system functions. Within the constraints
of the system’s capabilities, the user makes decisions concerning the means to
be employed in achieving the goal.
While factor 4 indicates that the manipulation options offered by the system
provide limitations to developing a means of achieving goals, other factors may
impact this, as well. Internally, factor 5—metaphor knowledge—helps the user
to determine the content of the activity. Cognitive control is the ability of the user
to interpret the functions of the system within his or her mental model of the
system. It is the user’s understanding of the causal relationships among the
various system components and the user’s actions. Factor 5 indicates that the
user’s ability to apply an understanding of other systems to the functioning of the
current system provides a greater sense of control over the current system. If
Copyright © 2005, Idea Group Inc. Copying or distributing in print or electronic forms without written
permission of Idea Group Inc. is prohibited.
TEAM LinG
102 Morris and Marshall
the deviation has been experienced previously, then routinization may handle the
determination of activity content without much conscious effort. If the deviation
is a routine occurrence, then the user will draw on his or her experiences with
similar systems (metaphors) to help determine the content of the activity.
CONCLUSION
The current study contributes to the understanding of perceived control in
information systems. It developed and empirically tested a questionnaire based
on the literature to assess users’ perceptions of control of an information system.
The results of an exploratory factor analysis of responses to this survey were
then expressed in terms of the feedback-control paradigm. Based on these
results, the questionnaire was reduced to 16 items.
Many of the findings are consistent with previous research on perceived
control in other disciplines. In comparison to the Averill (1973) operationalizations
of control, the current findings clearly support the factors of cognitive and
decisional control. Factor 5 of the current study deals with metaphor knowledge.
This directly assesses the ability of the user to conceptualize the functioning of
the system and to integrate those functions within the user’s mental model of the
system. Factor 4 of the current study deals with the decision latitude of users in
regard to their ability to decide on a strategy for attempting to achieve their goals.
This clearly supports the work done by Karasek (1979) in decisional control.
The issue of behavioral control, however, is not as clearly supported. Factor
1 of the current study appears to relate to behavioral control as well as decisional
control. It appears that the ability to make decisions about the actions to perform
(decisional control) and the ability to take those actions (behavioral control) are
intertwined. This is not very surprising, since most users would not make
decisions to carry out an action that they knew they could not complete. Factor
1 deals with the issue of having sufficient time to make decisions and then
attempting to enact those decisions.
Factors 2 and 3 both deal with the feedback signal that the user receives
from the system. While these factors do not fall within the Averill operationizations
of control, other researchers have recognized that the feedback signal is an
integral component of any form of control (Frese, 1987; Robertson & Powers,
1990). Factor 2 deals with the content of the feedback signal and indicates that
the signal must contain sufficient information in order for the user to recognize
the deviation of the environment from the reference point. Factor 3 indicates that
the duration of the feedback signal must be sufficient in order for the user to
properly interpret it. With respect to perceived control of an information system,
the user must receive sufficient feedback to make a valid comparison of the
environment to the ideal (factor 2). The feedback must last long enough for the
user to conceptualize its meaning so that a proper strategy can be formulated
Copyright © 2005, Idea Group Inc. Copying or distributing in print or electronic forms without written
permission of Idea Group Inc. is prohibited.
TEAM LinG
Measurement of Perceived Control in Information Systems
103
(factor 3). The user must have sufficient latitude to devise a strategy that can
manipulate the system to achieve the user’s goal (factor 4) within the constraints
of the user’s understanding of the system (factor 5). Finally, the user must have
sufficient time to go through iterations of devising and implementing multiple
strategies to achieve success (factor 1).
Given the equivocal results of previous attempts to determine the nature of
control as unidimensional or multi-dimensional (Smith et al., 1997), the current
study contributes not only to the specific investigation of control in the information systems area, but also to the greater investigation of perceived control in
other disciplines. While this study is a theoretically based, empirical investigation
into the facets of perceived control, further empirical research within a variety
of information system contexts is recommended. Limitations of the current
study, such as the ratio of subjects to variables and the low reliability scores for
factors 3 and 4, are acceptable in exploratory research. However, confirmatory
research that holds these factors to more rigorous standards is necessary to
refine the instrument and improve the understanding of perceived control.
Further, research into the interactions between cognitive, behavioral, and
decisional control is critical to the understanding of control. Given a greater
understanding of perceived control, information system design, development and
implementation can be more effectively focused on the intrinsic needs of the
intended user population and its perception of perceived control.
REFERENCES
Averill, J.R. (1973). Personal control over aversive stimuli and its relationship to
stress. Psychological Bulletin, 80, 286-303.
Azjen, I. (1991). Theory of planned behavior. Organizational Behavior and
Human Decision Process, 50, 179-211.
Baggaley, A.R. (1982). Deciding on the ratio of the number of subjects to the
number of variables in factor analysis. Multivariate Experimental Clinical Research, 6(2), 81-85.
Bailey, J.E., & Pearson, S.W. (1983). Development of a tool for measuring and
analyzing computer user satisfaction. Management Science, 29(5), 530-545.
Baroudi, J.J., Olson, M.H., & Ives, B. (1986). Empirical study of the impact of
user involvement on system usage and information satisfaction. Communications of the ACM, 29(3), 232-238.
Bernstein, I.H. (1988). Applied multivariate analysis. New York: Springer-Verlag.
Boudreau, M.C., Gefen, D., & Straub, D.W. (2001). Validation in information
systems research: A state-of-the-art assessment. MIS Quarterly, 25(1), 1-16.
Carroll, J.M., & Thomas, J.C. (1982). Metaphor and the cognitive representation
of computing systems. IEEE Transactions on Systems, Man, and Cybernetics, 12, 1007-1116.
Copyright © 2005, Idea Group Inc. Copying or distributing in print or electronic forms without written
permission of Idea Group Inc. is prohibited.
TEAM LinG
104 Morris and Marshall
Cattell, R.B. (1988). Meaning and strategic use of factor analysis. In J.R.
Nesselroade & R.B. Cattell (Eds.), Handbook of multivariate experimental psychology (2nd ed.). New York: Plenum Press.
Cordano, M., & Frieze, I.H. (2000). Pollution reduction preferences of U.S.
environmental managers: Applying Azjen’s theory of planned behavior.
Academy of Management Journal, 43(4), 627-641.
DeLone, W. & McLean, E. (1992). Information systems success: Quest for the
dependent variable. Information Systems Research, 3(1), 60-95.
Essex, P., Magel, S.R., & Mosteller, D.E. (1998). Determinants of information
center success. Journal of Management Information Systems, 15(2),
95-117.
Faranda, W.T. (2001). A scale to measure the cognitive control form of
perceived control: Construction and preliminary assessment. Psychology
& Marketing, 18(12), 1259-1281.
Flannery, B.L., & May, D.R. (2000). Environmental ethical decision making in
the U.S. metal-finishing industry. Academy of Management Journal,
43(4), 642-662.
Ford, J.K., MacCallum, R.C., & Tait, M. (1986). The application of exploratory
factor analysis in applied psychology: A critical review and analysis.
Personnel Psychology, 39, 291-314.
Fox, M.L., Dwyer, D.J., & Ganster, D.C. (1993). Effects of stressful job
demands and control on physiological and attitudinal outcomes in a hospital
setting. Academy of Management Journal, 36(2), 289-318.
Frese, M. (1982). Occupational socialization and psychological development: An
underemphasized research perspective in industrial psychology. Journal
of Occupational Psychology, 55, 209-224.
Frese, M. (1987). Theory of control and complexity: Implications for software
design and integration of computer systems into the work place. In M. Frese,
E. Ulich, & W. Dzida (Eds.), Psychological issues of human computer
interaction in the work place. Holland: Elsevier Science Publishers.
Friedman, M.I., & Lackey, G.H., Jr. (1991). Psychology of human control: A
general theory of purposeful behavior. New York: Praeger Publishers.
Glass, D.C., & Singer, J.E. (1972). Experiments on noise and social stressors.
New York: Academic.
Hair, J.F., Anderson, R.E., Tatham, R.L., & Black, W. (1998). Multivariate
data analysis (5 th ed.). Upper Saddle River, New Jersey: Prentice Hall.
Hu, P.J., Chau, P.Y.K., Sheng, O.R.L., & Tam, K.Y. (1999). Examining the
technology acceptance model using physician acceptance of telemedicine
technology. Journal of Management Information Systems, 16(2), 91112.
Igbaria, M., & Nachman, S.A. (1990). Correlates of user satisfaction with end
user computing. Information & Management, 19(2), 73-82.
Copyright © 2005, Idea Group Inc. Copying or distributing in print or electronic forms without written
permission of Idea Group Inc. is prohibited.
TEAM LinG
Measurement of Perceived Control in Information Systems
105
Kachigan, S.K. (1982). Multivariate statistical analysis. New York: Radius Press.
Kahai, S.S., Solieri, S.A., & Felo, A.J. (1998). Active involvement, familiarity,
framing, and the illusion of control during decision support system use.
Decision Support Systems, 23(2), 133-148.
Karasek, R.A. (1979). Job demands, job decision latitude, and mental strain:
Implications for job redesign. Administrative Science Quarterly, 24, 285308.
Karasek, R. A., & Theorell, T. (1991). Healthy work: Stress, productivity and
the reconstruction of working life. New York: Basic Books.
Keen, P.G.W. (1980). MIS research: reference disciplines and a cumulative
tradition. Proceedings of the First International Conference on Information Systems. Philadelphia, Pennsylvania.
Kim, J.O., & Mueller, C.W. (1982). Introduction to factor analysis. Beverly
Hills: Sage Press.
Lacey, H.M. (1979). Control, perceived control, and the methodological role of
cognitive constructs. In L.C. Perlmuter, & R.A. Monty (Eds.), Choice and
perceived control. Hillsdale, NJ: Lawrence Erlbaum Associates.
Lesgold, A. (1988). Problem solving. In R.J. Sternberg, & E.E. Smith (Eds.),
Psychology of human thought. New York: Cambridge Press.
Luconi, F.K., Malone, T.W., & Scott Morton, M. (1986). Expert systems: The
next challenge for managers. Sloan Management Review, 27(4), 3-15.
Morris, M.G., & Venkatesh, V. (2000). Age differences in technology adoption
decisions: Implications for a changing work force. Personnel Psychology,
53(2), 375-403.
Nord, G.D., & Nord, J.H. (1994). Perceptions & attitudes of end-users on
technology issues. Journal of Systems Management, 45(11), 12-15.
Norman, D. A. (1983). Some observations on mental models. In D. Gentner, &
A.L. Stevens (Eds.), Mental models. Hillsdale, NJ: Lawrence Erlbaum
Associates.
Olson, W.A., & Sarter, N.B. (2000). Automation management strategies: Pilot
preferences and operational experiences. International Journal of Aviation Psychology, 10(4), 327-341.
Robertson, R.J., & Powers, W.T. (1990). Introduction to modern psychology:
The control-theory view. Lexington, KY: Diamond Graphics.
Rouse, W.B., & Morris, N.M. (1986). On looking into the black box: Prospects and
limits in the search for mental models. Psychological Bulletin, 100, 349-363.
Sargent, L. D., & Terry, D.J. (1998). The effects of work control and job
demands on employee adjustment and work performance. Journal of
Occupational and Organizational Psychology, 71, 219-236.
Schaubroeck, J., Xie, J.L., & Lam, S.K. (2000). Collective efficacy versus selfefficacy in coping responses to stressors and control: A cross-cultural
study. Journal of Applied Psychology, 85(4), 512-525.
Copyright © 2005, Idea Group Inc. Copying or distributing in print or electronic forms without written
permission of Idea Group Inc. is prohibited.
TEAM LinG
106 Morris and Marshall
Seligman, M.E.P. (1975). Helplessness: On depression, development and
death. San Francisco: Freeman.
Sengupta, K., & Te’eni, D. (1993). Cognitive feedback in GDSS: Improving
control and convergence. MIS Quarterly, 17(1), 87-109.
Sethi, V., & King, W.R. (1991). Construct measurement in information systems
research: An illustration in strategic systems. Decision Sciences, 22(3),
455-472.
Skinner, B.F. (1971). Beyond freedom and dignity. New York: Knopf.
Skinner, E.A. (1995). Perceived control, motivation, & coping. Thousand
Oaks, CA: Sage Publications.
Smith, C.S., Tisak, J., Hahn, S.E., & Schmieder, R.A. (1997). The measurement
of job control. Journal of Organizational Behavior, 18(3), 225-237.
Staggers, N., & Norcio, A.F. (1993). Mental models: concepts for humancomputer interaction research. International Journal of Man-Machine
Studies, 38, 587-605.
Stanton, J.M., & Barnes-Farrell, J.L. (1996). Effects of electronic performance
monitoring on personal control, task satisfaction, and task performance.
Journal of Applied Psychology, 81(6), 738-745.
Straub, D., Limayem, M., & Karahanna-Evaristo, E. (1995). Measuring system
usage: implications for IS theory testing. Management Science, 41(8),
1328-1342.
Straub, D.W., & Carlson, C.L. (1989). Validating instruments in MIS Research.
MIS Quarterly, 13, 147-169.
Templeton, G. F., Lewis, B.R., & Snyder, C.A. (2002). Development of a
measure for the organizational learning construct. Journal of Management Information Systems, 19(2), 175-218.
van der Doef, M., & Maes, S. (1999). The Leiden quality of work questionnaire:
Its construction, factor structure, and psychometric qualities. Psychological Reports, 85(3, Part 1), 954-962.
Venkatesh, V., Morris, M. G., & Ackerman, P.L. (2000). A longitudinal field
investigation of gender differences in individual technology adoption decision-making processes. Organizational Behavior and Human Decision
Processes, 83(1), 33-60.
Williams, J., & Nelson, J.A. (1990). Striking oil in decision support. Datamation,
36(6), 83-86.
Yagil, D. (2001). Reasoned action and irrational motives: A prediction of drivers’
intentions to violate traffic laws. Journal of Applied Social Psychology,
31(4), 720-740.
Yoon, Y., Guimaraes, T., & O’Neal, Q. (1995). Exploring the factors associated
with expert systems success. MIS Quarterly, 19(1), 83-106.
Copyright © 2005, Idea Group Inc. Copying or distributing in print or electronic forms without written
permission of Idea Group Inc. is prohibited.
TEAM LinG
Measurement of Perceived Control in Information Systems
107
APPENDIX A
Research Instrument
Strongly Disagree
1
2
3
4
Strongly Agree
5
It is easy for me to visualize the way in which the system works.
1
2
3
4
5
The system lets me set my own goals each time I use it.
1
2
3
4
5
The system does not dictate the sequence in which objectives can be accomplished.
1
2
3
4
5
The system allows me to work on completing a task for as long as I want.
1
2
3
4
5
The system supports the achievement of goals in any order I want.
1
2
3
4
5
The system lets me make many decisions about the way I will achieve my goals.
1
2
3
4
5
The system offers many choices of tasks to accomplish.
1
2
3
4
5
The system lets me devise my own plans for how to complete my tasks.
1
2
3
4
5
The system will let me pursue a plan to achieve a goal for as long as I want.
1
2
3
4
5
There are not time restraints on my usage of the system.
1
2
3
4
5
When more than one method of achieving a task is available, the system does not dictate the order in
which I apply the methods.
1
2
3
4
5
They system allows me to choose the way in which it provides feedback on the success or failure of
the operations that I attempt.
1
2
3
4
5
I am free to complete tasks in any order I want.
1
2
3
4
5
I can select the method of feedback that the system uses to notify me of the success or failure of the
operations I perform on the system.
1
2
3
4
5
I can choose the order in which I receive multiple feedback signals from the system.
1
2
3
4
5
The system allows me to choose the feedback signal that it uses.
Copyright © 2005, Idea Group Inc. Copying or distributing in print or electronic forms without written
permission of Idea Group Inc. is prohibited.
TEAM LinG
108 Morris and Marshall
Strongly Disagree
1
2
3
4
Strongly Agree
5
The system allows me to choose the feedback signal that it uses.
1
2
3
4
5
The system lets me choose how long the feedback notification lasts when I receive feedback from the
system.
1
2
3
4
5
I am free to attempt alternative plans for completing tasks in any sequence that I choose.
1
2
3
4
5
I may pursue an objective on the system for as long as I want.
1
2
3
4
5
The system provides many alternate methods of notifying me of the success or failure of the
operations I perform on the system.
1
2
3
4
5
The feedback signal from the system, which notifies me of the success or failure of the operations I
perform on the system, lasts only as long as I want it to.
1
2
3
4
5
There is no presser order in which I must try alternative methods of accomplishing my goals on the
system.
1
2
3
4
5
The system does not limit the amount of time I can spend working on a method of accomplishing my
objectives.
1
2
3
4
5
When multiple potential feedback signals exist, the system allows me to decide the order in which I
will receive those signals.
1
2
3
4
5
The tasks I do on the system are tasks that I have been able to complete in the past.
1
2
3
4
5
The system allows me to prioritize the feedback signals that it sends to me.
1
2
3
4
5
I can receive feedback from the system whenever I want feedback.
1
2
3
4
5
I have used other systems that are fundamentally the same as this one.
1
2
3
4
5
I receive feedback from the system only when I want it.
1
2
3
4
5
The system seems to work similarly to other systems with which I am familiar.
1
2
3
4
5
I understand, at least abstractly, the components of the system and how they work.
1
2
3
4
5
Copyright © 2005, Idea Group Inc. Copying or distributing in print or electronic forms without written
permission of Idea Group Inc. is prohibited.
TEAM LinG
Measurement of Perceived Control in Information Systems
Strongly Disagree
1
2
3
4
109
Strongly Agree
5
The system allows me to select when I will receive feedback from the system.
1
2
3
4
5
The objectives I attempt on the system are very similar to ones that I have successfully completed in
the past.
1
2
3
4
5
The system allows me to attempt to achieve my goals in any manner I want
1
2
3
4
5
Once I start a session on the system, I do not change the goals I am trying to accomplish.
1
2
3
4
5
I am certain that my goals in using the system are achievable.
1
2
3
4
5
I never attempt to do things on the system unless I am certain that I can succeed.
1
2
3
4
5
I immediately discontinue trying to achieve an objective on the system when the system reports
negative results.
1
2
3
4
5
I use a very flexible approach to completing tasks on the system.
1
2
3
4
5
I can change the conditions for which the system notifies me of the success or failure of the
operations that I perform on the system.
1
2
3
4
5
I am easily discouraged from using the system when it reports negative results for a task I am trying
to accomplish.
1
2
3
4
5
I can easily adjust my plans when the system reports a negative result for a task I was trying to
complete.
1
2
3
4
5
The system does not force me to change plans of how to achieve a goal after a certain amount of
time.
1
2
3
4
5
The system does not dictate the objective I can pursue while using it.
1
2
3
4
5
The methods in which I achieve my objectives on the system are the same methods that I have used
successfully in the past.
1
2
3
4
5
The way that I attempt to accomplish my tasks on the system is a realistic approach to achieving my
goals.
1
2
3
4
5
Copyright © 2005, Idea Group Inc. Copying or distributing in print or electronic forms without written
permission of Idea Group Inc. is prohibited.
TEAM LinG
110 Morris and Marshall
Strongly Disagree
1
2
3
4
Strongly Agree
5
The system can provide feedback for varying durations based on my selection.
1
2
3
4
5
The goals I try to achieve on the system are logical consequences of the manner in which I try to
achieve these goals.
1
2
3
4
5
The system allows me to choose the order in which I attempt to achieve my goals.
1
2
3
4
5
I know all the steps required to complete common tasks on the system without instructions.
1
2
3
4
5
It requires little or no thought on my part to complete common tasks on the system.
1
2
3
4
5
The system provides many alternative ways to do a task.
1
2
3
4
5
Completing common tasks on the system has become an automated response for me.
1
2
3
4
5
There are parallels between this system and other systems I have operated.
1
2
3
4
5
The manner in which I try to complete tasks on the system changes to suit my environment.
1
2
3
4
5
APPENDIX B
Original Items for Each Factor
Factor
Goal Content
Goal Sequence
Goal Timeframe
Task Content
Task Sequence
Task Timeframe
Feedback Content
Feedback Sequence
Feedback Timeframe
Feedback Condition
Knowledge
Goal Realistic
Goal Stable
Task Realistic
Task Flexible
Task Organized
Item Numbers
2, 7, 44
3, 5, 13, 49
4, 10, 19,
6, 8, 34, 52
11, 18, 22
9, 23, 43
12, 14, 16, 20
15, 24, 26
17, 21, 47
27, 29, 32, 40
1, 28, 30, 31, 54
25, 33, 36, 37
35, 38, 41
45, 46, 48
39, 42, 55
50, 51, 53
Copyright © 2005, Idea Group Inc. Copying or distributing in print or electronic forms without written
permission of Idea Group Inc. is prohibited.
TEAM LinG
Measurement of Perceived Control in Information Systems
111
APPENDIX C
Final Factor Model
Number
Item
4
19
10
23
9
GT1
GT3
GT2
TT2
TT1
15
16
14
24
FS1
FC3
FC2
FS2
21
17
FT2
FT1
7
6
GC2
TC1
28
30
54
K2
K3
K5
Factor 1 Factor 2 Factor 3 Factor 4 Factor 5
.821
.803
.801
.727
.720
.786
.773
.621
.531
.660
.617
.735
.660
.799
.780
.680
Copyright © 2005, Idea Group Inc. Copying or distributing in print or electronic forms without written
permission of Idea Group Inc. is prohibited.
TEAM LinG
112 Ma and Liu
Chapter VI
The Technology
Acceptance Model:
A Meta-Analysis of
Empirical Findings
Qingxiong Ma, Central Missouri State University, USA
Liping Liu, University of Akron, USA
ABSTRACT
The technology acceptance model proposes that perceived ease of use and
perceived usefulness predict the acceptance of information technology.
Since its inception, the model has been tested with various applications in
tens of studies and has become a most widely applied model of user
acceptance and usage. Nevertheless, the reported findings on the model
are mixed in terms of statistical significance, direction, and magnitude. In
this study, we conducted a meta-analysis based on 26 selected empirical
studies in order to synthesize the empirical evidence. The results suggest
that both the correlation between usefulness and acceptance and between
usefulness and ease of use are somewhat strong. However, the relationship
between ease of use and acceptance is weak, and its significance does not
pass the fail-safe test.
Copyright © 2005, Idea Group Inc. Copying or distributing in print or electronic forms without written
permission of Idea Group Inc. is prohibited.
TEAM LinG
The Technology Acceptance Model 113
INTRODUCTION
Information technology (IT) acceptance or adoption has received considerable attention in the last decade. Several theoretical models have been proposed
to explain end users’ acceptance behavior. Among them, the technology
acceptance model (TAM) proposed by Davis (1989) is widely applied and
empirically tested. There have been tens of empirical studies conducted on TAM
since its inception. Compared with its competing models, TAM is believed to be
more parsimonious, predictive, and robust (Venkatesh & Davis, 2000).
Despite the plethora of literature on TAM, the empirical tests so far have
produced mixed and inconclusive results that vary considerably in terms of
statistical significance, direction, or magnitude. Although they are not uncommon
in social sciences where human behavior is difficult and complex to explain, the
mixed findings not only undermine the precision of TAM, but also complicate
efforts for IT practitioners and academicians to identify the antecedents to user
acceptance behavior.
The goal of this study is to understand to what extent the existing body of
literature reflects substantial and cumulative validity of TAM. In particular, we
synthesize the existing findings on TAM by conducting a meta-analysis. We hope
that by integrating existing empirical findings, we can better understand how
TAM is applicable to different technologies as a whole. We will be able to
examine the relationships between the constructs of TAM with a larger sample
of subjects than any individual studies. We hope that the results of this study can
be used as a benchmark for future tests of TAM.
Besides its potential theoretical contributions, a meta-analysis on TAM also
is significant to IT management practice. By understanding the substantive
antecedents to user acceptance, IT managers can take more effective interventions to achieve greater technology acceptance or usage. As Robey and Marus
(1998) and Benbasat and Zmud (1999) noted, IT management needs prescriptions. IT researchers should not only apply rigorous methodology best suited to
their research objectives, but also produce relevant and consumable research for
practitioners. There can be many possible ways for academic research to
contribute to practice. Benbasat and Zmud (1999) noted as a successful
example, “IT research based on Theory of Reasoned Action and its extensions,
such as the Theory of Planned Behavior, to the study of IT adoption, implementation, and use” (p. 9). They suggested that once a sizable body of literature
exists regarding a phenomenon, “it does become possible to synthesize this
literature” (p. 9). Thus, they recommended that the “IS research community
produce cumulative, theory-based, context-rich bodies of research” (p. 9). In a
sense, the current study answers this rigor and relevance research call.
The outline of this chapter is as follows. We first review the literature on
TAM and indicate major inconsistencies and discrepancies in the existing
findings. Then, we describe how we collected and recorded the sample of
Copyright © 2005, Idea Group Inc. Copying or distributing in print or electronic forms without written
permission of Idea Group Inc. is prohibited.
TEAM LinG
114 Ma and Liu
empirical findings and report the results of our meta-analysis based on 26
selected empirical studies. Finally, we conclude this study by including a
discussion on its limitations and some suggestions for future research.
LITERATURE REVIEW
The Technology Acceptance Model (TAM) introduced by Davis (1986) is
one of the most widely used models to explain user acceptance behavior. This
model is grounded in social psychology theory in general and the Theory of
Reasoned Action (TRA) in particular (Fishbein & Azjen, 1975). TRA asserts
that beliefs influence attitudes, which lead to intentions and, therefore, generate
behavior. Correspondingly, Davis (1986, 1989) introduced the constructs in the
original TAM (see Figure 1) as follows: perceived usefulness (PU), perceived
ease of use (PEOU), attitude, and behavioral intention to use. Among the
constructs, PU and PEOU form an end user’s beliefs on a technology and,
therefore, predict his or her attitude toward the technology, which in turn predicts
its acceptance.
Davis (1989) conducted numerous experiments to validate TAM by using
PEOU and PU as two independent variables, and system usage as the dependent
variable. He found that PU was correlated significantly with both self-reported
current usage and self-predicted future usage. PEOU also was correlated
significantly with current usage and future usage. Overall, he found that PU had
a significantly greater correlation with system usage than did PEOU. Further
regression analysis suggested that PEOU might be an antecedent of PU rather
than a direct determinant of system usage; that is, PEOU affects technology
acceptance (TA) indirectly through PU. Figure 2 shows the validated TAM.
In the last decade, TAM has received considerable attention and empirical
support (Davis, 1989; Mathieson 1991; Taylor & Todd, 1995a). We estimate that
there were about 100 studies, published in journals, proceedings, or technical
reports, that related to TAM between 1989 and 2001. In these studies, TAM was
extensively tested using different sample sizes and user groups within or among
organizations, analyzed with different statistical tools, and compared with
competing models (Gefen, 2000). It was applied to many different end-user
Figure 1. The original technology acceptance model
Perceived
Usefulness
External
Variables
Attitude
Toward Use
Behavioral
Intention to Use
System
Usage
Perceived
Ease of Use
Copyright © 2005, Idea Group Inc. Copying or distributing in print or electronic forms without written
permission of Idea Group Inc. is prohibited.
TEAM LinG
The Technology Acceptance Model 115
Figure 2. A validated technology acceptance model
Perceived
Ease of Use
Perceived
Usefulness
Technology
Acceptance
technologies such as e-mail (Adams, Nelson, & Todd, 1992; Davis, 1989), word
processors (Adams, Nelson, & Todd, 1992; Davis, Bagozzi, & Warshaw, 1989),
groupware (Taylor & Todd, 1995b), spreadsheets (Agarwal, Sambamurthy, &
Stair, 2000; Mathieson, 1991), and the World Wide Web (Lederer, Maupin, Sena,
& Zhuang, 2000). Some studies also extended TAM by including additional
predictors such as gender, culture, experience, and self-efficacy. Overall,
researchers tend to suggest that TAM is valid, parsimonious, and robust
(Venkatesh & Davis, 2000).
Davis (1989) developed and validated the scales for PEOU and PU and
found six highly reliable items for each construct with a Cronbach’s alpha of .98
for PU and .94 for PEOU, respectively. In succeeding studies, the measurement
items for these constructs varied from researcher to researcher (Adams,
Nelson, & Todd, 1992). As a result, the cumulative number of items for
measuring PU has increased from the original six to currently about 50, and for
PEOU has increased from six to 38. The Appendix shows nine different
instruments for PU and PEOU that were used in the existing studies1. Upon
closer scrutiny of the list, we found that the differences in measurement items
among the studies tend to be the result of adapting TAM to different technologies. The essential definitions of the constructs to be measured are still the same.
Therefore, we conclude that the empirical findings on the relationships between
the constructs in TAM are not much affected by how the constructs are
measured.
Existing empirical findings on TAM are not consistent and conclusive
(Moore & Benbasat, 1991). For instance, some studies indicated that PEOU has
no significant impact on TA, while others found that such an impact is significant
(Hendrickson & Collins, 1996; Subramanian, 1994; Venkatesh & Davis, 1996).
Many studies found that the impact of PEOU on PU is stronger than that of
PEOU on TA, whereas others found a much larger effect of PEOU on TA than
PU (Lim, 2001). More perplexing is the fact that even in the same study, when
the subjects were tested with different applications, PEOU was negatively
related to TA in some cases, but positively in others (Adams, Nelson, & Todd,
1992).
With regard to the divergent findings, many possible explanations have been
provided. However, they tend to be qualitative and subjective. What is needed,
we believe, is to integrate these findings and generate a quantitative and
objective synthesis.
Copyright © 2005, Idea Group Inc. Copying or distributing in print or electronic forms without written
permission of Idea Group Inc. is prohibited.
TEAM LinG
116 Ma and Liu
RESEARCH METHODOLOGY
Meta-analysis is defined as the “statistical analysis of a collection of
analysis results from individual studies for the purpose of integrating the
findings” (DerSimonian & Laird, 1986). An individual test typically provides
summary statistics that indicate the significance of the test results. In metaanalysis, we need to convert the statistics into a common metric called effect
size, which is usually in the form of the Pearson Product Moment Correlation.
Essentially, an effect size represents the degree to which the phenomenon is
present in the population (Cohen, 1977). In this section, we explain how we select
individual studies for our meta-analysis and how we estimate the effect size for
each sample study.
Selection of Individual Studies
To be included in our meta-analysis, a study had to meet four requirements:
(1) It involved empirical testing of TAM directly or indirectly; (2) It reported a
sample size; (3) It reported correlation coefficients between the constructs of
TAM or other values that can be converted to correlations; and (4) It was
published or dated after 1989, which is the year TAM was first published.
One widely documented concern on selecting sample studies for metaanalysis is the publication bias. It is well known that journals are more likely to
publish research results that are statistically significant. Therefore, effect sizes
in published journals are larger than those that have not been published. Because
one of the procedures in meta-analysis is to average the effect sizes of individual
studies, the result may be inflated if only published studies are reviewed
(Schafer, 1999). To avoid this so-called file drawer problem, we searched for
related studies at all levels of publications including refereed journals, unpublished dissertations, and conference proceedings. In this study, our source paper
collection was inclusive. We included all the related studies in major journals
such as MIS Quarterly, Information Systems Research, Information and
Management, and so forth. We searched digital libraries of Association for
Computing Machinery and Association for Information Systems and major
international conference proceedings. We also searched academic databases
such as ProQuest, EBSCO, and ResearchIndex at Google.
One of the important assumptions in meta-analysis is the independence of
individual findings; effect sizes such as correlations in different studies are
statistically independent. This assumption is frequently violated because some
studies often report more than one correlation or effect size based on the same
sample (Martinussen & Bjjornstad, 1999). To observe this assumption, when we
selected studies and calculated the effect sizes, we carefully checked the sample
to make sure it was not based on the same data. If multiple tests based on the
same sample were conducted, we selected only one of them and recorded its
statistics.
Copyright © 2005, Idea Group Inc. Copying or distributing in print or electronic forms without written
permission of Idea Group Inc. is prohibited.
TEAM LinG
The Technology Acceptance Model 117
In this project, initially we found a total of 91 empirical studies. Among them,
65 studies did not report correlation coefficients or other statistics that we could
convert into correlation coefficients. Thus, we dropped those studies and
selected the remaining ones. Among the 26 selected studies, seven of them are
working papers or published in conference proceedings. Since some studies
reported test results based on multiple samples (Davis, 1989; Subramanian,
1994), we obtained 102 correlation coefficients in total from the 26 selected studies.
Estimation of Effect Sizes
It is natural that different studies may report different statistics such as
correlation coefficients, F, t, or chi-square values. Consequently, the results may
not be comparable enough to provide an insight into the strength of a relationship
or the effect of interest (Wolf, 1986). Therefore, it is necessary to convert
different statistics into a common metric before conducting a meta-analysis. In
this study, the Pearson Product Moment Correlation is used as the index of effect
size to represent the empirical strength of a relationship between each pair of the
constructs in TAM. We selected the statistic because of its ease of interpretation
and the availability of formulae for converting other test statistics into correlation
coefficients (Lipsey & Wilson, 2000). In addition to effect size, we also encoded
the sample size for each study and determined whether an effect size is positive
and statistically significant.
For each pair of the constructs in TAM: PU, PEOU, and TA, we calculated
the effect sizes as follows: an effect size is simply a correlation coefficient, if it
was reported; otherwise, it is obtained through a conversion by using a formula.
For example, if a t-value is reported, we converted it into a correlation using the
formula r =
t2
, where df is the degree of freedom. Wolf (1986) provides
t 2 + df
guidelines for converting the most common test statistics to r. Cohen (1965,
1977), Friedman (1968), Glass, McGaw, and Smith (1981), and Rosenthal (1984)
discuss the conversion process and provide guidelines for transforming some less
common statistics. This procedure is widely used in many other studies (Szymanski
& Henard 2001).
DATA ANALYSIS
In this section, we analyze the data and report findings in two steps. First,
we describe the correlations in terms of range, direction, statistical significance,
and sample size. These data will reflect the nature and diversity of the existing
findings on TAM. Second, we present the findings from the univariate analysis
of the correlations. The purpose here is to show the central tendencies of the
existing findings and their statistical significance.
Copyright © 2005, Idea Group Inc. Copying or distributing in print or electronic forms without written
permission of Idea Group Inc. is prohibited.
TEAM LinG
118 Ma and Liu
Table 1. A summary of selected correlations
Link
# of
# of
Studies Correlations
Range of
Correlation
Coefficients
From
To
Positive
Significant
Correlations
#
%
Positive
Insignificant
Correlations
#
%
Range of
Sample Sizes
Cumulative
Sample Size
From
To
Average
PU-TA
21
37
.09
.91
23
62.2
2
5.4
36
1370
179
6058
PEOU-TA
20
32
.07
.59
17
53.0
12
37.5
36
1370
194
5744
PEOU-PU
21
33
.003
.92
21
63.6
6
18.2
39
1370
169
5421
Descriptive Statistics
Based on the 26 selected studies, we obtained 102 correlations as summarized in Table 1. Note that not all studies reported all three correlations or
equivalents. Among the 102 correlations, 37 PU-TA correlations were obtained
from 21 studies, 32 PEOU-TA correlations from 20 studies, and 33 PEOU-PU
correlations from 21 studies. The number of studies for each of the three
relationships is approximately the same. According to the range of correlation
coefficients, it is easy to see that the strength of each relationship varies greatly
from insignificant to strongly significant. For instance, the correlation between
PEOU and PU changes from 0.003 to 0.92. In addition, the correlation
coefficient between PU and TA was insignificant in some instances, although
most studies found otherwise.
As expected, most studies reported positive significant findings and few
non-significant or negative ones. According to Table 1, the percentage of
positive significant correlations of PEOU-PU is the highest among the three
relationships, while PEOU-TA has the highest percentage of positive nonsignificant correlation. The sample size varies from study to study. In some
studies, the sample size is as low as 36; while in others, it is as high as 1,370. Of
course, the extreme cases are few in number. The average sample size indicates
that the number of subjects used in the selected studies is very close across all
three relationships.
The Analysis of Direct Effect
In Table 2, we reported the findings on the mean effect sizes using three
methods: simple mean, sample size adjusted-mean (Mosteller & Bush 1954), and
the Fisher r to Z transformation (Fisher 1932). A simple mean is simply the
average of all individual effect sizes. A sample size adjusted-mean is the sample
size-weighted average of individual effect sizes, or r = ∑ (N i ri ) ∑ N i , where Ni
and ri are the sample size and the effect size of test i, respectively. To use the
Fisher r to Z transformation, three steps are followed (Wolf 1986). First, each
correlation is transformed into Fisher’s Z score using the formula Z = 0.5 *
Copyright © 2005, Idea Group Inc. Copying or distributing in print or electronic forms without written
permission of Idea Group Inc. is prohibited.
TEAM LinG
The Technology Acceptance Model 119
Table 2. Means and variances of correlations
Link
ln (
Sample-SizeAdjusted Correlation
Simple Mean
Correlation
Correlation
from Zr
Sample
Variance
Fail Safe
Nfs.05
Confidence
Interval
PU-TA
0.4113
0.49
0.54
0.0323
131
(.41, .57)
PEOU-TA
0.2759
0.27
0.28
0.0172
-0.7
(.21, .33)
PEOU-PU
0.4679
0.50
0.54
0.0380
71
(.41, .59)
1+ r
) , where r is an individual correlation coefficient. Next, we compute the
1− r
sample size weighted average of the individual Z scores for each pair of the
constructs in TAM. Finally, we convert the weighted average Z score back into
a correlation coefficient.
There are some discussions regarding these methods. Some suggest the
necessity of using the Fisher r to Z transformation in meta-analysis, while others
feel there is not much difference between simple mean and the Fisher r to Z
transformation (Wolf, 1986). Schmidt, Gast-Rosenberg, and Hunter (1980)
discussed the issue and reported a study based the Fisher transformation. In the
current study, we employed both techniques.
It is also commonly believed that correlations estimated from larger samples
and more reliable data sources can produce a mean correlation closer to the
population mean, all else being equal (Hunter & Schmidt, 1990; Szymanki &
Henard, 2001). Thus, it is desirable to calculate reliability-adjusted mean.
However, we found that it is difficult to do so due to the fact that many source
studies failed to report reliability data. Therefore, in this study, we chose samplesize-weighted mean instead of reliability-adjusted mean. Szymanki and Henard
(2001) did the same in their recent meta-analysis on customer satisfaction.
Table 2 shows some differences that result from using different methods.
First, we see that the Fisher r to Z transformation consistently results in larger
means than the other two methods. This inflation phenomenon has been reported
previously (Hunter, Schmidt, & Jackson, 1982; Schmidt, Gast-Rosenberg, &
Hunter, 1980). Second, we found that the mean effect sizes obtained using the
Fisher r to Z transformation and simple average are almost identical, while the
results from the sample-size-adjusted method are smaller. We rechecked sample
sizes and recalculated the means, and found that some extreme sample sizes
have an apparent effect on the means. For example, the correlations for a study
with a sample size of 1,370 are all relatively small (between 0.31 and 0.37). When
it is removed from the meta-analysis, the averages become larger and comparable with those obtained from the other two methods. It indicates that the sample
size adjusted method may not be appropriate for the current study. Thus, we will
Copyright © 2005, Idea Group Inc. Copying or distributing in print or electronic forms without written
permission of Idea Group Inc. is prohibited.
TEAM LinG
120 Ma and Liu
interpret the results of this study based on the Fisher r to Z transformation
method.
According to Cohen (1977), the magnitude of an effect size is small when
it is close to 0.10, medium when it is close to 0.30, and large when it is close 0.50.
By this rough guideline, our meta-analysis suggests a medium-sized effect for the
relationship between PEOU and TA and large effect sizes for PU-TA and
PEOU-PU. Also, note that the effect sizes for PU-TA and PEOU-PU are
almost identical to each other. It is different from the general perception; our
study does not suggest that the PU-TA relationship is stronger than the PEOUPU relationship.
To show the statistical significance of the mean effects, we computed the
99% confidence intervals for each mean estimate, based on the assumption that
individual correlations are normally distributed. These intervals portray the range
of effects that might exist in the true population, given the presence of errors and
variation in the calculation of sample effects. According to the results in Table
2, no interval contains zero, which, therefore, suggests that all three mean effects
are significantly different from zero.
To further test the significance of the findings, given the possibility that we
may miss the studies that report null effects (r = 0), we calculated the fail-safe
N for p = 0.05 using the formula N fs.05 = (ΣZ 1.645) 2 − N , where SZ is the sum of
individual Z scores and N is the number of tests. A fail-safe N represents the
number of additional studies confirming the null hypothesis (r = 0) that would be
needed to reverse a conclusion that a significant relationship exists (Cooper,
1979). Table 2 shows that the mean correlations for PEOU-PU and PU-TA are
significantly different from zero to the extent that 71-131 of null effects would
have to exist to bring the respective mean estimates down to a level not
considered statistically significant. However, the mean correlation for PEOUTA does not pass the fail-safe test as indicated by the negative Nfs.05.
As we pointed out before in this study, we selected the individual correlations reported for the model rather than the average of the correlations reported
within a study. The former is often referred to as individual-level analysis, while
the latter is considered study-level analysis. Hunter and Schmidt (1990) raised
the possibility that an individual-level analysis might underestimate the samplingerror variance and the generalizability of the estimates. To address this concern,
we computed the variance due to sampling error and standard deviation for each
relationship. The results show that the variances of sampling-error are very close
to each other and, therefore, suggest that an individual level analysis is appropriate within the context of this meta-analysis.
Copyright © 2005, Idea Group Inc. Copying or distributing in print or electronic forms without written
permission of Idea Group Inc. is prohibited.
TEAM LinG
The Technology Acceptance Model 121
CONCLUSION
This meta-analysis was designed to synthesize and analyze the existing
empirical findings on Technology Acceptance Model (TAM). It examined the
relationships in TAM with a larger sample size, which is impossible to achieve
in a traditional empirical study. In general, the results of our study confirm Davis’
original findings: Among the three constructs in TAM, both the relationships
between PEOU and PU, and between PU and TA are strong, while the
relationship between PEOU and TA is weak. Here, we measured the strengths
of the relationship from three perspectives. First, with respect to the magnitude
of a mean effect, we found the mean effects for PEOU-PU and PU-TA are
large, while for PEOU-TA is medium. Second, with respect to the statistical
significance of a mean effect, we found that all three mean effects are
significantly positive at the level a = 0.01. Finally, with respect to the fail-safe test
significance, we found that between 71 and 131 null effects would have to be
hidden away in file drawers for the mean correlations between PEOU and PU
and between PU and TA to be non-significant, which seems unlikely. However,
the mean effect for PEOU and TA does not pass the fail-safe test in the sense
that one additional study reporting a null effect would lead to the effect being nonsignificant.
This study contributes to information technology (IT) management in
several important ways. First, usefulness is shown to be critical for IT adoption,
based on the accumulated evidence. It implies that developers should focus on
system functionalities and features to improve the acceptance of a system to be
developed. Second, the relationship between ease of use and usefulness cannot
be ignored. Therefore, when IT professionals develop, test, or adopt a new
system, they should keep in mind that the ease of use of the system has a strong
impact on the end user’s perception of its usefulness.
Of course, when interpreting or applying the results of this research, some
caution is advised. As with any other research methodology, meta-analysis has
its assumptions and limitations. One of the major difficulties of applying metaanalysis to the studies on TAM is that the findings of many previous researchers
are generated by multivariate analyses such as multiple regression, factor
analysis, and structural equation modeling. Meta-analysts have not yet developed effect size statistics that adequately represent this form of research
findings (Lipsey & Wilson, 2000). Consequently, many sample studies were
dropped from our list. Otherwise, the results of this study would be more
accurate.
A second limitation of this study is the lack of the analysis of potential
moderators. Besides documenting the distribution, central tendencies, and
magnitudes of correlations, a meta-analysis can identify whether the variation of
correlations is due to chance or measurement and method factors. Although we
planned to do the analysis on moderating effects and collected data on potential
Copyright © 2005, Idea Group Inc. Copying or distributing in print or electronic forms without written
permission of Idea Group Inc. is prohibited.
TEAM LinG
122 Ma and Liu
moderators, including the technologies applied, the types of participants, and
whether the researchers use an experimental or survey approach, the small size
of the selected studies prevented us from running multiple regressions to
investigate their possible effects.
Our finding on the relationship between PEOU and TA is uncertain. More
future studies are needed to resolve the uncertainty. One possible direction is to
investigate whether the relationship is moderated by a third variable such as
gender, culture, experience, self-efficacy, complexity of a technology, or the
state of knowledge on a technology. Several existing studies do suggest the
possible existence of moderating effects. Gefen and Straub (1997) found that
although women tend to perceive the PEOU of e-mail to be higher than men, their
usage of e-mail is actually less than that of men. In their more recent study with
Internet technology, Gefen and Straub (2000) found that PEOU influences TA
when a Web site involves inquiries but does not influence TA when a Web site
is used for a purchasing task. Similarly, in a study of examining PEOU with
objected-oriented analysis technique, Liu and Grandon (2002) found that compared to the subjects with only partial training in structured technique, those
without training felt more positive about the PEOU of object-oriented techniques
but performed worse in object-oriented analysis tasks; those with full training
also felt more positive about its PEOU, but also performed better. Finally, Chircu,
Davis, and Kauffman (2000) studied the role of expertise in the adoption of
electronic commerce intermediaries and found that transaction complexity is an
important moderator for the relationships between PEOU and PU and between
PU and TA. By synthesizing these exiting findings, we noticed a common
phenomenon that individual and task characteristics moderate the PEOU-TA
relationship. Gefen and Straub (1997) and Liu and Grandon (2002) emphasized
individual differences such as gender and experience, whereas Gefen and Straub
(2000) and Chircu, Davis, and Kauffman (2000) stressed task characteristics.
Therefore, we suggest that future research should look into these characteristics
in order to better understand the weak PEOU-TA contingency.
REFERENCES
(*Studies whose findings are included in the meta-analyses.)
*Adams, D.A., Nelson, R.R., & Todd, P.A. (1992). Perceived usefulness, ease
of use, and usage of information. MIS Quarterly, 16(2), 227-250.
Agarwal, R., & Prasad, J. (1999). Are individual differences germane to the
acceptance of new information technologies? Decision Sciences, 30(2),
361-391.
Agarwal, R., Sambamurthy, V., & Stair, R.M. (2000). The evolving relationship
between general and specific computer self-efficacy—An empirical assessment. Information Systems Research, 1(4), 418-430.
Copyright © 2005, Idea Group Inc. Copying or distributing in print or electronic forms without written
permission of Idea Group Inc. is prohibited.
TEAM LinG
The Technology Acceptance Model 123
Benbasat, I., & Zmud, R. (1999). Empirical research in information systems: The
practice of relevance. MIS Quarterly, 23(1), 3-16.
*Chau, P.Y.K. (1996). An empirical assessment of a modified technology
acceptance model. Journal of Management Information Systems, 13(2),
185-204.
*Chircu, A.M., Davis, G.B., & Kauffman, R.J. (2000). The role of trust and
expertise in the adoption of electronic commerce intermediaries.
Technical Report, WP 00-07, Carlson School of Management, University
of Minnesota, Minneapolis, MN.
Cohen, J. (1965). Some statistical issues in psychological research. In B.
Wolman (Ed.), Handbook of clinical psychology. New York: Academic
Press.
Cohen, J. (1977). Statistical power analysis for the behavioral sciences.
New York: Academic Press.
Cooper, H.M. (1979). Statistically combining independent studies: A metaanalysis of sex differences in conformity research. Journal of Personality
and Social Psychology, 37, 131-146.
Davis, F.D. (1986). A technology acceptance model for empirically testing
new end-user information systems: Theory and results [Doctoral Dissertation]. Cambridge, MA: MIT Sloan School of Management.
*Davis, F.D. (1989). Perceived usefulness, perceived ease of use, and user
acceptance. MIS Quarterly, 13(3), 319-340.
*Davis, F.D. (1993). User acceptance of information technology: System
characteristics, user perceptions and behavioral impacts. International
Journal of Man-Machine Studies, 38(3), 475-487.
Davis, F.D., Bagozzi, R.P., & Warshaw, P.R. (1989). User acceptance of
computer technology: A comparison of two. Management Science, 35(8),
982-1001.
*Davis, F.D., & Venkatesh, V. (1996). A critical assessment of potential
measurement biases in the technology acceptance model: Three experiments. International Journal of Human-Computer Studies, 45(1), 1945.
DerSimonian, R., & Laird, N.M. (1986). Meta-analysis in clinical trials. Controlled Clinical Trials, 7, 177-188.
Fishbein, M., & Azjen, I. (1975). Belief, attitude, intention and behavior.
Reading, MA: Addison-Wesley.
Fisher, R.A. (1932). Statistical methods for research workers. London: Oliver
and Boyd.
Friedman, H. (1968). Magnitude of experimental effect and a table for its rapid
estimation. Psychological Bulletin, 70, 245-251.
Gefen, D. (2000). Structural equation modeling and regression: Guidelines for
research practice. CAIS, 4(7).
Copyright © 2005, Idea Group Inc. Copying or distributing in print or electronic forms without written
permission of Idea Group Inc. is prohibited.
TEAM LinG
124 Ma and Liu
*Gefen, D., & Keil, M. (1998). The impact of developer responsiveness on
perceptions of usefulness and ease of use: An extension of the technology
acceptance model. The Data Base for Advances in Information Systems,
29(2), 35-49.
Gefen, D., & Straub, D.W. (1997). Gender differences in the perception and use
of e-mail: An extension to the technology acceptance model. MIS Quarterly, 21(4), 389-400.
*Gefen, D., & Straub, D. (2000). The relative importance of perceived ease-ofuse in IS adoption: A study of e-commerce adoption. Journal of the
Association for Information Systems, 1(8).
Glass, G.V., McGaw, B., & Smith, M.L. (1981). Meta-analysis in social
research. Beverly Hills, CA: Sage Publications.
Heijden, H. (2000). Using the technology acceptance model to predict
website usage: Extensions and empirical test. Technical Report, No.
0025, Retrieved, from http://ideas.uqam.ca/ideas/data/Papers/
dgrvuarem2000-25.html
*Hendrickson, A.R., & Collins, M.R. (1996). An assessment of structure and
causation of IS usage. The DATA BASE for Advances in Information
Systems, 27(2), 61-67.
Hunter, J.E., & Schmidt, F.L. (1990). Methods of meta analysis. Newbury
Park, CA: Sage Publications.
Hunter, J.E., Schmidt, F.L., & Jackson, G.B. (1982). Meta-analysis: Cumulating research findings across studies. Beverly Hills, CA: Sage Publications.
*Igbaria, M., Guimaraes, T., & Davis, G.B. (1995). Testing the determinants of
microcomputer usage via a structural equation model. Journal of Management Information Systems, 11(4), 87-114.
*Igbaria, M., Iivari, J., & Maragahh, H. (1995). Why do individuals use computer
technology? A Finnish case study. Information and Management, 29(5),
227-238.
*Igbaria, M., Parasuraman, S., & Baroudi, J. (1996). A motivational model of
microcomputer usage. Journal of Management Information Systems,
13(1), 127-143.
*Igbaria, M., Zinatelli, N., Cragg, P., & Cavaye, A.L.M. (1997). Personal
computing acceptance factors in small firms: A structural equation model.
MIS Quarterly, 21(3), 279-305.
*Jackson, C.M., Chow, S., & Leitch, R.A. (1997). Towards an understanding of
the behavioral intention to use an iInformation system. Decision Sciences,
28(2), 357-389.
*Lederer, A.L., Maupin, D.J., Sena, M.P., & Zhuang, Y. (2000). The technology
acceptance model and the World Wide Web. Decision Support Systems,
29(3), 269-292.
Copyright © 2005, Idea Group Inc. Copying or distributing in print or electronic forms without written
permission of Idea Group Inc. is prohibited.
TEAM LinG
The Technology Acceptance Model 125
Lim, K-S. (2001). An empirical test of the technology acceptance model.
Proceedings of Decision Science Institute Annual Meeting, San Francisco, CA.
Lipsey, M.W., & Wilson,D.B. (2000). Practical meta-analysis: Applied social
research methods series, volume 49, Thousand Oaks, CA: Sage Publications.
Liu, L., & Grandon, E.E. (2002). An empirical study of how prior training in
structured analysis affects the perceptions on object orientation
[Technical Report]. Akron, OH: Department of Management, University
of Akron.
*Malhotra, Y., & Galletta, D.F. (1999). Extending the technology acceptance
model to account for social influence: Theoretical bases and empirical
validation. Proceedings of the 32nd Hawaii International Conference
on System Sciences, Honolulu, HI.
Martinussen, M., & Bjornstad, J.F. (1999). Meta-analysis calculations based on
independent and nonindependent cases. Educational and Psychological
Measurement, 59(6), 928-950.
*Mathieson, K. (1991). Predicting user intentions: Comparing the technology
acceptance model with the theory of planned behavior. Information
Systems Research, 2(3), 173-191.
Moore, G.C., & Benbasat, I. (1991). Development of an instrument to measure
the perceptions of adopting an information technology innovation. Information Systems Research, 2, 192-222.
Mosteller, F.M., & Bush, R.R. (1954). Selected quantitative techniques. In G.
Lindzey (Ed.), Handbook of social psychology, Volume 1. Cambridge,
MA: Addison-Wesley.
Robey, D., & Markus, L. M. (1998). Beyond rigor and relevance: Producing
consumable research about information systems. Information Resources
Management Journal, 11(1), 7-15.
*Rose, G., Straub, D.W. (1998). Predicting general IT use: Applying TAM to the
Arabic world. Journal of Global Information Management, 6(3), 39-47.
Rosenthal, R. (1984). Meta-analytical procedures for social research.
Beverly Hills, CA: Sage.
Schafer, W.D. (1999). Methods, plainly speaking—An overview of metaanalysis. Measurement and Evaluation in Counseling and Development, 32(1), 43-61.
Schmidt, F.L., Gast-Rosenberg, I., & Hunter, J.E. (1980). Validity generalization: Results for computer programmers. Journal of Applied Psychology,
65(6), 643-661.
*Segars, A.H., & Grover, V. (1993). Re-examining perceived ease of use and
usefulness: A confirmatory factor analysis. MIS Quarterly, 17(4), 517-525.
Copyright © 2005, Idea Group Inc. Copying or distributing in print or electronic forms without written
permission of Idea Group Inc. is prohibited.
TEAM LinG
126 Ma and Liu
*Straub, D.W., Keil, M., & Brennan, W. (1997). Testing the technology
acceptance model across cultures: A three country study. Information
and Management, 33(1), 1-11.
Straub, D.W., Limayem, M., & Karahanna, E. (1995). Measuring system usage:
Implications for IS theory testing. Management Science, 41(8), 13281342.
*Subramanian, G.H. (1994). A replication of perceived usefulness and perceived ease of use measurement. Decision Sciences, 25(5-6), 863-872.
*Szajna, B. (1996). Empirical evaluation of the revised technology acceptance
model. Management Science, 42(1), 85-92.
Szymanki, D.M., & Henard, D.H. (2001). Customer satisfaction: A metaanalysis of the empirical evidence. Journal of the Academy of Marketing
Science, 29(1), 16-35.
*Taylor, S., & Todd, P. (1995a). Understanding information technology usage:
A test of competing models. Information Systems Research, 6(2), 144173.
*Taylor, S., & Todd, P. (1995b). Assessing IT usage: The role of prior
experience. MIS Quarterly, 19(4), 561-570.
*Teo, T.S.H., Lim V.K.G., & Lai, R.Y.C. (1999). Intrinsic and extrinsic
motivation in Internet usage. Omega, 27(1), 25-37.
*Venkatesh, V., & Davis, F.D. (1996). A model of the antecedents of perceived
ease of use: Development and test. Decision Sciences, 27(3), 451-480.
*Venkatesh, V., & Davis, F.D. (2000). A theoretical extension of the technology
acceptance model: Four longitudinal field studies. Management Science,
46(2), 186-204.
Wolf, F.M. (1986). Meta-analysis—Quantitative methods for research synthesis. Newbury Park, CA: Sage Publications.
ENDNOTE
1
Many studies used one of these instruments with no modification. For
example, Adams, Nelson, and Todd (1992), Gefen and Straub (1997), and
Chircu, Davis, and Kauffman (2000) used the same instrument as in Davis
(1989). Similarly, Jackson, Chow, and Leitch (1997), Subramanian (1994),
and Szajna (1996) used the same instrument as Davis, Bagozzi, and
Warshaw (1989). Some other studies did not report their instruments but
mentioned that they adopted an existing one in the list.
Copyright © 2005, Idea Group Inc. Copying or distributing in print or electronic forms without written
permission of Idea Group Inc. is prohibited.
TEAM LinG
The Technology Acceptance Model 127
APPENDIX
Sample Measurement Scales for PU and PEOU
Study
Davis (1989)
Gefen and Keil (1998)
Heijden (2000)
Agarwal & Prasad
(1999)
Davis, Bagozzi, &
Warshaw (1989)
Gefen & Straub
(2000).
Igbaria, Iivari, &
Maragahh (1995)
Venkatesh & Davis
(1996)
Straub, Limayem, &
Karahanna (1995)
PU
-Work more quickly
-Job performance
-Increase productivity
-Effectiveness
-Makes job easier
-Useful
-Using … enables me to accomplish
configuration tasks more quickly
-Using … improves the quality of the
work I do
-Using … improves my job performance
-Overall, I find … to be advantageous in
my job
-Using … increases my sales
productivity
-I find … primarily a useful site
-The information on the site is interesting
to me
-I find this a site that adds value
-Accomplish tasks more quickly
-Improve my job performance
-Give me greater control over my work
-Improve the quality of the work I do
-Improve my productivity
-Make it easier to do my job
-Is useful in my job
-Using … would improve my
performance
-Using … would enhance my
effectiveness
-Using … would increase my
productivity
-I would find … useful
-ABB improves my performance in book
searching
-ABC enables me to search and buy
books faster
-ABC enhances my effectiveness in book
searching and buying
--ABC makes it easier to search for and
purchase books
-ABC increases my productivity in
searching and purchasing books
-Using … improves my job performance
-Using … increases my productivity
-I find … useful in my job
-Using … enhances my effectiveness in
the job
-Using … provides me with information
that would lead to better decisions
-Using … would improve my
performance in my degree program
-Using … in my degree program would
increase my productivity
-Using … would enhance my
effectiveness in my degree program
-I find … would be useful in my degree
program
-Voicemail is very important in
performing my job;
-My decision-making is more effective
PEOU
-Easy to learn
-Clear and understandable
-Easy to become skillful
-Easy to use
-Controllable
-Flexible
-Learning to operate … was easy for me
-Using … is clear and understandable
-I believe that … is easy to use
Technology
Lab experiment with e-mail
and graphics
Field study with expert
system CONFIG
-It is easy to navigate around the site
-I can quickly find the information that I
need
-I think it is a user-friendly site
-It is easy for me to remember how to
perform tasks
-It is easy to get … to do what I want it
to do
-My interaction with … is clear and
untreatable
-Overall it is easy to use
-Learning to operate … would be easy
for me
-I would find it easy to get … to do what
I want it to do
-It would be easy for me to become
skillful at using …
-I would find … easy to use
-ABC is easy to learn
-My interaction with ABC is clear and
understandable
-It is easy to become skillful at using
ABC
-Learning to operate ABC is easy
-It is easy to interact with ABC
-ABC is flexible to interact with
Field study with a Web site
-Learning to use … would be easy for
me
-I would find it easy to get … to do what
I want it to do
-It would be easy for me to become
skillful at using …
-I would find … easy to use
-My interaction with … is clear and
understandable
-Interacting with … does not require a lot
of my mental effort
-I find … easy to use
-I find it easy to get … to do what I want
it to do
Field study with
microcomputers
-I find it easy to get voicemail to do what
I want it to do
-I feel very comfortable using voicemail
Field study with voicemail
Field study with GUI
environment
Lab experiment with a word
processor
Lab experiment with an
online bookstore
Lab experiment with PC and
word processor
Copyright © 2005, Idea Group Inc. Copying or distributing in print or electronic forms without written
permission of Idea Group Inc. is prohibited.
TEAM LinG
128 Ma and Liu
Section II:
Collaborative
Technologies
and
Implementation
Issues
Copyright © 2005, Idea Group Inc. Copying or distributing in print or electronic forms without written
permission of Idea Group Inc. is prohibited.
TEAM LinG
Success Factors in the Implementation of a Collaborative Technology
129
Chapter VII
Success Factors in the
Implementation of a
Collaborative Technology
and Resulting Productivity
Improvements in
a Small Business:
An Exploratory Study
Nory B. Jones, University of Maine, USA
Thomas R. Kochtanek, University of Missouri in Columbia, USA
ABSTRACT
Practitioners and academics often assume that investments in technology
will lead to productivity improvements. While the literature provides many
examples of performance improvements resulting from adoption of different
technologies, there is little evidence demonstrating specific, generalizable
factors that contribute to these improvements. Furthermore, investment in
technology does not guarantee effective implementation. This qualitative
study examined the relationship between four classes of potential success
Copyright © 2005, Idea Group Inc. Copying or distributing in print or electronic forms without written
permission of Idea Group Inc. is prohibited.
TEAM LinG
130
Jones and Kochtanek
factors on the adoption of a collaborative technology and whether they
were related to performance improvements in a small service company.
Users of a newly adopted collaborative technology were interviewed to
explore which factors contributed to their initial adoption and subsequent
effective use of this technology. The results show that several factors were
strongly related to adoption and effective implementation. The impact on
performance improvements was further explored. Results showed a
qualitative link to several performance improvements including timesavings
and improved decision-making. These results are discussed in terms of
generalizability as well as suggestions for future research.
INTRODUCTION
The importance of knowledge sharing and the ability to tap into an
organization’s vast reservoir of creative intellect have been acknowledged as
possibly the greatest strategic competency an organization can achieve (Davenport 1999; Pan et al. 1999). By enabling associates to share their ideas, expertise,
and wisdom, problems can be solved more easily, processes can be improved,
and productivity can be increased. As business environments become more
turbulent and technologies become increasingly dynamic, the pace of change and
competitive pressures spiral more steeply upward. As this pace continues,
organizations require technologies, capabilities, and a culture that enables them
to keep up with these changes (Rumizen 1998; Senge 1997).
Furthermore, in an era that is becoming predominantly digital, the ability to
share knowledge is becoming easier, cheaper, and more widely accepted. Many
organizations recognize that collaborative technologies, supported by distributed
electronic networks, can reduce barriers to communication and facilitate knowledge sharing within the organization (Ciborra et al. 1996). Collaborative technologies can enable people in distributed environments to work together seamlessly,
irrespective of location, time, or functional area. By sharing a common goal in a
networked environment, virtual teams can create synergistic relationships and
quality output via collaborative knowledge sharing. In addition, the communication patterns that develop in electronic collaborative environments are equally
applicable to people sharing knowledge in the same building or even in the same
room as those who are divided by continents (Barbar et al. 1998).
While causal relationships between knowledge sharing and specific quantifiable performance improvements to achieve competitive advantages have
been scarce, researchers have qualitatively documented some organizational
performance improvements. For example, the adoption of one particular collaborative technology (Lotus Notes) to facilitate knowledge sharing increased
productivity and efficiency in a software company when they created a
knowledge sharing repository to prevent duplication of research efforts (Orlikowski
Copyright © 2005, Idea Group Inc. Copying or distributing in print or electronic forms without written
permission of Idea Group Inc. is prohibited.
TEAM LinG
Success Factors in the Implementation of a Collaborative Technology
131
1999). The research literature acknowledges this relationship while seeking to
validate it with additional empirical studies. While most research in knowledge
management and collaborative technologies has focused on large organizations,
few studies have examined its impact on small businesses. In addition, few
studies have explored the specific success factors that contribute to the adoption
and diffusion of technologies that facilitate knowledge sharing and resulting
performance improvements.
This article describes the experiences of a scientific contract research
organization that works in the pharmaceutical industry in its attempt to improve
organizational performance by adopting a collaborative technology to facilitate
knowledge sharing within the organization. It explores four classes of potential
success factors to facilitate this process. The literature on knowledge sharing
and collaborative technologies suggests a number of factors considered to be
instrumental in achieving successful knowledge information among people in
organizations.
In addition, researchers in the field of performance measurement and
collaborative technologies have found tentative relationships between performance improvement and knowledge sharing using different collaborative technologies in different contexts. However, organizations often introduce new
technologies using a forced adoption approach without fully understanding the
specific factors required for their continued and effective use. This represents
a prerequisite requirement, if the technology is to be used to fulfill the goals for
which it was intended.
Therefore, this study explored how and why certain variables contribute or
fail to contribute to the effective use of a CSCW (computer-supported collaborative work) system as well as their influence on knowledge sharing using a
CSCW system. The relationship between knowledge sharing, facilitated by a
collaborative technology, and resulting performance improvements in this small
business was also examined. Finally, this chapter reflects on the lessons learned
from this experience and whether the findings may be generalizable to other
organizations.
REVIEW OF THE LITERATURE
Adoption of Technology Innovations and Success
Factors
Pan and Scarbrough (1998, 1999) studied specific factors relating to the
successful implementation of a knowledge sharing system. The model outlined
serves as the framework for the initial study model (Figure 1). They introduced
a theory that said knowledge management should contain three components to
be successful:
Copyright © 2005, Idea Group Inc. Copying or distributing in print or electronic forms without written
permission of Idea Group Inc. is prohibited.
TEAM LinG
132
Jones and Kochtanek
1.
Infrastructure: “The hardware/software that enables the physical/communicational contact between network members; provides the means to share
knowledge” (e.g., H. Saint-Onge, a senior vice president at a Canadian
financial company, described the necessity of infrastructure as “connectivity-building, a seamless railroad that can carry the knowledge freight
around the organization” (Informationweek, 1999, p. 7ER).
Infostructure: “The formal rules which govern the exchange between the
participants in the network, providing a set of cognitive resources (metaphors, common language) whereby people make sense of events on the
network.”
Infoculture: “The stock of background knowledge which actors take for
granted and which is embedded in the social relations surrounding work
group processes; core values and attitudes, reflected in employees and
managers’ willingness to exchange knowledge to solve company problems.” This would also be known as the organizational culture. A common
theory among researchers was that organizational culture played a crucial
role in the effective adoption and use of both collaborative technologies and
knowledge sharing.
2.
3.
The importance of culture in the adoption and implementation was exemplified by the CEO of Buckman Laboratories. “The core values and attitudes of
Buckman employees are reflected in their willingness to exchange knowledge
simply to solve company problems, without the usual political baggage and
ulterior motives.” He further asserted, “What happened at Buckman was 90%
cultural change. At the heart of knowledge-sharing activities at Buckman is a
climate of continuity and trust.” (Pan & Scarbrough, 1999, p.369). Saint-Onge
also stated, “[Y]ou need a culture that fosters interdependence—that has a
sense that everyone is creating the future of the firm through everything they’re
doing” (Informationweek, 1999, p.7ER)
Scheraga (1998) contended that “putting knowledge management solutions
in place can prove useless unless a company encourages its workforce to
contribute its knowledge to the cycle. This is one of management’s greatest
challenges, as workers are often reluctant to share information. The modern
business climate inherently rewards people for what they know, which discourages people from sharing their knowledge.” However, he suggests that the
answer to this is to reward employees for sharing information and knowledge.
Pan and Scarbrough (1998, 1999) also emphasized the importance of top
management involvement. As mentioned above, the CEO of Buckman Laboratories acted as the visionary and the champion in the effort to create a
knowledge-sharing environment within the company. Not only did he invest
heavily in the infrastructure (the technology to provide the vehicle for sharing
knowledge), but he also created unique reward and recognition systems to
actively promote knowledge sharing, contending that employees who share their
Copyright © 2005, Idea Group Inc. Copying or distributing in print or electronic forms without written
permission of Idea Group Inc. is prohibited.
TEAM LinG
Success Factors in the Implementation of a Collaborative Technology
133
knowledge would become influential throughout the organization. In addition, he
modeled the culture by sharing knowledge and empowering associates to also
share theirs. Thus, creating a successful knowledge sharing culture is a blend of
technology and sociology, creating both the mechanisms to facilitate knowledge
sharing and the culture to encourage it in practice.
Collaborative Technologies, Knowledge Sharing, and
Performance Improvements
What lessons can be learned from the literature on knowledge sharing and
collaborative technologies that can help a small business? By creating the
capability to capture, organize, and disseminate knowledge, a small business
potentially can improve decision-making, processes, quality, customer satisfaction, and can reduce costs. This premise is based on capturing and sharing the
experience and knowledge of employees to facilitate creativity and innovation.
This assertion is based on the research found in the knowledge management
literature. Karl Wigg (1999) described the benefits of a knowledge management
system as reducing costs due to benchmarking and sharing best practices
between different groups inside and outside the organization, decreasing timein-process, reducing rework, and increasing customer satisfaction and quality by
increasing people’s knowledge of and improvement of processes. Other benefits
include an increase in innovation in products, services, and processes due to
sharing of knowledge among different functional areas, and increased knowledge of customers resulting in the ability to better satisfy their needs, resulting
in increased market penetration and increased profit margins.
Reisenberger (1999) further asserts that “the rate of employee turnover and
the speed of change requires us to place greater emphasis on capturing,
disseminating, and rescuing our precious intellectual capital” (p. 96). He takes
this one step further in his contention that “[t]oday’s fast-paced business
environment is characterized by chaotic markets with constantly evolving global
customers, competitors and suppliers. Tomorrow’s winners will be determined
by these few firms that create the ability to develop constant and continuous
innovation and transformation. This ability will be manifested successfully by
those enterprises that understand, properly harness, and exploit global learning
and the use of the organization’s intellectual capital” (p. 94). Even Peter Drucker
(1995) mirrors this view, asserting that in a knowledge society, “the basic
economic resource is no longer capital or natural resources or labor, but is and
will be knowledge, and where knowledge workers will pay a central role”
(Reisenberger, 1999, p. 94).
In terms of the relationship between knowledge sharing and performance
improvement, most researchers admit that while there are many conceptual
articles supporting the relationship, there is little empirical evidence to validate
it. Davenport (1999) suggests that it is extremely difficult to establish a causal
Copyright © 2005, Idea Group Inc. Copying or distributing in print or electronic forms without written
permission of Idea Group Inc. is prohibited.
TEAM LinG
134
Jones and Kochtanek
link between knowledge, strategy and organizational performance. However, in
an empirical study on large pharmaceutical firms that compete on the speed and
effectiveness of the drug development process, it was found that those firms
using knowledge management developed drugs more quickly. Furthermore, they
found that firms using knowledge management strategies, including knowledge
creation, idea generation and knowledge sharing, tended to be more profitable
than those that did not use these practices.
Davenport also suggests that one way to establish credibility in relating
knowledge management to improved performance is to use intermediate measures. For example, he suggested measuring the number of hits to a knowledge
repository or the satisfaction measures of employees using a knowledge
management system. By correlating these types of indicators with knowledge
management practices, a case can be built for the credibility of these processes.
Orlikowski (1996) studied the users of a digital collaboration software
system in a technical customer support division of a software company. Her
observations demonstrated a non-quantified increase in productivity. The creation of a knowledge repository allowed associates to share processes and
document problem-solving methods. This collective knowledge contributed to
better solutions to customer problems and improved efficiency and productivity,
since associates did not have to start from ground zero to research customer
problems. It also increased accountability and decision-making, because information entered into a repository was signed by the author, and users were aware
of the credibility of the sources. As the knowledge base grew, it shifted from
being simply a knowledge repository to being a training mechanism, as well. She
attributed the success of the groupware in this situation to a departmental culture,
which was open to change, and to using new technologies as well as adequate
training and expectations. The collaboration software was also user-centered,
emphasized a specific functionality, and was phased in gradually.
Failla (1996) similarly found that a team-oriented collaborative culture was
necessary for the successful adoption of collaboration technology tools as well
as commitment by top management and the users. He also identified interesting
criteria for the success of a collaborative database as a useful information
filtering system.1 He found that if no one took ownership of the system and
filtered data for relevance and usefulness, then it was not deemed to be valid by
the users. Consistent with this was his observation that users needed to take
personal satisfaction in the input they made into the system, inputting valuable
knowledge that would make a significant contribution to the organizational
knowledge.
In a consumer products manufacturer, Ciborra and Patriotta (1996) found
that the effectiveness2 of the new technology depended on the perceived
benefits of the new system (i.e., relative advantage) as well as the willingness
of the users to act collectively. They also found that resistance to the tool by new
Copyright © 2005, Idea Group Inc. Copying or distributing in print or electronic forms without written
permission of Idea Group Inc. is prohibited.
TEAM LinG
Success Factors in the Implementation of a Collaborative Technology
135
users depended on how closely it matched pre-existing work practices as well
as the presence of alternative communication tools with which users were
already familiar and comfortable. Adoption depended on organizational rewards
and incentives to use and actively contribute to the system. This particular
organization needed to change its culture to a more collaborative one and to
implement a reward scheme to encourage contributions to the system. These
findings are consistent with the adoption and diffusion literature (Rogers, 1995)
regarding the importance of relative advantage and compatibility in the continued
and effective use of a new technology.
In terms of knowledge sharing and contract research organizations, Mancini
(1998) suggested that using document sharing technologies like CSCW tools are
becoming more important as “time to market” in the pharmaceutical industry, is
more critical than ever. In addition, the reasons for using a document sharing
technology also translates into huge time savings where delays in the research
process can cause delayed approvals by the FDA (Food & Drug Administration). This potentially can result in millions of dollars in lost or delayed revenues
to the companies. Therefore, if a CSCW technology can allow people within this
industry to share information (documents and otherwise) and knowledge more
effectively, thereby reducing review, editing, and process time, it can give both the
contract research organizations and their clients, pharmaceutical and chemical
companies, a competitive advantage by reducing time to market.
THE STUDY
Purpose
The overarching purpose of this research was primarily to identify and
understand success factors that influence the continued and effective use of a
CSCW system, enabling knowledge sharing. Secondarily, the purpose was to
examine the resulting consequences of its use in several dimensions, including
performance improvements in time, productivity, and quality.
Research Questions
The literature suggests that factors associated with infrastructure,
infostructure, and infoculture are related to the successful adoption and implementation of a knowledge-sharing system, facilitated by a collaborative technology. The literature also suggests a relationship between knowledge sharing and
performance improvements in the organization. Based on this analysis of the
literature, the following research questions were posed:
Copyright © 2005, Idea Group Inc. Copying or distributing in print or electronic forms without written
permission of Idea Group Inc. is prohibited.
TEAM LinG
136
Jones and Kochtanek
1.
Which of the variables involved with (1) infrastructure, (2) infostructure,
(3) infoculture, and (4) individual concerns exert an influence (positive or
negative) on the effective use of a CSCW technology and knowledge
sharing, and in what ways do they exert their influence?
How does the use of a CSCW technology to facilitate knowledge sharing
influence the performance dimensions of time, productivity, and quality
assurance?
2.
A study model (Figure 1) was developed to explore the influence that
different potential success factors associated with the four major categories
might exert on the adoption and diffusion of a knowledge sharing system enabled
by a collaborative technology.
The model attempts to incorporate the success factors from the literature
into a comprehensive array of potential contributors to adoption and diffusion of
a knowledge-sharing system. Specifically, the work of Pan and Scarbrough
(1998, 1999) discussed in the literature review serves as the major framework
for this study model, incorporating their socio-technical view of the firm with
their infrastructure, infostructure, and infoculture variables. This study model
added a fourth major variable called individual concerns.
In this model, the infrastructure components incorporate the following
factors:
•
•
•
Relative advantage – user-friendly technologies that users perceive as
superior to existing technologies, providing more or better benefits
Training and time to learn and use the system effectively
Compatibility with existing work routines and norms
The infostructure components dealt with rules governing the use of the
system including:
•
•
Recency and relevancy of information – how the knowledge was managed
to ensure that contributions were both recent and relevant, thus motivating
its continued use.
Rules governing the system – did users perceive that the system was
managed well with clear and consistent rules for usage?
The infoculture component integrated many variables from the literature
including:
•
•
Influence of leadership on initial and continued use of the system
Influence of reward and compensation structures
Copyright © 2005, Idea Group Inc. Copying or distributing in print or electronic forms without written
permission of Idea Group Inc. is prohibited.
TEAM LinG
Success Factors in the Implementation of a Collaborative Technology
•
•
137
Influence of peers and social networks
Influence of trust and communication for effective knowledge sharing
Finally, the last component—individual concerns—explored potential success factors related to an individual’s personal agenda, including:
•
•
•
Prior experience with technologies
Personality variables, identified as adopter categories
Security concerns with using a collaborative technology and sharing
knowledge.
METHODOLOGY
In January of 2000, a contract service business made the decision to adopt
a Web-based collaborative technology for the purposes of enabling knowledge
sharing within the firm. The business was composed of three divisions with about
250 employees. The population of interest for this study consisted of the entire
population of users of a CSCW system within a contract research organization.
When the study was initiated in April of 2000, there were approximately 10-15
users. By completion of the study in December of 2000, there were approximately 47 users. Special emphasis was made to interview the leadership team
(top executives), who represented the heaviest users of the system. These
individuals included the president/CEO, three of the four vice presidents, and the
chief financial officer. In addition, five of the six business development (marketing) managers, who represented low-moderate users, were interviewed as well
as the director of information systems. Finally, from the remaining pool of
approximately 37 occasional-moderate users, 20 were selected by using a quota
system3 to represent the remaining functional areas—eight managers, four
quality-assurance/compliance, and eight data-entry people agreed to be interviewed. During the interview, questions were asked using a survey instrument
designing to elicit their perceptions and attitudes toward this collaborative
technology and knowledge sharing in terms of the factors described in the study
model. Respondents were encouraged to answer freely and openly and were
prompted only to keep responses focused on the variables of interest, if the
conversation began to stray from the topic under discussion.
In this organization, the collaborative system used was a Web-based
document sharing technology called BSCW (Basic Support for Cooperative
Work) (http://bscw.gmd.de/). Its primary application was to enable top management and mid-level managers to collaborate on reports, share information about
sales and budgets, and share information about customer problems and complaints with the quality assurance personnel for quality improvement purposes.
This Internet-based software is platform independent, requiring only an Internet
Copyright © 2005, Idea Group Inc. Copying or distributing in print or electronic forms without written
permission of Idea Group Inc. is prohibited.
TEAM LinG
138
Jones and Kochtanek
Figure 1. Study model
High relative advantage
Infrastructure
High compatibility
Adequate training and time
Infostructure
Information is managed for recency, relevancy, and
security
Clear rules governing use of the system
Leaders (change agents) motivated and committed to
BSCW use
Continued and effective
use of a CSCW
technology to facilitate
knowledge sharing
Reward/compensation structure and incentives
Infoculture
Positive peer influence (opinion leaders) within a social
network in favor of BSCW
Trust, good communication among colleagues
Prior experience and knowledge of technology
Individual
Concerns
Adopter category
Security concerns
Effective use of a CSCW technology to
facilitate knowledge sharing
Performance improvement in time,
processes, and/or innovation
connection, a login/password sequence, and a current version of a Web browser
such as Netscape Navigator or Internet Explorer. BSCW may be considered a
groupware product similar to Lotus Notes, in that it allows multiple users to work
on documents from a central repository, version the documents, and demonstrate
accountability in terms of who created changes and when they were made. The
system is organized within shared folders such as “Sales Forecast: Division A”
folder. The owner of that folder then invites those people that he or she wishes
to share information with, thus controlling access. Each invited member then can
retrieve documents, edit them, version them, and resubmit them. The versioning
capability allows members to see what changes each member made and keep
track of different versions. Its greatest benefit may be that employees can
Copyright © 2005, Idea Group Inc. Copying or distributing in print or electronic forms without written
permission of Idea Group Inc. is prohibited.
TEAM LinG
Success Factors in the Implementation of a Collaborative Technology
139
access needed information anywhere in the world at any time as long as they
have Web access.
In this qualitative study, metrics represented indicators of employee perceptions and attitudes regarding the collaborative technology. The number of times
that respondents discussed each factor was counted from the interview transcripts and analyzed using SPSS for frequency distributions and correlations with
actual usage. For example, if respondent #12 discussed relative advantage four
times, it was documented. In contrast, this respondent might not have discussed
compatibility at all as a factor in his or her usage of the collaborative technology.
Usage was documented on a daily basis from a log file that recorded the number
of hits to the system per user per day. All data were analyzed qualitatively from
the recorded transcripts as well as quantitatively using frequency distributions
and correlation analyses on the SPSS software program.
RESULTS
Influence of Major Variables
Figure 2 shows the total number of responses for each major variable in the
study. It may be inferred that the number of responses correlates with how
strongly people felt about each topic, as they would tend to elaborate more on
topics of interest to them. Because the responses focused on infrastructure and
infoculture variables, those factors are discussed in this chapter. In this case
study, the users did not express indications that the factors associated with
infostructure or individual concerns influenced their usage of this collaborative
technology or their willingness to share knowledge and information.
A correlation analysis (Table 1) between the four major variables of interest
and average BSCW use per day per person was run. Infrastructure showed a
significant correlation with usage at the 0.01 level. While not statistically
significant, infoculture did show a higher correlation than the other variables.
Based on these results, the individual components associated with infrastructure and infoculture were examined. In terms of the subcomponents
components within infrastructure, results showed that relative advantage emerged
as the major factor of influence.
For the infoculture subcomponents, the rich interview responses suggested
that leadership exerted the greatest influence on use of the collaborative
technology to support knowledge sharing. A reward/compensation structure to
support knowledge sharing was also seen as important. The following responses
exemplify this.
“Basically, [President/CEO] told us to use this system, so we are. He can
look to see who uses it to update the forecast and other information.”
Copyright © 2005, Idea Group Inc. Copying or distributing in print or electronic forms without written
permission of Idea Group Inc. is prohibited.
TEAM LinG
140
Jones and Kochtanek
Figure 2. Total responses for major variables (n=30)
Percent of total
Responses by Category
33%
32%
40%
30%
20%
10%
0%
24%
11%
e
ur
ct
ru
t
s
fo
In
..
c.
tru
s
fra
In
In
f
u
oc
ltu
re
In
di
v
u
id
al
...
Figure 3. Total responses relating to performance improvements (n=30)
25%
30%
25%
20%
15%
10%
5%
0%
g
.l
ea
rn
in
Q
ua
lit
y
sa
nt
lie
rg
O
is
ec
D
14%
C
io
n-
sa
m
vi
ak
t.
15%
e
m
Ti
24%
23%
ng
% responses
Performance Improvement
Potential
Table 1. Correlation analyses: Major independent variables (n=30)
Independent Variables
Infrastructure
Infostructure
Infoculture
Individual Concerns
Avg. Usage per day per person*
.527**
-.202
.299
-.088
* Average usage per day was measured in terms of the number of hits to the system per person
** Correlation is significant at the 0.01 level (1-tailed).
Table 2. Correlation analysis: Subelements of infrastructure (n=30)
Independent Variables
Relative Advantage
Compatibility and Training
Avg. Usage per day per person
.515**
.279
** Correlation is significant at the 0.01 level (1-tailed).
Copyright © 2005, Idea Group Inc. Copying or distributing in print or electronic forms without written
permission of Idea Group Inc. is prohibited.
TEAM LinG
Success Factors in the Implementation of a Collaborative Technology
141
“Well, I guess to be real honest, [President/CEO] did. He said, ‘You are
going to use it!’ End of discussion.”
“Oh yeah – [President/CEO]! He goes in there and looks—who’s been
reading it, who’s been revising it, yeah. It was the greatest motivation to begin
with.”
Figure 3 shows the major perceptions of performance improvements from
knowledge sharing, enabled by a collaborative technology.
The following sections demonstrate the qualitative link between knowledge
sharing, enabled by a collaborative technology and performance improvements.
RELATIVE ADVANTAGE
Time and Efficiency
Time is one of the most valuable and most scarce resources in a scientific
contract research organization due to the time-to-market pressures for its
clients. Thus, time-to-market and the lifespan of patents in the highly competitive
pharmaceutical and agrochemical industries presented the driving force in
achieving rapid turnaround time. In addition, many companies enjoy significant
profits from achieving a “first-mover” advantage, if they can be the first to get
their products to the marketplace.
As stated by one of the associates, “It cuts down on the number of meetings
that we need to have because we can take care of a lot of business just over the
network.” Another associate documented time savings in this statement: “You
have everybody who’s doing invoicing sitting in a room for 2 hours projecting
what you’re going to make for next month and that was a waste of time. I can
be in and out of BSCW in 10 minutes.”
By sharing information via BSCW, valuable knowledge could be entered
quickly and people could make decisions, initiate studies, and make corrections
much more quickly. In addition, simply by eliminating manual processes such as
copying and distributing information manually saved time in the research
process. One associate stated, “Unless you want to print up separate documents
and hand it to each person, and then integrate all those documents at once, this
is a better alternative because you have a single document. People at their leisure
can make changes and there’s no integration of the document left and there’s
nothing to transcribe error-wise.”
In this company, the leadership team traveled extensively, primarily to
attend conferences or visit clients. In addition, some executives were located at
the European site. Thus, the ability to share information in a distributed
environment on a timely basis was greatly facilitated by this collaborative
technology. Executives could simply input their current information about
strategic plans, budgets, forecasts, industry developments, or competitive acCopyright © 2005, Idea Group Inc. Copying or distributing in print or electronic forms without written
permission of Idea Group Inc. is prohibited.
TEAM LinG
142
Jones and Kochtanek
tions any time and from any place in the world. This allowed the president to save
time in face-to-face meetings and make better decisions based on the most
current information available from within the organization.
Decision Support
This collaborative technology enabled managers throughout the company to
input needed information such as sales forecasts, budgets, and client and
competitor information on a real time basis, which was accessible to the
leadership team. This allowed executives and managers to make decisions based
on the most recent and most relevant information and knowledge. This was
exemplified by the following response: “It allows managers and top executives
to make better decisions by having access to more timely information.”
Quality Assurance and Compliance
In terms of better client service, the president concluded, “This offered us
a better solution at prioritizing. We can identify if there’s going to be a conflict
with resources ahead of time, resolve it, communicate to the clients, adjust their
expectation, and meet them.” In addition, the ability to identify trends to improve
quality in processes as well as client satisfaction was demonstrated by this
associate’s statement: “The biggest advantage to this is being able to use that as
a tool to teach ourselves what we need to do.” By sharing client comments and
concerns, the quality assurance and compliance people could identify recurring
problems or trends and take corrective actions to improve quality or client
satisfaction.
Leadership Influence
In the interviews, the importance of leadership appeared to support the
literature. From the emphatic responses in the interviews, it became clear that
probably the most important influence on the initial adoption and use of the
technology was the President/CEO of the company. A typical response to “who
influenced your use of the system” was “Oh- absolutely—our CEO! He initiated
that BSCW is what we would use.” In this particular organization, the forced
adoption of a new technology appeared to have a great influence on adoption and
continued, effective use of the BSCW technology to facilitate knowledge
sharing. The results from the quantitative study appeared to support this view.
Approximately 70% of the respondents indicated that leadership or managers
exerted an influence on their use of BSCW to facilitate knowledge sharing.
Interestingly, 72% of the respondents also indicated that a perceived need
(relative advantage) in sharing knowledge also influenced their use of this
technology to facilitate knowledge sharing. Thus, this finding appears to support
further the importance of the relative advantage variable.
Copyright © 2005, Idea Group Inc. Copying or distributing in print or electronic forms without written
permission of Idea Group Inc. is prohibited.
TEAM LinG
Success Factors in the Implementation of a Collaborative Technology
143
Potential Performance Improvements
In addition to the performance improvements in time, efficiency, decision
support, and client satisfaction, several other potential improvements surfaced.
This research was conducted while this technology was relatively new to the
company, and it was revealing to see how people were beginning to find new uses
for it that could result in additional performance improvements. For example, one
associate referenced its potential use in benchmarking best practices: “A lot of
times somebody will have a problem with the analysis or they’re trying to develop
a method and something’s not working. If there’s a way to encourage people,
especially the sharper minds in the company, to look at these and offer solutions,
then I think that that could be extremely beneficial to the company.”
Similarly, performance improvement potential was recognized in the ability
to share other information, as found in this statement by a manager: “A good use
for it would be to input agency guidelines. It took about 45 minutes to search for
an EPA guideline, but it would be great to have the EPA guidelines available
when they needed them and not have to search for them—that would save a lot
of time.”
Finally, some managers recognized the potential for better and more
efficient communication with clients by providing a Web-accessible place to
share information on study status, reports, or other valuable information. As one
manager stated, “The real benefit of using BSCW is that it allows the client to
have access to it 24 hours a day. We work with clients that are spread out all over
the United States and even in Europe. If they log on, and get on the Web, they
can access that document, download it themselves, make changes in the
document.” Table 3 summarizes these performance improvements.
DISCUSSION AND CONCLUSIONS
Corporate practitioners and academic researchers recognize the increasing
rate of change in virtually all industries, often driven by dynamic technological
changes. Technologies that provide ways to reduce time and costs or improve
quality, efficiency, or customer satisfaction are readily embraced.
What have we learned that may be generalized from this one small case
study that may prove beneficial to the managers and researchers considering
technology in support of distributed knowledge management?
First, we learned that there was a clear need, a pressing business reason,
for investing in this collaborative technology as well as for initiating the
knowledge sharing process—relative advantage. The president had recognized
the need for a mechanism to share information across the organization. This need
arose from identified redundancies in processes and the need for more up-todate sales and operational information accessible in a distributable format.
Copyright © 2005, Idea Group Inc. Copying or distributing in print or electronic forms without written
permission of Idea Group Inc. is prohibited.
TEAM LinG
144
Jones and Kochtanek
Table 3. Summary of performance improvements attributed to BSCW and
knowledge sharing at a contract research organization
Stakeholder
Leadership Team
Performance Improvements
•
•
•
Marketing
•
•
•
Quality
Assurance/Compliance
•
•
•
Other Performance
Improvements
•
•
•
•
•
•
Time savings due to fewer meetings, less tracking of reports and data
Better decision making due to availability of the most recent information
available
Improved quality and performance due to monitoring of projects on realtime basis
Improved efficiency on client monitoring and prospect identification
Improved responsiveness to managements needs for current sales
forecasts
Availability of marketing information on and off site to improve
marketing efforts and responsiveness to clients
More responsive to client needs by trending patterns in shared
information
Improved efficiency with fewer meetings and ability to prioritize
projects
Improved quality and problem solving by centralizing master schedules
and detecting common problems
Sharing of best practices within functional areas and among divisions
Sharing information throughout company such as new government
regulations
Improved responsiveness to client needs by sharing information on
study status and reports on a real-time basis with 24/7 availability
Improving organizational learning by sharing knowledge throughout the
company
Increased innovativeness by sharing ideas
Improved responsiveness to stakeholders including employees and
shareholders by sharing reports and other information on a timely basis
The perceived relative advantage of the system was the driving force
behind the subsequent diffusion and effective use of this collaborative technology at this company. This is consistent with the work of several researchers
including Beckman (1999) and Pan and Scarbrough (1999), who asserted that the
perceived relative advantage of knowledge sharing (e.g., time-savings, increased customer satisfaction, improved decision making, etc.) would provide a
motivating influence on employee behavior to share knowledge.
In this study, relative advantage emerged as the primary determinant
influencing use of the CSCW technology to facilitate knowledge sharing as
discussed above, but relative advantage also emerged as being context specific.
For example, the leadership in this case study perceived relative advantage in the
ability to acquire the most recent information and knowledge to make the best
decisions and monitor the financial status and health of the company, and to use
it as a control mechanism to monitor employee productivity. Leadership also
clearly perceived relative advantage in using this type of technology to facilitate
organizational learning for continuous improvement. They recognized potential
improvements in client satisfaction by increasing turnaround time and solving
client concerns.
Copyright © 2005, Idea Group Inc. Copying or distributing in print or electronic forms without written
permission of Idea Group Inc. is prohibited.
TEAM LinG
Success Factors in the Implementation of a Collaborative Technology
145
Second, we learned leadership influence was a powerful factor in the initial
adoption and subsequent effective use of a collaborative technology and
knowledge sharing. In this situation, the initial forced adoption of the collaborative technology to facilitate knowledge sharing by the president was a very
effective means of jump-starting the system. The issue of accountability proved
to be a very powerful motivator in employee behavior in adopting and implementing the systems. When employees, from clerks to top management, understood
that their behaviors and actions were being monitored and that they were being
held accountable for using the collaborative technology to input valuable and
needed information and knowledge, they responded quickly and positively.
Based on the emerging themes from the results of this study, a new model
that we call the “Motivation-Maintenance Technology Implementation Model”
is proposed (Figure 4). The foundation for this model lies in respondent
perceptions. Most respondents indicated that only certain factors (independent
variables) truly motivated them to effectively and continually use this CSCW
technology to share information and knowledge. The major factors included the
relative advantage of the system and the influence of leadership. Secondarily, the
reward/compensation structures associated with using the technology and
sharing knowledge were also mentioned as somewhat important. In contrast, the
other factors from the original study model were expected or assumed to be
available for them.
These results were analogous to a classic management theory called
“Herzberg’s two-factor model” (Hellriegel & Slocum, 1996). In this theory,
Herzberg suggests that there are two separate and distinct factors that influence
satisfaction or dissatisfaction. The factors associated with positive factors are
called motivational influences. In contrast, factors that were associated with
dissatisfaction were called hygiene factors. Herzberg contends that these
hygiene factors are necessary to maintain satisfaction but are expected by
associates. In and of themselves, they do not contribute to increased satisfaction.
On the other hand, the factors called motivation factors do motivate employees.
The major finding was that perceived relative advantage appeared to be the
major influence on CSCW usage to facilitate knowledge sharing as well as the
perceived performance improvements resulting from knowledge sharing. However, the results from the interviews also support findings that a strong leadership
that supports knowledge sharing, enabled by a collaborative technology, was also
a very important influence on these users. Since leadership support also included
some form of reward/incentive structures to motivate individuals to share their
knowledge and use this system to do so, this was also considered a motivating
factor. Therefore, using Herzberg’s theory as a framework, these factors would
be considered the motivational factors.
In contrast, the factors considered to be maintenance (hygiene) factors
include compatibility and time/training (subcomponents of infrastructure);
Copyright © 2005, Idea Group Inc. Copying or distributing in print or electronic forms without written
permission of Idea Group Inc. is prohibited.
TEAM LinG
146
Jones and Kochtanek
Figure 4. Maintenance-motivation technology implementation model
Relative
Advantage
Motivational Factors
Leadership
Reward /
Incentive
Systems
Continued &
Effective Use of
CSCW
Technology to
Facilitate
Knowledge Sharing
Maintenance Factors
Infostructure
(Recency/
relevancy)
Compatibility
Technology
Experience
Training &
Time
Trust /
Communication
Peer influence
(Opinion
Leaders)
Continued & effective use of
CSCW technology to
facilitate knowledge
Security
Concerns
Attitudes
(Adopter
Categories)
Performance
improvements
infostructure (including rules for managing the system for recency and relevancy); trust/communication and peer influence (subcomponents of infoculture);
and all of the subcomponents of individual concerns (prior technology experience, security concerns, and adopter category/attitudes toward technology and
change). The results from this study demonstrated that while each of these
factors was considered important by the respondents, they did not appear to
motivate users to continually and effectively use the CSCW technology for the
purpose of sharing their information or knowledge. Rather, they were expected
to be at a certain level. If not, they were considered to be dissatisfiers, or a
hindrance, but did not truly influence use or the sharing of knowledge. For
example, the computer hardware and software systems were expected to be
compatible. If they were not, users assumed that the IT (information technology)
department would correct the problem. They similarly assumed that they could
get the training and time they needed from the IT department or their managers.
In terms of infostructure, they normally assumed that the rules for management
Copyright © 2005, Idea Group Inc. Copying or distributing in print or electronic forms without written
permission of Idea Group Inc. is prohibited.
TEAM LinG
Success Factors in the Implementation of a Collaborative Technology
147
of the information (recency and relevancy) were controlled either by management or by project or department needs and requirements.
Trust and communication were deemed to be adequate to use this system
as well as the level of perceived security to share information within the
organization. However, in the future evolution of the system, when dealing with
stakeholders outside the firm (clients, suppliers), most respondents felt there
should be additional training and communication about the CSCW technology, its
level of security, and management of the information on the system. Again,
however, this was expected rather than motivational. In terms of prior technology experience and user attitudes, those respondents who had more positive
attitudes toward technology and change as well as those who had used different
technologies did appear to be more confident and comfortable using the
technology. However, these factors did not seem to motivate them to use the
system. On the other hand, the issue of incentives (a motivational factor) may
become relevant when dealing with those people who are resistant to using
technologies or sharing information for different reasons.
IMPLICATIONS FOR ORGANIZATIONS
In this study, relative advantage emerged as the primary determinant
influencing use of the CSCW technology to facilitate knowledge sharing, but it
also emerged as being context specific. For example, the leadership in this case
study perceived relative advantage as the ability to acquire the most recent
information and knowledge in order to make the best decisions, monitor the
financial status and health of the company, and use it as a control mechanism to
monitor employee productivity. In contrast to the leadership group, relative
advantage was perceived by the marketing/business development associates as
improving their efficiency by creating a repository of shared client information.
However, these associates as well as data entry and quality assurance associates perceived a unique attribute of relative advantage quite differently than the
leaders. Specifically, they perceived personal relative advantage in terms of
potential rewards or punishments for their effective use (or lack of) in providing
information and knowledge required by their bosses.
We would theorize that leaders have the power and authority to shape the
organization and to develop reward/compensation structures needed to support
the implementation of new technologies. This idea may be supported by the
classic management theory that people tend to do what they are rewarded for
or to avoid punishment. In this case study, using this CSCW technology and
sharing knowledge represented a forced adoption. This may be true in many
other organizations. However, once introduced, this research suggests that
developing rewards, incentives, or ties to performance appraisals may overcome
initial resistance. This may lead to more effective implementation of the new
Copyright © 2005, Idea Group Inc. Copying or distributing in print or electronic forms without written
permission of Idea Group Inc. is prohibited.
TEAM LinG
148
Jones and Kochtanek
technology and knowledge sharing. It may also facilitate the routinization of use.
Again, the specific rewards, incentive, or ties to performance appraisals would
depend on the priorities of the leaders, the specific needs of the associates, and
the organizational culture.
Inherent in the above factors is the associated issue of accountability.
Results from this study indicate that accountability played a large role in
influencing effective use of a CSCW system and knowledge sharing. Most
associates acknowledged that accountability was a driving motivation in their
effective use of the technology and sharing valuable information on a timely
basis, especially when perceived to be tied to their performance appraisals.
Thus, despite the complexity of different organizations in different industries and cultures, using specific definitions of relative advantage, along with
supportive leadership that introduces effective reward/compensation structures
and accountability in the process, may significantly improve the successful
implementation of a CSCW technology to facilitate knowledge sharing in any
organization.
SUGGESTIONS FOR FUTURE RESEARCH
In terms of the correlation between knowledge management enabled by a
CSCW technology and resulting organizational performance improvements, it
would be helpful to establish quantitative measures to validate and confirm our
results and recommendations. If researchers were granted access to study timein-processes within an organization for specific tasks before and after, or with
and without the use of a knowledge sharing collaborative technology, this would
also help establish a more quantifiable relationship. Similarly, if researchers
measured the level of innovation in terms of new products or new processes
before and after implementation, or with versus without a CSCW technology, this
also would help to strengthen and validate the relationship. Quality could similarly
be measured by factors such as errors in reports or data. Customer satisfaction
could be measured by documented customer complaints with versus without a
CSCW system or before and after implementation, or by conducting customer
satisfaction surveys. The different success factors studied may be context
specific. Therefore, similar research in different types of organizations, industries, and situations would be interesting.
While this case study focused on a small business, the potential for
performance improvement extends to many other businesses including large,
small, or non-profit organizations. Given the potential improvements in time/
efficiency, customer satisfaction, and innovation enabled by Internet and ecommerce technologies, there exists an array of potential research explorations
involving collaborative technologies and their ability to support corporate knowledge sharing. Some of the key questions that we might need to ask include:
Copyright © 2005, Idea Group Inc. Copying or distributing in print or electronic forms without written
permission of Idea Group Inc. is prohibited.
TEAM LinG
Success Factors in the Implementation of a Collaborative Technology
•
•
•
•
149
Is the context of relative advantage determined by role, industry, or other
factors?
Is knowledge sharing heavily influenced by corporate culture, industry
norms, or other factors?
Is the willingness to share knowledge via a collaborative technology
influenced by prior technology experience, leadership influences, or other
factors?
Are there other factors that significantly contribute to knowledge sharing
and the use of collaborative technologies (i.e., personal agendas, reward/
compensation systems) that should be considered in management decisions
to adopt knowledge sharing?
REFERENCES
Anonymous. (1999). Knowledge-sharing roundtable. Informationweek, 731,
6ER-12ER.
Barker, R.T., & Camarata, M.R. (1998). The role of communication in creating
and maintaining a learning organization: Preconditions, indicators, and
disciplines. Journal of Business Communication, 35(4), 443-467.
Beckman, J. (1999). The current state of knowledge management. In J. Liebowitz
(Ed.), Knowledge management handbook. Boca Raton: CRC Press.
Ciborra, C.U. (1996a). Mission critical: Challenges for groupware in a pharmaceutical company. In C.U. Ciborra (Ed.), Groupware & teamwork. New
York: John Wiley & Sons, Ltd.
Ciborra, C.U. (1996b). What does groupware mean for the organizations hosting
it? In C.U. Ciborra (Ed.), Groupware & teamwork. New York: John
Wiley & Sons, Ltd.
Ciborra, C.U., & Patriotta, G. (1996). Groupware & teamwork in new product
development: The case of a consumer goods multinational. In C.U. Ciborra
(Ed.), Groupware & teamwork. New York: John Wiley & Sons, Ltd.
Davenport, T.H. (1999). Knowledge management & the broader firm: Strategy,
advantage & performance. In J. Liebowitz (Ed.), Knowledge management handbook. Boca Raton: CRC Press.
Drucker, P.F. (1995). Rethinking work. Executive Excellence, 12(2), 5-9.
Failla, A. (1996). Technologies for coordinating in a software factory. In C.U.
Ciborra (Ed.), Groupware & teamwork. New York: John Wiley & Sons, Ltd.
Mancini, J. (1998). $500 million just doesn’t seem to go very far anymore.
Inform, 12(3), 6-8.
Orlikowski, W. (1996). Evolving with notes: Organizational change and groupware
technology. In C.U. Ciborra (Ed.), Groupware & teamwork. New York:
John Wiley & Sons, Ltd.
Copyright © 2005, Idea Group Inc. Copying or distributing in print or electronic forms without written
permission of Idea Group Inc. is prohibited.
TEAM LinG
150
Jones and Kochtanek
Pan, S.L., & Scarbrough, H. (1998). A socio-technical view of knowledgesharing at Buckman Laboratories. Journal of Knowledge Management,
2(1), 55-66.
Pan, S. L., & Scarbrough, H. (1999). Knowledge management in practice: An
exploratory case study. Technology Analysis & Strategic Management,
11(3), 359-374.
Riesenberger, J.R. (1998). Executive insights: Knowledge—The source of
sustainable competitive advantage. Journal of International Marketing,
6(3), 94-107.
Rogers, E.M. (1995). Diffusion of innovations (4th ed.). New York: The Free
Press.
Rumizen, M.C. (1998). Report of the second comparative study of knowledge
creation conference. Journal of Knowledge Management, 2(1), 77-81.
Scheraga, D. (1998). Knowledge management competitive advantages become
a key issue. Chemical Market Reporter, 254(17), 3-6.
Senge, P.M. (1997). Creating learning communities. Executive Excellence,
14(3), 17-18.
Solomon, C. (1998). Sharing information across borders & time zones. Workforce,
3(2-Supplemental), 12-18.
Townsend, A.M., DeMarie, S.M., & Hendrickson, A.R. (1998). Virtual teams:
Technology & the workplace of the future. Academy of Management
Executive, 12(3), 17-29.
Wigg, K.M. (1999). Introducing knowledge management into the enterprise. In
J. Liebowitz (Ed.), Knowledge management handbook. Boca Raton, FL:
CRC Press.
ENDNOTES
1
2
3
These criteria included a great organizational emphasis on teamwork, a
need for experts who can filter and select contributions to the repository
based upon their usefulness, and forums where contributions represent a
source of personal satisfaction. The organizational culture should also
embrace and reward the use of groupware and teamwork.
Effectiveness in this study was measured by the actual usage of the
technology and the meaningful contributions to the system.
The quota system used in this study represented an attempt to interview a
proportionate number of users from each of the major functional groups
using this collaborative technology. This included middle management, data
entry, and quality assurance/compliance.
Copyright © 2005, Idea Group Inc. Copying or distributing in print or electronic forms without written
permission of Idea Group Inc. is prohibited.
TEAM LinG
Supporting the JAD Facilitator with the Nominal Group Technique 151
Chapter VIII
Supporting the
JAD Facilitator with the
Nominal Group Technique
Evan W. Duggan, University of Alabama, USA
Cherian S. Thachenkary, Georgia State University, USA
ABSTRACT
Joint Application Development (JAD) was introduced in the late 1970s to
solve many of the problems system users experienced with the conventional
methods used in systems requirements determination (SRD) and has produced
noteworthy improvements over these methods. However, a JAD session is
conducted with freely interacting groups, which makes it susceptible to the
problems that have curtailed the effectiveness of groups. JAD outcomes are
also critically dependent on excellent facilitation for minimizing dysfunctional
group behaviors. Many JAD efforts are not contemplated (and some fail)
because such a person is often unavailable. The nominal group technique
(NGT) was designed to reduce the impact of negative group dynamics. An
integration of JAD and NGT is proposed here as a crutch to reduce the
burden of the JAD facilitator in controlling group sessions during SRD.
This approach, which was tested empirically in a laboratory experiment,
appeared to outperform JAD alone in the areas tested and seemed to
contribute to excellent group outcomes even without excellent facilitation.
Copyright © 2005, Idea Group Inc. Copying or distributing in print or electronic forms without written
permission of Idea Group Inc. is prohibited.
TEAM LinG
152 Duggan and Thachenkary
INTRODUCTION
There is widespread support for the belief that systems requirements
determination (SRD)—discovering and documenting the features that an information system should deliver—is an extremely important but very difficult aspect
of software development (Borovits et al., 1990; Byrd et al., 1992; Cheng, 1996;
Holtzblatt & Beyer, 1995; Raghaven, et al, 1994). This difficulty often leads to
systems failures due to both development shortcomings (failure to establish the
required features in the required time) and usage factors (abandonment by its
intended beneficiaries) (Lyytinen, 1988). Several factors account for this
difficulty, but the nature of the interaction among system developers, users, and
stakeholders is the prime contributor (Antunes, 1999; Holtzblatt & Beyer, 1995).
User-developer communication and stakeholder negotiations assume greatest importance at the requirements determination phase of the systems development life cycle (SDLC). Here, the specific details of the problem to be solved
and the needs to be satisfied are clarified. It is here, however, that poor
communication is most pervasive (Dieckmann, 1996; Holtzblatt & Beyer, 1995).
JAD is a team-oriented approach that has been widely used to (1) confront the
communication barriers to effective information elicitation and (2) increase
users’ contribution to this key systems development activity (Byrd et al., 1992).
JAD assembles a diverse group of users, analysts, and managers from various
sectors of an organization to jointly specify requirements in a face-to-face
workshop.
Despite its success in comparison to conventional SRD methods, JAD has
failed somewhat to deliver on its initial promise to forge the team rapport
necessary to alleviate known communication impediments to effective SRD, and
has introduced other group-related problems (Dean et al., 1997; Kettelhut,
1993). A major reason for this failure is that JAD workshops are conducted
under the freely interacting meeting structure where spontaneous communication occurs among group members with minimal control imposed by the communication structure (Van de Ven & Delbecq, 1974). Groups that deliberate in this
manner typically experience many of the problems in which social and emotional
dynamics obstruct the accomplishment of the objectives of the meeting (Kettelhut,
1993). The success of a JAD session often is dependent on the extent to which
these problems are alleviated. This places a very high premium on excellent
facilitation (Carmel et al., 1995; Davidson, 1999; Wood & Silver, 1995).
Facilitators have been offered several prescriptions for minimizing these
problems (Andrews, 1991; Carmel et al., 1995; Davidson, 1999; Kettelhut, 1993;
Wood & Silver, 1995). Many of these are contained within the NGT, a facilitated
technique that focuses on alleviating negative group dynamics in meetings where
participants interact in a highly structured manner. This technique could be
applied in the decision-making stages of a JAD workshop to provide a comprehensive set of procedures for increasing the group’s effectiveness. NGT
Copyright © 2005, Idea Group Inc. Copying or distributing in print or electronic forms without written
permission of Idea Group Inc. is prohibited.
TEAM LinG
Supporting the JAD Facilitator with the Nominal Group Technique 153
reputedly increases the effectiveness of creative problem-solving groups (Delbecq
et al., 1986). Its easy-to-apply protocol supports facilitators in producing results
that fairly accurately reflect the combined judgment of groups engaged in
problem-solving meetings (Zuech, 1992).
Our thesis is that the application of NGT in the JAD workshop will help to
reduce the criticality of excellent facilitation for high-quality JAD results, and
that this integrated communication structure will induce more acceptable results
from less than excellent facilitation. This presumption is very important because
excellent JAD facilitation is a scarce commodity (Carmel et al., 1995), despite
several years of fairly extensive JAD practice (Davidson, 1999) and increasingly
common usage (Dennis et al., 1999; Kettelhut, 1997). In this study, we examine
the effects of the integration of NGT and JAD structures on the communication
problems that typically beset user-developer interactions in SRD, when JAD
alone is used. The major objective is to determine whether NGT, in combination
with JAD, reduces the facilitator’s burden in curbing dysfunctional group
behaviors and thereby contributes to improved performance.
REVIEW OF RELEVANT LITERATURE
The prevailing viewpoint is that SRD, which is a complex process incorporating a variety of features and often conflicting stakeholder interests (Vessey
& Conger, 1994), is a critical determinant of system development success or
failure (Byrd et al., 1992; Cheng, 1996; Raghaven et al., 1994). Unfortunately,
the dominant experience is that inadequate interaction and poor communication
among system developers and users characterize this process (Holtzblatt &
Beyer, 1995). A variety of SRD approaches have been used to elicit information
from knowledgeable managers and users. These include but are not limited to
interviewing, survey by questionnaire, JAD, focus group meetings, brainstorming, prototyping, goal- and scenario-based techniques, critical success factor and
task and protocol analyses, and ethnographic techniques.
Interviewing has been the most prevalent and best-known technique
(Raghaven et al., 1994; Watson & Frolick, 1993), but this approach has proven
inadequate for resolving competing requirements and securing stakeholder
agreement (Dennis et al., 1999; Dieckmann, 1996). It is also difficult to
determine whether all problems are unearthed and all requirements captured,
and also to gauge the adequacy of the participation of those interviewed. These
deficiencies seriously challenge the accuracy, completeness, consistency, and
clarity of the resulting requirements (Dean et al., 1997). Therefore, JAD was
designed to correct these problems (Dennis et al., 1999; Purvis & Sambamurthy,
1997).
While JAD is not as widely practiced as interviewing (Purvis &
Sambamurthy, 1997), it has gained in popularity (Jackson & Engles, 1996) and
Copyright © 2005, Idea Group Inc. Copying or distributing in print or electronic forms without written
permission of Idea Group Inc. is prohibited.
TEAM LinG
154 Duggan and Thachenkary
is increasing in common usage (Dennis et al., 1999; Kettelhut, 1997). Researchers (Dean et al., 1997-98) and practitioners (Jones, 1996; Spina & Rolonda,
2002) consider JAD best practice for structuring group interaction in participatory environments and for operationalizing user involvement (Uden, 1995). It has
been used increasingly with rapid application development (RAD) projects (Rist,
2001) and dynamic systems development method (DSDM), a RAD-based
technique used extensively in the UK (Barrow & Mayhew, 2000; BeynonDavies et al., 2000).
JAD is known by several other names, including facilitated technique,
facilitated workshop, joint application review, accelerated design, and usercentered design (Carmel, et al., 1995; Dean et al., 1997-98). Several derivatives
exist (Asario 2000), and some organizations have made their own modifications
to the formal JAD structure (Davidson, 1999). In addition to its application in
systems development, JAD (under any of these names) also has been used in
several other organizational decision-making contexts (Davidson, 1999; Kettelhut,
1997).
JAD places significant emphasis on the communication aspects of requirements elicitation (Liou & Chen, 1993-94; Purvis & Sambamurthy, 1997). System
developers, users, and managers assemble in a synchronous, three-to-five-day
workshop to specify information requirements and make system decisions under
the guidance of a trained facilitator (Andrews, 1991; Wood & Silver, 1995). One
of JAD’s important intentions is to develop the necessary team rapport in order
to bridge the communication gap and exploit potential synergistic opportunities
to produce higher quality system requirements (Dean et al., 1997; Purvis &
Sambamurthy, 1997). The steps in the JAD process, as described by Wood &
Silver (1995), are highlighted in Table 1.
Agile development methods are being used increasingly in systems development paradigms such as extreme programming (XP), features-driven development, adaptive software development, and DSDM (Highsmith & Cockburn,
Table 1. The five phases of JAD
JAD Phases
Key Activities
1. Project Definition
Agree scope and objectives; secure management commitment and
willingness to release experts (Liou & Chen, 1993-94)
2. Background Research
Acquire knowledge about existing business processes and problem
domain
3. Preparation for Workshop
Finalize meeting logistics and facilities
4. The Workshop (or Session)
Offsite meeting to minimize potential interruption; facilitator
demonstrates excellent interpersonal relationship skills and
understanding of group dynamics (Liou & Chen, 1993-94); the
facilitator should be neutral and objective (Anson et al., 1995;
Schuman, 1996) and should strive for broad user participation and
focus on agenda (Carmel et al., 1995)
5. Preparation of the Final Document
Review document is in the presence of participants and sponsor(s);
confirm, and get approval
Copyright © 2005, Idea Group Inc. Copying or distributing in print or electronic forms without written
permission of Idea Group Inc. is prohibited.
TEAM LinG
Supporting the JAD Facilitator with the Nominal Group Technique 155
2001). These methods typically collapse several life cycle stages for speed of
delivery and produce deployment-ready modules iteratively and/or incrementally. Traditional methods, however, still account for a large percentage of
development efforts1, especially for large systems with several stakeholders,
and in environments with fairly stable business processes. JAD also may be used
with newer methods, even when requirements are not completely pre-specified.
For example, it is often used with RAD to help generate use cases in objectoriented development. JAD conceivably could be used in short bursts at the
commitment stage of XP’s planning game to prioritize story cards and identify
implementation risks.
The performance of JAD facilitators during the critical interactions of the
JAD workshop is pivotal to the success of the meeting (Carmel et al., 1995;
Davidson, 1999; van Murik, 1994). Without a great deal of assistance from the
JAD communication structure, they bear the responsibility of guiding the session
toward the attainment of the desired objectives (Dean et al., 1997) and securing
decision outcomes that reflect the combined judgement of the group (Wood &
Silver, 1995). Anson et al. (1995) and Dowling and St. Louis (2000) found that
the quality of facilitation significantly influenced relationships and moderated
process outcomes. Some of the potential group problems that challenge JAD
facilitators are listed in Table 2.
Table 2. Potential JAD problems
Problem
Description
Search Behavior
Inadequate diagnosis and premature specification of solutions (Delbecq et al.,
1986)
Destructive Dominance
Less desirable contributions of powerful participants overwhelm useful ideas from
others (Wood & Silver, 1995)
Anchoring
Excessive focus on tangential issues raised by influential participants causes
digression from the main objective (Ven de Ven & Delbecq, 1974)
Groupthink
Over commitment to group harmony such that group cohesion becomes the de
facto decision criterion (Kettelhut, 1993)
Risky-shift Behavior
Empirically observed phenomenon where the group shifts from the risk profiles of
its individual members (Kettelhut, 1993)
Elective Participation and
Free Loading
Group members contribute of their own volition, and some may not contribute at
all (Carmel et al., 1995)
Commitment Errors
The group arbitrarily enlists the resources of its organization to unattainable
objectives (Kettelhut, 1993)
Goal-setting Errors
Scheduling that reflects unrealistic group aspirations (Kettelhut, 1993)
The Abilene Paradox
Conflict avoidance that permits group decisions that are contrary to the desires of
the individual members (Kettelhut, 1993)
Conforming Behavior
Participants acquiesce to the emergent group norm (Delbecq et al.., 1986)
Copyright © 2005, Idea Group Inc. Copying or distributing in print or electronic forms without written
permission of Idea Group Inc. is prohibited.
TEAM LinG
156 Duggan and Thachenkary
Meeting structures may influence the conditions responsible for process
loss or gain, but outcomes are determined more often by the extent to which the
intended structure is appropriately invoked (Bostrom et al., 1993; Gopal et al.,
1992-1993; Poole & DeSanctis, 1990). Groups that faithfully apply the intended
communication structure outperform those that do not (Anson et al., 1995). The
crux of our argument is that it is the facilitator’s responsibility to inspire faithful
appropriation of the adopted meeting structure (Bostrom et al., 1993; Schuman,
1996, van Murik, 1994).
While some meeting techniques provide a challenge for facilitators, NGT is
considered to be conducive to faithful appropriation (Ho et al., 1999), and groups
react very positively to the technique (Wood & Silver, 1995). Many of the
recommendations for offsetting the dysfunctional effects of the freely interacting group technique used in JAD workshops (i.e., brainstorming, anonymity;
prescriptions for reducing destructive dominance and increasing participation,
strategies for precipitating consensus) (Wood & Silver, 1995) and proposals for
overcoming groupthink (Kettelhut, 1993) seem to be standard features of NGT.
NGT is used in problem-solving situations to elicit individual knowledge,
views, and opinions (Zuech, 1992). It is particularly useful in situations where
group members must pool their judgements to determine a particular course of
action from a large number of alternatives (Hornsby et al., 1994; Zuech, 1992).
NGT combines the effects of two factors—conveyance (uninhibited idea
generation during which free interactions are restricted) and convergence
(precipitation toward consensus). These are accommodated in the five steps
(Table 3) that help to downplay the social and emotional dynamics that affect the
performance of freely interacting groups (Delbecq et al., 1986; Ho et al., 1999).
NGT’s superiority over the interacting group technique has been demonstrated in creative, problem-solving situations (Delbecq et al., 1975; Ven de Ven
& Delbecq, 1974) and with heterogeneous groups working with complex
problems (Stephenson et al., 1982). Several other noteworthy attributes that
have been verified empirically include participants’ satisfaction with the process
(Korhonen, 1990), usefulness in identifying different problem dimensions and
error reduction (Frankel, 1987), and its adaptability to a variety of problem
domains (Chapman, 1998). NGT has been successfully combined with techniques such as multidimensional scaling (Frankel, 1987), multi-attribute utility in
decision analysis (Thomas et al., 1989), quality function deployment (Ho et al.,
1999), and the analytical hierarchy process (Teltumbde, 2000). It also has been
used to identify potential problems in information systems deployment (Henrich
& Greene, 1991).
Researchers also have evaluated the effect of using group support systems
(GSS) to improve negative JAD outcomes (Carmel et al., 1995; Dennis et al.,
1999; Liou & Chen, 1993-94). The need to design structures to improve the
conveyance of information and convergence toward consensus for effective
group decision making are common objectives of NGT and GSS (Beruvides,
Copyright © 2005, Idea Group Inc. Copying or distributing in print or electronic forms without written
permission of Idea Group Inc. is prohibited.
TEAM LinG
Supporting the JAD Facilitator with the Nominal Group Technique 157
Table 3. NGT process
Step
Activity
Description
1.
Idea
Generation
Participants independently and silently generate ideas regarding goals and problem
solutions in writing. This separation of creative thinking from idea evaluation reduces
emotional attachment to an idea and contributes to greater objectivity (Delbecq et al.,
1986; Van de Ven & Delbecq, 1974).
2.
Idea
Recording
The facilitator records one idea at a time from group members in a round-robin format
until all participants have completed their list of ideas. This accommodates increased
participation (Stephenson et al., 1982; Ven de Ven & Delbecq, 1974).
3.
Discussion
and
Clarification
Each idea is discussed for clarification and subsequent evaluation, without either
critical evaluation or lobbying, which reduces conformance pressure on lower ranking
group members.
4.
Ranking
Participants independently rate and rank all the ideas.
5.
Decisionmaking
The final decision-making on the priority ordering of the alternatives (if necessary) is
based on voting and mathematical pooling of the individual rankings.
1995). NGT is primarily a manual technique, whose deliberations are usually not
automatically documented (Liou & Chen, 1993-94), while GSS uses networked
computers and specialized software to allow group members to interact anonymously but fully aware of the responses of others (Beruvides, 1995; Dennis et
al., 1999). Thus, a GSS is a more sophisticated and efficient application of the
basic NGT technique.
Carmel et al. (1995) used case studies to compare JAD in its traditional
application with JAD using GSS (EJAD) and found that EJAD sessions were
better with respect to both the degree of participation they induced and decision
time, but not as effective for conflict resolution. They recommended a more
active facilitator role for EJAD. In comparing group performances under NGTlike support and GSS support, Watson et al. (1988) and Liou and Chen (19931994) found no significant difference in task effectiveness under the two
structures. Since then, Dennis et al. (1999) have concluded that GSS-enabled
JAD has helped to reduce model-building time by approximately 75%. NGT, in
combination with JAD, however, offers an alternative medium for conducting
group research, particularly where the deployment of GSS is not yet pervasive.
RESEARCH MODEL AND HYPOTHESES
The research model (Figure 1) was adapted from several GSS process
models (Nunamaker et al., 1993; Ocker et al., 1995-96; Pinsonneault &
Kraemer, 1989) to abstract the relevant relationships among the variables of
interest in our proposed process. It depicts the transformation that occurs in a
facilitated group session as a result of the interaction of the contextual charac-
Copyright © 2005, Idea Group Inc. Copying or distributing in print or electronic forms without written
permission of Idea Group Inc. is prohibited.
TEAM LinG
158 Duggan and Thachenkary
teristics of the group, task, facilitation, and meeting structure to contrive some
instrumental outcome.
The nature of the interactions is determined by this dynamic interplay, which
affects process effectiveness (the degree of process gain or loss experienced).
The meeting structure (the protocol that governs the pattern of interaction) and
the complexity of the task (the activities required to accomplish the group’s
objectives) also influence group dynamics. The quality of facilitation impacts and
is impacted by group factors, and a similar, reciprocal relationship exists between
the meeting structure and the effect of facilitation. The degree of adherence that
the structure permits and the skill of the facilitator demarcate this effect. The
effectiveness of the process influences both participants’ satisfaction with the
meeting and its results, and the quality of the decisions.
We believe that facilitators using integrated JAD and NGT in SRD will
achieve superior results to those using JAD alone. The nature of the stakeholder
issues that typify SRD precludes effective results based on conventional JAD
facilitation or makes success attainable by only the very best facilitators.
Because of its amenity to faithful appropriation, the NGT structure will help to
reduce this crucial reliance on facilitator excellence for effective interactions
(greater participation, less destructive dominance, convergence toward consensus) and successful outcomes.
The theme that underpins our propositions is that the integrated communication structure provides assistance in reducing the performance gap between
expert and novice facilitators; the structure contributes more to the expected
difference in outcomes than heroic facilitator efforts. The parts of the hypotheses that refer to the effects of facilitation are necessarily exploratory. While it
is intuitively appealing to predict that expert facilitators will contribute to more
effective results than their less skilled counterparts, there is no theoretical basis
Figure 1. General research model
Group Factors
Dynamics
Size
Effort
Task
- Effectiveness
Nature
Complexity
Facilitation
- Participants’
Satisfaction
Outcome
- Quality
- Participants’
Satisfaction
Skill Level
Control of Structure
Mtg.Structure
JAD
JAD & NGT
Copyright © 2005, Idea Group Inc. Copying or distributing in print or electronic forms without written
permission of Idea Group Inc. is prohibited.
TEAM LinG
Supporting the JAD Facilitator with the Nominal Group Technique 159
to predict that either will inspire more faithful application of the integrated
structure.
The first four hypotheses are concerned with impacts on process effectiveness, an intermediate indicator of successful outcomes. Process effectiveness
is concerned with the manner in which the input variables (including the
communication structure and the facilitator) interplay to generate process
conditions that are satisfying for the participants and are conducive to right
outcomes. It is partitioned into several impacts—the extent of participation; the
degree of destructive dominance, where influential members commandeer the
deliberation to the exclusion of useful contributions from other members; and the
capacity to confront conflict and converge toward consensus, so that unresolved
issues are minimized. Under JAD, it is the facilitator who must devise innovative
means to draw introspective members “out of their shells” and “chill” dominators
(Wood & Silver, 1995). But participation is involuntary within NGT; the structure
compels the involvement of all participants, which helps to reduce the facilitator’s
burden.
Hypothesis 1: The integrated communication structure will contribute to a
significantly higher level of process effectiveness, but the expert facilitator
will not.
Hypothesis 2: The integrated communication structure will induce a significantly higher level of group participation, but the expert facilitator will not.
Hypothesis 3: The integrated communication structure will contribute to less
domination, but the expert facilitator will not.
Hypothesis 4: The integrated communication structure will help groups attain
a higher degree of consensus, but the expert facilitator will not.
Satisfaction with the process may be a post-requisite measure of effectiveness. There seems to be an inverse relationship between the existence of
dysfunctional group behaviors and group members’ satisfaction with the process. If, indeed, destructive dominance is controlled, participation has increased,
and consensus is achieved, more group members should be satisfied with the
process. But usually, the disparity in background, authority, and knowledge in
SRD makes it difficult for facilitators (without the benefit of a supportive meeting
structure) to stem the tide of group behaviors that are not conducive to overall
group satisfaction. We, therefore, propose:
Hypothesis 5: The integrated communication structure will contribute to a
significantly higher level of participant’s satisfaction with the process, but
the expert facilitator will not.
Satisfaction with the decisions and high-quality requirements, which are
desired outcomes of the intervention of the integrated structure, are postulated
Copyright © 2005, Idea Group Inc. Copying or distributing in print or electronic forms without written
permission of Idea Group Inc. is prohibited.
TEAM LinG
160 Duggan and Thachenkary
as important measures of the overall success of the process. We contend that
participants who use the integrated structure to generate requirements should
identify more with the results and will feel a greater sense of ownership of the
decision than JAD users. This increased affiliation derives from the greater
involvement in the decision making and satisfaction with the process that the
integrated structure supports. More effective participation in the deliberations
also is expected to result in process gain, which should help to improve the quality
of the output—the requirements.
Hypothesis 6: The integrated communication structure will contribute to a
significantly higher level of participant’s satisfaction with the outcome, but
the expert facilitator will not.
Hypothesis 7: The integrated communication structure will contribute to
significantly higher quality requirements, but the expert facilitator will not.
Because of NGT’s greater amenity to faithful appropriation, the integrated
protocol is expected to reduce the facilitator’s burden in minimizing group
behaviors inimical to good outcomes and help to reduce the reliance on excellent
facilitation for high-quality results. The reduction in dysfunctional group behavior
(i.e., destructive dominance is used as a surrogate measure) exhibited in sessions
conducted under the integrated structure and under JAD should, therefore, be
greater for the unskilled facilitator than for the skilled facilitator.
Hypothesis 8: The difference in destructive dominance in JAD and the
integrated structure sessions will be greater when the facilitator is low
skilled than when he or she is highly skilled.
RESEARCH METHOD
A completely randomized design was used to conduct the laboratory
experiment. In this design, two levels of group communication structure (i.e.,
standard JAD and the integrated protocol) were crossed with two levels of
facilitation (i.e., expert and novice). The facilitated group session was the unit
of analysis.
Procedures
Twelve professional facilitators from four facilitator associations, 18 scribes,
and 144 role players (75 females and 69 males) participated in this experiment.
Each participating facilitator led two sessions—one JAD and one the integrated
structure. The 24 experimental groups consisted of a mix of role players from a
wide cross-section of IS users, systems developers, business professionals (40%
Copyright © 2005, Idea Group Inc. Copying or distributing in print or electronic forms without written
permission of Idea Group Inc. is prohibited.
TEAM LinG
Supporting the JAD Facilitator with the Nominal Group Technique 161
of the participants), senior undergraduate (35%) and graduate students (25%).
This diverse combination of participants enriched the study by providing the
within-group heterogeneity to maximize the influence of the manipulated variables.
The professional organizations categorized the facilitators (who were all
volunteers) into the two skill levels by years of facilitation experience and the
number of sessions conducted. The 12 facilitators (six from each category) were
randomly pre-selected to conduct the experiments. A facilitator’s packet
containing the experimental task with instructions on how to conduct the sessions
and a script for the NGT protocol was provided before the day of the session.
Before each experiment, the facilitators participated in a further one-hour
debriefing session.
Student volunteers participated for extra credit in their systems analysis and
design classes. The four organizations (7 were asked originally) who participated, expressed great interest in the outcome of the experiment and were
promised a copy of the findings. These facilitator associations also canvassed
several business participants from among their membership, while other professionals participated during training exercises with these firms. Practicing or
trainee facilitators were not allowed to participate as role players.
The role players were assigned randomly to groups of six. Each group was
randomly assigned to one of the four experimental conditions: JAD conducted by
an expert facilitator, JAD conducted by a novice facilitator, the integrated
communication structure (that combined JAD and NGT) conducted by an expert
facilitator, and the integrated communication structure conducted by a novice
facilitator. In sessions that lasted approximately two hours, each group was
asked to generate high-level requirements for an integrated order processing,
inventory management, accounts payable and receivable, and distribution management system to solve information systems problems of a fictitious chain of
owned and franchised deli-style sandwich shops. The case was developed by
Marble (1992).
The documented requirements then were typed and verified by two independent volunteers and sent to the three expert judges, who rated them along
eight quality dimensions. Participants also completed a pre-session (i.e., objective background information) as well as a post-session survey to record their
perception of the sessions and facilitator-produced reports containing both
perceptual and objective observations.
Variables and Measures
The instruments used in this study—demographic information on participants collected before the experimental sessions, a post-session survey (PSS),
the facilitator’s report (FR), and the expert judge’s quality rating sheet (QRS)—
were adapted from previous research (Anson et al., 1995; Bailey & Pearson,
Copyright © 2005, Idea Group Inc. Copying or distributing in print or electronic forms without written
permission of Idea Group Inc. is prohibited.
TEAM LinG
162 Duggan and Thachenkary
Table 4. Variables and measures
Variable
Process Effectiveness
- Overall
Measure
Type of Measure
Seven-item scale (from PSS)
Perceptive
-
Participation
1.
2.
Facilitator count (from FR)
Two-item scale (PSS)
Objective
Perceptive
-
Destructive
Dominance
1.
2.
Facilitator observation (FR)
Two-item scale (PSS)
Objective
Perceptive
-
Consensus
1.
2.
Count of unresolved items at session end (FR)
Two-item scale (PSS)
Objective
Subjective
Participants’ Satisfaction
- With the Process
Four-item scale (PSS)
Subjective
-
Five-item scale (PSS)
Subjective
Aggregation of judges’ scores (maximum of five points
each) for accuracy, precision, completeness, conciseness,
relevance, creativity, consistency, and feasibility (from QRS)
Expert Rating
With the Outcome
Requirements Quality
Rating
1983; Green & Taber, 1980; Gouran, 1978) and revalidated. They measured the
dependent variables (Table 4) used in tests of hypotheses.
The following data were also obtained:
1.
2.
3.
Level of experience with SRD (single item from the pre-session instrument)
Level of business experience (from the pre-session instrument)
The level of effort expended by the group (assessed by the facilitator)
DATA ANALYSIS AND RESULTS
The main statistical procedures used to test the statistical hypotheses were
factorial multiple analysis of variance (MANOVA) for multiple dependent
variables and analysis of variance (ANOVA) for tests involving a single
dependent variable. The analysis of data was conducted in three main areas:
1.
An examination of the demographic profiles of the participants was
undertaken to establish whether potentially confounding input variables
(not manipulated experimentally) should be controlled statistically as
covariates. This analysis indicated (by the failure to reject the equality
hypotheses) that there was homogeneity across groups with respect to the
level of effort they expended for each communication structure used (pvalue < .093) and for facilitation (p-value < .254). Similar results were
obtained for equivalent experience in a professional business environment
and with SRD (p-value < .758 and < .290 for communication structure and
facilitation, respectively).
Copyright © 2005, Idea Group Inc. Copying or distributing in print or electronic forms without written
permission of Idea Group Inc. is prohibited.
TEAM LinG
Supporting the JAD Facilitator with the Nominal Group Technique 163
2.
3.
The revalidated instruments indicated satisfactory evidence of internal
consistency (Cronbach’s Alpha) with reliability ratings of .9082 (postsession), .7931 (pre-session), .8287 (facilitators’ report), and .9754 (judges’
rating sheet).
The evaluations of the hypotheses follow.
Summary of Statistical Analyses
Table 5, which summarizes results from the test of the hypotheses, indicates
those hypotheses that were supported. No significant interaction effect was
found for any of the tests, nor was there any indication that facilitation made a
difference where the integrated structure did not. In all cases, it was observed
that the integrated structure outperformed JAD, regardless of the caliber of the
facilitator. The results indicate that skillful facilitators will induce greater
participation, inspire a higher level of satisfaction with the process, and contribute to higher quality requirements than unskilled ones under any of the meeting
structures. However, there was no significant difference attributable to facilitator competence for process effectiveness, destructive dominance, conflict
resolution, and satisfaction with the outcome.
The results, where both the integrated structure and facilitation competence
were found to contribute to improved group performance, may indicate that the
integrated technique makes good facilitation better in these areas. Taken
together, the other cases that indicated significant effect due to structure and the
insignificant effect due to facilitator competence are also useful results. They
provide empirical support for the conclusion that the integrated structure may be
able to achieve objectives (reducing destructive dominance, precipitating consensus, and contributing to satisfaction with the requirements) that have eluded
even highly skilled facilitators under JAD.
Hypothesis 8 (which examined the relative performances of novice and
expert facilitators under the integrated structure and JAD, respectively) was
also supported in the test in which two dependent variables were used in a twofactor MANOVA (Table 5). This is an important result, especially as we accept
that excellent facilitation is a scarce commodity. It implies that the integrated
structure solution can overcome potential deficiencies imposed by less than
perfect JAD facilitation. Although only destructive dominance was used in the
test, the graphs in Figures 2(a) to 2(d) demonstrate that this phenomenon may be
true for other important determinants of process effectiveness and other
desirable outcomes.
These figures demonstrate the disproportionate improvements in performance by unskilled facilitators compared to their more competent counterparts,
as both groups switch between JAD and the integrated structure. The mean
scores (where bigger scores are more desirable) for satisfaction with the
outcome, destructive dominance, satisfaction with the process, and overall
Copyright © 2005, Idea Group Inc. Copying or distributing in print or electronic forms without written
permission of Idea Group Inc. is prohibited.
TEAM LinG
164 Duggan and Thachenkary
Table 5. Summary of results from the tests of hypotheses
Hypothesis
Type of Test
Difference Due to
Structure
Difference Due
to Facilitation
1. Process Effectiveness
ANOVA
Y (Sig. = .001)
N (Sig. = .070)
2. Level of Participation
MANOVA
Y (Sig. = .001)
Y (Sig. = .027)
3. Conflict Resolution
MANOVA
Y (Sig. = .001)
N (Sig. = .539)
4. Destructive Dominance
MANOVA
Y (Sig. < .000)
N (Sig. = .306)
5. Satisfaction with Process
ANOVA
Y (Sig. = .034)
Y (Sig. = .042)
6. Satisfaction with Outcome
ANOVA
Y (Sig. = .017)
N (Sig. = .202)
7. Quality of Requirements
ANOVA
Y (Sig. = .011)
Y (Sig. = .027)
8. Difference in Level of
Dysfunctional Behavior
MANOVA
(equivalent of
Hotelling’s T2)
Y (sig. = .032)
Not Applicable
Figure 2(a). Satisfaction with outcome
180
170
Mean Satisfaction with Outcome
160
150
140
Facilitator Level
130
Skilled
120
Unskilled
JAD
NJAD
Group Structure
Figure 2(b). Destructive dominance
80
Mean Destructive Dominance
70
60
Facilitator Level
Skilled
50
Unskilled
JAD
NJAD
Group Structure
Copyright © 2005, Idea Group Inc. Copying or distributing in print or electronic forms without written
permission of Idea Group Inc. is prohibited.
TEAM LinG
Supporting the JAD Facilitator with the Nominal Group Technique 165
Figure 2(c). Satisfaction with process
150
Mean Satisfaction With Process
140
130
120
Facilitator Level
110
Skilled
100
Unskilled
JAD
NJAD
Group Structure
Figure 2(d). Process effectiveness
260
250
240
Mean Process Effectiveness
230
220
210
200
Facilitator Level
190
Skilled
180
Unskilled
JAD
NJAD
Group Structure
process effectiveness, respectively, increased as skillful facilitators switched
between JAD and the integrated structure, respectively. However, unskilled
facilitators experienced a much larger increase for a similar shift. These all signal
the potentially beneficial effects of the integrated structure in making facilitation
less complex.
DISCUSSION AND IMPLICATIONS
This research effort was justified on the general acknowledgement that the
freely interacting meeting structure often contributes to dysfunctional group
behaviors that curtail the effectiveness of JAD. These behaviors impede
Copyright © 2005, Idea Group Inc. Copying or distributing in print or electronic forms without written
permission of Idea Group Inc. is prohibited.
TEAM LinG
166 Duggan and Thachenkary
communication; contribute to process loss, which prevents groups from realizing
their true potential; and obstruct the realization of synergy. JAD, therefore, is
critically dependent on excellent facilitation (a scarce resource) to overcome
these potential problems. The study was designed to evaluate the legitimacy of
the claim that the integration of NGT and JAD could enhance facilitation
effectiveness and obviate this prerequisite of facilitation excellence for SRD
success.
The findings support this expectation in the dimensions tested. However,
caution is advised in the general interpretation of these results. They were
obtained under experimental conditions where the task was simulated, and the
time for its accomplishment was compressed. Additionally, the high-level
requirements generated in the experiments lacked the details that typify normal
systems specifications. Further, role playing under experimental conditions
cannot capture realistically the effects of power asymmetry, intensity, emotiveness,
and political turf issues that characterize the natural process. On the contrary,
participants in the experiments seemed far more willing to make concessions
than is typical in natural settings. This research effort, therefore, should be
viewed as a laboratory model that requires replication in the field.
A further limitation of this study was the difficulty in establishing incontrovertible criteria for classifying facilitators into the two skill levels of expert or
novice. Facilitators perform at least three distinctly different but complementary
functions (Wood & Silver, 1995). They carry out environmental analysis—highlevel data collection to circumscribe the problem domain and the solution goals.
They plan and organize the meeting agenda, tools, techniques, and resources for
the session; and they facilitate communication during the meeting. Only the latter
was required in our study, but success in all three areas characterizes the
“goodness” of facilitation. Effective performance at the earlier levels can
simplify the effort at the communication level. Even more, good facilitators
overall may not be competent at all levels.
Although years of experience as a facilitator and the number of sessions
conducted were suggested criteria, participating organizations were free to
consider other means of classification. Discriminant analysis, however, indicated that the resulting categorization seemed reasonable. It is recognized that
facilitation competence levels exist along a continuum, but for this experiment
only the levels at the extremes of the continuum were used, which allowed this
manipulated variable the maximum potential for exhibiting relative influence.
Two other limitations also could have impacted the results. The facilitators
were given the freedom to decide the order in which they conducted their two
sessions. In hindsight, the claim to any systematic effect of facilitator learning
might have been nullified, if we had included an experimental condition that
required randomization of the order in which each facilitator conducted his or her
two sessions. Additionally, the facilitators were not paid; they volunteered
Copyright © 2005, Idea Group Inc. Copying or distributing in print or electronic forms without written
permission of Idea Group Inc. is prohibited.
TEAM LinG
Supporting the JAD Facilitator with the Nominal Group Technique 167
because of their interest in the outcome. Non-payment conceivably could have
induced differences in performance levels for some facilitators and not others,
although it would not necessarily affect the manner in which each conducted his
or her two sessions.
The insignificant effects of facilitation competence for process effectiveness, conflict resolution, destructive dominance, and satisfaction with the
outcome seem to bear out the suggestion that for these, the integrated technique
had the capability to equalize facilitator performance across the skill level
continuum. This inference seems consistent with the accepted role of facilitation
as the guardian of the faithful appropriation of the meeting structure. It is
precisely the integrated structure’s amenity to faithful appropriation that gave
rise to the proposition that even otherwise incompetent facilitators may experience successful results (induced by the structure) that facilitation competence
could not by itself enable.
Despite JAD’s success in some areas, several authors emphasized the
imperative for facilitators to “chill the dominators” and promote consensus. Yet
the experience has been that even excellent facilitators have not always
alleviated the deleterious impact of dominance by both powerful and extroverted
group members in group sessions generally, and in JAD workshops in particular.
Similarly, the desire by less influential group members to avoid conflict has tacitly
contributed to JAD outcomes that reflect the decision preferences of dominators
rather than group consensus. The indication that highly competent facilitators are
no more likely to reduce these problems than their less skillful counterparts
demonstrates the facilitators’ inability to curb dysfunctional behaviors and
enhances the value of the integrated structure.
For the other three measures—level of participation, satisfaction with the
process, and quality of the requirements—the significant result due to both
communication structure and facilitator competence suggests that these effects
may be additive; the integrated approach also helps good facilitators produce
better results. It may appear somewhat inconsistent, though, that facilitator
competence was shown to have a significant effect on the level of participation—one of the indicators of process effectiveness, but not on process
effectiveness itself. Similarly, there is an apparently conflicting indication of
significant facilitator effect on participants’ satisfaction with the process and not
with the outcome.
One credible explanation for the former may be that excellent facilitators
have a larger repertoire of artifices to cajole introspective group members
toward more active participation, as one of the authors observed during the
experiments. But these innovations were not enough to rectify more pernicious
problems like destructive dominance, anchoring, or subjective defense of opinions (especially those expressed by influential group members) that are not
supported by the group. This result is a good one in the larger scheme of the
integration of JAD and NGT; facilitation is still an important component in the
Copyright © 2005, Idea Group Inc. Copying or distributing in print or electronic forms without written
permission of Idea Group Inc. is prohibited.
TEAM LinG
168 Duggan and Thachenkary
idea clarification stage. Ultimately, the objective is not necessarily to equalize
participation, but to ensure breadth of participation and influence proportional to
the level of knowledge of the participants. The problem is the dysfunctional
consequences of inequality of influence and participation due to power or
personality that does not contribute to consensus. It seems that the communication structure and the facilitator can play mutually supportive roles to establish
this objective.
The significant facilitator effect for process satisfaction (but not satisfaction with the outcome) also may be due to the ability of more skillful facilitators
to draw on a larger set of tools to keep the sessions fluid, interesting, and more
efficient, which helps participants feel better about the process itself. However,
it is possible that the memory of people-related problems (prior to and even
despite facilitator intervention) lingered and affected participants’ evaluation of
the actual outcome.
The results also supported the proposition that the difference in facilitator
effectiveness under the integrated structure and JAD was greater on the
average for low-skilled facilitators than it was for the highly skilled facilitators.
Another way to view this is that the integrated structure induces greater
improvements in the results produced by groups directed by unskilled facilitators
than in those directed by highly skilled facilitators in comparison to similar results
under JAD. It reduces the onus for excellent process outcomes on the competence of the facilitator. This is an important finding, which could have potentially
far-reaching implications for practitioners. It suggests that superb facilitation is
still desirable, but it is not a critical success factor under the integrated structure.
CONCLUSION
The integrated approach appears to be able to preserve the benefits
commonly attributable to JAD (i.e., speed of SRD and user involvement) and
treat the group behavioral problems that mitigated its success. If this occurs,
several benefits could accrue to practitioners. First, some JAD efforts are not
contemplated because excellent facilitation is not always available; researchers
and practitioners agree that highly skilled JAD session leaders are in short
supply. The indications from this research could provide the confidence to
reduce this quandary (to apply JAD poorly or not at all) and make the technique
generally available to address the pervasive problems with systems requirements.
In addition, higher quality requirements permit early detection of potential
specification errors, which helps to reduce scope creep, prevent post-design
alterations, and ultimately contribute to better information systems. These
benefits would contribute to reduced systems development and maintenance
costs. Greater user satisfaction with both the SRD process and its decisions
Copyright © 2005, Idea Group Inc. Copying or distributing in print or electronic forms without written
permission of Idea Group Inc. is prohibited.
TEAM LinG
Supporting the JAD Facilitator with the Nominal Group Technique 169
could also promote user ownership—a sense of responsibility for the realization
of the system benefits—and help deflect usage-related systems failures.
These findings suggest some follow-up objectives for future research. An
interesting one is to attempt to replicate these results in the field to incorporate
the realism of true SRD environments and reduce many of the other limitations
of this study. It also would be useful to evaluate the performance of the
integrated structure by varying some of the factors that were controlled in this
experiment (i.e., group size and task complexity). Another possible research
undertaking would be to study the potential areas of applicability of the combined
JAD/NGT approach with newer systems development paradigms. The latter
objectives could provide valuable insights that could lead to the establishment of
contingency strategies for deploying this technique in several contexts.
REFERENCES
Andrews, D.C. (1991). JAD: A crucial dimension for rapid applications development. Journal of Systems Management, 42(3), 23-27, 31.
Anson, R., Bostrom, R., & Wynne, B. (1995). An experiment assessing group
support system and facilitator effects on meeting outcomes. Management
Science, 41(2), 189-208.
Antunes, P. (1999). On the design of group decision processes for electronic
meeting rooms. CLEI Electronic Journal (Special Issue) 2(1). Special
issue of best papers from CRIWG’98, held at Buzios, Brazil, September
1998.
Asaro, P.M. (2000). Transforming society by transforming technology: The
science and politics of participatory design. Accounting Mmanagement
and Information Technologies, 38, 257-290.
Bailey, J.E., & Pearson, S.W. (1983). Development of a tool for measuring and
analyzing computer user satisfaction. Management Science, 29(5), 530545.
Barrow, P.D.M., & Mayhew, P.J. (2000) Investigating principles of stakeholder
evaluation in a modern IS development approach. Journal of Systems and
Software, 52(2-3), 95-103.
Beynon-Davies, P., Mackay, H., & Tudhope D. (2000). It’s lots of bits of paper
and ticks and post-it notes and things: A case study of a rapid application
development project. Information Systems Journal, 10(3), 195-216.
Borovits, I., Ellis, S., & Yeheskel, O. (1990). Group processes and the development of information systems. Information & Management, 19, 65-72.
Bostrom, R.P., Anson, R., & Clawson, V.K. (1993). Group facilitation and group
support systems. In L.M. Jessup & J.S. Valacich (Eds.), Group support
systems: New perspectives (pp. 146-168). New York: Macmillian.
Copyright © 2005, Idea Group Inc. Copying or distributing in print or electronic forms without written
permission of Idea Group Inc. is prohibited.
TEAM LinG
170 Duggan and Thachenkary
Byrd, T.A., Cossick, K.L., & Zmud, R.W. (1992). A synthesis of research on
requirements analysis and knowledge acquisition techniques. MIS Quarterly, 16(3), 117-138.
Carmel, E., George, J.F., & Nunamaker, J.F. (1995). Examining the process of
electronic-JAD. Journal of End User Computing, 7(1), 13-22.
Chapman, R.J. (1998). The effectiveness of working group risk identification
and assessment techniques. International Journal of Project Management, 16(6), 333-343.
Cheng, K.E. (1996). A requirements definition and assessment framework for
SDL tools. Computer Networks and ISDN Systems, 28, 1703-1715.
Davidson, E. J. (1999). Joint application design (JAD) in practice. The Journal
of Systems and Software, 45(3), 215-223.
Dean, D.L., Lee, J.D. Pendergast, M.O., Hickey, A.M., & Nunamaker J.F.
(1997-98). Enabling the effective involvement of multiple users: Methods
and tools for effective software engineering. Journal of Management
Information Systems, 14(3), 179-222.
Dekleva, S.M. (1992). The influence of the information systems development
approach on maintenance. MIS Quarterly, 16(3), 355-372.
Delbecq, A.L., Van de Ven, A.H., & Gustafson, D.H. (1986). Group techniques for program planning: A guide to nominal group and Delphi
processes. Middleton, WI: Greenbriar.
Dennis, A. R., Hayes, G.S., & Daniels Jr., R.M. (1999). Business process
modeling with group support systems. Journal of Management Information Systems, 15(4), 115-142.
Dieckmann, M. (1996). Making new technology investments pay off. Managing
Office Technology, 41(7), 14-16.
Dowling, K.L., & St. Louis, R.D. (2000). Asynchronous implementation of the
nominal group technique: Is it effective? Decision Support Systems,
29(3), 229-248.
Frankel, S. (1987). NGT + MDS: An adaptation of the nominal group technique
for ill-structured problems. Journal of Applied Behavioral Science,
23(4), 543-551.
Gopal, A., Bostrom, R.P. & Chin, W. (1992-1993). Applying adaptive structuration
theory to investigate the process of group support systems use. Journal of
Management Information Systems, 9(3), 45-69.
Gouran, D.S., Brown, C., & Henry, D.R. (1978). Behavioral correlates of
perceptions of quality in decision making discussions. Communication
Monographs, 45, 51-63.
Green, S.G., & Taber, T.D. (1980). The effects of three social decision schemes
on decision group process. Organizational Behavior and Human Performance, 25, 97-106.
Copyright © 2005, Idea Group Inc. Copying or distributing in print or electronic forms without written
permission of Idea Group Inc. is prohibited.
TEAM LinG
Supporting the JAD Facilitator with the Nominal Group Technique 171
Henrich, T.R., & Greene, T.J. (1991). Using the nominal group technique to elicit
roadblocks to MRP II implementation. Computers & Industrial Engineering, 21(1-4), 335-338.
Highsmith, J., & Cockburn, A. (2001). Agile software development: The
business of innovation. Computer, 34(9), 120-127.
Ho, E.S., Lai, Y.J., & Chang, S.I. (1999). An integrated group decision-making
approach to quality function deployment. IIE Transactions, 31(6), 553567.
Holtzblatt, K., & Beyer, H.R. (1995). Requirements gathering: the human
factor. Communications of the ACM, 38(5), 30-32.
Hornsby, J.S., Smith, B.N., & Gupta, J.N. (1994). The impact of decisionmaking methodology on job evaluation outcomes. Group & Organization
Management, 19(1), 112-128.
Huber, G.P. (1980). Managerial decision making. Glenview, Ill: Scott,
Foresman.
Jackson, R.B., & Embley, D.W. (1996). Using joint application design to develop
readable formal specifications. Information and Software Technology,
38(10), 615-631.
Jones, C. (1996). Patterns of software system failure and success. Boston:
International Thomson Computer Press.
Kettelhut, M.C. (1993). JAD methodology and group dynamics. Information
Systems Management, 10(1), 29-36.
Kettelhut, M.C. (1997). Using JAD for strategic initiatives. Information Systems Management, 14(3), 46-53.
Korhonen, L.J. (1990). Nominal group technique. In M.W. Galbraith (Ed.),
Adult Learning Methods (pp. 247-259). Malabar, Florida: Krieger Publishing Company.
Liou, Y.I., & Chen, M. (1993-94). Using group support systems in joint
application development for requirements specifications. Journal of Management Information Systems, 8(10), 805-815.
Lyytinen, K. (1988). Expectation failure concept and systems analysts’ view of
information system failures: Results of an exploratory study. Information
& Management, 14(1), 45-56.
Marble, R. (1992). Casebook for systems analysis and design: FSS., Inc.
New York, NY: Mitchell-McGraw Hill.
Nunamaker, J.F., Dennis, A.R., Valacich, J.S., Vogel, D.R., & George, J.F.
(1993). Group support systems research: Experience from the Lab and
field. In L.M. Jessup & J.S. Valacich (Eds.), Group support systems:
New perspectives (pp. 125-145). New York: Macmillian.
Ocker, R., Hiltz, S.R., Turoff, M., & Fjermestad J. (1995-96). The effects of
distributed group support and process structuring on software requirements
development teams: Results on creativity and quality. Journal of Management Information Systems, 12(3), 127-153.
Copyright © 2005, Idea Group Inc. Copying or distributing in print or electronic forms without written
permission of Idea Group Inc. is prohibited.
TEAM LinG
172 Duggan and Thachenkary
Pinsonneault, A., & Kraemer, K.L. (1989). The impact of technological support
on groups: an assessment of the empirical research. Decision Support
Systems, 5(2), 197-216.
Poole M.S., & DeSanctis, G. (1990). Understanding the use of group decision
support systems: The theory of adaptive structuration. In C. Steinfield & J.
Fulk (Eds.), Organization and communication technology (pp. 173179). Beverly Hills, CA: Sage Publications.
Purvis, R., & Sambamurthy, V. (1997). An examination of designer and user
perceptions of JAD and the traditional IS design methodology. Information
& Management, 32(3), 123-135.
Raghaven, S., Zelesnik, G., & Ford, G. (1994). Lecture notes in requirements
elicitation [SEI-94-EM-010]. Pittsburgh, PA: Carnegie Mellon University.
Rist, O. (2001). Reinventing e-business. Network Computing, 12(20), 41-47.
Schuman, S.P. (1996). What to look for in a group facilitator. Quality Progress,
29(6), 69-72.
Spina, M. J., & Rolando, J.A. (2002, July). JAD on a shoestring budget.
CrossTalk The Journal of Defense Software Engineering, 26-28.
Stephenson, B.Y., Michaelsen, L.K., & Franklin, S.G. (1982). An empirical test
of the nominal group technique in state solar energy planning. Group &
Organization Studies, 7(3), 320-334.
Teltumbde, A. (2000). A framework for evaluating ERP projects. International
Journal of Production Research, 38(16), 4507-4520.
Thomas, J.B., McDaniel Jr., R.R., & Dooris, M.J. (1989). Strategic issue
analysis: NGT + decision analysis for resolving strategic issues. Journal of
Applied Behavioral Science, 25(2), 189-200.
Uden, L. (1995). Design and evaluation of human centered CIM systems.
Computer Integrated Manufacturing Systems, 8(2), 83-92.
Van de Ven, A.H., & Delbecq, A.L. (1974). The effectiveness of nominal,
Delphi, and interacting group decision making processes. Academy of
Management Journal, 17(4), 605-621.
van Maurik, J. (1994). Facilitating excellence: Styles and processes of facilitation. Leadership & Organizational Development Journal, 15(8), 30-34.
Vessey, I., & Conger S.A. (1994). Requirements specification: Learning object,
process, and data methodologies. Communications of the ACM, 37(5),
102-112.
Watson, H.J., & Frolick, M.N. (1993). Determining information requirements
for an EIS. MIS Quarterly, 17(3), 255-269.
Watson, R.T., DeSantis, G., & Poole, M.S. (1988). Using a GDSS to facilitate
group consensus: Some intended and unintended consequences. MIS
Quarterly, 12(3), 463-478.
Copyright © 2005, Idea Group Inc. Copying or distributing in print or electronic forms without written
permission of Idea Group Inc. is prohibited.
TEAM LinG
Supporting the JAD Facilitator with the Nominal Group Technique 173
Wood, J., & Silver, D. (1995). Joint application development. New York: John
Wiley & Sons.
Zuech N. (1992). Identifying and ranking opportunities for machine vision in a
facility. Industrial Engineering, 24, 42-44.
ENDNOTE
1
The International Software Benchmarking Group survey on worldwide
business systems projects (June 2001) indicated that 66% of these projects
used traditional systems techniques. They also found that RAD/JAD was
used in 28% of the overall projects.
Copyright © 2005, Idea Group Inc. Copying or distributing in print or electronic forms without written
permission of Idea Group Inc. is prohibited.
TEAM LinG
174 Adams, Berner and Wyatt
Chapter IX
Applying Strategies to
Overcome User Resistance
in a Group of Clinical
Managers to a Business
Software Application:
A Case Study
Barbara Adams, Cyrus Medical Systems, USA
Eta S. Berner, University of Alabama at Birmingham, USA
Joni Rousse Wyatt, Norwood Clinic, USA
ABSTRACT
User resistance is a common occurrence when new information systems are
implemented within health care organizations. Individuals responsible for
overseeing implementation of these systems in the health care environment
may encounter more resistance than trainers in other environments. It is
important to be aware of methods to reduce resistance in end users. Proper
training of end users is an important strategy for minimizing resistance.
This article reviews the literature on the reasons for user resistance to
health care information systems and the implications of this literature for
designing training programs. The other principles for reducing resistance—
Copyright © 2005, Idea Group Inc. Copying or distributing in print or electronic forms without written
permission of Idea Group Inc. is prohibited.
TEAM LinG
Applying Strategies to Overcome User Resistance
175
communication, user involvement, strategic use of consultants—are
illustrated with a case study involving training clinical managers on
business applications. Individuals responsible for health care information
system implementations should recognize that end user resistance can lead
to system failure and should employ these best practices when embarking
on new implementations.
INTRODUCTION
Traditionally, health care has lagged significantly behind other industries in
the use of information technology (Parton & Glaser, 2002). Until recently, the
use of computers in health care primarily has been to automate the business and
administrative functions. Today, a variety of pressures are forcing the health
care industry to invest more money and effort into using information technology
in clinical settings. New legislation to protect privacy and confidentiality of
medical information encourages the development of electronic medical records
(U.S. Department of Health and Human Services, 2002). Concerns over medical
errors have led to an increased interest in clinical decision support systems and
computer-based physician order entry (Bates et al., 1999; Leapfrog Group,
2000). These developments will lead to more need for direct use of computers
by health care providers who are used to manual processes for the same tasks.
In addition, many clinicians now are assuming managerial positions in health
care, where they will be expected to use traditional business applications as well
(Merry, 1999). Not only are these new managers not used to automating some
of these tasks, but, as clinicians, they also have not seen use of the computer as
part of their professional role. As a chairman of a clinical department once said,
“What do I have a secretary for?”
The reluctance to use the new systems may be perceived as resistance, or,
in fact, there may be real resistance to the changes that information technology
makes in the clinical work processes (Worthley, 2000). In either case, administrators, information technology personnel, or clinicians charged with promoting
the use of information technology in the health care environment may encounter
more resistance than is found in other environments; therefore, added to the
issues of training end users that are common across a variety of settings, health
care project managers also need to be aware of methods to reduce resistance
in end users (Kaplan, 1997).
User resistance is a common occurrence when new information systems
are implemented within a health care organization. There is also a sizable amount
of literature on health care system implementations to explain and give insight
into some of the reasons behind this resistance and to suggest strategies for
overcoming it (Ash et al., 2000; Jiang et al., 2000; Lauer et al., 2000; Lorenzi &
Copyright © 2005, Idea Group Inc. Copying or distributing in print or electronic forms without written
permission of Idea Group Inc. is prohibited.
TEAM LinG
176 Adams, Berner and Wyatt
Riley, 1995; Lorenzi et al., 1997, 2000, 2004; McNurlin & Sprague, 1998;
Worthley, 2000). The principles advocated in these studies can be used to
develop a variety of end-user training programs in health care settings. We will
discuss this literature and the implications for design of training programs and will
illustrate the application of these principles with a case study that involved
training clinical managers on business applications.
POSSIBLE EFFECTS OF USER RESISTANCE
When computers were first introduced into the health care setting, the
technical issues were the most important to address, but as Lorenzi et al. (1997,
2004) discuss, now that many technical issues have been solved, the managerial,
organizational, and people issues are equally, if not more, important. Worthley
(2000) attributes the failure of many system implementations to the failure to
properly address user resistance. He discusses five different forms that resistance can take: sabotage of computer equipment; employees being absent or late
to work; badmouthing the system, not using the new system, and continuing to
use the old system; and data tampering (Worthley, 2000).
REASONS FOR USER RESISTANCE
Kaplan (1997) discusses some of the causes of resistance to information
systems. She mentions user-centered theories, which “consider resistance to be
due to factors inherent in users, such as their lack of knowledge or their
reluctance to change” (p. 95). Other researchers also have identified resistance
to change as a significant source of implementation problems (Ash et al., 2000;
Brown & Coney, 1994; Jiang, Muhanna, & Klein, 2000; Lorenzi & Riley, 2000;
Yaghmaie, Jayasuriya, & Rawstorne, 1998).
In addition to resistance to change, both Lorenzi and Riley (1995) and
Worthley (2000) discuss some other reasons for user resistance:
•
•
•
•
•
•
Fear of loss of prestige and status in the organization due to not knowing the
new information systems (Lorenzi & Riley, 1995; Worthley, 2000)
Pressure to develop new skills (Lorenzi & Riley, 1995)
Pressure of higher performance expectations (Lorenzi & Riley, 1995)
Fear of loss of social interaction with other workers (Worthley, 2000)
Historical reasons, such as a previous bad experience with an information
technology effort (Worthley, 2000)
Benefits may not be clear to the user (Ash et al., 2000).
Copyright © 2005, Idea Group Inc. Copying or distributing in print or electronic forms without written
permission of Idea Group Inc. is prohibited.
TEAM LinG
Applying Strategies to Overcome User Resistance
177
STRATEGIES FOR A SUCCESSFUL
INFORMATION SYSTEMS IMPLEMENTATION
Based on this literature review, the following were recurrent themes as
strategies to overcome user resistance:
•
•
•
•
•
Communication – Several researchers name communication as one of the
most important strategies for a successful systems implementation (Jiang
et al., 2000; Krishnan, 1999; Lauer et al., 2000; Lorenzi & Riley, 1995;
Worthley, 2000).
User involvement – Ives and Olson (1984) found as a result of reviewing
over 20 articles that “participation leads to increased user acceptance and
use by encouraging realistic expectations, facilitating the user’s system
ownership, decreasing resistance to change, and committing users to the
system” (p. 587-588).
Clarification of benefits – A strategy discussed by Ash et al. (2000,
p.128) “is to make sure the system provides immediate benefits to users.”
Ash et al. suggest that telling the user what the short- and long-term
benefits will be for that individual user will motivate a person to use the
system more than telling the user what the overall benefits of the system
will be for the organization.
Role of consultants – Consultants can be beneficial in information
systems implementation by filling in the experience and knowledge gaps of
their clients (Bauman, 2001). As an outsider, they are not involved in office
politics, and their decisions are based on what is in the business’ best
interest, not the best interest politically (Bauman, 2001). Very often, a
credible outside consultant can get a user to adopt new practices that
internal managers have tried to implement unsuccessfully.
Training – Training has been one of the main topics researchers have
emphasized as essential to successful information systems implementation
(Ash et al., 2000; Jiang et al., 2000; Lauer et al., 2000; Lorenzi & Riley,
1995; Lorenzi et al., 1997, 2000; McNurlin & Sprague, 1998; Worthley,
2000). Both Lorenzi and Riley (1995) and Worthley (2000) advise the use
of the just-in-time training concept when training users on a new information system. This means that training should occur just prior to implementation. They also suggest training the users in the order in which they are
going to use the system. There is a danger of training users too early and
then finding that the users have forgotten much of what they learned and/
or are not as familiar with the product when the actual implementation
occurs (Lorenzi & Riley, 1995). This means that the implementation
schedule should be monitored carefully, and the training plans should be
revised if there is significant delay.
Copyright © 2005, Idea Group Inc. Copying or distributing in print or electronic forms without written
permission of Idea Group Inc. is prohibited.
TEAM LinG
178 Adams, Berner and Wyatt
Lorenzi and Riley (1995) suggest that training addresses both technical
content and attitudes. “Any training needs to be a combination of educating
people in how to use the system plus building their enthusiasm for doing so”
(Lorenzi & Riley, 2004, p.260). Lorenzi and Riley (1995) and Worthley (2000)
discuss the importance of training manuals and online help. Complex systems
may require special training such as training in stages (Lorenzi & Riley, 1995).
Breaking up the training will allow the users to get comfortable with one part of
the system and may help to build confidence in learning the more complex parts
(Lorenzi & Riley, 1995). Researchers have mentioned that physicians may
require specialized training (Ash et al., 2000). Physicians dislike spending any
time in training (Lorenzi & Riley, 2004) and “frequently want to be trained by
other physicians” (Ash et al., 2000, p.129). One method that Lorenzi et al. (1997)
suggest when training physicians on a new system is to design a training program
that adapts to their current work styles. One idea is to use “training aids that are
prepared on 3x5 index cards because most physicians are accustomed to keeping
pertinent information in this manner” (Lorenzi et al., 1997, p.84).
CASE STUDY
We applied these principles in designing a training program in the use of the
Microsoft Excel application to clinical managers of an outpatient medical clinic.
Although all of the principles discussed above in regard to major systems
implementation are not applicable to the small case study, many of them are. In
addition, many of the same reasons for resistance can be found with small
business applications as with large informational technology implementations.
We will describe the background to the request for assistance, the application of
the principles in the design of the training program, and the outcomes.
BACKGROUND
Southern Medical Clinic (not its real name) is a multi-specialty group
practice started in 1926. Currently, the clinic has been home to several of the
physicians for more than 20 years. One particular physician has been there for
more than 40 years, over half of the entire life of Southern Medical Clinic.
Likewise, the support staff boasts many that have been with the facility for 25,
30, and even 40 years. In health care today, such statistics are rare. Southern
Medical Clinic still operates as a multi-specialty, physician-owned clinic. They
still use paper medical records; they still house a completely handwritten master
patient index; they have a paper card catalogue of all the patient charts; and they
even make paper copies of all insurance remittances. For such a facility to
continue to thrive, it not only must let technology in the door, but it also must
Copyright © 2005, Idea Group Inc. Copying or distributing in print or electronic forms without written
permission of Idea Group Inc. is prohibited.
TEAM LinG
Applying Strategies to Overcome User Resistance
179
embrace what technology has to offer;, yet it also is to be expected that with such
a stable staff, there may be reluctance to doing things differently from the way
they have always been done. Southern Medical Clinic has overcome much
resistance already. All of the practice’s management, accounting, HR, claims
filing, and payroll are now electronic. Internet classes are held, and spreadsheets
have replaced old handwritten forms. They soon will be scanning all remittance
reports to a server, and one department is considering the idea of electronic
medical records. The board meetings now have physicians with pocket PCs, and
the preferred means of mass communication is e-mail.
The problem that formed the focus for the case study was the reluctance
of the clinical department managers to learn to use Excel. The managers had
been encouraged to use Excel for a variety of tasks including documenting
employee leave, which they currently monitored manually. The human resources
department provided them with spreadsheets that they were expected to use.
Although a few were interested in learning how to use the spreadsheets, most
of the managers were not extremely computer literate and appeared to prefer to
calculate the leave manually and ask their secretaries to enter the data into the
spreadsheet. Obviously, such a practice has a greater opportunity for introducing
error and is less efficient than directly entering and calculating the leave with the
spreadsheet, yet the managers were not eager to change the system with which
they were familiar. It was with this background that the clinic manager requested
outside consultation and training for her staff.
APPLICATION OF PRINCIPLES
FOR OVERCOMING RESISTANCE
The strategies in the literature review were applied to developing the
training program. A strategy discussed by Bauman (2001) was to bring in outside
consultants. The trainer did not have any affiliation with the health care
organization and did not know any of the clinical managers in the training classes.
When preparing the training program, an effort was made to make sure that the
users would see the personal benefits of using the program as advocated by Ash
et al. (2000). To accomplish this, the training program included examples of some
current processes that the managers performed manually, and the managers
were told that the goal of the training was to work on automating them. Some of
the benefits of using the software were emphasized, and the managers were told
how they would be able to use the software as soon as they went back to work.
Another strategy that was incorporated into the training program was based on
Lorenzi and Riley’s (1995) suggestion to break up the training into stages. There
were three training sessions scheduled, and each session progressively covered
more complex material. Lorenzi and Riley (1995) discussed how breaking up the
training into stages would allow users to get comfortable with one part of the
Copyright © 2005, Idea Group Inc. Copying or distributing in print or electronic forms without written
permission of Idea Group Inc. is prohibited.
TEAM LinG
180 Adams, Berner and Wyatt
system and help to build confidence in the users when they were faced with the
more complex parts.
Prior to taking the Excel training, the department managers were required
to pass a proficiency test in basic computing and Microsoft Word. Out of the 18
health care managers in this organization who were eligible to take the Excel
class, 12 enrolled, and 11 completed the class. There were three sessions, each
two hours long, completed over a three-week period, with multiple sessions given
each week to accommodate small groups of the managers. The training groups
were mixed according to level of computer experience. An evaluation form was
developed to get feedback on the teaching and to assess any resistance that the
health care managers might have had toward learning and using Excel. The
evaluation form was distributed at the end of the final training session. The
instructor informed the managers that their employer would not see the individual
evaluation forms.
Outcomes
The 11 health care managers completed the evaluation form about the Excel
training class. On the whole, they were very positive. More than 80% responded
positively to nine of the 10 questions. The exception still was positive, in that eight
of the managers felt the class was less difficult than they thought it would be, and
only one thought it was more difficult. What was particularly interesting was that
all of the managers agreed that their interest in using Excel was increased (73%
responded with agree, and 27% responded with strongly agree), and that they
would use Excel in their work (55% strongly agree; 45% agree). The respondents were very positive about the instructor, and all of them were interested in
taking another class with her. Approximately nine months after the training
session, the actual extent of use of the software was assessed. Results showed
more than half of the trained managers now were using the software. Of those
who were not, 18% did not have access to a computer. Twenty-seven percent
of the original group of trainees was still resisting using the software.
DISCUSSION
Given the expectation of encountering resistance, it was surprising that
during the class as well on the final evaluation, this resistance did not appear at
all. The training program was designed and developed in an effort to minimize
user resistance and appeared to have done so. When designing the Excel training
program, the one overall goal from the perspective of the organization was for
the managers to produce a sick and vacation report in Excel. This is a report that
all of the managers were required to do, and all were performing this report
manually. In the first class, managers were told that the sick and vacation report
was the overall goal, and they responded positively. During the classes, there
Copyright © 2005, Idea Group Inc. Copying or distributing in print or electronic forms without written
permission of Idea Group Inc. is prohibited.
TEAM LinG
Applying Strategies to Overcome User Resistance
181
were conversations about reports and processes that they perform manually and
discussions about how they could use Excel to automate some of those other
processes, as well. The basics of Excel were covered in the first class. In the
second and third classes, the focus was to work on the leave report. Showing the
managers how Excel could help automate a time-consuming manual report
helped to motivate them to use and learn Excel. As an outsider to the organization, the instructor was not encumbered by any relationships with the users. The
users knew that how they did in the training classes was not going to affect how
they were evaluated or perceived in their jobs. Thus, using outside consultants
to provide a different perspective, increase credibility, design the program to
illustrate personal benefits, and focus the training on gradually building up
confidence in use, resulted in very positive evaluations from a group of users
perceived to be resistant to learning new technologies.
Although it would be gratifying to think that the attention to evidence-based
good practices in instructional design were solely responsible for the positive
outcomes, there are other explanations. It is possible that the most resistant users
did not take the class, since a third of the eligible managers did not take advantage
of the training opportunity. In addition, sometimes users’ lack of confidence using
a computer system can be perceived as resistance to the system. It actually may
have been the clinical managers’ lack of confidence in using Excel that was
perceived as resistance. The training classes may have helped to build their
confidence, and then they realized that it was not as difficult as they thought it
would be.
CONCLUSION
As health care systems begin to implement new information technology, end
user resistance likely will become increasingly common. There are a variety of
reasons for the resistance, but there are also strategies that have been shown to
minimize it. These strategies include communication, user involvement, and
training, with specific focus on increasing user confidence. These strategies can
be used with large-scale implementations and can be incorporated within the
training programs themselves. Individuals responsible for health care information system implementations should recognize that end-user resistance can lead
to system failure and that they should employ these best practices when
embarking on new implementations.
REFERENCES
Ash, J.S., et al. (2000). Managing change: An analysis of a hypothetical case.
Journal of the American Medical Informatics Association, 7, 125-134.
Copyright © 2005, Idea Group Inc. Copying or distributing in print or electronic forms without written
permission of Idea Group Inc. is prohibited.
TEAM LinG
182 Adams, Berner and Wyatt
Bates, D.W., et al. (1999). Impact of computerized physician order entry on
medication error prevention. Journal of the American Medical Informatics
Association, 6(4), 313-321.
Bauman, C. (2001). Readying your organization for new technology. IT Health
Care Strategist, 3(7), 1-3.
Brown, S.H., & Coney, R.D. (1994). Changes in physicians’ computer anxiety
and attitudes related to clinical information system use. Journal of the
American Medical Informatics Association, 1, 381-394.
Ives, B., & Olson, H. (1984). User involvement and MIS success: A review of
research. Management Science, 30, 586-603.
Jiang, J.J., Muhanna, W.A., & Klein, G. (2000). User resistance and strategies
for promoting acceptance across system types. Information Management, 37, 25-36.
Kaplan, B. (1997). Addressing organizational issues into the evaluation of
medical systems. Journal of the American Medical Informatics Association, 4, 94-101.
Krishnan, R.S. (1999). Without nurses, inventory control impossible. Hospital
Materials Management, 24, 10-14.
Lauer, T.W., Joshi, K., & Browdy, T. (2000). Use of the equity implementation
model to review clinical system implementation efforts. Journal of the
American Medical Informatics Association, 7, 91-102.
Leapfrog Group for Patient Safety: Rewarding Higher Standards (2000). The
Leapfrog Group. Retrieved February 21, 2005 from http://www.leapfrog
group.org/
Lorenzi, N., Smith, J.B., Conner, S.R., & Campion, T.R. (2004). The success
factor profile© for clinical computer innovation. Proceedings, Medinfo,
2004, San Francisco, California.
Lorenzi, N.M., & Riley, R.T. (1995). Organizational aspects of health
informatics: Managing technological change. New York: SpringerVerlag.
Lorenzi, N.M., & Riley, R.T. (2000). Managing change. Journal of the
American Medical Informatics Association, 7, 116-124.
Lorenzi, N.M., & Riley, R.T. (2004). Managing technological change:
Organizational aspects of health informatics (2nd ed.). New York:
Springer.
Lorenzi, N.M., Riley, R.T., Blyth, A.J.C., Southon, G., & Dixon, B.T. (1997).
Antecedents of the people and organizational aspects of medical informatics:
Review of the literature. Journal of the American Medical Informatics
Association, 4, 79-93.
McNurlin, B.C., & Sprague, Jr., R.H., Jr. (1998). Information xystems management in practice. New Jersey: Prentice Hall.
Copyright © 2005, Idea Group Inc. Copying or distributing in print or electronic forms without written
permission of Idea Group Inc. is prohibited.
TEAM LinG
Applying Strategies to Overcome User Resistance
183
Merry, M. (1999). Wanted: A new breed of physician drivers for healthcare’s
nitroglycerin trucks. Frontiers of Health Services Management, 15(4),
29-35.
Parton, C., & Glaser, J.P. (2002, July). Myths about IT spending. Healthcare
Informatics. Retrieved February 21, 2005 from http://www.healthcareinformatics.com/issues/2002/07_02/myths.htm
U.S. Department of Health and Human Services (2002). Administrative simplification. Retrieved February 21, 2005 from http://aspe.hhs.gov/admn
simp/
Worthley, J.A. (2000). Managing information in healthcare: Concepts and
cases. Chicago, IL: Health Administration Press.
Yaghmaie, F., Jayasuriya, R., & Rawstorne, P. (1998). Computer experience
and computer attitude: A model to predict the use of computerised
information systems. Medinfo’ 98, Proceedings of the Ninth World
Congress on Medical Informatics, Amsterdam, Netherlands.
APPENDIX
Lesson Plan for Excel Training Session 1
Introduction
•
Define what Microsoft Excel is and what it is used for.
•
Excel is a spreadsheet application that allows you to perform quick and
accurate calculations on data that are entered into a worksheet. Using
Excel also helps to avoid errors and present data in a professional format.
•
Discuss how Excel can be beneficial to them in their daily jobs.
Objectives for Session 1
•
Learn how to open and create an Excel workbook.
•
Be able to identify the components of the Excel screen.
•
Learn how to use the menus and toolbars to perform commands in Excel.
•
Be able to enter text and values in a worksheet.
•
Learn how to close and save an Excel file.
Assignment
•
In class, we will create a calorie counter worksheet. This will involve the
students entering text and data. They will have a brief introduction to simple
formulas. We will use the auto-sum function and average function in this
assignment. Next session will cover formulas in more detail.
Copyright © 2005, Idea Group Inc. Copying or distributing in print or electronic forms without written
permission of Idea Group Inc. is prohibited.
TEAM LinG
184 Adams, Berner and Wyatt
Lesson Plan for Excel Training Session 2
Introduction
•
Question and answer section from last session
•
Review of what we covered in the last session
•
Discussion of formulas in Excel
Objectives for Session 2
•
Learn how to perform calculations in Excel by the using shortcut formulas
and by entering formulas.
•
Be able to edit and delete data in Excel.
•
Be able to cut, copy, and paste in Excel.
•
Learn how to move cells around in Excel using the drag and drop method.
Assignment
•
In class, we will begin work on a sick and vacation report that will allow
them to apply skills learned from the previous lessons. The report will
include entering text, values, and formulas. The objective is for them to use
the worksheet in their jobs to keep up with the sick and vacation hours for
each of the employees in their department.
Lesson Plan for Excel Training Session 3
Introduction
•
Question and answer section from last session
•
Review of what we covered in the last session
•
Discuss number formatting in Excel and how that can change the way
values are displayed.
Objectives for Session 3
•
Learn how to apply number formats.
•
Learn how to format cells using the formatting toolbar.
•
Be able to delete and insert columns and rows.
•
Be able to change the width of a column and the height of a row.
•
Learn how to use the undo function to undo your mistakes and the redo
function in case you change your mind and want to redo the action.
•
Be able to move between worksheets.
•
Learn how to add, delete, and rename worksheets in a workbook.
•
Learn how to get help from the office assistant and other resources in
Excel.
Assignment
•
We will continue to work on the sick and vacation report.
Copyright © 2005, Idea Group Inc. Copying or distributing in print or electronic forms without written
permission of Idea Group Inc. is prohibited.
TEAM LinG
Applying Strategies to Overcome User Resistance
1.
Excel Training Class Evaluation Form
Please circle the response for each that best reflects your opinion. Please write any additional
comments or suggestions on the back of this form.
The instructor covered too much material in each session.
Strongly
Agree
2.
Agree
Neutral
Disagree
Strongly
Disagree
The sequence of course content facilitated learning about the subject matter.
Strongly
Agree
3.
Agree
Neutral
Disagree
Strongly
Disagree
The Excel class was less difficult than I thought it would be.
Strongly
Agree
Agree
Neutral
Disagree
Strongly
Disagree
4.
The instructor was friendly and easy to talk to.
Student Comment: Helped above class subject for me.
Strongly
Agree
Neutral
Disagree Strongly
Agree
Disagree
5.
The instructor delivered the course content clearly.
Strongly
Agree
6.
Strongly
Disagree
Agree
Neutral
Disagree
Strongly
Disagree
Agree
Neutral
Disagree
Strongly
Disagree
Agree
Neutral
Disagree
Strongly
Disagree
Neutral
Disagree
Strongly
Disagree
I will use Excel in my work.
Strongly
Agree
10.
Disagree
This course increased your interest in using Excel.
Strongly
Agree
9.
Neutral
I learned more about Excel than I expected.
Strongly
Agree
8.
Agree
This class met your objective for what you wanted to accomplish in this training.
Strongly
Agree
7.
185
Agree
If you had the opportunity, would you take another class from the instructor?
Yes
No
Copyright © 2005, Idea Group Inc. Copying or distributing in print or electronic forms without written
permission of Idea Group Inc. is prohibited.
TEAM LinG
186 Stahl
Chapter X
Responsibility for
Information Assurance
and Privacy:
A Problem of Individual Ethics?
Bernd Carsten Stahl, De Montfort University, UK
ABSTRACT
Decisions regarding information assurance and IT security can affect
individuals’ rights and obligations and thereby acquire a moral quality.
The same can be said for questions of privacy. This chapter starts by
showing how and why information assurance and privacy can become
problems worthy of ethical consideration. It demonstrates that there is no
simple and linear relationship between ethics and information assurance or
between ethics and privacy. Many decisions in the area of IT, however,
affect not only one, but both of these subjects. The ethical evaluation of
decisions and actions in the area of privacy and security, therefore, is
highly complex. This chapter explores the question whether individual
responsibility is a useful construct to address ethical issues of this complexity.
After introducing a theory of responsibility, this chapter discusses the
conditions that a subject of responsibility typically is assumed to fulfill.
This chapter will argue that individual human beings lack some of the
Copyright © 2005, Idea Group Inc. Copying or distributing in print or electronic forms without written
permission of Idea Group Inc. is prohibited.
TEAM LinG
Responsibility for Information Assurance and Privacy
187
essential preconditions necessary to be ascribed responsibility. Individuals
have neither the power, the knowledge, nor the intellectual capacities to
deal successfully with the ethical challenges in the tension of privacy and
information assurance. This chapter ends by suggesting that the concept of
responsibility, nevertheless, may be useful in this setting, but it would have
to be expanded to allow collective entities as subjects.
INTRODUCTION
Proponents of information assurance aim at meeting the security testing,
evaluation, and assessment needs of IT consumers and producers. They are
mostly interested in eliminating security threats and, in the long run, want to
increase the levels of trust that users and consumers have in IT and networks.
While most users support these goals of information assurance, they also have
other objectives when using IT; among them is the preservation of privacy. To
a certain degree, these two objectives are contradictory. In order to facilitate
security, it would be helpful to eliminate privacy, because this would allow an
easier detection and elimination of security risks. Privacy, on the other hand,
requires security, because the protection of private data relies on the assumption
that no unauthorized access is possible. Privacy and information assurance thus
also can be complementary.
Further complicating this relationship, both terms also have an ethical side
to them. Trust, as the ultimate aim of information assurance, is at least partly a
moral notion. Security is necessary to facilitate a free and equal exchange of
ideas. At the same time, an excess of security can stifle the exchange of ideas
and the greater good. Privacy generally is recognized as a moral good, but it is
debatable how this good can be justified and where its limits are. The individual
user, who must make decisions concerning the weighting of privacy and
information assurance, therefore finds himself in a situation where, despite an
ethical quality of the choices, it is less than clear how decisions are to be made.
This is where the concept of responsibility enters the picture. This chapter
will describe a theory of responsibility and put a special emphasis on the question
of who can be the subject of responsibility. This theory of responsibility then will
be applied to the complex problem of privacy and information assurance. The
theory and conditions of responsibility will be used to demonstrate that while
individual responsibility can play an important role in such ethical decisions, it also
runs into severe problems. It will be argued that due to the lack of fulfillment of
the basic conditions of responsibility, the individual end user is not able to
shoulder the burdens required in order to make an ethical decision. As a
consequence, questions of privacy and information assurance require a wider
context and frame in which they can be answered. Only in such a frame does
individual responsibility make sense and can it achieve its objectives.
Copyright © 2005, Idea Group Inc. Copying or distributing in print or electronic forms without written
permission of Idea Group Inc. is prohibited.
TEAM LinG
188 Stahl
How should the individual end user deal with this dilemma? The conclusion
of the chapter will argue that the content of this chapter is of high relevance for
the individual end user, because it allows him or her to recognize the limits of his
or her capacities. The very fact that individual humans quickly reach their
fundamental limits when they are ascribed responsibility in the context of
information assurance and privacy will allow them to overcome their limitations.
By pointing out why they cannot accept such responsibility ascriptions, they
should be able to transcend the ascription and open discourses that will include
other subjects, which, in turn, might be able to solve the problem. Briefly, the
arguments presented in this chapter can be used to protect the individual end user
from responsibility ascription that he or she is incapable of satisfying. At the
same time, they should help avoid situations where responsibility is wrongly
ascribed to individuals.
INFORMATION ASSURANCE AND PRIVACY:
AN ETHICAL CHALLENGE
As indicated in the introduction, a brief look at the concepts of information
assurance and privacy could suggest that the two can be contradictory, but the
opposite interpretation is just as possible. Since it is the purpose of this chapter
to analyze the role that individual responsibility can play with regard to the
realization of information assurance and privacy, this section will be dedicated
to a discussion and definition of the concepts. In both cases, the focus of the
discussion will be their ethical content and the ethical challenges they pose.
We will leave the definition of ethics as open as possible and work with a
common sense notion of ethics. While this may not be very satisfactory from a
philosophical point of view, one reason to support this approach is that most end
users who make moral decisions concerning the use of ICT do not have a formal
education in philosophical ethics. At the same time, most users probably can be
considered to be ethical in the sense that they want to do the right thing. In order
to do so, they need some sort of private understanding of ethics, and it is this that
we will work with here. Briefly, ethics here will be understood as having to do
with doing good. Ethical behavior aims at improving the circumstances of oneself
and, more importantly, of others. Part of this is to respect other people’s rights
and interests, and in order to determine these, one has to assume a basic similarity
of rights and interests between different people. A generally shared rule of pretheoretical ethics, which is also reflected in ethical theories, is to treat the other
in such a way as one wants to be treated oneself. This rough sketch of ethics will
suffice for the identification of ethical problems posed by information assurance
and privacy. The reader who is not satisfied with this concept of ethics is referred
to Stahl (2004) for a detailed discussion of the relationship of philosophical ethics
and the idea of reflective responsibility.
Copyright © 2005, Idea Group Inc. Copying or distributing in print or electronic forms without written
permission of Idea Group Inc. is prohibited.
TEAM LinG
Responsibility for Information Assurance and Privacy
189
The Ethics of Information Assurance
Information assurance is a term that denotes the idea of security of
information in technical systems. The U.S. National Information Assurance
Partnership, for example, is a government initiative “designed to meet the
security testing, evaluation, and assessment needs of both information technology (IT) producers and consumers” (NIAP, 2003). Information assurance tends
to focus on security in information systems using a relatively wide framework.
As the above definition shows, it is a collaborative effort of private, public, and
often academic institutions that endeavors to consider all of the relevant
stakeholders. While not a completely new idea, the information assurance
movement seems to have been strengthened by the September 11, 2000, terrorist
attack and the subsequent attention by governments, particularly the U.S.
federal government, to security threats. This is shown by the fact that the U.S.
military plays a prominent role in information assurance (IASE 2003). This close
connection of information assurance to terrorism, government, and the military
carries ethical implications by itself that this chapter will not be able to discuss.
For the purposes of this chapter, we will understand information assurance as
concerned with the security in information systems and, therefore, concentrate
on the ethical implications of security.
Threats and Solutions to Security Problems
Threats to security and information assurance can be seen in many different
areas. They can result from intentional attacks but also from unintended
misbehavior or from technical or organizational mistakes. A central problem in
rectifying these mistakes is that they not only are unknown but, by definition,
unknowable. Human beings who make decisions regarding information technology deal with future states and, therefore, have to accept uncertainty and risks
in their decisions (Grabner-Kräuter 2002).
Nevertheless, the knowledge of uncertainties and possible dangers compels
us to act in order to avoid damages. In the case of threats to IT security, there
are several areas where security efforts can be fruitful. Among them, one can
find malicious attacks such as worms, viruses, and the like (Eisenberg et al.,
1995) or hacking (Johnson 2001). The biggest fear at the moment is probably
terrorism. It is interesting to note, however, that it is not a new fear and that
connections between the use of IT and terrorist attacks have been predicted
years before the attack on the World Trade Center (Levy 1995).
Information assurance, as the attempt to assure the availability of IT
services, can go several routes and will usually take several of them simultaneously. On the one hand, there are organizational measures that are frequently
linked with the embedding of information systems in organizations and hierarchies (Healy & Iles 2002). On the other hand, there are technical measures that
include the setting of standards of reliability (Littlewood & Stringy 1995),
Copyright © 2005, Idea Group Inc. Copying or distributing in print or electronic forms without written
permission of Idea Group Inc. is prohibited.
TEAM LinG
190 Stahl
measures to ensure authentication such as biometrics (van der Ploeg 2001), or
others such as encryption (Tavani 2000).
The Ethical Implications of Information Assurance
Given the loose definition of ethics used in this chapter, there are many
possible points of contact where information assurance and security can have an
ethical impact. If ethics has to do with doing the right thing (whatever that may
mean in a particular situation), then security in IT is something of ethical
relevance. Security questions affect who gets access to which technology. They
determine who can communicate with whom and about which topics. Security
regulations imply power relationships with all their ethical baggage. The question
of reciprocity that was introduced as central to ethical thinking is affected by
security measures. Generally, one can state that most, if not all, attempts to
secure information technology affects in some way or other the way people can
behave and interact. They thereby automatically affect moral rights and obligations. At the same time, security is also a necessary precondition for ethical
action. In order to act ethically, one needs social norms and institutions that
support and facilitate such action. This means that these institutions must be
secured. On the other hand, security considerations can be misused as excuses
for immoral behavior.
Information assurance thus can be seen as a topic of ethical importance that
has no clear and unequivocal ethical message. Security measures can have
morally positive results, but they can also become moral liabilities. There are no
simple guidelines along the lines of “the more security, the more ethics”.
Individuals making decisions regarding security are, therefore, in a difficult
position when they want to consider ethical problems. This difficult situation is
exacerbated when one widens possible decisions beyond pure security considerations and looks at other factors—in our case, privacy.
The Ethics of Privacy
Privacy is a concept that has gained prominence due to the spread of
information technology and the approaching information society. Given the
complexity of the discussion about privacy and the importance it has for the
question of how to assume responsibility for it, this section first will look at the
definitions of privacy, then at the justifications that can be found in the literature
in order to analyze the limits of the concept.
Definitions of Privacy
There is much debate about privacy from different academic disciplines.
One of the fields where privacy is most hotly debated is that of computer and
information ethics. Most authors agree that privacy is a moral value. However,
it often is not clear what exactly privacy is (Weckert & Adeney, 1997) and why
Copyright © 2005, Idea Group Inc. Copying or distributing in print or electronic forms without written
permission of Idea Group Inc. is prohibited.
TEAM LinG
Responsibility for Information Assurance and Privacy
191
it must be considered valuable. However, the amount of protection we believe
to be appropriate and the outcome of conflicts between privacy and other
interests depend on our answer to these questions, which is why it is necessary
in this chapter to give an overview of definition, justification, and limits of privacy.
Unlike information assurance, which is a term that only makes sense in a
modern society and with the use of information technology in mind, privacy is an
old concept that can be traced back to the beginning of modern civilization among
the ancient Greeks (Rotenberg, 1998). The modern meaning and importance of
the term privacy, nevertheless, are linked closely to technology. Also, the legal
protection of privacy is a relatively new phenomenon dating back to the late
1800s, which coincides with the growth of cities and the migration from rural
environments (Sipior & Ward, 1995). It is interesting to note that the legal
protection of privacy was a reaction to a technological development; namely,
photography. Warren and Brandeis (1890) wrote a seminal chapter that started
the modern discussion about privacy and led to its legal codification because of
the fact that through the use of technology, it became possible for the first time
to make accurate pictures of someone without their consent. Warren and
Brandeis (1890) also put forward the definition of privacy that to this day is used
most frequently; namely, the definition of privacy as the right “to be let alone”
(p. 205). They saw this right to privacy as one part of a larger right to be let alone,
which includes such rights as not to be assaulted, beaten, imprisoned, maliciously
prosecuted, and so forth. Although such privacy is a basic right that many authors
today still recognize (Britz, 1999; Velasquez, 1998), others argue that it is not a
basic right protected by the U.S. Constitution. While this argument was
developed in the U.S., similar views of privacy can be found in most countries,
usually codified by law. In some areas, notably the European Union, the
recognition of privacy goes beyond the negative right to merely be left alone and
extends to the positive right of informational self-determination. In the European
Union, privacy is recognized expressly as a fundamental human right (European
Union, 2000, Article 7). For now, however, we will continue to use the definition
of privacy as the right to be left alone, because this can be viewed as a generally
acceptable minimum standard.
Albeit widely recognized and generally understandable, this definition
produces several problems. First, it is based on a natural rights approach that is
hard to justify. Second, it is too broad to be of much practical use and does not
capture all of the meanings of the term that can be found today. The meanings
of privacy cover a diverse range from privacy as a situation, a right, a claim, to
privacy as a form of control or a value (Gavison 1995). Privacy is interlinked with
freedom and property. It can be defined in part as “the freedom to do things away
from the eyes and ears of others” (Weckert & Adeney 1997, p. 76). Privacy is
invaded when “individuals are unable to control their interactions with the social
and physical environment” (Culnan 1993, p. 344).
Copyright © 2005, Idea Group Inc. Copying or distributing in print or electronic forms without written
permission of Idea Group Inc. is prohibited.
TEAM LinG
192 Stahl
There are different reasons why privacy has gained importance over the
last decades. The first one, which is probably the most important in the context
of this chapter, is the impact that information and communication technology
(ICT) has. ICT has not changed the fact that data about persons are collected,
processed, and exchanged. However, it has changed fundamentally the speed
and scope in which this can be done. It has changed the mobility of data; as Moor
(2000) puts it, ICT has “greased” the data. The result of this is that on the one
hand, more data than ever before are collected on individuals, while on the other
hand, these individuals have less control over what happens with these data than
ever before. The availability of ICT also facilitates the creation of synergies and
the exchange of data in ways that have the potential to affect people’s lives
deeply. One example might be genetic data that can be used to create information
about health risks. This could be linked to employers’ or insurance companies’
databases with the effect that individuals lose their employment or are unable to
acquire insurance coverage. Such examples easily can be continued, and they
show that privacy has a deep impact on the role of individuals in society, on rights
and obligations, and on the way we interact on ethical matters. This is why
privacy is such a frequently discussed topic in computer and information ethics
(Anderson et al. 1993; Johnson, 2001; Mason, 1986; Robison, 2000; Straub &
Collins 1990).
The technological development is linked and propelled by economic interests, and, as the previous example shows, the two combine to exacerbate the
privacy problem. While traditionally the state has been seen as the greatest threat
to privacy, especially in totalitarian states, today many authors see a bigger threat
coming from private enterprises that have the technical means and the economic
incentive to collect data and that are not regulated in the way actions by state and
government bodies and representatives often are (Himanen, 2001; Tavani,
2000). Again, this is not an entirely new development. The original American
legal codification of privacy by Warren and Brandeis already aimed at curbing
commercial interests that promoted the technical threats to privacy. However,
in modern, information-based economies, the incentives to collect data on
individuals are great, and regulations are diverse and frequently contradictory.
One other reason why the question of privacy is so complex is that it runs across
several societal fault-lines; it interferes with the grand discourses of liberalism
versus collectivism, freedom, and autonomy; and our societies do not seem to be
able to agree on a position with regard to these questions (van den Hoven, 1999).
Justifications of Privacy
Among the different strategies used to defend a right to privacy, one can
distinguish between absolute and relative ones. Privacy as an absolute right or
value is based on the assumption that it is a basic right comparable to human
rights, which must be defended independent of specific circumstances. Privacy
Copyright © 2005, Idea Group Inc. Copying or distributing in print or electronic forms without written
permission of Idea Group Inc. is prohibited.
TEAM LinG
Responsibility for Information Assurance and Privacy
193
is thus afforded the same status that human rights generally have, and some
authors believe that it, indeed, is a basic human right (Rogerson, 1998; Spinello,
1997). Moor (2000) offers a similar distinction by introducing intrinsic and
instrumental values. Intrinsic values are those that deserve to be defended,
whereas instrumental values are only valuable with regard to something else,
ultimately with regards to intrinsic values. One example of privacy as an intrinsic
value is put forward by Milberg et al. (1995), who see it as a “hypernorm”—a
moral rule that seems to be a human universal and that is generally recognized
and does not need further justification. (For a description of the idea of
hypernorms, see Donaldson & Dunfee, 1999)
Those authors who do not see privacy as an intrinsic value or as a basic
human right and who still agree that it is something worth protecting must show
reasons why it is, nevertheless, important. There are again two possible
strategies that can be found in the literature for doing so. On the one hand,
privacy is defended as important for the individual; on the other hand, it is
portrayed as crucial for society. To some extent, these strategies reflect a
deontological and a teleological ethical argument, respectively.
The individual approach emphasizes the importance of privacy for the
development and maintenance of the individual. Privacy has been described as
the “basis for self-determination, which is the basis for self-identity as we
understand it” (Severson, 1997, p. 65). That privacy is important for individual
development is in little doubt. Just why and how privacy is needed to become a
fully developed individual or person is less clear. There seem to be different
functions that privacy has in the process of developing individuality. Johnson
(2001), drawing on Fried, believes that friendship, intimacy, and trust need
privacy in order to develop. The generally shared assumption is that in order to
develop satisfactory relationships with others, one must have a place where the
other cannot follow, where one is sure to be alone. Without this type of control
over who has access to us and who knows what about us, we have difficulties
developing meaningful relationships (Rachels, 1995). One problem of the
intrusions of privacy through ICT can be that others not only have access to areas
that one may believe to be intimate, but they also have more information about
individuals than the individuals have themselves (Robison, 2000). In extreme
cases, the access that others can have to one’s information is presumed to be
enough not only to undermine one’s relationships with others, but also, in fact, to
jeopardize the identity or the inner self of the person in question (Brown, 2000).
Another aspect of privacy and the individual is that respect for the privacy of
others can be interpreted as respect for the other, per se; or, put negatively, a lack
of respect for privacy equals a lack of respect for the other (Elgesiem, 1996). For
proponents of these arguments, privacy is an instrumental value. However, its
importance for the intrinsic value behind it (i.e., personhood) is such that it seems
to become an intrinsic value itself. This means that it deserves being protected
as a basic right (Introna, 2000).
Copyright © 2005, Idea Group Inc. Copying or distributing in print or electronic forms without written
permission of Idea Group Inc. is prohibited.
TEAM LinG
194 Stahl
The other strand of arguments used to defend privacy as an instrumental
value aims at its social utility. In this line of reasoning, privacy is seen as valuable
for something that is useful from a social or societal point of view. Classically,
one can find the contention here that privacy is necessary for the collective
deliberation process that determines decision making in democracies. Johnson
(2001), for example, states the case that individuals who are constantly observed
are incapable of the essential processes necessary for democracy to work. In a
more general sense, privacy can be seen as part of the values that characterize
democratic societies. Privacy, in this respect, is an instrumental value, because
it contributes to the success of democracies (Gavison, 1995).
Limits and Problems of Privacy
Independent of the arguments used to defend privacy, most authors agree
that there are limits to the right and the protection of privacy (Britz, 1999).
“Privacy is a relative concept. It is a continuum” (Introna, 2000, p. 190). This can
be explained easily by looking at the two possible extremes of privacy—complete
privacy and complete lack of privacy. A complete lack of privacy would lead to
social and psychological problems explained by our apparently natural need for
an undisturbed space. However, if this space is brought to the opposite
extreme—complete privacy—the results would be equally negative. Social
institutions rely on information about the members of society. Complete privacy
would bring about a collapse of many social institutions (Gavison, 1995),
especially those institutions that exert constraints on people, such as military
conscription and the tax system. The resulting collapse of much of what defines
our societies would be hard to justify on the grounds of privacy protection.
Basically, we find ourselves now in a situation where the value of privacy
is recognized, but where it is quite unclear how this translates into specific
privacy protection measures. In the context of this chapter, it is important to note
that privacy is a moral notion that can be defended from most ethical viewpoints.
Many of the defenses of privacy discussed are based on utilitarian grounds.
Privacy protection is supposed to increase the individual’s utility by allowing the
individual to develop his or her personality to the maximum and to engage in
meaningful social interaction. At the same time, privacy maximizes social utility,
first by increasing individual utilities and second, by facilitating social interaction.
However, privacy can be justified just as easily by deontological arguments. One
can see privacy as an intrinsic value, which could be translated into the duty to
respect it. Another strategy would be to stress the importance privacy has for
allowing the development of individual autonomy. Personal autonomy is important from a deontological perspective, because it is the basis of setting one’s own
norms, which, in turn, is a central idea in Kantian (Kant, 1995) morality. Privacy
has a moral value, because it can be seen as a sign of respect for persons, which
again can be justified by teleological (i.e., aims-base, consequentialist) as well as
deontological (i.e., duty-based) ethical theories. Furthermore, respect for priCopyright © 2005, Idea Group Inc. Copying or distributing in print or electronic forms without written
permission of Idea Group Inc. is prohibited.
TEAM LinG
Responsibility for Information Assurance and Privacy
195
vacy also can be seen as a virtue, which puts it squarely into the realm of virtue
ethics.
Privacy is thus a moral value or a moral right, and it is worth defending.
However, like most moral rights and values, it is not absolute. Philosophical
ethics have always had to deal with the question of how to limit moral rights and
what to do in case of a conflict of different rights. In many cases, moral rights
deemed significant within society are transformed into legal rights. Privacy is no
exception. The question of the limits of a moral right then becomes the question
of the limit of a legal right. While this sort of question often is solved more easily
in practical terms, due to the existence of a hierarchy of courts that gives us
practical solutions, privacy still raises a lot of questions when one looks for its
exact extent and limits.
Some of the limits of privacy are fundamental and closely related to the
justification of the term. If privacy gives individuals freedom to interact and to
do what they want without detection, then it also gives them freedom to do
undesirable things (i.e., commit crimes, do terrorist acts, etc.). Levy (1995),
therefore, can ask whether we can protect our privacy in an age of computers
“without also protecting the dark forces in society” (p. 652). A somewhat less
apocalyptic problem that can be raised by privacy is that of intellectual property.
Some authors suggest the framing of privacy in terms of property. That means
that information about a person is seen as that person’s property, and, consequently, the person gets to decide what to do with it (Hunter, 1995). Unfortunately this does not solve the problem either, because it remains questionable
whether personal information can be described usefully in terms of property, and,
even if this were agreed uppon, it would change the problem to the question of
the limits of personal property.
Apart from these fundamental problems that most individuals would be
hard-pressed to address, there are also many practical problems with privacy
protection. We have seen that privacy can be described as a right, but the status
of the right remains open. Is privacy a moral or a legal right, and what is the
relationship between the two? In most societies, a right to privacy is recognized
by the legal system, either explicitly or implicitly. However, as soon as we enter
the sphere of legal rights, we are confronted with a whole new set of problems.
Given the international nature of the information technology that threatens
privacy, we find a host of international questions such as jurisdiction and cultural
and language difficulties. One problem in this regard results from the different
perceptions of privacy between the U.S. and Europe. These differences go deep
enough to endanger data exchange between the two areas (Langford, 1999;
Tavani, 2000). The EU follows a strong privacy protection regime and outlaws
transborder data exchange with countries that do not guarantee the same level
of protection. Given that the U.S. has weaker privacy protection, complicated
arrangements have been set up to facilitate data exchange.
Copyright © 2005, Idea Group Inc. Copying or distributing in print or electronic forms without written
permission of Idea Group Inc. is prohibited.
TEAM LinG
196 Stahl
Having now discussed the ethical aspects of information assurance, privacy, and their justifications and limits, we can proceed to the difficult question
of their relationship with regard to ethics.
The Relationship of Information Assurance and Privacy
from and Ethical Viewpoint
Information assurance and privacy can reinforce one another, but they can
also come into conflict. This section will discuss these two possibilities while
emphasizing the way in which this may affect moral rights or obligations.
Ethical Correspondences of Information Assurance and Privacy
Information assurance and privacy can correspond and thereby jointly
protect or even constitute moral values. Both terms can refer to the concept of
security. Information assurance in this text is understood as the attempt to
increase the security of the use of ICT on different levels. This more technical
view of security can be seen as a precondition of a more personal psychological
concept of security. Human beings need security in an emotional sense, which
means that they need to feel secure. Technical and personal security can support
this feeling of security, but they do not have to be. One can feel secure because
one is not aware of the danger, and one can feel insecure despite an “objective”
lack of threats. However, objective technical security can be translated easily
into personal security. Most people will feel more secure in a modern car with
all sorts of active and passive security measures than in an older one that lacks
these measures. Similarly, information assurance is a precondition for feeling
secure when interacting with computers (Spafford, 1995). It is this feeling of
security, this psychological security, that was cited as one of the main reasons
that privacy should be defended. Security, therefore, is probably the most
important area where information assurance and privacy overlap, and where, at
the same time, they protect an important moral value—the individual and its
formation (Moor, 2000). Drawing on Giddens and Goffman, Brown calls this a
“‘protective cocoon’ which allows individuals to deal with life on a daily basis and
protect the inner self they know from exposure to outside scrutiny. This ‘veil’
separates self from those things that are external and therefore not self, in this
manner providing the most basic sense of ontological security” (Brown, 2000, p.
63) Technical security is thus necessary to produce privacy. An example would
be so-called privacy-enhancing technologies (PETs), and the most fundamental
of these is encryption, which simultaneously promotes privacy and security
(Tavani & Moor, 2001).
A related area where privacy and security work to achieve a shared goal,
which is generally recognized as an ethical value, is that of trust. Many authors
emphasize that in order to develop trust, an individual needs physical security as
well as privacy. Again, this is based on assumptions about the working of the
Copyright © 2005, Idea Group Inc. Copying or distributing in print or electronic forms without written
permission of Idea Group Inc. is prohibited.
TEAM LinG
Responsibility for Information Assurance and Privacy
197
human mind, which needs a feeling of security and a feeling of individuality in
order to interact meaningfully with others (Koehn, 2001). The dependence of
trust on privacy and security is a prevalent topic of discussion in e-commerce.
A lack of trust has been identified as one of the major impediments to the
continued success of online trading. Many individual customers are reluctant to
buy or sell online because they do not trust the procedures. The reasons for this
are manifold, but most authors agree that they can be found at least partly in the
areas of security and privacy (Hoffman, Novak, & Peralta, 1999; Nikander &
Karvonen, 2000; Khare & Rifkin, 1998).
Another angle under which the affinity of privacy and security can be
captured is that of control. For individuals to be in control of their lives, a certain
amount of control over what is happening to them and with them is indispensable.
This control can be interpreted in terms of security, which means that the
individual can prevent unwanted intrusion. This sort of control then automatically
entails a degree of privacy (Camp, 2001). Again, control in this sense can be seen
as a moral value, because it is a sign of the autonomy of the individual that we
have identified as ethically important.
Ethical Contradictions of Information Assurance and Privacy
While security and privacy can overlap, as we have seen in the last section,
they also can be contradictory. As a general point, one can note that security
requires openness, clarity, and accountability, whereas privacy often means the
opposite (Beu & Buckley, 2001). Privacy and security can come into conflict in
different areas. One example that can be used to demonstrate the possible
contradiction is trust. While we have argued that trust requires privacy and
security at the same time, the relationship also can be contradictory. One
argument along this line is that security can limit the exchange of ideas, and that
this free exchange is one of the basic building blocks of the computer community.
An increase in security thus means a decrease in free speech and consequentially a decrease in trust (Rotenberg, 1995). Other authors argue that the entire
trust issue is misleading, because it is based on fallacious premises. A large part
of the literature on trust in e-commerce, for example, tries to show ways that can
be followed in order to build trustworthy information systems. Critics of this
approach argue that one cannot trust technology; one can only trust people. More
security, therefore, cannot induce trust (Rutter, 2001; Corbato, 1995).
Another area where security and privacy may be contradictory is that of
power. Especially with regard to hierarchical organizations, both of these terms
can be seen as an expression of power of particular groups or individuals. In this
setting, security usually means control over access and use of systems, and in
many cases, this will be in contradiction to the power to protect one’s privacy
(Forester & Morrison, 1994). The expression of such conflicts often can be seen
in more technical issues that are needed to implement security or privacy
Copyright © 2005, Idea Group Inc. Copying or distributing in print or electronic forms without written
permission of Idea Group Inc. is prohibited.
TEAM LinG
198 Stahl
concerns. Examples of this are biometrics or encryption. Both of these technologies increasingly are used to secure data and information systems, and both also
can be interpreted as tools that have the potential to decrease privacy. While
biometrical protection of one’s personal data and files may increase one’s
privacy, it also can serve to identify a person more clearly and to use this data
for other purposes (van der Ploeg, 2001).
The most important area of conflict between security and privacy, however,
is that of surveillance, especially the surveillance of employees by organizations.
All of the arguments mentioned in this section apply to this, but the topic acquires
its importance due to the sheer magnitude of surveillance in today’s societies.
While there are important national differences in this area, it is probably true to
say that most commercial organizations have rather strong incentives to subject
their employees to surveillance, and the practice is widespread (Hartman, 2001;
Schulman, 2000; Bowie, 1999). The reasons for this differ among companies,
industries, and countries, but most of them have something to do with information
assurance. The rationale for surveillance usually is to produce security for the
company in some sense, be it for legal problems (Brown, 2000), competition, or
other economic considerations such as making sure that employees do their job
(Boncella, 2001; Posner, 1995). The price to be paid is a decrease in employee
privacy. It is in this situation—the surveillance of employees in their workplaces—that the problematic relationship between security and privacy becomes
most clear, and the question of ethical problems and of individual decision making
is most salient. It is, therefore, a good starting point for the discussion of how
these questions can be addressed. Since the proposed solution in this chapter is
the concept of responsibility, we now will look at how individuals can make
responsible decisions regarding the tension of privacy and information assurance.
RESPONSIBILITY AS AN ANSWER TO
ETHICAL PROBLEMS
So far, this chapter has argued that security and information assurance and
privacy are terms with important ethical aspects, but that their relationship is
problematic. Individual and organizational decisions with regard to the two
concepts will affect people’s rights and obligations in most cases, but it is usually
unclear exactly how this will be the case. The ethical evaluation of such decisions
depends on a highly opaque muddle of ethical theories, moral practices, empirical
consequences, legal frameworks, international negotiations, and so forth. One
ethical concept that is used frequently to address such muddles is responsibility.
This section will describe briefly the concept of responsibility, emphasizing the
individual perspective. By concentrating on the conditions of responsibility, it will
Copyright © 2005, Idea Group Inc. Copying or distributing in print or electronic forms without written
permission of Idea Group Inc. is prohibited.
TEAM LinG
Responsibility for Information Assurance and Privacy
199
be shown that responsibility, while in principle very useful for this sort of
situation, requires more than an individual is able to deliver.
The Conditions of Responsibility
It will not be possible in this chapter to present a comprehensive overview
of the concept of responsibility and its use in moral philosophy. (For more
exhaustive theories of responsibility, see Bayertz, 1995; Fischer, 1999; French,
1992; Lenk, 1998; May & Hoffman, 1991; Neuberg, 1997; Paul et al., 1999;
Sänger, 1991; Stahl, 2004.) The discussion, therefore, will concentrate on the
subject of responsibility and the conditions a potential subject needs to fulfill in
order to be admissible as a subject. In order to do this, it will be necessary to give
a brief definition of the concept of responsibility.
In this chapter, responsibility will be understood as a social construct that
results in the ascription of an object to a subject, usually before an authority of
some kind. The most accessible example of this is the case of legal responsibility,
where the object is the crime, the subject is the accused, and the authority is
represented by the law and the judge who interprets it. Responsibility, understood
in this way, is a complex notion that, in order to be practically relevant, requires
attention to many details such as the acceptability of the underlying rules, the
temporal aspect of ascription, and the admissibility of the object. There are
several advantages to the concept of responsibility over other normative
constructs that let it appear as a suitable candidate to address the problems raised
by information assurance and privacy. Responsibility is a formal process that can
transport different meanings. That means that it is capable of addressing the legal
questions at the same time it deals with the moral and ethical ones. Furthermore,
responsibility, at least in its legal form, is well established. It also has a positive
image, and responsibility statements often are more acceptable than other moral
assertions.
The most important component of the responsibility ascription is the subject.
Traditionally, the subject has been the individual adult and rational human
being—the person. In order to be ascribed responsibility, the subject needs to
fulfill several conditions. The one that probably is most frequently named is that
of causality. In order to be ascribed responsibility for an object, the subject must
have a causal relationship with it, must have caused it or at least have been
capable of changing the course of events that led to the object (Bechtel, 1985;
Birnbacher, 1995; Etchegoyen, 1993; Goldman, 1999; Jonas, 1984; Zimmerli,
1987). This causality assumes several other conditions. In order to be able to
influence events, the subject must have knowledge of the consequences of
actions (Rötzer, 1998) and must have the power to change them (Lenk & Maring,
1990; Nida-Rümelin, 1998; Staddon, 1999). In order to be able to do this, the
subject needs to fulfill some more implicit conditions such as freedom (Höffe,
1995; Frankfurt, 1997; Wunenburger, 1993) and personal qualities such as
Copyright © 2005, Idea Group Inc. Copying or distributing in print or electronic forms without written
permission of Idea Group Inc. is prohibited.
TEAM LinG
200 Stahl
emotions, empathy, a certain amount of rationality, a certain state of mind, and
so forth (Bierhoff, 1995; Hart, 1968; Stocker, 1999). Some of these assumptions
and conditions are quite difficult to come to terms with, as the example of the
concept of freedom shows. Freedom is a highly contentious topic in philosophy,
and it is not clear exactly what it is, whether it is possible, and how it relates to
responsibility (Wallace, 1996).
The Limits of Individual Responsibility in Privacy and
Information Assurance
The previous discussion of the conditions of responsibility should have made
it clear that it is very hard for an individual, as the traditional subject of
responsibility, to live up to the expectations, even in rather simple cases. While
humans usually fulfill the personal qualities such as awareness, intentionality, and
emotions, they are hard pressed fulfilling all of them simultaneously. In the
context of complex sociotechnical systems that are the center of attention in this
chapter, individuals generally fail to have the necessary knowledge, freedom,
and power to change events. They may play a role in the causality but are often
unable to change causalities, even if they are aware of them. This has led to a
weakening of the role of the individual as the subject of responsibility, and even
to the perception that there is a loss of the subject (Hubig, 1995a; Hubig, 1995b;
Kaufmann, 1992).
In order to clarify the difficulties that individuals have as subjects of
responsibility, let us return to the problem at hand, which is ethical responsibility
for information systems with regard to security and privacy. Let us take a look
at one typical example of this—a manager who has to make a decision regarding
the introduction of a system that monitors employees’ Internet use. In order for
the social construct of responsibility ascription to be successful and acceptable,
the manager would have to fulfill the conditions. First, the manager would have
to play a part in the causal chain of events. This condition is met due to the
realities of the case. Second, the manager would have to possess the freedom
to influence events according to his or her own free will. Disregarding the
philosophical problems of freedom and free will, we will grant this. By definition,
the manager also does fulfill the third set of conditions; namely, those referring
to personhood. Unfortunately, however, the manager lacks the remaining
capabilities that would render him or her a suitable responsibility subject. In order
for the manager to be a proper subject, the manager would have to know the
situation well enough to estimate all of the relevant factors and developments.
This is practically impossible since the manager does not know all of the
stakeholders’ views, which is principally impossible because the development
stretches into the unknown future.
Furthermore, the manager not only would have to know the objective facts,
but also would have to know their normative evaluation. That means the manager
Copyright © 2005, Idea Group Inc. Copying or distributing in print or electronic forms without written
permission of Idea Group Inc. is prohibited.
TEAM LinG
Responsibility for Information Assurance and Privacy
201
would have to know not only the laws but also the moral norms of the affected
parties, and the manager would have to know how to interpret and reconcile
these in case of a conflict. This discussion of the complex ethical relationship
between security and privacy has shown that the knowledge necessary to be a
competent subject is complex and distributed. It seems quite impossible for any
one subject to have it at his or disposal. But even if it were available, it would be
impossible for an individual to reconcile all of the potential contradictions and
feedback loops and to come to a decision that is responsible in the sense that it
is sustainable and attributable to the individual. If this is true, and if individuals,
even under the best of circumstances, will not be able to act as subjects of
responsibility in light of the ethical problems of security and privacy, where does
this leave us?
WHAT ABOUT THE END USER?
The purpose of this chapter is to show that information assurance and
privacy are concepts of high ethical importance; their relationship with each
other and with ethics is highly complex. The chapter analyzed the theory of
responsibility and argued that, despite some advantages of the notion, it runs into
serious difficulties when applied to the complex ethical questions relating to
privacy and information assurance. The one specific problem that was discussed
in more depth was that of the individual subject of responsibility. It was argued
that an individual lacks some of the crucial conditions necessary for a successful
ascription of responsibility. This allows us to give an answer to the question posed
in the title of the chapter: The combination of information assurance and privacy
is something that cannot be addressed successfully by individual ethics, at least
not by individual ethics as expressed by the concept of responsibility.
Where does all of this leave the end user who reads this chapter? There are
different possible answers to this. The message of the chapter should not be
misconstrued as meaning that there is no place for individual responsibility in the
normative muddle of security and privacy, and it also should not be misunderstood as a blanket excuse for individuals to do as they like. Given the severity of
the problem and its importance for organizational and social life, however, the
chapter leads to the conclusion that it would be irresponsible to rely on the
individual, who is not equipped to deal with questions of this sort. The argument
in this chapter, therefore, can be used by end users as an explanation of their
incapacity to accept individual responsibility for the complex social relationships
within privacy and information assurance. Going back to the example of the
manager who is asked to introduce a surveillance system for Internet use, a
manager could use this chapter to demonstrate his or her limits in the capacity
as a responsibility subject. This does not mean that the manager should go back
to his or her manager and refuse to do the job. Instead, the reflection on the
Copyright © 2005, Idea Group Inc. Copying or distributing in print or electronic forms without written
permission of Idea Group Inc. is prohibited.
TEAM LinG
202 Stahl
concept of responsibility would allow the manager to clearly state what he or she
is capable of doing and not doing. Furthermore, it would allow the manager to
indicate a way of dealing with the problem. Realizing the manager’s lack of
information about the affected people’s views of norms regarding Internet use,
the concept of responsibility introduced here would provide a framework for
determining how to get this information. This means that the manager might
devise specific or new processes that would allow the retrieval of the information. In this way, the manager might meet the expectations or requirements of
information assurance as well as privacy considerations.
This raises several other issues. If the analysis of the problem is correct, and
if ethics is involved in our topic, then the individual is not a promising starting point
from which to look for solutions. Thus, we have to ask how the problems can be
addressed. This question aims at directing the reader’s attention to the idea of
collective responsibility. I believe that the concept of responsibility offers the
promise to be able to address the problem. This would be possible by transcending the traditional definition of the individual human being as the sole possible
subject and by allowing more complex and collective ascriptions. This approach
raises several new questions (e.g., whether collectives can be moral subjects),
but it allows for the extension of the term. While individuals generally lack power
and knowledge in complex situations, the same is not necessarily true for
collectives. This argument for the extension of the concept of responsibility has
been made before (French, 1992; Werhane, 1985) and, in some respects, is
generally recognized already. If we were to agree that it is possible to address
the ethical problems of security and privacy by extending the concept of
responsibility, this again would raise many new questions and require us to
collectively agree on the applicable norms, the problems in question, institutions
of ascription, and sanctions.
Again, this is an area where the individual end user is concerned. If
collective responsibility is to be successful, then even a superficial view indicates
that it is to be connected with individual responsibility. It will be the responsibility
of individuals to participate in the discourses and processes that define suitable
collectives as subjects as well as potential sanctions, or mechanisms of attribution. Furthermore, there must be a structure that allows the drawing of
conclusions from individual to collective responsibility and vice versa. All of
these are aspects that individuals should keep in mind, and where end users can
and must play a central role.
The essential message of the chapter is, thus, that individual responsibility
plays an important role in the relationship of information assurance and privacy.
At the same time, it cautions that concentrating exclusively on the individual as
the responsible agent is easier than going down the long and stony way to
collective responsibility but, as I have tried to show in this chapter, is not very
promising and, thus, irresponsible.
Copyright © 2005, Idea Group Inc. Copying or distributing in print or electronic forms without written
permission of Idea Group Inc. is prohibited.
TEAM LinG
Responsibility for Information Assurance and Privacy
203
REFERENCES
Anderson, R.E., Johnson, D.G., Gotterbarn, D., & Perrolle, J. (1993). Using the
new ACM code of ethics in decision making. Communications of the
ACM, 36(2), 98-106.
Bayertz, K. (Ed.) (1995). Verantwortung: Prinzip oder Problem? Darmstadt,
Germany: Wissenschaftliche Buchgesellschaft.
Bechtel, W. (1985, October). Attributing responsibility to computer systems.
Metaphilosophy, 16(4), 296-305.
Beu, D., & Buckley, M.R. (2001). The hypothesized relationship between
accountability and ethical behavior. Journal of Business Ethics, 34, 5773.
Bierhoff, H.W. (1995). Verantwortungsbereitschaft, Verantwortungsabwehr
und Verantwortungszuschreibung—Sozialpsychologische Perspektiven. In
K. Bayertz (Ed.), Verantwortung: Prinzip oder Problem? (pp. 217-240).
Darmstadt, Germany: Wissenschaftliche Buchgesellschaft.
Birnbacher, D. (1995). Grenzen der Verantwortung. In K. Bayertz (Ed.),
Verantwortung: Prinzip oder Problem? (pp. 143-183). Darmstadt, Germany: Wissenschaftliche Buchgesellschaft.
Boncella, R.J. (2001). Internet privacy—At home and at work. Communications of the Association for Information Systems, 7, 1-28.
Bowie, N.E. (1999). Business ethics—A Kantian perspective. Oxford:
Blackwell.
Britz, J.J. (1999). Ethical guidelines for meeting the challenges of the information
age. In L.J. Pourciau (Ed.), Ethics and electronic information in the 21st
century (pp. 9-28). West Lafayette, IN: Purdue University Press.
Brown, W.S. (2000). Ontological security, existential anxiety and workplace
privacy. Journal of Business Ethics, 23, 61-65.
Camp, L.J. (2001). Web security and privacy: An American perspective. In
R.A. Spinello, & H.T. Tavani (Eds.), Readings in cyberethics (pp. 474486). Sudbury, MA: Jones and Bartlett.
Culnan, M.J. (1993). How did they get my name? An exploratory investigation
of consumer attitudes toward secondary information use. MIS Quarterly,
17(3), 341-363.
Donaldson, T., & Dunfee, T.W. (1999). Ties that bind: A social contracts
approach to business ethics. Boston: Harvard Business School Press.
Eisenberg, T. et al. (1995). The computer worm: A report to the provost of
Cornell University on an investigation conducted by the Commission of
Preliminary Enquiry. In D.G. Johnson, & H. Nissenbaum (Eds.), Computers,
ethics & social values (pp. 60-89). Upper Saddle River, NJ: Prentice Hall.
Elgesiem, D. (1996). Privacy, respect for persons, and risk. In C. Ess (Ed.),
Philosophical perspectives on computer-mediated communication (pp.
45-66). Albany, NY: State University of New York Press.
Copyright © 2005, Idea Group Inc. Copying or distributing in print or electronic forms without written
permission of Idea Group Inc. is prohibited.
TEAM LinG
204 Stahl
Etchegoyen, A. (1993). Le temps des responsables. Paris: Editions Julliard.
European Union (2000). Charter of fundamental rights of the European Union
(2000/C 364/01). Europarl. Retrieved January 13, 2004, from http://
www.europarl.eu.int/charter/default_en.htm
Fischer, J.M. (1999). Recent work on moral responsibility. Ethics, 110(1), 93-139.
Forester, T., & Morrison, P. (1994). Computer ethics—Cautionary tales and
ethical dilemmas in computing. Cambridge, MA/London: MIT Press.
Frankfurt, H.C. (1997). Partis contraires et responsabilité morale. In M.
Neuberg (Ed.), La responsabilité—Questions philosophiques (pp. 5564). Paris: Presses Universitaires de France.
Frankfurt, H.G. (1969). Alternate possibilities and moral responsibility. Journal
of Philosophy, LXVI, 828-839.
French, P.A. (1992). Responsibility matters. Lawrence, Kansas: University
Press of Kansas.
Gavison, R. (1995). Privacy and limits of law. In D.G. Johnson, & H. Nissenbaum
(Eds.), Computers, ethics & social values (pp. 332-351). Upper Saddle
River, NJ: Prentice Hall.
Goldman, A.I. (1999). Why citizens should vote: A causal responsibility approach. In E.F. Paul, F.D. Miller, & J. Paul (Eds.), Responsibility (pp. 201217). Cambridge, MA: Cambridge University Press.
Grabner-Kräuter, S. (2002). The role of consumers’ trust in online-shopping.
Journal of Business Ethics, 39, 43-50.
Hart, H.L.A. (1968). Punishment and responsibility—Essays in the philosophy of law. Oxford: Clarendon Press.
Hartman, L. (2001). Technology and ethics: Privacy in the workplace. Business
and Society Review, 106(1), 1-27.
Healy, M., & Iles, J. (2002). The impact of information and communications
technology on managerial practices: The use of codes of conduct. In I.
Alvarez et al. (Eds.), The transformation of organisations in the
information age: Social and ethical implications. Proceedings of the
Sixth ETHICOMP Conference, November 13-15, 2002, Lisbon, Portugal.
Himanen, P. (2001). The hacker ethic and the spirit of the information age.
London: Secker & Warburg.
Höffe, O. (1995). Moral als Preis der Moderne: Ein Versuch über
Wissenschaft, technik und umwelt. Frankfurt a. M.: Suhrkamp.
Hoffman, D.L., Novak, T.P., & Peralta, M. (1999). Building consumer trust
online. Communications of the ACM, 42(4), 80-87.
Hubig, C. (1995a). Verantwortung und Hochtechnologie. In K. Bayertz (Ed.),
Verantwortung: Prinzip oder Problem? (pp. 98-139). Darmstadt, Germany: Wissenschaftliche Buchgesellschaft.
Hubig, C. (1995b). Technik- und Wissenschaftsethik. Berlin/Heidelberg, NY:
Springer Verlag.
Copyright © 2005, Idea Group Inc. Copying or distributing in print or electronic forms without written
permission of Idea Group Inc. is prohibited.
TEAM LinG
Responsibility for Information Assurance and Privacy
205
Hunter, L. (1995). Public image. In D.G. Johnson, & H. Nissenbaum (Eds.),
Computers, ethics & social values (pp. 293-299). Upper Saddle River,
NJ: Prentice Hall.
IASE (2003). Information assurance support environment. IASE. Retrieved
April 8, 2003, from http://iase.disa.mil/
Introna, L. (2000). Privacy and the computer—Why we need privacy in the
information society. In R.M. Baird, R. Ramsower, & S.E. Rosenbaum
(Eds.), Cyberethics— Social and moral issues in the computer age (pp.
188-199). New York: Prometheus Books.
Johnson, D.G. (2001). Computer ethics. Upper Saddle River, NJ: Prentice Hall.
Jonas, H. (1984). Das Prinzip Verantwortung. Frankfurt a. M.: Suhrkamp.
Kant, I. (1995). Kritik der praktischen Vernunft/Grundlegung zur Metaphysik
der Sitten. Frankfurt a. M.: Suhrkamp.
Kaufmann, F.-X. (1992). Der Ruf nach Verantwortung. Freiburg im Breisgau:
Herder.
Khare, R., & Rifkin, A. (1998). Trust management on the World Wide Web.
First Monday, 3(6). Retrieved February 21, 2005 from http://www.first
monday.org/issues/issue3_6/khare/index.html
Koehn, D. (2001). Ethical challenges confronting businesses today. Proceedings of the 11th International Symposium on Ethics, Business and
Society, Barcelona, Spain.
Langford, D. (1999). Business computer ethics. Harlow, UK: Addison-Wesley.
Lenk, H. (1998). Konkrete Humanität: Vorlesungen über Verantwortung
und Menschlichkeit. Frankfurt a. M.: Suhrkamp Verlag.
Lenk, H., & Maring, M. (1990). Verantwortung und soziale Fallen. Ethik und
Sozialwissenschaften, 1, 49.
Levy, S. (1995). Battle of the clipper chip. In D.G. Johnson, & H. Nissenbaum
(Eds.), Computers, ethics & social values (pp. 651-664). Upper Saddle
River, NJ: Prentice Hall.
Littlewood, B., & Stringy, L. (1995). The risks of software. In D.G. Johnson, &
H. Nissenbaum (Eds.), Computers, ethics & social values (pp. 432-437).
Upper Saddle River, NJ: Prentice Hall.
Mason, R.O. (1986). Four ethical issues of the information age. MIS Quarterly,
10, 5-12.
May, L., & Hoffman, S. (Eds.). Collective responsibility: Five decades of
debate in theoretical and applied ethics. Savage, MD: Rowman &
Littlefield Publishers Inc.
Milberg, S., Burke, S., Smith, H.J., & Kallman, E. (1995). Values, personal
information, privacy, and regulatory approaches. Communications of the
ACM, 38(12), 65-74.
Moor, J.H. (2000). Toward a theory of privacy in the information age. In R.M. Baird,
R. Ramsower, & S.E. Rosenbaum (Eds.), Cyberethics—Social and moral
issues in the computer age (pp. 200-212). New York: Prometheus Books.
Copyright © 2005, Idea Group Inc. Copying or distributing in print or electronic forms without written
permission of Idea Group Inc. is prohibited.
TEAM LinG
206 Stahl
Neuberg, M. (Ed.) (1997). La responsabilité—Questions philosophiques.
Paris: Presses Universitaires de France.
NIAP (2003). About NIAP. Retrieved April 7, 2003, from http://niap.nist.gov/
Nida-Rümelin, J. (1998). Über den Respekt vor der Eigenverantwortung des
Anderen. In B. Neubauer (Ed.), Eigenverantwortung: Positionen und
Perspektiven. Waake, Germany: Licet Verlag.
Nikander, P. & Karvonen, K. (2000). Users and trust in cyberspace. Cambridge Security Protocol Workshop 2000, Cambridge, UK.
Paul, E.F., Miller, F.D., & Paul, J. (Eds.) (1999). Responsibility. Cambridge,
MA: Cambridge University Press.
Posner, R.A. (1995). An economic theory of privacy. In D.G. Johnson, & H.
Nissenbaum (Eds.), Computers, ethics & social values (pp. 358-366).
Upper Saddle River, NJ: Prentice Hall.
Rachels, J. (1995). Why privacy is important. In D.G. Johnson, & H. Nissenbaum
(Eds.), Computers, ethics & social values (pp. 351-357). Upper Saddle
River, NJ: Prentice Hall.
Robison, W.L. (2000). Privacy and appropriation of identity. In G. Collste (Ed.),
Ethics in the age of information technology (pp. 70-86). Linköping,
Sweden: Centre for Applied Ethics.
Rogerson, S. (1998). Ethical aspects of information technology—Issues for
senior executives. London: Institute of Business Ethics.
Rotenberg, M. (1995). Computer virus legislation. In D.G. Johnson, & H.
Nissenbaum (Eds.), Computers, ethics & social values (pp. 135-147).
Upper Saddle River, NJ: Prentice Hall.
Rotenberg, M. (1998). Communications privacy: Implications for network design.
In R.N. Stichler, & R. Hauptman (Eds.), Ethics, information and technology: Readings (pp. 152-168). Jefferson, NC: MacFarland & Company.
Rötzer, F. (1998). Eigenverantwortung in komplexen Systemen und als komplexes
System. In B. Neubauer (Ed.), Eigenverantwortung: Positionen und
Perspektiven. Waake, Germany: Licet Verlag.
Rutter, J. (2001). From the sociology of trust towards a sociology of “e-trust.”
International Journal of New Product Development & Innovation
Management, 2(4), 371-385.
Sänger, M. (Ed.). Arbeitstexte für den Unterricht: Verantwortung. Stuttgart,
Germany: Philipp Reclam jun.
Schulman, M. (2000). Littlebrother is watching you. In R.M. Baird, R. Ramsower,
& S.E. Rosenbaum (Eds.), Cyberethics—Social and moral issues in the
computer age (pp. 155-161). New York: Prometheus Books.
Severson, R.J. (1997). The principles of information ethics. Armonk, NY/
London: M.E. Sharpe.
Sipior, J.C., & Ward, B.T. (1995). The ethical and legal quandary of email
privacy. Communications of the ACM, 38(12), 48-54.
Copyright © 2005, Idea Group Inc. Copying or distributing in print or electronic forms without written
permission of Idea Group Inc. is prohibited.
TEAM LinG
Responsibility for Information Assurance and Privacy
207
Spafford, E.H. (1995). Are computer hacker break-ins ethical? In D.G. Johnson,
& H. Nissenbaum (Eds.), Computers, ethics & social values (pp. 125134). Upper Saddle River, NJ: Prentice Hall.
Spinello, R. (1997). Case studies in information and computer ethics. Upper
Saddle River, NJ: Prentice Hall.
Staddon, J. (1999). On responsibility in science and law. In E.F. Paul, F.D.
Miller, & J. Paul (Eds.), Responsibility (pp. 146-174). Cambridge, MA:
Cambridge University Press.
Stahl, B.C. (2004). Responsible management of information systems. Hershey,
PA: Idea Group Publishing.
Stocker, M. (1999). Responsibility and the abuse excuse. In E.F. Paul, F.D.
Miller, & J. Paul (Eds.), Responsibility (pp. 175-200). Cambridge, MA:
Cambridge University Press.
Straub, D.W., & Collins, R.W. (1990). Key information liability issues facing
managers: Software piracy, proprietary databases, and individual rights to
privacy. MIS Quarterly, 14.
Tavani, H. (2000). Privacy and security. In D. Langford (Ed.), Internet ethics
(pp. 65-89). London: McMillan.
Tavani, H.T., & Moor, J.T. (2001). Privacy protection, control of information,
and privacy-enhancing technologies. In R.A. Spinello, & H.T. Tavani
(Eds.), Readings in cyberethics (pp. 378-391). Sudbury, MA: Jones and
Bartlett.
van den Hoven, M.J. (1999). Privacy or informational injustice? In L.J. Pourciau
(Ed.), Ethics and electronic information in the 21st century (pp. 139150). West Lafayette, IN: Purdue University Press.
van der Ploeg, I. (2001). Written on the body: Biometrics and identity. In R.A.
Spinello, & H.T. Tavani (Eds.), Readings in cyberethics (pp. 501-514).
Sudbury, MA: Jones and Bartlett.
Velasquez, M. (1998). Business ethics: Concepts and cases. Upper Saddle
River, NJ: Prentice Hall.
Wallace, R.J. (1996). Responsibility and the moral sentiment. Cambridge,
MA/London: Harvard University Press.
Warren, S.D., & Brandeis, L.D. (1890). The right to privacy. Harvard Law
Review, 5, 193-220.
Weckert, J., & Adeney, D. (1997). Computer and information ethics. Westport,
CT/London: Greenwood Press.
Werhane, P. (1985). Persons, rights, and corporations. Englewood Cliffs, NJ:
Prentice-Hall.
Wunenburger, J.-J. (1993). Questions d’éthique. Paris: Presses Universitaires
de France, PUF.
Zimmerli, W.C. (1987). Wandelt sich die Verantwortung mit dem technischen
Wandel? In H. Lenk, & G. Ropohl (Eds.), Technik und Ethik (pp. 92-111).
Stuttgart: Philipp Reclam jun.
Copyright © 2005, Idea Group Inc. Copying or distributing in print or electronic forms without written
permission of Idea Group Inc. is prohibited.
TEAM LinG
208 Jones and Price
Chapter XI
Organizational Knowledge
Sharing in ERP
Implementation:
Lessons from Industry
Mary C. Jones, University of North Texas, USA
R. Leon Price, University of Oklahoma, USA
ABSTRACT
This study examines organizational knowledge sharing in enterprise
resource planning (ERP) implementation. Knowledge sharing in ERP
implementation is somewhat unique, because ERP requires end users to
have more divergent knowledge than is required in the use of traditional
systems. Because of the length of time and commitment that ERP
implementation requires, end users also are often more involved in ERP
implementations than they are in more traditional ERP implementations.
They must understand how their tasks fit into the overall process, and they
must understand how their process fits with other organizational processes.
Knowledge sharing among organizational members is one critical piece of
ERP implementation, yet it is challenging to achieve. There is often a large
gap in knowledge among ERP implementation personnel, and people do not
easily share what they know. This study presents findings about
organizational knowledge sharing during ERP implementation in three
firms. Data were collected through interviews using a multi-site case study
methodology. Findings are analyzed in an effort to provide a basis on
Copyright © 2005, Idea Group Inc. Copying or distributing in print or electronic forms without written
permission of Idea Group Inc. is prohibited.
TEAM LinG
Organizational Knowledge Sharing in ERP Implementation
209
which practitioners can facilitate knowledge sharing more effectively
during ERP implementation.
INTRODUCTION
Enterprise resource planning (ERP) is a strategic tool that helps companies
gain a competitive edge by streamlining business processes, integrating business
units, and providing organizational members greater access to real-time information. Many firms are using ERP systems to cut costs, standardize operations, and
leverage common processes across the organization. ERP allows firms to have
a more convergent view of their information by integrating processes across
functional and divisional lines using a centralized database and integrated sets of
software modules (Scott & Kaindl, 2000; Zheng et al., 2000).
However, the convergence that ERP affords at the organizational level
often results in a divergence of the knowledge required at the individual level
(Baskerville et al., 2000). ERP imposes a new framework on the organization
(Robey et al., 2002). It requires end users to have broader knowledge than is
required in the use of traditional systems. They must understand how their tasks
fit into the overall process and how their process fits with other organizational
processes (Lee & Lee, 2000). Thus, knowledge sharing is one critical piece of
ERP implementation. During implementation, an organization begins to build the
foundation on which end users can understand enough about the ERP framework
to realize its benefits (Robey et al., 2002). Because of the time commitments and
the extensive knowledge sharing that must take place during ERP implementation, end users often are more involved in the implementation than they are in
more traditional implementations. In some cases, ERP implementations are
managed and led by end users and end-user managers, and IT staff serves
primarily as technical advisors (Jones, 2001). Unfortunately, there is usually a
significant gap in knowledge among these implementation personnel, and people
do not easily share what they know (Constant et al., 1994; Jarvenpaa & Staples,
2000; Osterloh & Frey, 2000; Soh et al., 2000).
This study was undertaken to examine how firms ensure that organizational
knowledge is shared during ERP implementations. One objective is to identify
facilitators of organizational knowledge sharing. Another is to synthesize findings into lessons about knowledge sharing during implementation that other firms
can apply in their own ERP implementations.
THEORETICAL BACKGROUND
Knowledge sharing in ERP implementation is somewhat unique, because
ERP redefines jobs and blurs traditional intraorganizational boundaries (Lee &
Lee, 2000). Knowledge must be shared across functional and divisional boundCopyright © 2005, Idea Group Inc. Copying or distributing in print or electronic forms without written
permission of Idea Group Inc. is prohibited.
TEAM LinG
210 Jones and Price
aries, and the knowledge required during ERP implementation entails a wider
variety of experiences, perspectives, and abilities than traditional information
systems implementations do (Baskerville et al., 2000; Robey et al., 2002).
Knowledge sharing is challenging, because much knowledge is embedded into
organizational processes (Davenport, 1998). The way people actually do their
jobs is often different from the formal procedures specified for even the most
routine tasks (Brown & Duguid, 2000). It is also challenging because there are
gaps between what people do and what they think they do (Brown & Duguid,
2000). Some tasks are so routine, and people have done them for so long, that
many of the steps involved are subconscious (Leonard & Sensiper, 1998).
However, there is a variety of factors that can facilitate knowledge sharing
during ERP implementation.
In order to present a coherent and logical view of knowledge sharing, we
identify factors that influence knowledge sharing that are linked by a common
conceptual underpinning which allows individuals to share observations and
experiences across traditional boundaries. Most ERP implementation activities
center around the ERP implementation team (Baskerville et al., 2000). ERP
implementation teams typically consist of organizational members from a variety
of functional areas and organizational divisions. Each team member must
understand what the others do in order to effectively map processes during the
implementation (Baskerville et al, 2000). Team members must work to achieve
this level of understanding. The knowledge sharing required does not come
automatically with team membership; it must be facilitated. Thus, facilitation of
knowledge sharing on the team is one factor examined.
The team must also interact with end users to gather relevant information
about processes and to keep end users and user managers informed about
changes to expect when the ERP is implemented (Robey, Ross, & Boudreau,
2002). Ideally, there is an intensive exchange of knowledge between the team
and these users that they represent (Baskerville et al., 2000). Inadequate
knowledge sharing between these two groups leads to unsuccessful implementation (Soh et al., 2000). One key to a smooth ERP implementation is effective
change management (Andriola, 1999; Harari, 1996). Because of the complexity
and cost of ERP, it must be planned and implemented visibly (Hammer, 1990).
One way to communicate plans, share knowledge with end users, and gather
knowledge from end users is through careful change management (Clement,
1994). Therefore, change management is another knowledge-sharing factor
examined.
A large part of change management is training. Those affected by the
implementation should receive training to develop new and improved skills to deal
with new challenges brought about by the change (Andriola, 1999). Users must
gain knowledge about the business rules and processes embedded in the ERP
software (Lee & Lee, 2000). They also must understand the integrative nature
of ERP in order to use it effectively. ERP requires end users to understand that
Copyright © 2005, Idea Group Inc. Copying or distributing in print or electronic forms without written
permission of Idea Group Inc. is prohibited.
TEAM LinG
Organizational Knowledge Sharing in ERP Implementation
211
they are no longer working in silos, and whatever they do now impacts someone
else (Welti, 1999). Entire departments must be retrained with this in mind (AlMashari & Zairi, 2002; Caldwell & Stein, 1998). Training on transactions and on
the integrative nature of ERP is another factor examined.
Most firms hire external consultants (i.e., integration partners) that know
the ERP software in order to help them through the implementation (Soh et al.,
2000). This involves knowledge sharing because the organizational implementation team seeks ways for the know-how and skills possessed by integration
partner staff (IPS) to be shared with them so that they are not lost when the IPS
leaves (Al-Mashari & Zairi, 2000). This goes beyond written documentation and
training manuals. For example, consultants are assigned to work side-by-side
with organizational team members so that the members can learn what the
consultants know about the package that cannot easily be written down
(Osterloh & Frey, 2000). One source of failure in ERP implementation is IPS
who work alone and fail to share knowledge with organizational members (Welti,
1999). When the IPS fails to share what they know, the firm often has trouble
supporting the ERP after they leave. Thus, it is important that the firm capture
as much of the IPS’ knowledge as possible before they transition off the team.
Transition of IPS knowledge is another knowledge-sharing factor examined. In
summary, several factors that may influence knowledge sharing are examined.
These are facilitation of knowledge sharing on the implementation team, change
management activities, type of training end users receive (i.e., transactional or
integrative), and use of formal knowledge transfer from integration partner staff
when they leave the organization.
Finally, the extent to which a firm is beginning to alter its core knowledge
competency after SAP implementation is examined. The active sharing of
organizational members’ knowledge is linked to a firm’s ability alter its core
knowledge competencies (Grant, 1996; Hine & Goul, 1998; Kogut & Zander,
1992). Altering knowledge competency involves sharing knowledge across the
organization in a way that preserves existing knowledge competencies and, at the
same time, absorbs new knowledge that expands and strengthens those competencies (Stein & Vandenbosch, 1996). An innovation that impacts the entire
organization and facilitates major changes in a firm’s processes, as ERP does,
provides an opportunity for firms to do this (Brown & Vessey, 1999). Evidence
of this alteration is found in fundamental changes in the way a firm performs its
core processes. ERP benefits are the result of ongoing efforts to continuously
improve processes (Ross, 1999). At the time of data collection, these firms were
still too early in their use of ERP to have realized extensive change. However,
they were making efforts to integrate processes and thereby alter core knowledge competency. Thus, change in core knowledge competency in this study is
assessed as the extent to which processes were being changed as a result of
ERP, rather than the extent to which they had changed.
Copyright © 2005, Idea Group Inc. Copying or distributing in print or electronic forms without written
permission of Idea Group Inc. is prohibited.
TEAM LinG
212 Jones and Price
METHODOLOGY
Data were collected as part of a larger study using a multiple case study of
firms in the petroleum industry that had implemented SAP R/3. Focusing on a
single package helps minimize bias that might be introduced into findings across
packages. However, because the focus is on knowledge sharing rather than on
technical aspects of the package itself, findings should be generalizable to
implementation of other ERP software in other industries. The CIO or top IS
executive of 10 firms in the industry were contacted to determine if they had
implemented or were implementing SAP, and if so, whether they would agree to
participate in the study. In some cases, a division of the firm was included rather
than the whole firm. Because of size, structure, or geographic dispersion, some
firms have conducted completely separate implementations in divisions around
the world, with little or no communication between the implementation teams. In
those cases, the division seemed to be a more appropriate case site than the entire
organization. We collected data from those that agreed to participate and that
met two other criteria. We eliminated firms that had implemented only one or two
modules with no plans to implement more. We also eliminated firms that had not
implemented across the organization or the specific division in which we were
interested. Each firm in the study implemented the major modules of SAP,
including FI/CO (financial accounting and controlling), AM (assets management), PS (project systems), PM (plant maintenance), SD (sales and distribution), MM (materials management), and PP (production planning). These criteria
helped to ensure that the case sites were comparable and that differences in
findings were not due to the scale of implementation.
In order to minimize bias that the researchers might introduce into the
process of analyzing findings, a rigorous and structured approach to analysis was
followed (Yin, 1989). For example, the interviewer took notes and taped each
interview. Tapes and notes were transcribed by a third party and reviewed by
the interviewer; respondents were asked for clarification on points that seemed
vague or missing. The transcriptions then were summarized and reviewed by
another researcher to help ensure that the transcriptions flowed well and made
sense. Finally, the primary contacts in each firm reviewed summaries to help
ensure that what was recorded represented actual events and perceptions. A
case study database consisting of interview notes, documentation provided by
respondents, tables summarizing findings, and an exact narrative transcription of
all interviews were used. The questions from the interview guide are provided
in Appendix A. A within-case analysis was performed, where data were
extracted using the interview questions as a guide to get a clearer picture of
knowledge sharing in each firm. Then, a cross-case analysis was performed in
which knowledge sharing across the firms was compared.
Because of the size of the project teams, interviewing a sample of key
members was deemed more manageable than attempting to interview each
Copyright © 2005, Idea Group Inc. Copying or distributing in print or electronic forms without written
permission of Idea Group Inc. is prohibited.
TEAM LinG
Organizational Knowledge Sharing in ERP Implementation
213
member. In addition, many members had left the firm or moved out of the areas
in which they had originally worked. Thus, we asked each of the top IS
executives to identify key members of their SAP project team that were still
involved with SAP in some way, including support and post implementation
process redesign. This method of identifying respondents has been demonstrated
to be acceptable, because professionals in a field have been shown to be capable
of nominating key respondents that have a consistent set of attributes appropriate
for a study such as this (Nelson et al., 2000). A series of semi-structured
interviews were conducted with eight to 10 members of each firm. The number
of interviewees was chosen based on the concept of theoretical saturation where
“incremental learning is minimal because the researchers are observing phenomena seen before” (Eisenhardt, 1989, p. 545). In these interviews, the researcher
often heard the same examples from most of the respondents in a site, regardless
of functional background, when they came on the team, or what their job was at
the time of the interview. In these interviews, the researcher often heard the
same examples from most of the respondents in a site, and they often used the
same phrases to express their perceptions. This was true of respondents who
were not located at the same physical locations at a site, or who were not all on
the team at the same time. Thus, it was deemed that additional interviews would
not yield significantly different insights. For example, all the respondents at
USWhole used the phrase psychological effort when referring to how they
approached the project. They indicated one guiding tenet of their project was that
the implementation was as much a psychological effort as a technical effort. In
another example, the phrase the accountants always cleaned up after
everyone came up in most interviews at each case site.
The interviews lasted between one and two hours each over a period of
seven months between July of 2000 and February of 2001. Each person was
interviewed once in person for one to two hours, and then was contacted by email or by telephone for additional information or clarification. In addition to the
face-to-face interviews, the researchers also preceded and followed up the
interviews with e-mail and telephone calls for background information, clarification, and points not covered in the interviews.
Respondents included both information systems staff and business/functional staff. Some had been on the team from the beginning, while others joined
at various points in the project. These people represented a variety of perspectives on SAP, including some who were pleased with it, some who hated it, and
others who were indifferent. They also represented a variety of levels in the firm
ranging from CIO and/or project manager to lower level employees, and included
people from such functional areas as accounting, purchasing, refineries, sales
and distribution, and a variety of engineering functions (Table 1).
Copyright © 2005, Idea Group Inc. Copying or distributing in print or electronic forms without written
permission of Idea Group Inc. is prohibited.
TEAM LinG
214 Jones and Price
Table 1. Profile of respondents
Company
USWhole
(Multiple roles
for many
members)
E&P
Chemicals
SAP Team Role for Each Respondent (1 respondent per line)
Responsible for SAP configuration; reengineering processes; managed quality assurance and testing; change
management
IT team lead; applications development lead; general leadership with three others of Chemical and
Downstream implementations; managed configuration and upgrades throughout the company
Project Manager
Project Manager
Service Delivery Manager; managed transition plan from production to operations and oversight of the
conversion
Technical leader for FI/CO; was also on HR design team
Functional expert in project systems and asset management
Team member; worked with conversion of legacy systems and investment management data to SAP
Leader for transition from development to support
Site Implementation Manager
Logistics team lead
Team lead of all financial modules of SAP
Director of the order-to-cash process; dealt with customer service, accounts receivable, credit, and some sales
accounting.
Team lead for sales and operations planning
Change management lead; responsible for communications and training materials.
Business implementation lead
Manager of the support group
Co-project manager
Co-project manager
PROFILE OF COMPANIES
USWhole is the U.S. division of one of the world’s leading oil companies.
It includes upstream (i.e., exploration and production), downstream (i.e., marketing, refining, and transportation), and chemical segments. The firm has exploration and production interests in many countries, with a large concentration in the
U.S., and it markets its products worldwide. USWhole performed five SAP
implementations for each of its major business units, including a small pilot test
site and corporate headquarters. It began its SAP project in early 1995 and
completed its first implementation in March of 1996. The final two implementations were completed simultaneously in July of 1998. There are approximately
15,000 SAP users in USWhole.
E&P is the North American exploration and production division of an
international petroleum company that has annual revenues in excess of $90
billion dollars U.S.. This particular division is engaged in the exploration and
production of crude oil and natural gas worldwide and accounts for approximately $6.8 billion dollars U.S. of the corporation’s revenue. Although SAP has
been implemented in various units of the parent company throughout the world,
each project has been a separate activity from all the others. The teams, scope,
budget, and timelines have been managed separately, and SAP has been
designed and configured differently for each with very little or no collaboration
among the units. Therefore, focusing only on E&P’s application in this firm
seems to provide a unit of analysis that is comparable to that in the other sites.
E&P began its project in 1996, using a big bang implementation where all modules
were implemented at one time, and finished the implementation for approximately 3,000 users in mid-1998.
Copyright © 2005, Idea Group Inc. Copying or distributing in print or electronic forms without written
permission of Idea Group Inc. is prohibited.
TEAM LinG
Organizational Knowledge Sharing in ERP Implementation
215
Table 2. Corporate profile
Corporate
Identity
USWhole
E&P
Chemicals
Revenue
Began SAP
Implementation
Date
Number of Users
(U.S. $)
*
$6.8 Billion
$4 Billion
1995
1996
1996
1996-1998
1998
1998-1999
15,000
3,000
5,000
* USWhole requested that this not be revealed.
Chemicals is the chemical division of an international petroleum company
with annual revenues of approximately $16 billion dollars U.S.. Chemicals
accounts for approximately one-fourth of its parent company’s revenue, with
annual revenues of approximately $4 billion dollars U.S. It is a leading chemical
manufacturer with interests in basic chemicals, vinyls, petrochemicals, and
specialty products. Its products are largely commodity in nature, in that they are
equivalent of products manufactured by others and are generally available in the
marketplace. They are produced and sold in large volumes, primarily to industrial
customers for use as raw materials. Chemicals began its SAP project in late
1996, with the first of nine implementations in January 1998. The implementations occurred approximately every two to three months, until all implementations were finished in December 1999. There are approximately 5,000 SAP users
in Chemicals. A summary of profiles is provided in Table 2.
DATA ANALYSIS
In the sections that follow is a description of knowledge sharing factors in
each firm, including facilitation of knowledge sharing on the team, change
management/training, and transition of IPS knowledge. The extent to which
firms had changed or were beginning to change their core knowledge competencies through changes in processes as a result of the SAP implementation is also
discussed. A summary of points covered is provided in Tables 3a, 3b, and 3c.
Table 3a provides a summary of facilitation of knowledge sharing on the team.
Table 3b provides a summary of change management and training activities, and
IPS knowledge transition activities. Table 3c provides a summary of changes in
core knowledge competency.
USWHOLE
Facilitation of Knowledge Sharing on the Team
Teams at USWhole had a negative connotation prior to the SAP project.
They often were used as dumping grounds for weak employees. This was a
Copyright © 2005, Idea Group Inc. Copying or distributing in print or electronic forms without written
permission of Idea Group Inc. is prohibited.
TEAM LinG
216 Jones and Price
Table 3a. Summary of facilitation of knowledge sharing on the team
Company
USWhole
Facilitation of knowledge sharing on the team
deemphasized titles, rank, and seniority on the team
E&P
emphasis on codifying how things worked and comparing written descriptions
lots of socialization after work
team members got to know each other and were supportive of each other
viewed each other as experts in their respective areas
focused on a common purpose
some tension between IT and integration partner, yet it subsided as the project
required heavy time and energy commitments
Chemicals
proactively sought ways to minimize the impact of the tension
team organized by process
deemphasized seniority and rank by providing the same bonus to all on the team
actively
involved a variety of key users early in the process to ensure that they gathered
knowledge from the right people
Table 3b. Summary of change management/training for end users and
transition of IPS knowledge
Company
USWhole
Change Management
Training
Transition of IPS Knowledge
Team communicated
with end users about
how SAP would change
their jobs
Identified power users
among end users to
train
Worked with IPS throughout
the project
Identified end users to
be change agents within
the units
Relied on change agents
to communicate as well
E&P
Team went to change
management training
Followed a change
management strategy
Focused on
communicating project
status to the company
Chemicals
Made sure end users
who were not directly
part of the team had
input into the project
Focused on helping end
users understand how
their jobs would change
after SAP
Focused on how end
users would use SAP
Power users helped
train other users
Focused largely on
transactions
Limited focus on
integration
Identified power users
among end users to
train
Power users helped
train other users
Focused largely on
transactions
Documented lessons learned at
the end of each go-live
Used no formal transfer
process at the end
Used formal transfer process
with checklists on how to
configure and on which things
triggered what
Transferred knowledge from
IPS to 3rd party consultant,
then from that consultant to
E&P support team
Limited focus on
integration
Identified power users
among end users to
train
Power users helped
train other users
Focused on integration
in addition to
transactions
Built knowledge transfer into
the contract with the IPS
Focused on how they solved
problems and where they
looked for answers
Team members gradually took
on more responsibility so they
could learn what the integration
partner knew
major obstacle to overcome in facilitating knowledge sharing on the SAP
implementation team. Top management strongly supported SAP, so the project
managers were able to ask for and get the best people in most cases for the
implementation team. They sent people back to their units if they did not work
out. Thus, they put together team members that had reasonably good knowledge
Copyright © 2005, Idea Group Inc. Copying or distributing in print or electronic forms without written
permission of Idea Group Inc. is prohibited.
TEAM LinG
Organizational Knowledge Sharing in ERP Implementation
217
Table 3c. Summary of changes in core knowledge competency
Company
USWhole
Changes
Gradually eliminating silo behavior
Some units adapted better than others and, thus, have seen more changes than others
E&P
Adaptation across the firm seems to be occurring; “it’s not like I do a job anymore, but I perform a
step in a process”
Slowly moving away from silo behavior
People are beginning to understand the integration points better, particularly in the financials area
Adaptation limited by corporate budget cuts unrelated to SAP
Chemicals
Are still in the learning cycle, but changes are ongoing
Majority of Chemicals units have embraced the concept of common processes, particularly in
financials and purchasing
Have completed development of a common master file for parts, and units are designing
purchasing around families of parts
Processes in general are now more well defined and better understood across functions within and
across divisions
about their own processes. USWhole facilitated knowledge sharing on the team
by eliminating seniority and functional distinctions. For example, senior people
worked alongside hourly workers on the team, and if the lower level employees
had an idea or wanted to try something, the senior people listened to them and,
in some cases, took direction from them. As one person said, before this project,
“a lower level person wouldn’t say what they thought in front of a more senior
person. But with the shared goal of getting the project done quickly, they did.”
Lower level people also challenged senior people if they didn’t agree or thought
there was a better way of doing something. USWhole provided a structure to the
team that allowed people to share knowledge openly and freely. This helped to
resolve conflicts and to map processes to SAP effectively.
As one person said, “The bad thing was to have an idea and not express it.”
USWhole also relied heavily on codifying knowledge and writing down how
processes worked. For example, “if someone said we can’t do it this way, we
said, ‘Why can’t you? Is it really unique?’ We’d get them to list what they do and
to look at what others have listed, and identify the commonalities.” USWhole
used several approaches to facilitate knowledge sharing on the team, including
codifying knowledge, structuring the team to remove barriers to knowledge
sharing, and proactively seeking to overcome the stigma associated with teams.
Change Management/Training
From the beginning of the project, USWhole had a strong change management team to communicate with the rest of the organization about project status,
issues, ideas, managing expectations, and training. As one said, “It’s all about
change management. That’s the name of the game.” Another person indicated,
“We had to break down cultural barriers (to common processes) through
communication.” The team members shared their knowledge about SAP with
Copyright © 2005, Idea Group Inc. Copying or distributing in print or electronic forms without written
permission of Idea Group Inc. is prohibited.
TEAM LinG
218 Jones and Price
the users in order to do so. They used several verbal and written communication
means to reach users at all levels of the organization. The change management
team helped users and managers understand how SAP would impact them;
gathered feedback on user perceptions, concerns, and issues; and helped
overcome resistance to change.
USWhole used a power user concept for training users. They identified
users in each of the business units that were influential in their units and that were
interested in SAP, and trained them extensively in how to do transaction
processing as well as in how processes were changing and being integrated.
However, there was more emphasis on the how-to than on process changes.
Users largely learned the latter on the job as they began to use the system. As
power users shared their knowledge with other users, knowledge about how to
use SAP began to permeate the organization. However, this was more difficult
in some streams than in others. For example, one unit had old technology and
went from “1960’s technology to 1990’s technology in one fell swoop. Some had
never used a mouse before, and one guy was moving his mouse over the screen
to choose an icon.” Thus, it was harder for them to learn how to use the new
system even at the most basic level.
Transition of IPS Knowledge
Because of the sheer size of the project, USWhole had several integration
partners. They did not use a formal knowledge transfer process when IPS left,
but they did document how to configure and perform all major activities, and they
documented lessons learned with each implementation. USWhole people worked
with each integration partner throughout the project so that the knowledge
transfer took place over time. In addition, although integration partners may have
been different for each business unit, the core team from USWhole was the same
throughout. Thus, knowledge gained in one implementation was not lost but
rather enhanced as the project progressed.
Changes in Core Knowledge Competency
As a result of SAP, team members gained knowledge about the organization
as they learned about the “linkages and inefficiencies between processes.”
However, the organization has had mixed results in altering core knowledge
competencies to change the way they perform processes. “Different streams
have adapted differently.” The downstream operations are the most complex to
do in SAP, and this stream had experienced the least change in the past. In the
beginning, it had the greatest difficulty in adapting to integrated, common
processes. “Downstream adapted very poorly early on.” The chemicals division
was used to change because it operates in an “acquisition and trade environment.” It also was running SAP R/2, so it was more familiar with the integrated
process approach. Thus, it has had an easier time adapting. Similarly, “upstream
Copyright © 2005, Idea Group Inc. Copying or distributing in print or electronic forms without written
permission of Idea Group Inc. is prohibited.
TEAM LinG
Organizational Knowledge Sharing in ERP Implementation
219
is primarily accounting based, so with the changing economy they grew used to
change,” and this stream has adapted to the changes more readily. Thus,
USWhole has experienced mixed results in its efforts to alter core knowledge
competencies, but it is continually working toward change.
One explanation for this is that USWhole did not recognize early enough the
differences in the streams’ abilities to adapt to change. Its change management
approach was not tailored to each stream, and even though they received
feedback from each, if a stream was resistant, it may not have shared enough
of what it knew so that the team could make the transition more effectively.
Although USWhole worked hard to ensure that effective knowledge sharing took
place on the team, its efforts to ensure knowledge sharing between the team and
the rest of the organization may not have been strong enough to impact change
in core processes.
E&P
Facilitation of Knowledge Sharing on the Team
E&P used informal team building activities to help solidify team member
relationships in an effort to foster knowledge sharing. Team members frequently
socialized together after work, and at the end of major milestones, the company
treated the entire team to various dinners, parties, and other outings. The team
was also solidified, because team members “knew the legacy systems on the
business and technical side, and they were highly capable and credible in their
areas.” They viewed each other as experts in their areas and, thus, were willing
to listen to and learn from each other.
However, E&P had a somewhat unique obstacle to knowledge sharing to
overcome in its implementation. The information technology (IT) division of the
parent company is managed as a separate company and must contract with E&P
and in competition with other outsourcing vendors for jobs. The IT company bid
to be the integration partner on the SAP project, yet the E&P project lead chose
another firm to be the primary integration partner because it had more experience
with SAP. However, the IT staff had extensive knowledge about and experience
with the E&P legacy systems that SAP replaced. In some cases, the IT staff had
as much or more knowledge about how processes worked than the E&P business
unit employees. Thus, they were selected to be part of the SAP team in order not
to lose their knowledge. At first, there was some tension between IT staff and
the IPS, because the IT staff felt that they should have been chosen as the
primary integration partner. However, there was a strong corporate culture of
working in teams; thus, this tension was minimized, and team members focused
primarily on the common purpose of completing the project rather than on
themselves. In addition, as new people came on the team throughout the project,
Copyright © 2005, Idea Group Inc. Copying or distributing in print or electronic forms without written
permission of Idea Group Inc. is prohibited.
TEAM LinG
220 Jones and Price
they were not aware of the earlier tension, which also helped to dissipate it. As
one said, “We didn’t have time to draw lines in the sand. We were concerned with
meeting deadlines, and we all had the same goal—making SAP work.”
Change Management/Training
E&P had a change management team in place whose responsibility was to
make sure that current project status was communicated to all company
employees and to make sure that people not directly tied to the project felt like
they also had some ownership. There was particular emphasis on this communication because “our experience on these large implementations has a very
checkered past.” E&P had implemented fairly well conceived large systems in
the past, where the change management people did not handle the change well.
As a result, organizational members did not like the systems, and sometimes the
systems were perceived as becoming the “butt of a lot of jokes.” Thus, senior
management placed a high priority on managing change in the SAP project, and
a large piece of the budget was devoted to it. The change management team
went through change management training classes, and the integration partner
“brought in a very strong change management plan.” The “”change management
piece was very mature, very well thought out, very strong.” The change
management team handled all communication using a variety of written and
verbal communication techniques ranging from e-mail to town-hall meetings.
“We got some good input [through this communication] that helped us restore
some things that may have caused trouble later on.”
Training was done using the power user concept . The emphasis in training
was more on how to perform transaction processing than on the way processes
were changing or the integrative nature of processes. The project budget
provided for the latter aspect of training after implementation to give the users
a chance first to understand how to use the system for basic transactions.
However, the budget for all training at E&P, not just SAP, was cut, and they did
not get to do as much of that as they wanted. This hurt the change management
team’s ability to share knowledge with the organization. One site was able to do
more training, because they had some additional resources that they could use.
Even though “it wasn’t much more training, you can really see the difference in
how much better they are able to take advantage of SAP than other locations
are.”
Transition of IPS Knowledge
When it came time to transition the IPS off the team, the original tension
regarding choice of partner began to resurface. Although most of the team
members either had gotten past it or were unaware of it throughout the project,
the project manager still had reservations about the firm’s internal IT capabilities
to support SAP after implementation. He wanted to hire the integration partner
Copyright © 2005, Idea Group Inc. Copying or distributing in print or electronic forms without written
permission of Idea Group Inc. is prohibited.
TEAM LinG
Organizational Knowledge Sharing in ERP Implementation
221
to continue working with the firm indefinitely as the SAP support team, even
though this was a more expensive long-run option. Because of the expense and
the tension the decision created, senior management overrode the project
manager’s decision and hired the IT division to do long-term support. To ensure
that the transition was smooth, they removed the project manager from the
project and transferred him laterally to another part of the organization that had
nothing to do with SAP. They appointed an experienced, senior IT manager to
oversee the transition of knowledge from the integration partner to the team and
to manage the establishment of the support team. This was a strong, proactive
attempt to overcome an obstacle that could have negatively impacted the rest of
the project.
Another choice that helped minimize effects of this situation is that E&P
hired another consulting firm with experience in SAP to help transition the IPS
off the team and ensure that their knowledge was not lost to E&P. Because the
support team members had worked throughout the SAP project, they already
understood the processes quite well but were missing technical information such
as how to configure particular processes or where to look for certain technical
or operational information. The integration partner transferred its knowledge to
the third party consultant, and then the third party consultant transferred that
knowledge to the E&P support team. In their knowledge transfer model, “it was
transferring SAP knowledge from one SAP experienced group to another SAP
experienced group, then that group transitioned the knowledge to us in a way we
could understand.” While some knowledge was surely lost because of the
varying perceptions, experiences, and communication barriers involved in getting
second-hand or third-hand knowledge, this may have been the best way E&P
could gain integration partner knowledge, given the situation in which they were
working. Thus, E&P took strong steps to minimize knowledge loss when it
recognized a potential problem with knowledge sharing.
Changes in Core Knowledge Competency
The extent to which E&P has integrated the results of its knowledge sharing
to alter core knowledge and processes is somewhat lacking in consistency. One
person indicated that for a long time “people didn’t really try to exploit SAP; they
just tried to get their jobs done.” However, several months after implementation,
that began to change. The support team is “getting more requests from people
looking at how to use SAP to change the business.” Part of that is because budget
cuts and layoffs that occurred about the time SAP was implemented (not SAP
related) created a strain on employees’ time and motivation to learn something
new. The pressure on the budget has eased, yet the emphasis on cost cutting
remains. Thus, end users have renewed their efforts to find opportunities to run
the business more cost effectively. They are asking the SAP support team
questions about how to identify and make use of these opportunities in SAP. They
Copyright © 2005, Idea Group Inc. Copying or distributing in print or electronic forms without written
permission of Idea Group Inc. is prohibited.
TEAM LinG
222 Jones and Price
also have begun to understand that what they do in their process now affects
someone else in another process and are looking for ways to take advantage of
that. The SAP support team continues to encourage people to exploit SAP
opportunities. E&P has continued sharing knowledge and seeking ways to
exploit old certainties and explore new possibilities long after implementation.
Thus, changes to the core knowledge competency are ongoing. Users are now
trying to use SAP to change the way they perform processes and, thus, are
beginning to alter core knowledge competencies. One explanation for this may
be the efforts E&P made throughout the implementation to facilitate knowledge
sharing on the team and with the rest of the organization. These knowledgesharing efforts helped make the organization ready to facilitate change in
processes, and that readiness lasted through corporate budget cuts.
CHEMICALS
Facilitation of Knowledge Sharing on the Team
Chemicals’ project manager said that “one of the things I always tell my
folks is that SAP is a team sport. If you don’t play as a team you can’t win.” One
of the things in place to discourage individual hoarding of knowledge was that
each member of the team received the same bonus at the end of an implementation regardless of rank in the organization, and the bonus was based on the
quality of the work and how well the implementation deadlines were met. Thus,
there was an incentive for each member to work with others to accomplish a
common goal. “We had a foxhole mentality,” whereby team members were
united around a common cause.
The team was also organized by process rather than by function or SAP
module to facilitate knowledge sharing. Chemicals built overlap between modules and functions into the project, and often two or more groups worked together
on a particular piece. For example, logistics is in the SD (sales and distribution)
module, but Chemicals broke it out and had a subteam manage the logistics
process separately from the sales and distribution people. Much of that data was
also in the order-to-cash process performed by the customer service area. Thus,
the logistics group had to work closely with the order-to-cash group to make sure
that the logistics pieces fit. They also did cross-team training to help ensure that
people working on one piece understood how their piece impacted others.
Although this approach required more effort in many cases than a moduleoriented approach, they believed that “if you get too module oriented, you get too
focused on the modules you’re working on” and lose sight of the big picture,
which is the processes. Thus, the SAP team was organized to focus on the
transfer of knowledge across functions, processes, and units, and to eliminate silo
behavior within the team and between the team and the organization. Although
Copyright © 2005, Idea Group Inc. Copying or distributing in print or electronic forms without written
permission of Idea Group Inc. is prohibited.
TEAM LinG
Organizational Knowledge Sharing in ERP Implementation
223
they did not use formal team building activities, “everyone on the team had to rely
on everyone else,” because no one person or group knew all the things it took to
do the project.
The SAP team also decided to bring the key end users across plants into
implementation planning meetings, where each team gave a basic overview of
how each process would work in SAP, which included SAP terminology and
basic concepts. They went through an exhaustive set of detailed questions about
how processes worked and how they did their jobs. They built these questions
over time, based on the integration partner’s experience and on what they
learned with each implementation. Thus, by the last few implementations, they
had developed a set of questions that allowed them to cover almost every
conceivable part of the business processes. “We’d talk about the pros and cons
of each decision these plant people made. And we’d try to make people
understand what it actually meant and document the decision. We’d distribute
minutes of the meeting and have people either agree or not with what we’d
decided on.” This allowed the business people in multiple plants to share
knowledge and make decisions about common processes across the plants. As
a result, there was more uniformity of processes across plants, and there was a
better understanding of how to handle exceptions or things that had traditionally
been “workarounds” in the legacy system. “We had some consultants who said
our method was non-standard and shouldn’t be used, but it worked well for us.”
Change Management/Training
Chemicals had a very strong change management process in place, and
although they had a formal team in place for this, much of the change
management was an overall SAP team responsibility rather than that of just one
subgroup. “We had never worked so hard on cultural readiness,” one person
said. “We worked really hard on communications through e-mail, memos, ‘lunch
and learns,’ and television monitors with an animated video presentation that ran
continually in the cafeterias in plants.” The on-site planning meetings were also
viewed as an important part of change management. “We had decision makers
from every functional group in the plants in each design and implementation,”
which went a long way toward the cultural readiness on which change management was focused.
Although there was some use of the power user concept for training, the
team members who implemented also trained the users on site during the
implementation using materials the change management group had developed.
Training involved the transactional-based skills and a “heavy focus on the
integration points” to help people understand “where they fit in the chain of
events and why their piece was important and how it had downstream processes.” They originally thought that the training would be more focused on the
how-to, transactional skills, yet when they realized that “if we were going to get
Copyright © 2005, Idea Group Inc. Copying or distributing in print or electronic forms without written
permission of Idea Group Inc. is prohibited.
TEAM LinG
224 Jones and Price
the wins we hoped were there, it was predicated on everybody doing their job.”
Thus, the training role changed considerably. “We spent more time and money
around training than we originally planned, and we had planned to train much
heavier than we had in any previous system.”
Transition of IPS Knowledge
Chemicals built knowledge sharing into their contract with the integration
partner. Team members focused both on how the partner solved problems and
on where they looked for answers. This provided them not only with how-to
knowledge, but also with more experiential knowledge about how to solve
problems. Another way that Chemicals ensured knowledge sharing with its
integration partner is that team members took on more responsibility as the
implementation progressed, so they could learn what the integration partner
knew, and so they could develop shared SAP experiences with the partner.
Changes in Core Knowledge Competency
Chemicals has made substantial progress toward integrating what it learned
through the knowledge sharing in the SAP project into its core knowledge, and
its processes have begun to change. “A lot more people are aware of the
integration and dependencies among processes.” “Our business processes have
become much more well-defined and understood.” They are beginning to see
substantial financial savings from leveraging common processes across units.
For example, the purchasing process is now uniform throughout all the plants, and
Chemicals has negotiated better prices on parts by buying the same part for all
plants through fewer suppliers. To do this, the plants had to work together to
change their nomenclature for parts to create a common master file of parts
across plants, which was a major hurdle to cross because of the vast number of
parts involved. Chemicals hired a consulting firm that had experience with this
type of task to help them. The firm now has a uniform online catalog of parts and
vendors. Buyers are now called alliance owners who “negotiate contracts,
approve changes from vendors, and monitor the business flow with the vendors”
across Chemicals for a particular family of parts rather than buying all the parts
for a given plant. “We’re still not over the hump on all of these [standards]. The
process works, but there’s room for improvement.”
One explanation for this is the strong knowledge sharing facilitators that
Chemicals built throughout the implementation. It began from a process focus in
which functional boundaries were removed, and team members from a variety
of processes had to work together and share their knowledge. This process focus
also engaged end users from across the organization to ensure that their
knowledge about processes was incorporated into the implementation. In
addition, users who were not directly involved in the implementation were trained
not only on transactions, but also on the integrative nature of performing
Copyright © 2005, Idea Group Inc. Copying or distributing in print or electronic forms without written
permission of Idea Group Inc. is prohibited.
TEAM LinG
Organizational Knowledge Sharing in ERP Implementation
225
processes in ERP. Based on this evidence, Chemicals had the strongest
knowledge sharing during implementation and seems to have been able to move
more quickly than the other two firms in altering core knowledge competencies
by changing the way they perform processes.
LESSONS LEARNED
The firms that have had success with knowledge sharing during the
implementation process are making great strides toward taking advantage of
ERP in order to change the way they perform key processes. Although it is too
early for these companies to have realized substantial benefits, they have
mechanisms in place that put them well on the road to doing so. They have formed
cross-functional, cross-unit networks of employees to alter core knowledge
competencies by standardizing nomenclature, leveraging common processes,
and eliminating silo behavior between units. These networks have arisen out of
the knowledge sharing that took place during the implementation project among
team members, other organizational members, and integration partners. Thus,
there are several valuable lessons from these findings (see Table 4).
One lesson learned is that when firms start to implement an ERP, they
should identify organizational facilitators of and obstacles to knowledge sharing
and proactively seek to overcome the obstacles. For example, team members at
E&P recognized a potential problem in the tension between two organizational
units and made a conscious decision to minimize it, thus successfully ensuring it
was not passed on to new team members. One of Chemicals’ goals was to
engage a large number of the appropriate end users in the implementation to
ensure that they captured the right knowledge. Chemicals and USWhole both
Table 4. Summary of lessons learned
Identify and eliminate obstacles to success
e.g., cultural barriers such as stigma associated with teamwork or tensions between units;
structural barriers that promote silo behavior or inhibit knowledge sharing between levels
Focus on integration from the beginning of the project
e.g., implement by process rather than by module;
focus training on integration points in addition to how to process transactions
Focus on finding the best solutions to problems
e.g., don’t sweep problems under the carpet and hope to fix them later;
resist pressures to meet deadlines simply to mark milestones
Build organizational knowledge sharing throughout the project
e.g., foster knowledge sharing among team members with formal and informal activities;
encourage knowledge sharing between team and other organizational members;
minimize knowledge lost when consultants or other team members leave through formal roll- off
procedures
Learn from the past
e.g., acknowledge prior project weaknesses and look for ways to do better;
recognize prior strengths and build on those
Copyright © 2005, Idea Group Inc. Copying or distributing in print or electronic forms without written
permission of Idea Group Inc. is prohibited.
TEAM LinG
226 Jones and Price
worked to overcome traditional barriers to knowledge sharing such as rank,
seniority, titles, and physical workspace. Barriers or obstacles that a firm has had
in the past on large-scale projects will not disappear by themselves, and ignoring
them in an ERP project may magnify them. These firms took actions that were
different from, if not counter to, organizational norms and patterns in order to
ensure that the ERP implementation could successfully integrate processes and
eliminate silos.
Lesson two is that firms should focus on integration from the beginning of
the ERP project. Because ERP requires integration of processes in the end, the
transition from silos is easier if the entire implementation effort is built around this
integration. Implementing by module may feel more natural, because its how
organizational members are used to working. However, it only prolongs the
inevitable change to integrated processes necessary to realize significant ERP
benefits. For example, Chemicals sought to overcome the divisions among
functional areas and business units from the very beginning of its project.
Chemicals’ employees were educated about integration of processes from the
beginning of the project, because they were involved in integrated groups as they
worked with the SAP team to map out processes, and as they were trained to use
SAP. Furthermore, the firms that primarily focused on how-to training said that
they regret not having realized the importance of focusing on integration points
with users earlier.
Lesson three is that firms should learn from the past and not be afraid to
acknowledge prior project weaknesses or failures. For example, E&P recognized that they had not been good at change management in the past and took
steps to correct this weakness. USWhole recognized that its management of
teams in the past was not good and took deliberate steps to build a strong SAP
team.
Lesson four is that firms should focus on knowledge sharing both on the
team and with the rest of the organization. For example, USWhole may not have
recognized the differences in the ability of its streams to adapt to changes
brought about by SAP early enough, because it did not tailor its change
management activities to the different streams. As a result, different streams
adapted differently, and the team had to work harder with some than with others
to begin to effect change in processes. On the other hand, E&P and Chemicals
worked hard to facilitate knowledge sharing among all relevant stakeholders in
their implementations. Both organizations have begun to change core processes
and alter core knowledge competencies.
Thus, the findings from this study provide several lessons that firms may
apply in their own ERP implementations. Even firms that already have implementations in progress or that are struggling to make ERP work after the initial
implementation can apply these lessons to their own situations. ERP is a longterm solution, and, once implemented, it is difficult, if not impossible, to go back
Copyright © 2005, Idea Group Inc. Copying or distributing in print or electronic forms without written
permission of Idea Group Inc. is prohibited.
TEAM LinG
Organizational Knowledge Sharing in ERP Implementation
227
to the way things were prior to ERP. Thus, it is never too late to look at other
firms’ success stories to find out what we can learn from them.
LIMITATIONS OF THE STUDY AND
DIRECTIONS FOR FUTURE RESEARCH
One limitation of the study is that only one industry and one package were
examined. Although this helps to minimize bias that could be introduced across
industries and packages, there is a trade-off between generalizability of findings
and minimizing bias. Minimizing bias helps eliminate many factors that might
confound the results and provides a clearer view of the phenomenon of interest.
Selection of appropriate case sites controls extraneous variation and helps define
the limits for generalizing findings (Eisenhardt, 1989). If consistent results are
found across similar case sites, then we can be more sure that the theory that led
to the case study originally will also help identify other cases to which results are
analytically generalizable (Eisenhardt, 1989; Yin, 1989). However, using one
industry ignores difficulties or challenges in implementation that may be unique
to a given industry. One avenue for future research is to examine these
constructs in this study across industries and using different ERP packages to
determine whether industry or package mediate the findings in this study.
Another limitation is the number of respondents interviewed. Although
many of the same phrases were heard from respondents, indicating that
theoretical saturation had been reached, one direction for future research is to
examine the phenomena of interest in this study using a larger sample size in
order to be more sure that the responses obtained in this study do represent the
broader views and perceptions of the project team. In addition, the unit of
analysis in this study is restricted to the implementation team. Although most
knowledge sharing during the implementation revolved around this team, future
research that explores the perceptions of other organizational members or of the
integration partner staff could be useful. One avenue for this future research is
to compare responses to determine whether knowledge sharing is perceived
differently among team members, other organizational members, and the integration partner staff.
CONTRIBUTIONS OF THE STUDY
This study contributes in several ways to what is known about knowledge
sharing in ERP implementations. First, it identifies, categorizes, and discusses
several factors that facilitate knowledge sharing during ERP implementation.
Second, it links knowledge sharing to attempts to change core knowledge
competencies. Third, it provides several lessons for practitioners that they can
Copyright © 2005, Idea Group Inc. Copying or distributing in print or electronic forms without written
permission of Idea Group Inc. is prohibited.
TEAM LinG
228 Jones and Price
use in their own ERP implementations. Practitioners engaged in ERP implementation can use these findings both to determine what may work best for them and
to identify their own facilitators of knowledge sharing. Fourth, this study provides
directions for future research by identifying limitations of the current study and
suggesting ways that future research could examine those limitations to further
extend what we know about knowledge sharing in ERP implementation.
REFERENCES
Al-Mashari, M., & Zairi, M. (2000). The effective application of SAP R/3: A
proposed model of best practice. Logistics Information Management,
13(3), 156-166.
Andriola, T. (1999). Information technology—The driver of change. Hospital
Material Management, 21(2), 52-58.
Baskerville, R., Pawlowski, S., & McLean, E. (2000). Enterprise resource
planning and organizational knowledge: Patterns of convergence and
divergence. Proceedings of the 21st ICIS Conference, Brisbane, Australia.
Brown, C., & Vessey, I. (1999). ERP implementation approaches: Toward and
contingency framework. Proceedings of the 20th Annual International
Conference on Information Systems, Charlotte, NC.
Brown, J.S., & Duguid, P. (2000, May-June). Balancing act: How to capture
knowledge without killing it. Harvard Business Review, 73-80.
Caldwell, B., & Stein, T. (1998, November). Beyond ERP—New IT agenda—
A second wave of ERP activity promises to increase efficiency and
transform ways of doing business. InformationWeek, 34-35.
Clement, R.W. (1994). Culture, leadership, and power: The keys to organizational change. Business Horizons, 37(1),33-39.
Constant, D., Kiesler, S., & Sproull, L. (1994). What’s mine is ours, or is it? A
study of attitudes about information sharing. Information Systems Research, 5(4), 400-421.
Davenport, T.H. (1998, July-August). Putting the enterprise in the enterprise
system. Harvard Business Review, 121-131.
Eisenhardt, K.M. (1989). Building theories form case research. Academy of
Management Review, 14(4), 532-550.
Grant, R.M. (1996). Prospering in dynamically competitive environments: Organizational capability as knowledge integration. Organization Science,
7(4), 375-387.
Hammer, M. (1990). Reengineering work: Don’t automate, obliterate. Harvard
Business Review, 68(4), 104-112.
Harari, O. (1996). Why did reengineering die. Management Review, 85(6), 49-
Copyright © 2005, Idea Group Inc. Copying or distributing in print or electronic forms without written
permission of Idea Group Inc. is prohibited.
TEAM LinG
Organizational Knowledge Sharing in ERP Implementation
229
52.
Hine, M.J., & Goul, M. (1998). The design, development, and validation of a
knowledge-based organizational learning support system. Journal of
Management Information Systems, 15(2), 119-152.
Jarvenpaa, S.L., & Staples, D.S. (2000). The use of collaborative electronic
media for information sharing: An exploratory study of determinants.
Journal of Strategic Information Systems, 9, 129-154.
Jones, M.C. (2001). The role of organizational knowledge sharing in ERP
implementation. Final Report to the National Science Foundation
Grant SES 0001998.
Kogut, B., & Zander, U. (1992). Knowledge of the firm, combinative capabilities, and the replication of technology. Organization Science, 3(3), 383397.
Leonard, D., & Sensiper, S. (1998). The role of tacit knowledge in group
innovation. California Management Review, 40(3), 112-132.
Nelson, K.M., Nadkarni, S., Narayanan, V.K., & Ghods, M. (2000). Understanding software operations support expertise: A revealed causal mapping
approach. MIS Quarterly, 24(3), 475-507.
Osterloh, M., & Frey, B.S. (2000). Motivation, knowledge transfer, and organizational forms. Organization Science, 11(5), 538-550.
Robey, D., Ross, J.W., & Boudreau, M.-C. (2002). Learning to implement
enterprises systems: An exploratory study of the dialectics of change.
Journal of Management Information Systems, 19(1), 17-46.
Ross, J. (1999, July/August). Surprising facts about implementing ERP. IT Pro,
65-68.
Scott, J.E., & Kaindl, L. (2000). Enhancing functionality in an enterprise
software package. Information and Management, 37, 111-122.
Soh, C., Kien, S.S., & Tay-Yap, J. (2000). Cultural fits and misfits: Is ERP a
universal solution? Communications of the ACM, 43(4), 47-51.
Stein, E.W., & Vandenbosch, B. (1996). Organizational learning during advanced systems development: Opportunities and obstacles. Journal of
Management Information Systems, 13(2), 115-136.
Welti, N. (1999). Successful SAP R/3 implementation: Practical management
of ERP projects. Reading, MA: Addison-Wesley.
Yin, R.K. (1989). Case study research: Design and methods. Newbury Park,
CA: Sage Publications.
Zheng, S., Yen, D.C., & Tarn, J.M. (2000, Fall). The new spectrum of the crossenterprise solution: The integration of supply chain management and
enterprise resources planning systems. Journal of Computer Information
Systems, 84-93.
Copyright © 2005, Idea Group Inc. Copying or distributing in print or electronic forms without written
permission of Idea Group Inc. is prohibited.
TEAM LinG
230 Jones and Price
APPENDIX A
Semi-Structured Interview Guide
Team vs. Individual Efforts
1. Do you usually work on a project team, or do you primarily work alone on
projects?
2. Do you think you are more rewarded for individual activities or for work on
teams? How important is project teamwork to your company?
3. Are teams primarily made up of people from the same functional areas or
from across functions?
4. How would you describe the culture of the firm?
Process vs. Product (Deadline) Orientation
1. How much focus was there on meeting deadlines and finishing the project
under budget?
2. How well were deadlines met?
3. When deadlines weren’t met, what was the reason?
4. How did your team determine whether the goals were valid and being met?
5. How did your team learn about opportunities SAP could provide your firm?
6. Do you think this learning process occurred throughout the implementation?
Organizational Knowledge Sharing During the Project
1. How were the SAP project team members selected?
2. How were differences in perspectives melded together?
3. Was this easy or difficult?
4. Was there ever a time when differences couldn’t be resolved? (If so, how
was that handled?)
5. How did your team seek input from others in the company on areas where
you were uncertain?
6. How did your team seek to keep others in the company informed about
company goals and progress on SAP?
7. Do you think this was ever seen as simply another IT project?
8. How much did your group rely on outside consultant expertise?
9. How did you make sure that you had learned enough from them so that you
could carry on after they left?
10. Was there much transition off your SAP team? How was it managed?
11. How were new people coming on the team brought up to speed?
12. During SAP team meetings, were people encouraged to express their ideas,
even if they weren’t fully formed yet? And did they express these ideas?
Can you give some examples?
Copyright © 2005, Idea Group Inc. Copying or distributing in print or electronic forms without written
permission of Idea Group Inc. is prohibited.
TEAM LinG
Organizational Knowledge Sharing in ERP Implementation
231
13. Was there ever anything in the implementation process you felt just wasn’t
right, but couldn’t exactly explain why? If so, did you express this? Why or
why not?
14. Was there anything you assumed to be true about SAP that you later
changed your mind about?
Incorporation of New Knowledge Into Core Knowledge Competencies
1. Do you believe that the organization is different now than before SAP
implementation? If not, why not? If so, how?
2. Have the processes changed, or are they being changed because of SAP?
3. How has SAP changed the way you think about your job or the company?
4. What are some things that you learned about the business processes at the
company that you didn’t know before the SAP implementation?
Copyright © 2005, Idea Group Inc. Copying or distributing in print or electronic forms without written
permission of Idea Group Inc. is prohibited.
TEAM LinG
232 Jones and Price
Section III:
E-Commerce
Processes
and
Practices
Copyright © 2005, Idea Group Inc. Copying or distributing in print or electronic forms without written
permission of Idea Group Inc. is prohibited.
TEAM LinG
Electronic Banking and Information Assurance Issues
233
Chapter XII
Electronic Banking
and Information
Assurance Issues:
Survey and Synthesis
Manish Gupta, State University of New York, USA
Raghav Rao, State University of New York, USA
Shambhu Upadhyaya, State University of New York, USA
ABSTRACT
Information assurance is a key component in e-banking services. This
article investigates the information assurance issues and tenets of ebanking security that would be needed for design, development, and
assessment of an adequate electronic security infrastructure. The technology
terminology and frameworks presented in the article are with the view to
equip the reader with a glimpse of the state-of-art technologies that may help
toward learning and better decisions regarding electronic security.
INTRODUCTION
The Internet has emerged as the dominant medium in enabling banking
transactions. Adoption of e-banking has witnessed an unprecedented increase
over the last few years. Twenty percent of Internet users now access online
Copyright © 2005, Idea Group Inc. Copying or distributing in print or electronic forms without written
permission of Idea Group Inc. is prohibited.
TEAM LinG
234 Gupta, Rao and Upadhyaya
banking services, a total that will reach 33% by 2006, according to the Online
Banking Report. By 2010, more than 55 million U.S. households will use online
banking and e-payments services, which are tipped as “growth areas.” The
popularity of online banking is projected to grow from 22 million households in
2002 to 34 million in 2005, according to Financial Insite, publisher of the Online
Banking Report1 newsletter.
Electronic banking uses computer and electronic technology as a substitute
for checks and other paper transactions. E-banking is initiated through devices
such as cards or codes to gain access to an account. Many financial institutions
use an automated teller machine (ATM) card and a personal identification
number (PIN) for this purpose. Others use home banking, which involves
installing a thick client on a home PC and using a secure dial-up network to access
account information; others allow banking via the Internet. This article will
discuss the information assurance issues (Maconachy, Schou, & Ragsdale, 2002)
that are associated with e-banking infrastructure. We hope that this chapter will
allow information technology (IT) managers to understand information assurance issues in e-banking in a holistic manner, and that it will help them make
recommendations and take actions to ensure security of e-banking components.
INTERNET/WEB BANKING
A customer links to the Internet from his or her PC. The Internet connection
is made through a public Web server. When the customer brings up the desired
bank’s Web page, the customer goes through the front-end interface to the
bank’s Web server, which, in turn, interfaces with the legacy systems to pull data
out at the customer’s request. Pulling legacy data is the most difficult part of Web
banking. While connection to a direct dial access (DDA) system is fairly
straightforward, doing wire transfer transactions or loan applications requires
much more sophisticated functionality. A separate e-mail server may be used for
customer service requests and other e-mail correspondence. There are also other
middleware products that provide security to ensure that the customer’s account
information is secured, as well as products that convert information into an
HTML format. In addition, many of the Internet banking vendors provide
consulting services to assist banks with Web site design and overall architecture.
Some systems store financial information and records on client PCs but use the
Internet connections to transmit information from the bank to the customer’s PC.
For example, the Internet version of Intuit’s BankNOW runs off-line at the client
and connects to the bank via the Internet only to transmit account and transaction
information (Walsh, 1999).
In this section, we discuss some of the key nodal points in Internet banking.
The following points are the foundations and principal aspects of e-banking: Web
site and service hosting, possibly through providers; application software that
Copyright © 2005, Idea Group Inc. Copying or distributing in print or electronic forms without written
permission of Idea Group Inc. is prohibited.
TEAM LinG
Electronic Banking and Information Assurance Issues
235
includes middleware; regulations surrounding e-banking and standards that allow
different organizations and platforms to communicate over the Internet.
Web Site and Banking Service Hosting
Banks have the option of hosting Web sites in-house or outsourcing either
to service bureaus or core processing vendors with expertise in Internet banking.
Whether outsourced or packaged, Internet banking architectures generally
consist of the following components: Web servers; transaction servers; application servers; and data storage and access servers. Vendors such as Online
Resources2 offer a package of Web banking services that includes the design
and hosting of a financial institution’s Web site and the implementation of a
transactional Web site. Online’s connection makes use of the bank’s underlying
ATM network for transactions and real-time bill payment. In addition, optional
modules are generally available for bill payment, bill presentment, brokerage,
loan application/approval, small business, and credit cards. The fact that multiple
options of Web hosting exist also brings with them issues in security and
privacy—a topic that will be considered in a later section.
The components that form a typical Internet banking initiative are shown in
Figure 1.
•
•
Internet Banking Front-End: The front-end is often the client-side
browser access to the bank’s Web server. Client-side, thin-client access to
the bank’s Web server: This model allows the customer to download a thinclient software product from the bank’s Web site and may allow storing
financial data locally. Client-side, thick-client access to the bank’s Web
server: This is the model used when supporting personal financial management packages as tools to access account data and execute transactions. It
is important to note that these models are not mutually exclusive of each
other (Starita, 1999).
Internet Banking Transaction Platforms: The Internet banking transaction platform is the technology component that supports transactional
processes and interfaces between the front-end user interface and the
back-end core processors for functions like account information retrieval,
account update, and so forth. In general, the transactional platform defines
two main things: (1) the functional capabilities of the Internet banking
Figure 1. Architectural pieces of Internet banking (Starita, 1999)
In te rn et
F ro n t E n d
B ro w ser
b ased
Th in cl ien t
Th ick clien t
W eb site
B ac k E n d
M id d le wa re an d B ac k E n d
Ap p l ic atio n se rver s
D atab a se ser ve rs
Le gac y ap plicatio n s
B u s in e ss lo gic serve rs
S ecu r it y p a ck a ge s
Copyright © 2005, Idea Group Inc. Copying or distributing in print or electronic forms without written
permission of Idea Group Inc. is prohibited.
TEAM LinG
236 Gupta, Rao and Upadhyaya
offering (i.e., whether it offers bill payment or credit card access); and (2)
the method of access or interface between the front-end and back-end
legacy processors (Starita, 1999).
Internet Banking Platforms and Applications
Most of the Internet plumbing to present data onto Web interfaces from data
sources is offered by Internet banking application software vendors, who link
legacy systems to allow access to account data and transaction execution. Most
players position themselves as end-to-end solution providers by including a
proprietary front-end software product, integration with other front-end software, or Web design services.
Some of the solutions are middleware platforms with plug-in applications to
provide bill payment, bill presentment, brokerage, loan, small business, and/or
credit card functionality. Most vendors use Open Financial Exchange standard
(OFX) to connect to different delivery channels such as Interactive Voice
Response (IVRs), Personal Finance Managers (PFMs), and the Internet.
Middleware tools are designed to handle Internet-delivered core banking and bill
payment transactions (Walsh, 2002). Middleware platforms provide a link
between financial institutions’ legacy host systems and customers using browserbased HTML interfaces and OFX-enabled personal financial management
software (Walsh, 2002).
Middleware is designed for financial institutions that require a platform that
translates messages between collections of separate processing systems that
house core processing functions. Core processing systems include bill payment,
credit card, brokerage, loans, and insurance. Electronic bill payment and
presentment is widely believed to be the compelling application that brings large
volumes of customers to the Internet channel to handle their finances. There are
two kinds of Web sites: nontransactional and transactional. The nontransactional
sites, commonly known as promotional Web sites, publish content with information about bank products and allow customers to investigate targeted areas such
as college loans or retirement planning. These sites give basic information on
bank products and do not allow any transactions. Banks can collect information
to start to develop customer profiles by recording where a customer visits on the
Web site and comparing it with demographic information to develop personalized
marketing strategies.
Transactional sites link to back-end processing systems and include basic
functionality such as the ability to view recent transactions and account histories,
download information into PFM software, and transfer funds between existing
accounts. As banks become more sophisticated with transactional capabilities,
such things as electronic bill payment or moving of funds outside of the bank
become possible. Integrating with a third-party processor such as Checkfree or
Travelers Express most often does this. Bill presentment is also part of
Copyright © 2005, Idea Group Inc. Copying or distributing in print or electronic forms without written
permission of Idea Group Inc. is prohibited.
TEAM LinG
Electronic Banking and Information Assurance Issues
237
transactional capability; however, it is being done on a limited basis through a
small number of pilots. Some banks allow customers to apply for loans,
mortgages, and other products online, although much of the back-end process is
still done manually. In transactional Web sites, every page must be composed
dynamically and must offer continual updates on products and pricing.
Standards Compliance
Standards play a vital role in seamless flow and integration of information
across channels and help to reduce risk emanating from diverse platforms and
standards. In addition to the challenge of integrating Internet banking products
into the bank’s own IT environment, many Internet banking functions involve
third-party participation. This poses a significant integration question: What is the
best way to combine separate technology systems with third parties in a costeffective way in order to enable each participant to maintain control over its data
and maintain autonomy from other participants? The response from the technology marketplace has been to establish Internet banking standards to define
interactions and the transfer of information between multiple parties (Bohle,
2001). The premise of a standard is that everyone would use it in the same
consistent fashion; unfortunately, that is not the scenario in the current Internet
banking environment. One of the problems for the lackluster performance of ebanking arguably is the industry’s failure to attend to the payments infrastructure
(Orr, 2002). One initiative that does show promise is by the National Institute of
Standards and Technology, which has developed a proposed standard—Security
Requirements for Cryptographic Modules—that will require role-based authentication and authorization (FIPS, 1992). Some of the standards pervasive in
current e-banking models are the ADMS standard, the GOLD standard, and the
OFX standard.
INFORMATION ASSURANCE
Web banking sites include financial calculators; e-mail addresses/customer
service information; new account applications; transactions such as account
balance checks, transfers, and bill payment; bill presentment/payment; cash
management; loan applications; small business; credit card; and so forth. The
modes by which they can be accessed include online service provider or portal
site, direct-dial PC banking program, Internet-bank Web sites, WebTV, and
personal financial manager. Depending on the functionality of the Web sites,
different information assurance requirements are found.
Some examples of exploitation of information assurance issues in the
Web-banking arena include the following:
Copyright © 2005, Idea Group Inc. Copying or distributing in print or electronic forms without written
permission of Idea Group Inc. is prohibited.
TEAM LinG
238 Gupta, Rao and Upadhyaya
•
•
Many ATMs of Bank of America were made unavailable in January 2003
by the SQL Slammer worm, which also affected other financial services
like Washington Mutual3,4.
Barclays suffered an embarrassing incident when it was discovered that
after logging out of its online service, an account immediately could be reaccessed using the back button on a Web browser. If a customer accessed
their Barclays account on a public terminal, the next user could thereby view
banking details of the previous customer. According to the bank, when
customers join the online banking service, they are given a booklet that tells
them to clear the cache to prevent this from happening. However, this
procedure shifts the responsibility for security to the end user5.
Security and Privacy Issues
In their annual joint study in April 2002, the FBI and the Computer Security
Institute noted that the combined financial losses for 223 of 503 companies that
responded to their survey (Computer Crime and Security Survey) was $455
million for year 2002 (Junnarkar, 2002). Security and integrity of online transactions are the most important technical issues that a bank offering Web services
will need to tackle. The Internet bank Web sites handle security in different
ways. They can choose either public or private networks. The Integrion
consortium, for example, uses the private IBM/AT&T Global Network for all
Internet network traffic (Walsh, 1999). Server security is another important
issue, usually accomplished by server certificates and SSL authentication. Banks
must look at three kinds of security (Walsh, 1999): communications security;
systems security, from the applications/authorization server; and information
security.
Table 1. Standards in e-banking models
•
The ADMS Standard: Access Device Messaging System (ADMS) is a proprietary standard developed and
supported by Visa Interactive. From September 1998, this standard has been made obsolete for GOLD
standard.
•
The GOLD Standard: The GOLD standard is an electronic banking standard developed and supported by
Integrion to facilitate the exchange of information between participants in electronic banking transactions. Integrion is a PC direct-dial and Internet banking vendor developed as a consortium with 16
member banks, IBM and Visa Interactive (through acquisition) in an equal equity partnership. IBM is the
technology provider for the Integrion consortium.
•
The OFX Standard: Open Financial Exchange (OFX) is a standard developed cooperatively by Microsoft,
Intuit and Checkfree. Recently, Microsoft launched its OFX version 2.0 without the involvement of its
partners, Checkfree and Intuit. OFX v.2.0 is developed with XML to enable OFX to be used for bill
presentment. Though OFX can be considered as a much better solution for inter-operability needs of
banks, it imposes problems of incompatibility between older OFX versions.
•
The IFX Standard: Interactive Financial Exchange (IFX) initiative was launched in early 1998 by BITS
(the Banking Industry Technology Secretariat) in order to ensure convergence between OFX and another
proposed specification, GOLD, propounded by Integrion Financial Network. According to the IFX
forum, IFX specification provides a robust and scalable framework for the exchange of financial data and
instructions independent of a particular network technology or computing platform.
•
XML as standard: XML language is often perceived as a solution to the problem of standards incompatibility. XML appears as an ideal tool for multi-banking, multi-service Internet banking applications.
Copyright © 2005, Idea Group Inc. Copying or distributing in print or electronic forms without written
permission of Idea Group Inc. is prohibited.
TEAM LinG
Electronic Banking and Information Assurance Issues
239
From a user’s perspective, security must accomplish privacy, integrity
authentication, access control, and non-repudiation. Security becomes an even
more important issue when dealing with international banks, since only up to 128K
encryption is licensed for export. Currently, most Internet bank Web sites use a
combination of encryption, firewalls, and communications lines to ensure security. The basic level of security starts with an SSL-compliant browser. The SSL
protocol provides data security between a Web browser and the Web server, and
is based on public key cryptography licensed from security systems. Security has
been one of the biggest roadblocks that have kept consumers from fully
embracing Internet banking. Even after the advent of highly secure sites with the
aid of 128K encryption, a virtually invulnerable encryption technology, the
perception among some consumers is that Internet banking is unsafe. They
apprehend privacy violations, as the bank keeps track of all transactions, and they
are unsure of who has access to privileged data about their personal net worth.
The basic security concerns that face financial institutions offering banking
services and products through the Internet are summarized in Figure 2 and are
discussed next.
Authentication
Authentication relates to assurance of identity of person or originator of
data. Reliable customer authentication is imperative for financial institutions
engaging in any form of electronic banking or commerce. Strong customer
Figure 2. E-banking security infrastructure
S ta n d a rd s
C om p lia n ce
(Inter-operability
and acceptance)
E -b a n k in g
S ecu rity
In fr as tru ctu r e
R egu la to ry
C om p lia n ce
(Legal enforcement
and credibility)
In fo rm ation A ssu ra n ce Issu es an d C o n cern s
(Questions and problems)
Authentication
Access Control
Non-repudiation
Integrity
Confidentiality
Availability
Perimeter Defense
Intrusion Detection
Malicious Content
Incident Response
Administration
Social Engineering
Security Event Detection
S ecu rity S erv ice s, M e ch a n is m s
a n d P rotectio n
(Answers and solutions)
Encryption
Security Protocols
Kerberos
Firewalls, IDS
Passwords, PINs
Tokens
Biometrics
PKI, Certificates
HSDs
Crypto algorithms
Industry Standards
DR and CP Plans
Training and Awareness
Copyright © 2005, Idea Group Inc. Copying or distributing in print or electronic forms without written
permission of Idea Group Inc. is prohibited.
TEAM LinG
240 Gupta, Rao and Upadhyaya
authentication practices are necessary to enforce anti-money laundering measures and help financial institutions detect and reduce identity theft. Customer
interaction with financial institutions is migrating from physical recognition and
paper-based documentation to remote electronic access and transaction initiation. The risks of doing business with unauthorized or masquerading individuals
in an electronic banking environment could be devastating, which can result in
financial loss and intangible losses like reputation damage, disclosure of confidential information, corruption of data, or unenforceable agreements.
There is a gamut of authentication tools and methodologies that financial
institutions use to authenticate customers. These include the use of passwords
and personal identification numbers (PINs), digital certificates using a public key
infrastructure (PKI), physical devices such as smart cards or other types of
tokens, database comparisons, and biometric identifiers. The level of risk
protection afforded by each of these tools varies and is evolving as technology
changes. Multi-factor authentication methods are more difficult to compromise
than single factor systems. Properly designed and implemented multifactor
authentication methods are more reliable indicators of authentication and stronger fraud deterrents. Broadly, the authentication methodologies can be classified,
based on what a user knows (passwords, PINs), what a user has (smart card,
magnetic card), and what a user is (fingerprint, retina, voiceprint, signature).
The issues that face banks using the Internet as a channel are the risks and
risk management controls of a number of existing and emerging authentication
tools necessary to initially verify the identity of new customers and authenticate
existing customers that access electronic banking services. Besides, effective
authentication framework and implementation provides banks with a foundation
to enforce electronic transactions and agreements.
•
•
Account Origination and Customer Verification: With the growth in
electronic banking and commerce, financial institutions need to deploy
reliable methods of originating new customer accounts online. Customer
identity verification during account origination is important in reducing the
risk of identity theft, fraudulent account applications, and unenforceable
account agreements or transactions. There are significant risks when
financial institutions accept new customers through the Internet or other
electronic channels because of the absence of the tangible cues that banks
traditionally use to identify individuals (FDIC, 2001).
Monitoring and Reporting: Monitoring systems play a vital role in
detecting unauthorized access to computer systems and customer accounts. A sound authentication system should include audit features that can
assist in the detection of fraud, unusual activities (e.g., money laundering),
compromised passwords, or other unauthorized activities (FDIC, 2001. In
addition, financial institutions are required to report suspicious activities to
Copyright © 2005, Idea Group Inc. Copying or distributing in print or electronic forms without written
permission of Idea Group Inc. is prohibited.
TEAM LinG
Electronic Banking and Information Assurance Issues
241
appropriate regulatory and law enforcement agencies as required by 31
CFR 103.18.
Access Control
Access control refers to the regulating of access to critical business assets.
Access control provides a policy-based control of who can access specific
systems, what they can do within them, and when and from where they are
allowed access. One of the primary modes of access control is based on roles.
A role can be thought of as a set of transactions that a user or set of users can
perform within the context of an organization. For example, the roles in a bank
include teller, loan officer, and accountant, each of whom can perform different
functions. Role-based access control (RBAC) policy bases access control
decisions on the functions that a user is allowed to perform within an organization. In many applications, RBAC is concerned more with access to functions
and information than strictly with access to information.
The applicability of RBAC to commercial systems is apparent from its
widespread use. Nash and Poland (1990) discuss the application of role-based
access control to cryptographic authentication devices commonly used in the
banking industry. Even the Federal Information Processing Standard (FIPS) has
provisions for support for role-based access and administration.
Non-Repudiation
Non-repudiation refers to the need for each party involved in a transaction
to not go back on their word; that is, not break the electronic contract (Pfleeger,
1997). Authentication forms the basis for non-repudiation. It requires strong and
substantial evidence of the identity of the signer of a message and of message
integrity sufficient to prevent a party from successfully denying the origin,
submission, or delivery of the message and the integrity of its contents. This is
important for an e-banking environment where, in all electronic transactions,
including ATMs (cash machines), all parties to a transaction must be confident
that the transaction is secure; that the parties are who they say they are
(authentication), and that the transaction is verified as final. Essentially, banks
must have mechanisms that ensure that a party cannot subsequently repudiate
(reject) a transaction. There are several ways to ensure non-repudiation, which
include digital signatures, which not only validate the sender but also “time
stamps” the transaction, so it cannot be claimed subsequently that the transaction
was not authorized or not valid.
Integrity
Ensuring integrity means maintaining data consistency and protecting from
unauthorized data alteration (Pfleeger, 1997). Integrity is very critical for
Internet banking applications, as transactions have information that is consumer
and business sensitive. To achieve integrity, data integrity mechanisms can be
Copyright © 2005, Idea Group Inc. Copying or distributing in print or electronic forms without written
permission of Idea Group Inc. is prohibited.
TEAM LinG
242 Gupta, Rao and Upadhyaya
used. These typically involve the use of secret-keyor public-key-based algorithms
that allow the recipient a piece of protected data to verify that the data have not been
modified in transit. The mechanisms are presented further in a later section.
Confidentiality and Privacy
Privacy and security concerns are not unique to banking systems. Privacy
and confidentiality are related but are distinct concepts. Protection of personally
identifiable information like banking records must be ensured for consumers.
Information Privacy (NIIAC, 1995) is the ability of an individual to control the use
and dissemination of information that relates to him or her. Confidentiality
(NIIAC, 1995) is a tool for protecting privacy. Sensitive information is accorded
a confidential status that mandates specific controls, including strict limitations
on access and disclosure. Those handling the information must adhere to these
controls. Information confidentiality refers to ensuring that customer information
is secured and hidden as it is transported through the Internet environment.
Information not only must be protected wherever it is stored (e.g., on computer
disks, backup tape, and printed form), but also in transit through the Internet.
Availability
Availability in this context means that legitimate users have access when
they need it. With Internet banking, one of the strongest selling propositions is 24/
7 availability; therefore, it becomes even more critical for e-banks. Availability
applies both to data and to services. Expectations of availability include presence
of a service in usable form, capacity to meet service needs, timeliness of service,
fair allocation, fault tolerance, controlled concurrency, and deadlock management. One example where availability is compromised is the denial of service
attack. On the Internet, a denial of service (DoS) attack is an incident in which
a user or organization is deprived of the services of a resource they would
normally expect to have. When there are enormous transactions on the Internet
bank’s Web site, the losses that may arise owing to unavailability are severe in
terms of financial losses and reputation losses. Typically, the loss of service is the
inability of a particular network service, such as email, to be available or the
temporary loss of all network connectivity and services. It becomes imperative
and crucial for IT managers in the Internet banking world to better understand the
kind of denial of attacks possible. Some of the common and well-known types of
denial of service attacks (IESAC, 2003) are the following:
•
SYN Attack: It floods the server with open SYN connections, without
completing the TCP handshake. TCP handshake is a three-step process to
negotiate connection between two computers. The first step is for initiating
the computer to send SYN (for synchronize) packet.
Copyright © 2005, Idea Group Inc. Copying or distributing in print or electronic forms without written
permission of Idea Group Inc. is prohibited.
TEAM LinG
Electronic Banking and Information Assurance Issues
•
•
243
Teardrop Attack: It exploits the way that the Internet Protocol (IP)
requires a packet that is too large for the next router to handle be divided into
fragments. Here, the attacker’s IP puts a confusing offset value in the
second or later fragment of the packet. It can cause the system to crash.
Smurf Attack: In this attack, the perpetrator spoofs the source IP address
and broadcasts ping requests to a multitude of machines to overwhelm the
victim.
Perimeter Defense
Perimeter defense refers to the separation of an organization’s computer
systems from the outside world (IETF, 2000). This must allow free sharing of
certain information with clients, partners, suppliers, and so on, while also
protecting critical data from them. A security bulwark around network and
information assets of any bank can be achieved to a certain extent by implementing firewalls and correctly performing tuning and configuration of firewalls.
Today, with the kind of traffic generated toward Web-banking sites for all
kinds of purposes, from balance enquiries to interbank fund transfers, implementation of screening routers to ensure incoming and outgoing traffic would add
another layer of security. In this age of systems being hijacked for cyber-attacks,
it is also important that screen routers detect and prevent outgoing traffic that
attempts to gain entry to systems like spoofing IP addresses. Further, the
periphery of the corporate computer infrastructure can be bolstered by implementing VPN solutions to ensure privacy of data flowing through the firewall into
the public domain.
Probes and scans often are used techniques that are exploited to learn about
exposures and vulnerabilities on the network systems. A probe is characterized
by unusual attempts to gain access to a system or to discover information about
the system. Probes are sometimes followed by a more serious security event, but
often they are the result of curiosity or confusion. A scan is simply a large number
of probes done using an automated tool. Scans can sometimes be the result of a
misconfiguration or other error, but they are often a prelude to a more directed
attack on systems that the intruder has found to be vulnerable.
Intrusion Detection
Intrusion detection refers to the ability to identify an attempt to access
systems and networks in a fashion that breaches security policies. The Internet
banking scenario, where most of business these days is carried out over public
domain Internet and where a banking Web site becomes a single point interface
for information as well as transactions, gives hackers enough motivation to
intrude into Internet banks’ systems. To safeguard from such unwanted activities, organizations need to be able to recognize and distinguish, at a minimum, the
following (Gartner, 1999): internal and external intrusion attempts; human versus
Copyright © 2005, Idea Group Inc. Copying or distributing in print or electronic forms without written
permission of Idea Group Inc. is prohibited.
TEAM LinG
244 Gupta, Rao and Upadhyaya
automated attacks; unauthorized hosts connecting to the network from inside and
outside the perimeter; unauthorized software being loaded on systems; and all
access points into the corporate network.
Intrusion detection systems (IDS) allow organizations to protect their
systems from the threats that come with increasing network connectivity and
reliance on information systems. Given the level and nature of modern network
security threats, the question for security professionals should not be whether to
use intrusion detection, but which intrusion detection features and capabilities to
use. IDSs have gained acceptance as a necessary addition to every organization’s
security infrastructure. IDS products can provide worthwhile indications of
malicious activity and spotlight security vulnerabilities, thus providing an additional layer of protection. Without them, network administrators have little
chance of knowing about, much less assessing and responding to, malicious and
invalid activity. Properly configured, IDSs are especially useful for monitoring
the network perimeter for attacks originating from outside and for monitoring
host systems for unacceptable insider activity.
Security Event Detection
Security event detection refers to the use of logs and other audit mechanisms
to capture information about system and application access, types of access,
network events, intrusion attempts, viruses, and so forth. Logging is an important
link in the analysis of attack and real-time alerts of any kind of suspicious activity
on the Internet bank Web site. For proper tracking of unusual events and attempts
of intrusion, the following logs should be collected: basic security logs, network
event logging, log authentication failures, log access violations, log attempts to
implant viruses and other malicious code, and log abnormal activity. This strongly
implies that the technical department that is analyzing logs to identify unusual
behavior must be aware of business initiatives. In addition, it has to be ensured
that audit logs are retained long enough to satisfy legal requirements. Also, at a
minimum, investigation of security breaches should be allowed for up to 14 days
after any given attack (IETF, 2000). Today, data mining techniques can interpret
millions of items of log data and reveal any unobserved attempts to breach an
ebank’s Web site. For this, it has to be ensured that logs do not overwrite
themselves causing loss of data. For analysis of events at a site, documentation
of automated systems that identify what the logs mean should be maintained.
Understanding the nature of attempts such as whether an attack was from within
the organization or from outside or whether it was just a false alarm is critical to
security.
Malicious Content
Malicious content refers to programs of any type that are introduced into a
system to cause damage or steal information. Malicious content includes viruses,
Trojan horses, hacker tools, and network sniffers. While common in multiple
Copyright © 2005, Idea Group Inc. Copying or distributing in print or electronic forms without written
permission of Idea Group Inc. is prohibited.
TEAM LinG
Electronic Banking and Information Assurance Issues
245
domains, this is as important in the e-banking world, as well. Malicious code
brings with it the potential to create serious technical and economic impact by
crashing e-mail servers and networks, causing millions of dollars of damage in lost
productivity.
Some of the common forms of malicious contents are the following:
•
•
•
Virus: A virus is a computer program that runs on a system without being
asked to do so, created to infect other computer programs with copies of
itself. Pioneer virus researcher Fred Cohen has defined a virus as “a
program that can ‘infect’ other programs by modifying them to include a,
possibly evolved, copy of it.”
Worm: A worm has the ability to spread over a network and, thus, can take
advantage of the Internet to do its work. Worms reside in memory and
duplicate themselves throughout the network without user intervention.
Trojan Horse: A Trojan horse is the name applied to a malicious computer
program disguised as a seemingly innocent activity such as initiating a
screen saver, accessing an e-mail attachment, or downloading executable
files from an untrusted Web site. Some of the widely manifested malicious
codes are Stoned, Yankee, Michelangelo, Joshi, Lehigh, Jerusalem, MBDF
(for Macintosh), Melissa, Concept, LoveBug (ILOVEYOU), ShapeShift,
Fusion, Accessiv, Emporer, Sircam, Nimda, and Badtrans.
Protection against malicious codes like viruses, worms, Trojan horses, and
so forth could be effectively dealt with by installing security protection software
that thwarts and mitigates the effects of codes. However, such software provides
only a level of defense and is not by itself sufficient. Recommendations for ebanking IT infrastructure include (Noakes, 2001):
•
•
•
•
Install detection and protection solutions for all forms of malicious code, not
just an antivirus solution.
Ensure that all users are aware of and follow safe behavior practices—do
not open attachments that have not been scanned, do not visit untrusted Web
sites, and so forth.
Ensure that users are aware of how easy data may be stolen automatically
just by visiting a Web site. Install an effective solution. Keep it current with
the latest signatures as new forms of malicious code are identified.
Use anti-spammers, harden operating systems, configure stricter firewall
rules, and so forth.
Security Services, Mechanisms, and Security Protection
Security risks are unlike privacy risks; they originate outside the Financial
Service Provider (FSP) and change rapidly with advances in technology (DeLotto,
Copyright © 2005, Idea Group Inc. Copying or distributing in print or electronic forms without written
permission of Idea Group Inc. is prohibited.
TEAM LinG
246 Gupta, Rao and Upadhyaya
1999). In December 2000, IATF released guidelines that require all covered
institutions to secure their clients’ personal information against any reasonably
foreseeable internal or external threats to their security, confidentiality, and
integrity. By July 1, 2001, FSPs were expected to develop customer information
security programs that ensured the security and confidentiality of customer
information, protected against any anticipated threats or hazards to the security
or integrity of customer information, and protected against unauthorized access
to or use of customer information that could result in substantial harm or
inconvenience to customers.
The services and mechanisms that are prevalent in an e-banking environment are presented below in order to provide an understanding of key issues and
terms involved.
Encryption
Encryption is the process of using a key to scramble readable text into
unreadable cyphertext. Encryption on the Internet, in general, and e-banking, in
particular, have many uses, from the secure transmission of credit card numbers
via the Web to protecting the privacy of personal e-mail messages. Authentication also uses encryption by using a key or key pair to verify the integrity of a
document and its origin. The Data Encryption Standard (DES) has been endorsed
by the National Institute of Standards and Technology (NIST) since 1975 and is
the most readily available encryption standard. Rivest, Shamir, and Adleman
(RSA) encryption is a public-key encryption system; it is a patented technology
in the United States and, thus, is not available without a license. RSA encryption
is growing in popularity and is considered quite secure from brute force attacks.
Another encryption mechanism is Pretty Good Privacy (PGP), which allows
users to encrypt information stored on their system as well as to send and receive
encrypted e-mail. Encryption mechanisms rely on keys or passwords. The longer
the password, the more difficult the encryption is to break. VPNs employ
encryption to provide secure transmissions over public networks such as the
Internet.
Security Protocol Services
The Internet is viewed as an insecure place. Many of the protocols used in
the Internet do not provide any security. Today’s businesses, particularly the
banking sector, must integrate security protocols into their e-commerce infrastructure to protect customer information and privacy. Some of the most common
protocols are discussed briefly in Appendix A.
Firewalls and Intrusion Detection Systems
A firewall is a collection of hardware and software designed to examine a
stream of network traffic and service requests. Its purpose is to eliminate from
Copyright © 2005, Idea Group Inc. Copying or distributing in print or electronic forms without written
permission of Idea Group Inc. is prohibited.
TEAM LinG
Electronic Banking and Information Assurance Issues
247
the stream those packets or requests that fail to meet the security criteria
established by the organization. A simple firewall may consist of a filtering router,
configured to discard packets that arrive from unauthorized addresses or that
represent attempts to connect to unauthorized service ports. Firewalls can filter
packets based on their source and destination addresses and port numbers. This
is known as address filtering. Firewalls also can filter specific types of network
traffic. This is also known as protocol filtering, because the decision to forward
or reject traffic is dependent upon the protocol used (e.g., HTTP, ftp, or telnet).
Firewalls also can filter traffic by packet attribute or state. But a firewall cannot
prevent individual users with modems from dialing into or out of the network,
bypassing the firewall altogether (Odyssey, 2001). In this age of systems being
hijacked, it is also important that firewalls and screen routers detect and prevent
outgoing traffic that attempts to compromise the integrity of the systems. A
Network Intrusion Detection System (NIDS) analyzes network traffic for
attacks. It examines individual packets within the data stream to identify threats
from authorized users, backdoor attacks, and hackers who have thwarted the
control systems to exploit network connections and access valuable data. NIDS
adds a new level of visibility into the nature and characteristics of the network.
They provide information about the use and usage of the network. Host Based
IDS/Event Log Viewers are a kind of IDS that monitors event logs from multiple
sources for suspicious activity. Host IDS is best placed to detect computer misuse
from trusted insiders and those who have infiltrated the network. The technology
and logical schemes used by these systems often are based on knowledge-based
misuse detection (Allan, 2002). Knowledge-based detection methods use
information about known security policy, known vulnerabilities, and known
attacks on the systems they monitor. This approach compares network activity or
system audit data to a database of known attack signatures or other misuse
indicators, and pattern matches produce alarms of various sorts. Behavior-based
detection (Allan, 2002) methods use information about repetitive and usual
behavior on the systems they monitor. Also called anomaly detection, this
approach notes events that diverge from expected (based on repetitive and usual)
usage patterns. One technique is threshold detection (Allan, 2002) in which
certain attributes of user and system behavior are expressed in terms of counts,
with some level established as permissible. Another technique is to perform
statistical analysis (Allan, 2002) on the information, build statistical models of the
environment, and look for patterns of anomalous activity.
Passwords and Personal Identification Numbers (PINs)
The most common authentication method for existing customers requesting
access to electronic banking systems is the entry of a user name and a secret
string of characters such as a password or PIN. User IDs combined with
passwords or PINs are considered a single-factor authentication technique.
Copyright © 2005, Idea Group Inc. Copying or distributing in print or electronic forms without written
permission of Idea Group Inc. is prohibited.
TEAM LinG
248 Gupta, Rao and Upadhyaya
There are three aspects of passwords that contribute to the security they provide:
secrecy, length and composition, and system controls. In the present Internet
banking scenario, there are policies, for customers as well as employees, set by
banks for passwords to ensure effective authentication, like prohibiting using
public e-mail IDs as user IDs, ensuring that there are no user IDs with no
password, ensuring that policies exist and can be automatically enforced
concerning minimum password length, password format (i.e., which characters
make up a valid password), expiration and renewal of passwords, uniqueness of
passwords, not allowing the use of real words for passwords, and so forth.
Tokens
The use of a token represents authentication using something the customer
possesses. Typically, a token is part of a two-factor authentication process,
complemented by a password as the other factor. There are many benefits to the
use of tokens. The authentication process cannot be completed unless the device
is present. Static passwords or biometric identifiers used to activate the token
may be authenticated locally by the device itself. This process avoids the
transmission of shared secrets over an open network such as the Internet.
Digital Certificates and Public Key Infrastructure (PKI)
A financial institution may use a PKI system to authenticate customers to
their own electronic banking product. Institutions may also use the infrastructure
to provide authentication services to customers who wish to transact business
over the Internet with other entities or to identify employees and commercial
partners seeking access to the business’ internal systems. A properly implemented and maintained PKI may provide a strong means of customer identification over open networks such as the Internet. By combining a variety of hardware
components, system software, policies, practices, and standards, PKI can
provide for authentication, data integrity, and defenses against customer repudiation, and confidentiality (Odyssey, 2001). The certificate authority (CA), which
may be the financial institution or its service provider, plays a key role by attesting
with a digital certificate that a particular public key and the corresponding private
key belong to a specific individual or system. It is important when issuing a digital
certificate that the registration process for initially verifying the identity of
customers is adequately controlled. The CA attests to the individual’s identity by
signing the digital certificate with its own private key, known as the root key.
Each time the customer establishes a communication link with the financial
institution, a digital signature is transmitted with a digital certificate. These
electronic credentials enable the institution to determine that the digital certificate
is valid, identify the individual as a customer, and confirm that transactions
entered into the institution’s computer system were performed by that customer.
PKI, as the most reliable model for security and trust on the Internet, offers a
Copyright © 2005, Idea Group Inc. Copying or distributing in print or electronic forms without written
permission of Idea Group Inc. is prohibited.
TEAM LinG
Electronic Banking and Information Assurance Issues
249
comprehensive e-security solution for Internet banking. Unlike the other security
models, PKI is a standards compliant, most credible trust framework, highly
scalable and modular. PKI comprehensively satisfies the security requirements
of e-banking (Odyssey, 2001).
A brief discussion on the processes and mechanisms used in PKI to address
common security concerns follows:
•
•
•
•
•
Authentication: The customer requests the Registration Authority (RA)
for a certificate. The Registration Authority validates the customer’s
credentials. After valid credentials are ensured, the RA passes the certificate request to the Certification Authority (CA). CA then issues the
certificates. A digital certificate can be stored on the browser on the user’s
computer, on a floppy disk, on a smart card, or on other hardware tokens.
Confidentiality: The customer generates a random session key at his or her
end. The session key is sent to the bank, encrypting it with the bank’s public
key. The bank decrypts the encrypted session key with its private key. The
session key is employed for further transactions.
Integrity: The message is passed through a suitable hashing algorithm to
obtain a message digest or hash. The hash, encrypted with the sender’s
private key, is appended to the message. The receiver, upon receiving the
message, passes it through the same hashing algorithm. The digest the
receiver obtains is compared with the received and decrypted digest. If the
digests are the same, it implies that the data have not been tampered with
in transit.
Non-Repudiation: The hash is encrypted with the sender’s private key to
yield the sender’s digital signature. Since the hash is encrypted with the
sender’s private key (which is accessible only to the sender), it provides an
indisputable means of non-repudiation.
The use of digital signatures and certificates in Internet banking has
provided the trust and security needed to carry out banking transactions
across open networks like the Internet. PKI, being a universally accepted
standards compliant security model, provides for the establishment of a
global trust chain. (Odyssey, 2001).
Biometrics
A biometric identifier measures an individual’s unique physical characteristic or behavior and compares it to a stored digital template to authenticate that
individual. A biometric identifier representing “something the user is” can be
created from sources such as a customer’s voice, fingerprints, hand or face
geometry, the iris or retina in an eye, or the way a customer signs a document or
enters keyboard strokes (FDIC, 2001). The success of a biometric identifier rests
on the ability of the digitally stored characteristic to relate typically to only one
Copyright © 2005, Idea Group Inc. Copying or distributing in print or electronic forms without written
permission of Idea Group Inc. is prohibited.
TEAM LinG
250 Gupta, Rao and Upadhyaya
individual in a defined population. Although not yet in widespread use by financial
institutions for authenticating existing customers, biometric identifiers are being
used in some cases for physical access control.
Banks could use a biometric identifier for a single or multi-factor authentication process. ATMs that implement biometrics like iris-scan technologies are
examples of the use of a biometric identifier to authenticate users. The biometric
identifier may be used for authentication instead of the PIN. A customer can use
a PIN or password to supplement the biometric identifier, making it part of a more
secure two-factor authentication process. Financial institutions also may use
biometric identifiers for automating existing processes. Another application
would be a financial institution that allows customer to reset a password over the
telephone with voice-recognition software that authenticates the customer. An
authentication process that relies on a single biometric identifier may not work
for everyone in a financial institution’s customer base. Introducing a biometric
method of authentication requires physical contact with each customer to
capture initially the physical identifier, which further buttresses the initial
customer verification process. But this process may increase the deployment
costs.
Hardware Security Devices (HSDs)
This mechanism is an extension to usage of tokens for authentication. Using
hardware devices for authentication provides “hacker-resistant” and “snoopingproof” two-factor authentication, which results in easy-to-use, effective user
identification (Grand, 2001). To access protected resources, the user simply
combines his or her secret PIN (something the user knows) with the code
generated by the user’s token (something the user has). The result is a unique,
one-time-use code that is used to positively identify, or authenticate, the user
(Grand, 2001). Some central server validates the code. The goal is to provide
acceleration, secure key management.
A hardware security module is a hardware-based security device that
generates, stores, and protects cryptographic keys. There are universal criteria
for rating these devices. The criteria are documented in a Federal Information
Processing Standard (FIPS) called FIPS 140-1 to 140-4—Security for Cryptographic Modules. Such hardware devices generate tokens that are dynamic, onetime passwords through the use of a mathematical function. Passwords generated by tokens are different each time the user requests one, so an intercepted
password is useless, as it will never be used again. Acceptance and credibility of
the devices is reflected in the increasing number of devices in use.
Industry Standards and Frameworks
Industry standards for financial transactions over the Internet are an
absolute necessity for ensuring various security aspects of business as well as
consumer confidence. There have been a constant search and a development of
Copyright © 2005, Idea Group Inc. Copying or distributing in print or electronic forms without written
permission of Idea Group Inc. is prohibited.
TEAM LinG
Electronic Banking and Information Assurance Issues
251
Table 2. End-user involvement with the security issues
standards for e-banking infrastructural tenets like authentication, access control,
non-repudiation, and so forth. Some of the standards developed and advocated
by different industry players and their proponents are briefly discussed in
Appendix B, which will provide an overall understanding of the evolution and
prevalence of some of the standards.
User and E-Banking Focus on Security Issues
To summarize, Table 2 presents issues over which the user has direct control
or with which the user has involvement, and issues that are commonly left for the
systems to handle.
CONCLUSIONS
It should be noted that the discussion of e-banking information assurance
(IA) issues also has included several generic IA issues. To illustrate this, Table
3 briefly categorizes e-banking-specific information assurance issues and generic issues separately. Some issues may be more significant than in other areas.
We have made an attempt to comprehensively discuss all the areas in the article.
Security for financial transactions is of vital importance to financial institutions providing or planning to provide service delivery to customers over the
Internet, as well as to suppliers of products, services, and solutions for Internetbased e-commerce. The actual and perceived threats to Internet-based banking
define the need for a set of interrelated security services to provide protection to
all parties who can benefit from Web banking in a secure environment. Such
services may be specific to counter particular threats or may be pervasive
Copyright © 2005, Idea Group Inc. Copying or distributing in print or electronic forms without written
permission of Idea Group Inc. is prohibited.
TEAM LinG
252 Gupta, Rao and Upadhyaya
Table 3. IA issues
throughout an Internet-based environment to provide the levels of protection
needed.
There are also requirements that the entire e-commerce environment be
constructed from components that recognize the need for security services and
provide means for overall security integration, administration, and management.
These services that offer the security from an infrastructure standpoint are found
throughout the e-commerce network and computing infrastructure. Financial
institutions should carry out, as a matter of corporate security policy, identification of likely targets, which should include all systems that are open to the public
network, such as routers, firewalls, Web servers, modem banks’ Web sites, and
internal unsecured systems such as desktops. They should regularly revise and
update their policies on auditing, risk assessment, standards, and key management. Vulnerability assessment and identification of likely targets and the
recognition of systems most vulnerable to attack are critical in the e-banking
arena. Accurate identification of vulnerable and attractive systems will contribute to prioritization when addressing problem areas.
ACKNOWLEDGMENTS
The authors would like to thank John Walp and Shamik Banerjee for their
contributions and help with this chapter, and the anonymous referees for their
comments that have improved this chapter. We would also like to thank the NSA
for the Center for Information Assurance recognition and the Department of
Defense for two student fellowships. The research of the second author was
supported in part by National Science Foundation (NSF) under grant 990735, and
the research of the third author was supported in part by the U.S. Air Force
Research Lab, Rome, New York, under Contract F30602-00-10505.
REFERENCES
Allan, A. (2002). Technology overview. Intrusion detection systems (IDSs):
Perspective. Gartner Research Report (DPRO-95367).
Basel Committee (2001). Risk management Principles for electronic banking. Basel Committee Publication No. 82.
Copyright © 2005, Idea Group Inc. Copying or distributing in print or electronic forms without written
permission of Idea Group Inc. is prohibited.
TEAM LinG
Electronic Banking and Information Assurance Issues
253
Bohle, K. (2001). Integration of Internet payment systems—What’s the problem? ePSO (E-payments systems Observatory)—–Newsletter. Retrieved
March 1, 2003, from http://epso.jrc.es/newsletter/vol11/ 5.html
Burt, S. (2002). Online banking: Striving for compliance in cyberspace. Bankers
Systems Inc. Retrieved September 5, 2002, from http://www.bankers
systems.com/compliance/article13.html
DeLotto, R. (1999). Competitive intelligence for the e-financial service
provider. Gartner Group Research Report.
Dittrich, D. (1999). Incident response steps. Lecture series at University of
Washington.
FDIC (Federal Deposit Insurance Corporation) (2001). Authentication in electronic banking. Financial Institution Letters.
FIPS (Federal Information Processing Standard). (1992). Security requirements for cryptographic modules. Federal Information Processing Standard 140-1. National Institute of Standards and Technology.
GartnerGroup RAS Services. (1999). Intrusion detection systems. R-08-7031.
Glaessner, T., Kellermann, T., & McNevin, V. (2002). Electronic security: Risk
mitigation in financial transactions. Public policy issues. The World
Bank.
Grand, J. (2001). Authentication tokens: Balancing the security risks with
business requirements. Cambridge, MA: Stake, Inc.
IESAC (2003). Transactional security. Institution of Engineers, Saudi Arabian Center. Retrieved January 12, 2003, from http://www.iepsac.org/
papers/p04c04a.htm
Internet Security Task Force (2000). Initial recommendations for conducting
secure ebusiness. Retrieved January 12, 2003, from http://www.ca.com/
ISTF/recomme ndations.htm
Junnarkar, S. (2002). Online banks: Prime targets for attacks. e-Business
ZDTech News Update.
Maconachy, W.V., Schou, C.D., Ragsdale, D., & Welch, D. (2001, June 5-6). A
model for information assurance: An integrated approach. Proceedings of
the 2001 IEEE Workshop on Information Assurance and Security,
United States Military Academy, West Point, NY.
Marchany, R. (1998). Internet security & incident response: Scenarios &
tactics. Retrieved February 2, 2003, from https://courseware.vt.edu/
marchany/InternetSecurity/Class
NIIAC (The National Information Infrastructure Advisory Council) (1995).
Common ground: Fundamental principles for the national information
infrastructure.
Noakes, K. (2001). Virus and malicious code protection products: Perspective. Fry Technology Overview, Gartner Research Group, DPRO-90840.
OCC (Office of the Comptroller of the Currency) (1998). OCC bulletin 98-3
Technology risk management. PC Banking.
Copyright © 2005, Idea Group Inc. Copying or distributing in print or electronic forms without written
permission of Idea Group Inc. is prohibited.
TEAM LinG
254 Gupta, Rao and Upadhyaya
OCC (Office of the Comptroller of the Currency) (2001). AL 2001-4 OCC
advisory letter.
Odyssey Technologies (2001). PKI for Internet banking. Retrieved August 23,
2002, from http://www.odysseytec.com
Orr, B. (2002). Infrastructure, not innovation. ABA Banking Online Journal.
Retrieved August 8, 2002, from http://www.banking.com/aba/infra
structure.asp
Pfleeger, C.P. (1997). Security in computing. Upper Saddle River, NJ: Prentice
Hall.
Poland, K.R., & Nash, M.J. (1990). Some conundrums concerning separation of
duty. IEEE Symposium on Computer Security and Privacy.
Starita, L. (1999). Online banking: A strategic perspective. Context Overview Report (R-08-7031-Gartner).
United States Senate (2002). Financial services modernization act: Provisions of
GLB act. The United States Senate. Retrieved August 8, 2002, from http:/
/www.senate.gov/~banking/conf/grmleach.htm
Walsh, E. (1999). Technology overview: Internet banking: Perspective.
DPRO-90293, Gartner.
Walsh, E. (2002). Product report: S1 corporate suite e-banking software.
DPRO-95913 Gartner Research Group.
ENDNOTES
1
2
3
4
5
6
7
http://www.epaynews.com/statistics/bankstats.html
http://www.orcc.com
Robert Lemos, Staff Writer, CNET news.com, Counting the Cost of
Slammer, Retrieved March 31, 2003, from http://news.com.com/21001001-982955.html
Reuters, Seattle (Washington), CNN.com, Technology news, Feb 5,
2003. Retrieved March 8, 2003, from http://www.cnn.com/2003/TECH/
internet/02/05/virus.spread.reut/
Atomic Tangarine Inc, NPV: Information Security¸Retrieved March 21,
2003, from www.ttivanguard.com/risk/netpresentvalue.pdf
The latest version of the specifications, EMV 2000 version 4.0, published
December 2000, http://www. emvco.com/).
CEN/ISSS was created in mid-1997 by CEN (European Committee for
Standardization) and ISSS (Information Society Standardization) to provide
a comprehensive and integrated range of standardization-oriented services
and products.
Copyright © 2005, Idea Group Inc. Copying or distributing in print or electronic forms without written
permission of Idea Group Inc. is prohibited.
TEAM LinG
Electronic Banking and Information Assurance Issues
255
APPENDIX A:
COMMON SECURITY PROTOCOL
SERVICES
Protocol
Secure Sockets Layer
(SSL)
Secure Shell (SSH)
AS1 and AS2
Digital Certificates
Pretty Good Privacy (PGP)
Secure Multipurpose
Internet Mail Extension
(S/MIME)
Secure HTTP
HTTP)
(S-
Simple Key management
for Internet Protocols
(SKIP)
Encapsulating Security
Payload (ESP)
Authentication Header
(AH)
Description
Originally developed by Netscape, the SSL security protocol provides data encryption, server authentication, message
integrity, and optional client authentication for a TCP/IP connection. SSL has been universally accepted on the World
Wide Web for authenticated and encrypted communication between clients and servers. However, SSL consumes large
amounts of the Web server's processing power due to the massive cryptographic computations that take place when a
secure session is initiated. If many secure sessions are initiated simultaneously, then the Web server quickly becomes
overburdened. The results are slow response times, dropped connections, and failed transactions.
SSH Secure Shell is the de facto standard for remote logins. It solves an important security problem on the Internet of
password hacking. Typical applications include secure use of networked applications, remote system administration,
automated file transfers, and access to corporate resources over the Internet.
AS1 provides S/MIME encryption and security over SMTP (Simple Mail Transfer Protocol) through object signature
and object encryption technology. AS2 goes a step further than AS1 by supporting S/MIME over HTTP and HTTPS.
Both AS1 and AS2 provide data authentication, proving that the sender and receiver are indeed the people or company
that they claim to be.
Digital certificates are used to authenticate the identity of trading partners, ensuring partners are really who they say
they are. In addition to data authentication, digital signatures support non-repudiation, proving that a specific message
did come from a known sender at a specific time. A digital signature is a digital code that can be sent with electronically
transmitted message and it uniquely identifies the sender. It is based on digital certificates. This prevents partners from
claiming that they didn’t send or receive a particular message or transaction.
PGP is a freely available encryption program that uses public key cryptography to ensure privacy over FTP, HTTP and
other protocols. PGP is the de-facto standard software for the encryption of e-mail and works on virtually every
platform. But PGP suffers from absence of Trust management and it is not standards compliant though it could provide
for integrity, authentication, non-repudiation and confidentiality.. PGP also provides tools and utilities for creating,
certifying, and managing keys.
S/MIME addresses security concerns such as privacy, integrity, authentication and non-repudiation, through the use of
signed receipts. S/MIME provides a consistent way to send and receive secure MIME data. Based on the MIME
standard, S/MIME provides authentication, message integrity, non-repudiation of origin (using digital signatures) and
data confidentiality (using encryption) for electronic messaging applications. Since its development by RSA in 1996,
S/MIME has been widely recognized and widely used standard for messaging. The technology for S/MIME is primarily
built on the Public Key Cryptographic Standard, which provides cryptographic interoperability. Two key features of
S/MIME are the digital signature and the digital envelope. Digital signatures ensure that a message has not been
tampered with during transit. Digital signatures also provide non-repudiation so senders can’t deny that they sent the
message.
S-HTTP is an extension to HTTP, which provides a number of security features, including Client/Server
Authentication, Spontaneous Encryption and Request/Response Non-repudiation. S-HTTP allows the secure exchange
of files on the World Wide Web. Each S-HTTP file is either encrypted, contains a digital certificate, or both. For a
given document, S-HTTP is an alternative to another well-known security protocol, Secure Sockets Layer (SSL). A
major difference is that S-HTTP allows the client to send a certificate to authenticate the user whereas, using SSL, only
the server can be authenticated. S-HTTP is more likely to be used in situations where the server represents a bank and
requires authentication from the user that is more secure than a userid and password.
It is a manifestation of IP-Level Cryptography that secures the network at the IP packet level. Any networked
application gains the benefits of encryption, without requiring modification. SKIP is unique in that an Internet host can
send an encrypted packet to another host without requiring a prior message exchange to set up a secure channel. SKIP is
particularly well suited to IP networks, as both are stateless protocols.
ESP is security protocol that provides data confidentiality and protection with optional authentication and replaydetection services. ESP completely encapsulates user data. ESP can be used either by itself or in conjunction with AH.
ESP may be implemented with AH, as discussed in next paragraph, in a nested fashion through the use of tunnel mode.
Security services can be provided between a pair of communicating hosts, between a pair of communicating security
gateways, or between a security gateway and a host, depending on the implementation. ESP may be used to provide the
same security services, and it also provides a confidentiality (encryption) service. Specifically, ESP does not protect any
IP header fields unless those fields are encapsulated by ESP (tunnel mode).
A security protocol that provides authentication and optional replay-detection services. AH is embedded in the data to
be protected (a full IP datagram, for example). AH can be used either by itself or with Encryption Service Payload
(ESP). The IP Authentication Header is used to provide connectionless integrity and data origin authentication for IP
datagrams, and to provide protection against replays. AH provides authentication for as much of the IP header as
possible, as well as for upper level protocol data. However, some IP header fields may change in transit and the value of
these fields, when the packet arrives at the receiver, may not be predictable by the sender. The values of such fields
cannot be protected by AH. Thus the protection provided to the IP header by AH is somewhat piecemeal and not
complete.
Copyright © 2005, Idea Group Inc. Copying or distributing in print or electronic forms without written
permission of Idea Group Inc. is prohibited.
TEAM LinG
256 Gupta, Rao and Upadhyaya
APPENDIX B:
SOME INDUSTRY STANDARDS AND
FRAMEWORKS IN E-BANKING
Standard
SET
HBCI
EMV1
CEPS
XMLPay
ECML
W3C standard on
micropayments
Passport
eWallet project of
CEN/ISSS2
SEMPER
IOTP
SEPP
STT
JEPI
1
2
Description
Secure Electronic Transaction (SET) is a system for ensuring the security of financial transactions on the Internet. It was
supported initially by Mastercard, Visa, Microsoft, Netscape, and others. With SET, a user is given an electronic wallet
(digital certificate) and a transaction is conducted and verified using a combination of digital certificates and digital
signatures among the purchaser, a merchant, and the purchaser's bank in a way that ensures privacy and confidentiality. SET
makes use of Netscape's Secure Sockets Layer (SSL), Microsoft's Secure Transaction Technology (STT), and Terisa System's
Secure Hypertext Transfer Protocol (S-HTTP). SET uses some but not all aspects of a public key infrastructure (PKI). SET
provides authentication, integrity, non-repudiation and confidentiality.
HBCI is a specification for the communication between intelligent customer systems and the corresponding computing
centers for the exchange of home banking transactions. The transmission of data is done by a net data interface, which is
based on flexible delimiter syntax.
Specifications by Europay, MasterCard and Visa that define a set of requirements to ensure interoperability between chip
cards and terminals on a global basis, regardless of the manufacturer, the financial institution, or where the card is used.
The Common Electronic Purse Specifications (CEPS) define requirements for all components needed by an organization to
implement a globally interoperable electronic purse program, while maintaining full accountability and auditability. CEPS,
which were made available in March of 1999, outline overall system security, certification and migration. CEPS have paved
the way for the creation of an open, de facto, global electronic purse standard (http://www.cepsco.com/).
XMLPay is a standard proposed/developed by Ariba and Verisign. It defines an XML syntax for payment transaction
requests, responses and receipts in a payment processing network. The intended users are Internet merchants and merchant
aggregators who need to deal with multiple electronic payment mechanisms (credit/debit card, purchase card, electronic
cheque and automated clearing house payment). The supported operations include funds authorization and capture, sales and
repeat sales, and voiding of transactions.
The Electronic Commerce Modeling Language ECML is a specification that describes the format for data fields that need to
be filled at checkout in an online transaction. The fields defined include shipping information, billing information, recipient
information, payment card information and reference fields. Version 2.0 describes these fields in XML syntax.
The W3C standard on micropayments has originated from IBM’s standardization efforts. It covers the payment function for
payment of digital goods. The Micropayment initiative specifies how to provide in a Web page all the information necessary
to initialize a micropayment and transfer this information to the wallet for processing. The W3C Ecommerce/Micropayment
Activity is now closed.
Microsoft Passport is an online user-authentication service. Passport’s primary service is user authentication, referred to as
the Passport single sign-in (SSI) service. Passport also offers two other optional services: Passport express purchase (EP),
which lets users store credit card and billing/shipping address information in their optional Passport wallet profiles to
expedite checkout at participating e-commerce sites, and Kids Passport (source: Microsoft Passport Technical White Paper).
CEN/ISSS Electronic Commerce Workshop initiated the eWallet project in mid-2001 assuming a need for standardization in
the field. CEN/ISSS has chosen a flexible working definition considering an eWallet as "a collection of confidential data of a
personal nature or relating to a role carried our by an individual, managed so as to facilitate completion of electronic
transactions".
Secure Electronic Market Place for Europe (SEMPER) was produced by an EU supported project under a special program,
undertaken by a 20 partner consortium led by IBM. It is a definition of an open and system independent architecture for
Electronic Commerce. The project was concluded in 1999. Based on access via a browser, the architecture specifies common
functions to be supported by applications which include Exchange of certificates, Exchange of signed offer/order, Fair
contract signing, Fair payment for receipt, and Provision of delivery information.
The Internet Open Trading Protocol (IOTP) is defined as an interoperable framework for Internet commerce. It is optimized
for the case where the buyer and the merchant do not have a prior acquaintance. IOTP is payment system independent. It can
encapsulate and support several of leading payment systems.
Secure Electronic Payment Process is a protocol developed by MasterCard and Netscape to provide authentication, integrity
and payment confidentiality. It uses DES for confidentiality and 512, 768, 1024 or 2048 bit RSA and 128 bit MD5 hashing.
RSA encrypts DES key to encrypt hash of account numbers. It uses up to three public keys, one for signing, one for key
exchange, one for certificate renewal. Besides, SEPP uses X.509 certificates with CMS at top of hierarchy[ 26].
Secure Transaction Technology was developed by Visa and Microsoft to provide authentication, integrity and confidentiality
to the Internet based transactions. It is based on 64 bit DES or 64 bit RC4 (24-bit salt) for confidentiality and 512, 768, 1024
or 2048 bit RSA for encryption with 160 bit SHA hashing. It uses two public keys, one for signing, one for key exchange. It
has credentials similar to certificates but with account details and higher level signatures, though they are not certificates.
(Joint Electronic Payment Initiative) CommerceNet and the W3 Consortium are jointly initiating a multi-industry project to
develop an Internet payment negotiation protocol. The project explores the technology required to provide negotiation over
multiple payment instruments, protocols and transports. Examples of payment instruments include credit cards, debit cards,
electronic cash and checks. Payment protocols include STT and SEPP (amongst others). Payment transport encompasses the
message transmission mechanism: S-HTTP, SSL, SMTP, and TCP/IP are all categorized as transport technologies that can be
used for payment.
The latest version of the specifications, EMV 2000 version 4.0, was published in December 2000 (http://
www.emvco.com/).
CEN/ISSS was created in mid-1997 by CEN (European Committee for Standardization) and ISSS(Information
Society Standardization) to provide with a comprehensive and integrated range of standardization-oriented
services and products
Copyright © 2005, Idea Group Inc. Copying or distributing in print or electronic forms without written
permission of Idea Group Inc. is prohibited.
TEAM LinG
Computer Security and Risky Computing Practices
257
Chapter XIII
Computer Security and
Risky Computing Practices:
A Rational Choice Perspective
Kregg Aytes, Idaho State University, USA
Terry Connolly, University of Arizona, USA
ABSTRACT
Despite rapid technological advances in computer hardware and software,
insecure behavior by individual computer users continues to be a significant
source of direct cost and productivity loss. Why do individuals, many of
whom are aware of the possible grave consequences of low-level insecure
behaviors such as failure to backup work and disclosing passwords,
continue to engage in unsafe computing practices? In this chapter we
propose a conceptual model of this behavior as the outcome of a boundedly
rational choice process. We explore this model in a survey of undergraduate
students (N = 167) at two large public universities. We asked about the
frequency with which they engaged in five commonplace but unsafe
computing practices, and probed their decision processes with regard to
these practices. Although our respondents saw themselves as knowledgeable,
competent users and were broadly aware that serious consequences were
quite likely to result, they reported frequent unsafe computing behaviors.
We discuss the implications of these findings both for further research on
risky computing practices and for training and enforcement policies that
will be needed in the organizations that these students will be entering
shortly.
Copyright © 2005, Idea Group Inc. Copying or distributing in print or electronic forms without written
permission of Idea Group Inc. is prohibited.
TEAM LinG
258 Aytes and Connolly
INTRODUCTION
Over the past few years, the public has become increasingly aware of
computer security issues, as incidents have been covered in the popular news
media. Computer viruses, denial of service attacks, and cases of intruders
hacking into corporate systems and stealing confidential information are becoming more commonplace. Information technology (IT) professionals seem to be
waging a constant battle to maintain control over corporate technology and
information assets.
The costs of security breaches are enormous and widespread. The most
recent survey of 503 corporate and government organizations conducted by the
Computer Security Institute and the FBI includes these sobering facts (Power,
2002):
•
•
•
•
40% report intrusion into information systems from outside the organization
85% were hit by worms or computer viruses
80% acknowledged financial losses due to computer security breaches
While only 40% quantified their losses, those that did reported a total of
almost $455 million in financial losses in 2001, mostly through the theft of
proprietary information and financial fraud.
More important than just the magnitude of these numbers is the fact that
they have gotten worse during the seven years in which the survey has been
conducted. Financial losses have climbed each year, and most categories of
attacks either have gotten worse or remain substantially unchanged from
previous years.
Although there are technological solutions to counteract the many security
threats, most security professionals realize that technology alone is insufficient
to adequately protect a firm’s assets. Because information systems involve
human users, and people do not always act the way they are supposed to, users
are now considered one of the major chinks in the armor of computer security
countermeasures (Rhodes, 2001; Tuesday, 2001). User-related risks include
such low-level insecure behaviors as sharing passwords, creating and using
weak passwords that easily can be guessed, and opening e-mail attachments
without checking for viruses. In addition to these risky behaviors, users pose a
serious threat to computer security because hackers have learned to manipulate
them into divulging confidential information (Adams & Sasse, 1999), a technique
referred to as “social engineering.”
To counter the risks that users pose, security professionals propose security
training and awareness programs for users (Gips, 2001; Peltier, 2000; Tuesday,
2001). The primary goals of such programs are to make users aware of the
various computer security risks and how they could affect the organization, and
to get users to understand the importance of engaging in safe computing behavior
Copyright © 2005, Idea Group Inc. Copying or distributing in print or electronic forms without written
permission of Idea Group Inc. is prohibited.
TEAM LinG
Computer Security and Risky Computing Practices
259
(Peltier, 2000). Fear of negative consequences is a common theme of these
programs. Many of the security standards that have developed over the last 20
or 30 years originated in the federal government, often in the Department of
Defense, where compliance can be mandated with more success than in private
industry. Some authors suggest that security can be increased also by implementing positive motivators for users (Parker, 1999; Tuesday, 2001).
Unfortunately, these training and remediation efforts are designed largely
in the absence of reliable knowledge about the behaviors they are seeking to
change. We know very little about why computer users choose to engage in
unsafe computing behaviors. Are they unaware that they are doing so? Do they
know about the safer behaviors they could choose, and do they have the training
to implement those behaviors effectively? Do they misjudge the likelihood that
their unsafe behaviors will lead to bad consequences or believe that the
consequences will not, in fact, be very serious? Are their behaviors simply a
matter of knowing better but doing worse, of succumbing to the temptations of
the moment instead of doing the prudent thing? Our hope is that a better
understanding of the individual’s decision process relating to safe or unsafe
computing behaviors will provide a better basis for strategies aimed at influencing the process.
Viewing the practice of safe computing behaviors as a rational decision
process is consistent with several well-researched theories related to the use of
information technology. Fishbein and Ajzen’s (1975) Theory of Reasoned
Action (TRA) and Davis, Borgozzi, and Warshaw’s (1989) Technology Acceptance Model (TAM) both view the use or non-use of an information system to
be based on, among other things, behavioral intentions. Those behavioral
intentions are the result of a choice the users make based on their attitudes and
their perceptions of the norms concerning the behavior. For example, the TAM
model posits that a person’s intention to use a system is determined by the
person’s attitude toward a system and the person’s beliefs about the probability
that the system will increase his or her job performance (Jackson et. al., 1997).
That is, a person makes a rational choice either to use or not to use an information
system based on several decision criteria. This intention to use an information
system is, then, a major determinant of a person’s actual behavior. Put in the
context of safe computing behaviors, we believe that a person’s intention to
employ safe computing behaviors (e.g., scan for viruses, change passwords,
etc.) is also a rational choice based on the person’s perceptions about the
usefulness of the safe behaviors and the consequences of not engaging in safe
behavior.
This study had two main goals. First, we wanted to document the prevalence
of unsafe computing practices in one population. For all the concern noted above
about unsafe computing practices, we were unable to find any systematic
evidence of which practices are prevalent, to what extent, and in which
populations. Our population here is undergraduate students at two large U.S.
Copyright © 2005, Idea Group Inc. Copying or distributing in print or electronic forms without written
permission of Idea Group Inc. is prohibited.
TEAM LinG
260 Aytes and Connolly
universities, a population chosen primarily for its convenience, but also as
representing a group of active, non-specialist computer users, rather than a
technological elite. These are young adults who have grown up with computing
as part of their everyday work and professional lives, who are likely to remain
active users in the foreseeable future, and who soon will be entering the work
force. Thus, their computing habits will be of concern to employers assessing
their potential vulnerability to unsafe practices and the extent of retraining or
other remediation that will be required.
Our second goal was to explore a tentative theoretical model of risky
computing, both as a guide for the present study and as a framework for future
work. When viewing the use of countermeasures as a choice made by the user,
we have available to us a substantial body of research investigating the
perceptions of risk and decision making under uncertainty. This research is
particularly relevant, as choices about safe computing practices are quite similar
to choices studied in this referent literature, such as general technological risk
(Fischhoff et al., 1978) and seatbelt use (Slovic et. al., 1978). Here, we present
a model based on concepts from this referent literature. It assumes that risky
computing behavior is a result of individual choices at least weakly guided by
considerations of the probability and desirability of choice consequences. We, of
course, are not postulating a highly rational, utility-maximizing user; a huge
empirical literature (Connolly, Arkes, & Hammond, 2002; Goldstein & Hogarth,
1997) attests to the implausibility of such an assumption. We do, however,
propose that conscious thought about consequences plays some role in guiding
risky behavior. (If the evidence fails to support even this weak assumption,
alternative theoretical frameworks such as habit formation, peer pressure, or
simple impulsivity would have to be considered.) The basic outline of our model
is presented in Figure 1.
The core of our model (see Figure 1) is the assumption that risky computing
behavior is a result of individual choices at least weakly guided by considerations
of the probability and desirability of choice consequences, consistent with the
assumptions of the Theory of Reasoned Action (Fishbein & Ajzer, 1975) and the
Technology Acceptance Model (Davis et. al., 1989). We assume, then, that the
user faces a choice between two courses of action. In the simplest case, Option
1—safe practice—leads to a certainty1 of no negative consequences, but at the
cost of some additional time or effort. Option 2—risky practice—involves no
additional costs but leads with some probability (p) to negative consequences
and, with probability (1-p), to no negative consequences. Some implications of
this highly simplified choice model are summarized in Figure 1.
The central implication is that several conditions must be met in order for
the user to choose Option 1—safe practice (i.e., use of security countermeasures)—rather than Option 2—risky practice. These conditions are similar to the
predictive model for information use founded on TRA and TAM and proposed
Copyright © 2005, Idea Group Inc. Copying or distributing in print or electronic forms without written
permission of Idea Group Inc. is prohibited.
TEAM LinG
Computer Security and Risky Computing Practices
261
Figure 1. Rational choice model
Training
News/Media
Friends &
Coworkers
Personal
Experience
Policies &
Procedures
a. Awareness
of safe
practice
b. Awareness
of negative
consequences
c. Availability
of safe practice
option
d. Perception of
probability of
negative
consequences
Option 1:
Safe
Practice
Choice
Process
Option 2:
Risky
Practice
e. Perception of
severity of
negative
consequences
by Jackson, Chow, and Leitch (1997). In that model, the perceived usefulness
and perceived ease of use are considered predictors of information system use.
Specific factors affecting the decision include the following:
a.
b.
c.
d.
Is the user aware of the safe practice options that may be used as
countermeasures against threats? For example, is the user aware of a
practice called “regular backup”? Is an appropriate backup technology
available, and does the user know how to use this technology with
reasonable time and effort? No choice exists unless this option is realistically available.
Is the user aware of the potential negative consequences of not using safe
practices? For example, is the user aware that by not backing up data
regularly, significant data loss will occur in the event of a disk crash?
Is the user aware that safe practice options (i.e., countermeasures) are
readily available for his or her use and that countermeasures easily can be
employed? For example, the capability of backing up data (i.e., CD burner,
tape drive, etc.) must be available when needed, and the user needs to know
how to use it properly.
Does the user believe that, with a non-zero probability, risky practices may
lead to negative consequences? An extensive literature (Slovic, Fischhoff,
& Lichtenstein, 1979; Zeckhauser & Viscusi, 1990) shows that humans
estimate and react to small probabilities in non-normative ways, either
exaggerating or ignoring the risks involved. A related literature (Fischhoff,
Bostrum, & Quadrel, 1993) suggests that we are insensitive to the
compounding of small probabilities with repeated exposure. It seems likely
that the risks involved in many unsafe computing practices will be small in
individual instances and compounded by repetition, so both types of
distortions may be found.
Copyright © 2005, Idea Group Inc. Copying or distributing in print or electronic forms without written
permission of Idea Group Inc. is prohibited.
TEAM LinG
262 Aytes and Connolly
e.
Does the user believe that the negative consequences that may follow
unsafe practice are both substantial in scope and personally significant? For
example, the user may believe that modern software restricts data loss only
to recent documents or that the loss of a data file, while significant for the
organization, is not a matter of personal importance. In some cases of virus
propagation, the costs may be borne mainly by others who receive infected
files rather than by the user, who may remain unaware of the problem.
Figure 1 summarizes these relationships. It also suggests some of the
antecedents of these decision-related elements. For example, formal training,
which makes users aware of safe practices and instructs them in using them
efficiently (and thus, at low personal cost), also offers an opportunity to raise the
user’s awareness of the probability and significance of the negative consequences of unsafe practices. A formally identical model could guide research on
computer security issues in general, where safe practice would be understood to
include using appropriate countermeasures to offset the efforts of an active
opponent. A rational choice framework applies whether the situation is conceived as a game against nature (e.g., the possible failure of a hard drive) or as
a game against an opponent (e.g., the possible theft of financial data), though the
analysis is obviously more complex in the latter case.
In summary, the study reported here has two goals: (1) to assess the
prevalence of risky computing practices in a university population and (2) to
explore the value of a rational choice model as a theoretical framework for
understanding these practices. The design of the study is described in the
following section. The remainder of the chapter presents the findings and their
implications.
STUDY DESIGN
Practices Considered
We chose three areas of potentially risky behaviors: password usage, e-mail
usage, and backing up data. (We originally included a fourth area, financial
transactions over the Web, but the issues involved in this area emerged as
significantly different from the first three, and we do not discuss them further
here). Obviously, this is not a complete list of risk issues, but we judged them to
be a reasonable sampling of everyday practices that carry some element of risk.
Within password usage, we asked how frequently users share their login
passwords with others and how frequently they voluntarily change their passwords. No matter how well a computer system is protected from unauthorized
intrusion using technical countermeasures, all is for naught if authorized users
share their passwords with others. Even if they only share passwords with other
Copyright © 2005, Idea Group Inc. Copying or distributing in print or electronic forms without written
permission of Idea Group Inc. is prohibited.
TEAM LinG
Computer Security and Risky Computing Practices
263
authorized users, audit trails and accountability are compromised. Because
passwords may be undetectably cracked or revealed to outsiders or unauthorized
personnel, frequently changing one’s password helps prevent long-term usage of
an account by an intruder.
We investigated e-mail usage primarily because e-mail-borne viruses are
one of the major threats to the security of computer systems today (Consumer
Reports, 2002). We asked our respondents how often they opened e-mail
attachments, both from known and unknown sources, without first checking
them for viruses. We also asked about practices concerning backing up files to
protect from loss of data. Regularly backing up data to a second device (i.e.,
network drive, diskette, CD, etc.) offers some protection to users from computer
hardware problems and viruses. It cannot, of course, prevent the problems, but
it does reduce the risk of losing valuable information.
Questionnaire
The five practices were included in a questionnaire (see Appendix 1).
Within each practice, a standard sequence of questions asked the respondent to
indicate how frequently he or she engaged in the practice, how frequently others
do so, the probability and severity of bad consequences from engaging in unsafe
practices, and whether the respondent or someone he or she knew had
experienced these bad consequences. The questionnaire also included several
items concerning the respondent’s training in and knowledge about computer
security issues, and some brief demographic questions. Responses were anonymous, and respondents were asked not to put their names on the questionnaires.
Sample and Administration
Respondents were recruited from undergraduate business classes in two
large public universities and were given offers of extra course credit and
discharge of a lab participation obligation. The questionnaires were distributed
and completed in class; completion required approximately 30 minutes. Completed questionnaires were received from a total of 167 respondents, who were
surveyed during the fall semester of 2001. The average age of the respondents
was 23.5 years; 60% were male; 94% were juniors and seniors, and the
remainder was sophomores and graduate students.
RESULTS
Overall, the respondents considered themselves to be a highly knowledgeable group, with the vast majority of them describing themselves as “knowledgeable/comfortable,” “very knowledgeable/comfortable,” or “expert” at using email and protecting themselves from viruses and computer crashes. Half of the
Copyright © 2005, Idea Group Inc. Copying or distributing in print or electronic forms without written
permission of Idea Group Inc. is prohibited.
TEAM LinG
264 Aytes and Connolly
Table 1. Self-rated knowledge of four areas of computer use
Activity
E-mail
Protecting against viruses
Protecting against computer crash
Protecting against interception of
financial information
% Rating Themselves
Knowledgeable, Very
Knowledgeable, or Expert
93%
69%
70%
50%
subjects were similarly confident that they knew how to protect themselves from
unauthorized interception of financial information (see Table 1).
This self-image of sophisticated, security-savvy users does not track very
well with their training and actual behaviors. Nearly half of them (79/167: 47%)
report having never received any information or tutoring on computer securityrelated matters. Of those that have received information, only 19% received it
through formal training or education. The most common sources of computer
security information were friends and co-workers (cited by 52%), and personal
experience (cited by 42%).
A surprising number of subjects reports that they do not follow basic
computer-security procedures (Table 2). Only 22% (36/167) report never
sharing their passwords with others, and a majority (85/166: 51%) reports that
they had rarely or never voluntarily changed their passwords after establishing
an online account. Almost a quarter (38/158: 24%) reports having opened e-mail
attachments from unknown sources without checking for viruses, and more than
half (89/159: 56%) reports having done so when the source appeared to be a
friend. Well under half (64/167: 38%) reports that they backup their work
frequently or all the time, and over a quarter (45/167: 27%) rarely or never
backup their work.
Table 2. Self-reported frequency of engaging in five security-related
practices
Activity
Never
Rarely Occasionally Frequently
Share passwords
22%
53%
20%
Voluntarily change
27%
24%
29%
password*
Open e-mail attachments
58%
18%
14.5%
without virus checking—
unknown source
Open e-mail attachments
25%
19%
18%
without virus checking—
known source
Backup regularly*
6%
21%
35%
* = Higher frequency on these items indicates more secure behavior
3%
9%
All the
Time
2%
11%
6%
4%
23%
25%
24%
14%
Copyright © 2005, Idea Group Inc. Copying or distributing in print or electronic forms without written
permission of Idea Group Inc. is prohibited.
TEAM LinG
Computer Security and Risky Computing Practices
265
Given these percentages, 49% of the subjects engaged in risky computing
behavior at least occasionally, with 28% doing so frequently or all the time.
Additionally, in each of these cases, subjects report that their peers engage in
these insecure behaviors more frequently than they do themselves. (It is not clear
whether this reflects accurate observations of their friends or a way of disclosing
their own socially-disapproved bad behavior. In either reading, these peer
reports suggest that insecure behavior is even more widespread than the selfreport rates would indicate.)
The subjects seemed to be aware of the possibility that negative consequences may result from engaging in these risky behaviors. When asked if there
were any negative consequences to these various activities, an average of less
than 12% felt there were no negative consequences for all of these behaviors.
The activity most widely recognized as potentially having negative consequences
was opening e-mail attachments from unknown sources without running a virus
check; only 4% said that there were no negative consequences to doing so. The
activity least recognized as having negative consequences was not changing
passwords; 24% said that there were no negative consequences.
However, while they recognize the possibility of negative consequences,
they seem quite optimistic regarding the likelihood of personally experiencing a
negative outcome. On average, 34% felt that negative consequences were likely
to happen to them only rarely, and 6% felt that they would never occur. The
behaviors deemed least likely to result in negative consequences were sharing
passwords and not changing passwords. The behaviors most likely to result in
personal negative outcomes were deemed to be opening e-mail attachments
from either known or unknown sources without first scanning for viruses, and not
backing up files (Table 3).
Table 3. Perceptions of likelihood of negative consequences following five
security-related
Likelihood of negative
consequences from:
Sharing passwords
Not voluntarily
changing password
Opening e-mail
attachments without
virus checking –
unknown source
Opening e-mail
attachments without
virus checking – known
source
Not backing up regularly
Never
Rarely Occasionally Frequently
10%
10%
28%
48%
28%
30%
25%
10%
All the
Time
9%
2%
2%
21%
43%
28%
6%
5%
48%
17%
28%
17%
2%
26%
40%
23%
10%
Copyright © 2005, Idea Group Inc. Copying or distributing in print or electronic forms without written
permission of Idea Group Inc. is prohibited.
TEAM LinG
266 Aytes and Connolly
These data suggest that although subjects know that there are possible
negative consequences to insecure computer practices, they feel that in many
areas, the probability of experiencing those negative consequences is fairly low.
In summary, these descriptive analyses suggest that there is a significant
gap between the respondents’ self-perceptions that they are quite expert at and
comfortable with good practice, and their reports that they actually engage in
risky behavior quite often. While the vast majority of them recognize that there
can be significant negative consequences to risky computing behavior, they also
believe that the probability of it happening to them is fairly low. They tend to:
•
•
•
•
be somewhat overconfident in their computer security knowledge.
engage in risky behavior rather frequently.
recognize that there are potential negative consequences to their risky
behaviors.
think the probability that they will experience negative consequences is
quite low.
In addition to these descriptive analyses, we also examined several correlational and predictive issues.
Safe Computing Cluster
Is there evidence of a cluster of safe computing behaviors, a tendency for
those who are careful about one area to be careful about another? Surprisingly,
there is not. The five behaviors appear to be largely independent of one another.
There is almost no evidence that students (by self-report) who do a lot of one,
Table 4. Pearson’s correlation coefficients (measure of the linearity of a
relationship) among self-reported frequency of five security-related
practices2
Shared Voluntarily Opened e-mail Opened e-mail
from known from unknown
passwords changed
password sources without sources without
checking for
checking for
viruses
viruses
1
-.074
.070
.034
1
-.063
-.172*
Shared passwords
Voluntarily changed
password
Opened e-mail from
known sources without
checking for viruses
Opened e-mail from
unknown sources
without checking for
viruses
Backed up PC
* Significant at the 0.05 level (2-tailed).
** Significant at the 0.01 level (2-tailed)
1
Backed up
PC
-.051
.037
.498**
.086
1
.059
1
Copyright © 2005, Idea Group Inc. Copying or distributing in print or electronic forms without written
permission of Idea Group Inc. is prohibited.
TEAM LinG
Computer Security and Risky Computing Practices
267
do a lot another. The only exceptions are that (a) those who frequently check emails for viruses tend to do so both for known and unknown sources, and (b)
those who frequently change passwords are somewhat less likely to open e-mail
attachments from known sources without checking them for viruses. The
remaining eight correlations are all quite small and are not significantly different
from zero. With the exception of virus checking of e-mails, these behaviors
essentially are independent of one another (see Table 4).
The Role of Expertise
Four measures on the questionnaire (final section, questions 1 and 2a-2c)
asked respondents to assess aspects of their expertise. Scores on these items
were strongly correlated (mean r = .76), so we averaged them to provide a simple
index of self-rated expertise. Correlations between this expertise index and the
reported frequency of the five security-related behaviors are shown in Table 5.
As Table 5 shows, expertise is related to several of the risky behaviors we
considered. Subjects reporting higher levels of expertise are less likely to open
emails without screening them for viruses and more likely to change passwords.
There is some indication that they are less likely to have shared passwords (r =
-.14, p<.10), and more likely to do frequent backups (r = .13, p<.10). Thus, there
is some connection between self-claimed expertise in safe computing and selfreported safe practices, but the connection is not especially strong. Even among
those 91 subjects who scored at or above the median of our expertise scale, 26%
share passwords at least occasionally; 36% rarely or never change passwords;
18% open e-mail attachments from unknown sources, without virus checking;
36% open e-mail attachments from known sources, without virus checking; and
25% rarely or never backup their work. Knowledge about how to protect oneself
thus increases the rate of safe behavior but falls a long way short of ensuring it.
Perceptions of Bad Consequences
There are two aspects of negative consequences for following insecure
computing practices: how likely respondents feel the negative consequences are,
Table 5. Pearson’s correlation coefficients of expertise index with reported
frequency of five security-related practices
Voluntarily Opened email Opened email Backed up your
changed
from known from unknown
PC
password sources without sources without
checking for
checking for
viruses
viruses
-.136
.473**
-.295**
-.291**
.134
Expertise
** Significant at the 0.01 level (2-tailed).
* Significant at the 0.05 level (2-tailed).
Shared
passwords
Copyright © 2005, Idea Group Inc. Copying or distributing in print or electronic forms without written
permission of Idea Group Inc. is prohibited.
TEAM LinG
268 Aytes and Connolly
and how significant they expect those consequences to be. The questionnaire
contained two or more items (question 4) in each behavior domain related to the
subjects’ perception of the probability of negative consequences. Within each
domain, the responses were highly correlated, so the responses were aggregated
into one measure for each. A single question within each domain (question 5)
related to perceived significance of those consequences.
The five measures of the probability of negative consequences are positively, but not strongly, correlated with one another (mean r = .34), suggesting a
weak computer paranoia cluster: Those who see bad outcomes as likely in one
area tend to see them as more likely in other areas. The two probability measures
related to opening e-mail attachments from known and unknown sources without
checking them for viruses tend to be positively, but only weakly, associated with
our expertise measure (r = .17, r = .21). None of the other probability measures
is correlated with expertise. This suggests that expertise does not significantly
change people’s belief that bad consequences are likely to happen to them if they
behave insecurely.
The probability measures are correlated with one’s (in)secure behavior
measures (Table 6). Those who see the behavior as likely to lead to bad outcomes
are less likely to share passwords, more likely to change passwords, less likely
to open unscreened e-mails from unknown and known sources, and more likely
to backup frequently. While these correlations are in the directions one would
expect, they are relatively weak.
Correlations between perceived significance of consequences and behavior
are even more modest (Table 6). Correlations are in the direction one would
expect, but are all .21 or lower, and two of them are not statistically significant.
Table 6. Pearson’s correlation coefficients between perceived probability
and significance of consequences and reported frequencies of five core
behaviors
Sharing
Passwords
Perceived probability
-.32**
of negative
consequences for each
behavior
Perceived significance
-.19*
of negative
consequences
** Significant at the 0.01 level (2-tailed)
* Significant at the 0.05 level (2-tailed)
+
Significant at the 0.10 level (2-tailed)
Changing
Passwords
.24**
.06
Frequency of Behavior
Opening e-mail
Opening e-mail
from known
from unknown
sources without sources without
checking for
checking for
viruses
viruses
-.16*
-.22**
.07
.21**
Backing
up PC
.15+
.17*
Copyright © 2005, Idea Group Inc. Copying or distributing in print or electronic forms without written
permission of Idea Group Inc. is prohibited.
TEAM LinG
Computer Security and Risky Computing Practices
269
Table 7. Regression models predicting frequency of behavior from expertise
and rated probability and significance of consequences.
Frequency of
behavior
Expertise
Sharing
-.09
passwords
Changing
.46**
passwords
Opening e-mail
-.26**
attachments –
unknown
source
Opening e-mail
-.22**
attachments –
known source
Backing up PC
.16*
** p < 0.01 level (2-tailed)
* p < 0.05 level (2-tailed)
Beta Values
Perceived
probability of
consequences
-.28**
Significance of
consequences
Adjusted Rsquared
-.07
.10
.20**
.06
.26
-.12
.06
.08
-.17*
.18*
.12
.08
.18
.05
Predicting Behaviors
As a summary of the preceding correlational analyses, we built simple linear
regression models for each of the five core behaviors, assessing how well we
could predict the self-reported frequency of each behavior from three measures:
the respondent’s ratings of (a) his or her expertise, (b) the probability, and (c) the
significance of negative consequences that might follow from behaving unsafely.
The five regression models are summarized in Table 7.
Other than changing passwords (R-squared = .26), all the other R-squared
values are quite small. With this single exception, it seems that we cannot predict
much of the variance in how often someone engages in a particular securityrelated behavior from knowing (a) how much they know about protecting
themselves (expertise), (b) how bad they think the consequences of insecure
behavior are, or (c) how likely they think these consequences are to follow from
insecure behavior. The exception—changing passwords—is a once-and-done
event, while the remaining four behaviors require continuing safe practice. The
implication is that our respondents may approximate sensible choices when the
behavior in question is a single event, but they make much less risk-sensitive
choices when the behavior requires repeated inconvenience on an ongoing basis.
DISCUSSION
We argued earlier that reducing computer security risks to organizations
and individuals will continue to require that individual users voluntarily comply
with safe computing practices. To the extent that our sample of advanced
Copyright © 2005, Idea Group Inc. Copying or distributing in print or electronic forms without written
permission of Idea Group Inc. is prohibited.
TEAM LinG
270 Aytes and Connolly
undergraduates represents the user population of the future, the data presented
suggest that achieving such compliance will continue to be a significant problem.
Some of those advocating training and awareness programs for users seem to
assume that simply describing the possible threats to secure computing and the
possible negative consequences of insecure behaviors will effectively gain
compliance with security procedures. These data, consistent with what is known
about risk perception in general, suggest otherwise.
Our data suggest that many users, despite having little or no formal training
in computer security, feel relatively comfortable in their ability to protect
themselves from viruses, computer crashes, and password violations. This raises
an important question: If users feel they already know how to engage in secure
computing, will they be motivated to become truly educated? Assuming our
respondents are reasonably typical of the rising generation of corporate recruits,
it seems clear that hiring organizations will need to undertake serious security
training themselves. Simply relying on new entrants’ assurances that they are
familiar with safe computing practices is not enough.
The data suggest that corporate trainers of new recruits face a difficult
challenge. Even if they can provide improved knowledge and make trainees
aware of the probabilities of negative consequences and the significance of those
consequences, the data give little confidence that this knowledge will ensure safe
computing practices. Expertise and perceptions related to consequences are
only weak predictors of secure computer practices. Better understanding of this
gap between knowledge and behavior is key to effectively altering user behavior
(Fischhoff et al., 1993). Although risk perceptions in this domain have been
studied little, they can be understood better from the perspective of what we
know about people’s risk perceptions in general. For example, there is evidence
that people underestimate the rate at which single-incident risks cumulate with
repeated exposure (Shaklee & Fischhoff, 1990). People often engage in behavior, such as driving without seatbelts, that carries some risk. However, most
people make many trips without ever experiencing negative consequences. We
know that experience affects people’s behavior and that each safe trip reinforces not using seatbelts. Conversely, people who consistently use seatbelts and
are not involved in an accident are penalized for their safe behavior, because
using a seatbelt has some cost (in comfort and time). This means that each safe
trip reinforces not using a seatbelt. Other factors, such as the knowledge that
seatbelts are not 100% effective, also may reduce people’s tendency to use
seatbelts (Slovic, 1978).
Although computer security breaches are not likely to have life and death
consequences for most people, it is likely that some of these same factors are at
work in this domain. The vast majority of the time, users can share passwords,
open e-mail attachments without checking them for viruses, and so forth, with no
negative consequences. In fact, they are rewarded in this behavior, because they
Copyright © 2005, Idea Group Inc. Copying or distributing in print or electronic forms without written
permission of Idea Group Inc. is prohibited.
TEAM LinG
Computer Security and Risky Computing Practices
271
are seen either as helpful (in the case of sharing passwords) or as saving time
(by not scanning for viruses). Just as with seatbelts, they are usually penalized,
at least mildly, for engaging in safe behavior.
Logically, it would seem that informing users of the efficacy of safe
computing and describing in detail the potential catastrophic effects of poor
computing practices would affect behavior. However, experience with seatbelt
usage (Robertson et al., 1974) suggests that these approaches may not work in
practice. As long as the probability of an occurrence is perceived as being
negligible, the significance of the consequences seems to matter little (Slovic,
1978).
Once again, there seems to be a logical approach to addressing the problem:
Inform users about the probability of experiencing a negative outcome. While the
probability of a single event resulting in negative consequences is small, the
overall probability is increased, of course, when the risky behavior is repeated.
Research has shown that increasing people’s time horizons can induce them to
take repetitive risks more seriously (Slovic, 1978). This approach holds promise,
but there is a dearth of empirical data regarding the probabilities of negative
consequences for various computing practices. For example, we do not have
accurate data on what percentage of e-mail attachments contains viruses or how
often password files are cracked. Without credible, understandable probabilities,
we cannot expect users to be swayed in their beliefs that they are unlikely to
suffer from their behaviors.
A final complication is the fact that negative consequences may not be
personally significant to the offending user even when they do occur. Many email-borne computer viruses, for example, do no damage to the infected user.
Instead, they wreak havoc on the larger computing community by replicating
themselves to many other systems, overloading e-mail systems, and requiring
extensive work by system administrators. While peer pressure and the embarrassment of being known as the cause of others’ distress may provide some
motivation, in many cases, infected individuals may never know the trouble they
cause.
CONCLUSION AND FUTURE RESEARCH
Threats to computer security are an increasing concern to organizations.
While technological countermeasures offer some protection, computer users still
need to follow good security practices. This investigation of users’ knowledge,
perceptions, and behaviors regarding computer security issues is an attempt to
better understand the human element of computer security. Our student respondents consider themselves to be fairly knowledgeable about computer use and
safe computing practices, but, nonetheless, they continue to engage in unsafe
Copyright © 2005, Idea Group Inc. Copying or distributing in print or electronic forms without written
permission of Idea Group Inc. is prohibited.
TEAM LinG
272 Aytes and Connolly
computing practices. They appear to be cognizant of the risks involved, but, as
in other domains of risk, this knowledge does little to curb unsafe behavior. The
assumption that users are predominantly making sensible action choices in light
of expected consequences is supported only modestly in these data. Other
mechanisms, such as unthinking behavior (Langer, 1978) or impulsivity
(Zuckerman, 2003), also may be implicated.
The findings suggest that it is unlikely that computer users will change their
behavior significantly in response to being provided simply with additional
information regarding computing risks and safe practices. While extending the
time frame that users consider when making computing choices may increase
compliance with security procedures, it also is likely that organizations will have
to enforce compliance when the risks warrant it. This can be done through
automatic means, such as blocking all e-mail attachments, but in many cases
human choice still could negate technological solutions. In these cases, personnel
policies, such as close monitoring and sanctions for violating procedures, may be
necessary to establish a culture of safe practice. These personnel procedures
reflect important organizational choices that will affect organizational climate
and culture, and will involve significant costs, financial and otherwise. They will
have to be weighed against the security risks imposed.
Extensions of this survey approach are also needed. Surveys of corporate
computer users, where policies regarding security practices are both known and
enforced, would be useful in better understanding the users’ perspectives
regarding the effectiveness of such policies. Additionally, further research into
those areas where users may experience personal financial loss (e.g., identity
theft, credit card fraud) is also necessary to better understand if there are certain
types of risks that users are less willing to take.
Finally, further development of a research model that incorporates users’
perceptions and decision-making process is needed. Rational choice models,
such as the one presented here, appear to be useful in understanding users’
behaviors, although further understanding of the factors that affect a user’s
decision process is necessary. Extensions of the model proposed here, perhaps
borrowing more from related models such as the Technology Acceptance
Model, will help us to understand better how to improve information security by
concentrating on factors most directly related to users’ acceptance of countermeasures.
ACKNOWLEDGMENT
Our thanks to Raghu Nandan for assistance in collecting and coding the data
for this study.
Copyright © 2005, Idea Group Inc. Copying or distributing in print or electronic forms without written
permission of Idea Group Inc. is prohibited.
TEAM LinG
Computer Security and Risky Computing Practices
273
REFERENCES
Adams, A., & Sasse, M. (1999). Users are not the enemy. Communications of
the ACM, 42(12), 41-46.
Connolly, T., Arkes, H., & Hammond, K. (2002). Judgment and decision making:
An interdisciplinary reader. New York: Cambridge University Press.
Cyberspace invaders (2002, June). Consumer Reports, 67(6), 16-21.
Davis, F., Bagozzi, R.P., & Warshaw, P.R. (1989). User acceptance of
computer technology: A comparison of two theoretical models. Management Science, 35(8), 982-1003.
Fischhoff, B., Bostrum, A., & Quadrel, M. (1993). Risk perception and communication. Annual Review of Public Health, 14, 183-203.
Fishbein, M., & Ajzen, I. (1975). Belief, attitude, intention, and behavior: An
introduction to theory and research. Reading, MA: Addison-Wesley.
Gips, M. (2001). Plugging into awareness. Security Management, 45(11), 2122.
Goldstein, W., & Hogarth, R. (1997). Research on judgment and decision
making. New York: Cambridge University Press.
Jackson, C., Chow, S., & Leitch, R. (1997). Toward and understanding of the
behavioral intention to use an information system. Decision Sciences,
28(2), 357-389.
Langer, E. (1978). Rethinking the role of thought in social interaction. In J.
Harvey, W. Ickes, & R. Kidd (Eds.), New directions in attribution
research, vol.2. Hillsdale, NJ: Erlbaum.
Peltier, T. (2000). How to build a comprehensive security awareness program.
Computer Security Journal, 16(2), 23-32.
Power, R. (2002). Computer security issues and trends. 2002 CSI/FBI Computer Crime and Security Survey, 8(1), 1-22.
Rhodes, K. (2001). Operations security awareness: The mind has no firewall.
Computer Security Journal, 18(3), 27-36.
Robertson, L., et al. (1974). A controlled study of the effect of television images
on safety belt use. American Journal of Public Health, 64, 1071-1080.
Shaklee, H., & Fischhoff, B. (1990). The psychology of contraceptive surprises:
Judging the cumulative risk of contraceptive failure. Journal of Applied
Psychology, 20, 385-403.
Slovic, P., Fischoff, B., & Lichtenstien, S. (1978). Accident probabilities and
seat belt usage: A psychological perspective. Accident Analysis and
Prevention, 10, 281-285.
Slovic, P., Fischoff, B., & Lichtenstien, S. (1979). Rating the risks. Environment, 21, 14 -39.
Tuesday, V. (2001, April 30). Human factor derails best-laid security plans.
Computerworld, 35(18), 52-55.
Copyright © 2005, Idea Group Inc. Copying or distributing in print or electronic forms without written
permission of Idea Group Inc. is prohibited.
TEAM LinG
274 Aytes and Connolly
Zeckhauser, R., & Viscusi, K. (1990 ). Risk within reason. Science, 248, 559564.
Zuckerman, M. (2003). Biological bases of personality. In T. Millon, & M.J.
Lerner (Eds.), Handbook of psychology, volume 5 (pp. 85-116). New
York: John Wiley.
ENDNOTES
1
2
We recognize that this is not truly a certainty of no negative outcomes. In
our simplified model, however, we consider the user to perceive the
outcome to be a practical certainty.
For details on statistical terms, see: Freedman, D., Pisani, R., & Purves, R.
(1998). Statistics (3rd ed.), New York: Norton.
Copyright © 2005, Idea Group Inc. Copying or distributing in print or electronic forms without written
permission of Idea Group Inc. is prohibited.
TEAM LinG
Computer Security and Risky Computing Practices
275
APPENDIX:
QUESTIONNAIRE USED
IN DATA COLLECTION
COMPUTER SECURITY ISSUES AND PRACTICES
DECISION ANALYSIS SURVEY
We are conducting a study of how people deal with computer security – things people do and do
not do that can make their computer use more or less safe. These activities include:
Sharing (or not sharing) your passwords with other people
Changing (or not changing) your passwords frequently
Opening (or not opening) emails with suspicious attachments – from friends; from
others
Backing up your files regularly (or not)
Performing financial transactions via the Internet (Web)
Your responses to this survey will help us better understand the issues that need to be addressed
in personal computer security habits and practices.
Prior to answering the questions in the next four (4) pages, we request you to fill out the
information below. This information will help us in keeping track of demographic data of survey
participants.
* Please note that all information that you provide will remain anonymous.
STATISTICAL DATA
Age
: _______ years
Gender
:
Male
Year in School
Graduate Student
:
Freshman Sophomore Junior Senior
Major
: ________________________________________
Full-Time Student
:
Yes
Female
No
Copyright © 2005, Idea Group Inc. Copying or distributing in print or electronic forms without written
permission of Idea Group Inc. is prohibited.
TEAM LinG
276 Aytes and Connolly
SHARING PASSWORDS
E-mail, online membership accounts for various services, financial accounts, and even your student information at the university requires you to enter
a login and password prior to accessing your account. Logins and passwords
together form a unique combination that is theoretically supposed to prevent
unauthorized persons from accessing your information (e-mail, bank accounts,
credit card accounts, etc.). While a login name may be easily identifiable (your
first name, full name, etc.), your password is usually a set of letters and numbers
that is known only to yourself. In this section, we would like you to answer a few
questions regarding the privacy of your passwords.
1. Have you ever shared your password with friends, family, co-workers or others?
2. In your opinion, how often do your peers share passwords with family, friends and
co-workers?
3. Are there any negative consequences to sharing passwords?
4. How likely are the following consequences IF you share your password?
a. Unauthorized persons accessing and reading your e-mail
b. Unauthorized persons accessing and using your financial information
c. Unauthorized persons accessing personal information
5. If these consequences were to occur, how significant would they be to you?
(0=no significance; 1=mild inconvenience; 2=cause for concern; 3=considerable;
4=disaster)
6.
a. Have any of the above consequences ever happened to you?
b. If yes, how recently? ___ months ago
7.
a. To your knowledge, have any of the above consequences ever happened to
someone you know?
b. If yes, how recently? ___ months ago
Occas- Frequ- All the
Never Rarely -ionally -ently time
0
0
Yes
0
0
0
0
1
1
1
1
1
1
2
2
No
2
2
2
2
Yes
No
Yes
No
3
3
4
4
3
3
3
3
4
4
4
4
CHANGING PASSWORDS
Once you establish your online account, you ordinarily need not change your
password. However, most accounts have an option that allows you to voluntarily
change your password. Some accounts require you to change your password and
prompt you to do so at regular intervals. In this section, we would like to ask you
some questions that are related to your voluntary password changing habits.
Copyright © 2005, Idea Group Inc. Copying or distributing in print or electronic forms without written
permission of Idea Group Inc. is prohibited.
TEAM LinG
Computer Security and Risky Computing Practices
1. After establishing an online account, have you ever voluntarily changed your
password(s)?
2. In your opinion, how often do your peers voluntarily change their passwords(s)?
3. Are there any negative consequences to NOT CHANGING password(s)?
4. How likely are the following consequences IF you DID NOT CHANGE your
password(s)?
a. Unauthorized persons accessing and reading your e-mail
b. Unauthorized persons accessing and using your financial information
c. Unauthorized persons accessing personal information
5. If these consequences were to occur, how significant would they be to you?
(0=no significance; 1=mild inconvenience; 2=cause for concern; 3=considerable;
4=disaster)
6.
a. Have any of the above consequences ever happened to you?
b. If yes, how recently? ___ months ago
7.
a. To your knowledge, have any of the above consequences ever happened to
someone you know?
b. If yes, how recently? ___ months ago
277
Occas- Frequ- All the
Never Rarely -ionally -ently time
1
0
0
1
Yes
2 3
2 3
No
4
4
0
0
0
0
2
2
2
2
4
4
4
4
1
1
1
1
Yes
No
Yes
No
3
3
3
3
UNKNOWN E-MAIL ATTACHMENTS/UNKNOWN
SOURCE
Most of us receive unsolicited e-mail from unknown companies, organizations, and individuals. In this section, we would like to learn more about your
behavior in handling an unknown e-mail attachment (an attachment that is
ambiguous in content or is unexpected) from an unknown or unrecognizable
source.
1.
a. Have you ever received an unknown e-mail attachment from an UNKNOWN
source?
b. If yes, have you opened the attachment without checking for computer
viruses?
2.
a. In your opinion, how often do your peers receive e-mail attachments from
unknown sources?
b. In your opinion, how often do your peers open these attachments without
checking for viruses?
3. Are there any negative consequences to opening these attachments?
4. How likely are the following consequences IF you were to open an unknown
attachment from an unknown source?
a. Attachment contains computer virus that infects files
b. Attachment contains computer virus that crashes computer
5. If these consequences were to occur, how significant would they be to you?
(0=no significance; 1=mild inconvenience; 2=cause for concern; 3=considerable;
4=disaster)
6
a. Have any of the above consequences ever happened to you?
b. If yes, how recently? ___ months ago
7.
a. To your knowledge, have any of the above consequences ever happened to
someone you know?
b. If yes, how recently? ___ months ago
Occas- Frequ- All the
Never Rarely -ionally -ently time
0
0
0
1
1
1
2
2
2
3
3
3
4
4
4
0
1
2
3
4
0
1
Yes
2 3
No
4
0
0
0
1
1
1
2
2
2
3
3
3
4
4
4
0
1
2
3
4
Yes
No
Yes
No
Copyright © 2005, Idea Group Inc. Copying or distributing in print or electronic forms without written
permission of Idea Group Inc. is prohibited.
TEAM LinG
278 Aytes and Connolly
UNKNOWN E-MAIL ATTACHMENT/KNOWN
SOURCE
Many of us receive and send e-mails that contain jokes, interesting articles,
and other not-so-relevant information, such as a forwarded message to family,
friends, and co-workers. Some of these e-mails may contain attachments that
are not easily recognizable, although you are able to recognize the source (person
who sent the e-mail). In this section, we would like to learn more about your
behavior in handling an e-mail that contains an unknown attachment but comes
from a known source (friend, family, or colleague).
1
a. Have you ever received unknown e-mail attachments from a KNOWN source?
b. If yes, have you opened these attachments without checking for computer
viruses?
2.
a. In your opinion, how often do your peers receive unknown e-mail attachments
from known sources?
b. In your opinion, how often do your peers open these attachments without
checking for viruses?
3. Are there any negative consequences to opening these attachments?
4. How likely are the following consequences IF you were to open an unknown
attachment from a known source?
a. Attachment contains computer virus that infects files.
b. Attachment contains computer virus that crashes computer.
5. If these consequences were to occur, how significant would they be to you?
(0=no significance; 1=mild inconvenience; 2=cause for concern; 3=considerable;
4=disaster)
6.
a. Have any of the above consequences ever happened to you?
b. If yes, how recently? ___ months ago
7.
a. To your knowledge, have any of the above consequences ever happened to
someone you know?
b. If yes, how recently? ___ months ago
Occas- Frequ- All the
Never Rarely -ionally -ently time
0
0
0
1
1
1
2
2
2
3 4
3 4
3 4
0
1
2
3 4
0
1
Yes
2 3 4
No
0
0
0
2
2
2
1
1
1
Yes
No
Yes
No
3 4
3 4
3 4
REGULAR BACK-UP
This section explores your behavior in backing-up your personal computer
work. A backup copy is defined as any SECOND copy that is NOT on your hard
drive. If you were to save your work on your hard drive, and then copy it onto
a floppy disk, that would constitute a backup copy. Other traditional means of
backing up your work involve digital tape backup, CD-ROMs, backing up on the
Internet, and so forth. The following questions explore your habits in this area.
Copyright © 2005, Idea Group Inc. Copying or distributing in print or electronic forms without written
permission of Idea Group Inc. is prohibited.
TEAM LinG
Computer Security and Risky Computing Practices
1. Do you back-up your personal computer work?
2. In your opinion, do your peers backup their personal computer work?
3. Are there any negative consequences to NOT BACKING-UP your personal work?
4. How likely are the following consequences IF you DID NOT back-up your personal
work?
a. Some work lost when computer freezes
b. No consequences at all
c. Work lost due to computer virus
5. If these consequences were to occur, how significant would they be to you?
(0=no significance; 1=mild inconvenience; 2=cause for concern; 3=considerable;
4=disaster)
6.
a. Have any of the above consequences ever happened to you?
b. If yes, how recently? ___ months ago
7.
a. To your knowledge, have any of the above consequences ever happened to
someone you know?
b. If yes, how recently? ___ months ago
279
Occas- Frequ- All the
Never Rarely -ionally -ently time
0
1
0
1
Yes
2 3 4
2 3 4
No
0
0
0
0
2
2
2
2
1
1
1
1
Yes
No
Yes
No
3
3
3
3
4
4
4
4
COMPUTER SECURITY KNOWLEDGE
This section asks you some general questions regarding your computing
habits.
0=not very comfortable/ knowledgeable; 1=somewhat comfortable/ knowledgeable; 2=comfortable/knowledgeable; 3=very comfortable/ knowledgeable;
4=expert
1. How comfortable are you using a computer for sending and receiving e-mails and performing
financial transactions via the Internet (Web)?
2. How knowledgeable are you about protecting yourself against
a. Computer virus attacks?
b. Computer crashes resulting in loss of work saved on your computer?
c. Unauthorized people intercepting your financial information via the Internet (Web)?
3. Have you ever received any sort of information or tutoring about protecting yourself against
computer viruses, computer crashes resulting in loss of information, invasion of privacy by
hackers, and other computer security-related issues?
4. If yes, which of these methods best describes the information/tutoring you have received regarding
computer security? (check all that apply)
ο Learned from friends, acquaintances or co-workers
ο Learned from personal experience
ο Heard or read about it in the media
ο Received formal computer training (class-related, job-related training, etc.)
ο Received information when purchasing computer
5. Which of the following best describes the PRIMARY computer you use? (check ONLY one)
ο Personal computer at home
ο Computer at work
ο University computer (computer labs, library)
0 1 2 3 4
0 1 2 3 4
0 1 2 3 4
0 1 2 3 4
Yes
No
Copyright © 2005, Idea Group Inc. Copying or distributing in print or electronic forms without written
permission of Idea Group Inc. is prohibited.
TEAM LinG
280 Warkentin, Davis and Bekkering
Chapter XIV
A TAM Analysis of an
Alternative High-Security
User Authentication
Procedure
Merrill Warkentin, Mississippi State University, USA
Kimberly Davis, Mississippi State University, USA
Ernst Bekkering, Northeastern State University, USA
ABSTRACT
The objective of information system security management is information
assurance, which means to maintain confidentiality (privacy), integrity,
and availability of information resources for authorized organizational
end users. User authentication is a foundation procedure in the overall
pursuit of these objectives, and password procedures historically have
been the primary method of user authentication. There is an inverse
relationship between the level of security provided by a password procedure
and ease of recall for users. The longer the password and the more
variability in its characters, the higher the level of security is that is
provided by the password, because it is more difficult to violate or crack.
However, such a password tends to be more difficult for an end user to
remember, particularly when the password does not spell a recognizable
Copyright © 2005, Idea Group Inc. Copying or distributing in print or electronic forms without written
permission of Idea Group Inc. is prohibited.
TEAM LinG
A TAM Analysis of an Alternative High-Security User Authentication Procedure 281
word or when it includes non-alphanumeric characters such as punctuation
marks or other symbols. Conversely, when end users select their own more
easily remembered passwords, the passwords also may be cracked more
easily. This study presents a new approach to entering passwords that
combines a high level of security with easy recall for the end user. The
Check-Off Password System (COPS) is more secure than self-selected
passwords and high-protection, assigned-password procedures. The present
study investigates tradeoffs between using COPS and three traditional
password procedures, and provides a preliminary assessment of the efficacy
of COPS. The study offers evidence that COPS is a valid alternative to
current user authentication systems. End users perceive all tested password
procedures to have equal usefulness, but the perceived ease of use of COPS
passwords equals that of an established high-security password, and the
new interface does not negatively affect user performance compared to a
high-security password. Further research will be conducted to investigate
long-term benefits.
BACKGROUND
Despite continuing improvements in computer and network technology,
computer security continues to be a concern. One of the leading causes of
security breaches is the lack of effective user authentication, primarily due to
poor password system management (The SANS Institute, 2003), and the ease
with which certain types of passwords may be cracked by computer programs.
Yet even with today’s high-speed computers, an eight-character password can
be very secure, indeed. If a Pentium 4 processor can test 8 million combinations
per second, it would take more than 13 years on average to break an eightcharacter password (Lemos, 2002). However, the potential for password
security has not been fully realized, and a security breach can compromise
significantly the security of information systems, other computer systems, data,
and Web sites. Furthermore, the increasing degree to which confidential and
proprietary data are stored and transmitted electronically makes security a
foremost concern in today’s age of technology. This is true not only in civilian
use, but also in government and military use.
A primary objective of information system security is the maintenance of
confidentiality, which is achieved in part by limiting access to valuable information resources. Historically, user authentication has been the primary method of
protecting proprietary and/or confidential data by preventing unauthorized
access to computerized systems. User authentication is a foundation procedure
in the overall pursuit of secure systems, but in a recent e-mail to approximately
one million people, Bill Gates (chairman of Microsoft Corporation) referred to
Copyright © 2005, Idea Group Inc. Copying or distributing in print or electronic forms without written
permission of Idea Group Inc. is prohibited.
TEAM LinG
282 Warkentin, Davis and Bekkering
passwords as “the weak link” in computer security, noting that most passwords
are either easy to guess or difficult to remember (“Gates Pledges Better
Software Security,” 2003). Gates correctly identified a classic tradeoff that
system and network administrators must face when considering various password procedures for adoption. Specifically, there is an inverse relationship
between the level of security provided by a password procedure and the ease of
recall for end users. When end users select their own easily remembered
passwords, the passwords are easier to crack than longer passwords with a
greater variety of characters. The longer the password and the more variability
in the characters, the higher the level of security provided by such a password.
However, human memory has significant limitations, and such passwords tend
to be more difficult for end users to remember. Typically, human short-term
memory can store only seven plus or minus two (7 ± 2) “chunks” of information
(Miller, 1956), and alphanumeric characters such as punctuation marks and other
symbols are not easily combined in a chunk with other characters. For example,
the letters b, a, n, and d can be stored easily together as a single chunk, but it is
difficult for humans to combine symbols such as the vertical bar ( | ) and tilde
( ~ ) with other characters to form a chunk. The problem of striking a balance
between security and ability to remember passwords will become more acute as
the number of passwords per user increases.
In a survey with 3,050 distinct respondents (Rainbow Technologies Inc.,
2003), the following picture emerged:
•
•
•
•
•
•
Respondents used, on average, almost 5½ passwords
23.9% of respondents used eight or more passwords
More than 80% were required to change passwords at work at least once
a year
54% reported writing down a password at least once
9% reported always writing down their passwords
More than half had to reset business passwords at least once a year,
because they forgot or misplaced the password
The 352 participants in the present study reported using an average of 3.9
passwords at the time of the study and 4.53 passwords in the prior six months.
Furthermore, 35.5% reported writing down at least one password. Clearly, the
use of multiple passwords constitutes a burden to users.
PASSWORD STRATEGIES
Because of these tradeoffs and because methods and technologies employed by crackers are improving constantly, new security strategies with
Copyright © 2005, Idea Group Inc. Copying or distributing in print or electronic forms without written
permission of Idea Group Inc. is prohibited.
TEAM LinG
A TAM Analysis of an Alternative High-Security User Authentication Procedure 283
improved password procedures are required. Traditional methods include allowing users to select their own passwords and assigning passwords to them, both
of which may be subject to restrictions on password length and character
choices. The efficacy of both systems depends on the ability of end users to recall
such passwords without writing them down. The Federal Information Processing
Standards (FIPS) publication 112 includes guidelines for different levels of
password security (National Institute of Standards and Technology, 1985). At
the highest level, these guidelines include passwords with six to eight characters
composed from the full 95 printable character ASCII set. Furthermore, the
guidelines specify using an automated password generator, individual ownership
of passwords, use of non-printing keyboards, encrypted password storage, and
encrypted communications with message numbering. The theoretical number of
passwords using the FIPS procedure is approximately 6.7 x 10¹⁵ ( = 958 + 957 +
956 ). However, to utilize the full set of characters, all printable non-alphanumeric
characters must be included in the set and have an equal chance of selection as
the alphanumeric characters. But passwords with non-alphanumeric characters
can be hard to remember. Consider, for example, passwords such as “ ,swFol=; ”
or “ >_F<“Yjz .” To avoid having to use such awkward passwords, we have
devised a new password interface for user authentication. (The FIPS procedure
is one of the four procedures investigated in this study.)
When allowed to select their own password, users tend to select passwords
that may be easy to remember but also may be easy to crack. On the other hand,
when they are assigned a cryptographically strong password, users generally will
find them difficult to remember and will frequently record them in writing. To
remedy these potential security problems, various strategies currently are used.
Some organizations attempt to reduce the number of passwords needed by using
a single system sign on (SSO) (Boroditsky & Pleat, 2001). Others are researching the possibility of using graphical mechanisms (Bolande, 2000; Pinkas &
Sander, 2002) or combining passwords with keystroke dynamics (Monrose,
Reiter, & Wetzel, 1999). Organizations can instruct their members in the proper
selection of passwords to varying degrees, from simple instructions regarding the
minimum number of positions and the minimum variability of characters to
extensive instructions and even feedback mechanisms where weak passwords
are rejected immediately (Bergadano, Crispo, & Ruffo, 1998; Jianxin, 2001).
Weirich and Sasse (2001) advocate proper instruction and motivation of users,
as well as a flexible approach depending on the organization and type of work for
which the security is needed. The self-selection procedure (“Self”) is the second
of four procedures investigated in this study. Users were required to include at
least one letter and at least one number in their password and were required to
select passwords of at least six but not more than 14 characters in length. The
third procedure utilizes system-assigned passwords from the list of common
Copyright © 2005, Idea Group Inc. Copying or distributing in print or electronic forms without written
permission of Idea Group Inc. is prohibited.
TEAM LinG
284 Warkentin, Davis and Bekkering
passwords found in Spafford’s Technical Report (1988), typically spelling
common words that are relatively easily remembered (“Spafford”). Table 1
shows some examples of passwords that might be used under the three primary
password procedures in use today.
In a study of password usage, Adams and Sasse (1999) identified the
following four factors that negatively influence the use of passwords:
1.
2.
3.
4.
The need to remember multiple passwords due to the use of different
passwords for different systems and the requirement to change passwords
at intervals;
Lack of user awareness regarding the requirements for secure password
content
Perceived lack of compatibility of passwords with work practices
Unrealistic user perception of organizational security and information
sensitivity
Though the latter three factors can be remedied with organizational
measures such as review of password policies and user education, the first factor
is grounded in the limitations of human memory. Since the number of secure
systems used by each individual is bound to increase rather than decrease over
time, resulting in the need to remember more passwords, memory limitations
must be accommodated.
Table 1. Examples of passwords used in current password procedures
Self-Selected
Spafford
FIPS
fido
academia
|iaSq/a<
101565 (birthdate)
brenda
.EUg`=M=
mustang
deluge
JVe*,UuB
corvette
garfield
1X+]HpM?
2895 (last four of SSN)
heinlein
*R(AO-3P
mary
irishman
&\qe2P\H
john
lamination
,WU$&TTW
newyork
marvin
Ua#==f9Z
godawgs81 (sports fan)
napoleon
GB<X(DE)
chevy1
oxford
_so\yor$
march241981
password
$4Y,*T6R
Jesus1
rascal
L1t_<Mv,
covergirl1
saxon
`(WCpod{
holein1 (golf fan)
william
2]^p<ngn
Bu11ocks
yellowstone
s@5A:L7>
Copyright © 2005, Idea Group Inc. Copying or distributing in print or electronic forms without written
permission of Idea Group Inc. is prohibited.
TEAM LinG
A TAM Analysis of an Alternative High-Security User Authentication Procedure 285
HUMAN MEMORY
A heuristic for the capacity of the human short-term memory system states
that an individual can recall seven plus or minus two (7 ± 2) chunks of information
(Miller, 1956). This rule of thumb only applies to information to be recalled for
relatively brief periods without rehearsal. Information can be maintained for
longer periods of time, but elaborate rehearsal is required for transfer to longterm memory (Hewett, 1999; Newell & Simon, 1972). A recent model describes
a working memory, which is part of the larger memory system and not distinct
from long-term memory (Anderson, 1994). In this model, memory limitations also
depend on the ability to retrieve information from long-term storage to working
memory. Regardless of the cognitive model, a capacity limitation exists. The
proposed password procedure addresses this memory capacity limitation by
using a password that may be easier to remember than FIPS-compliant passwords, although the input mechanism may be more cognitively challenging.
CHECK-OFF PASSWORD SYSTEM (COPS)
Traditional password procedures either assign an ordered series (sequence)
of characters, which may or may not spell something meaningful to the user, or
allow users to select their own ordered sequence of characters. In either case,
the order of the characters is significant and must be maintained. A strength of
the Check-Off Password System (COPS), the fourth procedure in this investigation, is that the order of characters within the password is irrelevant, and,
therefore, the user can choose to remember them in many ways. A COPS
password is assigned to each user and consists of a set of eight different
characters (the “COPS password”) selected from the 16 most commonly used
letters in the American alphabet (AskOxford.com, 2002) (the “COPS Superset”),
including all five major vowels (E A R I O T N S L C U D P M H G). The user
may form any word or words by rearranging these eight characters (similar to
an anagram) and may use any of the characters repeatedly in doing so. For
example, suppose a user were issued the characters “ULATSREG,” which we
will refer to as the “Example Password.” Using the characters in the Example
Password, one user might form the compound word “STARGLUE” in order to
remember the eight characters, whereas another user may select “GLUERATS,”
“SLUGTEARS,” or “RESTGULAG.” In other words, while the Example
Password (and every COPS password) consists of a random selection of 8
alphabetic characters without repetition, users may reorder those characters
(and use characters more than once) to form their own password to facilitate
recall. The user even may use characters not found in the COPS Superset (B F
Y W K V X Z J Q) to form a memorizable password, since those characters will
not be included on the input interface (the COPS selection grid), as described
Copyright © 2005, Idea Group Inc. Copying or distributing in print or electronic forms without written
permission of Idea Group Inc. is prohibited.
TEAM LinG
286 Warkentin, Davis and Bekkering
later. For example, by using the “B” character, a music aficionado could form the
password “GREATBLUES” from the Example Password. In addition to users
tapping their imagination to form a memorable password, an automated password generator with a facility for suggesting words from a dictionary could be
used. Table 2 shows some additional examples of COPS passwords with several
user-tailored modifications.
To authenticate the user, COPS presents an 8-by-7 grid of checkboxes,
each adjacent to a character randomly selected from the COPS Superset. The
user checks off only the boxes adjacent to characters contained in the COPS
password. Because the grid contains 56 checkboxes generated from only 16
characters (the COPS Superset), characters will typically appear more than
once. On average, each character in the COPS Superset will appear in a grid 3.5
times (56 ¸16), ranging from a minimum of zero times (even if such character
appears in the COPS password) to a maximum of 56 times, although each of
those extremes would be a rare occurrence. Thus, users must check off a given
letter in a COPS password an average of 3.5 times, as follows.
Consider the Example Password again (“ULATSREG”). To enter the
password, the user would be presented with a grid such as the one shown in
Figure 1, which demonstrates a failed attempt to enter the Example Password.
To successfully enter the Example Password in such grid, the user would need
Table 2. Examples of COPS passwords with user-tailored modifications
Original COPS Password
TRLOHASM
GDRHISTE
MROTPSCA
ENTMAOPL
RMTOCALG
SAGNTPHI
TASHMREN
User-Tailored COPS Password
HARM BOLTS
FARM SLOTH
SLAM THROW
RAM SLOTH
WED RIGHTS
DREG THIS
THE GIRDS
DR EIGHTS
CRAFTS MOP
RAMP COST
CAM SPORT
FARM PC TO
PETAL MONK
PANT MOLE
PANEL TOM
LAMB PET ON
GRAM CLOT
CART GLOM
TRACK GLOM
TRACY GLOM
SNAP BIGHT
HANG SPIT
PANT WHIGS
PAST NIGH
FARMS THEN
HARM VENTS
WHEN SMART
MARSH NEWT
HAL STORM
HALF STORM
HARM LOTS
MARSH LOT
RED SIGHT
SHRED TWIG
SHRED GIFT
BIGHTS RED
WORST CAMP
CATS PROM
CRAP MOST
CRAB STOMP
MENTAL POW
NAME PLOT
LAMP TONE
TAP MELON
CLOG MART
MALT VCR GO
TRAM CLOG
GRAM COLT
PATH SIGN
GAP HINTS
HANG PITS
ZAP NIGHTS
SMART HEN
TRASH MEN
MATH FERNS
MASH RENT
Copyright © 2005, Idea Group Inc. Copying or distributing in print or electronic forms without written
permission of Idea Group Inc. is prohibited.
TEAM LinG
A TAM Analysis of an Alternative High-Security User Authentication Procedure 287
to check the box adjacent to every “U” appearing in the grid (i.e., three “U”
checkboxes would need to be checked), and the user would need to check the
box for every “L” appearing in the grid (i.e., four “L” checkboxes), and so forth.
In Figure 1, the user has neglected to check off the “S” box in the fifth row of
the eighth column, which will result in a failed login attempt. When the user fails
to successfully check all of the necessary boxes, he or she will be presented with
a new grid in a randomized layout, which will almost certainly be different than
the preceding layout. The user must reattempt the COPS procedure with the
same password and a new grid.
Without the ever-changing grid interface, the number of possible combinations would be no higher than C(16,8) or 12,870, because the presence of one
instance of a character would determine the result for all other instances of the
same character. In other words, if one “T” is selected, all other boxes with a “T”
on the same interface should also be selected. A cracker could manually try to
enter all 12,870 combinations, although time considerations would make this
impractical. But this assumes that the cracker is a human who is able to see the
letters next to each checkbox. A computer could run through combinations much
faster, but the lack of knowledge of which letters appear on the grid (due to the
lack of sight) causes the number of possible combinations to increase to 256 or
7.2 x 10¹⁶. For the computer, the number of possible combinations is higher than
the 12,870 combinations for humans, because the universe of possible combinations is based on 56 checkboxes rather than letters appearing on the grid. Optical
Character Recognition (OCR) could overcome this limitation of computers and
is currently effectively counteracted online by major organizations such as
AltaVista, PayPal, Yahoo (Pinkas & Sander, 2002) and Ticketmaster
Figure 1. Representative COPS selection grid
Copyright © 2005, Idea Group Inc. Copying or distributing in print or electronic forms without written
permission of Idea Group Inc. is prohibited.
TEAM LinG
288 Warkentin, Davis and Bekkering
(Ticketmaster, 2003) by using a Reverse Turing Test (Coates, Baird, &
Fateman, 2001). As long as the layouts are randomly generated and OCR cannot
be used effectively, the number of possible combinations with 56 check-off
boxes either selected or not selected will remain 2 56 or 7.2 x 10 16. Unlike selfselected, Spafford, and FIPS passwords, COPS passwords achieve both a high
level of security and a high degree of memorability—neither goal of password
procedures is made paramount at the expense of the other. In other words, the
COPS paradigm achieves the “best of both worlds” in terms of security and
memorability.
RESEARCH QUESTIONS
Given these issues, an investigation into the COPS password system was
undertaken in order to assess its efficacy in an end-user environment. Would the
COPS system be perceived as useful and easy to use? Would users be inclined
to use the COPS system, given the presumed relative tradeoff in its use? From
these research questions, the following specific research hypotheses were
developed.
Hypothesis 1: All password procedures are perceived to be equally useful.
Hypothesis 2: All password procedures are perceived to be equally easy to
use.
Hypothesis 3: Users will be equally inclined to use each of the password
procedures.
METHODOLOGY
For this investigation, the authors devised and executed a controlled
experiment in which the participants took a pre-survey to characterize their
perceptions about the usefulness of passwords and their preferences and
intention to use passwords in general. The participants then used one of the four
password procedures under investigation, followed by a post-survey regarding
their perceptions of the password procedure they used in the experiment. This
research methodology is based on the theoretical foundations of the Technology
Acceptance Model, from which the survey instrument was derived in a modified
form.
Applicability of TAM
In new technology implementations, the Technology Acceptance Model
(TAM) indicates that Perceived Ease of Use (PEOU) and Perceived Usefulness
(PU) are considered antecedents of Behavioral Intent to Use (BI), which in turn
Copyright © 2005, Idea Group Inc. Copying or distributing in print or electronic forms without written
permission of Idea Group Inc. is prohibited.
TEAM LinG
A TAM Analysis of an Alternative High-Security User Authentication Procedure 289
is an antecedent to actual use (Davis, 1989). Although the semi-self-selected
passwords using COPS are relatively easy to remember, the system also
requires user input that is more cognitively challenging than traditional password
systems. If only one check-off box is erroneously missed or selected, an entirely
new check-off grid is generated and must be completed, thereby increasing the
cognitive load of the activity. This may cause the system user to become
frustrated, resulting in a low Perceived Ease of Use of the password procedure.
If the user had a choice, such frustration might generate resistance to adopting
the technology. The end user typically does not have a choice, however, of which
password procedure is employed for user authentication. The selection of user
authentication measures is the purview of system administrators, not end users.
One might query, therefore, why researchers should be interested in end users’
“intention to use” password procedures and why TAM is relevant to determining
the potential for the widespread adoption of COPS.
Although system or network administrators are responsible for the selection
and adoption of password procedures to protect the systems they manage, such
decisions are not made in a vacuum. They are not at liberty to select the most
cryptographically secure password procedure, if users are unable to efficiently
and effectively use such a system. Imagine at one extreme a password system
that is impossible to crack but also impossible to use. Obviously, implementation
of that system is infeasible. Also, an extremely secure password procedure can
generate user resistance and complaints, and lead to a high incidence of
passwords being reset. At the other extreme is a password procedure that is
extremely easy to use but also extremely easy to crack. Such a system also is
not likely to be a system administrator’s preferred choice. A system administrator must weigh the multiple objectives of a password system (including security
and usability) in determining the most suitable password procedures to use for
the protection of different computer systems. Therefore, PEOU and PU, as
measured from the user’s perspective, are indirect factors affecting the system
administrator’s adoption of a password procedure. Thus, it is imperative that
we test the PEOU and PU of COPS from the user’s perspective in order to
evaluate its potential as an alternative to current user authentication methods. In
order to preliminarily evaluate the efficacy of COPS, a controlled empirical study
comparing user perceptions of COPS and existing alternatives was conducted.
Scale Development and Modification
A formal process was observed to develop measurement scales with
reliability and validity within the TAM framework. A large inventory of existing
TAM scale items was gathered from existing literature and adjusted for use in
this password procedure study. During this process, the authors were confronted
with the contrast between password procedures and other technologies in which
the TAM model has been used to research user acceptance. In previous studies,
Copyright © 2005, Idea Group Inc. Copying or distributing in print or electronic forms without written
permission of Idea Group Inc. is prohibited.
TEAM LinG
290 Warkentin, Davis and Bekkering
ease of use and usefulness were considered assets of the technology. For
example, if a menu clearly enables a user to attach a file to an e-mail with one
click, it might be deemed easy to use. For a password procedure, however, ease
of use may be a liability if it allows unauthorized users to easily crack the
password procedure and obtain unauthorized access to a computer system or
confidential data. Moreover, it is never easier to access a system that requires
a password than a system that does not require a password. Similarly, the
usefulness of a password protection procedure may not be apparent to the user,
unlike the functionality of e-mail or other software. This requires some modification of the traditional TAM scales.
For example, an original Davis (1989) TAM instrument item stated, “Electronic mail enables me to accomplish tasks more quickly” (p. 324). If we simply
had modified existing TAM indicators by substituting password procedures for
the technology being tested, the instrument items would not have measured
properly the Usefulness or Ease of Use in this context. For example, users
always would strongly disagree with the statement, “This password system
enables me to log on to computers more quickly,” because password systems, by
their very nature, require more time and make it more difficult to logon to
computers. It was critical, therefore, to measure the constructs in terms of the
absence of a negative, specifically the absence of inconvenience and frustration
to the user. The above question was, therefore, modified as follows: “I can
efficiently access computers even when I must use this password procedure.”
Similarly, the traditional TAM question, “Using this technology saves me time,”
was modified to read, “Using this password procedure does not take too much
time.”
Furthermore, password procedures do not facilitate end-user activity by
producing a tangible benefit such as improved communication or increased
efficiency in completing a task. The primary benefit of password procedures is
maintaining the security of confidential data or proprietary applications. Such
security is achieved by limiting access to authorized users through user authentication methods such as password procedures. Whether the purpose of such
security is to protect a user’s own data or an employer’s data, password
procedures frequently may be viewed by the user as a hindrance rather than a
facilitator to accomplishing a task. While in the long run the user may recognize
the necessity of password procedures for maintaining security, passwords often
may be viewed as a necessary evil that otherwise impairs the user’s immediate
need for legitimate and authorized access to protected data or applications.
Therefore, we determined that it was necessary to modify traditional TAM
indicators designed to measure perceived usefulness of technologies in general
to properly measure perceived usefulness in this context (see Table 3 for the
resulting instrument items).
With these differences in mind, we made appropriate adjustments to
standard TAM survey instrument items and developed a pre-test research
Copyright © 2005, Idea Group Inc. Copying or distributing in print or electronic forms without written
permission of Idea Group Inc. is prohibited.
TEAM LinG
A TAM Analysis of an Alternative High-Security User Authentication Procedure 291
instrument to measure attitudes toward password procedures in general and a
post-test research instrument to measure attitudes toward the particular password procedure to which a user was exposed during the study. We generated a
list of 14 potential items to measure PU, 16 potential items to measure PEOU,
and five potential items to measure BI. Because all items were generated using
well-established scales, all participants in our study responded to all items in the
pre-survey before exposure to a password procedure, and then responded again
to all items in the post-survey after exposure to one of the four password
procedures being tested. All items were measured on a five-point Likert scale
ranging from strongly disagree to strongly agree.
Data Collection
The study was conducted as a controlled experiment in a large computer
facility with 40 stations, where 352 participants were exposed to one of the
following four password procedures: (1) self-selected passwords with limited
restrictions;, (2) system-assigned passwords from the list of common passwords
found in Spafford’s Technical Report (1988); (3) system-assigned passwords
compliant with the FIPS standard for high protection (National Institute of
Standards and Technology, 1985); and (4) system-assigned passwords in the
Check-Off Password System (COPS). The size of the groups was almost equal,
with n = 90 for COPS, n = 88 for self-selected passwords, and n = 87 for FIPS
and Spafford passwords. All participants were experienced system users who
used an average of 3.90 passwords at the time of the study and 4.53 passwords
in the six months prior.
Each study participant signed an implied consent form and then received a
disk containing a compiled program written in Visual Basic. All disks were
numbered and contained only one of four versions of the program. Each version
of the program incorporated the pre-test instrument to measure attitudes toward
password procedures in general, a login procedure using one of the four
password procedures, and the post-test instrument to measure attitudes toward
that particular password procedure. The different versions of the program were
randomly distributed to participants (with randomization accomplished by using
randomization functions in Microsoft Excel), so that participants were randomly
exposed to the different password procedures. These randomized disks with no
indication of the version were distributed sequentially as participants arrived at
the lab. Participants executed the program from the disk, and at the end of the
session, all data were automatically captured to a text file with the text files
transferred to the researcher’s hard disk after completion.
Each program started with a brief general description of the purpose of the
study. Participants were informed that they would be using only one of four
possible password procedures, and that they would have the option to stop trying
if they were unable to successfully enter the correct password within five
Copyright © 2005, Idea Group Inc. Copying or distributing in print or electronic forms without written
permission of Idea Group Inc. is prohibited.
TEAM LinG
292 Warkentin, Davis and Bekkering
attempts, in which case the participants were presented immediately with the
post-test survey instrument. After completing the pre-test survey reflecting
general attitudes, participants received instructions for using the password
procedure contained on their disk. Instructions for each procedure were
different only to the extent necessary due to differences in the procedure to be
used. After successfully entering their password (or electing to stop trying after
five failed attempts), participants completed the post-test survey regarding the
procedure they had just used and answered general demographic questions.
Upon completion, disks were immediately returned to the researchers. Participants experienced minimal waiting time to receive their disks, and, once
received, there was no further delay.
Scale Purification
Following data collection, we used the pre-test survey responses to generate the measurement scales. First, all items hypothesized to reflect one of the
constructs were used to generate a unidimensional scale for each construct.
Items were eliminated based on changes in coefficient Alpha and their effect on
unidimensionality. A list of pre-test and post-test instrument items and their
status of inclusion or elimination is provided in Table 3.
The scale for PU retained seven items and had a coefficient Alpha of 0.91.
The scale for PEOU also retained seven items and had a coefficient Alpha of
0.80. In his classic work, Davis (1989) noted that this construct may contain three
clusters relating to physical effort, mental effort, and ease of learning. Consistent
with his findings, each cluster appears to be represented by two items in our
scale, with overall ease of use as the seventh item. Finally, the scale for BI
retained three items, with a coefficient Alpha of 0.71. All three scales were
unidimensional. Testing for discriminant validity between the three constructs
was performed with a Varimax rotation of all items in the scales, yielding clear
loading on the hypothesized construct without any cross-loadings (see Table 4).
RESULTS AND DISCUSSION
According to the TAM literature, PEOU and PU influence BI. Real-world
user authentication, however, is accomplished with password procedures that
are mandated by the organization or its technical staff, not adopted by user
choice. Password procedure usage results indirectly from users’ needs to use
computer systems. In addition, one of our procedures (COPS) is experimental
and not currently available for real-life application. Therefore, the full TAM
model, which includes actual use, cannot be evaluated. In this chapter, we will
limit our analysis to a discussion of differences between the four password
procedures in terms of PEOU, PU, and BI, but not actual use, which was
impossible to observe. To measure the effect of each procedure, we used
Copyright © 2005, Idea Group Inc. Copying or distributing in print or electronic forms without written
permission of Idea Group Inc. is prohibited.
TEAM LinG
A TAM Analysis of an Alternative High-Security User Authentication Procedure 293
summated scales constructed from the responses to the individual items. Since
all items were worded positively, no reversal of negative scoring was needed.
The ANOVA model for PU revealed an absence of statistically significant
differences between the four procedures (p = 0.84).
Table 3. Pre- and post-test instrument items
Item
PU1
PU2
PU3
PU4
PU5
PU6
PU7
PU8
PU9
PU10
PU11
PU12
PU13
PU14
PEOU1
PEOU2
PEOU3
PEOU4
PEOU5
PEOU6
PEOU7
PEOU8
PEOU9
PEOU10
PEOU11
PEOU12
PEOU13
PEOU14
PEOU15
PEOU16
BI1
BI2
BI3
BI4
BI5
Pre-Test Instrument Item
Password procedures effectively protect my
confidential information.
Password procedures enable computers to limit
access to authorized users.
I find password procedures useful.
Using password procedures to maintain security
is a good idea.
Using password procedures is generally
important for using computers.
Using password procedures is important to me
for using computers.
Using password procedures enhances my
security when working with computers.
I find password procedures useful for protecting
my confidential information.
Using password procedures improves the
security of my confidential information.
Password procedures are an effective way to
maintain security.
Password procedures improve the security of
computers.
I find password procedures useful for limiting
access to confidential information.
Using password procedures for security is
important to me.
Overall, I find password procedures useful.
Using password procedures is an easy method
for maintaining security.
Using password procedures does not take too
much time.
Password procedures make it difficult to use
computers.
Password procedures make it easier for me to
maintain security.
When I use password procedures, computers
behave in unexpected ways.
Using password procedures requires a lot of
mental effort.
I can efficiently access computers even when I
must use password procedures.
I make mistakes frequently when I use
password procedures.
I find it easy to correct my mistakes while using
password procedures.
I often become confused when I use password
procedures.
It is easy for me to become skillful at using
password procedures.
Learning to use password procedures is easy for
me.
Passwords are easy to remember.
Passwords are easy to enter.
Using password procedures is frustrating.
Overall, password procedures are easy to use.
I do not mind using password procedures when
they are required.
Whenever possible, I will avoid using
computers that require password procedures.
I intend to choose password procedures for
security over other procedures if I am given a
choice.
I would prefer using computers that use
password procedures.
I intend to use password procedures.
Post-Test Instrument Item
This password procedure would effectively
protect my confidential information.
This password procedure would enable
computers to limit access to authorized users.
I would find this password procedure useful.
Using this password procedure to maintain
security would be a good idea.
Using this password procedure would be
generally important for using computers.
Using this password procedure would be
important to me for using computers.
Using this password procedure would enhance
my security when working with computers.
I would find this password procedure useful for
protecting my confidential information.
Using this password procedure would improve
the security of my confidential information.
This password procedure would be an effective
way to maintain security.
This password procedure would improve the
security of computers.
I would find this password procedure useful for
limiting access to confidential information.
Using this password procedure for security
would be important to me.
Overall, I would find this password procedure
useful.
Using this password procedure would be an easy
method for maintaining security.
Using this password procedure would not take
too much time.
This password procedure would make it difficult
to use computers.
This password procedure would make it easier
for me to maintain security.
When I used this password procedure, the
computer behaved in unexpected ways.
Using this password procedure would require a
lot of mental effort.
I could efficiently access computers even if I
must use this password procedure.
I made mistakes frequently when I used this
password procedure.
I found it easy to correct my mistakes while
using this password procedure.
I often became confused when I used this
password procedure.
It would be easy for me to become skillful at
using this password procedure.
Learning to use this password procedure was
easy for me.
This password was easy to remember.
This password was easy to enter.
Using this password procedure was frustrating.
Overall, this password procedure was easy to
use.
I would not mind using this password procedure
if it were required.
Whenever possible, I would avoid using
computers that require this password procedure.
I intend to choose this password procedure for
security over other procedures if I am given a
choice.
I would prefer using computers that use this
password procedure.
I intend to use this password procedure.
Status
Eliminated
Eliminated
Eliminated
Eliminated
Eliminated
Eliminated
Retained
Eliminated
Retained
Retained
Retained
Retained
Retained
Retained
Eliminated
Eliminated
Eliminated
Eliminated
Eliminated
Eliminated
Retained
Eliminated
Retained
Eliminated
Retained
Retained
Retained
Retained
Eliminated
Retained
Eliminated
Eliminated
Retained
Retained
Retained
Copyright © 2005, Idea Group Inc. Copying or distributing in print or electronic forms without written
permission of Idea Group Inc. is prohibited.
TEAM LinG
294 Warkentin, Davis and Bekkering
The results show that end users do not perceive any procedure to be more
useful than another (see Table 5) but do consider passwords in general to be
useful, considering the high average mean scores for the our procedures (COPS
25.6, FIPS 26.0, Spafford 26.0, and Self 27.6 on a scale raging from 7 to 35). This
absence of differences between procedures may be related to the fact that using
passwords is generally mandated by system administrators rather than chosen
by users, but could also be related to lack of user awareness regarding the
protection that each procedure offers. Users generally are not aware of the ease
with which self-selected or Spafford passwords can be cracked. Similarly, users
generally do not reflect on the level of computing resources necessary to
compromise passwords with the number of permutations offered by FIPS and
COPS, and the amount of time required to be successful. In order not to influence
our participants and possibly skew the responses with the impressive differences
in the level of security provided by the different password procedures, we did not
provide any information regarding this issue.
There were significant differences (p = 0.00) between password procedures for PEOU, but only between the two groups with low and high levels of
security (and consequently different levels of effort needed to use them).
Considering our large sample of 352 participants, average summated scores for
Table 4. Factor analysis of PU, PEOU, and BI
PU7
PU9
PU10
PU11
PU12
PU13
PU14
PEOU7
PEOU9
PEOU11
PEOU12
PEOU13
PEOU14
PEOU16
BI3
BI4
BI5
Using password procedures enhances my
security when working with computers.
Using password procedures improves the
security of my confidential information.
Password procedures are an effective way to
maintain security.
Password procedures improve the security
of computers.
I find password procedures useful for
limiting access to confidential information.
Using password procedures for security is
important to me.
Overall, I find password procedures useful.
I can efficiently access computers even
when I must use password procedures.
I find it easy to correct my mistakes while
using password procedures.
It is easy for me to become skillful at using
password procedures.
Learning to use password procedures is easy
for me.
Passwords are easy to remember.
Passwords are easy to enter.
Overall, password procedures are easy to
use.
I intend to choose password procedures for
security over other procedures if I am given
a choice.
I would prefer using computers that use
password procedures.
I intend to use password procedures.
PU
Component
PEOU
BI
.799
.082
.171
.852
.028
.015
.803
.116
.003
.795
.161
.011
.790
.121
.016
.747
.117
.279
.782
.155
.204
.121
.570
.059
.046
.653
.028
.137
.711
.208
.130
.766
.181
.071
.045
.693
.530
.216
.127
.181
.626
.371
.102
.236
.620
.081
.220
.812
.113
.226
.797
Copyright © 2005, Idea Group Inc. Copying or distributing in print or electronic forms without written
permission of Idea Group Inc. is prohibited.
TEAM LinG
A TAM Analysis of an Alternative High-Security User Authentication Procedure 295
Table 5. ANOVA for PU
Tests of Between-Subjects Effects
Dependent Variable: Perceived Usefulness
Source
Type III
Sum of Squares
df
200.966(a)
3
66.989
2.236
.084
1
243,442.351
8125.086
.000
2.236
.084
Corrected Model
243442.351
Intercept
200.966
Mean Square
3
66.989
Error
10426.713
348
29.962
Total
254071.000
352
10627.679
351
Password Procedure
Corrected Total
F
Sig.
R Squared = 0.019 (Adjusted R Squared = 0.010)
COPS (21.82) and FIPS (22.0) are remarkably close, and the difference is
statistically negligible (p=.995). The average scores for the lower-security
Spafford (29.38) and self-selected passwords (29.41) are much higher than their
high-security counterparts and not (p = 1.00) different from each other. Interestingly, the specific forms of the password procedures used appear to be
irrelevant (see Table 6).
The same pattern (p = 0.00) can be found in the average summated scores
for BI. Users are more inclined to use self-selected (11.1) or Spafford (10.46)
passwords than either COPS or FIPS, but have no clear preference (p = .443)
between the self-selected and Spafford passwords. Users are less inclined to use
either COPS (8.29) or FIPS (8.84), but without a clear preference (p = .591)
between those two procedures. The pattern is evident from Table 7. Of equal
interest to system administrators may be the response to item BI1 (“I would not
mind using this password procedure if it were required”), not included in the
scale. The average summated score for COPS (3.17) is not statistically
significantly (p= .056) different from FIPS (3.53).
In contrast with differences in PEOU and BI, examination of demographic
information revealed no influence of gender (p = .186), or computer ownership
Table 6. Difference of means for PEOU*
Password Procedure
N
COPS
90
21.81
FIPS
87
22.00
Tukey HSD Spafford
Self-selected
Significance (Alpha =. 05)
Subset 1 Subset 2
87
29.38
88
29.41
.995
1.000
* Scale of 7-35, with higher scores indicating higher PEOU.
Copyright © 2005, Idea Group Inc. Copying or distributing in print or electronic forms without written
permission of Idea Group Inc. is prohibited.
TEAM LinG
296 Warkentin, Davis and Bekkering
Table 7. Difference of means for BI*
Password procedure
N
COPS
90
8.29
FIPS
87
8.84
Tukey HSD Spafford
Self-selected
Subset 1 Subset 2
87
10.46
88
Significance (Alpha=.05)
11.11
.591
.441
*Scale of 3-15, with higher scores indicating higher BI
(p = .244) on intent to use any of the procedures. Finally, performance measures
revealed that COPS and FIPS require a statistically equal (p = .29) number of
attempts to successfully enter the correct password (3.17 and 2.83 attempts,
respectively), and that users are equally likely (p = .92) to abandon the procedure
after repeated failed attempts. We did find a statistically significant difference
in completion time for each attempt, between COPS (84.0 seconds) and all other
procedures (Spafford 9.3 seconds, self-selected 10.3 seconds, FIPS 17.9
seconds). Indeed, participants required substantially more time (over a minute
longer) to login using the COPS password than any of the other passwords. This
finding is not shocking, however, in light of the fact that the Spafford, selfselected, and FIPS passwords involve the familiar task of entering characters
in a textbox using a keyboard, while COPS involves a new task of selecting
checkboxes using a mouse. We surmise that the time required to login using a
COPS password would significantly diminish over time as users acquire practice
and familiarity with the task. Moreover, it is interesting that the substantial
difference in completion time did not result in a significant difference in PEOU
between COPS and FIPS, which may indicate that the difficulty of logging in
using COPS is commensurate with the difficulty of logging in using FIPS, albeit
for different reasons. In the case of FIPS passwords, the difficulty of remembering odd characters such as the vertical bar ( | ) and tilde ( ~ ) and locating
them on the keyboard presumably reduced its PEOU scores.
Having empirically established that for high security systems COPS and
FIPS are not distinguishable from a usability point of view, we will briefly discuss
the security levels afforded by both. Initially, COPS and FIPS seem to afford a
fairly comparable level of security, considering the total number of combinations
(7.2 x 10¹⁶ vs. 6.7 x 10¹⁵). This similarity is illusory, however, if users of FIPS are
allowed to select their own passwords to make them easier to remember.
Theoretically, this applies even more if restrictions other than minimum password length are placed on password selection, since each restriction decreases
the total search space for a given password length. Character-selection restric-
Copyright © 2005, Idea Group Inc. Copying or distributing in print or electronic forms without written
permission of Idea Group Inc. is prohibited.
TEAM LinG
A TAM Analysis of an Alternative High-Security User Authentication Procedure 297
tions reduce the search space of combinations by a very significant amount, in
some cases by more than 90%. For instance, the FAA can be considered to be
an organization with high security requirements, especially after September 11,
2001. Government documents are no longer freely posted on the World Wide
Web (WWW), but a copy of the FAA Policy on Password Administration (2002)
is cached on Google. Restrictions on password selection include using at least
three of four characteristics: two or more numeric characters, two or more
upper-case non-numeric characters, two or more lower-case non-numeric
characters, and one or more special characters. For the best combination, the
search space of combinations decreases by an astonishing 99.8% (953x33x26 4/
958 = 1.3 x 10¹³/6.6 x 1015 = 0.19% of original combinations left).
Computers continue to increase in speed. Soon, we may reach the point
where a reduced search space can be effectively covered in a brute force attack.
At that point, system administrators are no longer able to balance security and
usability concerns, and allowing users to select their own passwords may not be
an option. Before we reach that point, easier-to-remember passwords such as
COPS need to be researched and introduced in the field.
CONCLUSION
This study has demonstrated that end users perceive password procedures
equally useful regardless of the specific procedure used. Further, though the
study also shows that users perceive easy-to-remember passwords as easier to
use than high security passwords and, therefore, are more inclined to use them,
the mathematical and practical difficulty of hacking the high-security password
procedures makes them more attractive to system administrators. A classic
tradeoff is found to exist between ease of use and effectiveness of various
password systems. Procedures that are easier for end users likely are also easier
for hackers to compromise.
The study establishes that at least one acceptable alternative exists for the
current guidelines for high security passwords as defined in FIPS 112—namely,
the Check-Off Password System (COPS). If system administrators wish to use
password procedures with protection levels equal to or exceeding the high
security guidelines of FIPS 112, passwords from the full 95-character set should
be assigned and not chosen, or an alternative password procedure such as COPS
should be used. COPS can provide a secure alternative to FIPS passwords,
which are difficult to remember for many users. COPS is more secure than FIPS
by a factor of 10 (7.2 x 10¹⁶ vs. 6.7 x 10¹⁵)), and, despite the additional time
required to enter a COPS password, PEOU is equal for both procedures.
Moreover, as the number of passwords per user increases (because the number
of secure systems they must access multiplies), improved memorability becomes
an increasingly strong advantage of COPS passwords.
Copyright © 2005, Idea Group Inc. Copying or distributing in print or electronic forms without written
permission of Idea Group Inc. is prohibited.
TEAM LinG
298 Warkentin, Davis and Bekkering
Future research efforts should include conducting longitudinal studies to
establish the efficacy of COPS for more realistic applications in which passwords are used to access systems repeatedly over time. In particular, future
studies should examine whether training end users how to use COPS passwords
has an impact on its PEOU, and whether the time required to login using the
COPS password procedure significantly decreases with proper training and
repeated usage to the point where the login time is comparable to that of the FIPS
password procedure. Will users be more able to remember the COPS password
than the alternative high-security password (FIPS) for realistic periods of time?
The PEOU and PU of COPS also should be evaluated from the perspective
of system administrators, who are ultimately responsible for the selection and
adoption of password procedures to protect the systems they manage. Because
system operators are more knowledgeable about security risks and the degree
to which security measures may be compromised using available cracking tools,
we might expect system operators (as opposed to end users) to appreciate more
the increased security afforded by COPS passwords, which may lead to a
significantly higher PU for COPS than traditional password procedures. Future
studies could also examine a lower-security version of COPS by reducing the
number of check-off boxes on the interface, which would reduce the cognitive
load of the input mechanism, while still providing greater practical security than
self-selected passwords.
ACKNOWLEDGMENT
This research is supported by the Mississippi State University Center for
Computer Security Research and funded by the U.S. National Security Agency
(NSA), grant number DUE-0209869.
REFERENCES
Adams, A., & Sasse, M.A. (1999). Users are not the enemy. Communications
of the ACM, 42(12), 40-46.
Ames, B.B. (2002). PC developers worry about security. Design News, 57(16), 29.
Anderson, J.R. (1994). Cognitive psychology and its implications. New York:
W.H. Freeman.
Bergadano, F., Crispo, B., & Ruffo, G. (1998). High dictionary compression for
proactive password checking. ACM Transactions on Information and
System Security (TISSEC), 1(1), 3-25.
Bolande, H. (2000). Forget passwords, what about pictures? Retrieved September 18, 2002, from http://zdnet.com.com/2102-11-525841.html
Copyright © 2005, Idea Group Inc. Copying or distributing in print or electronic forms without written
permission of Idea Group Inc. is prohibited.
TEAM LinG
A TAM Analysis of an Alternative High-Security User Authentication Procedure 299
Boroditsky, M., & Pleat, B. (2001). Security @ the Edge—Making security and
usability a reality with SSO. Passlogix. Retrieved September 18, 2002,
from http://www.passlogix.com/media/pdfs/security_at_the_edge.pdf
Burrows, J. H. (1985). Password usage: Federal information processing standards publication 112. National Institute of Standards and Technology.
Retrieved September 18, 2002, from http://www.itl.nist.gov/fipspubs/
fip112.htm
Coates, A.L., Baird, H.S., & Fateman, R.J. (2001). Pessimal print: A reverse
turing test. Proceedings of the Sixth International Conference on
Document Analysis and Recognition, Seattle, WA.
Davis, F.D. (1989). Perceived usefulness, perceived ease of use, and user
acceptance of information technology. MIS Quarterly, 13(3), 318.
Federal Aviation Administration (FAA), U.S. Department of Transportation
(2002). Password administration (Internatl document N 1370.38, dated 3/
25/2002, cancelled 3/24/2003). Retrieved April 8, 2003, from http://
216.239.39.100/search?q=cache:UcqXFyMXIPYC:www2.faa.gov/
aio/common/documents/HTMLfiles/N137038.htm+faa-8 (originally at
http://www2.faa.gov/aio/common/documents/N137038.pdf)
Gates pledges better software security. CNN.com/Technology. Retrieved
January 21, 2003, from http://www.cnn.com/2003/TECH/biztech/01/25/
microsoft.security.ap/
Hewett, T.T. (1999). Cognitive factors in design (tutorial session): Basic
phenomena in human memory and problem solving. Proceedings of the
Third Conference on Creativity & Cognition, Loughborough, United
Kingdom.
Jianxin, J.Y. (2001). A note on proactive password checking. Proceedings of
the 2001 Workshop on New Security Paradigms, Cloudcroft, NM.
Lemos, R. (2002). Passwords: The weakest link? Retrieved September 18, 2002
from http://news.com.com/2009-1001-916719.html
Miller, G.A. (1956). The magical number seven, plus or minus two: Some limits
on our capacity for processing information. Psychological Review, 63, 8197.
Monrose, F., Reiter, M.K., & Wetzel, S. (1999). Password hardening based on
keystroke dynamics. Proceedings of the 6th ACM Conference on
Computer and Communications Security, Singapore.
Newell, A., & Simon, H.A. (1972). Human problem solving. Englewood Cliffs,
NJ: Prentice-Hall.
Password usage survey results: June 2003 (2003). SafeNet. Retrieved August
7, 2003, from http://mktg.rainbow.com/mk/get/pwsurvey03
Pinkas, B., & Sander, T. (2002). Securing passwords against dictionary attacks.
Proceedings of the 9th ACM Conference on Computer and Communications Security, Washington, D.C.
Copyright © 2005, Idea Group Inc. Copying or distributing in print or electronic forms without written
permission of Idea Group Inc. is prohibited.
TEAM LinG
300 Warkentin, Davis and Bekkering
Spafford, E.H. (1988). The Internet worm program: An analysis (Purdue
Technical Report CSD-TR-823). West Lafayette, IN: Purdue University.
The twenty most critical Internet security vulnerabilities (updated): The experts
consensus (2002). SANS. Retrieved May 2, 2002, from http://www.sans.org/
top20.htm
The twenty most critical Internet security vulnerabilities (updated) (2003).
SANS. Retrieved August 7, 2003, from http://www.sans.org/top20
Ticketmaster—Read this first (2003). Ticketmaster. Retrieved January 23,
2003, from https://www.ticketmaster.com/checkout/reserve
Weirich, D., & Sasse, M.A. (2001). Pretty good persuasion: A first step towards
effective password security in the real world. Proceedings of the Workshop on New Security Paradigms, Cloudcroft, NM.
What is the frequency of the letters of the alphabet in English? (2002).
AskOxford.com. Retrieved September 29, 2002, from http://www.ask
oxford.com/asktheexperts/faq/aboutwords/frequency
Copyright © 2005, Idea Group Inc. Copying or distributing in print or electronic forms without written
permission of Idea Group Inc. is prohibited.
TEAM LinG
A Blended Approach Learning Strategy for Teacher Development 301
Chapter XV
A Blended Approach
Learning Strategy for
Teacher Development
Kalyani Chatterjea, Nanyang Technological University, Singapore
ABSTRACT
In-service upgrading has been an accepted avenue for retraining practicing
teachers in Singapore to keep abreast of changing curriculum requirements
as well as infusion of information technology (IT) in teaching and learning.
To cope with the teachers’ busy work schedules and many school
commitments, upgrading courses were offered to the teachers primarily
asynchronously, using the Internet platform with some integrated
synchronous sessions. This chapter analyzes the rationale for the
development of such a Web-based teacher-upgrading program and discusses
the main issues of professional upgrading addressed in the development.
Issues of adult learning in a learner-controlled adaptive learning
environment and lifelong learning were addressed through an IT-infused
asynchronous mode, providing the much-needed freedom in time
management for the course participants. The development also includes
delivery of high definition graphics through a customized hybrid system of
CD-ROM and Web that addresses image-downloading bottleneck and
thereby overcomes a basic problem of distance learning in geospatial
education. Finally, reflections on the attending adult learners’ responses
to such an upgrading program are discussed.
Copyright © 2005, Idea Group Inc. Copying or distributing in print or electronic forms without written
permission of Idea Group Inc. is prohibited.
TEAM LinG
302 Chatterjea
INTRODUCTION
Learning through distance education using computer-mediated environment
has become not only an accepted norm, but also a necessity in the field of
retraining working professionals. As McIssac and Gunawardena (1996) put it,
it currently has become the fastest growing form of education. The fast flow of
information and the resultant rapid change in all disciplines have made it
necessary for continuous upgrading of all professionals. With the workforce
engaged in work-related commitments, distance learning using computers has
enhanced the learning environment whereby the learners have access to
upgrading programs without having to physically go for the courses and yet being
in constant contact with the facilitator as well as the other participants. In
response to such demands for training and available technological infrastructure,
there is a growing trend for blended-approach upgrading courses. One such
example of matching the upgrading requirement with the available technology is
the teacher training courses offered through the World Wide Web (WWW) to
the teachers in Singapore. Singapore’s IT thrust started with the effort to
integrate information technology in education under the first IT Master Plan in
1997; a corollary to the introduction of IT-infused learning is teacher education
and training, not just for the sake of learning IT skills, but also to incorporate IT
into their overall training programs. This is where the in-service upgrading
programs fit in. Each year, the teachers attend courses in content and pedagogy
to keep abreast of the latest developments while still continuing their school
commitments. The courses in discussion were a part of such upgrading of
teachers and were delivered for content upgrading between 1999 and 2001 via
the WWW. This chapter analyzes the rationale for the development of such a
Web-based distance teacher retraining program, discusses the strategies adopted
to align discipline and training requirements with the available technology, and
reflects some on how the Web-based retraining program was used by the
participating teachers. The latter reflects to a certain extent on how computermediated learning environment influences upgrading of working professionals.
SPECIFICS OF THE SINGAPORE
CASE AT HAND
The following excerpt from the Year 2000 Teacher Training Prospectus of
the Ministry of Education (MOE, 2000), Singapore, underlines the teacher
training initiatives that have been a part of the in-service teacher training scene
in Singapore.
Copyright © 2005, Idea Group Inc. Copying or distributing in print or electronic forms without written
permission of Idea Group Inc. is prohibited.
TEAM LinG
A Blended Approach Learning Strategy for Teacher Development 303
From Year 2000, core upgrading for teachers will be implemented. Each
teacher will need to attend at least three core activities within each 5-year
cycle, starting from 2000. The aim is to enable teachers update themselves
on the latest developments in education and to upgrade their teaching skills
or content so as to stay relevant and competent in their profession. (Ministry
of Education, 2000, p. v)
PRESENT TREND IN
UPGRADING PROGRAMS
As a rule, most in-service courses for the teachers are requested by the
Ministry of Education, Singapore, and offered by the National Institute of
Education (NIE). Traditionally, these courses are conducted synchronously at
the NIE campus, although this is slowly changing. In 2002, NIE offered as many
as 150 in-service courses, 35 of which were Web-based. While physical distance
is not a real problem in Singapore, one reason for this move toward delivery via
the World Wide Web is to free the participating teachers from a fixed time
constraint. This series of three courses, named Geomorphology Online, was
delivered as stand-alone upgrading courses between 1999 and 2001. The main
objective was to support content upgrading of the participating teachers. The
courses were designed for a blended-approach, dual-mode delivery, incorporating asynchronous Web-based as well as synchronous face-to-face sessions.
Following Johanssen et al.’s (1991) 4-square map of distance education technology options, this present delivery could be described as combining the Different
Time/Different Place Instruction and the Same Time/Same Place Instruction to
provide not only the freedom of access but also the much-needed laboratory and
field experience for a course in Geomorphology. Through the provisions of online
content delivery and online communication coupled with the integrated face-toface sessions, the course aims to deliver what McIssac and Gunawardena (1996)
describe as “individualized and collaborative learning” in a combined setup of
both distance and traditional education (McIssac & Gunawardena, 1996, p. 403).
WHY USE THE INTERNET PLATFORM?
Freedom From Time and Space Constraints. Prior to 1999, in-service
courses were delivered through synchronous sessions where participating
teachers had to attend on-campus classes for three hours every Saturday for 10
consecutive weeks. But a survey done by Chatterjea and Goh (1999) revealed
that many of the participating teachers had too many concurrent work commitments, even though classes were held on Saturdays, a day of no regular lessons
in Singapore schools. This affected the attendance in the on-campus teacher
Copyright © 2005, Idea Group Inc. Copying or distributing in print or electronic forms without written
permission of Idea Group Inc. is prohibited.
TEAM LinG
304 Chatterjea
upgrading courses and, in turn, affected the learning outcomes. As a countermeasure, the author offered to deliver the required upgrading courses using the
Internet platform to allow the flexibility of time, so that the teachers could access
the lessons anytime and anywhere, in spite of the many concurrently running
school activities. Each of the developed Web-based courses involved 18 hours
worth of online self-study and four three-hour sessions (total of 12 hours) of
integrated on-campus lab work. This reduced the number of visits to the campus
for the teachers and was clearly an advantage over the mandatory attendance
required in a synchronous course. As Porter (1997) points out, this facility of
learning anytime and anywhere, using the Web-based platform creates a
congenial environment for lifelong learning, and the concept of lifelong learning
becomes acceptable. Following Flowers and Reeve (2000), it may be emphasized here that the provision of such an online course offers an answer to the
constraints of physical distance and time. While considerations of space constraints, higher student population, and the like might be the driving forces for
opting for online courses in some universities (Pallof & Pratt, 1999), the
Singapore teacher education scene is filled with other factors. Here, providing
a continuum of knowledge upgrading with minimal infringement on the existing
teacher responsibility and commitment is the prime mover, and, from this
perspective, provision of online courses for teacher development seems to be one
of the best options the in-service service providers have.
IT Immersion: The second objective for introducing an asynchronous,
Web-based training package is to initiate teachers into an IT-immersed training
environment. Use of IT in education is one of the mainstays in the education
environment of Singapore. The first IT Masterplan of Singapore aims to provide
not only a pupil-computer ratio of 2:1 and a teacher-computer ratio of 2:1 by the
end of 2002, but it also aims to set aside 30% of the curriculum time for IT-based
curriculum (MOE, 2002). With this great emphasis on the use of information
technology in every aspect of education in Singapore, this initiative of Web-based
teacher upgrading seems most timely. Even though expressions such as “get
online or get out,” “virtualize or die” (Flowers & Reeve, 2000) are too drastic,
information technology pervades the educational scene in Singapore. Taking part
in an online course provides the much required IT proficiency and, therefore,
relevance to the participants. Moreover, since this upgrading tool is accessible
to all teachers, older teachers who have not grown up in the present IT-infused
environment can take this as an opportunity to narrow the gap between
themselves and their younger colleagues. In this respect, it may be apt to say that
while online delivery and its appropriateness is being debated in forums, in the
Singapore teacher training context, delivery of online upgrading programs seems
like a very appropriate learning technology therapy (Flowers & Reeve, 2000). In
response to the Ministry of Education’s thrust on introducing IT in all fields of
Copyright © 2005, Idea Group Inc. Copying or distributing in print or electronic forms without written
permission of Idea Group Inc. is prohibited.
TEAM LinG
A Blended Approach Learning Strategy for Teacher Development 305
education in Singapore, NIE is presently mounting as many as 35 Web-based
courses under advanced diploma, advanced post-graduate diploma, and masters
degree programs, especially catering to the needs of the practicing teachers. In
addition, there is an increasing number of stand-alone Web-based in-service
courses (e.g., Geomorphology Online) that do not lead to formal qualifications
but are offered to teachers for their discipline area and pedagogic skills
upgrading. These initiatives come as a planned response to the needs of the
upgrading of teachers. The present provision of lifelong learning using the Internet
platform is a part of this ongoing strong thrust into technology-mediated learning
in Singapore, which particularly suits the needs of working professionals.
DEVELOPMENT CONSIDERATIONS
The Web-based courses on Geomorphology for the secondary school
teachers were developed with the following considerations:
1.
2.
3.
4.
The courses need to be goal-oriented and adaptive in order to cater to
the varying requirements of the participating teachers. Participants in such
courses generally fall under two categories: (1) those with some years of
teaching experience but requiring upgrading of knowledge and (2) those
new to the profession that might lack the experience and sometimes the
specific knowledge base required to cope with the school syllabus (Chatterjea
& Yee, 1997). To cater to these disparate teacher-requirements, in-service
courses need to allow adaptive, non-linear access to information upgrading
rather than a set path for all. An online course can offer this provision
without much difficulty, which is a clear advantage over the traditional
classroom-based system of instruction.
The upgrading course should allow avenues of communication. Many
teacher participants, though experienced, may have reservations in a faceto-face exchange of ideas and, as pointed out by S. W. Schimdt (2000),
might find it daunting to speak up. Bulletin board discussions incorporated
in a distance learning setup removes this barrier, and academic discourse
is more possible than the face-to-face session.
A Web-based course with the option of infinite repetitions on demand
offers the right degree of freedom to teachers for effective learning without
making them feel left out in a fast-progressing class.
An asynchronous intervention provides freedom to the learner, not just in
terms of modes of learning, but also in temporal terms. The full-time
teachers, in spite of their other work-related responsibilities, can access the
course in their own spare time. This gives them better control over their
learning process.
Copyright © 2005, Idea Group Inc. Copying or distributing in print or electronic forms without written
permission of Idea Group Inc. is prohibited.
TEAM LinG
306 Chatterjea
MAIN ISSUES ADDRESSED
IN THE DEVELOPMENT
To cater to the specific requirements of the working professionals, online
courses were offered to provide freedom from fixed-time, fixed-format, and
fixed-paced classes. While the course involved asynchronous online delivery and
guidance on attaining content upgrading and asynchronous online communication
for exchange of ideas, it also included integrated synchronous face-to-face
sessions to cover the lab-based segment of the training program and to keep all
participants on track. The five main issues addressed in the development are (1)
lifelong learning, (2) enhanced visual learning, (3) dynamic knowledge building,
(4) asynchronous knowledge sharing, and (5) personalized guidance during
integrated face-to-face sessions. Together, these features aim to provide
freedom of learning options through the use of online mode, while maintaining the
face-to-face sessions to provide subject-specific lab-based skills and knowledge.
Lifelong Learning Through Learner Control. The primary objective of
this course was to provide a continuum of content upgrading to geography
teachers in an environment of rapid changes and adjustments to the school
syllabus. This rapid and regular updating of school syllabi and the pedagogic
strategies through the use of information technology could be likened to the
“Permanent White Water” metaphor used by Vaill (1996), where the participants are constantly confronted with a continuously changing stream of developments. The players in this system constantly are required to adjust to these
changes through various programs, initiatives, or other learning strategies to feel
sufficiently updated both in content and in the technologies. In this respect, the
in-service course in question tends to support Vaill’s definition of learning, which
refers to “changes a person makes in himself or herself that increase the knowwhy and/ or the know-what and/ or the know-how the person possesses with
respect to a given subject” (Vaill, 1996, p. 21). This constant wave of changes
makes the issue of lifelong learning not just an awareness, but a reality and a
requirement to stay relevant. This course development focuses on this issue of
lifelong learning and offers an environment to engage in self-directed learning to
sustain lifelong learning. Teachers who participated in the in-service course
were exposed to a learner-controlled environment. Instead of providing all
required information and explanations on the Web page, two main textbooks
were adopted. For each point of discussion, a guided reading list from these two
books and from other published sources (i.e., journals, newspaper clips, relevant
Web sites) were provided at the bottom of each page (Figure 1). All this
information is given in a window set aside for this information on the desktop.
This provision is meant to initiate a “guided discovery” (Boyle, 1999, p. 49)
Copyright © 2005, Idea Group Inc. Copying or distributing in print or electronic forms without written
permission of Idea Group Inc. is prohibited.
TEAM LinG
A Blended Approach Learning Strategy for Teacher Development 307
Figure 1. A sample page from the courseware
A sample page from the course
approach placing the primary emphasis on the learner. The role of the courseware
is to create an effective environment for learning that goes beyond the temporal
restrictions of the course. Once introduced to finding information from books and
other sources, it was hoped that the teachers would continue to do so and thus
extend the learning beyond the limits of the course. It is designed optimally to
support learner-oriented strategies, as the learning experience is defined by the
learner.
Another unique feature of this reading window is that the information is
delivered via the WWW. This gives it a dynamic nature allowing immediate
update in response to a relevant event. For example, if there is an event of a flood,
an earthquake, or a similar occurrence anywhere in the world that can be used
to illustrate the points on the Web page, the relevant readings can be added
immediately to this reading list. This adds relevance and dynamism to the course
materials and also shifts the onus of learning to the learner as he or she now has
to deal with the option of taking advantage of the available material. The
facilitator’s job here is only to make the source of information known. This shifts
radically from the traditional system of providing all information on the Web site,
which often leads to inactivity on the part of the course participant. This has an
added relevance in teacher education, as teachers, being facilitators themselves,
often need to be reminded of their role as independent learners.
Instantly Delivered Image-Rich Learning Environment. Branden
(1996), while reviewing the literature on visual illustrations, pointed out the
importance using visuals in conjunction with text materials. Peek (1974) emphaCopyright © 2005, Idea Group Inc. Copying or distributing in print or electronic forms without written
permission of Idea Group Inc. is prohibited.
TEAM LinG
308 Chatterjea
sized the same. When pictures and texts are used together, retention is
facilitated, and illustrations facilitate delayed recall, according to Peek (1974).
Pictures have been said to arouse interest, set mood, arouse curiosity, make
reading more enjoyable, and create positive attitudes toward subject content and
toward reading itself. Levie and Lentz (1982) reviewed results of 155 experiments and found on the average that group scores for the illustrated-text groups
were 36% better than for text-alone groups; they commented that learning is
better with pictures in most cases. Illustrations can help learners understand and
remember what they read, enhance learner enjoyment, and evoke affective
reactions. Race (1992) lists 10 reasons for making learning packages visual.
Visual images are particularly useful and, in some environments, indispensable
to explain spatial and process relationships, to synthesize, to develop contextual
backgrounds, and so forth. Geography, especially physical geography, is a
discipline that almost demands an image-enriched environment for effective
learning and knowledge assimilation. In a scenario of asynchronous learning,
where the learner is physically separated from the lecturer, visuals are even
more important to bring concepts to the learner. Textual delivery offers a
learning material that, at its best, has to fight for attention from the learner. As
Subbaro and Langa-Spencer (2000) exclaim, “Text loading cannot be turned
off!” (p113). In comparison, “pictures and illustrations catch the eye. They
enhance the attractiveness of the system and (more importantly) deepen the
information channel” (Boyle, 1997, p. 151). Visual images play a very important
role in establishing links in the concepts. In the absence of the lecturer, an
increased use of visual images helps to explain the points in question and captures
the attention of the learner. As Race (1992) points out, illustrations can set a
scene for the learner so that the idea unfolds and helps the learner to see the
broader scene. This is especially important in an asynchronous Web-based
environment, where the learner is left with the visual display to assimilate a
concept from the information depicted on the screen. Visual images also play a
great role in bringing the outside world into the classroom or, in this case, onto
the monitor. Many research papers have emphasized the importance of the use
of visual images (Broudy, 1987; Gardner, 1993; Hutton & Lescohier, 1983; Race,
1989; Salomon, 1997). Thus, visual images were considered as one of the key
requirements during the planning stage of this developed courseware in order to
inject the visual reinforcement while the learners dealt with the learning
themselves.
The decision of creating an image-intensive learning environment on the
Internet platform has its almost insurmountable problems. In spite of much
advancement in software technology in image compression, high-definition
image delivery still makes the downloading of visual information excruciatingly
slow, even via broadband delivery. The meager use of visuals on the majority of
Web pages merely points blatantly to this constraint. Subbaro and LangaSpencer (2000), while discussing the problems of slow downloading on the Web,
Copyright © 2005, Idea Group Inc. Copying or distributing in print or electronic forms without written
permission of Idea Group Inc. is prohibited.
TEAM LinG
A Blended Approach Learning Strategy for Teacher Development 309
have painted quite a grim picture of the constraints that Web course designers
face and the constraints and the restrictions with which they have to operate.
Reiterating a study done by the Graphics, Visualization and Usability (GVU)
Centre at Georgia Tech (Subbaro & Langa-Spencer (2000), they quite rightly
almost warn developers that download times of Web pages needs to be strictly
monitored and, if necessary, “ruthlessly scrutinized” (p. 113). They also suggest
that images only should be used if they are absolutely indispensable, and, when
given, images preferably should be given with <ALT> coding. This would allow
the reader the option of bypassing the whole image to save time. We often see
thumbnail-sized images on Web pages with an option for clicking on them to see
the full image. As Race (1989) points out, such thumbnails are not effective as
illustrations. Therefore, such compromises do not serve the intended purpose.
The author is of the opinion that such a system fails to deliver pedagogically sound
courseware. After all, if something may or may not be used at all, the purpose
of it being there is not served. The fact that an image is necessary for the
illustration of the point makes it mandatory that the image is actually seen by the
learner. Otherwise, the image should not be included at all.
With this conviction, the present courseware planned to incorporate as
many visual images (i.e., maps, diagrams, photographs, graphs, toposheets, etc.)
as was deemed necessary to explain the concepts. The idea was that a distance
learner in no way should be disadvantaged by not coming to a face-to-face class
where the use of slides, maps, and diagrams are constrained only by time and not
by technology. The choice of Macromedia Authorware as the authoring tool for
this courseware was based on its ability to allow a hybrid development where the
textual material is delivered via the Web, while visual images are all delivered
from a CD-ROM. The CD-ROM works essentially as a storage space for all
image library files and is accessed by the program to extract the right images at
the right time. This effectively eliminates all waiting time for the numerous
graphic files that are used heavily in the explanations of the various geographic
Table 1. Comparison of downloading times for a 30K file using different
downloading devices
Image delivered
via the Web
Image delivered
from the CD-ROM
Device Used
14.4 kbs
modem
28.8 kbs
modem
56 kbs modem
ISDN
connection
T1 line
16X CD-ROM
Drive
Time taken
to
download
(sec)
20.9
15.54
Source of
Information
Subbaro and
Langa-Spencer,
2000
7.78
2.81
1.1
Instant
Author’s own
records
Copyright © 2005, Idea Group Inc. Copying or distributing in print or electronic forms without written
permission of Idea Group Inc. is prohibited.
TEAM LinG
310 Chatterjea
concepts. Table 1 gives a comparison of downloading times of graphic files when
they are delivered via the Web and clearly shows the edge this present hybrid
courseware has over the existing system of delivery.
In comparison, a 2.4Mb mpeg format file delivered from the courseware
CD-ROM takes three seconds to load with a 16X CD-ROM drive, which is well
within the usual time any user is willing to wait for loading a page, as mentioned
by Subbaro and Langa-Spencer (2000). This capability enables the courseware
to deliver what Novitzki (2000) calls a key issue in any asynchronous learning
program. According to him, material presented in a wide variety of ways,
including text, graphics, video, and audio, gains attention and accommodates
students with differing learning styles. In-service courses for teacher development needs to operate for a wide spectrum of teacher profiles, and much of the
success of such a program running asynchronously depends on how well it
addresses the issues of learner engagement. Therefore, the issue of facilitating
the delivery of a visually enriched learning environment was taken as one major
Table 2. Organization of the delivery of teaching materials in the
Geomorphology online courseware
Courseware
Components
Main teaching
concepts (texts)
Explanations
(texts)
Readings
(texts)
Notices and
announcements for
the course (texts)
Discussion facilities on
Bulletin Board (texts)
Hyperlinks (texts)
Additional
explanations in
response to participant
requests (texts).
Navigation buttons
such as page sliders
(graphics).
All video clips
All graphic files
showing graphs,
maps, diagrams,
photographs,
cartoons, as well as
the courseware
templates
Mode of Delivery
On the
From the
CD-ROM
Web
Comments on the Advantages
These are delivered dynamically and can be
added/appended/updated anytime. There are
provisions to add new explanation pages in
response to participant requirements. The
diagrams from the existing pages can be used
repeatedly with these updated pages.
The reading list is updated on the Web. This
provides the possibility of dynamic delivery of
information from news items, TV programs,
journals, and so forth.
This is a mode of communication with the
participants and is updated on the Web.
This discussion forum is asynchronous Webbased in nature.
This is updated on the Web.
These pages can be added on the Web, using
images from the CD-ROM.
These are given in the CD-ROM for instant
loading.
These are given in the CD-ROM for instant
loading. There is virtually no restriction on the
number of images used. The availability of
storage allows pictures of high quality.
Therefore, there is no compromise on the
illustrations, especially in the use of
toposheets, which require high resolution
images for clarity.
Copyright © 2005, Idea Group Inc. Copying or distributing in print or electronic forms without written
permission of Idea Group Inc. is prohibited.
TEAM LinG
A Blended Approach Learning Strategy for Teacher Development 311
requirement for the courseware. Table 2 gives details of the mode of delivery of
materials in the developed courseware. It shows how the hybrid concept using
Web and CD-ROM has been used in the development of the courseware. The
main delivery on the Internet platform is not burdened by the graphic usage, and the
user gets an instant loading of the graphic files whenever a new page is called up.
The facility of ultra-quick loading as provided in Geomorphology Online has
several advantages:
•
•
Not only is there freedom from the network speed or lack of it, but also the
downloading of the graphics does not depend on the user’s hardware
capabilities, as there is very little difference in time taken by CD-ROM
drives of different speeds to open the graphic files.
It frees the courseware developer from the severe constraint in the use of
visuals. By doing so, it allows flexibility in using illustrations, an essential
element of a course in geospatial education. No longer does the learner
have to accommodate the restricted access to images, and no longer does
the developer have to hold back on the use of images, whether to illustrate
points or even to make it more visually attractive and cognitively sound. The
Web-based part of the courseware can be enhanced visually through the
use of the library files that are stored in the CD-ROM. This can create quite
a transformation of the way the Web-based courseware looks without
sacrificing the sanity of mind. Particularly for geography, where maps are
an essential teaching/learning element, such a system has proven to be
extremely useful. This element has put the asynchronous course truly at par
with the classroom-based courses of the past, since the use of huge-sized
visuals is no longer a hindrance.
Dynamic Course Material and Explanations. Text-based concepts and
explanations in the courseware are delivered via the Web. This gives flexibility
like any other Web-based course, where the material can be uploaded/updated/
appended at any time during the course. A prominent feature of the way this
material is presented is the lack of too much detail in the information provided on
the screen. Morkes and Nielson (1998) mention that only 16% of readers read
word-for-word from the screen. Novitzki (2000) also observes that many
students prefer reading from textbooks than from online materials. “No students
spend as much time reading material off the screen as either the instructor or
course designer believes” (Novitzki, 2000, p. 72). Readers, therefore, should be
guided in noting the important points instead of giving a lot of printed information
on the screen. To supplement this concise text, two textbooks are adopted; for
each point of discussion, the learner is guided to the relevant section of the books
(See Reading Window in Figure 1). Inclusion of blank spaces, short paragraphs,
subheadings, bulleted lists, and concise texts are all part of an effort to offer
enhanced readability to the course material.
Copyright © 2005, Idea Group Inc. Copying or distributing in print or electronic forms without written
permission of Idea Group Inc. is prohibited.
TEAM LinG
312 Chatterjea
Another feature of the textual content pages is the predictability of scheme.
Charney (1994) and Subbaro and Langa-Spencer (2000) emphasize that mental
representations of the structure of texts are essential to comprehension. Texts
in the courseware are delivered following a standardized format with fixed color
codes and font types for the main point, explanations, informal notes, and
humorous comments. This latter element is a deliberate addition to the pages to
simulate classroom conditions and attempts to lighten the solitary environment of
an online session. The informality and spontaneity of language is aimed at
overcoming the lack of face-to-face contact and “is working to change academic
discourse” (Moran & Hawisher, 1998, p. 94).
There are provisions to add new pages for explanation or for updating
information as events take place. These additional pages can use the graphics
that are already provided in the library files in the CD-ROM. The usefulness of
this provision is that the appended pages can be used to provide additional
explanation in response to online discussions or e-mail queries from participants.
This feature of help-on-demand is one of the key requirements in a JIT (just-intime) training situation. Thus, the system is equipped to handle a full learnercontrolled learning environment with a facilitator providing the right amount of
support as and when necessary.
Online Forum for Discussions. To compensate for the reduced synchronous sessions, provisions are made for an online forum for discussion and
exchange of ideas. This provision is kept asynchronous, as opposed to live chat
sessions, to provide teachers the freedom of time. Teachers who have their own
work commitments cannot be expected to logon simultaneously. An asynchronous forum still allows the participating teachers the scope of exchanging their
ideas and reflections, even when they have concurrently running work commitments. The asynchronous forum also allows time for reflection. Another
additional advantage is that such asynchronous communication does not alienate
the shy participant. Additional lesson/explanation pages can be mounted in
response to forum discussions. This integration with the bulletin board discourse
to develop the course material goes in line with the JIT concept, and it also
provides greater learner control of the material. In-service teachers, being goaloriented, can make greater use of this facility and have the freedom to have a
say in the development of the material to suit their purpose. This fits in Pallof and
Pratt’s (1999) framework for distance learning by contributing to “active
creation of knowledge” through interaction and feedback, mutually negotiated
guidelines, shared goals, and collaborative learning.
Integrated Synchronous Sessions. The asynchronous online part of the
course is blended with some on-campus sessions at designated intervals. These
are held at fixed intervals after the participants are scheduled to cover given
Copyright © 2005, Idea Group Inc. Copying or distributing in print or electronic forms without written
permission of Idea Group Inc. is prohibited.
TEAM LinG
A Blended Approach Learning Strategy for Teacher Development 313
sections of the course. This is planned with several objectives in mind. First, a
course in geomorphology involves, among other things, interpretation of aerial
photographs (which needs stereoscopes), identification of rocks and minerals
(which needs handling of rock and mineral samples), neither of which can be
done on the WWW. In addition, it is felt that some face-to-face interaction with
the facilitator and other participants is necessary in order to build a lasting rapport
as well as to gain from each other’s experiences. This is particularly important
as the teachers form part of a well-knit society of geography teachers in
Singapore. Therefore, the synchronous sessions aim to provide the specific
requirements of the discipline as well as the social needs of a learning community. However, they are aimed also at ensuring the success of the asynchronous
sessions. In any learning situation, there can be some participants who are less
enthusiastic about independent learning. If left to handle themselves through an
asynchronous mode, these participants tend to lag behind, and along the way,
they might totally abandon the course. The synchronous sessions at regular
intervals, with prerequisites of a certain degree of coverage of the course, can
help to force this group to keep pace with the rest of the class. The chances of
some participants not benefiting from the course thus are reduced.
Reflections on the Asynchronous Mode of Delivery
Geomorphology Online was the first venture into providing in-service
course in geomorphology on the Internet. Triggered by the observed problems
of running synchronous iIn-service courses and the continuing emphasis on using
IT for education, this course was set to break the tradition in providing avenues
of lifelong learning. On reflection, some points need to be mentioned that are
course development-related, participant-related, and developer/ facilitator-related.
Reflections on Course Development
The two most important features of the course at hand were (1) provision
for an image-enriched learning environment without any bandwidth constraint
and (2) an integrated Web cum face-to-face delivery. While the first was related
to subject requirements and learning effectiveness, the latter was related to
ensuring effective participation in the upgrading program.
Image-Enriched Learning Environment. Participant response on the
image-intensive delivery in the course was overwhelmingly positive. Use of
graphic illustrations was unanimously voted the most interesting aspect of the
course development. Participants also felt that it allowed more in-depth learning,
helped in understanding of difficult concepts, and illustrated issues (more)
effectively. From this respect, the objective of creating a near-classroom
learning environment was achieved. No technical hurdles (i.e., slow downloadCopyright © 2005, Idea Group Inc. Copying or distributing in print or electronic forms without written
permission of Idea Group Inc. is prohibited.
TEAM LinG
314 Chatterjea
ing even with a modem connection or during peak hours) were encountered to
get the image-rich course materials as this issue was tackled in the development.
The learner, therefore, was freed of the operating hurdles—an issue of great
importance when technologically-mediated learning systems are used.
Integrated Web Cum Face-to-Face Delivery. When asked about
negative points of Web-based courses in general, 54% of the participants
commented that there are scopes to stray on a fully Web-based course.
However, 90% of the participants said partly synchronous Web-based courses
such as the present one helped them to stay on track without drifting. When
asked about their preferred choice for future in-service courses, an emphatic
92% opted for an integrated course like the present one with integrated
synchronous sessions, while 8% opted for a full face-to-face delivery. That
makes a 100% learner demand for an integrated Web cum synchronous delivery
for those learners who opt for some IT-infused learning delivery system.
Obviously, the scope for straying was minimized through this integrated synchronous session and allowed the learners the required freedom to learn in their own
time and yet provide the compulsion to push through the course, in spite of work
commitments and other distractions. This learner response and preference set
the goal for future course deliveries where the Internet is used not just to impose
a new learning style, but also to use the facilities offered by the environment to
enhance and facilitate the learning and training of busy professionals who would
otherwise find it difficult to attend courses but also might stray from the course
for lack of personal contact. Adult individuals are mostly intrinsically motivated
toward learning, be it for induced professional upgrading requirements or for
personal motivations. Yet, work commitments and hours of lonely learning
environment are not seen as conducive to learning. A learning package that
integrates Web-based delivery with synchronous sessions creates an opportunity
to maintain the personal contacts and keeps the learners on track. Tracking of
the learners through the learning management system showed that the most
favored hit periods always were a few days to a day before the impending
synchronous sessions, supporting the view of the participants that the synchronous sessions helped them to be on track. Participants even talked about being
encouraged by the interest shown by the facilitator and other participants during
the synchronous sessions, something only achieved through personal contacts.
Reflections on Participants and Their Participation
On Web-Based Delivery. Web-based delivery of courses definitely has
caught on, as 31% of the participants mentioned they prefer Web-based courses;
23% said they are adjusting and beginning to like it; 46% said they can live with
it; and none were uncomfortable with it. This means that in an IT-infused society,
Copyright © 2005, Idea Group Inc. Copying or distributing in print or electronic forms without written
permission of Idea Group Inc. is prohibited.
TEAM LinG
A Blended Approach Learning Strategy for Teacher Development 315
Table 3. Response of teachers to the various aspects of the course
Aspect of the Course
Focused and customized
learning
Lifelong learning through
reading guidance
Freedom from travel
Opportunity to learn at own
pace
Teacher Response (Out of 89 Participants)
90% said this suited them more than a broad-based
general course.
67% said customized explanations helped them
understand better
95.5% said the Web-based strategies of self-determined
scope of learning helped them to carry on learning
beyond the course and later
31% showed this as an incentive for joining a Web-based
course
46% said they think this is a positive point of the Webbased course.
learning via the WWW is accepted as a norm, even in groups where 23% of the
learners have been teaching for more than 15 years and, therefore, are from a
pre-Internet era in Singapore. Learning via the WWW has become, therefore,
more of a willing compliance and an accepted norm than an imposed strategy in
the Singapore environment. Table 3 shows the responses of the participating
teachers to the various aspects of the course and sums up their views on Webbased delivery.
Perception of Online Delivery. While the figures in favor of online
course delivery say volumes about the acceptance of such a mode of delivery,
it is quite clear that online learning is still equated with online content delivery.
A review of the participants’ login details reveals that the content areas of the
course were used far more than any others, and the use of communication areas
was minimal (Figure 2).
There appears to be a large disparity in the way online courses are perceived
and followed. First, the built-in flexibility of time, in a way, was abused with quite
a few teachers logging on only before the synchronous sessions. I was happy to
have the synchronous component that actually pushed these not-so-initiated
Figure 2. Areas of the courseware most frequented by the participants
Percentage of access
100.00%
80.00%
Content areas
60.00%
Communication areas
40.00%
Group areas
Student areas
20.00%
0.00%
Group 1 Group 2 Group 3
Copyright © 2005, Idea Group Inc. Copying or distributing in print or electronic forms without written
permission of Idea Group Inc. is prohibited.
TEAM LinG
316 Chatterjea
teachers into doing some work. But that also meant they failed to get the benefit
from a system that is designed to guide them gradually to relevant learning
resources along the way. The reason cited by the participants was lack of free
time. Login records revealed that most teachers accessed the course during
weekends and at nights. In other words, they were using their personal times to
access the course. Although access to the course is available from the schools,
lack of time during or even after regular school hours prevents teachers from
being regular in their accesses. Although irregular login may not provide
regularity to the training program, login from home during weekends needs not
be seen as a drawback, as one of the initial objectives of developing this course
was to make it accessible at all times. From this perspective, asynchronous
delivery did allow the teachers to access the course at their convenience. By
their positive responses regarding freedom to learn at their own paces (Table 4),
the teachers meant that they do not need to do the learning modules regularly.
From this response, it appears that the learners hold a very different view of the
freedom to learn on their own. Obviously, they are not thinking of the offered
freedom to learn according to learner abilities or aptitudes. They simply are
categorizing this as a freedom from restricted time for learning. Perhaps this
aspect is particularly applicable for working professionals who have workrelated commitments and are mostly interested in acquiring the knowledge when
they have the time.
Online Communication. While some teachers used the bulletin board for
discussions, a large group did not. Even though additional explanations were
provided to answer specific questions, more could be achieved to provide helpon-demand. There could be two reasons for this pattern:
1.
2.
Use of the bulletin board as a communication media is not accepted yet by
the vast majority of the learners. Participants feel more comfortable
discussing things in person and are not keen on opening up to strangers and
taking them as partners in the learning process. In a face-to-face situation
they still can go to the lecturer in person at the end of the class, but on the
bulletin board, everything is so open—what if I make a mistake—a
response from one of the participants.
Although nearly all participants mentioned during the survey that they opted
for the Web-based course and that they prefer it this way since it saves a
lot of time, the participants do not see online communication as a part of the
learning package.
The perception about this learning platform is clear from the survey, where
46% viewed that, in spite of the online discussion board, they do not feel there
is actual interaction in a fully Web-based delivery system.
Copyright © 2005, Idea Group Inc. Copying or distributing in print or electronic forms without written
permission of Idea Group Inc. is prohibited.
TEAM LinG
A Blended Approach Learning Strategy for Teacher Development 317
I have learnt much from you esp the clarifications of concepts made during
class interaction [excerpt from teacher response].
Actually what I think most teachers need is the exchange and sharing of
ideas face to face, be it in content or methodology. We need some professional
stimulations esp after so many years of teaching. People like you would help us
to keep abreast with times in the developing of the subject and also to clarify grey
areas. [excerpt from teacher response].
While there was fervent discussion during the face-to-face sessions, there
was, at best, only coerced postings on the bulletin board from teachers and, even
then, mostly on facilitator-initiated issues.
On reflection, it may be said that at least a part of the reason for this
apathetic response was due to the fact that, even though the teachers had signed
up for a Web-based course, they still were not completely at the comfort level
of using an asynchronous online mode for all aspects of learning. In this respect,
it must be mentioned that all the teachers involved were computer-savvy, having
been trained and immersed in computer-mediated environment both at work and
at home for more than a decade; therefore, they had no problem using the ITinitiated media. However, it is the author’s conclusion that using computermediated communication for negotiating learning as well as for self-learning
were both very different from their usually held concept of retraining courses.
Therefore, in spite of the technical know-how and apparent acceptance of the
medium, computer-mediated learning through online communication has not
caught on yet among practicing teachers. However, it was encouraging to note
that at the end of the course, more teachers were logging on to discuss. It is
hoped, therefore, that with more courses that are run in this manner, in time,
teachers will be more receptive to the idea of learning on their own. Asynchronous interventions then would lead to a continuum of teacher education.
Reflections on the Developer/Facilitator and the
Development Environment
As pointed out by Novitzki (2000), the developer not only needs to be an
expert on the discipline, but also needs to have a sound working knowledge of the
software. In fact, much of the time in the beginning is spent not on answering
questions on the content but on the basic use of the courseware (i.e., installation
of Web players, etc.), the learning management system, and the login details. The
time spent on answering e-mail inquiries begins to encroach upon other work
commitments, and one begins to see the merit of the warning given by Rea et al.
(2000) that “students become increasingly demanding of the instructor’s time
[and] care must be taken to avoid becoming a full time consultant, advisor, and
assistant for the students” (in this case, the participating teachers) (p. 142).
Another aspect to be pointed here is that of the long development time for
a courseware. Even though the idea of infusing IT into the various programs is
Copyright © 2005, Idea Group Inc. Copying or distributing in print or electronic forms without written
permission of Idea Group Inc. is prohibited.
TEAM LinG
318 Chatterjea
generally looked upon positively, there is as yet no set guideline about the
operations. Therefore, there is no fixed workload offset for the developer. Since
any online course development requires a lot of development time, this only can
add up to the developer’s workload without much respite from the other usual
workload. Similar concerns are voiced by Robinson and Borokowski (2000). This
can be a problem and can affect the quality of the courseware. However, it is
expected that with more and more such courses offered, some norms will be
implemented.
CONCLUSION
In conclusion, it can be said that asynchronous intervention using the
Internet can be seen as a major mode of providing teacher development in the
21st century. It can satisfy the usual requirements of any adult learning situation
(i.e., available anytime and anywhere; a resource for learning just in time; a
platform for interaction, even when participants are physically separated; a
platform for introducing the participants to IT-enriched learning environment,
etc.). However, in case of flagging interest in lonely online courses, provision for
integrated face-to-face sessions like the ones offered in the present geomorphology courses is an effective encouragement to carry on in this asynchronous
learning environment. But the success of such an asynchronous course depends
also on its ability to simulate the positive learning environment of a classroombased system. Each discipline has its own requirement for knowledge dissemination. For a course in geospatial education, the ability of the courseware to
provide ample and unrestricted visual illustrations becomes an added advantage
when presented with the other usual basic requirements. This issue has been
handled adequately in the present courseware. The lessons learned for the
developer/course facilitator could be summarized as follows:
i)
Teachers, like other adult learners, do have intrinsic motivation, but they
expect to get only what they need. So, the course for retraining purposes
ideally should have the flexibility of providing just-in-time learning components. In this respect, IT-mediated systems can offer non-linear, randomly
accessible learning experiences at different levels suitable for such learners with prior experiences in the discipline. The teachers, being already
exposed to the content area, have a fair understanding of the discipline. Any
retraining program, therefore, has to offer only specific scaffolding to the
learner to provide the required upgrading instead of an entire curriculum.
IT mediation is one way of providing this just-in-time and randomly
accessible content material where the learners are free to access as much
as they need.
Copyright © 2005, Idea Group Inc. Copying or distributing in print or electronic forms without written
permission of Idea Group Inc. is prohibited.
TEAM LinG
A Blended Approach Learning Strategy for Teacher Development 319
ii)
iii)
iv)
v)
Although learning from remote locations, learners expect to get information
in much the same way as they do in campus-based schools. In this respect,
if the discipline requires an image-enriched environment, the Web-based
development should endeavor to incorporate that element in the development to maintain learner interest.
Freedom from routine learning schedules is seen as a major pull factor by
all participants in these courses. Although the expected style of regular
login to get the benefit of evenly-spaced-out learning did not happen, it is
seen as a useful element, especially since the courses were meant for busy
professionals whose time was too divided among other work commitments.
The fact that they accessed the course from home and even during
weekends says that the flexibility of time did help.
Up until now, the teachers involved have not seen computer-mediated
learning as a negotiating platform. But with time, as they attend more and
more such courses, this might change. For now, pitching online communication with some compulsory assignment might help generate more incentive to participate in online communication.
If distances permit (like in Singapore), having some synchronous sessions
do help to keep learners in line with the flow of the course, ensuring that
learners do not lag behind and, more importantly, ensure that the human
touch of being in contact with other participants remains.
Distance education programs continue to grow due to the ever-growing
global need for an educated workforce and; in this case, an ever-growing need
for updating teachers. Upon considering the trends in distance education, it is
clear that lifelong learning potential for adult learners in computer-mediated
environments will play a vital role as it allows for independent learning by
working adults. Along with the growing preference for a distance learning
environment, there is a great need to align learning programs with the needs and
styles of the learners; and a successful educational package should pay adequate
attention to the specific requirements of learners, their learning styles, technology of the delivery system, and interaction with the instructor. So far, the already
IT-initiated workforce either has shown preference or willing compliance to
computer-mediated retraining programs. But much of the preference, it appears,
still is limited to the advantages of accessibility of information without the spatial
proximity demands, as provided by the asynchronous setup. Training via the
WWW still is seen as a convenient resource base rather than a dynamic platform
for knowledge negotiation. The concurrently running workload is cited as one of
the hindrances of using the online discourse platform. Some judicious persuasion
seems to work, at best, in a passive way. But the traffic usually improves with
some built-in compulsion. This might lead the way to developing into willing
compliance much like the way Web-based lesson delivery once did.
Copyright © 2005, Idea Group Inc. Copying or distributing in print or electronic forms without written
permission of Idea Group Inc. is prohibited.
TEAM LinG
320 Chatterjea
ACKNOWLEDGMENT
Development of Geomorphology Online is funded by NIE Research Fund
(Reference no. RP 18/98KC). The author thanks Mr. Supriyo Chatterjea for his
technical assistance in the development and incorporation of the hybrid system.
REFERENCES
Boyle, T. (1997). Design for multimedia learning. London: Prentice Hall.
Braden, R.A. (1996). Visual literacy. In D.H. Jonassen (Ed.), Handbook of
research for educational communications and technology (pp. 491520). New York: Macmillan.
Broudy, H.S. (1987). The role of imagery in learning [occasional paper 1]. Los
Angeles: The Getty Centre for Education in the Arts.
Charney, D. (1994). The effect of hypertext on the processes of reading and
writing. In C. Selfe & S. Hilligloss (eds.), Literacy and computers: The
complications of teaching and learning with technology (pp. 238-263).
New York: Modern Language Association of America.
Chatterjea, K., & Goh, K.C. (1999). In-service teacher training As a strategy for
geography teacher development in Singapore. Proceedings of the International Conference on Teacher Education, Hong Kong.
Chatterjea, K., & Yee, S.O. (1997). Lifelong learning in ASEAN: Singapore’s
in-service programmes in geography. In T.C. Wong & M. Singh (Eds.),
Development and challenge: Southeast Asia in the new millennium (pp.
239-256). Singapore: Times Academic Press.
Flowers, S., & Reeve, S. (2000). Positioning Web-based learning in the higher
education portfolio: Too much, too soon? In L. Lloyd (Ed.), Teaching with
technology (pp. 133-151). Medford, NJ: Information Today, Inc.
Gardner, H. (1993). Frames of mind. London: Fontana Press.
Hutton, D.W., & Lescohier, J.A. (1983). Seeing to learn: Using mental imagery
in the classroom. In M.L. Fleming, & D.W. Hutton (Eds.), Mental imagery
and learning (p. 157). Englewood Cliffs, NJ: Educational Technology
Publications.
Johanssen, R., Martin, A., Mittman, R., & Saffo, P. (1991). Leading business
teams: How teams can use technology and group process tools to
enhance performance. Reading, MA: Addison-Wesley.
Levie, W.H., & Lentz, R. (1982). Effects of text illustrations: A review of
research. Educational Communication and Technology Journal, 30,
195-232.
McIssac, M.S., & Gunawardena, C.N. (1996). Distance education. In D.H.
Jonassen (Ed.), Handbook for research for educational communications and technology. New York: Simon and Schuster.
Copyright © 2005, Idea Group Inc. Copying or distributing in print or electronic forms without written
permission of Idea Group Inc. is prohibited.
TEAM LinG
A Blended Approach Learning Strategy for Teacher Development 321
MOE (2000). TRAISI, training for the new millennium, Prospectus 2000.
Singapore: Ministry of Education.
MOE (2002). Under implementation: Phases. Retrieved February 22, 2005, from
http://www1.moe.edu.sg/iteducation/masterplan/brochure.htm
Moran, C., & Hawisher, G.E. (1998). The rhetorics and languages of electronic
mail. In I. Snyder (Ed.), Page to screen (pp. 80-101). London: Routledge.
Morkes, J., & Nielson, J. (1997). Concise, SCANNABLE, and objective: How
to write for the Web. Sun Microsystems. Retrieved June 10, 1998, from
http://www.useit.com/papers/Webwriting/writing.html
Novitzki, J.E. (2000). Asynchronous learning tools: What is really needed,
wanted and used? In A. Aggarwal (Ed.), Web-based learning and
teaching technologies (pp. 60-78). Hershey, PA: Idea Group Publishing.
Pallof, R., & Pratt, K. (1999). Building learning communities in cyberspace. San
Francisco: Jossey-Bass Publishers.
Peek, J. (1974). Retention of pictorial and verbal content of a text with
illustrations, Journal of Educational Psychology, 66, 880-888.
Porter, L.R. (1997). Creating the virtual classroom distance learning with
the Internet. New York: John Wiley & Sons, Inc.
Race, P. (1989). The open learning handbook. London: Kogan Page.
Race, P. (1992). 53 interesting ways to write open learning materials.
Bristol, UK: Technical and Educational Services Ltd.
Rea, A., White, D., McHaney, R., & Sanchez, C. (2000). Pedagogical methodology in virtual courses. In A. Aggarwal (Ed.), Web-based learning and
teaching technologies: Opportunities and challenges (pp. 135-154).
Hershey, PA: Idea Group Publishing.
Robinson, P., & Borokowski, E.Y. (2000). Faculty development for Web-based
teaching: Weaving pedagogy with skills training. In A. Aggarwal (Ed.),
Web-based learning and teaching technologies: Opportunities and
challenges (pp. 216-226). Hershey, PA: Idea Group Publishing.
Salomon, G. (1997). Of mind and media. Ann Arbor, MI: Phi Delta Kappan.
Schimdt, S.W. (2000). Distance education 2010: A virtual odyssey. In L. Lloyd
(Ed.), Teaching with technology (pp. 75-90). Medford, NJ: Information
Today, Inc.
Subbaro, S., & Langa-Spencer, L. (2000). When less is more: Some ergonomic
considerations in course page design. In L. Lloyd (Ed.), Teaching with
technology (pp. 109-126). Medford, NJ: Information Today, Inc.
Vaill, P.B. (1996). Learning as a way of being. San Francisco: Jossey-Bass
Publishers.
Copyright © 2005, Idea Group Inc. Copying or distributing in print or electronic forms without written
permission of Idea Group Inc. is prohibited.
TEAM LinG
322 About the Editor
About the Editor
M. Adam Mahmood is a professor of computer information systems, Department of Information and Decision Sciences. He also holds the Ellis and Susan
Mayfield Professorship in the College of Business Administration. He is a
visiting faculty at the Helsinki School of Economics and Business Administration,
Finland, and the University of Canterbury, New Zealand. Dr. Mahmood’s
scholarly and service experience includes a number of responsibilities. He is
presently serving as editor-in-chief of the Journal of Organizational and End
User Computing. He has also recently served as guest editor of the International Journal of Electronic Commerce and the Journal of Management
Information Systems. Dr. Mahmood’s research interests center on the utilization of information technology including electronic commerce for managerial
decision making, strategic and competitive advantage, group decision support
systems, and information systems success as it relates to organizational and end
user computing. On this topic and others, he has published four edited books and
87 technical research papers in some of the leading journals and conference
proceedings in the IT field. These include Management Information Systems
Quarterly, Decision Sciences, Journal of Management Information Systems, International Journal of Electronic Commerce, European Journal of
Information Systems, INFOR — Canadian Journal of Operation Research
and Information Processing, Journal of Information Systems, Information
and Management, Journal of End User Computing, Information Resources
Management Journal, Journal of Computer-Based Instruction, Data Base,
and others. He has also presented papers in numerous regional, national, and
international conferences. In recognition of his research, he has received several
“outstanding research” awards from various professional organizations.
Copyright © 2005, Idea Group Inc. Copying or distributing in print or electronic forms without written
permission of Idea Group Inc. is prohibited.
TEAM LinG
About the Authors 323
About the Authors
Barbara Adams, MSHI, is vice president of Cyrus Medical Systems and her
focus includes addressing user resistance to the implementation of new software
systems in health care organizations. She received her bachelor’s degree and her
Master of Science in health informatics from the University of Alabama at
Birmingham. She has published in various journals and presented at industry
conferences including the International Journal of Medical Informatics and
the American Association of Tissue Banks Annual Conference. She is the
recipient of the 2003 Samuel B. Barker Award for Excellence in Graduate
Studies at the Master’s Level and the 2003 Outstanding Graduate Student
Award in Health Informatics.
Kregg Aytes is a professor and chair of the Computer Information Systems
Department in the College of Business, Idaho State University. He holds a PhD
in business administration (MIS) from the University of Arizona. His research
interests include the use of collaborative technologies, information security, and
pedagogy.
Eta S. Berner, EdD, is professor in the Health Informatics Program, Department of Health Services Administration in the School of Health Related
Professions at the University of Alabama at Birmingham. She received her
bachelor’s degree from the University of Rochester and her doctorate from the
Harvard Graduate School of Education. She has published in a variety of journals
and is on the editorial boards of the Journal of the American Medical
Informatics Association (AMIA) and the Journal of Healthcare Information
Copyright © 2005, Idea Group Inc. Copying or distributing in print or electronic forms without written
permission of Idea Group Inc. is prohibited.
TEAM LinG
324 About the Authors
Management. She was elected secretary of AMIA in 2004 and is a fellow in
AMIA’s College of Informatics.
Summer E. Bartczak is an assistant professor of information resource management at the Air Force Institute of Technology. As the IRM program director, she
is responsible for the graduate education of officer and enlisted candidates
selected from across the Department of Defense. Lieutenant Colonel Bartczak
is a U.S. Air Force Academy graduate (1986), a Squadron Officer’s School
distinguished graduate (1993), and an Air Command and Staff College (inresidence) graduate (1999). She completed her PhD program in management
information systems at Auburn University. Her research interests include
information and knowledge management, information and knowledge strategy,
and information and knowledge system implementation.
Ernst Bekkering is assistant professor in management information systems at
Northeastern State University in Tahlequah, OK. Dr. Bekkering received his MS
and PhD degrees in MIS from Mississippi State University. His current research
interests include adoption of new technologies, security, and telecommunications. He has published in the Communications of the ACM, Journal of
Organizational and End User Computing, the Journal for the Advancement
of Marketing Education, and several conference proceedings.
Kalyani Chatterjea is an associate professor at the National Institute of
Education, Nanyang Technological University, Singapore. Her main area of
specialization and research is geomorphology and more specifically, soil erosion
and slope stability, geographic education, and in-service education. She regularly
conducts courses, workshops, and field trips for teachers in schools and junior
colleges and for Geography Teachers’ Association, Singapore. She is involved
in in-service training for teachers, for many years. She has been developing
Web-based in-service training packages for secondary school and junior collage
teachers in Singapore for more than five years. She has also published in journals
and books on topics related to her areas of specialization, in geomorphology and
geography education.
Terry Connolly is the FINOVA professor and head of the Management and
Policy Department, Eller College, at the University of Arizona. His research and
publications are mainly in judgment and decision making. His most recent book
is titled Judgment and Decision Making: An Interdisciplinary Reader (2nd
ed., Arkes and Hammond; Cambridge, 2002). He is past president of the Society
for Judgment and Decision Making.
Copyright © 2005, Idea Group Inc. Copying or distributing in print or electronic forms without written
permission of Idea Group Inc. is prohibited.
TEAM LinG
About the Authors 325
Kimberly Davis is assistant professor of information systems at Mississippi
State University, where her research interests include information assurance
and security, information privacy, and software outsourcing relationships. She
earned a BA in economics (magna cum laude and Phi Beta Kappa) and an
MBA from the University of Nebraska. She earned her doctorate in law (JD),
cum laude, from Harvard Law School. As an attorney, Professor Davis
practiced in the area of intellectual property, with a focus on software licensing.
Professor Davis has published in various outlets, including the European
Journal of Operational Research, Journal of Organizational and End User
Computing, and PC AI.
James P. Downey is an assistant professor of MIS at the University of Central
Arkansas. He was formerly an instructor in the Department of Computer
Science and Information Technology at the U.S. Naval Academy and is still an
active duty Naval officer with 24 years of service. He completed his PhD from
Auburn University. His research interests include IT in the workplace, humancomputer interaction, database technology, and technology trends.
Evan W. Duggan is assistant professor of MIS in the Culverhouse College of
Commerce & Business Administration, University of Alabama. He obtained a
PhD and MBA from Georgia State University and a BSc from the University of
the West Indies, Jamaica. He has more than 25 years of IT experience in
industry. His research interests involve the management of information systems
(IS) in corporations with reference to IS success factors and quality, sociotechnical
issues, and systems development and project management methodologies implementation. He has publications (or articles forthcoming) in the International
Journal of Industrial Engineering, Journal of International Technology
and Information Management, Information Technology & Management,
Journal of End User Computing, Information Resources Management
Journal, Human-Computer Interactions, Information & Management, Electronic Journal of Information Systems in Developing Countries, and Communications of the Association of Information Systems. Dr. Duggan has
taught MIS and decision sciences courses at the graduate and undergraduate
levels, including executive MBA programs, in several U.S. and international
institutions.
Manish Gupta is an executive at M&T Bank in the Information Security
Division. He recently graduated from SUNY Buffalo with an MBA.
Kun S. Im is an assistant professor of MIS at School of Business, Yonsei
University. He holds PhD in MIS from the University of South Carolina and a
PhD in accounting from Yonsei University. His current research interests
Copyright © 2005, Idea Group Inc. Copying or distributing in print or electronic forms without written
permission of Idea Group Inc. is prohibited.
TEAM LinG
326 About the Authors
include IT adoption, impacts of IT on organizational structure, and valuation of
IT investments. He has published his papers in the areas of information systems
research and in the Journal of Information Technology Management.
Mary C. Jones is an associate professor of information systems at the
University of North Texas. She received her doctorate from the University of
Oklahoma in 1990. Dr. Jones has published articles in such journals as Information and Management, Information Resources Management Journal, European Journal of Information Systems, Journal of Computer Information
Systems, and Behavioral Science. Her research interests are in the management and integration of emerging electronic commerce technologies and in
organizational factors associated with enterprise-wide systems.
Nory B. Jones is an assistant professor of MIS at the Maine Business School,
University of Maine, in Orono. Her research interests are in the areas of
knowledge management and collaborative technologies as well as the adoption
and diffusion of technological innovations. She holds a PhD in information
systems from the University of Missouri in Columbia. She has published in
Performance Improvement Quarterly, Technology Horizons in Education,
and E-learning in Corporations (Prentice Hall).
Thomas R. Kochtanek is an associate professor of information science in the
School of Information Science and Learning Technologies at the University of
Missouri in Columbia. His research interests focus on information storage and
retrieval systems, digital libraries and asynchronous learning environments. He
holds the BS in management science and a PhD in information science, both from
Case Western Reserve University. He has more than 50 publications in
international and national journals including Information Processing and
Management, Journal of the American Society for Information Science,
Online Information Retrieval, and many others.
Liping Liu is an associate professor of management and information systems
at the University of Akron. He received a BS in applied mathematics from
Huazhong University of Science and Technology, China (1986), a BE in river
dynamics from Wuhan University, China (1987), an ME in systems engineering
from Huazhong University of Science and Technology, China (1991), and a PhD
in business from the University of Kansas (1995). His research interests have
been in the areas of uncertainty reasoning and decision making in artificial
intelligence, electronic business, systems analysis and design, technology adoption, and data quality. His articles have appeared in Decision Support Systems,
European Journal of Operational Research, International Journal of
Approximate Reasoning, Information Systems Frontier, Journal of Risk and
Copyright © 2005, Idea Group Inc. Copying or distributing in print or electronic forms without written
permission of Idea Group Inc. is prohibited.
TEAM LinG
About the Authors 327
Uncertainty, and others. He has served as a guest editor for the International
Journal of Intelligent Systems and co-editor for Classic Works on the
Dempster-Shafer Theory of Belief Functions. He served on the program
committee or as a track chair for INFORMS, AMCIS, IRMA, IIT, etc. He has
strong practical and teaching interests in emerging e-business technologies and
systems design and development using advanced DBMS, CASE, and RAD tools.
He has won two teaching awards. His recent consulting experience includes
designing and developing a patient record management system, a payroll system,
a course management system, and an e-travel agent, and administering Oracle
databases for medium and large corporations.
Qingxiong Ma is an assistant professor of computer information systems at
Central Missouri State University. He received his MBA from Eastern Illinois
University, Charleston (1999), and his PhD in MIS at Southern Illinois University
at Carbondale (2004). His research interests include information technology
adoption/diffusion, electronic commerce, and information security management.
His articles were published in the International Journal of Healthcare
Technology and Management and the Journal of Organizational and End
User Computing. He presented numerous papers at the America’s Conference
on Information Systems and Decision Sciences Institute annual meetings.
Information systems classes he has taught include: systems analysis and design,
data communication and networks, management of information systems, and
database management systems.
Thomas E. Marshall is an associate professor of management information
systems at Auburn University. His previous research has been published in
journals including Information & Management, Information Resource Management Journal, and Journal of Database Management. His research
interests include CASE technologies, cognitive modeling, accounting information
systems, information security and database technologies.
Tanya McGill is a senior lecturer in the School of Information Technology at
Murdoch University, Western Australia. She has a PhD from Murdoch University. Her major research interests include end user computing and information
technology education. Her work has appeared in various journals including the
Information Resources Management Journal, Journal of Research on
Computing in Education, European Journal of Psychology of Education,
Journal of the American Society for Information Science, and Journal of
End User Computing.
Steven A. Morris is associate professor of computer information systems at
Middle Tennessee State University, Murfreesboro, Tennessee. Dr. Morris
Copyright © 2005, Idea Group Inc. Copying or distributing in print or electronic forms without written
permission of Idea Group Inc. is prohibited.
TEAM LinG
328 About the Authors
received in PhD in MIS from Auburn University in 1999. His research interests
include cognitive factors in information systems, organizational design, and
various issues regarding system analysis and design. Dr. Morris has published in
numerous IS journals including Journal of Organizational and End User
Computing and Information Resources Management Journal.
R. Leon Price’s research interests include management information systems,
systems analysis and design and computer auditing. Professor Price’s articles
have been published in Academy of Management Review, Journal of Systems
Management, Journal of End User Computing, Journal of Microcomputer
System Management, DATA Management, Information Resource Management, Information Executive, Behavioral Science, Journal of Purchasing
and Materials Management and The American Oil and Gas Reporter. He has
also presented papers at numerous professional meetings and seminars such as
ICIS and DSI. He handles review assignments for several journals. Professor
Price is a member of the International Conference of Information Systems,
Decision Sciences Institute, Association of Information Technology Professionals and Association for Information Systems. He was selected as the industry
contact for the International Conference on Information Systems and has served
as MIS chairperson for the Decision Sciences Institute. Professor Price has won
more than 20 teaching awards during his tenure at the University of Oklahoma.
He has also served as faculty coordinator for the annual Oklahoma Business
Conference and on numerous university committees.
H. Raghav Rao is a professor of MIS and an adjunct professor of CSE at SUNY
Buffalo.
Peter B. Seddon, PhD, is an associate professor in the Department of
Information Systems at The University of Melbourne, Australia. His teaching
and research interests focus on helping people and organizations make more
effective use of IT. His particular research interests are (1) evaluation of
information systems success, (2) packaged enterprise application software, and
(3) IT outsourcing. Peter is on the editorial boards of a number of publications,
and has recently completed a term as an associate editor for Management
Information Systems Quarterly.
Bernd Carsten Stahl is a senior lecturer in the Faculty of Computer Sciences
and Engineering and a research associate at the Centre for Computing and Social
Responsibility of De Montfort University, Leicester, UK. His area of research
consists of philosophical, more specifically of normative, questions arising from
the use of information and communication technology. The emphasis in this area
is on the notion of responsibility. He researches the application of such normative
Copyright © 2005, Idea Group Inc. Copying or distributing in print or electronic forms without written
permission of Idea Group Inc. is prohibited.
TEAM LinG
About the Authors 329
questions in economic organizations, but also educational and governmental
institutions. His second area of interest consists of epistemological questions in
Information Systems research. Dr. Stahl has published more than 40 papers in
refereed journals, books, and conferences. His first book Responsible Management of Information Systems has recently been published by Idea Group
Publishing. He is the editor-in-chief of the International Journal of Technology and Human Interaction.
D. Sandy Staples, PhD, is an associate professor in the School of Business at
Queen’s University, Kingston, Canada. His research interests include the
enabling role of information systems for working virtually and knowledge
management, and assessing the effectiveness of information systems and IS
practices. Sandy has published articles in various journals and magazines
including Organization Science, Information Systems Research, Information
& Management, Journal of Strategic Information Systems, Journal of
Management Information Systems, Journal of End-User Computing,
OMEGA, and KM Review. He is currently an associate editor of MIS Quarterly
and serves on the editorial board of other journals.
Cherian S. Thachenkary is associate professor of management in the J. Mack
Robinson College of Business at Georgia State University in Atlanta, Georgia,
USA. He obtained his PhD and MASc degrees in management sciences from the
Faculty of Engineering, University of Waterloo, Canada, and a BSc from the
University of Toronto. Dr. Thachenkary conducts teaching and research in the
area of management of technology. His current focus is on the digital economy
— the cost/benefits of high bandwidth networks and electronic services/
applications. Dr. Thachenkary’s research has been published in the Journal of
Telemedicine and e-Health, OR/MS Today, Computer Networks and ISDN
Systems, IEEE Transactions on Engineering Management, Office: Technology and People, and Computerworld. He has served as a senior editor of
Computer Networks and ISDN Systems, and as a departmental editor of
DATABASE. Dr. Thachenkary has also held faculty appointments at the
University of Waterloo in Canada, The University of Waikato in New Zealand,
and at Cairo University, Egypt.
Shambhu Upadhyaya is an associate professor of CSE and director of the
Center of Excellence in Information Systems Assurance Research and Education at SUNY Buffalo.
Merrill Warkentin is a professor of information systems at Mississippi State
University. His research, primarily in e-commerce, virtual teams, and computer
security, has appeared in such journals as MIS Quarterly, Decision Sciences,
Copyright © 2005, Idea Group Inc. Copying or distributing in print or electronic forms without written
permission of Idea Group Inc. is prohibited.
TEAM LinG
330 About the Authors
Decision Support Systems, Communications of the AIS, Information Systems
Journal, Journal of End User Computing, Journal of Global Information
Management, Journal of Electronic Commerce Research, and Journal of
Computer Information Systems. Professor Warkentin’s newest book will
focus on Information System Assurance and Security. He is associate editor of
Information Resources Management Journal, Journal of Information Systems Security, and eGovernment Quarterly, and can be reached at
www.MISProfessor.com.
Joni Rousse Wyatt, MHA, MHS-HIA is presently the manager of operations
for Norwood Clinic, Inc., a 40-physician multispecialty clinic in Birmingham, AL.
She earned a master’s degree in health administration and a master’s degree in
health science with a focus in health information administration from the Medical
University of South Carolina in 2000. Her current focus is on process improvement as a precursor to technological advancement.
Mun Y. Yi is an assistant professor of MIS at the Moore School of Business,
University of South Carolina. He earned his PhD in information systems from the
University of Maryland, College Park. His current research focuses on computer skill acquisition and training, information technology adoption and diffusion,
electronic commerce, and IS project management. His work has been published
in journals such as Information Systems Research, Decision Sciences, Information and Management, International Journal of Human-Computer Studies, Journal of End User Computing, and Journal of Applied Psychology.
Copyright © 2005, Idea Group Inc. Copying or distributing in print or electronic forms without written
permission of Idea Group Inc. is prohibited.
TEAM LinG
Index 331
Index
A
adoption of technology innovations 131
appraisal 92
assets management (AM) 212
asynchronous intervention 305
authentication 239
automated teller machine (ATM) 234
availability 242
B
banking service hosting 235
behavioral control 92
blended approach learning strategy
301
BSCW (basic support for cooperative
work) 137
C
centralized database 209
change management process 223
check-off password system (COPS)
281
chemicals 215
cognitive control 92
collaborative technologies 130
computer learning 66
computer security 257
computer self-efficacy 72
computer software training 68
computer task performance 65
computer viruses 258
computer-supported collaborative work
(CSCW) 131
computing behaviors 259
confidentiality 242, 280
consequences of use 51
control 91
D
decision support systems (DSS) 6
decisional control 92
digital 130
direct dial access (DDA) 234
distance education 302
E
E&P 214
Copyright © 2005, Idea Group Inc. Copying or distributing in print or electronic forms without written
permission of Idea Group Inc. is prohibited.
TEAM LinG
332 Index
e-banking 234
e-mail 263
end user 3, 188
end user computing (EUC) 1, 22
end user development 21
end user dimension 5
end user support 7
end-user productivity 66
enterprise resource planning (ERP)
208
ethics 189
experimental social psychology 92
extreme programming (XP) 154
F
feedback condition 95
feedback content 95
feedback sequence 95
feedback timeframe 95
feedback-control paradigm 92
FI/CO (financial accounting and
controlling) 212
Frese model 94
G
goal content 95
goal realistic 95
goal sequence 95
goal stable 95
goal timeframe 95
group decision support systems
(GDSS) 6
group support systems (GSS) 6
H
health care 176
Herzberg’s two-factor model 145
human memory 285
immoral behavior 190
in-service upgrading 301
infoculture 132
information assurance 189, 233
information gathering 92
information system security 281
information systems 176
information systems implementation
177
information technology (IT) 66, 189,
258
infostructure 132
infrastructure 132
integration 226
integrity 241, 280
interactive voice response (IVRs) 236
Internet 233, 303
IT management 113
J
joint application development (JAD)
151
K
keystroke dynamics 283
knowledge 94
L
learner control 306
M
materials management (MM) 212
meta-analysis 116
motivation-maintenance technology
implementation 145
N
nominal group technique (NGT) 151
I
O
image-intensive learning environment
308
online course 304
Copyright © 2005, Idea Group Inc. Copying or distributing in print or electronic forms without written
permission of Idea Group Inc. is prohibited.
TEAM LinG
Index 333
P
password 259, 282
performance improvements 133
personal finance managers (PFMs)
236
personal goal 65
personal identification number (PIN)
234
plant maintenance (PM) 212
PLS structural model 75
privacy 190, 242, 280
privacy-enhancing technologies (PETs)
196
production planning (PP) 212
project systems (PS) 212
R
rapid application development (RAD)
154
rational choice model 261
resistance 179
S
sales and distribution (SD) 212
security 186
share knowledge 130
short-term memory 282
Singapore 302
single system sign on (SSO) 283
social engineering 258
social psychology theory 114
software modules 209
stimulus–response 92
support staff 45
system usage 90
systems requirements determination
(SRD) 152
task organized 95
task performance 66
task realistic 95
task sequence 95
task timeframe 95
task-technology fit (TTF) 47
teacher development 301
team-oriented collaborative culture 134
technical customer support division
134
technology acceptance model (TAM)
113, 259
technology-to-performance chain
(TPC) 42
theory of reasoned action (TRA)
47, 114, 259
training 210
transition of IPS knowledge 218
U
user developed applications (UDAs)
21
user resistance 176
user satisfaction 23, 90
user-centered theories 176
USWhole 214
W
Web banking 234
Web-based course 305
T
task content 95
task flexible 95
Copyright © 2005, Idea Group Inc. Copying or distributing in print or electronic forms without written
permission of Idea Group Inc. is prohibited.
TEAM LinG
Instant access to the latest offerings of Idea Group, Inc. in the fields of
I NFORMATION SCIENCE , T ECHNOLOGY AND MANAGEMENT!
InfoSci-Online
Database
BOOK CHAPTERS
JOURNAL AR TICLES
C ONFERENCE PROCEEDINGS
C ASE STUDIES
“
The Bottom Line: With easy
to use access to solid, current
and in-demand information,
InfoSci-Online, reasonably
priced, is recommended for
academic libraries.
The InfoSci-Online database is the
most comprehensive collection of
full-text literature published by
Idea Group, Inc. in:
”
- Excerpted with permission from
Library Journal, July 2003 Issue, Page 140
n
n
n
n
n
n
n
n
n
Distance Learning
Knowledge Management
Global Information Technology
Data Mining & Warehousing
E-Commerce & E-Government
IT Engineering & Modeling
Human Side of IT
Multimedia Networking
IT Virtual Organizations
BENEFITS
n Instant Access
n Full-Text
n Affordable
n Continuously Updated
n Advanced Searching Capabilities
Start exploring at
www.infosci-online.com
Recommend to your Library Today!
Complimentary 30-Day Trial Access Available!
A product of:
Information Science Publishing*
Enhancing knowledge through information science
*A company of Idea Group, Inc.
www.idea-group.com
TEAM LinG
New Releases from Idea Group Reference
Idea Group
REFERENCE
The Premier Reference Source for Information Science and Technology Research
ENCYCLOPEDIA OF
ENCYCLOPEDIA OF
DATA WAREHOUSING
AND MINING
INFORMATION SCIENCE
AND TECHNOLOGY
AVAILABLE NOW!
Edited by: John Wang,
Montclair State University, USA
Two-Volume Set • April 2005 • 1700 pp
ISBN: 1-59140-557-2; US $495.00 h/c
Pre-Publication Price: US $425.00*
*Pre-pub price is good through one month
after the publication date
Provides a comprehensive, critical and descriptive examination of concepts, issues, trends, and challenges in this
rapidly expanding field of data warehousing and mining
A single source of knowledge and latest discoveries in the
field, consisting of more than 350 contributors from 32
countries
Five-Volume Set • January 2005 • 3807 pp
ISBN: 1-59140-553-X; US $1125.00 h/c
ENCYCLOPEDIA OF
DATABASE TECHNOLOGIES
AND APPLICATIONS
Offers in-depth coverage of evolutions, theories, methodologies, functionalities, and applications of DWM in such
interdisciplinary industries as healthcare informatics, artificial intelligence, financial modeling, and applied statistics
Supplies over 1,300 terms and definitions, and more than
3,200 references
DISTANCE LEARNING
April 2005 • 650 pp
ISBN: 1-59140-560-2; US $275.00 h/c
Pre-Publication Price: US $235.00*
*Pre-publication price good through
one month after publication date
Four-Volume Set • April 2005 • 2500+ pp
ISBN: 1-59140-555-6; US $995.00 h/c
Pre-Pub Price: US $850.00*
*Pre-pub price is good through one
month after the publication date
MULTIMEDIA TECHNOLOGY
AND NETWORKING
ENCYCLOPEDIA OF
ENCYCLOPEDIA OF
More than 450 international contributors provide extensive coverage of topics such as workforce training,
accessing education, digital divide, and the evolution of
distance and online education into a multibillion dollar
enterprise
Offers over 3,000 terms and definitions and more than
6,000 references in the field of distance learning
Excellent source of comprehensive knowledge and literature on the topic of distance learning programs
Provides the most comprehensive coverage of the issues,
concepts, trends, and technologies of distance learning
April 2005 • 650 pp
ISBN: 1-59140-561-0; US $275.00 h/c
Pre-Publication Price: US $235.00*
*Pre-pub price is good through
one month after publication date
www.idea-group-ref.com
Idea Group Reference is pleased to offer complimentary access to the electronic version
for the life of edition when your library purchases a print copy of an encyclopedia
For a complete catalog of our new & upcoming encyclopedias, please contact:
701 E. Chocolate Ave., Suite 200 • Hershey PA 17033, USA • 1-866-342-6657 (toll free) • cust@idea-group.com
TEAM LinG
IT Solutions Series
Humanizing Information Technology: Advice from Experts
Authored by:
Shannon Schelin, PhD, North Carolina State University, USA
G. David Garson, PhD, North Carolina State University, USA
With the alarming rate of information technology changes over the past two decades, it is not unexpected
that there is an evolution of the human side of IT that has forced many organizations to rethink their
strategies in dealing with the human side of IT. People, just like computers, are main components of any
information systems. And just as successful organizations must be willing to upgrade their equipment and
facilities, they must also be alert to changing their viewpoints on various aspects of human behavior. New
and emerging technologies result in human behavior responses, which must be addressed with a view
toward developing better theories about people and IT. This book brings out a variety of views expressed
by practitioners from corporate and public settings offer their experiences in dealing with the human
byproduct of IT.
ISBN 1-59140-245-X (s/c) • US$29.95 • eISBN 1-59140-246-8 • 186 pages • Copyright © 2004
Information Technology Security: Advice from Experts
Edited by:
Lawrence Oliva, PhD, Intelligent Decisions LLC, USA
As the value of the information portfolio has increased, IT security has changed from a product focus to
a business management process. Today, IT security is not just about controlling internal access to data
and systems but managing a portfolio of services including wireless networks, cyberterrorism protection
and business continuity planning in case of disaster. With this new perspective, the role of IT executives
has changed from protecting against external threats to building trusted security infrastructures linked to
business processes driving financial returns. As technology continues to expand in complexity, databases
increase in value, and as information privacy liability broadens exponentially, security processes
developed during the last century will not work. IT leaders must prepare their organizations for previously
unimagined situations. IT security has become both a necessary service and a business revenue
opportunity. Balancing both perspectives requires a business portfolio approach to managing investment
with income, user access with control, and trust with authentication. This book is a collection of
interviews of corporate IT security practitioners offering various viewpoint on successes and failures in
managing IT security in organizations.
ISBN 1-59140-247-6 (s/c) • US$29.95 • eISBN 1-59140-248-4 • 182 pages • Copyright © 2004
Managing Data Mining: Advice from Experts
Edited by:
Stephan Kudyba, PhD, New Jersey Institute of Technology, USA
Foreword by Dr. Jim Goodnight, SAS Inc, USA
Managing Data Mining: Advice from Experts is a collection of leading business applications in the data mining
and multivariate modeling spectrum provided by experts in the field at leading US corporations. Each contributor
provides valued insights as to the importance quantitative modeling provides in helping their corresponding organizations
manage risk, increase productivity and drive profits in the market in which they operate. Additionally, the expert
contributors address other important areas which are involved in the utilization of data mining and multivariate modeling
that include various aspects in the data management spectrum (e.g. data collection, cleansing and general
organization).
ISBN 1-59140-243-3 (s/c) • US$29.95 • eISBN 1-59140-244-1 • 278 pages • Copyright © 2004
E-Commerce Security: Advice from Experts
Edited by:
Mehdi Khosrow-Pour, D.B.A.,
Information Resources Management Association, USA
The e-commerce revolution has allowed many organizations around the world to become more effective and efficient
in managing their resources. Through the use of e-commerce many businesses can now cut the cost of doing
business with their customers in a speed that could only be imagined a decade ago. However, doing business on
the Internet has opened up business to additional vulnerabilities and misuse. It has been estimated that the cost
of misuse and criminal activities related to e-commerce now exceeds 10 billion dollars per year, and many experts
predict that this number will increase in the future. This book provides insight and practical knowledge obtained from
industry leaders regarding the overall successful management of e-commerce practices and solutions.
ISBN 1-59140-241-7 (s/c) • US$29.95 • eISBN 1-59140-242-5 • 194 pages • Copyright © 2004
Its Easy to Order! Order online at www.cybertech-pub.com,
www.idea-group.com or call 717/533-8845 x10
Mon-Fri 8:30 am-5:00 pm (est) or fax 24 hours a day 717/533-8661
CyberTech Publishing
Hershey • London • Melbourne • Singapore
Excellent additions to your library!
TEAM LinG