/


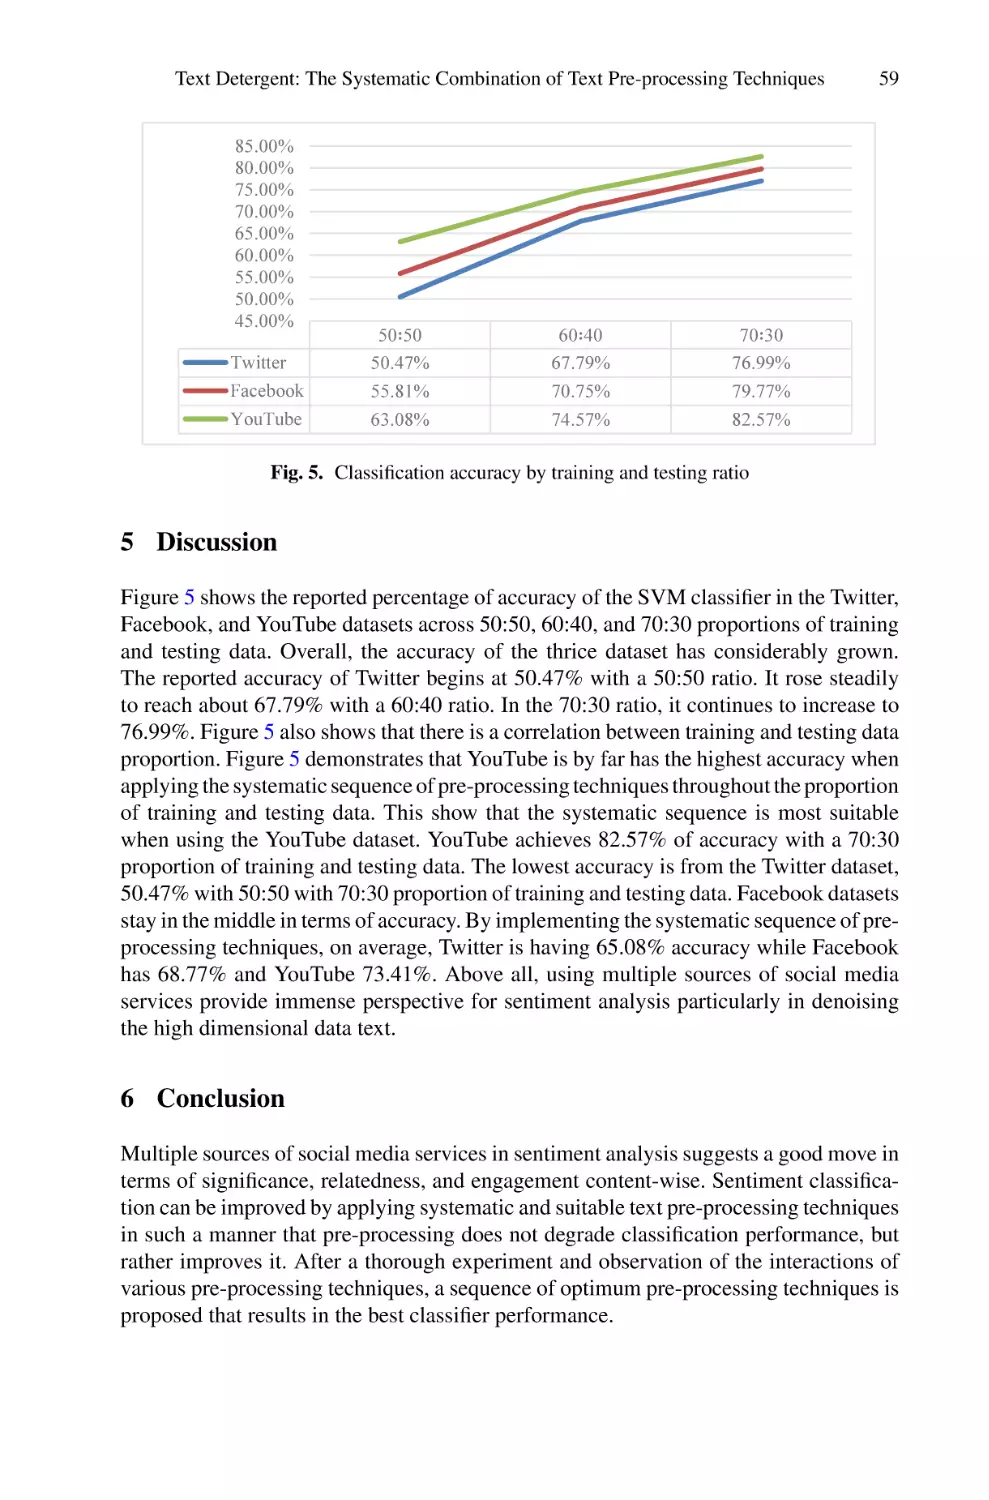


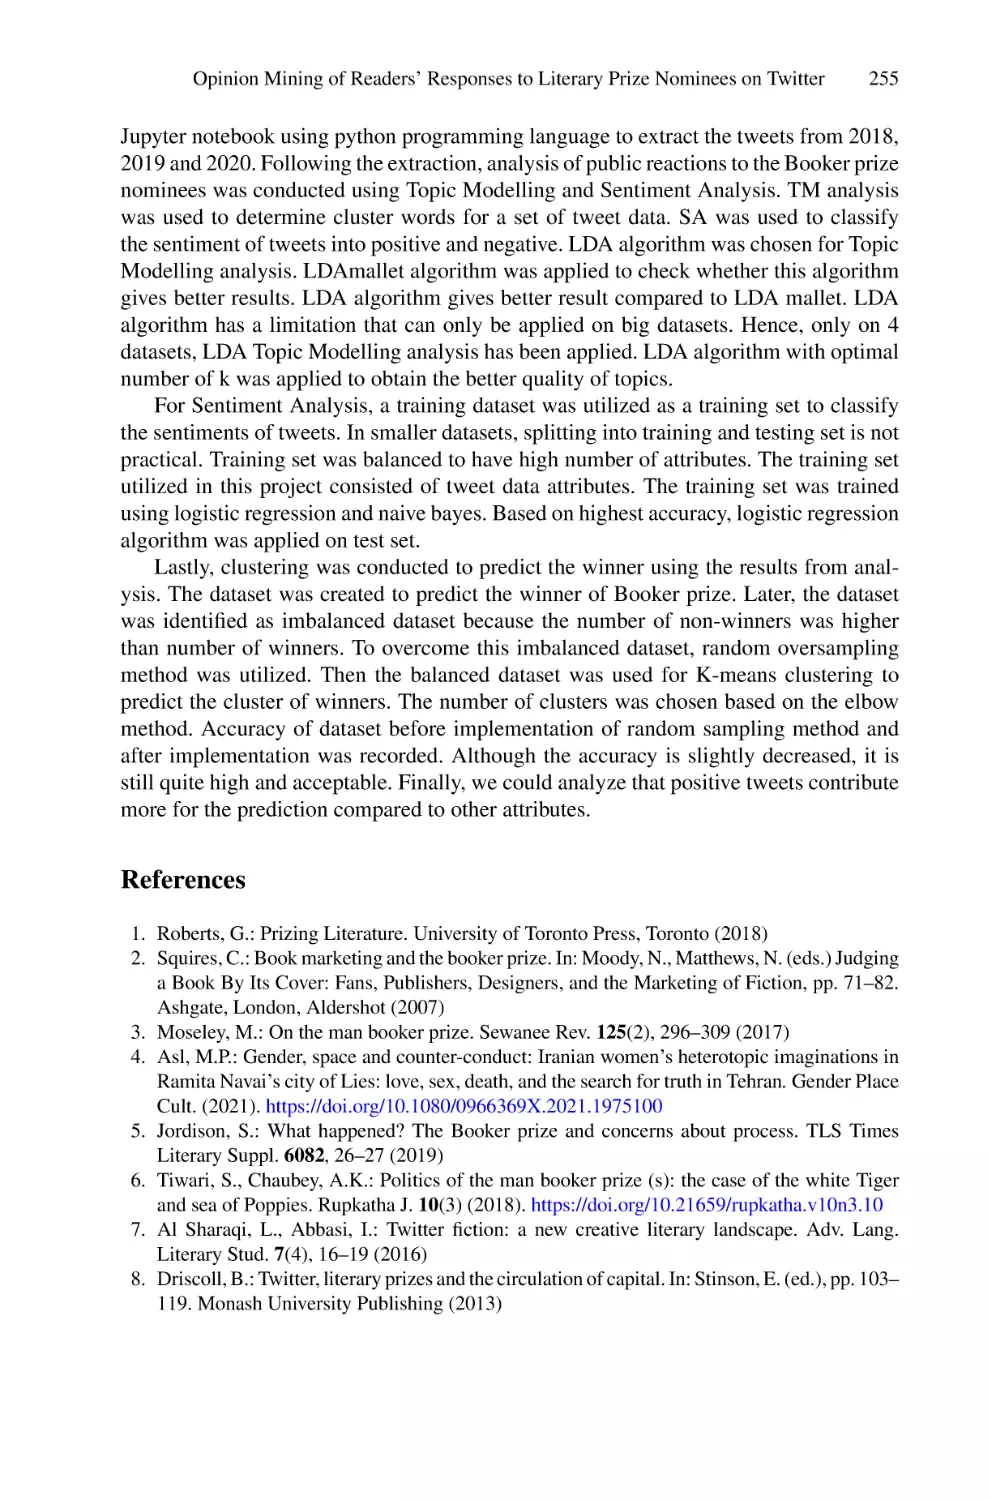


Author: Saeed F. Mohammed F. Ghaleb F.
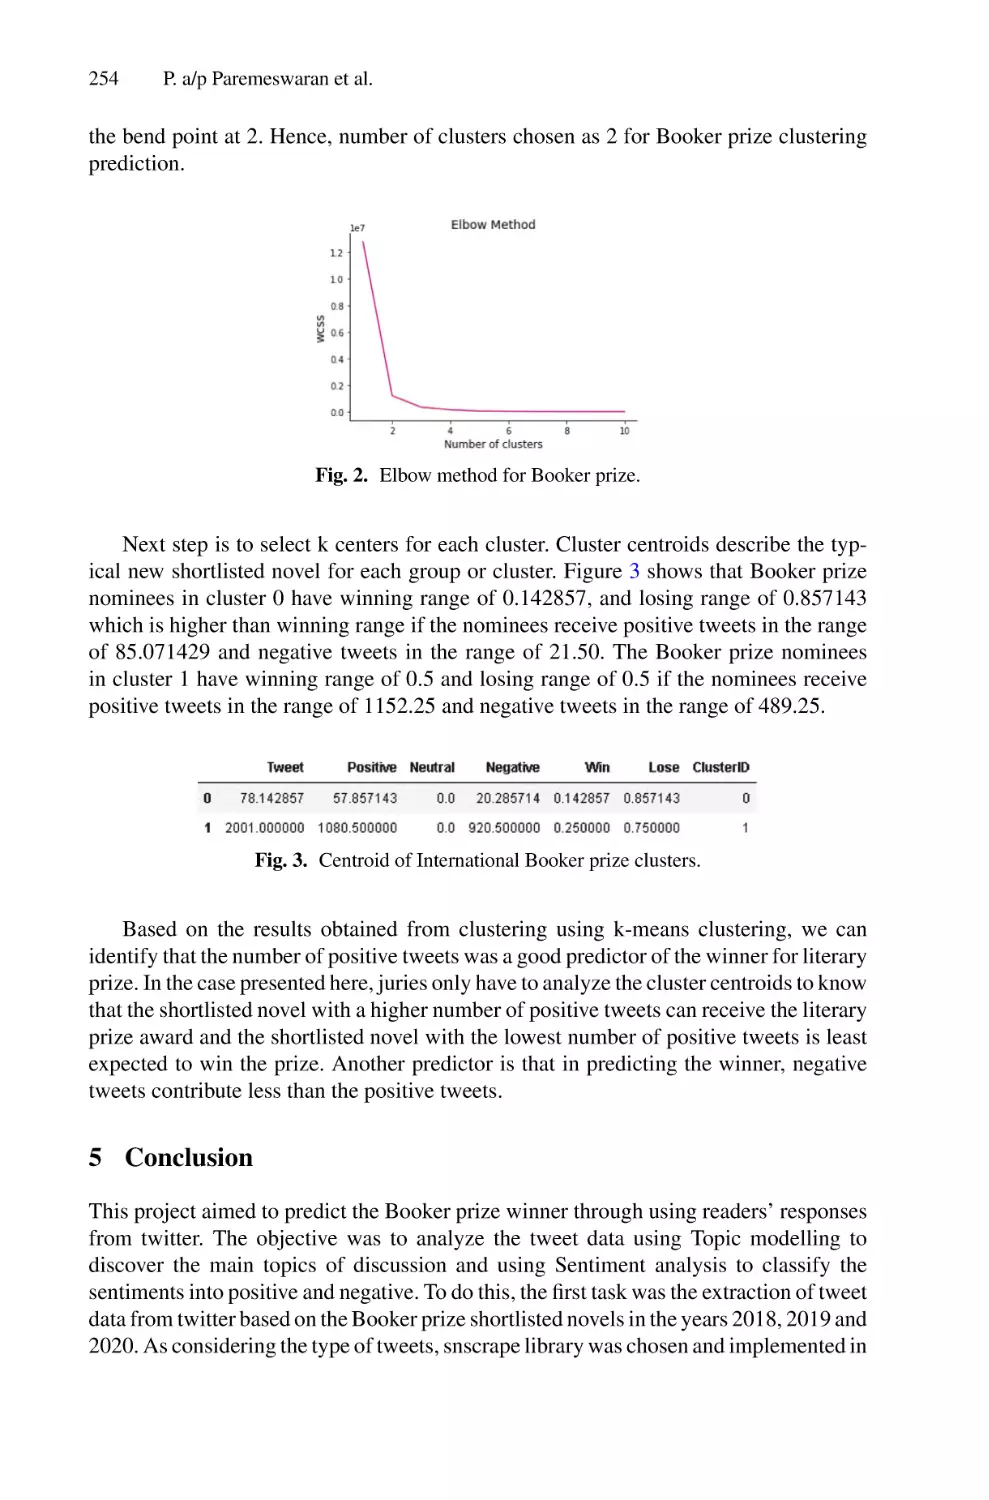
Tags: informatics computer technology
ISBN: 978-3-030-98740-4
Year: 2022
Similar


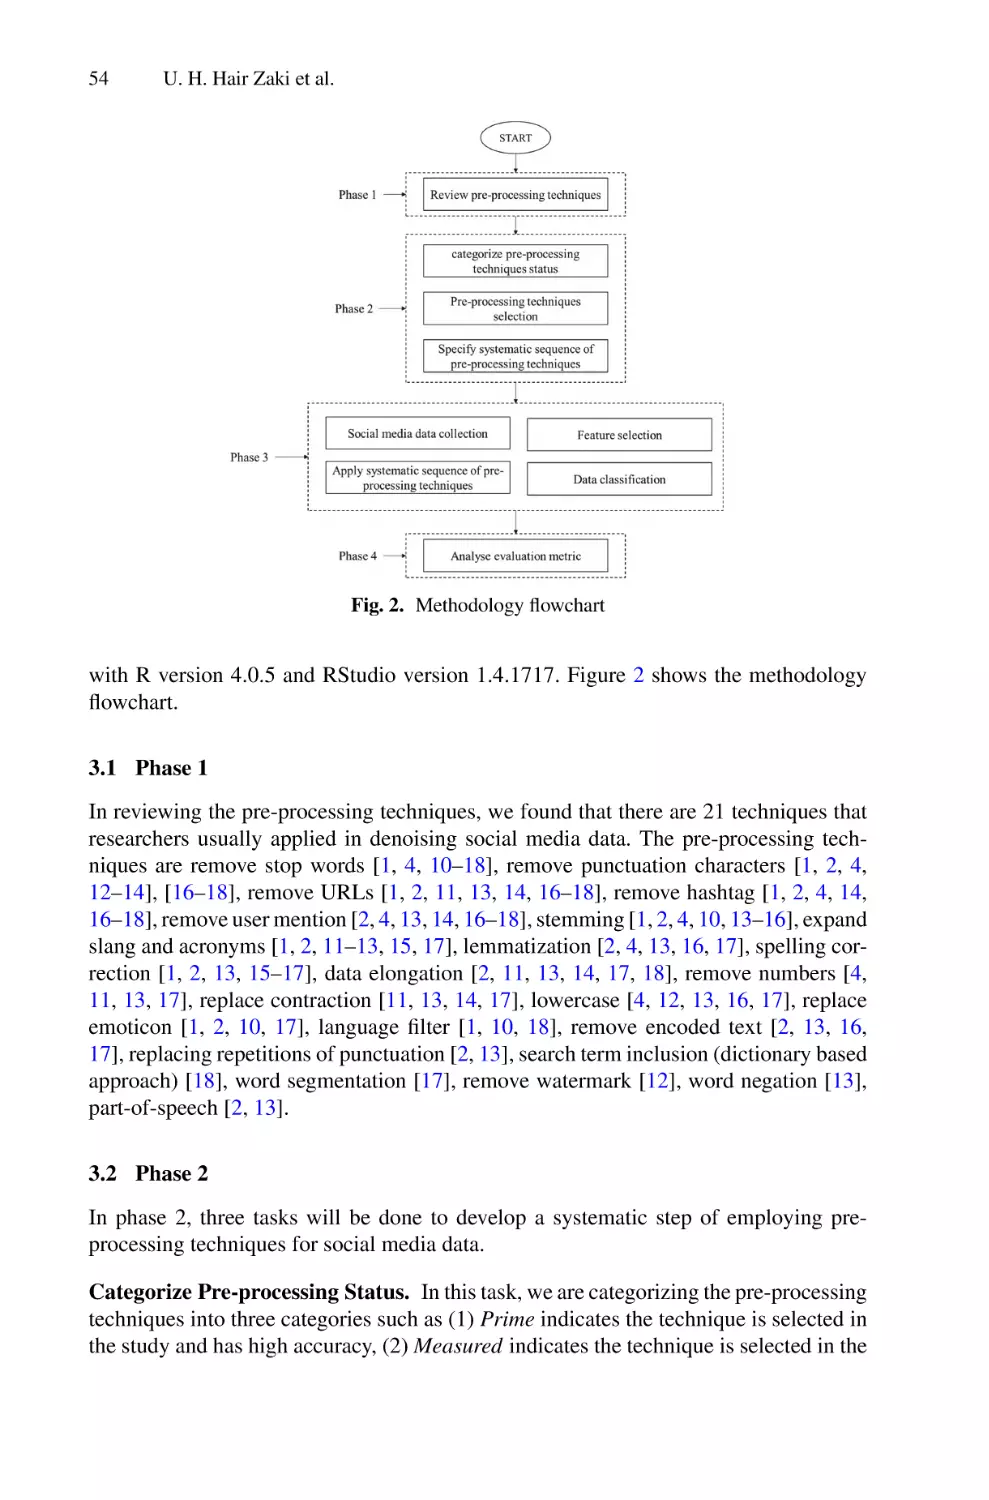
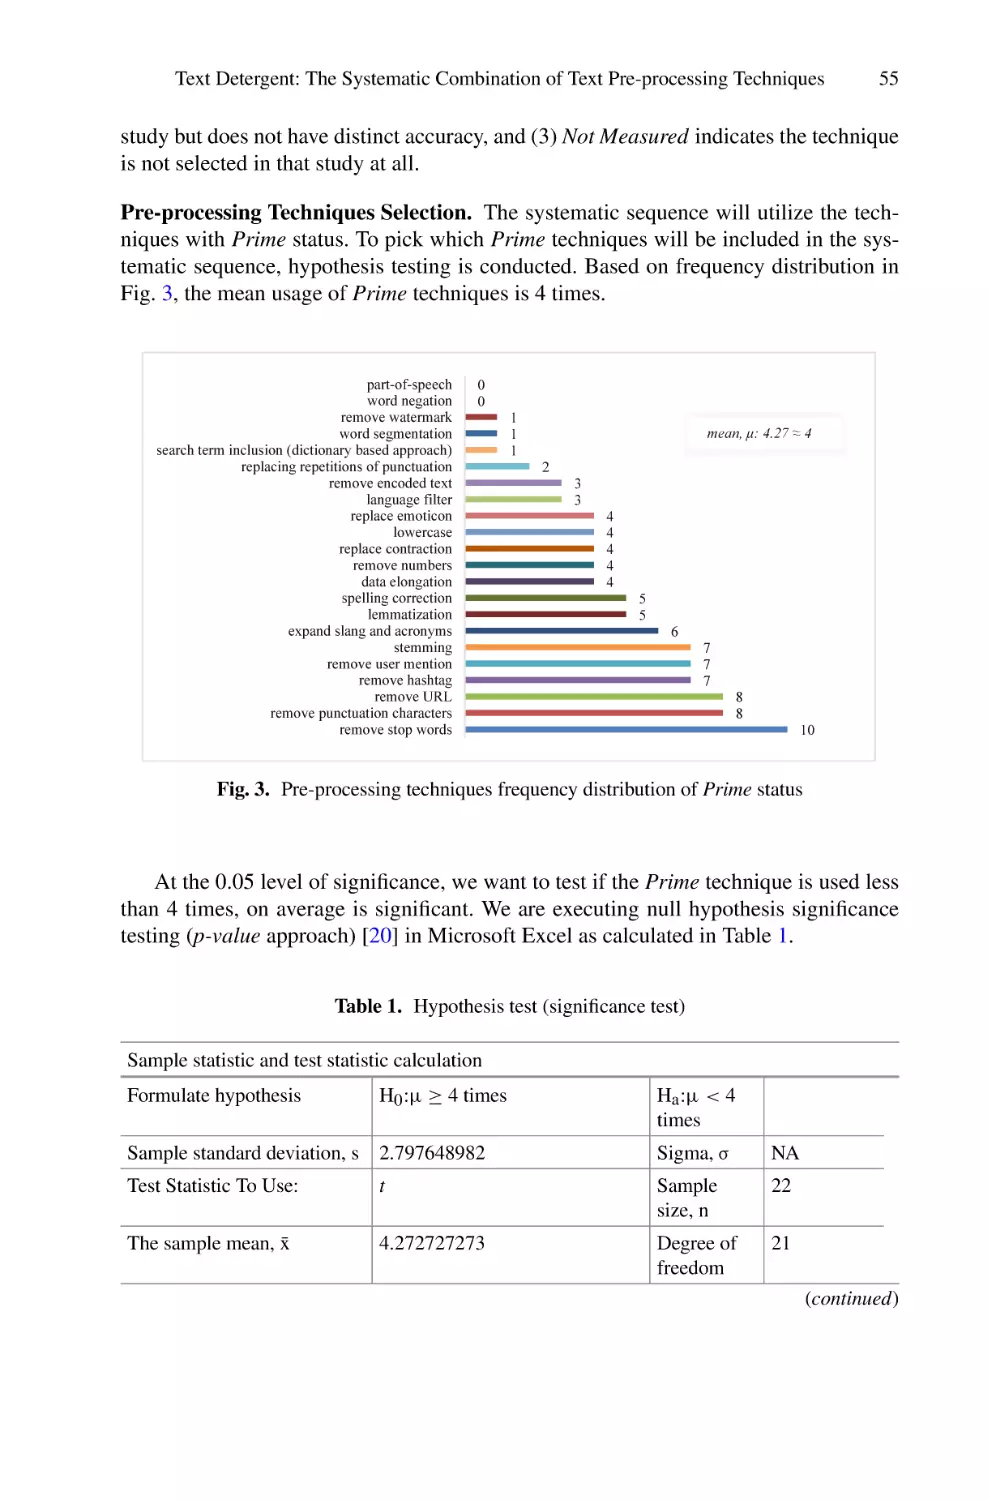
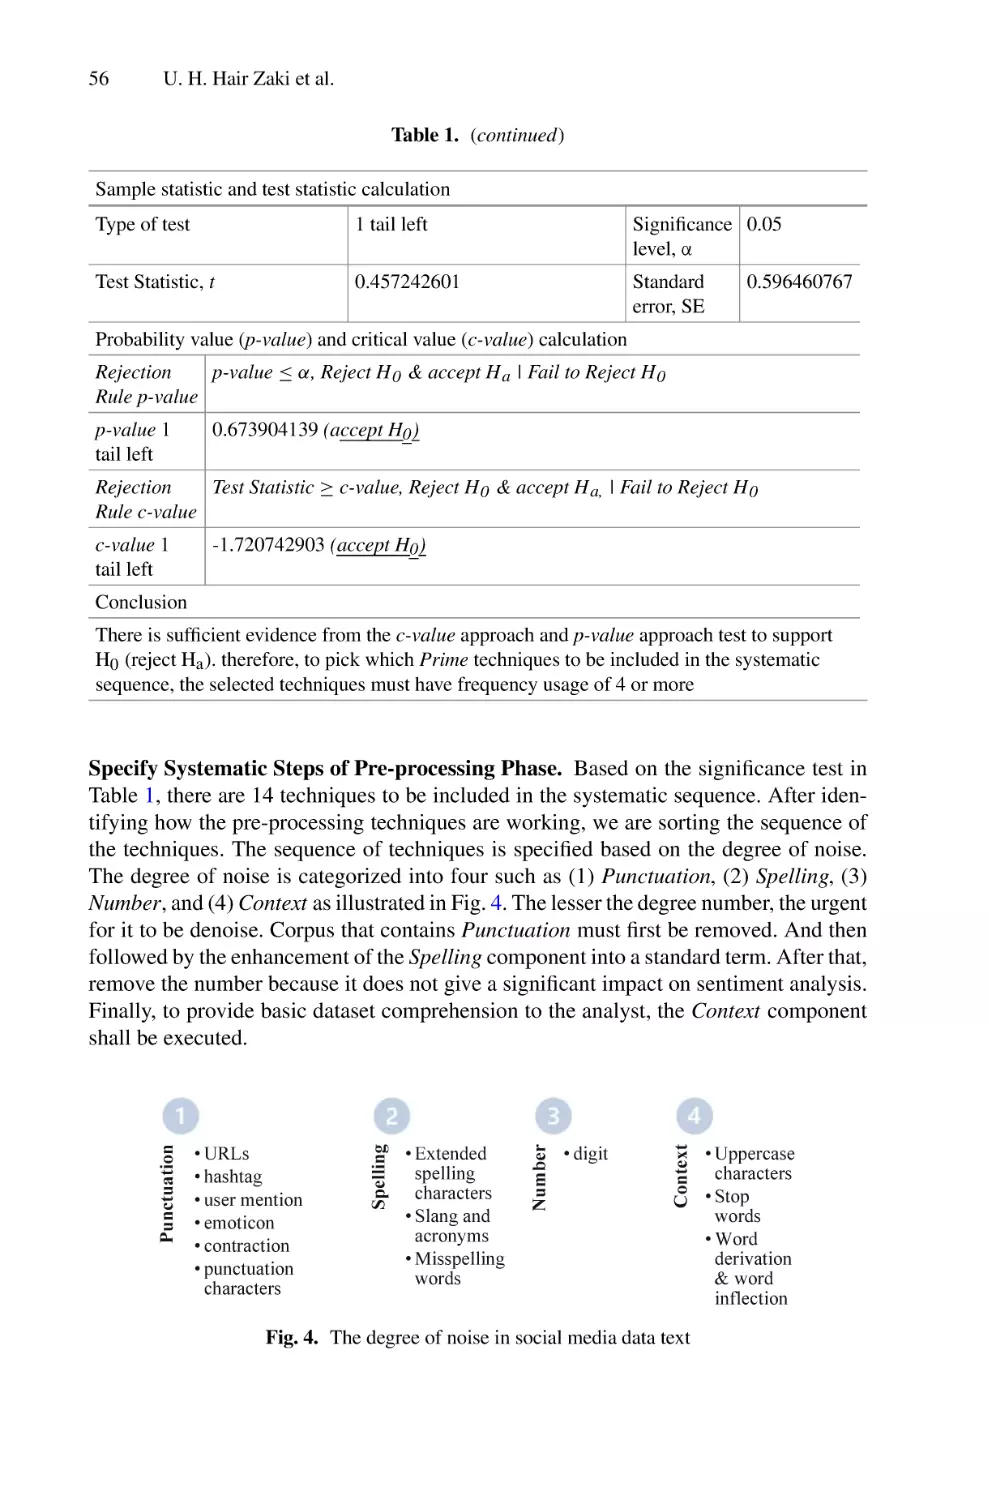
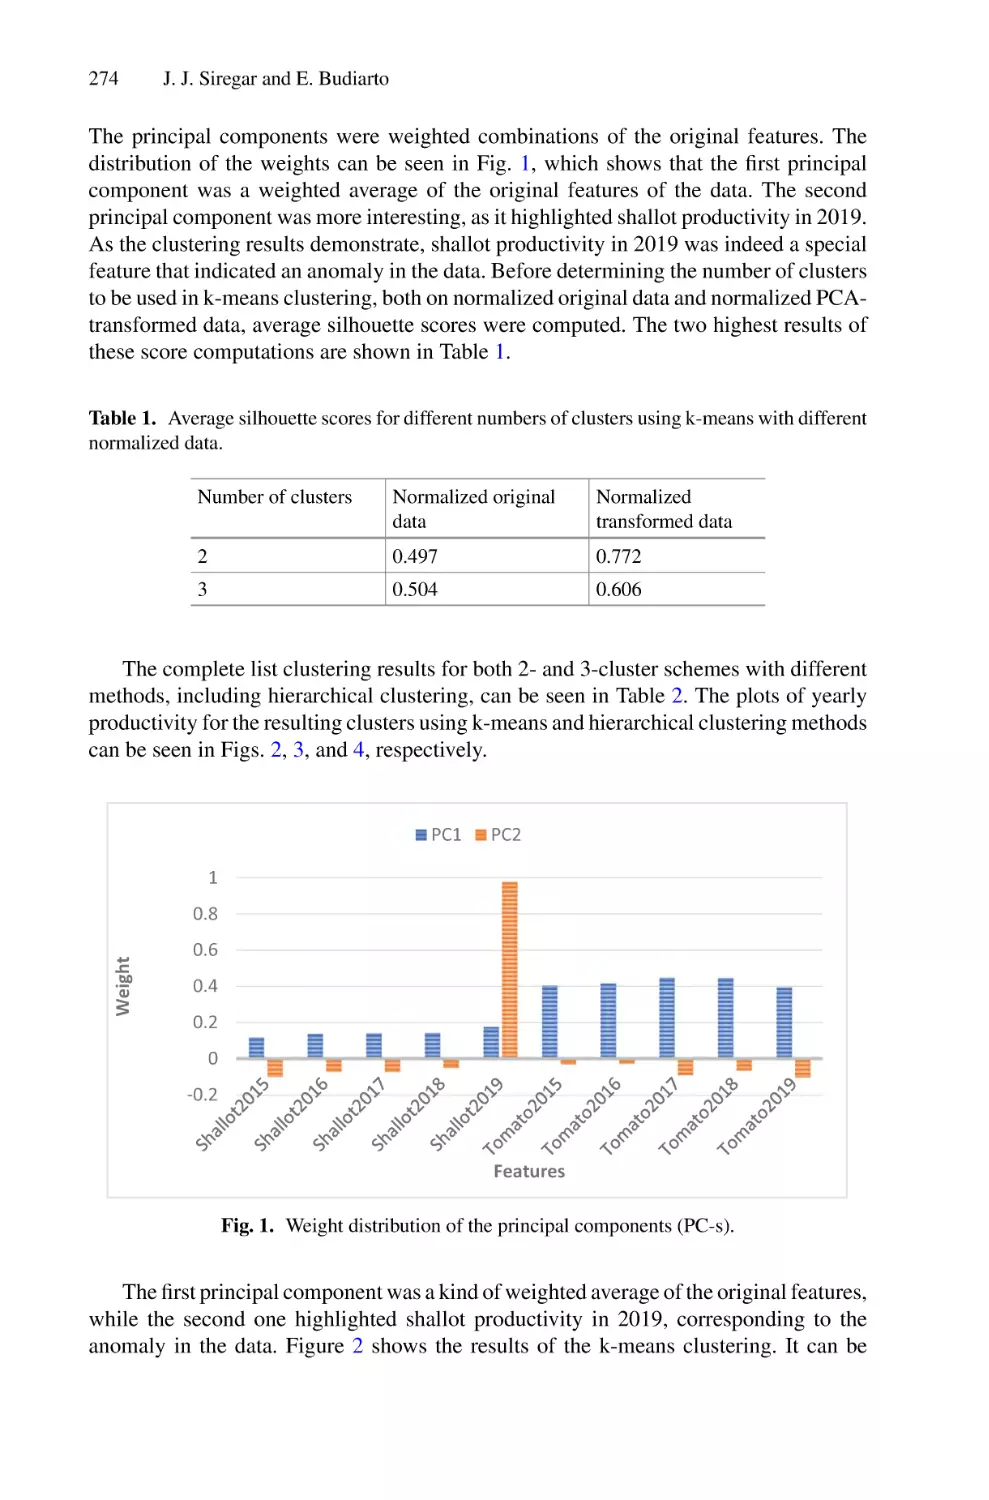
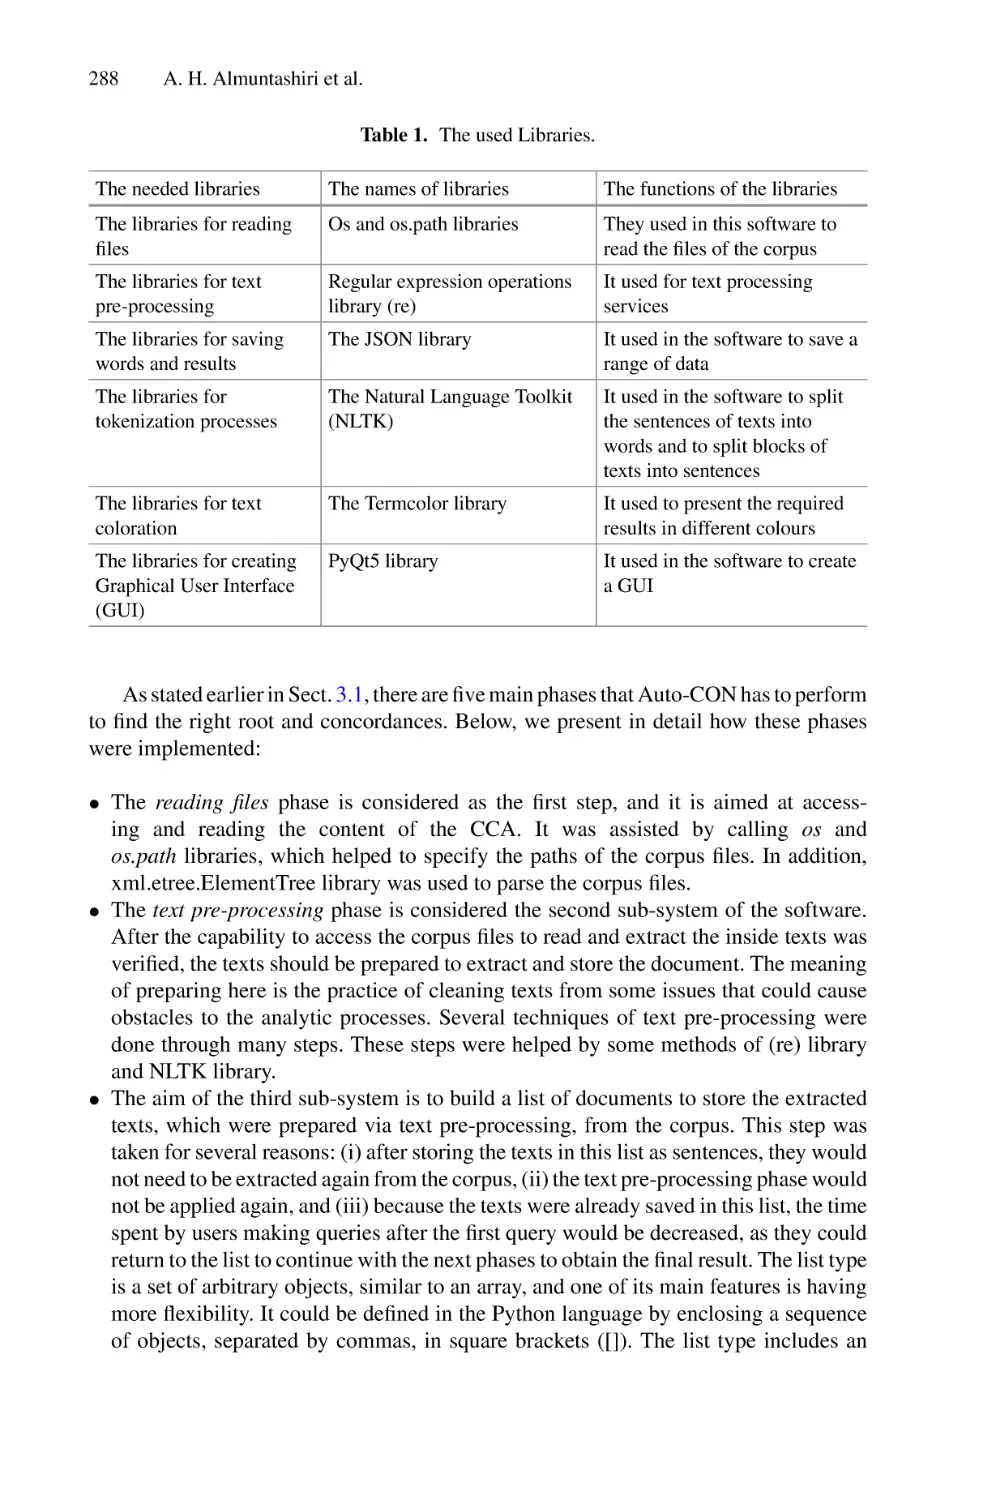
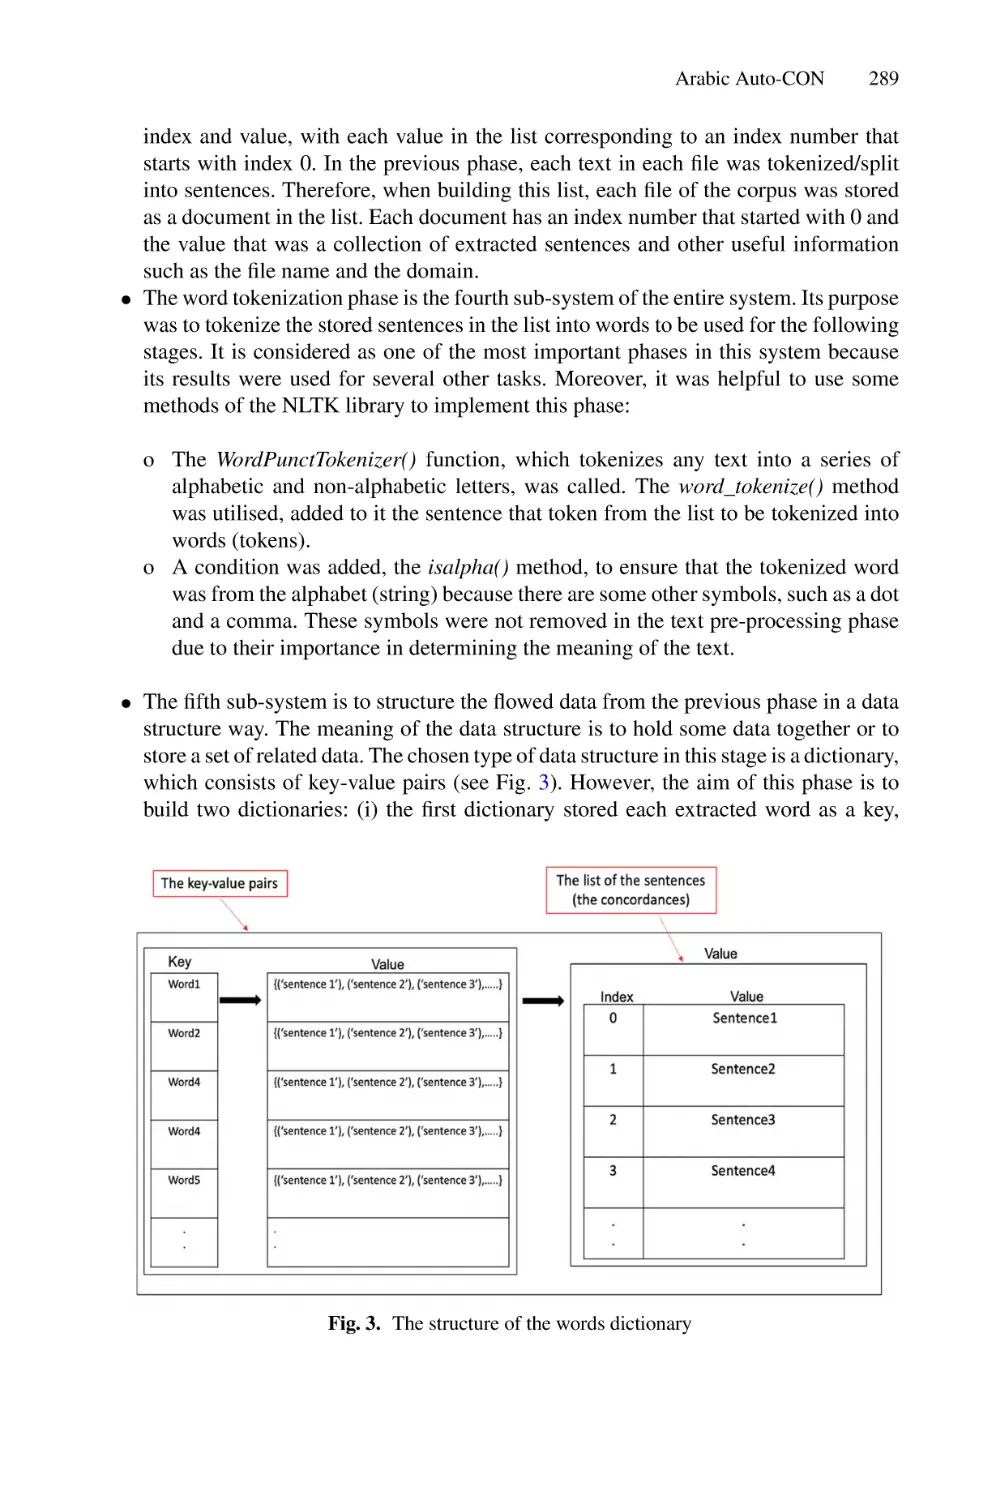
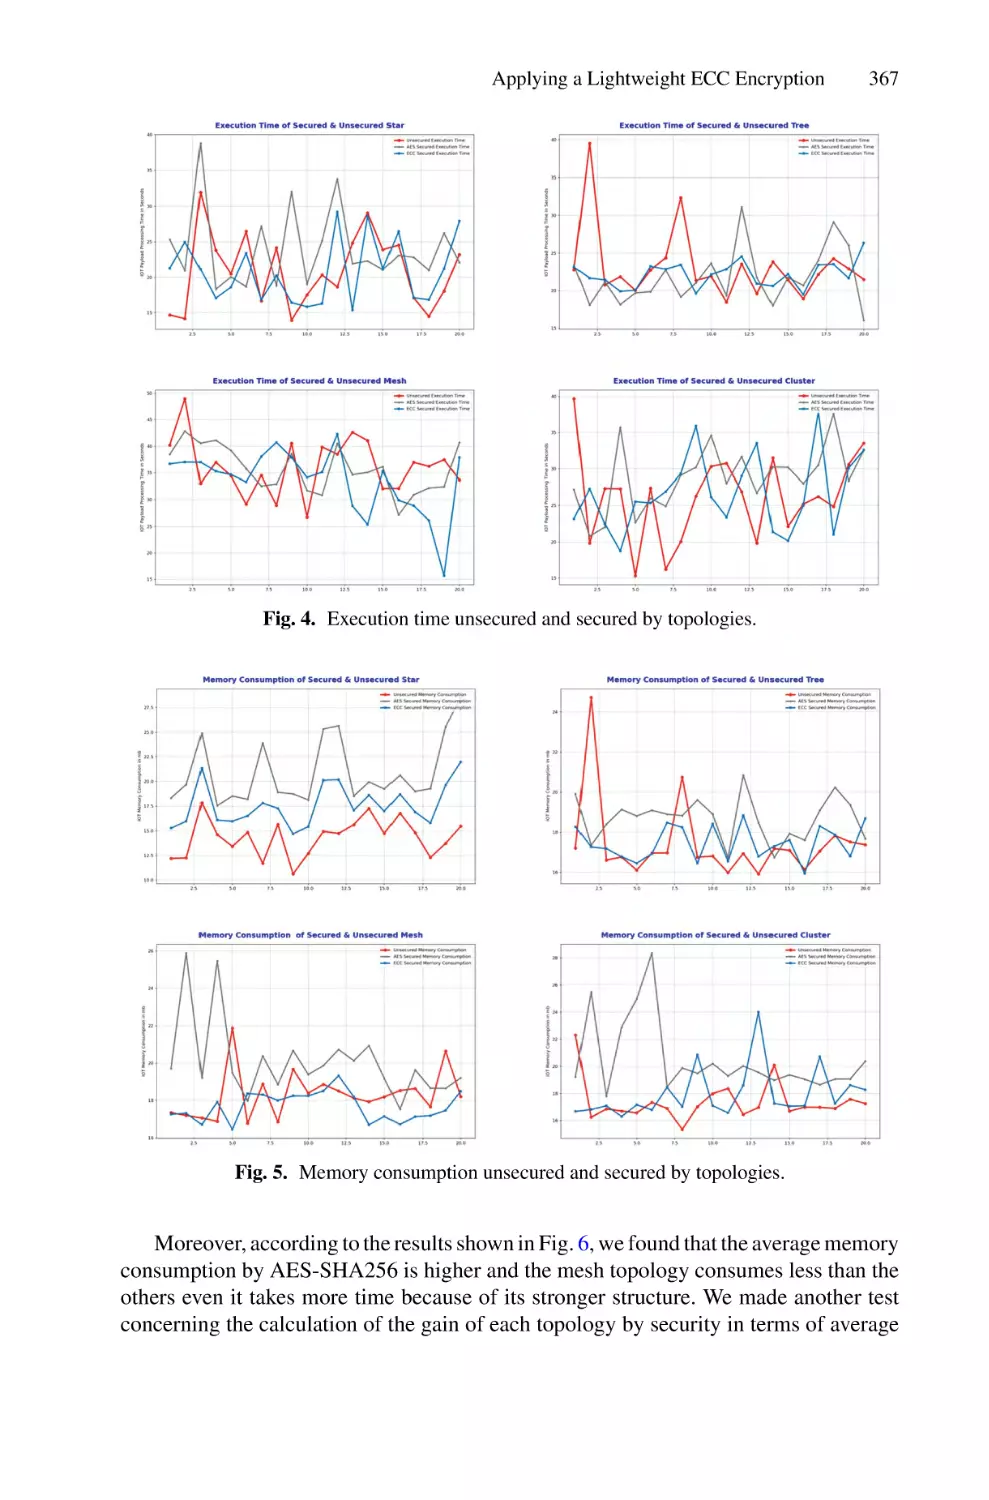
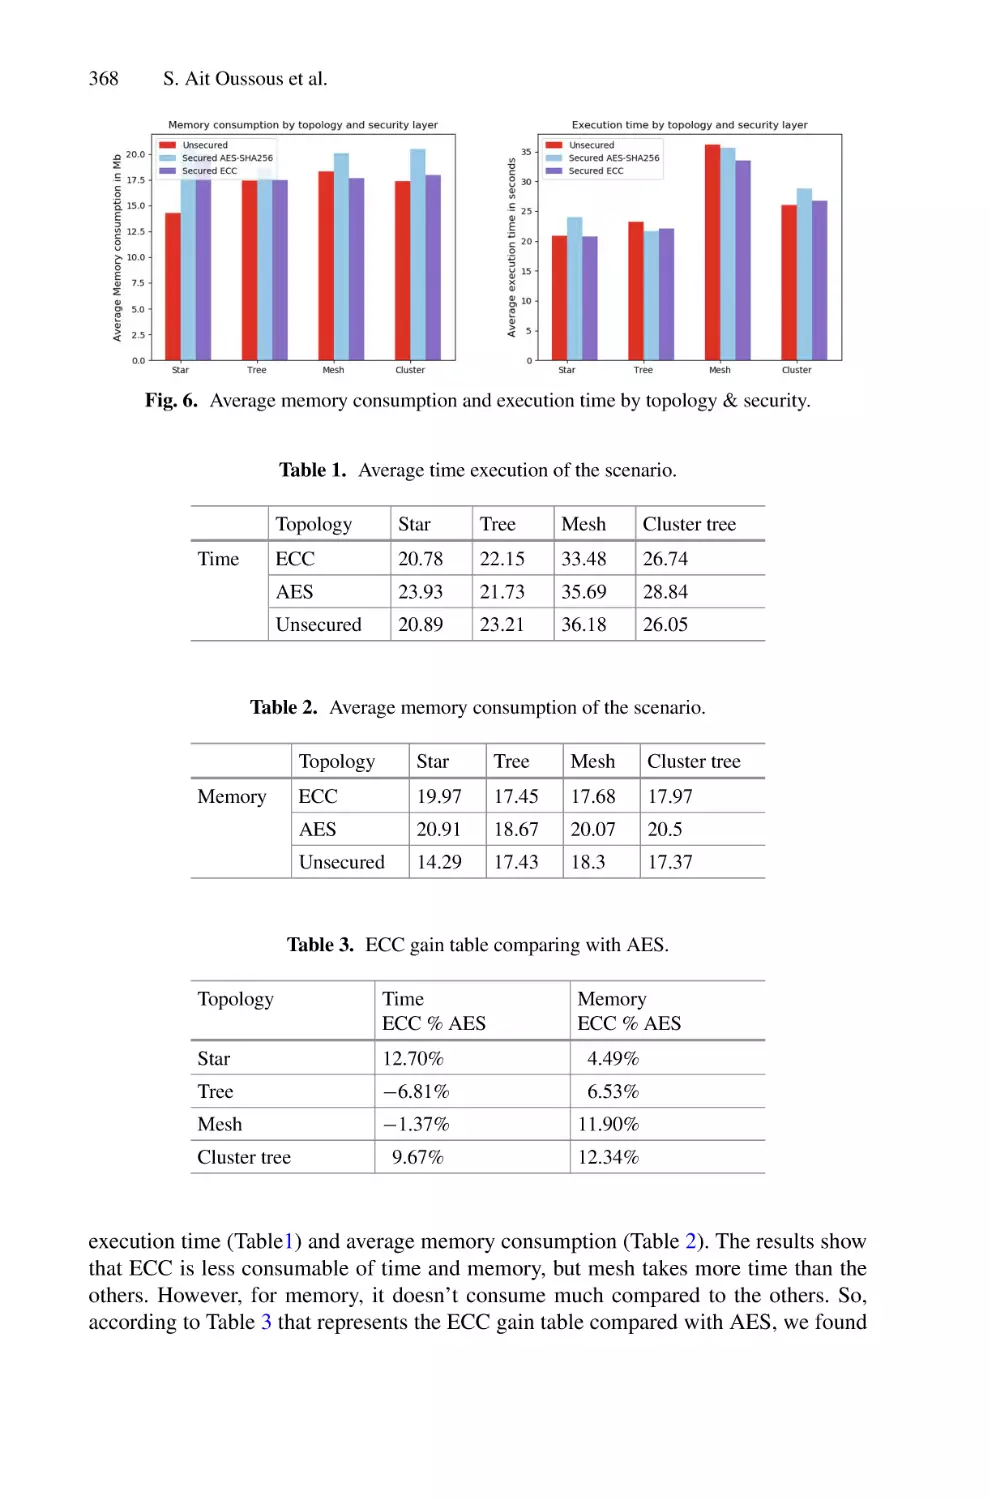
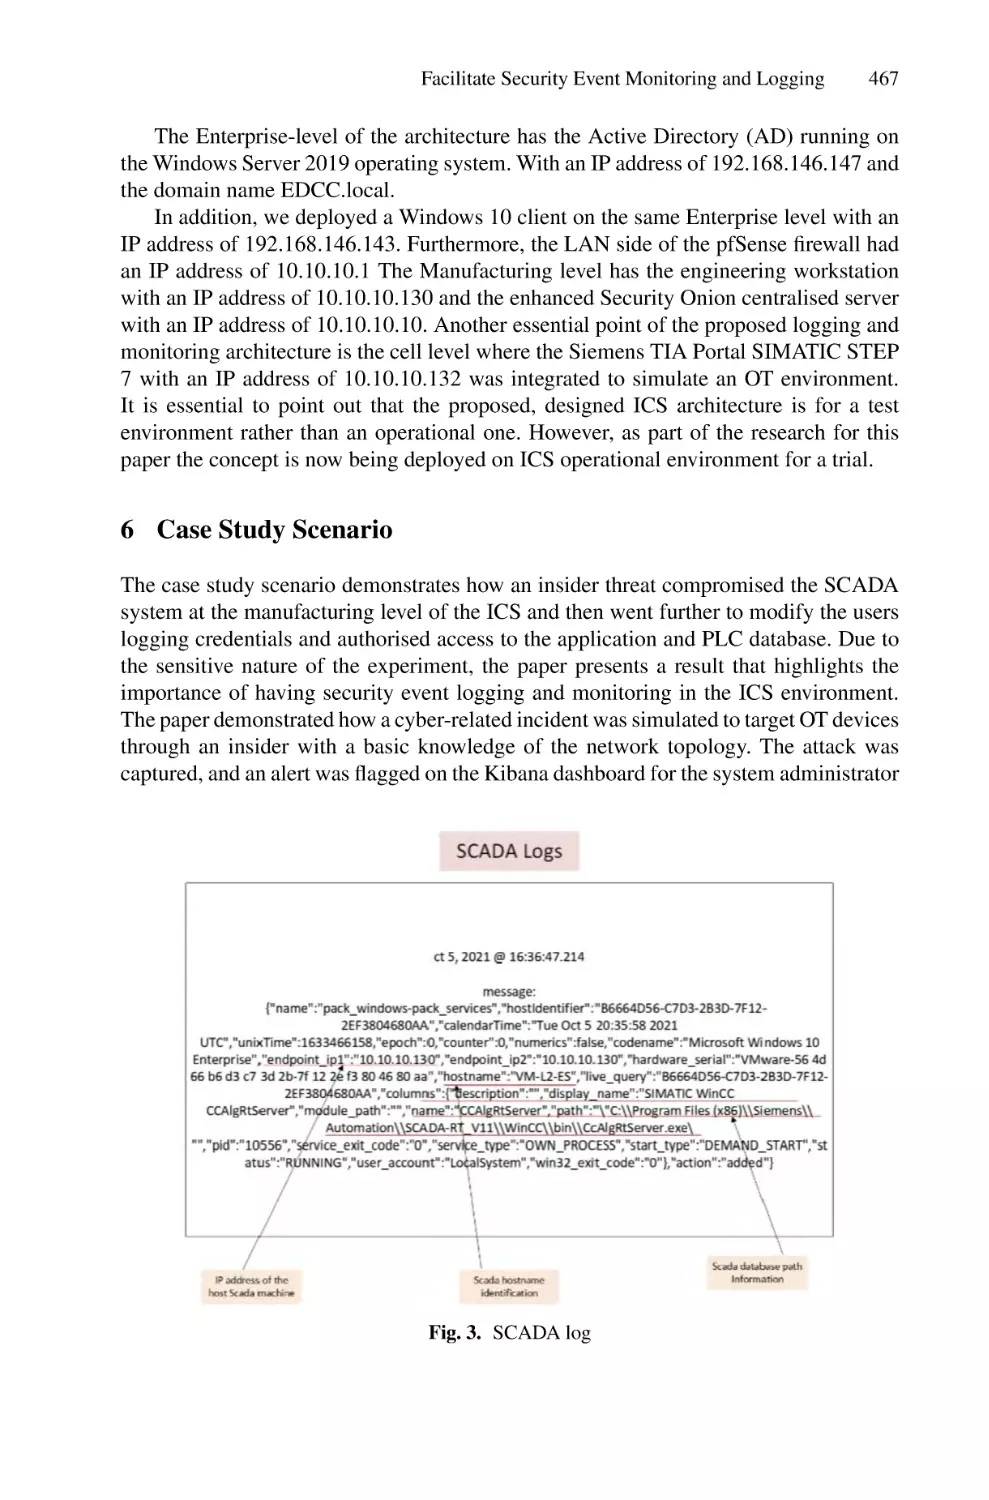
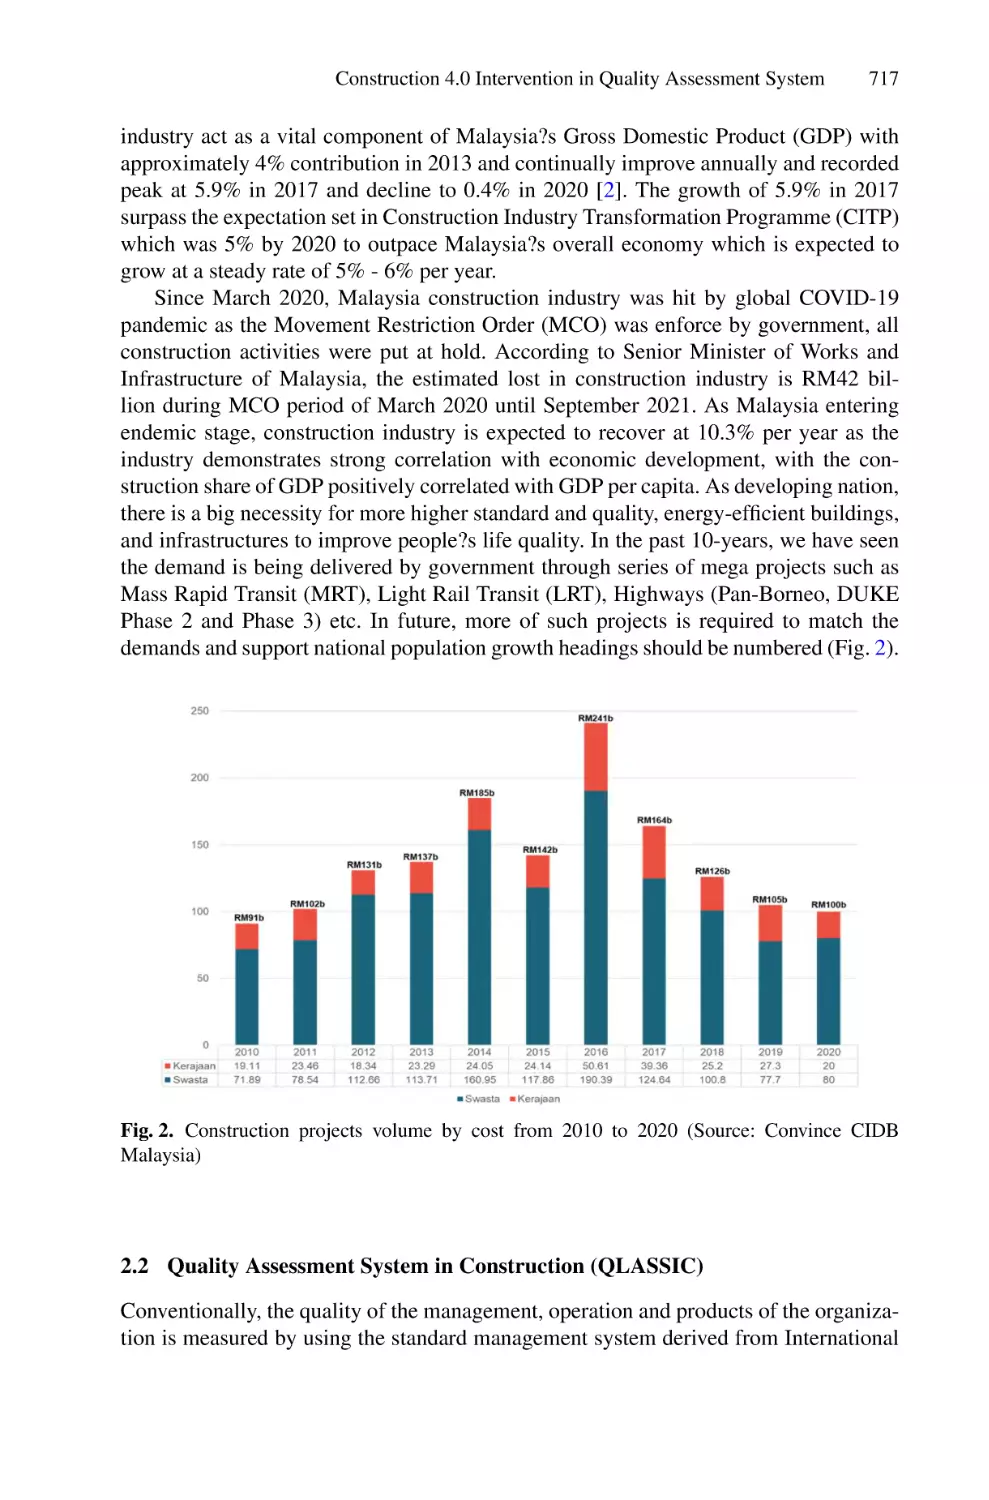
Text
Lecture Notes on Data Engineering
and Communications Technologies 127
Faisal Saeed
Fathey Mohammed
Fuad Ghaleb Editors
Advances
on Intelligent
Informatics and
Computing
Health Informatics, Intelligent
Systems, Data Science and Smart
Computing
Lecture Notes on Data Engineering
and Communications Technologies
Volume 127
Series Editor
Fatos Xhafa, Technical University of Catalonia, Barcelona, Spain
The aim of the book series is to present cutting edge engineering approaches to data
technologies and communications. It will publish latest advances on the engineering
task of building and deploying distributed, scalable and reliable data infrastructures
and communication systems.
The series will have a prominent applied focus on data technologies and
communications with aim to promote the bridging from fundamental research on
data science and networking to data engineering and communications that lead to
industry products, business knowledge and standardisation.
Indexed by SCOPUS, INSPEC, EI Compendex.
All books published in the series are submitted for consideration in Web of Science.
More information about this series at https://link.springer.com/bookseries/15362
Faisal Saeed Fathey Mohammed
Fuad Ghaleb
•
•
Editors
Advances on Intelligent
Informatics and Computing
Health Informatics, Intelligent Systems,
Data Science and Smart Computing
123
Editors
Faisal Saeed
Birmingham City University
Birmingham, UK
Fathey Mohammed
School of Computing
Universiti Utara Malaysia (UUM)
Sintok, Kedah, Malaysia
Fuad Ghaleb
Department of Computer Science,
School of Computing
Universiti Teknologi Malaysia
Skudai, Malaysia
ISSN 2367-4512
ISSN 2367-4520 (electronic)
Lecture Notes on Data Engineering and Communications Technologies
ISBN 978-3-030-98740-4
ISBN 978-3-030-98741-1 (eBook)
https://doi.org/10.1007/978-3-030-98741-1
© The Editor(s) (if applicable) and The Author(s), under exclusive license
to Springer Nature Switzerland AG 2022
This work is subject to copyright. All rights are solely and exclusively licensed by the Publisher, whether
the whole or part of the material is concerned, specifically the rights of translation, reprinting, reuse of
illustrations, recitation, broadcasting, reproduction on microfilms or in any other physical way, and
transmission or information storage and retrieval, electronic adaptation, computer software, or by similar
or dissimilar methodology now known or hereafter developed.
The use of general descriptive names, registered names, trademarks, service marks, etc. in this
publication does not imply, even in the absence of a specific statement, that such names are exempt from
the relevant protective laws and regulations and therefore free for general use.
The publisher, the authors and the editors are safe to assume that the advice and information in this
book are believed to be true and accurate at the date of publication. Neither the publisher nor the
authors or the editors give a warranty, expressed or implied, with respect to the material contained
herein or for any errors or omissions that may have been made. The publisher remains neutral with regard
to jurisdictional claims in published maps and institutional affiliations.
This Springer imprint is published by the registered company Springer Nature Switzerland AG
The registered company address is: Gewerbestrasse 11, 6330 Cham, Switzerland
Preface
We are pleased to welcome all of you to the 6th International Conference of
Reliable Information and Communication Technology 2021 (IRICT 2021) that is
held online on December 22–23, 2021. RICT 2021 is organized by the Yemeni
Scientists Research Group (YSRG), in collaboration with Behavioral Informatics
Research Group (INFOBEE) in Universiti Teknologi Malaysia (Malaysia) and
College of Engineering, IT and Environment at Charles Darwin University
(Australia). IRICT 2021 is a forum for the presentation of technological advances in
the field of information and communication technology. The main theme of the
conference is “Advances on Intelligent Informatics and Computing”.
The conference book includes 66 papers that discuss several research topics such
as health informatics, artificial intelligence, soft computing, data science, big data
analytics, Internet of Things (IoT), intelligent communication systems, cybersecurity, and information system. These papers were presented in three parallel sessions
during the two days.
We would like to express our appreciations to all authors and the keynote
speakers for sharing their expertise with us. And, we would like to thank the
organizing committee for their great efforts in managing the conference. In addition,
we would like to thank the technical committee for reviewing all the submitted
papers.
Finally, we thank all the participants of IRICT 2021 and hope to see you all
again in the next conference.
v
Organization
IRICT 2021 Organizing Committee
International Advisory Board
Abdul Samad Haji Ismail
Ahmed Yassin Al-Dubai
Ali Bastawissy
Ali Selamat
Ayoub AL-Hamadi
Eldon Y. Li
Kamal Zuhairi Zamil
Kamarulnizam Abu Bakar
Mohamed M S Nasser
Srikanta Patnaik
Universiti Teknologi Malaysia, Malaysia
Edinburgh Napier University, UK
Cairo University, Egypt
Universiti Teknologi Malaysia, Malaysia
Otto-von-Guericke University Magdeburg,
Germany
National Chengchi University (NCCU), Taiwan
Universiti Malaysia Pahang, Malaysia
Universiti Teknologi Malaysia, Malaysia
Qatar University, Qatar
SOA University, Bhubaneswar, India
Conference General Chair
Faisal Saeed (President)
Yemeni Scientists Research Group (YSRG)
Program Committee Chair
Fathey Mohammed
Universiti Utara Malaysia (UUM), Malaysia
General Secretary
Nadhmi Gazem
Taibah University, Kingdom of Saudi Arabia
vii
viii
Organization
Technical Committee Chair
Faisal Saeed
Tawfik Al-Hadhrami
Mamoun Alazab
Taibah University, Kingdom of Saudi Arabia
Nottingham Trent University, UK
Charles Darwin University, Australia
Publications Committee
Fathey Mohammed
Fuad A. Ghaleb
Abdulaziz Al-Nahari
Universiti Utara Malaysia
University Teknologi Malaysia, Malaysia
Unitar, International University, Malaysia
Publicity Committee
Wahid Al-Twaiti (Chair)
Maged Nasser
Mohammed Omar Awadh
Al-Shatari
Ali Ahmed Ali Salem
Universiti Tun Hussein Onn Malaysia
Universiti Teknologi Malaysia
Universiti Teknologi Petronas
Universiti Tun Hussein Onn Malaysia
IT & Multimedia Committee
Sameer Hasan Albakri
(Chair)
Mohammed Alsarem
Amer Alsaket
Sana’a University, Yemen
Taibah University, KSA
Sitecore, Malaysia
Treasure Registration Committee Chair
Abdullah Aysh Dahawi
Universiti Teknologi Malaysia
International Technical Committee
Abdelhamid Emara
Abdelrahman Elsharif Karrar
Abdulmajid Aldaba
Abdulrahman A Alsewari
Abdulrahman Alqarafi
Abdulwahab Almazroi
Adel Ammar
Ahmad Alzu'Bi
Ahmed Awad
Ahmed Rakha
Aisyah Ibrahim
Akram Osman
Alaa Alomoush
Ali Nasser
Ammar Alqadasi
Amr Tolba
Ashraf Osman
Bakr Salim Ba-Quttayyan
Bouchaib Cherradi
Badiea Abdulkarem Mohammed
Al-Shaibani
Ghassan Aldharhani
Heider Wahsheh
Hiba Zuhair
Organization
Fadi Herzallah
Faisal Saeed
Fathey Mohammed
Funminiyi Olajide
Hakeem Flayyih
Hany Harb
Hussien Abualrejal
Ibrahim Fadhel
Ibrahim Mahgoub
Jawad Alkhateeb
Kamal Alhendawi
Kamal Karkonasasi
Khairul Shafee Kalid
Khalil Almekhlafi
Lamia Berriche
Maged Rfeqallah
Maha Idriss
Manal A.Areqi
Masud Hasan
Mohamamed A. Al-Sharafi
Mohamed Abdel Fattah
Mohamed Elhamahmy
Mohammed A. Hajar
Mohammed Al Sarem
ix
Mohammed Azrag
Mounira Kezadri Hamiaz
Nadhmi Gazem
Nejood Hashim Al-Walidi
Noor Suhana Sulaiman
Nouf Alharbi
Osama Sayaydeh
Othman Asiry
Qasim Alajmi
Rashiq Marie
Rayan Alanazi
Safa Ben Atitallah
Salisu Garba
Siwar Rekik
Tariq Saeed
Tawfik Al-Hadhrami
Wadii Boulila
Waleed Abdulmaged Hammood
Waseem Alromimah
Yogan Jaya Kumar
Yousef Fazea
Yousif Aftan Abdullah
Zahid Khan
Zeyad Ghaleb Al-Mekhlafi
Contents
Artificial Intelligence
Automatic Saudi Arabian License Plate Detection and Recognition
Using Deep Convolutional Neural Networks . . . . . . . . . . . . . . . . . . . . .
Maha Driss, Iman Almomani, Rahaf Al-Suhaimi, and Hanan Al-Harbi
Ship Detection Approach Using Machine Learning Algorithms . . . . . . .
Abdirahman Osman Hashi, Ibrahim Hassan Hussein,
Octavio Ernesto Romo Rodriguez, Abdullahi Ahmed Abdirahman,
and Mohamed Abdirahman Elmi
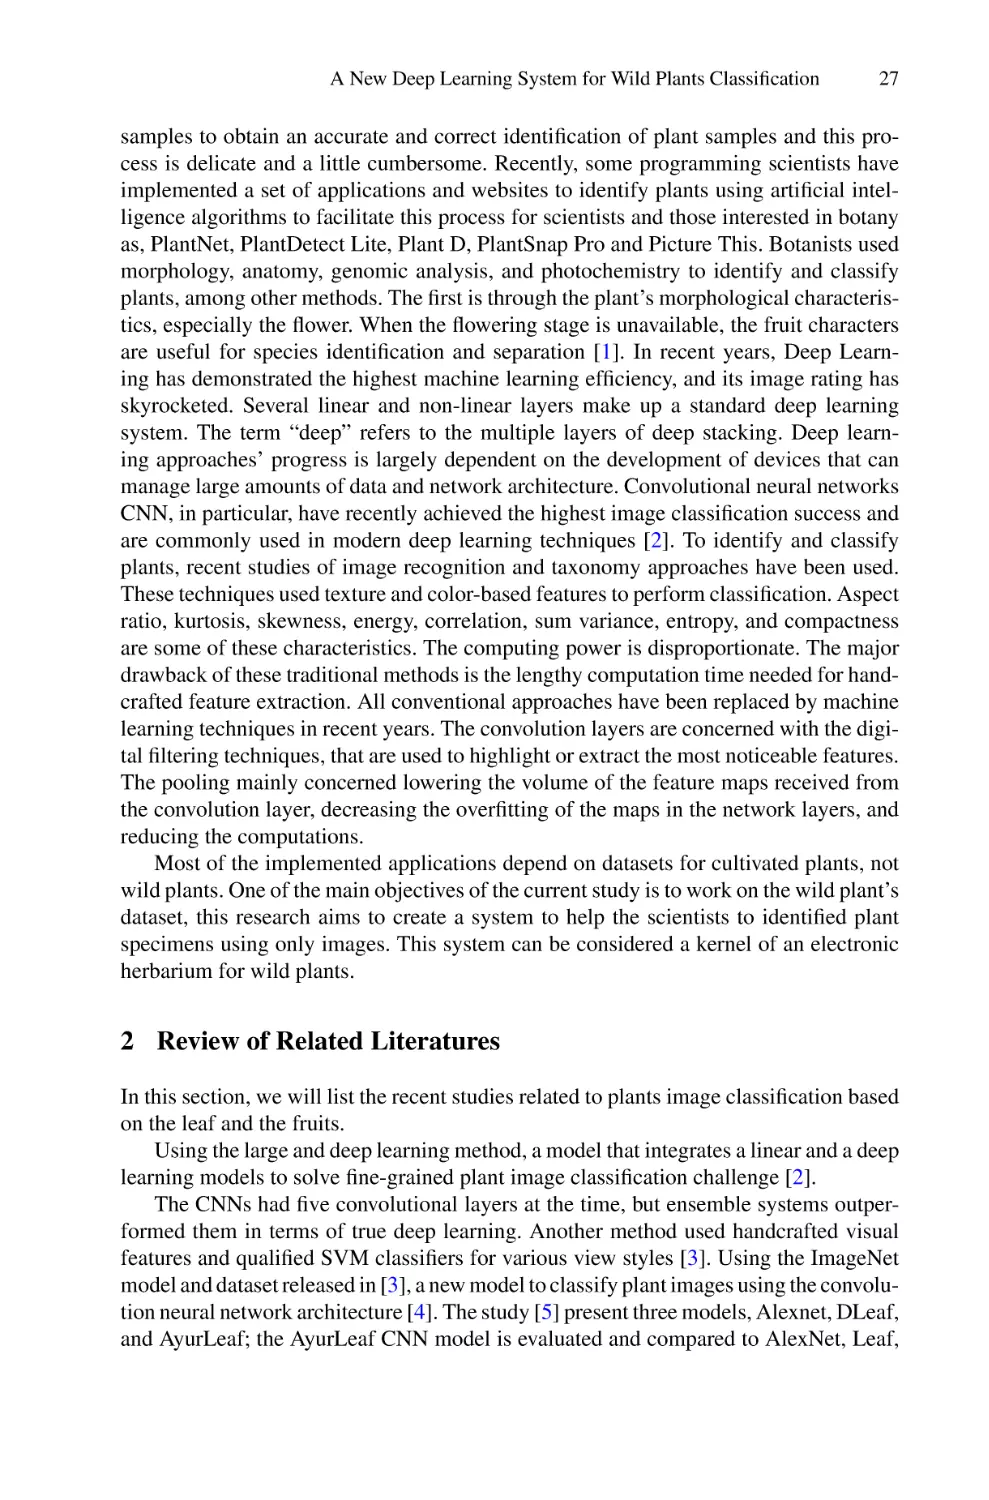
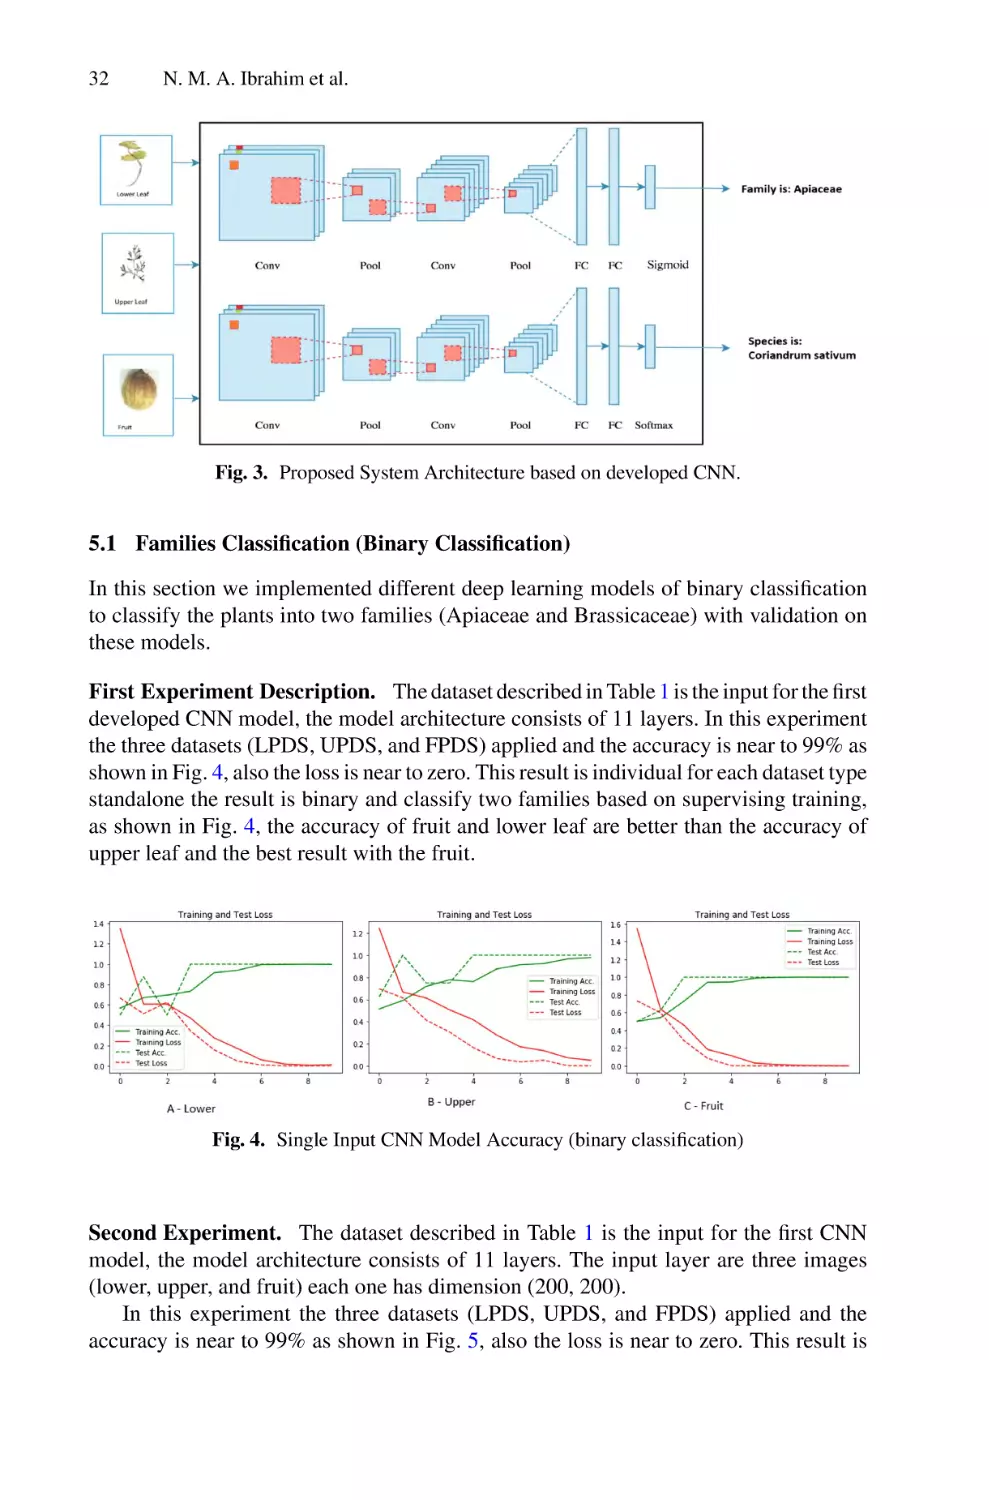
A New Deep Learning System for Wild Plants Classification and
Species Identification: Using Leaves and Fruits . . . . . . . . . . . . . . . . . . .
Nehad M. Abdulrahman Ibrahim, Dalia Goda Gabr,
and Abdel-Hamid M. Emara
A Novel Weighted Fractional TDGM Model and Quantum Particle
Swarm Optimization Algorithm for Carbon Dioxide
Emissions Forecasting . . . . . . . . . . . . . . . . . . . . . . . . . . . . . . . . . . . . . .
Ani Shabri
Text Detergent: The Systematic Combination of Text Pre-processing
Techniques for Social Media Sentiment Analysis . . . . . . . . . . . . . . . . . .
Ummu Hani’ Hair Zaki, Roliana Ibrahim, Shahliza Abd Halim,
and Izyan Izzati Kamsani
3
16
26
38
50
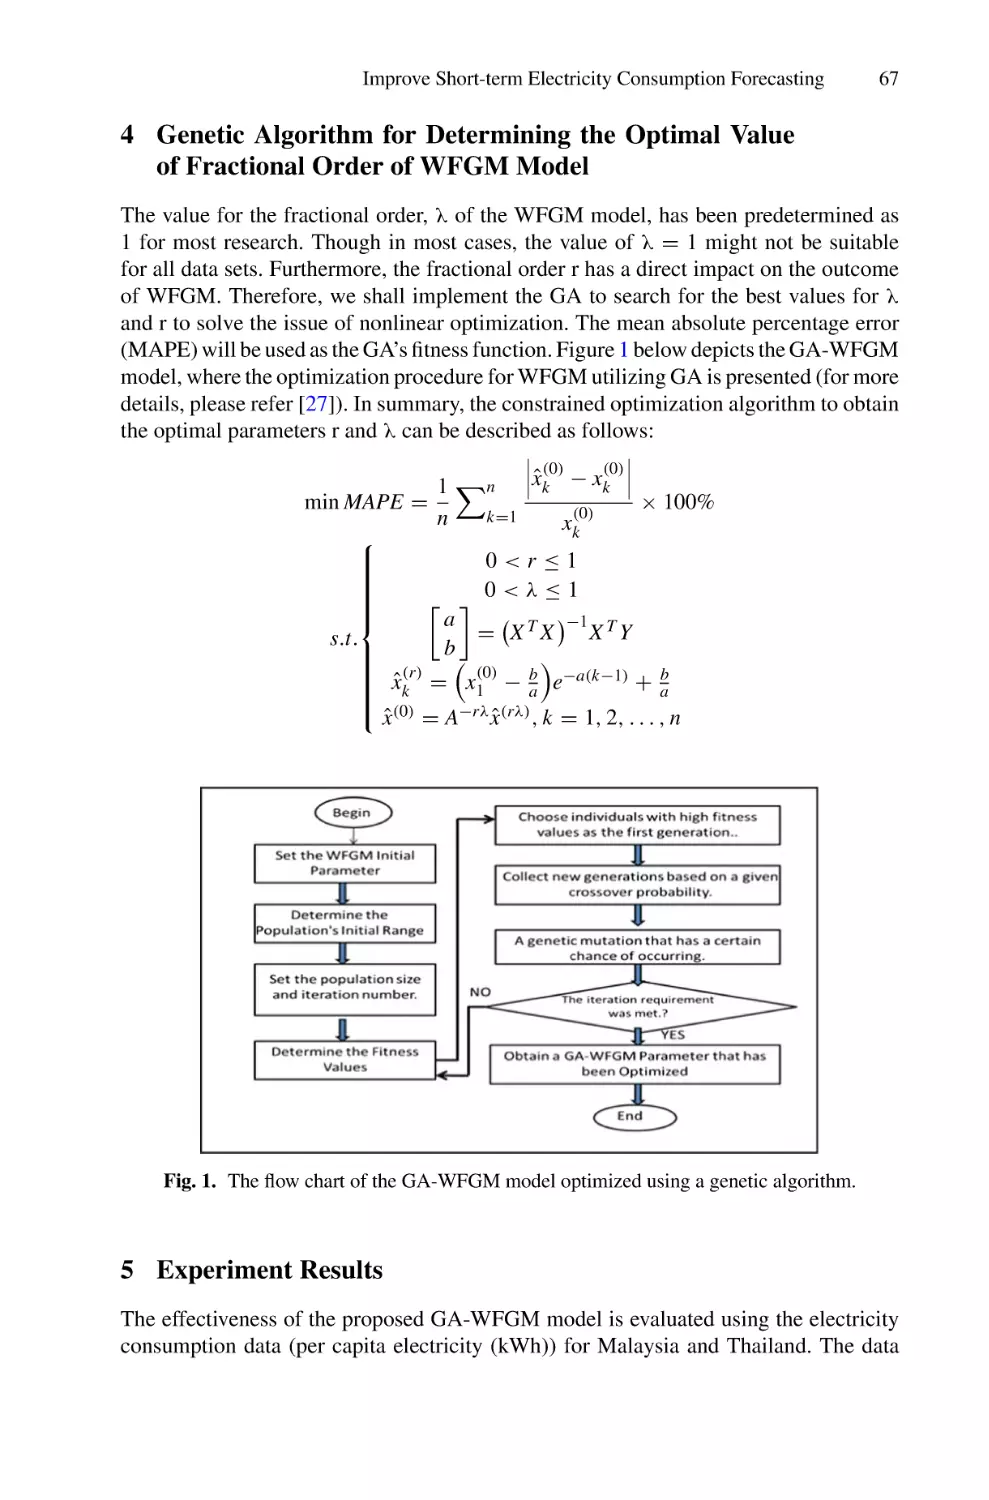
Improve Short-term Electricity Consumption Forecasting Using
a GA-Based Weighted Fractional Grey Model . . . . . . . . . . . . . . . . . . . .
Ani Shabri, Ruhaidah Samsudin, and Waseem Alromema
62
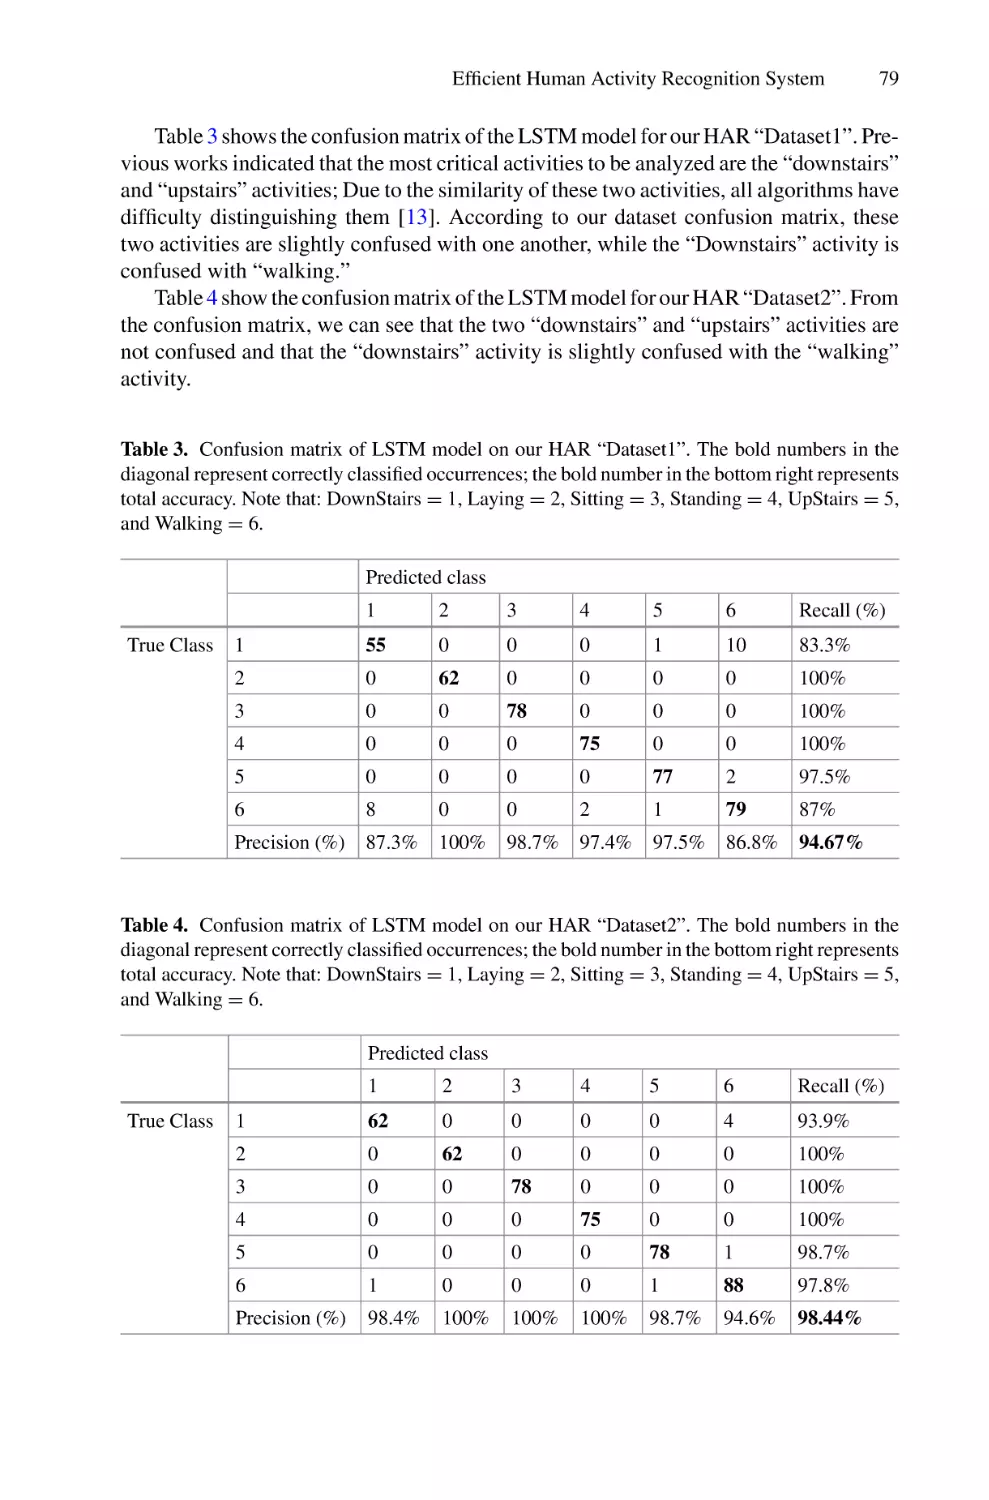
Efficient Human Activity Recognition System Using Long Short-Term
Memory . . . . . . . . . . . . . . . . . . . . . . . . . . . . . . . . . . . . . . . . . . . . . . . . .
Athraa Almusawi and Ali H. Ali
73
xi
xii
Contents
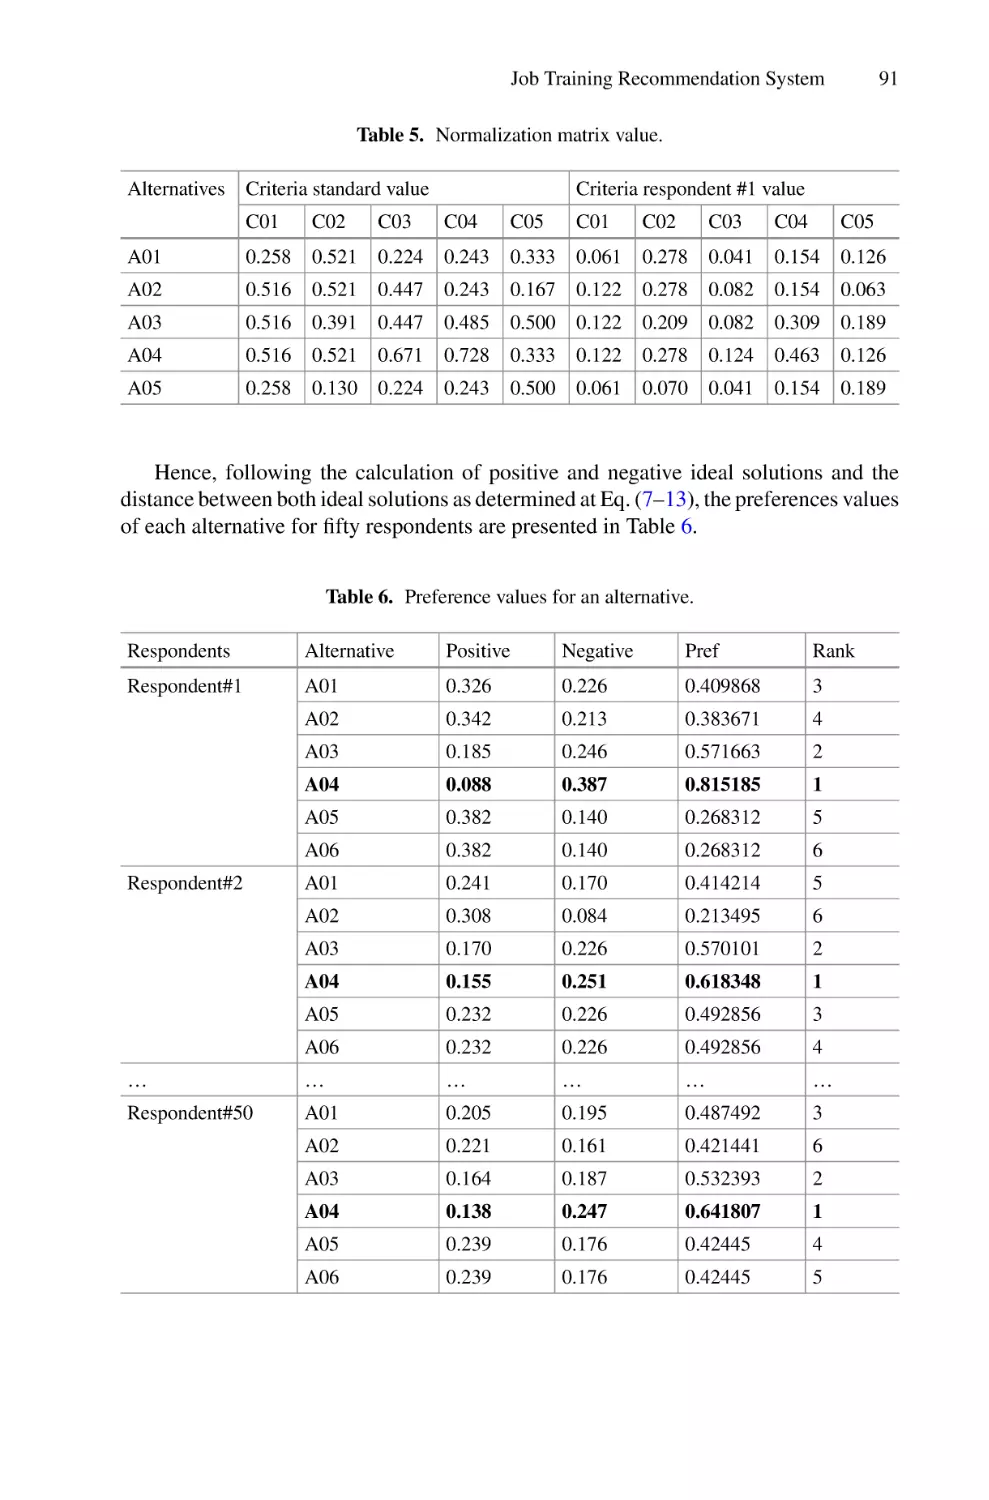
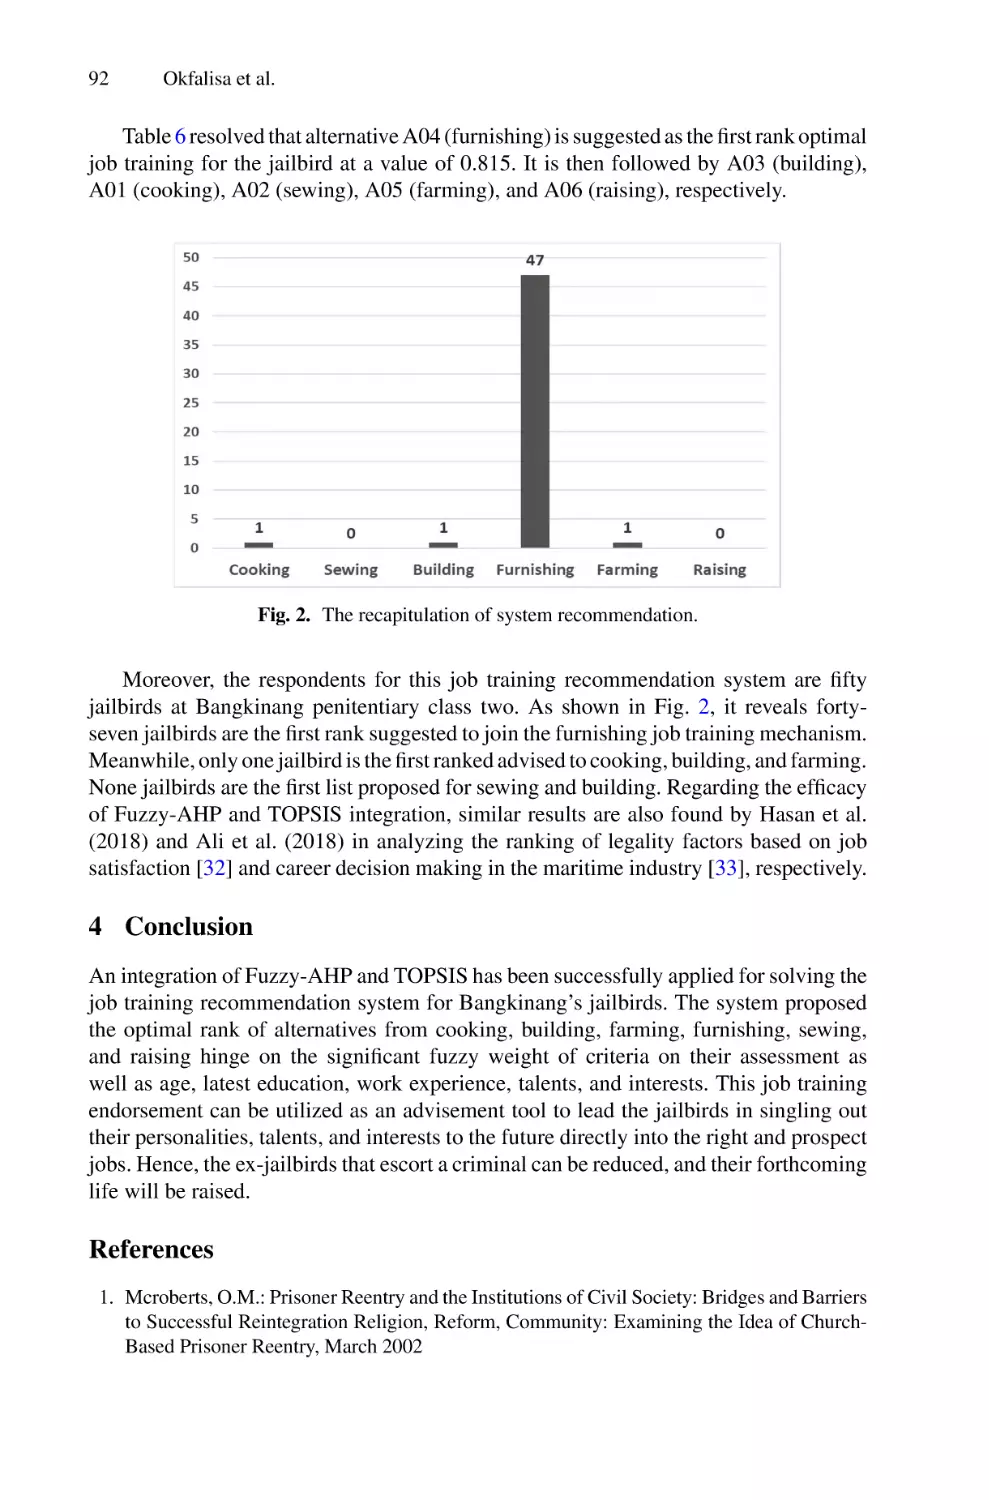
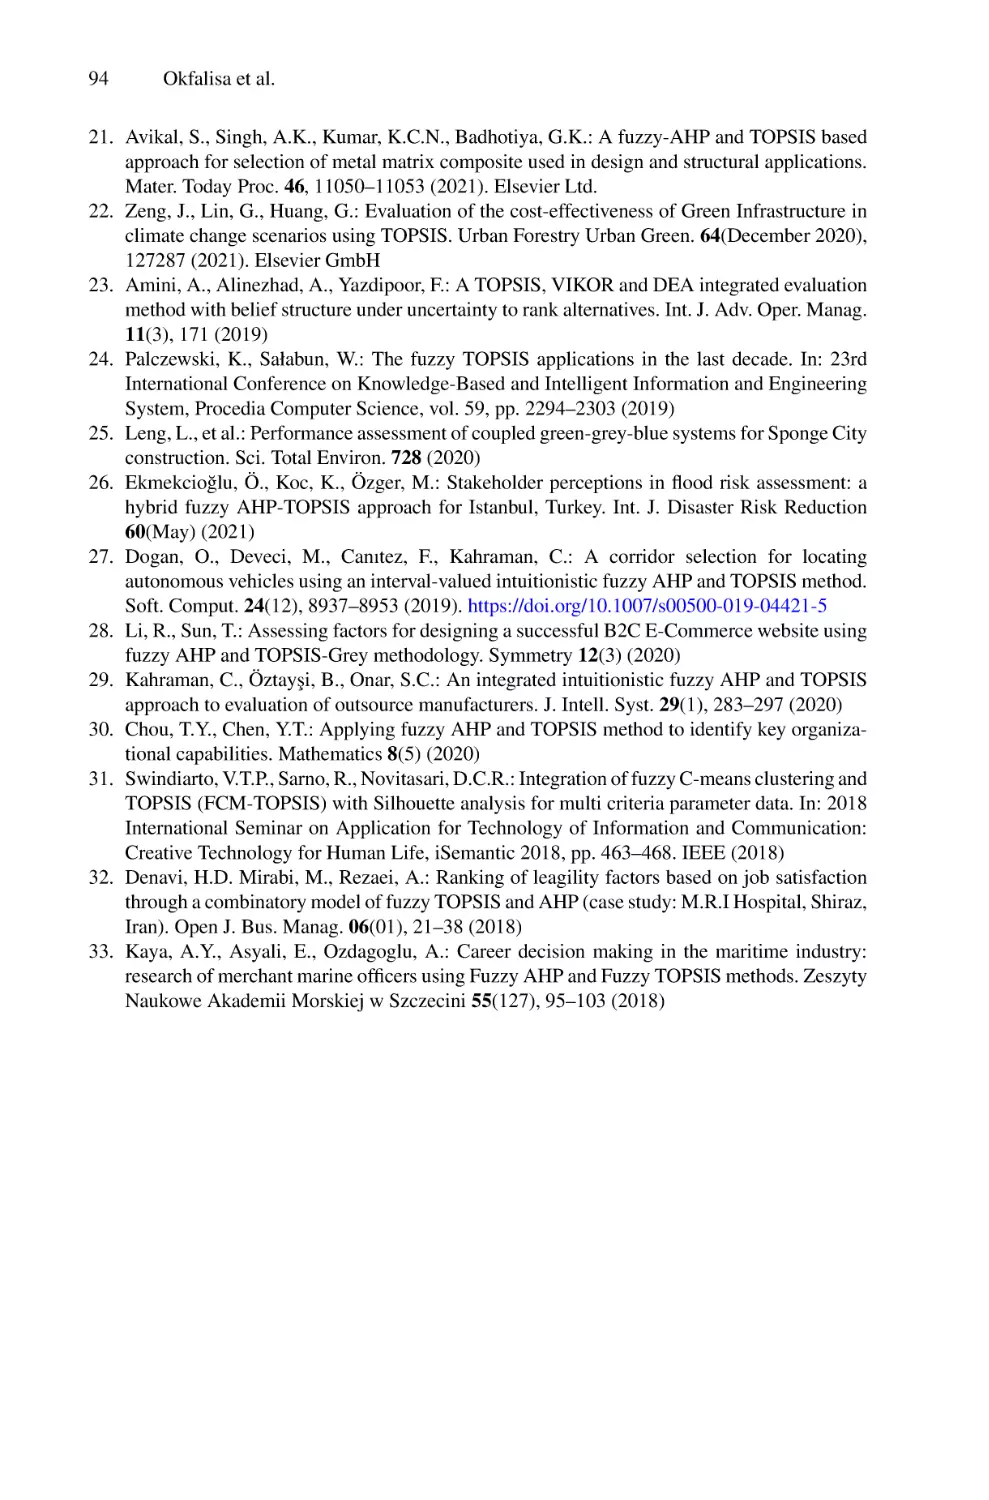
Job Training Recommendation System: Integrated Fuzzy AHP
and TOPSIS Approach . . . . . . . . . . . . . . . . . . . . . . . . . . . . . . . . . . . . .
Okfalisa, Rizal Siburian, Yelfi Vitriani, Hidayati Rusnedy, Saktioto,
and Melfa Yola
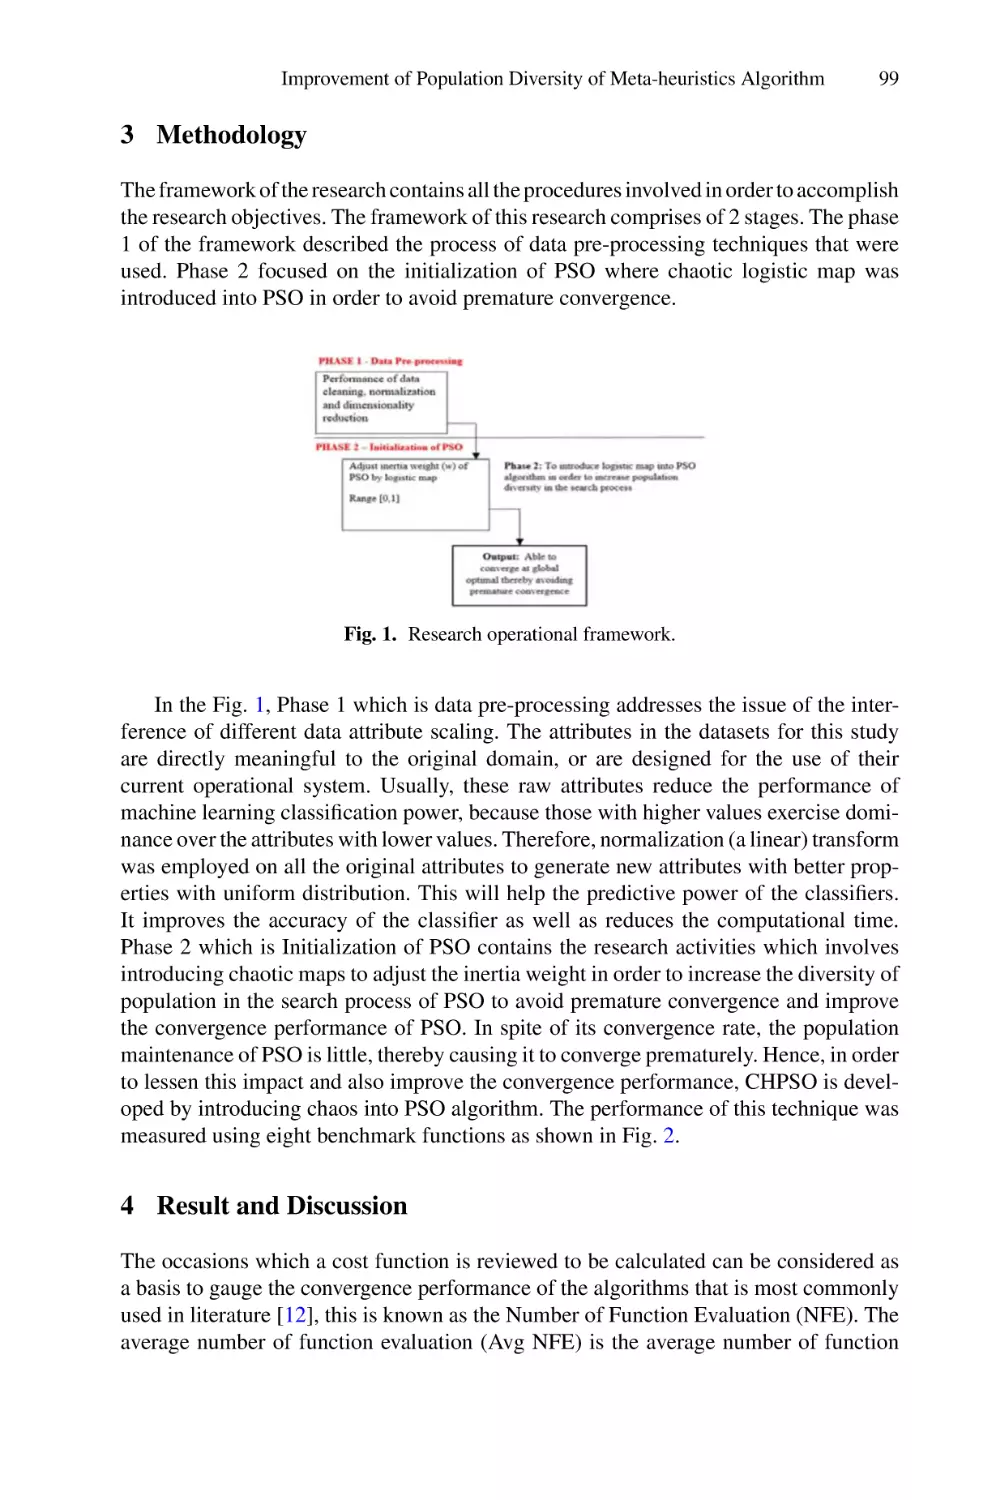
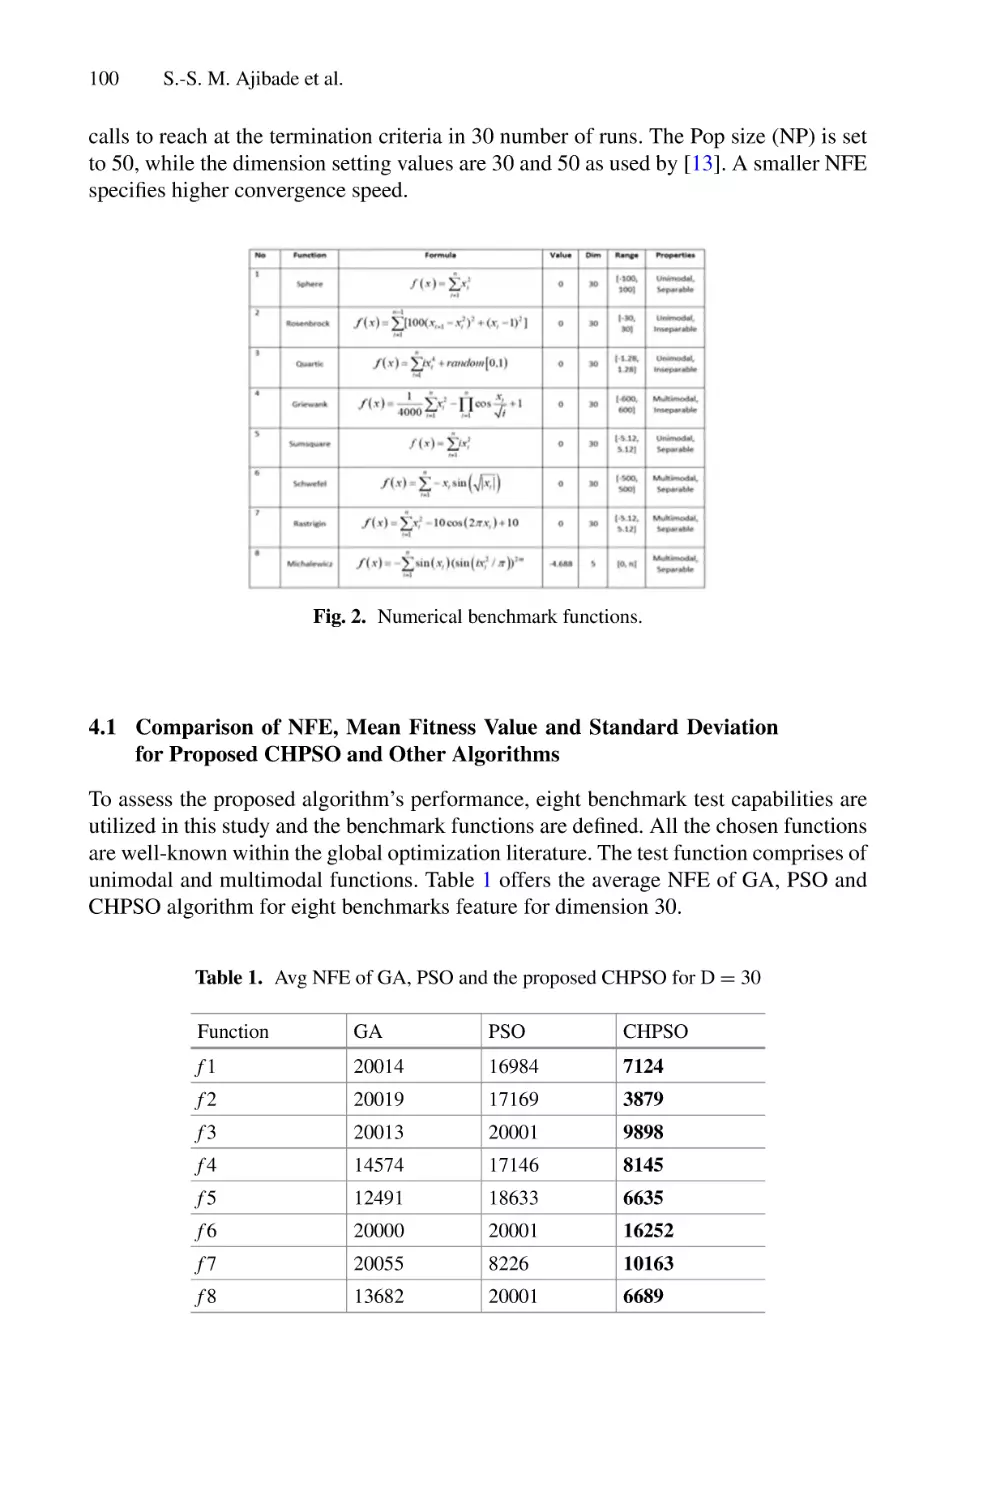
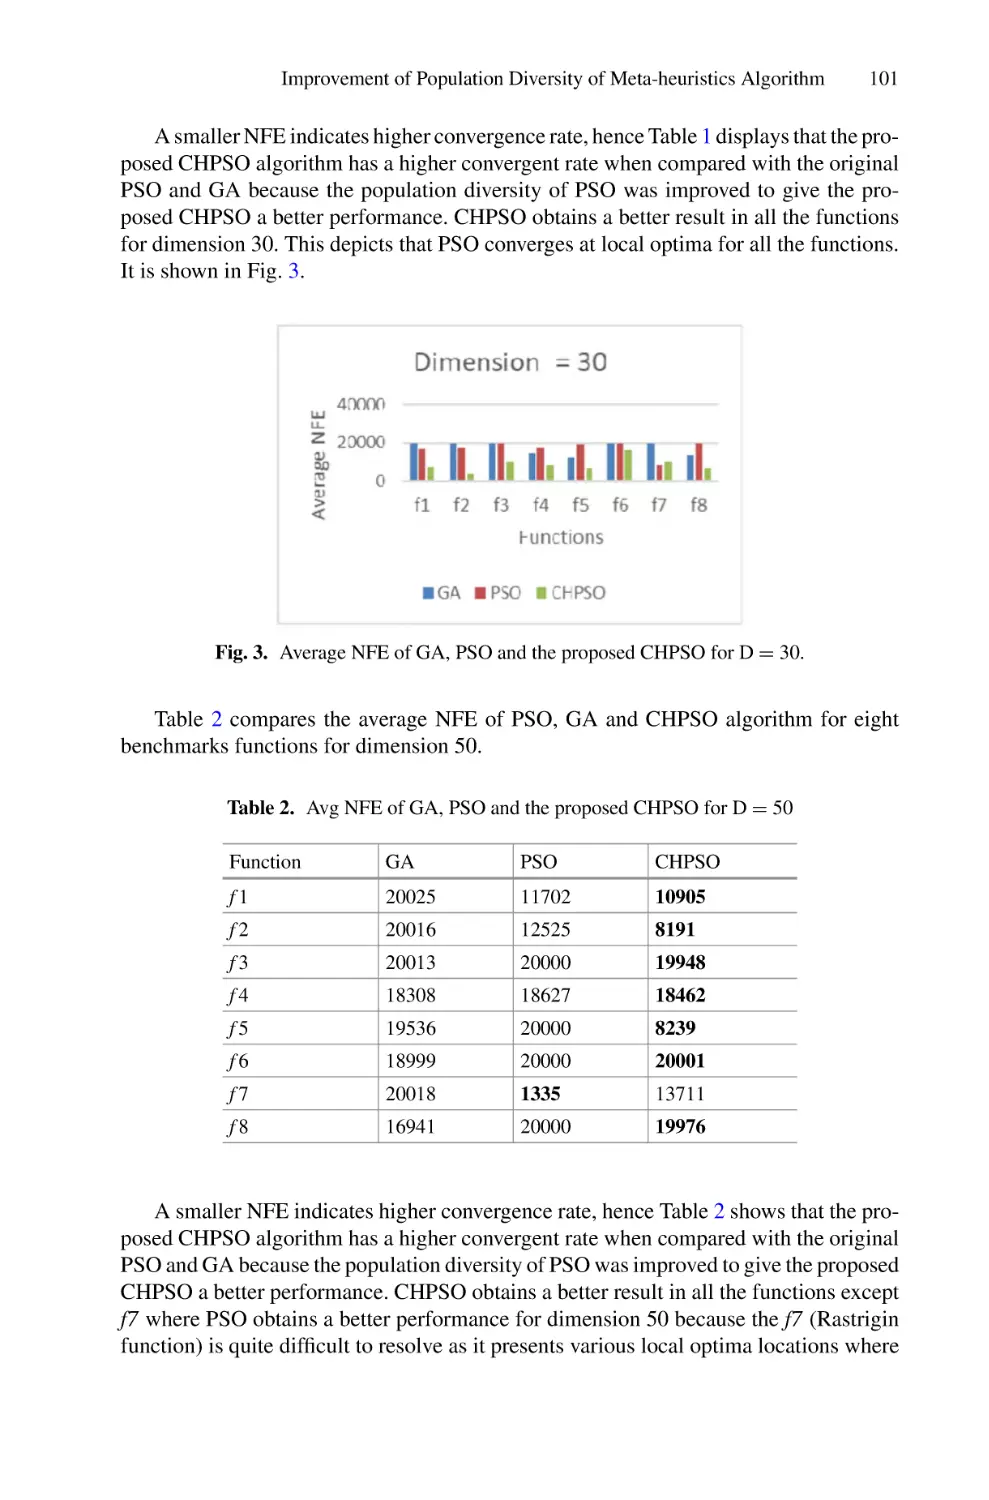
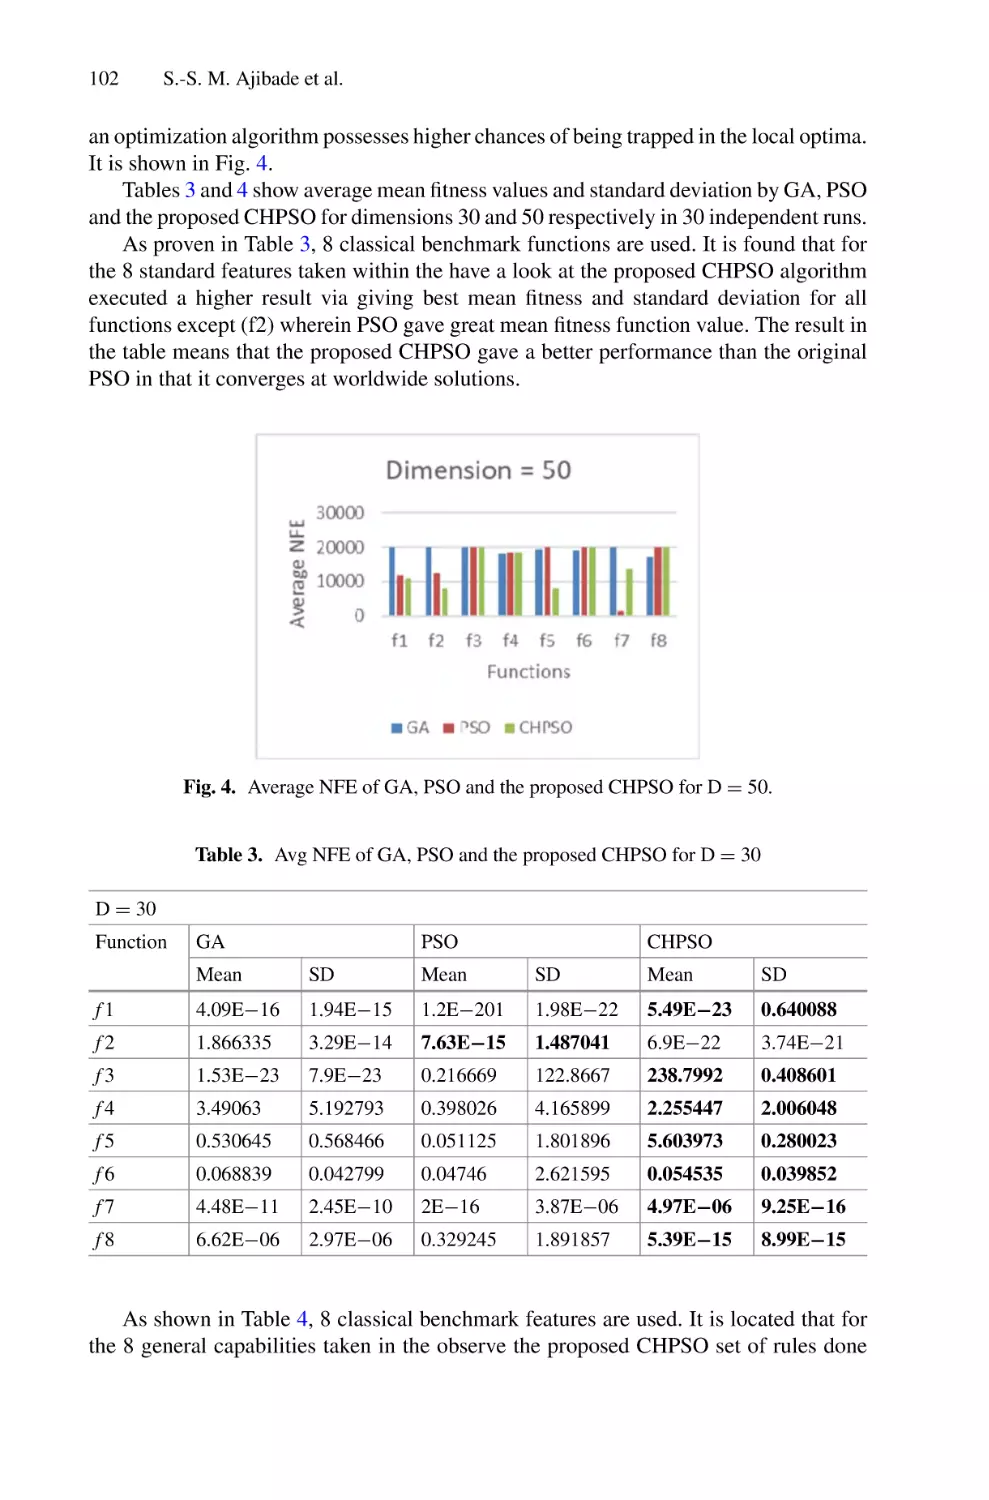
Improvement of Population Diversity of Meta-heuristics Algorithm
Using Chaotic Map . . . . . . . . . . . . . . . . . . . . . . . . . . . . . . . . . . . . . . . .
Samuel-Soma M. Ajibade, Mary O. Ogunbolu, Ruth Chweya,
and Samuel Fadipe
84
95
Adaptive and Global Approaches Based Feature Selection
for Large-Scale Hierarchical Text Classification . . . . . . . . . . . . . . . . . . 105
Abubakar Ado, Mustafa Mat Deris, Noor Azah Samsudin,
and Abdurra’uf Garba Sharifai
Ensemble Method for Online Sentiment Classification Using Drift
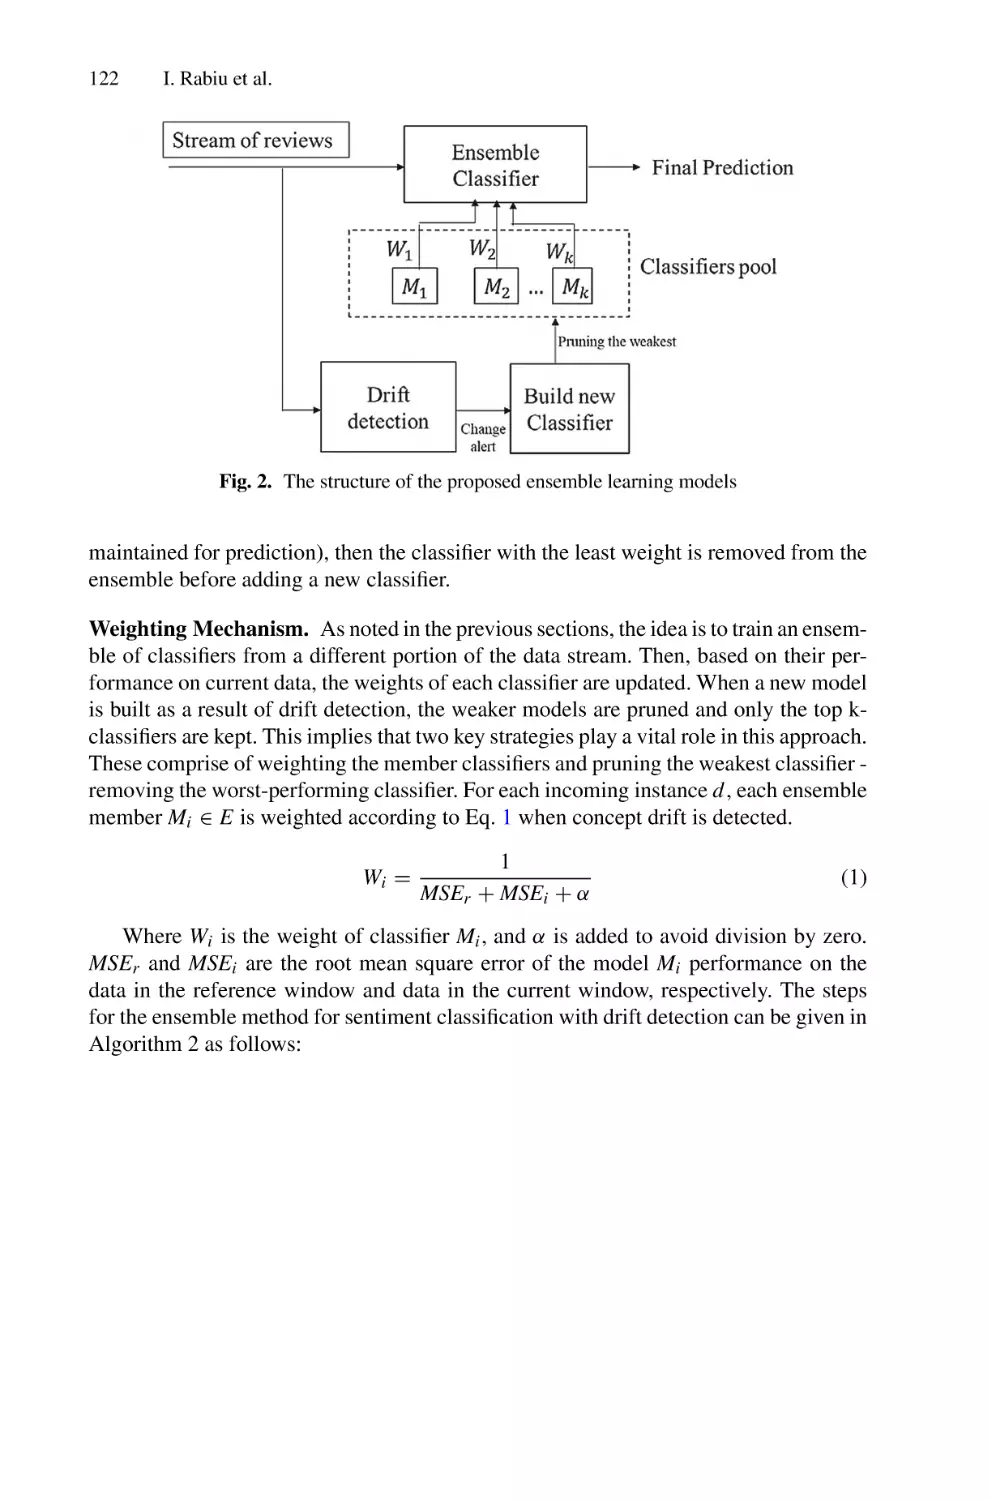
Detection-Based Adaptive Window Method . . . . . . . . . . . . . . . . . . . . . . 117
Idris Rabiu, Naomie Salim, Maged Nasser, Faisal Saeed,
Waseem Alromema, Aisha Awal, Elijah Joseph, and Amit Mishra
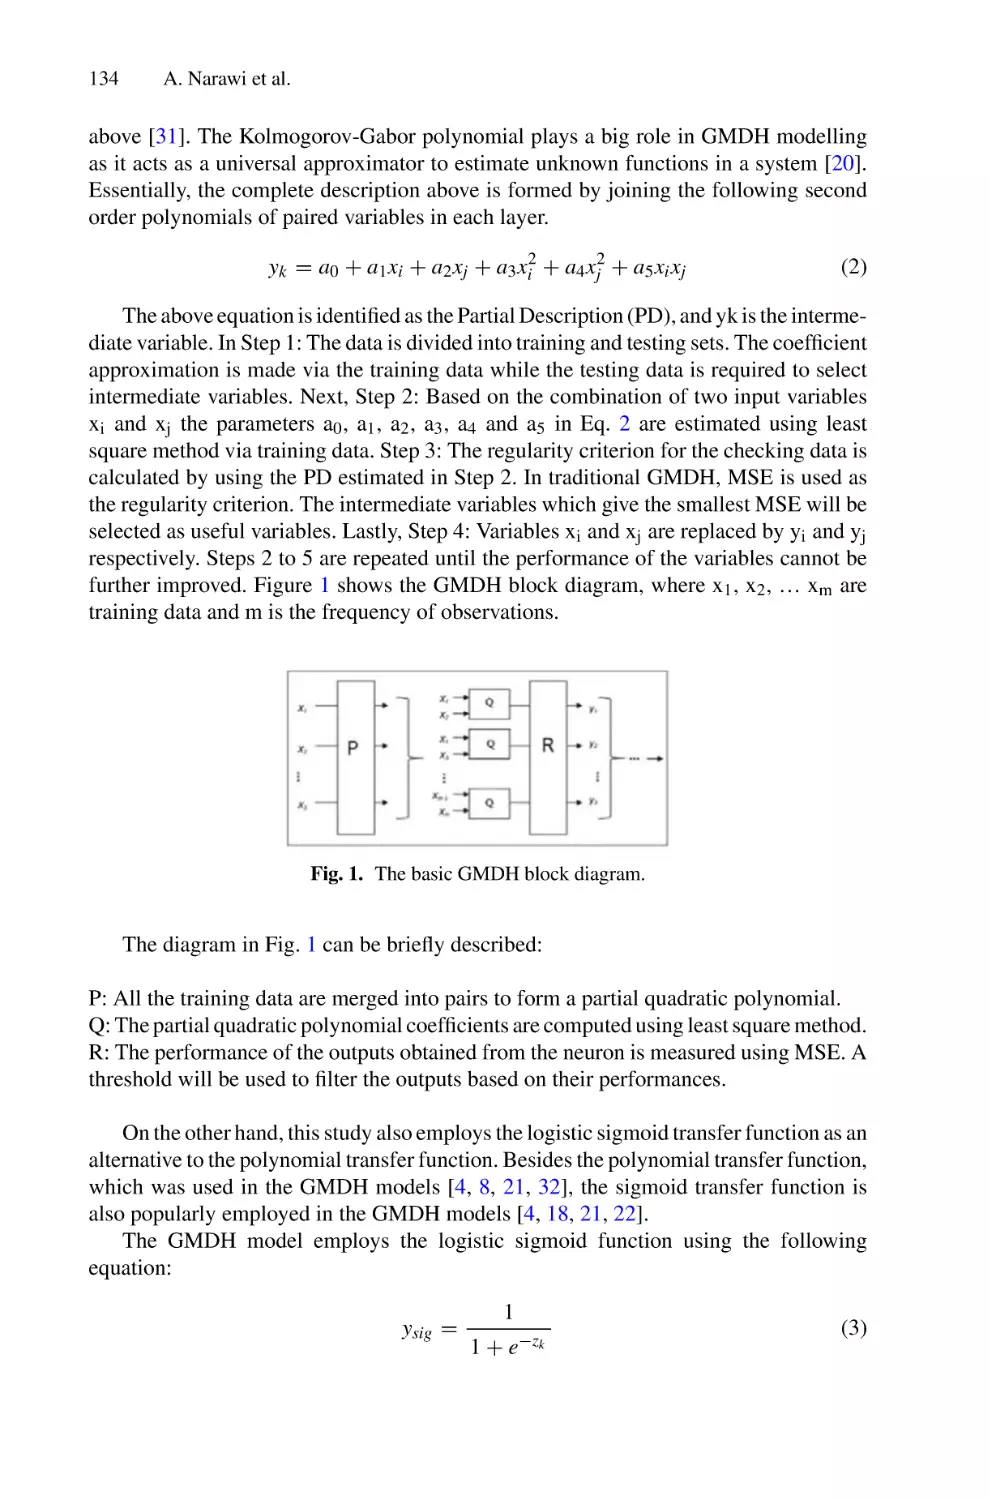
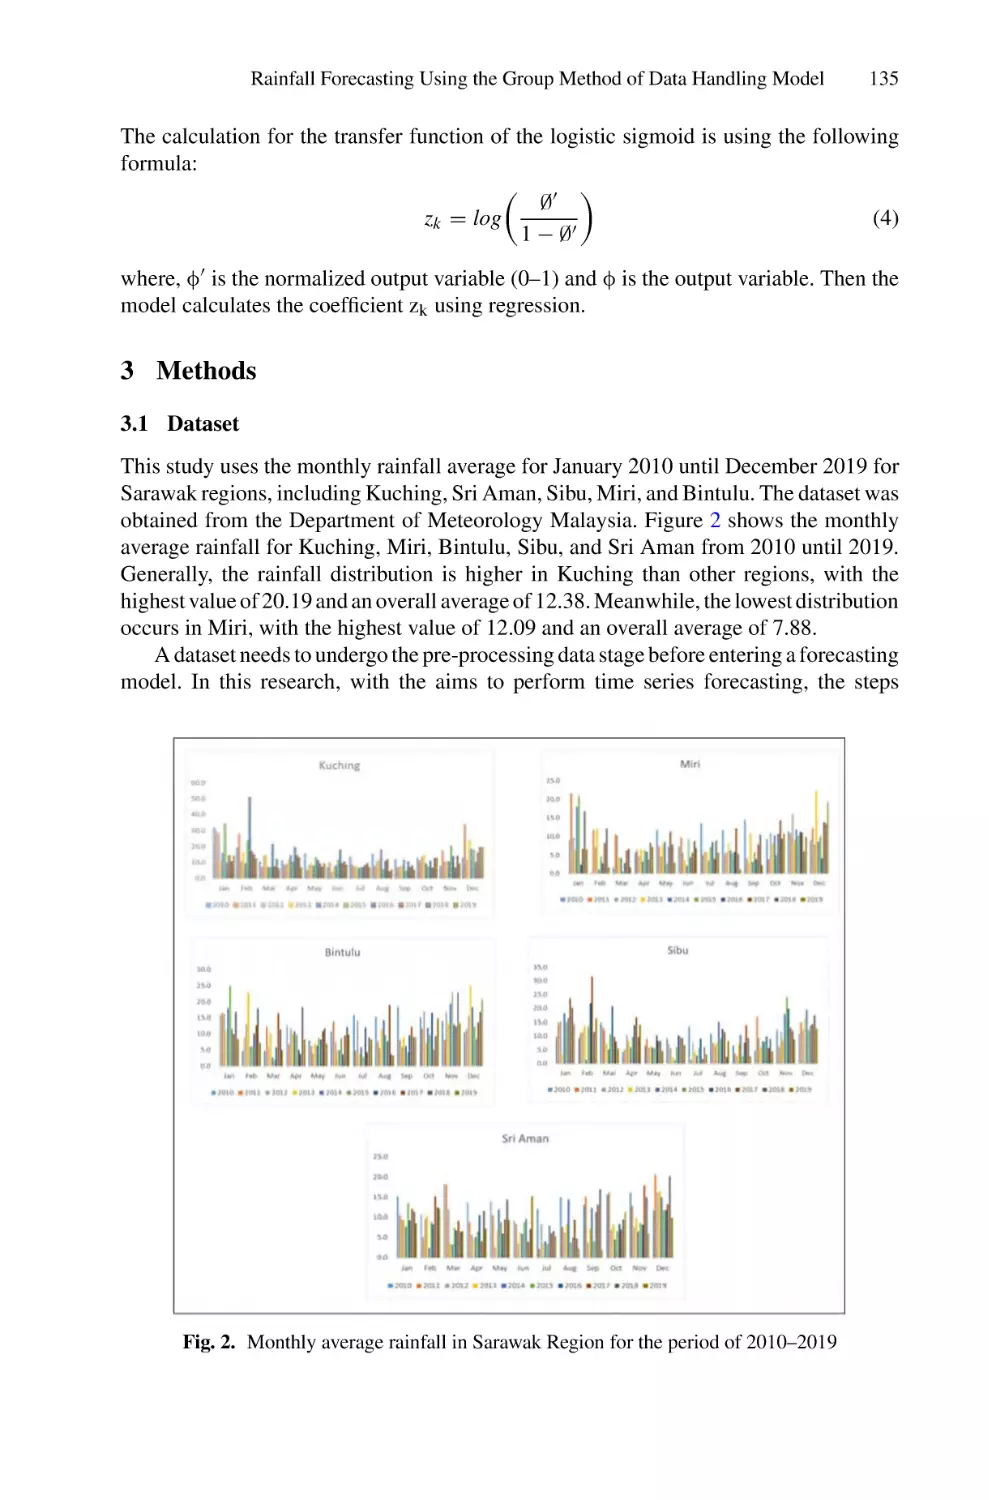
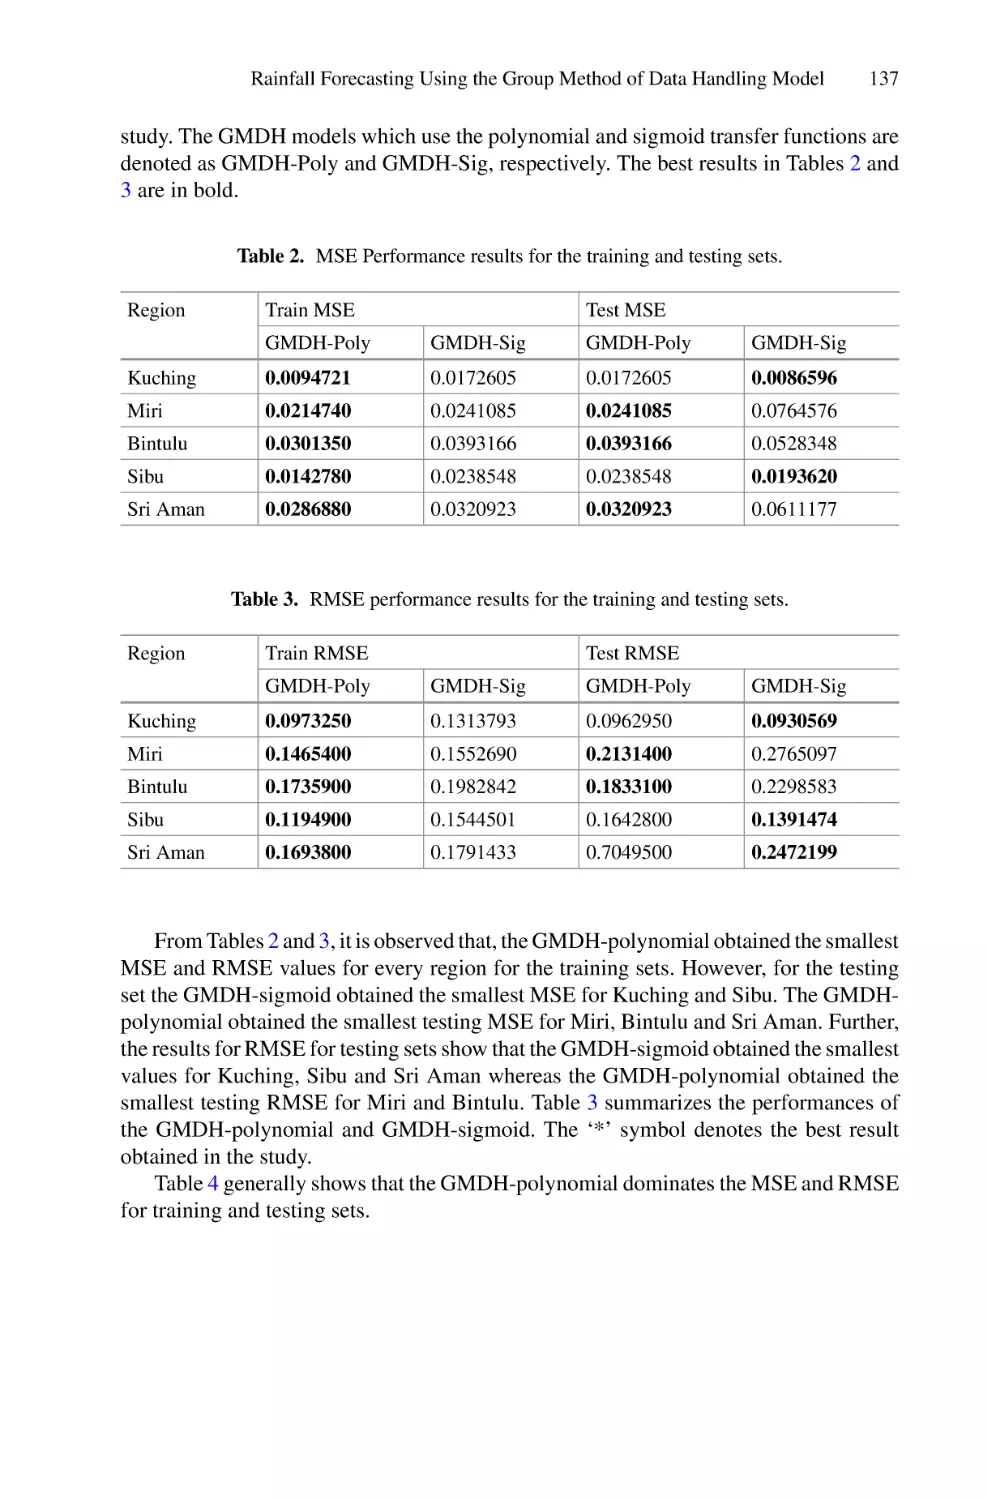
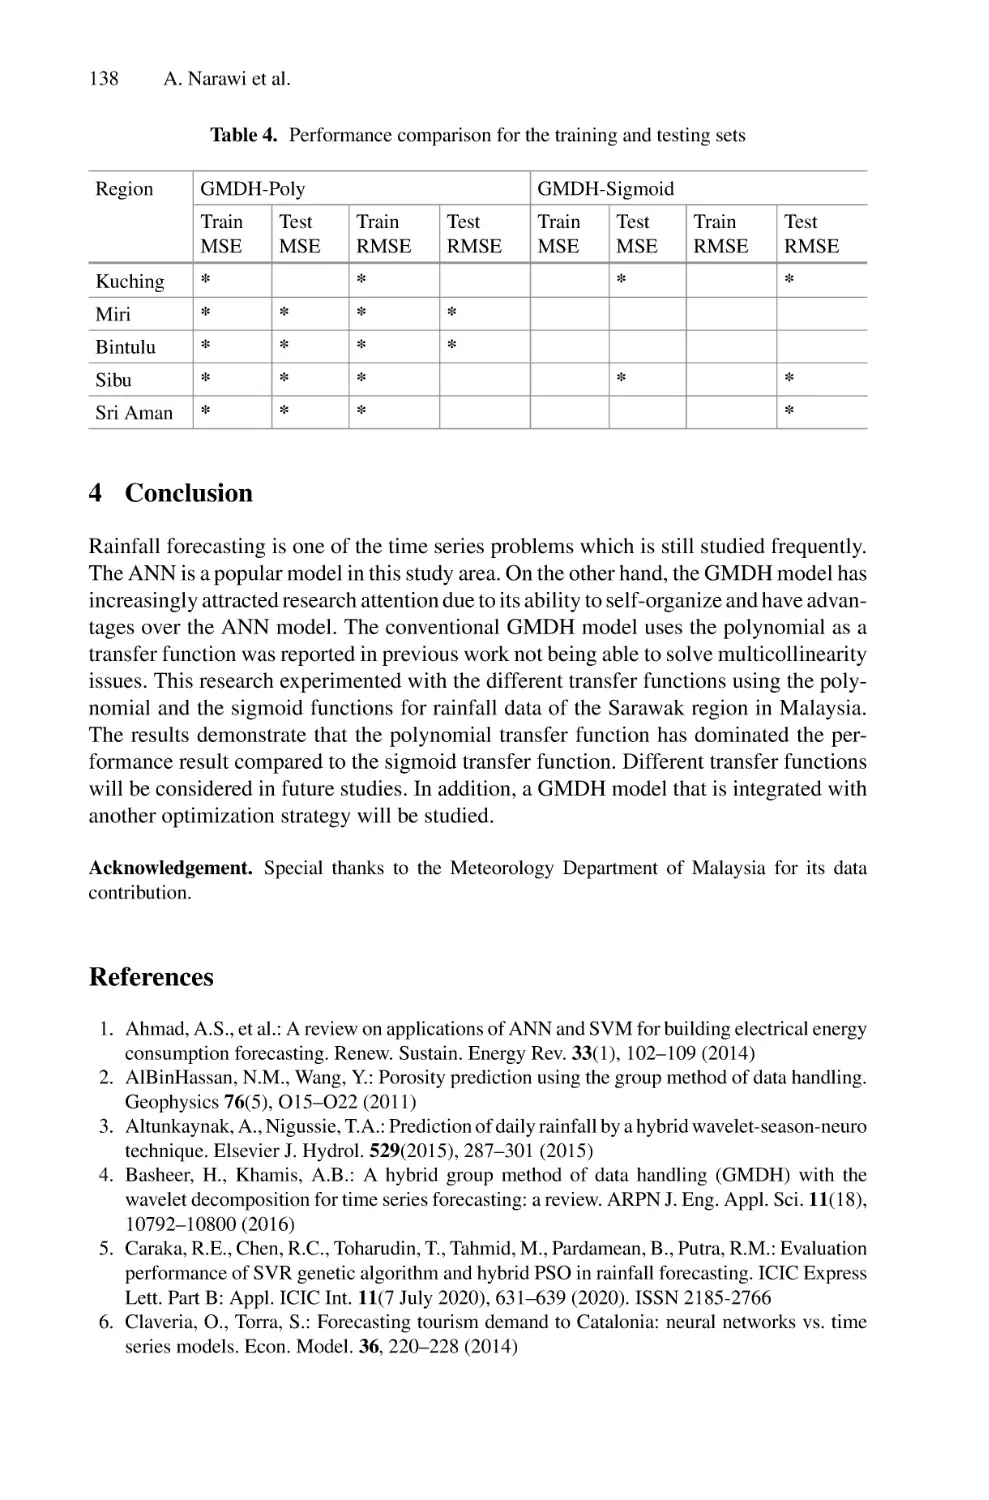
Rainfall Forecasting Using the Group Method of Data Handling
Model: A Case Study of Sarawak, Malaysia . . . . . . . . . . . . . . . . . . . . . 129
Azlina Narawi, Dayang Norhayati Abang Jawawi,
and Ruhaidah Samsudin
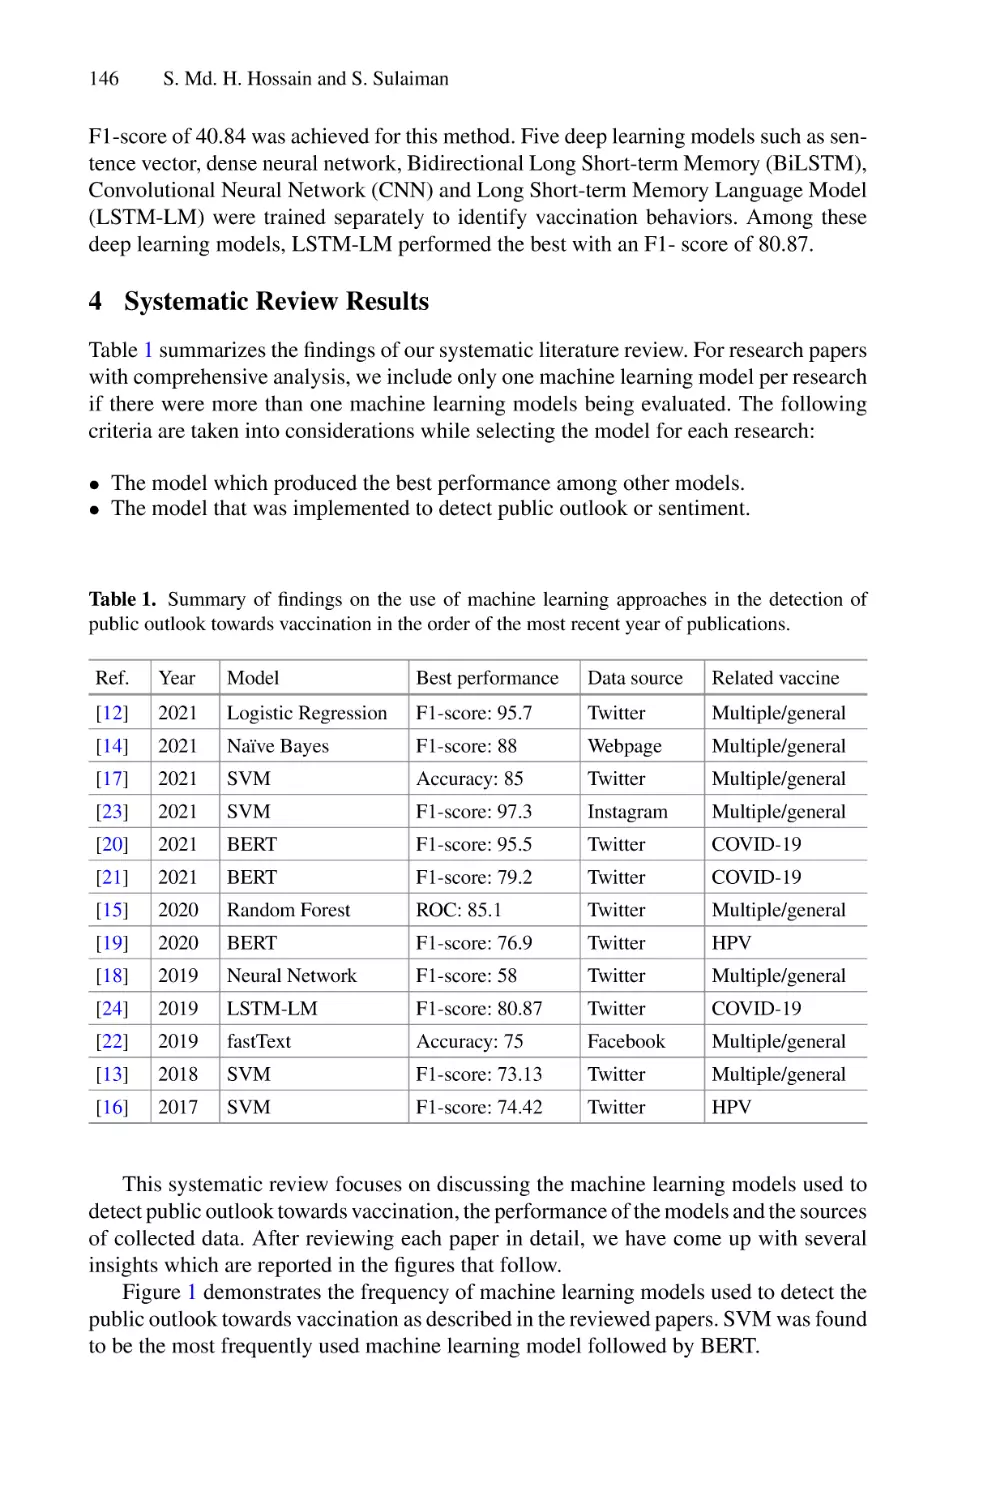
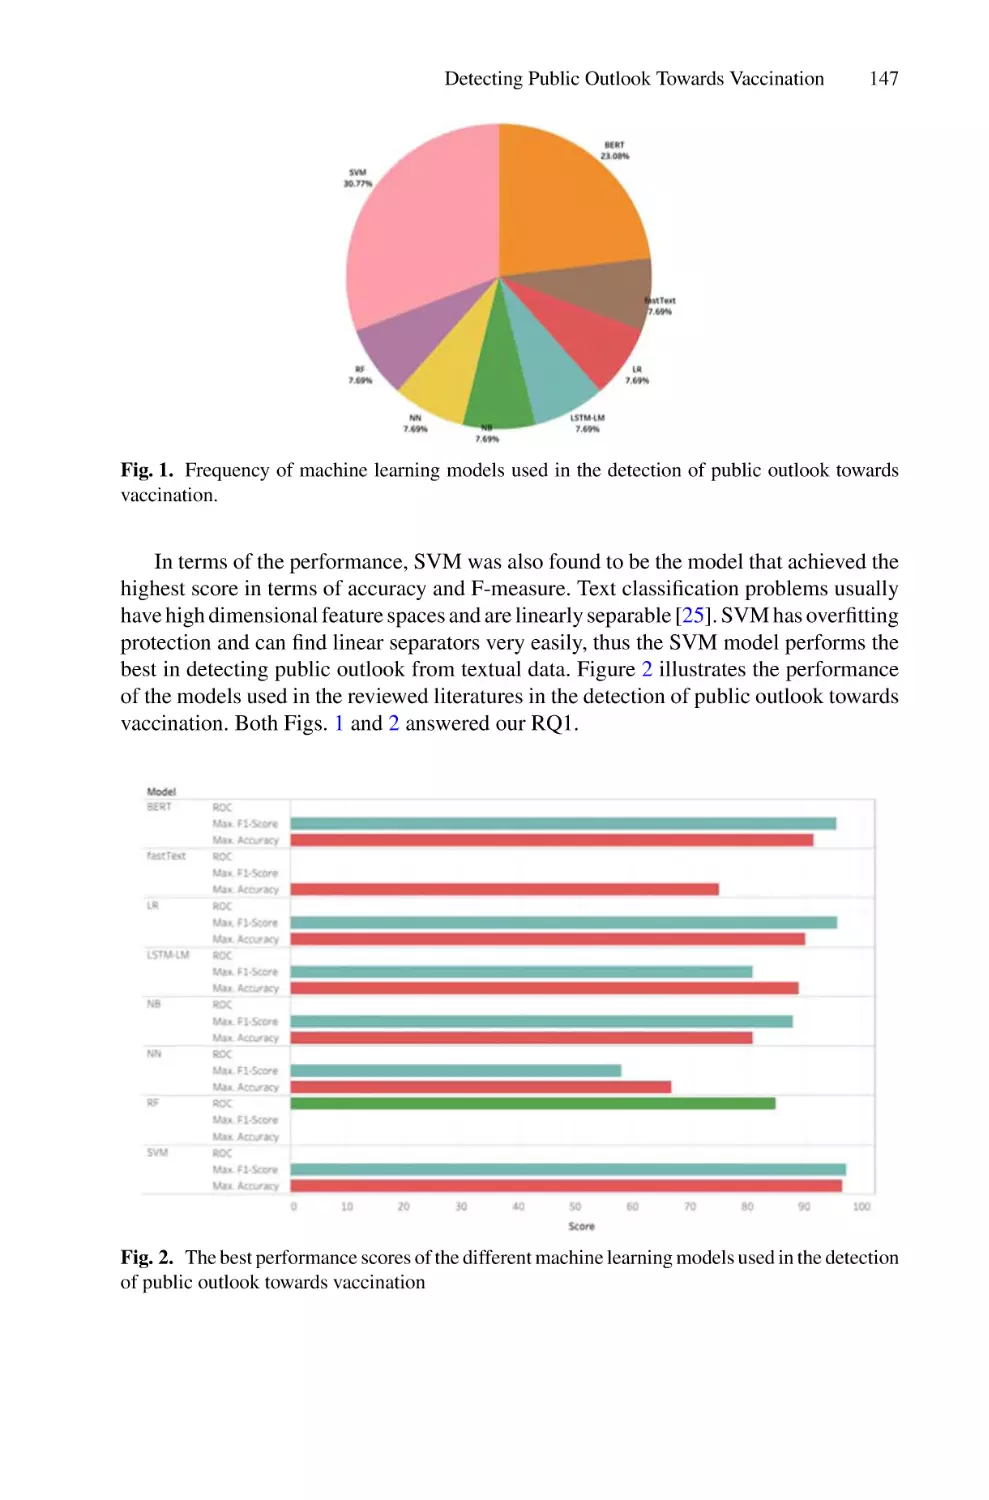
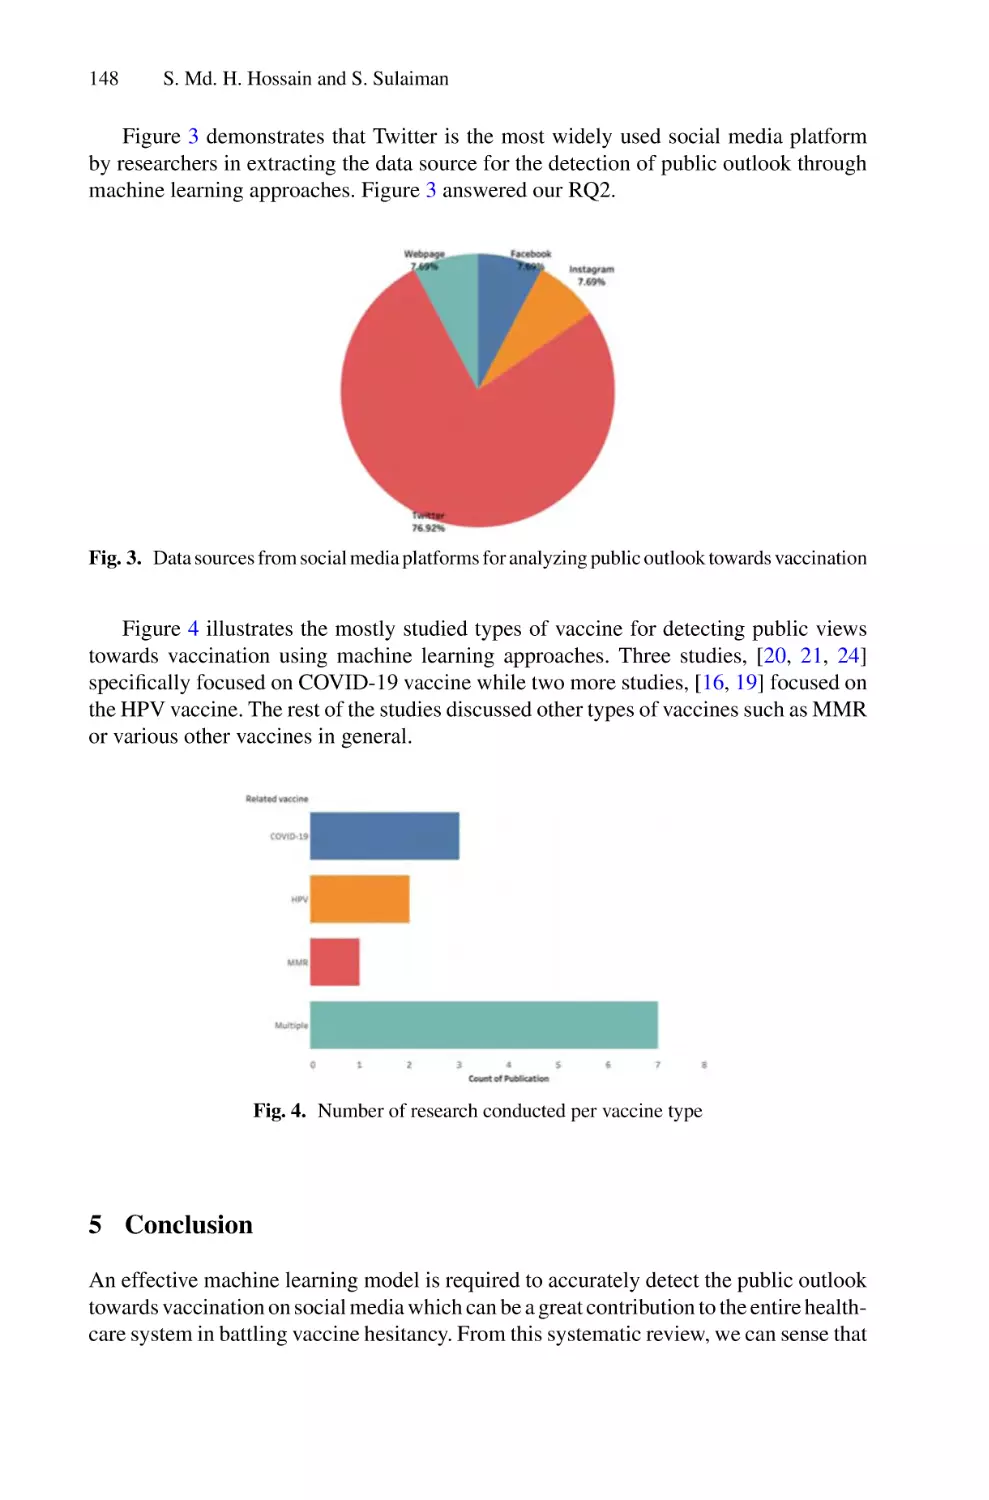
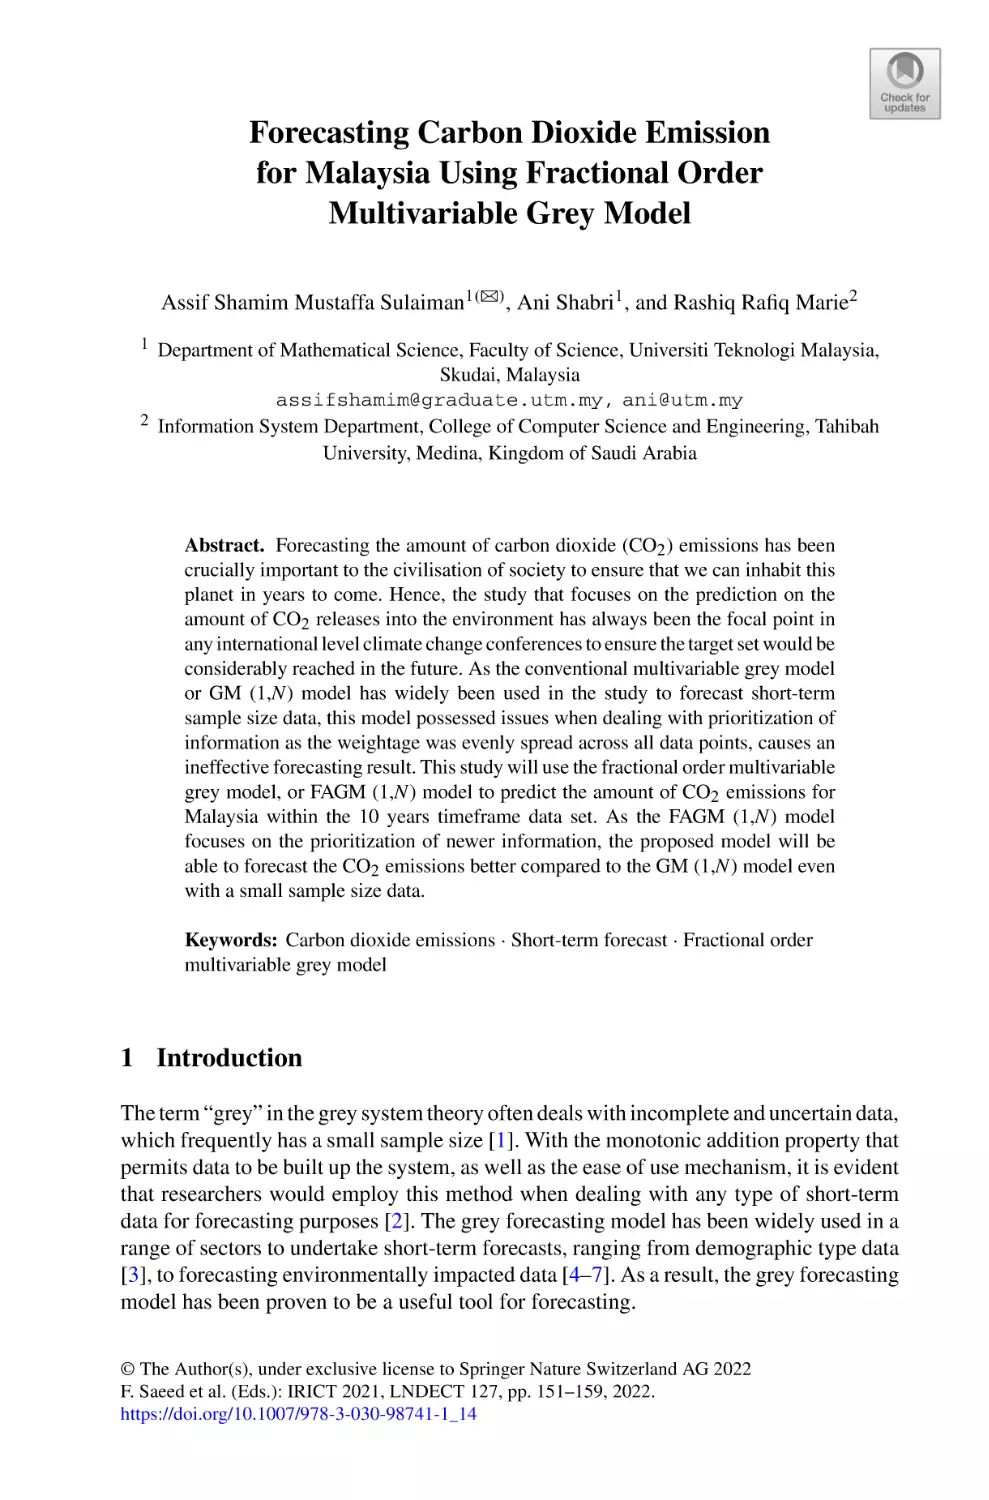
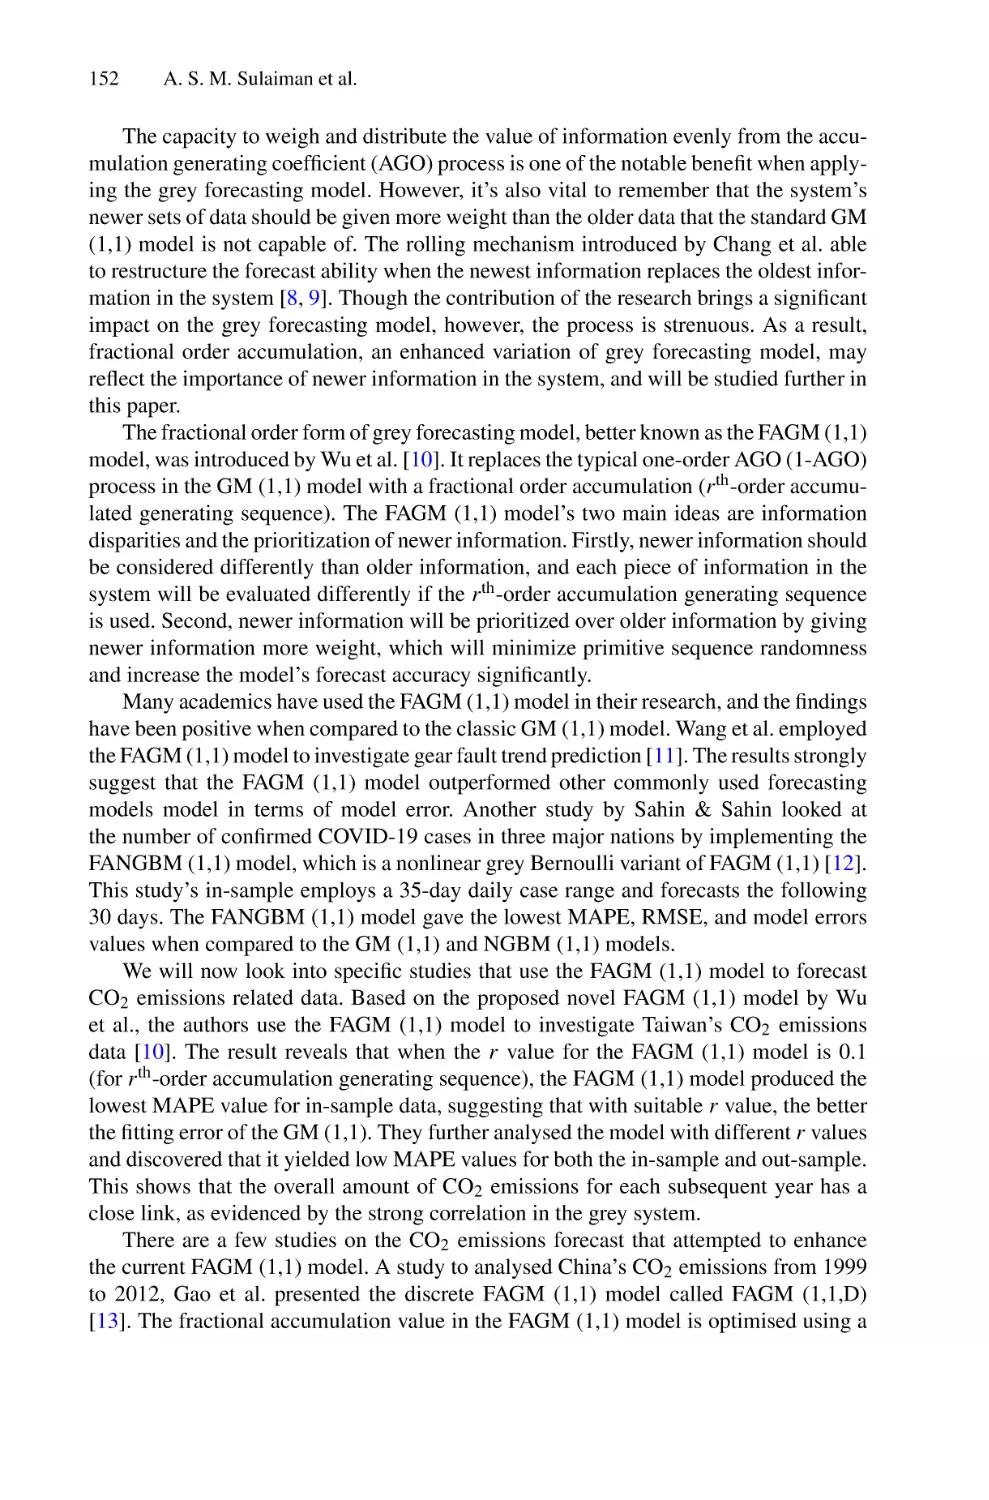
Detecting Public Outlook Towards Vaccination Using Machine
Learning Approaches: A Systematic Review . . . . . . . . . . . . . . . . . . . . . 141
Sheikh Md. Hanif Hossain and Suriani Sulaiman
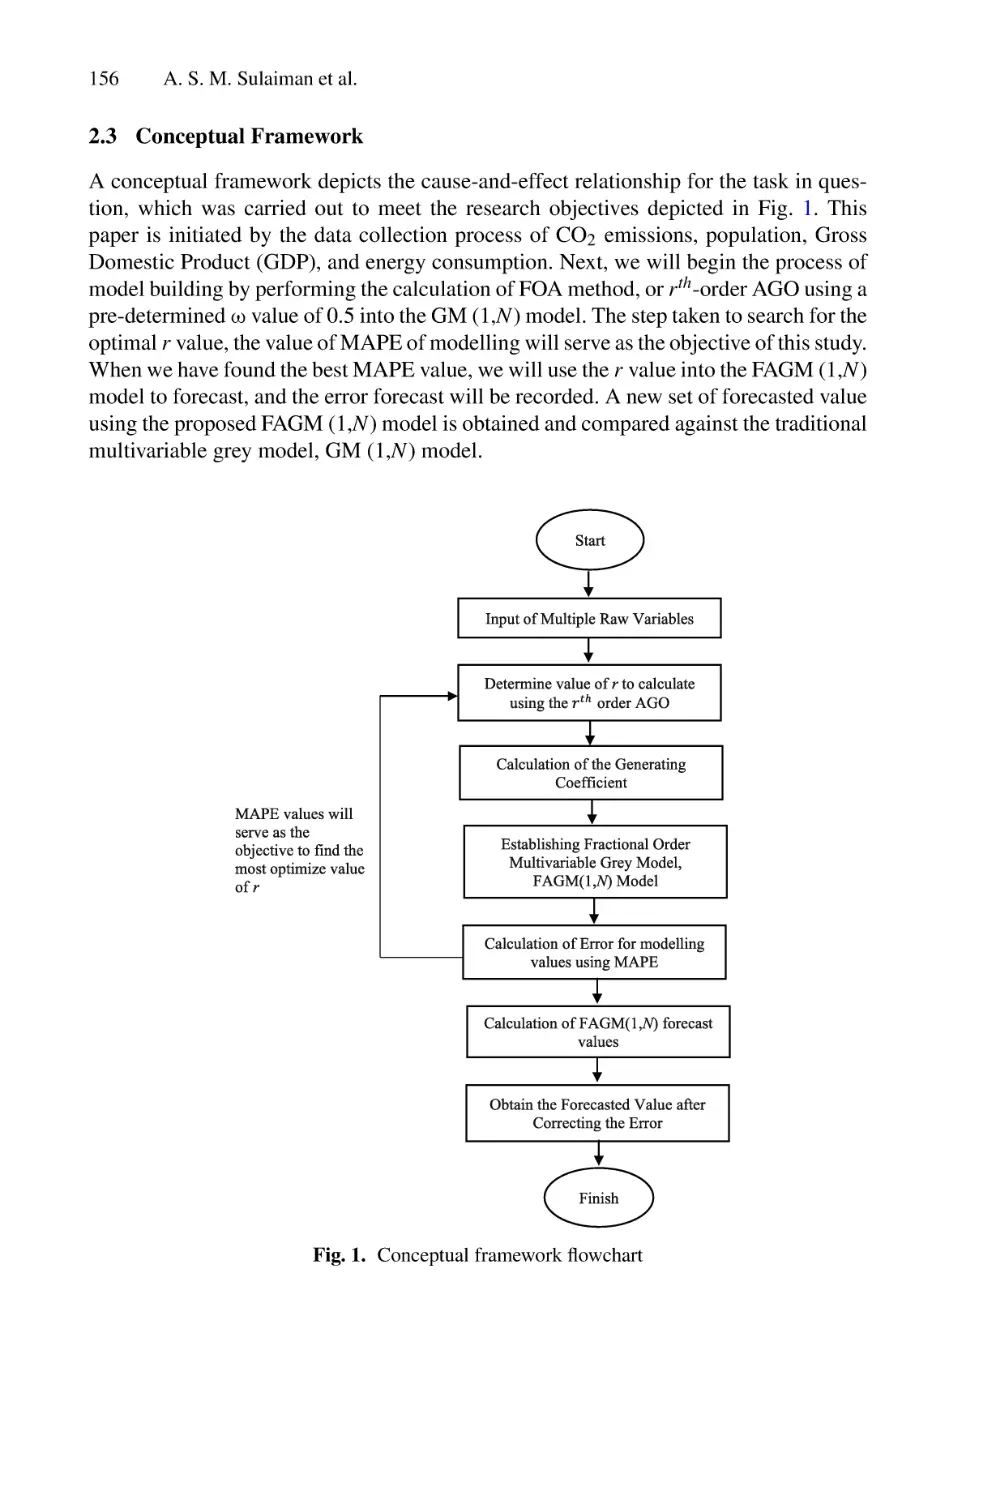
Forecasting Carbon Dioxide Emission for Malaysia Using Fractional
Order Multivariable Grey Model . . . . . . . . . . . . . . . . . . . . . . . . . . . . . . 151
Assif Shamim Mustaffa Sulaiman, Ani Shabri, and Rashiq Rafiq Marie
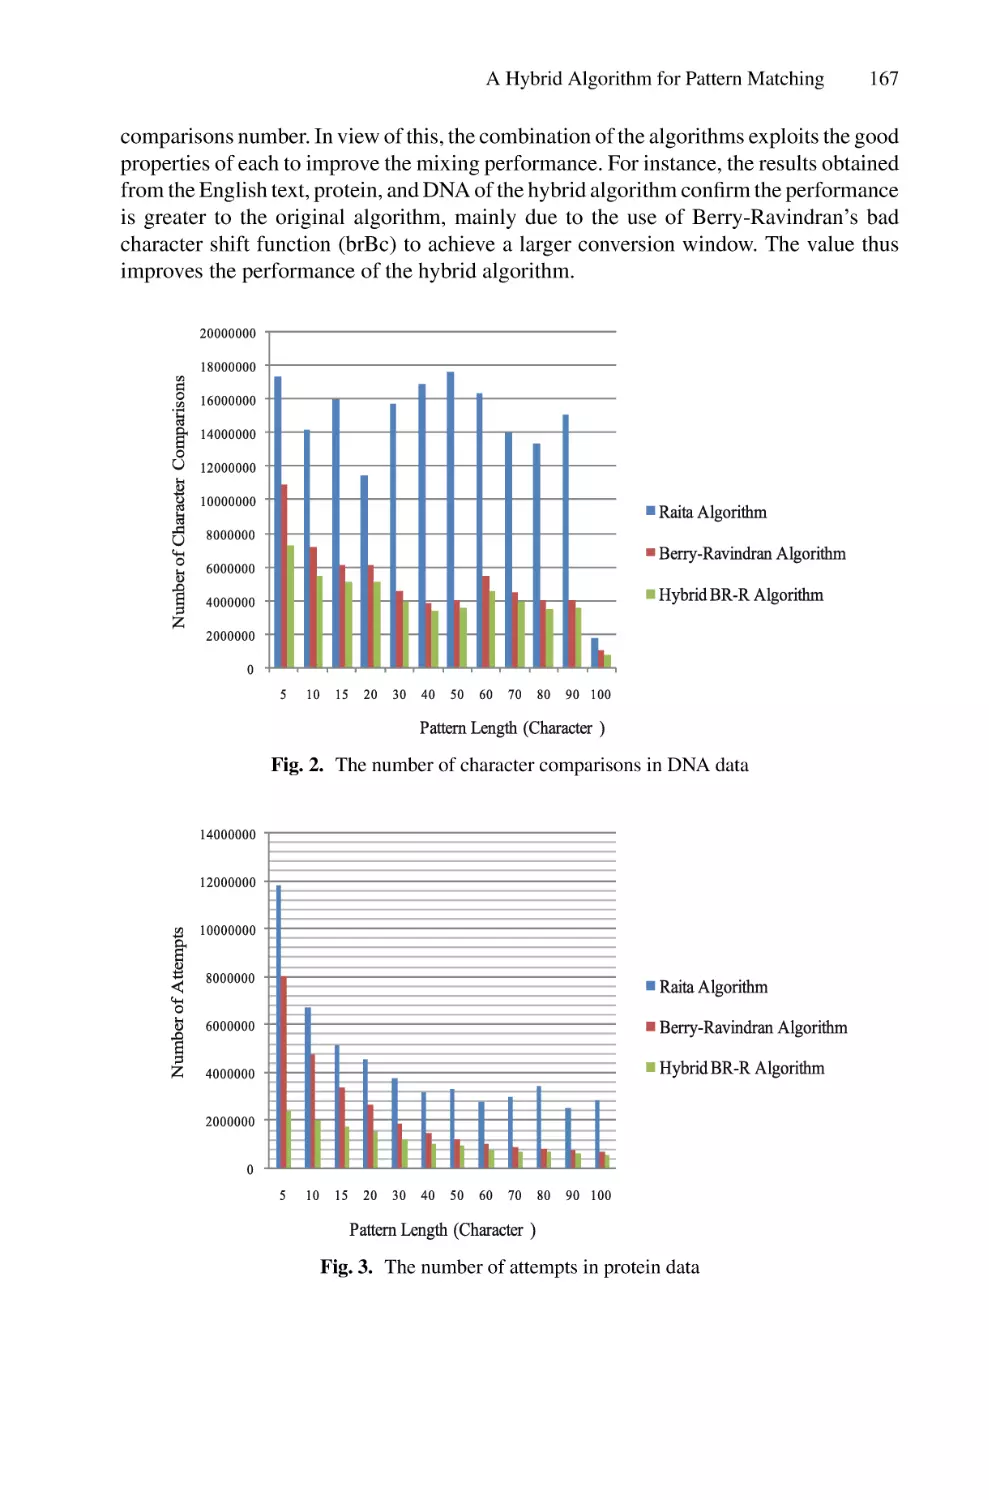
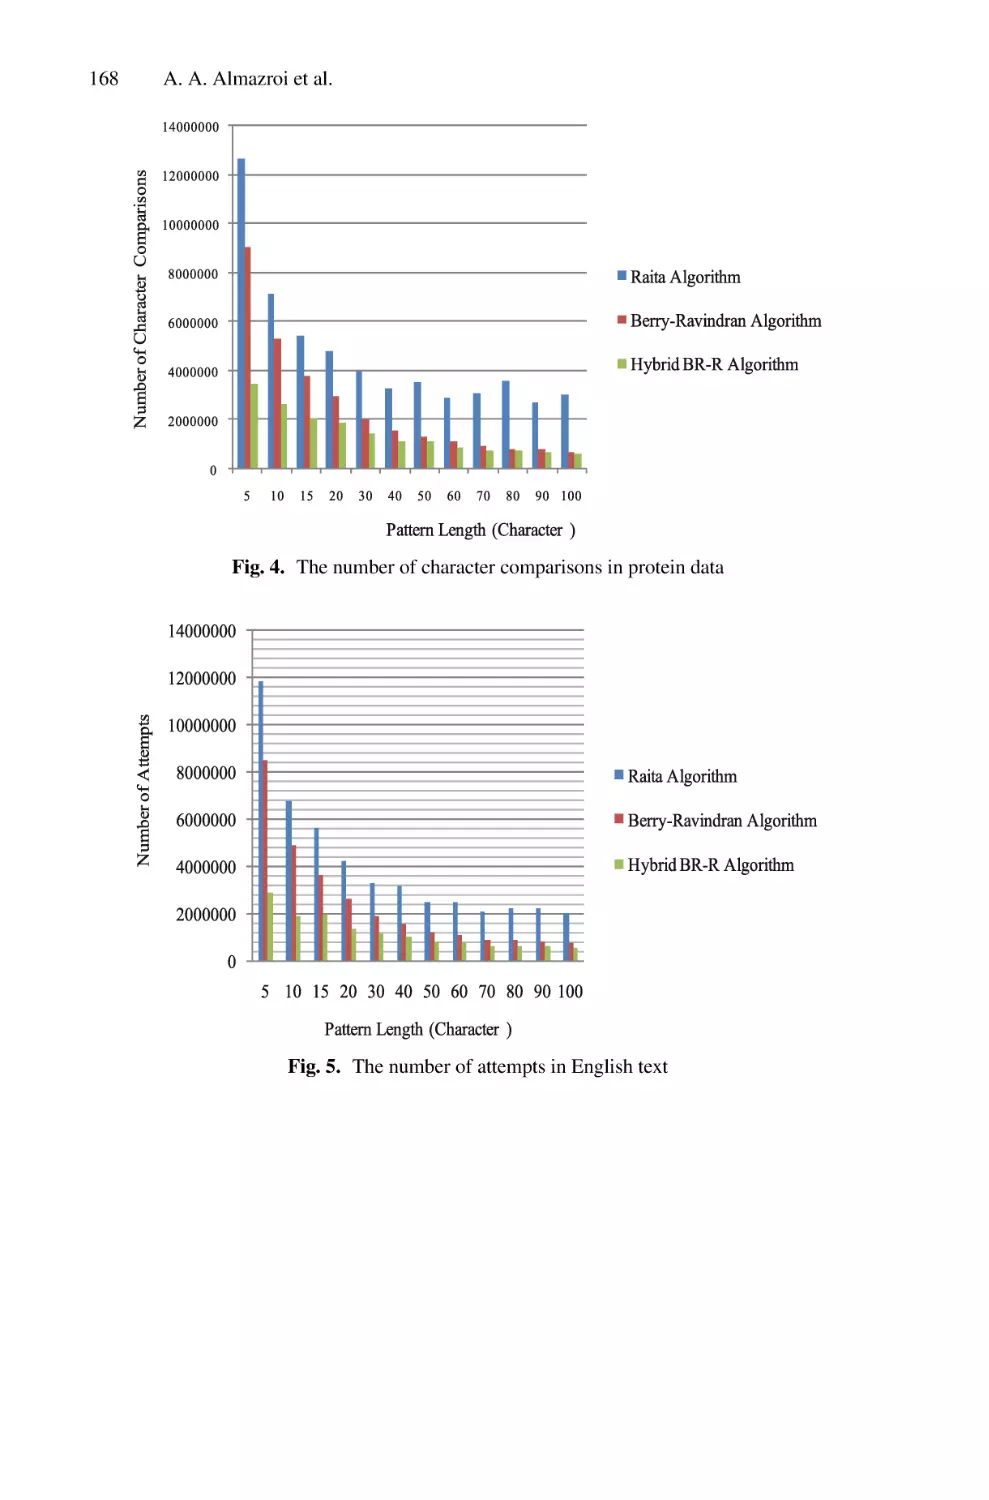
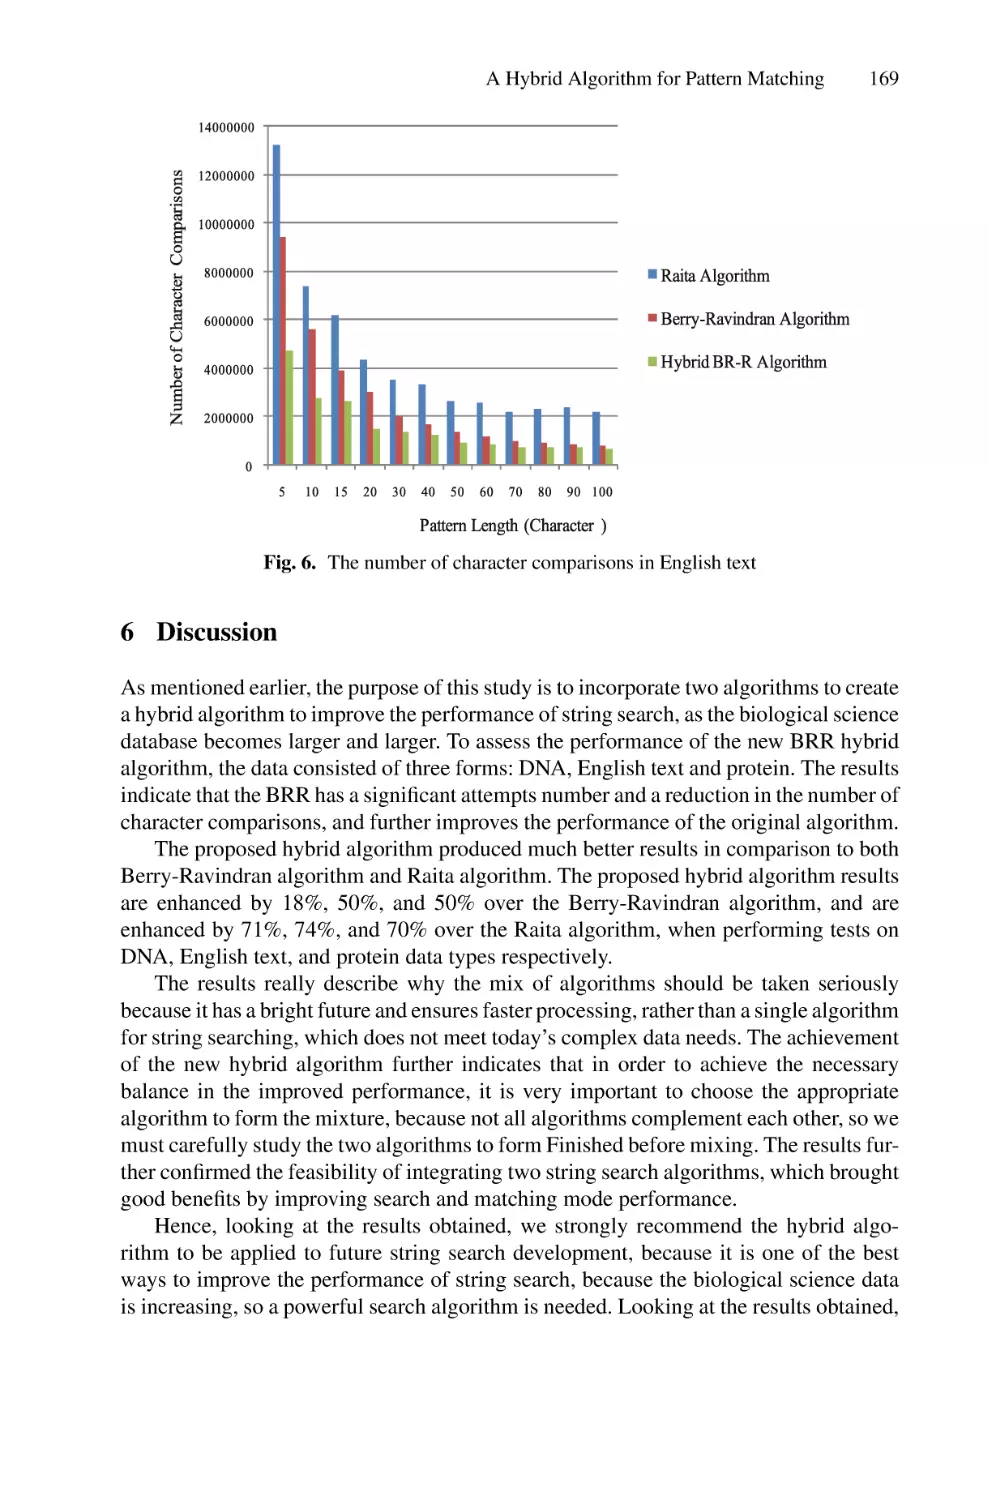
A Hybrid Algorithm for Pattern Matching: An Integration
of Berry-Ravindran and Raita Algorithms . . . . . . . . . . . . . . . . . . . . . . . 160
Abdulwahab Ali Almazroi, Fathey Mohammed,
Muhammad Ahsan Qureshi, Asad Ali Shah,
Ibrahim Abaker Targio Hashim, Nabil Hasan Al-Kumaim,
and Abubakar Zakari
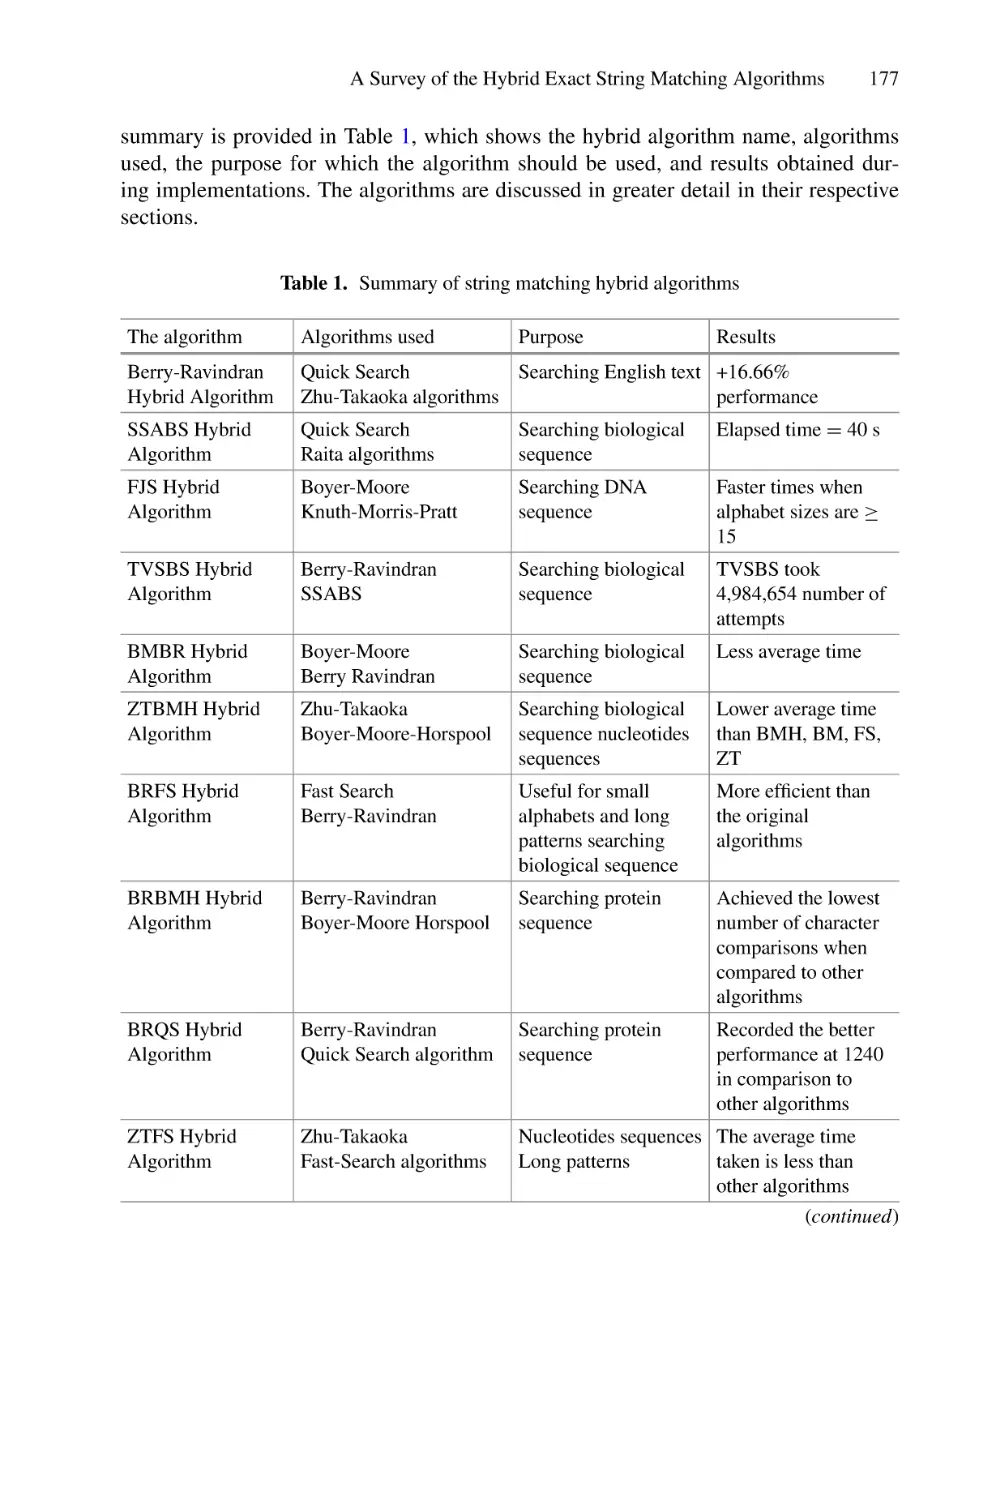
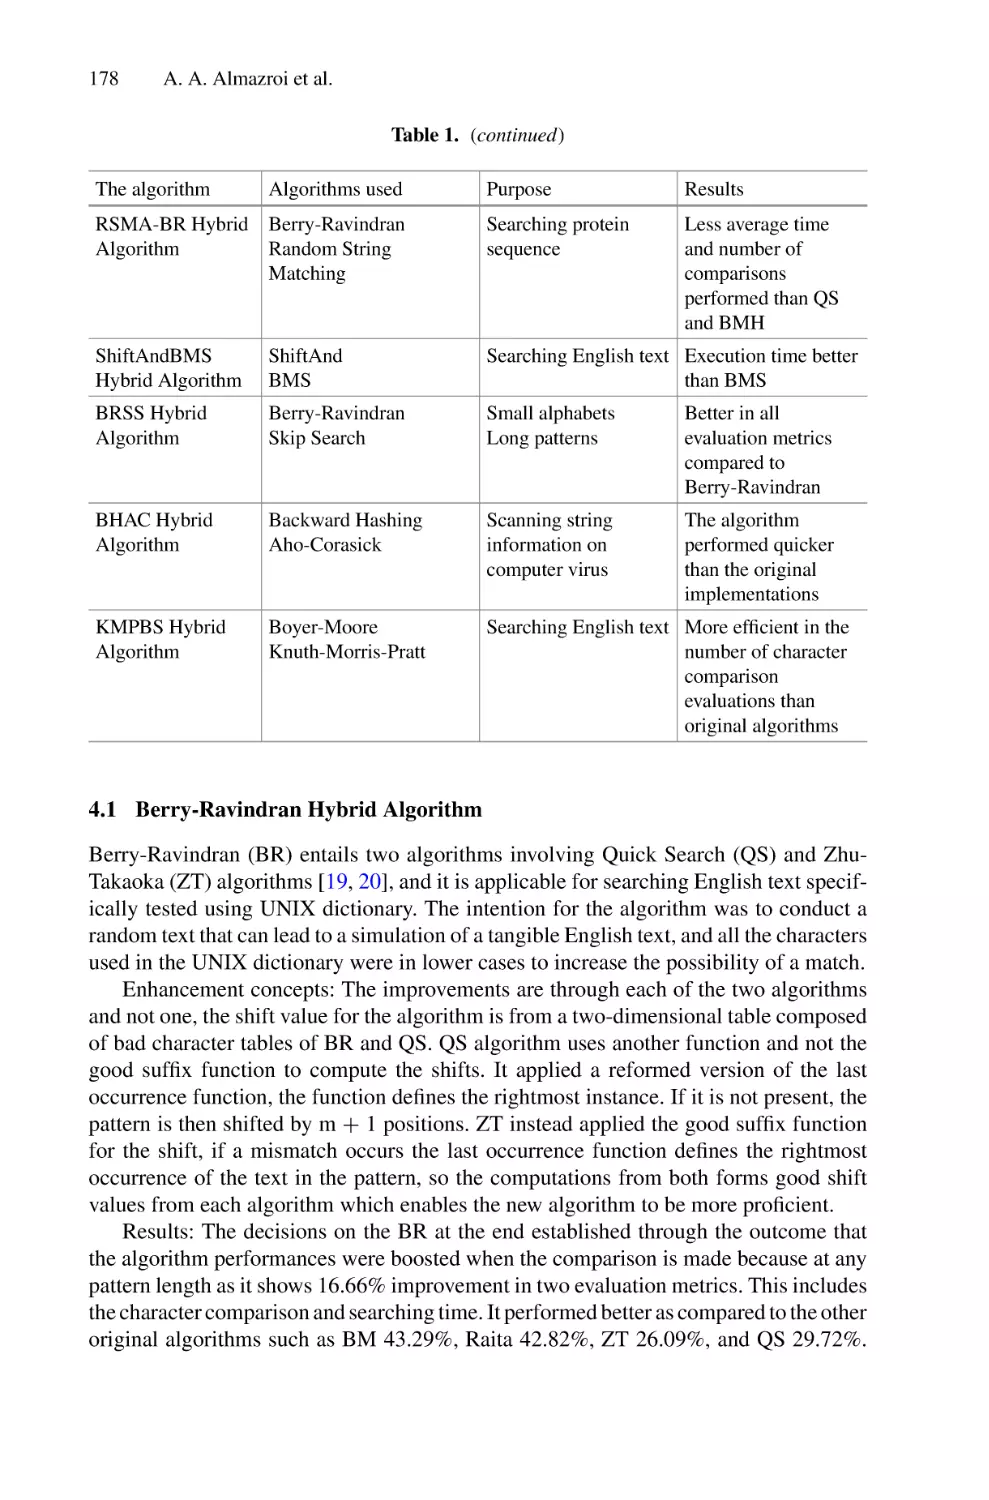
A Survey of the Hybrid Exact String Matching Algorithms . . . . . . . . . . 173
Abdulwahab Ali Almazroi, Asad Ali Shah, Abdulaleem Ali Almazroi,
Fathey Mohammed, and Nabil Hasan Al-Kumaim
Data Science
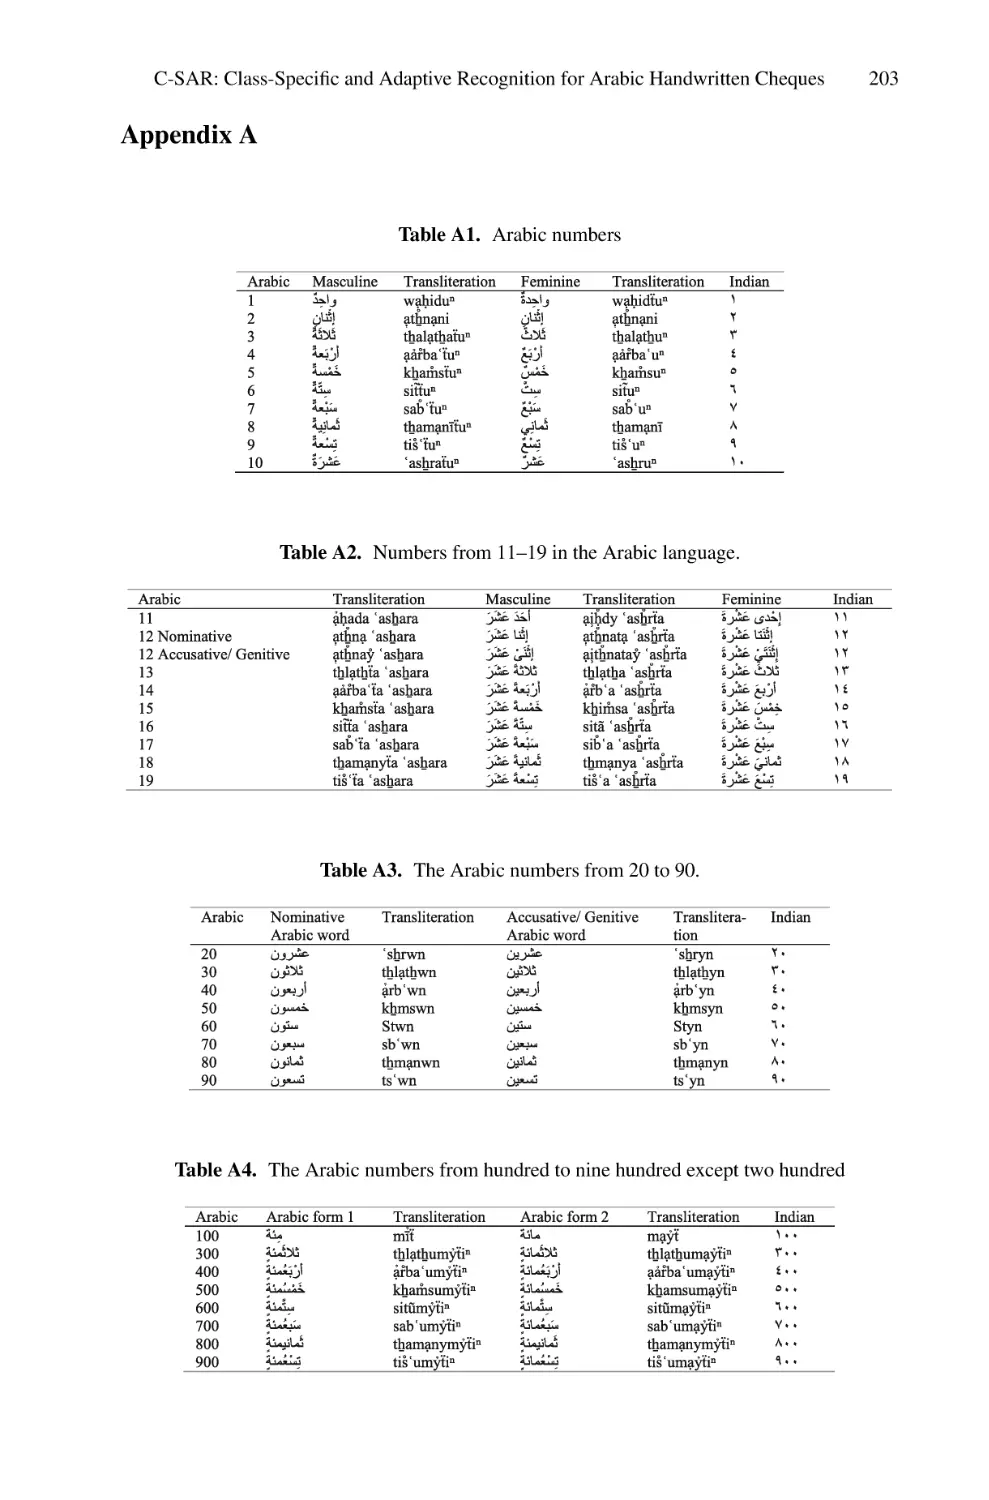
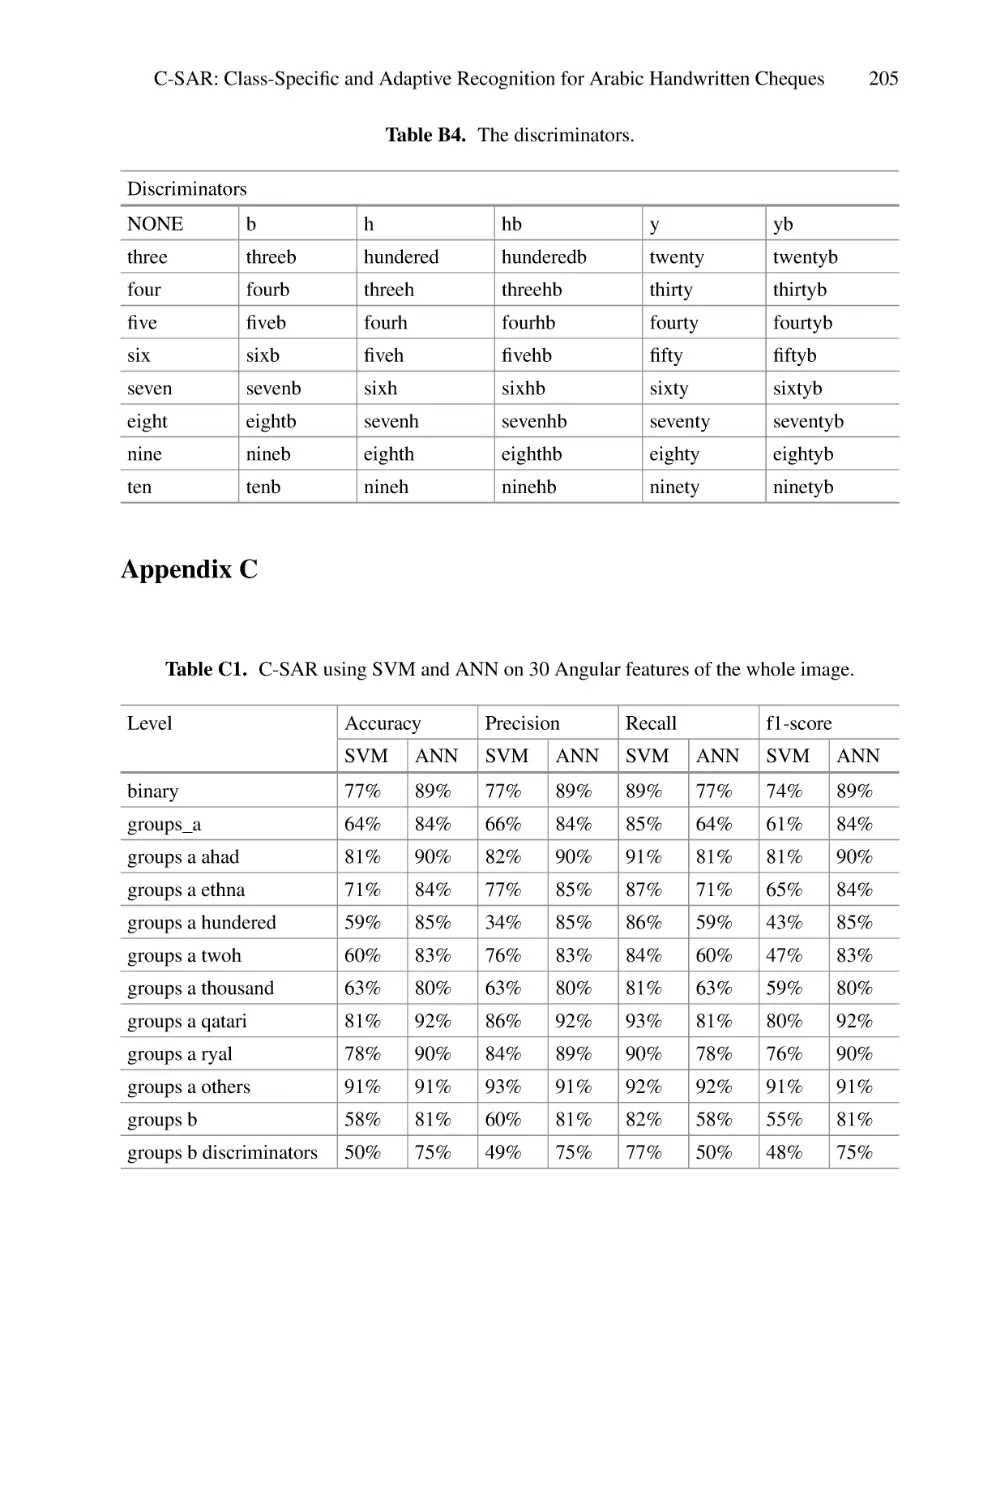
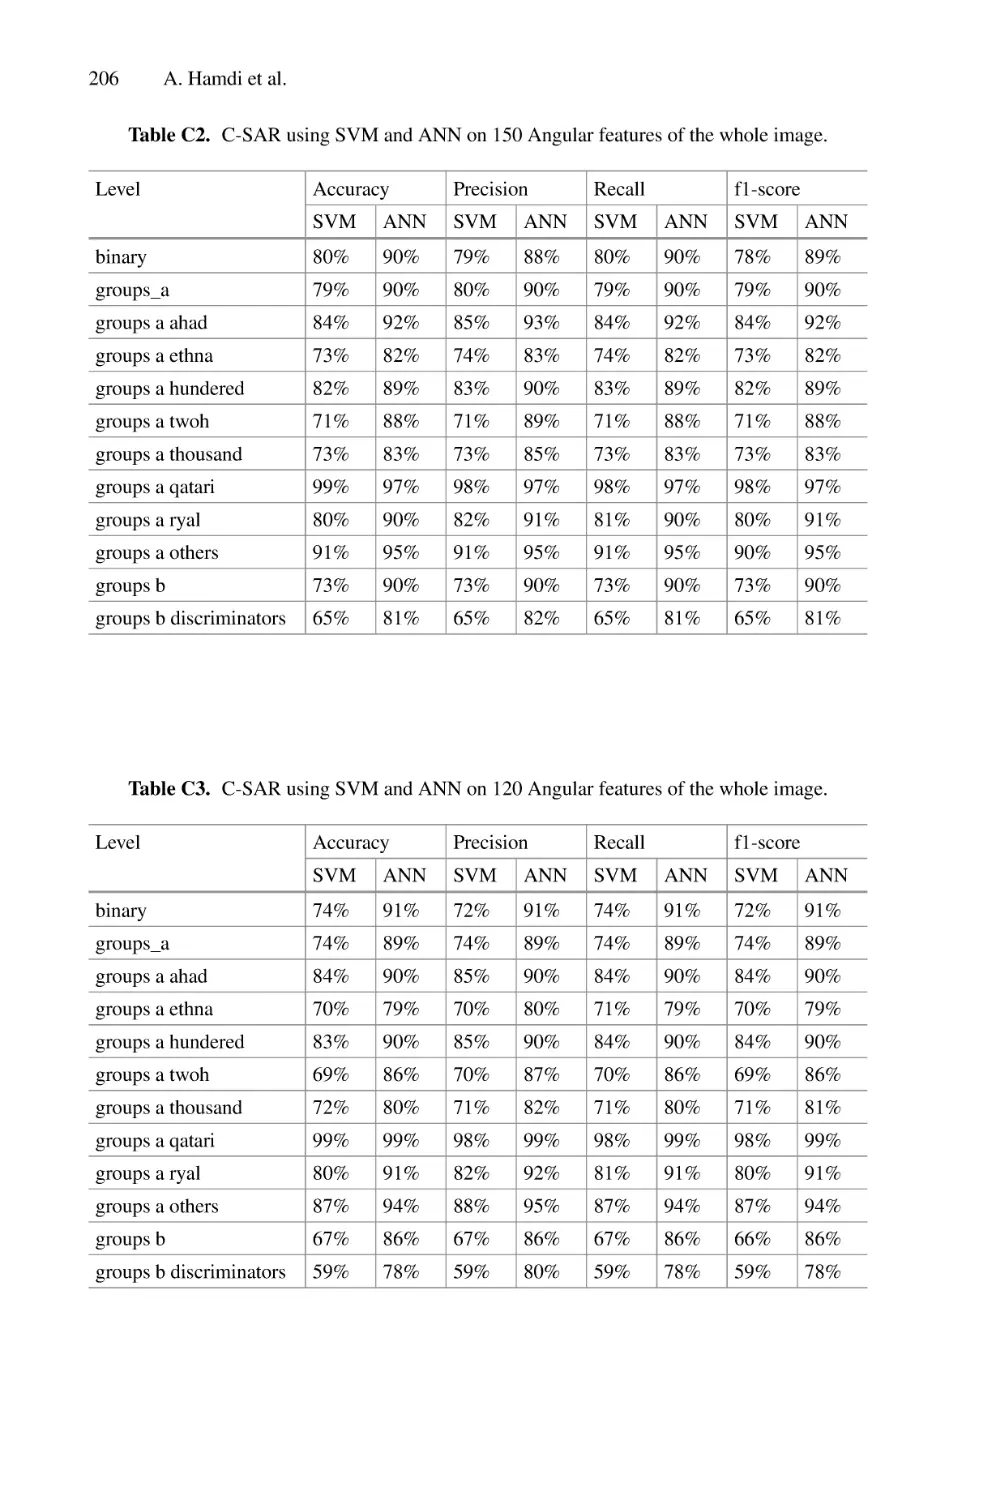
C-SAR: Class-Specific and Adaptive Recognition for Arabic
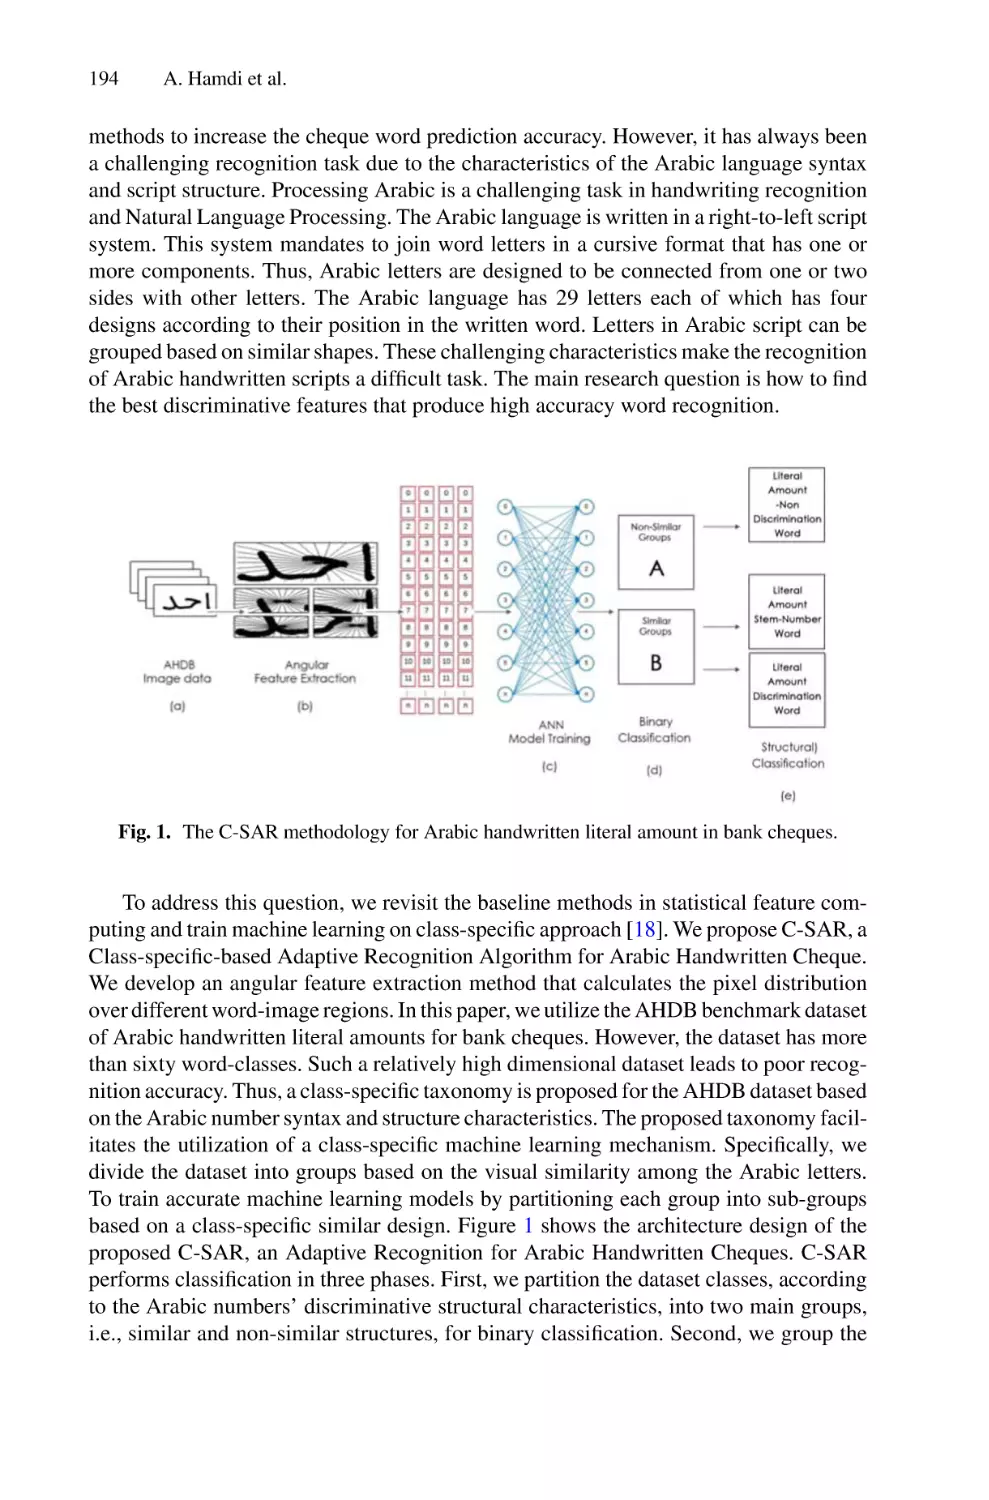
Handwritten Cheques . . . . . . . . . . . . . . . . . . . . . . . . . . . . . . . . . . . . . . . 193
Ali Hamdi, Qais Al-Nuzaili, Fuad A. Ghaleb, and Khaled Shaban
Contents
xiii
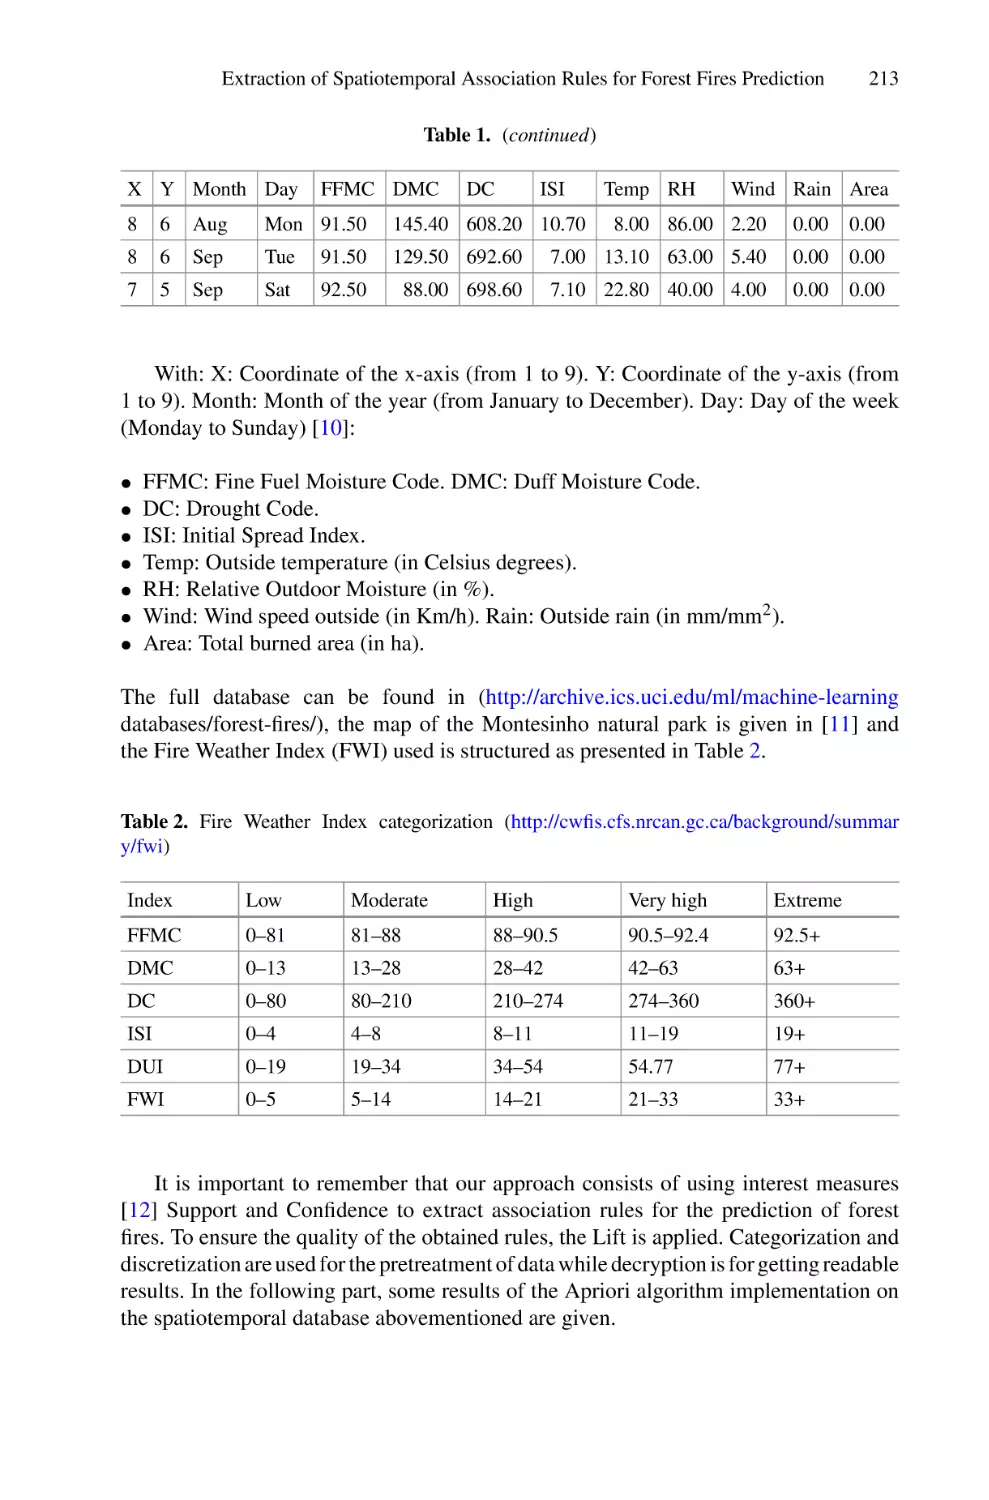
Extraction of Spatiotemporal Association Rules for Forest
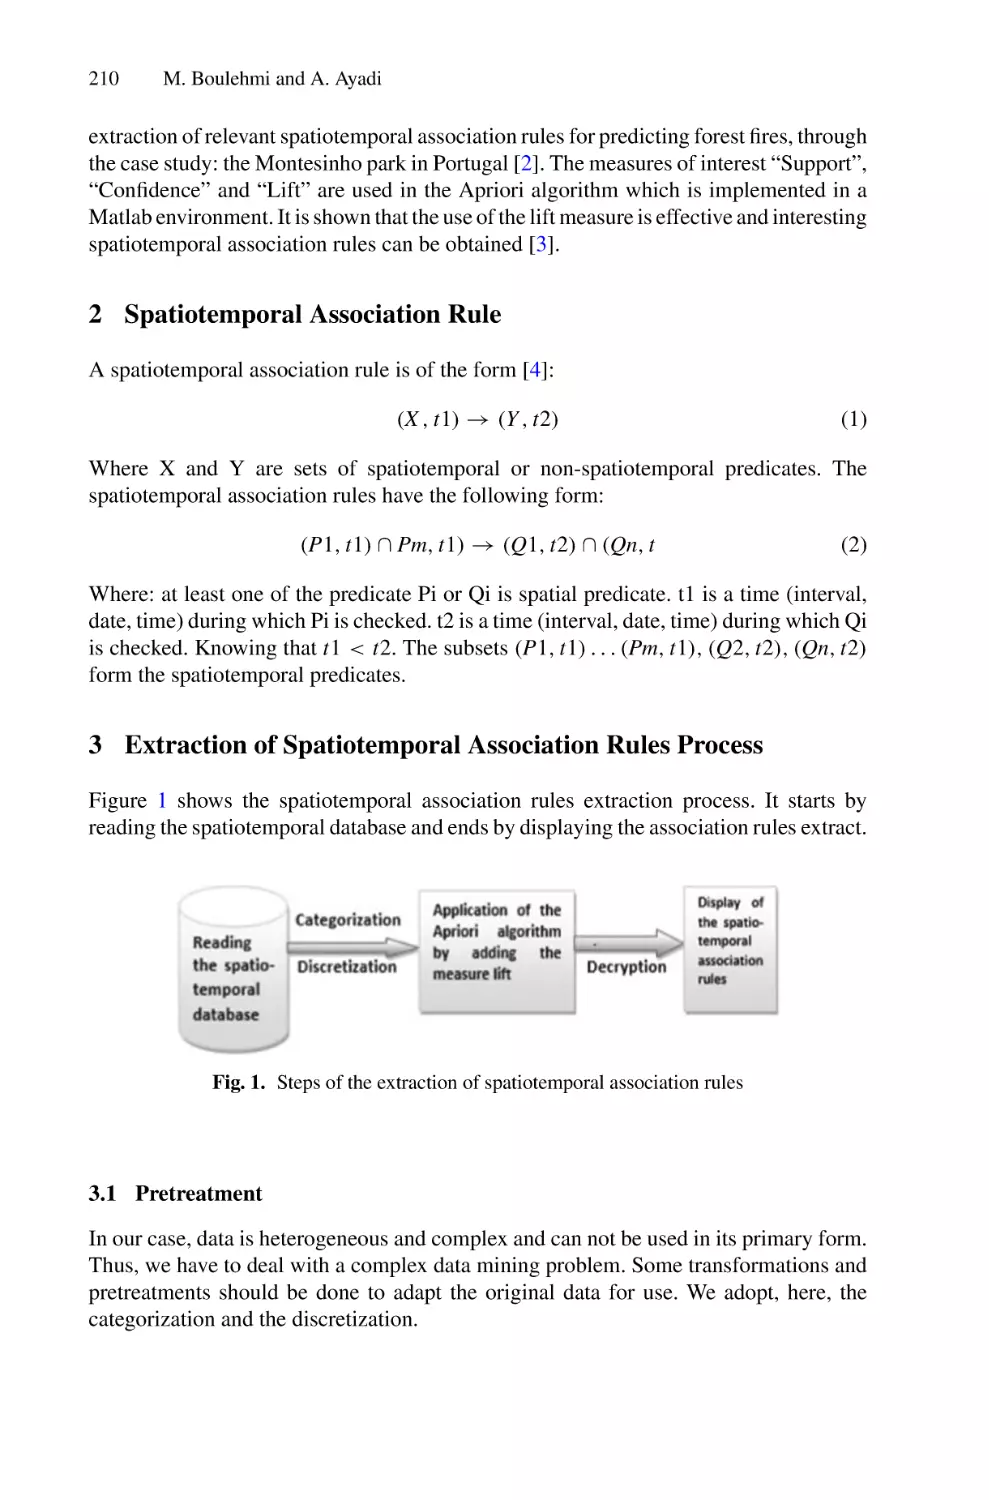
Fires Prediction . . . . . . . . . . . . . . . . . . . . . . . . . . . . . . . . . . . . . . . . . . . 209
Mongi Boulehmi and Amira Ayadi
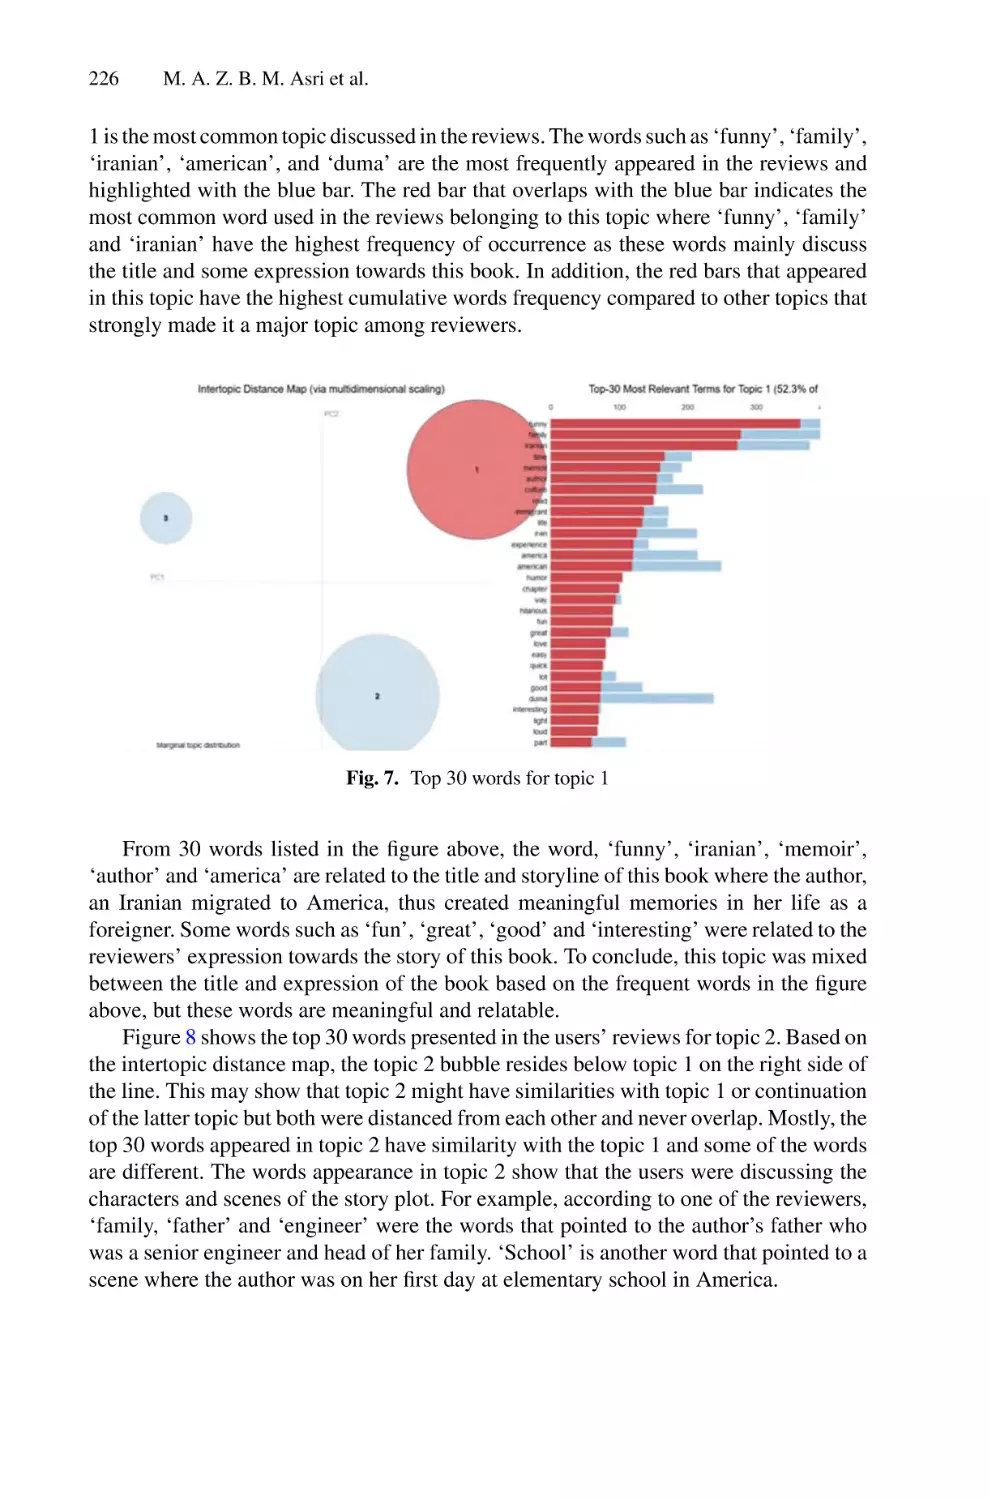
Opinion Mining Using Topic Modeling: A Case Study of Firoozeh
Dumas’s Funny in Farsi in Goodreads . . . . . . . . . . . . . . . . . . . . . . . . . . 219
Muhamad Aiman Zikri Bin Muhamad Asri, Pantea Keikhosrokiani,
and Moussa Pourya Asl
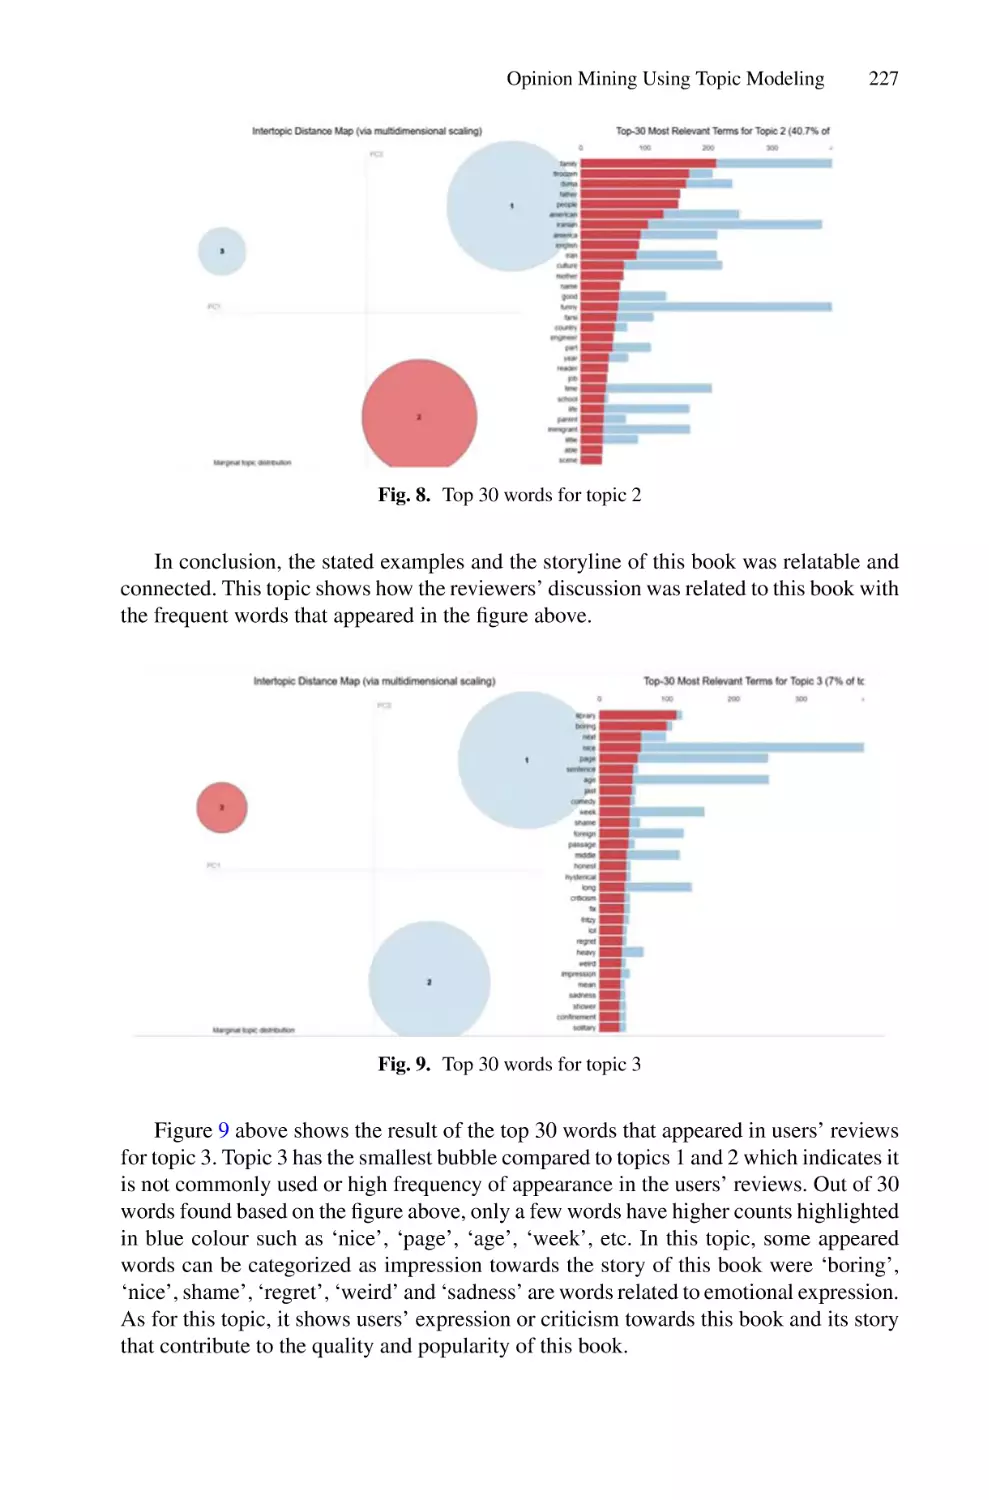
Opinion Mining Using Sentiment Analysis: A Case Study of Readers’
Response on Long Litt Woon’s The Way Through the Woods
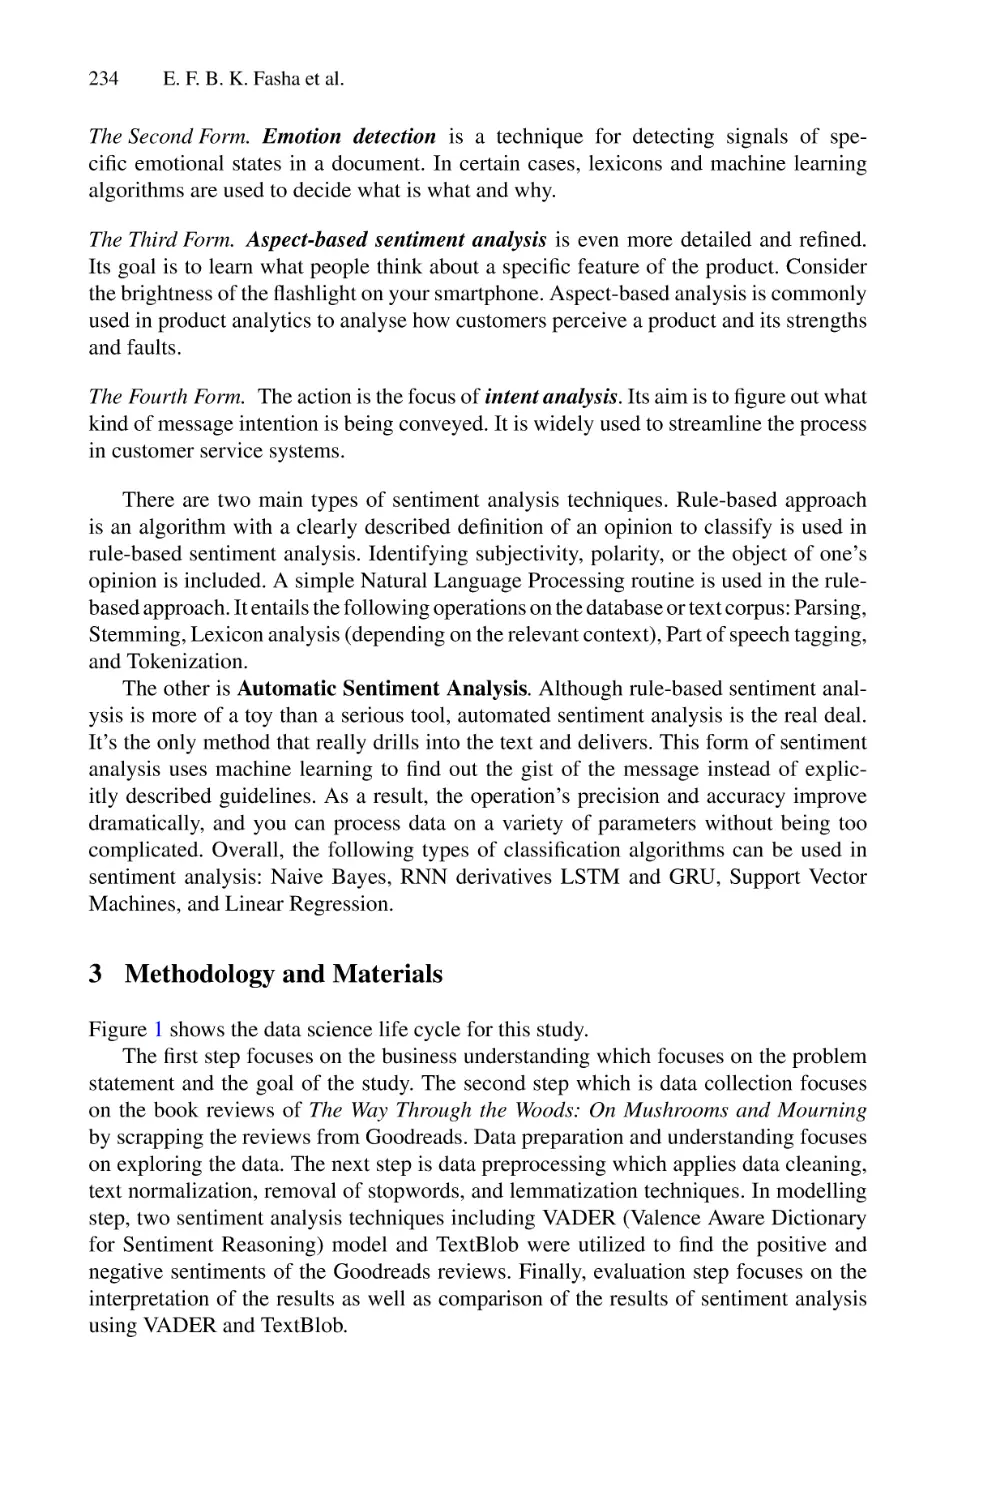
in Goodreads . . . . . . . . . . . . . . . . . . . . . . . . . . . . . . . . . . . . . . . . . . . . . 231
Ezqil Fasha Bin Kamal Fasha, Pantea Keikhosrokiani,
and Moussa Pourya Asl
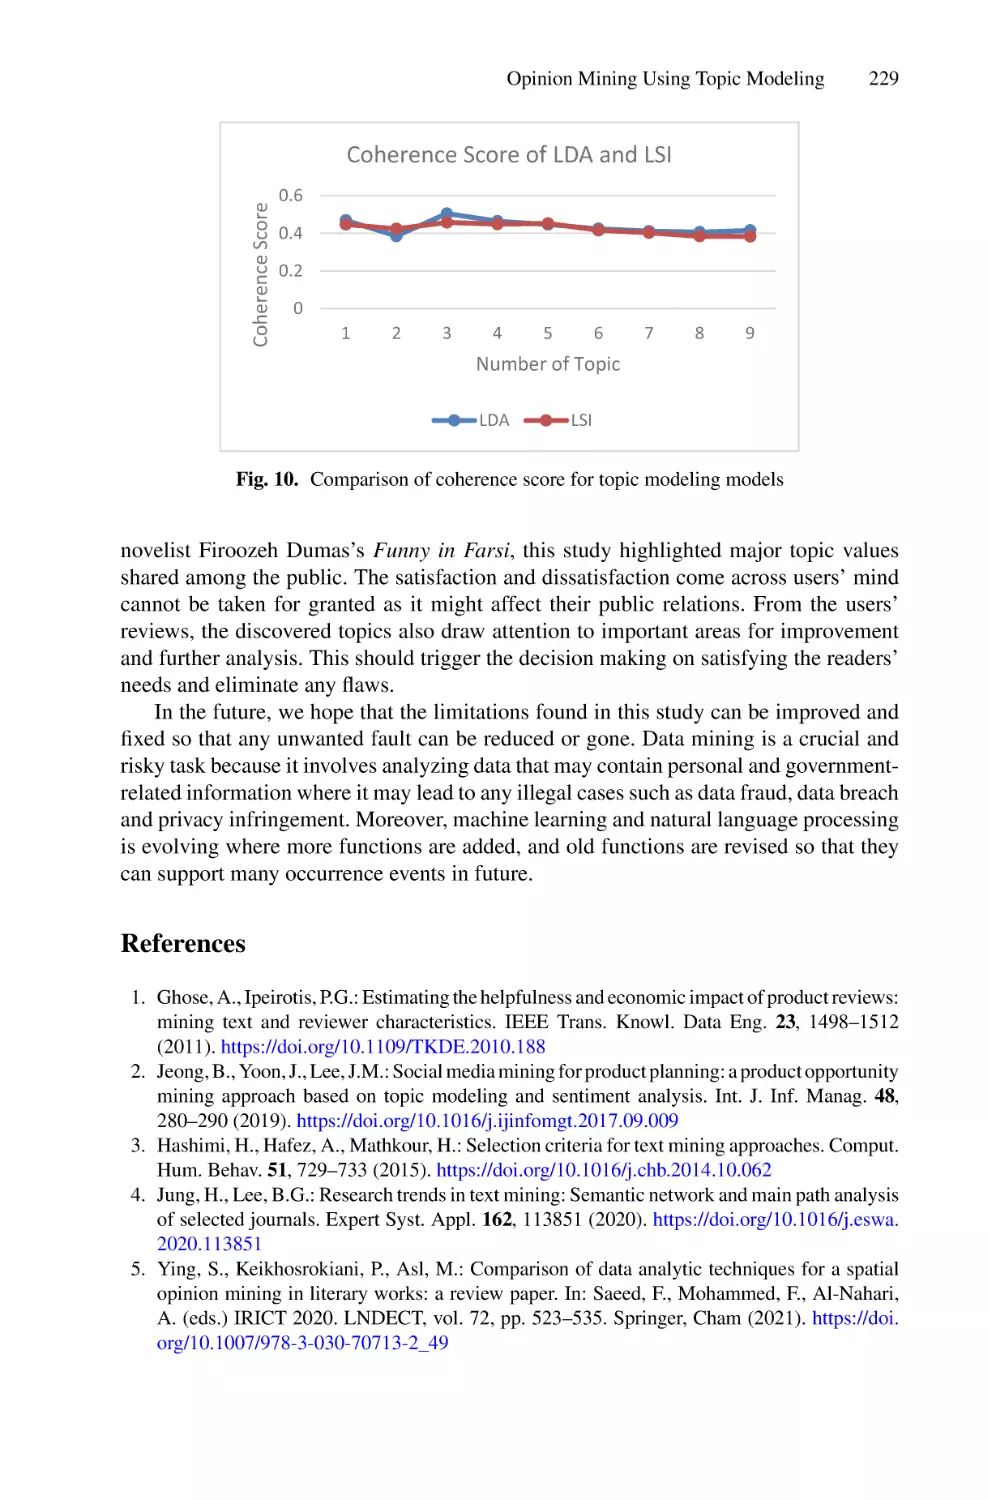
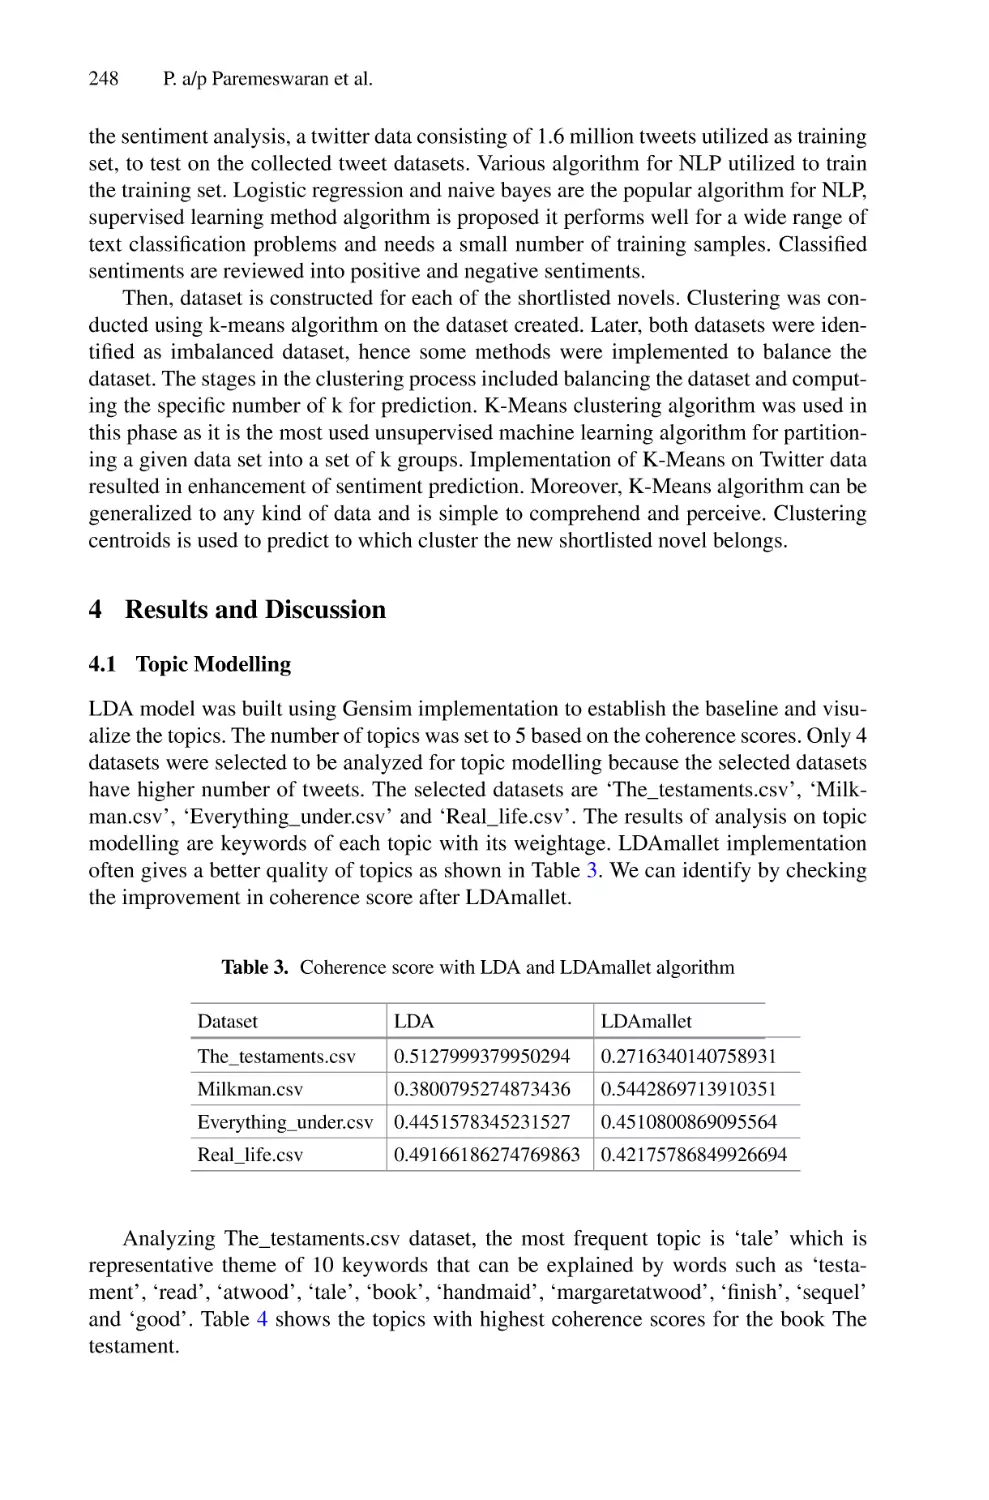
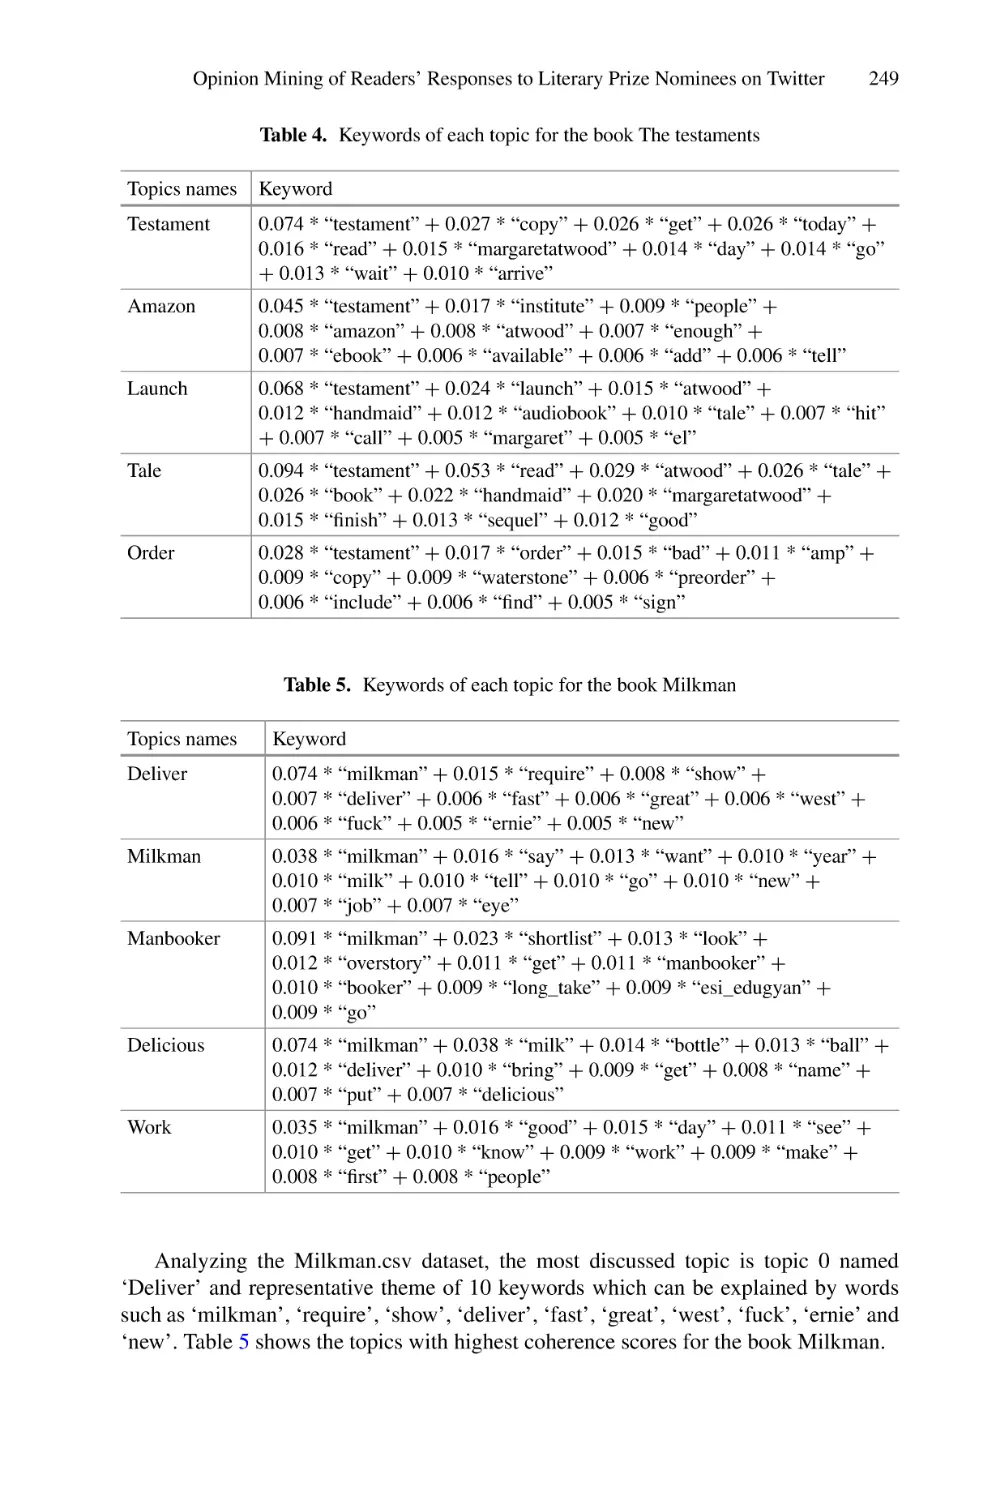
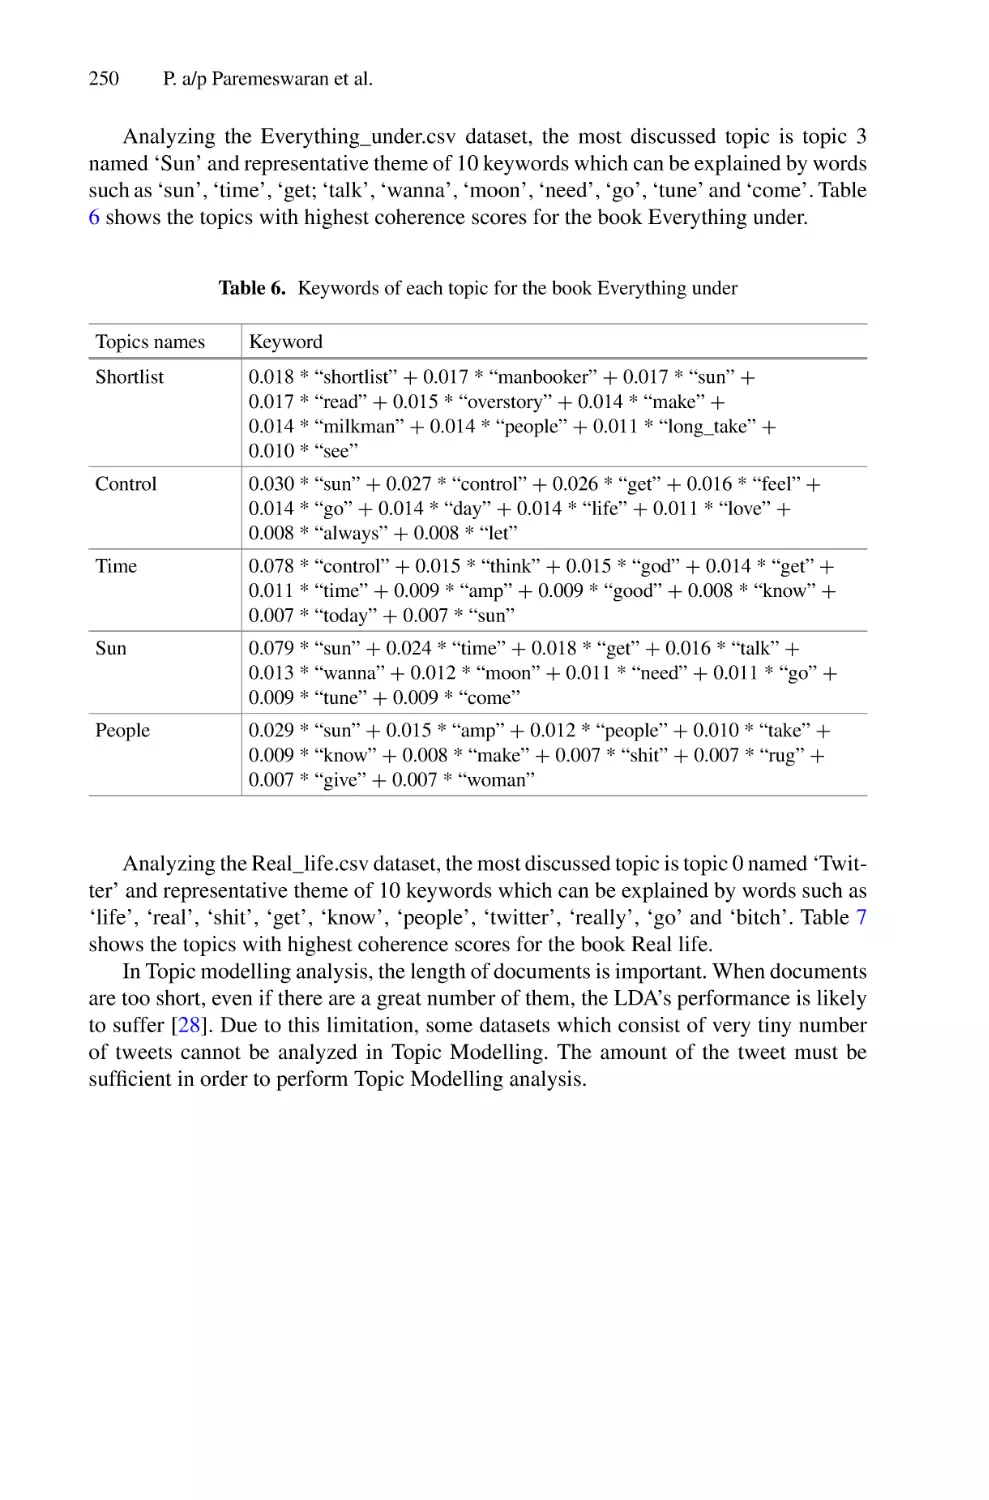
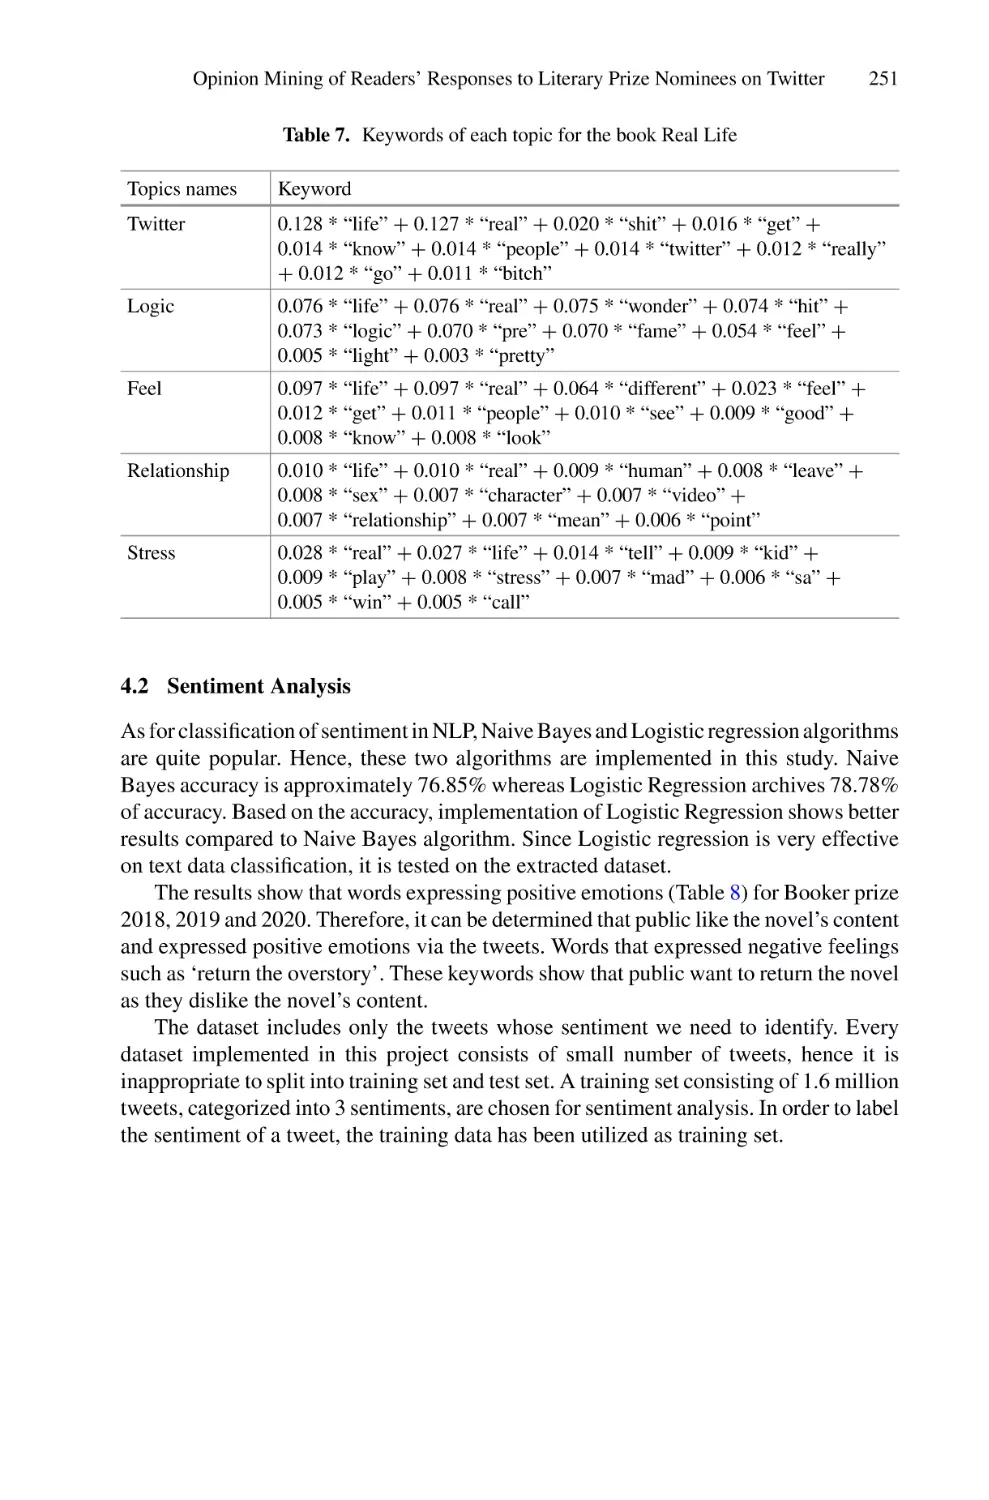
Opinion Mining of Readers’ Responses to Literary Prize Nominees on
Twitter: A Case Study of Public Reaction to the Booker
Prize (2018–2020) . . . . . . . . . . . . . . . . . . . . . . . . . . . . . . . . . . . . . . . . . . 243
Punetham a/p Paremeswaran, Pantea Keikhosrokiani,
and Moussa Pourya Asl
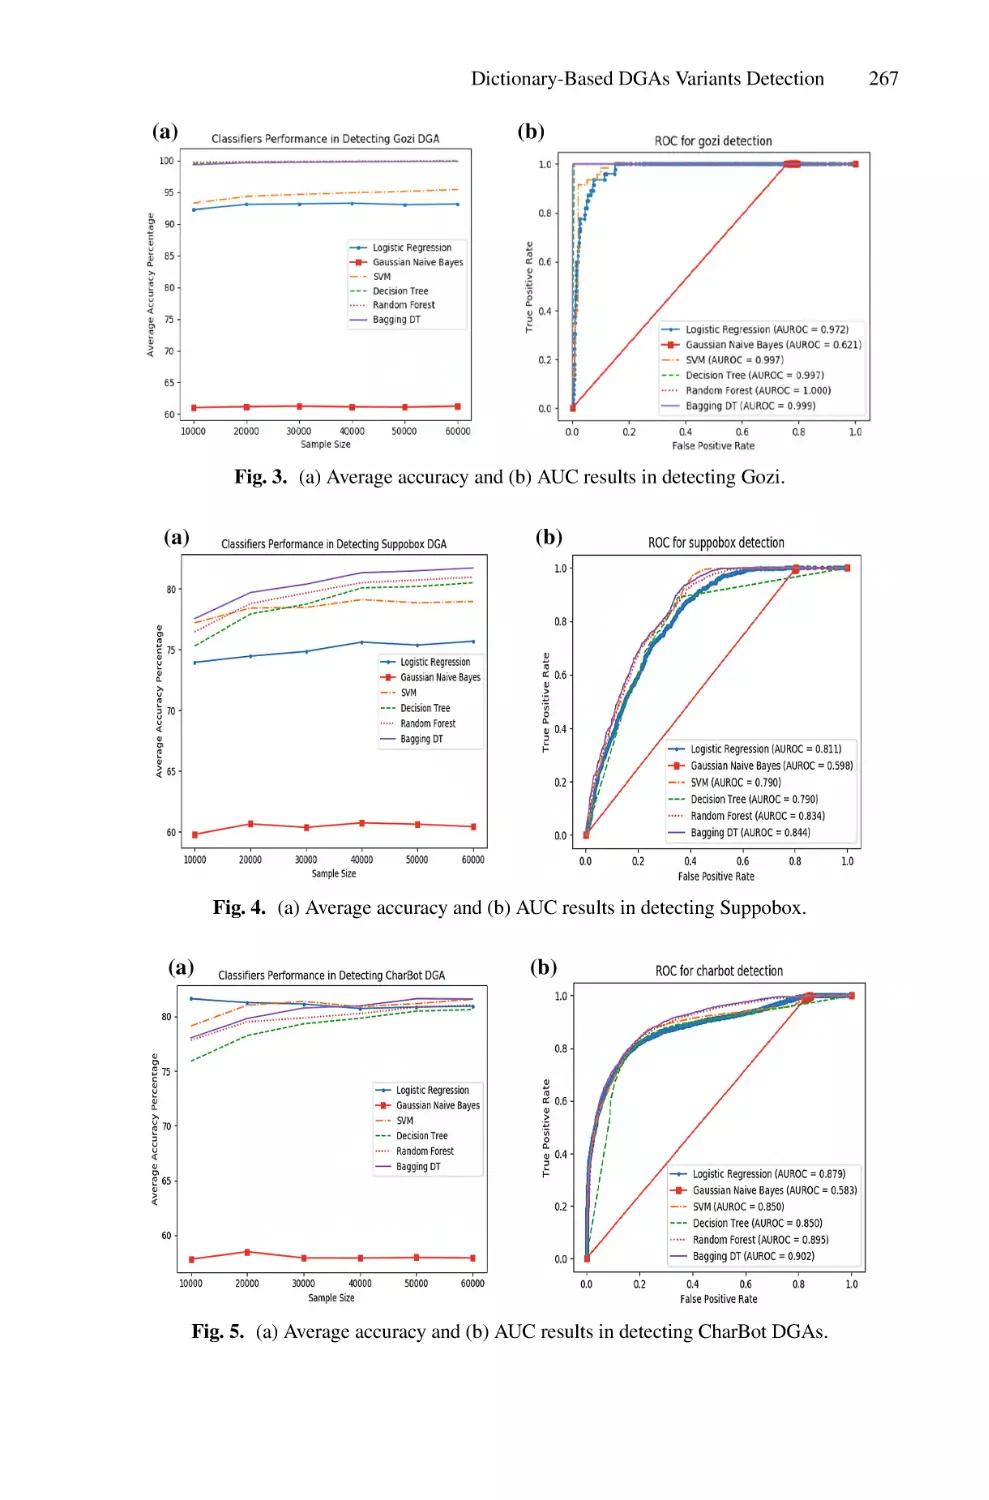
Dictionary-Based DGAs Variants Detection . . . . . . . . . . . . . . . . . . . . . . 258
Raja Azlina Raja Mahmood, Azizol Abdullah, Masnida Hussin,
and Nur Izura Udzir
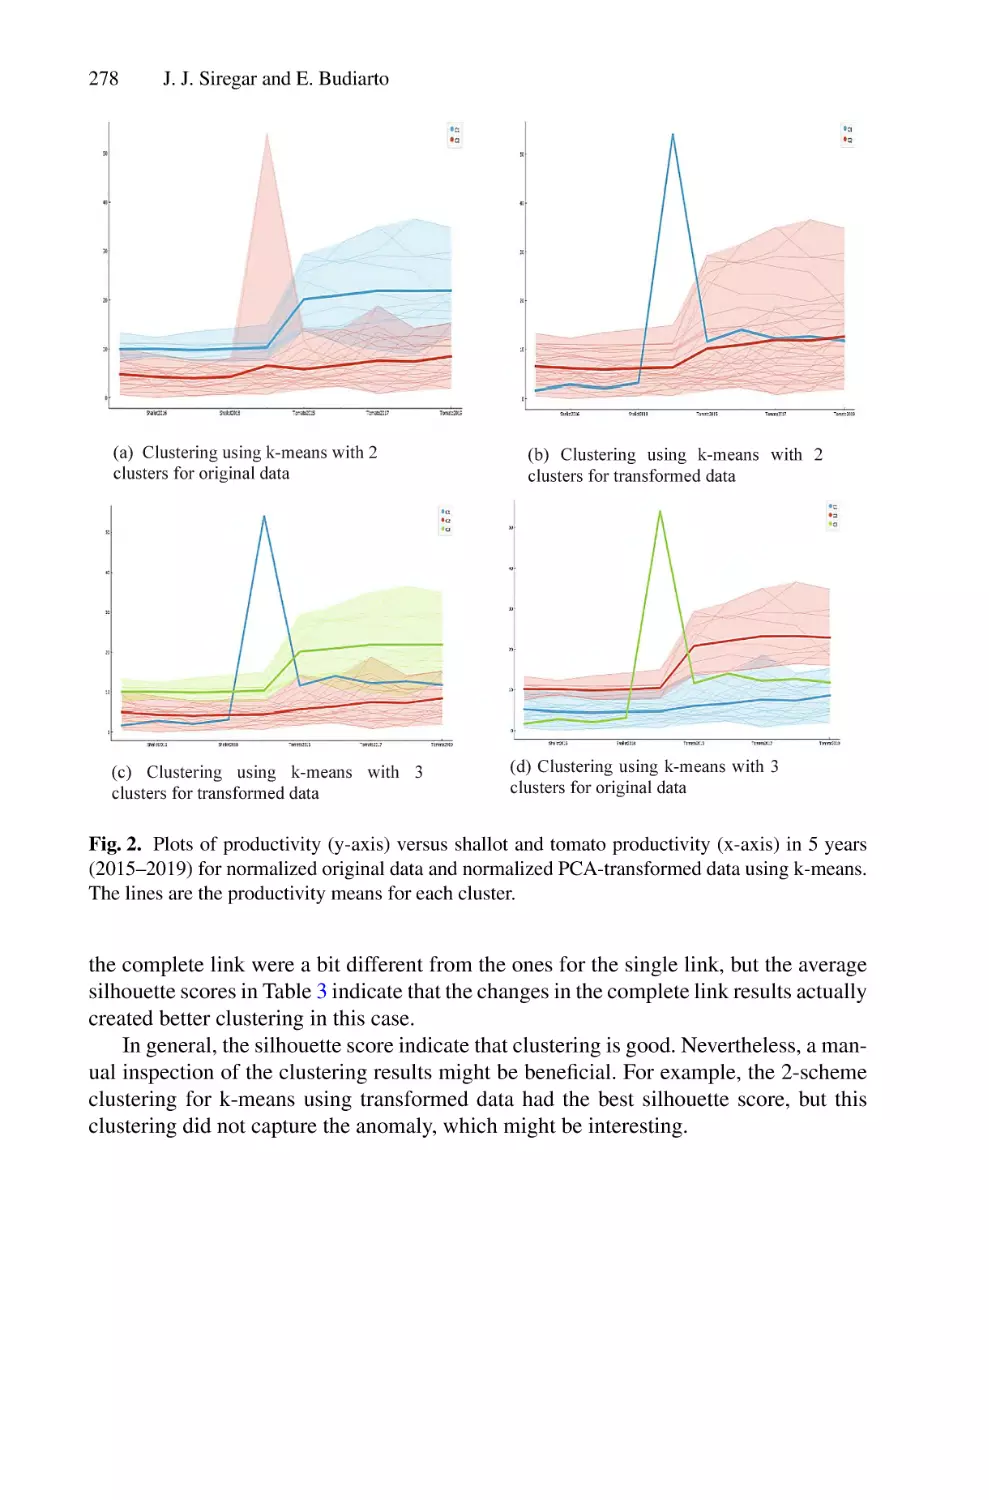
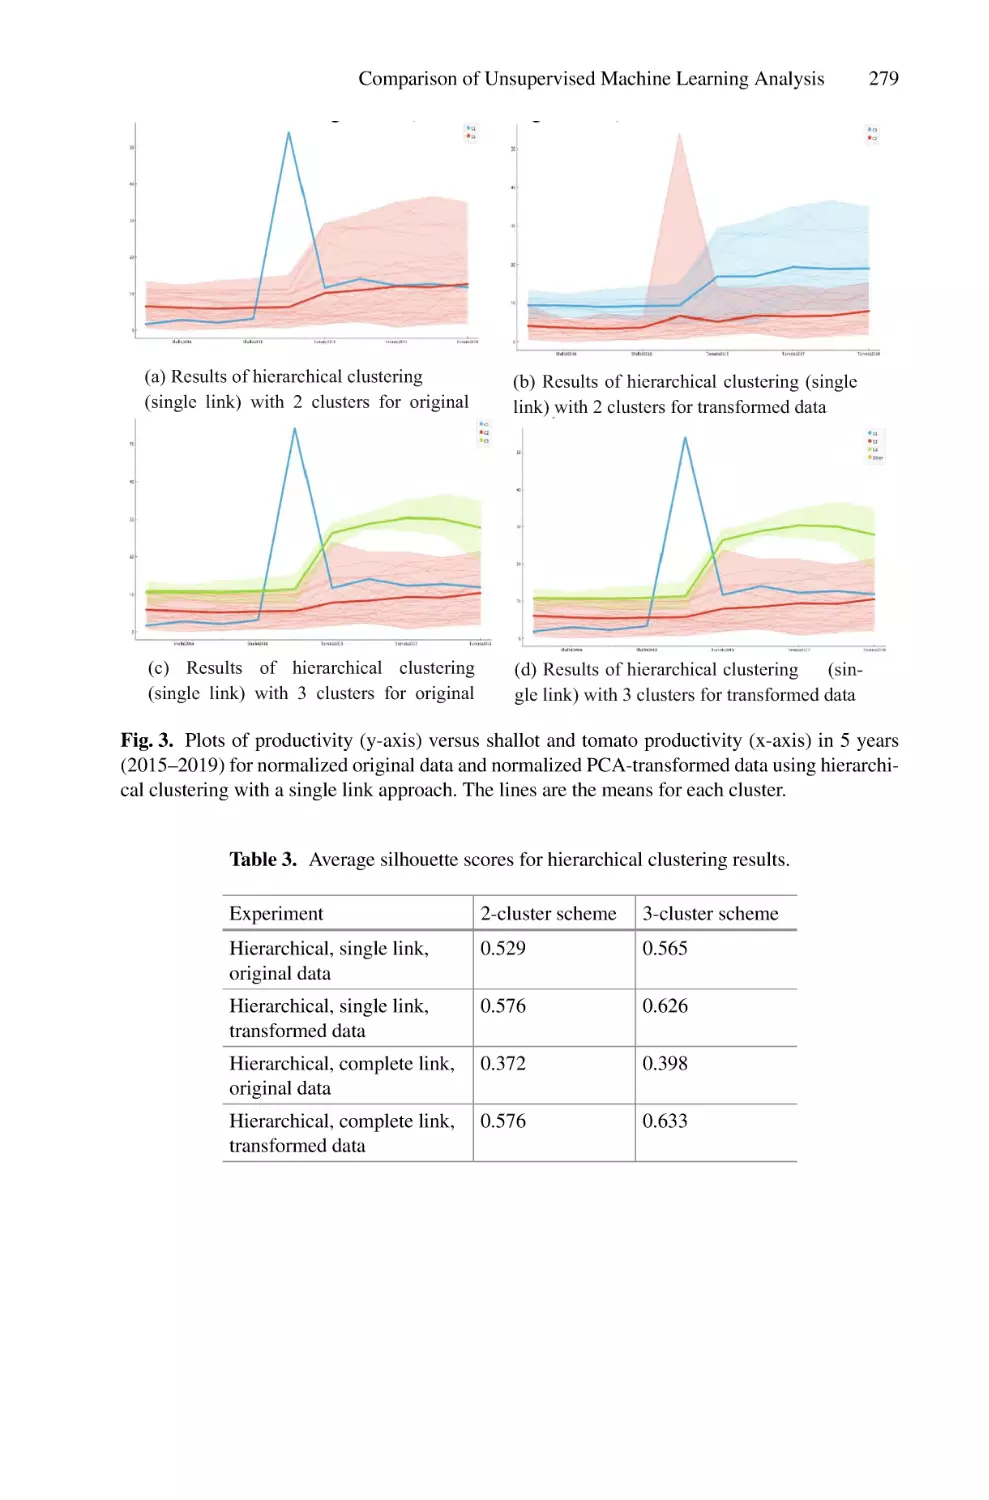
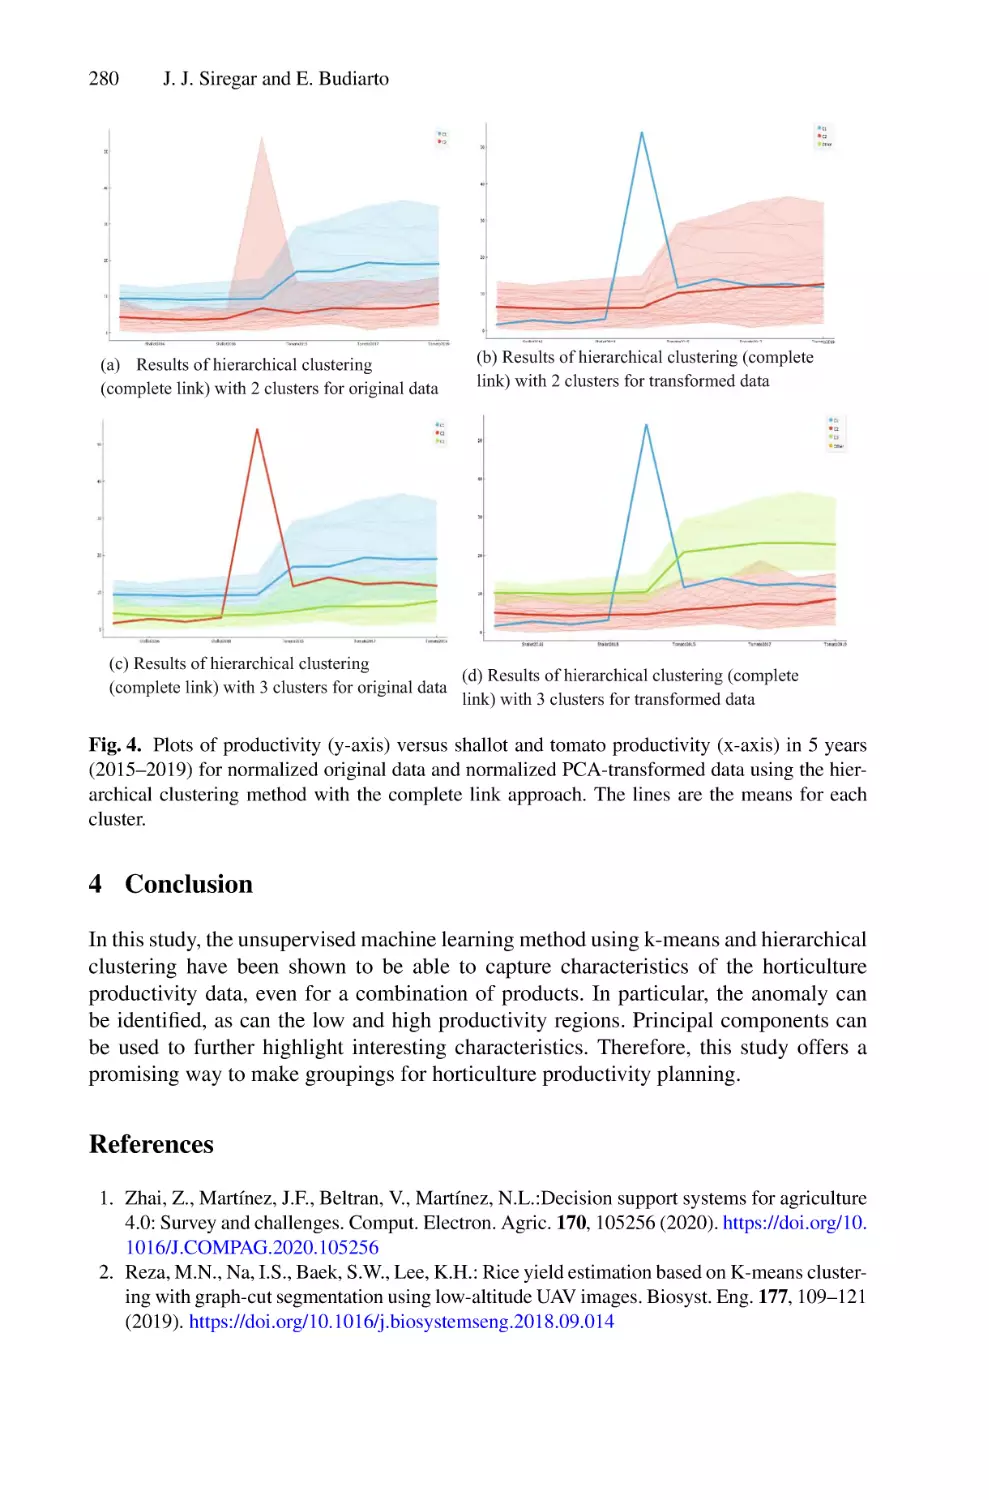
Comparison of Unsupervised Machine Learning Analysis Using
K-Means, Hierarchical Clustering, and Principal Component Analysis
in Horticulture Agribusiness: Shallot and Tomato Productivity
in Indonesia . . . . . . . . . . . . . . . . . . . . . . . . . . . . . . . . . . . . . . . . . . . . . . 270
Junita Juwita Siregar and Eka Budiarto
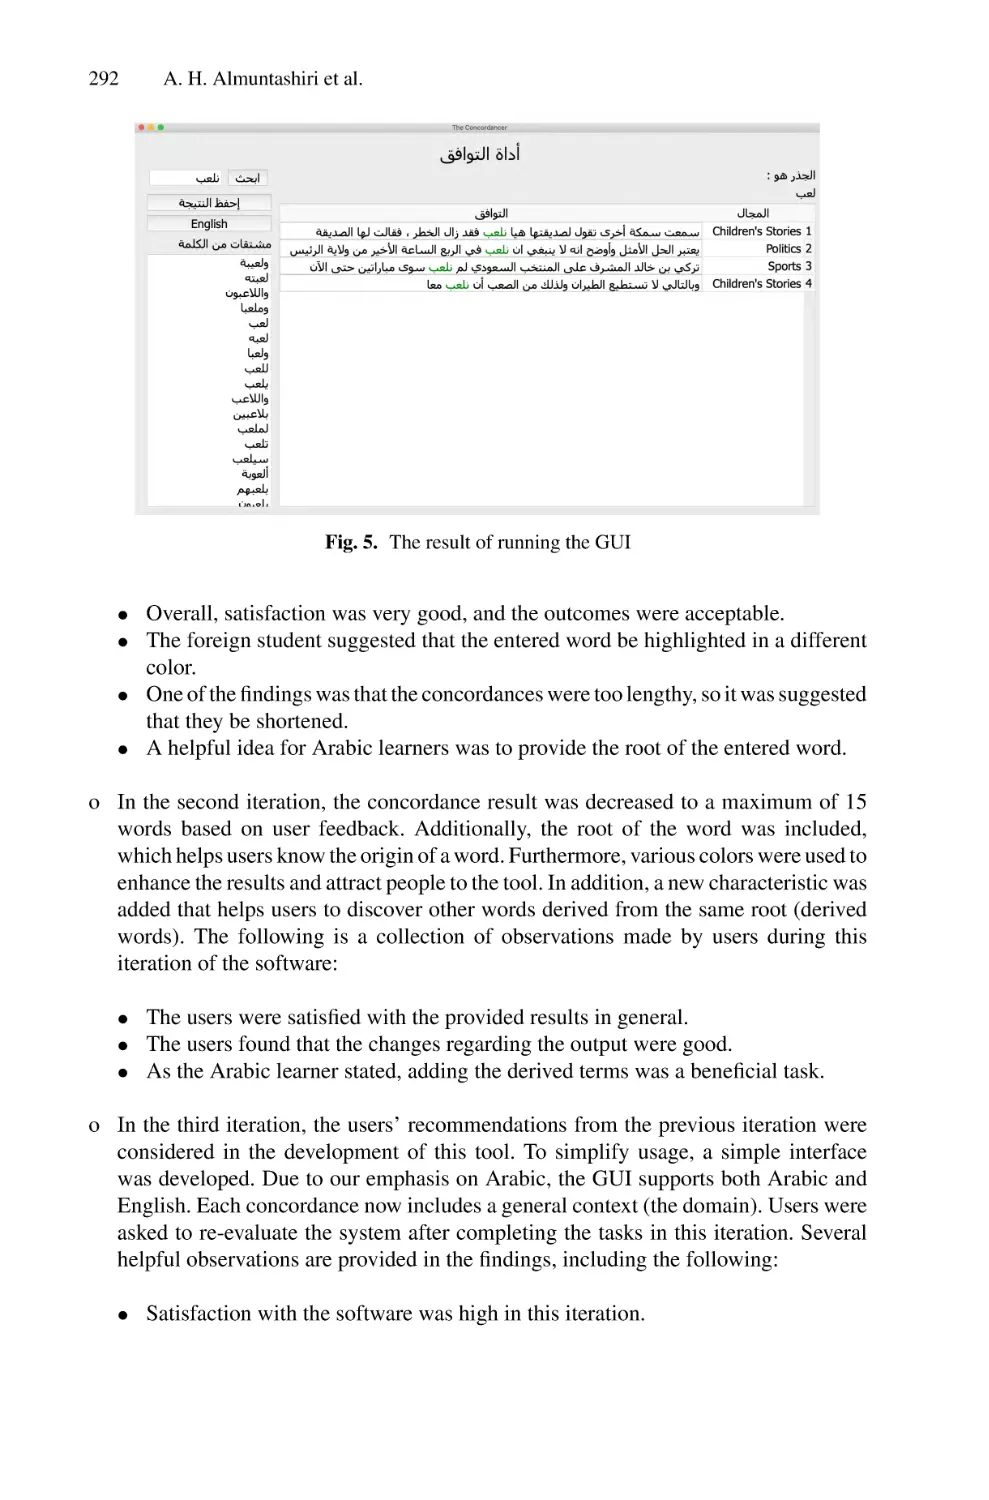
Arabic Auto-CON: Automated Arabic Concordancer Construction
from Arabic Corpus . . . . . . . . . . . . . . . . . . . . . . . . . . . . . . . . . . . . . . . . 283
Abdullah H. Almuntashiri, Mohammed Al-Sarem, Omar F. Aloufi,
Abdel-Hamid Emara, and Mhd Ammar Alsalka
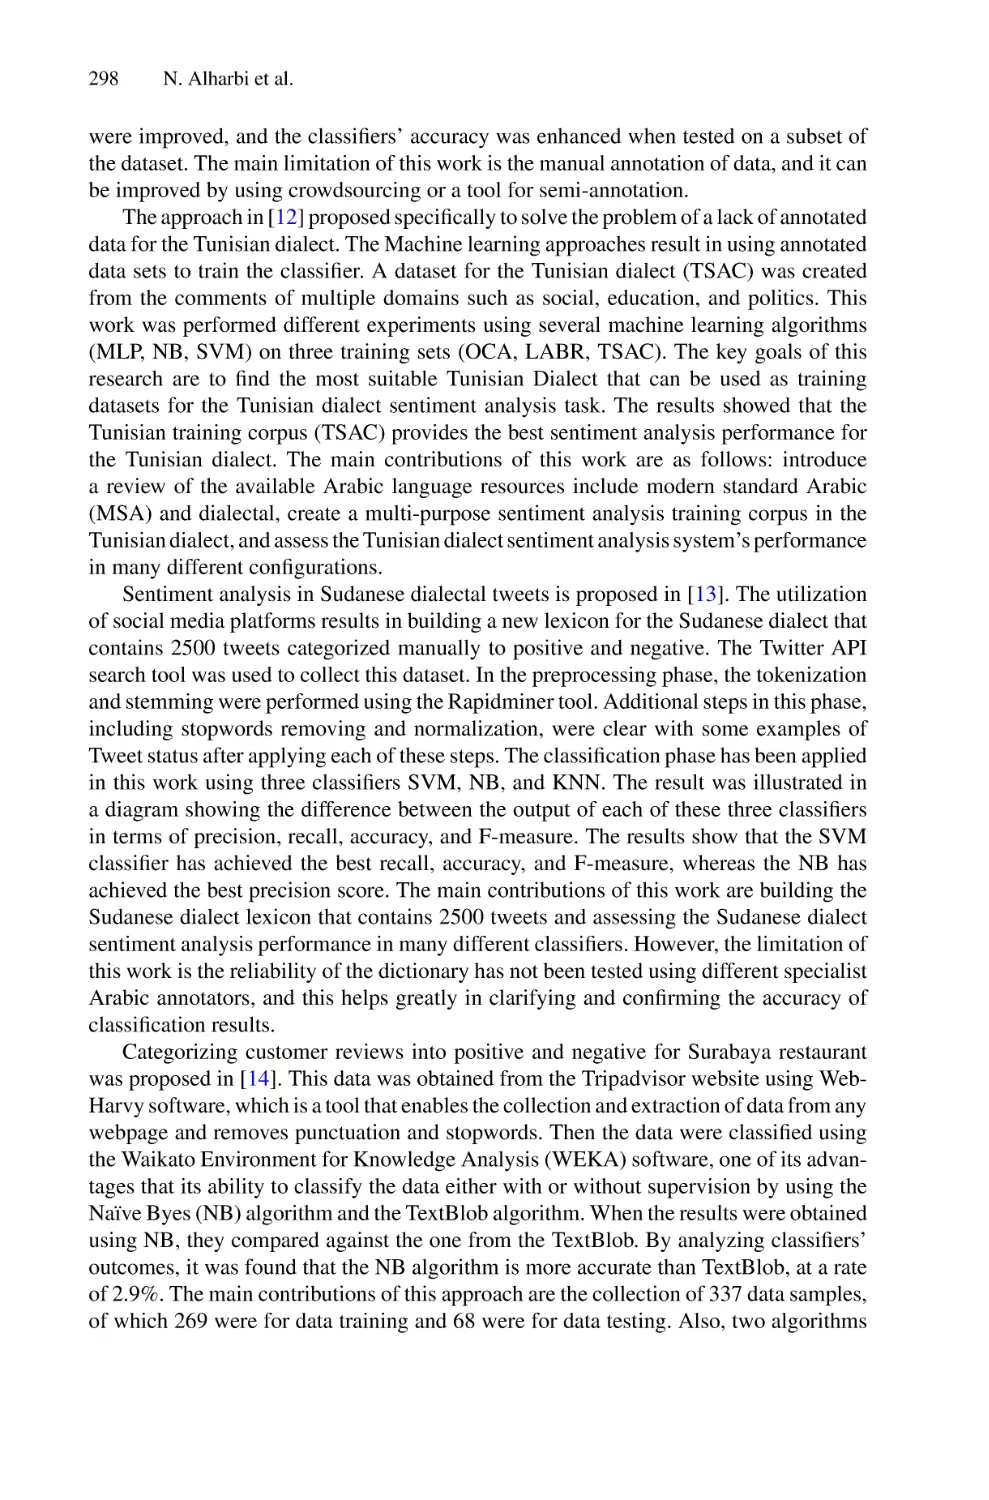
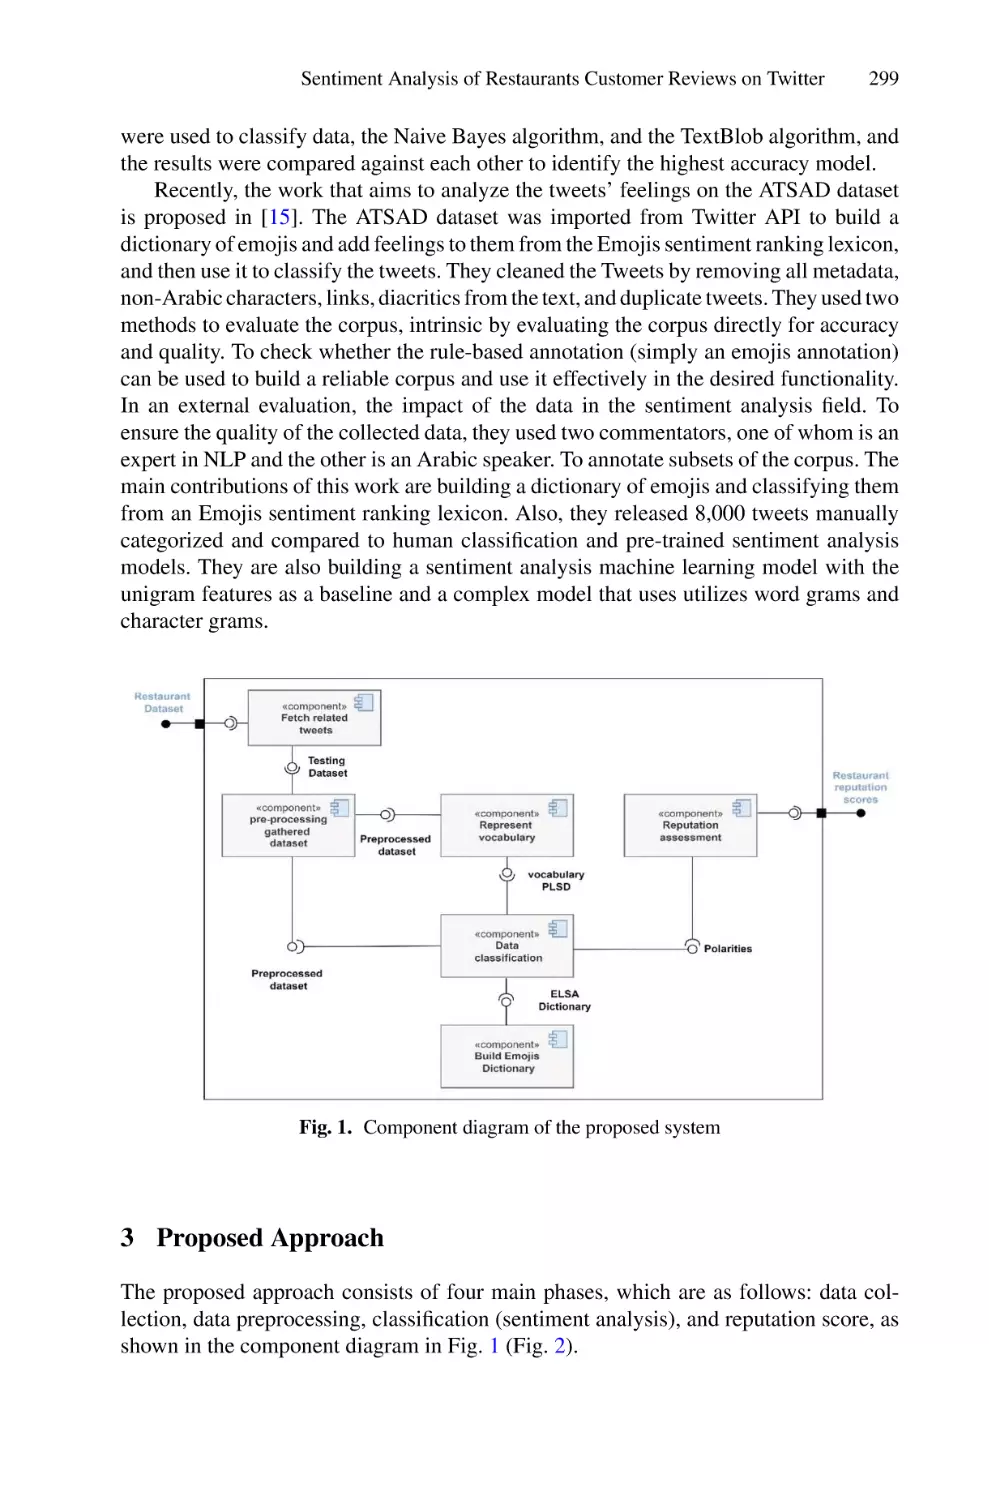
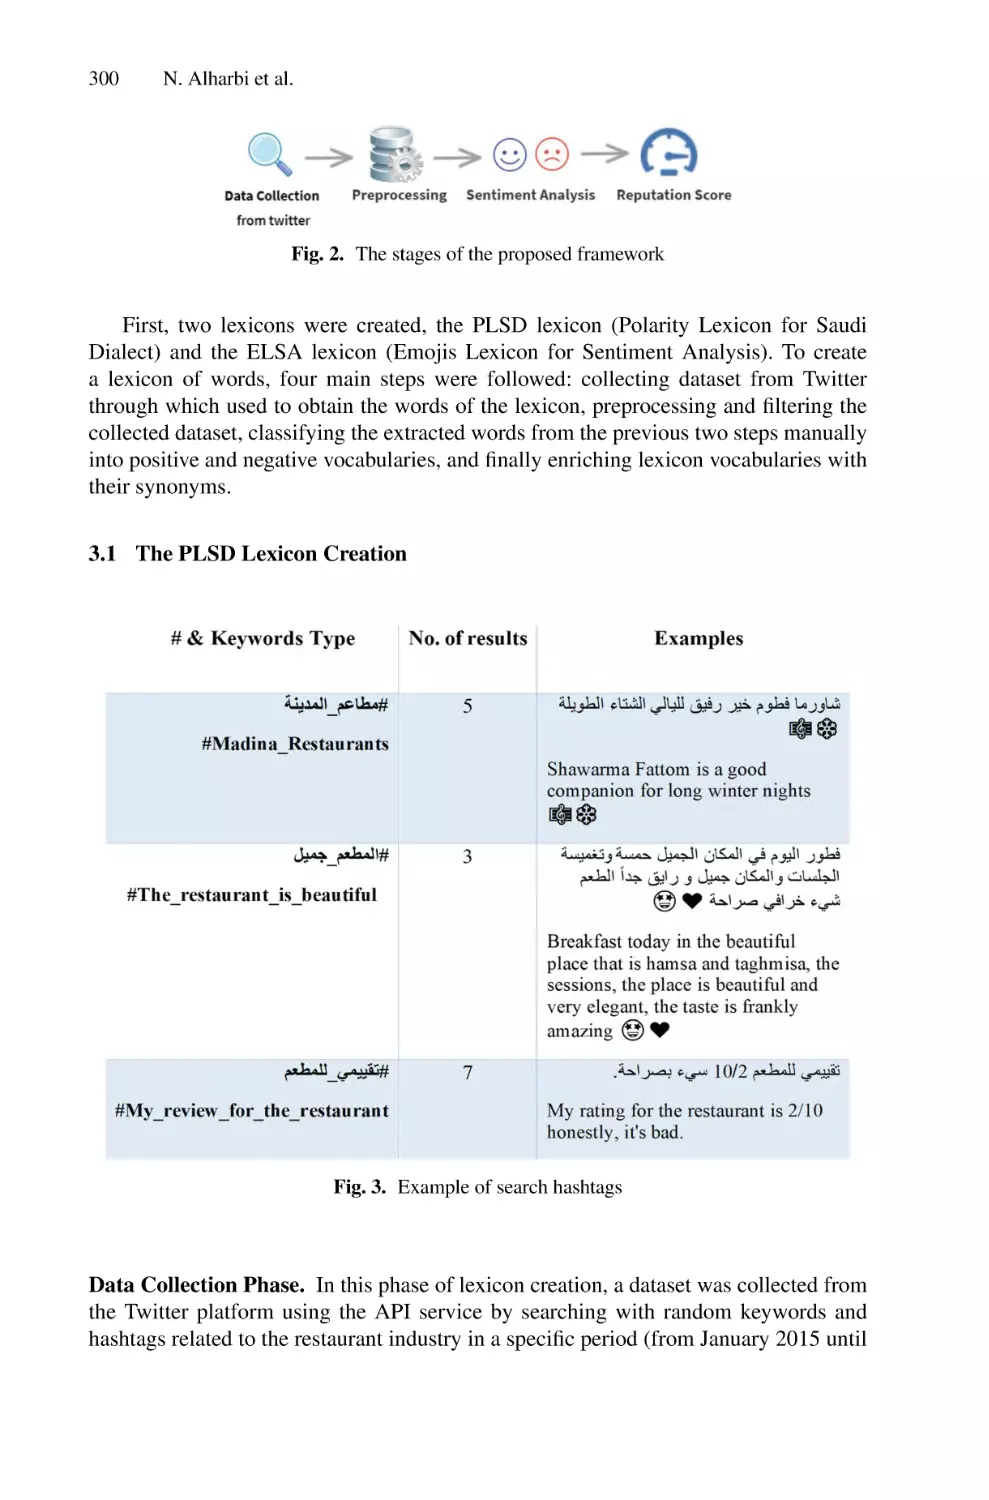
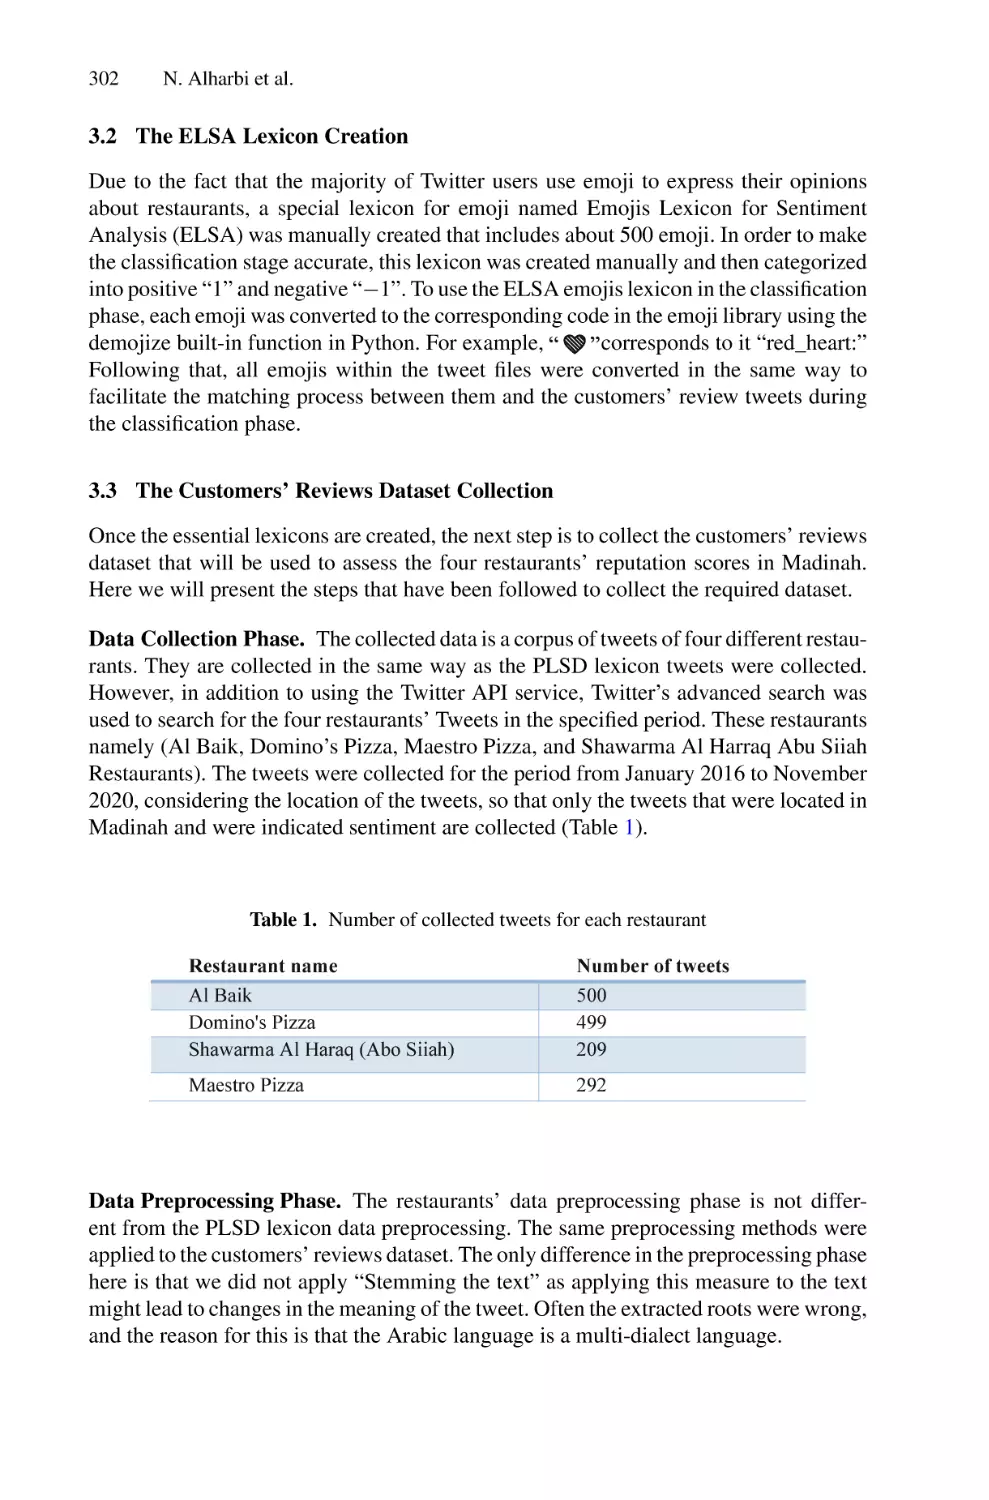
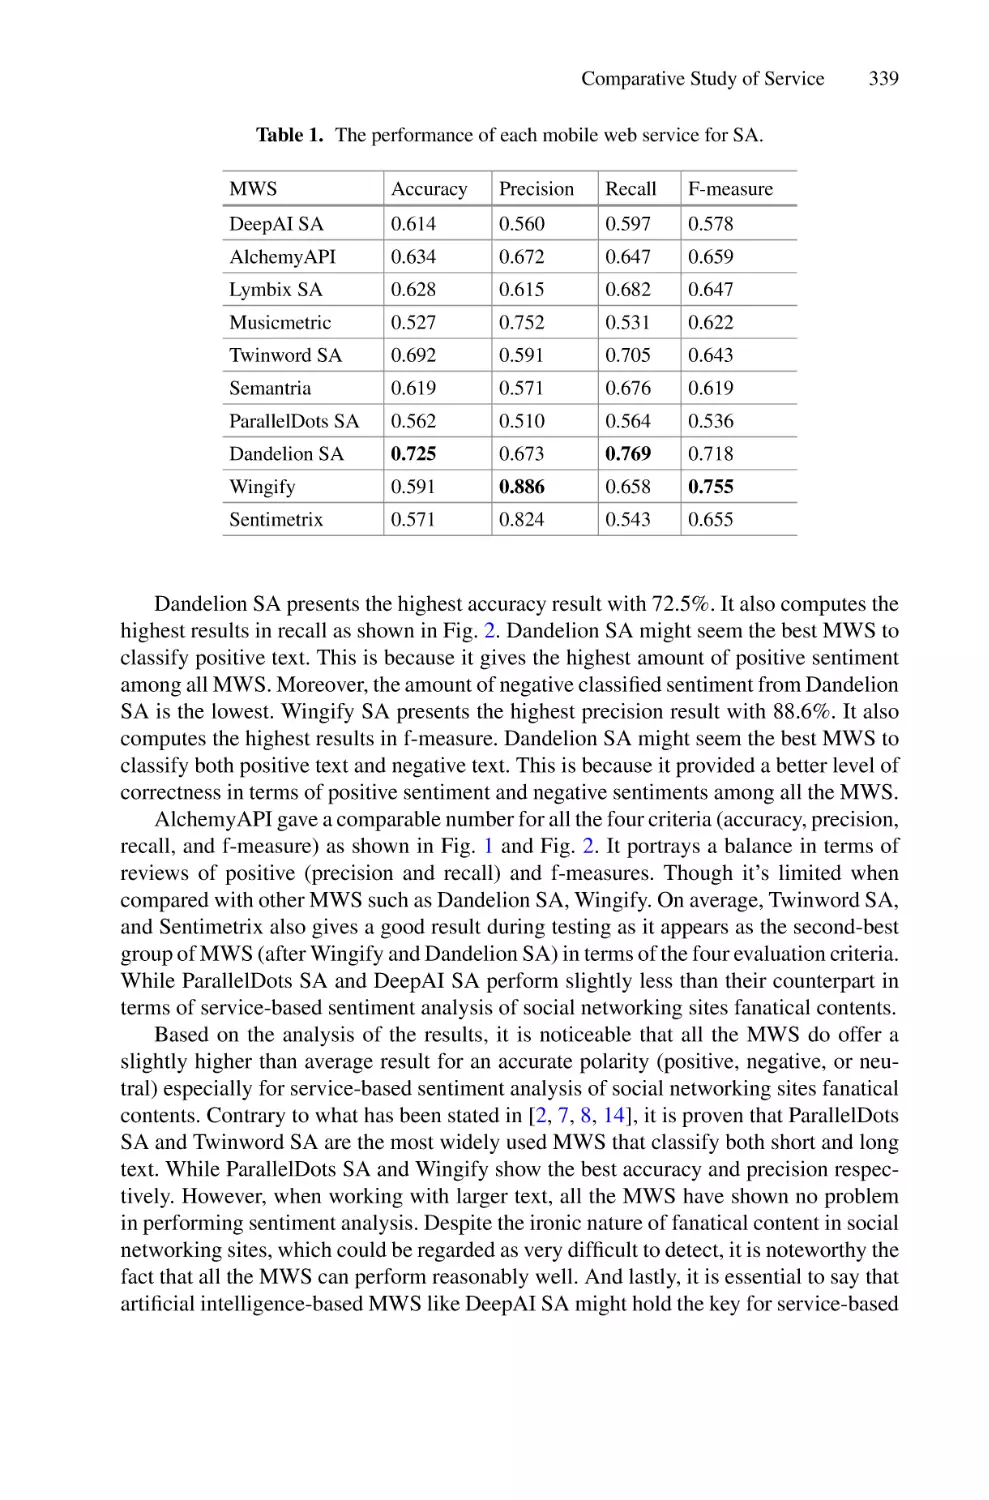
Sentiment Analysis of Restaurants Customer Reviews on Twitter . . . . . 295
Nouf Alharbi, Ohoud Moqbel Al-Mohammadi,
Raghad Abdullah Al-Rehaili, Shatha Abdulhadi Al-Rehaili,
and Heba Abdullah Al-Harbi
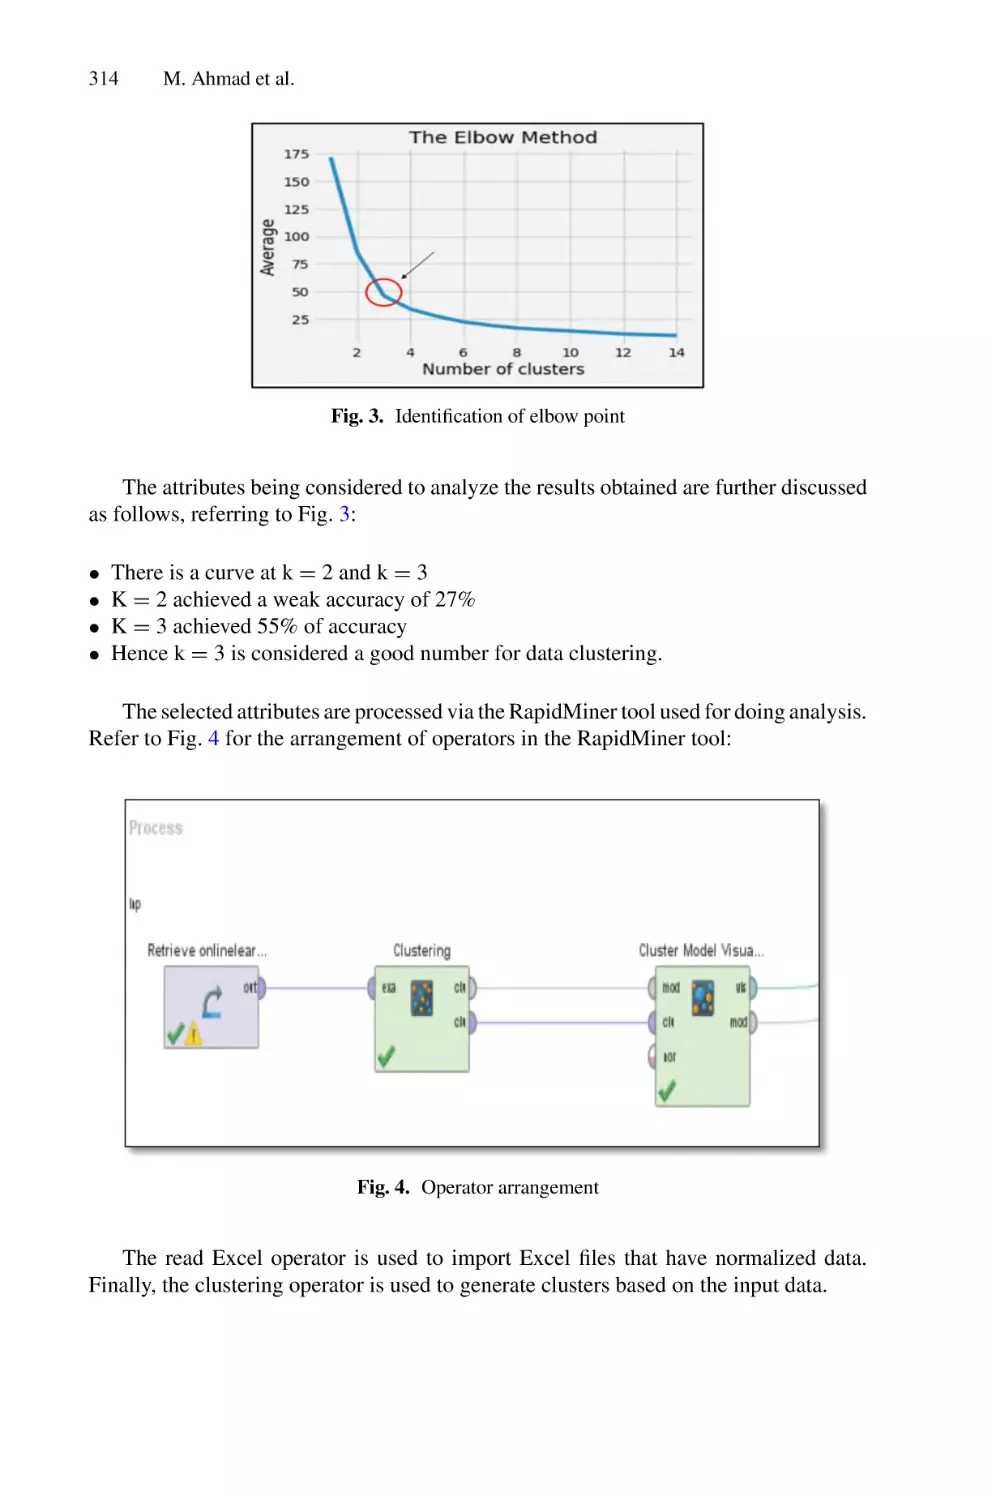
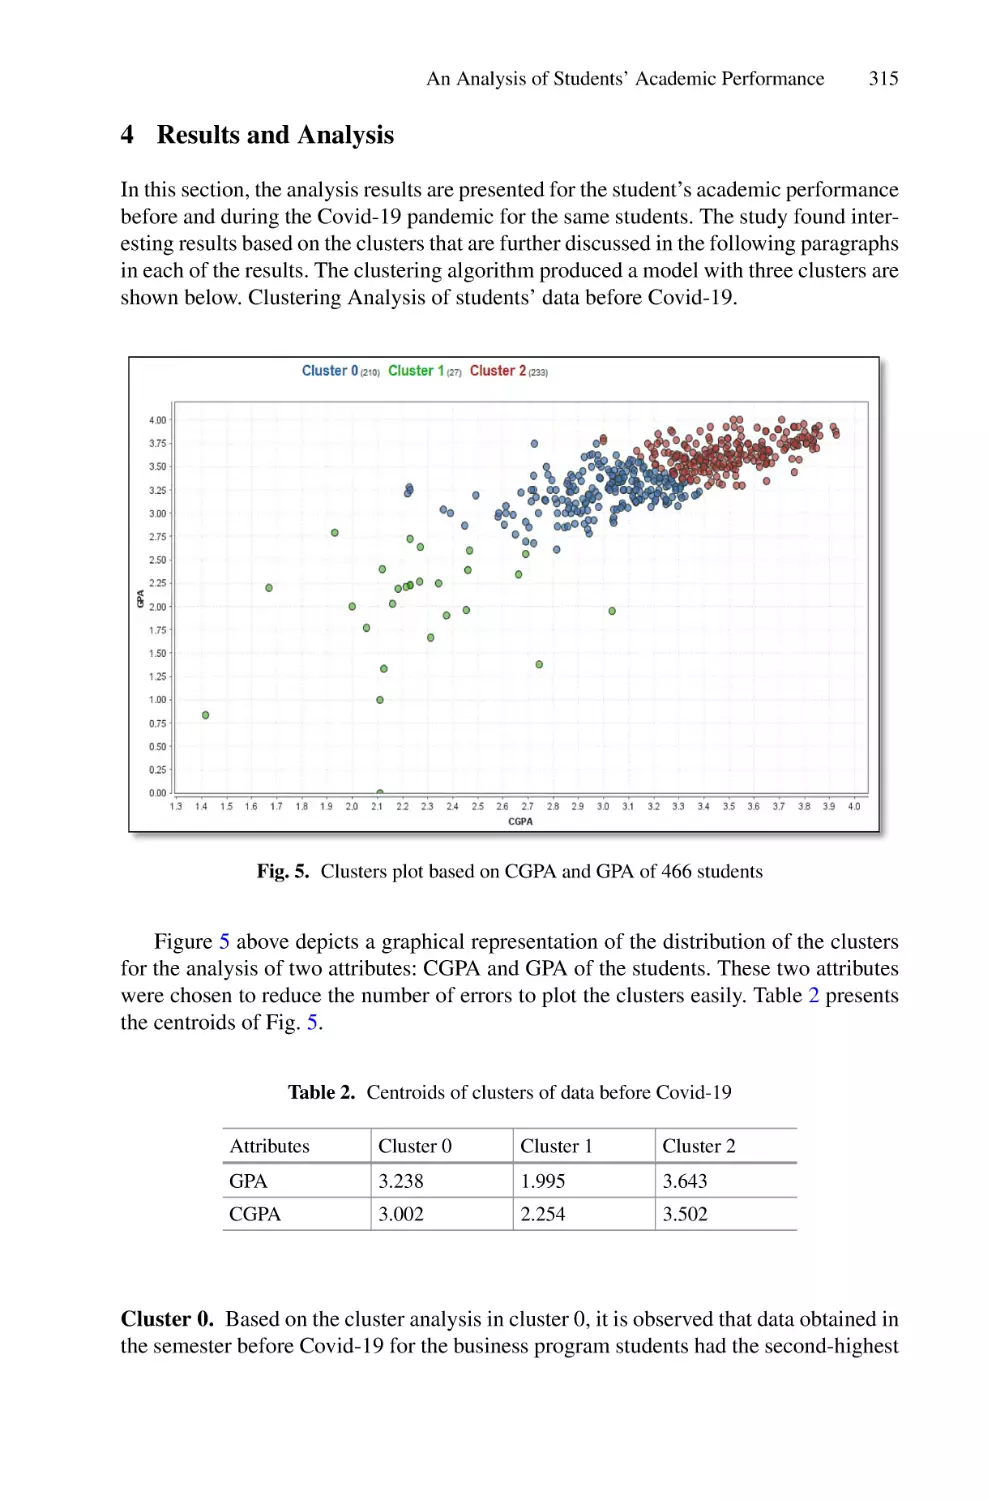
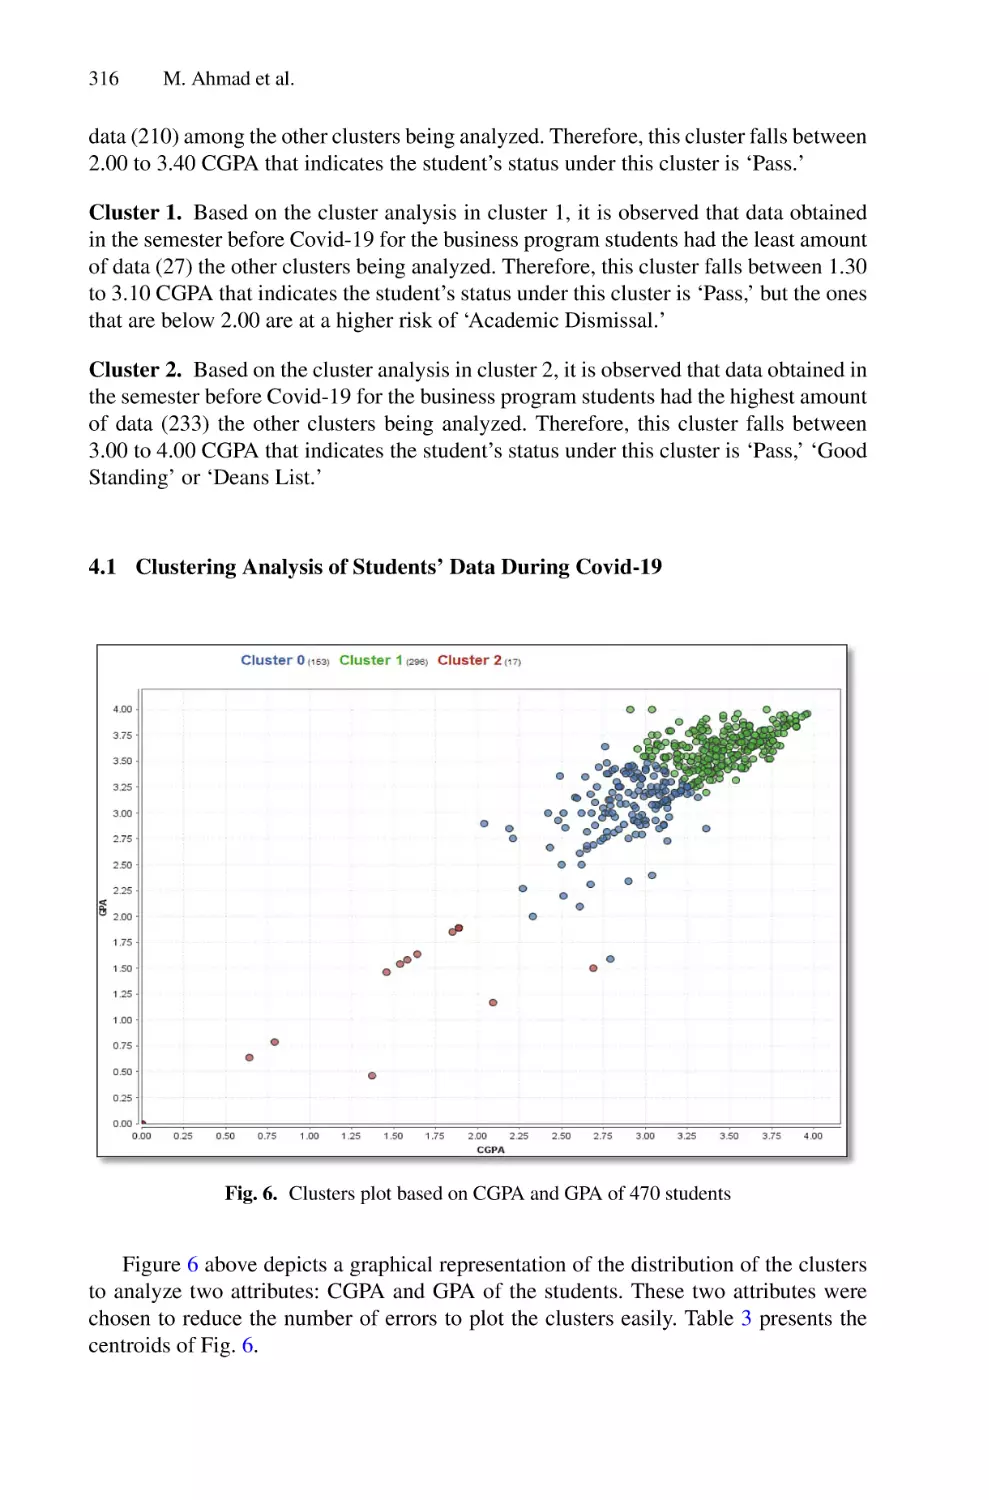
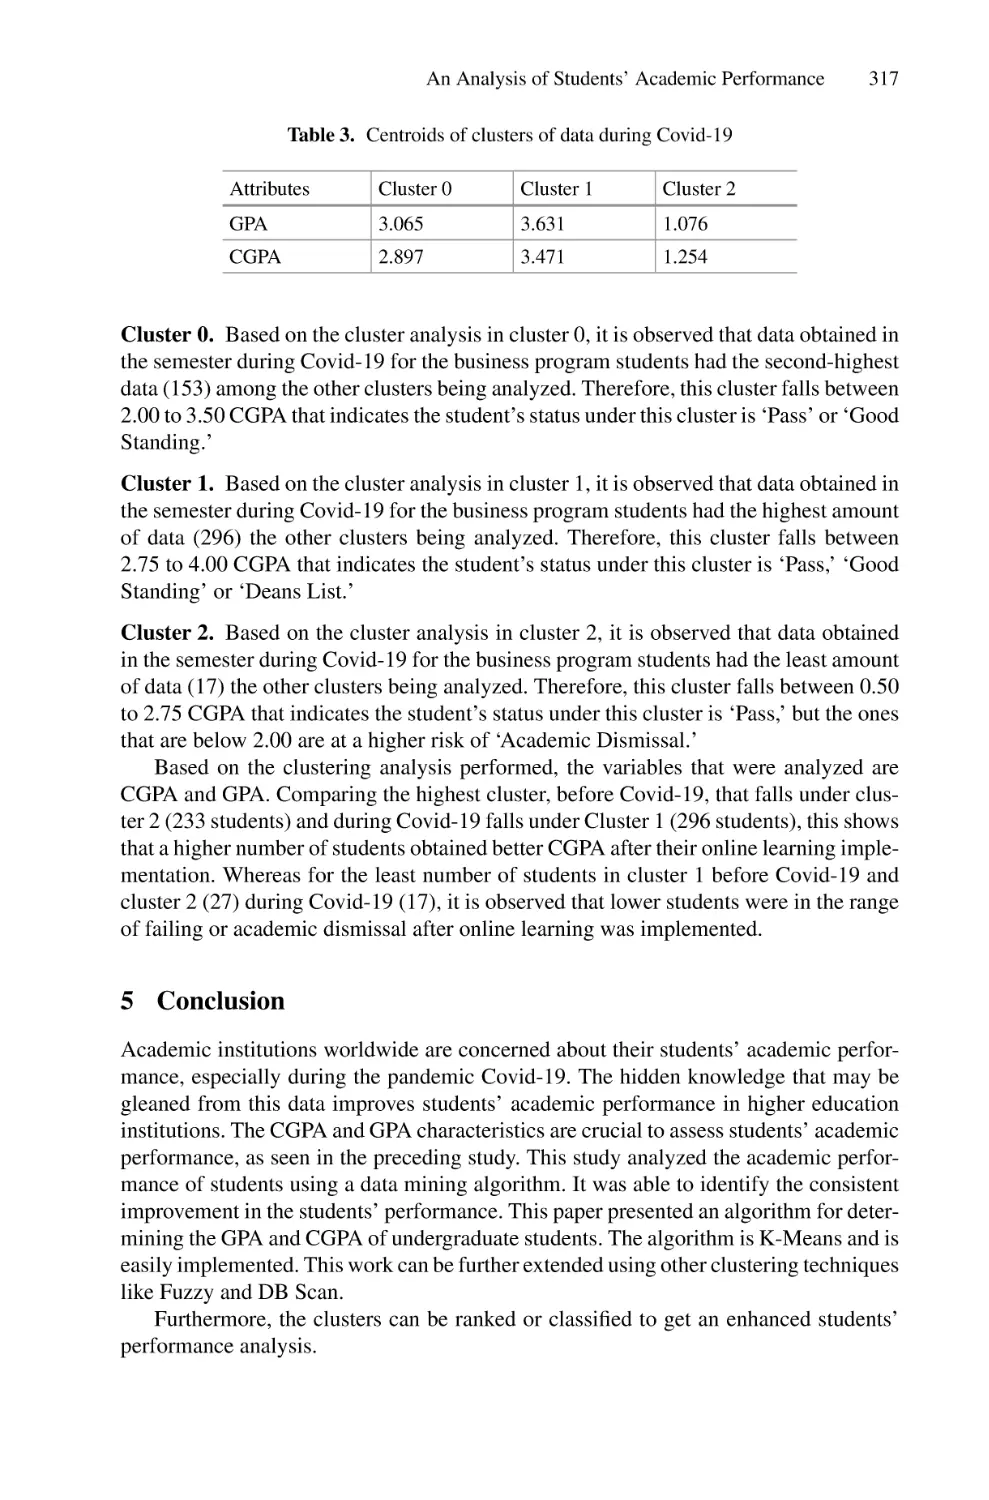
An Analysis of Students’ Academic Performance Using K-Means
Clustering Algorithm . . . . . . . . . . . . . . . . . . . . . . . . . . . . . . . . . . . . . . . 309
Maryam Ahmad, Noreen Izza Bt Arshad, and Aliza Bt Sarlan
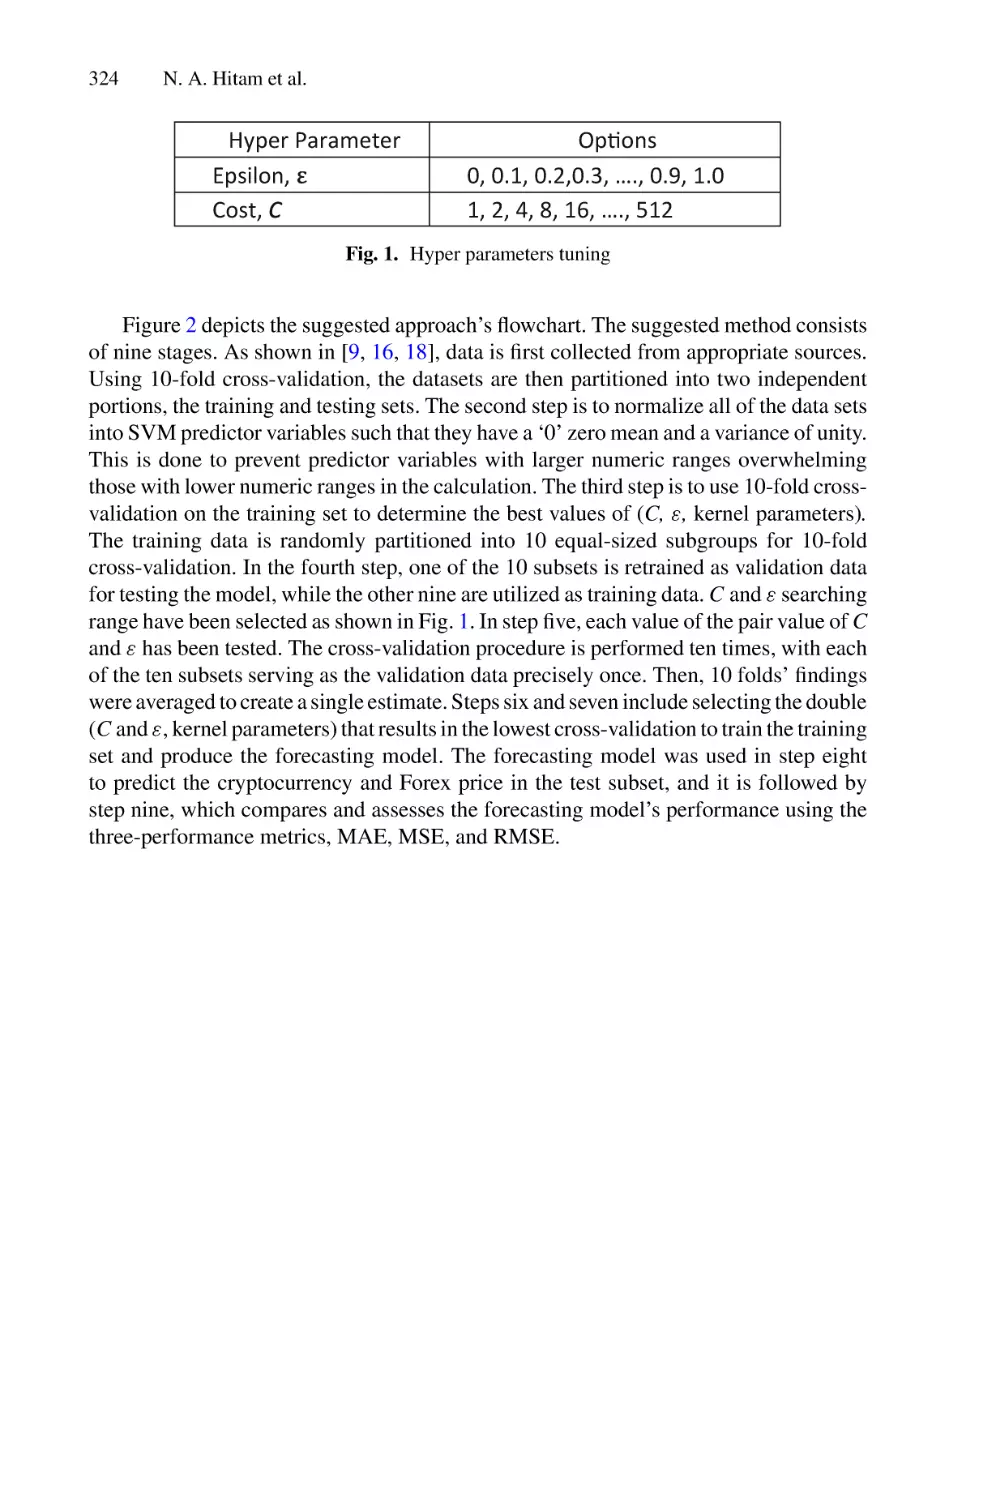
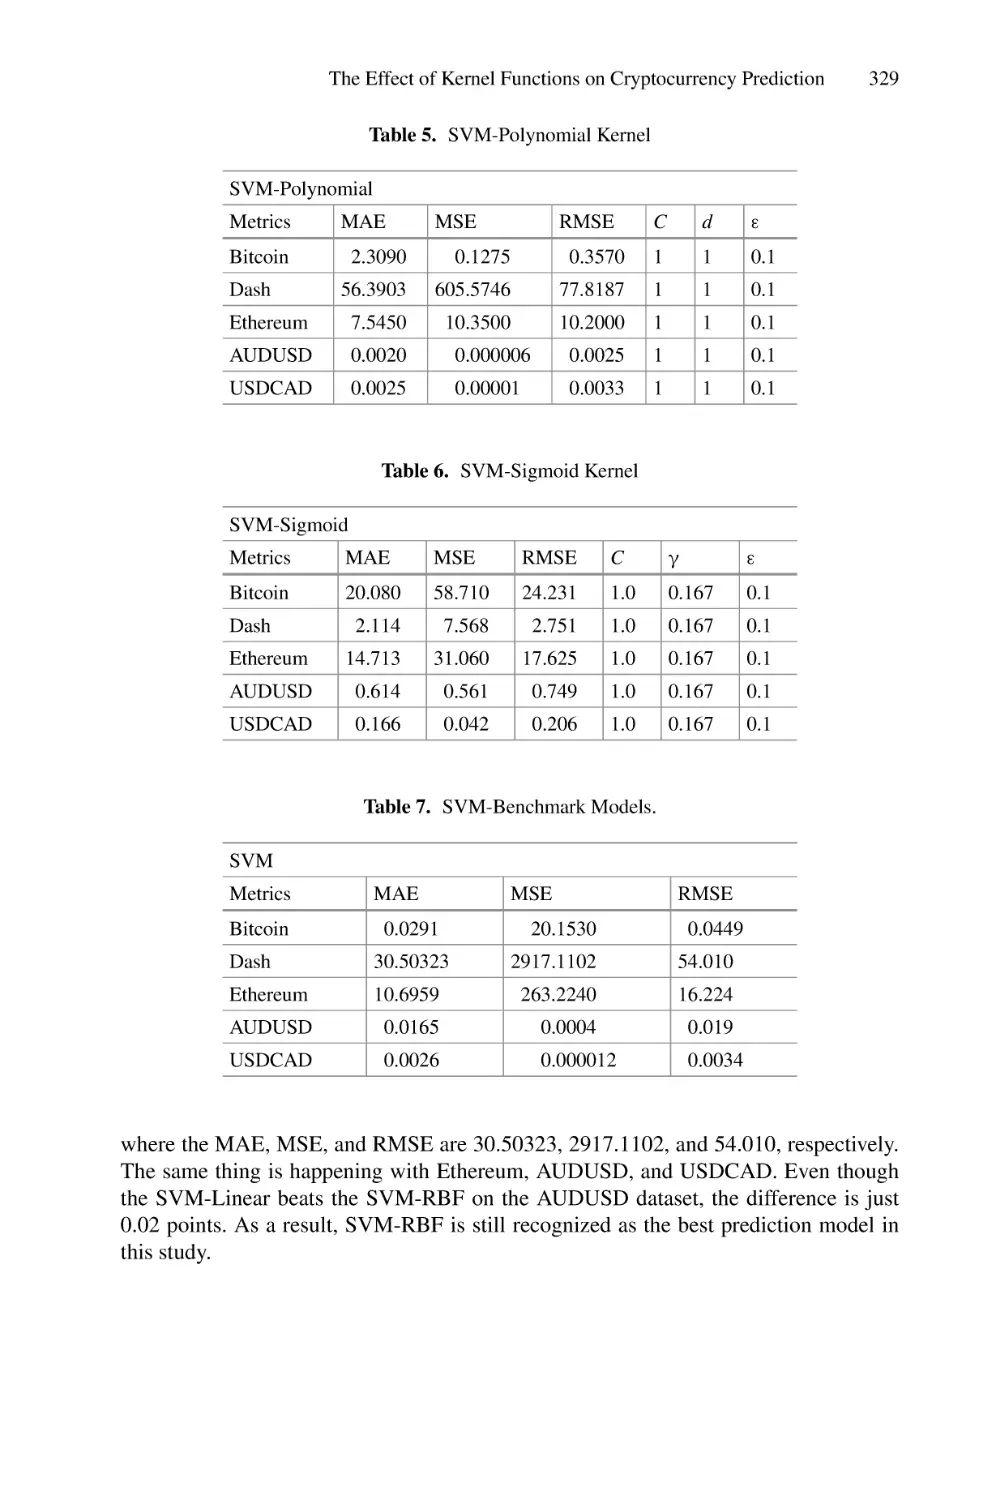
The Effect of Kernel Functions on Cryptocurrency Prediction Using
Support Vector Machines . . . . . . . . . . . . . . . . . . . . . . . . . . . . . . . . . . . . 319
Nor Azizah Hitam, Amelia Ritahani Ismail, Ruhaidah Samsudin,
and Eman H. Alkhammash
xiv
Contents
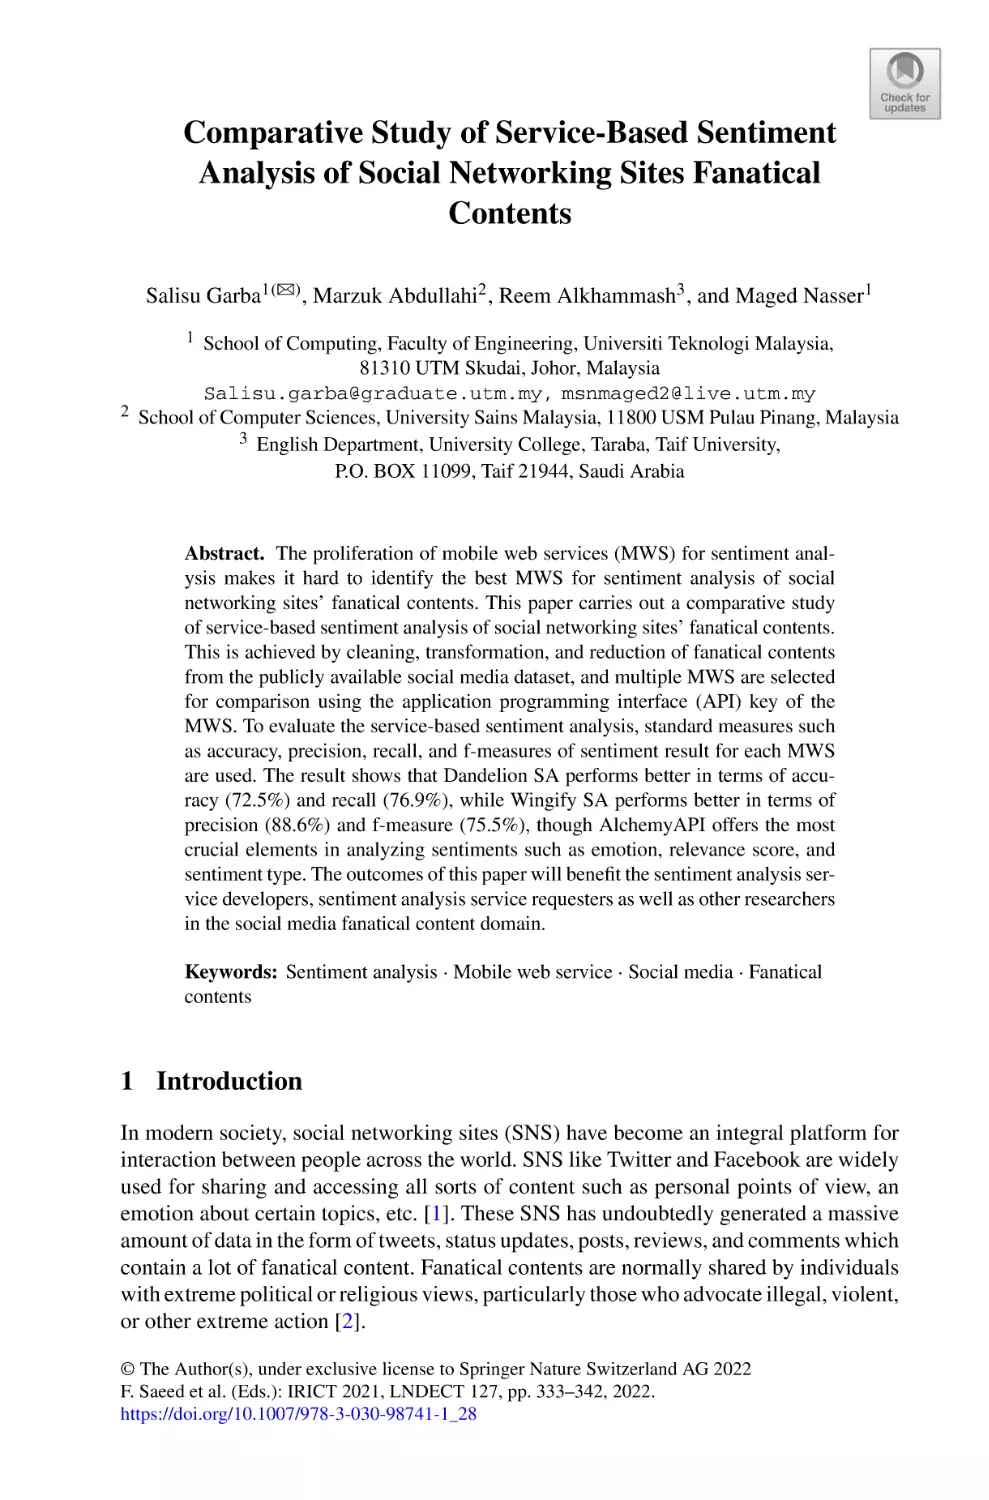
Comparative Study of Service-Based Sentiment Analysis of Social
Networking Sites Fanatical Contents . . . . . . . . . . . . . . . . . . . . . . . . . . . 333
Salisu Garba, Marzuk Abdullahi, Reem Alkhammash, and Maged Nasser
Networking and IoT
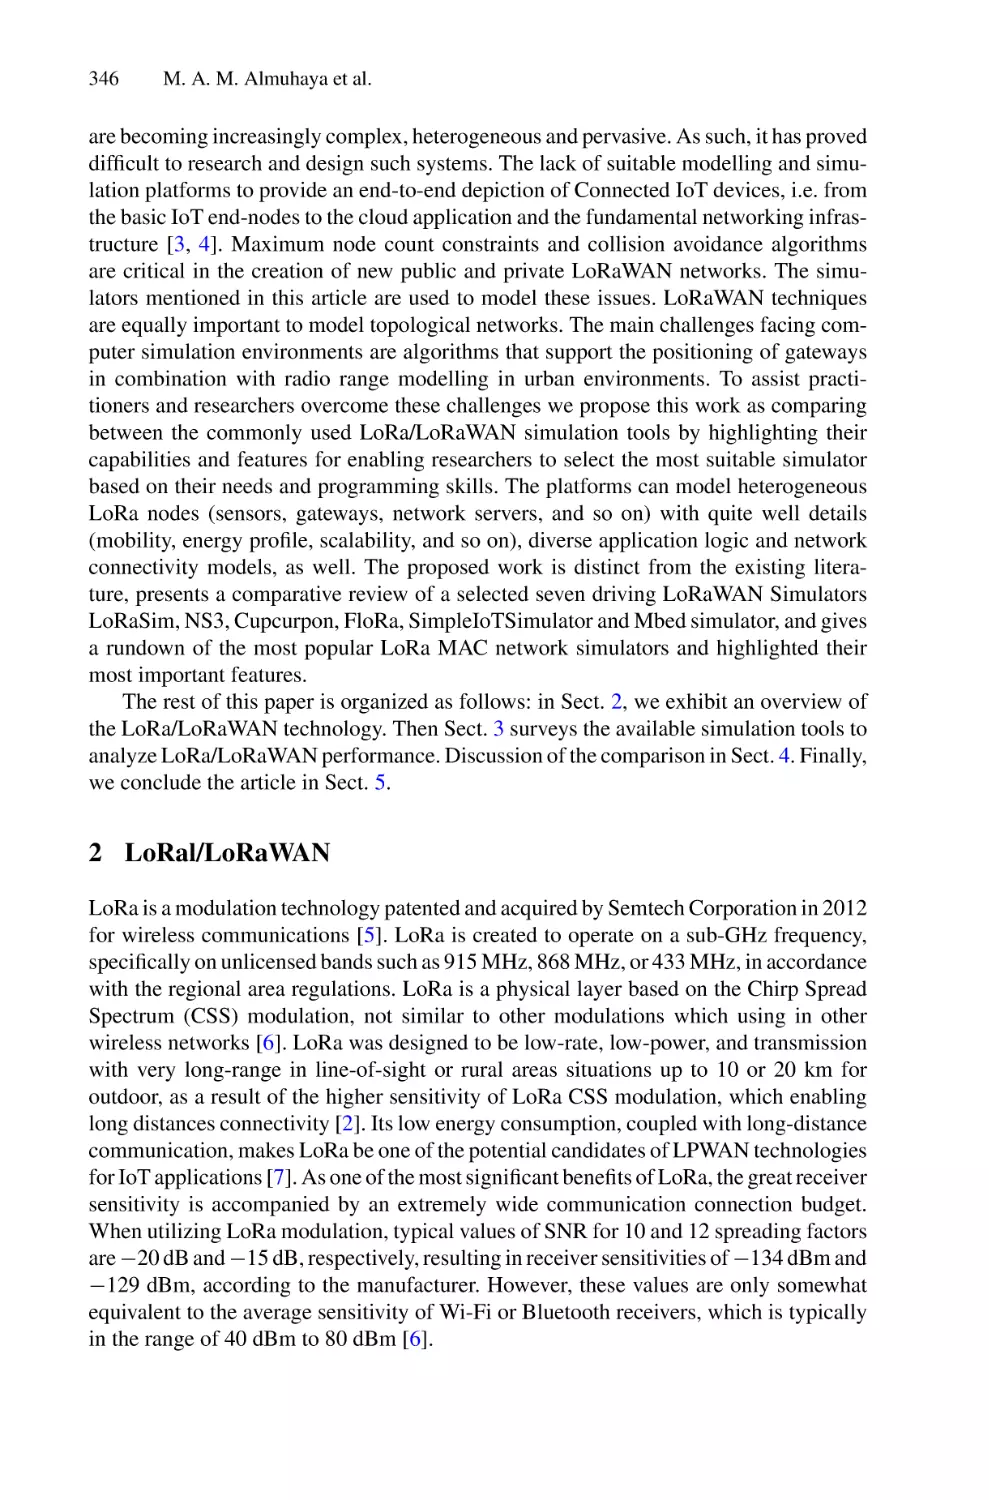
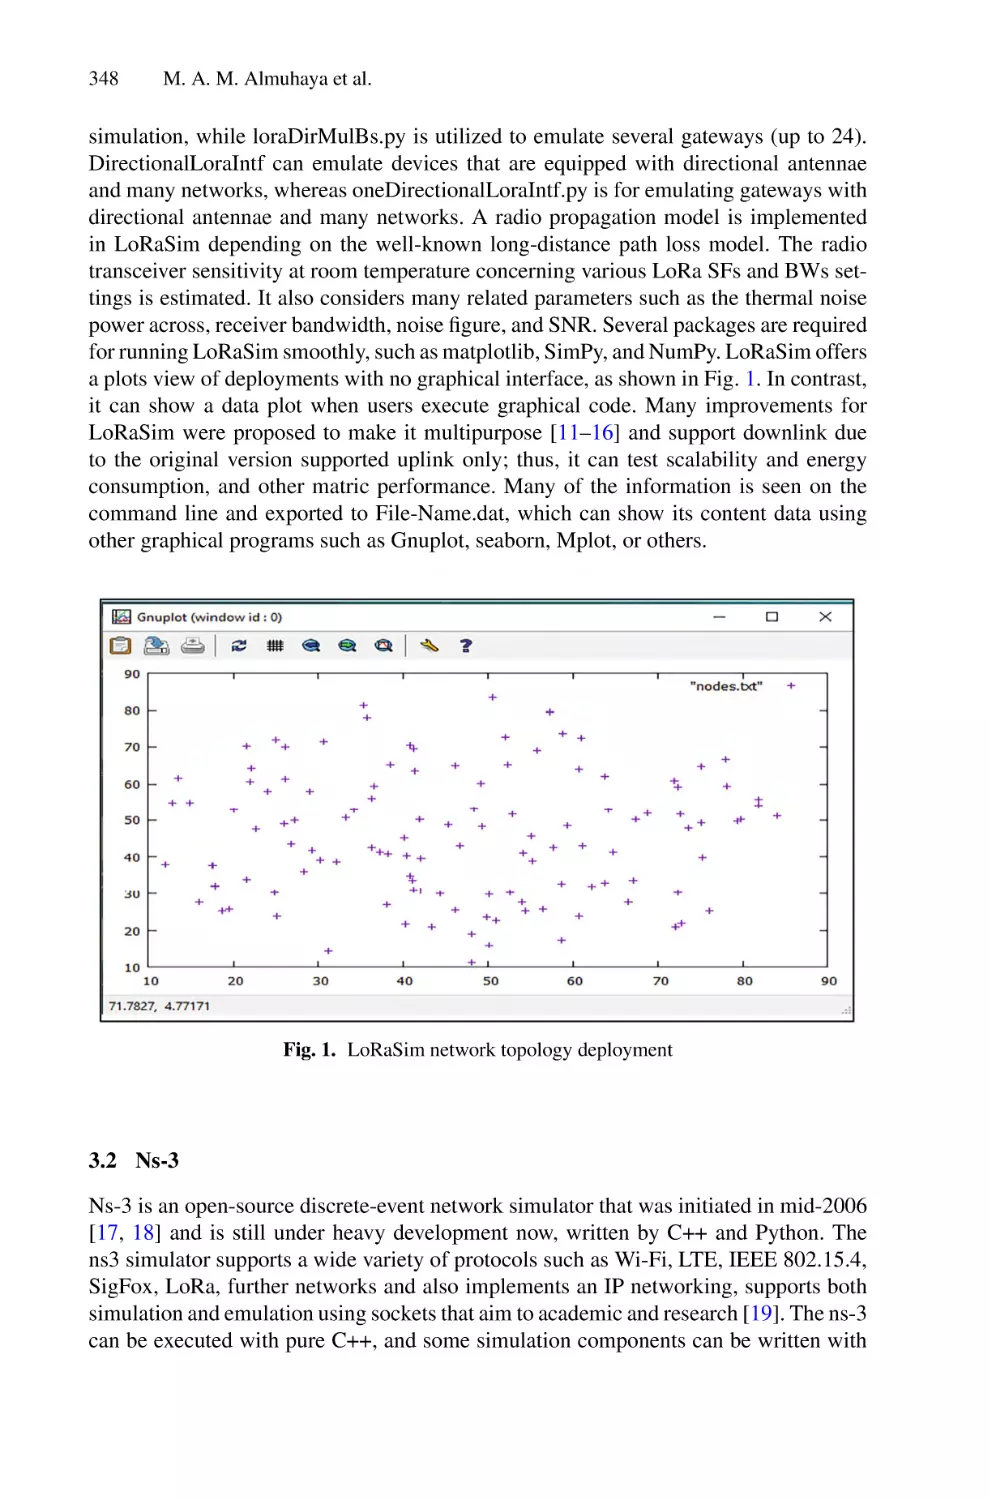
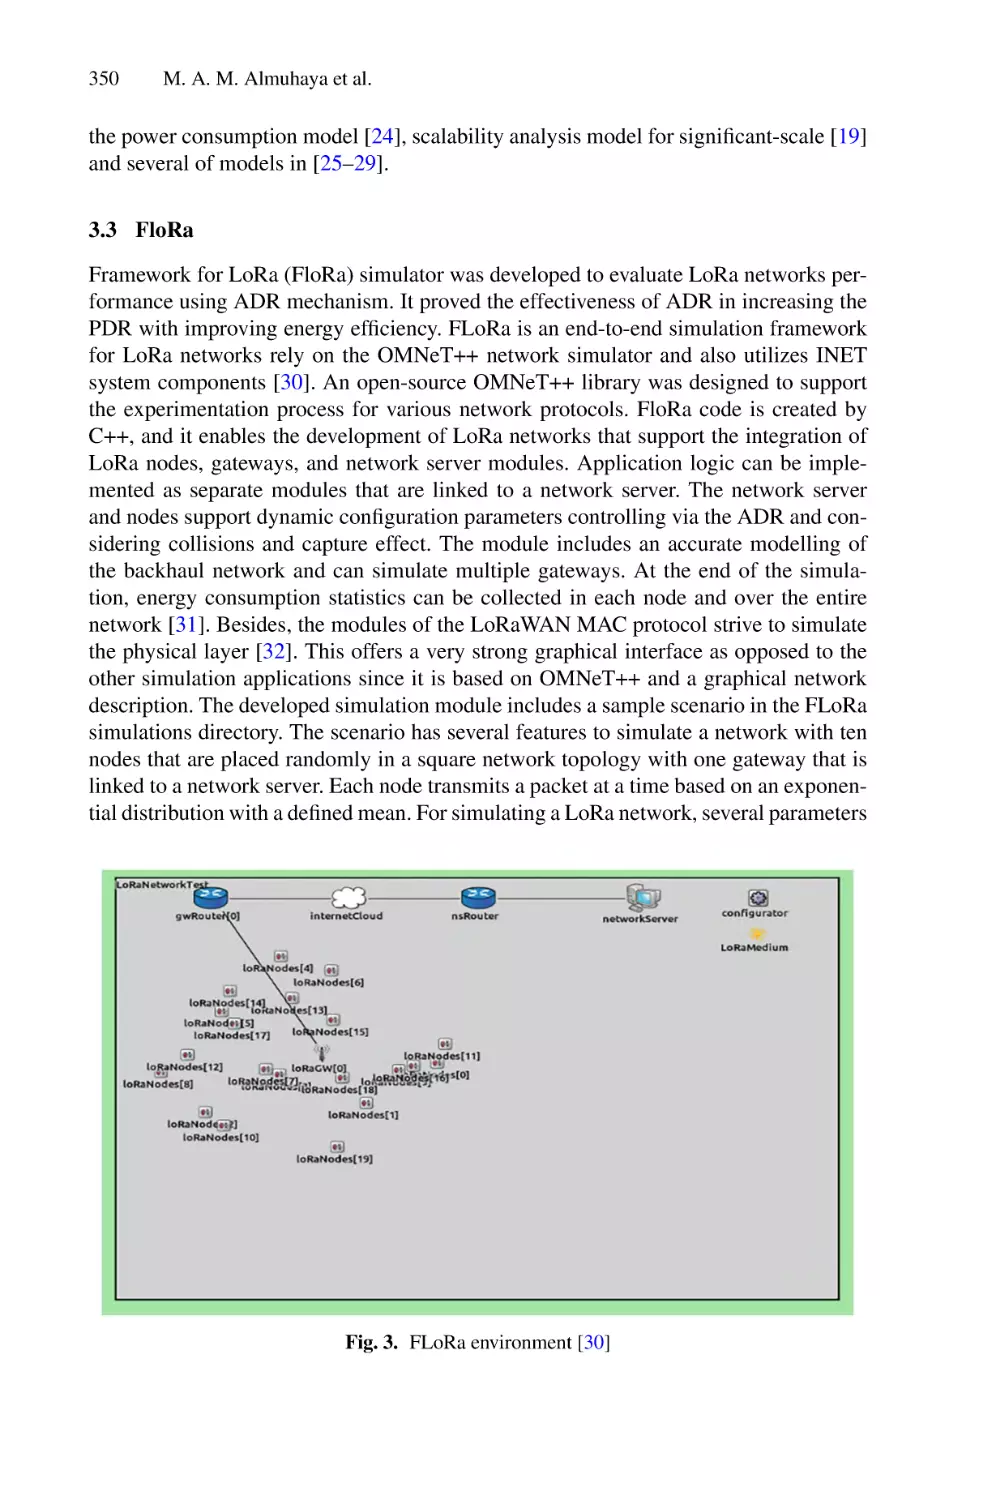
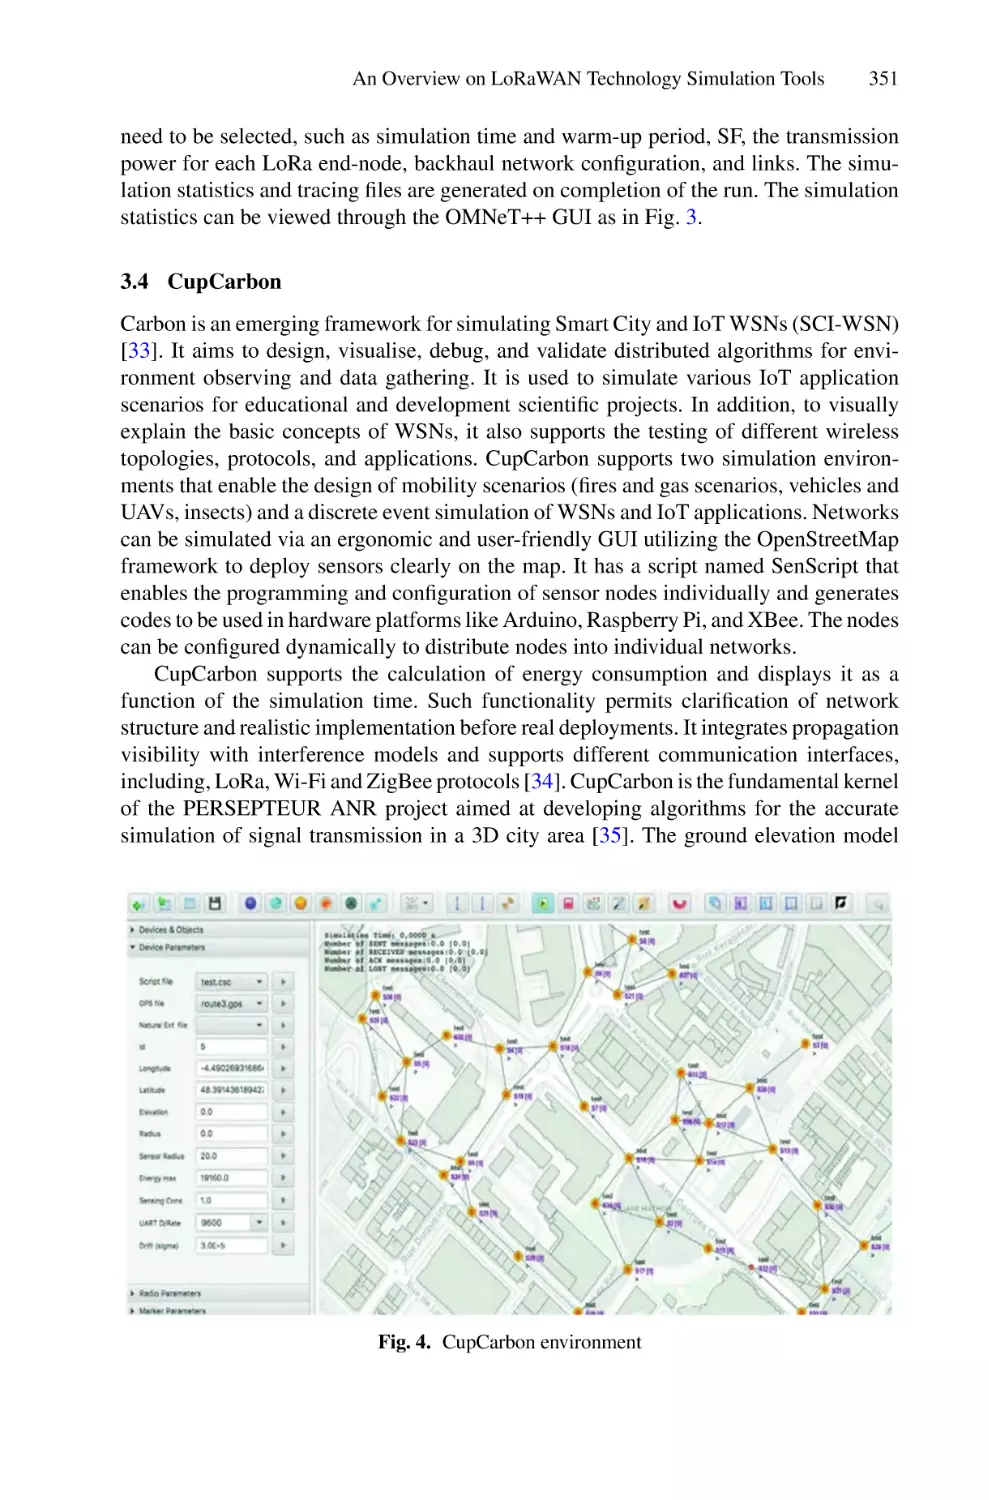
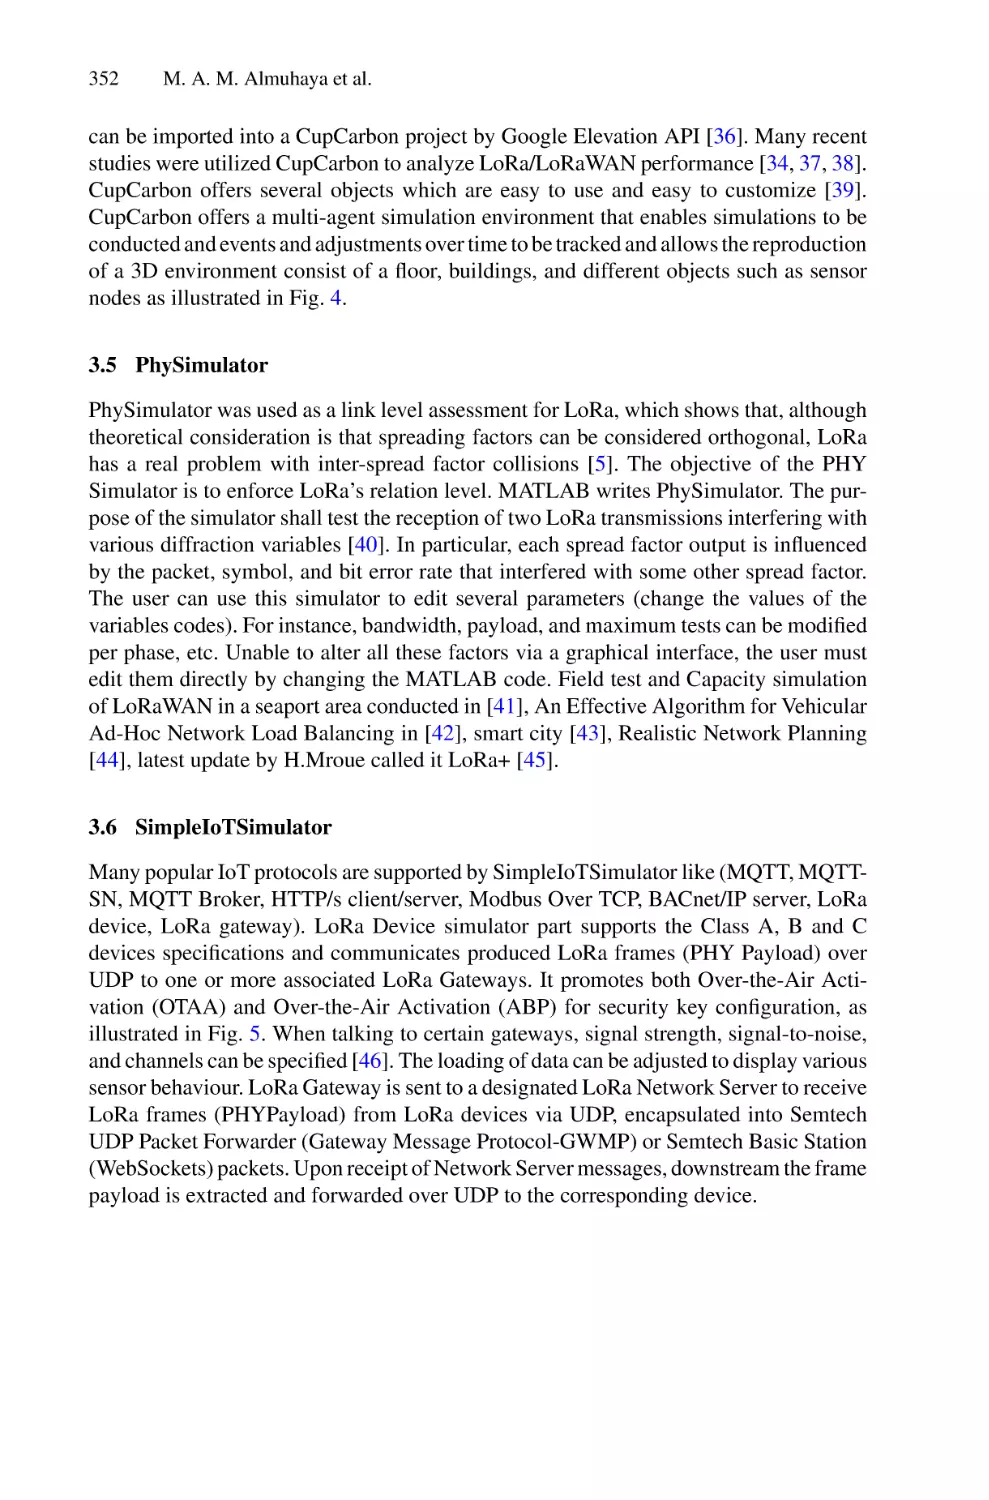
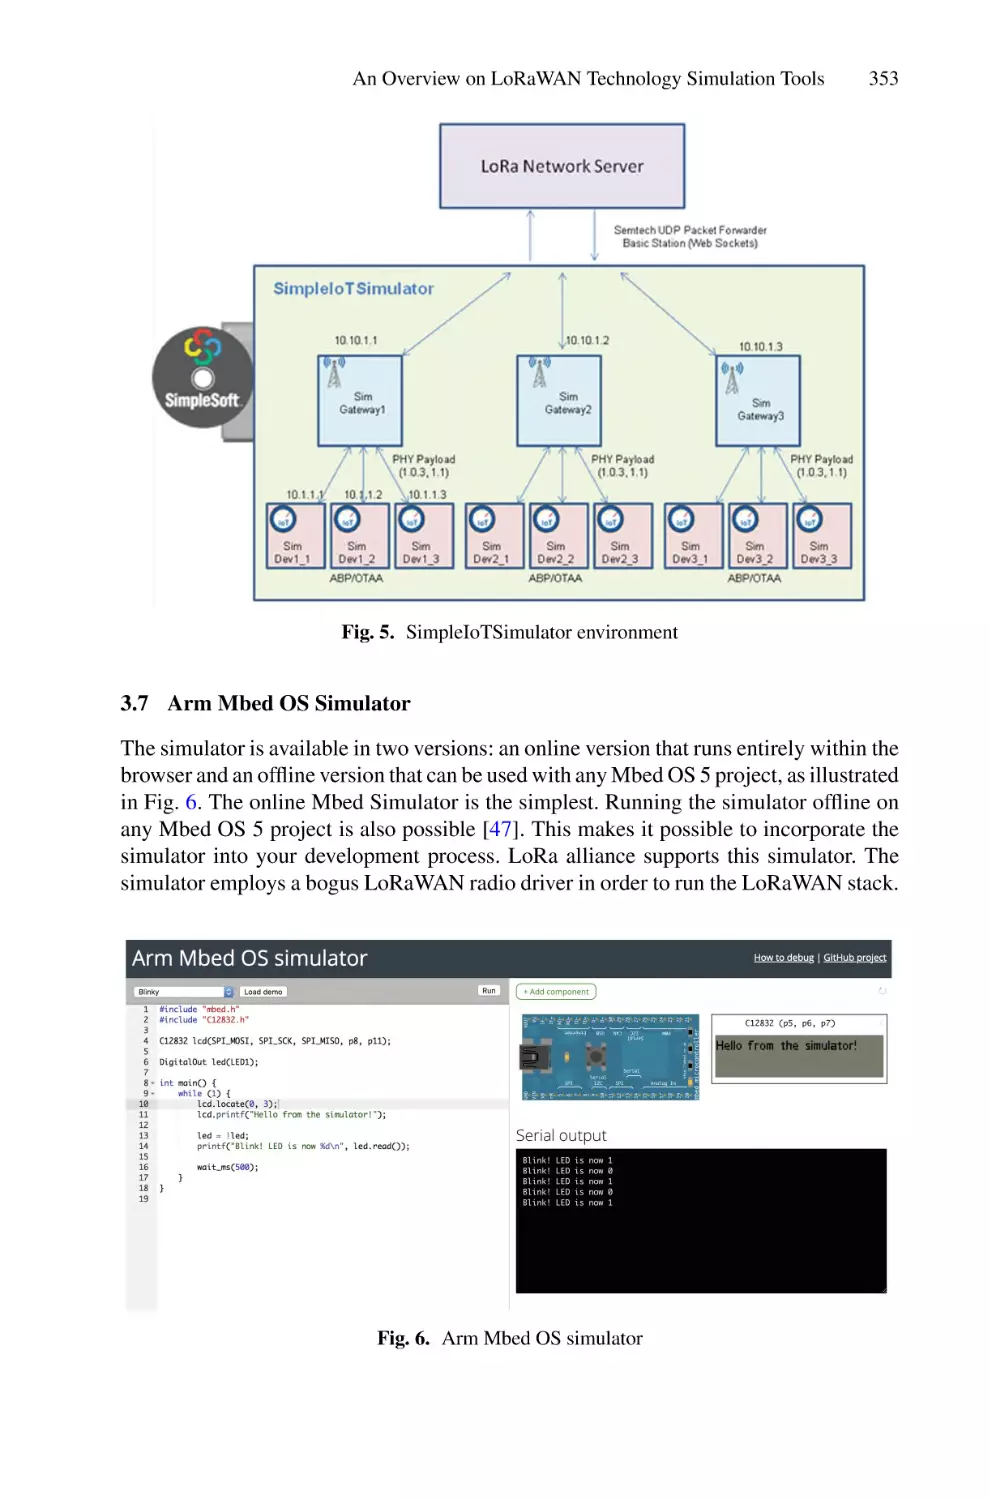
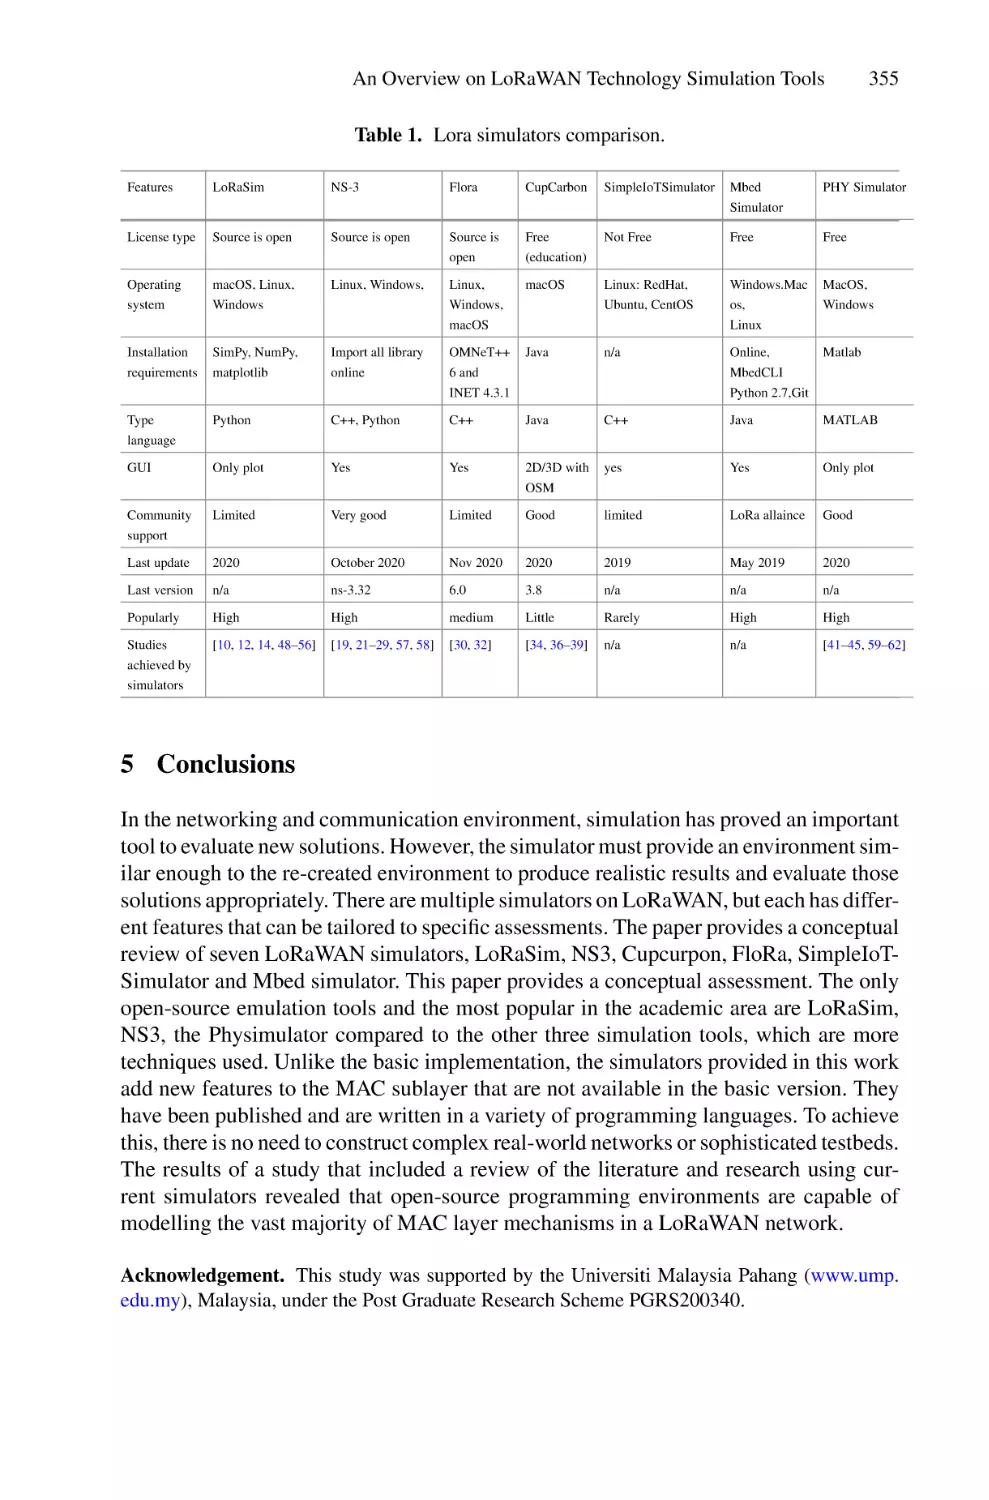
An Overview on LoRaWAN Technology Simulation Tools . . . . . . . . . . 345
Mukarram A. M. Almuhaya, Waheb A. Jabbar, Noorazliza Sulaiman,
and A. H. A. Sulaiman
Applying a Lightweight ECC Encryption in Multi-topology Sensor
Networks to Enhance Intelligent IoT Low-Cost Transportation
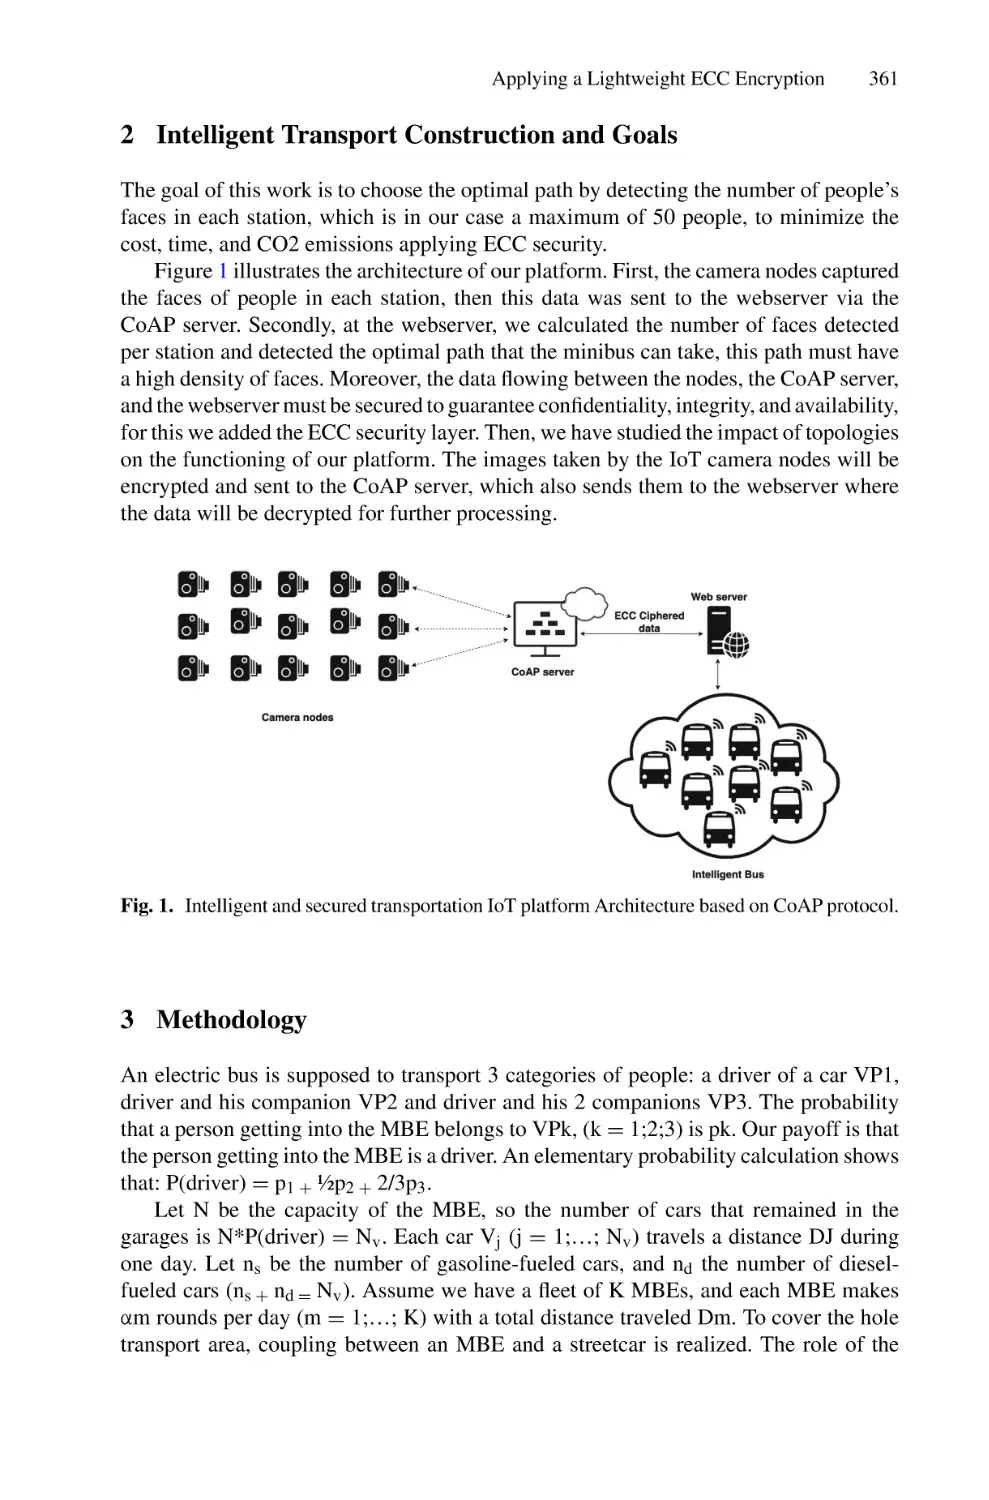
Platforms Security Based on CoAP Constrained Protocol . . . . . . . . . . . 359
Salma Ait Oussous, Mohammed Yachou, Sanaa El Aidi, Siham Beloualid,
Taoufiq El Harrouti, Abdelhadi El Allali, Abderrahim Bajit,
and Ahmed Tamtoui
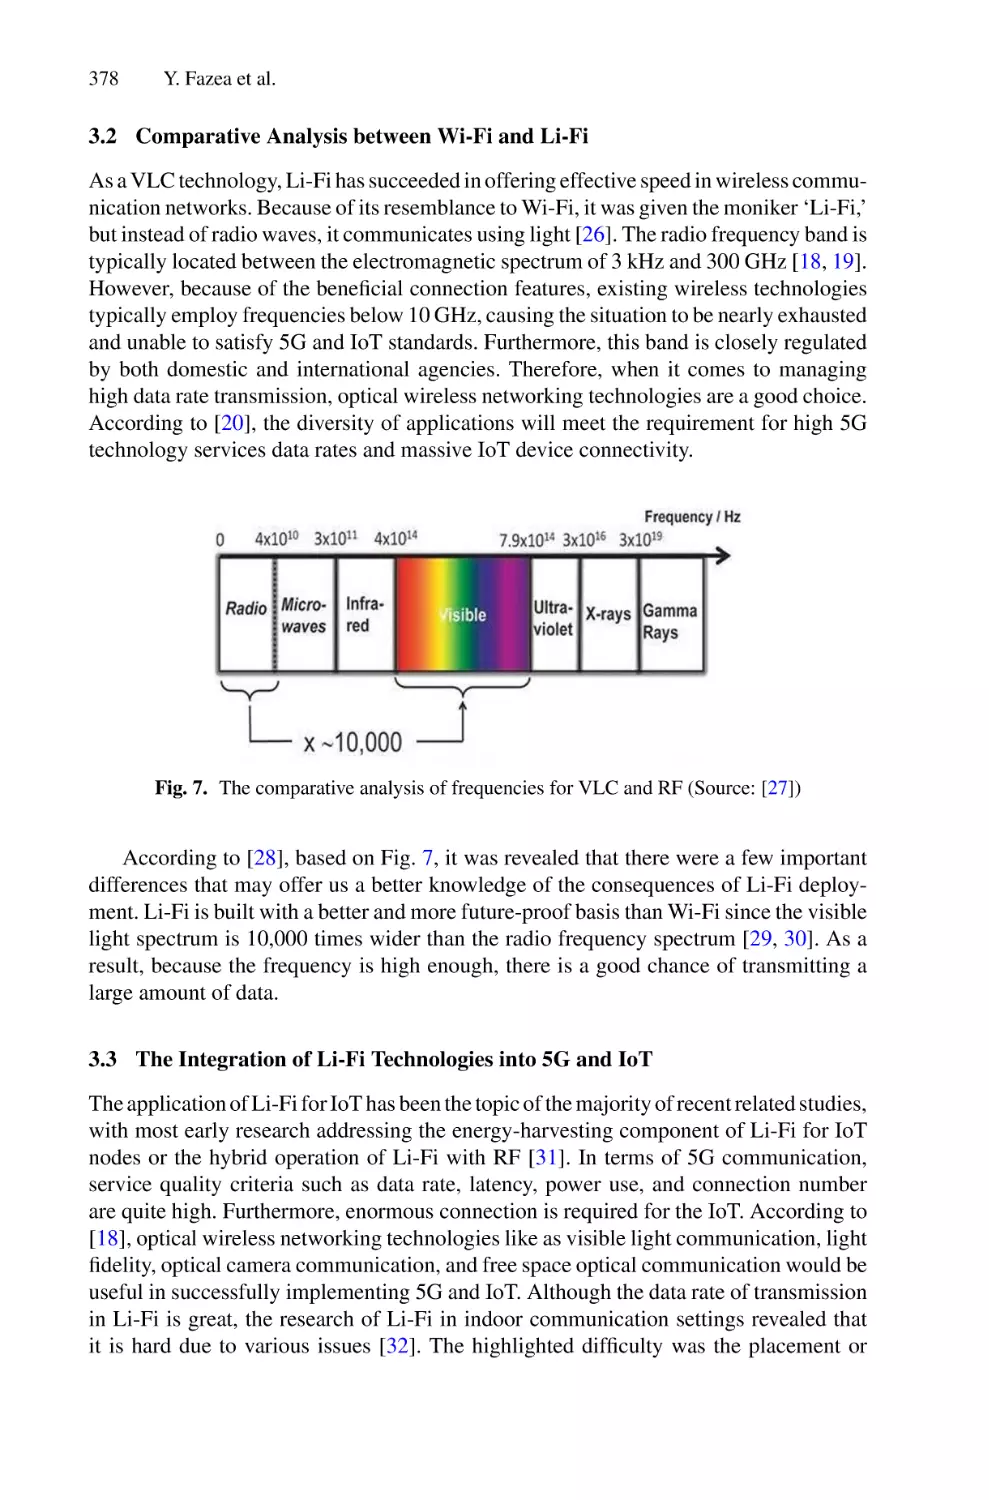
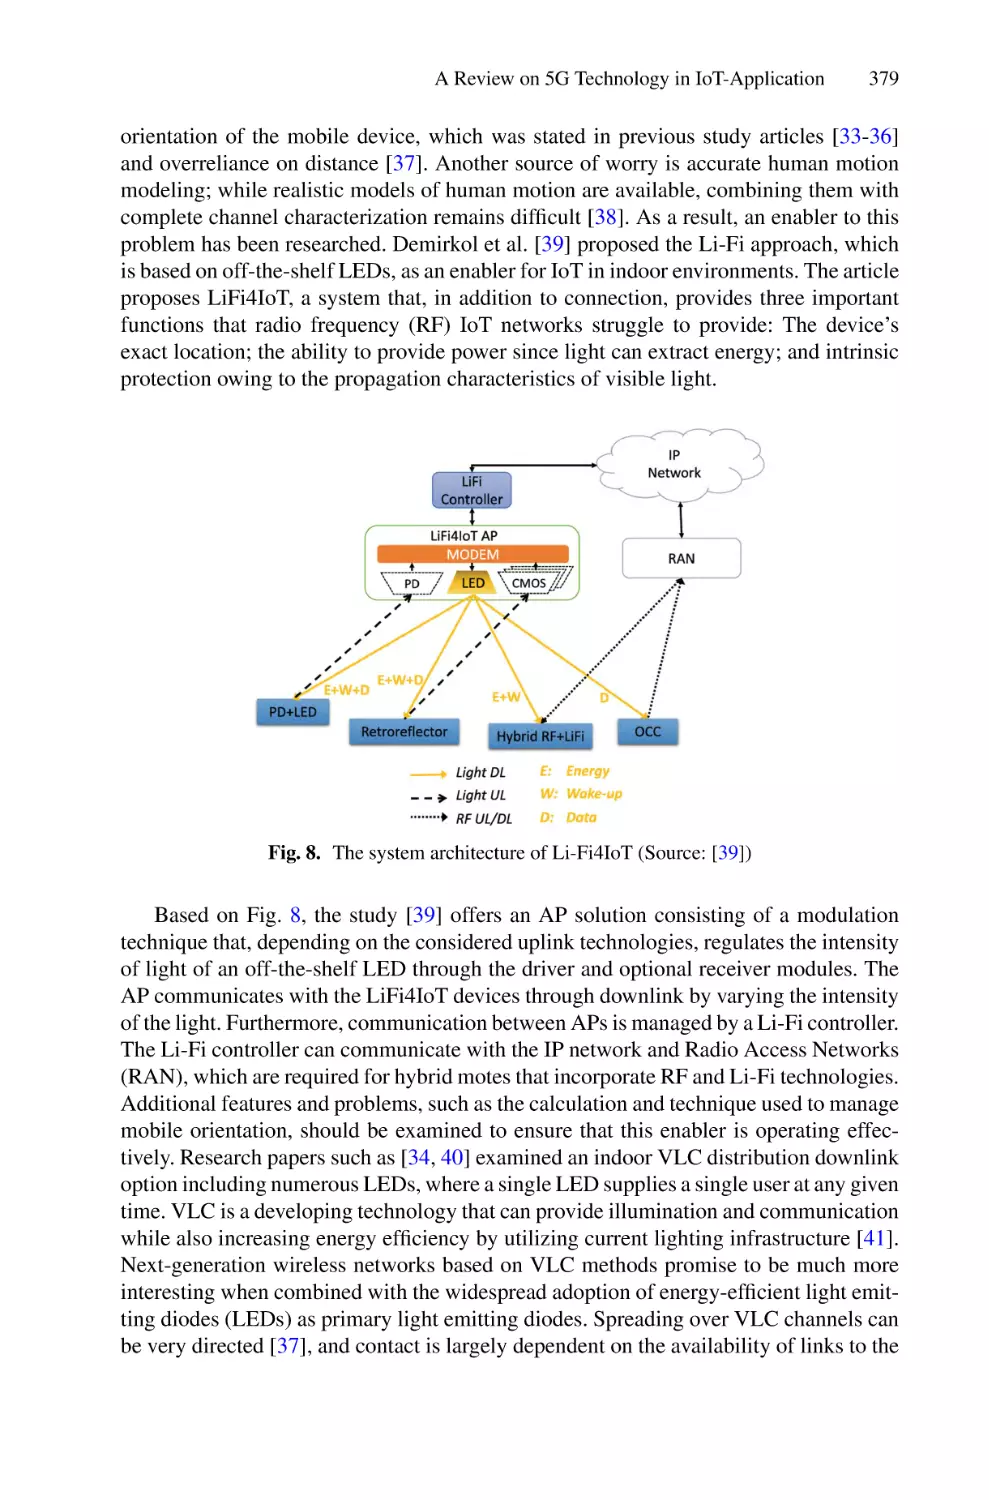
A Review on 5G Technology in IoT-Application Based on Light
Fidelity (Li-Fi) Indoor Communication . . . . . . . . . . . . . . . . . . . . . . . . . 371
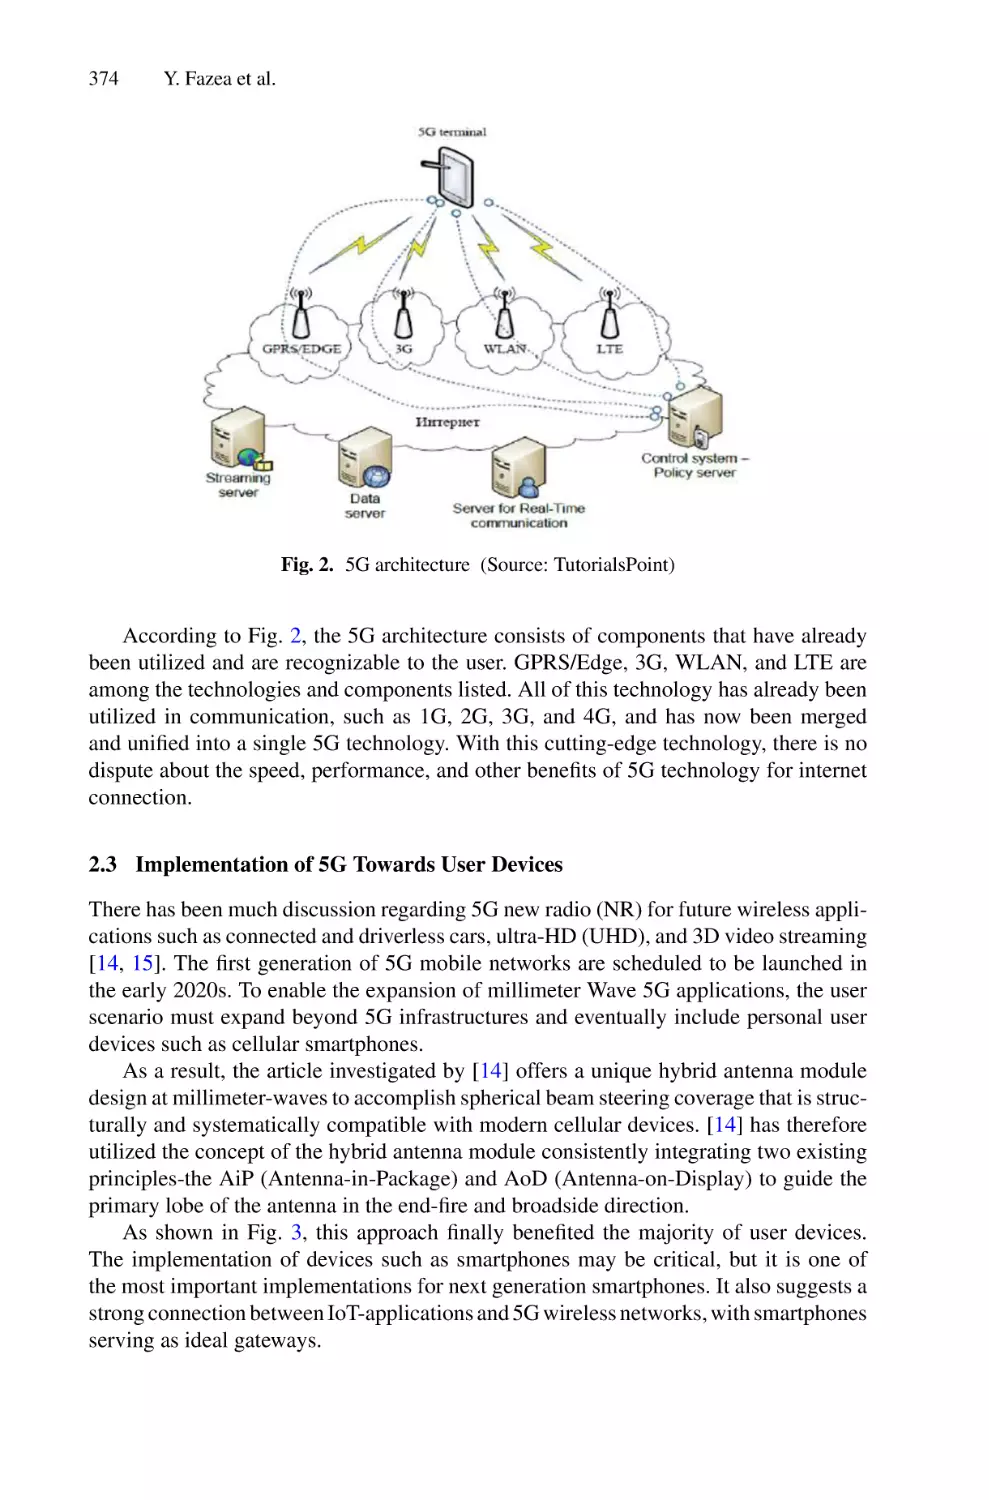
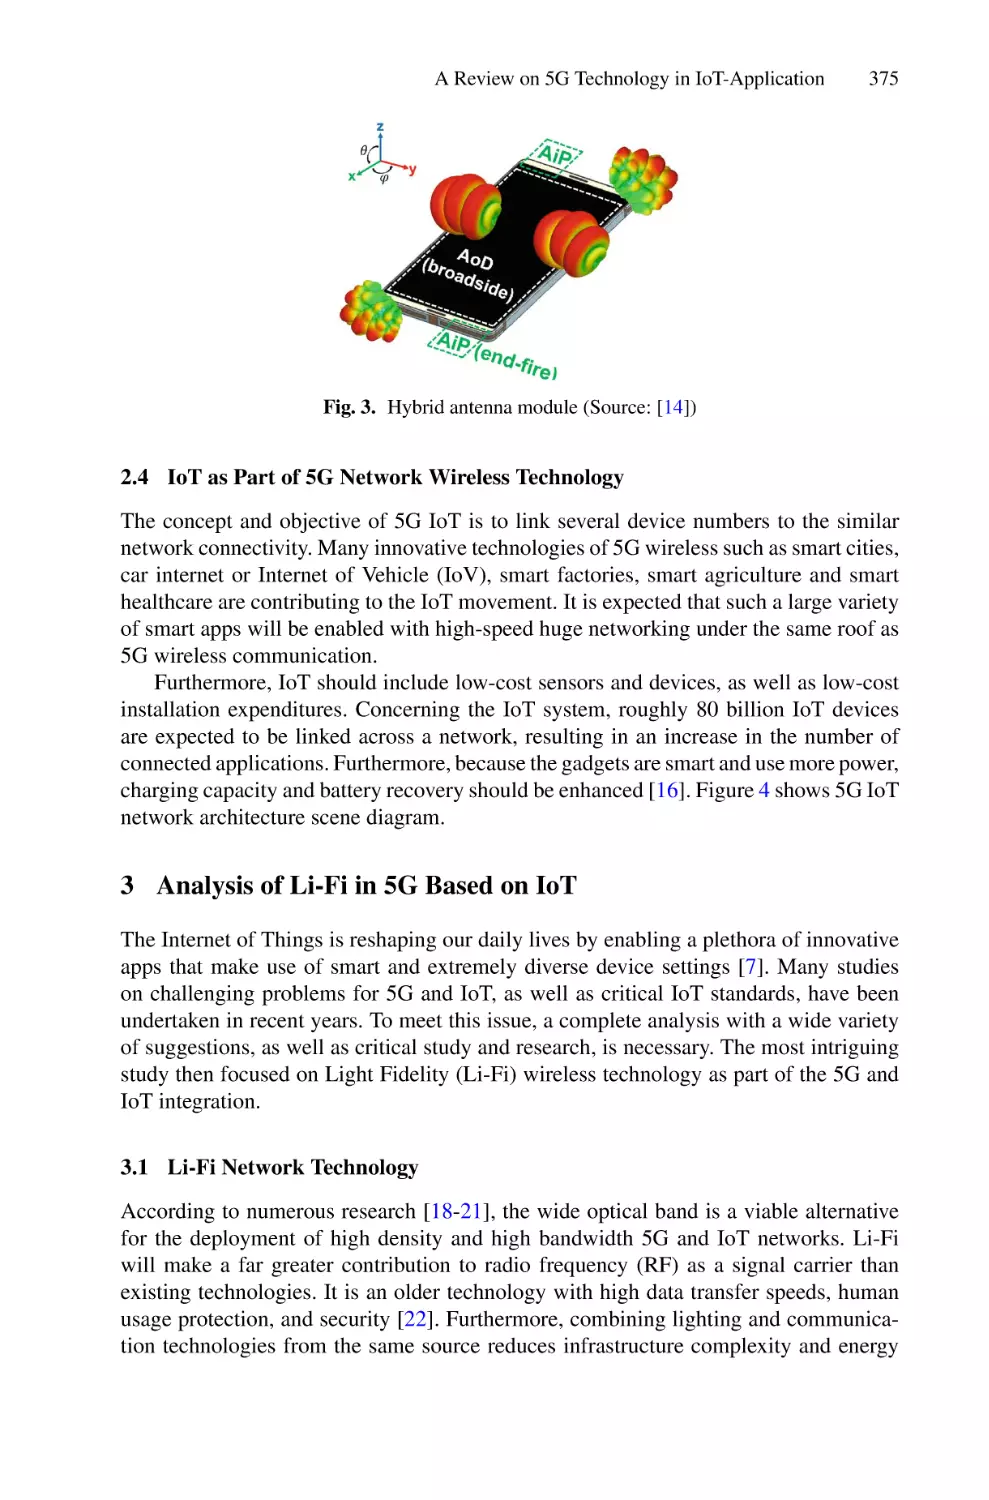
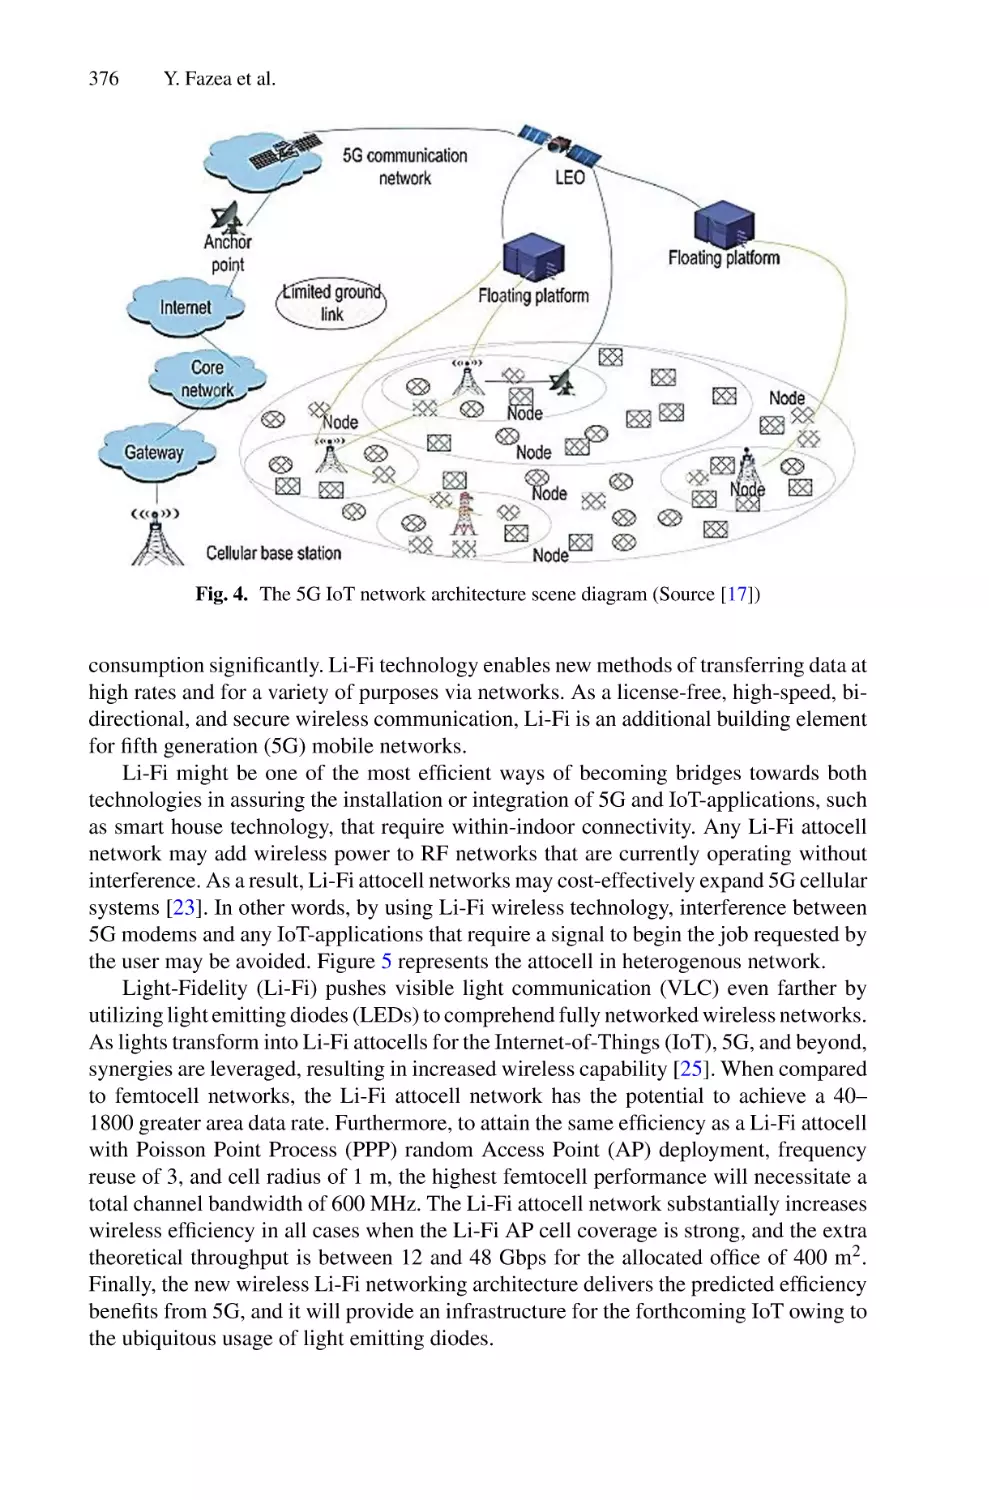
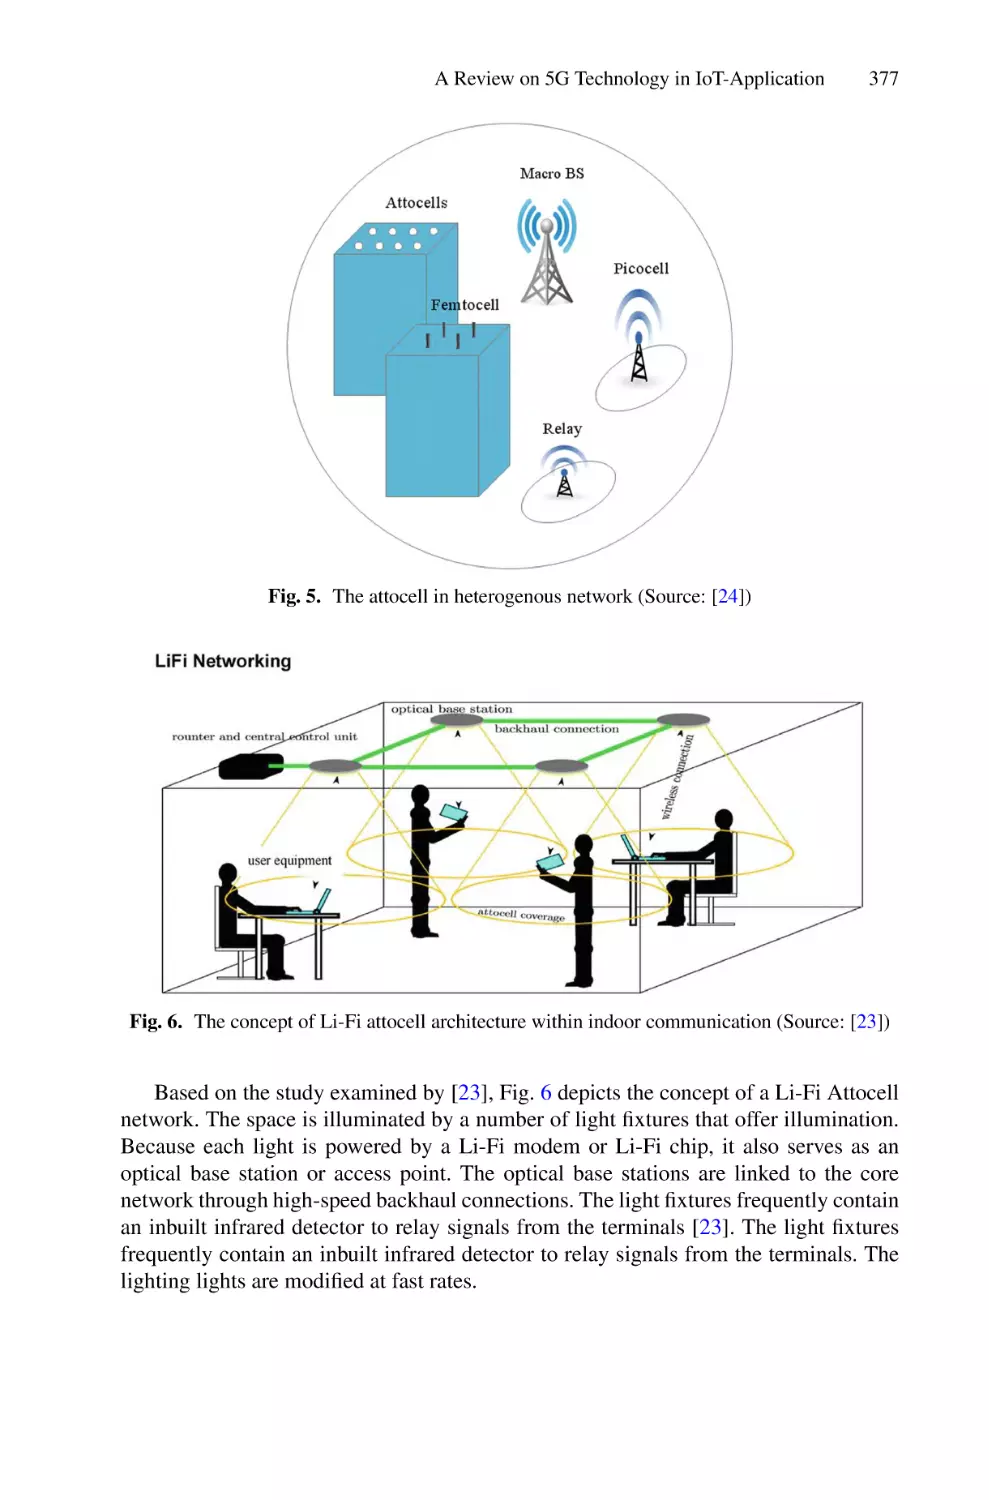
Yousef Fazea, Fathey Mohammed, and Abdulaziz Al-Nahari
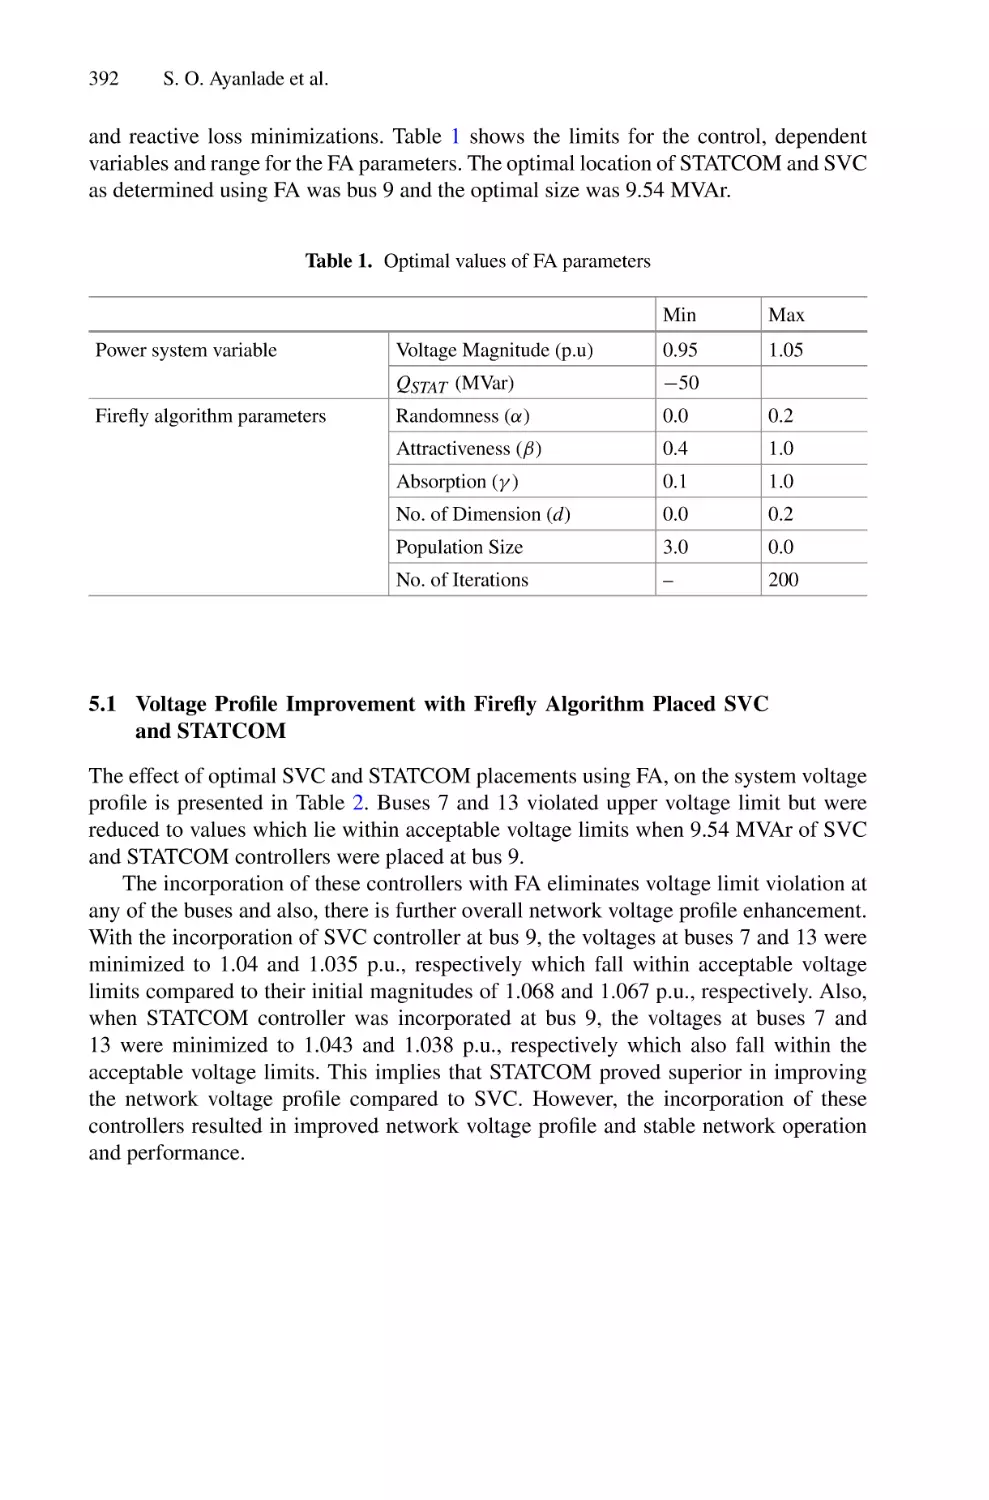
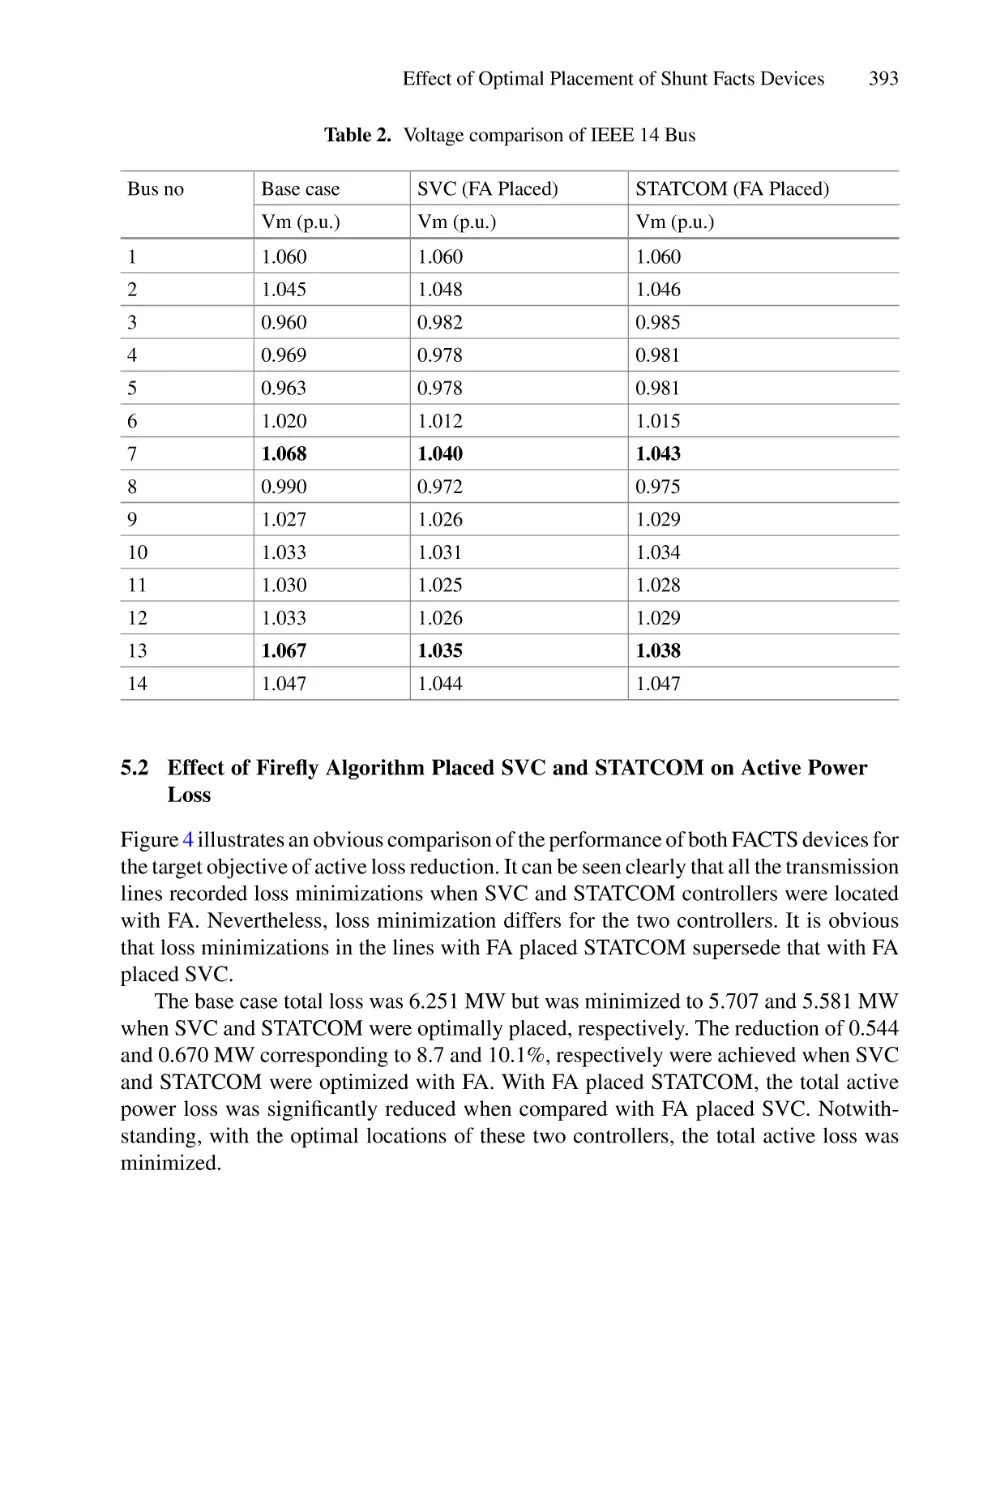
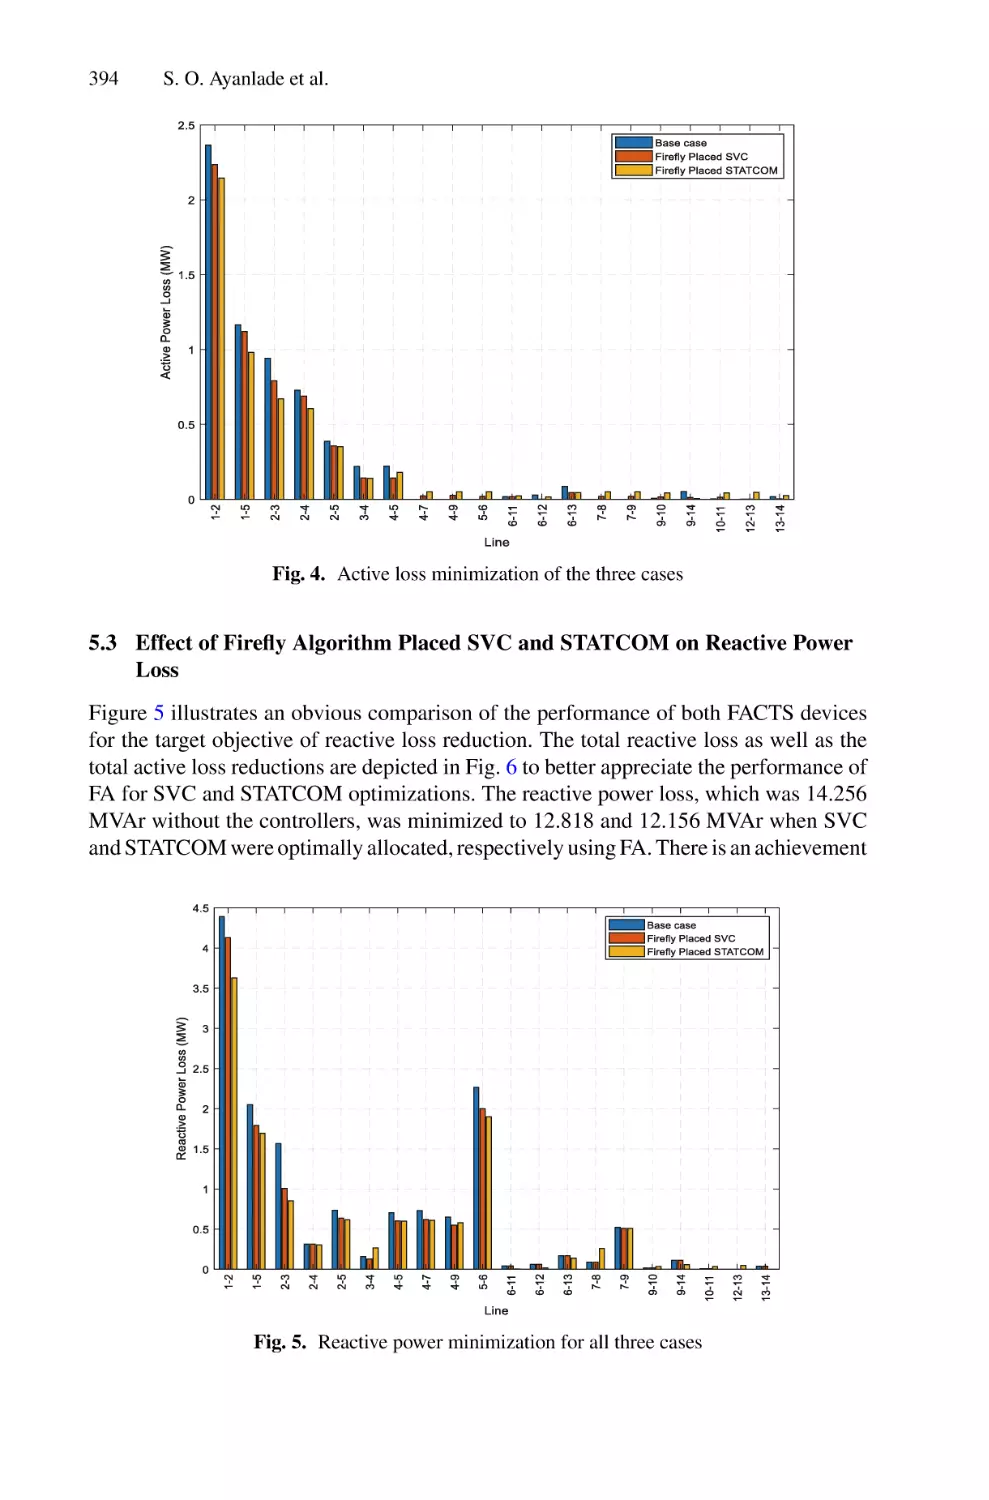
Effect of Optimal Placement of Shunt Facts Devices on Transmission
Network Using Firefly Algorithm for Voltage Profile Improvement
and Loss Minimization . . . . . . . . . . . . . . . . . . . . . . . . . . . . . . . . . . . . . . 385
S. O. Ayanlade, E. I. Ogunwole, S. A. Salimon, and S. O. Ezekiel
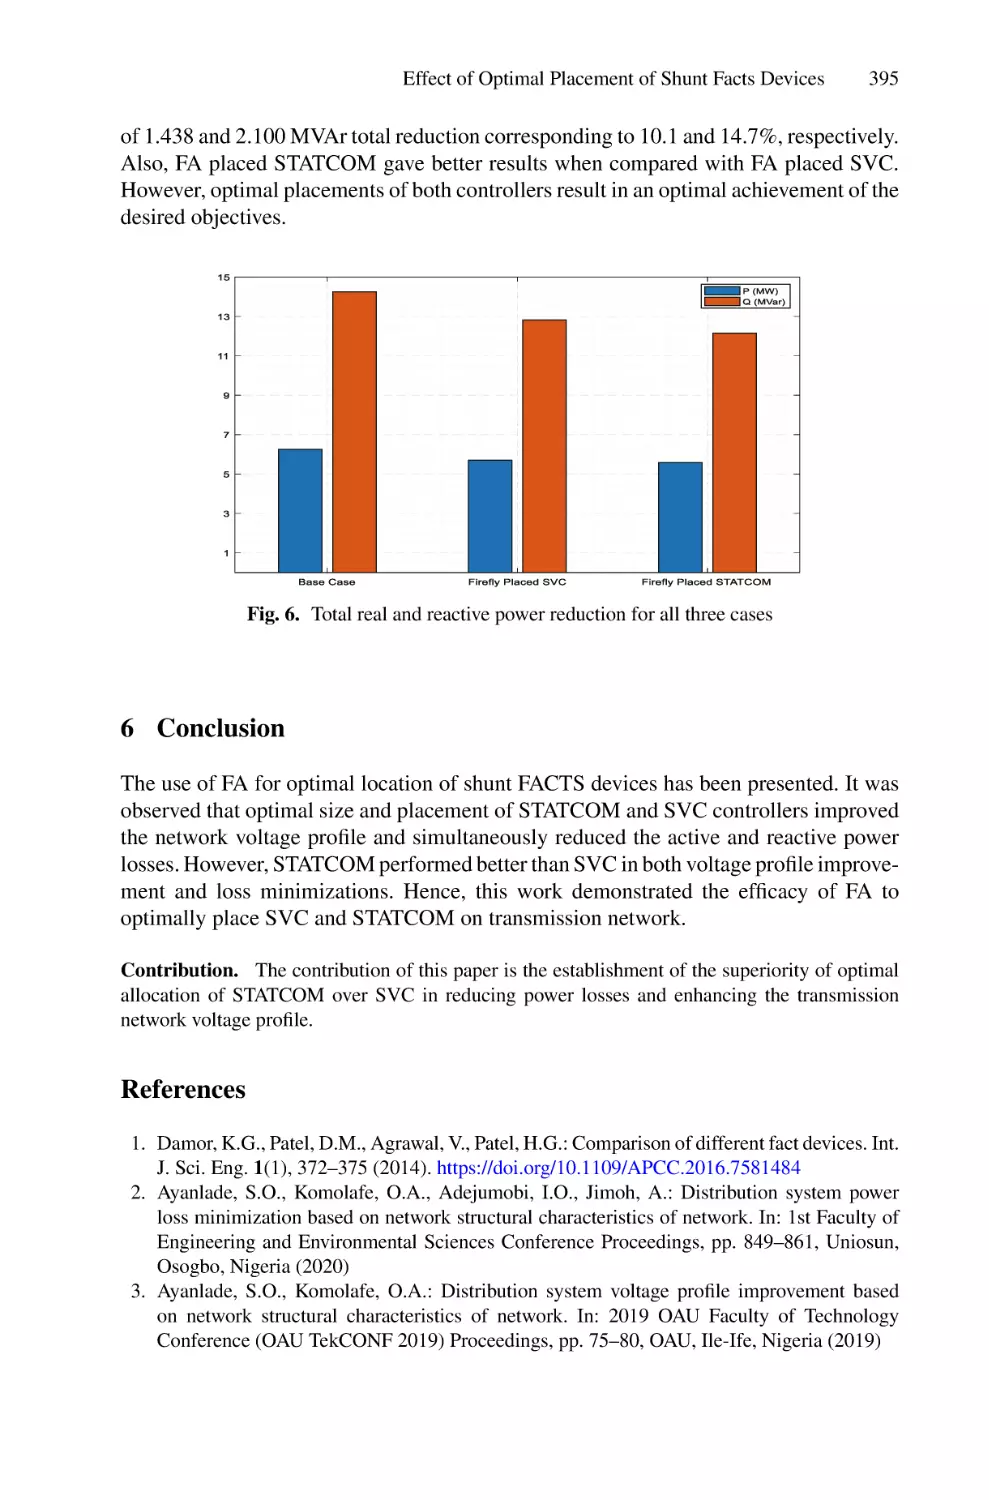
Efficient and Secure Topology Discovery in SDN: Review . . . . . . . . . . . 397
Olomi Isaiah Aladesote and Azizol Abdullah
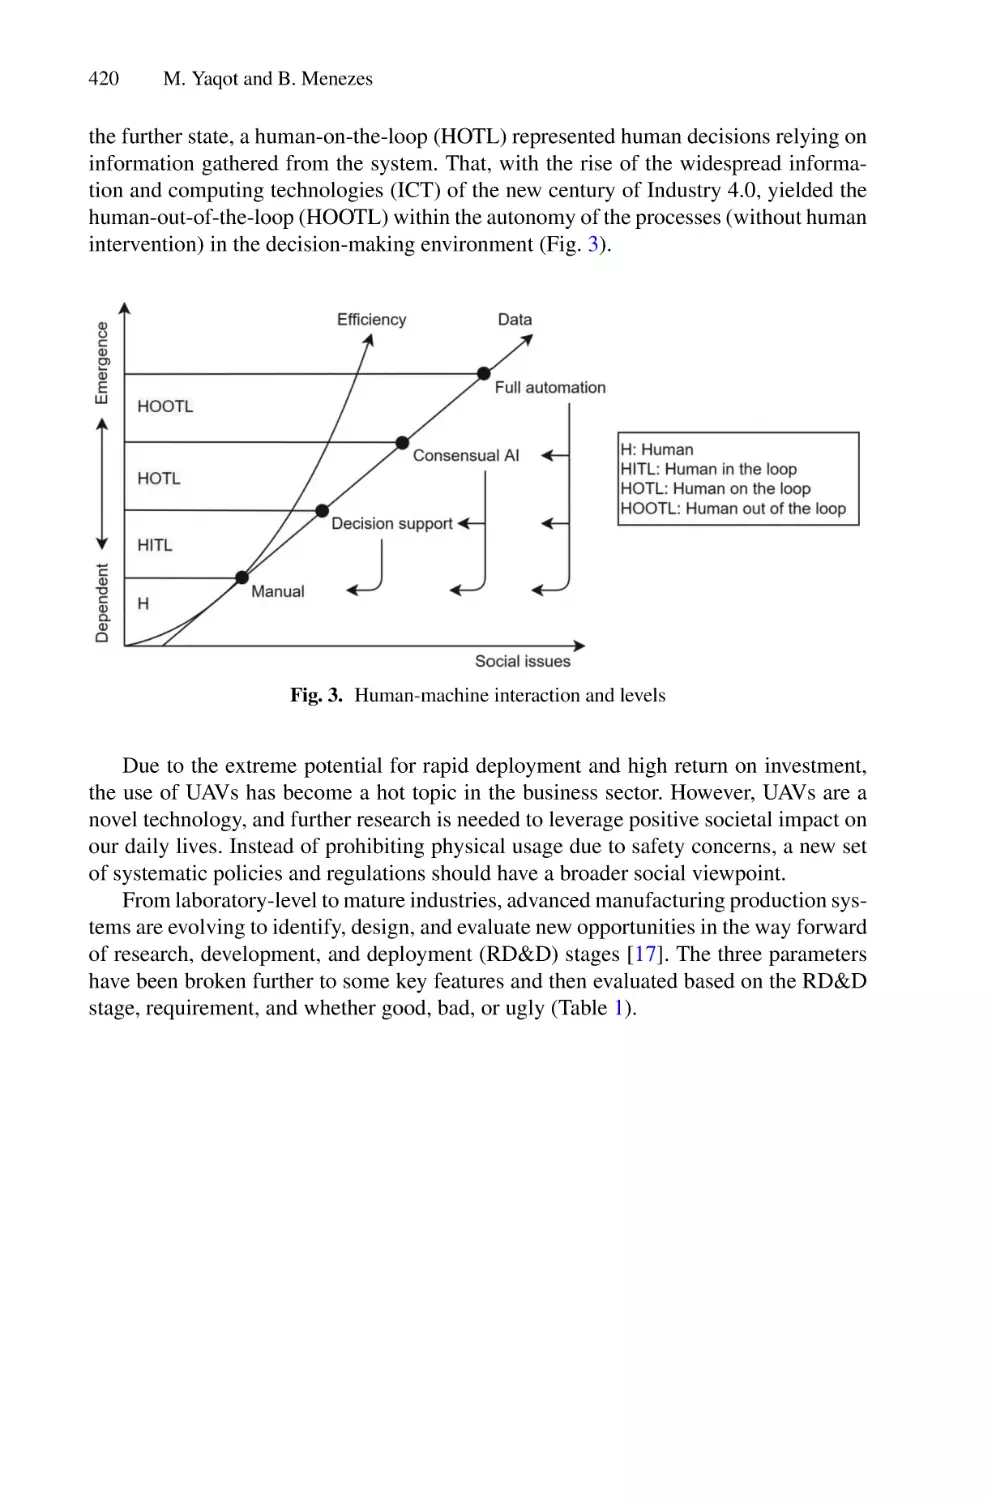
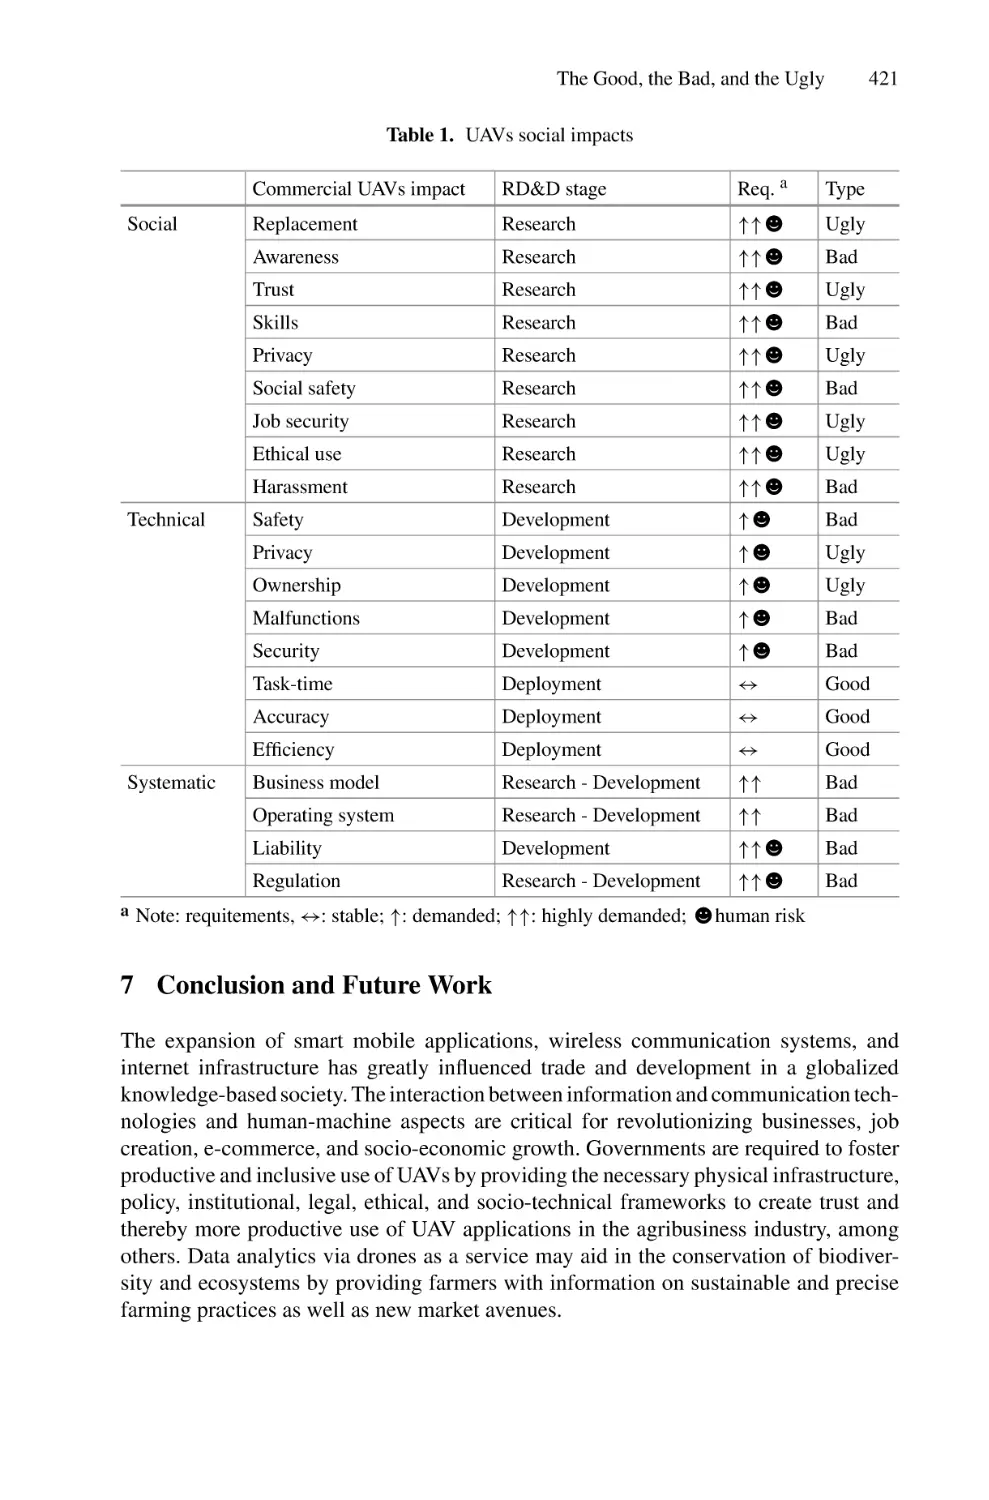
The Good, the Bad, and the Ugly: Review on the Social Impacts
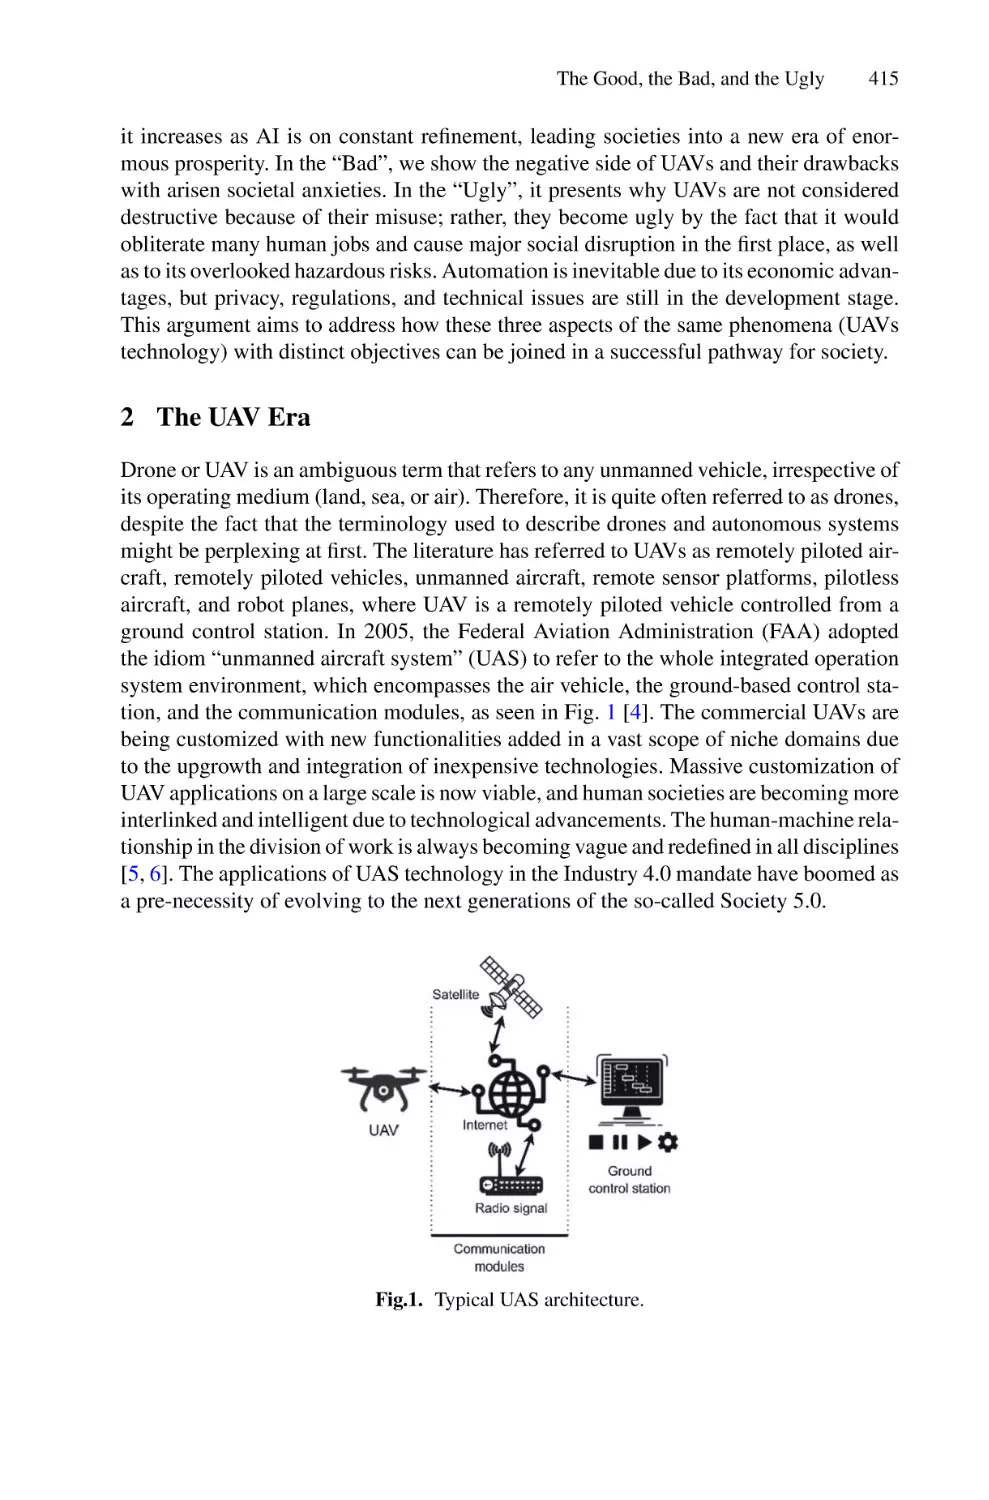
of Unmanned Aerial Vehicles (UAVs) . . . . . . . . . . . . . . . . . . . . . . . . . . 413
Mohammed Yaqot and Brenno Menezes
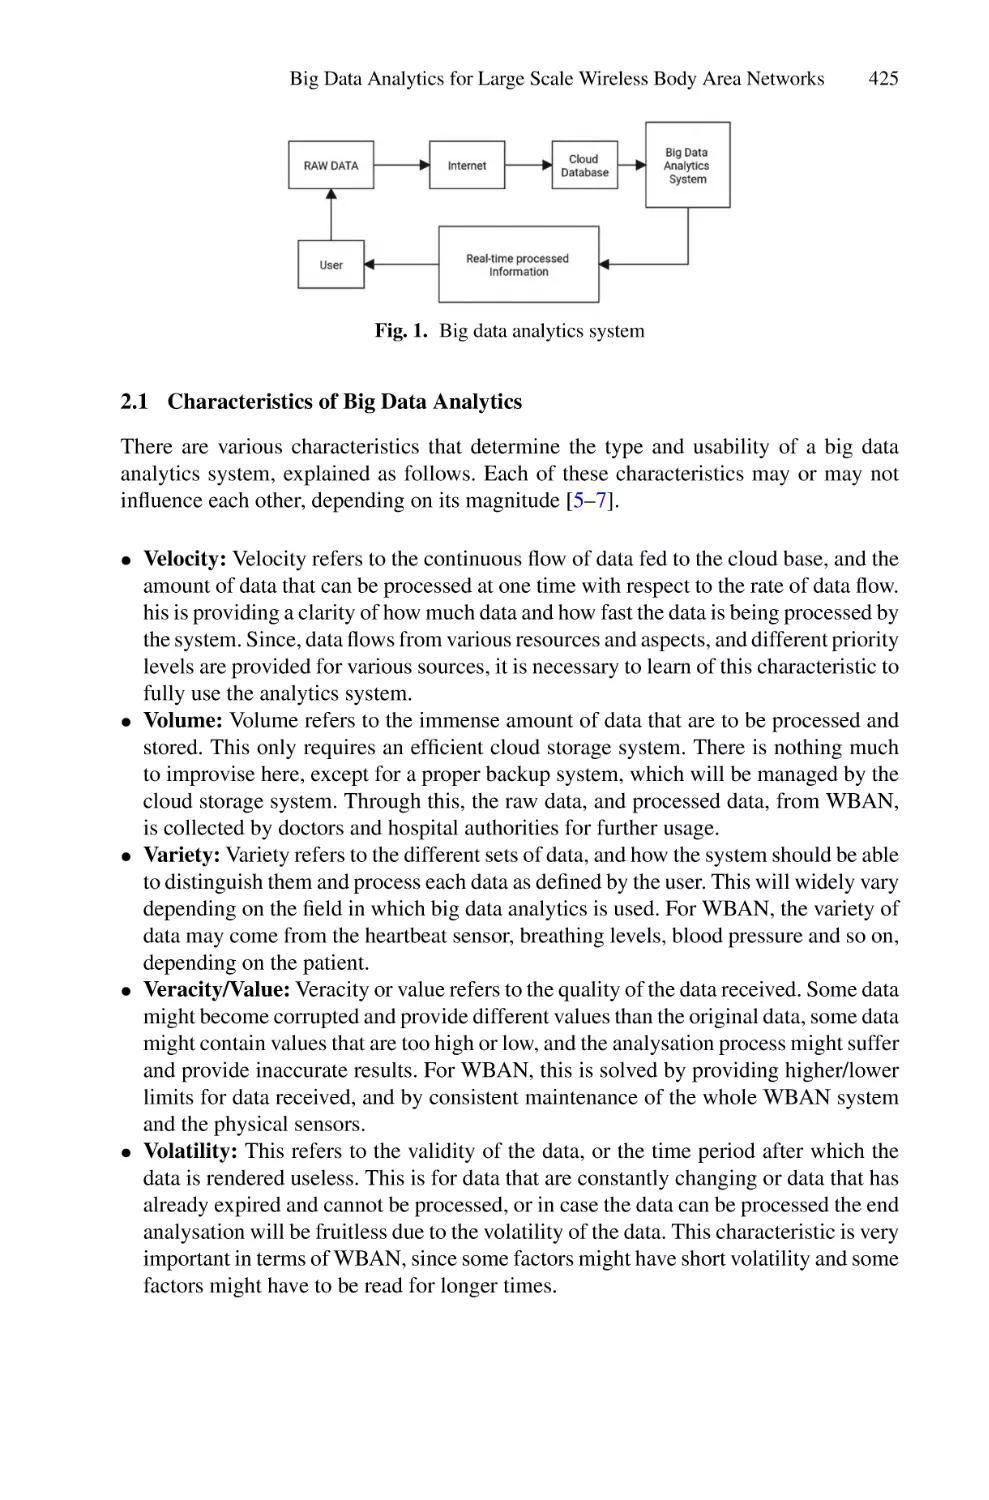
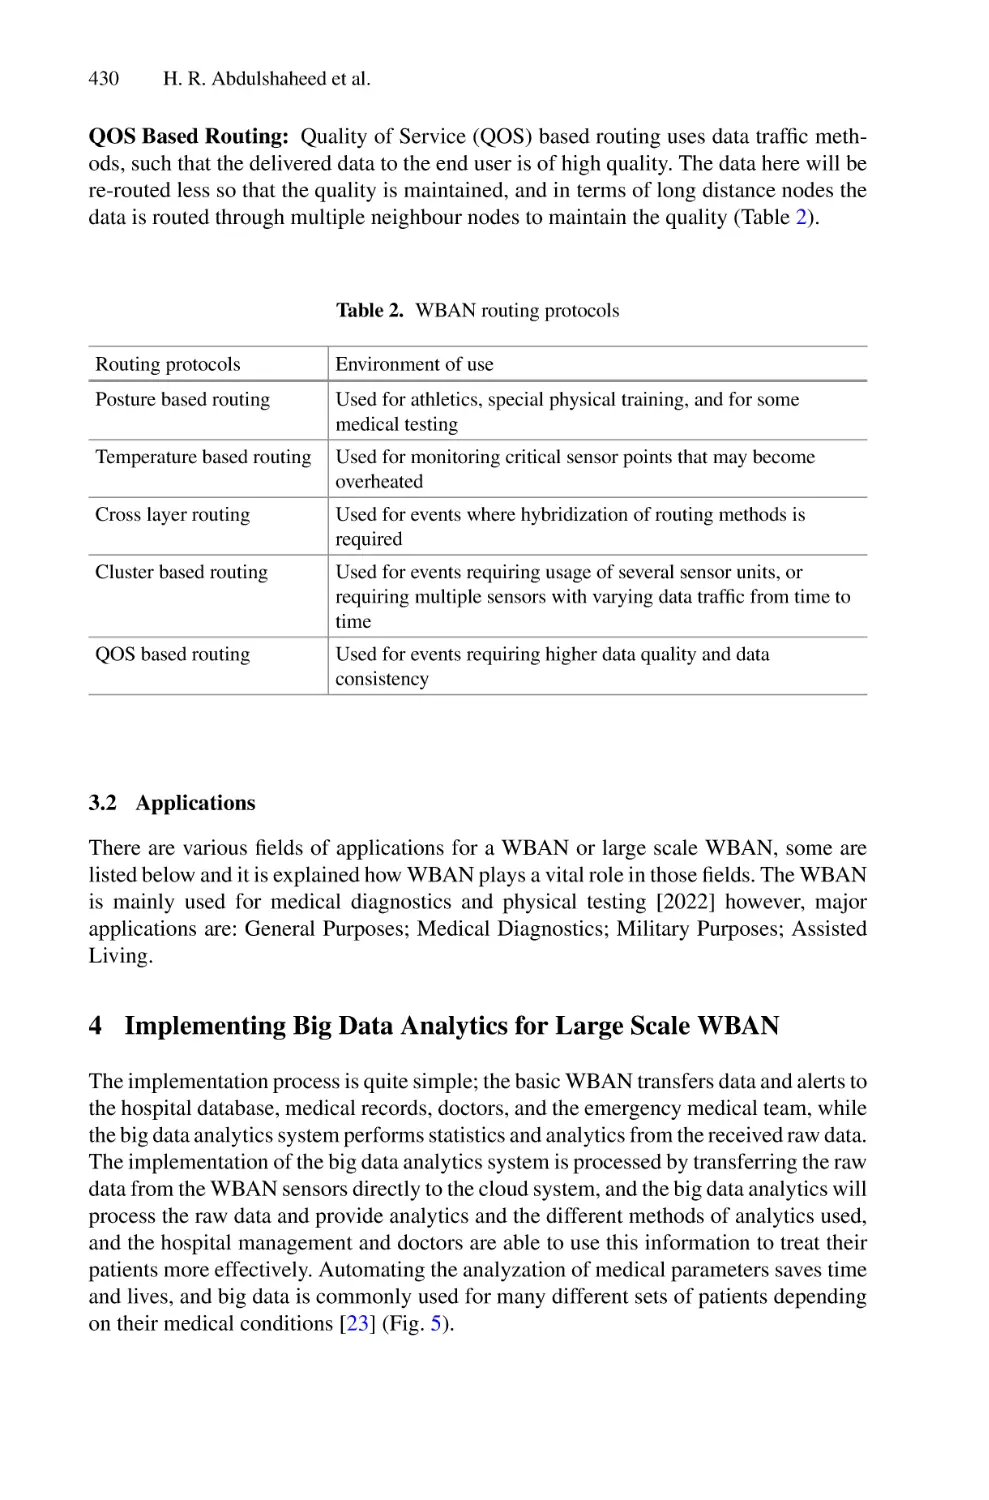
Big Data Analytics for Large Scale Wireless Body Area Networks;
Challenges, and Applications . . . . . . . . . . . . . . . . . . . . . . . . . . . . . . . . . 423
Haider Rasheed Abdulshaheed, Haider Hadi Abbas, Ehsan Qahtan Ahmed,
and Israa Al-Barazanchi
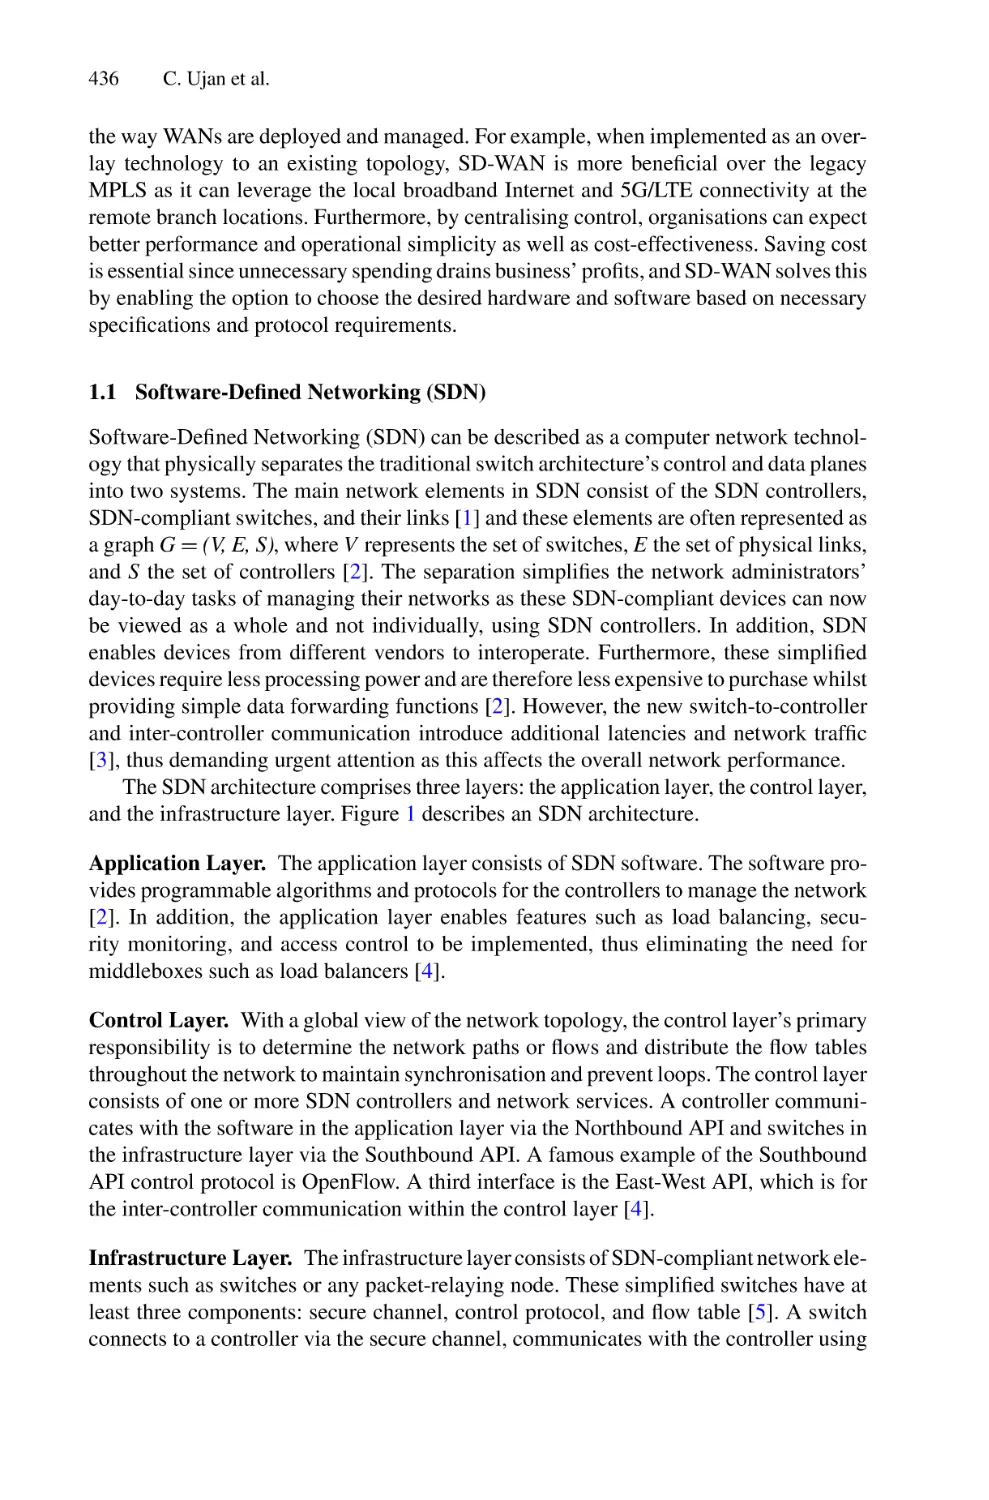
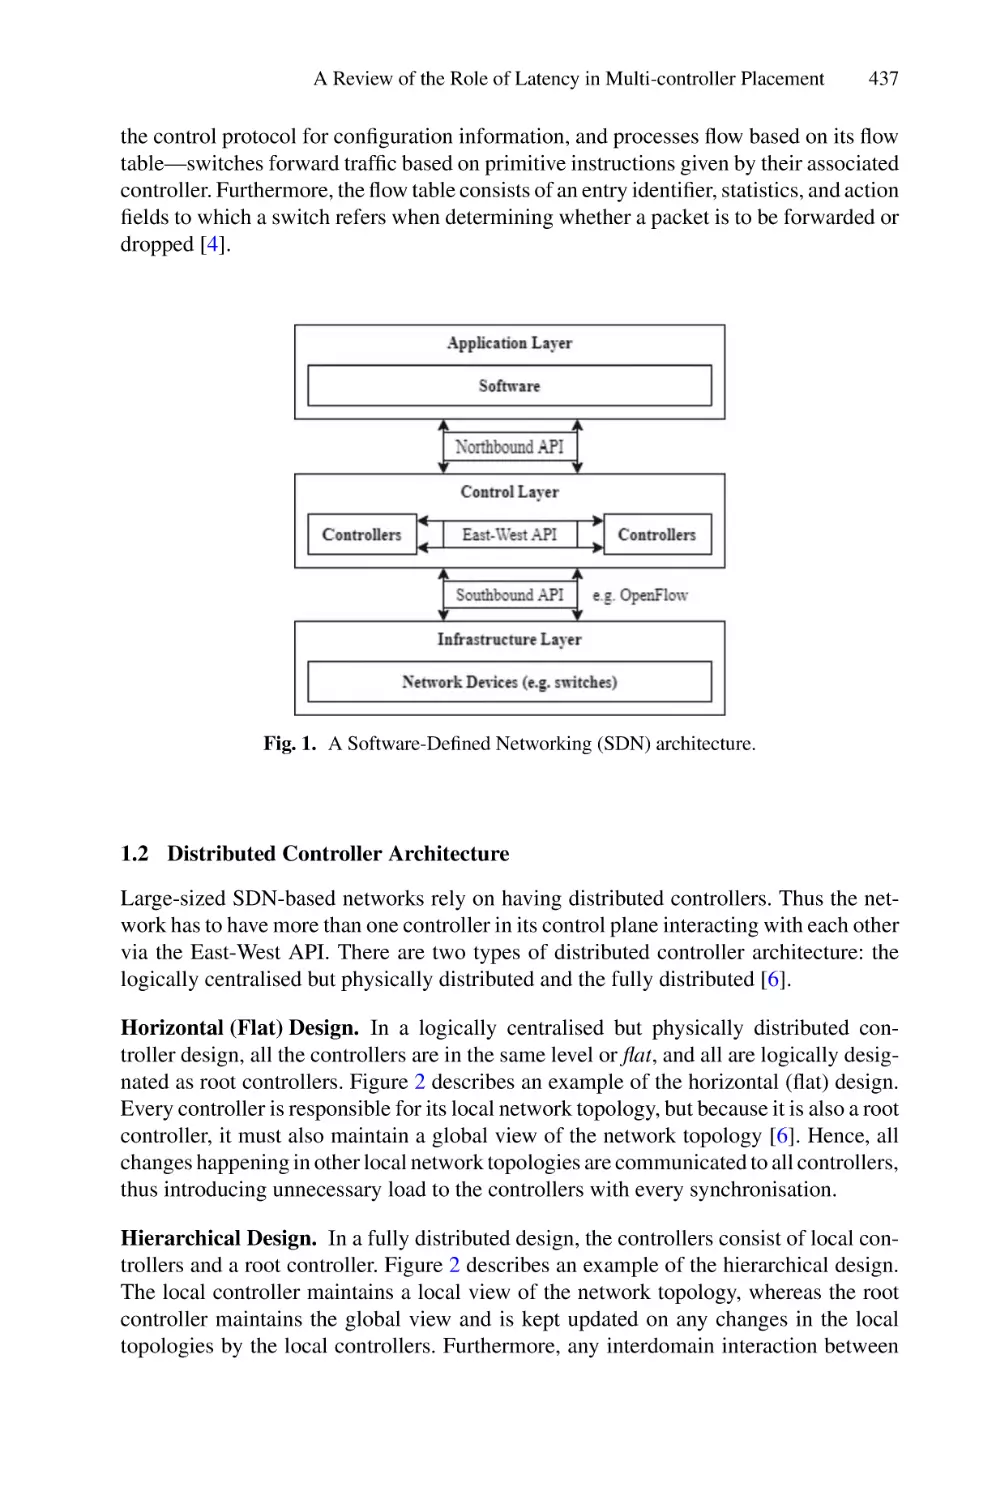
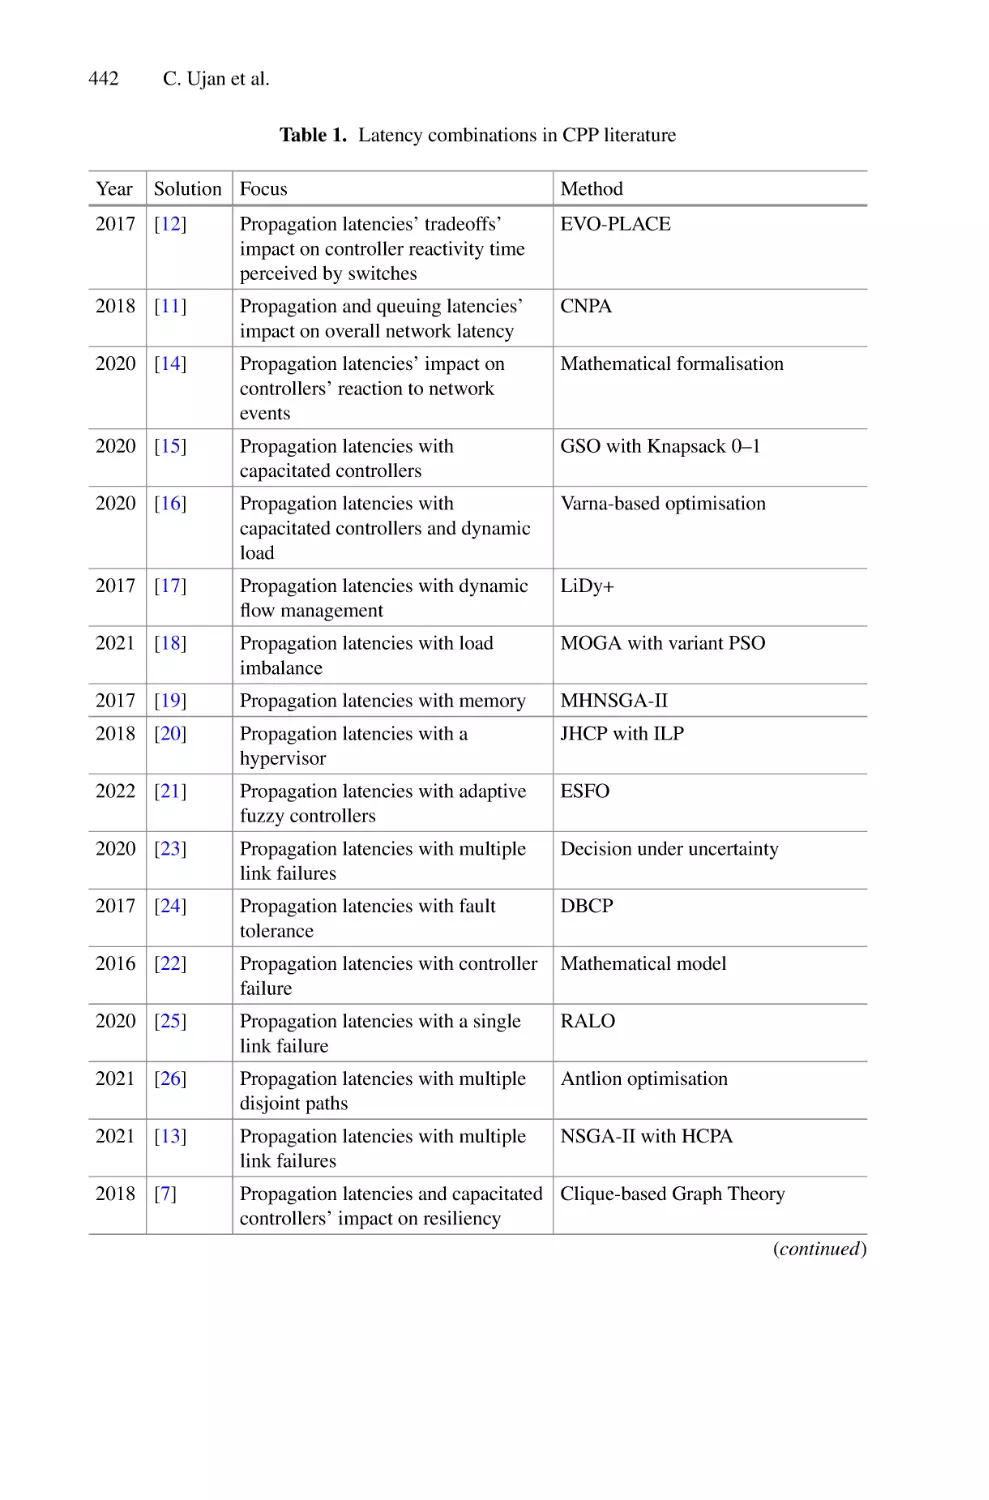
A Review of the Role of Latency in Multi-controller Placement
in Software-Defined-Wide Area Networks . . . . . . . . . . . . . . . . . . . . . . . 435
Cindy Ujan, Mohd Murtadha Mohamad, and Anisah Kasim
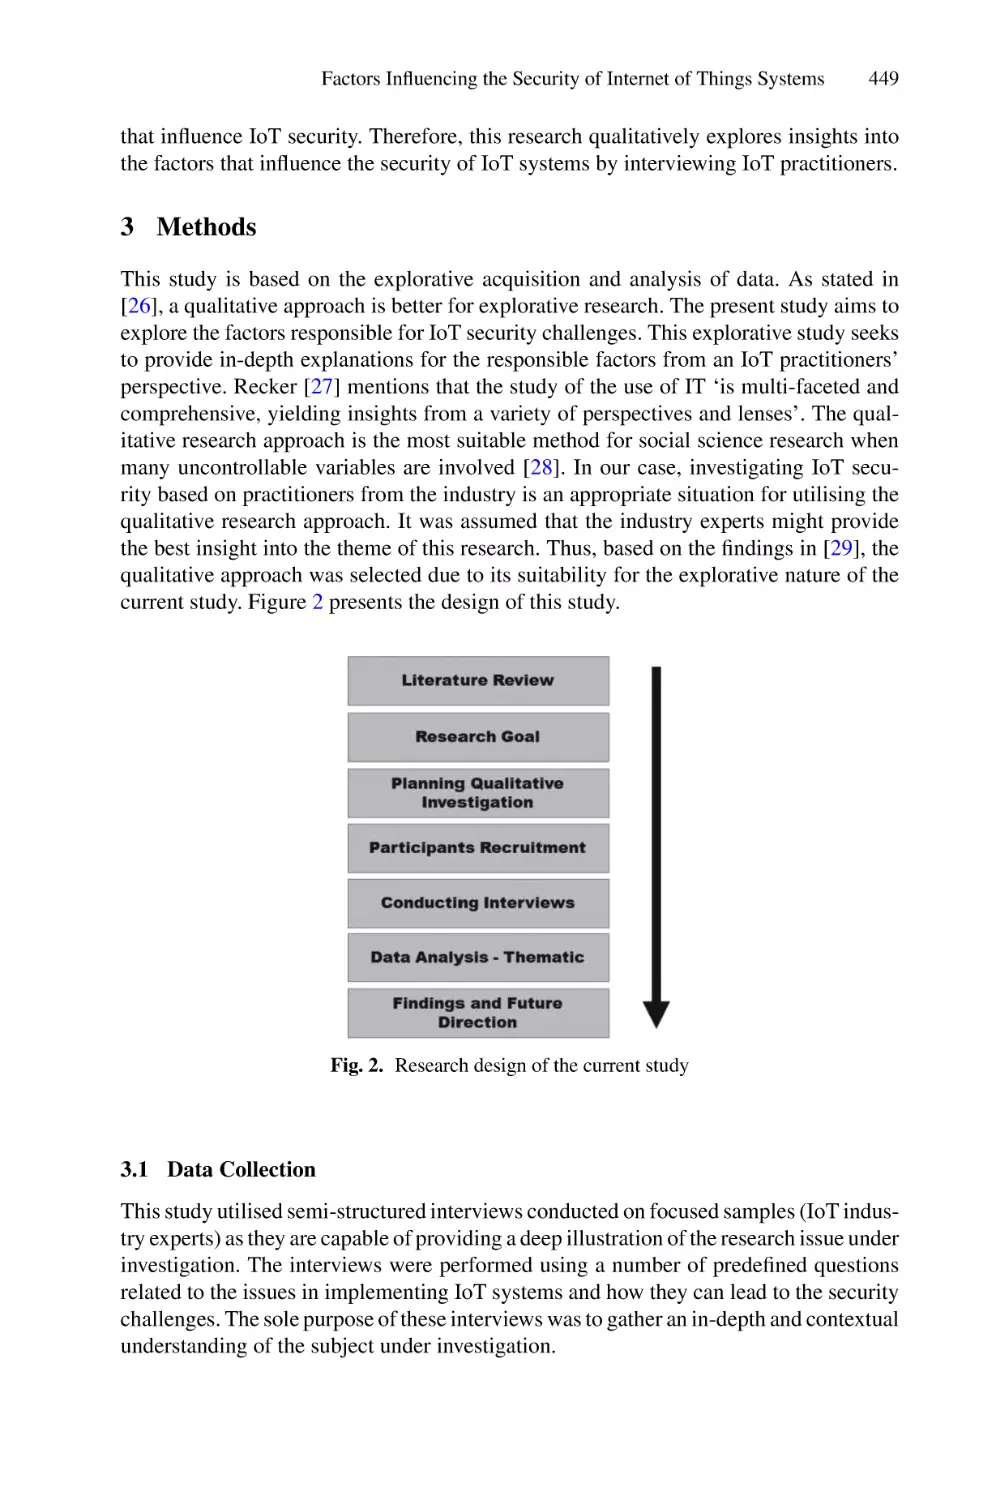
Factors Influencing the Security of Internet of Things Systems . . . . . . . 446
Fayez Hussain Alqahtani
Contents
xv
Cyber Security
Facilitate Security Event Monitoring and Logging of Operational
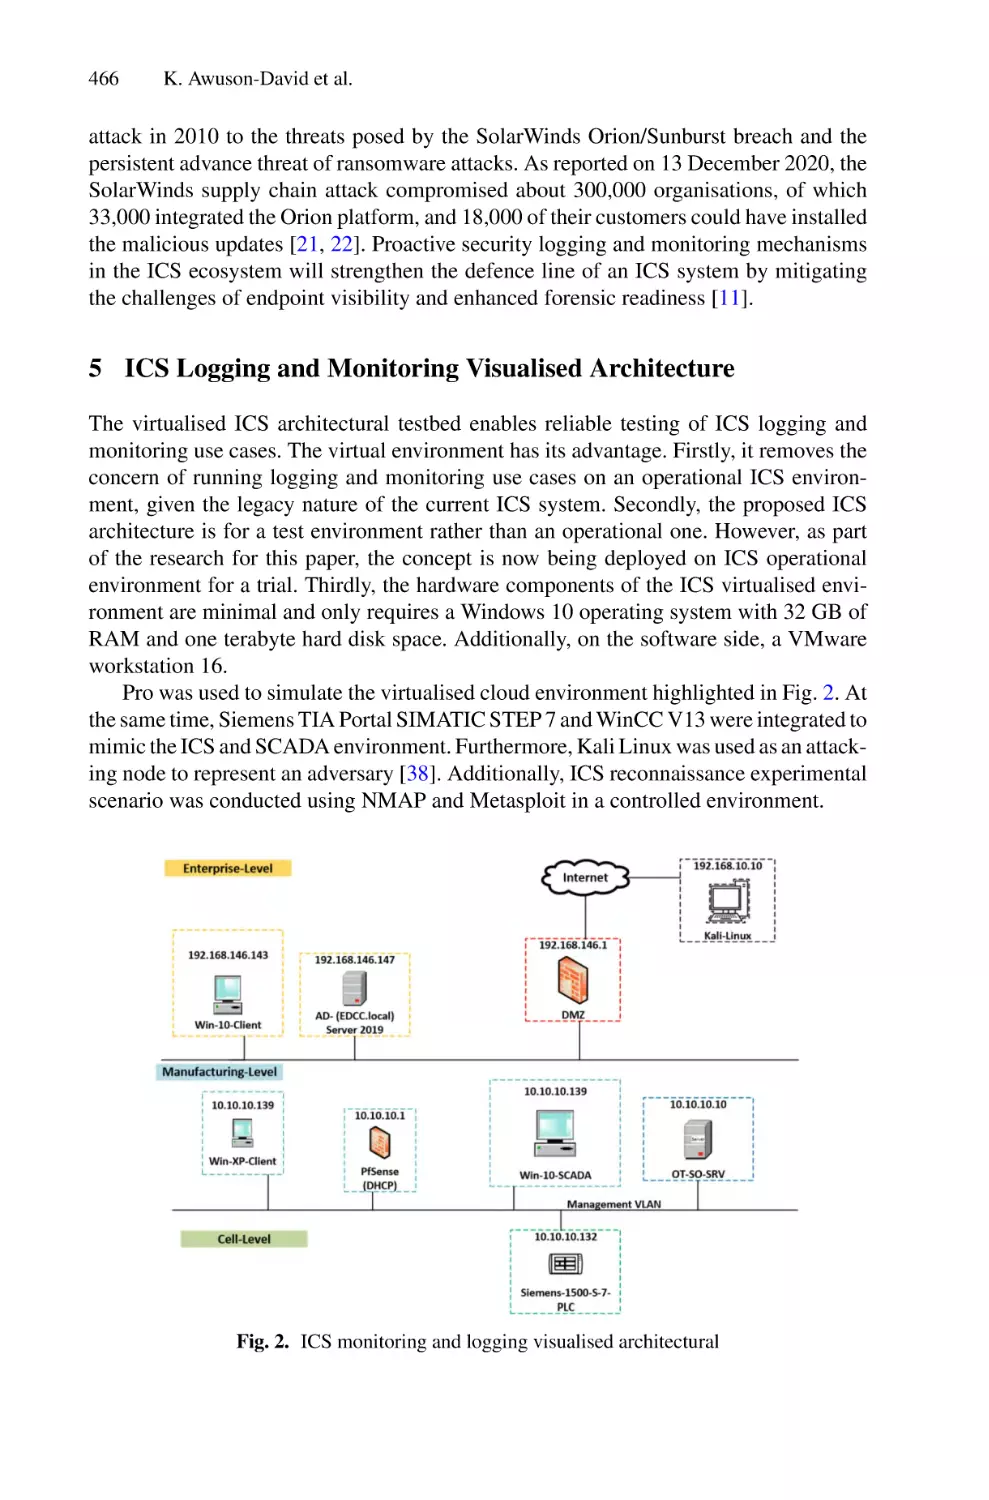
Technology (OT) Legacy Systems . . . . . . . . . . . . . . . . . . . . . . . . . . . . . . 461
Kenny Awuson-David, James Thompson, Kiran Tuner,
and Tawfik Al-Hadhrami
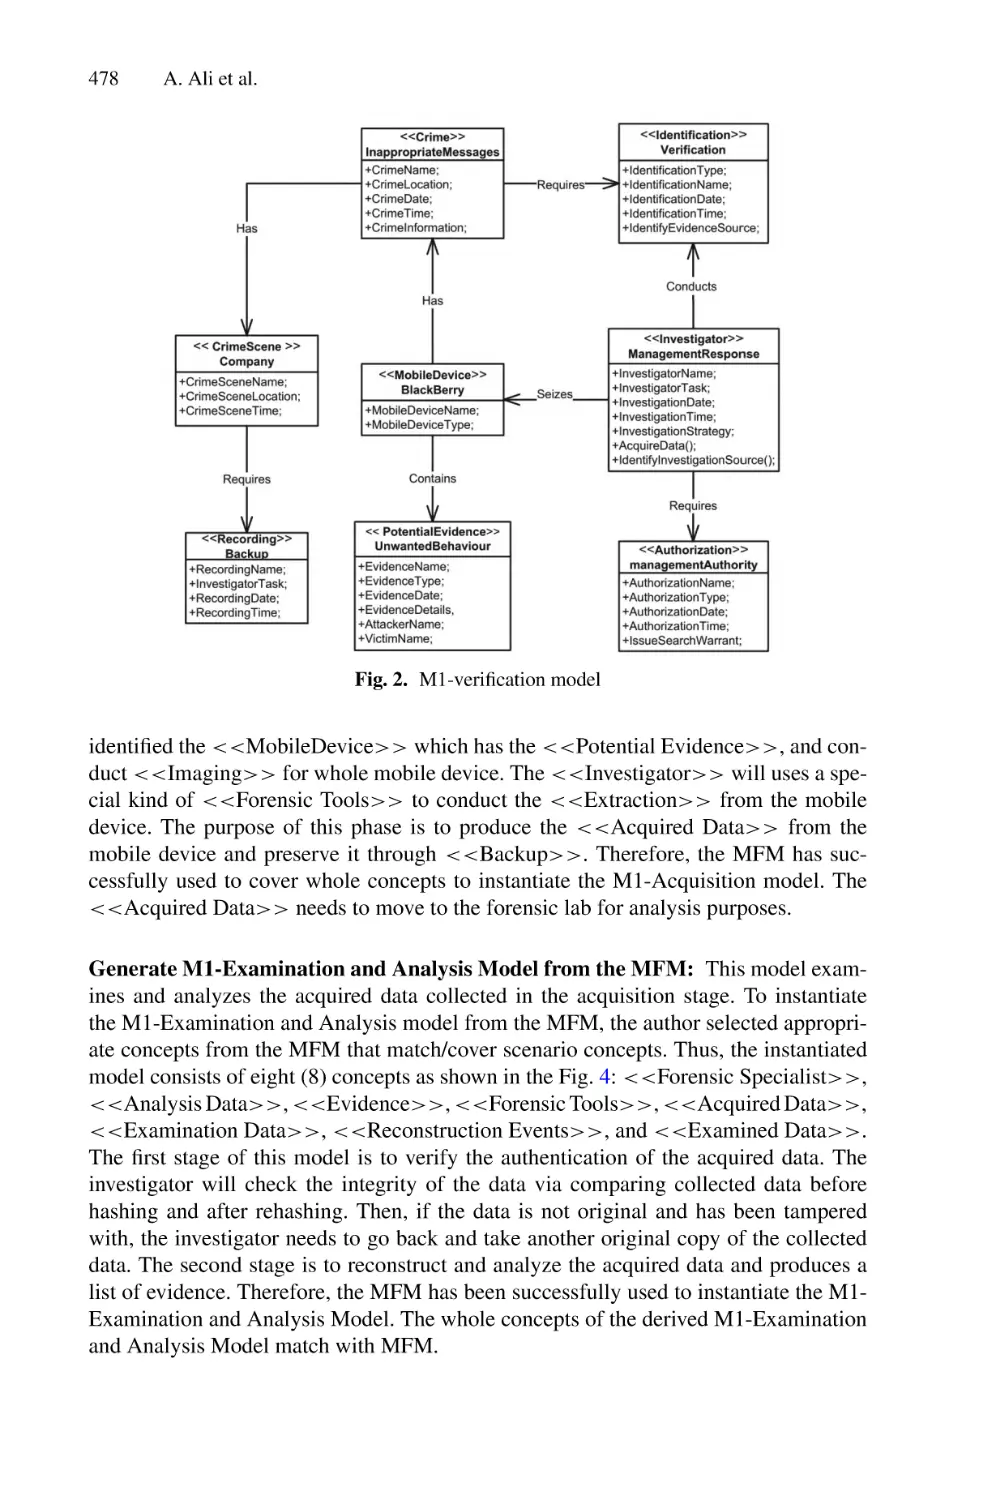
Validating Mobile Forensic Metamodel Using Tracing Method . . . . . . . 473
Abdulalem Ali, Shukor Abd Razak, Siti Hajar Othman,
Rashiq Rafiq Marie, Arafat Al-Dhaqm, and Maged Nasser
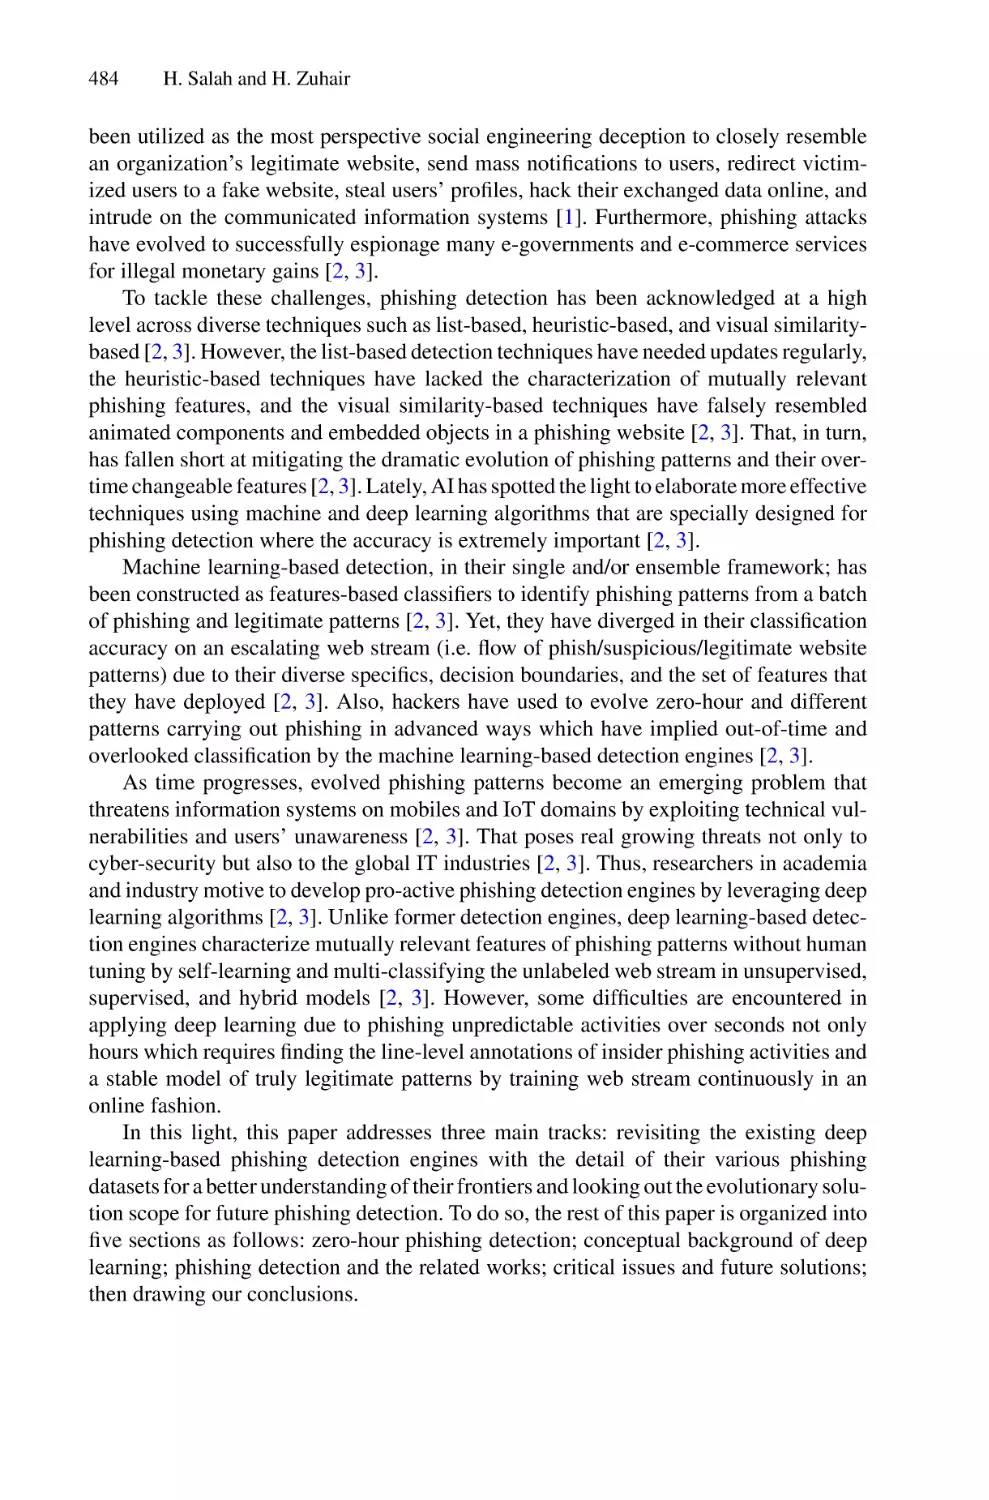
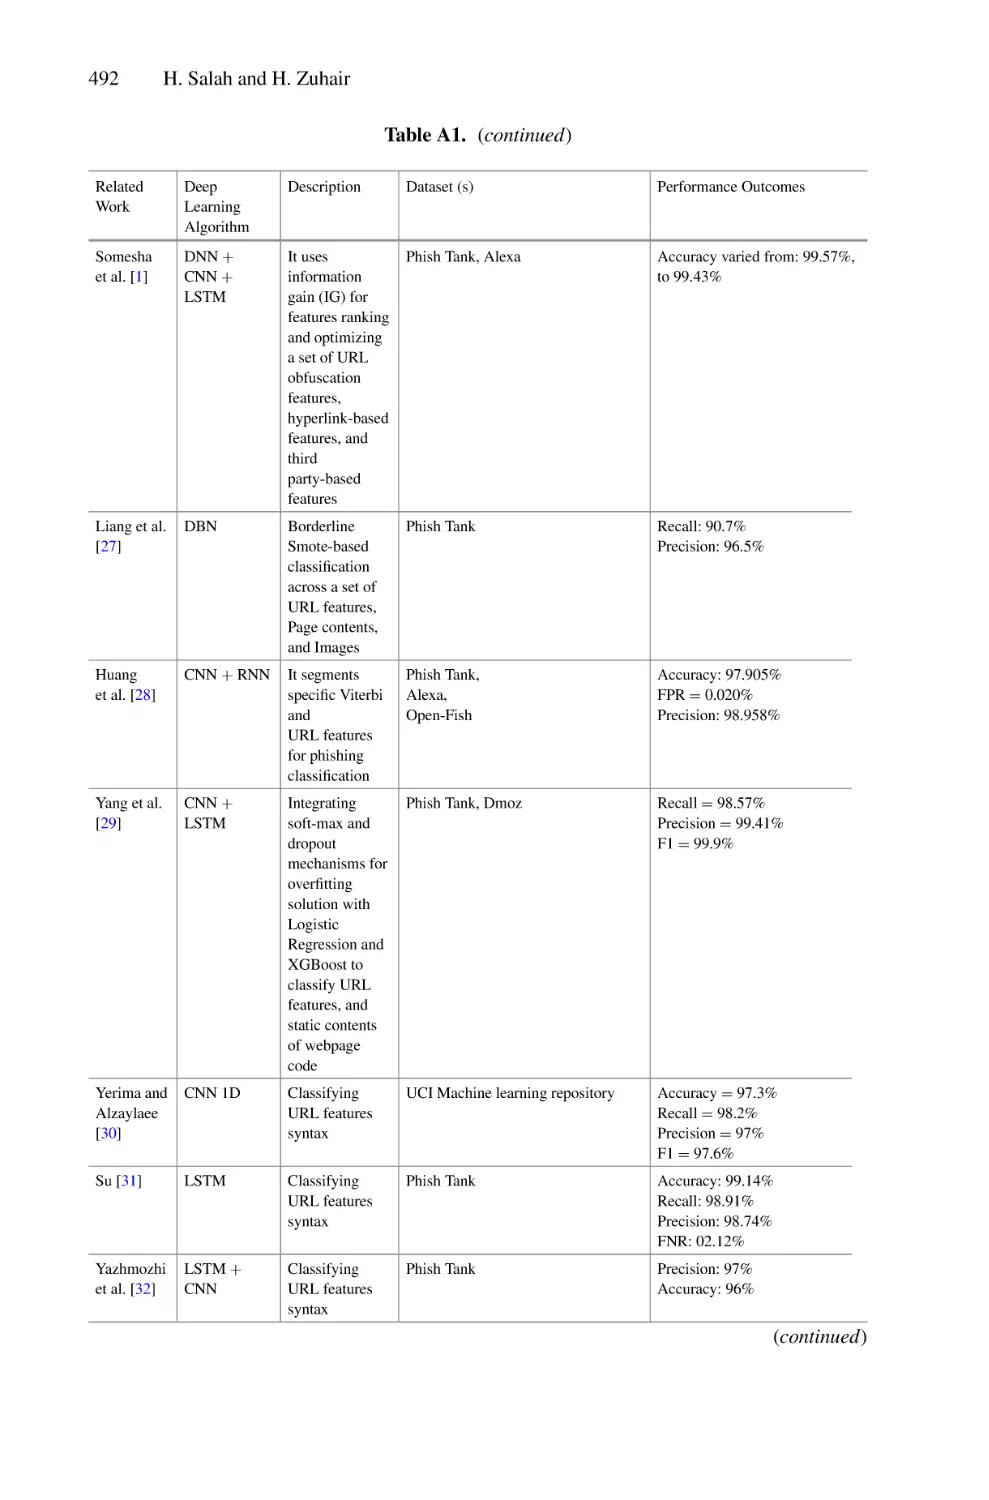
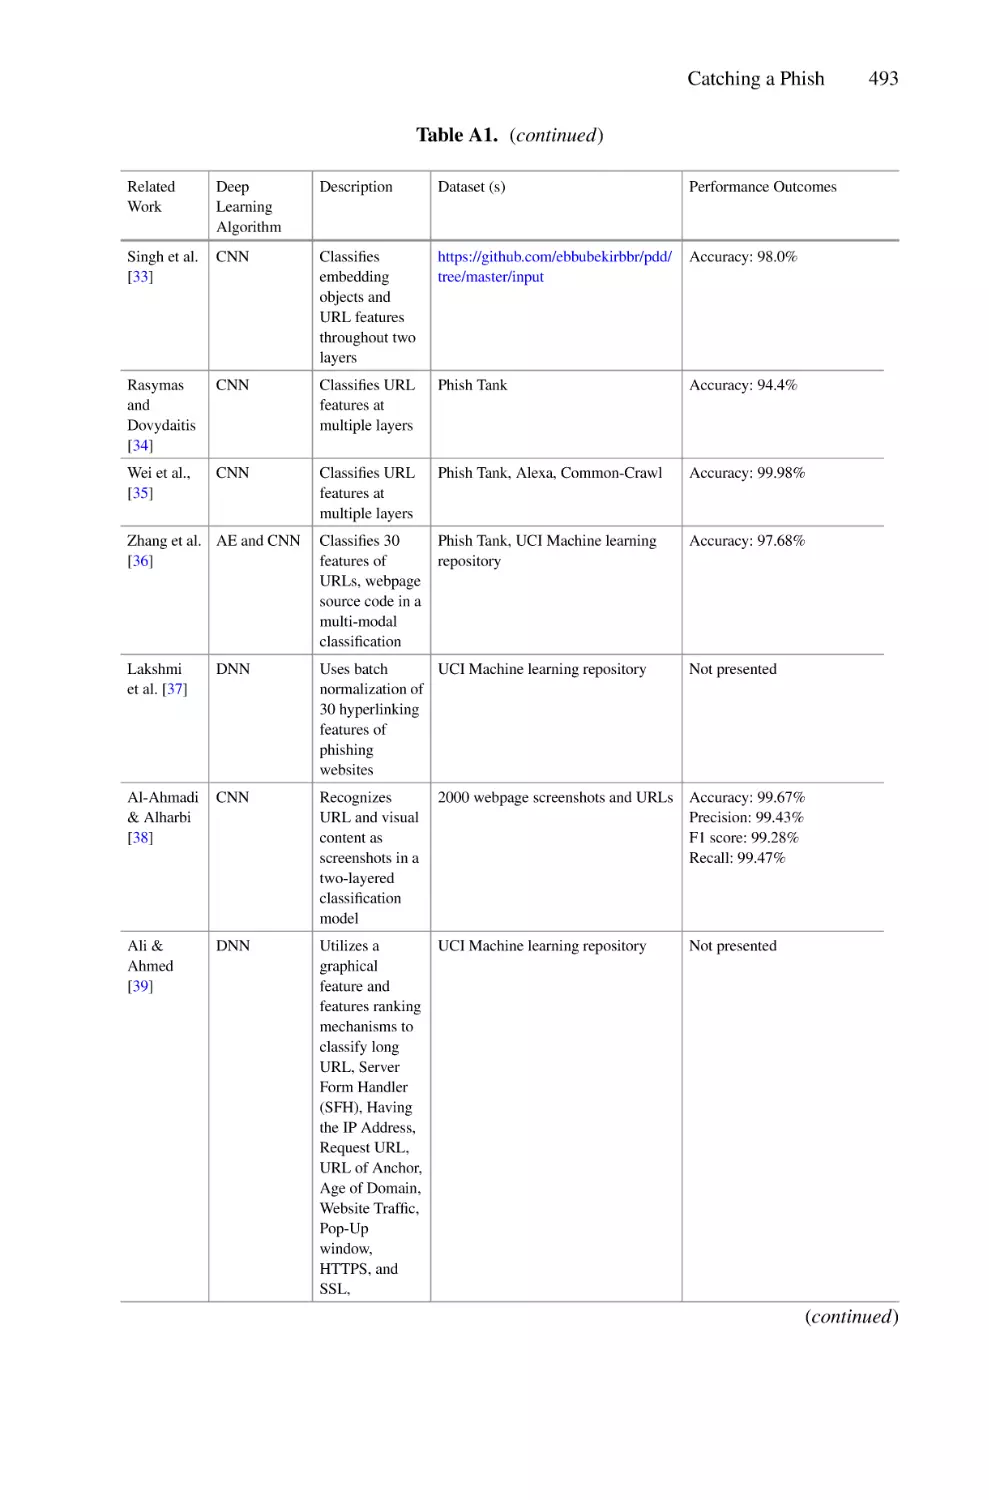
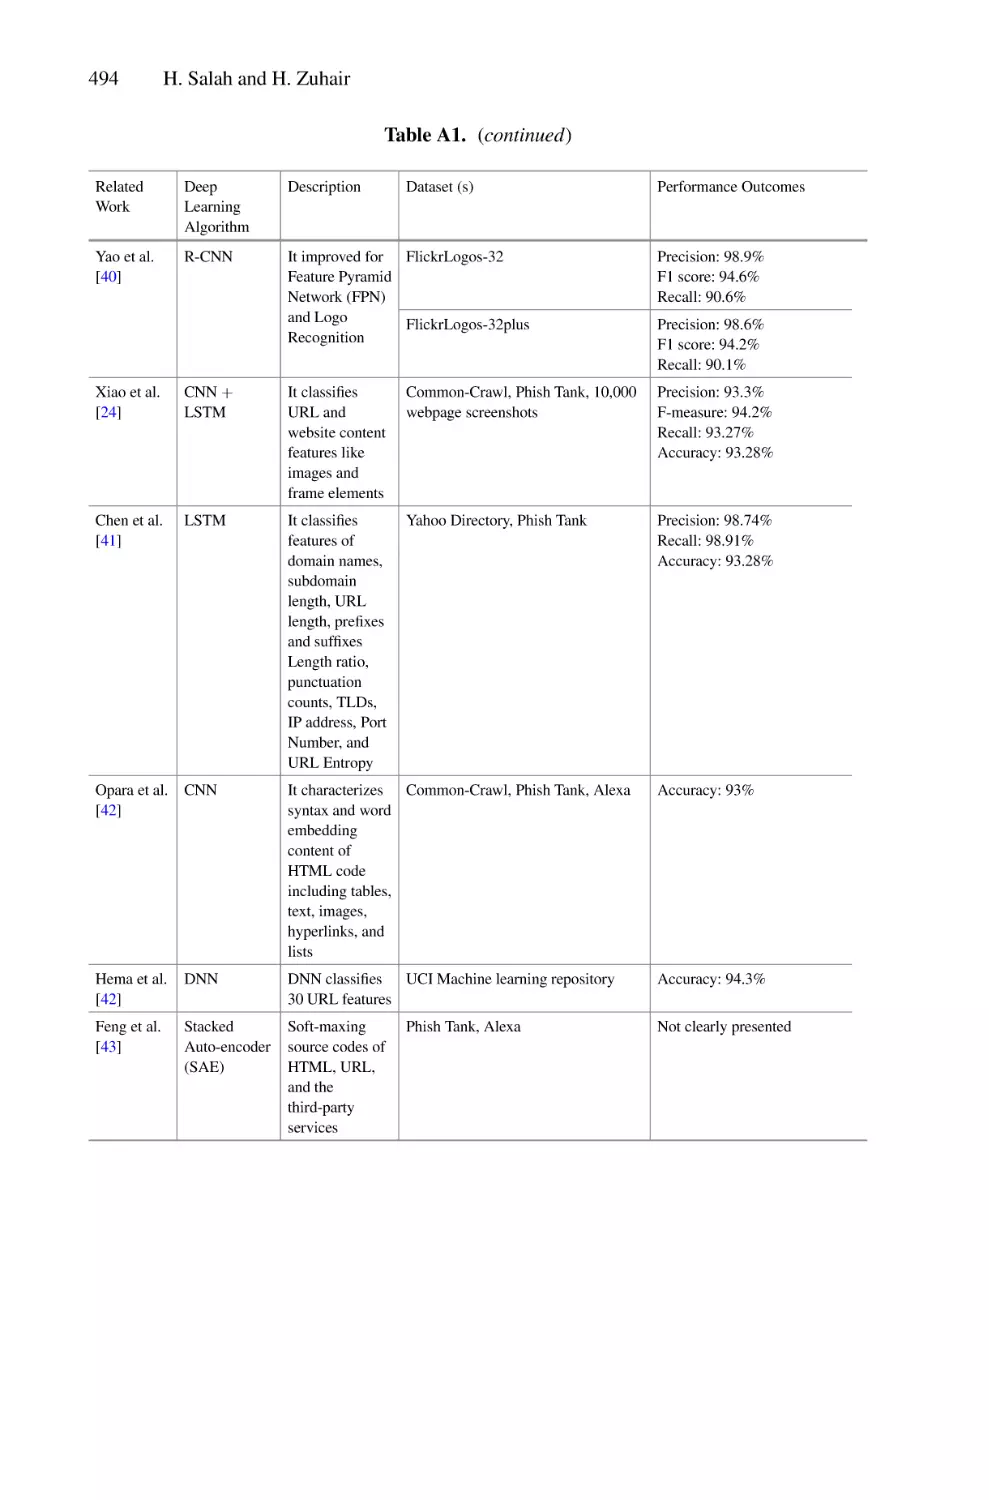
Catching a Phish: Frontiers of Deep Learning-Based Anticipating
Detection Engines . . . . . . . . . . . . . . . . . . . . . . . . . . . . . . . . . . . . . . . . . . 483
Hamzah Salah and Hiba Zuhair
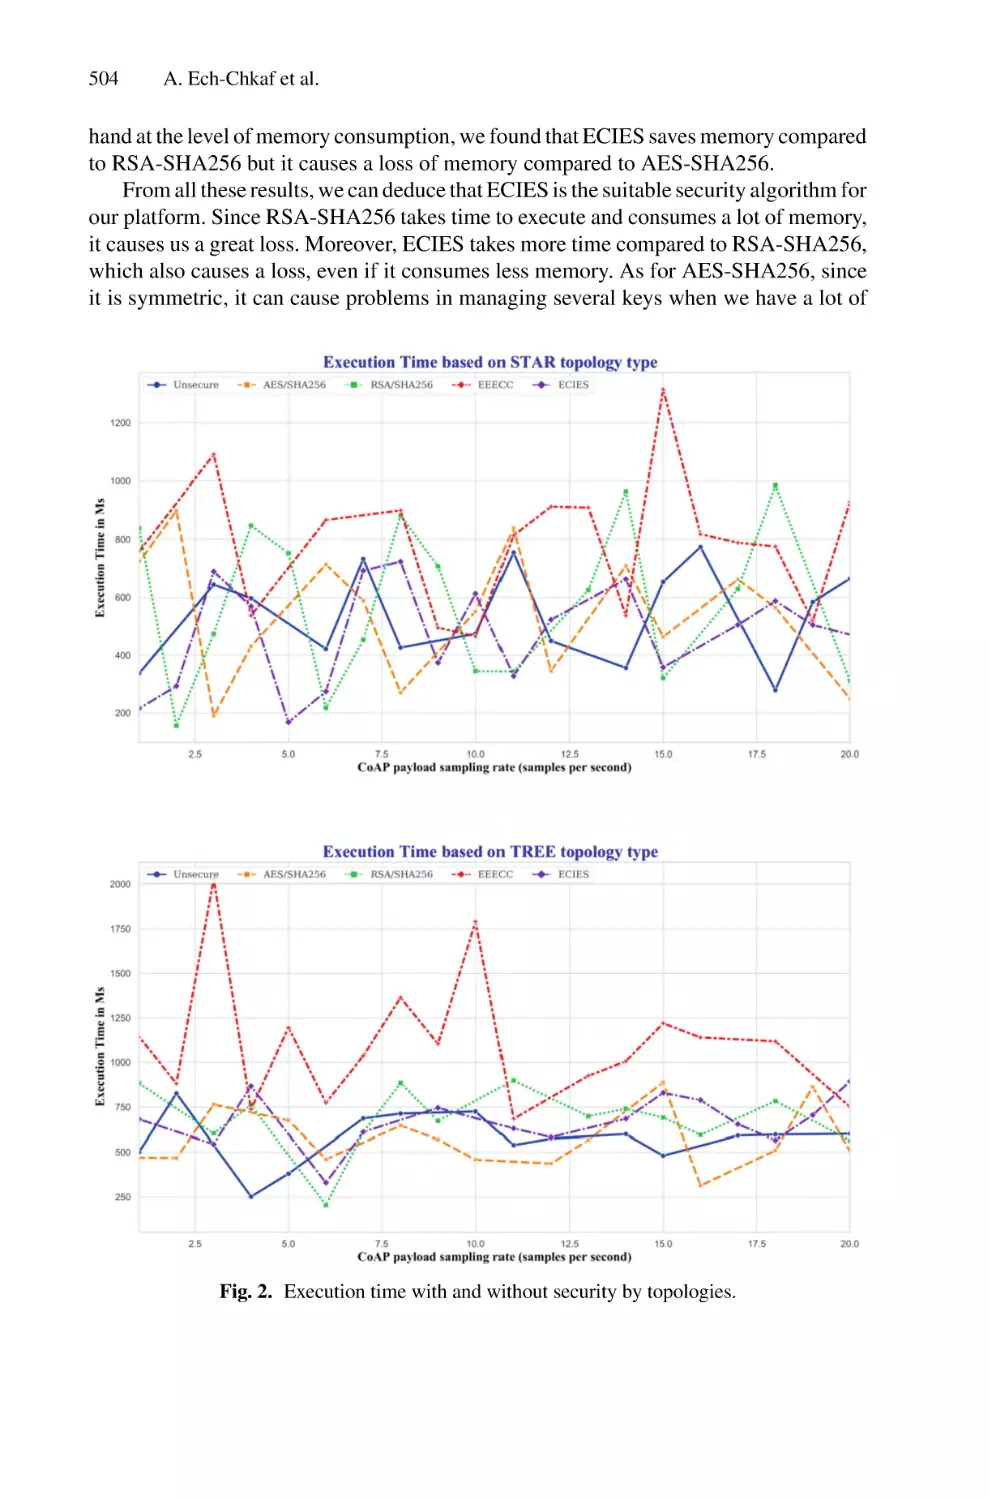
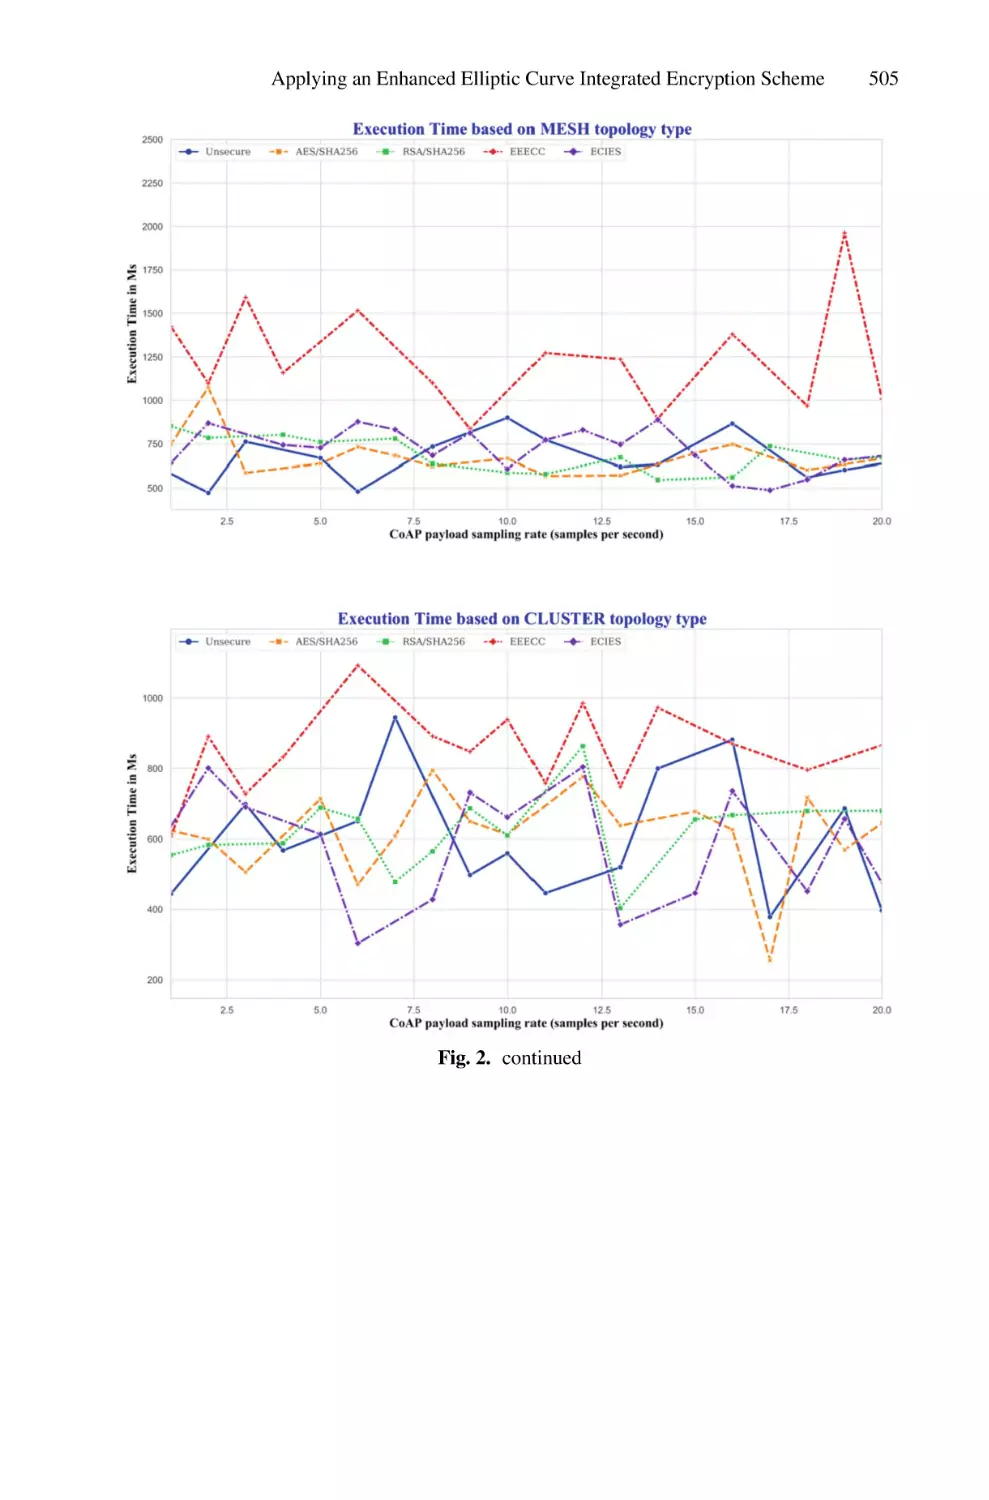
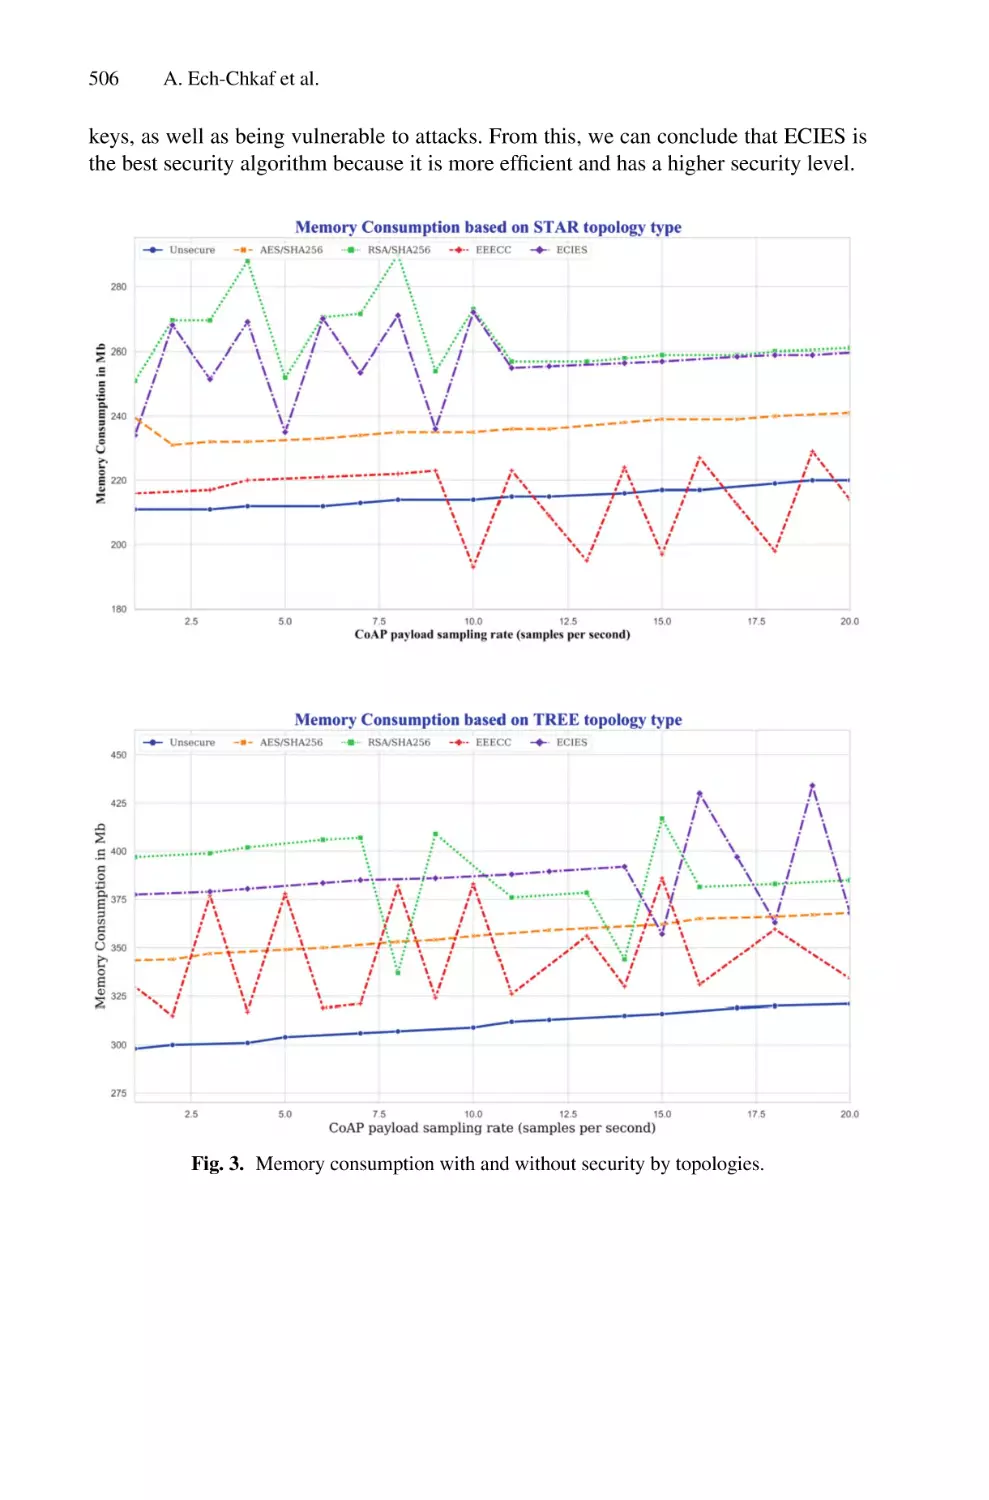
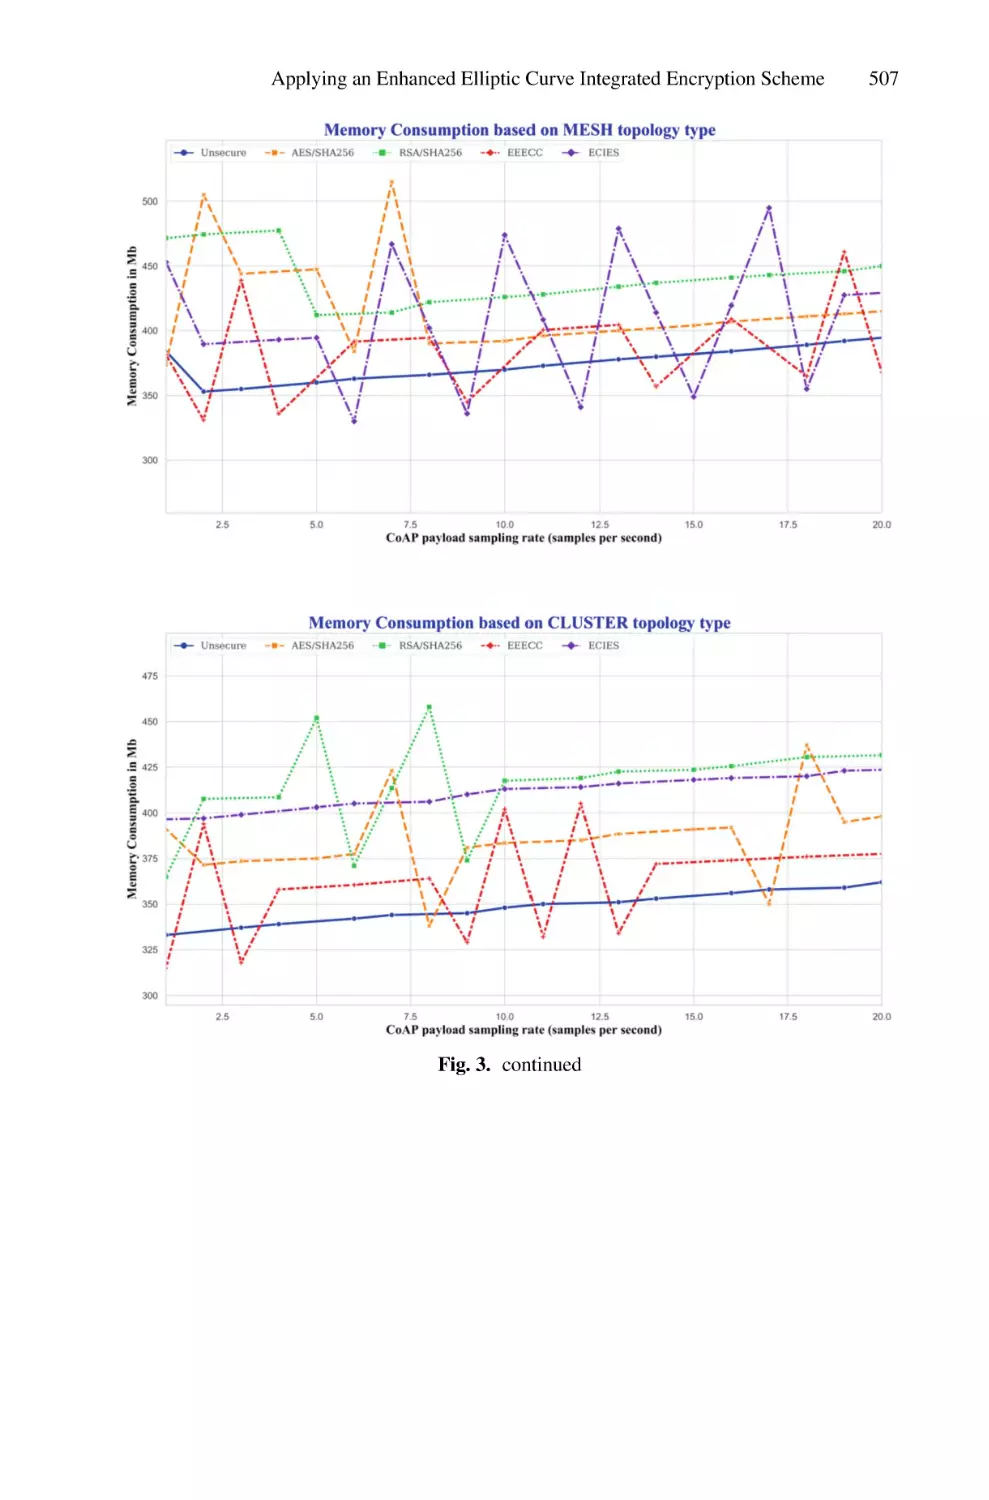
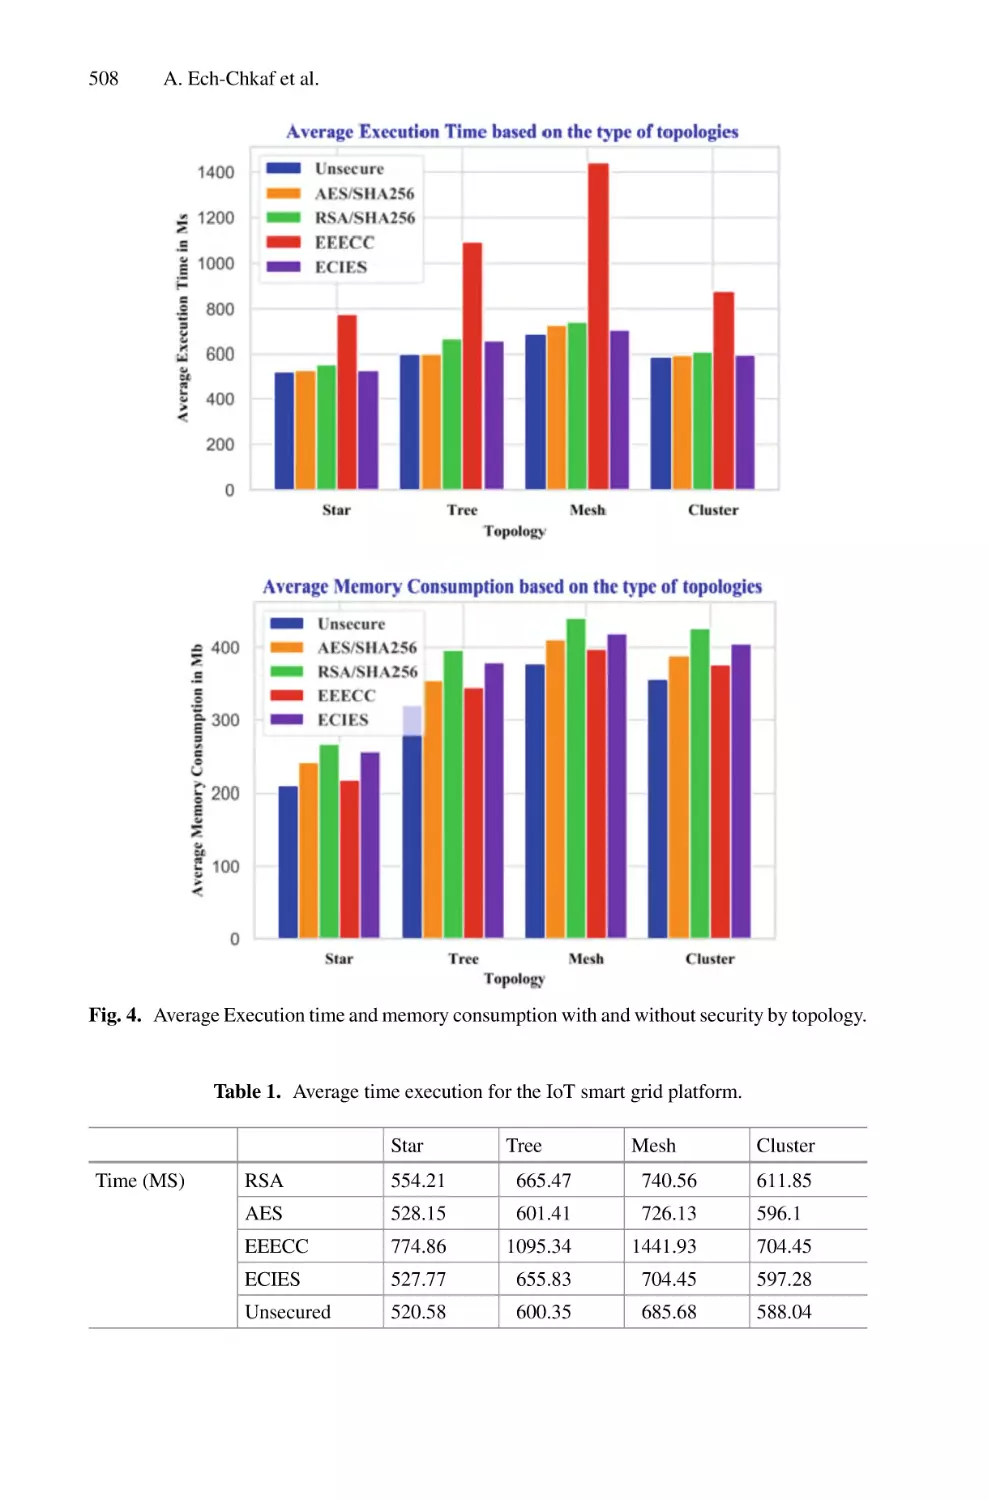
Applying an Enhanced Elliptic Curve Integrated Encryption
Scheme ECIES to Enhance Smart Energy IoT Platform Security
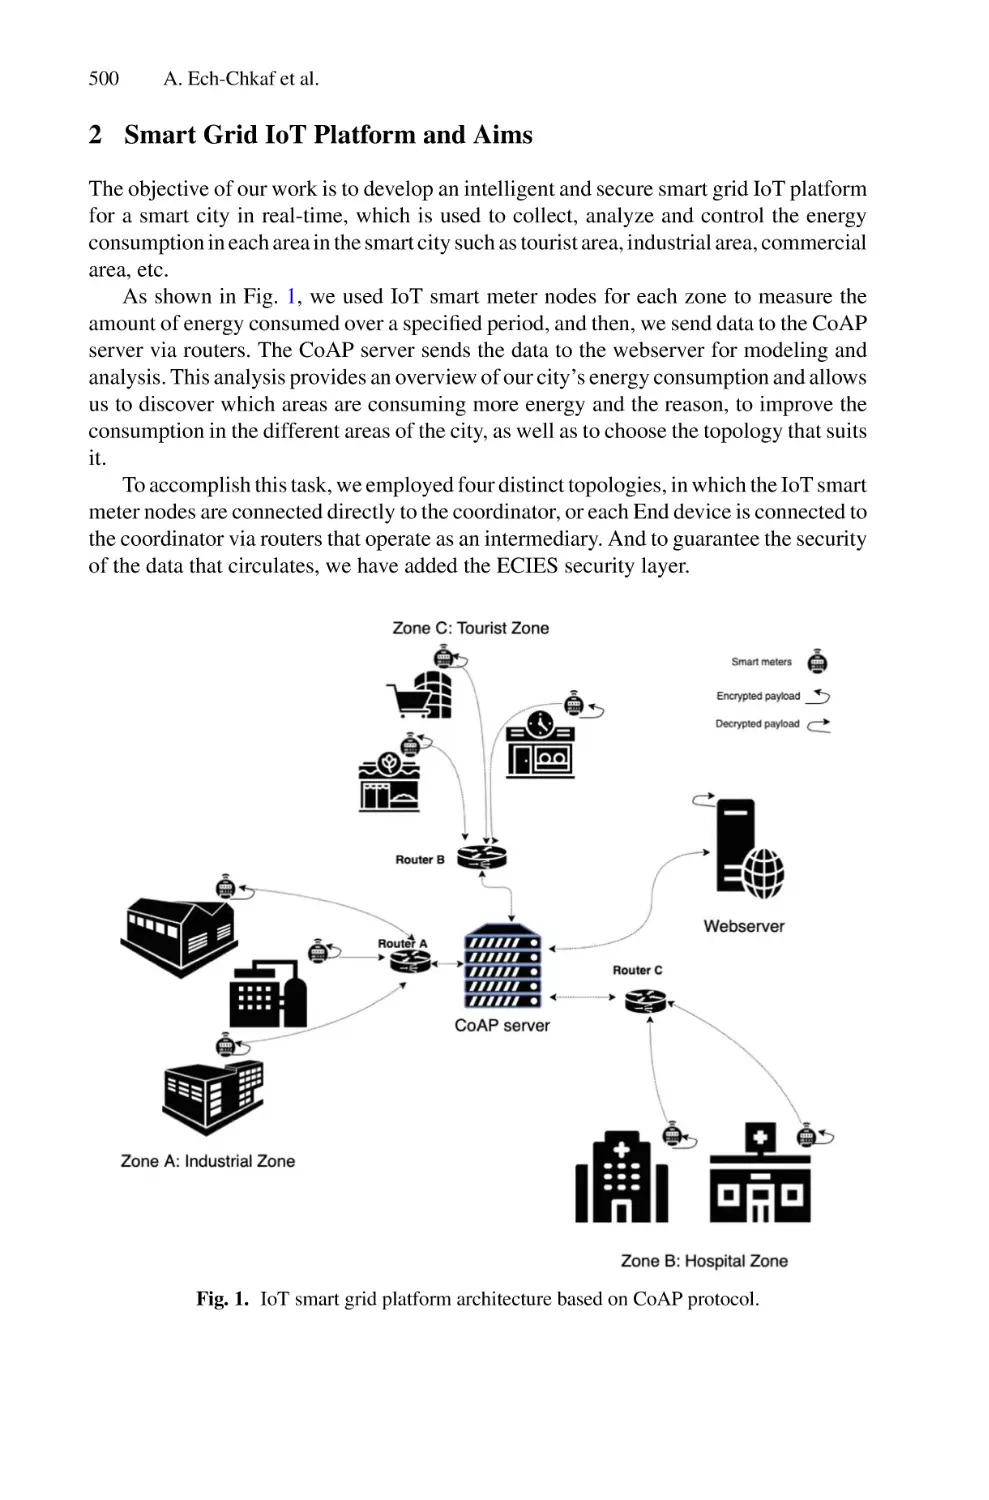
Based on Constrained Protocol . . . . . . . . . . . . . . . . . . . . . . . . . . . . . . . 498
Ayoub Ech-Chkaf, Salma Ait Oussous, Abdelhadi El Allali,
Siham Beloualid, Taoufiq El Harrouti, Sanaa El Aidi, Abderrahim Bajit,
Habiba Chaoui, and Ahmed Tamtoui
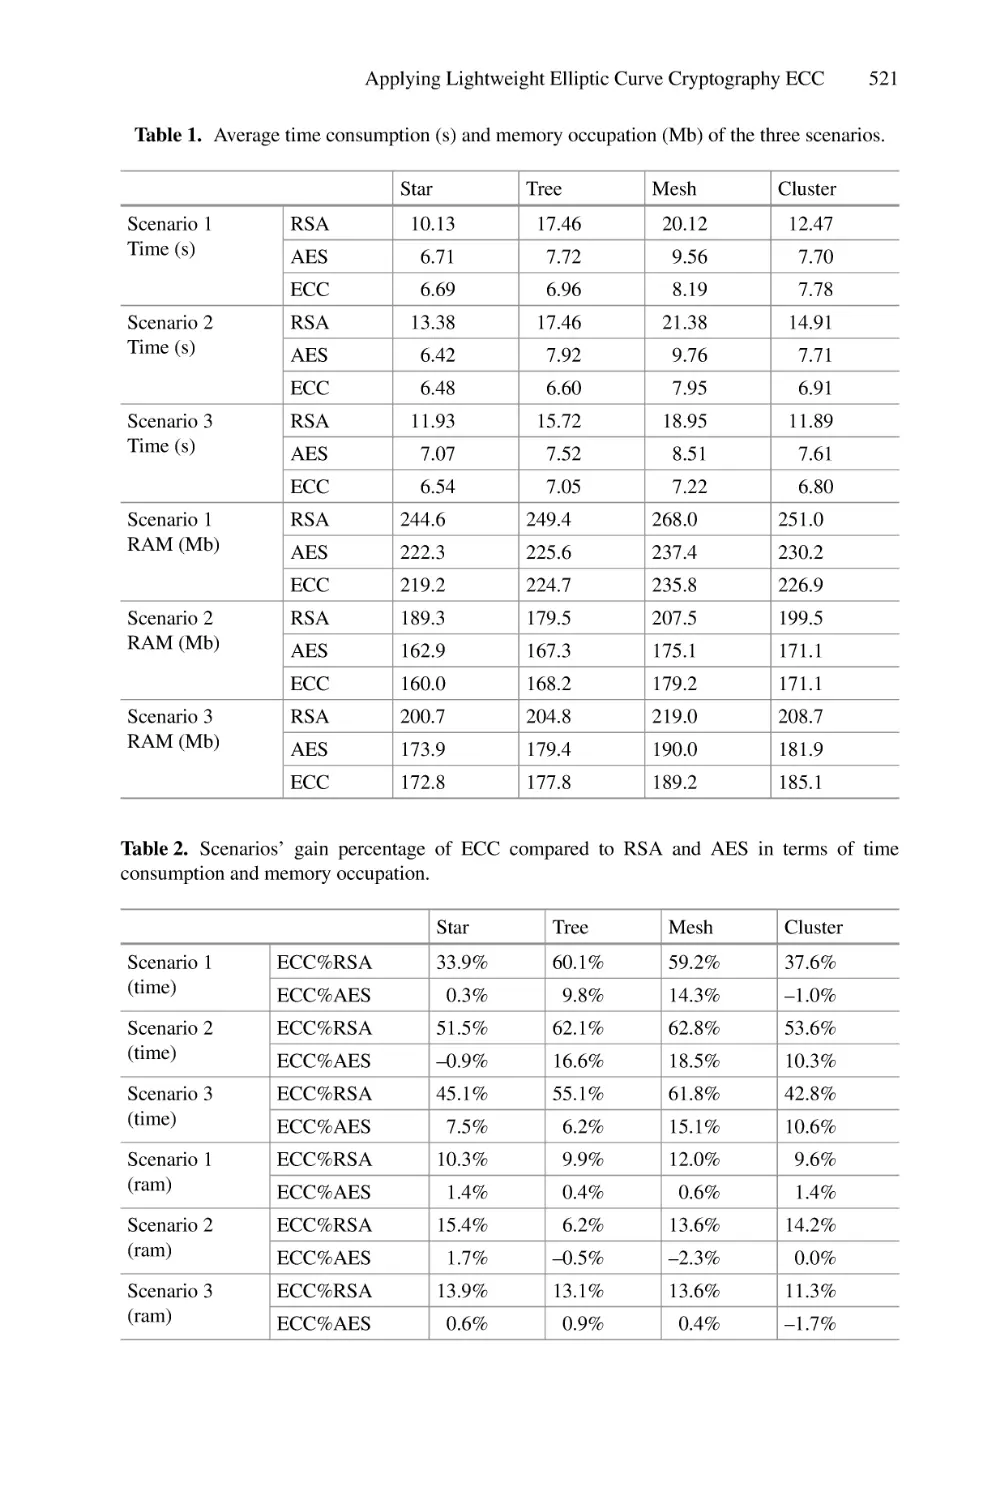
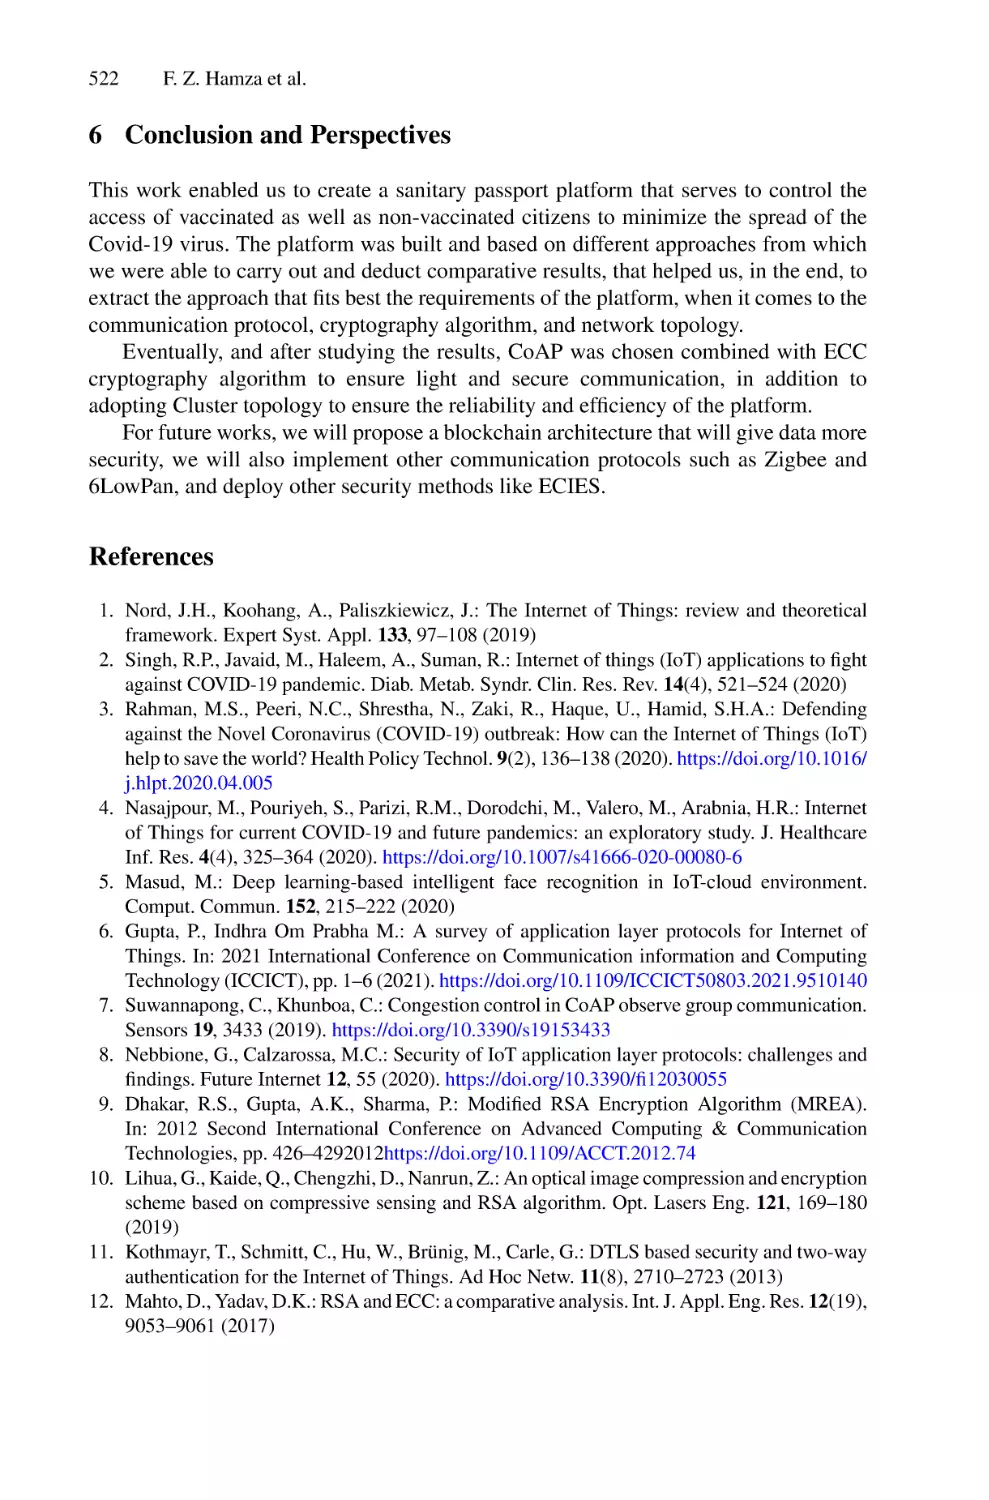
Applying Lightweight Elliptic Curve Cryptography ECC and
Advanced IoT Network Topologies to Optimize COVID-19 Sanitary
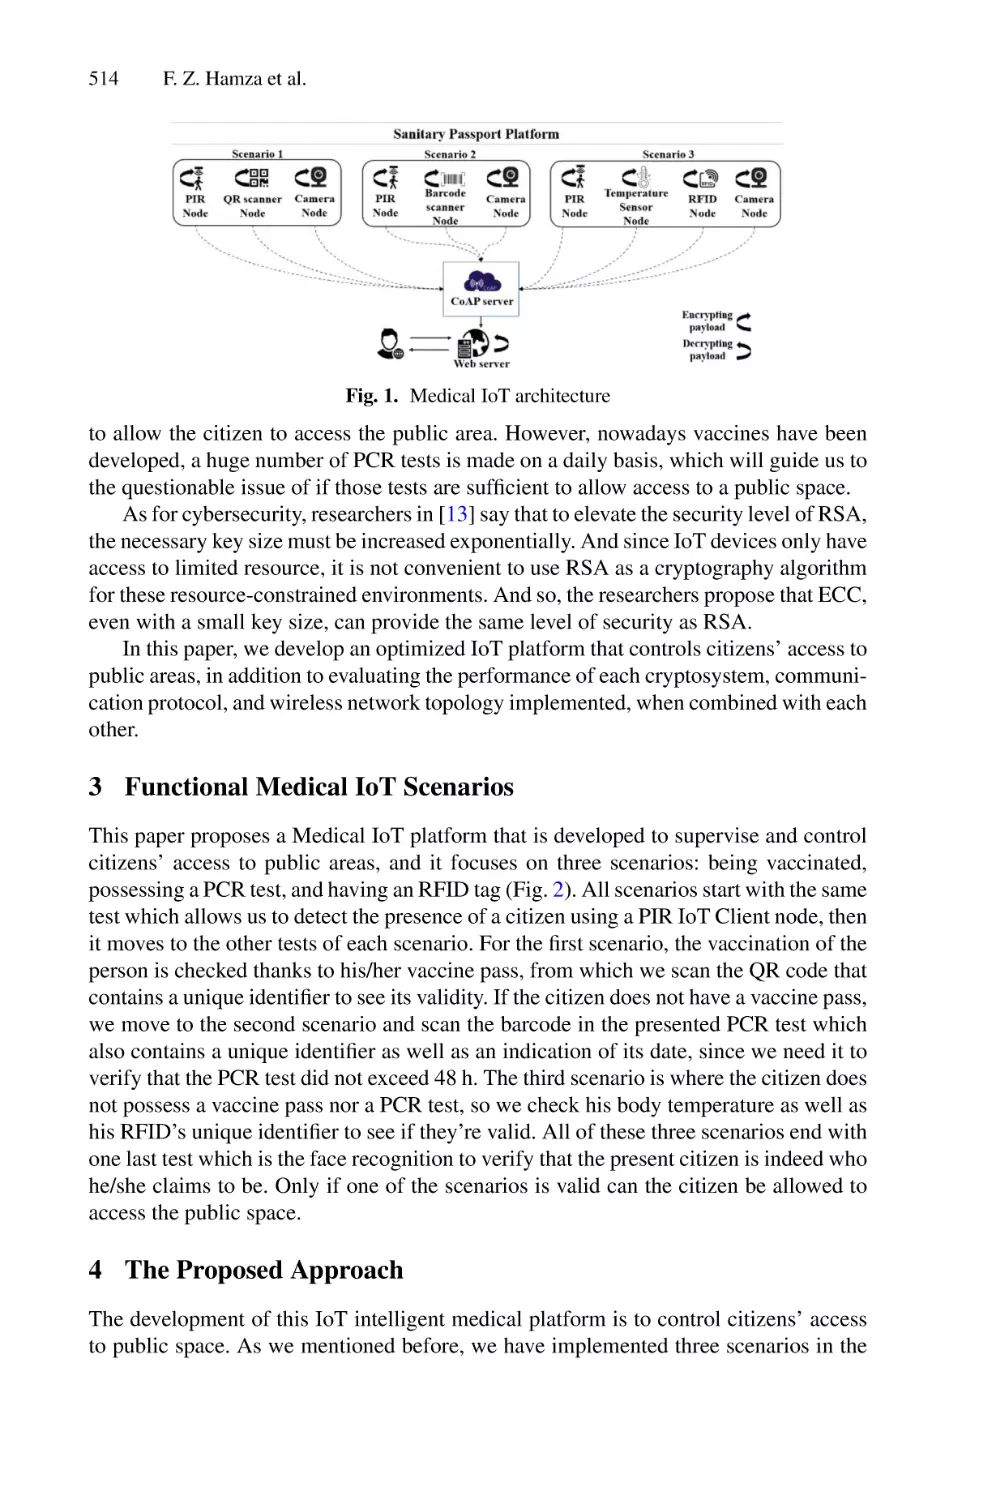
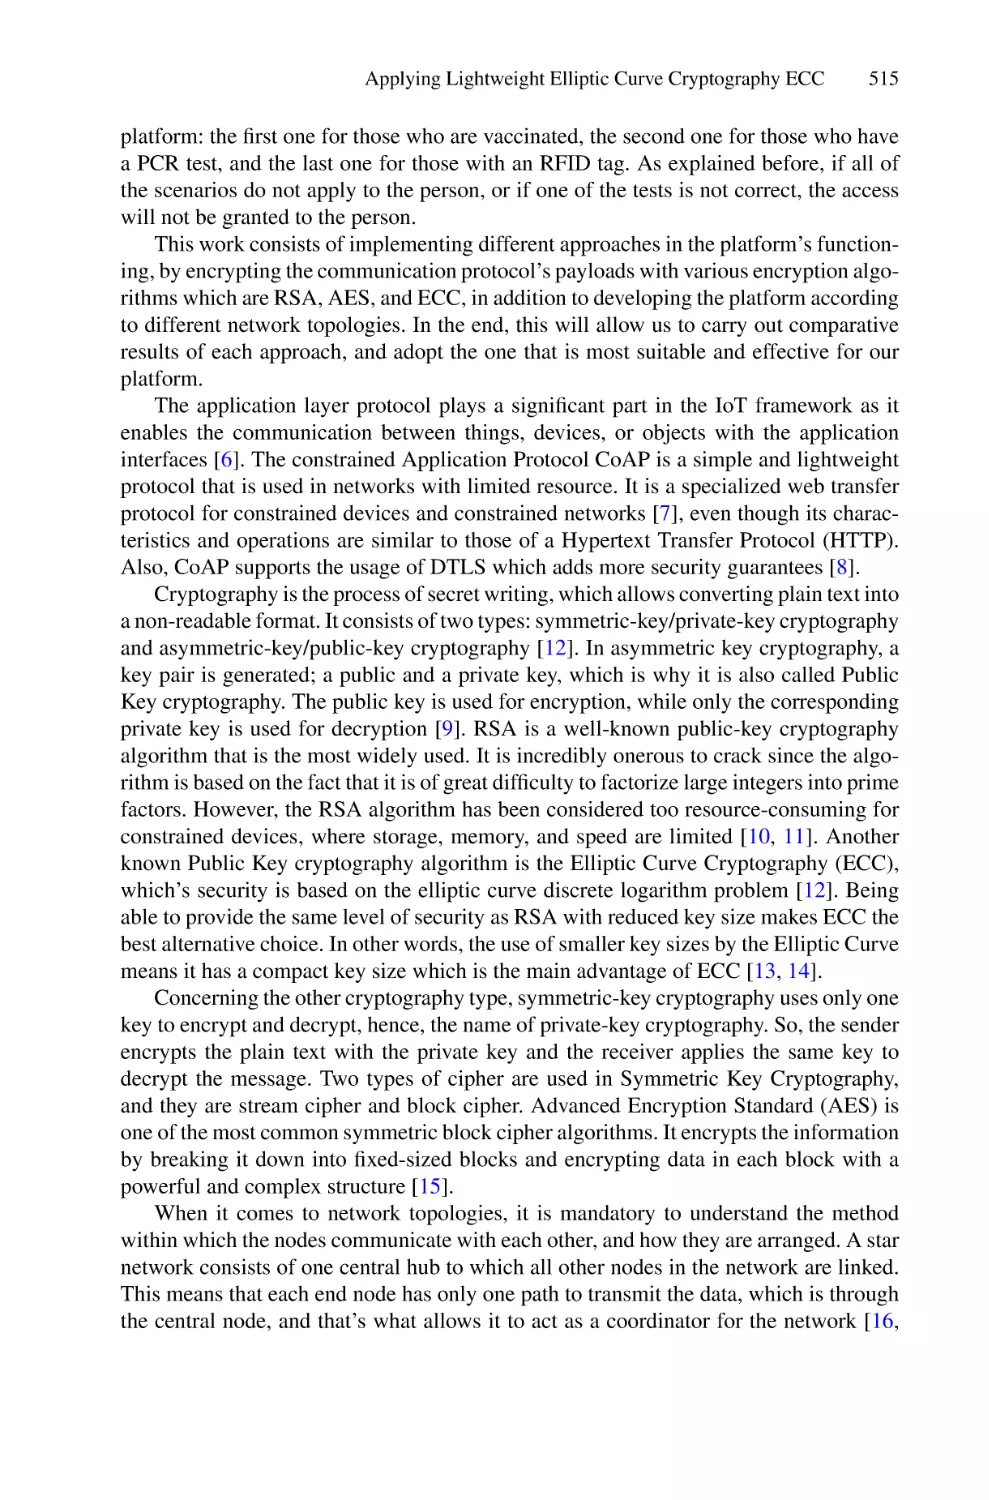
Passport Platforms Based on Constrained Application Protocol . . . . . . . 512
Fatima Zahra Hamza, Sanaa El Aidi, Abdelhadi El Allali, Siham Beloualid,
Abderrahim Bajit, and Ahmed Tamtaoui
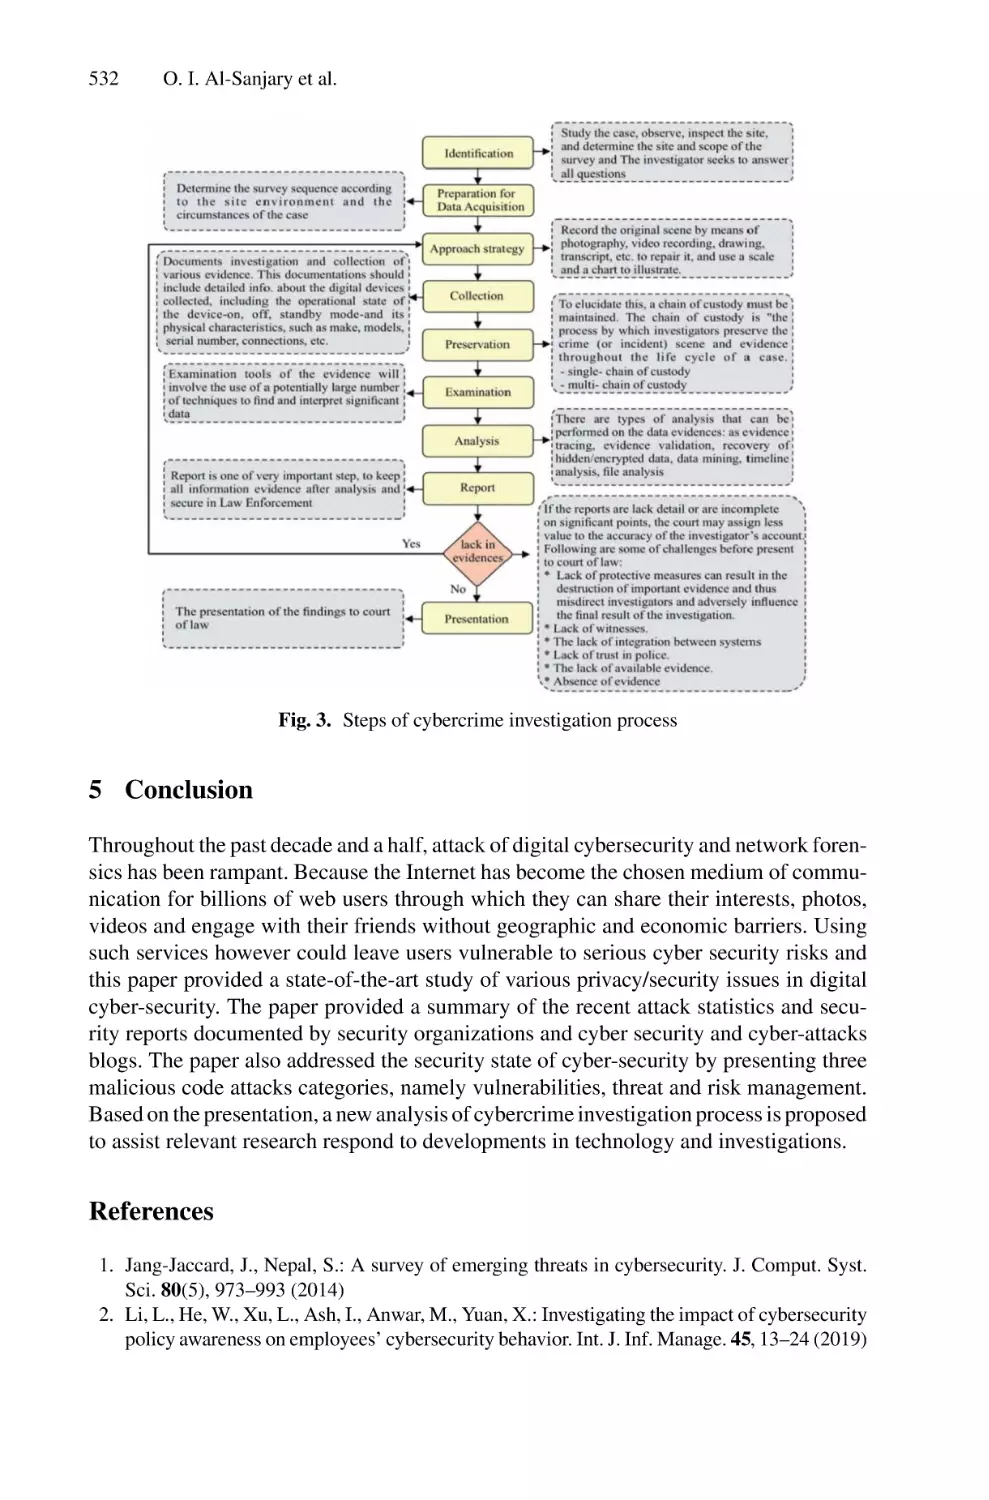
Challenges on Digital Cyber-Security and Network Forensics:
A Survey . . . . . . . . . . . . . . . . . . . . . . . . . . . . . . . . . . . . . . . . . . . . . . . . 524
Omar Ismael Al-Sanjary, Ahmed Abdullah Ahmed, M. N. Mohammed,
and Kevin Loo Teow Aik
Information Systems
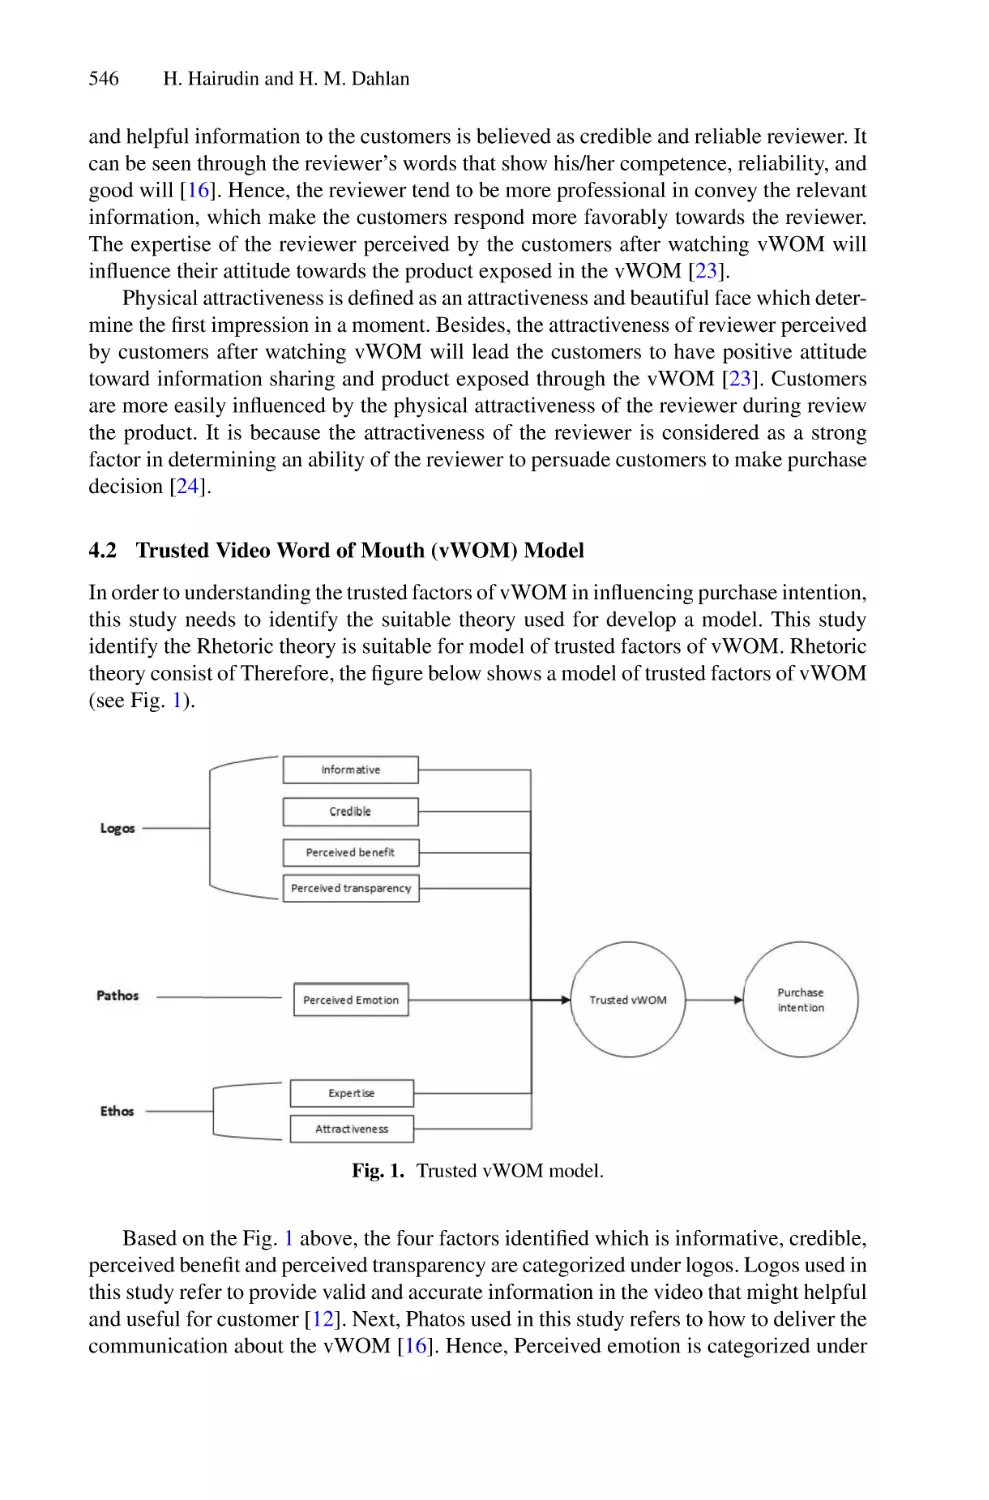
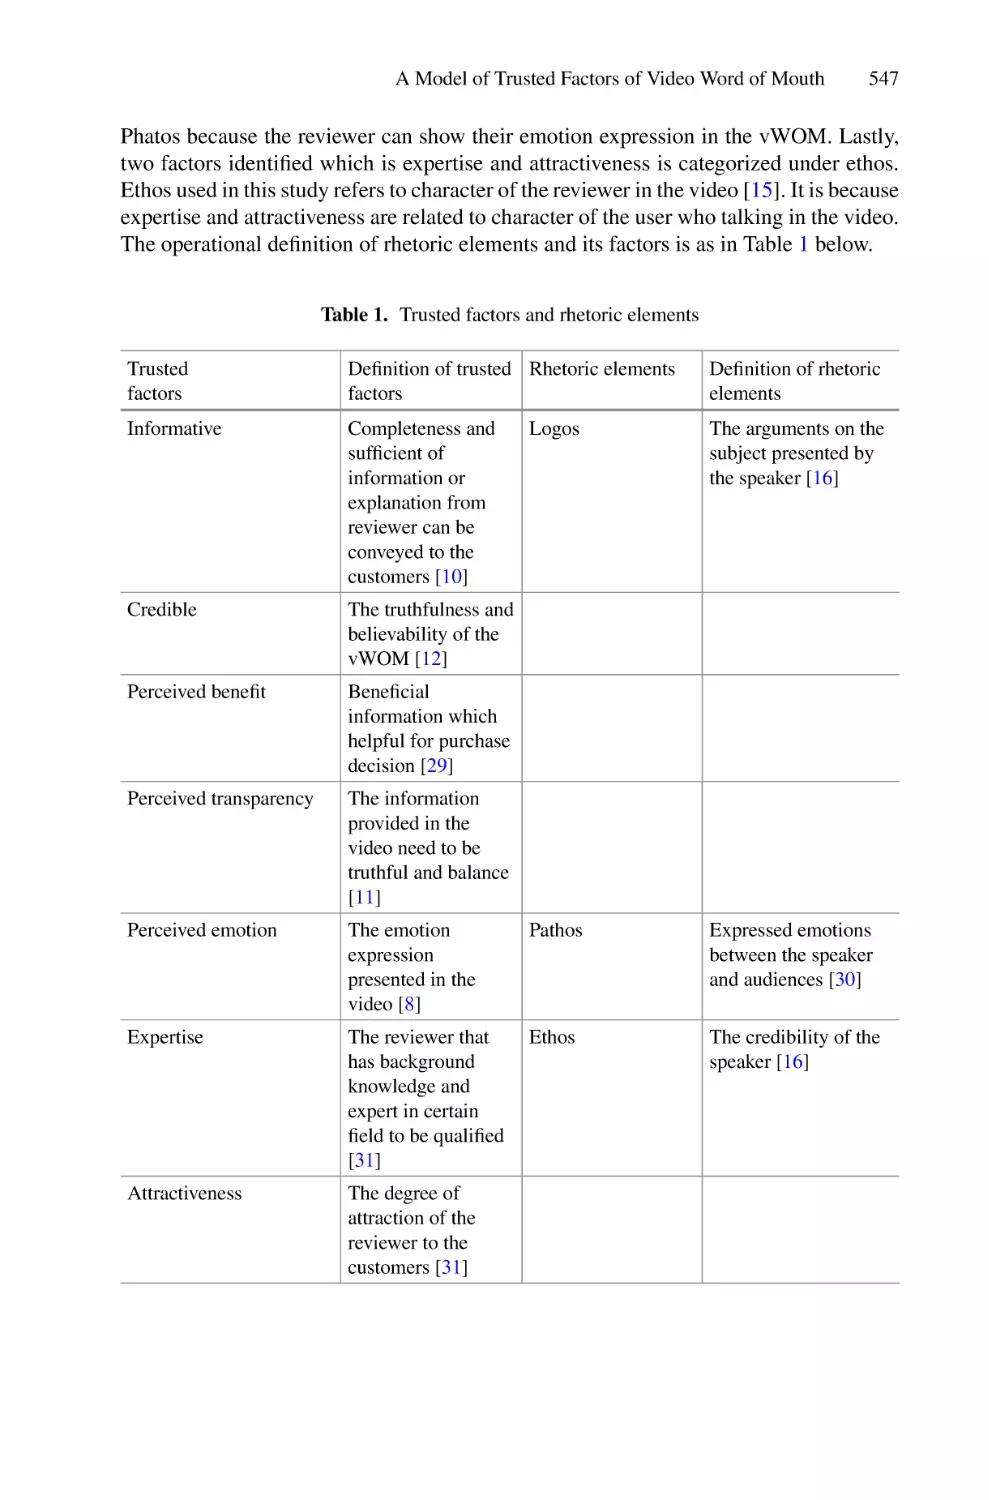
A Model of Trusted Factors of Video Word of Mouth (vWOM)
in Social Commerce . . . . . . . . . . . . . . . . . . . . . . . . . . . . . . . . . . . . . . . . 541
Humaira Hairudin and Halina Mohamed Dahlan
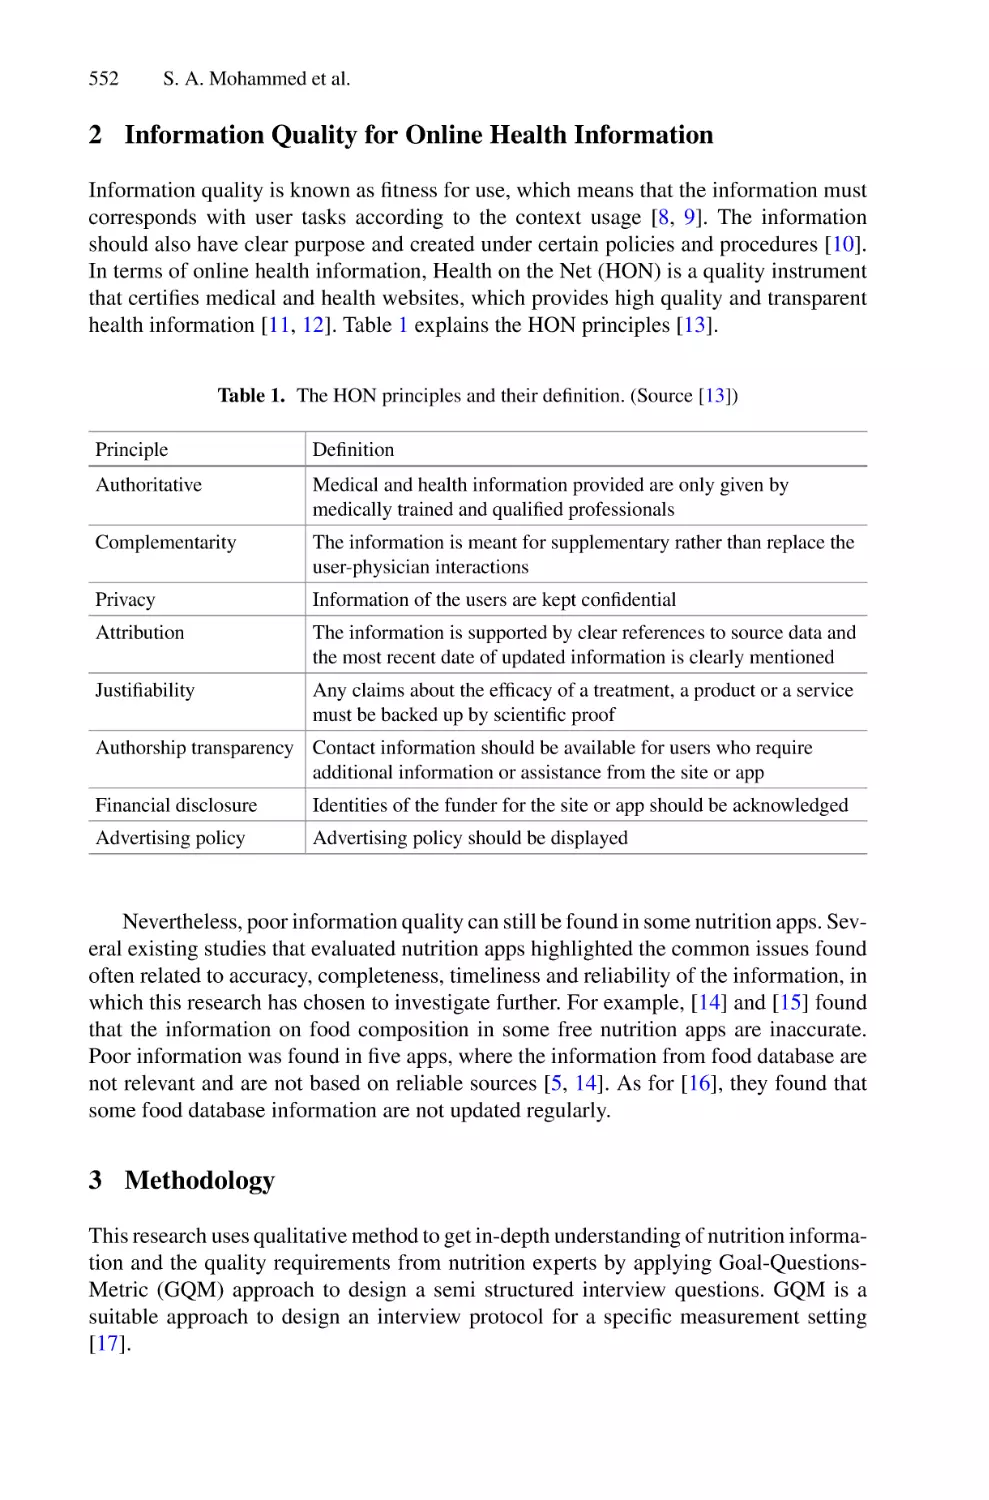
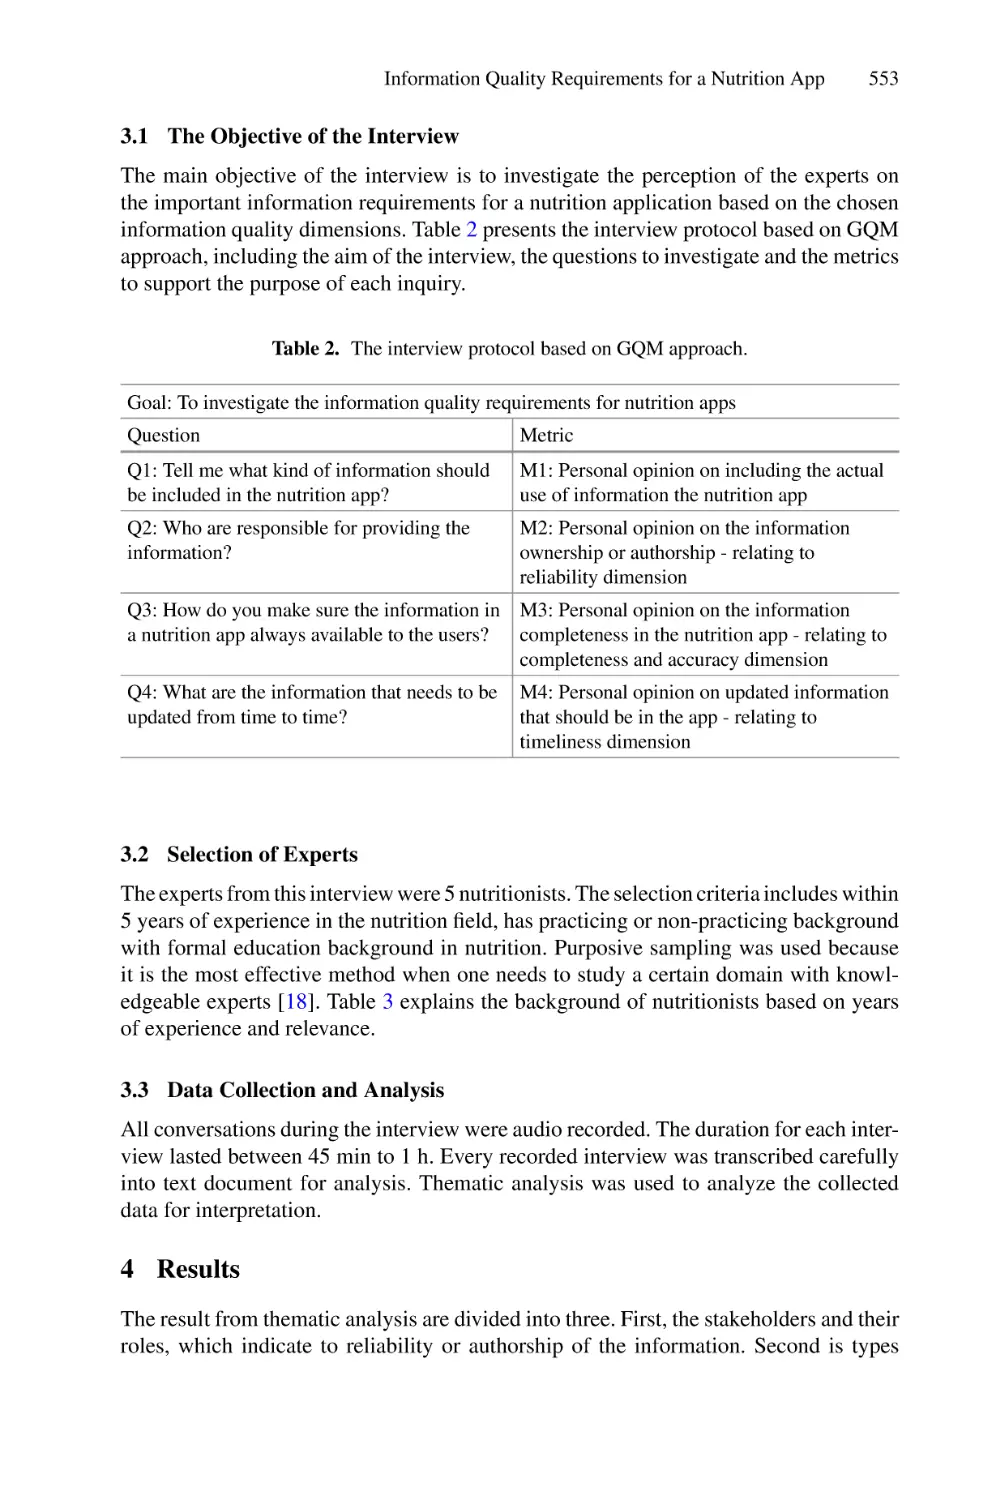
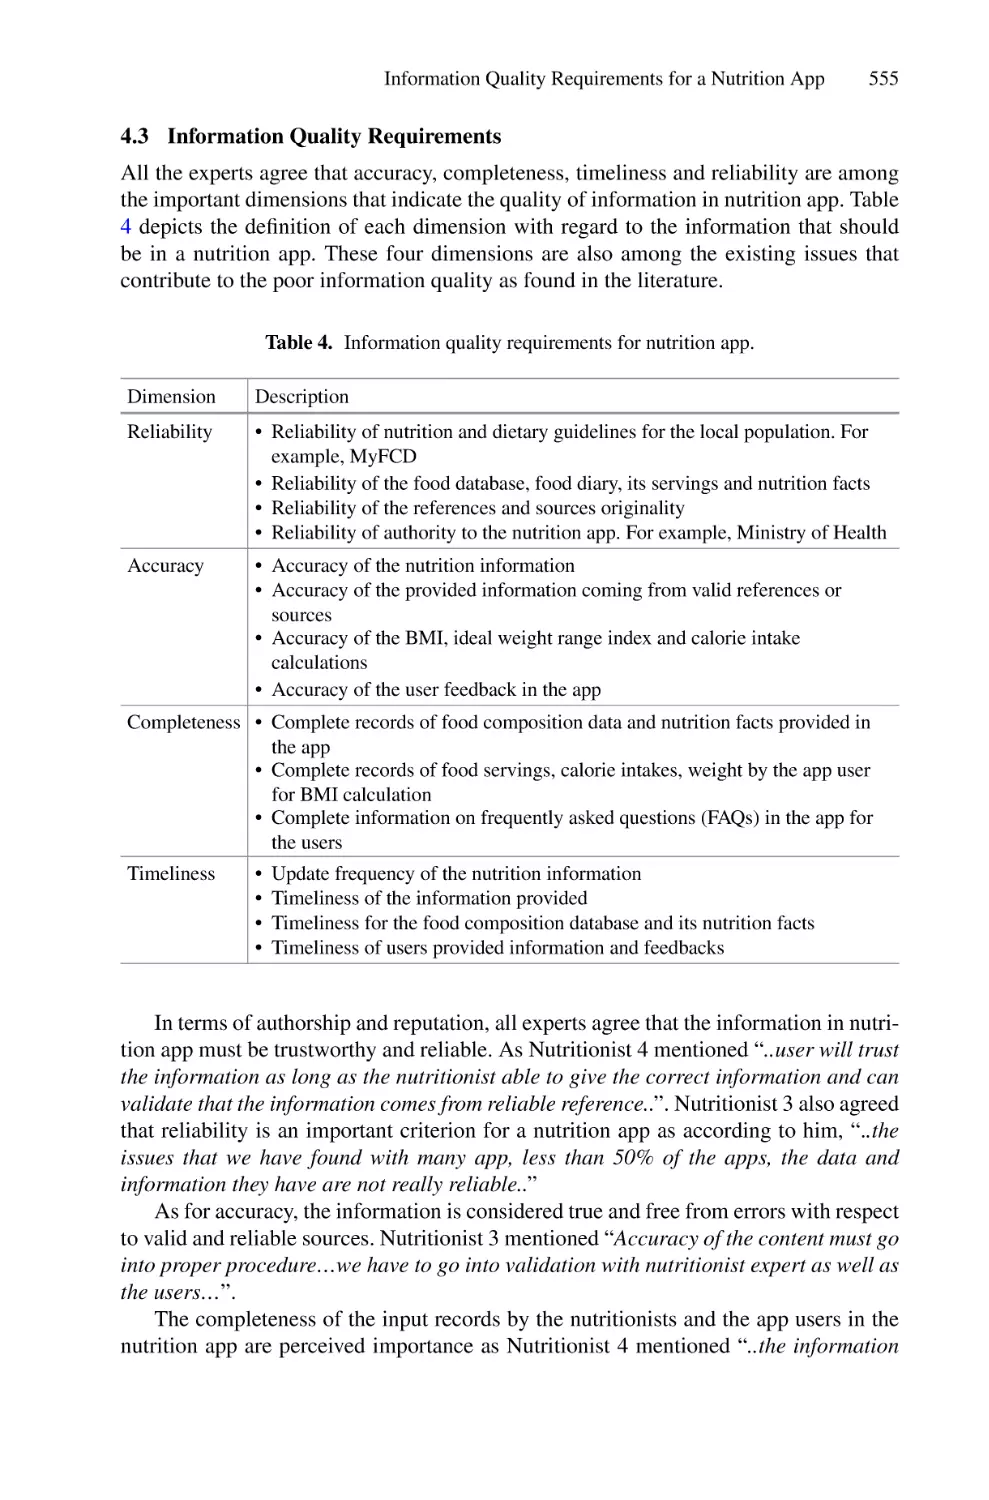
Information Quality Requirements for a Nutrition App Based
on Experts Interviews . . . . . . . . . . . . . . . . . . . . . . . . . . . . . . . . . . . . . . . 551
Siti Asma Mohammed, Mohamed Aden Ighe, and Azlin Nordin
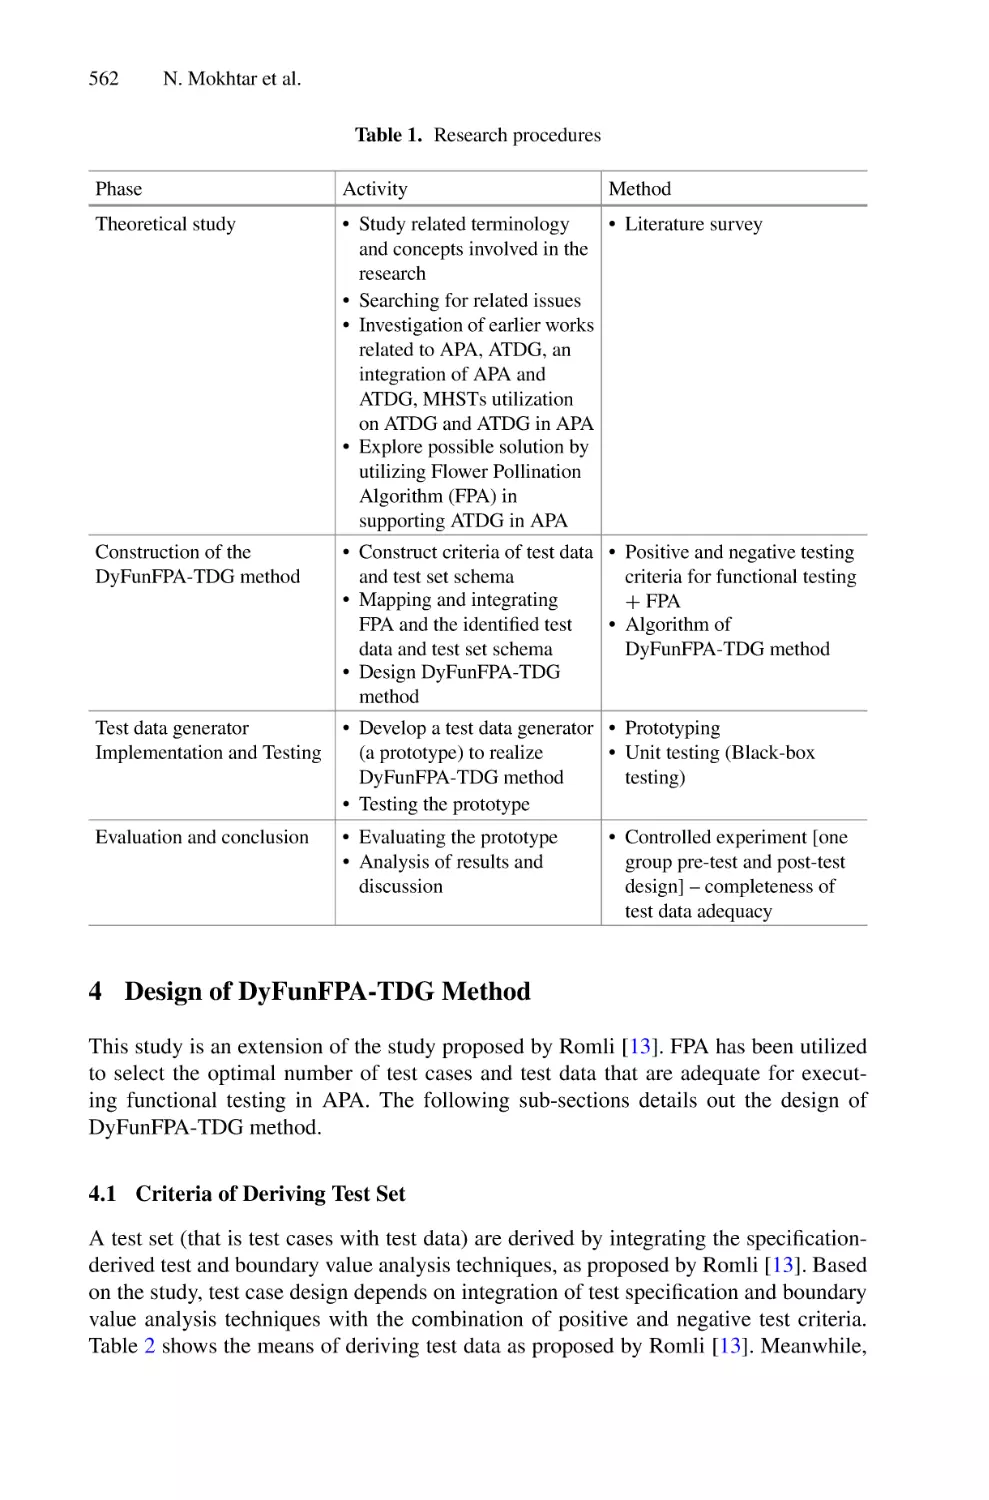
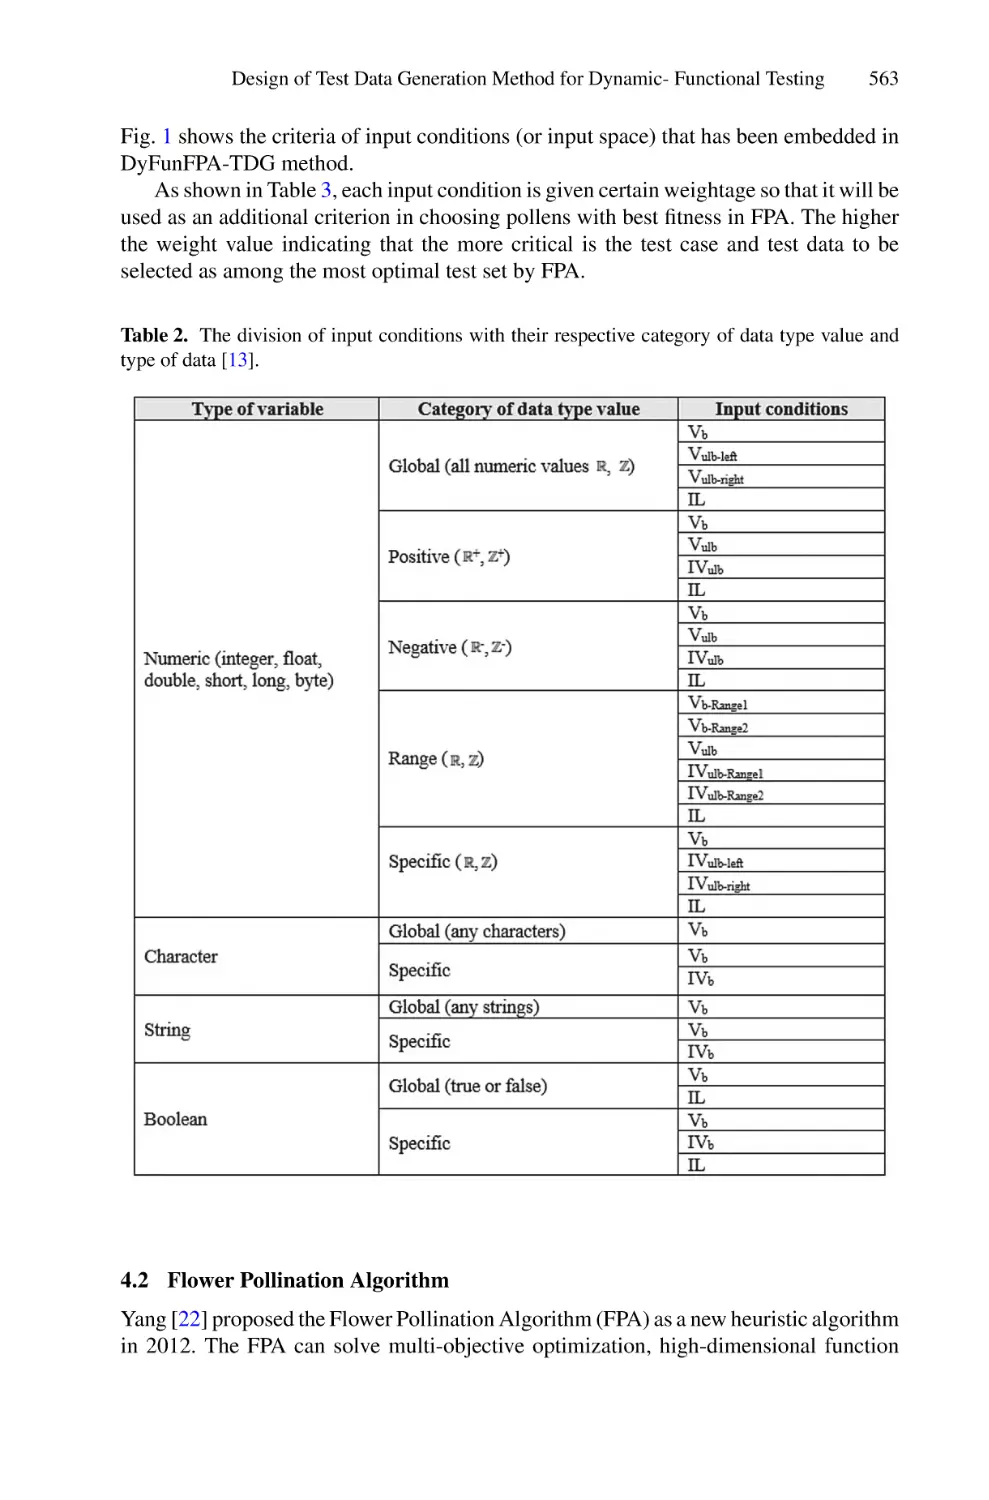
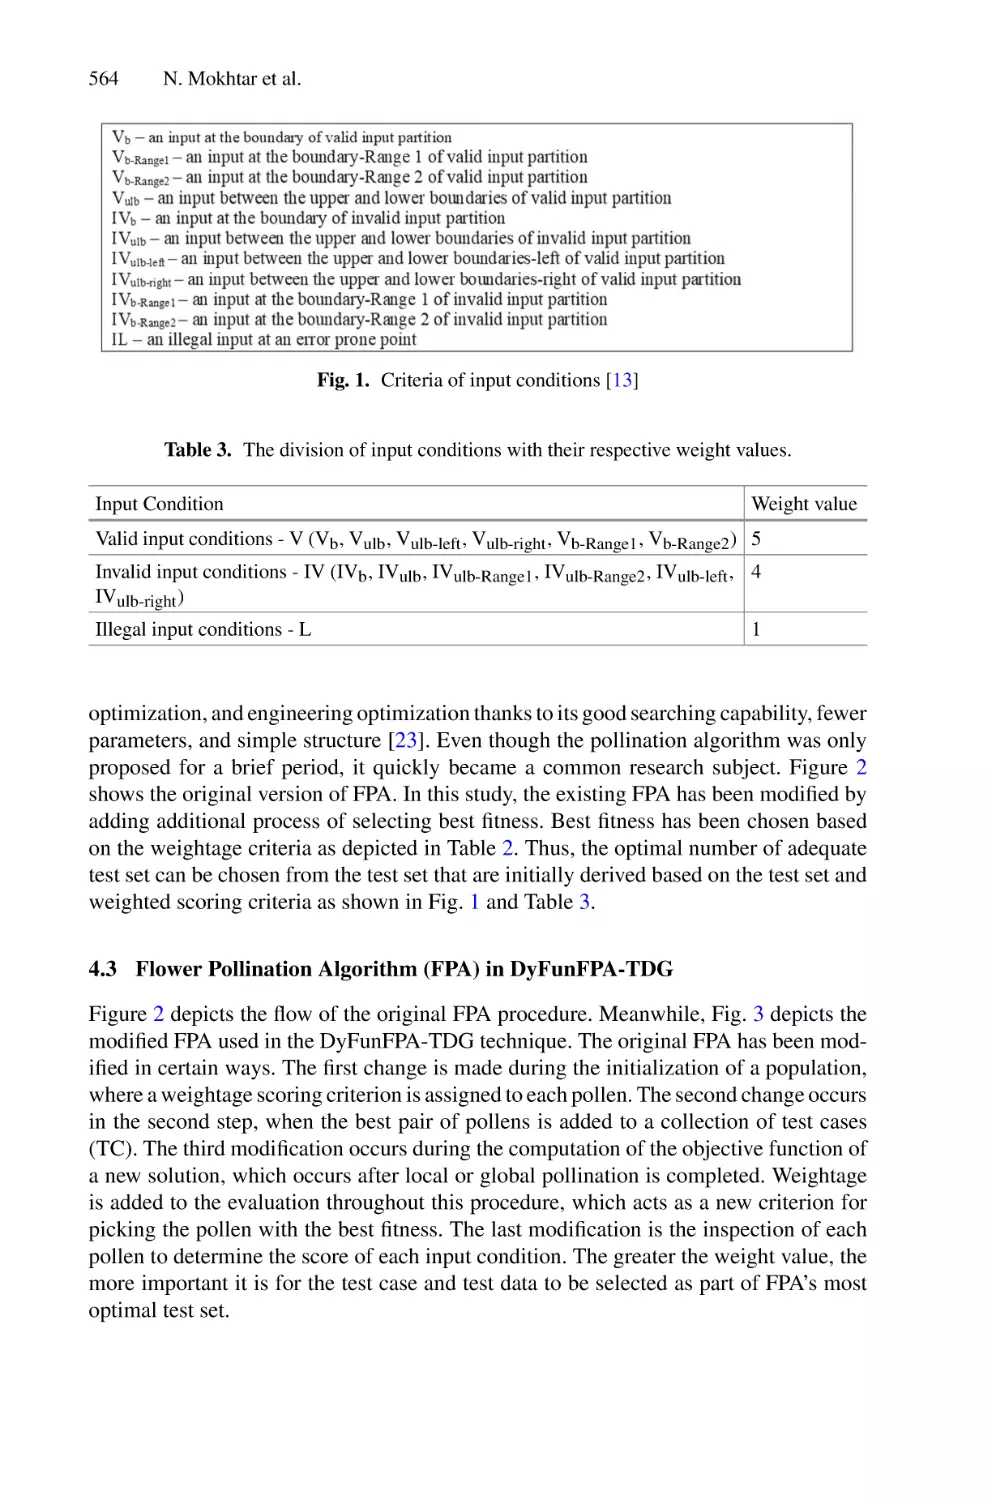
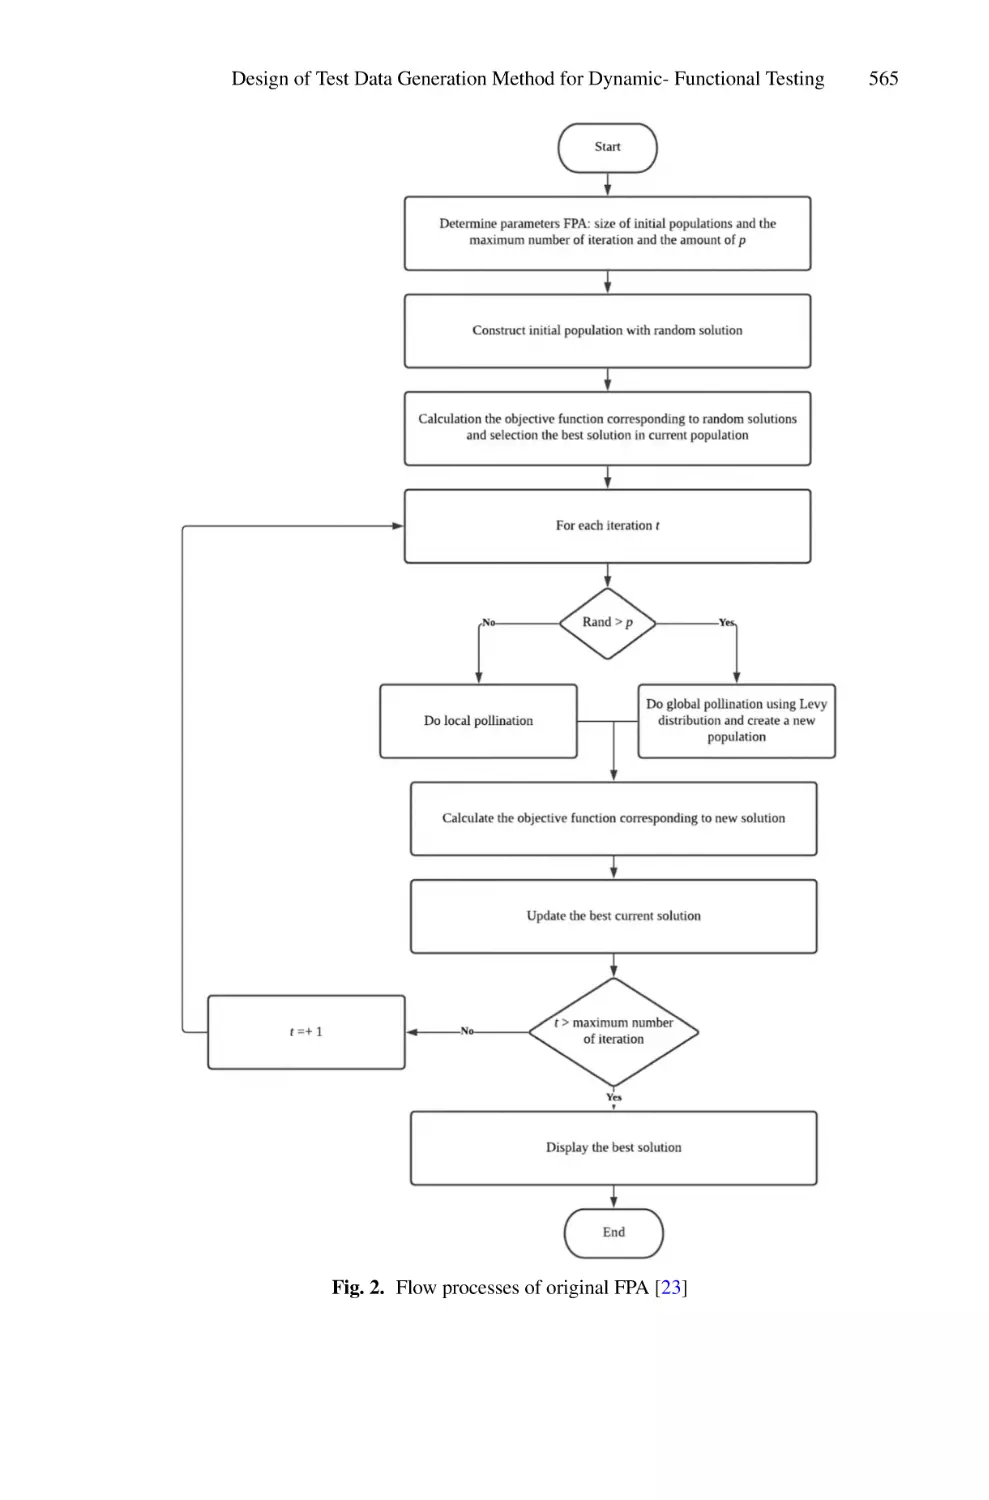
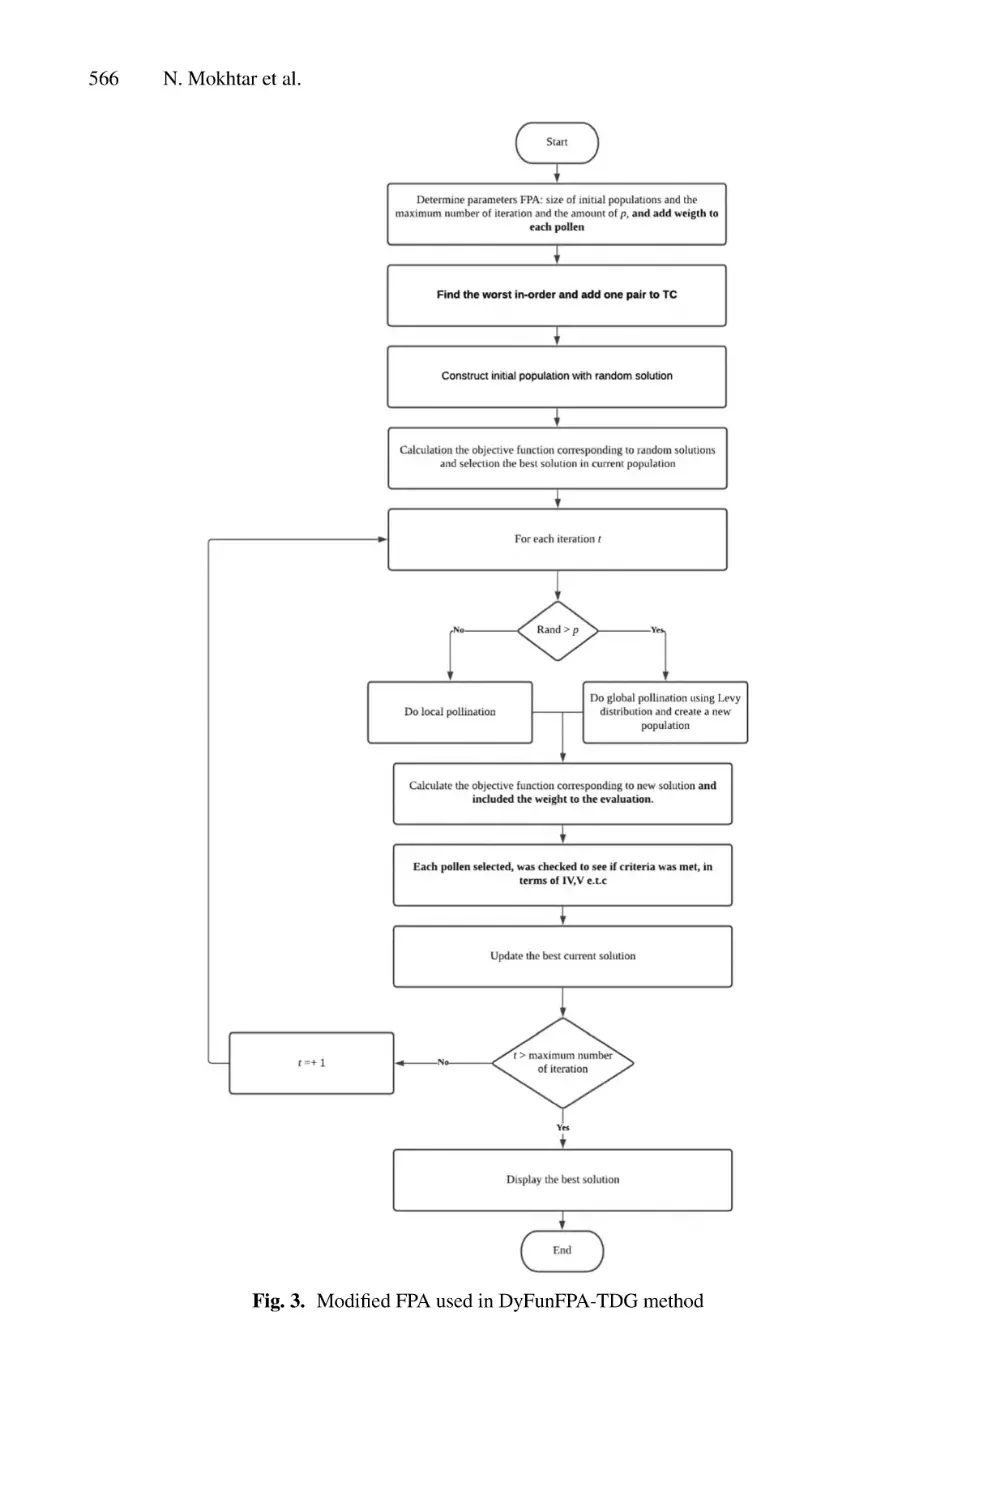
Design of Test Data Generation Method for Dynamic- Functional
Testing in Automatic Programming Assessment Using Flower
Pollination Algorithm . . . . . . . . . . . . . . . . . . . . . . . . . . . . . . . . . . . . . . . 559
Nurhidayah Mokhtar, Rohaida Romli, Rusnida Romli,
Alawiyah Abd Wahab, and Nooraini Yusoff
xvi
Contents
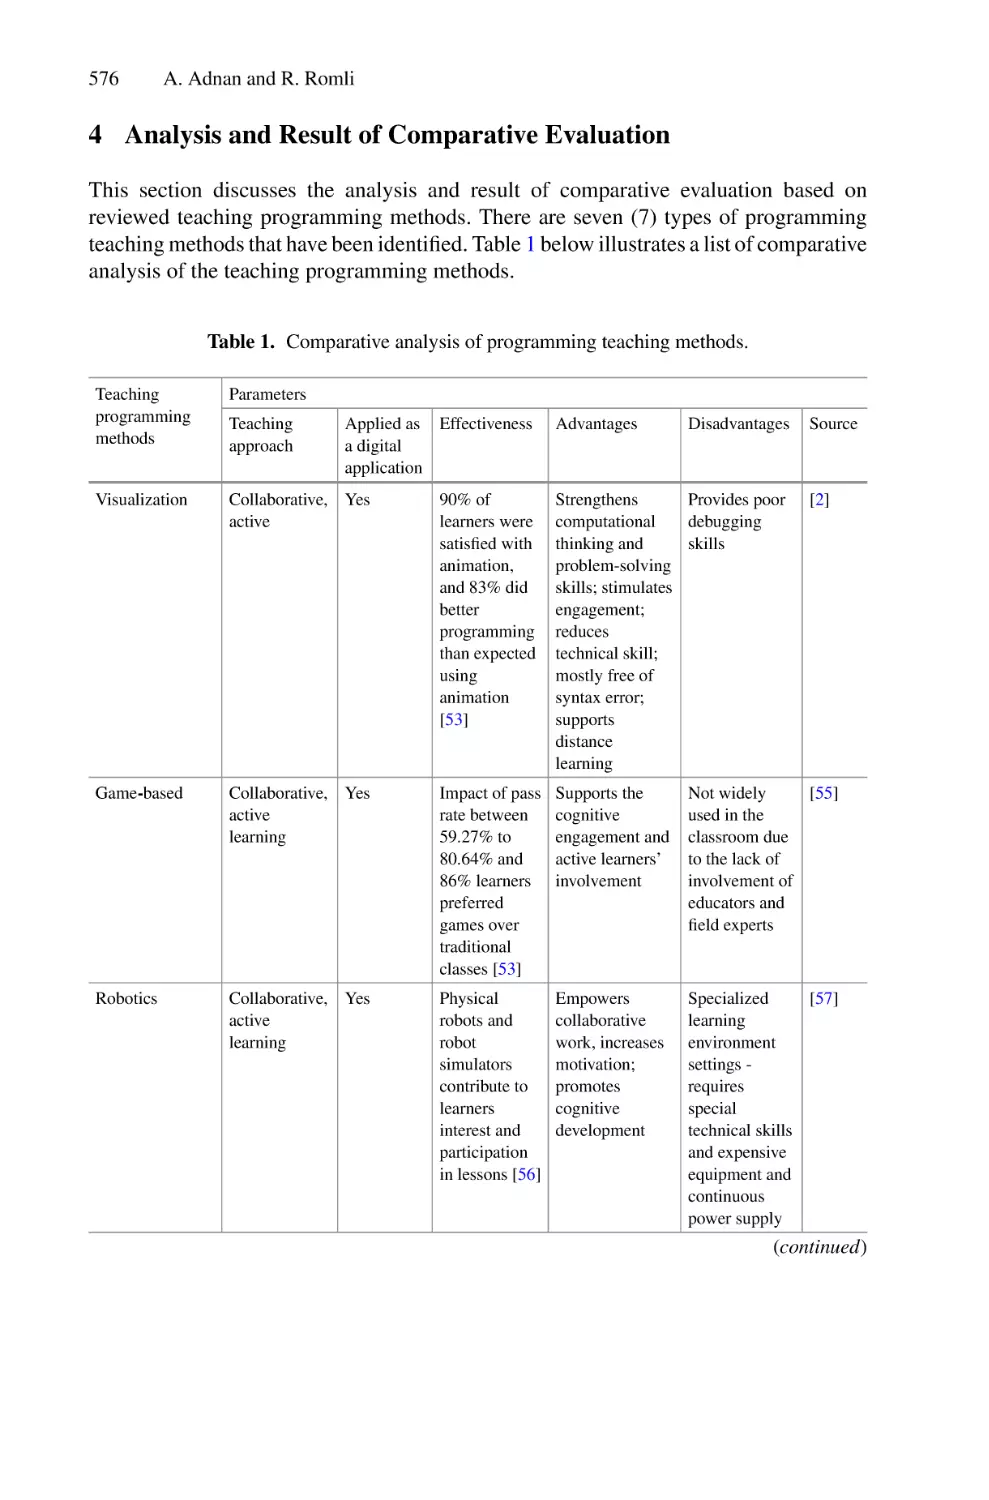
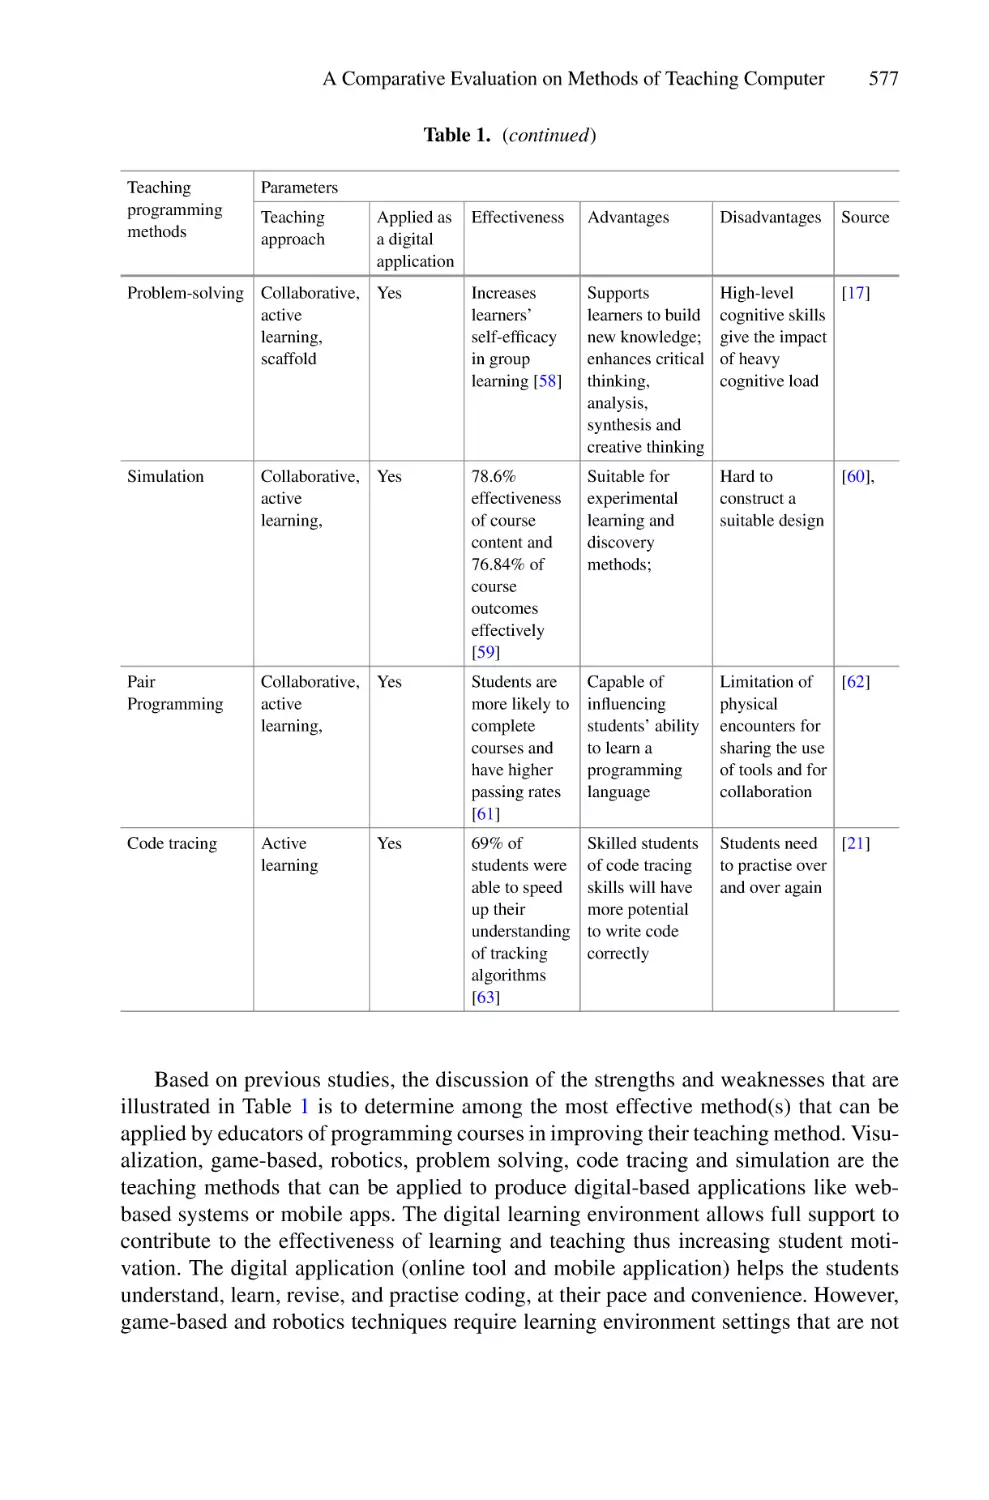
A Comparative Evaluation on Methods of Teaching Computer
Programming . . . . . . . . . . . . . . . . . . . . . . . . . . . . . . . . . . . . . . . . . . . . . 571
Asmalinda Adnan and Rohaida Romli
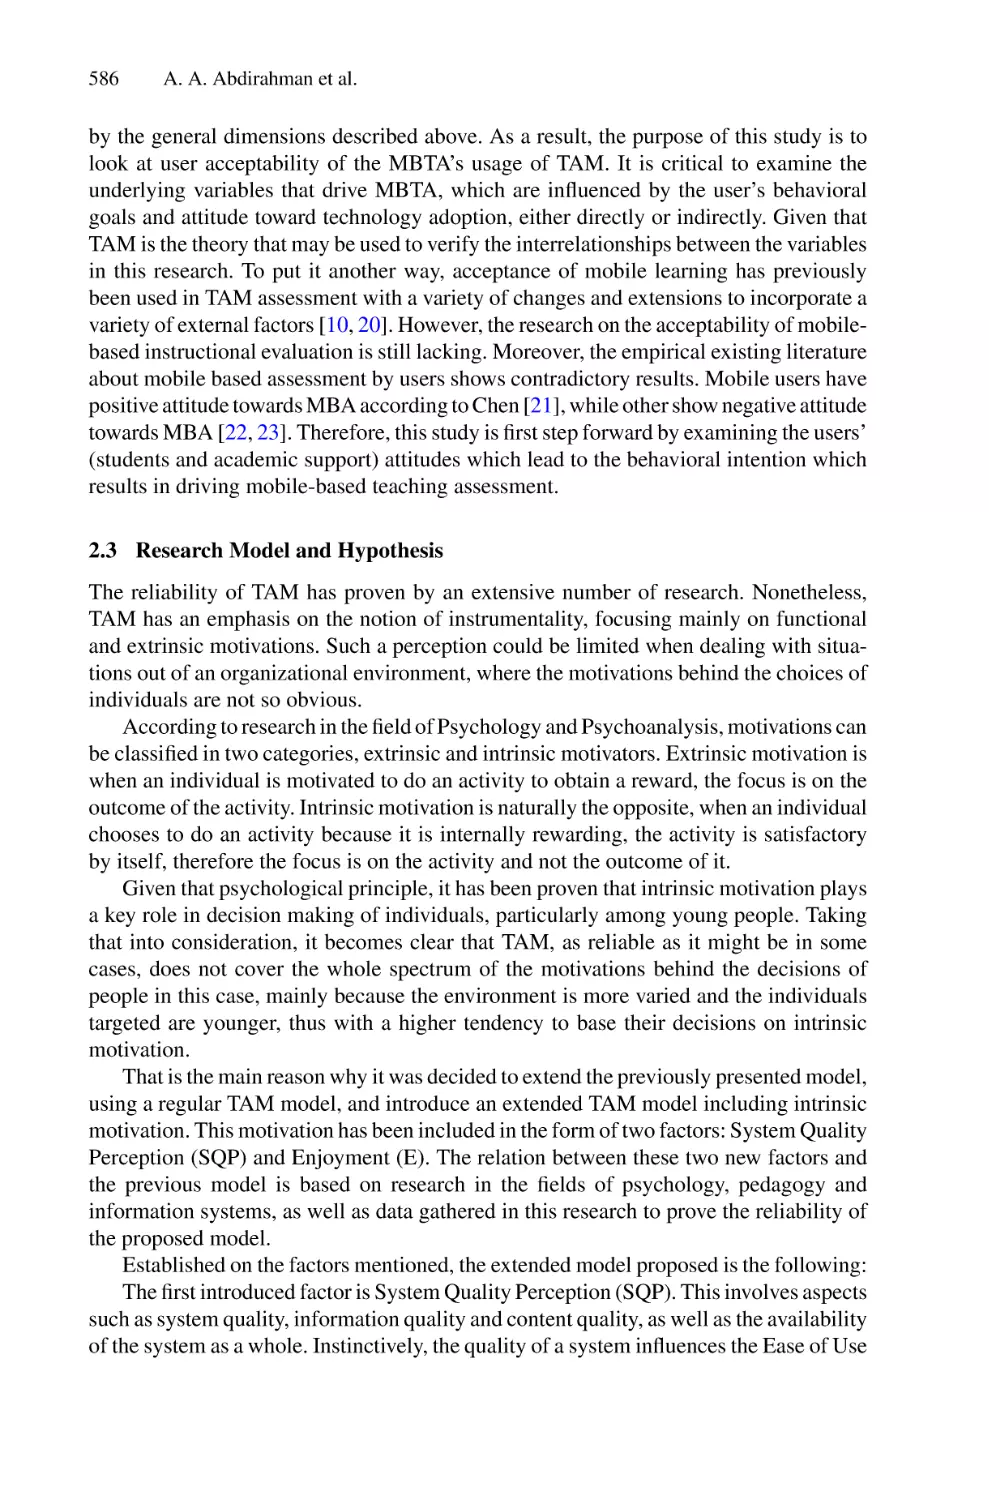
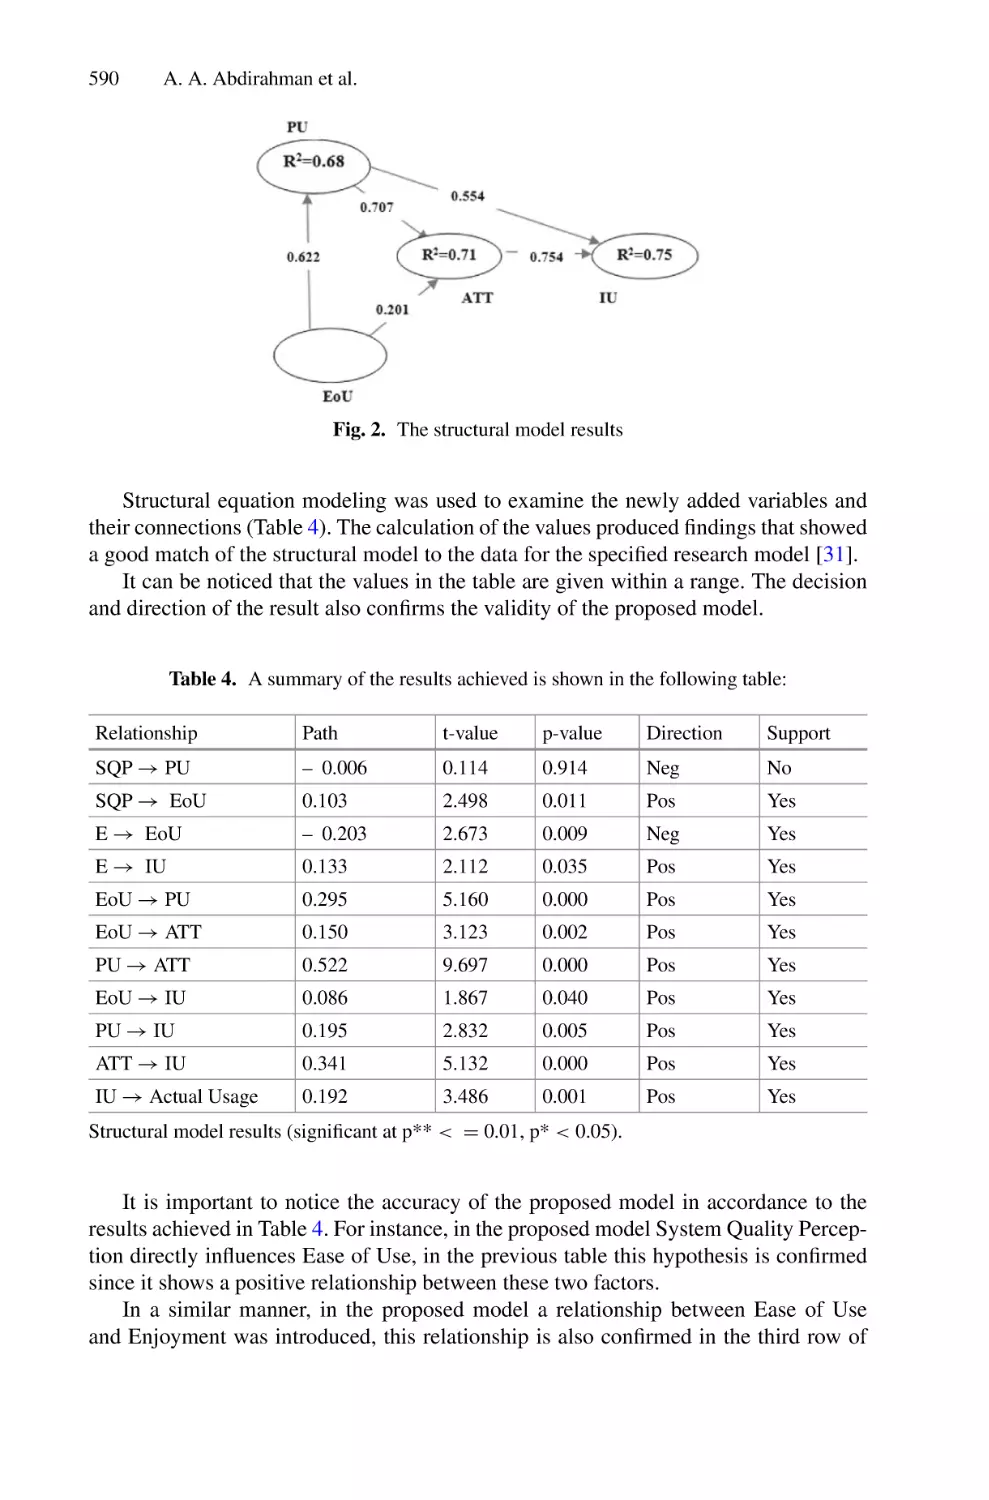
Attitude Towards Intention to Use Mobile-Based Teaching Assessment
Based on TAM and a Novel Extended TAM Model . . . . . . . . . . . . . . . . 583
Abdullahi Ahmed Abdirahman, Marzanah A. Jabar,
Abdirahman Osman Hashi, Mohamed Abdirahman Elmi,
and Octavio Ernesto Romo Rodriguez
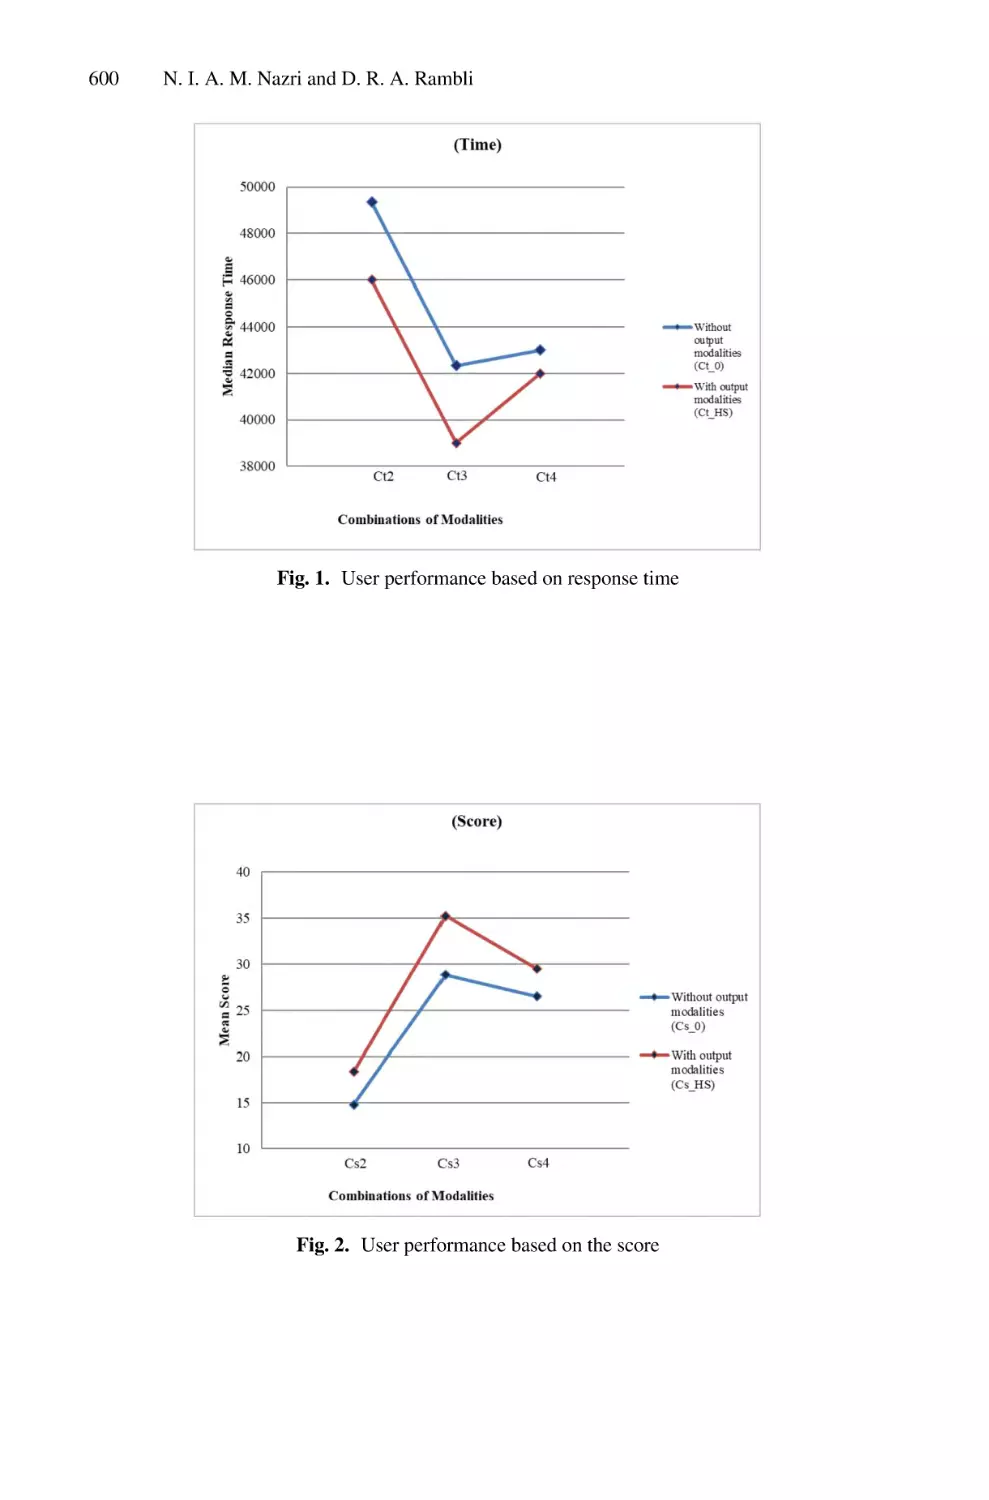
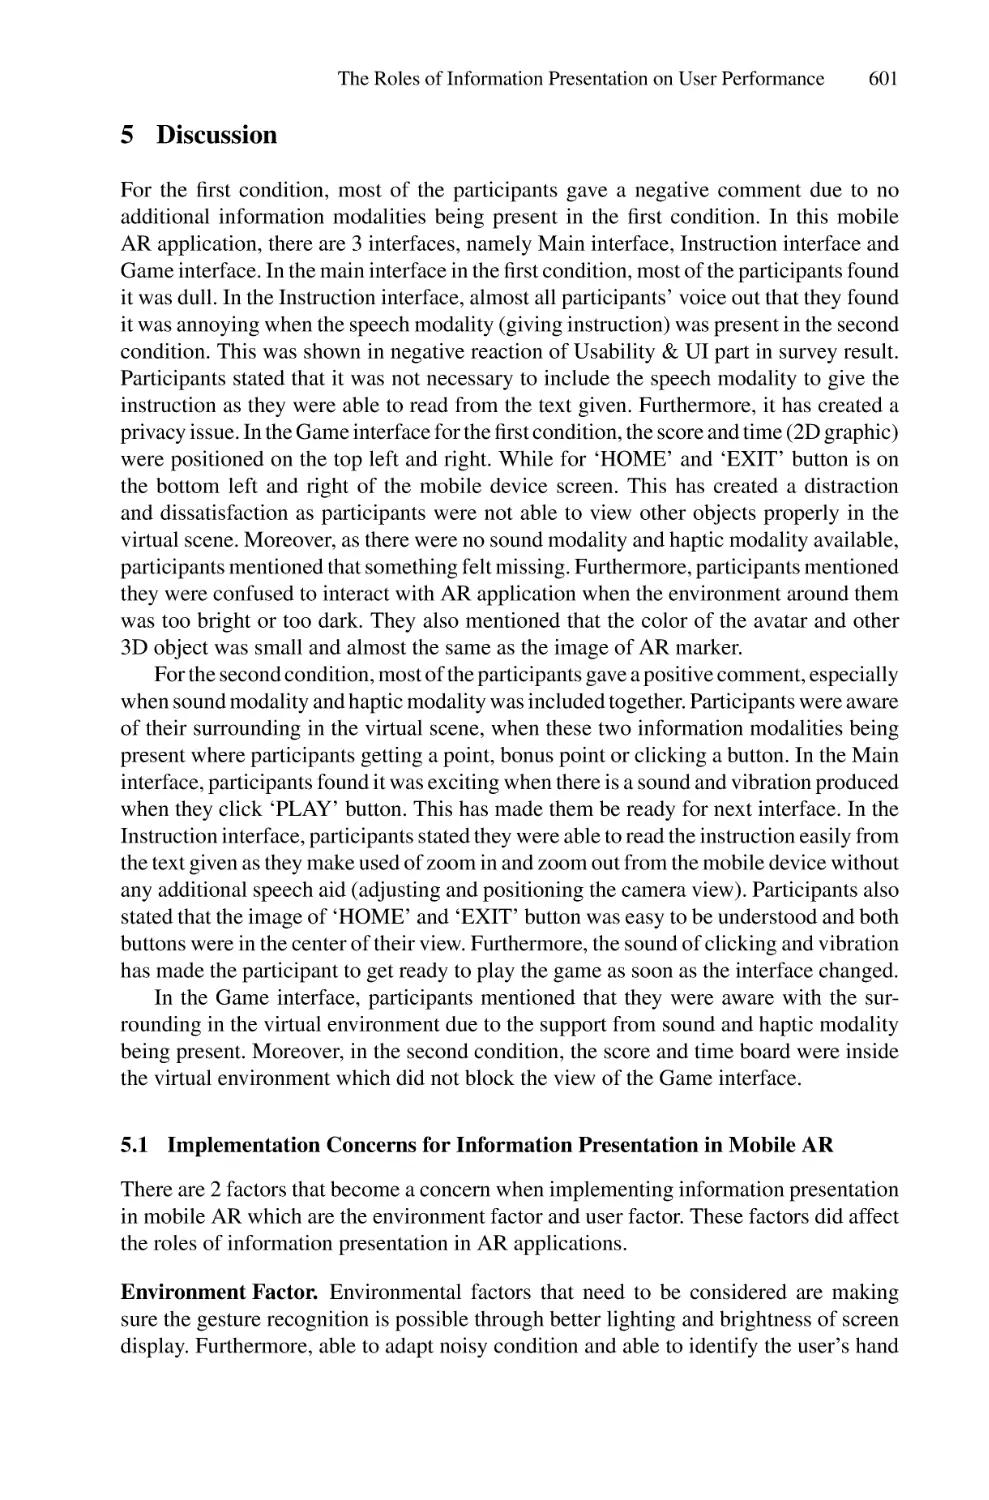
The Roles of Information Presentation on User Performance in Mobile
Augmented Reality Application . . . . . . . . . . . . . . . . . . . . . . . . . . . . . . . 594
Nur Intan Adhani Muhamad Nazri and Dayang Rohaya Awang Rambli
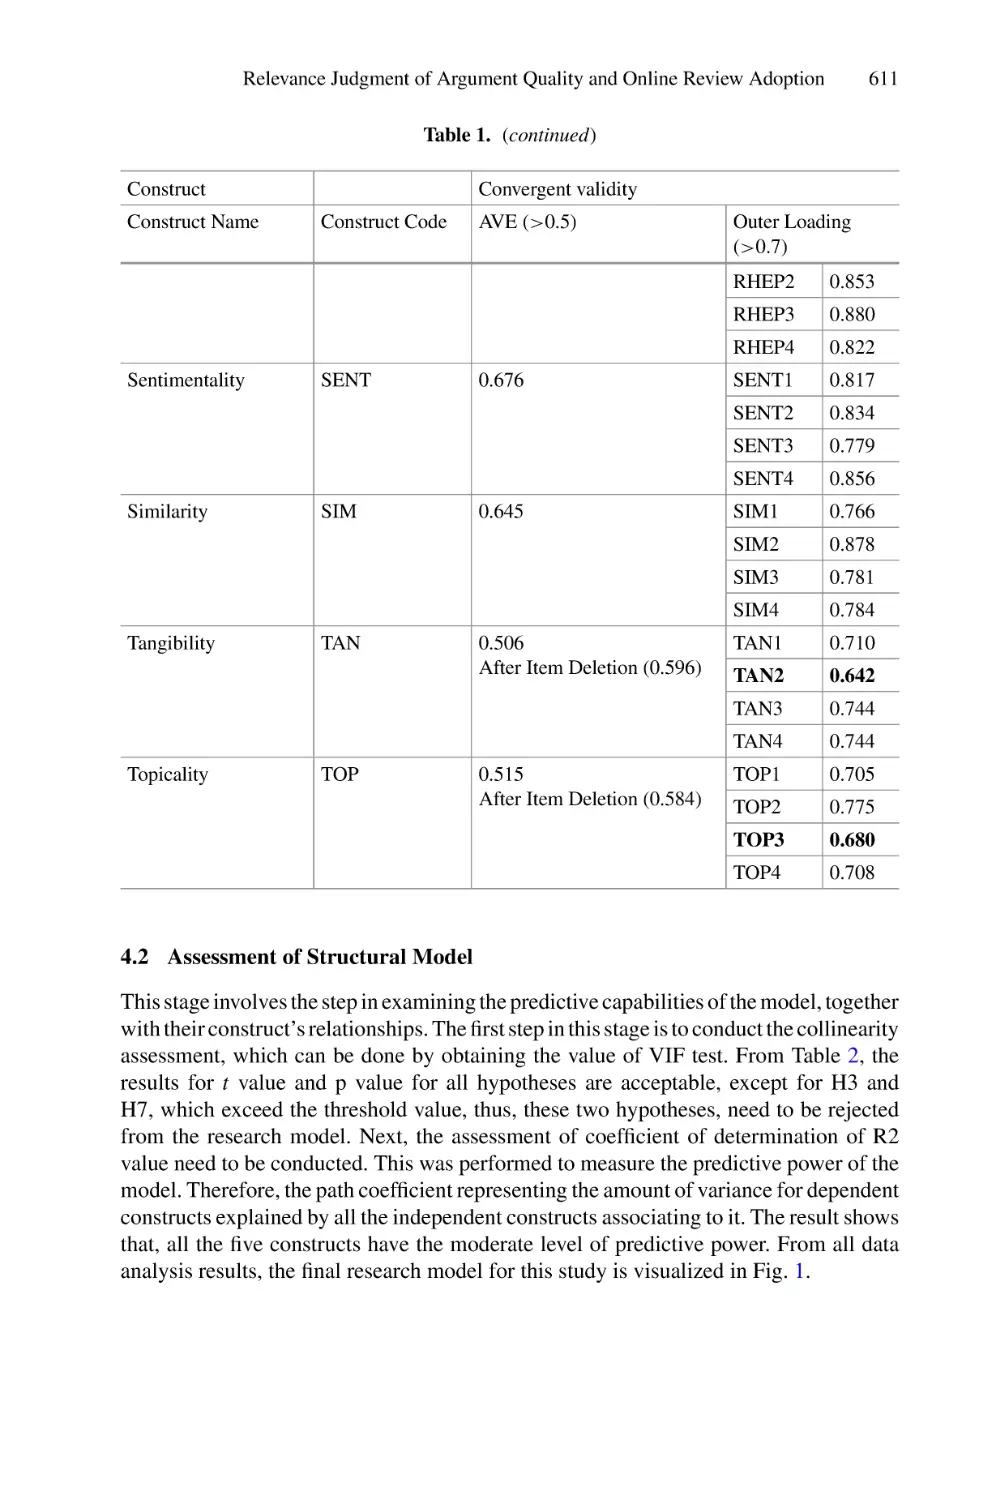
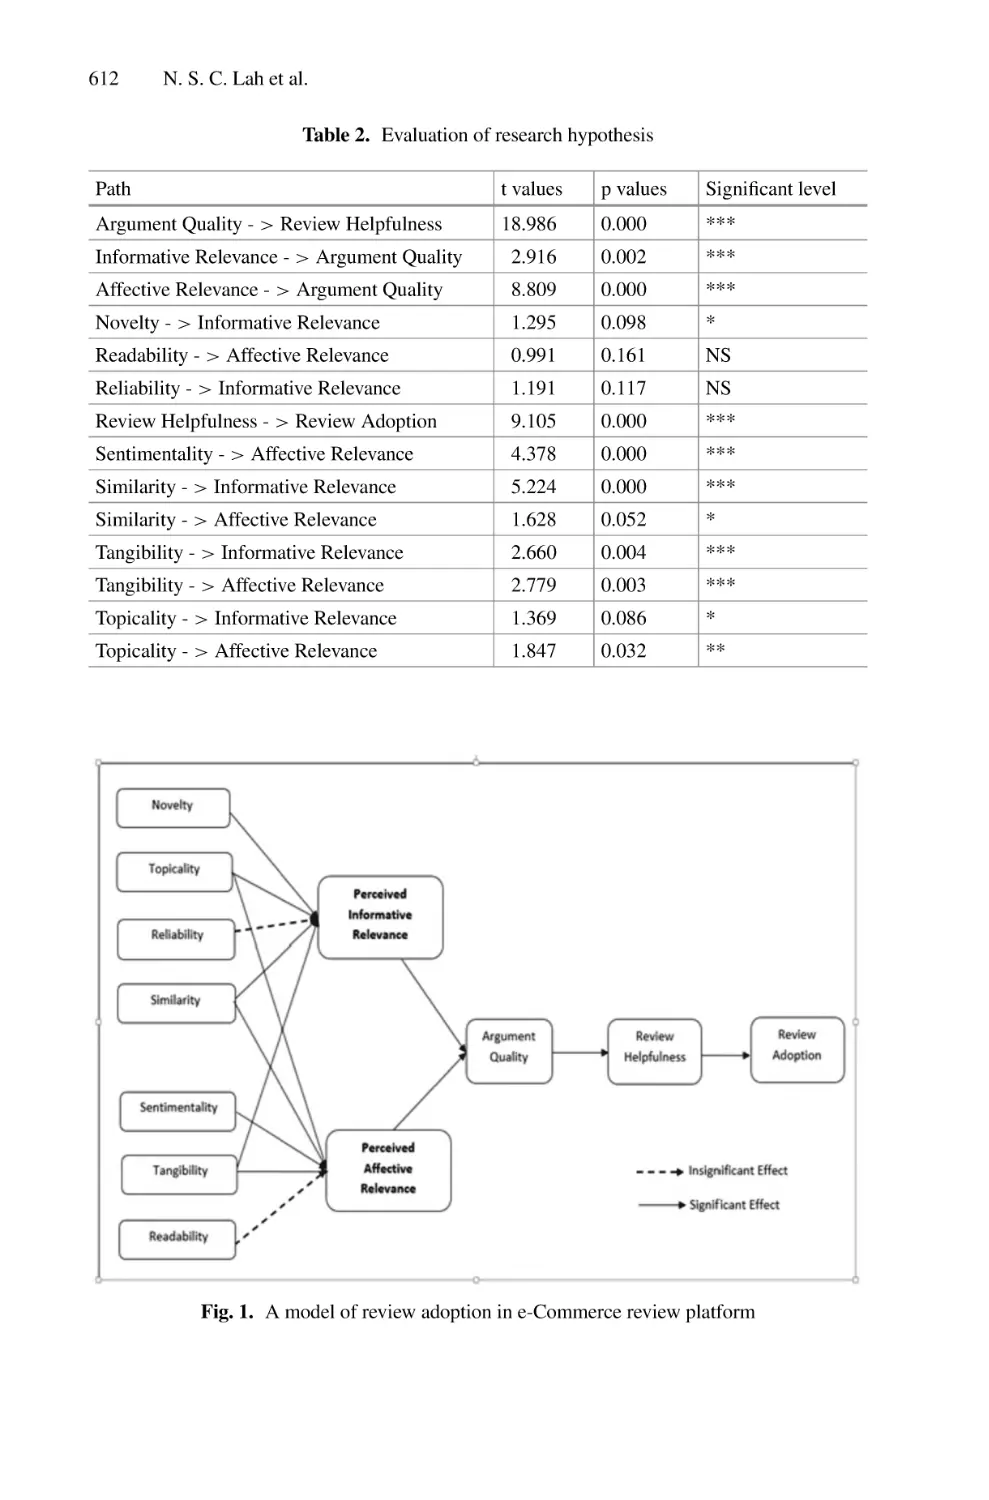
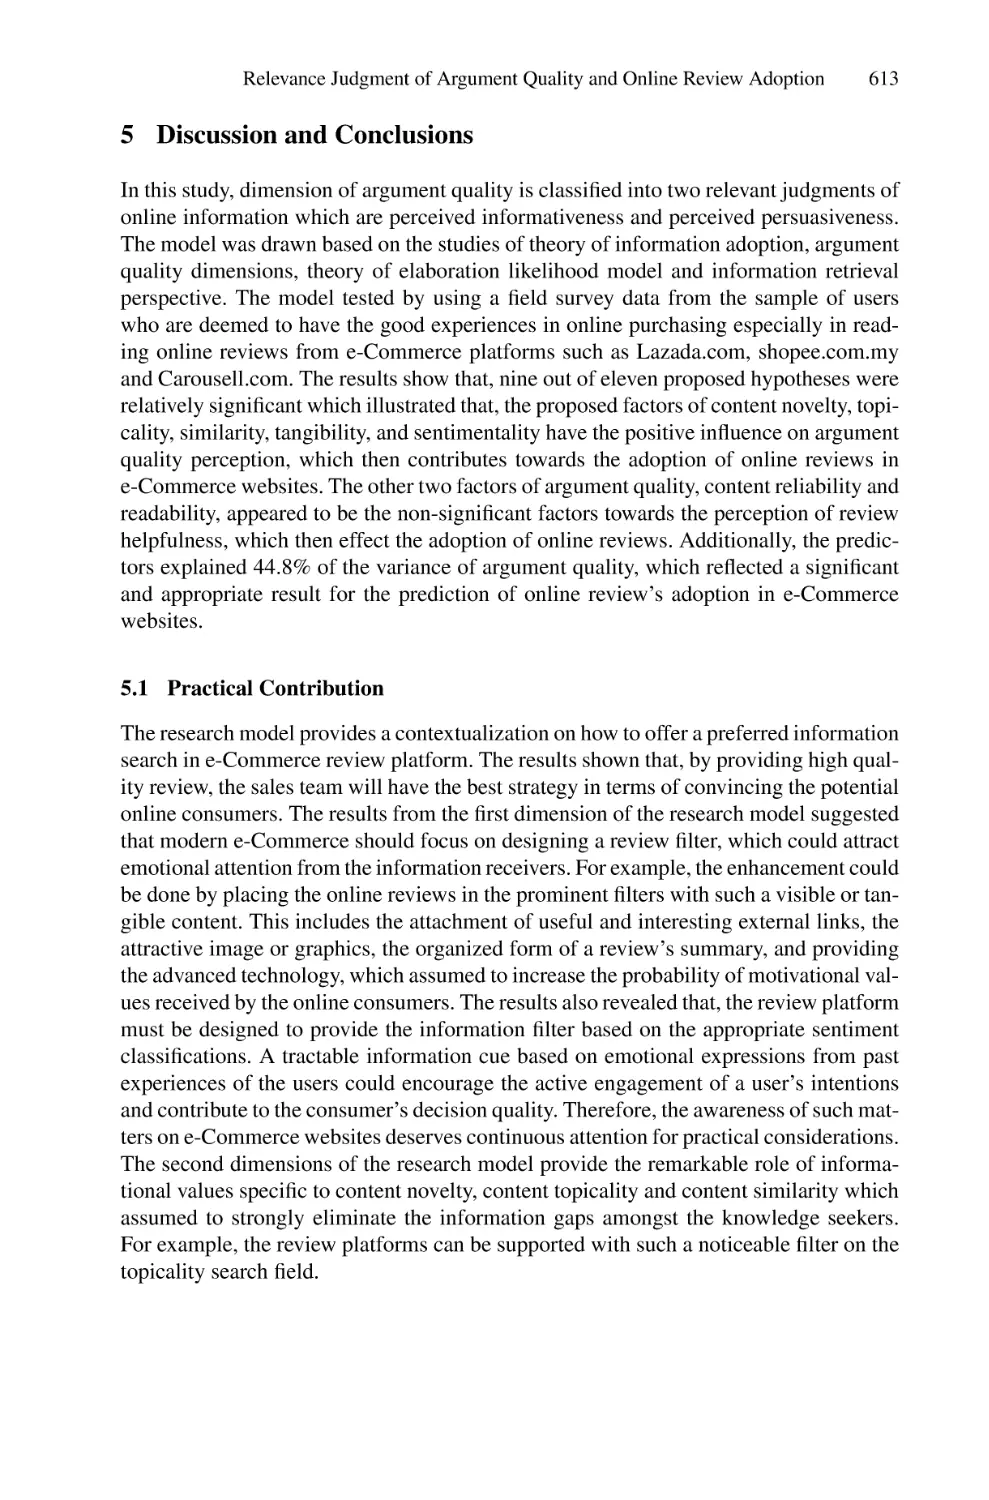
Relevance Judgment of Argument Quality and Online Review
Adoption During Information Search in e-Commerce Review
Platform . . . . . . . . . . . . . . . . . . . . . . . . . . . . . . . . . . . . . . . . . . . . . . . . . 604
Nur Syadhila Che Lah, Ab Razak Che Hussin, Norazira A. Jalil,
and Nor Fatiha Subri
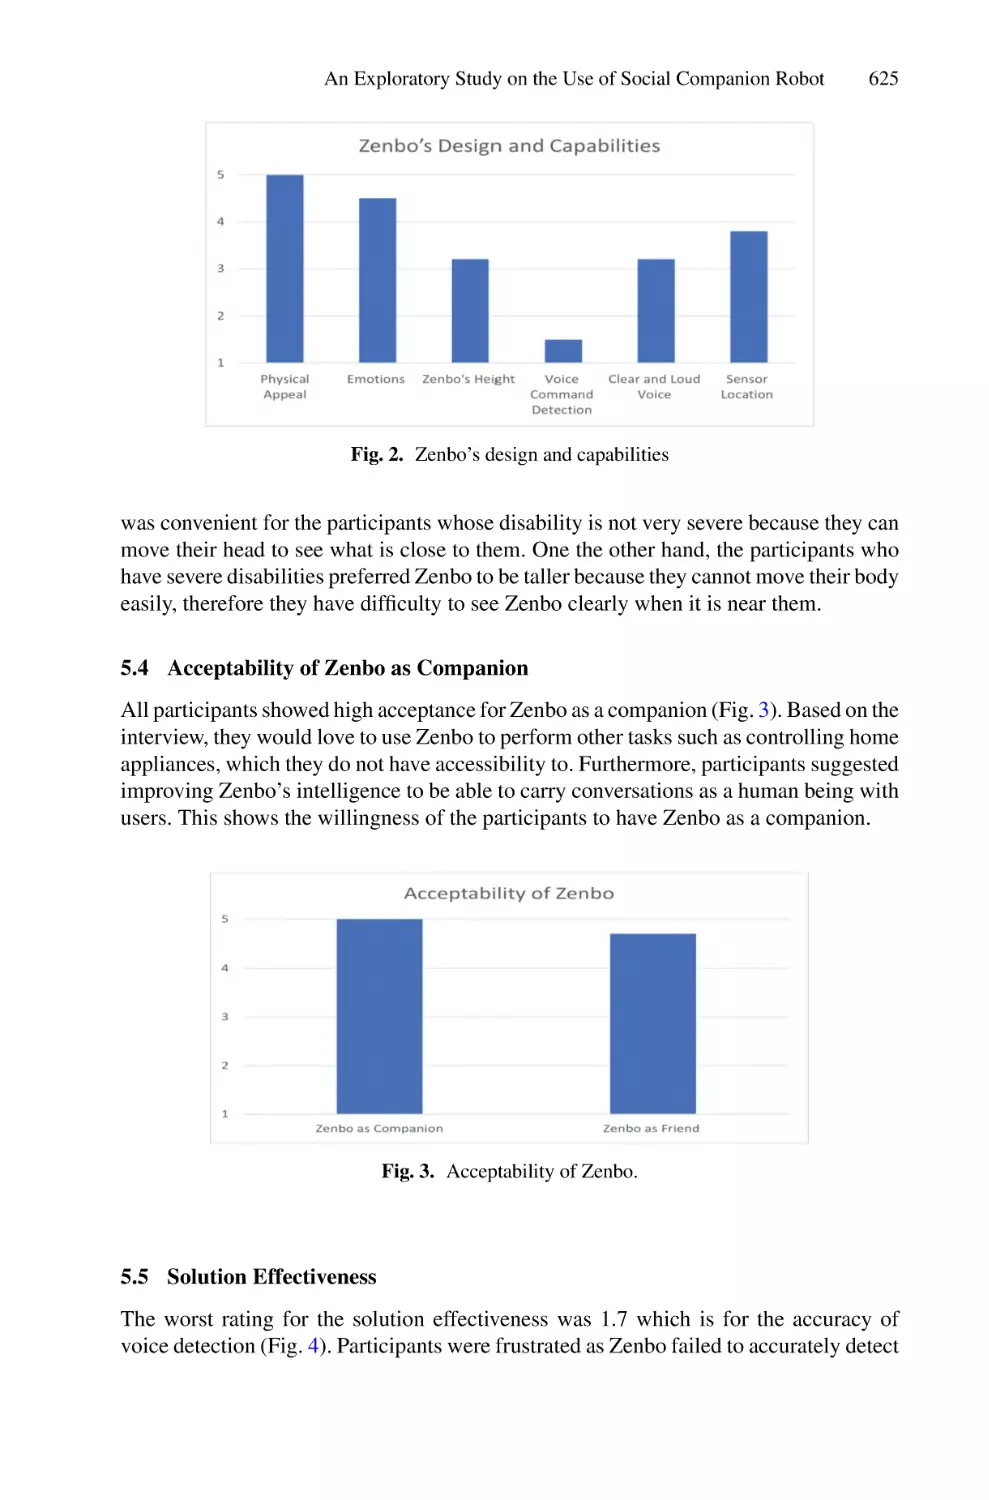
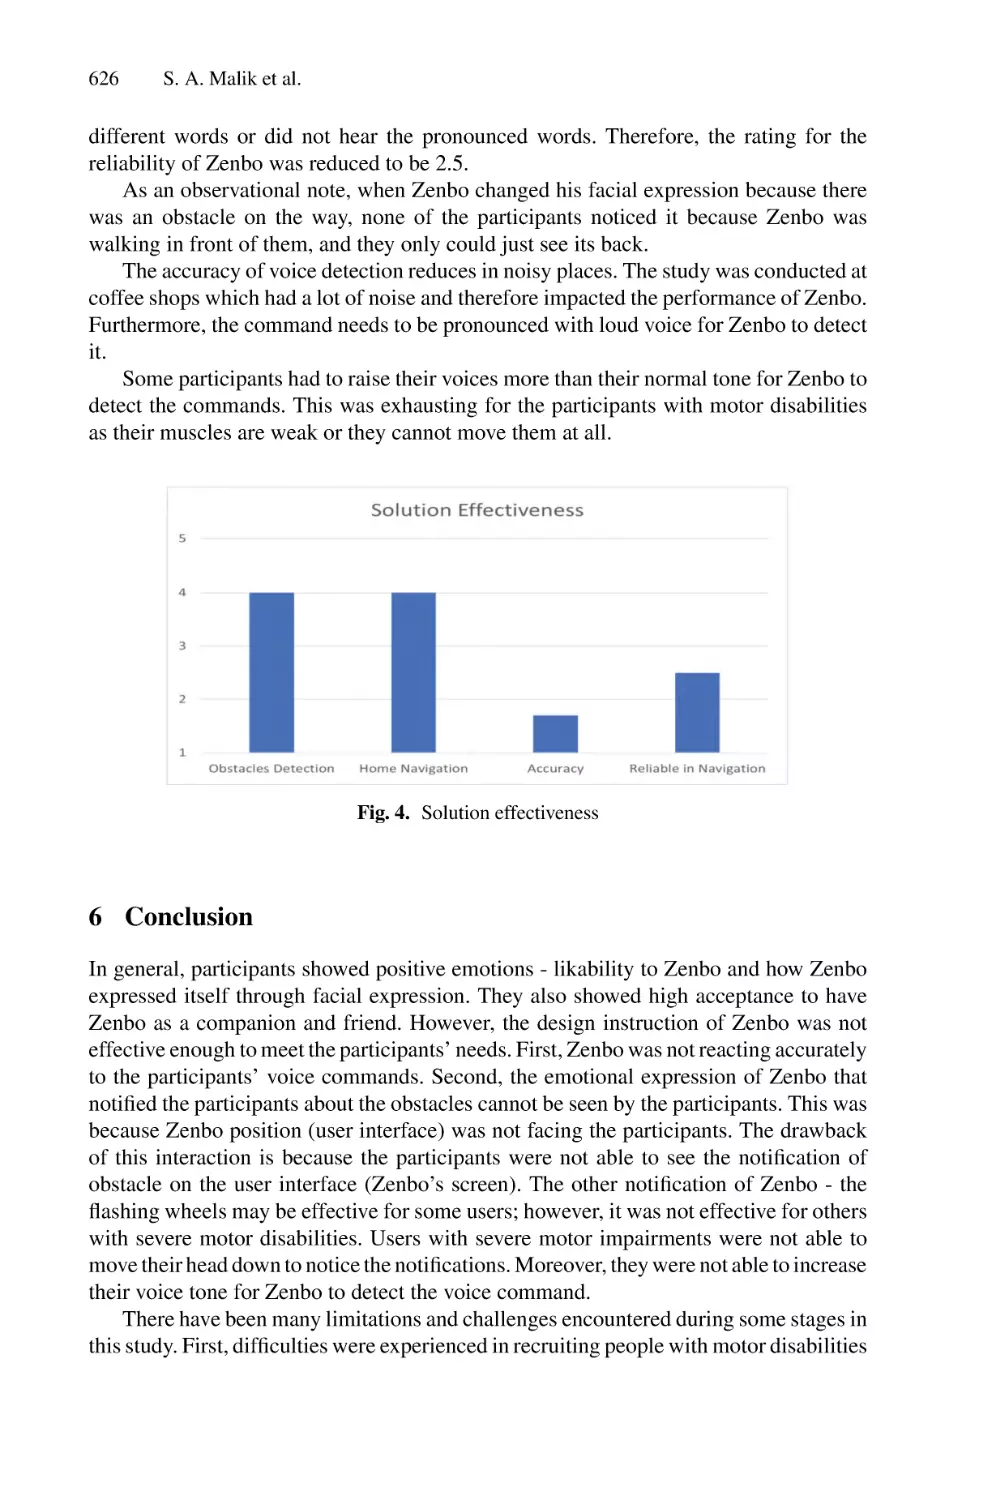
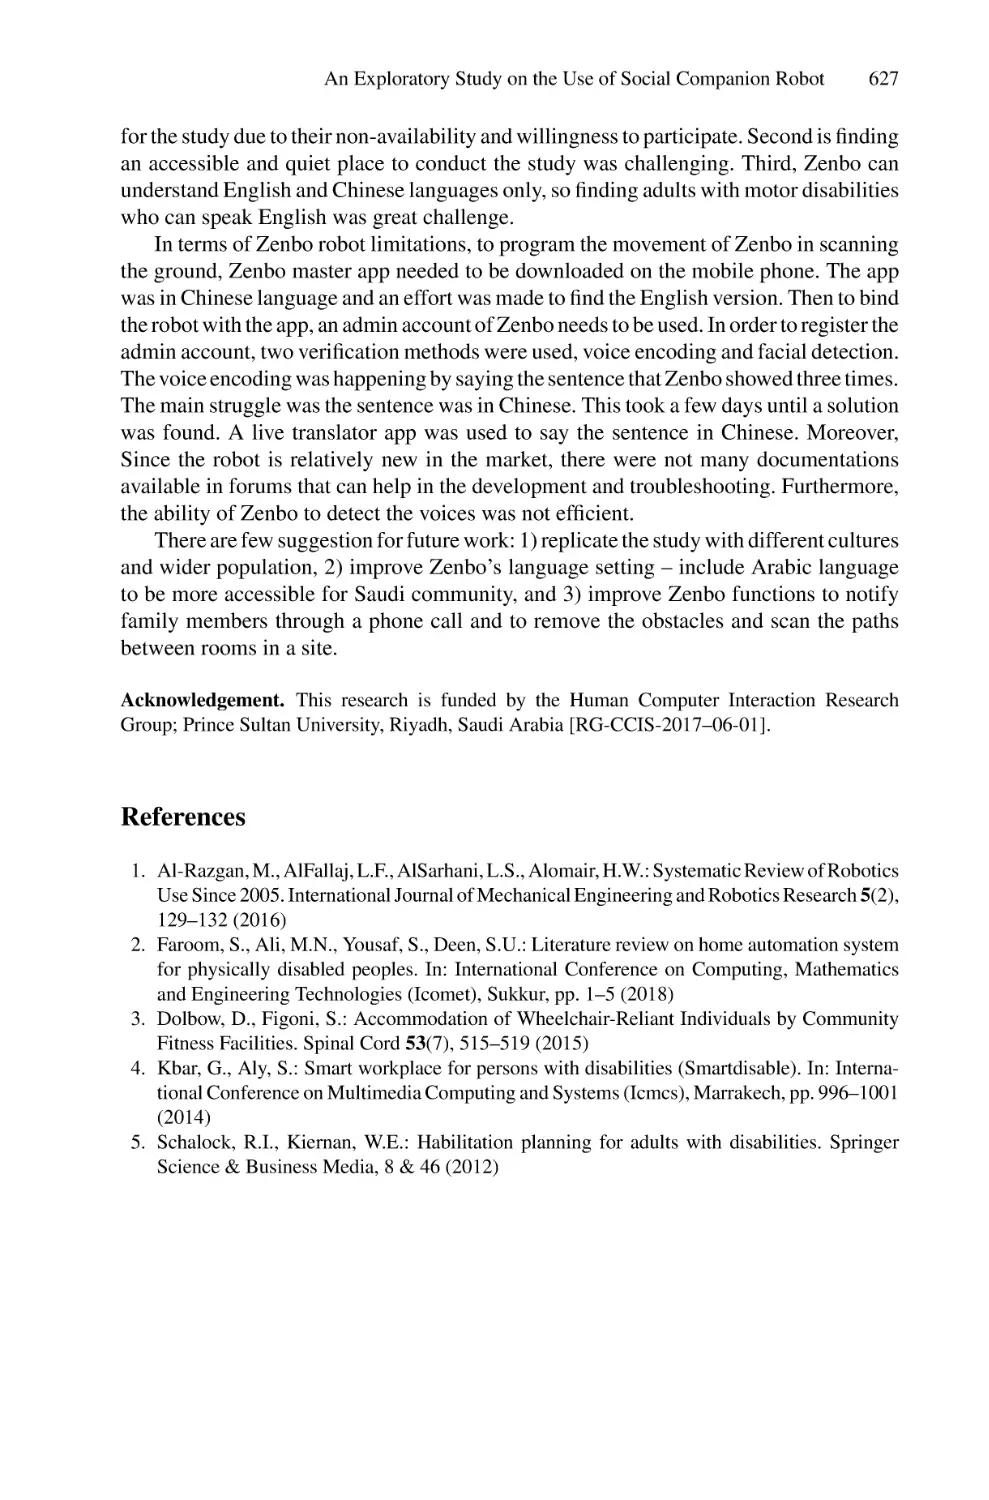
An Exploratory Study on the Use of Social Companion Robot for
Adults with Motor Disabilities . . . . . . . . . . . . . . . . . . . . . . . . . . . . . . . . 616
Sofianiza Abd Malik, Linah Aburahmah, and Muna Azuddin
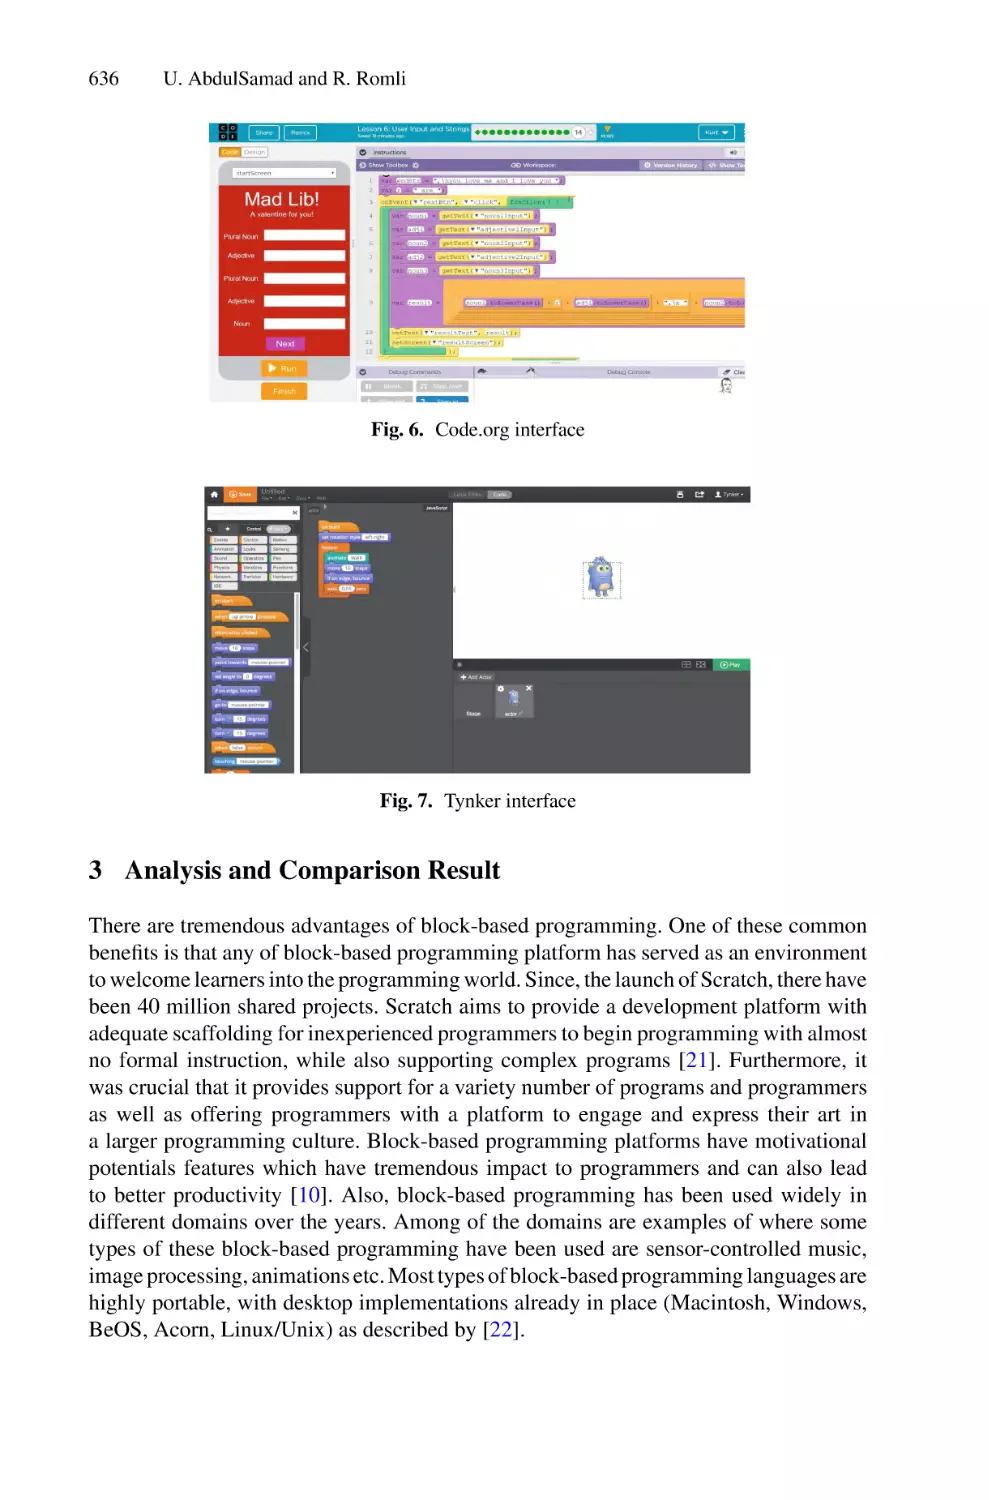
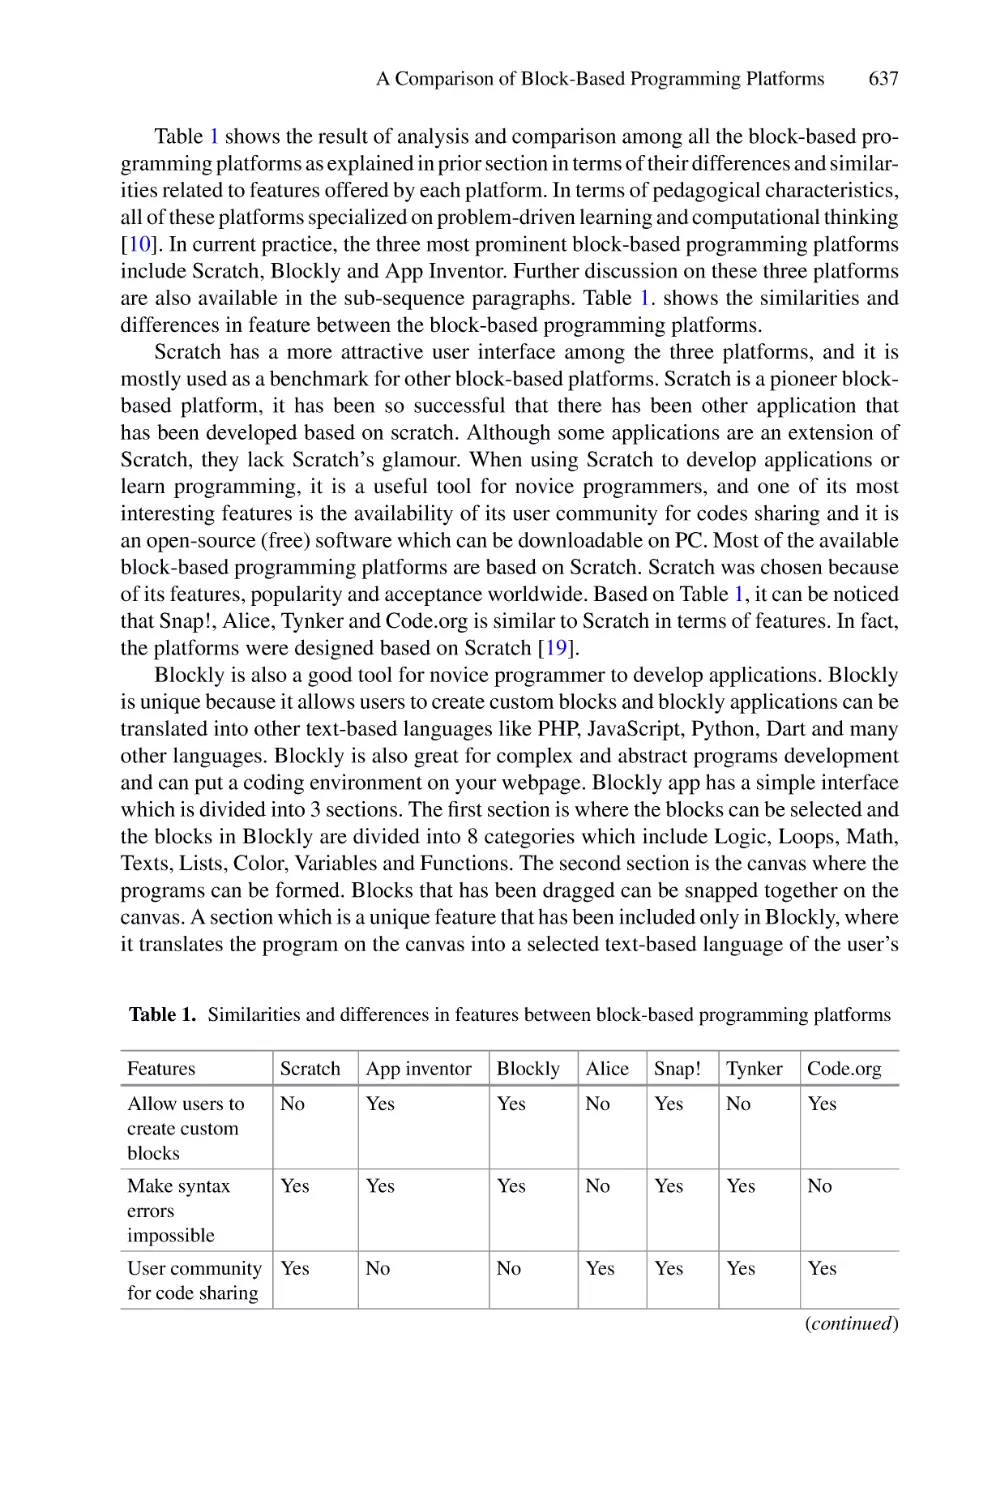
A Comparison of Block-Based Programming Platforms for Learning
Programming and Creating Simple Application . . . . . . . . . . . . . . . . . . . 630
Umar AbdulSamad and Rohaida Romli
Information Security Policy Compliance: An Exploration of User
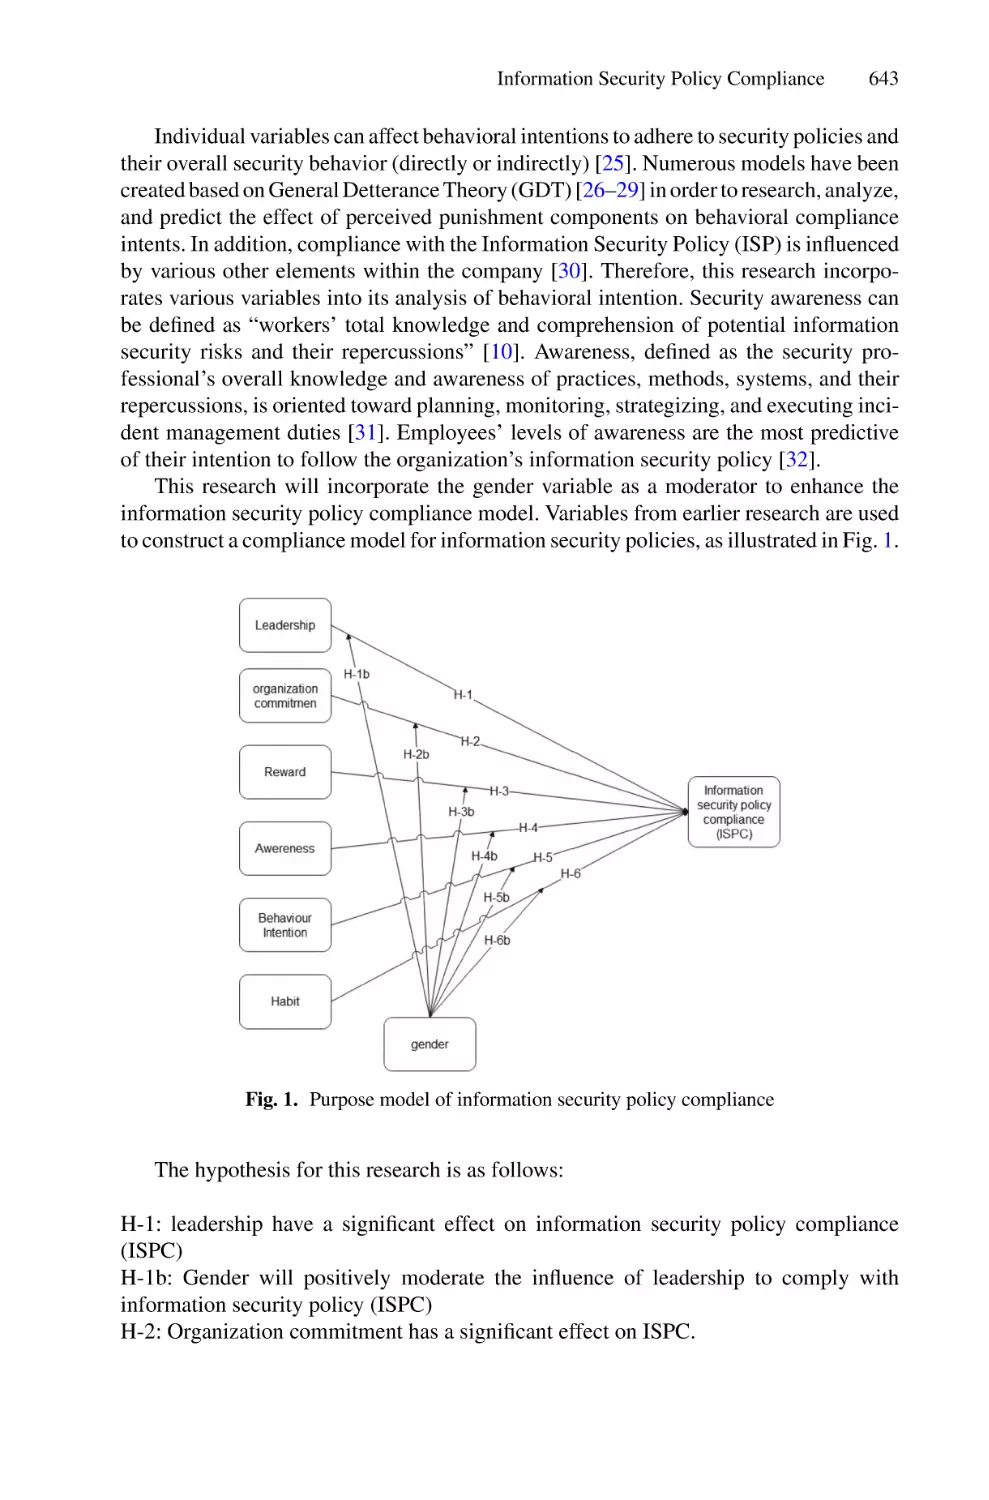
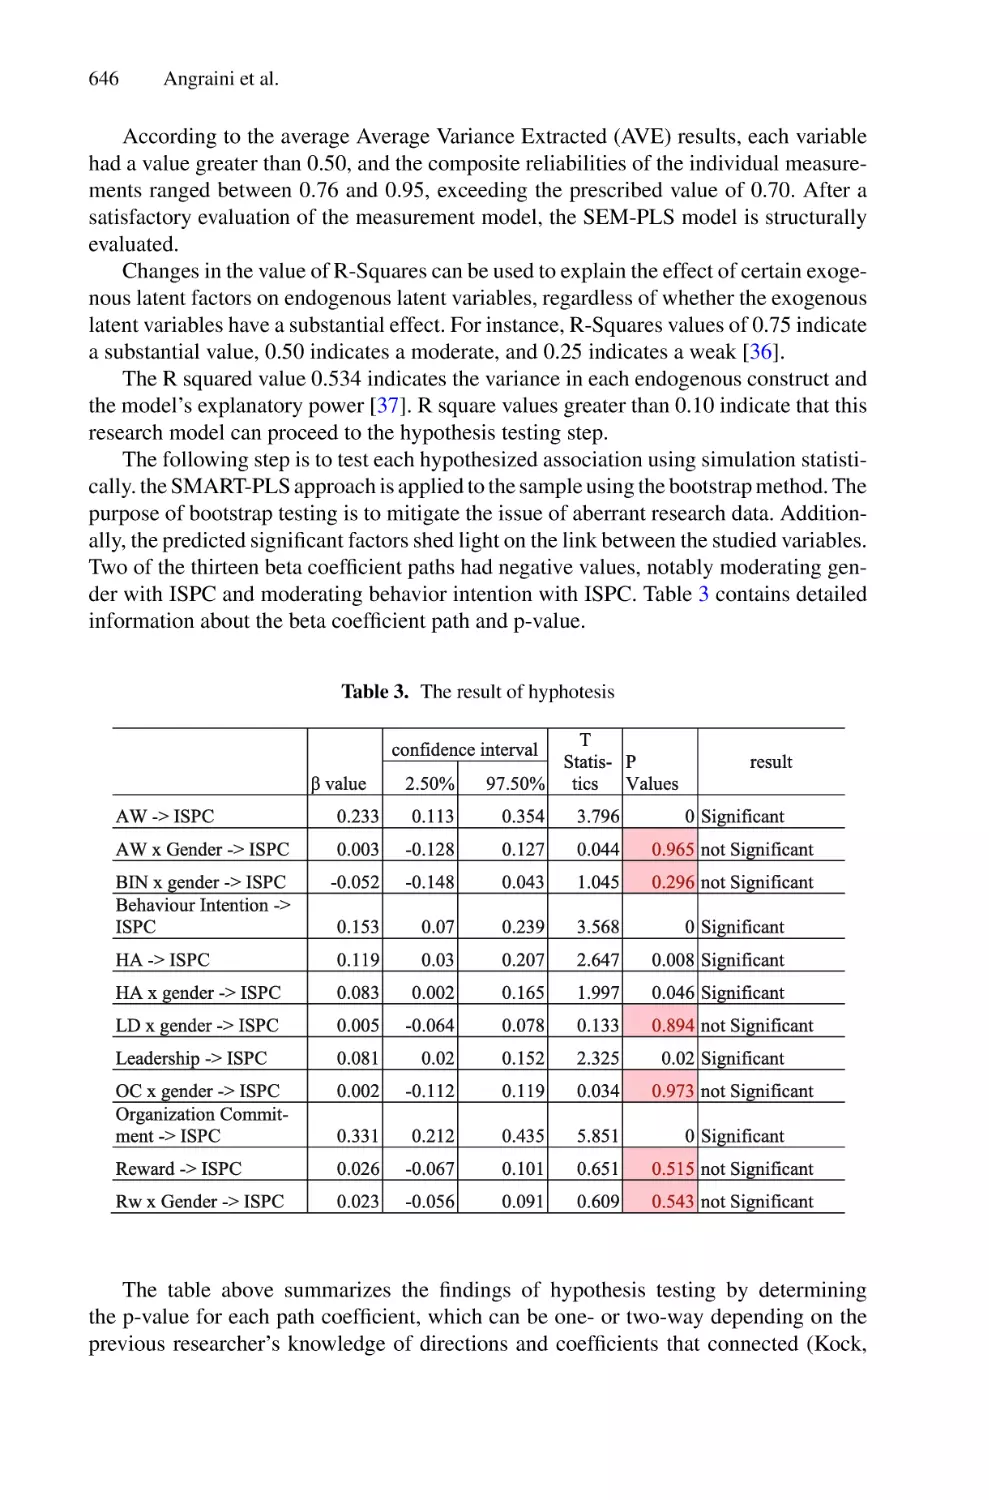
Behaviour and Organizational Factors . . . . . . . . . . . . . . . . . . . . . . . . . . 641
Angraini, Rose Alinda Alias, and Okfalisa
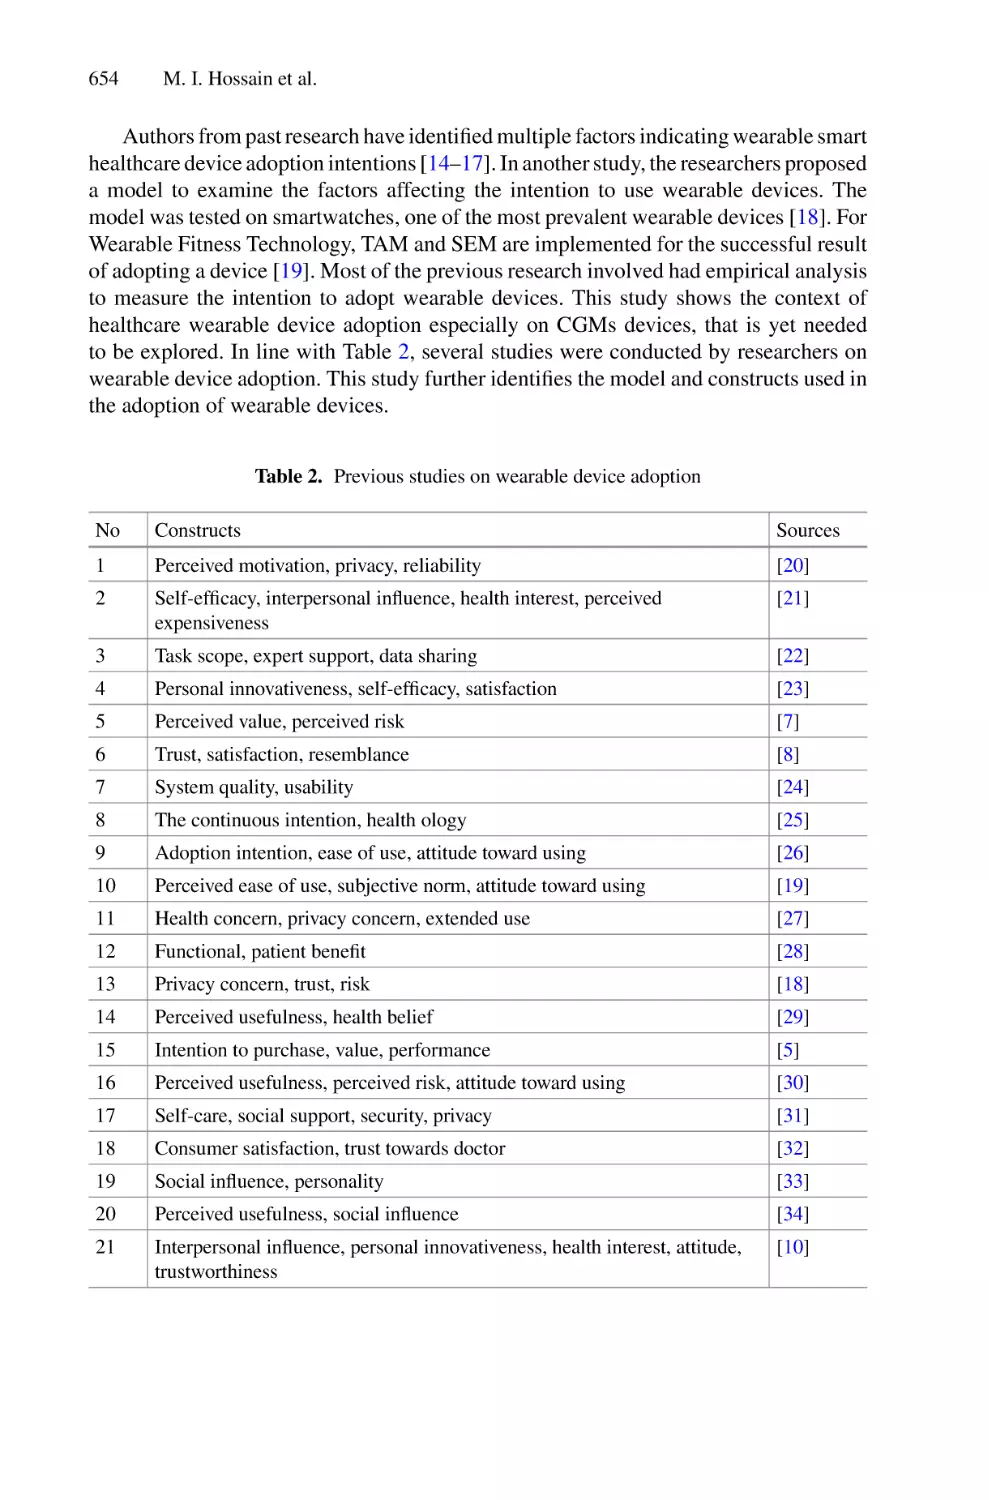
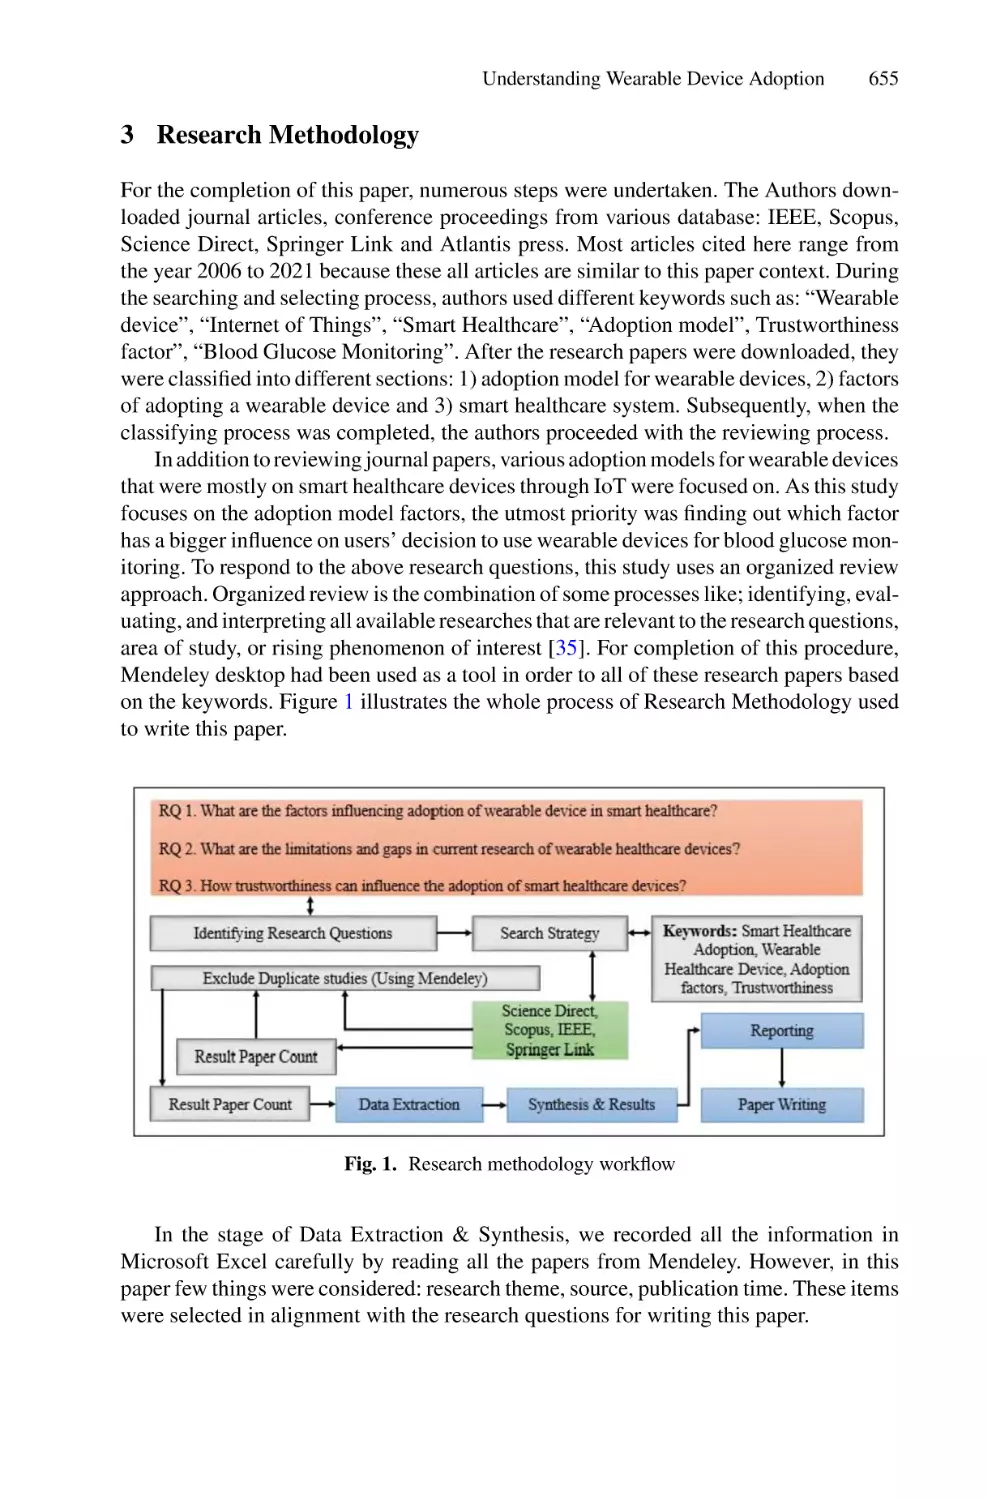
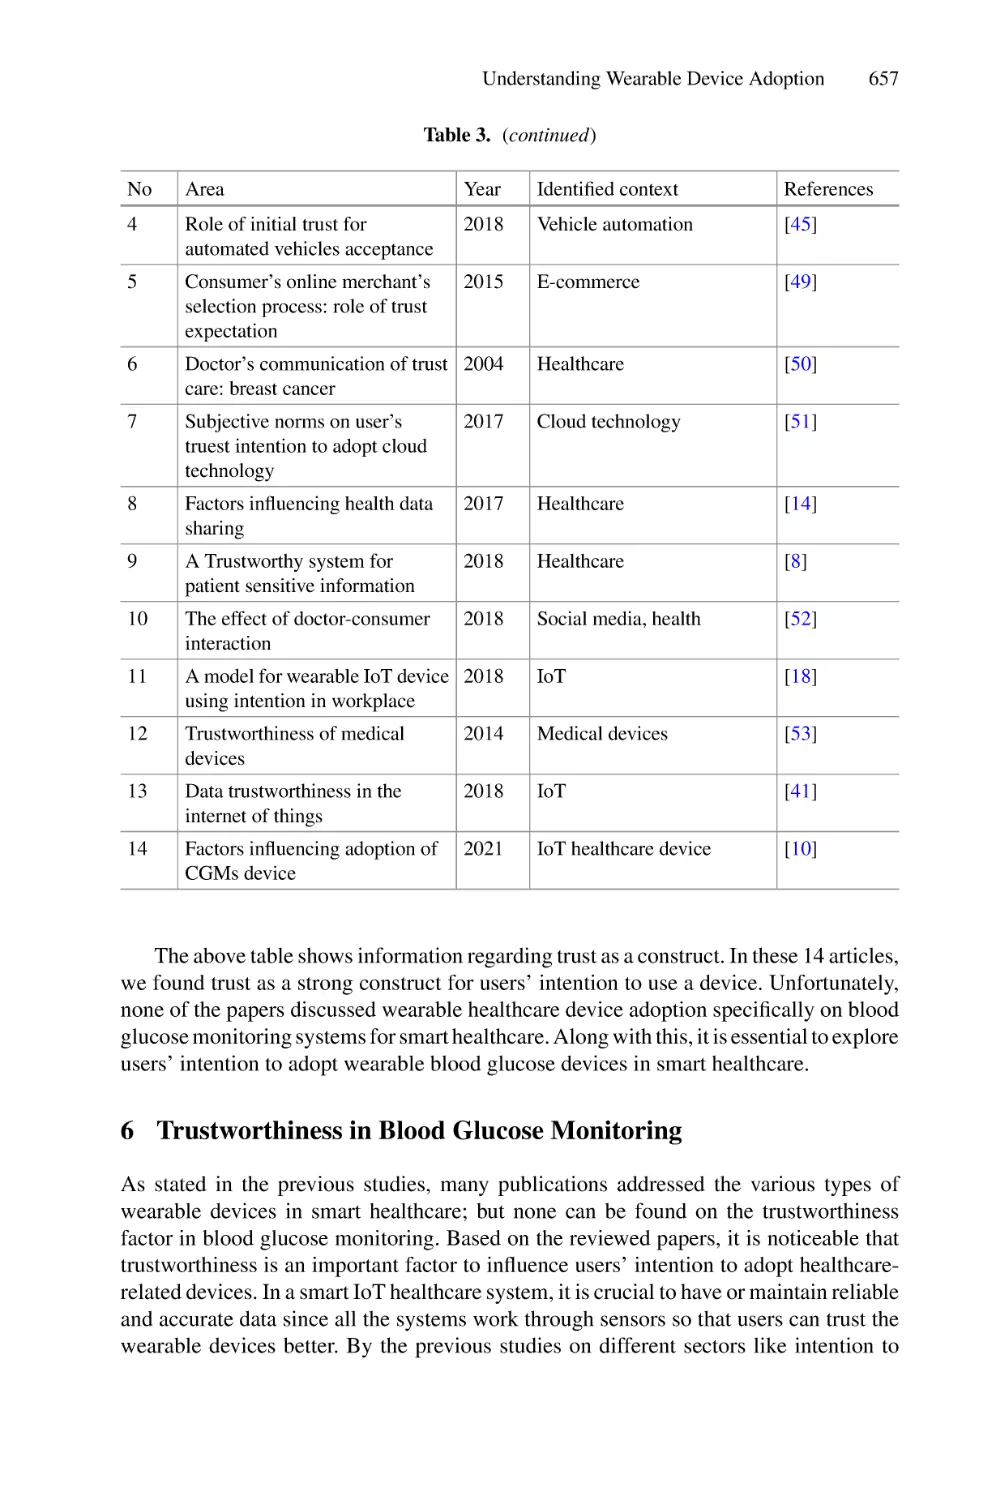
Understanding Wearable Device Adoption: Review on Adoption
Factors and Directions for Further Research in Smart Healthcare . . . . 651
Md Ismail Hossain, Ahmad Fadhil Yusof, and Mohana Shanmugam
Factors Contributing to an Effective E- Government Adoption in
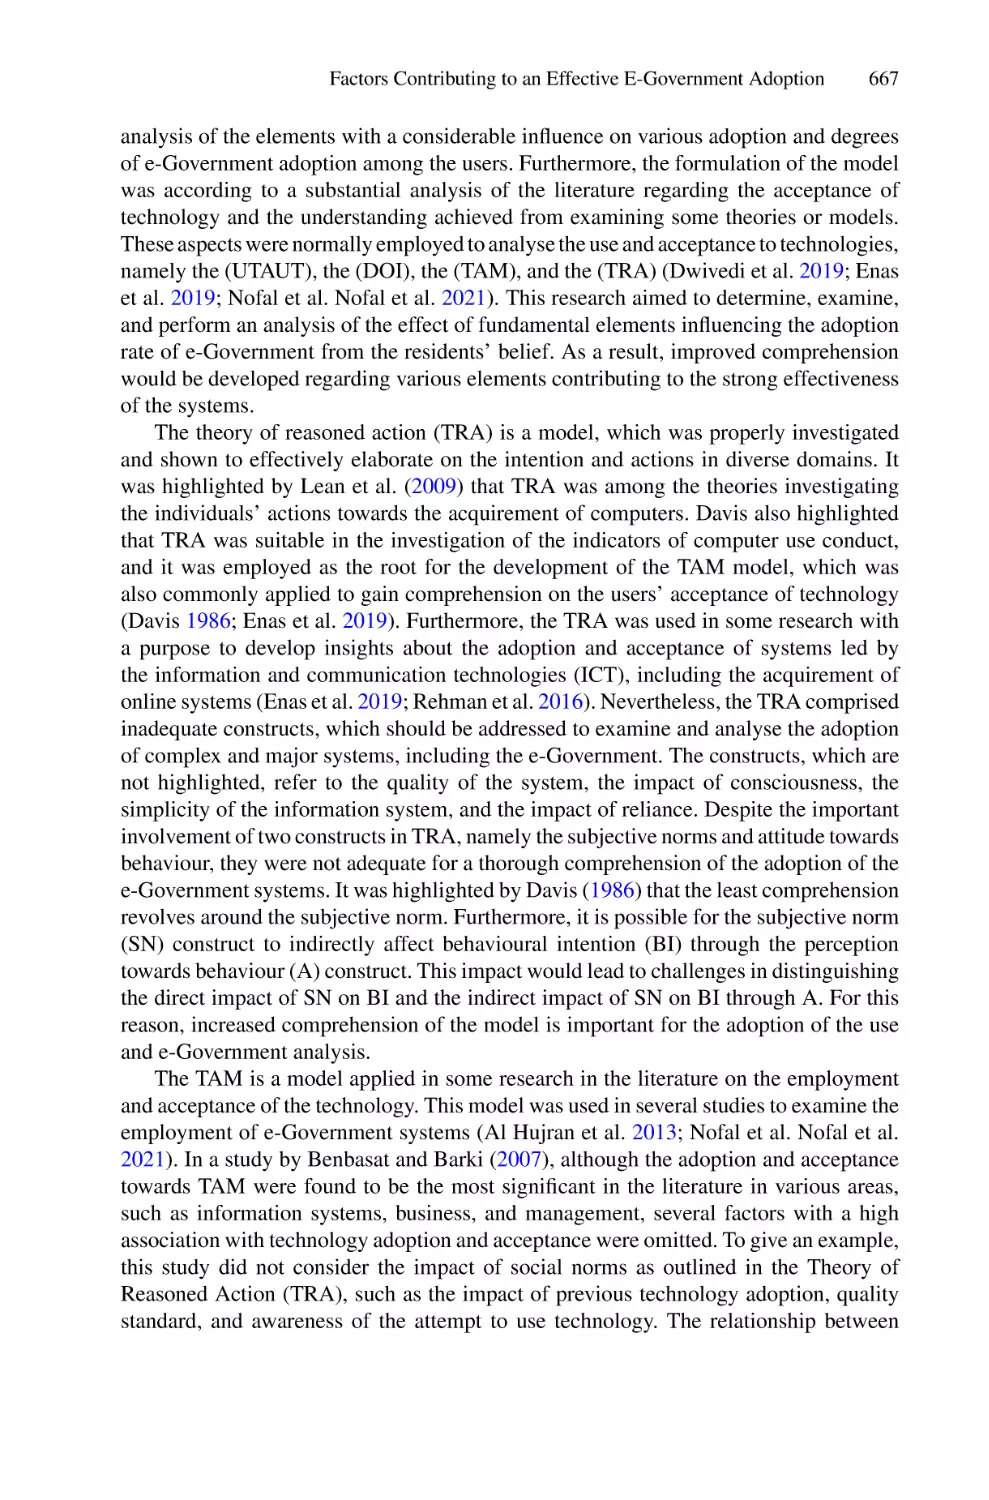
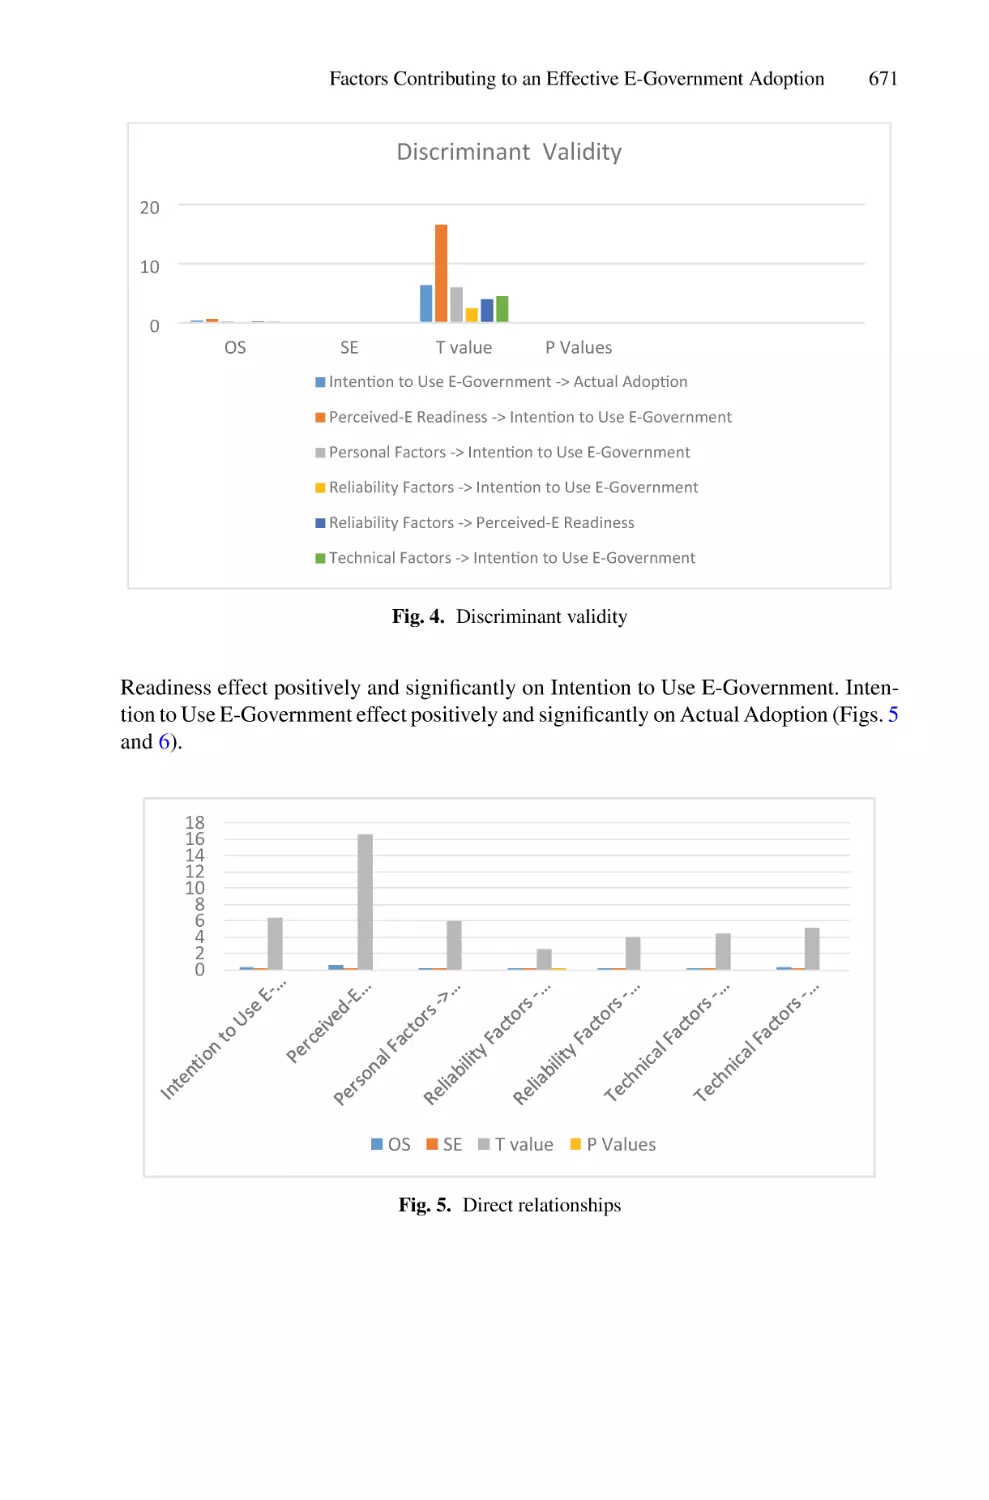
Palestine . . . . . . . . . . . . . . . . . . . . . . . . . . . . . . . . . . . . . . . . . . . . . . . . . 663
Tareq Obaid, Bilal Eneizan, Samy S. Abu Naser, Ghaith Alsheikh,
Ahmed Ali Atieh Ali, Hussein Mohammed Esmail Abualrejal,
and Nadhmi A. Gazem
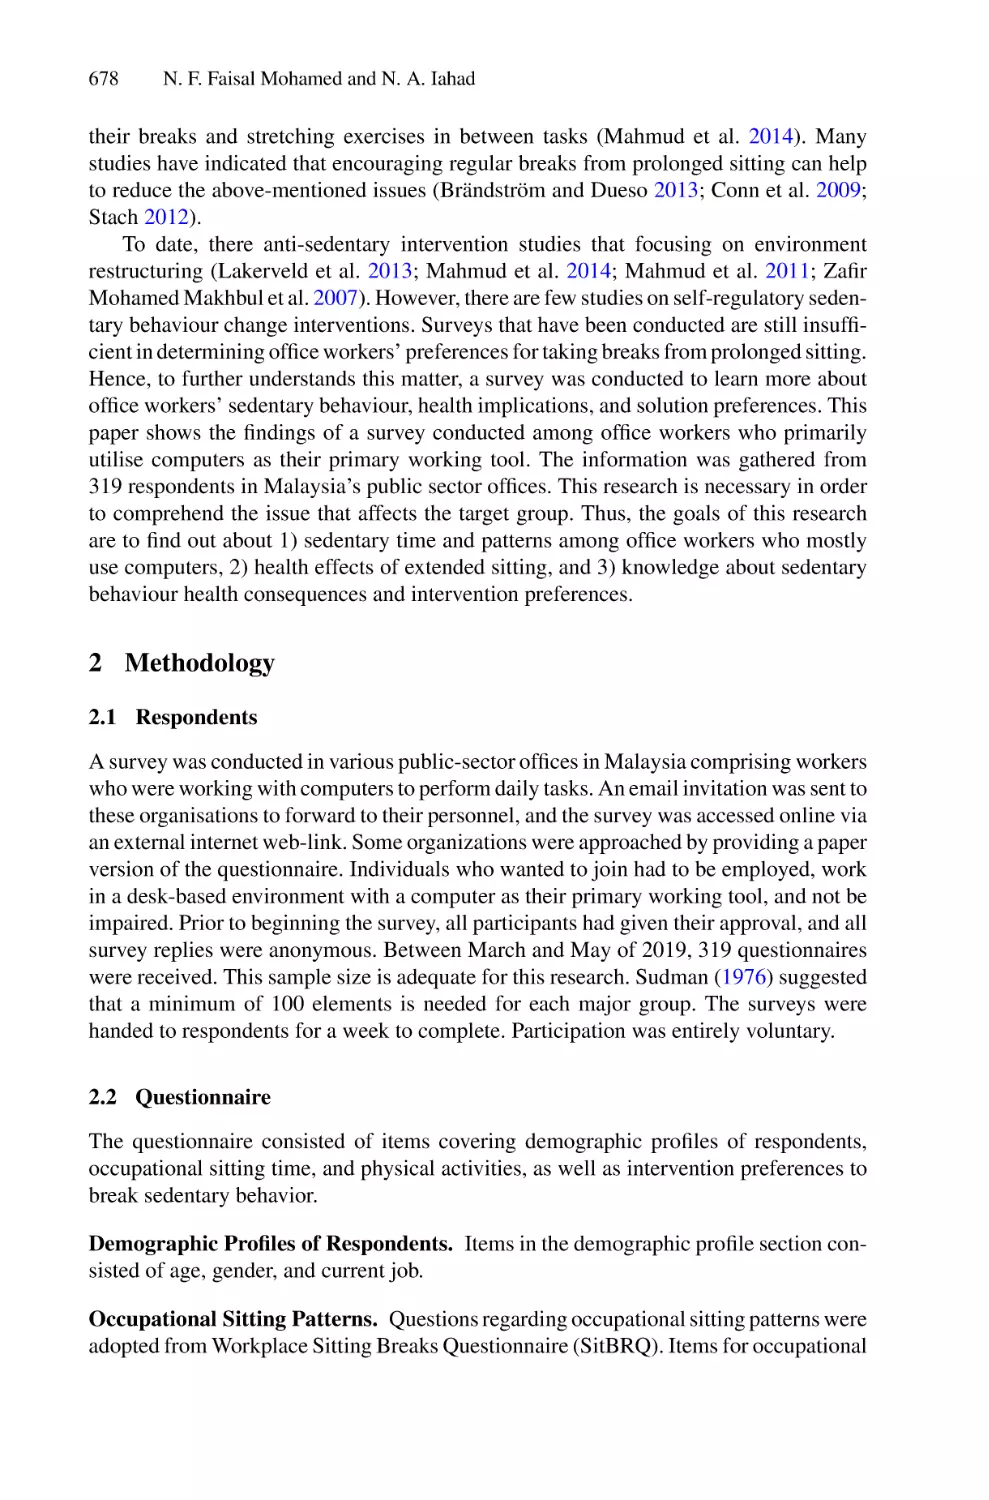
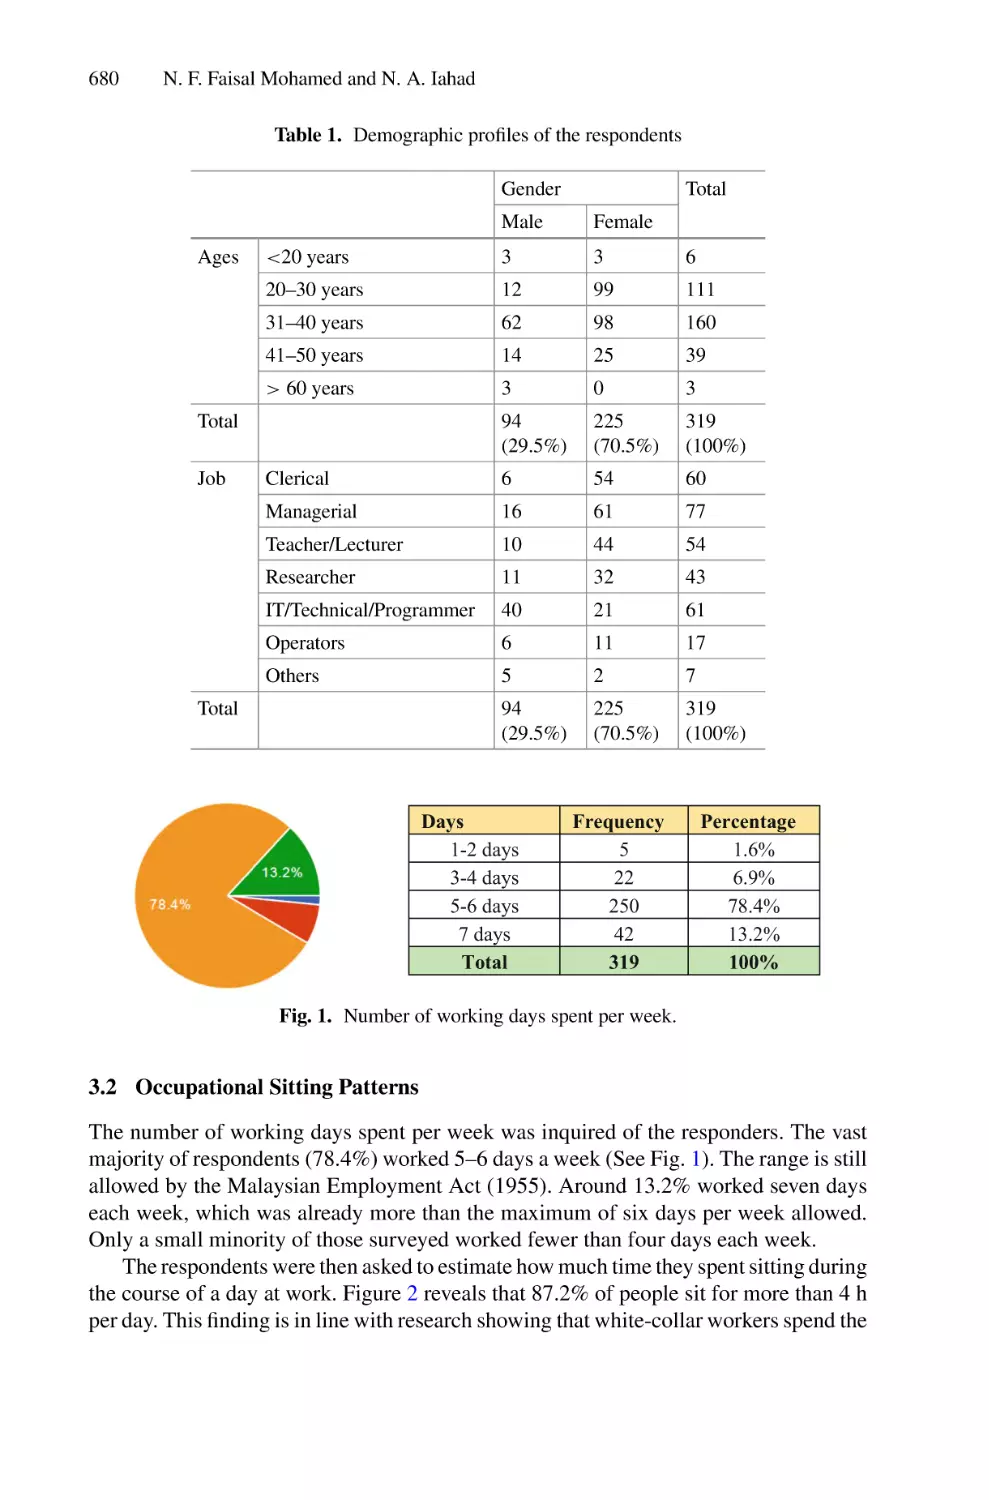
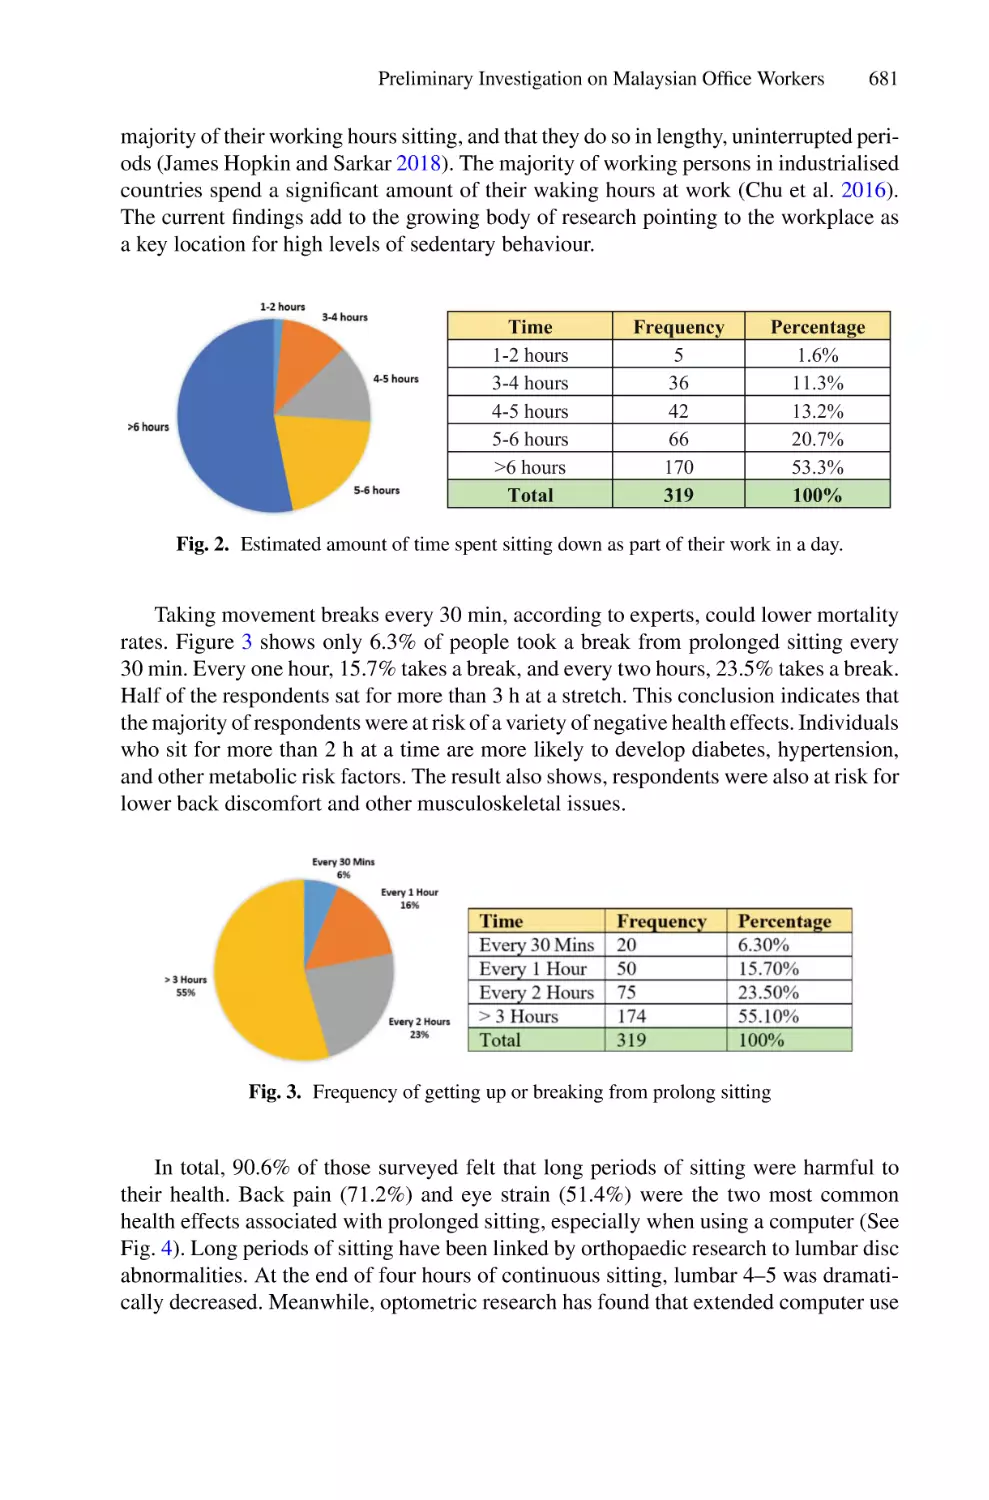
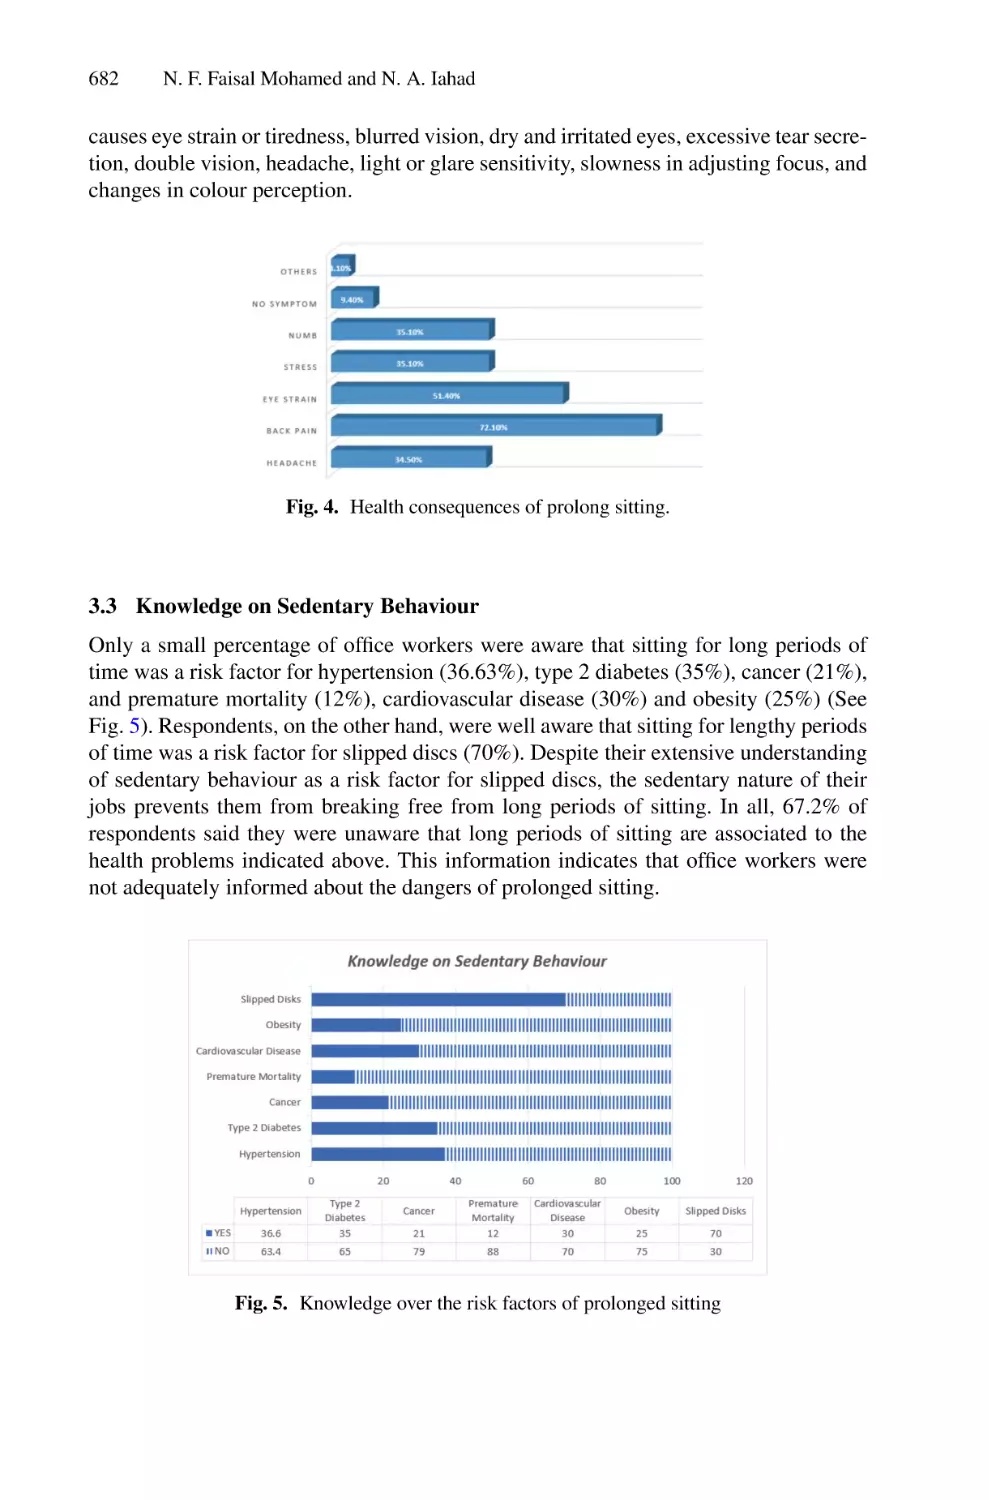
Preliminary Investigation on Malaysian Office Workers’ Sedentary
Behaviour, Health Consequences, and Intervention Preferences:
Towards Designing Anti Sedentary Behaviour Change Support
Systems . . . . . . . . . . . . . . . . . . . . . . . . . . . . . . . . . . . . . . . . . . . . . . . . . 677
Nur Fadziana Faisal Mohamed and Noorminshah A. Iahad
Contents
xvii
The National Industry 4.0 Policy Performance Review Based on
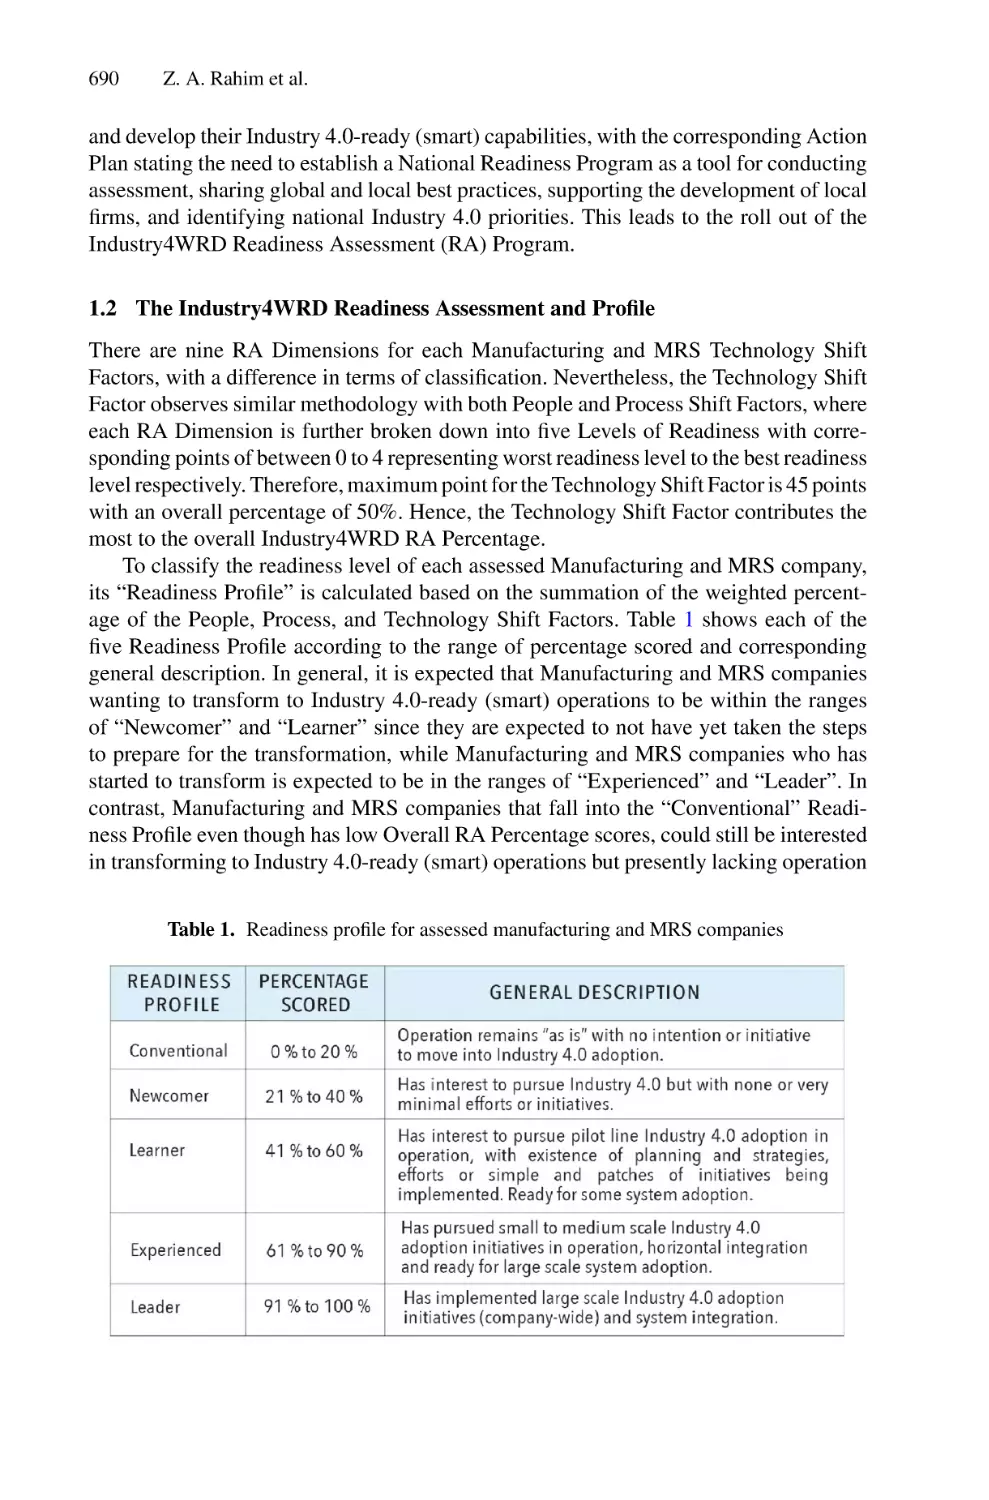
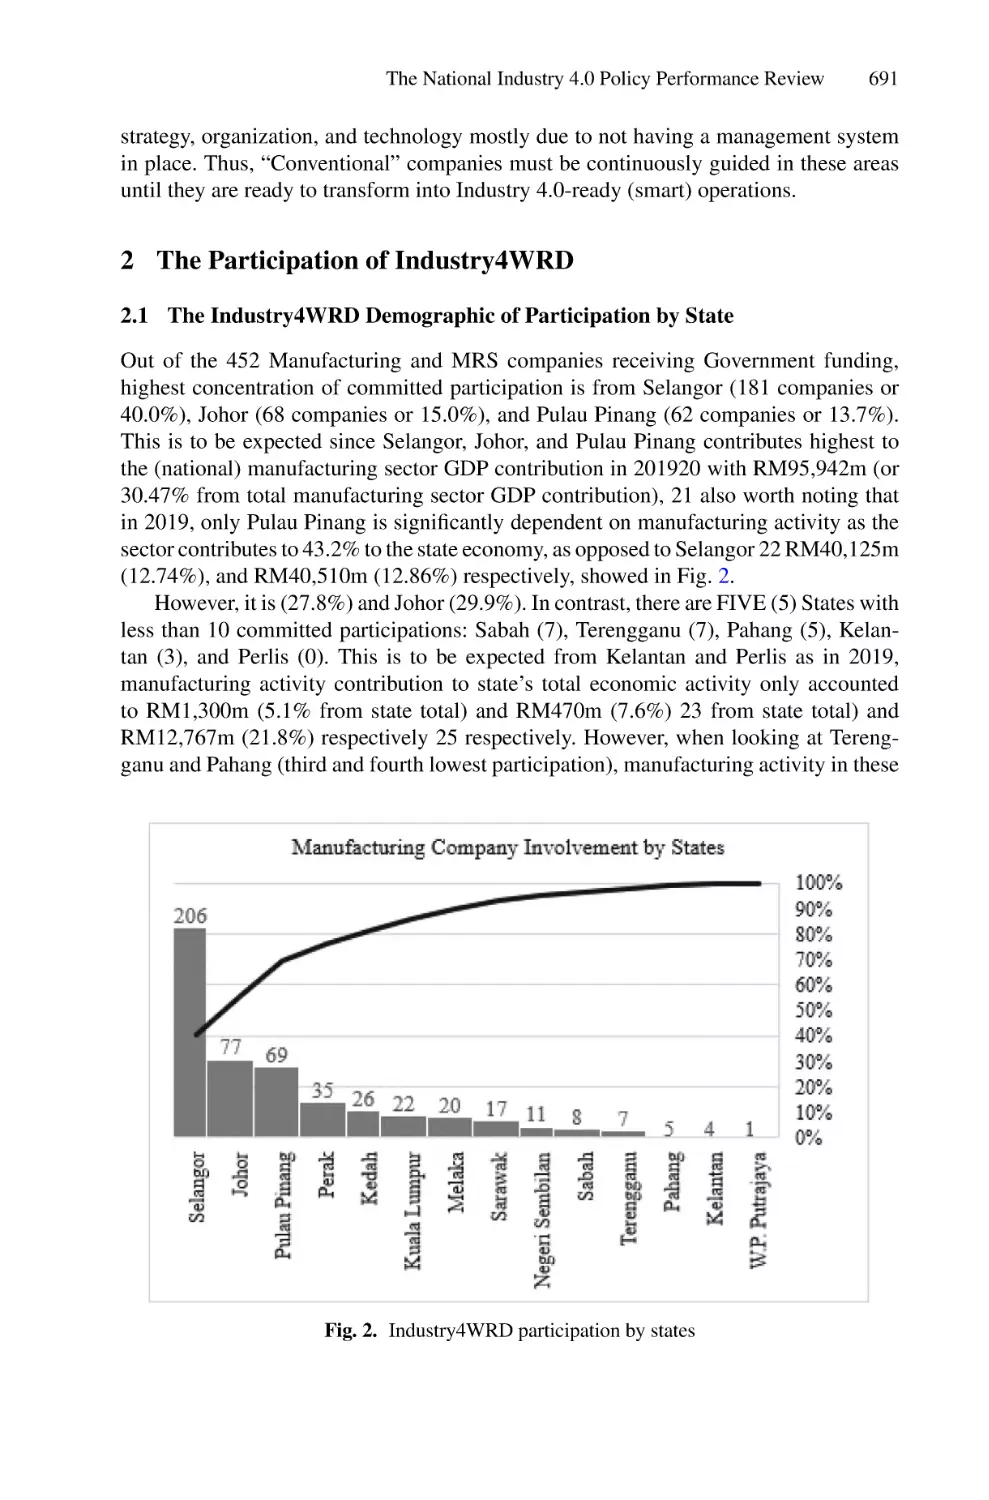
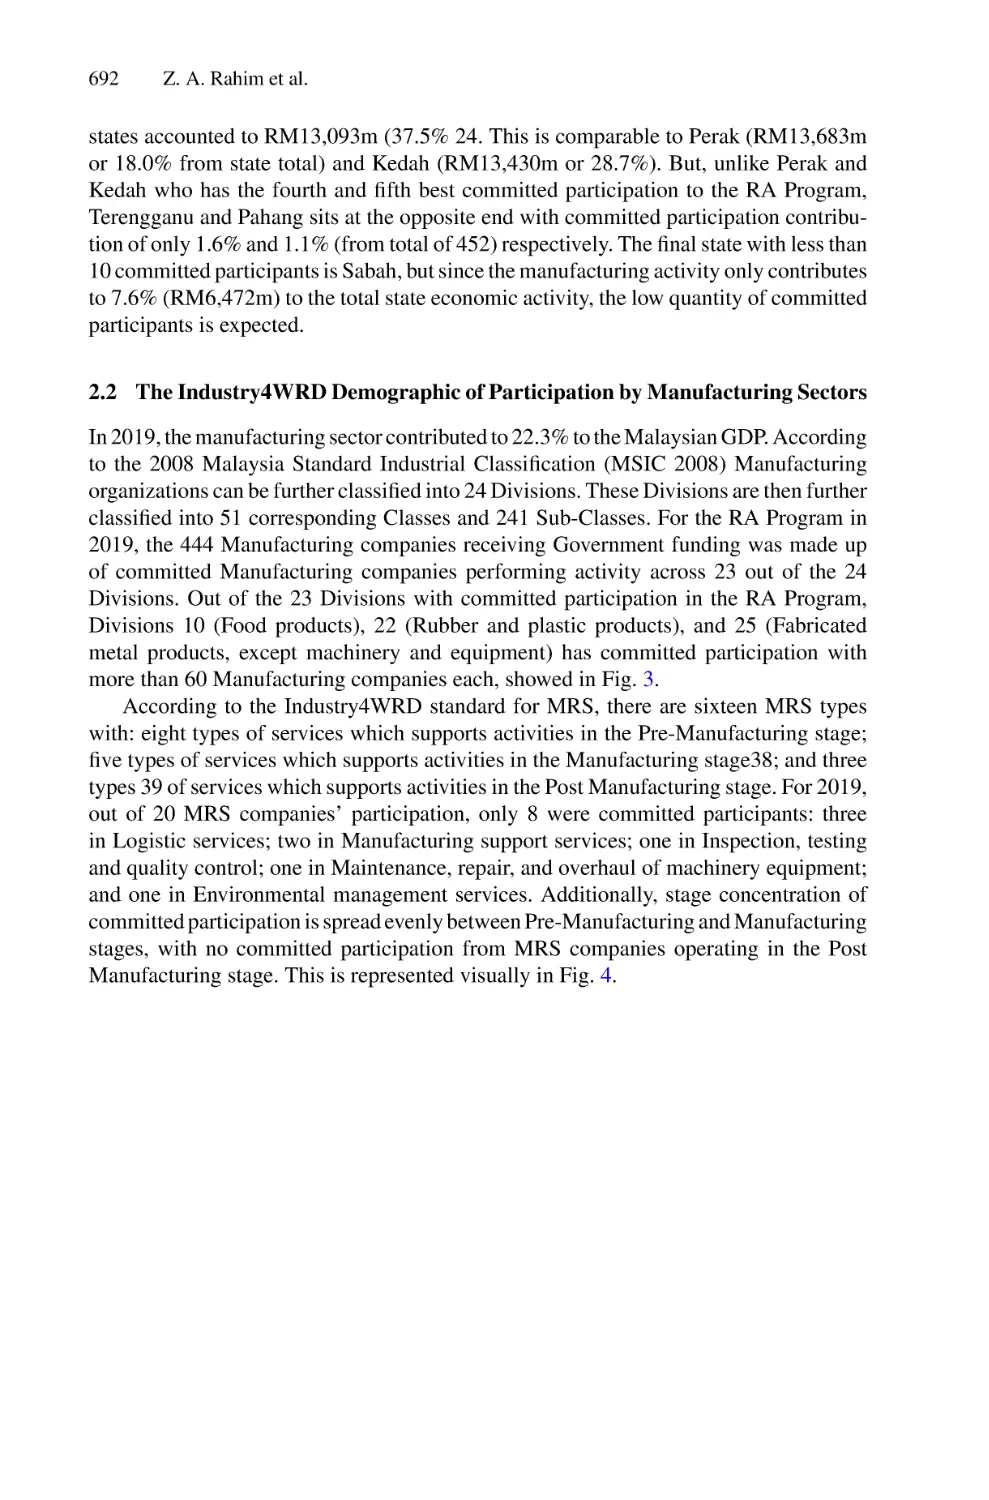
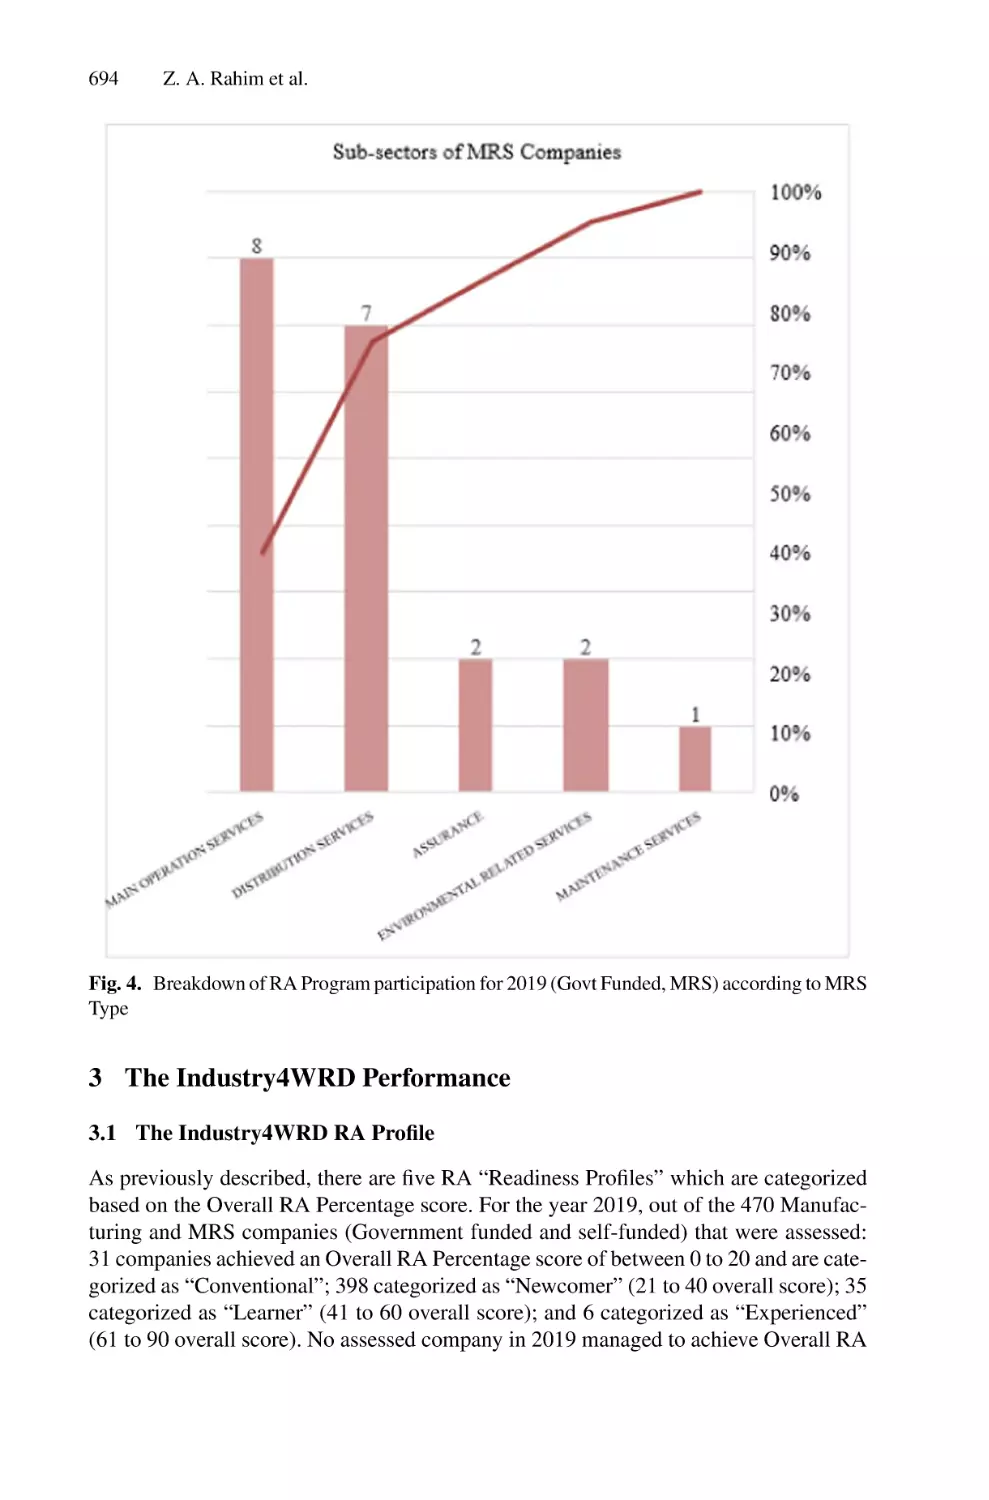
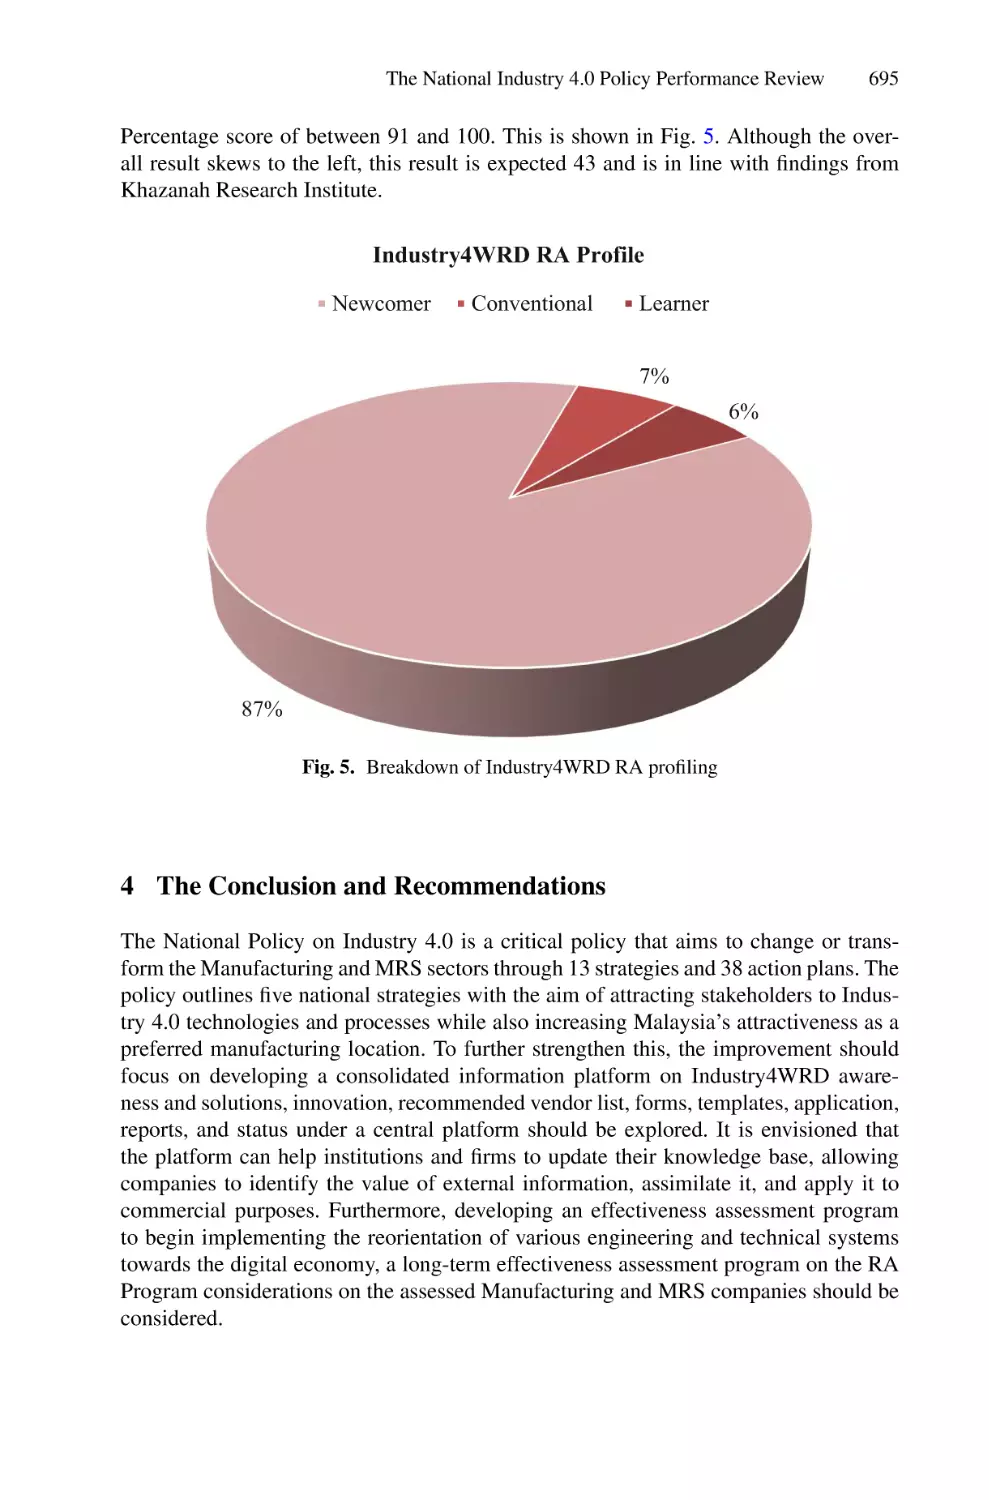
Industry4WRD Readiness Assessment and Intervention Program . . . . . 688
Zulhasni Abdul Rahim, Nor Azian Abdul Rahman,
and Muhamad Saqib Iqbal
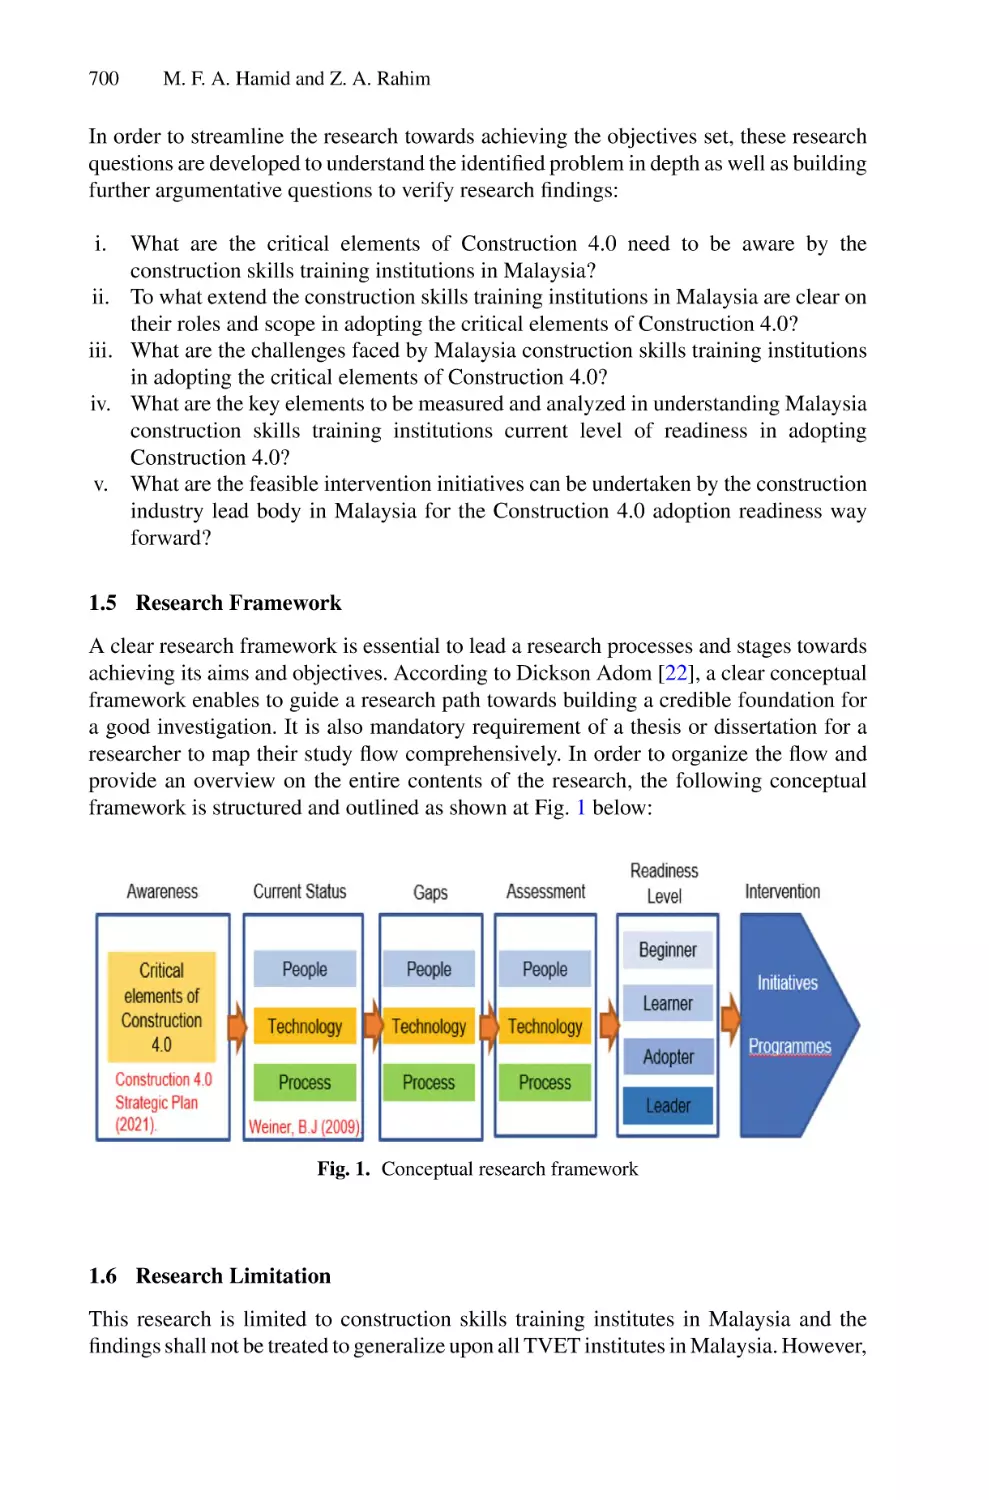
Construction 4.0 Readiness and Challenges for Construction Skills
Training Institutions in Malaysia . . . . . . . . . . . . . . . . . . . . . . . . . . . . . . 697
Muhammad Fariq Abdul Hamid and Zulhasni Abdul Rahim
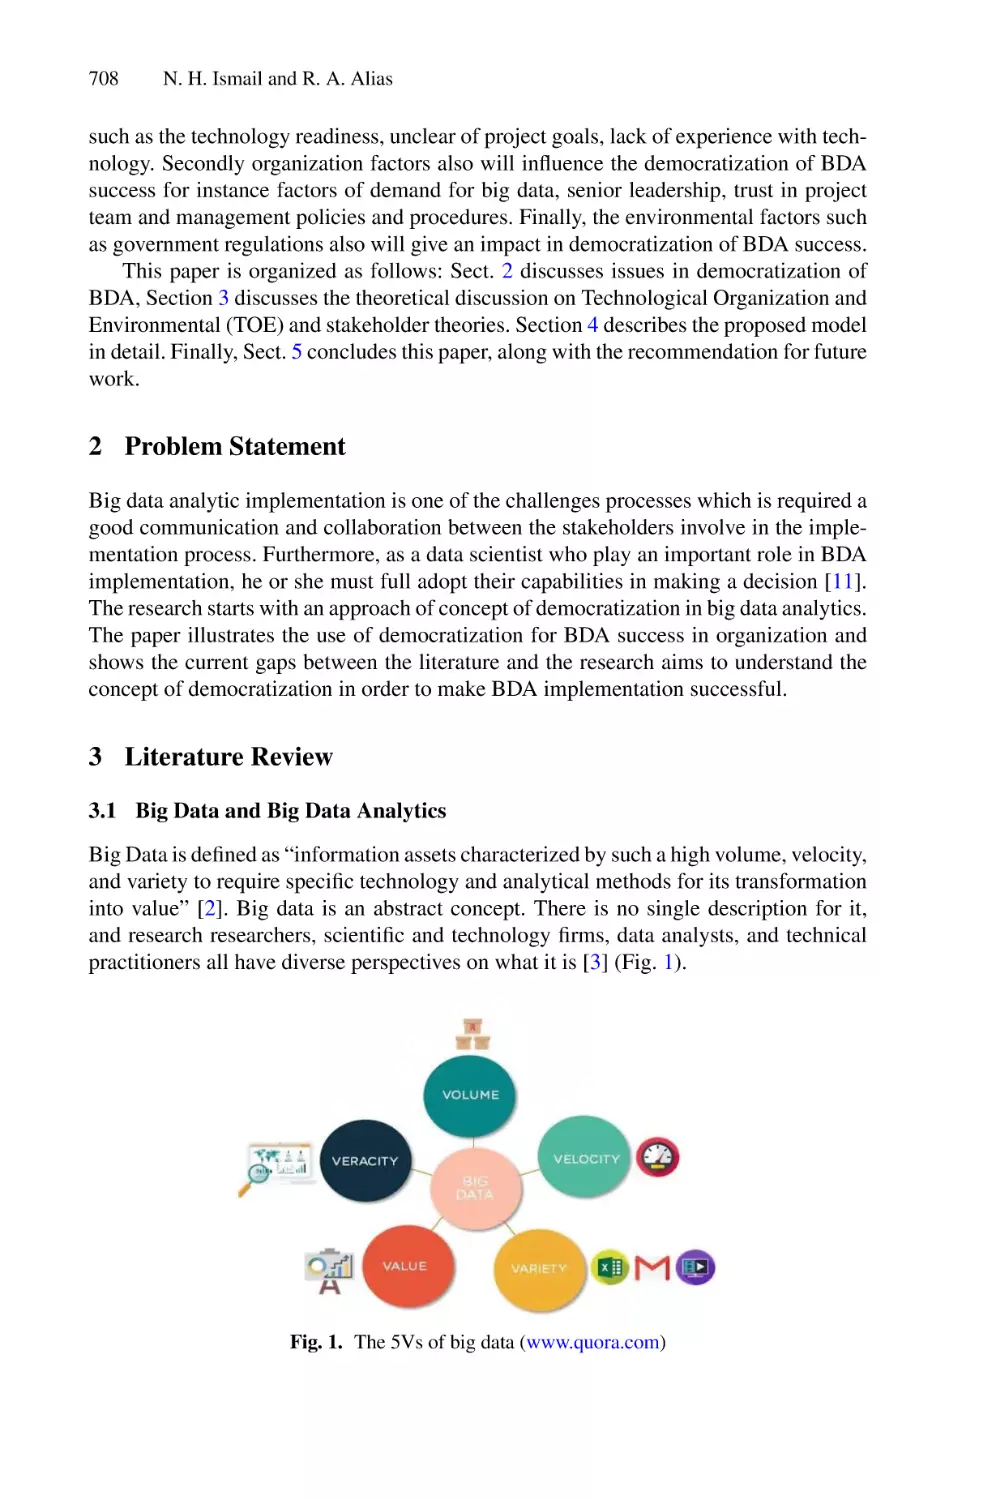
A Conceptual Framework for Democratization of Big Data
Analytics (BDA) . . . . . . . . . . . . . . . . . . . . . . . . . . . . . . . . . . . . . . . . . . . 707
Nor Haslinda Ismail and Rose Alinda Alias
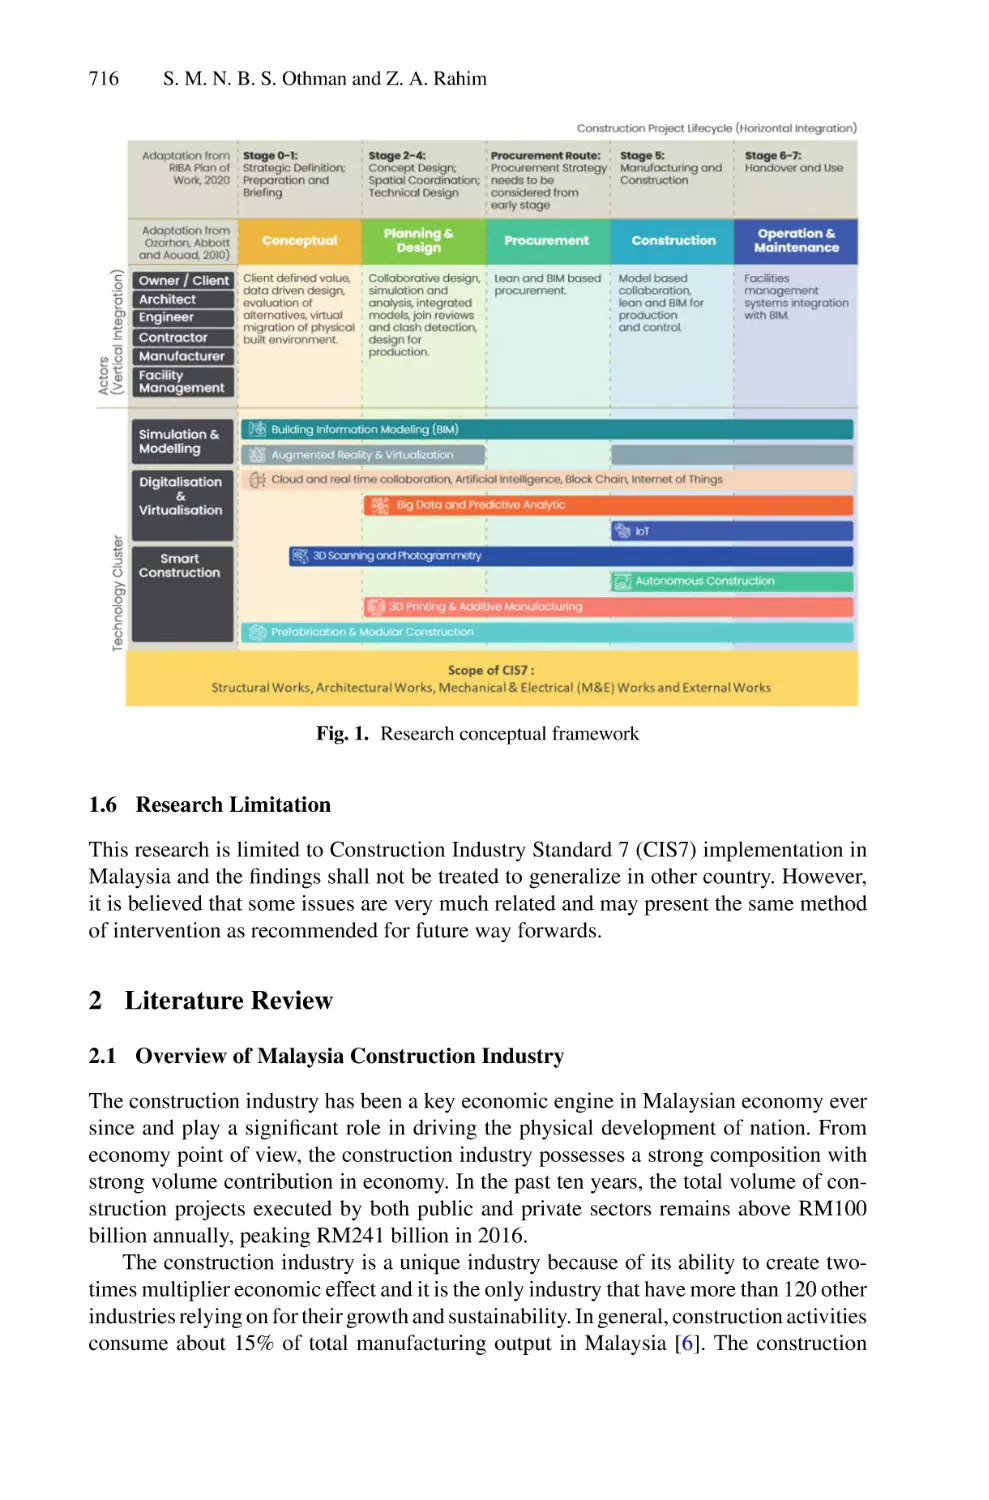
Construction 4.0 Intervention in Quality Assessment System
in Construction’s Implementation . . . . . . . . . . . . . . . . . . . . . . . . . . . . . 713
Syed Muhammad Nazir Bin Syed Othman and Zulhasni Abdul Rahim
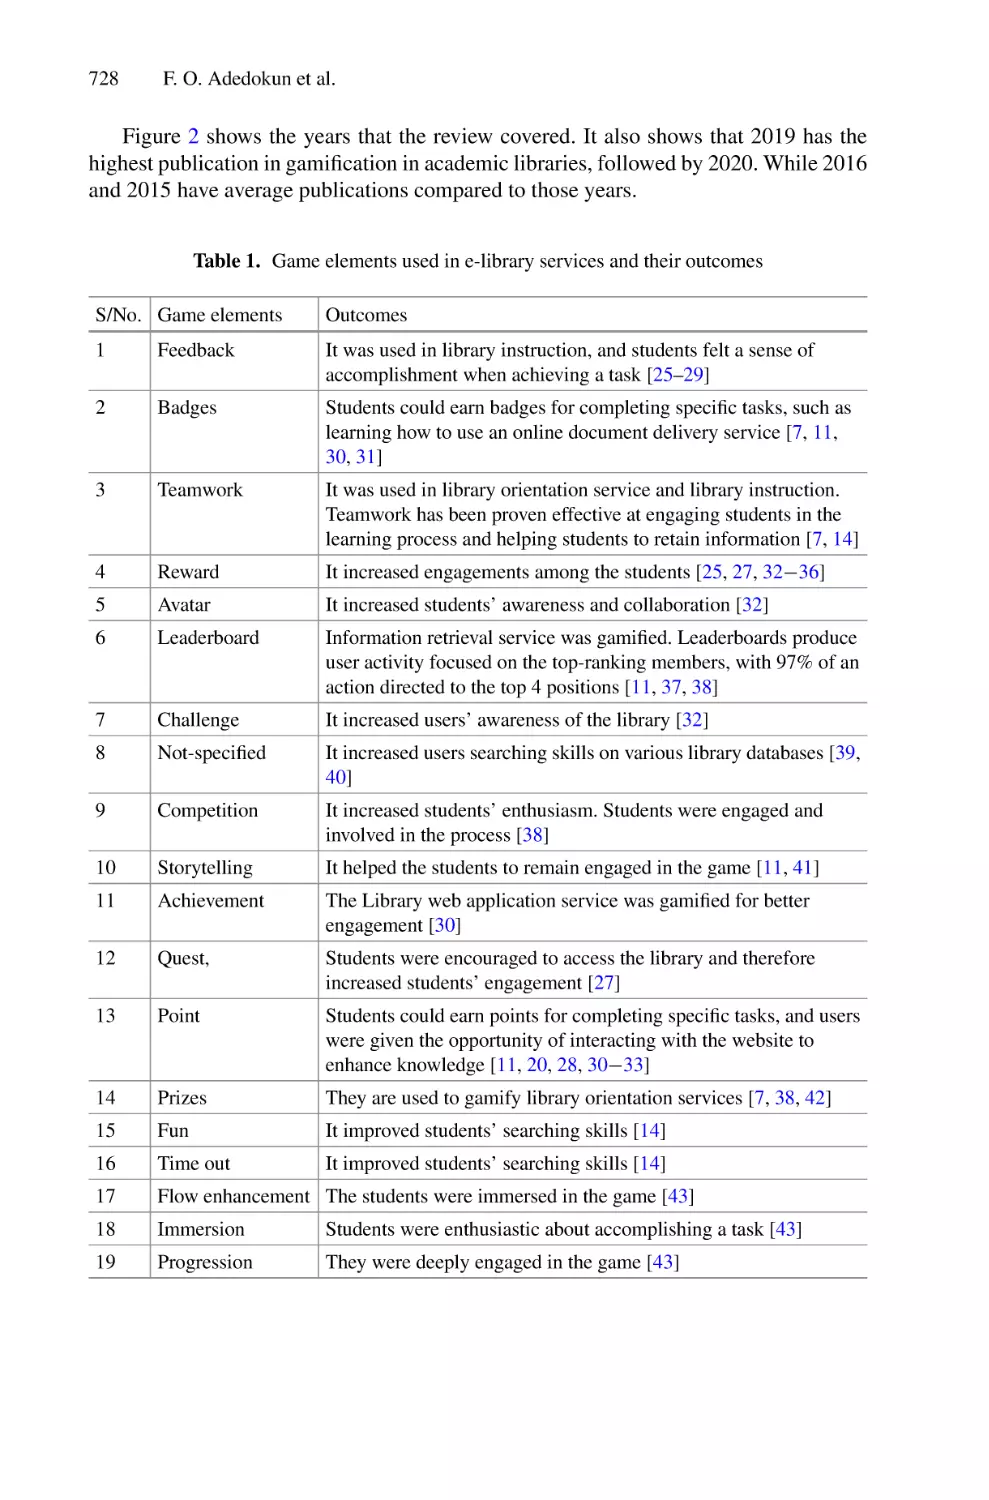
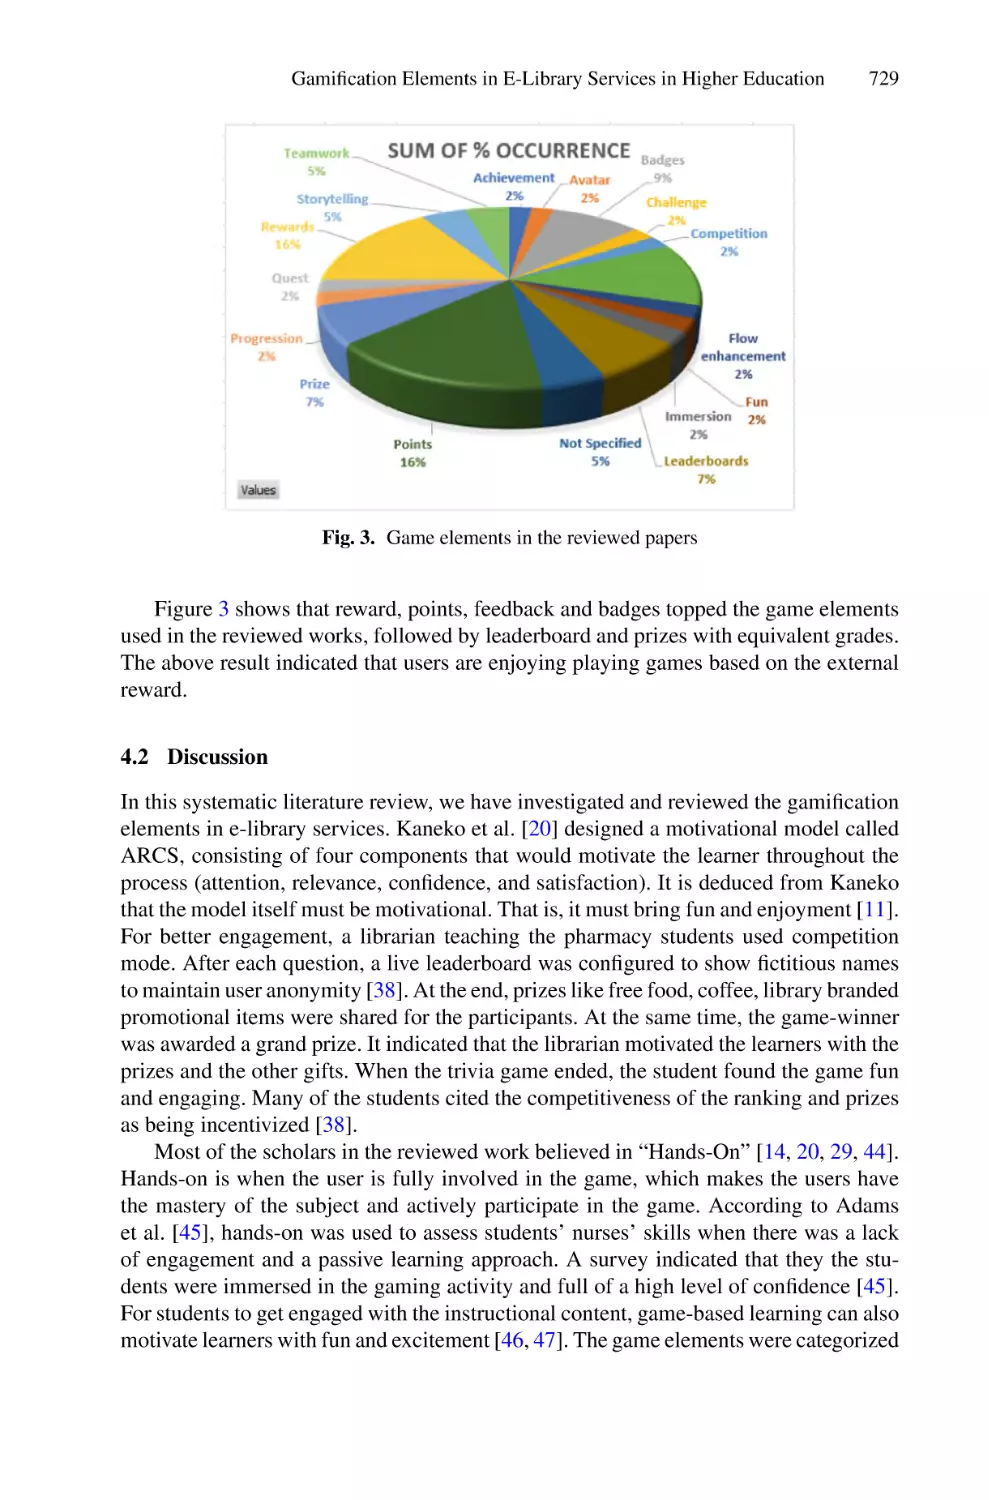
Gamification Elements in E-Library Services in Higher Education:
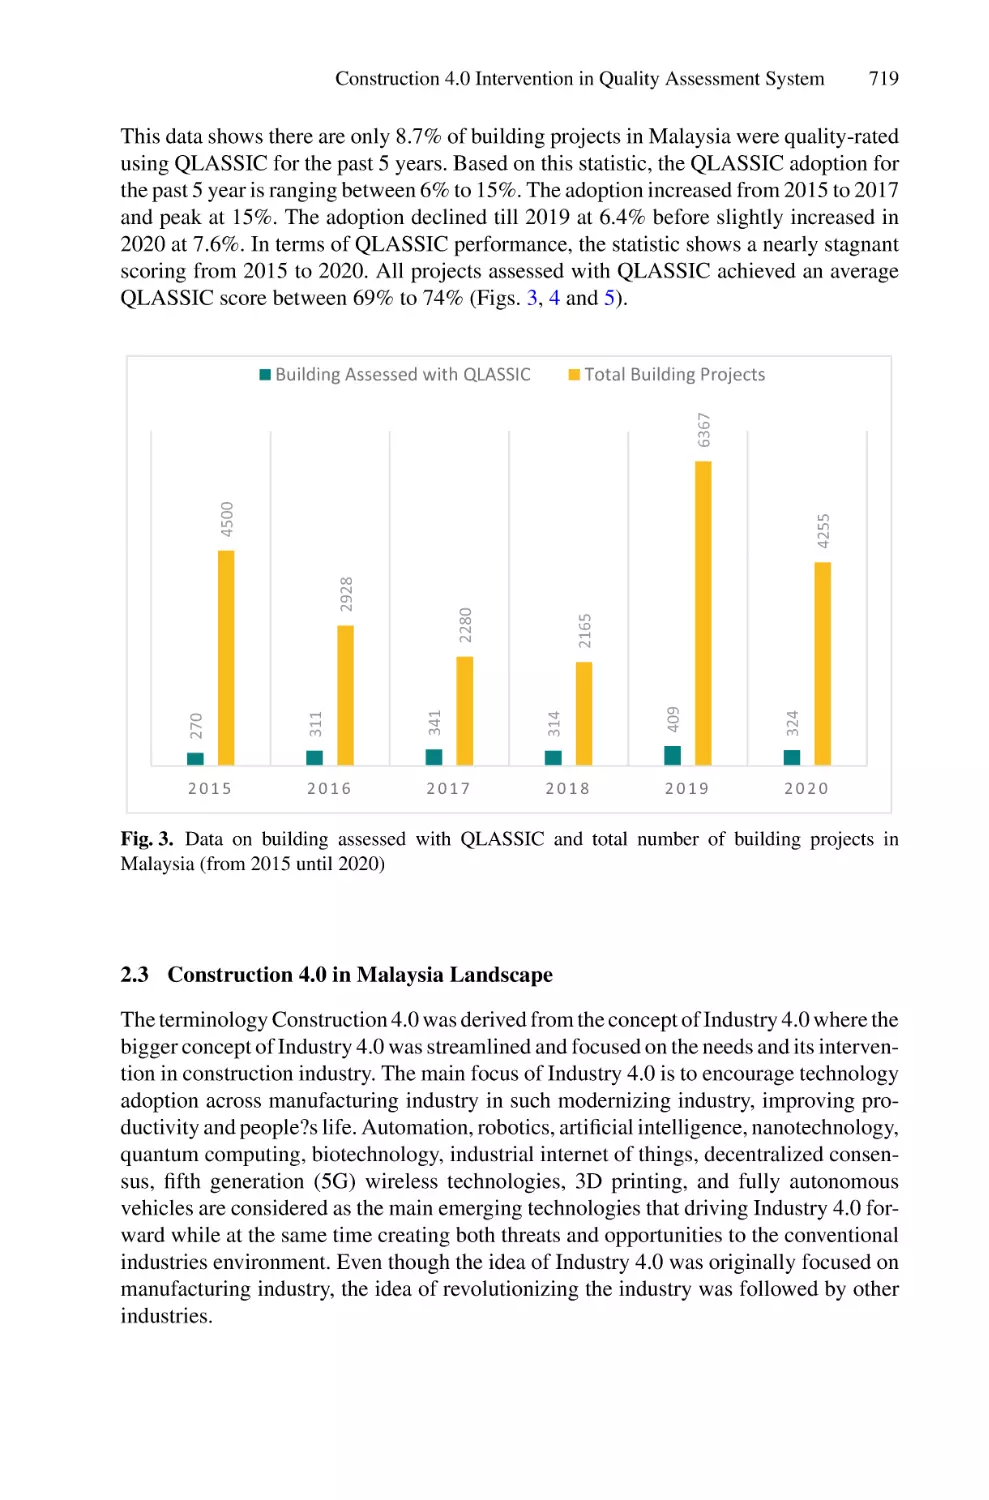
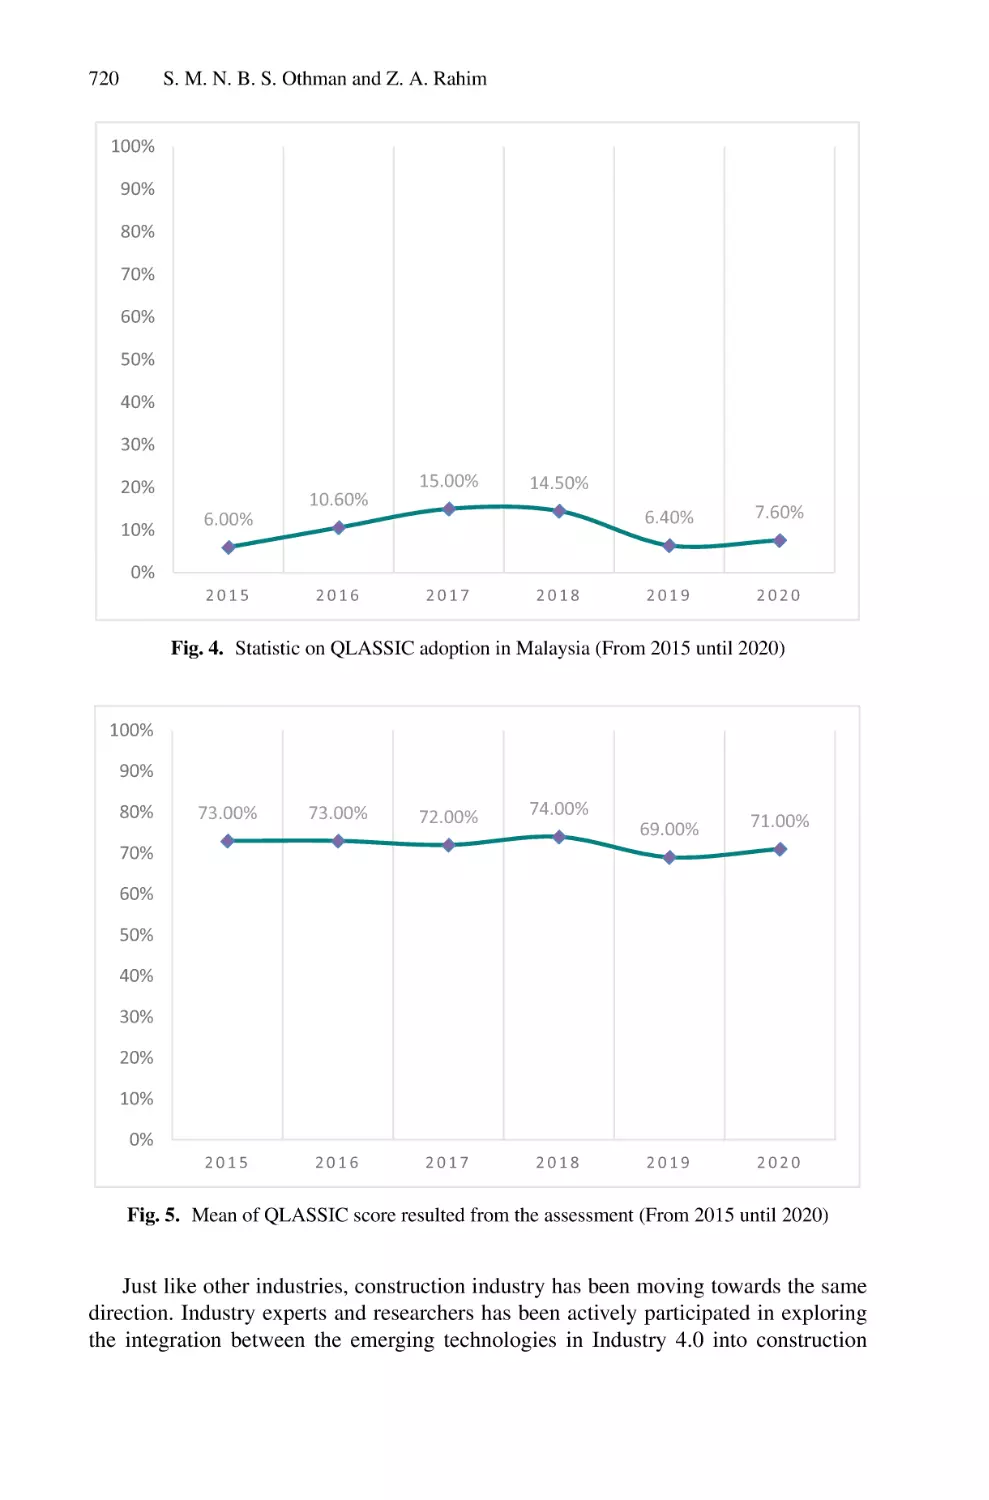
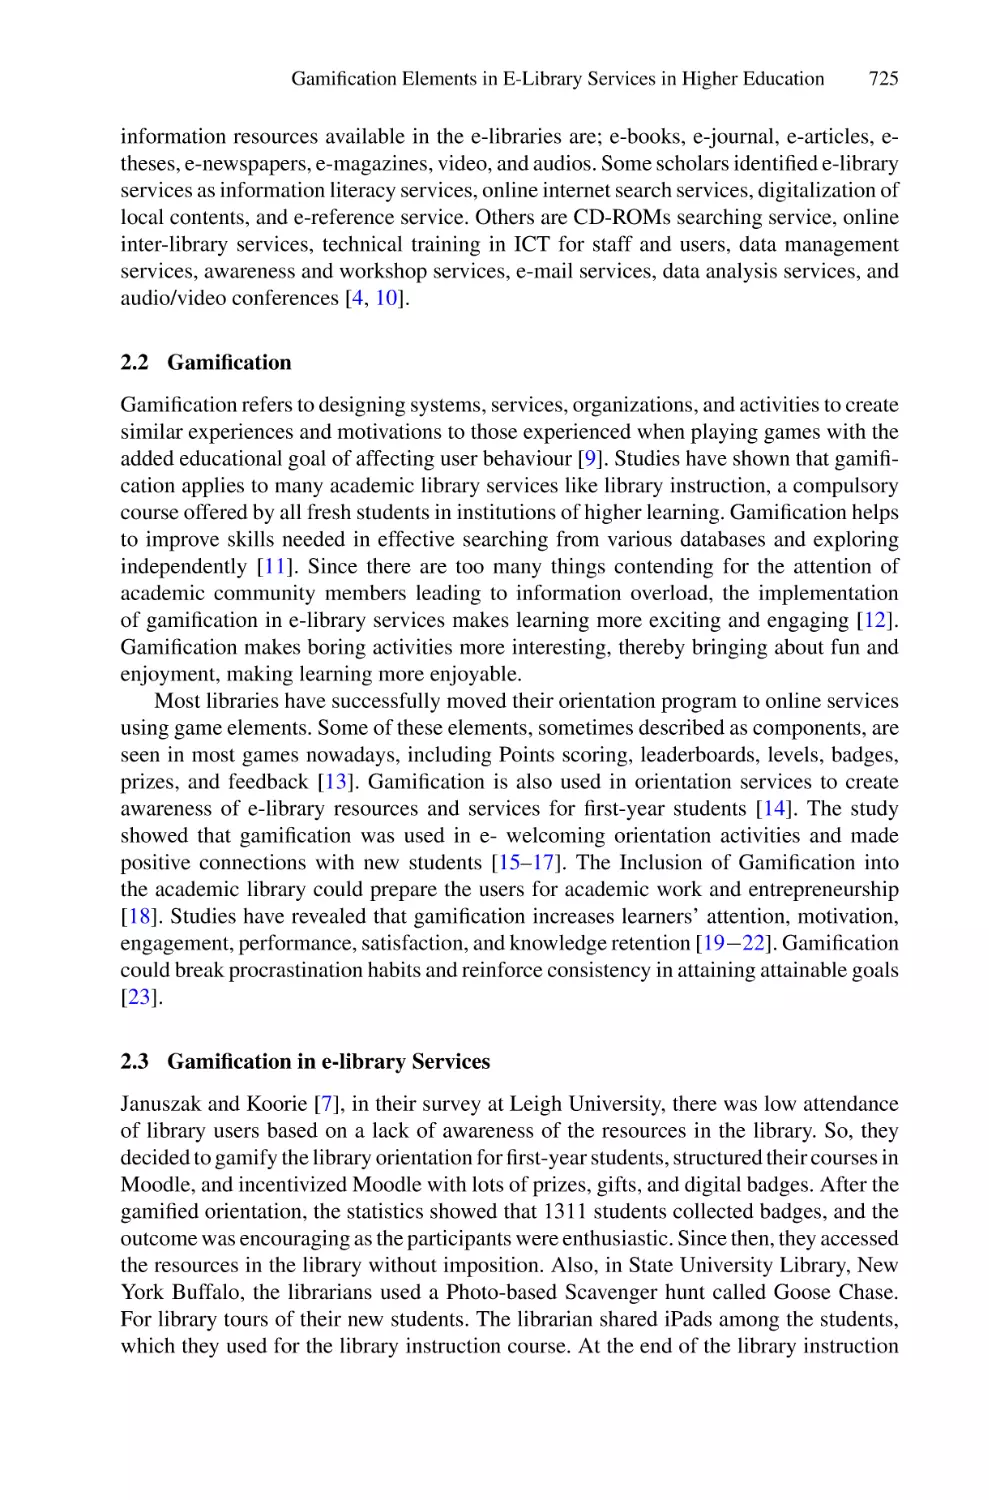
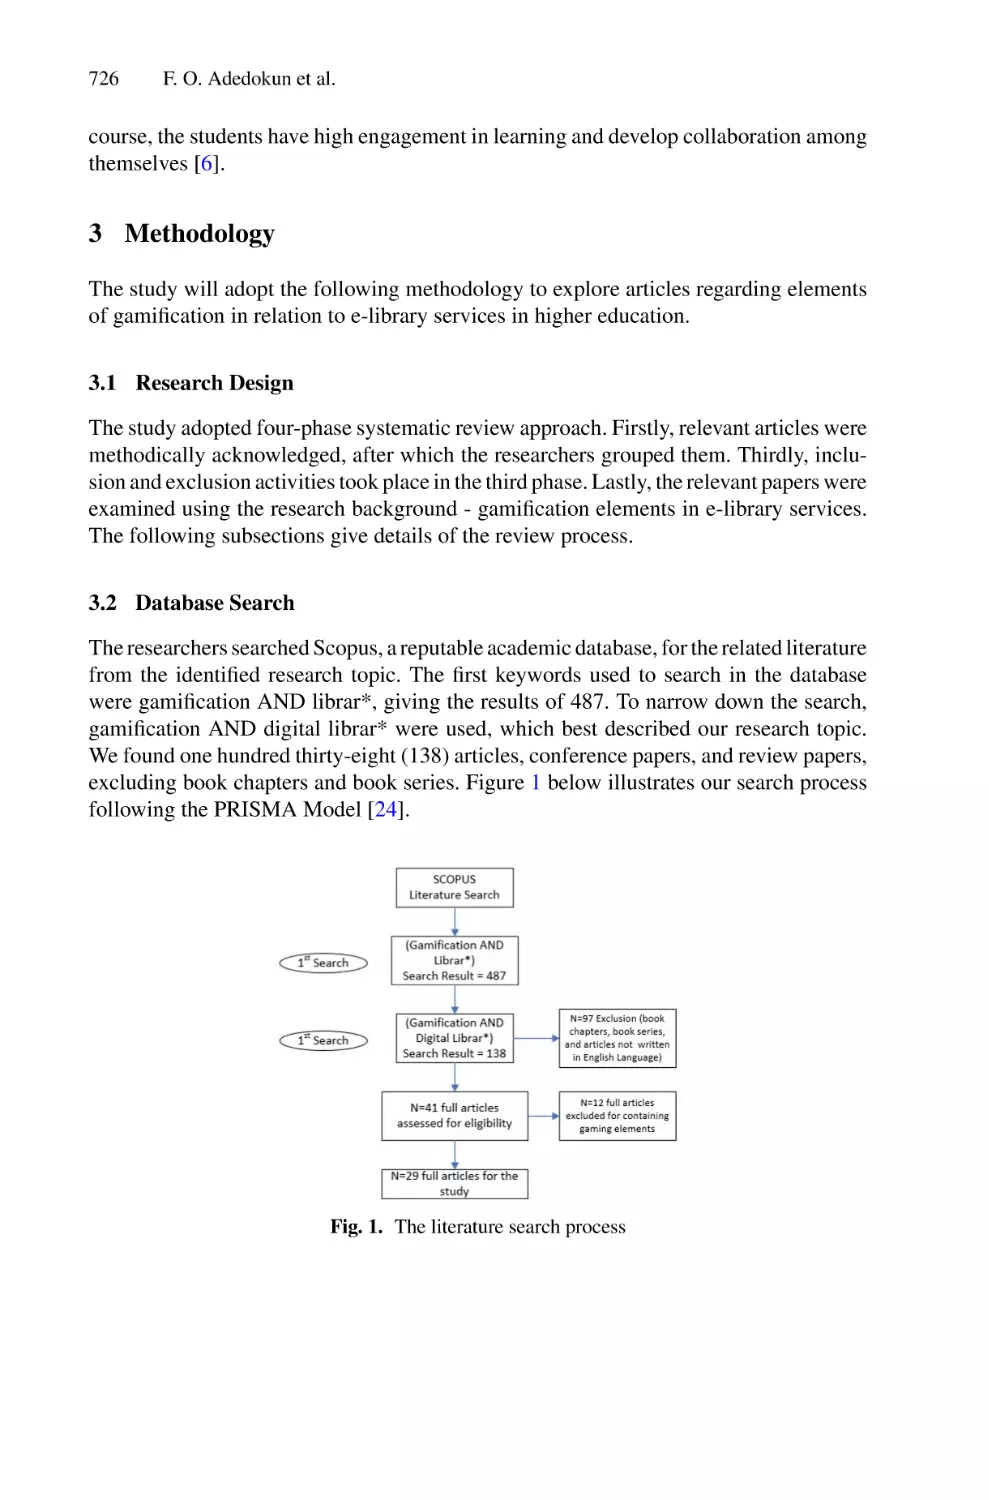
A Systematic Review . . . . . . . . . . . . . . . . . . . . . . . . . . . . . . . . . . . . . . . 723
Folashade Oyinlola Adedokun, Norasnita Ahmad, and Suraya Miskon
Health Informatics
Bayesian Model for Detecting Influence Directionality of Heart
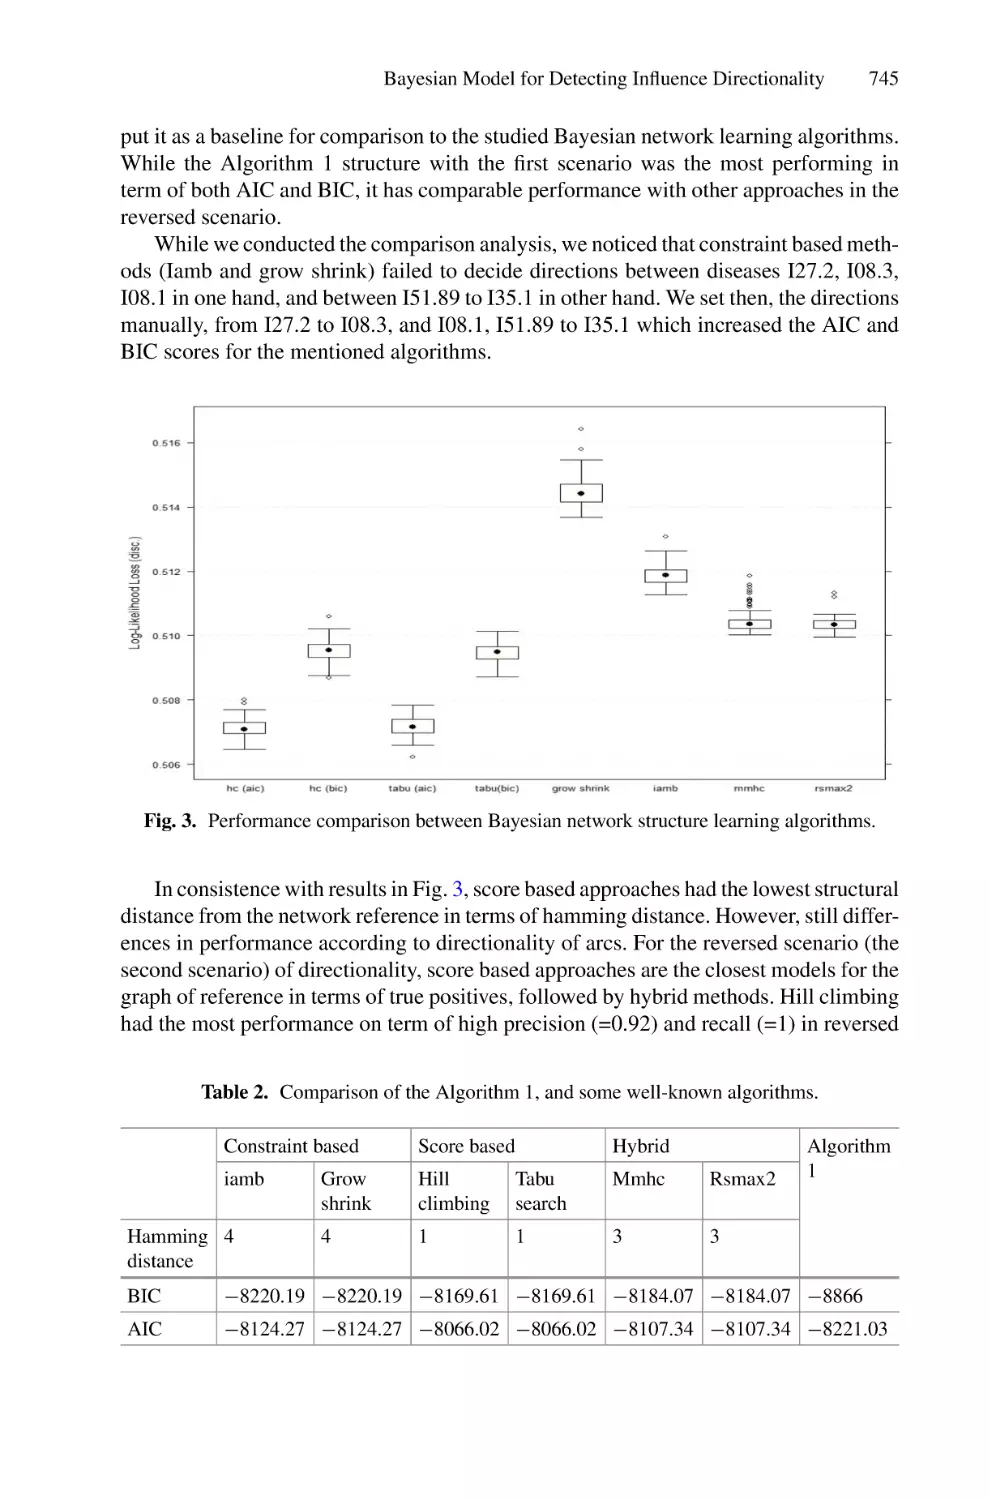
Related Diseases with Application in Multimorbidity Understanding . . . 737
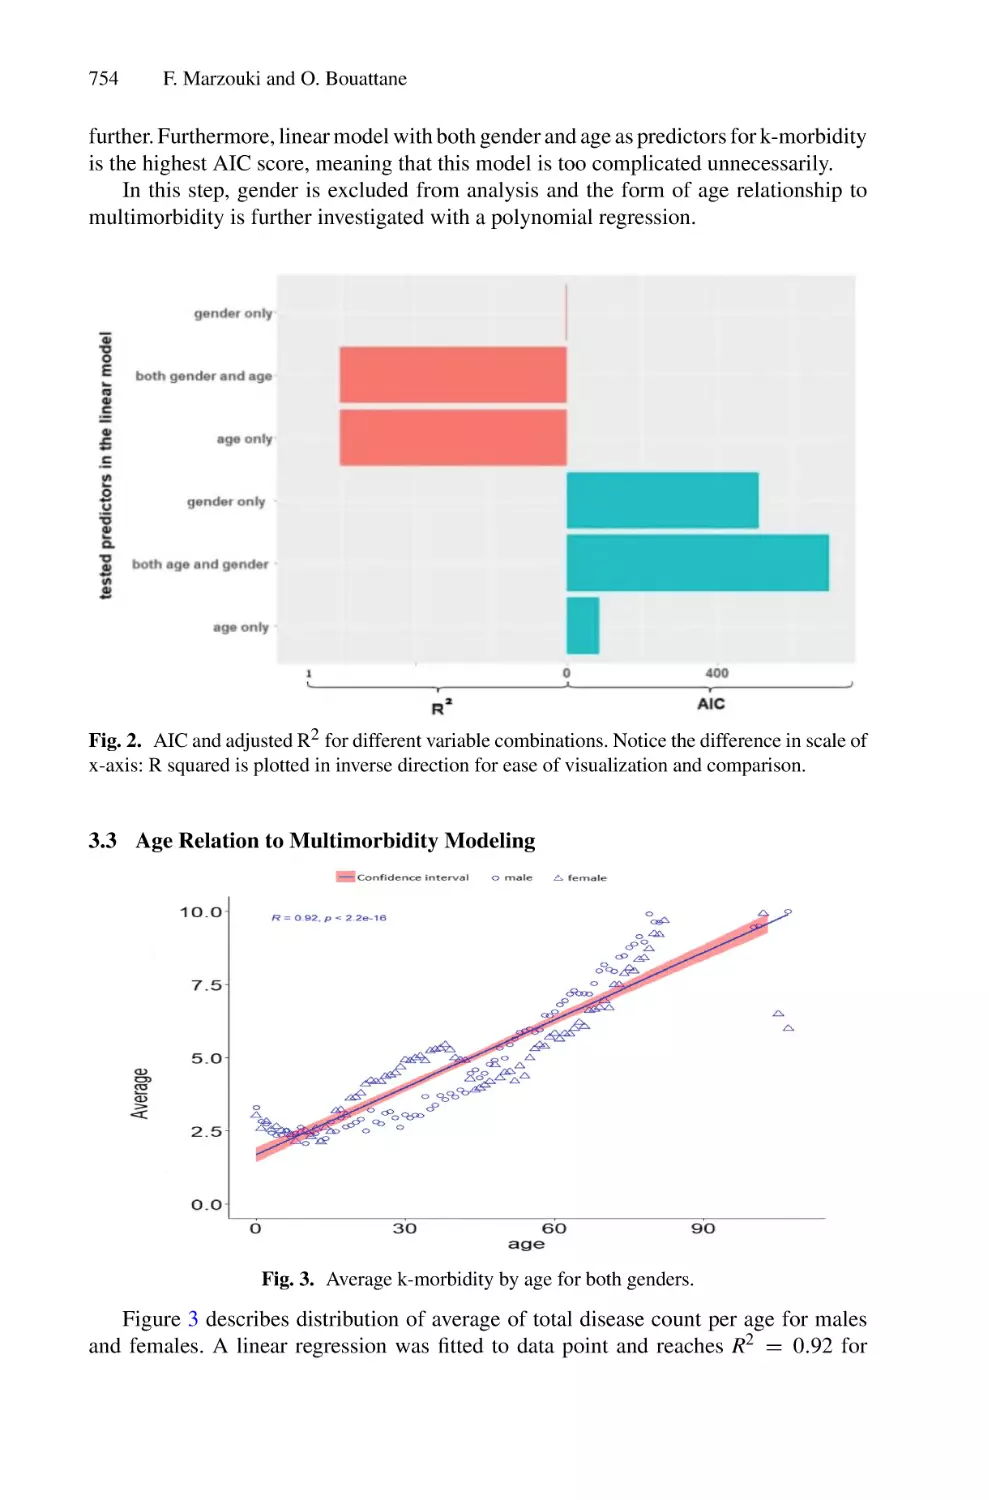
Faouzi Marzouki and Omar Bouattane
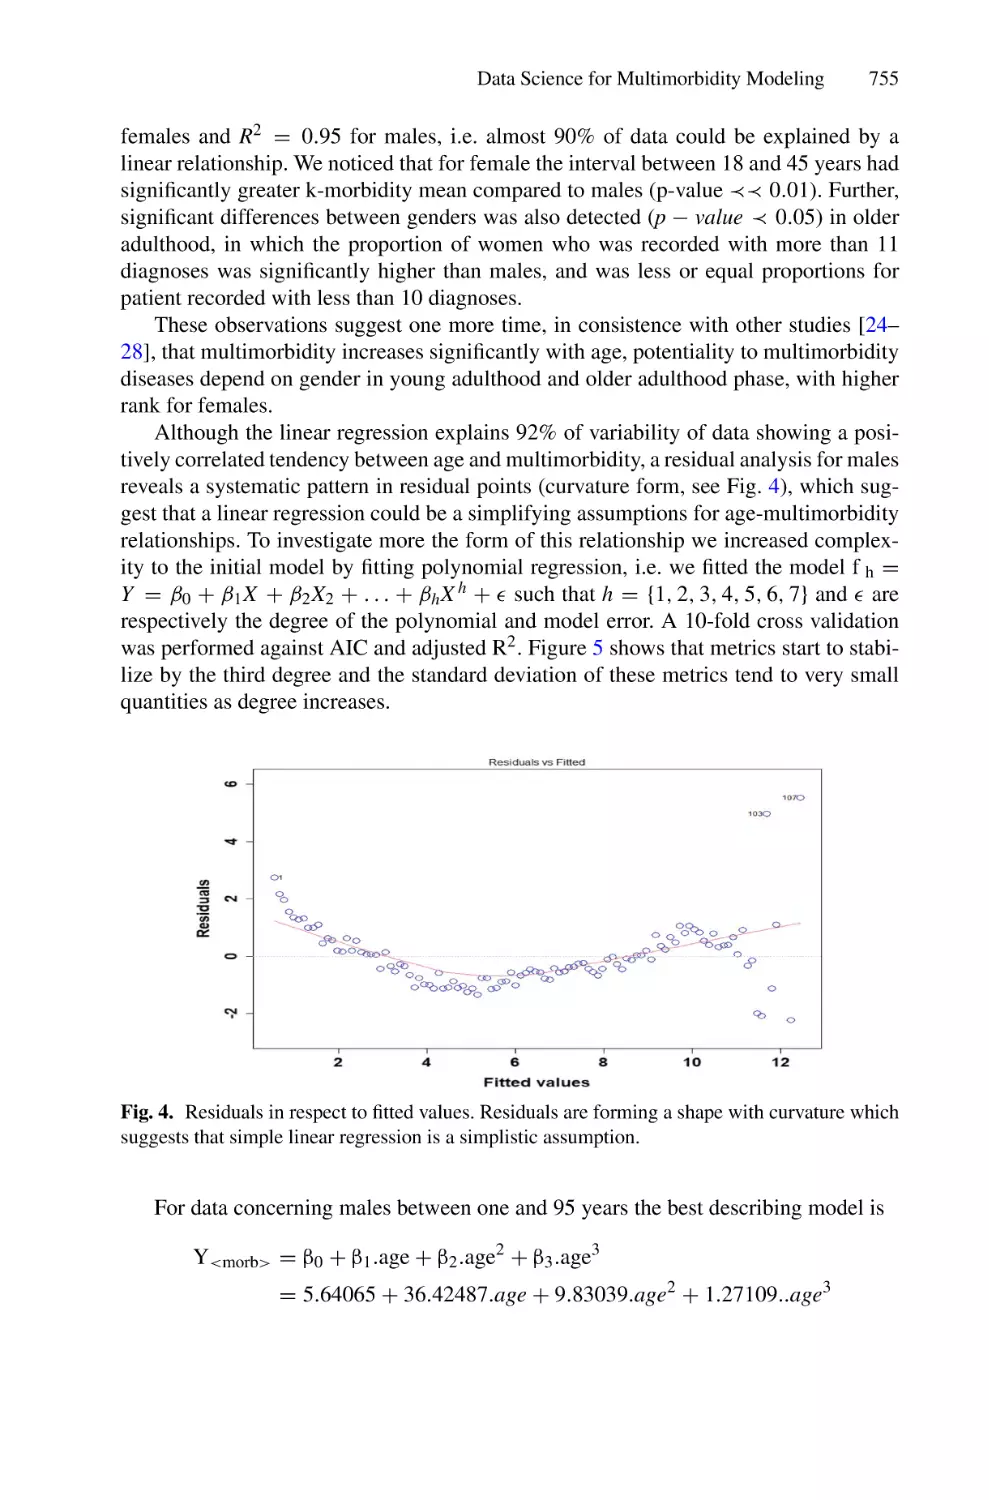
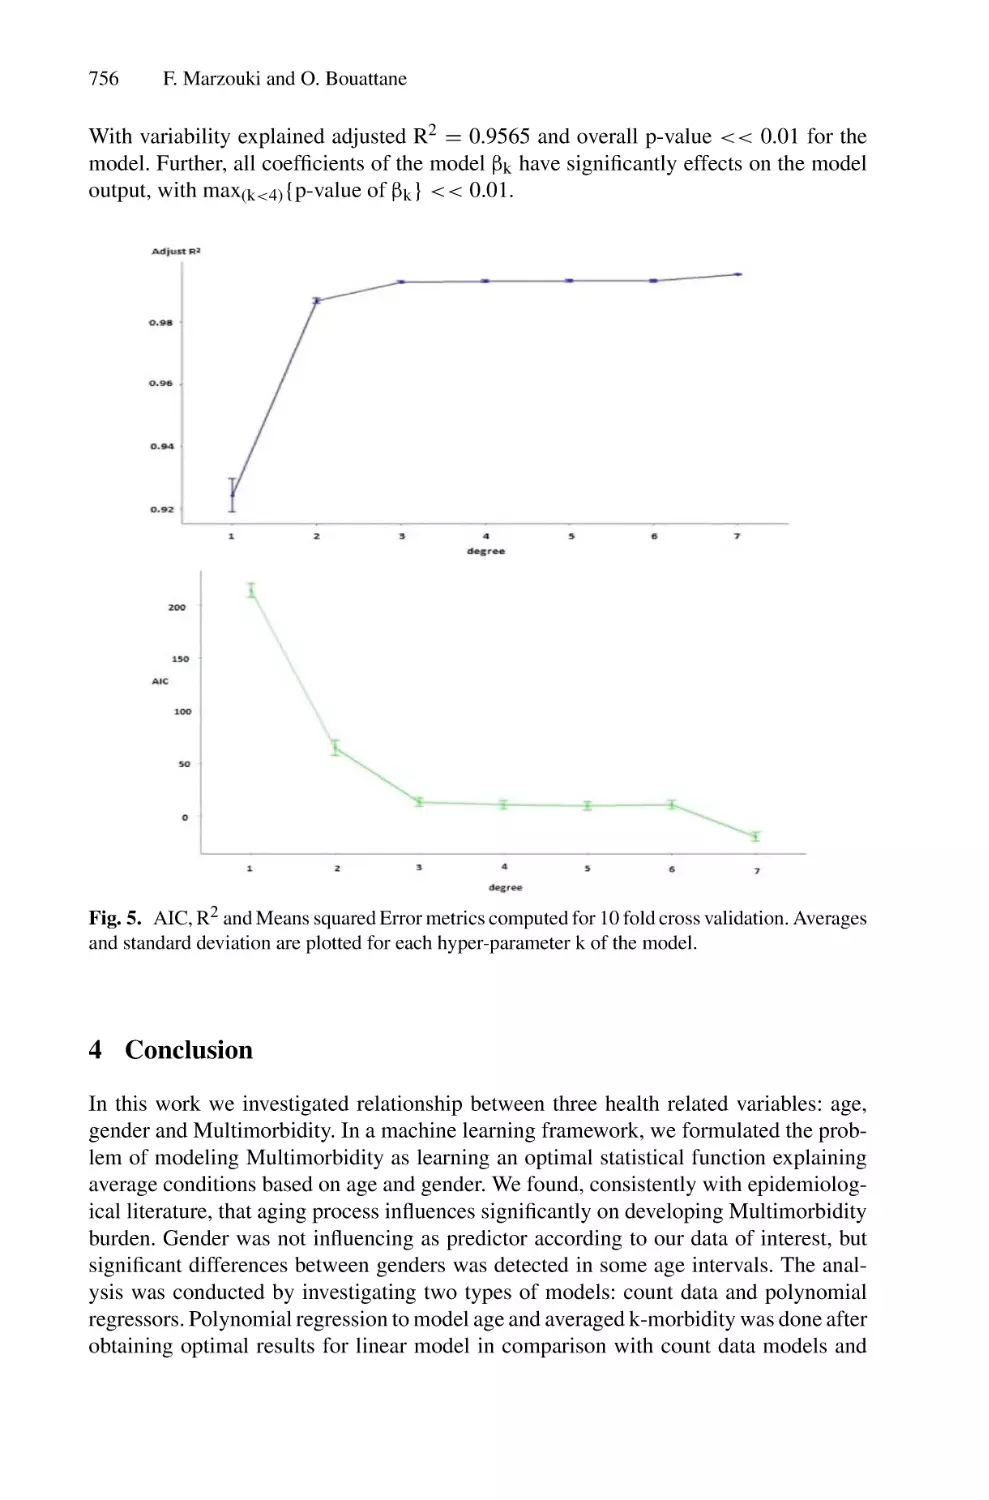
Data Science for Multimorbidity Modeling: Can Age and Sex Predict
Multimorbidity Burden? . . . . . . . . . . . . . . . . . . . . . . . . . . . . . . . . . . . . 748
Faouzi Marzouki and Omar Bouattane
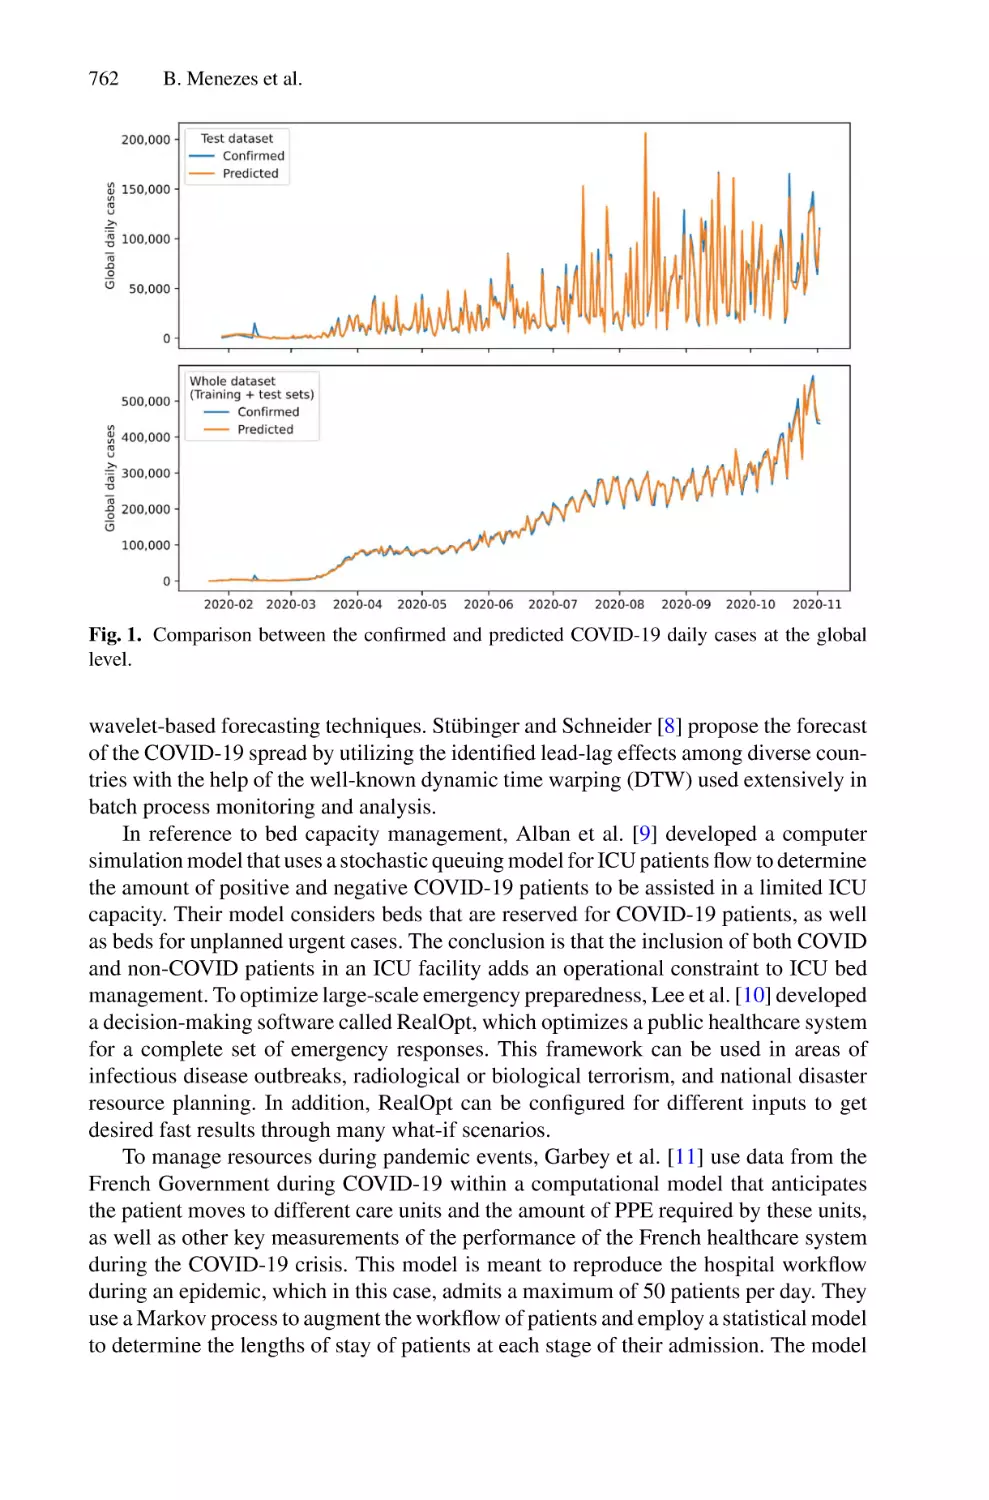
Advanced Analytics for Medical Supply Chain Resilience in
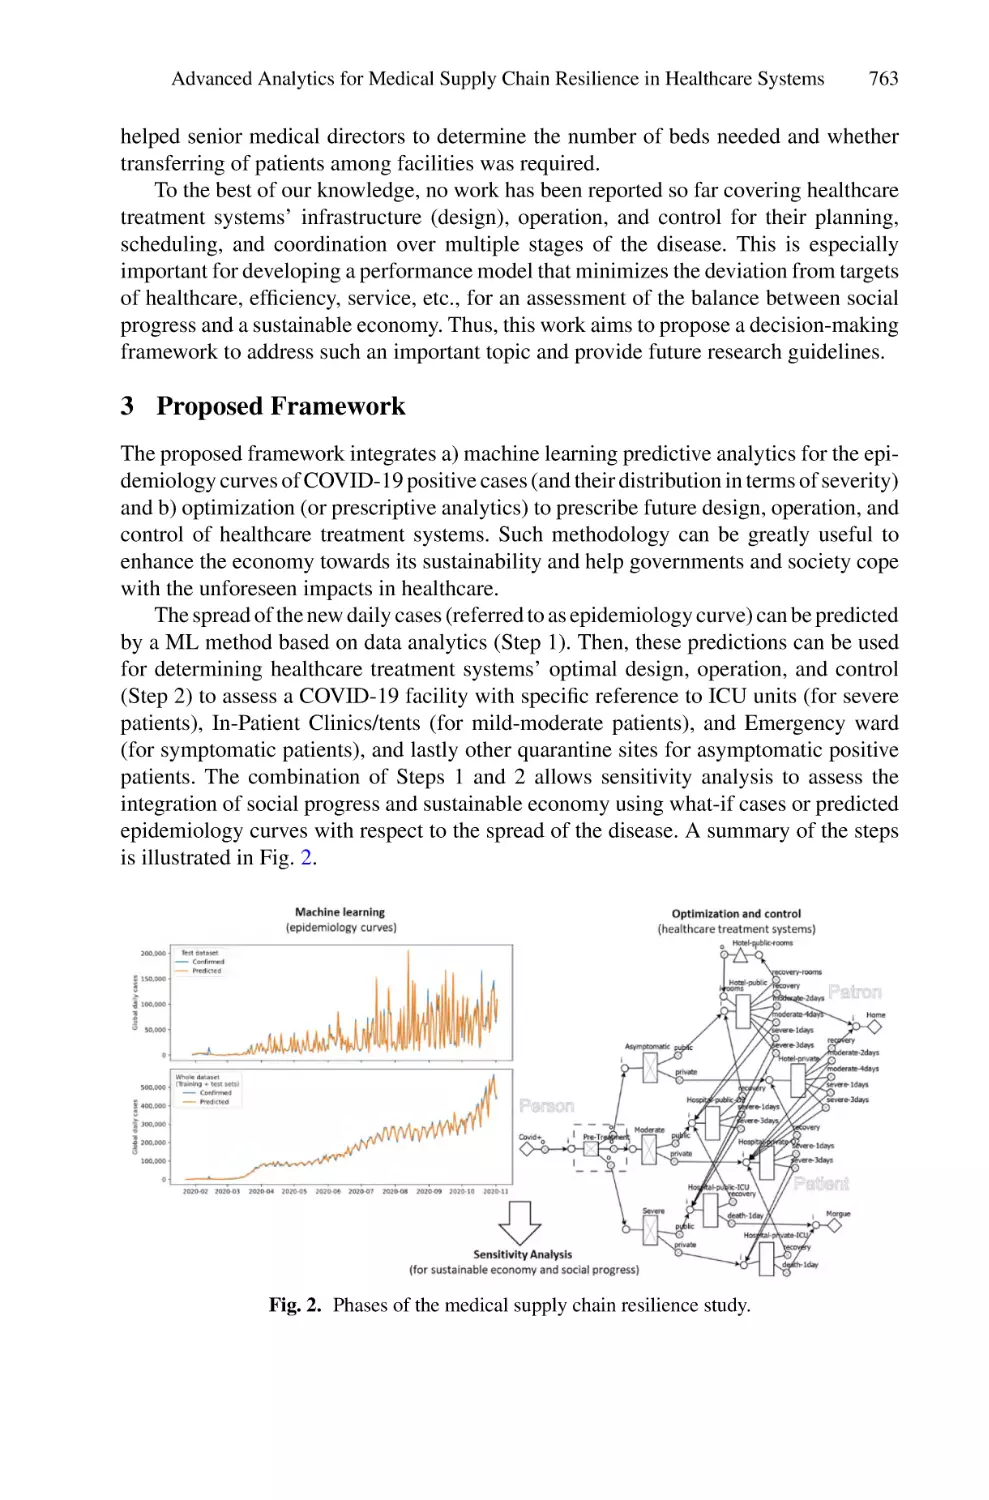
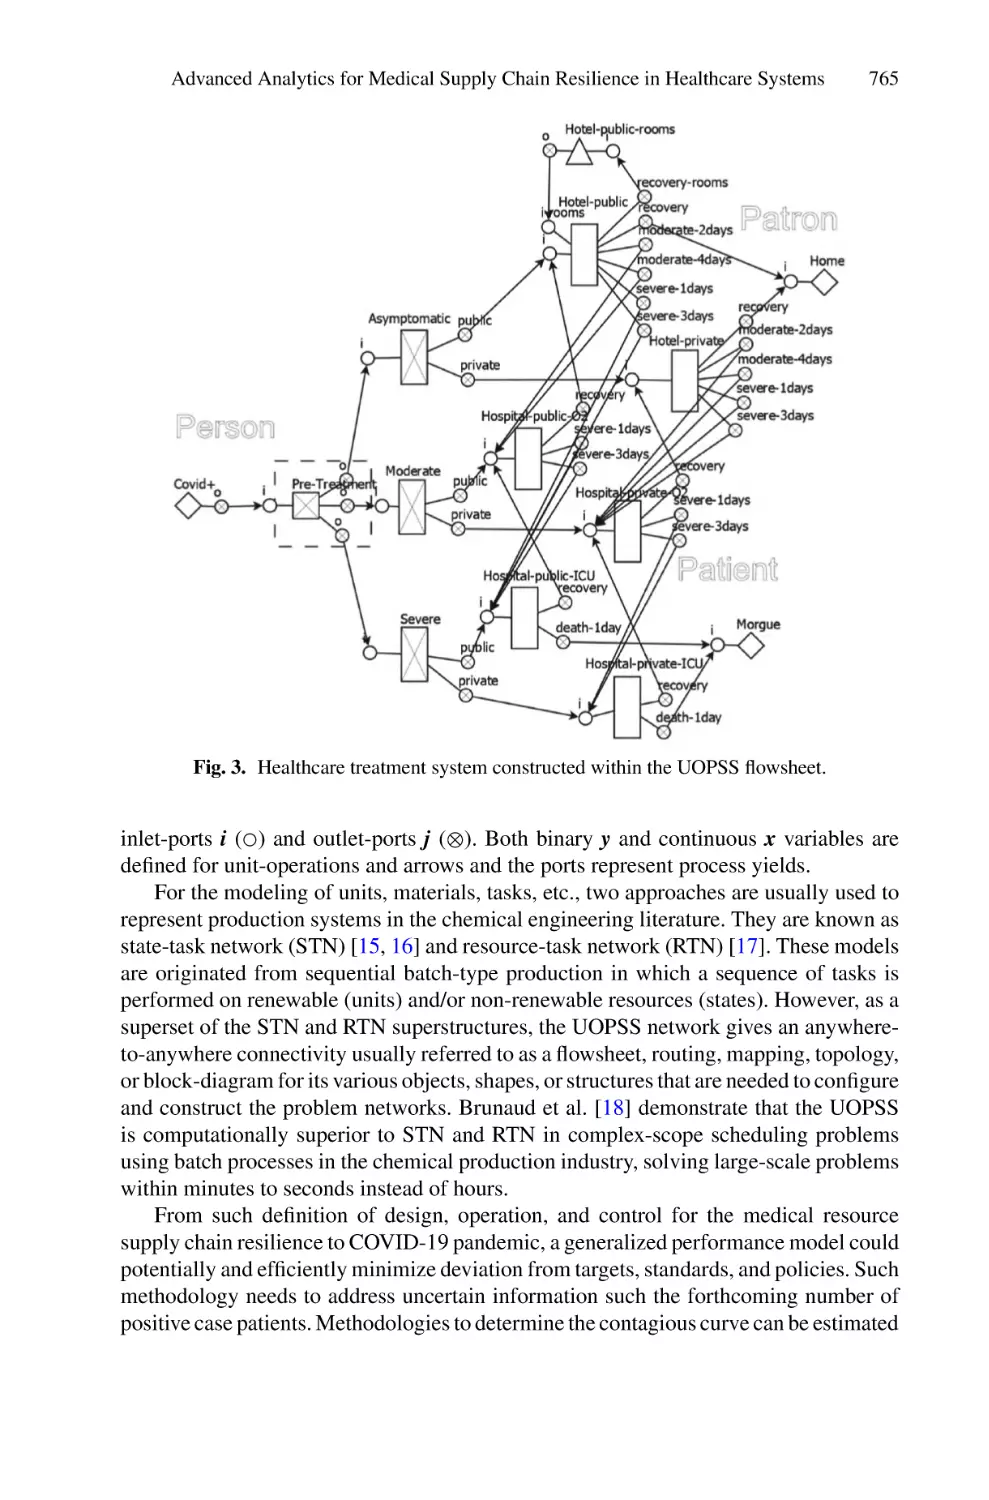
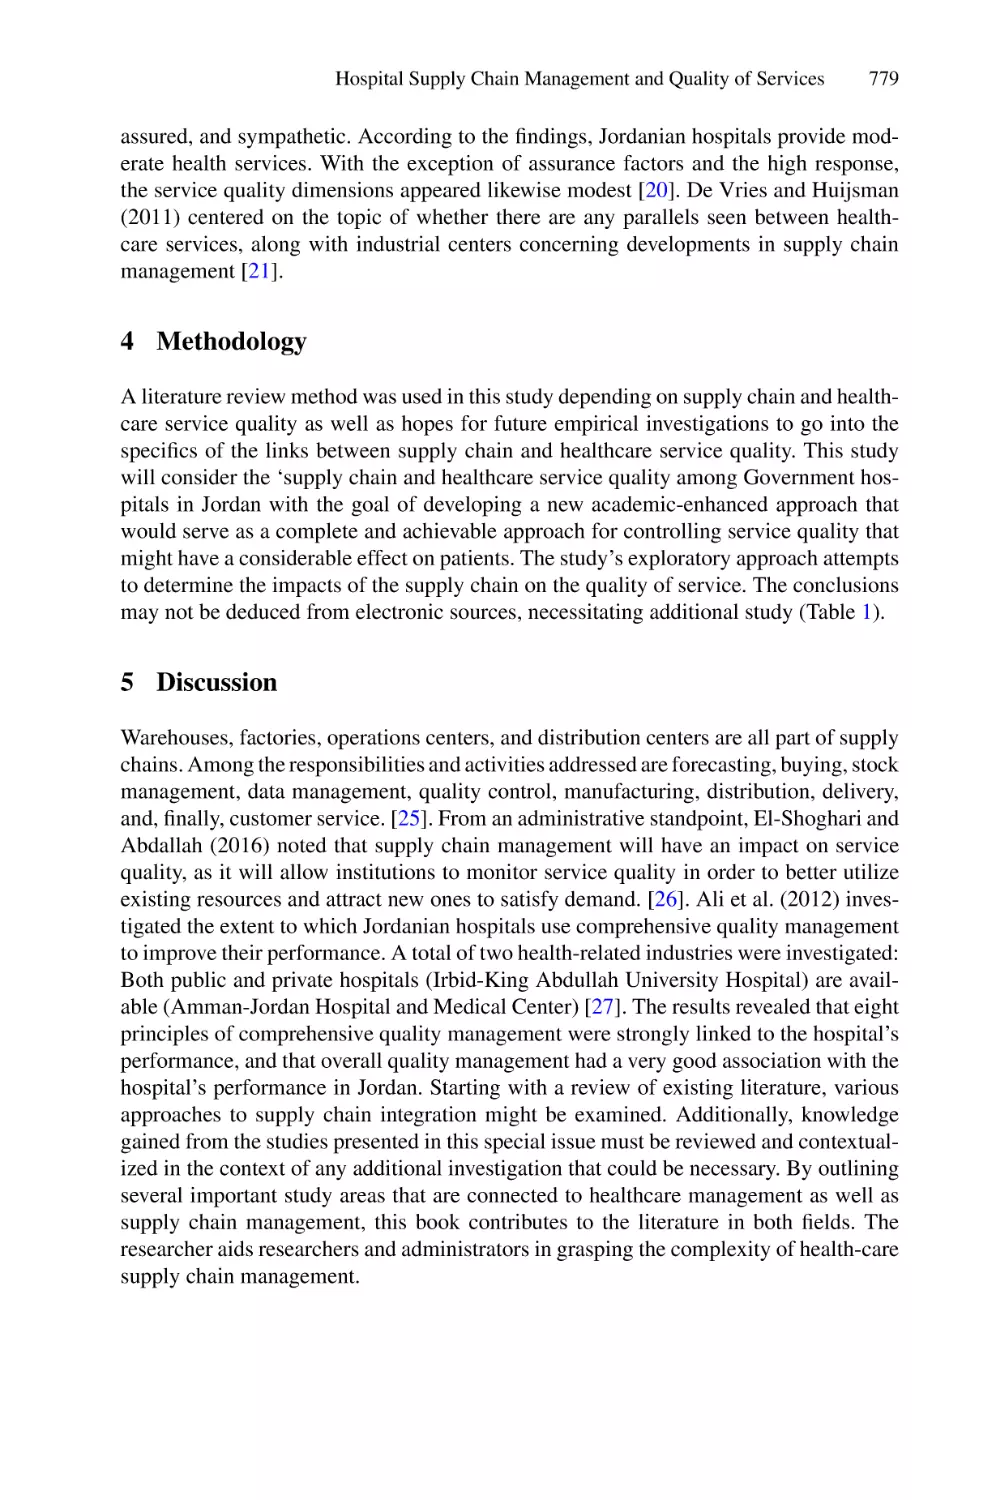
Healthcare Systems: An Infection Disease Case . . . . . . . . . . . . . . . . . . . 759
Brenno Menezes, Robert Franzoi, Mohammed Yaqot, Mohammed Sawaly,
and Antonio Sanfilippo
Application of Temporal Network on Potential Disease Transmission:
Hospital Case Study . . . . . . . . . . . . . . . . . . . . . . . . . . . . . . . . . . . . . . . . 769
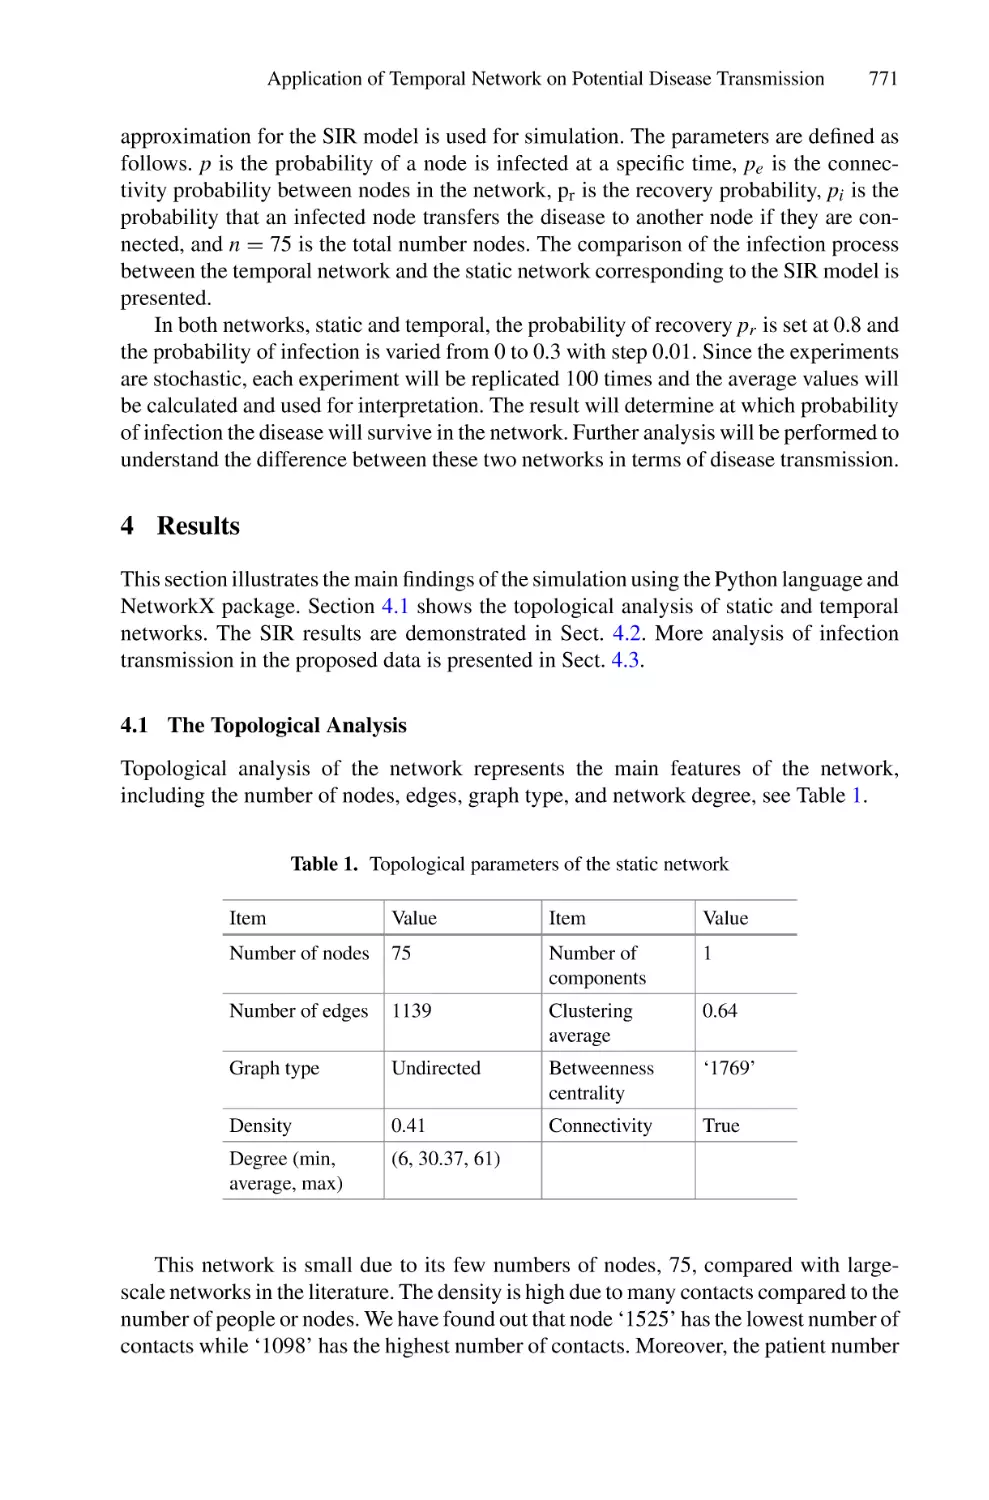
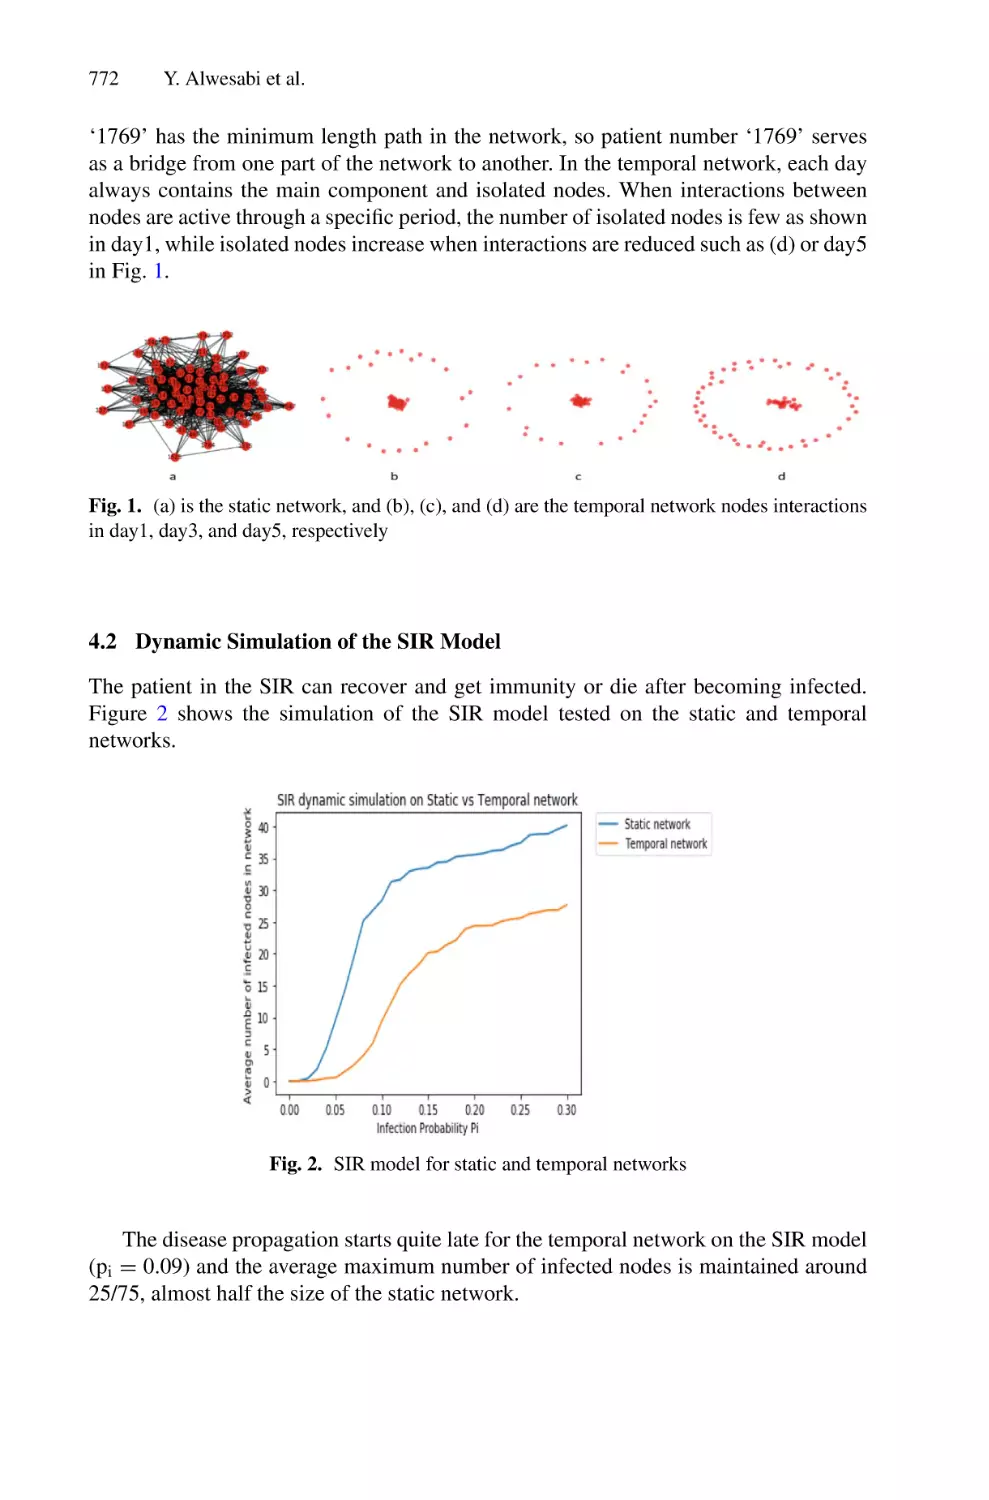
Yaseen Alwesabi, Dong Dinh, and Xilin Zhang
Hospital Supply Chain Management and Quality of Services Within
Hospitals: A Preliminary Review . . . . . . . . . . . . . . . . . . . . . . . . . . . . . . 775
Amer Alqudah, Hussein Mohammed Abualrejal, and Ezanee Elias
Author Index . . . . . . . . . . . . . . . . . . . . . . . . . . . . . . . . . . . . . . . . . . . . . . . . 785
Artificial Intelligence
Automatic Saudi Arabian License Plate
Detection and Recognition Using Deep
Convolutional Neural Networks
Maha Driss1,2(B) , Iman Almomani1 , Rahaf Al-Suhaimi3 , and Hanan Al-Harbi3
1 Security Engineering Lab, CS Department, CCIS, Prince Sultan University,
Riyadh, Saudi Arabia
maha.idriss@riadi.rnu.tn
2 RIADI Laboratory, National School of Computer Sciences, University of Manouba, Tunis,
Tunisia
3 IS Department, CCSE, Taibah University, Medina, Saudi Arabia
Abstract. Automatic License Plate (LP) detection and recognition algorithms
have become a necessity for intelligent transportation systems due to their efficiency in multiple applications such as parking control and traffic management.
Vehicle LP detection and recognition is the process of identifying and locating
the LP from the vehicle and then extracting and recognizing the characters from
this plate. Several academic studies have addressed the problem of LP detection
and recognition and have proposed implementations with different performance
indicators’ values. However, many of the current studies’ solutions are still not
robust and efficient in complex real-world situations. In this paper, an automatic
LP detection and recognition approach is proposed for the context of Saudi Arabia using Deep Learning (DL) techniques. The core of the proposed approach
is to develop a sequence of Faster Region-based Convolutional Neural Networks
(Faster-RCNN) and Convolutional Neural Networks (CNN). The Faster-RCNN
model is used for LP detection, whereas CNN is applied for characters’ recognition
from LPs. The obtained experimental results prove the robustness and effectiveness of the proposed approach. We obtained a precision of 92% for LP detection
and an accuracy of 98% for LP recognition.
Keywords: License plate · Detection · Recognition · Faster-RCNN · CNN ·
Saudi Arabia
1 Introduction
Automatic License Plate (LP) detection and recognition have become an interesting
research field since it contributes significantly to the enhancement of smart cities’ applications such as traffic flow control, stolen and criminals’ vehicles detection, enforcement
of traffic laws, and management of parking lots, etc. This topic has been largely studied and is still receiving significant attention from researchers and the industry. In the
literature, several research works have been proposed [1]. Traditional methods based
© The Author(s), under exclusive license to Springer Nature Switzerland AG 2022
F. Saeed et al. (Eds.): IRICT 2021, LNDECT 127, pp. 3–15, 2022.
https://doi.org/10.1007/978-3-030-98741-1_1
4
M. Driss et al.
on image pre-processing techniques such as object localization, character extraction,
and pattern recognition did not provide good results, especially with different image
acquisition conditions. With the technological progress made on the graphics processing unit, running high-performance computing algorithms becomes possible, and several
Machine Learning (ML) and Deep Learning (DL) models are increasingly used in image
classification applications and provide impressive results [2–5]. In the last decade, many
research studies have been conducted using DL-based methods to propose more robust
and efficient systems for LP detection and recognition.
In this paper, an efficient approach for LP detection and recognition in the context
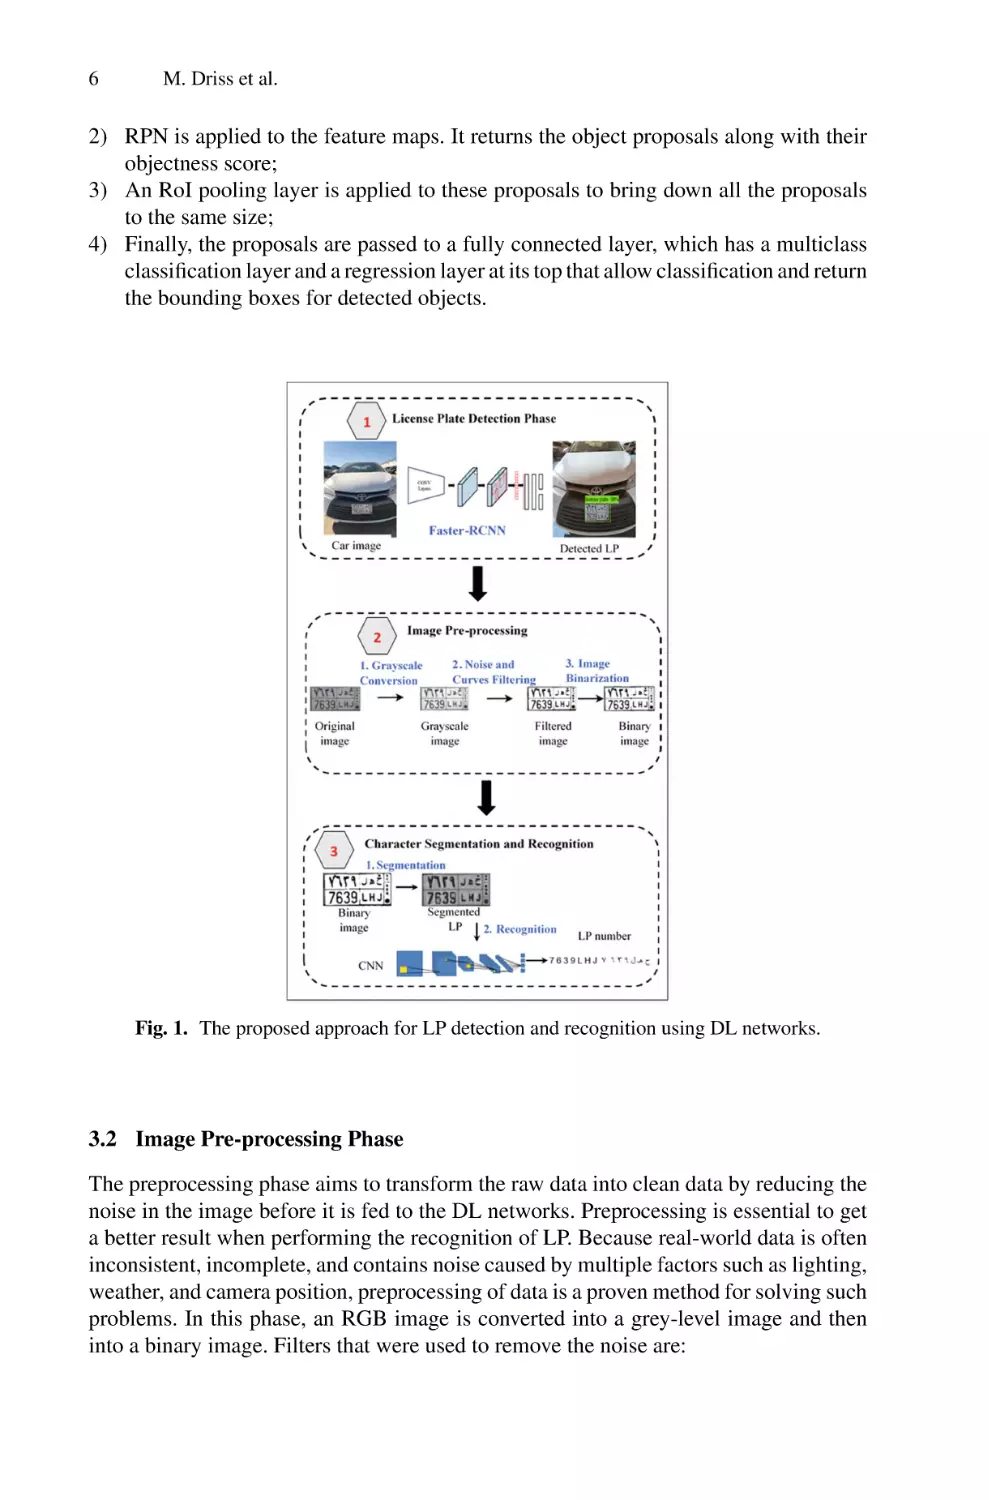
of Saudi Arabia is proposed. The proposed approach is based on three steps: 1) license
plate detection, 2) image pre-processing, and 3) character segmentation and recognition.
The main contributions of the proposed work are summarized as follows:
• To the best of the authors’ knowledge, this paper constitutes the first study that investigates the problem of LP detection and recognition for the context of Saudi Arabia
using DL techniques;
• The proposed approach is based on two DL models; the Faster-RCNN model for LP
detection and CNN for characters’ recognition from LPs;
• A new dataset is created consisting of 1150 real-world Saudi Arabian cars. The
car images were collected under various lighting and weather conditions. Besides,
the images cover different types of cars and vehicles such as pickup trucks, vans,
hatchbacks, buses, ambulances, and sports coupes cars, etc.
• Experiments that were conducted on the collected dataset showed that the proposed
approach achieved a precision of 92% for LP detection and an accuracy of 98% for
LP recognition.
This paper is organized as follows. Section 2 presents related works for LP detection and
recognition. Section 3 details the proposed approach. Implementations and experiments
are illustrated in Sect. 4. Finally, Sect. 5 concludes the paper and provides potential
future work.
2 Related Works
In the literature, a limited number of works were conducted to ensure detection and
recognition for Saudi Arabian LPs. Most of these works used image processing and
analysis techniques [6, 7]. Other works used simple neural networks to ensure either LP
detection or recognition [8, 9]. Our focus in this work is to examine research studies
that have been conducted to resolve both the detection and recognition problems of LP
using DL techniques.
In [10], Hendry and Chen used You Only Look Once (YOLO) to detect LP for
Taiwan’s car, which contains six digits. They modified the original YOLO to detect a
single class by using a sliding window. Experiments that were made under different
conditions such as rainy background, darkness, and dimness showed that the proposed
system achieved good performance results in terms of detection and recognition accuracy, average model loss, and average speed. Kessentini et al. [11] proposed a real-time
Automatic Saudi Arabian License Plate Detection and Recognition
5
LP recognition system based on two DL stages. The first stage aimed to detect LP using
full raw images by applying the YOLOv2 CNN model. The second stage recognized
LPs captured on cropped images. In this paper, two fully annotated datasets were considered and experiments carried out showed that the proposed system achieved acceptable
rates in terms of LP recognition accuracy. The authors in [12] developed a DL-based
system for automatic recognition of Brazilian LP. Montazzolli et al. used two YOLO
CNN networks to detect LP and to recognize characters within cropped LPs. The authors
introduced a method to annotate car bounding boxes. The results of experiments applied
on a Brazilian public dataset showed good performance of this approach in terms of
character segmentation and recognition accuracy. In [13], Omar et al. proposed using
semantic segmentation to split images into regions that were fed into two CNN models
for both Arabic number recognition and city determination. Omar et al. have conducted
their experiments using a new LP dataset composed of images taken in the northern
region of Iraq. Experiments showed that the proposed approach achieved acceptable
results in terms of recognition recall, precision, and F-measure scores. Laroca et al. [14]
presented an automatic LP recognition system based on a YOLO object detector. The
authors trained their model using images from different datasets. To improve training
accuracy, more than 38,000 bounding boxes were labeled. Obtained results showed that
the proposed approach achieved good performance results for LP recognition across
eight public datasets.
In this work, our purpose is to take advantage of the previous experiences to propose
enhancements of the deployed DL models to detect and efficiently recognize Saudi
Arabian LPs.
3 Proposed Approach
This paper proposes a new approach for the automatic detection and recognition of
license plates. This approach consists of 3 successive phases as shown in Fig. 1.
3.1 License Plate Detection Phase
For this phase, the input is an image of a car, and the output encloses the detected
LP. This phase is automated by applying the region-based object detector Faster-RCNN
model, which delimits the LP by surrounding it with a bounding box. Faster-RCNN is the
modified version of Fast-RCNN. The main difference between these two DL models is
that Fast-RCNN applies the selective search for generating Regions of Interest (RoI). In
contrast, Faster-RCNN applies the Region Proposal Network (RPN), which takes image
feature maps as input and produces a set of object proposals, each with an objectness
score as output. Our choice of Faster-RCNN is justified by its effectiveness in detecting
objects from images or videos, which has been proven in different applications [15, 16].
To detect LPs from car images, the network flow of the Faster-RCNN model consists of
4 successive steps as shown by Fig. 2:
1) A car image is taken as input and then transmitted to the convolutional layers, which
return the feature maps for this image;
6
M. Driss et al.
2) RPN is applied to the feature maps. It returns the object proposals along with their
objectness score;
3) An RoI pooling layer is applied to these proposals to bring down all the proposals
to the same size;
4) Finally, the proposals are passed to a fully connected layer, which has a multiclass
classification layer and a regression layer at its top that allow classification and return
the bounding boxes for detected objects.
Fig. 1. The proposed approach for LP detection and recognition using DL networks.
3.2 Image Pre-processing Phase
The preprocessing phase aims to transform the raw data into clean data by reducing the
noise in the image before it is fed to the DL networks. Preprocessing is essential to get
a better result when performing the recognition of LP. Because real-world data is often
inconsistent, incomplete, and contains noise caused by multiple factors such as lighting,
weather, and camera position, preprocessing of data is a proven method for solving such
problems. In this phase, an RGB image is converted into a grey-level image and then
into a binary image. Filters that were used to remove the noise are:
Automatic Saudi Arabian License Plate Detection and Recognition
7
Fig. 2. Network flow of Faster-RCNN-based LP detection
• RGB to grayscale conversion: the captured input image is in RGB format. The first
step of preprocessing consists of converting the RGB image into a grayscale image.
The RGB image is 24 bit, and processing it is time-consuming. Therefore, we need
to convert the color image into a grayscale image to reduce the number of colors;
• Noise and curve filtering: the input image contains different types of noise that reduce
the efficiency of detecting the LPs. This filter aims to remove noise and distortions
from the input image. The noise can happen during camera capturing and can also
result from the weather and illumination conditions. The noise and curves filtering is
performed by applying the Gaussian blur filter;
• Image binarization: by using this filter, the grayscale image is converted into a binary
image (black and white image). This transformation is useful to reduce computational
complexity.
3.3 Character Segmentation and Recognition Phase
After the preprocessing phase, a segmentation of the license plate characters is necessary
before identifying the characters. This step aims to localize the characters to facilitate
their recognition. In addition, it allows extracting any black object from the white background of the binary image. For this phase, we choose to apply the horizontal and vertical
projection profile method for character segmentation. This method uses horizontal and
vertical projection histograms. First, the horizontal histogram is used to find relevant
regions that contain characters of the LP. Then, the vertical histogram is applied to find
out a series of valley points separating characters. Finally, the image is segmented at the
resulting valley points.
After the segmentation, the last step is character recognition. There are several techniques for character recognition, such as syntactic, statistical, and neural networks-based
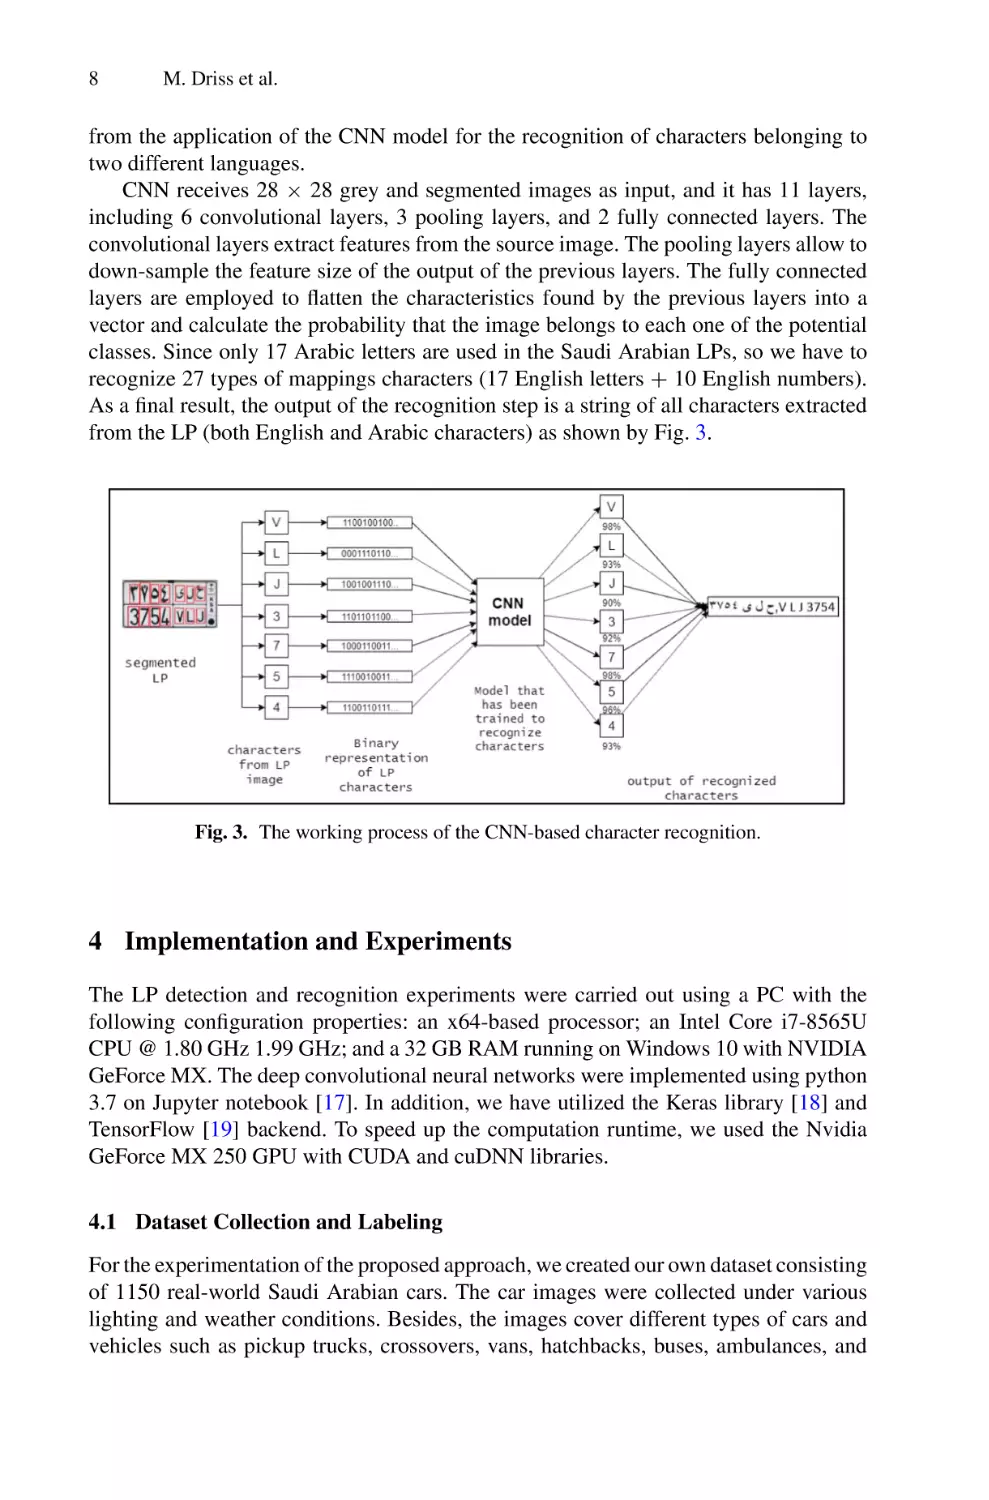
techniques. Our proposed approach is performed using the CNN DL model. CNN classifies the LP characters into several classes. For training, classes were divided into English
digits class (0 to 9), upper case letters class (A to Z), and non-letters class. The Saudi
Arabian LPs use two different languages, which are English and Arabic. In our approach,
we choose to recognize only the English numbers and letters, then we propose to apply a
character matching method to match each English character with its corresponding Arabic character, and this for the purpose to reduce the computational complexity resulting
8
M. Driss et al.
from the application of the CNN model for the recognition of characters belonging to
two different languages.
CNN receives 28 × 28 grey and segmented images as input, and it has 11 layers,
including 6 convolutional layers, 3 pooling layers, and 2 fully connected layers. The
convolutional layers extract features from the source image. The pooling layers allow to
down-sample the feature size of the output of the previous layers. The fully connected
layers are employed to flatten the characteristics found by the previous layers into a
vector and calculate the probability that the image belongs to each one of the potential
classes. Since only 17 Arabic letters are used in the Saudi Arabian LPs, so we have to
recognize 27 types of mappings characters (17 English letters + 10 English numbers).
As a final result, the output of the recognition step is a string of all characters extracted
from the LP (both English and Arabic characters) as shown by Fig. 3.
Fig. 3. The working process of the CNN-based character recognition.
4 Implementation and Experiments
The LP detection and recognition experiments were carried out using a PC with the
following configuration properties: an x64-based processor; an Intel Core i7-8565U
CPU @ 1.80 GHz 1.99 GHz; and a 32 GB RAM running on Windows 10 with NVIDIA
GeForce MX. The deep convolutional neural networks were implemented using python
3.7 on Jupyter notebook [17]. In addition, we have utilized the Keras library [18] and
TensorFlow [19] backend. To speed up the computation runtime, we used the Nvidia
GeForce MX 250 GPU with CUDA and cuDNN libraries.
4.1 Dataset Collection and Labeling
For the experimentation of the proposed approach, we created our own dataset consisting
of 1150 real-world Saudi Arabian cars. The car images were collected under various
lighting and weather conditions. Besides, the images cover different types of cars and
vehicles such as pickup trucks, crossovers, vans, hatchbacks, buses, ambulances, and
Automatic Saudi Arabian License Plate Detection and Recognition
9
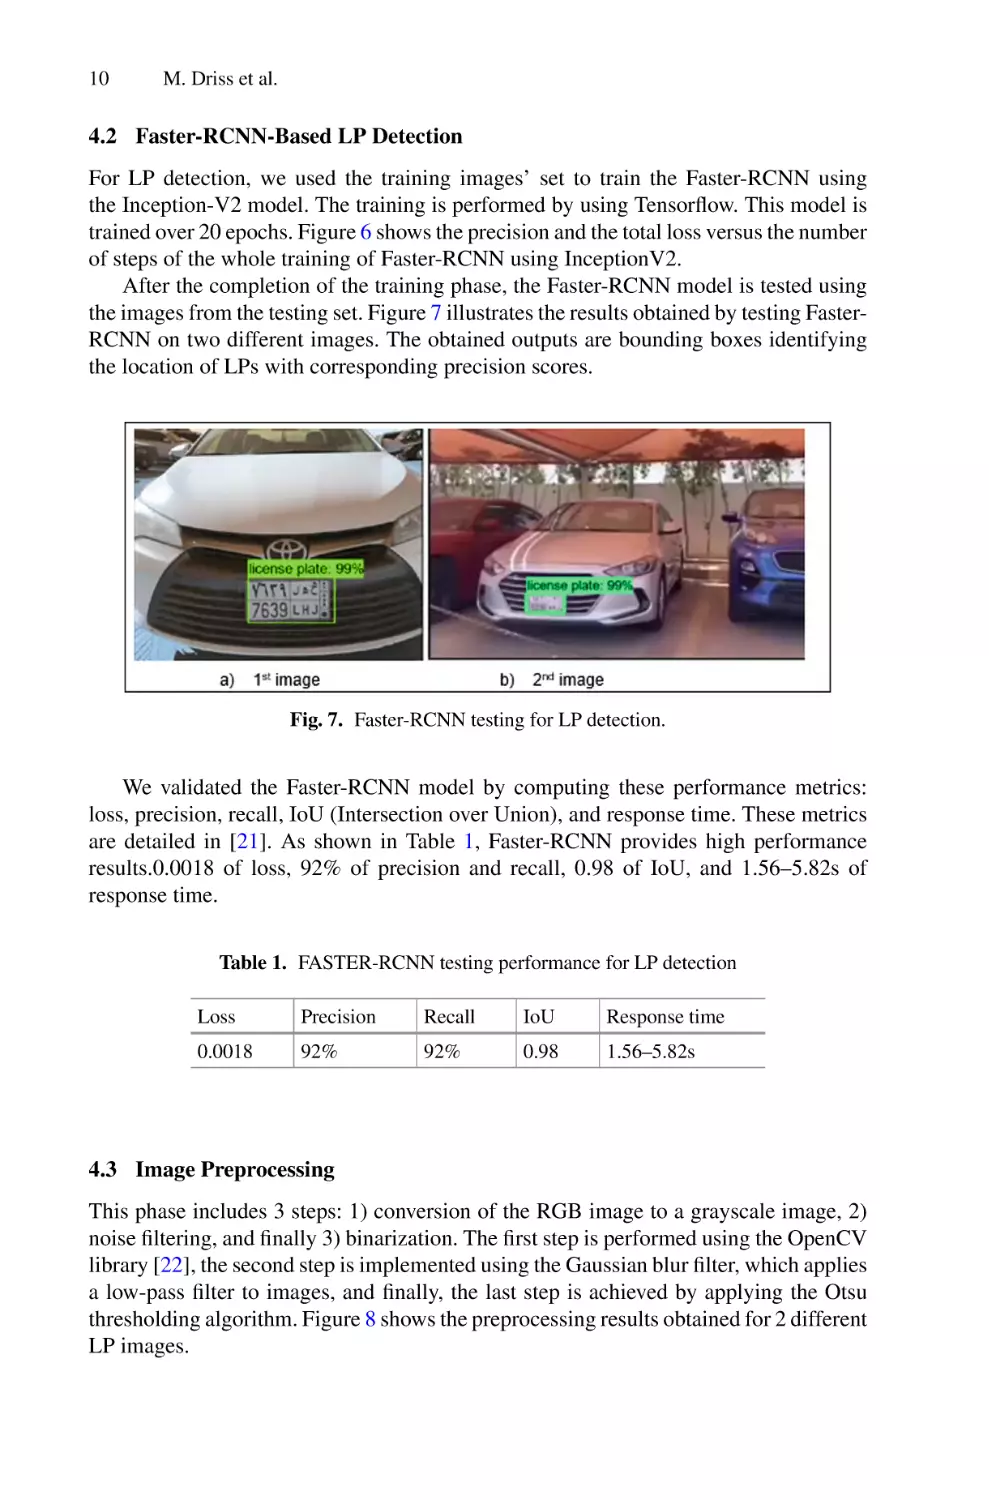
sports cars, etc. We used 80% of this dataset for deep convolutional neural networks’
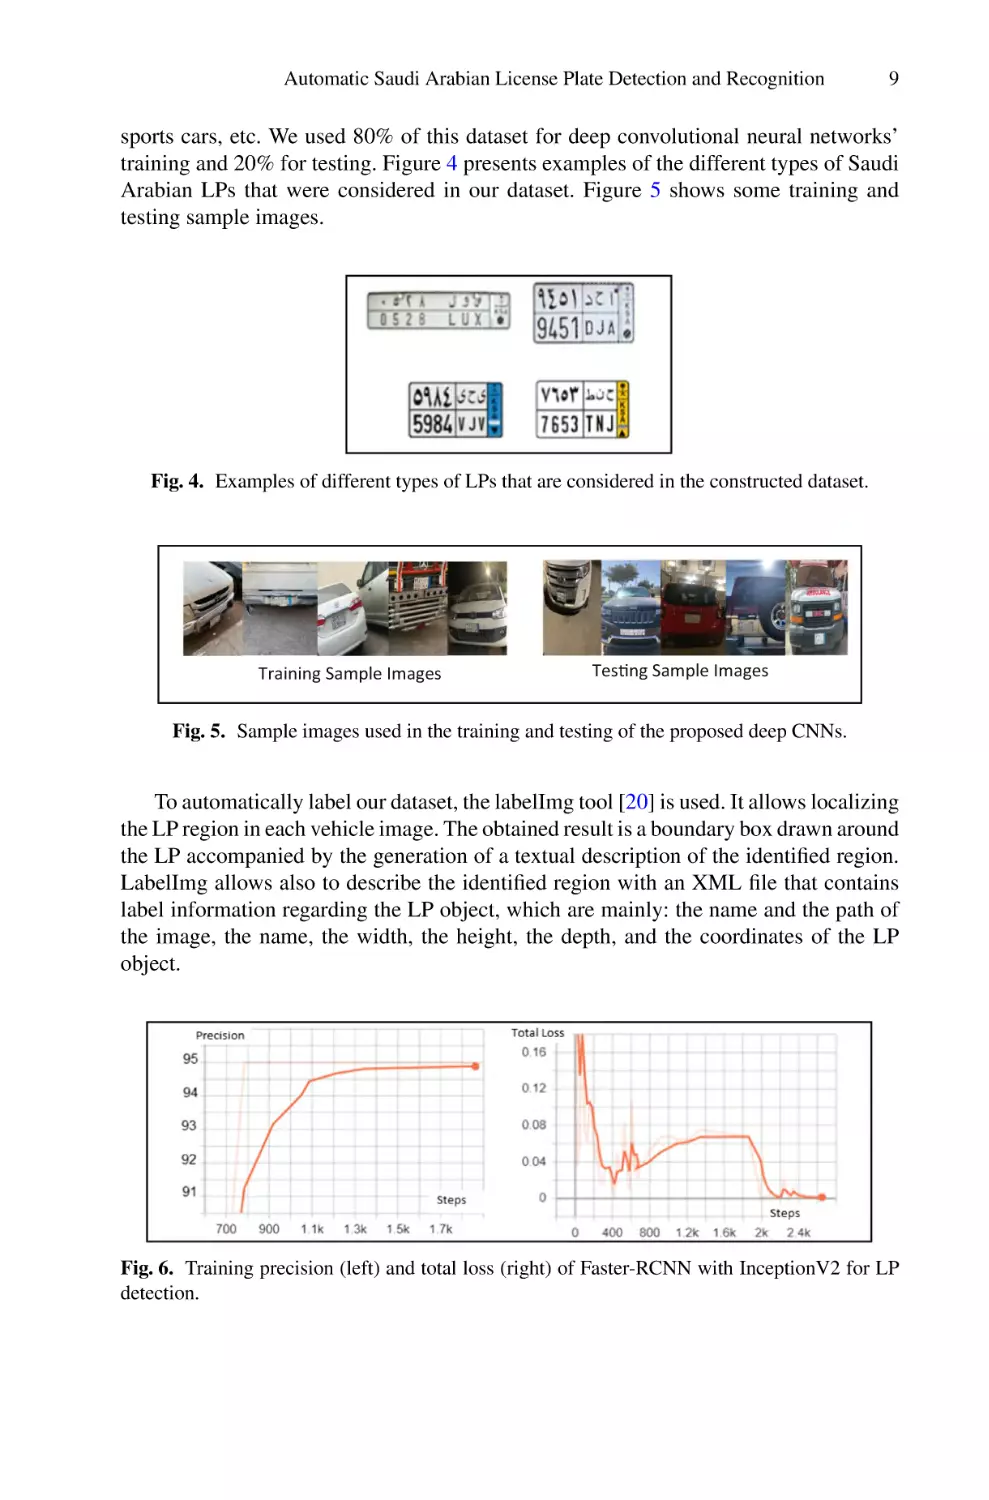
training and 20% for testing. Figure 4 presents examples of the different types of Saudi
Arabian LPs that were considered in our dataset. Figure 5 shows some training and
testing sample images.
Fig. 4. Examples of different types of LPs that are considered in the constructed dataset.
Training Sample Images
TesƟng Sample Images
Fig. 5. Sample images used in the training and testing of the proposed deep CNNs.
To automatically label our dataset, the labelImg tool [20] is used. It allows localizing
the LP region in each vehicle image. The obtained result is a boundary box drawn around
the LP accompanied by the generation of a textual description of the identified region.
LabelImg allows also to describe the identified region with an XML file that contains
label information regarding the LP object, which are mainly: the name and the path of
the image, the name, the width, the height, the depth, and the coordinates of the LP
object.
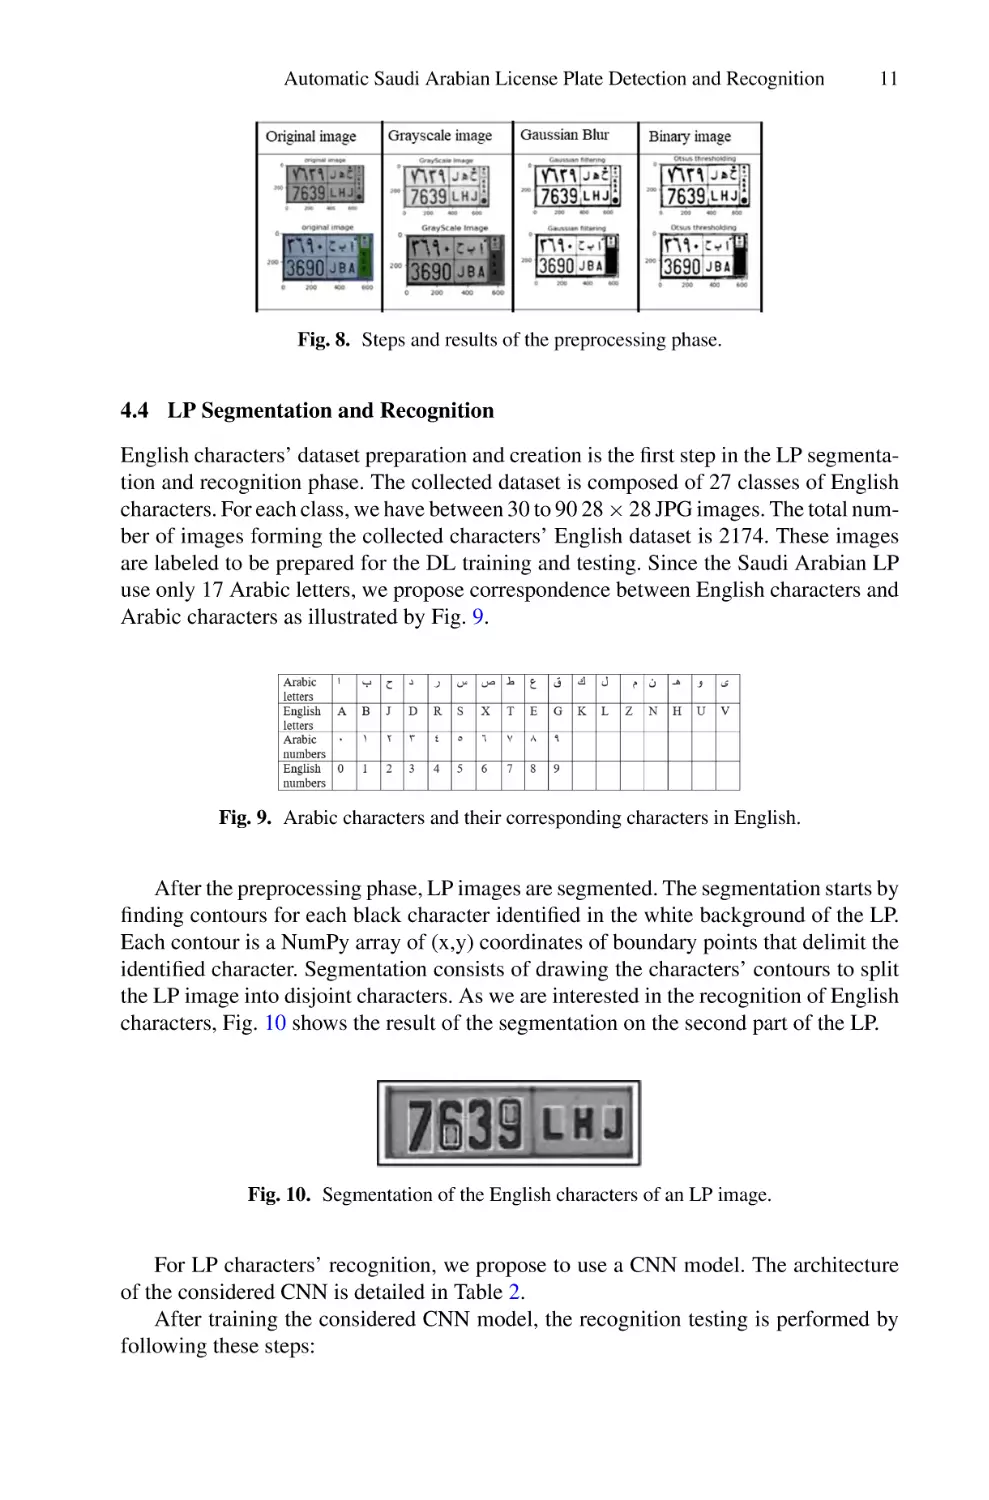
Fig. 6. Training precision (left) and total loss (right) of Faster-RCNN with InceptionV2 for LP
detection.
10
M. Driss et al.
4.2 Faster-RCNN-Based LP Detection
For LP detection, we used the training images’ set to train the Faster-RCNN using
the Inception-V2 model. The training is performed by using Tensorflow. This model is
trained over 20 epochs. Figure 6 shows the precision and the total loss versus the number
of steps of the whole training of Faster-RCNN using InceptionV2.
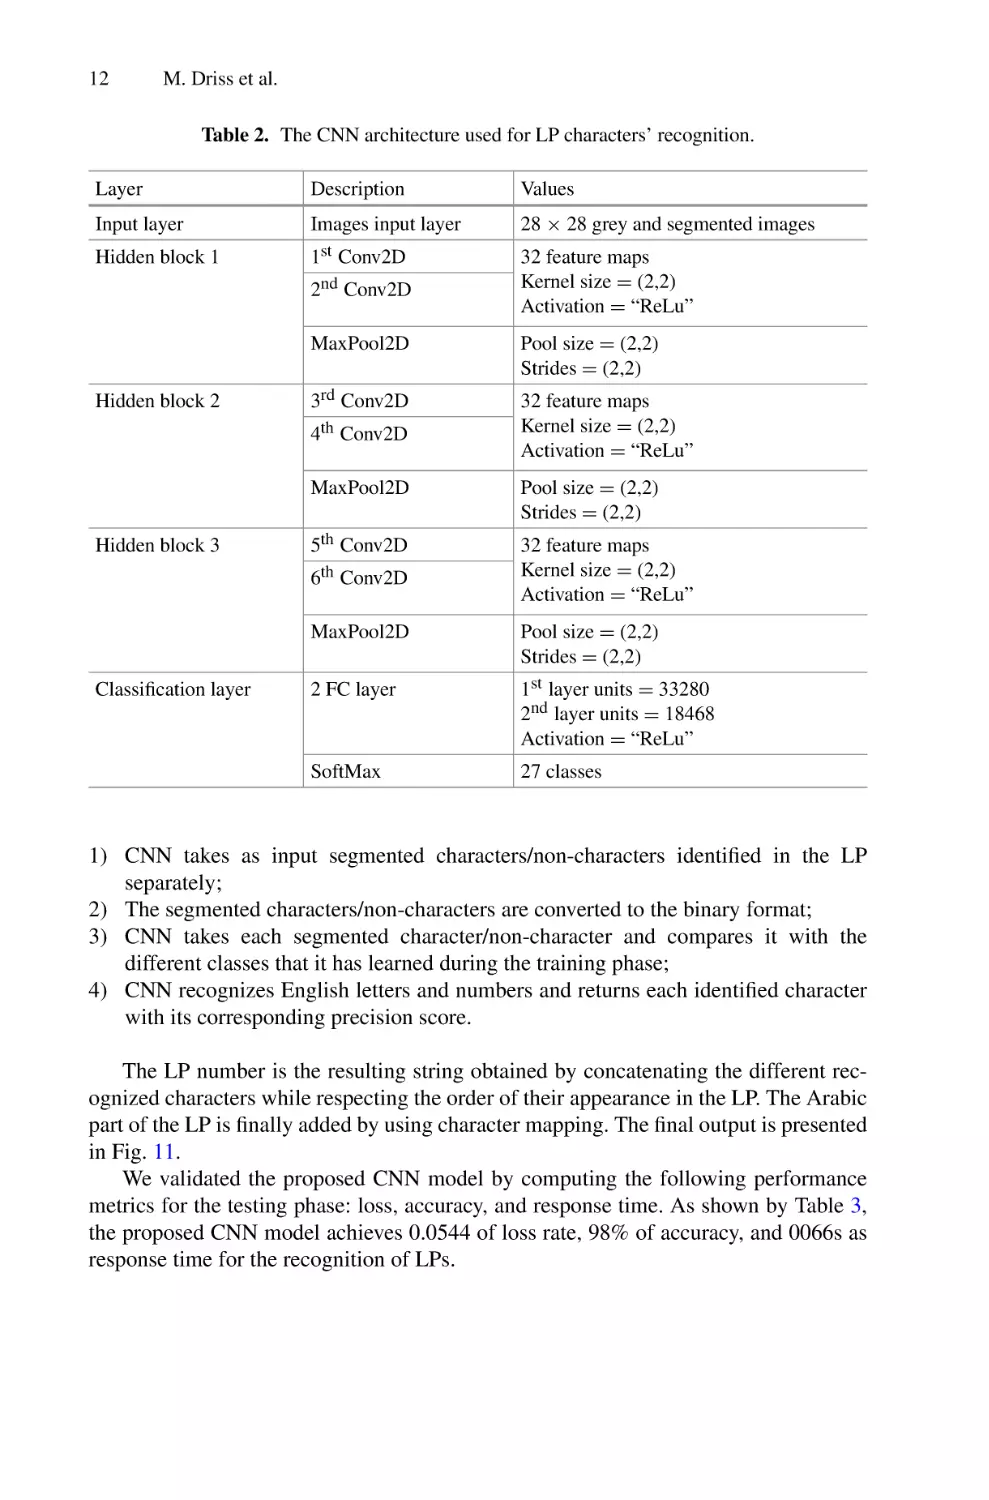
After the completion of the training phase, the Faster-RCNN model is tested using
the images from the testing set. Figure 7 illustrates the results obtained by testing FasterRCNN on two different images. The obtained outputs are bounding boxes identifying
the location of LPs with corresponding precision scores.
Fig. 7. Faster-RCNN testing for LP detection.
We validated the Faster-RCNN model by computing these performance metrics:
loss, precision, recall, IoU (Intersection over Union), and response time. These metrics
are detailed in [21]. As shown in Table 1, Faster-RCNN provides high performance
results.0.0018 of loss, 92% of precision and recall, 0.98 of IoU, and 1.56–5.82s of
response time.
Table 1. FASTER-RCNN testing performance for LP detection
Loss
Precision
Recall
IoU
Response time
0.0018
92%
92%
0.98
1.56–5.82s
4.3 Image Preprocessing
This phase includes 3 steps: 1) conversion of the RGB image to a grayscale image, 2)
noise filtering, and finally 3) binarization. The first step is performed using the OpenCV
library [22], the second step is implemented using the Gaussian blur filter, which applies
a low-pass filter to images, and finally, the last step is achieved by applying the Otsu
thresholding algorithm. Figure 8 shows the preprocessing results obtained for 2 different
LP images.
Automatic Saudi Arabian License Plate Detection and Recognition
11
Fig. 8. Steps and results of the preprocessing phase.
4.4 LP Segmentation and Recognition
English characters’ dataset preparation and creation is the first step in the LP segmentation and recognition phase. The collected dataset is composed of 27 classes of English
characters. For each class, we have between 30 to 90 28 × 28 JPG images. The total number of images forming the collected characters’ English dataset is 2174. These images
are labeled to be prepared for the DL training and testing. Since the Saudi Arabian LP
use only 17 Arabic letters, we propose correspondence between English characters and
Arabic characters as illustrated by Fig. 9.
Fig. 9. Arabic characters and their corresponding characters in English.
After the preprocessing phase, LP images are segmented. The segmentation starts by
finding contours for each black character identified in the white background of the LP.
Each contour is a NumPy array of (x,y) coordinates of boundary points that delimit the
identified character. Segmentation consists of drawing the characters’ contours to split
the LP image into disjoint characters. As we are interested in the recognition of English
characters, Fig. 10 shows the result of the segmentation on the second part of the LP.
Fig. 10. Segmentation of the English characters of an LP image.
For LP characters’ recognition, we propose to use a CNN model. The architecture
of the considered CNN is detailed in Table 2.
After training the considered CNN model, the recognition testing is performed by
following these steps:
12
M. Driss et al.
Table 2. The CNN architecture used for LP characters’ recognition.
Layer
Description
Values
Input layer
Images input layer
28 × 28 grey and segmented images
Hidden block 1
1st Conv2D
2nd Conv2D
32 feature maps
Kernel size = (2,2)
Activation = “ReLu”
MaxPool2D
Pool size = (2,2)
Strides = (2,2)
3rd Conv2D
32 feature maps
Kernel size = (2,2)
Activation = “ReLu”
Hidden block 2
4th Conv2D
Hidden block 3
MaxPool2D
Pool size = (2,2)
Strides = (2,2)
5th Conv2D
32 feature maps
Kernel size = (2,2)
Activation = “ReLu”
6th Conv2D
Classification layer
MaxPool2D
Pool size = (2,2)
Strides = (2,2)
2 FC layer
1st layer units = 33280
2nd layer units = 18468
Activation = “ReLu”
SoftMax
27 classes
1) CNN takes as input segmented characters/non-characters identified in the LP
separately;
2) The segmented characters/non-characters are converted to the binary format;
3) CNN takes each segmented character/non-character and compares it with the
different classes that it has learned during the training phase;
4) CNN recognizes English letters and numbers and returns each identified character
with its corresponding precision score.
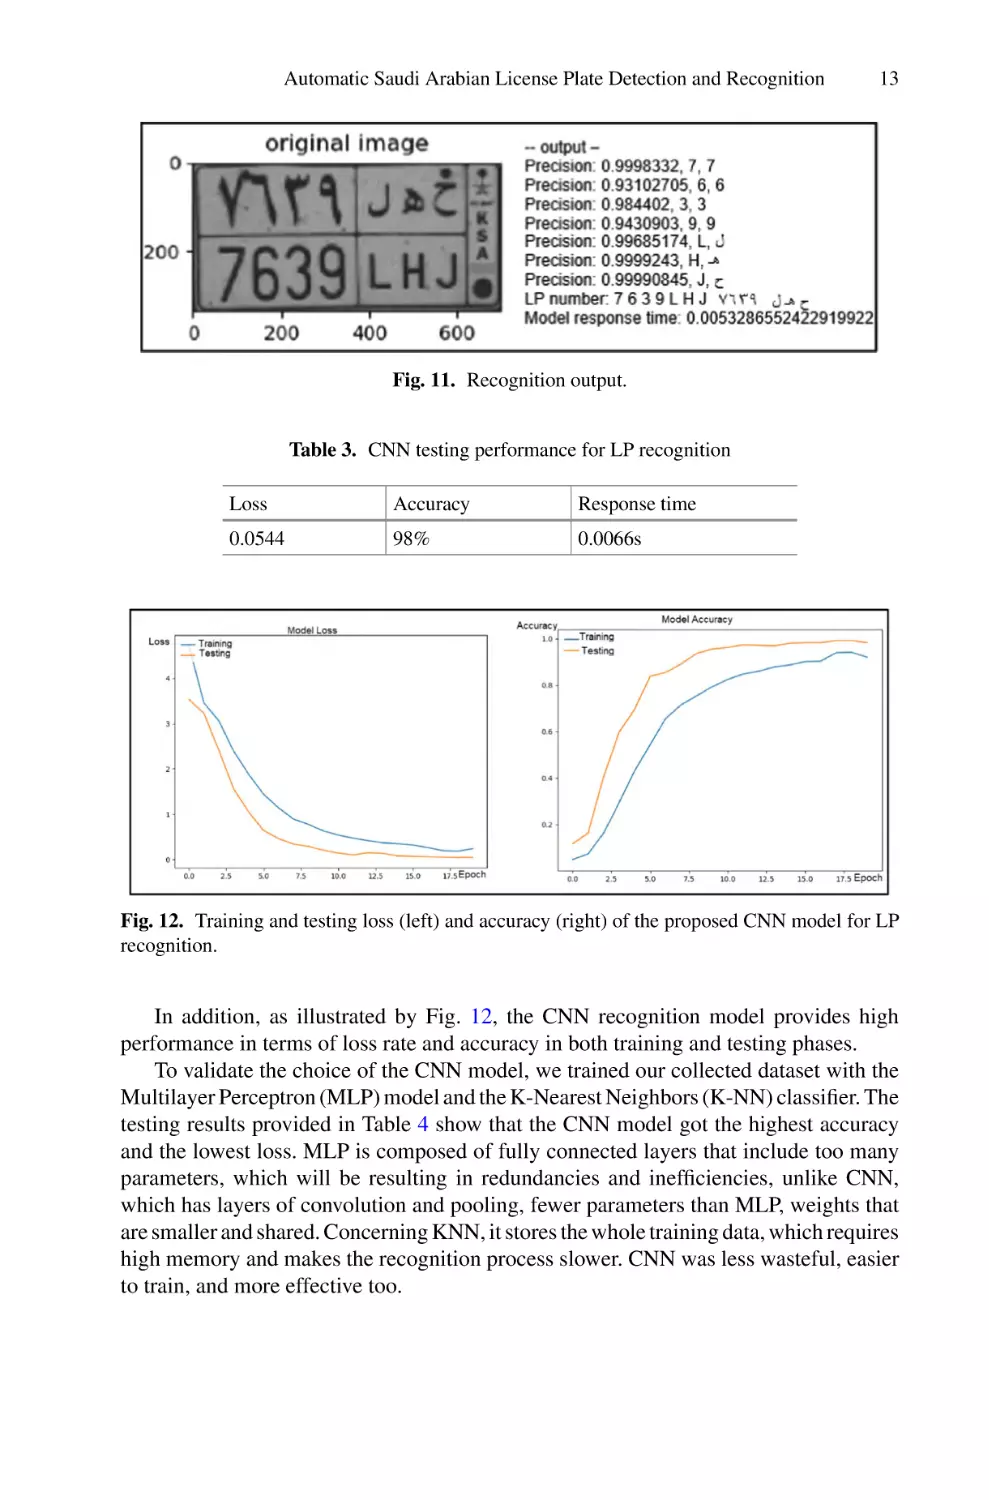
The LP number is the resulting string obtained by concatenating the different recognized characters while respecting the order of their appearance in the LP. The Arabic
part of the LP is finally added by using character mapping. The final output is presented
in Fig. 11.
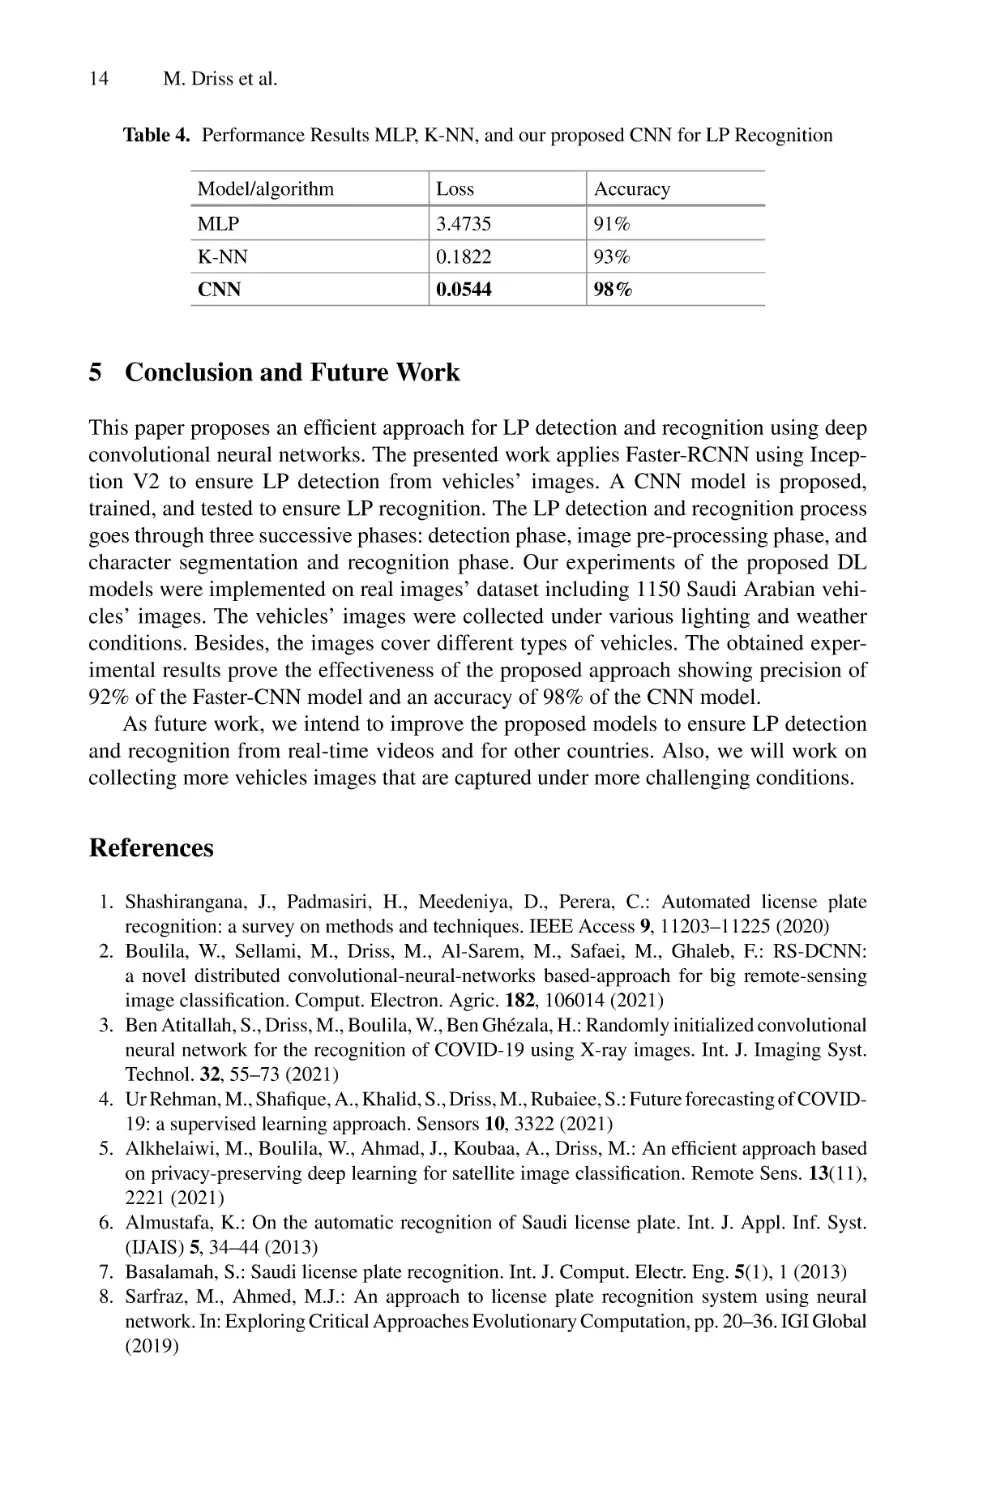
We validated the proposed CNN model by computing the following performance
metrics for the testing phase: loss, accuracy, and response time. As shown by Table 3,
the proposed CNN model achieves 0.0544 of loss rate, 98% of accuracy, and 0066s as
response time for the recognition of LPs.
Automatic Saudi Arabian License Plate Detection and Recognition
13
Fig. 11. Recognition output.
Table 3. CNN testing performance for LP recognition
Loss
Accuracy
Response time
0.0544
98%
0.0066s
Fig. 12. Training and testing loss (left) and accuracy (right) of the proposed CNN model for LP
recognition.
In addition, as illustrated by Fig. 12, the CNN recognition model provides high
performance in terms of loss rate and accuracy in both training and testing phases.
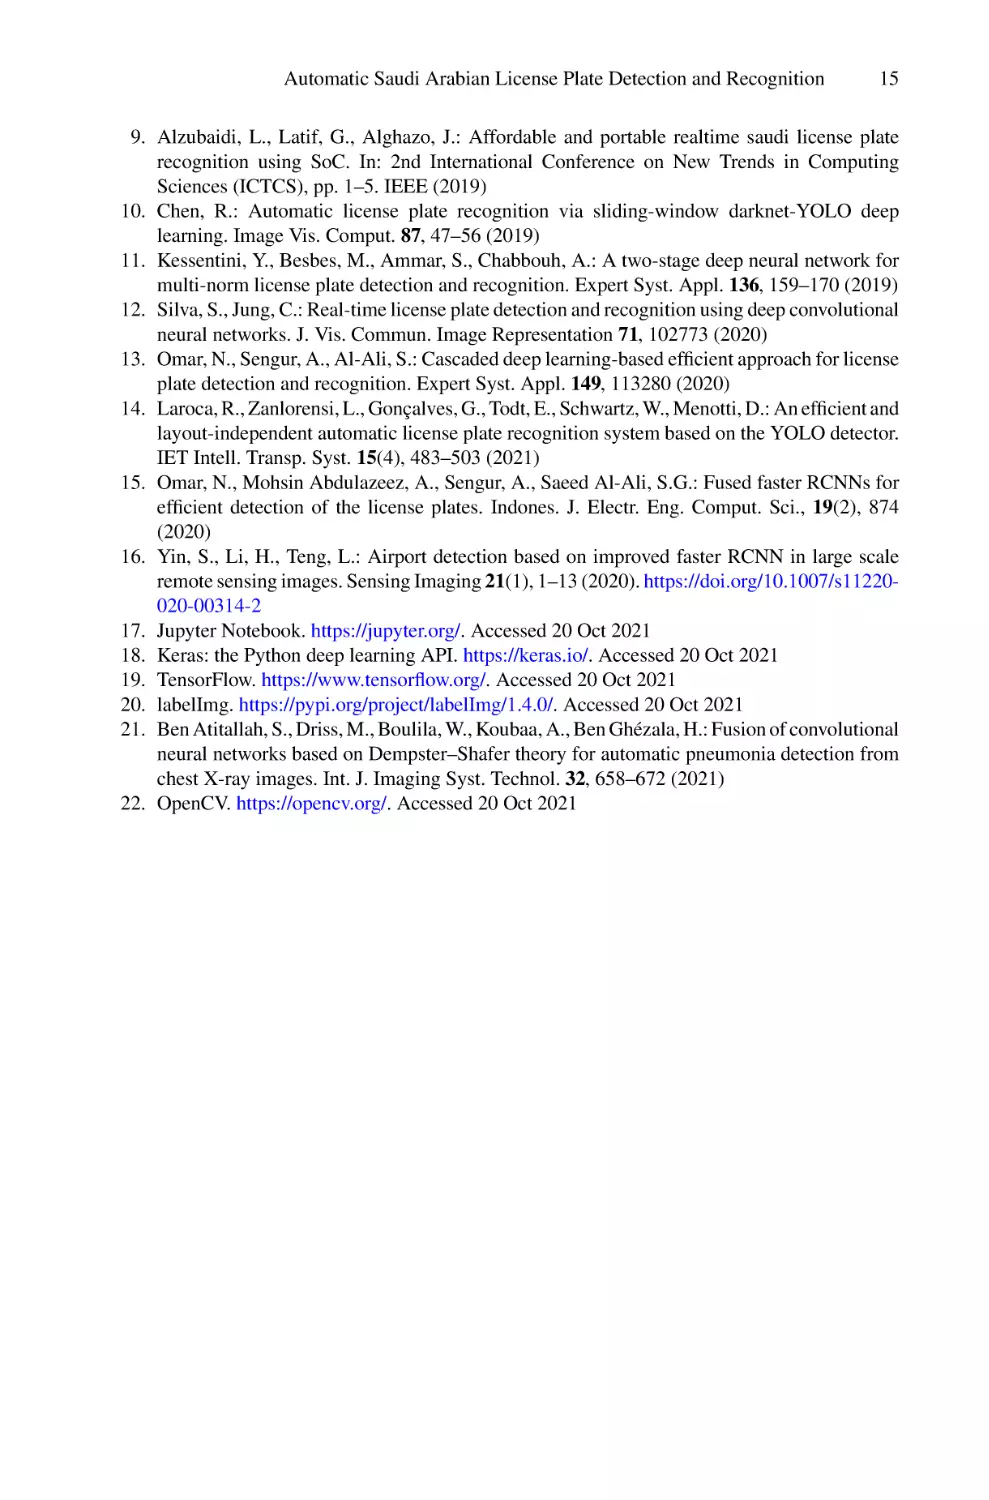
To validate the choice of the CNN model, we trained our collected dataset with the
Multilayer Perceptron (MLP) model and the K-Nearest Neighbors (K-NN) classifier. The
testing results provided in Table 4 show that the CNN model got the highest accuracy
and the lowest loss. MLP is composed of fully connected layers that include too many
parameters, which will be resulting in redundancies and inefficiencies, unlike CNN,
which has layers of convolution and pooling, fewer parameters than MLP, weights that
are smaller and shared. Concerning KNN, it stores the whole training data, which requires
high memory and makes the recognition process slower. CNN was less wasteful, easier
to train, and more effective too.
14
M. Driss et al.
Table 4. Performance Results MLP, K-NN, and our proposed CNN for LP Recognition
Model/algorithm
Loss
Accuracy
MLP
3.4735
91%
K-NN
0.1822
93%
CNN
0.0544
98%
5 Conclusion and Future Work
This paper proposes an efficient approach for LP detection and recognition using deep
convolutional neural networks. The presented work applies Faster-RCNN using Inception V2 to ensure LP detection from vehicles’ images. A CNN model is proposed,
trained, and tested to ensure LP recognition. The LP detection and recognition process
goes through three successive phases: detection phase, image pre-processing phase, and
character segmentation and recognition phase. Our experiments of the proposed DL
models were implemented on real images’ dataset including 1150 Saudi Arabian vehicles’ images. The vehicles’ images were collected under various lighting and weather
conditions. Besides, the images cover different types of vehicles. The obtained experimental results prove the effectiveness of the proposed approach showing precision of
92% of the Faster-CNN model and an accuracy of 98% of the CNN model.
As future work, we intend to improve the proposed models to ensure LP detection
and recognition from real-time videos and for other countries. Also, we will work on
collecting more vehicles images that are captured under more challenging conditions.
References
1. Shashirangana, J., Padmasiri, H., Meedeniya, D., Perera, C.: Automated license plate
recognition: a survey on methods and techniques. IEEE Access 9, 11203–11225 (2020)
2. Boulila, W., Sellami, M., Driss, M., Al-Sarem, M., Safaei, M., Ghaleb, F.: RS-DCNN:
a novel distributed convolutional-neural-networks based-approach for big remote-sensing
image classification. Comput. Electron. Agric. 182, 106014 (2021)
3. Ben Atitallah, S., Driss, M., Boulila, W., Ben Ghézala, H.: Randomly initialized convolutional
neural network for the recognition of COVID-19 using X-ray images. Int. J. Imaging Syst.
Technol. 32, 55–73 (2021)
4. Ur Rehman, M., Shafique, A., Khalid, S., Driss, M., Rubaiee, S.: Future forecasting of COVID19: a supervised learning approach. Sensors 10, 3322 (2021)
5. Alkhelaiwi, M., Boulila, W., Ahmad, J., Koubaa, A., Driss, M.: An efficient approach based
on privacy-preserving deep learning for satellite image classification. Remote Sens. 13(11),
2221 (2021)
6. Almustafa, K.: On the automatic recognition of Saudi license plate. Int. J. Appl. Inf. Syst.
(IJAIS) 5, 34–44 (2013)
7. Basalamah, S.: Saudi license plate recognition. Int. J. Comput. Electr. Eng. 5(1), 1 (2013)
8. Sarfraz, M., Ahmed, M.J.: An approach to license plate recognition system using neural
network. In: Exploring Critical Approaches Evolutionary Computation, pp. 20–36. IGI Global
(2019)
Automatic Saudi Arabian License Plate Detection and Recognition
15
9. Alzubaidi, L., Latif, G., Alghazo, J.: Affordable and portable realtime saudi license plate
recognition using SoC. In: 2nd International Conference on New Trends in Computing
Sciences (ICTCS), pp. 1–5. IEEE (2019)
10. Chen, R.: Automatic license plate recognition via sliding-window darknet-YOLO deep
learning. Image Vis. Comput. 87, 47–56 (2019)
11. Kessentini, Y., Besbes, M., Ammar, S., Chabbouh, A.: A two-stage deep neural network for
multi-norm license plate detection and recognition. Expert Syst. Appl. 136, 159–170 (2019)
12. Silva, S., Jung, C.: Real-time license plate detection and recognition using deep convolutional
neural networks. J. Vis. Commun. Image Representation 71, 102773 (2020)
13. Omar, N., Sengur, A., Al-Ali, S.: Cascaded deep learning-based efficient approach for license
plate detection and recognition. Expert Syst. Appl. 149, 113280 (2020)
14. Laroca, R., Zanlorensi, L., Gonçalves, G., Todt, E., Schwartz, W., Menotti, D.: An efficient and
layout-independent automatic license plate recognition system based on the YOLO detector.
IET Intell. Transp. Syst. 15(4), 483–503 (2021)
15. Omar, N., Mohsin Abdulazeez, A., Sengur, A., Saeed Al-Ali, S.G.: Fused faster RCNNs for
efficient detection of the license plates. Indones. J. Electr. Eng. Comput. Sci., 19(2), 874
(2020)
16. Yin, S., Li, H., Teng, L.: Airport detection based on improved faster RCNN in large scale
remote sensing images. Sensing Imaging 21(1), 1–13 (2020). https://doi.org/10.1007/s11220020-00314-2
17. Jupyter Notebook. https://jupyter.org/. Accessed 20 Oct 2021
18. Keras: the Python deep learning API. https://keras.io/. Accessed 20 Oct 2021
19. TensorFlow. https://www.tensorflow.org/. Accessed 20 Oct 2021
20. labelImg. https://pypi.org/project/labelImg/1.4.0/. Accessed 20 Oct 2021
21. Ben Atitallah, S., Driss, M., Boulila, W., Koubaa, A., Ben Ghézala, H.: Fusion of convolutional
neural networks based on Dempster–Shafer theory for automatic pneumonia detection from
chest X-ray images. Int. J. Imaging Syst. Technol. 32, 658–672 (2021)
22. OpenCV. https://opencv.org/. Accessed 20 Oct 2021
Ship Detection Approach Using Machine
Learning Algorithms
Abdirahman Osman Hashi1(B) , Ibrahim Hassan Hussein1 ,
Octavio Ernesto Romo Rodriguez2 , Abdullahi Ahmed Abdirahman1 ,
and Mohamed Abdirahman Elmi1
1 Faculty of Computing, SIMAD University, Mogadishu, Somalia
Wadani12727@gmail.com, {aaayare,m.abdirahman}@simad.edu.so
2 Department of Computer Science, Faculty of Informatics, Istanbul Teknik Üniversitesi,
34469 Maslak, İstanbul, Turkey
Abstract. The control of territorial waters is critical, since water occupies more
than 70% of earth surface. Due to that fact, maritime security and safety is essential, in order to reduce illegal operations including piracy, illegal fishing and transportation of illicit goods. With the rapid development of artificial intelligence,
ship detection research has increased as well. Several researchers have addressed
this issue by proposing a variety of solutions such as VGG and Dense Net. Nevertheless, these proposed solutions have not provided enough accuracy in term
of ship detection. Therefore, the primary objective of this work is to propose a
robust model that can detect ships by applying artificial intelligence and machine
learning models, those are Random Forest, Decision Tree, Naive Bayes and CNN.
The result achieved in this experiment will tackle the forementioned problems and
conduct research on how ships could be detected. Based on the result, Random
Forest outperforms other models in terms of accuracy, scoring 97.20% for RGB
and 98.90% for HSV, in comparison with Decision Tree and Naive Bayes those
are scored 96.82% for RGB and 97.18% for HSV and 92.43 for RGB and 96.30%
for HSV respectively. Meanwhile, CNN scored 90.45% for RGB and 98.45% for
HSV. Overall, Random Forest is the best model so far, achieving a good result
in terms of RGB and HSV 97.20% and 98.90% respectively. The significance of
the proposed method for the field of artificial intelligence is to introduce a novel
method to detect Ships.
Keywords: Deep learning · Naive Bayes · Random forest · Artificial
intelligence · Convolutional neural network
1 Introduction
The precise and concurrent identification of moving ships has become an important part
of marine video surveillance, resulting in increased traffic safety and security. With the
fast advancement of artificial intelligence, intelligent methods to improve ship identification outcomes in marine applications are becoming possible. The visual picture quality
is often reduced in real-world imaging settings owing to poor weather conditions, such
© The Author(s), under exclusive license to Springer Nature Switzerland AG 2022
F. Saeed et al. (Eds.): IRICT 2021, LNDECT 127, pp. 16–25, 2022.
https://doi.org/10.1007/978-3-030-98741-1_2
Ship Detection Approach Using Machine Learning Algorithms
17
as rain, haze, and low light, among others. The apparent degradation has the potential to
jeopardize the safety and security of maritime traffic. Furthermore, since it enables for
accurate and real-time identification of moving ships, high-quality images has become
an essential component in maritime video surveillance. As a result, a great deal of effort
has gone into improving low-visibility enhancement and ship recognition in a variety of
imaging scenarios [1].
As a consequence of many international cooperation efforts, the frequency of cases of
maritime piracy has recently reduced. The Ministry of Defense proposed 3,200 million
JPY for anti-piracy operations off the coast of Somalia in Japan’s FY2017 national
budget. A important marine route between Japan and Europe must pass through this
area through the Suez Canal. The Japanese Maritime Self-Defense Force has sent a fleet
to protect Japanese ships [2]. This works well, but it would have been much better if
Somalis had been able to identify ships using ship detection models.
Machine learning has opened new opportunities for better picture categorization
and detection in recent years. It has started Machine learning methods to learn picture
characteristics automatically and discover possible object characters and distribution
rules across the object that are not defined by human cognition [3]. Three criteria should
be fulfilled by a competent ship detecting technique. The first is robustness; the detecting
technique should be resistant to changes in light, clouds, and waves. The second need
is generality; the detection technique must be capable of detecting both in-shore and
offshore ships. Last but not least, computational efficiency: the detecting technique
should be computationally efficient. This is particularly important when working with
large-scale remote sensing pictures [4]. Recent years, numerous researchers such as [5,
6] and [7] have proposed different solutions for ship detection. However, these proposed
solutions were not provided enough accuracy in term of ship detection. Hence, the
primary key objective of this paper is to intend by proposing robust model that can
detect ships in the sea by applying four machine learning models, those are CNN,
Random forest, Decision Tree and Naive Bayes.
This paper is organized with five sections. The upcoming section discusses the related
work of ship detection methods that other researchers have proposed before. Section three
explains the proposed methodology for ship detection that uses four machine learning
algorithms. The next section illustrates the experiment result and dataset description
that is applied for the proposed model. And the final section presents the conclusion and
future work recommendations.
2 Background and Related Work
Due to the increasing need for applications in the scope of maritime security and safety,
marine monitoring research has increased recently. With the objective of maritime border control, fight against piracy, observing ocean pollution, and related missions, several
organizations and government agencies must guarantee the safety of ships and the overall
security of maritime operations. The oceans and seas occupy about 71% of the earth’s
surface, as a result of that, water transportation has played a significant role in global
economies throughout history [8]. However, the sea is fraught with threats ranging from
piracy to the potential of mishaps. Furthermore, numerous illegal operations, including
18
A. O. Hashi et al.
illegal fishing and the transportation of illicit goods might take place, especially in the
Indian Ocean. There are resources such as satellites that can be used to keep track of these
enormous seas. However, sophisticated image processing techniques are required for
the identification and the following categorization of ships and maritime transportationvehicles traversing the seas using satellite images. In conjunction with monitoring the
seas for the intention of ships guard, prevention of illegal fishing and illicit goods transportation, countries must also control their shores and nearby waterbodies in search of
military threats, including enemy ships and submarines from a defensive standpoint [7].
Through history; Airbus, previously known as the European-Aeronautic-Defense
Space-Company, has offered a wide range of maritime surveillance services with effective solutions and intense monitoring of marine areas with fine fidelity [8]. Airbus supplied researchers with data in order for them to create an automatized prediction model
that could track the activity of ships, correctly identify every ship in all the satellite pictures given, therefore preventing illegal maritime operations [9]. Given the increment of
maritime traffic, there is a greater chance of illicit operations occurring in the water, such
as piracy and illegal goods transportation. Airbus had the aim to develop a comprehensive maritime surveillance system to constantly check ship traffic and prevent criminal
operations including piracy, illegal fishing, and the transport of illicit goods. Furthermore, a system like that would safeguard the maritime environment, since it would help
prevent accidents that could result in pollution [5].
On account of the benefits that automated surveillance of the seas or oceans areas
could result in, ship location is an imperative application when we talk about area of
computer vision or in specific an image processing field. The benefits of creating a
model that can locate and examine ships in an autonomous way range from stopping
piracy, illegal fishing, illicit transportation of goods. As a result of recent technological
advancements, the interest in Neural-Network research for detecting and classificating
specific items in pictures has increased. Ship detection is one of these applications that
may provide significant benefits to the parties involved but yet not implemented in
Somalia which is currently dealing with the forementioned problems [3].
On the other hand, to predict the object’s minimal circumscribed rectangle and minimize the redundant detection area, a method based on rotation anchor approach was
developed [10]. For identifying ships, the experiment’s dataset relies on remote sensing photos from Google Earth. The RDFPN performed better in ship identification in
complicated pictures, particularly in identifying densely packed ships, according to the
findings. The authors used K-Nearest Neighbors, Random Forest, Naive Bayes in another
approach for ship identification using satellite imagery [11]. Deep Learning techniques
were also put to the test, with researchers using pre-trained network designs as a comparison network. When the Deep Learning technique was compared to conventional
methods, the Random-Forest model had the highest accuracy in the category of classical
methods, scoring 93% of accuracy in detection. In contrast, the methods in the category
of Deep Learning obtained 94% of accuracy in detection [12].
Since last decade most researchers were always working on ways to enhance current
algorithms, which is something that typically happens as the quantity of datasets grows.
Between the input and output layers of a typical deep learning classifier, there are many
layers of CNN that allow for sophisticated non-linear information processing [13]. Chua
Ship Detection Approach Using Machine Learning Algorithms
19
et al. [14] compared three traditional machine learning algorithms: histogram of oriented
gradient (HOG), exemplar-SVM, and latent-SVM [15] to determine their particular
benefits, and discovered that exemplar SVM is excellent for specificity measurement.
Chen et al. [15] proposed a detection technique that uses a fully convolutional neural
network (FCNN) segmentation method and then identifies the item using bounding box
regressions, with the class labelled by a CNN classifier.
3 Proposed Methodology
It is well know that the research methodology presents the sequence of the follows and
the structure overview of the proposed model, this proposed model consists of four
models: CNN, Random forest, Decision Tree and Naive Bayes. As already mention we
are trying to find which algorithms can give us the best accuracy of ship detection and
we are dealing with images that airbus ship detection provides. It is also a notable to
mention that we used Yolovov3 as it is one of the most advanced of object detection.
Hence, to do the pre-processing, the images in this research are first subjected to a
block section. Following this phase, the color and texture characteristics are retrieved
from the picture blocks to be utilized as training data. A hybrid feature vector is created
by combining these characteristics. Then, using the previously extracted feature vectors,
the Naive Bayes, Decision Tree, and Random Forest classifiers are trained, this method
has been done other researchers too. The categorization of ship blocks and non-ship
blocks on the blocks of test images was done as the last step after the classifiers had been
trained. There are three main steps that have done before applying the models. Here are
the steps:
1. Block division
2. Feature Extraction
3. Color Feature
For the block division, in comparison to pixel-based detection, the block-based
method offers more meaningful and comprehensive detection. It offers more homogenous information based on the image’s color and texture richness, as well as the ability
to create vectors quickly. This research used 64 × 64 pixel blocks throughout the preprocessing stage, but there are other researchers that have applied 16 × 16 and 32 × 32
pixel blocks. The second step is to apply a binary mask in order to label images if they
are from a ship or not.
As it is important to choose the appropriate features in order to achieve the right
classification, it is also important to do a feature selection based on the image blocks by
creating a feature vector from the extracted features in the data. Similar to that, the color
feature is also important as it gives information about the visual perception of pixels. This
proposed method considers two different color spaces: HSV (Hue-Saturation-Value) and
RGB (Red-GreenBlue) (Fig. 1).
From this figure, we can see that after the pre-processing stage, there are numerous
steps to follow before applying the model, such as block division, feature extraction,
and color features that will play an important role in extracting the appropriated images.
After that, we trained CNN, Random forest, Decision Tree and Naive bayes.
20
A. O. Hashi et al.
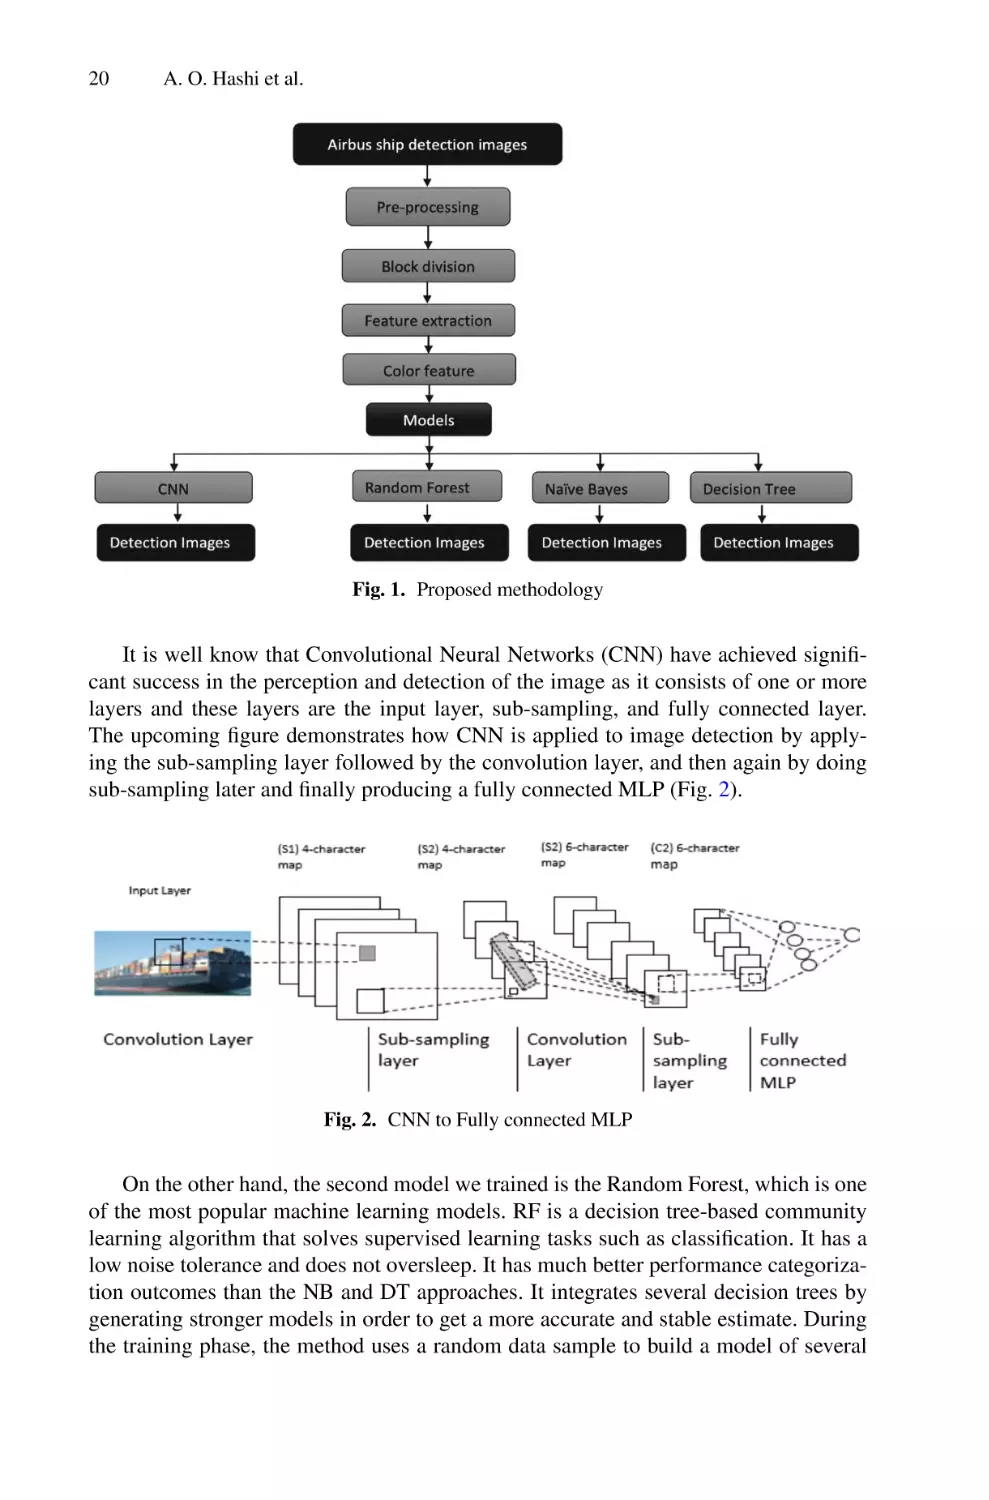
Fig. 1. Proposed methodology
It is well know that Convolutional Neural Networks (CNN) have achieved significant success in the perception and detection of the image as it consists of one or more
layers and these layers are the input layer, sub-sampling, and fully connected layer.
The upcoming figure demonstrates how CNN is applied to image detection by applying the sub-sampling layer followed by the convolution layer, and then again by doing
sub-sampling later and finally producing a fully connected MLP (Fig. 2).
Fig. 2. CNN to Fully connected MLP
On the other hand, the second model we trained is the Random Forest, which is one
of the most popular machine learning models. RF is a decision tree-based community
learning algorithm that solves supervised learning tasks such as classification. It has a
low noise tolerance and does not oversleep. It has much better performance categorization outcomes than the NB and DT approaches. It integrates several decision trees by
generating stronger models in order to get a more accurate and stable estimate. During
the training phase, the method uses a random data sample to build a model of several
Ship Detection Approach Using Machine Learning Algorithms
21
decision trees based on various data subsets. The unpredictability of the random forest model is a benefit, since it makes it more resilient than a single decision tree and
eliminates the issue of conventional data being too compatible and comparable.
It is also applied to the Decision Tree (DT) algorithm, which is the second technique
that delivers the most effective outcomes among machine learning algorithms. It may
be used for regression and classification. A knot, branch, and leaf make up a decision
tree. The root is at the top, the branch is the route from the root to the other nodes, and
the leaf is the final outcome of these branches. This algorithm asks a series of questions
to the data to be trained, and the outcomes are determined based on the responses. The
information gain and information gain rate methods are computed while constructing a
decision tree, depending on the criteria or attribute value of the branch in the tree.
The last model we applied is the Naive Bayes (NB) algorithm, which is a machine
learning method that is regulated. It’s a straightforward probability model for multiple
classifications based on the premise of feature independence. NB implies that each
feature contributes to the possibilities given to a class in its own right.
4 Results and Discussion
4.1 Dataset
The Kaggle platform [16] was used to generate a dataset of ship pictures from satellite
photos for this study. The satellite pictures show the earth’s surface, including farmland,
buildings, roads, and other features. PlanetScope complete views of the San Francisco
Bay and San Pedro Bay regions of California were used to create these pictures. It
contains 4000 RGB pictures with a resolution of 80 × 80 pixels for two issue classes:
“ship” and “non-ship.”
Table 1. Total number of samples
Class
Numbers of imges in each sample
Ships
1000
Non-Ships
3000
The pictures for the ship class must show the whole look of a single ship. It comes in
a variety of sizes and orientations, as well as some ambient sounds. A non-ship class is
made up of one or more of the following three elements: 1) random samples of various
land cover characteristics such as buildings, water, vegetation, bare soil, and so on; 2) a
partial picture of a ship; and 3) noises produced by bright pixels or strong linear features
(Table 1).
4.2 Results
Following the steps that are mentioned after preprocessing in the methodology, we have
obtained a hybrid vector by extracting color from each image’s contents based on the
22
A. O. Hashi et al.
block size. After that, the results were evaluated based on the block sizes while keeping
in mind the successful classification. As we are dealing with each block size, we created
different vectors that have different sizes based on block size and then apply the color
space. As mentioned before, in this study it used 64 × 64 block sizes, and after we
divided them into 64 × 64 block sizes, we found 40752 images.
By using Yolovov3 as mentioned in the methodology, we have created the bounding
box and bounding area to make it more clear by feeding it into our models, so that the
classification will be more accurate. Here is the picture that demonstrates the division
of each picture into bounding boxes and bounding areas (Fig. 3).
Fig. 3. Image bounding box
We can see from this figure that each image has a bounding box and a bounding box
area, which is a vector based on the block size for each image. Hence, it is easy to fit the
model or to apply it with a blanched bounding box. Before applying any model, here is
the dataset images which we meant to detect the ships from inside the images.
Fig. 4. Image of undetected images
From Fig. 4, we can see that there are certain ships in each image. However, after
applying the models, we detected the ships in each image. Here is the detected result
after applying the models.
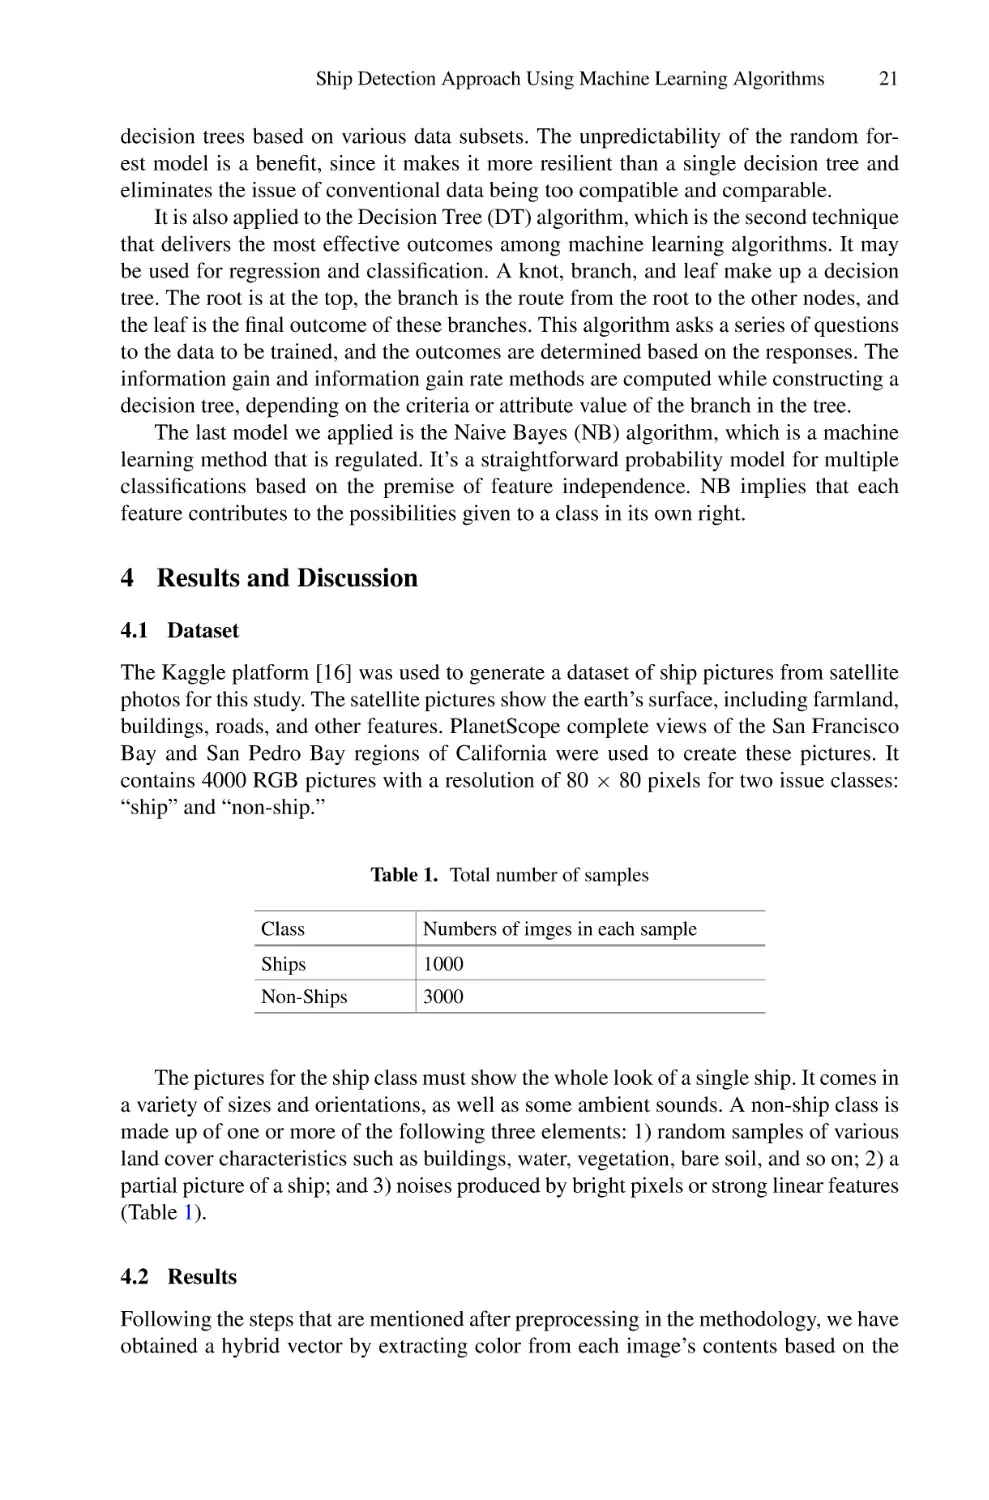
Figure 5 illustrates how each image is block sized and then detected the ship by
putting a red rectangle box which clearly shows that the model has performed and
segmented the image accurately. Although there are other images where there is no ship
in the image, the trained model returned without block sizing it and putting the rectangle
boundary box around it.
Ship Detection Approach Using Machine Learning Algorithms
23
Fig. 5. Detected ship results
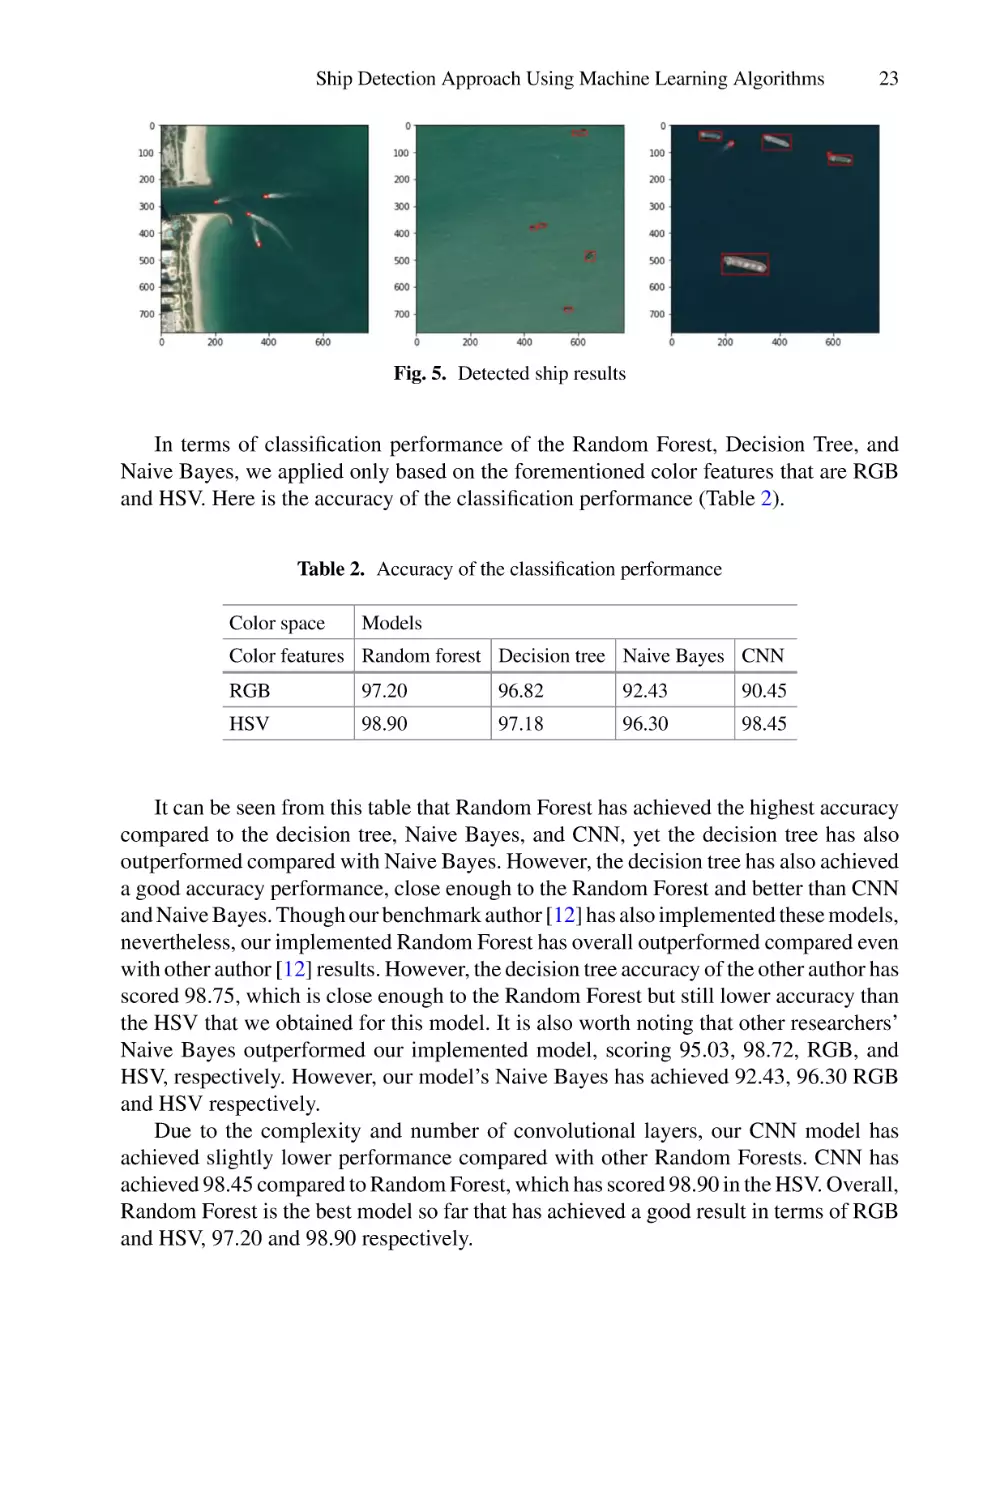
In terms of classification performance of the Random Forest, Decision Tree, and
Naive Bayes, we applied only based on the forementioned color features that are RGB
and HSV. Here is the accuracy of the classification performance (Table 2).
Table 2. Accuracy of the classification performance
Color space
Models
Color features Random forest Decision tree Naive Bayes CNN
RGB
97.20
96.82
92.43
90.45
HSV
98.90
97.18
96.30
98.45
It can be seen from this table that Random Forest has achieved the highest accuracy
compared to the decision tree, Naive Bayes, and CNN, yet the decision tree has also
outperformed compared with Naive Bayes. However, the decision tree has also achieved
a good accuracy performance, close enough to the Random Forest and better than CNN
and Naive Bayes. Though our benchmark author [12] has also implemented these models,
nevertheless, our implemented Random Forest has overall outperformed compared even
with other author [12] results. However, the decision tree accuracy of the other author has
scored 98.75, which is close enough to the Random Forest but still lower accuracy than
the HSV that we obtained for this model. It is also worth noting that other researchers’
Naive Bayes outperformed our implemented model, scoring 95.03, 98.72, RGB, and
HSV, respectively. However, our model’s Naive Bayes has achieved 92.43, 96.30 RGB
and HSV respectively.
Due to the complexity and number of convolutional layers, our CNN model has
achieved slightly lower performance compared with other Random Forests. CNN has
achieved 98.45 compared to Random Forest, which has scored 98.90 in the HSV. Overall,
Random Forest is the best model so far that has achieved a good result in terms of RGB
and HSV, 97.20 and 98.90 respectively.
24
A. O. Hashi et al.
5 Conclusions
This work addresses the issue of detecting ships using artificial intelligence. We proposed
a more accurate ship detection approach using four machine learning models. Those are
Random Forest, Decision Tree, Naive Bayes, and CNN. Before applying the model, it
was observed that doing block size and color highlighting played an essential role for
feature extraction. Based on the results, Random Forest outperformed other models in
terms of accuracy, as it scored 97.20% for RGB and 98.90% for HSV. Although other
models have also performed well, their accuracy was slightly lower than the Random
Forest technique.
For future work, it is important to classify the detected ships into categories based
on the ship’s operation. This will require the implementation of more complex features
such as classifying objects according to their shapes and sizes.
Acknowledgments. It is imperative to acknowledge the support given by SIMAD Research Center in order to make this research a success. In addition to that, the authors of this paper are honored
to thank SIMAD University for making this research possible by granting the Research University
Grant.
References
1. Liu, R.W., Yuan, W., Chen, X., Lu, Y.: An enhanced CNN-enabled learning method for
promoting ship detection in maritime surveillance system. Ocean Eng. 235, 109435 (2021)
2. Watanabe, K., Takashima, K., Mitsumura, K., Utsunomiya, K., Takasaki, S.: Experimental
study on the application of UAV drone to prevent maritime pirates attacks. TransNav Int. J.
Marine Navigation Saf. Sea Transp 11(4), 705–710 (2017)
3. Nie, G.H., Zhang, P., Niu, X., Dou, Y., Xia, F.: Ship detection using transfer learned single
shot multi box detector. In: ITM Web of Conferences, vol. 12, p. 01006). EDP Sciences (2017)
4. Zhang, T., Zhang, X., Shi, J., Wei, S.: HyperLi-Net: a hyper-light deep learning network for
high-accurate and high-speed ship detection from synthetic aperture radar imagery. ISPRS J.
Photogramm. Remote. Sens. 167, 123–153 (2020)
5. Zhou, L., Suyuan, W., Cui, Z., Fang, J., Yang, X., Ding, W.: Lira-YOLO: a lightweight model
for ship detection in radar images. J. Syst. Eng. Electron. 31(5), 950–956 (2020)
6. Li, J., Qu, C., Shao, J.: Ship detection in SAR images based on an improved faster R-CNN.
In: 2017 SAR in Big Data Era: Models, Methods and Applications (BIGSARDATA), pp. 1–6.
IEEE, November 2017
7. Petrescu, R.V., Aversa, R., Akash, B., Corchado, J., Apicella, A., Petrescu, F.I.: Home at
airbus. J. Aircraft Spacecraft Technol. 1(2), 97–118 (2017)
8. Corbane, C., Pecoul, E., Demagistri, L., Petit, M.: Fully automated procedure for ship detection using optical satellite imagery. In: Remote Sensing of Inland, Coastal, and Oceanic
Waters, vol. 7150, p. 71500R, December 2008
9. Yang, X., et al.: Automatic ship detection in remote sensing images from google earth of
complex scenes based on multi-scale rotation dense feature pyramid networks. Remote Sens.
10(1), 132 (2018)
10. Chen, Y., Zheng, J., Zhou, Z.: Airbus Ship Detection-Traditional vs Convolutional Neural
Network Approach, Stanford
Ship Detection Approach Using Machine Learning Algorithms
25
11. Dolapci, B., Özcan, C.: Automatic ship detection and classification using machine learning
from remote sensing images on apache spark. J. Intell. Syst. Theory Appl. 4(2), 94–102 (2021)
12. Wang, Y., Wang, C., Zhang, H., Dong, Y., Wei, S.: A SAR dataset of ship detection for deep
learning. Remote Sens. 11(765), 6–11 (2019)
13. Ma, M., Chen, J., Liu, W., Yang, W.: Ship classification and detection based on CNN using
GF-3 SAR images. Remote Sens. 2043(10), 2–22 (2018)
14. Li, H., Chen, L., Li, F., Huang, M.: Ship detection and tracking method for satellite video
based on multiscale saliency and surrounding contrast analysis. Remote Sens. 13(2), 6–10
(2019)
15. Kaggle. Dataset for Airbus Ship Detection Challenge (2018). https://www.kaggle.com/c/air
bus-shipdetection/data
A New Deep Learning System for Wild Plants
Classification and Species Identification: Using
Leaves and Fruits
Nehad M. Abdulrahman Ibrahim1(B) , Dalia Goda Gabr2 ,
and Abdel-Hamid M. Emara3,4
1 Department of Computer Science, College of Computer Science and Information Technology,
Imam Abdulrahman Bin Faisal University, Dammam, Saudi Arabia
nmaibrahim@iau.edu.sa
2 Botany and Microbiology Department, Faculty of Science (Girls Branch),
AL Azhar University, Cairo, Egypt
daliaGabr.el20@azhar.edu.eg
3 Department of Computers and Systems Engineering, Faculty of Engineering, Al-Azhar
University, Cairo 11884, Egypt
4 College of Computer Science and Engineering, Taibah University, Medina 41477,
Saudi Arabia
Abstract. Many studies are based on the study of plant classification and their
identification using its leaves, and there are many studies to identify plants using
its fruits. Most of these studies are based on the leaves of the plant in general
as well as the fruits in general as well. In this research, we present a new tool
using artificial intelligence to classify and identify wild plants through the leaves
of these plants, or by using their fruits, or by using both leaves and fruits together.
This tool has proven an excellent result compared to similar tools in the same
field. More than one AI model was applied to three datasets, lower plants dataset
(LPDS), upper plant dataset (UPDS), and fruit plant dataset (FPDS). The aim of
this study is to use machine learning methods to serve in the plant taxonomy and
identification. The wild plant’s dataset was gathered in its natural habitat in Egypt.
The developed convolution neural network model (AlexNet CNN), the Random
Forest (RF), and the support vector machine (SVM) techniques were contrasted
in the species classifications. The highest degree of accuracy achieved was 98.2%
by using the developed CNN model.
Keywords: Plant taxonomy · Deep learning · Support vector machine · Random
forest
1 Introduction
Botanists, especially plant taxonomists, after collecting plant samples from the fields,
the first step before starting work on plant samples is to identify plants in terms of family,
genus and species. Taxonomists use flora books and also comparisons with herbarium
© The Author(s), under exclusive license to Springer Nature Switzerland AG 2022
F. Saeed et al. (Eds.): IRICT 2021, LNDECT 127, pp. 26–37, 2022.
https://doi.org/10.1007/978-3-030-98741-1_3
A New Deep Learning System for Wild Plants Classification
27
samples to obtain an accurate and correct identification of plant samples and this process is delicate and a little cumbersome. Recently, some programming scientists have
implemented a set of applications and websites to identify plants using artificial intelligence algorithms to facilitate this process for scientists and those interested in botany
as, PlantNet, PlantDetect Lite, Plant D, PlantSnap Pro and Picture This. Botanists used
morphology, anatomy, genomic analysis, and photochemistry to identify and classify
plants, among other methods. The first is through the plant’s morphological characteristics, especially the flower. When the flowering stage is unavailable, the fruit characters
are useful for species identification and separation [1]. In recent years, Deep Learning has demonstrated the highest machine learning efficiency, and its image rating has
skyrocketed. Several linear and non-linear layers make up a standard deep learning
system. The term “deep” refers to the multiple layers of deep stacking. Deep learning approaches’ progress is largely dependent on the development of devices that can
manage large amounts of data and network architecture. Convolutional neural networks
CNN, in particular, have recently achieved the highest image classification success and
are commonly used in modern deep learning techniques [2]. To identify and classify
plants, recent studies of image recognition and taxonomy approaches have been used.
These techniques used texture and color-based features to perform classification. Aspect
ratio, kurtosis, skewness, energy, correlation, sum variance, entropy, and compactness
are some of these characteristics. The computing power is disproportionate. The major
drawback of these traditional methods is the lengthy computation time needed for handcrafted feature extraction. All conventional approaches have been replaced by machine
learning techniques in recent years. The convolution layers are concerned with the digital filtering techniques, that are used to highlight or extract the most noticeable features.
The pooling mainly concerned lowering the volume of the feature maps received from
the convolution layer, decreasing the overfitting of the maps in the network layers, and
reducing the computations.
Most of the implemented applications depend on datasets for cultivated plants, not
wild plants. One of the main objectives of the current study is to work on the wild plant’s
dataset, this research aims to create a system to help the scientists to identified plant
specimens using only images. This system can be considered a kernel of an electronic
herbarium for wild plants.
2 Review of Related Literatures
In this section, we will list the recent studies related to plants image classification based
on the leaf and the fruits.
Using the large and deep learning method, a model that integrates a linear and a deep
learning models to solve fine-grained plant image classification challenge [2].
The CNNs had five convolutional layers at the time, but ensemble systems outperformed them in terms of true deep learning. Another method used handcrafted visual
features and qualified SVM classifiers for various view styles [3]. Using the ImageNet
model and dataset released in [3], a new model to classify plant images using the convolution neural network architecture [4]. The study [5] present three models, Alexnet, DLeaf,
and AyurLeaf; the AyurLeaf CNN model is evaluated and compared to AlexNet, Leaf,
28
N. M. A. Ibrahim et al.
and fine-tuned AlexNet versions using two classifiers, CNN and SVM with accuracy
96.76%. Plant taxonomy is the study of how various species of plants are categorized.
In comparison to other transfer learning strategies, the study found that transfer
learning improves the performance of deep learning models, especially models that
apply deep features and use fine-tuning to provide better performance [6], the research
applies deep learning features SVM and LDA to four publicly accessible plant datasets
using two deep learning models, Alexnet and VGG16 (Flavia, Swedish Leaf, UCI Leaf,
and Plantvillage). The study [7] present the extension work to [8] with an adaptive
algorithm that relies on a deep adaptive Residual Neural Network to deal with the
identification of multiple plant diseases in real-world acquisition environments, where
numerous modifications have been proposed for early disease detection using a Residual
Neural Network, including several enhancements to the augmentation scheme and tile
cropping. The study [9] presents D-Leaf, a modern CNN-based approach that was proposed. After pre-processing the leaf images, the three pretrained Convolutional Neural
Network (CNN) models: pre-trained AlexNet, fine-tuned AlexNet, and D-Leaf. Support Vector Machine (SVM), Artificial Neural Network (ANN), K-Nearest-Neighbour
(K-NN), Nave-Bayes (NB), and CNN are five machine learning methods which used to
extract and identify the features. The accuracy of these techniques is 90–98% on three
publicly available datasets: MalayaKew, Flavia, and Swedish Leaf Dataset. [10] present
the three neural network architectures, Inception v3, ResNet50, and DenseNet201 to
improve the performance of plant species classification, used a variety of augmentation
operations to increase the dataset diversity further, using dataset holds 256.288 samples
and the noisy set 1.432.162. These samples are for 10.000 different plants, as well as
a robust Orchid family plant database built for algorithm evaluation. The study [11]
present a pre-trained AlexNet was fine-tuned, which resulted in the 4th place. The study
[12] providing a detailed empirical guide showing that residual networks are easier to
refine and can achieve precision by increasing depth substantially, also test performed
on the residual nets with a depth of 152 layers in the ImageNet dataset, but with lower
complexity, on the ImageNet test range, an ensemble of these residual nets achieves a
3.57% error. The model was pre-trained with ImageNet and fine-tuned with the PlantCLEF database, using an Inception Convolutional Neural Network (CNN) model-based
network. They merged the outputs of five CNNs, which were fine-tuned with randomly
selected sections of the database. The optimization of hyperparameters, on the other
hand, was not completed [13]. The study [14] design A multi-input convolutional neural
network for large scale flower grading and achieves 89.6 after data augmentation. The
study [15] presents a method for extracting distinctive invariant features from images
that can be used to perform reliable matching between different views of an object or
scene. The study [16] propose model that use different training epochs, batch sizes and
dropouts. Compared with popular transfer learning approaches, the proposed model
achieves better performance when using the validation data. After an extensive simulation, the proposed model achieves 96.46% classification accuracy. The study [17]
present overview on the plant species recognition methods and features extraction using
leaf image. The study [18] provide a data article for a dataset that holds samples of
images of healthy citrus fruits and leaves. The study [19] the pre-processing, feature
extraction, and categorization into one of the species. Several morphological parameters
A New Deep Learning System for Wild Plants Classification
29
such as centroid, major axis length, minor axis length, solidity, perimeter, and orientation are retrieved from digital pictures of various leaf categories with an accuracy rate
of 95.85%
In the study [20], builds an unique multiscale convolutional neural network with
attention (AMSCNN) model for plant species detection, with a maximum accuracy of
95.28%.
3 Description of the Implemented Techniques
Taxonomy and family classification of plants are difficult to decipher. There have been
several studies on the classification and recognition of plant images. We used a matrix
of multiple models with multiple plant parts in this study. On the lower leaf, upper leaf,
and fruit images, CNN developed model, Random Forest with parameter optimization,
and SVM are used. Deep Learning has shown the best outcomes of machine learning.
Convolutional neural networks (CNN) have recently achieved the greatest success in
image recognition and are commonly used in most advanced deep learning techniques.
Most recent studies have focused on using deep learning to classify images.
Support Vector Machine: The main objective of the SVM is to find the hyperplane
that can separate the data most efficiently and most accurately. In both classification and
regression, the support vector machine (SVM) is used.
In a linear SVM, the given data set is represented as a p-dimensional vector that can
be separated by a maximum of p-1 planes. These planes divide the data space or define
the boundaries between data classes in classification and regression problems [21].
Deep Learning: VGGNet, LeNet, GoogLeNet, and AlexNet are the most common
CNN architectures used in current state-of-the-art Deep Learning research to solve
various Computer Vision problems such as Image Classification, Object Recognition.
AlexNet is a CNN model that has been pre-trained using images from the ImageNet
dataset. It can distinguish 1000 different animals. There are five convolutional layers,
three completely linked layers, and a softmax classification layer in this model [22].
Mathematical formula for a convolution layer:
Conv(I , K)x, y =
nW
nC
nH
(Ki, j, kIx + i − 1, y + j − 1, k)
i=1 j=1 k=1
where: I: image, K: filter, nH: the size of the Height, nW: the size of the Width, nC: the
number of Channels.
Random Forest: Random Forest is a powerful and scalable that classify as the supervised learning of the machine learning algorithms that creates a “forest” by growing
and combining more than one of the decision trees that are compiled to enhance the
prediction. It can be used to solve problems involving classification and regression.
30
N. M. A. Ibrahim et al.
4 Empirical Studies
4.1 Description of Dataset
• Reviewed all images of (lower leaf, upper leaf, and fruit) and ensured that the image
is clear.
• Ensured that all images are uniform in length.
• Distortion cleaning.
• Standardized the image features.
4.2 Dataset Analysis
The dataset is 51 original images for 17 species belonging to two families, is not useful
in the training of the CNN model. We use the augmentation to increase the dataset to
3954 images for 51 species belong to two different families. The image dimensions
are 224 ×224, divided into 3164 for training and 790 images for testing, as shown in
Table 1. Eight for the first family (Apiaceae), and nine images from the second family
(Brassicaceae) as shown in Fig. 1, and Fig. 2 respectively. In our work we used different
four plants species in identification testing, which does not train by our system.
Table 1. Plant dataset information.
Family name
No. of
plants
Fruit
images
Lower
leaf
images
Upper
leaf
images
Total
Apiaceae
8
608
608
608
1824
Brassicaceae
9
710
710
710
2130
17
1318
1318
1318
3954
Total
Fig. 1. The image of family Apiaceae used for the dataset (1- Lower leaf, 2- Upper leaf, and 3fruit).
One of the contributions in the current study is preparing this dataset, because the
current study is the first machine learning and AI experiments applied on this dataset.
The dataset consists of three parts; the first is lower leaf images, the second is upper
leaf images and the third is the fruits images. All images related to two plant families as
shown in Table 1.
A New Deep Learning System for Wild Plants Classification
31
Fig. 2. The image of family Brassicaceae used for the dataset (1- Lower leaf, 2- Upper leaf, and
3- fruit).
4.3 Feature’s Extraction
Features are parts or patterns of an object in an image that help to identify it. The HOG
(Histogram of Oriented Gradients) descriptor is one of commonly used global explored
in the object detection group. It is based on the idea of counting the number of times a
gradient orientation appears in a particular localized region of an image [23]. We extract
the Histogram of Oriented Gradients (HOG) for the plant’s images, and compute a HOG
by using python package (SKIMAGE) that working on:
•
•
•
•
•
•
Global image normalization
Computing the gradient image
Computing gradient histograms
Normalizing across blocks
Flattening into a feature vector
Combine color and hog features.
HOG descriptors are not tied to a specific machine learning algorithm.
In the current study we have developed the features extraction process based on the
CNN model.
5 Proposed Models and Results
More than one AI model was applied to three datasets, lower plants dataset (LPDS), upper
plant dataset (UPDS), and fruit plant dataset (FPDS). The AlexNet CNN (Convolution
Neural Network) model developed and implemented to extract the fruit and the leaves
features, classify each plant to its family, and use the trained model to identify the plant
and to classify it to the belongs family. The current study propose the system for family
classification and species identification based on the developed CNN model as shown
in Fig. 3:
• Developed CNN
• SVM (Support Vector Machine)
• Random Forest.
32
N. M. A. Ibrahim et al.
Fig. 3. Proposed System Architecture based on developed CNN.
5.1 Families Classification (Binary Classification)
In this section we implemented different deep learning models of binary classification
to classify the plants into two families (Apiaceae and Brassicaceae) with validation on
these models.
First Experiment Description. The dataset described in Table 1 is the input for the first
developed CNN model, the model architecture consists of 11 layers. In this experiment
the three datasets (LPDS, UPDS, and FPDS) applied and the accuracy is near to 99% as
shown in Fig. 4, also the loss is near to zero. This result is individual for each dataset type
standalone the result is binary and classify two families based on supervising training,
as shown in Fig. 4, the accuracy of fruit and lower leaf are better than the accuracy of
upper leaf and the best result with the fruit.
Fig. 4. Single Input CNN Model Accuracy (binary classification)
Second Experiment. The dataset described in Table 1 is the input for the first CNN
model, the model architecture consists of 11 layers. The input layer are three images
(lower, upper, and fruit) each one has dimension (200, 200).
In this experiment the three datasets (LPDS, UPDS, and FPDS) applied and the
accuracy is near to 99% as shown in Fig. 5, also the loss is near to zero. This result is
A New Deep Learning System for Wild Plants Classification
33
based on the three images added to the inputs parallel, the result is binary and classify
two families based on supervising training. The accuracy is stable and better than the
first experiment.
Fig. 5. Three-inputs CNN Model Accuracy (binary classification)
The results of a comparison of different binary classifiers applied on the dataset are
shown in Fig. 6, the best accuracy is 99.7% by using the Random Forest method.
Accuracy of Binary ClassificaƟon
100.00%
99.50%
99.50%
99.00%
99.70%
99.00%
99.00%
98.50%
Developed AlexNet Developed AlexNet
with single input with three inputs
SVM
RF
Fig. 6. Comparison of Binary Classification Accuracy
5.2 Species Identification (Categorical Classification)
The categorical classification problem is very important to build the digital library of
plants. In this section we implemented the same deep learning models with changing
in the output cost functions and number of classes to classify the plants into seventeen
plant of the same families.
Third Experiment. In this experiment we applied the same model implemented in the
first experiment with changing the number of classes in the output layer to 17 class
(Number of plants in the two families), with change the objective function from sigmoid
to the activation function calculation, that classify the 17 plant, Softmax function comes
34
N. M. A. Ibrahim et al.
to solve categorical classification problem its responsible for the final prediction layer,
and with using categorical entropy in loss calculation. We applied this experiment using
two dataset size and modifying the developed AlexNet CNN hyperparameters using
KERAS python package as shown in Table 2.
Table 2. Developed CNN hyper parameters.
Parameter
Value
Loss
Categorical cross entropy
Learning rate
0.0001
Activation function
Softmax
rho
0.9
The results from this experiment are the classification probabilities for 17 plants
using categorical entropy in loss calculation. As shown in Fig. 7 the accuracy and loss
for each training and testing of three datasets (LPDS, UPDS, and FPDS) with small
dataset samples is very bad, the average of validation accuracy is 6% and the average of
validation loss is 282%.
Fig. 7. CNN Plant Categorical Classification of 17 plants without augmentation.
Fourth Experiment (SVM). In this experiment, we were used the SVM method with
the parameter’s optimization. The best parameters are {‘C’: 10.0, ‘gamma’: 1e−08} with
a score of 1.00 and using the SKLEARN package from python language. The results
from this experiment we were used the SVM method with the parameter’s optimization,
the testing accuracy of 30% from the dataset is 96.7%.
Fifth Experiment (Random Forest). SKLEARN Python package was used to implement the RF (Random Forest) select the optimal parameters, and to evaluate the accuracy
as shown in Table 3.
Random forest method applied to classify 17 plants, 1106 samples the results of
important features are shown in Fig. 8, and the testing accuracy of 30% from the dataset
is 93%, 96%, and 96% respectively for the fruit, lower, and upper.
A New Deep Learning System for Wild Plants Classification
35
Table 3. Random forest parameters
Random forest
Max depth
None
Min. samples leaf
1
Min. samples split
2
Random state
None
Fig. 8. Random Forest visualizing the important features of 17 plants.
The results of a comparison of different methods implemented on the dataset are
shown in Fig. 9 the best accuracy is 98.2% by using the developed CNN model.
Accuracy Categorical ClassificaƟon
100
98
96
94
98
98
Developed AlexNet Developed AlexNet
with single input
with three inputs
96.7
96
SVM
RF
Accuracy Categorical
Fig. 9. Comparison of categorical classification accuracy
6 Conclusion and Recommendation for the Future Work
The purpose of the current study was to implement machine learning based tools to serve
a plants taxonomy. The wild plants dataset collected from its natural locality in Egypt.
The techniques that were compared in the family classifications (binary classification)
were the developed convolution neural network (CNN), support vector machine (SVM),
and the Random Forest. The highest level of accuracy obtained was 99.7% achieved
with the random forest method RF with the two samples classification, while support
36
N. M. A. Ibrahim et al.
vector machine (SVM), and CNN obtained 99.5%, and 99% accuracy, respectively. The
challenges in the species classification (categorical classification) not in the families,
and we obtained the excellent results in this area. The techniques that were compared in
the categorical classifications were the developed convolution neural network (CNN),
support vector machine (SVM), and the Random Forest. The highest level of accuracy
obtained was 98.2% achieved with the developed CNN with the 17 plants samples
classification, while support vector machine (SVM), and RF obtained 96.7%, and 96%
accuracy, respectively.
In the future, we recommend increasing the samples and implement the digital library
using website and mobile application to increase the wild plants samples and to facilitate
the biological researchers in the plant taxonomy.
References
1. Jana, B.K., Mukherjee, S.K.: Diversity of cypselar features of seven species of the Genus
Crepis L. in. Indian J. Fundam. Appl. Life Sci. 2(1), 54–58 (2012)
2. Lee, J.W., Chan Yoon, Y.: Fine-Grained Plant Identification using wide and deep learning
model 1. In: 2019 International Conference on Platform Technology and Service PlatCon
2019 - Proceedings, no. 2016, pp. 1–5 (2019). https://doi.org/10.1109/PlatCon.2019.8669407
3. Lee, S.H., Chan, C.S., Wilkin, P., Remagnino, P.: Deep-plant: plant identification with convolutional neural networks. In: Proceedings of the International Conference Image Processing
ICIP, vol. 2015, pp. 452–456, December 2015. https://doi.org/10.1109/ICIP.2015.7350839
4. Gyires-Tóth, B.P., Osváth, M., Papp, D., Szucs, G.: Deep learning for plant classification and
content-based image retrieval. Cybern. Inf. Technol. 19(1), 88–100 (2019). https://doi.org/
10.2478/CAIT-2019-0005
5. Dileep, M.R., Pournami, P.N.: AyurLeaf: a deep learning approach for classification of medicinal plants. In: IEEE Region 10 Annual International Conference Proceedings/TENCON, vol.
2019, pp. 321–325, October 2019. https://doi.org/10.1109/TENCON.2019.8929394
6. Kaya, A., Keceli, A.S., Catal, C., Yalic, H.Y., Temucin, H., Tekinerdogan, B.: Analysis of
transfer learning for deep neural network based plant classification models. Comput. Electron.
Agric. 158, 20–29 (2019). https://doi.org/10.1016/j.compag.2019.01.041
7. Picon, A., Alvarez-Gila, A., Seitz, M., Ortiz-Barredo, A., Echazarra, J., Johannes, A.: Deep
convolutional neural networks for mobile capture device-based crop disease classification in
the wild. Comput. Electron. Agric. 161, 280–290 (2019). https://doi.org/10.1016/j.compag.
2018.04.002
8. Johannes, A., et al.: Automatic plant disease diagnosis using mobile capture devices, applied
on a wheat use case. Comput. Electron. Agric. 138, 200–209 (2017). https://doi.org/10.1016/
j.compag.2017.04.013
9. Tan, J.W., Chang, S.W., Abdul-Kareem, S., Yap, H.J., Yong, K.T.: Deep learning for
plant species classification using leaf vein morphometric. IEEE/ACM Trans. Comput. Biol.
Bioinforma. 17(1), 82–90 (2020). https://doi.org/10.1109/TCBB.2018.2848653
10. Haupt, J., Kahl, S., Kowerko, D., Eibl, M.: Large-scale plant classification using deep
convolutional neural networks. In: CEUR Workshop Proceedings, vol. 2125, pp. 1–7 (2018)
11. Reyes, A.K., Caicedo, J.C., Camargo, J.E., Nari, U.A.: Fine-tuning deep convolutional
networks for plant recognition
12. He, K., Zhang, X., Ren, S., Sun, J.: Deep residual learning for image recognition. In: Proceedings of the Computer Society Conference on Computer Vision and Pattern Recognition,
vol. 2016, pp. 770–778, December 2016. https://doi.org/10.1109/CVPR.2016.90
A New Deep Learning System for Wild Plants Classification
37
13. Choi, S.: Plant identification with deep convolutional neural network: SNUMedinfo at LifeCLEF plant identification task 2015. In: CEUR Workshop Proceedings, vol. 1391, pp. 2–5
(2015)
14. Sun, Y., Zhu, L., Wang, G., Zhao, F.: Multi-input convolutional neural network for flower
grading, vol. 2017 (2017)
15. Low, D.G.: Distinctive image features from scale-invariant keypoints. Int. J. Comput. Vis.,
91–110 (2004). https://www.cs.ubc.ca/~lowe/papers/ijcv04.pdf
16. Xiao, J., Wang, J., Cao, S., Li, B.: Application of a Novel and Improved VGG-19 Network
in the Detection of Workers Wearing Masks Application of a Novel and Improved VGG-19
Network in the Detection of Workers Wearing Masks (2020). https://doi.org/10.1088/17426596/1518/1/012041
17. Zhang, S., Huang, W., Huang, Y., Zhang, C.: Neurocomputing Plant species recognition
methods using leaf image: Overview, vol. 408, pp. 246–272 (2020). https://doi.org/10.1016/
j.neucom.2019.09.113
18. Ullah, M.I., Attique, M., Sharif, M., Ahmad, S., Bukhari, C.: Data in brief a citrus fruits and
leaves dataset for detection and classification of citrus diseases through machine learning,
vol. 26 (2019). https://doi.org/10.1016/j.dib.2019.104340
19. Mahajan, S., Raina, A., Gao, X.Z., Pandit, A.K.: Plant recognition using morphological feature
extraction and transfer learning over SVM and adaboost. Symmetry (Basel) 13(2), 1–16
(2021). https://doi.org/10.3390/sym13020356
20. Wang, X., Zhang, C., Zhang, S.: Multiscale convolutional neural networks with attention
for plant species recognition. Comput. Intell. Neurosci. 2021 (2021). https://doi.org/10.1155/
2021/5529905
21. Hearst, B.S.M.A., Dumais, S.T., Osuna, E., Platt, J.: Support vector machines. IEEE Intell.
4(1), 18–28 (1998)
22. Krizhevsky, A., Sutskever, I., Hinton, G.E.: ImageNet classification with deep convolutional
neural networks. In: ACM International Conference Proceedings Series., pp. 145–151 (2020).
https://doi.org/10.1145/3383972.3383975
23. Gogul, I., Kumar, V.S.: Flower species recognition system using convolution neural networks
and transfer learning. In: 2017 4th International Conference on Signal Processing, Communication and Networking ICSCN 2017, pp. 1–6 (2017). https://doi.org/10.1109/ICSCN.2017.
8085675
A Novel Weighted Fractional TDGM Model
and Quantum Particle Swarm Optimization
Algorithm for Carbon Dioxide Emissions
Forecasting
Ani Shabri(B)
Department of Mathematic, Science Faculty, University Technology of Malaysia, UTM,
81310 Skudai, Johor, Malaysia
ani@utm.my
Abstract. This paper will present a novel weighted fractional TDGM(1,1) (WFTDGM) model based on the combination of the weighted fractional-accumulation
generating operator (FAGO) and the TDGM(1,1) model. The suggested WFTDGM model would be able to reduce the traditional TDGM(1,1) model and the
fractional TDGM(1,1), or FTDGM model when the parameters are adjusted differently. Hence, the quantum particle swarm optimization algorithm will be used
to select the optimal parameters for the proposed model to achieve the best accuracy precision. Whereas the least squares estimate method is used to determine
the remaining model parameters. Twenty numerical samples selected from various
countries presented in this paper will be used as the case study. When compared
to the other conventional grey models such as the GM(1,1), FGM(1,1), TDGM,
and FTDGM models, the computational results indicate that the proposed model
has the best forecast performance compared to the other models.
Keywords: Grey model · Fractional-accumulation generating operator ·
Quantum particle swarm optimization algorithm · ANN
1 Introduction
In recent years, climate change has moved to the top of global political agendas, with
significant economic repercussions. According to scientific sources, the most major
contributor to the global warming phenomena is the release of greenhouse gases (GHGs),
especially carbon dioxide (CO2) [1]. Human activity produces CO2 mostly through
the burning of fossil fuels and deforestation. According to international statistics, the
shipping, international aviation, and transportation sectors have had the most rises in
GHG emissions over the last decade, while other sectors have seen declines. Due to these
several factors, an accurate CO2 emission forecasting report for the next decade is critical
for the concern of current economic and political issues [1]. A handful of techniques
have been presented in multiple studies to model and forecast the CO2 emission time
series related data.
© The Author(s), under exclusive license to Springer Nature Switzerland AG 2022
F. Saeed et al. (Eds.): IRICT 2021, LNDECT 127, pp. 38–49, 2022.
https://doi.org/10.1007/978-3-030-98741-1_4
A Novel Weighted Fractional TDGM Model
39
Several techniques have been implemented in these studies to forecast CO2 emissions
data, including statistical models such as Holt-Winters and exponential smoothing [1],
the ARIMA model [2, 3], logistic equations [4], and regression models [2, 4, 5]. However, statistical approaches to forecasting accuracy often necessitate a large amount of
data that complies with particular statistical assumptions [6]. As the nature of CO2 emissions data fluctuates, some artificial intelligent forecasting methods, such as the artificial
neural networks (ANN) [1, 7, 8], fuzzy regression [9], and hybrid models [10], have been
applied to forecast CO2 emissions related data. The amount of training data and its representativeness, on the other hand, are limits that affect predicting effectiveness, and both
issues have yet to be resolved. In all of the following methodologies, the sample size is a
significant issue, restricting their applicability to specific forecasting situations [11].
Grey system theory was proposed by Deng [12] as a solution to problems involving
limited, partial, and/or unpredictable data. The grey model, or commonly known in the
form of GM (1,1) is commonly used to forecast CO2 emissions, along with its variation
such as Pao et al. [15] proposed a nonlinear grey Bernoulli model (NGBM(1,1)), Lin
et al. [16] proposed a nonlinear GM(1,1) model, Xu et al. [17] proposed an adaptive grey
model, and Wang and Li [18] proposed a grey Verhulst model. Despite the implementation of grey models, these models were developed in response to various challenges,
which pushed us to continue developing a more diversely acceptable grey model in
the study of CO2 emissions forecasting. Many researchers have worked on different
aspects of the GM(1,1) model to improve prediction performance, including attempting
to build more accurate background value formulas [19, 20], improving initial guess [21],
exploring different accumulation generating operators [22–24], and selecting parameter
optimization techniques [25].
In addition, Xie and Liu [26] devised the discrete grey model, abbreviated as
DGM(1,1), to solve the GM(1,1) model’s inherent flaws caused by converting discrete data into continuous series. Following that, Xie et al. [27] developed the nonhomogeneous discrete grey model (NDGM(1,1)) and to improve the modeling performance of the NDGM(1,1) model, Zhang and Liu [28] suggested the time-varying
parameters discrete grey prediction model TDGM(1,1). As a result, it is proved that using
time-varying parameters is a practical technique for dealing with the normal volatility
and nonlinearity present in most real-world problems.
The accumulated generating operation (AGO) is the central idea of grey system theory, as its purpose is to convert raw data unpredictability into a monotonically rising
series. The one-order accumulated generating operation (1-AGO) is commonly served
as the identification for the GM(1,1) model. However, the one issue with 1-AGO is
that each sample is given the same weightage throughout the whole system [29]. In
recent decades, numerous research has suggested that the fractional accumulated generating operation (F-AGO) can improve the performance of the GM(1,1) model. Wu
[30, 31] was the first to incorporate the F-AGO with GM(1,1) model, known as the
FGM(1,1) model, which results proven to outperform GM (1,1) model. FGM(q,1) model
[32], FNGBM(1,1) model [33], fractional non-homogeneous grey model [34], and discrete fractional grey model [35] are some of the additional grey models that have been
presented and effectively used in many practical applications based on the concept of
F-AGO.
40
A. Shabri
As the AGO is the main focus of this research in this paper, we first try to construct
a weighted F-AGO (WF-AGO), which is based on the new information priority concept
and the F-AGO. The WF-AGO has two parameters that can change the summing order
based on different data sequences and represent information priority variations. The
effectiveness and practicality of a new WFTDGM model are compared to the GM(1,1),
FGM(1,1), TDGM(1,1), and FTDGM(1,1) models in this study. Furthermore, the quantum particle swarm optimization (QPSO) method is used to find the optimal parameters
by generating a nonlinear optimization problem for predicted value [36, 37].
The content of this study is organised as follows: Sect. 2.1 discusses the WF-AGO
and its inverse. The WF-AGO linear time-varying parameters discrete grey model is
introduced in Sect. 2.2. The proposed QPSO and WTDGM are described in Sect. 2.3.
The experimental findings of the CO2 emissions forecast performance of the various grey
models evaluated are presented in Sect. 3. Section 4 has a discussion and conclusions.
2 Materials and Methods
2.1 The Weighted Fractional Accumulation Generating Operator and Their
Inverse
(0) (0)
(0)
(0)
of size n, and the 1st
Assume the time series x(0) = x1 , x2 , . . . , xk , . . . , xn
order-fractional accumulation generating
operator (1-AGO) of x(0) can be written as
(1)
(0)
(1) (1)
(1)
(1)
xk = ki=1 xi where x(1) = x1 , x2 , . . . , xk , . . . , xn and k = 1, 2, …, n.
The fractional order-accumulation generating operator (F-AGO) is defined as
follows:
k r (0)
(r)
xk =
(1)
xi
i=1 k − i
or in matrix form as x(r) = Ar x(0) where
⎛
r
0
⎜
0
0
⎜
r
⎜
r
0
⎜
0
⎜
1
r
⎜
r
⎜
r
r
0
A =⎜
⎜
1
..
⎜
2
..
⎜
.
.
⎜
.
..
⎜
r
⎜
r
⎝
r
n−3
n−2
n−1
⎞
···
···
···
..
.
···
⎟
⎟
⎟
⎟
⎟
⎟
⎟
⎟
⎟
⎟
⎟
r ⎟
⎟
0 ⎟
⎠
0
0
0
..
.
(2)
(rλ) (rλ)
(rλ)
(rλ)
where
The WF-AGO of x(0) can be written as x(rλ) = x1 , x2 , . . . , xk , . . . , xn
r
(rλ)
(0)
xk = ki=1
λk−i xi . WF-AGO can be represented in matrices formula x(rλ) =
k −i
A Novel Weighted Fractional TDGM Model
41
Arλ x(0) where
⎛
Arλ
⎜
⎜
⎜
⎜
⎜
⎜
⎜
=⎜
⎜
⎜
⎜
⎜
⎜
⎜
⎝
r
0
0
r
r
λ
0
1
r
λ
r 2
λ
1
2
..
..
.
.
r
λn−2
r
λn−1
n−2
n−1
⎞
0
0
r
0
..
.
r
λn−3
n−3
···
···
···
..
.
···
⎟
⎟
⎟
⎟
⎟
⎟
⎟
⎟
⎟
⎟
⎟
r ⎟
⎟
0 ⎟
⎠
0
0
0
..
.
(3)
1n=0
r
= r(r+1)...(r+n+1)
n
n ∈ N+
n!
When r = λ = 1, the WF-AGO will be reduced in the form of 1-AGO. While when
λ = 1, the WF-AGO will be reduced in the form of F-AGO. The inverse of WF-AGO is
defined as
⎛
⎞
−r
0
⎜
⎟
0
0
⎜
⎟
0
−r
⎜
⎟
−r
···
0
⎜
⎟
λ
0
0
⎜
⎟
···
−r
⎜ 1
⎟
0
−r
⎜
⎟
λ
⎟ (4)
−r 2
···
0
A−rλ = ⎜
.
⎜
⎟
λ
1
..
..
..
⎜
⎟
2
..
.
⎜
⎟
.
..
⎜
⎟
−r
.
⎜
⎟
.
−r
n−3 · · ·
⎜
⎟
λ
0
−r
n−2
⎝
⎠
λ
−r
n−3
n−1
λ
n−2
n−1
where
The relation between x(0) and x(rλ) is as shown:
x(0) = A−rλ x(rλ)
(5)
When r = λ = 1, x(0) = A−1 x(1) . A−1 is the inverse of 1-AGO and can be denoted as
⎛
−1
A
1 0
⎜ −1 1
⎜
⎜
= ⎜ 0 −1
⎜ .
..
⎝ ..
.
0 0
0
0
1
..
.
···
···
···
..
.
0
0
0
..
.
0 ··· 1
⎞
⎟
⎟
⎟
⎟
⎟
⎠
(6)
42
A. Shabri
Similarly, when λ = 1, x(0) = A−r x(r) . We refer to A−r as the inverse of F-AGO and
can be denoted as
⎛
⎞
−r
0
⎜
⎟
0
0
⎜
⎟
0
−r
⎜
⎟
−r
···
0
⎜
⎟
λ
0
0
⎜
⎟
···
−r
⎜ 1
⎟
0
−r
⎜
⎟
−rλ
λ
⎜
⎟ (7)
−r
·
·
·
0
A
=⎜
..
⎟
λ2
1
.
.
⎜
.
2
.. ⎟
..
..
⎜
⎟
..
⎜
.
−r ⎟
⎜
⎟
·
·
·
.
−r
⎜
⎟
λn−3
−r
0
n−2
⎝
⎠
λ
−r
n−3
n−1
λ
n−2
n−1
2.2 The Weighted of Fractional-Order of TDGM Model
The DGM(1,1), given by (Wu et al. 2013) as:
(1)
(1)
xk+1 = axk + b, k = 1, 2, . . . , n − 1
(8)
(1)
(0)
(0) (0)
(0)
where xk = ki=1 xi and x(0) = x1 , x2 , . . . , xn indicate the original value of
size n. The least-square method is used to estimate the parameters of DGM(1,1) model
as shown:
−1
a
XTY
(9)
= XTX
b
where
⎛ (1) ⎞
⎞
(1)
x 1
x2
⎜ 1(1) ⎟
⎜ (1) ⎟
⎜ x2 1 ⎟
⎜ x3 ⎟
⎜
⎟
⎟
Y =⎜
⎜ .. ⎟ and X = ⎜ .. .. ⎟
⎝ . . ⎠
⎝ . ⎠
(1)
(1)
xn−1 1
xn
⎛
(10)
The TDGM is denoted by
(1)
(1)
xk+1 = (ak + b)xk + ck + d , k = 1, 2, . . . , n − 1
(11)
The least-squares estimate method is used to solve the TDGM model’s parameters, as
defined below:
⎡ ⎤
a
⎢ b ⎥ T −1 T
⎢ ⎥= X X
X Y
(12)
⎣c⎦
d
A Novel Weighted Fractional TDGM Model
43
where
⎛
(1)
⎞
x1
(1)
x2
(1)
⎜
2x2
⎜
⎜ (1) ⎟
⎜
⎜ x3 ⎟
..
⎜
⎟
Y =⎜
.
⎜ .. ⎟ and X = ⎜
⎜
⎝ . ⎠
(1)
⎝
−
2)x
(n
(1)
n−2
xn
(1)
(n − 1)xn−1
⎛
(1)
x1
(1)
x2
..
.
(1)
xn−2
(1)
xn−1
⎞
1
1⎟
⎟
.. ⎟
⎟
.⎟
⎟
n − 2 1⎠
n−11
1
2
..
.
(13)
The TDGM model predicted value is as follows:
x̂(0) = A−1 x̂(1)
(1)
(14)
(1)
where x̂k+1 = (ak + b)x̂k + ck + d , k = 1, 2, . . . , n − 1.
The WFTDGM is denoted by
(rλ)
(rλ)
xk+1 = (ak + b)xk
+ ck + d , k = 1, 2, . . . , n − 1
(15)
The parameters of the WFTDGM(1,1) model can be estimated using the following
formula:
⎡ ⎤
a
⎢ b ⎥ T −1 T
⎢ ⎥= X X
X Y
(16)
⎣c⎦
d
where
⎛
⎛
⎞
(rλ)
x
⎜ 2(rλ) ⎟
⎜ x3 ⎟
⎜
⎟
(rλ)
x1
(rλ)
2x2
..
.
(rλ)
x1
(rλ)
x2
..
.
⎜
⎜
⎜
Y = ⎜ . ⎟ and X = ⎜
⎜
.
⎜
⎝ . ⎠
(rλ) (rλ)
⎝ (n − 2)xn−2
xn−2
(rλ)
xn
(rλ) (rλ)
(n − 1)xn−1 xn−1
⎞
1
1⎟
⎟
.. ⎟
⎟
.⎟
⎟
n − 2 1⎠
n−11
1
2
..
.
The predicted value of WFTDGM model is as shown:
k −r
(0)
(rλ)
−rλ (rλ)
(0)
x̂ = A x̂
or x̂k =
λk−i x̂i
i=1 k − i
(rλ)
(rλ)
where x̂k+1 = (ak + b)x̂k
+ ck + d , k = 1, 2, . . . , n − 1
(17)
(18)
(19)
When r = λ = 1, the WFTDGM model produces the simple form of TDGM(1,1) model,
while when λ = 1 and 0 < r < 1, it produces the FTDGM model. The WFTDGM
model is thus a generalisation of the TDGM(1,1) and FTDGM models.
44
A. Shabri
2.3 Quantum Particle Swarm Optimization Algorithm Weighted
of Fractional-Order of WFGM Model
The model’s parameter λ and r shall be calculated in advance to construct the WFAGO sequence. The WFTDGM model’s prediction performance is directly influenced
by these parameters. To identify the best fitting parameters and forecast accuracy, the
mean absolute percentage error (MAPE) is used in this research. To summarize, the
minimization problem below can be used to discover the optimal choices for λ and r.
(0)
n (0)
1 x̂k − xk
× 100%
min MAPE =
(0)
n
xk
k=1
⎧
0<r≤1
⎪
⎪
⎪
⎪
0
<λ≤1
⎪
⎪
⎪
⎪
−1 T
⎪
a
⎪
⎪
= XTX
X Y
⎪
⎪
b
⎨
(rλ)
(rλ)
s.t. x̂k+1
(20)
= (ak + b)x̂k + ck + d
⎪
⎪
⎪
−r
(0)
(rλ)
⎪
⎪
x̂k = ki=1
λk−i x̂i
⎪
⎪
k
−
i
⎪
⎪
⎪
⎪
⎪
⎪
⎩
k = 1, 2, . . . , n
The problem formulation presented above is nonlinear, non-differentiable, and difficult to solve in general. To identify the most optimum solution, we must first identify the
parameters a, b, c, and d. The quantum particle swarm optimization (QPSO) method is
used to efficiently obtain a quasi-optimal solution to Eq. (20). The QPSO algorithm incorporates quantum physics into the main Particle Swarm Optimization (PSO) algorithm
to ensure global convergence. QPSO outperforms traditional PSO on some benchmark
issues [36, 37]. Because Eq. (16) is complicated, it would be difficult to generate analytic
findings for the optimum values of r and λ. As demonstrated below, the QPSO is used
to discover the optimal values of r and λ.
Since there are just two variables, r and λ, only two-dimensional problem needs
to be investigated. Assuming that Ei1 (l) and Ei2 (l) are the solutions for the parameters r and λ, respectively. Let l = 1, Pi1 (1) = Ei1 (1) and Pi2 (1) = Ei2 (1) for
i = 1, 2, . . . , m, in the first iteration. Next, (Ei1 (l), Ei2 (l))T denotes its coordinate and
Ei1 (l) denotes the position of the ith particle. Furthermore, the ith particle’s optimal
position at the lth iteration, Pi (l), is referred to as “pbest”, while the global optimal
position,Pg (l), is referred to as “gbest”. Hence, Pg (l) is given by
Pg1 (l) ∼ r(l)
Pg (l) =
= gbest
(21)
=
Pg2 (l)
λ(l)
where g = arg min MAPE(Pi (l)). The position of each particle is updated using the
1≤l≤m
following rule (Ei1 (l + 1), Ei2 (l + 1))T at the (l + 1) th iteration.
Eid (l + 1) = Wid (l) ± α|Cd (l) − Eid (l)|.ln
1
uid (l)
(22)
A Novel Weighted Fractional TDGM Model
where Wid (l) = φd (l)Pid (l) + (1 − φd (l))Pgd (l), Cd (l) =
0.5(lmax −l)
,
l
1
m
m
45
Pid (l), α = 0.5 −
i=1
φd (l) = uid (l) ∼ U (0, 1), d = 1, 2 and lmax is the maximum iteration
number.
We will use the QPSO algorithm to optimize the order number of the WFTDGM
model in this section. The procedure for determining the WFTDGM model’s optimal
solution order is as follows.
Step 1: Determine the initial parameters r and λ, and the data set x(0) .
Step 2: Calculate the WF-AGO, x(rλ) = Arλ x(0) .
Step 3: Solve the parameters β = [a, b, c, d ] using Eq. (16).
(rλ)
Step 4: Calculate the approximated values x̂k+1 and predicated x̂(0) using Eq. (19).
Step 5: Find the optimal parameters r and λ use the QPSO algorithm to minimize the
MAPE as shown below.
i.
ii.
iii.
iv.
v.
Set settings such as the particle swarm size, iteration step size, and termination
criteria, as well as the position of the population particles.
Calculate the fitness value of each particle using MAPE as the fitness function.
To update the particle position, use Eq. (17).
The fitness number of each particle is calculated, as well as the individual optimal
position pbest, Pid (l), the global optimal position gbest, Pgd (l) and the group ideal
center, Cd (l) are changed based on the value of optimal fitness.
Repeat step (iv) if the algorithm fails to meet the convergence rule; if it does,
continue with step 6.
(rλ)
Step 6: Find the optimal parameters r ∗, λ ∗, the associated optimal fitted x̂k and
the predicted values x̂(0) .
Using the procedure outlined above, the modelling flow chart of QPSO-WFTDGM
can be drawn as shown in Fig. 1.
3 Experiment Results
Annual total CO2 emissions from the top 20 countries, as published by the International
Energy Agency [38] and Hu et al. [39], are used to compare the precision of the proposed
WFTDGM model. Data from 2003 to 2013 was used to build the prediction model, and
data from 2014 to 2017 was used to test its accuracy.
Annual total CO2 emissions from the top 20 countries, as published by the International Energy Agency [38] and Hu et al. [39], are used to compare the precision of the
proposed WFTDGM model. Data from 2003 to 2013 was used to build the prediction
model, and data from 2014 to 2017 was used to test its accuracy.
The proposed WFTDGM model’s forecasting performance is compared to that of
TDGM, FTDGM, and Hu et al. [39] GM(1,1) and FGM(1,1) models result. The population size of QPSO is set to 5 in the proposed WFTDGM model, and the maximum
number of iterations is set to 500 times as the stop condition. All of the computations
46
A. Shabri
Fig. 1. The QPSO-WFTDGM model’s flowchart
were done in Matlab. Table 1 summarizes the MAPE and rank of five different models
for the testing data. For 8 of the 20 datasets, the proposed WFTDGM ranked the highest
against other models. The average MAPE value of the proposed WFTDGM model is
lower than the MAPE values of the other prediction models, as seen in Table 1.
To evaluate the performance of the considered prediction models, the average rank of
prediction models denoted by Rj (j = 1, 2, ..., 5) was used to the 20 datasets. When the
average rank was lower, the prediction model performed better. As presented in Table
1, R1 = 2.95, R2 = 2.55, R3 = 3.0, R4 = 3.1 and R5 = 3.4 were obtained for TDGM,
WFTDGM, FTDGM, FGM(1,1) and GM(1,1), respectively. Table 1 also shows that the
proposed WFTDGM model has a lower average rank than the others as the proposed
WFTDGM model outperformed the TDGM, FTDGM, GM(1,1), and FGM(1,1) models
in terms of efficiency.
Table 1. MAPE and the rank of different prediction models for testing data.
Country
MAPE
The rank of prediction model (Rj )
TDGM
WFTD
GM
FTD
GM
FGM
GM
TDGM
WFTD
GM
FTD
GM
FGM
GM
China
12.1
11.2
11.3
15.8
23.2
3
1
2
4
5
USA
4.6
6.1
4.6
0.9
2.7
3
5
4
1
2
(continued)
A Novel Weighted Fractional TDGM Model
47
Table 1. (continued)
Country
MAPE
The rank of prediction model (Rj )
TDGM
WFTD
GM
FTD
GM
FGM
GM
TDGM
WFTD
GM
FTD
GM
FGM
GM
Russia
4.2
0.9
4.1
2.7
5.4
4
1
3
2
5
India
3.8
4.5
4.6
3.0
10.2
2
3
4
1
5
Japan
7.2
1.1
7.2
22.6
4.5
4
1
3
5
2
Germany
1.4
1.4
1.4
1.1
1.2
4
3
5
1
2
Canada
2.5
3.0
2.5
3.2
1.7
2
4
3
5
1
Korea
9.8
8.3
8.8
5.4
6.9
5
3
4
1
2
UK
6.3
2.0
6.2
10.6
9.2
3
1
2
5
4
Iran
1.3
2.2
1.4
4.5
4.1
1
3
2
5
4
Mexico
5.8
0.6
5.8
3.5
7.4
4
1
3
2
5
Italy
3.5
3.9
3.5
7.1
3.2
2
4
3
5
1
S. Africa
4.6
2.5
4.5
5.3
5.6
3
1
2
4
5
Saudi
3.5
4.6
5.0
2.9
6.9
2
3
4
1
5
Australia
3.3
3.9
3.4
3.1
3.6
2
5
3
1
4
Indonesia
3.2
3.6
3.6
3.1
3.8
2
3
4
1
5
Brazil
12.3
10.8
12
29.0
12.1
4
1
2
5
3
France
3.8
3.4
3.8
3.8
3.4
4
1
3
5
2
Poland
3.5
3.5
3.5
4.0
4.0
3
2
1
4
5
Spain
11.6
15.2
13.5
14.3
8.3
2
5
3
4
1
Average
5.41
4.63
5.53
7.29
6.4
2.95
2.55
3.00
3.10
3.40
4 Conclusions
The weighted fractional orders with a time-delayed fractional grey model (WFTDGM)
were presented in this paper. The optimum values for two different fractional orders
were then obtained using the QPSO method. The efficiency of QPSO and WFTDGM
was demonstrated using the results of numerical testing with twenty real-world datasets
when compared to the original GM(1,1), FGM(1,1), TDGM(1,1), and FTDGM(1,1)
models.
According to the findings, the proposed WFTDGM model outperformed the other
four conventional grey models. Furthermore, the findings of this paper demonstrated that
the proposed WFTDGM model was capable of forecasting CO2 emissions and might
be considered a new method to fractional grey modeling in the future, with the ability
to build more fractional grey models with reliable results.
48
A. Shabri
Acknowledgments. The authors are grateful to the Ministry of Higher Education Malaysia and
Universiti Teknologi Malaysia for fully supporting and funding this research project through the
Fundamental Research Grant Scheme under Grant Vot 5F271.
References
1. Tudor, C.: Predicting the evolution of CO2 emissions in bahrain with automated forecasting
methods. Sustainability 6(923), 1–10 (2016)
2. Liu, L., Zong, H., Zhao, E., Chen, C., Wang, J.: Can China realize its carbon emission reduction
goal in 2020: from the perspective of thermal power development. Appl. Energy 124, 199–212
(2014)
3. Pao, H.T., Tsai, C.M.: Modeling and forecasting the CO2 emissions, energy consumption,
and economic growth in Brazil. Energy 36, 2450–2458 (2011)
4. Piecyk, M., McKinnon, A.C.: Forecasting the carbon footprint of road freight transport in
2020. Int. J. Prod. Econ. 128(1), 31–42 (2010)
5. Hosseini, S.M., Saifoddin, A., Shirmohammadi, R., Aslani, A.: Forecasting of CO2 emissions
in Iran based on time series and regression analysis. Energy Rep. 5, 619–631 (2019)
6. Lee, Y.S., Tong, L.I.: Forecasting energy consumption using a grey model improved by
incorporating genetic programming. Energy Convers. Manag. 52, 147–152 (2011)
7. Mason, K., Duggan, J., Howley, E.: Forecasting energy demand, wind generation and carbon
dioxide emissions in Ireland using evolutionary neural networks. Energy 155, 705–720 (2018)
8. Wen, L., Yuan, X.: Forecasting CO2 emissions in Chinas commercial department, through BP
neural network based on random forest and PSO. Sci. Total. Environ. 718, ID137194 (2020)
9. Pao H.T., Fu H.F., Tseng C.L.: Forecasting of CO2 emissions, energy consumption and
economic growth in China using an improved grey model. Energy 40(1), 400–409 (2012)
10. Sun, W., Wang, C., Zhang, C.: Factor analysis and forecasting of CO2 emissions in Hebei,
using extreme learning machine based on particle swarm optimization. J. Clean. Prod. 162,
1095–1101 (2017)
11. Pi, D., Liu, J., Qin, X.: A grey prediction approach to forecasting energy demand in China.
Energy Sources Part A Recover. Util. Environ. Eff. 32, 1517–1528 (2010)
12. Deng, J.L.: Control problems of grey systems. Syst. Control Lett. 1, 288–294 (1982)
13. Liu, S., Lin, Y.: Grey Information: Theory and Practical Applications. Springer, London
(2010)
14. Liu, S., Yang, Y., Forrest, J.: Grey Data Analysis: Methods, Models and Applications.
Springer, Berlin (2017)
15. Pao, H.T., Fu, H.C., Tseng, C.L.: Forecasting of CO2 emissions, energy consumption and
economic growth in China using an improved grey model. Energy 40, 400–409 (2012)
16. Lin, C.S., Liou, F.M., Huang, C.: Grey forecasting model for CO2 emissions: a Taiwan study.
Appl. Energy 88, 3816–3820 (2011)
17. Xu, N., Ding, S., Gong, Y., Bai, J.: Forecasting Chinese greenhouse gas emissions from energy
consumption using a novel grey rolling model. Energy 175, 218–227 (2019)
18. Wang, Z.X., Li, Q.: Modelling the nonlinear relationship between CO2 emissions and economic growth using a PSO algorithm based grey Verhulst model. J. Clean. Prod. 207, 214–224
(2019)
19. Zeng, B., Li, C.: Improved multi-variable grey forecasting model with a dynamic backgroundvalue coefficient and its application. Comput. Ind. Eng. 118, 278–290 (2018)
20. Ye, J., Dang, Y., Li, N.: Grey-Markov prediction model based on background value optimization and central-point triangular whitenization weight function. Commun. Nonlinear Sci.
Numer. Simul. 54, 320–330 (2018)
A Novel Weighted Fractional TDGM Model
49
21. Wang, Y., Dang, Y., Li, Y., Liu, S.: An approach to increase prediction precision of GM(1,1)
model based on optimization of the initial condition. Expert Syst. Appl. 37(8), 5640–5644
(2010)
22. Song, Z.M., Deng, J.L.: The accumulated generating operation in opposite direction and its
use in grey model GOM(1,1). Syst. Eng. 19(1), 66–69 (2001)
23. Yang, B.H., Zhang, Z.Q.: The grey model has been accumulated generating operation in
reciprocal number and its application. Math. Practice Theory 33(10), 21–25 (2003)
24. Qian, W.Y., Dang, Y.G., Wang, Y.M.: GM(1,1) model based on weighting accumulated
generating operation and its application. Math. Practice Theory 39(15), 48–51 (2009)
25. Li, D.C., Chang, C.J., Chen, C.C., Chen, W.C.: Forecasting short-term electricity consumption
using the adaptive grey-based approach-an Asian case. Omega 40(6), 767–773 (2012)
26. Xie, N.M., Liu, S.F.: Discrete grey forecasting model and its optimization. Appl. Math. Model
33(2), 1173–1186 (2009)
27. Xie, N.M., Liu, S.F., Yang, Y.J.: On novel grey forecasting model based on nonhomogeneous
index sequence. Appl. Math. Model 37(7), 5059–5068 (2013)
28. Zhang, K., Liu, S.F.: Linear time-varying parameters discrete grey forecasting model. Syst.
Eng. Theory Pract. 30(9), 1650–1657 (2010)
29. Zeng, B., Meng, W.: Research on Fractional Accumulating Generation Operators and Grey
Prediction Models. Scientific Press, Beijing (2015)
30. Wu, L.F., Liu, S.F., Yao, L.G.: Grey system model with the fractional accumulation. Commun.
Nonlinear Sci. Numer. Simul. 18(7), 1775–1785 (2013)
31. Wu, L.F., Liu, S.F., Chen, D.: Using gray model with fractional accumulation to predict gas
emission. Nat. Hazards 71(3), 2231–2236 (2014)
32. Mao, S., Gao, M., Xiao, X., Zhu, M.: A novel fractional grey system model and its application.
Appl. Math. Model 40, 5063–5076 (2016)
33. Wu, L., Liu, S., Yao, L., Yan, S.: The effect of sample size on the grey system model. Appl.
Math. Model. 37, 6577–6583 (2013)
34. Wu, W., Ma, X., Zhang, Y., Li, W., Wang, Y.: A novel conformable fractional nonhomogeneous
grey model for forecasting carbon dioxide emissions of BRICS countries. Sci. Total. Environ.
707, ID135447 (2020)
35. Gao, M., Mao, S., Yan, X., Wen, J.: Estimation of Chinese CO2 emission based on a discrete
fractional accumulation grey model. J. Grey Syst. 27, 114–130 (2015)
36. Singh, M.R., Mahapatra, S.S.: A quantum behaved particle swarm optimization for flexible
job shop scheduling. Comput. Ind. Eng. 93, 36–44 (2016)
37. Shen, Q.Q., Shi, Q., Tang, T.P., Yao L.Q.: A novel weighted fractional GM(1,1) model and
its applications. 1–20, ID 6570683 (2020)
38. International Energy Agency. Key World Energy Statistics 2019; IEA/OECD: Paris, France
(2019)
39. Hu, Y.C., Jiang, P., Tsai, J.F., Yu, C.Y.: An optimized fractional grey prediction model for
carbon dioxide emissions forecasting. Int. J. Environ. Res. Public Health 18(2), 587 (2021)
Text Detergent: The Systematic Combination
of Text Pre-processing Techniques for Social
Media Sentiment Analysis
Ummu Hani’ Hair Zaki(B) , Roliana Ibrahim, Shahliza Abd Halim,
and Izyan Izzati Kamsani
School of Computing, Faculty of Engineering, Universiti Teknologi Malaysia,
81300 Skudai, Malaysia
uhani8@graduate.utm.my, {roliana,shahliza,izyanizzati}@utm.my
Abstract. During catastrophes such as natural or man-made disasters, social
media services have evolved into a crucial tool utilised by communities to disseminate information. Because a vast number of social media data is being used for
many applications, including sentiment analysis, sentiment analysis has become a
very useful and demanding problem. Social media data cannot be applied directly
because it is raw and unstructured or semi-structured data. Consequently, text
pre-processing becomes one of the most important tasks because the process is
strongly constrained by its dependable workflow. This reason creates a complex
pattern in pre-processing workflows. For this purpose, different text pre-processing
techniques have been used on Twitter, Facebook, and YouTube datasets to study
the impact of different pre-processing techniques on the accuracy of machine
learning algorithms. This paper applied different text pre-processing techniques
in a specific sequence based on significance testing. This study examines their
influence on sentiment classification accuracy using a machine learning classifier,
Support Vector Machines (SVM). Results proved that applying all 14 techniques
systematically can achieve up to 82.57% of the accuracy of the SVM classifier with
unigram representations. By using Text Detergent, the YouTube dataset achieve
the highest accuracy compared to Facebook and Twitter datasets. This will potentially improve the quality of the text and leads to better feature extraction, which
in turn helps the sentiment analyst produce a better classifier.
Keywords: Social media · Text pre-processing · Support vector machine ·
Classification · Accuracy
1 Introduction
The data received through social media is either incomplete or noisy, which can lead
to serious problems and wastage of precious time in a critical scenario such as disaster
events. The information available from social media users is more likely to have grammatical or spelling errors, punctuation signs to emphasize emotions like many exclamation marks, and slang, which makes it challenging for both humans and machines to
© The Author(s), under exclusive license to Springer Nature Switzerland AG 2022
F. Saeed et al. (Eds.): IRICT 2021, LNDECT 127, pp. 50–61, 2022.
https://doi.org/10.1007/978-3-030-98741-1_5
Text Detergent: The Systematic Combination of Text Pre-processing Techniques
51
decipher the accurate meaning of sentences [1]. In this paper, the term “noise” refers
to data that provides no useful information for analysis, which in this case is sentiment
analysis. Even though sometimes this kind of noise is easily comprehended by humans, a
machine cannot detect it, especially in the case of social media data [2]. Some noises can
be omitted, substituted, or mixed with others so that they do not have to be included in the
machine learning stage. By using suitable text pre-processing techniques in such a way
that pre-processing does not degrade classification performance, but rather improves it.
Through our observation and analysis, many pre-processing techniques have been
implemented. However, most of them focused only on specific social media services,
for example, Twitter. In addition, only a few focus on the sequence of pre-processing
techniques. In conclusion, no work has been done on the comparison of different social
media service data on the recommended pre-processing techniques. Nonetheless, the
great news is, this paper explores exactly how to use “text detergent” to clean through
the noise of social media data to find the information that matters by applying the most
suitable pre-processing steps in a systematic order. The emergence of “text detergent” –
as a cleansing solution for this noisy data is becoming a key factor through the preprocessing step of social media sentiment analysis.
The key contributions of this paper are (1) utilizing different pre-processing techniques on Facebook, Twitter, and YouTube data and performing analysis on their impact
on sentiment classification using disaster based topics; (2) a systematic sequence of
pre-processing techniques based on significance testing (p-value approach); and (3)
comprehensive experiments on disaster based topic datasets are conducted which manifest that the accuracy of the machine learning algorithm is considerably enhanced when
combined with a variety of pre-processing techniques in systematic order. The rest of
this paper is organized as follows. Section 2 discusses related works; Sect. 3 outlines the
research methodology; Sect. 4 presents the experimental results, and Sect. 5 concludes.
2 Related Work
A vast amount of social media data is being used for a variety of purposes, including
sentiment analysis [3–7]. Social media data shares many characteristics of big data. The
veracity of data causes problems in data pre-processing. Biases, noise, and abnormalities in data are all forms of veracity [8]. The issue of information overload has grown
particularly severe, because of the fast development of digital content in the social media
community, making it even more difficult to extract meaningful information from noisy
data. Allowing those kinds of noises in the text increases the dimensionality, and hence
the classification of text becomes more challenging because each word is treated as an
individual dimension. To gain the opinion of users from lengthy comments, informal
language such as emoticons or abbreviations will complicate the analysis [9]. It is necessary to consider eliminating noise from text to enhance text classification accuracy
and speed up the classification process.
Many studies have been conducted on pre-processing techniques for social media
data, as seen in Fig. 1 [1, 2, 4, 10–18]. In brief, [2] propose an improved framework
for pre-processing of social media feeds for better performance. The framework had an
accuracy of 94.07% on a standardized dataset, and 99.78% on a localised dataset when
52
U. H. Hair Zaki et al.
Fig. 1. Research demographic with social media data usage
used to extract sentiments from tweets. In addition, [15] applies the pre-processing techniques that include removal of stop words, expanding abbreviation, spelling correction,
and stemming. They combine Particle swarm optimization (PSO), Genetic Algorithm
(GA), and Decision Tree (DT) and it has proved to have better performance with an
accuracy of over 90% when compared to other existing algorithms.
The result obtained from [16] confirms that Naïve Bayes and SVM were the most
common classifiers used and with them performing better among all the classifiers. Even
among those two, SVM performed better in most of the cases. According to work by
[4], they indicate that after pre-processing of the dataset the F1-score of the classifier
is substantially improved. For example, the accuracy and F1-measure of the Twitter
sentiment classification classifier are enhanced by [11] when applying pre-processing
techniques such as expanding acronyms and replacing negation. However, there were
barely any differences when removing URLs, numbers or stop words.
Similarly, [18] presents a quality model to evaluate the quality of social information services. They have constructed three noise removal filters: Data Overload (which
defines the degree of unwanted data), Data Relevancy (which defines the contextual
relevancy of the retrieved data), and Data Corruption (which defines the level of errors
present in the data). They also considered custom stop words to exclude the irrelevant
data items for the Data Relevancy filter. They also employed a dictionary-based approach for the data correction in the Data Corruption filter. The performance of this filter
is lower than expected. Only 21.3% of data items were fixed. This demonstrated that
applying a Data Corruption filter is a time and resource-intensive process that is not
always scalable to large datasets.
There are a couple of recommendations by [13] on which techniques are highly
advised. If someone wants to pre-process text for a classic machine learning sentiment
analysis, they can be considering replacing URLs and user mentions, replacing contractions, removing numbers, replacing repetitions of punctuation and lemmatization.
Text Detergent: The Systematic Combination of Text Pre-processing Techniques
53
Meanwhile, [14] looked into how URLs, hashtags, negations, repeated characters, punctuations, stop words and stemming were affected. With the Stanford Twitter Sentiment
dataset, the performance of sentiment classification increases when URL removal, username replacing with white space, hashtag removal, negation, character normalization,
punctuation removal, stop word elimination and stemming are applied.
A work by [12] exploits several pre-processing techniques such as normalization,
removing stop words, and tokenization. In normalization, they combine lowercase,
removing accents, removing blank spaces, removing punctuation characters, removing
hyphen symbols, and removing watermarks. They prove that the use of the Word2vec
method increases the accuracy of the opinion classification in comparison with TF–IDF.
Interestingly, [10] utilize pre-processing techniques such as removing emoticons, removing stopwords, stemming, and word vector. These studies show that the accuracy of the
Naïve Bayes algorithm was substantially improved after applying the pre-processing
steps.
Another proposed method by [1] is that they categorize the techniques into two,
which are category 1 (removing URL, hashtags symbols, punctuations, emoticons, and
newlines) and category 2 (tokenization, expanding slang and acronyms, spelling correction, normalization, removing stop words, stemming and lemmatization). Different
from others, not only does [17] investigate the impact of different pre-processing techniques on Twitter, but they also make a recommendation of pre-processing techniques
that increase the quality of the text and improve the performance of automated classification. By implementing 12 techniques in a systematic sequence order, the best classifier
performance is recommended.
As described above, many studies are based on Twitter text only. There are more
social media services with important information that must be analysed, but few pieces
of work use multiple social media services [18]. As examined by [19], the most significant and related dataset is produced by Facebook. From an engagement aspect, social
media users prefer the YouTube platform. In reading [19]’s article, one may well be convinced that using multiple sources of social media services is a good move in terms of
content-wise. Furthermore, pre-processing techniques are interconnected to one another.
For example, removing numbers cannot be done before expanding slang and acronyms,
because the nature of slang sometimes is a combination of characters and numbers
like gr8 (great). Even though [17] applies pre-processing techniques in a systematic
order, it only utilizes Twitter, where the applicability is not represented across multiple social media services. Therefore, it is important to have a systematic sequence to
implement pre-processing techniques. Given these points, this study does comprehensive experimentation to demonstrate the influence of pre-processing techniques from
Twitter, Facebook, and YouTube datasets.
3 Methodology
This section presents the analysis of different pre-processing techniques. The effect of
pre-processing is next investigated, followed by a recommended systematic combination
of several pre-processing techniques. The algorithms are executed using R language on
RStudio utilizing ASUS Nitro 5 notebook (Windows 10 64-bit OS and RAM 16BG)
54
U. H. Hair Zaki et al.
Fig. 2. Methodology flowchart
with R version 4.0.5 and RStudio version 1.4.1717. Figure 2 shows the methodology
flowchart.
3.1 Phase 1
In reviewing the pre-processing techniques, we found that there are 21 techniques that
researchers usually applied in denoising social media data. The pre-processing techniques are remove stop words [1, 4, 10–18], remove punctuation characters [1, 2, 4,
12–14], [16–18], remove URLs [1, 2, 11, 13, 14, 16–18], remove hashtag [1, 2, 4, 14,
16–18], remove user mention [2, 4, 13, 14, 16–18], stemming [1, 2, 4, 10, 13–16], expand
slang and acronyms [1, 2, 11–13, 15, 17], lemmatization [2, 4, 13, 16, 17], spelling correction [1, 2, 13, 15–17], data elongation [2, 11, 13, 14, 17, 18], remove numbers [4,
11, 13, 17], replace contraction [11, 13, 14, 17], lowercase [4, 12, 13, 16, 17], replace
emoticon [1, 2, 10, 17], language filter [1, 10, 18], remove encoded text [2, 13, 16,
17], replacing repetitions of punctuation [2, 13], search term inclusion (dictionary based
approach) [18], word segmentation [17], remove watermark [12], word negation [13],
part-of-speech [2, 13].
3.2 Phase 2
In phase 2, three tasks will be done to develop a systematic step of employing preprocessing techniques for social media data.
Categorize Pre-processing Status. In this task, we are categorizing the pre-processing
techniques into three categories such as (1) Prime indicates the technique is selected in
the study and has high accuracy, (2) Measured indicates the technique is selected in the
Text Detergent: The Systematic Combination of Text Pre-processing Techniques
55
study but does not have distinct accuracy, and (3) Not Measured indicates the technique
is not selected in that study at all.
Pre-processing Techniques Selection. The systematic sequence will utilize the techniques with Prime status. To pick which Prime techniques will be included in the systematic sequence, hypothesis testing is conducted. Based on frequency distribution in
Fig. 3, the mean usage of Prime techniques is 4 times.
part-of-speech
word negation
remove watermark
word segmentation
search term inclusion (dictionary based approach)
replacing repetitions of punctuation
remove encoded text
language filter
replace emoticon
lowercase
replace contraction
remove numbers
data elongation
spelling correction
lemmatization
expand slang and acronyms
stemming
remove user mention
remove hashtag
remove URL
remove punctuation characters
remove stop words
0
0
1
1
1
mean, μ: 4.27 ≈ 4
2
3
3
4
4
4
4
4
5
5
6
7
7
7
8
8
10
Fig. 3. Pre-processing techniques frequency distribution of Prime status
At the 0.05 level of significance, we want to test if the Prime technique is used less
than 4 times, on average is significant. We are executing null hypothesis significance
testing (p-value approach) [20] in Microsoft Excel as calculated in Table 1.
Table 1. Hypothesis test (significance test)
Sample statistic and test statistic calculation
Formulate hypothesis
H0 :μ ≥ 4 times
Ha :μ < 4
times
Sample standard deviation, s
2.797648982
Sigma, σ
NA
Test Statistic To Use:
t
Sample
size, n
22
The sample mean, x̄
4.272727273
Degree of
freedom
21
(continued)
56
U. H. Hair Zaki et al.
Table 1. (continued)
Sample statistic and test statistic calculation
Type of test
1 tail left
Significance 0.05
level, α
Test Statistic, t
0.457242601
Standard
error, SE
0.596460767
Probability value (p-value) and critical value (c-value) calculation
Rejection
p-value ≤ α, Reject H 0 & accept H a | Fail to Reject H 0
Rule p-value
p-value 1
tail left
0.673904139 (accept H0 )
Rejection
Test Statistic ≥ c-value, Reject H 0 & accept H a, | Fail to Reject H 0
Rule c-value
c-value 1
tail left
-1.720742903 (accept H0 )
Conclusion
There is sufficient evidence from the c-value approach and p-value approach test to support
H0 (reject Ha ). therefore, to pick which Prime techniques to be included in the systematic
sequence, the selected techniques must have frequency usage of 4 or more
• digit
Context
• Extended
spelling
characters
• Slang and
acronyms
• Misspelling
words
Number
• URLs
• hashtag
• user mention
• emoticon
• contraction
• punctuation
characters
Spelling
Punctuation
Specify Systematic Steps of Pre-processing Phase. Based on the significance test in
Table 1, there are 14 techniques to be included in the systematic sequence. After identifying how the pre-processing techniques are working, we are sorting the sequence of
the techniques. The sequence of techniques is specified based on the degree of noise.
The degree of noise is categorized into four such as (1) Punctuation, (2) Spelling, (3)
Number, and (4) Context as illustrated in Fig. 4. The lesser the degree number, the urgent
for it to be denoise. Corpus that contains Punctuation must first be removed. And then
followed by the enhancement of the Spelling component into a standard term. After that,
remove the number because it does not give a significant impact on sentiment analysis.
Finally, to provide basic dataset comprehension to the analyst, the Context component
shall be executed.
Fig. 4. The degree of noise in social media data text
• Uppercase
characters
• Stop
words
• Word
derivation
& word
inflection
Text Detergent: The Systematic Combination of Text Pre-processing Techniques
57
3.3 Phase 3
The experiment was conducted using the dataset from Facebook, Twitter, and YouTube
social media services.
Social Media Data Collection. Three social media datasets are employed for experimentation. The dataset is downloaded from Kaggle1 . All datasets are consisted of Twitter2 (331,091 rows), Facebook3 (89,866 rows), and YouTube4 (718,458). For Twitter
dataset, it is collected using the #CovidVaccine hashtag. While the Facebook dataset
is Facebook posts made by Anti-Vaccine and Chilf Care groups. As for the YouTube
dataset, the data has been collected from the comments of listed trending YouTube videos
in the UK. However, for this experimental work, we only used 1,500 rows of data for
each dataset were 500 rows for each sentiment score (positive, negative, and neutral).
Apply Systematic Sequence of Pre-processing Techniques. Table 2 shows the example of the working mechanism for each technique. Not all techniques perform well when
combined with others; even where they perform well when used standalone, some combinations of pre-processing techniques do not interact well. It is not only about the
selection of pre-processing techniques that are important, but also their sequence must
be logical too as referred to in Fig. 4.
Table 2. The noise mapped with respective pre-processing techniques
Noise
Pre-processing technique
URLs
Remove URLs
Hashtag symbol
Remove hashtag
User mention
Remove user mention
Emoticon
Replace emoticon
Word contraction
Replace contraction
Punctuation characters
Remove punctuation characters
Extended spelling character
Data elongation
Slang and acronyms
Expand slang and acronyms
Misspelling word
Spelling correction
Number
Remove number
Uppercase text
Lowercase
(continued)
1 https://www.kaggle.com.
2 https://www.kaggle.com/kaushiksuresh147/covidvaccine-tweets.
3 https://www.kaggle.com/alechelyar/facebook-antivaccination-dataset.
4 https://www.kaggle.com/datasnaek/youtube?select=GBcomments.csv.
58
U. H. Hair Zaki et al.
Table 2. (continued)
Noise
Pre-processing technique
Stop words
Remove stop words
Word derivation & word inflection
Lemmatization
Word derivation & word inflection
Stemming
Feature Selection. The pre-processed dataset represents using the n-gram representation model. In this paper, the n-gram that is applied is unigram. Feature selection is
carried out using TF-IDF (Term Frequency weighting with Inverse Document frequency)
to find the number of terms that appeared in each dataset [21].
Data Classification. In identifying which machine learning algorithm is suitable for
this experiment, this paper is using algorithm explorer 5 . To classify sentiment polarity,
this paper is applying a classification technique to perform supervised learning tasks by
using the Support Vector Machine (SVM). Experimentation was carried out utilising a
combination of training and testing ratios such as 50:50, 60:40, and 70:30. The AFINN
lexicon is used in this work [22]. In this experiment, we are converting all positive
integers to 1, all negative integers to –1 and all zeros remain 0.
4 Results
In this section, we discover the outcomes achieved when a variety of types of preprocessing techniques are applied on Twitter, Facebook, and YouTube datasets.
4.1 Phase 4
We are applying a systematic sequence of pre-processing techniques based on Table 2
list order. The feature representation includes a unigram for each process.
Analyze Evaluation Metrics. To discover and investigate the relationship between
techniques, a systematic combination study was carried out to investigate the effect
between the Prime techniques by combining each of them based on the sequence. The
influence of pre-processing techniques on classification accuracy is seen in Fig. 5. Accuracy refers to the correctness of classification obtained overall. The ratio is measured
between the correctly classified instances with a total number of instances [15]. The
SVM classifier gives better accuracy in unigram when the training and testing ratio is
increased. Figure 5 indicates that when utilising a 70:30 split ratio, the SVM classifier on
unigram gives higher accuracy. In addition, It plotted that the Twitter dataset is having
lower accuracy compared to the Facebook dataset while the YouTube dataset gave the
highest accuracy across three split ratios.
5 https://samrose3.github.io/algorithm-explorer/.
Text Detergent: The Systematic Combination of Text Pre-processing Techniques
85.00%
80.00%
75.00%
70.00%
65.00%
60.00%
55.00%
50.00%
45.00%
Twitter
Facebook
YouTube
50 50
50.47%
55.81%
63.08%
60 40
67.79%
70.75%
74.57%
59
70 30
76.99%
79.77%
82.57%
Fig. 5. Classification accuracy by training and testing ratio
5 Discussion
Figure 5 shows the reported percentage of accuracy of the SVM classifier in the Twitter,
Facebook, and YouTube datasets across 50:50, 60:40, and 70:30 proportions of training
and testing data. Overall, the accuracy of the thrice dataset has considerably grown.
The reported accuracy of Twitter begins at 50.47% with a 50:50 ratio. It rose steadily
to reach about 67.79% with a 60:40 ratio. In the 70:30 ratio, it continues to increase to
76.99%. Figure 5 also shows that there is a correlation between training and testing data
proportion. Figure 5 demonstrates that YouTube is by far has the highest accuracy when
applying the systematic sequence of pre-processing techniques throughout the proportion
of training and testing data. This show that the systematic sequence is most suitable
when using the YouTube dataset. YouTube achieves 82.57% of accuracy with a 70:30
proportion of training and testing data. The lowest accuracy is from the Twitter dataset,
50.47% with 50:50 with 70:30 proportion of training and testing data. Facebook datasets
stay in the middle in terms of accuracy. By implementing the systematic sequence of preprocessing techniques, on average, Twitter is having 65.08% accuracy while Facebook
has 68.77% and YouTube 73.41%. Above all, using multiple sources of social media
services provide immense perspective for sentiment analysis particularly in denoising
the high dimensional data text.
6 Conclusion
Multiple sources of social media services in sentiment analysis suggests a good move in
terms of significance, relatedness, and engagement content-wise. Sentiment classification can be improved by applying systematic and suitable text pre-processing techniques
in such a manner that pre-processing does not degrade classification performance, but
rather improves it. After a thorough experiment and observation of the interactions of
various pre-processing techniques, a sequence of optimum pre-processing techniques is
proposed that results in the best classifier performance.
60
U. H. Hair Zaki et al.
References
1. Pavan Kumar, C.S., Dhinesh, L.D.: Novel text preprocessing framework for sentiment analysis. In: Satapathy, S.C., Bhateja, V., Das, S. (eds.) Smart Intelligent Computing and Applications. SIST, vol. 105, pp. 309–317. Springer, Singapore (2019). https://doi.org/10.1007/978981-13-1927-3_33
2. Kolajo, T., Daramola, A.A., Seth, A.: A framework for pre-processing of social media feeds
based on integrated local knowledge base. Inf. Process. Manag. 57(6), 102348 (2020)
3. Karami, A., Shah, V., Vaezi, R., Bansal, A.: Twitter speaks: a case of national disaster
situational awareness. J. Inf. Sci. 46(3), 313–324 (2020)
4. Pimpalkar, A.P., Retna Raj, R.J.: Influence of pre-processing strategies on the performance of
ML classifiers exploiting TF-IDF and BOW features. ADCAIJ Adv. Distrib. Comput. Artif.
Intell. J. 9(2), 49–68 (2020)
5. Sharma, S., Jain, A.: Role of sentiment analysis in social media security and analytics. Wiley
Interdiscip. Rev. Data Min. Knowl. Discov. 10(5) (2020)
6. Ali, K.: Sentiment Analysis as a Service. RMIT University (2019)
7. Khader, M., Awajan, A., Al-Naymat, G.: The impact of natural language preprocessing on
big data sentiment analysis. Int. Arab J. Inf. Technol. 16(3), 506–513 (2019). ASpecial Issue
8. Sivarajah, U., Kamal, M.M., Irani, Z., Weerakkody, V.: Critical analysis of Big Data challenges
and analytical methods. J. Bus. Res. 70, 263–286 (2017)
9. Naresh, A., Venkata Krishna, P.: An efficient approach for sentiment analysis using machine
learning algorithm. Evol. Intel. 14(2), 725–731 (2020). https://doi.org/10.1007/s12065-02000429-1
10. Alam, S., Yao, N.: The impact of preprocessing steps on the accuracy of machine learning
algorithms in sentiment analysis. Comput. Math. Organ. Theory 25(3), 319–335 (2018).
https://doi.org/10.1007/s10588-018-9266-8
11. Jianqiang, Z., Xiaolin, G.: Comparison research on text pre-processing methods on Twitter
sentiment analysis. IEEE Access 5, 2870–2879 (2017)
12. Sohrabi, M.K., Hemmatian, F.: An efficient preprocessing method for supervised sentiment
analysis by converting sentences to numerical vectors: a twitter case study. Multimed. Tools
Appl. 78(17), 24863–24882 (2019). https://doi.org/10.1007/s11042-019-7586-4
13. Symeonidis, S., Effrosynidis, D., Arampatzis, A.: A comparative evaluation of pre-processing
techniques and their interactions for Twitter sentiment analysis. Expert Syst. Appl. 110, 298–
310 (2018)
14. K. Kumar, H.M., Harish, B.S.: Classification of short text using various preprocessing techniques: an empirical evaluation. In: Kumar Sa, P., Bakshi, S., Hatzilygeroudis, I.K., Sahoo,
M.N. (eds.) Recent Findings in Intelligent Computing Techniques, vol. 3, pp. 19–30. Springer,
Singapore (2018). Doi: https://doi.org/10.1007/978-981-10-8633-5_3
15. Nagarajan, S.M., Gandhi, U.D.: Classifying streaming of Twitter data based on sentiment
analysis using hybridization. Neural Comput. Appl. 31(5), 1425–1433 (2018). https://doi.
org/10.1007/s00521-018-3476-3
16. Pradha, S., Halgamuge, M.N., Tran Quoc Vinh, N.: Effective text data preprocessing technique
for sentiment analysis in social media data. In: Proceedings of the 2019 11th International
Conference Knowledge System Engineering, KSE 2019 (2019)
17. Naseem, U., Razzak, I., Eklund, P.W.: A survey of pre-processing techniques to improve
short-text quality: a case study on hate speech detection on twitter. Multimed. Tools Appl.
80, 35239–35266 (2020)
18. Ali, K., Dong, H., Bouguettaya, A., Erradi, A., Hadjidj, R.: Sentiment analysis as a service:
a social media based sentiment analysis framework. In: 2017 IEEE International Conference
on Web Services (ICWS), pp. 660–667 (2017)
Text Detergent: The Systematic Combination of Text Pre-processing Techniques
61
19. Hair Zaki, U.H., Ibrahim, R., Abd Halim, S.: A social media services analysis. Int. J. Adv.
Trends Comput. Sci. Eng. 8(1.6), 69–75 (2019)
20. Infanger, D., Schmidt-Trucksäss, A.: P value functions: an underused method to present
research results and to promote quantitative reasoning. Stat. Med. 38(21), 4189–4197 (2019)
21. Na, J., Sui, H., Khoo, C., Chan, S., Zhou, Y.: Effectiveness of simple linguistic processing in
automatic. In: Knowledge Organization and the Global Information Society: Proceedings of
the Eighth International ISKO Conference, pp. 49–54 (2004)
22. Nielsen, F.Å.: A new ANEW: evaluation of a word list for sentiment analysis in microblogs.
CEUR Workshop Proc. 718, 93–98 (2011)
Improve Short-term Electricity Consumption
Forecasting Using a GA-Based Weighted
Fractional Grey Model
Ani Shabri1(B) , Ruhaidah Samsudin2 , and Waseem Alromema3
1 Faculty of Science, Universiti Teknologi Malaysia, 81300 Johor Bahru, Johor, Malaysia
ani@utm.my
2 Faculty of Engineering, Universiti Teknologi Malaysia, 81300 Johor Bahru, Johor, Malaysia
ruhaidah@utm.my
3 Computer Science and Information Systems, Applied College, Taibah University, Medina,
Saudi Arabia
wromema@taibahu.edu.sa
Abstract. This study proposed a weighted fractional grey model (WFGM) based
on a genetic algorithm for forecasting annual electricity consumption. WFGM has
two parameters that can be used to adjust the order of the summation based on different data sequences and reflect the new information priority. The key issue with
the WFGM model is determining two optimum fractional-order values to improve
the accuracy of electricity consumption forecasts. The Genetic Algorithm (GA)
is used to select the best values for the weighted fractional-order accumulation,
which is one of the most important aspects determining the grey model’s prediction accuracy. The additional linear parameters of grey models are estimated
using the least squares estimation method. Finally, two real data sets of electricity
consumption from Malaysia and Thailand are presented to validate the proposed
model. Numerical results show that the new proposed prediction model is very
efficient and has the best prediction accuracy compared to the models of GM(1,1)
and FGM(1,1).
Keywords: First grey model · Weighted fractional · Genetic algorithm ·
Forecasting
1 Introduction
As the goal to enhance the energy system’s reliability and efficiency of operation become
more important, research focus on the area of forecasting electricity consumption has
been deemed to be vital to avoid costly errors which might have a critical impact on the
environment.
In the last several decades, numerous methods including the least squares support
vector machines (LS-SVMs) [1, 2, 3], linear regression models [1, 4], ARIMA models [5], neural networks [1, 6, 7], genetic algorithms [8] and support vector machines
(SVMs) [9] have been applied in the study of electricity consumption forecast. However,
© The Author(s), under exclusive license to Springer Nature Switzerland AG 2022
F. Saeed et al. (Eds.): IRICT 2021, LNDECT 127, pp. 62–72, 2022.
https://doi.org/10.1007/978-3-030-98741-1_6
Improve Short-term Electricity Consumption Forecasting
63
these methods mentioned above required a large chunk of data sets with complicated
calculations to conducting an adequate prediction experiment.
The grey system theory has been publicized to be an effective strategy in handling the
uncertainty problems with limited and incomplete data in recent years. The grey system
theory has been widely applied in diverse fields, which includes the study of agricultural
output, electricity production, and consumption, transportation, industrialisation, military, as well as medicine [10–13]. Though the accuracy of the GM(1,1) model prediction
accuracy is often inconsistent and unsatisfied.
Researchers have found ways to improve the GM(1,1) model’s performance, with a
majority of work focusing on modifying residual model errors, optimizing the starting
values, improving the model background value conformation, as well as merging several
prediction models [14–18]. The factional order accumulation-based grey model or FGM
has had a wide-ranging impact on the overall grey model efficiency [19–22]. As the
FGM offers a better forecasting performance than the GM(1,1) model, they have been
applied as a predictive tool extensively by researchers from multiple disciplines [23–25].
As most of the current FGM models only employ a single fractional order, numerous
academicians have noted that it reduces the impacts of fractional order accumulation,
making FGM less versatile if multivariable data is to be used [26].
A study conducted by Shen et al. [26] introduced the WFGM, which is to construct on
the quantum particle swarm optimization technique, by utilizing four numerical examples from various practical applications to obtain the best fitting accuracy. By comparing
the GM(1,1) and FGM(1,1) models, the result from the WFGM possessed a better result
due to the efficiency of the model. As the WFGM has been proven to be a clear choice,
this paper will incorporate the Genetic Algorithm, GA into the WFGM to form a novel
GA-WFGM forecasting model to approach the electricity consumption data. To solve
the nonlinear optimization problem, we will use the GA natural algorithm intelligent
method in determining the ideal parameters for WFGM.
This paper shall be constructed as follows: the weighted fractional accumulated
generating matrices and the inverse matrices are to be introduced in Sect. 2. Followed
by the weighted fractional grey model in Sect. 3. Section 4 will further explain the
application of GA to determine the best fractional order value for the WFGM model.
The findings for both Malaysia and Thailand case studies are presented in Sect. 5. Lastly,
Sect. 6 will conclude the overall the finding for GA-WFGM model.
2 The Weighted Fractional Accumulated Generating Matrices
and Their Inverse Matrices
The original sample size is denoted as x(0) =
(0) (0)
(0)
(0)
of size
x1 , x2 , . . . , xk , . . . , xn
n, and the weighted fractional accumulation generating operator (WF-AGO) of x(0) is
defined as
(rλ) (rλ)
(rλ)
x(rλ) = x1 , x2 , . . . , xk , . . . , xn(rλ)
64
A. Shabri et al.
where
k
r
(0)
=
λk−i xi , k = 1, 2, . . . , n.
k −i
(rλ)
xk
(1)
i=1
x(rλ) = Arλ x(0) is a simple equation to express the WF-AGO, where
⎛
r
0
⎜
0
0
⎜
0
r
⎜
r
···
0
⎜
λ
0
0
⎜
1
···
r
⎜
0
r
⎜
λ
r 2
···
0
Arλ = ⎜
..
⎜
λ
1
..
..
⎜
.
2
..
.
⎜
.
..
⎜
r
.
⎜
···
.
r
⎜
λn−3
0
r
⎝
λn−2
r
n−3
n−1
λ
n−2
n−1
(1)
⎞
⎟
⎟
⎟
⎟
⎟
⎟
⎟
⎟
⎟
⎟
⎟
⎟
⎟
⎟
⎠
(2)
(0)
When r = λ = 1,then xk = ki=1 xi can also be written as x(1) = Ax(0) . x(1) is the
first order-accumulation generating operator (1-AGO), where A is defined as
⎛
⎜
⎜
A=⎜
⎝
1
1
..
.
0
1
..
.
1
1
···
···
..
.
···
0
0
..
.
⎞
⎟
⎟
⎟
⎠
(3)
1
r
(0)
x can also be written as x(r) = Ar x(0) . x(r) is
k −i i
the fractional order-accumulation generating operator (F-AGO), where Ar is defined as
⎛
⎞
r
0
⎜
⎟
0
⎜ 0
r
0 ⎟
⎜
⎟
r
0
···
⎜
0
0 ⎟
⎜
⎟
r
···
⎜ 1
⎟
r
0
⎜
⎟
r
0
···
Ar = ⎜
(4)
.. ⎟
⎜
⎟
1
..
..
⎜
⎟
.
2
..
. ⎟
⎜
.
..
⎜
.
r ⎟
⎜
⎟
r
···
⎜ .
⎟
r
0
⎝
⎠
r
n−3
n−2
n−1
(r)
When λ = 1 then xk =
k
i=1
1n=0
r
where
= r(r+1)...(r+n+1)
n
n ∈ N+
n!
Improve Short-term Electricity Consumption Forecasting
The inverse WF-AGO is denoted as
⎛
−r
0
⎜
0
⎜
−r
⎜
−r
⎜
λ
0
⎜
⎜ 1
−r
⎜
λ
−r 2
A−rλ = ⎜
⎜
λ
1
⎜
2
..
⎜
..
⎜
.
⎜
.
⎜
−r
⎝
λn−2
−r
λn−1
n−2
n−1
65
⎞
0
0
−r
0
..
.
−r
λn−3
n−3
···
···
···
..
.
···
⎟
⎟
⎟
⎟
⎟
⎟
⎟
⎟
⎟
⎟
⎟
−r ⎟
⎟
⎟
0
⎠
0
0
0
..
.
(5)
The relationship between x(0) and x(rλ) can be deduced as follows,
x(0) = A−rλ x(rλ)
When r = λ = 1, x(0) = A−1 x(1) where A−1 is the inverse form of 1-AGO, defined
as
⎛
−1
A
1 0
⎜ −1 1
⎜
⎜
= ⎜ 0 −1
⎜ .
..
⎝ ..
.
0 0
0
0
1
..
.
···
···
···
..
.
0
0
0
..
.
⎞
⎟
⎟
⎟
⎟
⎟
⎠
(6)
0 ··· 1
Likewise, when λ = 1, x(0) = A−r x(r) . We refer to A−r as the inverse form of
F-AGO, defined as
⎛
⎞
−r
0
⎜
⎟
0
0
⎜
⎟
0
−r
⎜
⎟
−r
···
0
⎜
⎟
λ
0
0
⎜
⎟
···
−r
⎜ 1
⎟
0
−r
⎜
⎟
−rλ
λ
⎜
⎟ (7)
−r
·
·
·
0
A
=⎜
2
.
⎟
λ
1
..
..
..
⎜
⎟
2
..
.
⎜
⎟
.
..
⎜
⎟
−r
.
⎜
⎟
.
−r
n−3 · · ·
⎜
⎟
λ
0
−r
n−2
⎝
⎠
λ
−r
n−3
n−1
λ
n−2
n−1
3 The Weighted of Fractional-Order Grey Model
The rλ -order differential equation of grey model is defined as [25]
dx(rλ)
+ ax(rλ) = b
dt
(8)
66
A. Shabri et al.
When both sides of Eq. (8) are integrated inside the interval [k − 1, k], the result will be
prompted as
k
k−1
dx(rλ)
dt + a
dt
k
x
(rλ)
k
dt =
bdt
k−1
(9)
k−1
Hence, the Eq. (9) become
(rλ)
xk
(rλ)
where the background value zk
(rλ)
zk
(rλ)
(rλ)
− xk−1 + azk
=
k
k−1 x
(r)
(rλ) dt
=b
(10)
is defined by
(r)
= 0.5xk + 0.5xk−1 , ∀k = 2, 3, . . . , n
(11)
The Eq. (11) can be expressed as
(rλ)
xk
(rλ)
(rλ)
− xk−1 = b − azk
(12)
To estimate the parameters of the model in Eq. (12), the least-square method shall
be applied. The model’s parameters are calculated using the equation and follows
−1
a
XTY
= XTX
b
where
⎛
⎜
⎜
Y =⎜
⎝
x2rλ − x1rλ
x3rλ − x2rλ
..
.
rλ
xnrλ − xn−1
⎞
⎛
(1)
−z
⎜ 2(1)
⎟
⎜ −z3
⎟
⎟ and X = ⎜
⎜ ..
⎠
⎝ .
(1)
−zn
The solution for Eq. (8) is defined by
b −ak b
(rλ)
(0)
x̂k+1 = x1 −
e
+
a
a
⎞
1
⎟
1⎟
.. ⎟
⎟
.⎠
1
(13)
(14)
Lastly, the predicted values of WFGM can be calculated using the inverse r-order
fractional accumulated operation as follows:
x̂(0) = A−rλ x̂(rλ) , k = 1, 2, . . . , n
(15)
When r = λ = 1, the WFGM model will be reduced to GM(1,1) model, whereas
when λ = 1 it shall be reduced to the FGM model. As such, the WFGM model is a
generalization form for both the GM(1,1) and FGM models.
Improve Short-term Electricity Consumption Forecasting
67
4 Genetic Algorithm for Determining the Optimal Value
of Fractional Order of WFGM Model
The value for the fractional order, λ of the WFGM model, has been predetermined as
1 for most research. Though in most cases, the value of λ = 1 might not be suitable
for all data sets. Furthermore, the fractional order r has a direct impact on the outcome
of WFGM. Therefore, we shall implement the GA to search for the best values for λ
and r to solve the issue of nonlinear optimization. The mean absolute percentage error
(MAPE) will be used as the GA’s fitness function. Figure 1 below depicts the GA-WFGM
model, where the optimization procedure for WFGM utilizing GA is presented (for more
details, please refer [27]). In summary, the constrained optimization algorithm to obtain
the optimal parameters r and λ can be described as follows:
(0)
(0)
−
x
x̂
k
k
1 n
× 100%
min MAPE =
(0)
k=1
n
xk
⎧
⎪
0<r≤1
⎪
⎪
⎪
⎪
0<λ≤1
⎪
⎪
⎪
⎨
−1 T
a
= XTX
X Y
s.t.
b
⎪
⎪
⎪
(r)
(0)
⎪
⎪
x̂k = x1 − ab e−a(k−1) + ab
⎪
⎪
⎪
⎩ x̂(0) = A−rλ x̂(rλ) , k = 1, 2, . . . , n
Fig. 1. The flow chart of the GA-WFGM model optimized using a genetic algorithm.
5 Experiment Results
The effectiveness of the proposed GA-WFGM model is evaluated using the electricity
consumption data (per capita electricity (kWh)) for Malaysia and Thailand. The data
68
A. Shabri et al.
was extracted from the World Bank Data portal, presented in Table 1. The electricity
consumption data for the range between 2000 to 2014 (referred to as the in-sample
data) is utilized for modeling, while the data from 2015 to 2019 (referred to as the
out-of-sample data) is utilized to test the models’ forecast performance.
5.1 Performance Measures
To quantify the accuracy of prediction models, various performance measures have been
proposed in the literature. The accuracy of GA-WFGM was evaluated using the MAPE.
The MAPE can be defined as follows:
(0)
(0)
−
x
x̂
n
k
k
1
× 100%
MAPE =
(0)
k=1
n
xk
(0)
(0)
where xk is predicted value and xk actual value. The lower the MAPE value, the better
the prediction.
5.2 Obtained Results and Comparison
The purpose of implementing the GA algorithm in this study is to find the best parameters
for FGM and WFGM models. The linear parameters for all grey models are estimated
using the least-square technique. Table 1 below shows the optimal parameter values for
all GM(1,1), FGM and, GA-WFGM models.
Table 1. The optimal parameters of GM(1,1), FGM and GA-WFGM.
GM(1,1)
FGM
GA-WFGM
Data
r
λ
r
λ
r
λ
Malaysia
1
1
0.6980
1
0.9878
0.9228
Thailand
1
1
0.7386
1
0.2445
0.8606
Figures 2 compare the actual values to the predicted values generated from all
GM(1,1), FGM and, GA-WFGM models. When comparing the GA-WFGM model to
both the FGM and GM(1,1) models, it is clear that the simulated values for the GAWFGM model fit closely to the actual data for both Malaysia and Thailand real-case
studies.
Tables 2 and 3 summarize the MAPE results for all GM(1,1), FGM, and GA-WFGM
models for Malaysia and Thailand respectively. Tables 2 and 3 are also seen to present
the smallest MAPE value for the GA-WFGM model, both in-sample and out-of-sample
data, suggesting that the proposed model can accomplish its goal to minimize the forecast
error. In the sense of predictive performance, the results indicate that GA-WFGM with
optimally weighted fractional order is able to perform better than the GM(1,1) and FGM
models.
Improve Short-term Electricity Consumption Forecasting
69
Fig. 2. Comparison of the real values to the predicted values generated by the three grey models.
Table 2. The predicted value and MAPE results for the grey models from Malaysia country
Year
Actual Value
GM(1,1)
FGM
GA-WFGM
2000
3014
3013.9
3013.9
3013.9
2001
3196
3316.3
2855.6
3195.8
2002
3341
3420.2
3128.7
3355.8
2003
3373
3527.3
3377.7
3506.5
2004
3813
3637.7
3596.8
3650.7
2005
3844
3751.7
3792.1
3789.5
2006
3969
3869.1
3968.9
3923.6
2007
4062
3990.3
4131.0
4053.4
2008
4179
4115.3
4281.0
4179.1
2009
4187
4244.2
4421.0
4301.0
2010
4433
4377.1
4552.7
4419.3
2011
4435
4514.2
4677.3
4534.0
2012
4613
4655.5
4795.6
4645.4
2013
4784
4801.3
4908.5
4753.5
2014
4937
4951.7
5016.6
4858.4
In-Sample
MAPE
3.350
1.312
2015
4959
2683.7
2600.8
4960.3
2016
5106
2772.2
2644.7
5059.3
2017
5164
2863.6
2687.0
5155.4
2018
5307
2958.0
2727.7
5248.7
2019
5353
3055.5
2767.1
5339.4
Out-Sample
MAPE
4.958
2.636
0.490
1.969
70
A. Shabri et al.
Table 3. The predicted value and MAPE results for the grey models from Thailand country
Year
Actual Value
GM(1,1)
FGM
GA-WFGM
2000
1517
1517.3
1517.3
1517.3
2001
1589
1704.2
1521.6
1589.4
2002
1693
1760.4
1670.5
1690.0
2003
1796
1818.4
1796.0
1789.4
2004
1910
1878.4
1902.9
1883.5
2005
1994
1940.3
1996.2
1971.4
2006
2078
2004.3
2079.4
2053.4
2007
2154
2070.3
2154.8
2129.7
2008
2186
2138.6
2223.9
2200.7
2009
2182
2209.1
2287.9
2266.8
2010
2345
2281.9
2347.6
2328.3
2011
2271
2357.2
2403.7
2385.5
2012
2491
2434.9
2456.7
2438.8
2013
2475
2515.1
2507.0
2488.3
2014
2539
2598.1
2554.9
2534.4
In-Sample
MAPE
2015
2588
2683.7
2600.8
2577.2
2016
2607
2772.2
2644.7
2617.1
2017
2554
2863.6
2687.0
2654.2
2018
2559
2958.0
2727.7
2688.8
2019
2679
3055.5
2767.1
2720.9
Out-Sample
MAPE
10.368
3.414
2.280
2.690
1.468
1.232
6 Conclusion
To overcome the issue in forecasting the electricity consumption data, an improved
weighted fractional-gray model is proposed. The optimal value of the weighted
fractional-order values was considered to improve the WFGM modeling and forecasting performance. The GA approach is selected to determine the optimal values of the
WFGM model’s weighted fractional order accumulation. To demonstrate the effectiveness of the proposed GA-WFGM model, two real-world data sets comprised of Malaysia
and Thailand were compared against the traditional GM(1,1) and, FGM models. Hence
according to the findings, the proposed GA-WFGM model has greatly increased the
forecast accuracy when compared to the other two models in electricity consumption
data, therefore, confirming the superiority of the proposed model.
Improve Short-term Electricity Consumption Forecasting
71
Acknowledgments. The authors are grateful to the Ministry of Higher Education Malaysia and
Universiti Teknologi Malaysia for fully supporting and funding this research project through the
Fundamental Research Grant Scheme under Grant Vot 5F271.
References
1. Fazil, K., Taplamacioglu, M.C., Cam, E., Hardalac, F.: Forecasting electricity consumption: a
comparison of regression analysis, neural networks and least squares support vector machines.
Int. J. Electr. Power Energy Syst. 67, 431–438 (2015). https://doi.org/10.1016/j.ijepes.2014.
12.036
2. Sulaiman, M.H., Mustafa, M.W., Shareef, H., Khalid, S.N.A.: An application of artificial
bee colony algorithm with least squares support vector machine for real and reactive power
tracing in deregulated power system. Int. J. Electr. Power Energy Syst. 37(1), 67–77 (2012).
https://doi.org/10.1016/j.ijepes.2011.12.007
3. Wang, S., Yu, L., Tang, L., Wang, S.: A novel seasonal decomposition based least squares support vector regression ensemble learning approach for hydropower consumption forecasting
in China. Energy 36(11), 6542–6554 (2011). https://doi.org/10.1016/j.energy.2011.09.010
4. Abdel-Aal, R.E., Garni, A.Z.: Forecasting monthly electric electricity consumption in Eastern
Saudi Arabia using univariate time series analysis. Energy 22, 1059–1069 (1997). https://doi.
org/10.1016/S0360-5442(97)00032-7
5. Bianco, V., Manca, O., Nardini, S.: Electricity consumption forecasting in Italy using linear regression models. Energy 34, 1413–1421 (2009). https://doi.org/10.1016/j.energy.2009.
06.034
6. Ekonomou, I.: Greek long-term electricity consumption prediction using artificial neural
network. Energy 35, 512–517 (2010). https://doi.org/10.1016/j.energy.2009.10.018
7. Geem, Z.W., Roper, W.E.: Energy demand estimation of South Korea using artificial neural
network. Energy Policy 37, 4049–4054 (2009)
8. Ceylan, H., Ozturk, H.K.: Estimating energy demand of Turkey based on economic indicators
using genetic algorithm approach. Energy Convers Manage. 45, 2525–2537 (2004). https://
doi.org/10.1016/j.enconman.2003.11.010
9. Kavaklioglu, L.: Modeling and prediction of Turkey’s electricity consumption using support
vector regression. Appl. Energy, 88, 368–375 (2011). https://doi.org/10.1016/j.enconman.
2009.06.016
10. Zeng, B., Li, C.: Forecasting the natural gas demand in China using a self-adapting intelligent
greymodel. Energy 112, 810–825 (2016). https://doi.org/10.1016/j.energy.2016.06.090
11. Lihua, Z., Suliang, D., Butterworth, J., Ma, X., Dong, B., Liu, A.: Grey forecasting model for
active vibration control systems. J. Sound Vib. 322(4–5), 690–706 (2009). https://doi.org/10.
1016/j.jsv.2008.11.036
12. Xiao, X.P., Mao, S.H.: Grey fForecasting and Decision Methods. Science Press, Beijing,
China (2013)
13. Wang, Z.X.: An optimized Nash nonlinear grey Bernoulli model for forecasting the main
economic indices of high technology enterprises in China. Comput. Ind. Eng. 64(3), 780–787
(2013). https://doi.org/10.1016/j.cie.2012.12.010
14. Wu, L., Liu, S., Yang, Y.: A gray model with a time varying weighted generating operator.
IEEE Trans. Syst. Man Cybern. Syst. 46(3), 427–433 (2016). https://doi.org/10.1109/TSMC.
2015.2426133
15. Wei, Y., Zhang, Y.: An essential characteristic of the discrete function transformation to
increase the smooth degree of data. J. Grey Syst. 19(3), 293–300 (2007)
72
A. Shabri et al.
16. Zeng, B., Duan, H., Bai, Y., Meng, W.: Forecasting the output of shale gas in China using an
unbiased grey model and weakening buffer operator. Energy 151, 238–249 (2018). https://
doi.org/10.1016/j.energy.2018.03.045
17. Xie, N., Liu, S.: Interval grey number sequence prediction by using non-homogenous exponential discrete grey forecasting model. J. Syst. Eng. Electron. 26(1), 96–102 (2015). https://
doi.org/10.1109/JSEE.2015.00013
18. Ma, X., Liu, Z.: The kernel-based nonlinear multivariate grey model. Appl. Math. Model. 56,
217–238 (2018). https://doi.org/10.1016/j.apm.2017.12.010
19. Mao, S., Gao, G., Xiao, X., Zhu, M.: A novel fractional grey system model and its application.
Appl. Math. Model. 40(7–8), 5063–5076 (2016). https://doi.org/10.1016/j.apm.2015.12.014
20. Wu, L., Liu, S., Yao, L., Yan, S., Liu, D.: Grey system model with the fractional order
accumulation. Commun. Nonlinear Sci. Numer. Simul. 18(7), 1775–1785 (2013). https://doi.
org/10.1016/j.cnsns.2012.11.017
21. Wu, L.F., Liu, S.F., Yang, Y.J.: Grey double exponential smoothing model and its application
on pig price forecasting in China. Appl. Soft Comput. J. 39, 117–123 (2016). https://doi.org/
10.1016/j.asoc.2015.09.054
22. Wu, L.F., Liu, S.F., Yang, Y.J., Ma, L., Liu, H.: Multi-variable weakening buffer operator and
its application. Inf. Sci. 339, 98–107 (2016). https://doi.org/10.1016/j.ins.2016.01.002
23. Gao, M., Mao, S., Yan, X., Wen, J.: Estimation of Chinese CO2 emission based on a discrete
fractional accumulation grey model. J. Grey Syst. 27(4), 114–130 (2015). https://doi.org/10.
3724/SP.J.1248.2014.017
24. Mao, S., Gao, M., Xiao, X., Zhu, M.: A novel fractional grey system model and its application.
Appl Math Modell. 40, 5063–3076 (2016). https://doi.org/10.1016/j.apm.2015.12.014
25. Wu, L., Liu, S., Yao, L., Yan, S., Liu, D.: Grey system model with the fractional order
accumulation. Commun. Nonlinear Sci. Numerical Simul. 18, 1775–1785 (2013). https://doi.
org/10.1016/j.cnsns.2012.11.017
26. Shen, Q.Q., Shi, Q., Tang, T.P., Yao, L.Q.: A novel weighted fractional GM(1,1) model and
its applications mathematics. Math. Comput. Sci. 6570683, 1–20 (2020). https://doi.org/10.
1155/2020/6570683
27. Wang, C.H., Hsu, L.C.: Using genetic algorithms grey theory to forecast high technology
industrial output. Appl. Math. Comput. 195(1), 256–263 (2008). https://doi.org/10.1016/j.
amc.2007.04.080
Efficient Human Activity Recognition System
Using Long Short-Term Memory
Athraa Almusawi(B) and Ali H. Ali
Department of Electronic and Communications Engineering, University of Kufa, Najaf, Iraq
{athraat.almusawi,alih.alathari}@uokufa.edu.iq
Abstract. Human activity recognition (HAR) is a popular and challenging area
of research, driven by a diverse set of applications. This paper aims to build
a system with the fewest sensors in locations thoughtful enough to distinguish
six activities using a Long Short-Term Memory (LSTM) approach to give high
performance. We used two wearable Inertial Measurement Units (IMU) sensors
with a gyroscope, accelerometer, and magnetometer fixed in the waist and the right
ankle of the subject body. For this purpose, ten random subjects were asked to
do six activities (walking, sitting, walking upstairs, standing, walking downstairs,
and laying) indoors for data acquisition. Then we analyzed these data and used
LSTM to classify the labelled dataset with a different number of hidden units, and
the best result was with the number of 150 hidden units. After that, we trained the
dataset and registered the test accuracy of 98.44%. Thus, the performance of the
proposed method achieved the highest accuracy with low computing costs.
Keywords: Wearable sensors · Human activity recognition · Long short-term
memory network · Data acquisition · Deep learning
1 Introduction
Human activity recognition (HAR) is a significant area of research worldwide, driven
by various applications in a wide variety of contexts, including industrial automation,
sports, medical, security…, etc. [1]. HAR methods are categories based on the data type
generated: sensor-based HAR and vision-based HAR [2]. Vision-based HAR analyses
videos or images captured by the camera that contain human motions [3]. Sensor-based
HAR utilizes wearable or ambient sensors [4]. In addition, there is also a hybrid type
of HAR that combines the vision-based GRB camera and sensor-based sensors from
wearable devices in the smart home with ambient sensors and gives an accuracy of
92.33% [5].
Wearable sensors are one of the most commonly used HAR modalities [3]. Sensors
are typically integrated onto a single platform carried by individuals; sensor devices are
frequently configured at Smartphones, smartwatches, inertial units, bright clothes, and
purpose-built platforms [6]. The position of sensors on the body is essential for HAR [7].
HAR classification could be done offline or online [8]. When the user does not require
© The Author(s), under exclusive license to Springer Nature Switzerland AG 2022
F. Saeed et al. (Eds.): IRICT 2021, LNDECT 127, pp. 73–83, 2022.
https://doi.org/10.1007/978-3-030-98741-1_7
74
A. Almusawi and A. H. Ali
immediate feedback, offline classification (non-real-time) is sufficient [9]. However, the
deep learning algorithm is supported in the majority of the proposed studies [10].
Deep learning is a machine learning branch that automatically extracts features from
raw sensor data, unlike traditional classical learning requiring a human-engineered feature to perform optimally [11]. While CNN is the most widely used method for HAR
[12], long short-term memory LSTM is more suitable for complex sequences of sensor inputs [13]. Some researchers believed that combining CNN and recurrent neural
networks RNN(LSTM) would produce better results, based on the recent success of
RNN in time series domains [29]. A neural network learning capabilities can become
more sophisticated as the number of nodes and layers increases [9]. As well, Espinilla
et al. confirm that redundant features do exist, and they generally introduce noise into
the classification process, resulting in reduced performance efficiency [14]. To solve
this problem, some researchers add steps to dimensionality reduction before applying
a learning algorithm such as Linear Discriminant Analysis (LDA) or Principal Component Analysis (PCA),.. etc. [10]. The challenge in HAR is to achieve high recognition
accuracy at a low computational cost [12].
This paper develops an automated system that can efficiently classify human activities by reducing computations and the number of sensors. We designed a cost-effective
device consisting of two IMU sensors. Furthermore, we proposed to use only the twolayer LSTM algorithm in the dataset we collected from the IMU sensors. The same
hardware obtained in all the results includes a 2.6GHz Intel Core i7 CPU and 16GB
RAM.
The paper is organized as follows. Explanation of HAR dataset acquisition is in
Sect. 3. Section 4 contains the description of the raw data pre-processing. Section 5 introduces LSTM Architecture. Section 6 describes and explains the results of the datasets
that were used in LSTM algorithms. Finally, Sect. 7 concludes the outcomes of the
experiments and future work.
2 Related Work
Human activity recognition is becoming an increasingly appealing study subject in recent
years, owing to the rapid development of wearable or body sensor technologies [15]. In
one of the earliest HAR studies, Albaba et al. proposed convolutional neural networks
(CNN) deep learning algorithm on the WISDM dataset [16] was reached an accuracy of
81% [17].
Lawal and Bano experimented with datasets acquisition from various locations on
the body to determine the optimal position, concluding that the shin and waist were the
optimal locations for the sensors [7].
San Buenaventura et al. performed seven ambulatory activities for 3–4 min (sitting, walking, jogging, standing, biking, walking downstairs, and walking upstairs). The
smartphones are located on-body of ten subjects: the left pants pocket, the belt, the right
pants pocket, wrist, and the upper arm [18].
Oluwalade et al. used the popular WISDM dataset for activity recognition. The
dataset fed into the LSTM model with 128 LSTM units, followed by a dropout layer
(0.3 units), dense layer (64 units), dense layer (32 units), and finally a dense layer with
Efficient Human Activity Recognition System
75
15 units (for the number of classes). They employed Softmax as the activation function,
ReLU in the preceding levels, and the Adam optimizer in the final layer. Categorical
cross-entropy to determine the loss. With a batch size of 32, the model trained for 226
epochs achieved 74.3% [19].
Fu et al. proposed the IPL-JPDA method to classify seven activity acquisitions by 1axis air pressure sensors, 3-axis acceleration, 3-axis gyroscope, and 3-axis Euler angle
sensors fixed in the Left thigh of seven subjects. In pre-processed data used Sliding
window technology, PCA, Pseudo-Labels, and Joint Probability Domain Adaptation. In
result registered an accuracy of 93.2% [1].
Leonardis et al. proposed traditional learning techniques Naïve Bayes (NB), KNearest Neighbor (KNN), Decision Tree (DT), Feedforward Neural Network (FNN), and
Support Vector Machines (SVM) to classify data acquired from magnetic and inertial
measurement units (MIMU) sensors attached to the right thigh of 15 subjects. They
extracted manual 342 features and two-step feature selection (genetic algorithm and
correlation-based), reduced them to 69 features and achieved more than 90% accuracy.
However, the deep learning algorithm is supported in the majority of the proposed studies
[10].
In this work, we introduce an automated system capable of efficiently classifying
human activities through fewer computations and sensors. We developed a low-cost
device using two IMU sensors. Additionally, we proposed to employ only the two-layer
LSTM algorithm in the IMU sensor dataset.
3 Data Acquisition
We designed a wearable device content two IMU sensors to dataset acquisition. The
first sensor was 3-axis Accelerometer/Compass LSM303, and the other sensor was 9
Degrees of Freedom LSM9DS0, which has all three types of IMU sensors: a gyroscope, accelerometer, and magnetometer. These sensors were based on a flora chip
manufactured by Adafruit.
A wearable sensor on-body placement is critical for recognition accuracy [7]. Therefore, these two body-worn sensors are placed on the subject body in two ways. The first
experiment fixed LSM9DS0 at the right wrist and LSM303 at the waist, as shown in
Fig. 1(a). we refer to data collected from this experiment as “Dataset1”. In the second
experiment, the LSM303 sensor was placed at the waist, and the LSM9DS0 sensor at
the right ankle, as Fig. 1(b) and Fig. 1(c); in this experiment, we refer to data collected
as “Dataset2”. These two sensors used protocol 12C to collect data on the flora chip,
then we sent Dataset via Bluetooth to the computer. Finally, the information is recorded
on the computer by an internal program.
Ten subjects (aged 10 to 58, five males and five females) were asked to do six activities
(walking, sitting, walking upstairs, standing, walking downstairs, and laying)) indoors
with a fixed order, each activity lasting 11 s. Finally, the entire wireless communication
system can acquire datasets of the subject activity using the sensors and the personal
computer. Due to the three-axis data provided by each sensor, the raw signals had a total
of 12 dimensions (i.e., x, y, and z). Therefore, we gathered 3000 samples at a sampling
rate of 10 Hz (10 samples per second), together with the timestamp-associated activity
labels (hand-labelled by the observer).
76
A. Almusawi and A. H. Ali
(a)
(b)
(c)
Fig. 1. Sensor position on the subject: (a) Initial placement of sensors in the first experiment. (b)
Initial placement of sensors in the second experiment. (c) Actual image of initial placement of
sensors in the second experiment.
4 Pre-processing
After data collection, the second step is pre-processing. Noise in the data can be caused
by humans or a network system error that fails to provide reliable sensor readings [20],
so the first step is to delete the missing or noise data. Then we adjust the standardization
to standardized the data and remove the randomized data from input x using Standard
Score (z-score) as equation below
(1)
where δ and denote the standard deviation and mean of the dataset, respectively [21].
Finally, we divided the HAR dataset into three random sections: training 70%, testing
15%, and Validation 15%; For testing purposes, the epoch with the best validation-set
performance is used [22].
5 Architecture
The LSTM architecture is an RNN developed for modelling temporal sequences and
solving long-term dependency problems [23]. The LSTM solves the long-term memory
problem by utilizing two hidden states denoted by ‘h’ and ‘c’. Internally, the LSTM
controls information via four gates: the forget gate f , the input gate , the cell gate C,
and output gate O, as shown in the equations below [24]
(2)
(3)
(4)
Efficient Human Activity Recognition System
77
(5)
(6)
(7)
In the last step, product the output with tanh to normalized data. After that, the Fully
Connection layer integrates all the features from the LSTM layer with each activation
unit of the next layer as follows [21]
(8)
where WjlK is a matrix containing the weight values between the
and Kth nodes of the
and ( + 1)
is the
layer. Some of the output values
may be greater than one or negative. Their sum may not reach one, but after applying the
Softmax layer, all components will be between [0,1], and their sum is one as equation
follows [25]
th
th
node data in the th
layers. cjl
ezi
softMax(z )i = N
j=1 e
zj
(9)
The Classification layer must come after the Softmax layer, take the values from the
SoftMax, and mutually assign each input to one of the N classes using the following
entropy formula [26]
L(n, y) = −
N
i=1
ni log(pi )
(10)
where ni equal one of the target class and pi the predicted output value from the last
layer. We have used MATLAB R2020b for train data, Table 1 display some important
LSTM parameters.
Table 1. Parameter range for LSTM implementation.
LSTM parameter
Value
Number of layers
2
Number of features
12
Number of class
6
Execution Environment
GPU
Mini Batch Size
20
Max Epochs
20
Estimation
Adaptive Moment (adam)
78
A. Almusawi and A. H. Ali
The Confusion Matrix (CM) is a matrix N × N, the columns displayed for model
prediction, and the rows represent the actual classification. CM Consists of True Positive
(TP), False Negative (FN), False Positive (FP), and True Negative (TN). CM gives us
a comprehensive view of the types of errors our system makes and the quality of its
performance. Measurement performance of all activities are computed for multiclass
data by average Recall, Precision, and average Accuracy, as equations below [11]
N
Recall = 1 N ×
j=1
TPj
× 100%
TPj + FNj
N
precision = 1 N ×
j=1
n
j=1 TPj
Accurcy =
TPj
× 100%
TPj + FPj
+ TNj
Total
F1 − score = 2 ×
(11)
× 100%
(12)
(13)
Recall × Precision
× 100%
Recall + Precision
(14)
However, accuracy is an important performance metric that indicates how well a
model performs across all classes.
6 Results
In this section, we present and discuss the result of the LSTM model for classifying
our HAR dataset. Both datasets were included in five layers with 150 hidden units for
training, classification, and finding accuracy. Table 2 shows the summary of the chosen
number of hidden units on “Dataset2”.
Table 2. Validation and Testing Accuracy in frass number of hidden units and Precision, Recall,
and F1-score for “Dataset2”. The bold numbers in the raw represent the best accuracy.
Number of
hidden
units
Validation
accuracy
Testing
accuracy
Precision
Recall
F1-score
50
97.11%
96.22%
96.32%
96.40%
96.36%
80
97.11%
97.33%
97.36%
97.58%
97.47%
100
96.67%
97.56%
97.71%
97.61%
97.66%
120
96.67%
96.00%
96.24%
96.17%
96.21%
150
97.11%
98.44%
98.41%
98.63%
98.52%
180
96.00%
96.67%
96.85%
96.84%
96.85%
200
98.00%
97.78%
97.83%
97.97%
97.90%
220
97.11%
96.89%
96.93%
97.09%
96.36%
Efficient Human Activity Recognition System
79
Table 3 shows the confusion matrix of the LSTM model for our HAR “Dataset1”. Previous works indicated that the most critical activities to be analyzed are the “downstairs”
and “upstairs” activities; Due to the similarity of these two activities, all algorithms have
difficulty distinguishing them [13]. According to our dataset confusion matrix, these
two activities are slightly confused with one another, while the “Downstairs” activity is
confused with “walking.”
Table 4 show the confusion matrix of the LSTM model for our HAR “Dataset2”. From
the confusion matrix, we can see that the two “downstairs” and “upstairs” activities are
not confused and that the “downstairs” activity is slightly confused with the “walking”
activity.
Table 3. Confusion matrix of LSTM model on our HAR “Dataset1”. The bold numbers in the
diagonal represent correctly classified occurrences; the bold number in the bottom right represents
total accuracy. Note that: DownStairs = 1, Laying = 2, Sitting = 3, Standing = 4, UpStairs = 5,
and Walking = 6.
Predicted class
True Class
1
2
3
4
5
6
Recall (%)
1
55
0
0
0
1
10
83.3%
2
0
62
0
0
0
0
100%
3
0
0
78
0
0
0
100%
4
0
0
0
75
0
0
100%
5
0
0
0
0
77
2
97.5%
6
8
0
0
2
1
79
87%
Precision (%)
87.3%
100%
98.7%
97.4%
97.5%
86.8%
94.67%
Table 4. Confusion matrix of LSTM model on our HAR “Dataset2”. The bold numbers in the
diagonal represent correctly classified occurrences; the bold number in the bottom right represents
total accuracy. Note that: DownStairs = 1, Laying = 2, Sitting = 3, Standing = 4, UpStairs = 5,
and Walking = 6.
Predicted class
True Class
1
2
3
4
5
6
Recall (%)
1
62
0
0
0
0
4
93.9%
2
0
62
0
0
0
0
100%
3
0
0
78
0
0
0
100%
4
0
0
0
75
0
0
100%
5
0
0
0
0
78
1
98.7%
6
1
0
0
0
1
88
97.8%
Precision (%)
98.4%
100%
100%
100%
98.7%
94.6%
98.44%
80
A. Almusawi and A. H. Ali
As can be seen from the results, the LSTM algorithm performs slightly worse on
“Dataset1” than on “Dataset2” for the classes “Sitting” and “Standing” and slightly worse
for the activities “Upstairs” and “downstairs.“ On the other hand, the “Walking” activity
has significantly inferior performance. As a result, we may conclude that forecasting the
“Walking” activity is considerably more complex than predicting other activities.
For “Dataset1”, the test accuracy was 94.67%, training accuracy was 100%, Precision
was 94.76%, Recall was 94.83%, validation accuracy was 93.11%, and F1-score was
94.8% when hidden unit 50, max epochs 120, and mini-batch size 10. Figure 2 and
Fig. 3 show the accuracy and loss of LSTM on Dataset1 during iteration in the R2020b
MATLAB window.
Fig. 2. Validation and Training vs. iteration of Dataset1 using the LSTM model.
Fig. 3. Validation and training Lost vs. iteration of “Dataset1” using the LSTM model.
For “Dataset2”, the testing accuracy of 98.44%, training accuracy 100%, validation
accuracy 97.11%, Precision 98.48%, Recall 98.63%, and F1-score 98.52% when hidden
unit 150, max epochs 20, and mini-batch size 20. Figure 4 and Fig. 5 show the accuracy
and loss of LSTM on Dataset2 during iteration in the R2020b MATLAB window.
However, adopting two IMU sensors placed at the waist and the right ankle improves
performance for identifying the six activities when using the LSTM model. As shown in
Table 4, the total classification accuracy was 98.48%; and the recognition performance
of walking and walking Downstart is better than using two IMU sensors placed at the
waist and the right wrist in Table 3.
Efficient Human Activity Recognition System
81
Fig. 4. Validation and Training vs. iteration of “Dataset2” using the LSTM model.
Fig. 5. Validation and training Lost and vs. iteration of “Dataset2” using the LSTM model.
7 Conclusions
This paper proposed a deep learning recurrent neural network architecture for human
activity recognition from wearable sensors. It consists of three stages: data acquisition,
data analysis, and classification. In addition, two datasets Collected of IMU sensors
with gyroscope, accelerometer, and magnetometer placed different positions on subjects,
indoor. For this purpose, ten subjects do six activities (walking, sitting, walking upstairs,
standing, walking downstairs, and lay-ing). The first dataset was collected from sensors
placed in the right wrist and the waist to get “Dataset1”, and the second dataset was
collected from sensors placed in the right ankle and the waist to get “Dataset2”. Each
dataset standardizes and divided into three sections: training 70%, testing 15%, and
validation 15%. To classify the “Dataset1” used LSTM and requested test accuracy of
94.67% with 50 hidden units. The “Dataset2” classification used LSTM with a different
number of hidden units; the number of 150 hidden units registered the highest accuracy
was 98.44%. However, adopting two IMU sensors placed at the waist and the right ankle
better performance for recognizing the six activities than using two IMU sensors placed
at the waist and the right wrist.
References
1. Fu, Z., He, X., Wang, E., Huo, J., Huang, J., Wu, D.: Personalized human activity recognition
based on integrated wearable sensor and transfer learning. Sensors (Switzerland) 21(3), 1–23
(2021). https://doi.org/10.3390/s21030885
2. Minh Dang, L., Min, K., Wang, H., Jalil Piran, M., Hee Lee, C., Moon, H.: Sensor-based
and vision-based human activity recognition: a comprehensive survey. Pattern Recognit. 108,
107561 (2020) https://doi.org/10.1016/j.patcog.2020.107561
82
A. Almusawi and A. H. Ali
3. Wang, J., Chen, Y., Hao, S., Peng, X., Hu, L.: Deep learning for sensor-based activity recognition: a survey. Pattern Recognit. Lett. 119, 3–11 (2019). https://doi.org/10.1016/j.patrec.
2018.02.010
4. Chen, K., Zhang, D., Yao, L., Guo, B., Yu, Z., Liu, Y.: deep learning for sensor-based human
activity recognition: overview, challenges and opportunities (2020) http://arxiv.org/abs/2001.
07416
5. Aparecida, R., Romero, F.: Inertial Units and Ambient Sensors, pp. 1–32 (2021)
6. Wang, Y., Cang, S., Yu, H.: A survey on wearable sensor modality centred human activity
recognition in health care. Expert Syst. Appl. 137, 167–190 (2019). https://doi.org/10.1016/
j.eswa.2019.04.057
7. Lawal, I.A., Bano, S.: Deep human activity recognition with localisation of wearable sensors.
IEEE Access 8, 155060–155070 (2020). https://doi.org/10.1109/ACCESS.2020.3017681
8. Suto, J., Oniga, S., Lung, C., Orha, I.: Comparison of offline and real-time human activity
recognition results using machine learning techniques. Neural Comput. Appl. 32(20), 15673–
15686 (2018). https://doi.org/10.1007/s00521-018-3437-x
9. Slim, S.O., Atia, A., Elfattah, M.M.A., Mostafa, M.S.M.: Survey on human activity recognition based on acceleration data. Int. J. Adv. Comput. Sci. Appl. 10(3), 84–98 (2019). https://
doi.org/10.14569/IJACSA.2019.0100311
10. . De Leonardis, G., et al.: Human activity recognition by wearable sensors: Comparison of
different classifiers for real-time applications. In: MeMeA 2018 - 2018 IEEE Int. Symp. Med.
Meas. Appl. Proc., vol. 3528725544, pp. 1–6 (2018). doi: https://doi.org/10.1109/MeMeA.
2018.8438750
11. Nweke, H.F., Teh, Y.W., Al-garadi, M.A., Alo, U.R.: Deep learning algorithms for human
activity recognition using mobile and wearable sensor networks: State of the art and research
challenges. Expert Syst. Appl. 105, 233–261 (2018). doi: https://doi.org/10.1016/j.eswa.2018.
03.056
12. Zebin, T., Scully, P.J., Ozanyan, K.B.: Human activity recognition with inertial sensors using
a deep learning approach. Proc. IEEE Sensors, no. 1 (2017). https://doi.org/10.1109/ICSENS.
2016.7808590
13. Milenkoski, M., Trivodaliev, K., Kalajdziski, S., Jovanov, M., Stojkoska, B.R.: Real time
human activity recognition on smartphones using LSTM networks. In: 2018 41st International
Convention on Information and Communication Technology, Electronics and Microelectronics, MIPRO 2018 - Proceedings, pp. 1126–1131 (2018). https://doi.org/10.23919/MIPRO.
2018.8400205
14. Espinilla, M., et al.: Human activity recognition from the acceleration data of a wearable
device. which features are more relevant by activities? Proceedings 2(19), 1242 (2018). https://
doi.org/10.3390/proceedings2191242
15. Hassan, M.M., Huda, S., Uddin, M.Z., Almogren, A., Alrubaian, M.: Human activity recognition from body sensor data using deep learning. J. Med. Syst. 42(6), 1–8 (2018). https://
doi.org/10.1007/s10916-018-0948-z
16. Weiss, G.M.: WISDM Smartphone and Smartwatch Activity and Biometrics Dataset. UCI
Mach. Learn. Repos. WISDM Smartphone Smartwatch Act. Biometrics Dataset Data Set,
vol. 7, pp. 133190–133202 (2019)
17. Albaba, M., Qassab, A., Yilmaz, A.: Human activity recognition and classification using of
convolutional neural networks and recurrent neural networks. Int. J. Appl. Math. Electron.
Comput. 8(4), 185–189 (2020). https://doi.org/10.18100/ijamec.803105
18. San Buenaventura, C.V., Tiglao, N.M.C., Atienza, R.O.: Deep learning for smartphone-based
human activity recognition using multi-sensor fusion. In: Chen, J.-L., Pang, A.-C., Deng, D.J., Lin, C.-C. (eds.) WICON 2018. LNICSSITE, vol. 264, pp. 65–75. Springer, Cham (2019).
Doi: https://doi.org/10.1007/978-3-030-06158-6_7
Efficient Human Activity Recognition System
83
19. Oluwalade, B., Neela, S., Wawira, J., Adejumo, T., Purkayastha, S.: Human activity recognition using deep learning models on smartphones and smartwatches sensor data. In: Heal. 2021
- 14th Int. Conf. Heal. Informatics; Part 14th International Joint Conference on Biomedical
Engineering Systems and Technologies BIOSTEC 2021, pp. 645–650 (2021). https://doi.org/
10.5220/0010325906450650
20. Munoz-Organero, M.: Outlier detection in wearable sensor data for human activity recognition
(HAR) based on DRNNs. IEEE Access 7, 74422–74436 (2019). doi: https://doi.org/10.1109/
ACCESS.2019.2921096
21. Uddin, M.Z., Hassan, M.M.: Activity recognition for cognitive assistance using body sensors
data and deep convolutional neural network. IEEE Sens. J. 19(19), 8413–8419 (2019). https://
doi.org/10.1109/JSEN.2018.2871203
22. Lyu, L., He, X., Law, Y.W., Palaniswami, M.: Privacy-preserving collaborative deep learning
with application to human activity recognition. In: International Conference on Information
and Knowledge Management Proceedings, vol. Part F1318, pp. 1219–1228 (2017). https://
doi.org/10.1145/3132847.3132990
23. Holzinger, A., Kieseberg, P., Tjoa, A.M., Weippl, E. (eds.): CD-MAKE 2017. LNCS, vol.
10410. Springer, Cham (2017). https://doi.org/10.1007/978-3-319-66808-6
24. Zhao, Y., Yang, R., Chevalier, G., Xu, X., Zhang, Z.: Deep residual bidir-LSTM for human
activity recognition using wearable sensors. Math. Probl. Eng. 2018 (2018). https://doi.org/
10.1155/2018/7316954
25. Sharma, S., Sharma, S., Anidhya, A.: Understanding activation functions in neural networks.
Int. J. Eng. Appl. Sci. Technol. 4(12), 310–316 (2020)
26. Aljarrah, A.A., Ali, A.H.: Human activity recognition by deep convolution neural networks
and principal component analysis. In: Balas, V.E., Solanki, V.K., Kumar, R. (eds.) Further
Advances in Internet of Things in Biomedical and Cyber Physical Systems. ISRL, vol. 193,
pp. 111–133. Springer, Cham (2021). https://doi.org/10.1007/978-3-030-57835-0_10
Job Training Recommendation System:
Integrated Fuzzy AHP and TOPSIS Approach
Okfalisa1(B) , Rizal Siburian1 , Yelfi Vitriani1 , Hidayati Rusnedy2 , Saktioto3 ,
and Melfa Yola4
1 Department of Informatics Engineering, Universitas Islam Negeri Sultan Syarif Kasim Riau,
Pekanbaru, Indonesia
okfalisa@gmail.com
2 Faculty of Computer Science, Universitas Putra Indonesia YPTK Padang, Padang, Indonesia
3 Faculty of Science, Universitas Riau, Pekanbaru, Indonesia
4 Department of Industrial Engineering, Universitas Islam Negeri Sultan Syarif Kasim Riau,
Pekanbaru, Indonesia
Abstract. A penitentiary serves as a job training mechanism to intensify and
delve into jailbirds’ talent and interest for workforce preparedness. Unfortunately,
the job training commonly fails to reach the jailbird’s potential benefits in getting
the proper workforce position. Therefore, this study tries to develop an integrated
multi-attribute decision making Fuzzy Analytical Hierarchy Process (Fuzzy-AHP)
together with The Technique for Order of Preference by Similarity to Ideal Solution (TOPSIS) to assist the jailbird in finding the appropriate training place on
age, latest education, work experience, talents and interests as domain criteria.
Fuzzy-AHP employs the weighting criteria, whereas TOPSIS takes a role as an
alternative ranking tool. Six alternatives are suggested based on their preferences,
including cooking, sewing, building, furniture, farming, and raising livestock. This
recommended system has been successfully proposed fifty jailbirds for their optimal training job. Hence, there is optimism that this profession will enhance their
future level of life.
Keywords: Fuzzy-AHP · Job training · TOPSIS · Decision support system ·
Recommended system
1 Introduction
The ex-jailbirds face various challenges when returning to their society, including the
broken family relationships, social abuse that assume the ex-jailbirds would never move
to be the right people, and mental health issues. Nevertheless, the greatest insists upon
finding the right job in a friendly and accepting environment. The workforce grows
into the influencing key factor for ex-jailbirds after incarceration [1]. It is due to the
unemployed person is substantial returns to crime (recidivism) if he lacks sufficient skills
and competencies. Moreover, the negative societal stigma makes it challenging for exoffenders to get respectable work [2–4]. Therefore, job training or vocational education
© The Author(s), under exclusive license to Springer Nature Switzerland AG 2022
F. Saeed et al. (Eds.): IRICT 2021, LNDECT 127, pp. 84–94, 2022.
https://doi.org/10.1007/978-3-030-98741-1_8
Job Training Recommendation System
85
for jailbirds is crucial in leading to the qualification provision and eligible workforce
enhancement as rehabilitative contributions of Correctional Institution services [5].
Bierens and Carvalho (2011) identified that the effectiveness persuades the recidivism reduction of employment supported programs, the jailbirds’ age management [6,
7], the successful finding of the post-release workforce, or particular work in progress.
However, Duwe (2017) notes that the increased recidivism rates significantly impact
both social and economic circumstances and community [8–10]. On the contrary, it was
discovered that the proposed job training fails to provide substantial percussion on jailbirds or even ex-jailbirds. It is due to the limitation of supporting tools and approaches
and the lack of training tailored to the convicts’ abilities, talents, and interests.
Chang [10] first introduced Fuzzy-AHP to complement the Analytical Hierarchy Process (AHP) approach. As one of the Multi-Criteria Decision Making (MCDM) schema,
AHP assessed the relative significance of criteria in decision-making problems [11].
One of the most convincing drawbacks of AHP is the limitation of decision-makers in
expressing their precise figures of opinion or evaluation. Meanwhile, Fuzzy logic plays
an essential role in capturing decision makers’ uncertainty judgment [12, 13]. Hasan
et al. (2018) supported the advantages of fuzzy AHP to compute the inconsistency
rate of criteria through the pairwise comparisons matrix for job satisfaction assessment [14]. They successfully rated the hierarchy job satisfaction criteria scoring in less
than 0.1 for variables and sub-variables. With AHP, fuzzy extends the uncertainty of
incomplete information interpretation in AHP to serve more logical judgment in solving
decision-making issues [15]. The application of AHP and Fuzzy-AHP in many fields
of decision-making problems, such as business, industrial, energy, farming, health, and
education, has been identified. Okfalisa et al. (2021) has successfully compared AHP
and Fuzzy-AHP for smartphone selection [16]. AHP has been studied to measure the
different factors of Small Medium Enterprises (SMEs) digitalization preparedness from
multiple perspectives and judgments [17]. Wang et al. (2019) integrated the Fuzzy-AHP
and SWOT analysis approach to choosing renewable energy resources [18]. Yucesan
et al. (2019) hybrid the Fuzzy-AHP and Fuzzy-TOPSIS for hospital service quality
assessment [19]. Pilevar et al. (2020) conducted the land suitability assessment using
Fuzzy-AHP and GIS techniques [20]. The fuzzy-AHP method prioritizes the criteria by
determining the pairwise comparisons on a nine-point scale. Pairwise comparison ratios
are expressed in absolute numbers, namely a scale of 1–9, which has the advantage of
simplicity and ease of use [21]. A nine-point scale was used to compare pairs of each
selected criterion. Meanwhile, this pairwise comparison indicates the priority of the
criteria being compared [22].
The Technique for Order Preference by Similarity to Ideal Solution (TOPSIS) method
was developed by Hwang and Yoon in 1981 [23]. This technique is initiated as the most
commonly used MCDM technique for finding the ideal point category [24]. Herein,
the ranking of alternatives is determined by calculating the distance between the ideal
solution and the negative ideal solution. Hence, the selection of optimal alternatives is
simultaneously administered by the shortest distance from the ideal solution and the
longest distance from the negative ideal solution. [25]. In a nutshell, TOPSIS hands
over the full use of original data and accurate results to reflect the gaps between various
evaluation schemes instead of the other approaches [26]. TOPSIS works well optimum
86
Okfalisa et al.
in priority alternatives, while Fuzzy-AHP flourishing pursues the criteria assessment in
multi-tier hierarchies [27]. Dogan et al. (2019) utilized the integration of the above methods for vehicle corridor selection [28], Li et al. (2020) applied for assessing successful
B2C e-commerce websites [29], Kahraman et al. (2018) devoted to outsources manufacturers evaluation [30]. Chou et al. (2020) applied to identify critical organizational
capabilities [31]. Thus, integrating these approaches is potentially adopted to clear up
the job training recommendation system for jailbirds. Whereas Fuzzy-AHP employs the
weighting job training criteria, and TOPSIS deploys to rank the potential job training as
alternatives based on the jailbirds’ criteria and conditions.
2 Research Method
This study accommodates two potential Decision Support System methods, whereby the
Fuzzy-AHP handling the weighting criteria as well as the TOPSIS equips for alternative
rankings. The Fuzzy-AHP follows the algorithm stage by [16].
Stage 1: Structuring the problem hierarchy and pairwise matrix comparisons between
criteria with the Triangular Fuzzy Number (TFN) scale to find consistent values (CR ≤
0.1) on the comparison matrix. Furthermore, the value of the AHP comparison matrix
will be changed into the Fuzzy-AHP value. TFN Scale is explained in Table 1.
Table 1. The TFN comparison scale [21]
Level significance
Linguistic set
TFN
Invers
1
Equal relative importance
(1, 1, 1)
(1, 1, 1)
2
Equally to moderately more important
(1/2, 1, 3/2)
(2/3, 1, 2)
3
Moderately more important
(1, 3/2, 2)
(1/2, 2/3, 1)
4
Moderately to strongly important
(3/2, 2, 5/2)
(2/5, ½, 2/3)
5
Strongly important
(2, 5/2,3)
(1/3, 2/5, 1/2)
6
Strongly to very strongly more important
(5/2, 3, 7/2)
(2/7, 1/3, 2/5)
7
Very strongly more important
(3, 7/2, 4)
(1/4, 2/7, 1/3)
8
Very strongly to extremely more important
(7/2, 4, 9/2)
(2/9, ¼, 2/7)
9
Extremely important (high priority)
(4, 9/2, 9/2)
(2/9, 2/9, ¼)
Stage 2: Calculating the value of Fuzzy Synthesis (Si) (See Eq. 1) and the consideration parameters including TFN number (M), number of criteria (m), row (i), column
(j), and parameter (g) in low (l), middle (m), and upper (u) categorization.
(Si) :
m
j
M
j=1 gi
×
n
i=1
m
j
M
j=1 gi
−1
(1)
Job Training Recommendation System
87
Stage 3: Computing the vector value (V), M2 = (l2, m2, u2) ≥ M1 = (l1, m1, u1)
are defined as a vector value.
V (M2 ≥ M1 ) = sup min(π
M
min(π
M
(x)),
(y))
1
2
⎫
⎧
1 if m2 ≥ m1 ⎪
⎪
⎪
⎪
⎪
⎪
⎪
⎪
⎪
0 if l1 ≥ u2 ⎪
⎪
⎪
⎪
⎪
⎬
⎨
(2)
l1−u2
VM2 ≥ M1 = (m2 −u2 )−(m2 −l2 )
⎪
⎪
⎪
⎪
⎪
⎪
⎪
⎪
⎪
⎪
⎪
⎪
⎪
⎪
⎭
⎩
Stage 4: De-fuzzification Ordinary Value (d ) For k = 1, 2, n; k = I, it obtains the
vector weight value:
W = d (A1), d (A2), . . . d (An) T
(3)
Stage 5: Normalizing value of fuzzy vector weights (W), where W is defined as a
non-fuzzy number.
W = (d(A1), d(A2), . . . , d(An))T
(4)
The following stage of TOPSIS approaches [31]:
Stage 1: Determining the normalized decision matrix (rij).
xij
rij =
m
(5)
i=1 xij2
Stage 2: Calculating the weighted normalized decision matrix. The positive ideal
solution + and the negative ideal solution can be determined based on the normalized
weight rating (yij).
yij = wi rij
(6)
Stage 3: Calculate the positive ideal solution matrix and the negative ideal solution
matrix.
A+ = y1+ , y2+ , . . . , yn+
(7)
A− = y1− , y2− , . . . , yn−
Assumption:
y+
j
=
y−
j =
(8)
max yij if j is a benifit attribute
min yij if j is the attribute cost
max yij if j is a benifit attribute
min yij if j is the attribute cost
(9)
88
Okfalisa et al.
Stage 4: Calculating the distance (d) between the values of each alternative with the
positive ideal solution matrix (d*) and the negative ideal solution matrix (d−).
2
n
∗
vij − v∗j , i = 1, . . . , m
(10)
dj =
j=1
d−
j =
n
j=1
2
vij − v−
, i = 1, . . . , m
j
(11)
Stage 5: Calculating preference values for each alternative (CC).
CCi =
d−
i
d∗i + d−
i
, i = 1, . . . , m
(12)
3 Results and Discussion
3.1 Criteria and Sub-criteria Analysis
By referencing literature reviews and interviews with penitentiary staff responsible for
jailbird’s job training, the criteria and sub-criteria for this DSS mechanism are defined
in Table 2.
Table 2. The criteria formulation.
No
Criteria
Sub-criteria
1
Age (C01)
2
3
Latest
education
(C02)
Work
experience
(C03)
Range
Weight
Attribute
References
Old age adult >55
1
Cost
[6, 7]
Young-age
adult
17–25
2
Middle-age
adult
26–55
3
Low
Not educate
1
Benefit
[2, 3]
Moderately
low
Elementary school
2
Moderate
Junior high school
3
Moderately
High
senior high school
4
High
Diploma/Bachelor
5
Low
<1 year
1
Benefit
[1, 5]
Moderate
2–3 year
2
High
≥3 year
3
(continued)
Job Training Recommendation System
89
Table 2. (continued)
No
Criteria
Sub-criteria
Range
Weight
Attribute
References
4
Talents
(C04)
Abstract
Pattern and design
skill
1
Benefit
[8–10]
Speed
accuracy
Laboratory and
office skill
2
Mechanic
Mechanical skill
3
Professional
Science and art
interest
1
Benefit
[8–10]
Commercial
Enterprise interest
2
Physical
Physical and
mechanical interest
3
5
Interest
(C05)
Meanwhile, six alternatives are listed as optimum recommended training for the
jailbirds, including cooking (A01), sewing (A02), building (A03), furnishing (A04),
farming (A05), and raising (A06).
3.2 Criteria and Sub-criteria Analysis
The hierarchy problems for the job training recommendation system can be depicted in
Fig. 1.
Fig. 1. Hierarchy problems.
Referring to Eq. (1), Table 3 explained that the values of CR ≤ 0,1. These values
indicated the consistency of the proposed criteria. Thus the synthesis of fuzzy calculations for the Low (l), Middle (m), and Upper (u) scales can proceed. Next, following
90
Okfalisa et al.
Table 3. Fuzzy synthesis values.
Fuzzy synthesis value (Si)
CI
CR
RI
Criteria
L
M
U
0.11
0.098
1.12
C01
0.122
0.250
0.455
C02
0.090
0.167
0.375
C03
0.095
0.186
0.348
C04
0.108
0.218
0.401
C05
0.090
0.179
0.401
Table 4. Normalization of criteria weighting values.
Criteria
W (vector weight)
W (fuzzy vector weight)
C01
1
0.236
C02
0.753
0.178
C03
0.780
0.184
C04
0.898
0.212
C05
0.799
0.189
Total
7.433
1
Eqs. (2) to (5), the criteria weighting and normalized fuzzy vector weights are described
in Table 4.
The criterion weight value is normalized on a scale of 0–1. Table 3 informed that
C01 (age) is the most significant criteria in influencing job training selection. It is then
followed by C04, C05, C03, and C02, respectively.
3.3 Criteria and Sub-criteria Analysis
Following the TOPSIS stage at Eq. (6), the value of matrix normalization is obtained as
bellows. Table 4 points out that matrix value for alternative A01 against C01 at 0.258, C02
at 0.521, C03 at 0.224, C04, and C05 at 0.243 and 0.333, respectively. These values are
generated as the basic calculations for the next stage TOPSIS algorithm by considering
each criterion’s weight values and attribute (Table 2) and jailbird’s weighted assessment
(Tables 4 and 5).
Job Training Recommendation System
91
Table 5. Normalization matrix value.
Alternatives
Criteria standard value
Criteria respondent #1 value
C01
C02
C03
C04
C05
C01
C02
C03
C04
C05
A01
0.258
0.521
0.224
0.243
0.333
0.061
0.278
0.041
0.154
0.126
A02
0.516
0.521
0.447
0.243
0.167
0.122
0.278
0.082
0.154
0.063
A03
0.516
0.391
0.447
0.485
0.500
0.122
0.209
0.082
0.309
0.189
A04
0.516
0.521
0.671
0.728
0.333
0.122
0.278
0.124
0.463
0.126
A05
0.258
0.130
0.224
0.243
0.500
0.061
0.070
0.041
0.154
0.189
Hence, following the calculation of positive and negative ideal solutions and the
distance between both ideal solutions as determined at Eq. (7–13), the preferences values
of each alternative for fifty respondents are presented in Table 6.
Table 6. Preference values for an alternative.
Respondents
Alternative
Positive
Negative
Pref
Rank
Respondent#1
A01
0.326
0.226
0.409868
3
A02
0.342
0.213
0.383671
4
A03
0.185
0.246
0.571663
2
A04
0.088
0.387
0.815185
1
A05
0.382
0.140
0.268312
5
A06
0.382
0.140
0.268312
6
A01
0.241
0.170
0.414214
5
A02
0.308
0.084
0.213495
6
A03
0.170
0.226
0.570101
2
A04
0.155
0.251
0.618348
1
A05
0.232
0.226
0.492856
3
A06
0.232
0.226
0.492856
4
…
…
…
…
…
…
Respondent#50
A01
0.205
0.195
0.487492
3
A02
0.221
0.161
0.421441
6
A03
0.164
0.187
0.532393
2
A04
0.138
0.247
0.641807
1
A05
0.239
0.176
0.42445
4
A06
0.239
0.176
0.42445
5
Respondent#2
92
Okfalisa et al.
Table 6 resolved that alternative A04 (furnishing) is suggested as the first rank optimal
job training for the jailbird at a value of 0.815. It is then followed by A03 (building),
A01 (cooking), A02 (sewing), A05 (farming), and A06 (raising), respectively.
Fig. 2. The recapitulation of system recommendation.
Moreover, the respondents for this job training recommendation system are fifty
jailbirds at Bangkinang penitentiary class two. As shown in Fig. 2, it reveals fortyseven jailbirds are the first rank suggested to join the furnishing job training mechanism.
Meanwhile, only one jailbird is the first ranked advised to cooking, building, and farming.
None jailbirds are the first list proposed for sewing and building. Regarding the efficacy
of Fuzzy-AHP and TOPSIS integration, similar results are also found by Hasan et al.
(2018) and Ali et al. (2018) in analyzing the ranking of legality factors based on job
satisfaction [32] and career decision making in the maritime industry [33], respectively.
4 Conclusion
An integration of Fuzzy-AHP and TOPSIS has been successfully applied for solving the
job training recommendation system for Bangkinang’s jailbirds. The system proposed
the optimal rank of alternatives from cooking, building, farming, furnishing, sewing,
and raising hinge on the significant fuzzy weight of criteria on their assessment as
well as age, latest education, work experience, talents, and interests. This job training
endorsement can be utilized as an advisement tool to lead the jailbirds in singling out
their personalities, talents, and interests to the future directly into the right and prospect
jobs. Hence, the ex-jailbirds that escort a criminal can be reduced, and their forthcoming
life will be raised.
References
1. Mcroberts, O.M.: Prisoner Reentry and the Institutions of Civil Society: Bridges and Barriers
to Successful Reintegration Religion, Reform, Community: Examining the Idea of ChurchBased Prisoner Reentry, March 2002
Job Training Recommendation System
93
2. Hirschfield, P.J., Piquero, A.R.: Normalization and legitimation: modeling stigmatizing
attitudes toward ex-offenders. Criminology 48(1), 27–55 (2010)
3. Uggen, C., Vuolo, M., Lageson, S., Ruhland, E., Whitham, H.K.: The edge of stigma: an
experimental audit of the effects of low-level criminal records on employment. Criminology
52(4), 627–654 (2014)
4. Decker, S.H., Ortiz, N., Spohn, C., Hedberg, E.: Criminal stigma, race, and ethnicity: the
consequences of imprisonment for employment. J. Crim. Justice 43(2), 108–121 (2015).
Elsevier Ltd.
5. Cale, J., et al.: Australian prison vocational education and training and returns to custody
among male and female ex-prisoners: a cross-jurisdictional study. Aust. N. Z. J. Criminol.
52(1), 129–147 (2019)
6. Maden, A., Skapinakis, P., Lewis, G., Scott, F., Burnett, R., Jamieson, E.: Gender differences
in reoffending after discharge from medium-secure units: national cohort study in England
and Wales. Br. J. Psychiatry 189(AUG), 168–172 (2006)
7. Payne, J.: Recidivism in Australia: findings and future research. AIC Res. Publ. Policy Ser.
(80), 140 (2007)
8. Duwe, G.: The use and impact of correctional programming for inmates on pre- and postrelease outcomes. Natl. Inst. Justice 10097(2010), 1–41 (2017)
9. Andrews, D.A., Bonta, J.: Rehabilitating criminal justice policy and practice. Psychol. Publ.
Policy Law 16(1), 39–55 (2010)
10. Okfalisa, Anugarah, S., Anggraini, W., Absor, M., Fauzi, S.S.M., Saktioto: Integrated analytical hierarchy process and objective matrix in balanced scorecard dashboard model for performance measurement. Telkomnika (Telecommun. Comput. Electron. Control) 16, 2703–2711
(2018)
11. Mdallal, A., Hammad, A.: Application of fuzzy analytical hierarchy process (FAHP) to reduce
concrete waste on construction sites. In: Proceedings, Annual Conference - Canadian Society
for Civil Engineering, June 2019
12. Kaya, T., Kahraman, C.: Multicriteria renewable energy planning using an integrated fuzzy
VIKOR & AHP methodology: the case of Istanbul. Energy Elsevier 35(6), 2517–2527 (2010)
13. Dogan, O.: Process mining technology selection with spherical fuzzy AHP and sensitivity
analysis. Expert Syst. Appl. 178(May), 114999 (2021). Elsevier Ltd.
14. Liu, Y., Eckert, C.M., Earl, C.: A review of fuzzy AHP methods for decision-making with
subjective judgements. Expert Syst. Appl. 161, 113738 (2020). Elsevier Ltd.
15. Okfalisa, Rusnedy, H., Iswavigra, D.U., Pranggono, B., Haerani, E., Saktioto: Decision support system for smartphone recommendation: the comparison of fuzzy AHP and fuzzy ANP
in multi-attribute decision making. Sinergi 25(1), 101 (2020)
16. Okfalisa, Anggraini, W., Nawanir, G., Saktioto, Wong, K.Y.: Measuring the effects of different
factors influencing on the readiness of SMEs towards digitalization: a multiple perspectives
design of decision support system. Decis. Sci. Lett. 10(3), 425–442 (2021)
17. Wang, Y., Xu, L., Solangi, Y.A.: Strategic renewable energy resources selection for Pakistan:
based on SWOT-Fuzzy AHP approach. Sustain. Cities Soc. 52 (2020)
18. Yucesan, M., Gul, M.: Hospital service quality evaluation: an integrated model based on
Pythagorean fuzzy AHP and fuzzy TOPSIS. Soft Comput. 24(5), 3237–3255 (2020). Springer,
Heidelberg
19. Pilevar, A.R., Matinfar, H.R., Sohrabi, A., Sarmadian, F.: Integrated fuzzy, AHP and GIS
techniques for land suitability assessment in semi-arid regions for wheat and maize farming.
Ecol. Indic. 110(August 2019), 105887 (2020). Elsevier
20. Zoghi, M., Rostami, G., Khoshand, A., Motalleb, F.: Material selection in design for deconstruction using Kano model, fuzzy-AHP and TOPSIS methodology. Waste Manag. Res.
(2021)
94
Okfalisa et al.
21. Avikal, S., Singh, A.K., Kumar, K.C.N., Badhotiya, G.K.: A fuzzy-AHP and TOPSIS based
approach for selection of metal matrix composite used in design and structural applications.
Mater. Today Proc. 46, 11050–11053 (2021). Elsevier Ltd.
22. Zeng, J., Lin, G., Huang, G.: Evaluation of the cost-effectiveness of Green Infrastructure in
climate change scenarios using TOPSIS. Urban Forestry Urban Green. 64(December 2020),
127287 (2021). Elsevier GmbH
23. Amini, A., Alinezhad, A., Yazdipoor, F.: A TOPSIS, VIKOR and DEA integrated evaluation
method with belief structure under uncertainty to rank alternatives. Int. J. Adv. Oper. Manag.
11(3), 171 (2019)
24. Palczewski, K., Sałabun, W.: The fuzzy TOPSIS applications in the last decade. In: 23rd
International Conference on Knowledge-Based and Intelligent Information and Engineering
System, Procedia Computer Science, vol. 59, pp. 2294–2303 (2019)
25. Leng, L., et al.: Performance assessment of coupled green-grey-blue systems for Sponge City
construction. Sci. Total Environ. 728 (2020)
26. Ekmekcioğlu, Ö., Koc, K., Özger, M.: Stakeholder perceptions in flood risk assessment: a
hybrid fuzzy AHP-TOPSIS approach for Istanbul, Turkey. Int. J. Disaster Risk Reduction
60(May) (2021)
27. Dogan, O., Deveci, M., Canıtez, F., Kahraman, C.: A corridor selection for locating
autonomous vehicles using an interval-valued intuitionistic fuzzy AHP and TOPSIS method.
Soft. Comput. 24(12), 8937–8953 (2019). https://doi.org/10.1007/s00500-019-04421-5
28. Li, R., Sun, T.: Assessing factors for designing a successful B2C E-Commerce website using
fuzzy AHP and TOPSIS-Grey methodology. Symmetry 12(3) (2020)
29. Kahraman, C., Öztayşi, B., Onar, S.C.: An integrated intuitionistic fuzzy AHP and TOPSIS
approach to evaluation of outsource manufacturers. J. Intell. Syst. 29(1), 283–297 (2020)
30. Chou, T.Y., Chen, Y.T.: Applying fuzzy AHP and TOPSIS method to identify key organizational capabilities. Mathematics 8(5) (2020)
31. Swindiarto, V.T.P., Sarno, R., Novitasari, D.C.R.: Integration of fuzzy C-means clustering and
TOPSIS (FCM-TOPSIS) with Silhouette analysis for multi criteria parameter data. In: 2018
International Seminar on Application for Technology of Information and Communication:
Creative Technology for Human Life, iSemantic 2018, pp. 463–468. IEEE (2018)
32. Denavi, H.D. Mirabi, M., Rezaei, A.: Ranking of leagility factors based on job satisfaction
through a combinatory model of fuzzy TOPSIS and AHP (case study: M.R.I Hospital, Shiraz,
Iran). Open J. Bus. Manag. 06(01), 21–38 (2018)
33. Kaya, A.Y., Asyali, E., Ozdagoglu, A.: Career decision making in the maritime industry:
research of merchant marine officers using Fuzzy AHP and Fuzzy TOPSIS methods. Zeszyty
Naukowe Akademii Morskiej w Szczecini 55(127), 95–103 (2018)
Improvement of Population Diversity
of Meta-heuristics Algorithm Using Chaotic
Map
Samuel-Soma M. Ajibade1,2(B) , Mary O. Ogunbolu3 , Ruth Chweya4 ,
and Samuel Fadipe5
1 Department of Computer Engineering, Istanbul Ticaret Universitesi, Istanbul, Turkey
asamuel@ticaret.edu.tr
2 Department of Computer Science, Universiti Teknologi Malaysia, Johor Bahru, Malaysia
3 Department of Computer Science, Lead City University, Ibadan, Oyo State, Nigeria
bunmi810@yahoo.com
4 School of Information Science and Technology, Kisii University, Kisii, Kenya
rchweya@kisiiuniversity.ac.ke
5 Lagos State University, Ojo, Lagos, Nigeria
samuel.fadipe@lasu.edu.ng
Abstract. Particle swarm optimization (PSO) is a global optimization and natureinspired algorithm known for its good quality and easily applied in various realworld optimization challenges. Nevertheless, PSO has some weaknesses such as
slow convergence, converging prematurely and simply gets stuck at local optima.
This study aims to solve the problem of deprived population diversity in the search
process of PSO which causes premature convergence. Therefore, in this research,
a method is brought to PSO to keep away from early stagnation which explains
premature convergence. The aim of this research is to propose a chaotic dynamic
weight particle swarm optimization (CHPSO) wherein a chaotic logistic map is
utilized to enhance the populace diversity within the search technique of PSO with
the aid of editing the inertia weight of PSO in an effort to avoid premature convergence. This study additionally investigates the overall performance and feasibility
of the proposed CHPSO as a function selection set of rules for fixing problems of
optimization. 8 benchmark functions had been used to assess the overall performance and seek accuracy of the proposed (CHPSO) algorithms and as compared
with a few other meta-heuristics optimization set of rules. The outcomes of the
experiments show that the CHPSO achieves correct consequences in fixing an
optimization and has established to be a dependable and green metaheuristics
algorithm for selection of features.
Keywords: Particle swarm optimization · Premature convergence · Inertia
weight · Population diversity · Poor diversity
1 Introduction
Nowadays, in every facets of life, we deal with voluminous or massive data which cut
across every field of study. Datamining is a procedure of extracting and discovering
© The Author(s), under exclusive license to Springer Nature Switzerland AG 2022
F. Saeed et al. (Eds.): IRICT 2021, LNDECT 127, pp. 95–104, 2022.
https://doi.org/10.1007/978-3-030-98741-1_9
96
S.-S. M. Ajibade et al.
styles in large datasets concerning methods on the intersection of machine learning,
facts, database structures. Data Mining strategies are utilized to locate hidden designs and
relations on an intensive measure of facts that is probably beneficial in making of choices
[1]. Because of the way that the greater part of the datasets created have an enormous
number of redundant and insignificant elements, there could be broad lessening in the
exactness of preparing the classifiers and furthermore a decrease in the training speed of
the classifiers. This issue is prominently called “curse of dimensionality” in information
mining methods and this makes the computational intricacy of fostering the classifiers
to upsurge [2, 3]. To beat the issues of exorbitant dimensionality, feature selection is
used to reduce the assortment of capacities and improve the fine of the feature set by
discarding unseemly and excess capacities. The complete space of exploring consists of
all the feasible subsets of capabilities and this shows that the request space degree is 2n
wherein n is the quantity of the actual capabilities [4].
To eliminate the weaknesses of filter and wrapper techniques, Metaheuristics algorithm was introduced. Recently, metaheuristics-based techniques have involved several
considerations because of their good performance in resolving the issues of feature selection and have been widely applied because of their potential global search ability [2].
PSO has been utilized as an efficient method in feature selection [5]. However, it has a
few drawbacks, for example, premature convergence [6], high computational complexity [6], slow convergence [7]. Furthermore, the search direction of PSO is to approach
the global optimum, which makes the information exchange in the group in a single
direction, such that the particles quickly gather in a small search area, resulting in the
poor swarm diversity [8], which makes it easy to fall into local optima and get poor
convergence accuracy. The swarm diversity information can reflect the distribution of
the entire particle swarm. The lack of swarm diversity will cause the swarm to converge
prematurely to some local optimums whilst tackling complex optimization difficulties
[9]. Additionally, it has the inadequacies of premature convergence with weakness in
fine-tuning close local optimum positions [10]. Another confinement is choosing similar
features in the final feature subset which winds up not giving optimal solution for feature
selection because PSO does not efficiently deal with the relationship between exploitation (local search) and exploration (global search), therefore it generally converges to a
local minimum so quick and reduces the convergence speed [6].
2 Review of Literature
2.1 Particle Swarm Optimization (PSO)
PSO is an optimization algorithm which was invented by Kennedy and Eberhart in 1995
[6] that imitates the social practices of persons in swarms of fish and fowls. PSO has been
shown to be less exorbitant computationally and can quickly merge with the other metaheuristics techniques like Genetic Algorithm (GA), Ant Colony Optimization (ACO),
Differential Evolution (DE) [2] etc. Additionally, PSO is easy to execute and it has
minimum parameters that are being fine-tuned and it is much lesser computationally
costly in memory and speed requirements. It is therefore vastly used as an efficient
method for feature selection and various domains. Despite the fact that the PSO is
extremely proficient in dealing with looks for ideal subsets of component, it tragically
Improvement of Population Diversity of Meta-heuristics Algorithm
97
has different difficulties, for example, premature convergence that exist in complex
issues of optimization [5], they likewise ignore the quantity of elements in their course
of looking while it exclusively lay accentuation on limiting the error rate of classification.
Another shortcoming that it has is that it chooses features that are indistinguishable in the
finishing up include subset [7]. Furthermore, the PSO does not make use of correlation
information which belongs to the features that heads process of searching, and this
causes similar features to be chosen in the concluding feature subset, thereby decreasing
the classifier performance [8]. It is easy and requires only few control parameters [13].
The PSO technique distinguishes the global ideal arrangement by refreshing the flying
velocity and the area of every person in the swarm as per Eqs. (1) and (2).
vid (t + 1) = vid (t) + r1 (t) × c1 × pbestid (t) − xid (t)
+ r2 (t) × c2 × (gbest(t) − xid (t))
(1)
xid (t + 1) = xid (t) + vid (t + 1)
(2)
where c1 and c2 are the acceleration parameters, which are set to 2.0 commonly; r 1 and
r 2 are two uniform distributed values in the range [0, 1]. Therefore, making use of the
inertia weight w, the Eq. (1) is improved to Eq. (3) as shown below:
Vid (t + 1) = ω × vid (t) + r1 (t) × c1 × pbestid (t) − xid (t) + r2 (t) × c2
× (gbest(t) − xid (t))
(3)
The best current location of particle i is recorded as pbest and the global best location
is recorded as gbest. Also, the location of the particle of the coming generation relies
essentially upon the present location, which is known as, xid(t), and the flying speed,
known as, vid(t + 1). The initial term in the right-hand side of Eq. (3) utilizes ω, which
stands for the inertia weight and the two terms are excitations towards promising areas
in the pursuit space as announced by the global and personal best locations.
2.2 Inertia Weight
The chaotic map is brought to regulate the inertia weight ω of PSO. The tuning of
inertia weight ω using chaotic maps is able to enhance the potential of PSO escape from
neighborhood optima when solving multimodal functions. According to [9] and [10],
the logistic map is chosen to music inertia weight ω of PSO. Due to the ergodicity,
irregularity and non-repetition homes of logistic map, it has the potential to improve
population variety within the seek system and additionally will increase the capacity to
converge at global most useful, hereby keeping off untimely convergence. The range of
the logistic map is always [0, 1] and any wide variety within that variety can be selected
because the preliminary cost. Nevertheless, it has to be famous that the preliminary value
is capable of have important results on the sample of fluctuation of a few chaotic maps
together with logistic map. This type of chaotic maps is selected with various attitudes,
while the initial cost is set to 0.7 for all of them [11]. The inertia weight ω is represented
in Eq. (4).
Mj
∗π+τ
(4)
ω = ϕ ∗ cos
M max
98
S.-S. M. Ajibade et al.
2.3 Chaotic Logistic Map
The chaos is a deterministic, arbitrary like technique that is seen in non-linear, dynamic,
which is non-period, non-merging and limited. Numerically, chaos occurs as a simple and
random deterministic dynamical framework and the system which entail chaos can be
seen as a source of randomness. Several chaotic maps have been introduced in literature
and these chaotic maps differs by their mathematical equations. In recent times, the
chaotic maps have been broadly used in optimization because of their dynamic conduct
distinctive confused guides having diverse numerical conditions are utilized. Since a
decade ago, clamorous guides have been broadly refreshing in the field of enhancement
because of their dynamic conduct that aids the optimization techniques in investigating
the search space globally. In the chaotic maps, numbers within the range of [0, 1] can
be used as the initial value. Nonetheless, the initial value used can impact the instability
pattern of some chaotic maps. The chaotic maps positively influence the convergent rate
of the algorithms because the maps initiate chaos in the feasible ahead and is likely just
for an initial short time and stochastic for longer time frame. Some of the well-known
chaotic maps are:
Cubic Map: The cubic map generates values in the interval [−1.5, 1.5]. It is almost
similar to Sine map. It is defined as:
(5)
Xk+1 = 3xk 1 − X2k
where Xk is the kth chaotic number, with k denoting the iteration number.
Sine Map: The sine map is a unimodal map and it is represented by:
Xk+1 =
a
sin(πxk )
4
(6)
where Xk is the kth chaotic number, with k denoting the iteration number.
Logistic Map: The equation of logistic map is a non-linear dynamic of population
which is biological evidencing chaotic behaviour. The map is represented by:
Xk+1 = axk (1 − Xk )
(7)
where Xk is the kth chaotic number, with k denoting the iteration number.
In the method of using the logistic chaotic map:
i. A chaotic random sequence Z is generated between [0, 1] by utilizing the logistic
map formula, thereafter pass the carrier map in Eq. (8), by incorporating the chaos
into gbest, a nearby area, in order to accomplish the local chaotic search:
Z → Y : X = gbest + R × cos(Z)
(8)
where R is the search radius which is used to control the range of local chaotic search.
R ∈ [0.1, 0.4].
Improvement of Population Diversity of Meta-heuristics Algorithm
99
3 Methodology
The framework of the research contains all the procedures involved in order to accomplish
the research objectives. The framework of this research comprises of 2 stages. The phase
1 of the framework described the process of data pre-processing techniques that were
used. Phase 2 focused on the initialization of PSO where chaotic logistic map was
introduced into PSO in order to avoid premature convergence.
Fig. 1. Research operational framework.
In the Fig. 1, Phase 1 which is data pre-processing addresses the issue of the interference of different data attribute scaling. The attributes in the datasets for this study
are directly meaningful to the original domain, or are designed for the use of their
current operational system. Usually, these raw attributes reduce the performance of
machine learning classification power, because those with higher values exercise dominance over the attributes with lower values. Therefore, normalization (a linear) transform
was employed on all the original attributes to generate new attributes with better properties with uniform distribution. This will help the predictive power of the classifiers.
It improves the accuracy of the classifier as well as reduces the computational time.
Phase 2 which is Initialization of PSO contains the research activities which involves
introducing chaotic maps to adjust the inertia weight in order to increase the diversity of
population in the search process of PSO to avoid premature convergence and improve
the convergence performance of PSO. In spite of its convergence rate, the population
maintenance of PSO is little, thereby causing it to converge prematurely. Hence, in order
to lessen this impact and also improve the convergence performance, CHPSO is developed by introducing chaos into PSO algorithm. The performance of this technique was
measured using eight benchmark functions as shown in Fig. 2.
4 Result and Discussion
The occasions which a cost function is reviewed to be calculated can be considered as
a basis to gauge the convergence performance of the algorithms that is most commonly
used in literature [12], this is known as the Number of Function Evaluation (NFE). The
average number of function evaluation (Avg NFE) is the average number of function
100
S.-S. M. Ajibade et al.
calls to reach at the termination criteria in 30 number of runs. The Pop size (NP) is set
to 50, while the dimension setting values are 30 and 50 as used by [13]. A smaller NFE
specifies higher convergence speed.
Fig. 2. Numerical benchmark functions.
4.1 Comparison of NFE, Mean Fitness Value and Standard Deviation
for Proposed CHPSO and Other Algorithms
To assess the proposed algorithm’s performance, eight benchmark test capabilities are
utilized in this study and the benchmark functions are defined. All the chosen functions
are well-known within the global optimization literature. The test function comprises of
unimodal and multimodal functions. Table 1 offers the average NFE of GA, PSO and
CHPSO algorithm for eight benchmarks feature for dimension 30.
Table 1. Avg NFE of GA, PSO and the proposed CHPSO for D = 30
Function
GA
PSO
CHPSO
f1
20014
16984
7124
f2
20019
17169
3879
f3
20013
20001
9898
f4
14574
17146
8145
f5
12491
18633
6635
f6
20000
20001
16252
f7
20055
8226
10163
f8
13682
20001
6689
Improvement of Population Diversity of Meta-heuristics Algorithm
101
A smaller NFE indicates higher convergence rate, hence Table 1 displays that the proposed CHPSO algorithm has a higher convergent rate when compared with the original
PSO and GA because the population diversity of PSO was improved to give the proposed CHPSO a better performance. CHPSO obtains a better result in all the functions
for dimension 30. This depicts that PSO converges at local optima for all the functions.
It is shown in Fig. 3.
Fig. 3. Average NFE of GA, PSO and the proposed CHPSO for D = 30.
Table 2 compares the average NFE of PSO, GA and CHPSO algorithm for eight
benchmarks functions for dimension 50.
Table 2. Avg NFE of GA, PSO and the proposed CHPSO for D = 50
Function
GA
PSO
CHPSO
f1
20025
11702
10905
f2
20016
12525
8191
f3
20013
20000
19948
f4
18308
18627
18462
f5
19536
20000
8239
f6
18999
20000
20001
f7
20018
1335
13711
f8
16941
20000
19976
A smaller NFE indicates higher convergence rate, hence Table 2 shows that the proposed CHPSO algorithm has a higher convergent rate when compared with the original
PSO and GA because the population diversity of PSO was improved to give the proposed
CHPSO a better performance. CHPSO obtains a better result in all the functions except
f7 where PSO obtains a better performance for dimension 50 because the f7 (Rastrigin
function) is quite difficult to resolve as it presents various local optima locations where
102
S.-S. M. Ajibade et al.
an optimization algorithm possesses higher chances of being trapped in the local optima.
It is shown in Fig. 4.
Tables 3 and 4 show average mean fitness values and standard deviation by GA, PSO
and the proposed CHPSO for dimensions 30 and 50 respectively in 30 independent runs.
As proven in Table 3, 8 classical benchmark functions are used. It is found that for
the 8 standard features taken within the have a look at the proposed CHPSO algorithm
executed a higher result via giving best mean fitness and standard deviation for all
functions except (f2) wherein PSO gave great mean fitness function value. The result in
the table means that the proposed CHPSO gave a better performance than the original
PSO in that it converges at worldwide solutions.
Fig. 4. Average NFE of GA, PSO and the proposed CHPSO for D = 50.
Table 3. Avg NFE of GA, PSO and the proposed CHPSO for D = 30
D = 30
Function
GA
PSO
CHPSO
Mean
SD
Mean
SD
Mean
SD
f1
4.09E−16
1.94E−15
1.2E−201
1.98E−22
5.49E−23
0.640088
f2
1.866335
3.29E−14
7.63E−15
1.487041
6.9E−22
3.74E−21
f3
1.53E−23
7.9E−23
0.216669
122.8667
238.7992
0.408601
f4
3.49063
5.192793
0.398026
4.165899
2.255447
2.006048
f5
0.530645
0.568466
0.051125
1.801896
5.603973
0.280023
f6
0.068839
0.042799
0.04746
2.621595
0.054535
0.039852
f7
4.48E−11
2.45E−10
2E−16
3.87E−06
4.97E−06
9.25E−16
f8
6.62E−06
2.97E−06
0.329245
1.891857
5.39E−15
8.99E−15
As shown in Table 4, 8 classical benchmark features are used. It is located that for
the 8 general capabilities taken in the observe the proposed CHPSO set of rules done
Improvement of Population Diversity of Meta-heuristics Algorithm
103
a better end result through giving the best mean fitness and standard deviation for all
features except (f3) in which GA gave best mean fitness function value. The result in
the table implies that the proposed CHPSO gave a better performance than the authentic
PSO in that it converges at global resolutions.
Generally, from the result illustrated in the tables above, the proposed CHPSO algorithm proves to be more efficient and reliable in escaping premature convergence than
the GA and original PSO because the weakness of converging at a local optimum for
the original PSO comes to play when solving complex both unimodal and multimodal
problems since it still has poor swarm diversity as seen in the result.
Table 4. Avg NFE of GA, PSO and the proposed CHPSO for D = 50
D = 50
Function GA
Mean
PSO
SD
Mean
CHPSO
SD
Mean
SD
5.1975
3.75E−18
1.73E−17
23.27691
1.62E−06
2.44E−06
372.8988
812.7194
f1
7.7795E−06 2.21E−06 3.53E−06
f2
4.07E−18
3.45E−06 70.28041
f3
2.894472
3.469198
2931.641
f4
22.39456
25.14135
226.1307
f5
4.775809
3.084979
47.41923
11.92975
2.327313
5.310664
f6
0.44720163
0.078309
48.44681
15.95185
0.141085
0.079965
f7
4.8E−08
2.61E−07 4.8407E−06
0.001491 0.001162
4.04E−20
f8
0.60455
0.675166
1.346292 4.48E−08
4.58E−08
0.00187485
1015.749
66.2979
8.3794177 2.211705
5 Conclusion
This study discusses the implementation of the phases of this research. After the preprocessing stage, the PSO was improved by introducing chaotic map to adjust the inertia
weight so as to increase the population diversity of PSO, thereby avoiding premature
convergence. This new improved algorithm is known as CHPSO. In CHPSO, the logistic
map is merged with PSO to adjust the inertia weight ω hence improves the convergence
speed and avoid premature convergence. The result of the comparison on NFE indicates that CHPSO had higher overall performance than GA and PSO but DE slightly
outperformed the CHPSO algorithm.
References
1. Ajibade, S.S.M., Ahmad, N.B.B., Shamsuddin, S.M.: A novel hybrid approach of
AdaboostM2 algorithm and differential evolution for prediction of student performance. Int.
J. Sci. Technol. Res. 8(07), 65–70 (2019)
104
S.-S. M. Ajibade et al.
2. Makinde, O., Chakraborty, B.: On some classifiers based on multivariate ranks. Commun.
Stat. Theory Methods 47(16), 3955–3969 (2018)
3. Azmi, M.S., Arbain, N.A., Muda, A.K., Abas, Z.A., Muslim, Z.: Data normalization for
triangle features by adapting triangle nature for better classification. In: 2015 IEEE Jordan
Conference on Applied Electrical Engineering and Computing Technologies (AEECT), pp. 1–
6. IEEE, November 2015
4. Ajibade, S.S.M., Ahmad, N.B., Shamsuddin, S.M.: An heuristic feature selection algorithm to
evaluate academic performance of students. In: 2019 IEEE 10th Control and System Graduate
Research Colloquium (ICSGRC), pp. 110–114. IEEE, August 2019
5. Mirjalili, S., Song Dong, J., Lewis, A., Sadiq, A.S.: Particle swarm optimization: theory,
literature review, and application in airfoil design. In: Mirjalili, S., Song Dong, J., Lewis,
A. (eds.) Nature-Inspired Optimizers. SCI, vol. 811, pp. 167–184. Springer, Cham (2020).
https://doi.org/10.1007/978-3-030-12127-3_10
6. Chen, K., Zhou, F., Liu, A.: Chaotic dynamic weight particle swarm optimization for
numerical function optimization. Knowl.-Based Syst. 139, 23–40 (2018)
7. Lin, G.-H., Zhang, J., Liu, Z.-H.: Hybrid particle swarm optimization with differential evolution for numerical and engineering optimization. Int. J. Autom. Comput. 15(1), 103–114
(2016). https://doi.org/10.1007/s11633-016-0990-6
8. Wang, D., Tan, D., Liu, L.: Particle swarm optimization algorithm: an overview. Soft. Comput.
22(2), 387–408 (2017). https://doi.org/10.1007/s00500-016-2474-6
9. Felippe, W.N., Carneiro, L.F.: A discrete particle swarm algorithm for sizing optimization of steel truss structures. Paper presented at the World Congress of Structural and
Multidisciplinary Optimisation (2017)
10. Rehman, T., Khan, F., Khan, S., Ali, A.: Optimizing satellite handover rate using particle
swarm optimization (PSO) algorithm. J. Appl. Emerg. Sci. 7(1), 53–63 (2017)
11. Ajibade, S.S.M., Ahmad, N.B.B., Zainal, A.: A hybrid chaotic particle swarm optimization
with differential evolution for feature selection. In: 2020 IEEE Symposium on Industrial
Electronics and Applications (ISIEA), pp. 1–6. IEEE, July 2020
12. Kennedy, J., Eberhart, R.: Particle swarm optimization. In: Proceedings of ICNN 1995International Conference on Neural Networks, vol. 4, pp. 1942–1948. IEEE, November
1995
13. AlNuaimi, N., Masud, M.M., Serhani, M.A., Zaki, N.: Streaming feature selection algorithms
for big data: a survey. Appl. Comput. Inform. (2020)
Adaptive and Global Approaches Based Feature
Selection for Large-Scale Hierarchical Text
Classification
Abubakar Ado1(B) , Mustafa Mat Deris1 , Noor Azah Samsudin1 ,
and Abdurra’uf Garba Sharifai2
1 Faculty of Computer Science and Information Technology,
Universiti Tun Hussein Onn Malaysia, Batu Pahat, Malaysia
adamrogo@yahoo.com
2 Department of Computer Science, Yusuf Maitama Sule University, Kano, Nigeria
Abstract. High-feature dimensions is one of the obvious challenges facing largescale hierarchical classification problem. One promising way to overcome such
problem is reducing the features size by removing irrelevant, noise and redundant
features. Filter-based feature selection methods are commonly used to construct
smaller subset of most relevant features in either adaptive or global approach at
each non leaf node within the hierarchy. Both the Feature selection approaches do
not only reduce time and space complexity but also improve classification accuracy
of the learning models. In this study, the effectiveness of the main approaches
for constructing relevant features subset, that is adaptive and global approaches
are analyzed using the two filter-based methods suitable for text classification.
Experiment evaluation conducted on 20NG, IPC, and DMOZ-small datasets shows
that implementing feature selection adaptively has more capability of selecting
most relevant features, thus, achieving the best classification accuracy. Moreover,
further evaluation shown integrating feature selection with LSHC records improve
performance when compared to without feature selection.
Keywords: Feature selection · Filter-based method · Adaptive · Global ·
Large-scale
1 Introduction
The advancement of digital technology has resulted in tremendous growth of digital
data from numerous sources including web directories, social networks and so on, most
of which are in text format [1]. Apart from large volume problem, current text data
generated known as large-scale data also faces with problems of high features size and
large number of classes. Yahoo! Directory, Directory Mozilla, and International Patent
Record are some few examples of such large-scale text datasets that are associated with
hundred millions of features and millions of instances distributed between thousands of
classes [2]. Classification of such kind of data into a large number of label classes has
achieved significance predominantly in the perspective of Big Data [3]. Statistical and
© The Author(s), under exclusive license to Springer Nature Switzerland AG 2022
F. Saeed et al. (Eds.): IRICT 2021, LNDECT 127, pp. 105–116, 2022.
https://doi.org/10.1007/978-3-030-98741-1_10
106
A. Ado et al.
machine learning have emerged in few decades as a key approach for analyzing such
kind of large-scale data. Thus, the continued exponential growth of text data and its
complexities have made text classification problems more cumbersome [4, 5], while at
the same time resulting in new problems for the text classification task. These problems
make it very difficult to handle using the conventional learning frameworks.
Several recent applications need a classification with extremely large number of
instances, features and classes to effectively analyze and extract valuable information
[6]. In order to achieve this, there is a need to define a structure taxonomy upon the data
first [6]. Usually, hierarchical structures provide a suitable means to organize data. Hierarchical classification (HC) is one specific problem of interest that effectively handles
this large-scale taxonomy. A considerable number of Large Scale Hierarchical Classification (LSHC) approaches have been proposed to deal with the problems and challenges
that have arisen, such as minimizing training time, faster class prediction, performance
improvement, and reducing memory footprint utilization [1].
To reduce the processing time and memory requirements, one of the common approach is to integrate suitable dimensional reduction technique in combination with model
training [1, 7]. Dimensional reduction is the known popular approach recently use to
overcome the problems associated with large-scale problem (by reducing the storage
and processing time requirement). The main idea behind this approach is to scale up or
improve the performance of machine learning models by squeezing the feature dimensionality of a given large-scale dataset from high-dimensions into lower dimensions [8,
9]. This effective method scales up the learning model by allowing it to be trained only
on the resultant lower features subset rather than the original features set [10], while
maintaining or improving the classification accuracy of the model. This is possible for
LSHC problems by utilizing only the features subset that are useful in discriminating
among the classes at every internal node within the hierarchy. Even though, HC-models
that consider parent-child relationship show improvement in classification accuracy but
are computational expensive [1, 11].
In this paper, we analyze the two main filter methods based on the adaptive and global
FS approaches for solving the LSHC problem. We independently integrate the considered
filter methods at the preprocessing phase in the classification framework before training
the models. The study wishes to answer the following research questions: What is the
effect of feature selection on classification performance? Which of the feature subset
construction approaches (adaptive or global) in congestion with filter methods (IG or
Chi2) shows the greatest impact on classification performance?
The remaining body of this paper is systematically partitioned as follows: In Sect. 2,
literature review is systematically presented. Hierarchical classification method, considered filter-based methods, and feature construction based approaches are briefly discussed in Sect. 3. Properties of the datasets used and experimental set up are devoted to
Sect. 4. Experimental results and analysis are systematically placed in Sect. 5. Finally,
the study ends with a conclusion and highlights of possible future work which are given
in Sect. 6.
Adaptive and Global Approaches Based Feature Selection
107
2 Literature Review
2.1 Hierarchical Classification (HC)
Following the popularity of hierarchies across various application domains, especially in
text categorization, a group of researchers from the Institute of Informatics, Greece and
Laboratoire d’Informatique de Grenoble, France, tried to boost the motivation of HC by
jointly organizing a competition known as the Large Scale Hierarchical Text Classification (LSHTC) challenge [12]. Their efforts resulted in a sequence of competitions (2009,
2011, 2012, and 2014) that enabled them to set benchmarks for the problem [13–15].
This is achieved by evaluating the effectiveness of the methods by processing large-scale
datasets with large instances and classes number. These days, datasets with defined hierarchies are widely utilized in various application domains, such as ImageNet (system for
indexing hundreds of millions of images), audio hierarchy (system for organizing and
classifying signals of music), international patent classification (system for surfing patent
documents), DMOZ hierarchy (system for classifying and organizing internet pages),
and gene hierarchy (system for classifying and organizing gene sequences) [6]. HC also
known as structured classification, is a sort of classification task in which the instances’
classes have a pre-defined hierarchical information, which is usually expressed as a tree
(single label) or a directed acyclic graph (Multi-label) [16]. Therefore, HC takes advantage of taxonomy structure to break large scale classification problems into a subset of
smaller tasks, one for every node in the tree taxonomy.
There are generally two main approaches adopted for designing HC models. The
first approach, which is the simpler one called flat classification, does not consider
inter-dependency relationships between the classes in the process of model training.
The second approach, which is more complex and is called Hierarchical Classification
considers inter-dependency relationships between the classes in the process of model
training. The later approach can be further categorized into two: the Local Classifier
approach and Global Classifier approach. The first approach (LC) considers local parentchild relationships in the processing of model [1]. This approach is further subdivided
into three approaches based on how hierarchies are explored from the parent to the
child [17], namely: Local Classifier per Node (LCN), Local Classifier per Parent Node
(LCPN), and Local Classifier per Level (LCL) [12]. The second approach, known as
the Global Classification (GC) approach, takes the classification problem as a whole
and trains a single global classification model at the same time, taking the hierarchy
information into consideration [12]. This approach is more complex and computational
expensive than the Local approach. Both the approaches followed a similar approach in
predicting new examples.
2.2 Dimensional Reduction (DR)
Dimensionality reduction [9, 18] is a process of converting or transforming highdimensional space into low-dimensional space. With the recent increase in highdimensional data, proposing and employing different reduction techniques has become
necessary in various application domains [19], especially in text classification. Dimensional reduction constructs a lower discrepant features set by taking input features
108
A. Ado et al.
set (high-dimensional) and transforms it into a lower features representation (lowdimension) while preserving the important information as much as possible [20]. The
resultant low feature representation of the input data aids to tackle dimensionality curse
issue and can be easily visualized, analyzed and processed. Dimensional reduction can
be broadly categorized in to three groups namely, Feature Selection, Feature Extraction,
and Feature Hashing.
Feature Selection (FS) reduces the size of features set by selecting small subset of
most informative features and eliminating those features that are known to be noise, irrelevant, and redundant from a given input set of features [21, 22]. The methods that utilizes
FS technique basically adopts either the strategy of subsets performance evaluation or
feature ranking strategy [23]. Features Extraction (FE) [24–26] and Feature Hashing
(FH) [27–29] transform or project the original input features into lower feature space
[30], while preserving Euclidean distance. The techniques reduce the dimensionality by
taking the whole set of original features and projecting them into a smaller index space,
whereby the discriminating features lie within the low-dimensional space. This study
revolves around FS. Therefore, the following section will detail more on the approaches
of FS.
2.3 Feature Selection Approaches
Generally, FS methods are broadly grouped into filter methods, wrapper methods, and
embedded methods [21, 31, 32]. Filter methods are independent that they do not interact
with classifier when constructing an informative feature subset. They rely on metrics for
evaluating and ranking the importance of a feature prior to the classification. The methods
can attain quick feature sorting to effectively filter out a high number of non-relevant or
noise features [32]. They select features subset by considering the usefulness of a feature
according to evaluation metrics [21, 32]. Wrapper methods are dependent on classifiers
that they frequently interact with the classification algorithm in order to construct a
subset of informative features [21, 32]. They evaluate a particular feature subset by
training and testing a given classifier, and they are tailored to a particular classifier
[33]. The methods in this group have poor computational efficiency but result in high
classification accuracy. These methods are not usually favored in text classification task
[34]. Embedded Methods integrate classifiers with feature selection technique during
the training phase and optimally search feature subset by designing an optimization
function [21, 35]. Like wrapper methods, embedded methods frequently interact with
the classifier but have better computational efficiency than wrapper methods and are also
tailored to a specific classifier [34].
Upon all the FS approaches explained so far, filter approaches are shown to be
computational inexpensive, good storage compression, and preserves sparsity [27, 36].
These make them scalable and more advantageous in large scale problems. Therefore,
this study integrates filter-based based FS methods into the Large-scale HC problem
framework. However, few studies in the past consider reducing features dimensionality
prior to training HC, which shown to achieve significant improvement.
Adaptive and Global Approaches Based Feature Selection
109
3 Material and Methods
3.1 Hierarchical Classification Method
The HC method uses the hierarchical structure of a given dataset to split the classification
problem into simpler task problems, one per internal node of the tree hierarchy. Any
classification model can be extended and used as a baseline model to perform HC by
placing a distinct classifier at each non-leaf node of the tree structure. To predict category
label yi for unknown input instance xi , the classification process which referred as to
Top-Down approach greedily moves down the tree structure until it reaches the target
leaf node yi . As presented in Algorithm 1. The process starts at the root node Q and
chooses the best child nodes c(n) recursively until it reaches a category label yi ∈
(terminal node). Where is a set of leaf nodes. In this study, we used LR (Logistic
Regression) and SVM (Support Vector Machine) as the baseline models for training.
Algorithm 1: Top-Down Hierarchical Classification
Input: Input: instance , parameters
Output:
Set = 0 \\ Start from the root node
Repeat
\\ Transverse through the most
weighted child
Until
\\ Until a node with single category label is reach.
Return
\\ Return the predicted label
3.2 Information Gain Method
The Information Gain (IG) is an information theory-based method commonly used in
statistics to model word association [36, 38]. IG measures the amount of information
presence or absence of a feature and its contribution in making the appropriate classification prediction on labelled classes. The method computes and assigns a score to each
feature by considering the variation between the entropy obtained based on the presence
or absence of feature/term in a class [4, 39]. High IG score indicates the discriminating
capability of a feature and ranked top. The general formula for calculating IG of a given
feature t is given in Eq. (1).
P(t, c)
(1)
P(t, c) ∗ log
I (t, c) =
P(t) ∗ P(c)
c∈{ci, ci } t∈{tk ,t k }
Where P(t,c) is the probability of class c and occurrence of the feature t, P(t) is the
probability of class containing feature t, P(c) is the probability of class c. tk and ck
donate feature not present, and class not present, respectively.
110
A. Ado et al.
3.3 Chi-square Method
Chi-Square (Chi2) is a statistical-based and important non-parametric test method used
to Compare more than two attributes for a randomly chosen data [34]. It is commonly
known as independence test, and the method is applied to test if the concurrence of a
particular term and a particular category are not dependent [36]. Chi2 generates a value
that reveals the relationship between a term and category during feature filtering. The
Chi2 score of a give term tk for a category ci is calculated as:
Chi − square(tk ci ) =
NP(tk )2 (P(ci |tk ) − P(ci ))2
P(tk )(1 − P(tk ))P(ci )(1 + P(ci ))
(2)
Where P(t k ) is the probability of a document that contains term t k, P(ci ) is the probability of documents that belongs to class ci ; P(ci |t k ) is the conditional probabilities of a
document that belongs to ci ; given that it contained t k .
3.4 Adaptive and Global Approaches
There are two different approaches for constructing discrepant features subset at each
internal node in the hierarchy which are adaptive and global approach. For adaptive approach, variable number and different features are selected at each non leaf node within
the hierarchy to construct the subset of discrepant features. The size and the features
elected at the parent node should not necessary be the same as that of children nodes
(likewise among the sibling nodes). For the global approach, the same number of features is selected at every node in the entire hierarchy, and also the same set of discrepant
features is selected for every tree branch in the hierarchy. The approach construct discrepant features subset by selecting equal features for each tree branch rooted to the leaf
node. The two approaches are nearly equivalent in terms of computational complexity
because model tuning and optimization need almost equal runtime, which makes up the
main computational fraction [1].
4 Dataset and Experiment Settings
We have conducted experimental evaluation using three benchmark text datasets, including 20Newsgroup (20NG) [40], International Patient Classification (IPC) [41], and
Directly Mozilla (DMOZ-small) [15]. Table 1 presents the key summary properties
of the datasets. We believe all the datasets are sparse and highly dimensional.
For all the experiments, we utilized the standard train-test partitions available in order
to preserve comparability with previously evaluations presented, see Table 1. We further
split the training set into 90% as the main training set (to train Top-Down models)
and 10% as the small validation set (to fine tune the regularization parameter). The
model is trained with a set of a parameter values ranges from 0.01 to 1000 in steps of
“x10”, and utilized the validation dataset to select the best value. The models are trained
again using the whole training dataset (including the validation dataset) using the best
choosing parameter value, we measure the models’ performance using the unseen test
dataset. Conventionally, we build bag of words (BOW) and vectored the features with
Adaptive and Global Approaches Based Feature Selection
111
l 2 -norm using TF-IDF transformation. As for the FS, we select the best initial threshold
by varying the size of features ranging from 10% to 80% of the entire features set in steps
of 10. From the preliminary results, we chose the threshold at which the model attained
the best performance. We use Top-down approach with Logistic Regression (LR) as the
baseline classifier. Therefore, training multi-class LR in respect of ith child (Ci ) of a
corresponding internal node n, the respective objective function is formulated as given
in Eq. (3)
T
n
T
2
c
log
1
+
exp
−(yi )cn wnc xi + wnc 2
λ
(3)
LR_fn = min
c
wn
i=1
Where λ > 0 denotes penalty parameter value for mis-classification, ·22 denotes regularization term, and Tn is the total number of instances. To get the optimal weight
vector wnc , one of the above equations is solve (based on the model used) for every child
Ci belonging to the corresponding node n within the taxonomy H. The entire set of
parameters for C(n) that is Wn = wnc c∈C(n) constructs the multi-class learned model at
that particular node while total parameters for all non-leaf nodes that is W = [Wn ]n∈N
constructs the TD-learned model.
Table 1. Properties of the datasets used.
Dataset
#Training
doc
20NG
11269
7505
IPC
46324
6323
DMOZ-small
#Testing
doc
#Features
#Classes
#Nodes
Height
61188
20
28
4
28926
1123497
451
553
4
1858
51033
1139
2388
6
The performance of the HC methods is reported using suitable metrics commonly
used for HC in literature, namely, Micro-f1 (gives equal importance to every document),
Macro-f1 (gives equal importance to every category), Hierarchical-f1 and Hierarchicalerror [6], which are computed as follows:
2PR
P+R
1 || 2Pn Rn
Macro − F1 =
n=1 Pn + Rn
||
Micro − F1 =
2 × hP × hR
hP + hR
1 m
HE =
E yi , yi
i=1
N
hF1 =
(4)
(5)
(6)
(7)
Where P and R denote precision and recall, respectively, Pn and Rn are the precision and
recall for leaf node n, || denotes total number of labels or classes, hP, hR, hF1, and HE
112
A. Ado et al.
represent hierarchical precision, hierarchical recall, hierarchical-f1, and hierarchicalerror,
respectively, A(yi ) denotes all the ancestors of the categories plus the true label,
A yi denotes all the ancestors of the categories plus the predicted label, and E yi , yi
denotes the length of undirected path from yi to the label category.
5 Results Analysis
Table 1 shows the micro-f1 and macro-f1 comparison of IG and Chi2 methods by considering both adaptive and global approaches against All Features (AF). The face bolded
indicates the best results on comparing between adaptive and global FS while figures
with subscript plus sign (+) indicates the best results when considering AF. The results
from the table shows that Chi2 outperformed IG in all comparisons except on micro-F1
of IPC. This is because IG usually assigns higher weight to lengthier documents when
computing features importance and in addition, it favors those terms that are distributed
in several categories, while those terms have less discriminating capability in text classification problem. Chi2 selects more rare terms than IG, even though IG also select rare
terms as much as possible but its chosen criteria does not essentially choose the terms
that improve classification accuracy. We can see from the both tables that adaptive approach based FS achieves better performance for all datasets when compare with global
approach. This shows that selecting the same set and number of features for all internal
nodes will not significantly improve classification accuracy. For instance, a particular
feature in the parent node could be more informative in discriminating the children nodes
but it could be less informative when it comes to discriminating the grandchildren. On
comparing against AF we can see that adaptive based FS still achieves best performance
across all the datasets (with around 2% accuracy improvement). In general, adaptive FS
is significantly better due to its ability to selects small subset of variable number features
that are more important for discriminating data-sparse nodes that exist in LSHC datasets.
Figure 1 shows the hierarchical error comparison based on TD-LR for 20NG, IPC and
DMOZ-Small datasets with feature selection (Chi2) and all features (AF). We consider
only Chi2 due to its outstanding performance in the previous experiment and also due
to space limit. We can see that less error is committed when the classifiers are used with
feature selection compared to AF (without feature selection). This is because feature
selection methods able to filter out irrelevant features that may interrupt the modelling
of linear classifier in process of discriminating children nodes at each level within the
hierarchy. Moreover, adaptive based FS gives the lowest error, this reveals its capability
to select the most discrepant number of features at each non leaf nodes in the hierarchy.
Another observation is that global based FS achieves almost similar error when compared
with all features (AF) on DMOZ-small dataset while achieves significant improvement
on 20NG and IPC datasets (Table 2).
Table 3 and 4 show the level-wise performance and hierarchical-f1 analysis for AFS,
GFS, and AF using IPC and DMOZ-Small datasets. From the tables we can observe the
poor performance of the models in terms of hierarchical-f1 (hF1) relative to the baseline
level three and level five of IPC and DMOZ-small, respectively. As stated by other
studies, we also attribute the obtained result to the backside of top-down hierarchical
approach; errors occur at upper level of the hierarchy are not recoverable at the subsequent
Adaptive and Global Approaches Based Feature Selection
113
Table 2. Performance comparison of adaptive and global approaches upon IG and Chi2 based
filter method in terms of micro-f1 and macro-f1 using TD-LR
Dataset
Metric
IG
20NG
micro-F1 77.09
Chi
AF
Adaptive Global Adaptive Global
macro-F1 77.03
IPC
micro-F1
48.94+
macro-F1 42.23
DMOZ-small micro-F1 42.02
macro-F1 27.81
77.01
78.12+
77.90
76.10
76.93
77.94+
77.83
75.84
46.45
48.55
46.90
46.83
39.62
42.46+
40.07
40.75
40.94
42.22+
41.04
39.91
26.68
28.02+
26.77
25.80
Fig. 1. Performance comparison of feature selection based on adaptive, global and all features in
terms of hierarchical-error using TD-LR.
lower levels and, therefore propagate down to the leaf level, affecting the performance
of TD-models. We can also observe that higher score is obtained at uppermost level
compared to the lower level. This is because at upper levels each of the children nodes
that has to be categories is a multiple combination of leaf classes which could not be
accurately modelled using the linear classifiers. Furthermore, AFS achieves the best
results on level wise comparison (maximum accuracy improvement of about 6.61% and
5.55% using IPC and DMOZ-small dataset. When compared to GFS, this demonstrates
its ability to select the most relevant and informative features. In general, from the tables
we can see that the performance with feature selection is better than without feature
selection.
114
A. Ado et al.
Table 3. Level-wise analysis for adaptive and global based feature selection and all features in
terms of hierarchical-fi based on TD-LR using IPC dataset.
L1
L2
L3
hF1
AFS
92.82 (+4.92)
89.94 (+6.61)
79.20 (+2.8)
68.41 (+2.48)
GFS
90.57
85.73
77.85
66.84
AF
87.90
83.33
76.40
65.93
Table 4. Level-wise analysis for adaptive and global based feature selection and all features in
terms of hierarchical-fi based on TD-LR using DMOZ-small dataset.
L1
L2
L3
L4
L5
hF1
AFS
92.54
(+3.51)
90.00
(+5.55)
88.01
(+3.11)
84.40
(+5.11)
77.34
(+2.44)
68.85
(+0.86)
GFS
91.13
88.70
87.14
80.47
76.84
67.09
AF
89.03
84.45
85.30
79.29
74.90
67.99
6 Conclusion
The main approaches for constructing relevant features subset for LSHC problem that is
adaptive and global approach are analyzed in this study. For extensive comparative, two
filter based feature selection methods suitable for text classification in respect to IG and
Chi2 are considered for selecting discrepant features prior to training of TD-LR baseline
classifier. Series of experiments conducted on 20NG, IPC, and DMOZ-small benchmark
datasets, results show that using Chi2 method in an adaptive approach achieves maximum
improvement of around 2% accuracy when compared with the other approaches across
all the datasets. Further analysis showed that integrating feature selection method with
LSHC achieved significant improvement against all features (without feature selection).
References
1. Ado, A., Samsudin, N.A., Mat Deris, M.: A new feature hashing approach based on term
weight for dimensional reduction. In: IEEE International Congress of Advance Technology
and Engineering (ICOTEN), pp. 1–7 (2021)
2. Naik, A., Rangwala, H.: Embedding feature selection for large-scale hierarchical classification. In: IEEE International Conference on Big Data (Big Data), pp. 1212–1221
(2016)
3. Babbar, R., Partalas, L., Gaussier, E., Amini, M., Amblard, C.: Learning taxonomy adaptation
in large-scale classification. J. Mach. Learn. Res. 17, 1–37 (2016)
4. Ado, A., Deris, M.M., Noor Azah, S., Aliyu, A.: A new feature filtering approach by integrating IG and T-test evaluation metrics for text classification. Int. J. Adv. Comput. Sci. Appl.
12(6), 500–510 (2021)
Adaptive and Global Approaches Based Feature Selection
115
5. Pilnenskiy, N., Smetannikov, I.: Feature selection algorithms as one of the Python data
analytical tools †. Futur. Internet Artic. 54(12), 1–14 (2020)
6. Naik, A., Rangwala, H.: Large Scale Hierarchical Classification: State of the Art. Springer
Briefs in Computer Science, pp. 1–104. Springer, Cham (2018). https://doi.org/10.1007/9783-030-01620-3
7. Zhou, D., Xiao, L., Wu, M.: Hierarchical classification via orthogonal transfer. In: International Conference on Machine Learning (ICML), pp. 801–808 (2011)
8. Ikeuchi, K.: Computer Vision: A Reference Guide, 2014th edn, vol. 2. Springer, Boston
(2014). https://doi.org/10.1007/978-0-387-31439-6
9. Krishnan, R., Samaranayake, V.A., Jagannathan, S.: A hierarchical dimension reduction
approach for big data with application to fault diagnostics. J. Big Data Res. 18, 100121
(2019)
10. Cunningham, J.P., Ghahramani, Z.: Linear dimensionality reduction: survey, insights, and
generalizations. J. Mach. Learn. Res. 16(1), 2859–2900 (2015)
11. Gopal, S., Yang, Y.: Recursive regularization for large-scale classification with hierarchical
and graphical dependencies. In: ACM SIGKDD, pp. 257–265 (2013)
12. Alan, R., Jaques, P.A., Francisco, J.: An analysis of hierarchical text classification using word
embeddings. Inf. Sci. (Ny) 471, 216–232 (2019)
13. Naik, A., Rangwala, H.: Filter based taxonomy modification for improving hierarchical
classification. arXiv:1603.00772v3 [cs.AI], vol. 3, pp. 1–14 (2016)
14. Charuvaka, A., Rangwala, H.: HierCost: improving large scale hierarchical classification with
cost sensitive learning. In: Appice, A., Rodrigues, P.P., Santos Costa, V., Soares, C., Gama, J.,
Jorge, A. (eds.) ECML PKDD 2015. LNCS (LNAI), vol. 9284, pp. 675–690. Springer, Cham
(2015). https://doi.org/10.1007/978-3-319-23528-8_42
15. Partalas, I., et al.: LSHTC: a benchmark for large-scale text classification. CoRR, vol.
abs/1503, pp. 1–9 (2015)
16. Ramírez-corona, M., Sucar, L.E., Morales, E.F.: Hierarchical multilabel classification based
on path evaluation. Int. J. Approx. Reason. 68, 179–193 (2016)
17. Silla, C.N., Freitas, A.A.: A survey of hierarchical classification across different application
domains. Data Min. Knowl. Discov. 22(1–2), 31–72 (2011)
18. Zhang, S., Chen, X., Li, P.: Principal component analysis algorithm based on mutual information credibility. In: 2019 International Conference on Computation and Information Sciences,
ICCIS, pp. 536–545 (2019)
19. Ayesha, S., Hanif, M.K., Talib, R.: Overview and comparative study of dimensionality
reduction techniques for high dimensional data. Inf. Fusion 59(01), 44–58 (2020)
20. Juvonen, A., Sipola, T., Hämäläinen, T.: Online anomaly detection using dimensionality
reduction techniques for HTTP log analysis. Comput. Netw. 91, 46–56 (2015)
21. Rong, M., Gong, D., Gao, X.: Feature selection and its use in Big Data: challenges, methods,
and trends. IEEE Access 7, 19709–19725 (2019)
22. Sharif, W., Samsudin, N.A., Deris, M.M., Khalid, S.K.A.: A technical study on feature ranking
techniques and classification algorithms. J. Eng. Appl. Sci. 13(9), 7074–7080 (2018)
23. El-Hasnony, I.M., Barakat, S.I., Elhoseny, M., Mostafa, R.R.: Improved feature selection
model for Big Data analytics. IEEE Access 8, 66989–67004 (2020)
24. Lhazmir, S., El Moudden, I., Kobbane, A.: Feature extraction based on principal component analysis for text categorization. In: 6th IFIP International Conference on Performance
Evaluation and Modelling in Wired and Wireless Networks, PEMWN 2017, pp. 1–6 (2018)
25. Hira, Z.M., Gillies, D.F.: A review of feature selection and feature extraction methods applied
on micraarray data. Adv. Bioinform. 1–13 (2015)
26. Subasi, A.: Practical Guide for Biomedical Signals Analysis Using Machine Learning
Techniques, 1st edn. Elsevier Inc., Amsterdam (2019)
116
A. Ado et al.
27. Freksen, C.B., Kamma, L., Larsen, K.G.: Fully understanding the hashing trick. In: International Conference on Neural Information Processing System, NIPS 2018, pp. 5394–5404
(2018)
28. Shi, Q., et al.: Hash kernels. In: Proceedings of Machine Learning Research, MLR, pp. 496–
503 (2009)
29. Weinberger, K., Dasgupta, A., Langford, J., Smola, A., Attenberg, J.: Feature hashing for large
scale multitask learning. In: 26th Annual International Conference on Machine Learning,
ICML 2009, pp. 1113–1120 (2009)
30. Khalid, S., Khalil, T., Nasreen, S.: A survey of feature selection and feature extraction
techniques in machine learning. In: 2014 Science and Information Conference, SAI 2014,
pp. 372–378 (2014)
31. Gu, N., Fan, M., Du, L., Ren, D.: Efficient sequential feature selection based on adaptive
eigenspace model. Neurocomputing 161, 199–209 (2015)
32. Li, M., Wang, H., Yang, L., Liang, Y., Shang, Z.: Fast hybrid dimensionality reduction method
for classification based on feature selection and grouped feature extraction. Expert Syst. Appl.
150(July), 1–10 (2020)
33. EL Aboudi, N., Benhlima, L.: A review on wrapper feature selection approaches. In:
International Conference of Engineering and MIS (ICEMIS), pp. 1–5 (2016)
34. Şahin, D.Ö., Kılıç, E.: Two new feature selection metrics for text classification. J. Control
Meas. Electron. Comput. Commun. 60(2), 162–171 (2019)
35. Das, A.K., Sengupta, S., Bhattacharyya, S.: A group incremental feature selection for classification using rough set theory based genetic algorithm. Appl. Soft Comput. J. 64(April),
400–411 (2018)
36. Jagadeesan, M., Understanding sparse JL for feature hashing. In: Proceeding of Advances in
Neural Information Processing Systems, NeurlPS 2019, pp. 1–31 (2019)
37. Haris, B. S., Revanasidappa, M.B.: A comprehensive survey on various feature selection
methods to categorize text documents. Int. J. Comput. Appl. 164(8), 1–7 (2017)
38. Ado, A., Samsudin, N.A., Deris, M.M., Ahmed, A.: Comparative analysis of integrating
multiple filter-based feature selection methods using vector magnitude score on text classification. In: 11th Annual International Conference on Industrial Engineering and Operations
Management (IEOM), pp. 4664–4676 (2021)
39. Zhou, H., Han, S., Liu, Y.: A novel feature selection approach based on document frequency
of segmented term frequency. IEEE Access 6, 53811–53821 (2018)
40. Dhillon, I.S., Mallela, S., Kumar, R.: A divisive information-theoretic feature clustering
algorithm for text classification. J. Mach. Learn. Res. 3, 1265–1287 (2003)
41. WIPO: Guide to the International Patent Classification (2016)
Ensemble Method for Online Sentiment
Classification Using Drift Detection-Based
Adaptive Window Method
Idris Rabiu1,4(B) , Naomie Salim1 , Maged Nasser1 , Faisal Saeed2 ,
Waseem Alromema3 , Aisha Awal4 , Elijah Joseph4 , and Amit Mishra5
1 School of Computing, Univerti Teknologi Malaysia, 81310 Bahru, Johor, Malaysia
irabiu@ibbu.edu.ng
2 College of Computer Science and Engineering, Taibah University, Medina, Saudi Arabia
3 Computer Science and Information Systems, Applied College, Taibah University,
Medina, Saudi Arabia
4 Ibrahim Badamsi Babangida University, Lapai, Niger State, Nigeria
5 Baze University, Abuja, Nigeria
Abstract. Textual data streams have been widely applied in real-world applications where online users’ expressed their opinions for online products. Mining this
stream of data is a challenging task for researchers as a result of changes in data
distribution, a phenomenon widely known as concept drift. Most of the existing
classification methods incorporated drift detection methods that depend on the
classification errors. However, these methods are prone to higher false-positive or
missed detections rates. Thus, there is a need for more sensitive detection methods that can detect the maximum number of drifts in the data stream to improve
classification accuracy. In this paper, we present a drift detection-based adaptive
windowing for ensemble classifier, an adaptive unsupervised learning algorithm
for sentiment classification, and opinion mining. The proposed algorithm employs
four different dissimilarity measures to quantify the magnitude of concept drift
in data streams, to improve the classification performance. Series of the experiments were conducted on the real-world datasets and the results demonstrated the
efficiency of our proposed model.
Keywords: Data streams · Sentiment analysis · Concept drift · Ensemble
classification
1 Introduction
Data streams are a well-ordered sequence of samples that were generated continuously
in real-time [1]. Examples of data streams include recommender systems, computer
network traffic streams, financial time series, and various sensor data among others.
Besides, the sentiment classification in stream data mining applications, each of which
is made up of an instance and a class label is most widely explored using the stream
classification models [2]. Unlike the traditional stationary settings, stream data are very
© The Author(s), under exclusive license to Springer Nature Switzerland AG 2022
F. Saeed et al. (Eds.): IRICT 2021, LNDECT 127, pp. 117–128, 2022.
https://doi.org/10.1007/978-3-030-98741-1_11
118
I. Rabiu et al.
different due to the problems such as the increase in data volume, read-only once,
different types of concept drift, and imbalanced situations [3].
In the text stream analysis, especially review-based sentiment classification, these
issues become more challenging as review contents are unpredictable and mostly a
user’s perception changes often times [4, 5]. Sometimes, users express their opinions for
a given item based on their characteristics which may change over time. For example, in
a phone product, a user may have a positive sentiment about the phone, and at a specific
time if some features change (i.e., some add or remove), then suddenly some terms
associated with the new features may be appeared or disappeared in the user’s review for
the phone, revealing a different sentiment. In such a dynamic environment, the classifier
performance degrades as a result of these shifts in the underlying distribution of data
[6, 7]. Concept drifts are generally categorized as abrupt and gradual concept drifts
dependent on the speed [8]. A number of approaches have been presented to address
concept drifts, which are basically comprised of three groups, such as window-based,
weight-based, and ensemble-based methods [5]. Among these methods, the ensemblebased method is particularly popular and effective, but it calls for a more powerful design
to accommodate the high speed and dynamic data streams environments. Moreover, the
ensemble method combines various base methods leveraging the advantages of their joint
performances, to increase the predictive power that any of the individual methods can
achieve [9, 10]. In recent times, several efforts have proposed the ensemble approach
and much success has been recorded [10–12]. However, most of these methods only
integrate base classifiers to improve the predictive performance of data streams, they do
not explicitly consider concept drift detection [13–15].
In this paper, a novel drift detection-based adaptive windowing (DDAW) is proposed
for ensemble classifier in online user sentiment classification that incorporates drift
detectors intending to simultaneously identify different types of concept drifts, rather
than using a static ensemble of the classifier. To this end, the contribution of this paper
is summarized in three folds:
i.
Concept drift detection technique is deployed to provide fast reaction to sudden
changes. Moreover, a two-window method is used to handle drift detection tasks.
ii. To quantify the drift magnitude, different dissimilarity measures are explored based
on their performances to measure the changes between two windows, that is, the
reference window and the current window, respectively. Besides, the framework
for a novel adaptive ensemble classification method is presented, which considers
concept drift to improve the predictive performance of the ensemble classifier.
iii. A series of experiments were performed on two real-world datasets and the results
show the superiority of our model over the state-of-the-art models in terms of
accuracy.
The rest of this paper is as follows: Sect. 2 provides short review of the related works.
The proposed method is presented in Sect. 3, while the experimental settings and results
are presented in Sect. 4 to assess the performance of the proposed model. Finally, the
paper is concluded in Sect. 5.
Ensemble Method for Online Sentiment Classification
119
2 Related Works
In this section, we present a review of the related works for change detection. Accordingly, this paper investigates how to exploit the textual data features to detect and handle
concept drift of user opinions which have widely appeared in real-world online applications, and posed a significant challenge for classification accuracy [16]. In most cases,
concept drift detection methods work together with a base classifier such as NB and LibSVM (SVM) models to improve classification accuracy [17–19]. Generally, the stream
classification models are aimed to train the prediction models using both the historical
data and current examples in the stream to predict the true class of incoming examples
[20, 21]. However, the data instances arrive at a higher rate, which classifiers need to
process with stringent constraints of time and memory. To address these issues, ensemble
paradigms are designed for streaming environments for enhancing classification accuracy [11]. The existing ensemble methods mainly address the issue of improving the
accuracy of prediction by training individual classifiers on different portions of data
instances and combining them via voted weighting schemes to predict the incoming
instances [11]. Unfortunately, such methods could not deal with concept drift properly.
Essentially, there are two types of works concerning the concept drift detection, which
are categorized into evolving-based and trigger-based learners [4]. With evolving learning approach, the learners are updated periodically independent of whether the change
has occurred or not. This means that evolving learners do not detect changes explicitly
and therefore they do not influence the decision on how the new model should be reconstructed [5]. Under this category, two approaches are distinguished, namely instance
selection and instance weighting. Instance selection involves selecting the instances that
are more appropriate to the current concept. The most common variant of the instance
selection method is the time window approach that moves in varying sizes or a fixed
size over the newly arrived instances [22]. Instance weighting approach on the other
hand processes weighting of the instances by employing the decay functions according
to their age and relevance to the current concept [22].
The second category of adaptation method which is more prevalent is the triggerbased learners. The trigger-based approach works in conjunction with detection models
which produced signals, indicating the need to update the current model. Trigger-based
models are of two types. The first group produced the signals based on information
about classifier’s performance while the second group is by monitoring changes in data
distributions using dissimilarity measures. Based on the first group, some references
[23–25] used the difference between the accuracy of the recent instances and that of
the overall data to detect the concept drift. Also, [5] for example proposed a model
to detect concept drift using the classifier’s error rate based stream data as the change
indicator. The monitoring approach is that when the error rate exceeds the threshold, a
concept drift is signaled, and a model update is required. However, the problem with
this method is that if the sliding window is mall it produces too many false alarms. But,
if the sliding window is too large, it does not perform well on graduate drifts. Another
type of drift detection approach is by using the batch mode for monitoring two distributions. Distributions over these two windows are compared based on dissimilarities
measures and performing statistical tests with the null hypothesis H_0, indicating that
the distributions are equal, and alternative hypothesis H_1, indicating that change has
120
I. Rabiu et al.
occurred [26]. This is rarely used in the previous works. A common advantage of this
approach is that it doesn’t depend on the classification error rate to signal drift detection,
unlike the above-mentioned methods. As a result, our method takes advantage of these
approaches and the ensemble of the classifier, which is aimed to detect different types
of drifts simultaneously.
3 Proposed Ensemble Method for Sentiment Classification Using
DDAW
This section presents the proposed DDAW approach for sentiment classification, which
uses an unsupervised concept drift detection method that triggers the drift points as they
occur more timely and efficiently. A trigger-based approach observes all the possible drift
points in the data streams and then adapts the model accordingly. DDAW is specifically
designed to deal with the concept drift of online users’ sentiments and opinions based
on their review data. It aims at enhancing the ability of the ensemble model to deal
with the drift of user opinions and maximizing the accuracy of the model. To this end,
the proposed model comprises two components: the drift detection component and the
classification component. Each of these components is detailed as follows:
3.1 Drift Detection Component
As noted in the literature, most of the concept drift detection methods work with the
classifiers or learning models. Also, most of these change detections techniques focus
on detecting changes in the error rate of the classifiers, without considering changes in
the distribution of data [27, 28]. To build our DDAW, we adopt the two-window scheme
as shown in Fig. 1, which is also the most extensively used method by comparing the
data distribution between two consecutive windows [11].
Fig. 1. Two-window scheme for change detection model
From Fig. 1, W1 and W2 represent the reference and current windows, respectively.
And the size of each window is n. In stream mining, the problem of drift detection is to
test the null hypothesis H0 against alternative hypothesis H1 as shown below:
H0 d (W1 , W2 ) ≤ ε
H1 d (W1 , W2 ) > ε
Where ε is a distance-based threshold that determines if the change has occur, and
d (W1 , W2 ) is a distance function that measures the similarity of two windows. When the
Ensemble Method for Online Sentiment Classification
121
dissimilarity between two windows is greater than a given threshold, then, a change has
occurred. In this study, four distance measures are considered to be used to compare the
current window and the reference window based on their efficiency for drift detection,
such as Hellinger distance (HD), Kullback–Leibler divergence (KD), Total variation
distance (TVD), and the Kolmogorov–Smirnov statistic (KS distance) [26]. The steps
for the drift detection method is presented in Algorithm 1.
Algorithm 1: Drift Detection-based Adaptive Windowing
Input:
D: A set of review textual data
Window size n
Output: Drift detection
Begin
1. Initialize t = 0;
2. Set reference window
={
,...,
};
={
,...,
};
3. Set detection window
4.
for each instance in D do
5.
Calculate d( ,
) according to any of equation (4.6) to (4.11);
6.
Calculate ε according to Theorem 1;
7.
if d( ,
) > ε then
8.
t ++;
9.
Report drift at time t;
10.
Clear all windows and go to step 2;
11.
else
12.
Slide
by 1 point;
13.
end if
14.
end for
15. end
3.2 Ensemble Method for Sentiment Classification Using DDAW
In recent times, ensemble approach is mostly used for stream data classification to
enhance the accuracy [11, 20, 29]. As illustrated in Fig. 2, the proposed ensemble method
maintains a pool of classifiers, where each classifier represents the existing concept to be
used to predict the class of incoming instances based on the weighted voting weighted
scheme. In addition, a change detector was employed to track the distribution between
two consecutive windows, one representing the older instance and the other the more
recent instances. Once a drift occurs, a new classifier is trained on the new data and
added to the pool to represent a new concept identified.
To generate the final prediction, it assumed that, as new models were added, the
previously added classifiers lose their weights and thus contribute little to the final
result, and need to be pruned from the ensemble classifier. Moreover, it is worth noting
that, as new classifiers are being added, the total number of classifiers in the ensemble
is checked if it has exceeded the predefined maximum limit K (number of classifiers
122
I. Rabiu et al.
Fig. 2. The structure of the proposed ensemble learning models
maintained for prediction), then the classifier with the least weight is removed from the
ensemble before adding a new classifier.
Weighting Mechanism. As noted in the previous sections, the idea is to train an ensemble of classifiers from a different portion of the data stream. Then, based on their performance on current data, the weights of each classifier are updated. When a new model
is built as a result of drift detection, the weaker models are pruned and only the top kclassifiers are kept. This implies that two key strategies play a vital role in this approach.
These comprise of weighting the member classifiers and pruning the weakest classifier removing the worst-performing classifier. For each incoming instance d , each ensemble
member Mi ∈ E is weighted according to Eq. 1 when concept drift is detected.
Wi =
1
MSEr + MSEi + α
(1)
Where Wi is the weight of classifier Mi , and α is added to avoid division by zero.
MSEr and MSEi are the root mean square error of the model Mi performance on the
data in the reference window and data in the current window, respectively. The steps
for the ensemble method for sentiment classification with drift detection can be given in
Algorithm 2 as follows:
Ensemble Method for Online Sentiment Classification
123
Algorithm 2: Ensemble method using DDAW algorithm
Input:
D : A set of review textual data;
k: the size of ensemble classifier
Output:
E: the ensemble of classifier
1 Begin
2 E
3 for all instances dt in D do
4 W
{dt};
5
if change detected = = true (according to equation (4.6) and (4.11)) then
6
create a new classifier M’;
7
update the weight of all classifiers in an ensemble based on eq. (4.12)
8
if |E| < k then
9
E
10
else prune the worst classifier;
11
else
12
reuse the classifier in E;
13
end if
14
end if
15
end for
16 end
4 Experimental Results and Discussions
In this section, we first present the results and discussed the performance of the different
settings of our proposed DDAW model using four different distance measures and then
identifies the best performing setting for further comparison with other baseline methods
on two real-world datasets, Amazon shopping [30] and 20-Newsgroup [31]. To evaluate
our proposed model, we employ the false-positive rate, miss detection rate, and accuracy
[32]. Each of these measures is detailed as follows:
False-Positive Rate - describes the percentage of non-draft detected as drift, which is
defined as the number of non-drift samples detected as drifts divided by the total number
of non-drift samples, shown in Eq. 2.
FP
(2)
FP + TN
Miss Detection Rate - describes the percentage of drift samples detected as non-drift,
which is defined as the number of drift samples classified as non-drifts divided by the
total number of drifts samples, as shown in Eq. 3.
False Alarm Rate =
FN
(3)
FN + TP
Accuracy - describes the overall accuracy of the detection method to detect between
the concept drift and non-concept drift preferences as shown in Eq. 4.
Miss Rate =
Accuracy =
TP + TN
TP + TN + FP + FN
(4)
124
I. Rabiu et al.
The baseline methods include reactive drift detection method RDDM [33], PageHinkley [34], and AEE [35] which are widely used in concept drift detection, and several
studies in this field use them as baseline algorithms.
4.1 Performance of the Different DDAW Versions
Table 1 and Fig. 3 demonstrate different performances of our proposed DDAW model for
drift detection with different versions across all the datasets in terms of False Positive,
Miss Rate, and Accuracy across all the datasets. The False Positive Rate indicates the
rate of identified drifts when none occurred, while the Miss Detection Rate indicates
the rate of missed drifts when they actually occurred. The lower values indicate that the
methods actually identify drifts correctly.
Table 1. Results of the DDAW Variants in terms of False rate, Miss rate and Accuracy.
Model
Amazon
F
20-Newsgroup
M
A
F
M
A
DDAW-KL
0.034
0.017
0.091
0.044
0.062
0.487
DDAW-TVD
0.033
0.014
0.115
0.046
0.068
0.592
DDAW-KSD
0.024
0.013
0.198
0.035
0.056
0.794
DDAW-HD
0.013
0.005
0.293
0.025
0.032
0.937
From Table 1, it can be observed that the DDAW-HD version outperforms all the
other versions of the model, namely, DDAW-KL, DDAW-TVD, and DDAW-KSD in
all cases. Specifically, it can be seen that compared to the DDAW-KL version which
utilized Kullback–Leibler divergence, the DDAW-HD outperformed it with significant
improvements of 2.5%, 4.1%, and 3.1%, 3.5% in terms of the False Positive and Miss
Detection rates respectively. Compared to the DDAW-TVD, which uses Total variation distance, the DDAW-HD recorded gains of 2.9%, 4.4%, and 2.6%, 2.7% in terms
of the False Positive and Miss Detection rates respectively. Meanwhile compared to
the DDAW- KSD which performs better than the other two measures, the DDAW-HD
recorded gains of 1.9%, 2.1%, and 2.5%, 2.7% in terms of the False Positive and Miss
Detection rates respectively. This directly indicates the robustness of Hellinger distance
as a distance measure of quantifying the concept drift between two distributions, which
in turns reaffirms many of the previous findings signifying the benefit of the Hellinger
distance over the other measures [26, 36].
4.2 Performance Comparison with Existing Methods
In comparison with the existing methods, the best performing version of the proposed
DDAW model according to Table 1 and Fig. 3 was selected to make further comparison
with the existing methods in Table 2 and Fig. 4. Essentially, for the fact that DDAW-HD
performs better among the other versions of the DDAW method, we only report the result
Ensemble Method for Online Sentiment Classification
125
Fig. 3. Graphical representation of the results of different versions of our model
on the DDAW-HD to make a comparison with RDDM, PH, and AEE methods. From
Table 2 and Fig. 4, it can be seen that our proposed DDAW-HD model outperformed all
the existing methods across all the datasets.
Table 2. Performance of DDAW compared with the baselines
Model
Amazon
20-Newsgroup
F
M
A
F
M
A
AEE
0.053
0.041
0.297
0.130
0.132
0.460
RDDM
0.048
0.034
0.293
0.092
0.124
0.467
PH
0.044
0.037
0.304
0.070
0.110
0.753
DDAW-HD
0.013
0.005
0.409
0.025
0.032
0.937
Compare to the RDDM model, our DDAW-HD approach performs better with
a reduced error rate of 18.23%, 24.5%, and 13.40%, 6.8% on the Amazon and 20Newsgroups datasets in terms of False Positive and Miss Detection rates, respectively.
More importantly, our DDAW-HD approach performs better compared to the PH model
which is the best performing model among the baselines on drift detections. Specifically, our DDAW-HD approach outperformed the PH model with a reduced error rate of
13.76%, 4.5%, and 7.3%, 4.18% on the 20-Newsgroups and Amazon datasets in terms
of False Positive and Miss Detection rates, respectively. This can be attributed to the
fact that the baselines are based on error rates of classifications, which results in missing several concept drifts as the learners cannot respond to the error rates timely and
accurately in most cases.
126
I. Rabiu et al.
Fig. 4. Graphical representation of the DDAW results compared with baselines
5 Conclusion
The availability of concept drift detection techniques offers many different potentials for
extracting the possible changes between concepts depending on whether the change is
mine through model performance or by comparing data distribution over two windows,
using different similarity measures. In this study, we exploit the second approach and used
different similarity measures to compare text data streams for concept drift detection.
In this paper, we proposed the DDAW algorithm for concept drift detection based on
the distance measures to quantify concept drift. It was found that our DDAW model
with Hellinger distance measure (DDAW-HD performs better than other versions and
the baseline methods. We believe this is due to the different ways it produces the desired
distance. In addition, Hellinger distance is known to be an excellent and easy-to-use
numerical estimation tool for high-dimensional data. Finally, from these results, we
may conclude that distance measures play a significant role in quantifying concept drift.
Moreover, it is believed that more robust approaches can be explored by incorporating
our detection measures into the techniques such as deep learning models to increase the
performance of sentiment classification models.
References
1. Aggarwal, C.C.: Recommender Systems The Textbook. Springer, Cham (2016). https://doi.
org/10.1007/978-3-319-29659-3
2. Gaber, M.M., Zaslavsky, A., Krishnaswamy, S.: A survey of classification methods in data
streams. In: Data Streams (2007)
3. Widmer, G.: Learning in the presence of concept drift and hidden contexts. Mach. Learn.
(1996). https://doi.org/10.1007/bf00116900
4. Žliobaitė, I., Pechenizkiy, M., Gama, J.: An overview of concept drift applications. In: Japkowicz, N., Stefanowski, J. (eds.) Big Data Analysis: New Algorithms for a New Society.
SBD, vol. 16, pp. 91–114. Springer, Cham (2016). https://doi.org/10.1007/978-3-319-269
89-4_4
5. Gama, J., Zliobaite, I., Bifet, A., et al.: A survey on concept drift adaptation. ACM Comput.
Surv. 46 (2014)
Ensemble Method for Online Sentiment Classification
127
6. Sujatha, P., Saradha, S.: A study of data mining concepts and techniques. Int. J. Appl. Eng.
Res. (2014)
7. Pinage, F.A., dos Santos, E.M., da Gama, J.M.P.: Classification systems in dynamic environments: an overview. Wiley Interdiscip. Rev. Data Min. Knowl. Discov. (2016). https://doi.
org/10.1002/widm.1184
8. Tsymbal, A.: The problem of concept drift: definitions and related work (2004)
9. Rokach, L., Maimon, O.: The Data Mining and Knowledge Discovery Handbook, pp. 1203–
1224. Springer, Boston (2010). https://doi.org/10.1007/978-0-387-09823-4
10. Min, J.K., Hong, J.H., Cho, S.B.: Combining localized fusion and dynamic selection for highperformance SVM. Expert Syst. Appl. (2015). https://doi.org/10.1016/j.eswa.2014.07.028
11. Sun, Y., Shao, H., Wang, S.: Efficient ensemble classification for multi-label data streams
with concept drift. Information (2019). https://doi.org/10.3390/info10050158
12. Minku, L.L., Yao, X.: DDD: a new ensemble approach for dealing with concept drift. IEEE
Trans. Knowl. Data Eng. 24, 619–633 (2012). https://doi.org/10.1109/TKDE.2011.58
13. Katakis, I., Tsoumakas, G., Vlahavas, I.: Tracking recurring contexts using ensemble classifiers: an application to email filtering. Knowl. Inf. Syst. (2010). https://doi.org/10.1007/s10
115-009-0206-2
14. Krawczyk, B., Cano, A.: Adaptive ensemble active learning for drifting data stream mining.
In: IJCAI International Joint Conference on Artificial Intelligence (2019)
15. Jȩdrzejowicz, J., Jȩdrzejowicz, P.: GEP-based ensemble classifier with drift-detection. In:
Bramer, M., Petridis, M. (eds.) SGAI 2018. LNCS (LNAI), vol. 11311, pp. 121–131. Springer,
Cham (2018). https://doi.org/10.1007/978-3-030-04191-5_9
16. Al-Ghossein, M., Murena, P.A., Abdessalem, T., et al.: Adaptive collaborative topic modeling
for online recommendation. In: RecSys 2018 - 12th ACM Conference on Recommender
Systems, pp 338–346. Association for Computing Machinery, Inc., (2018)
17. Bifet, A., Frank, E., Holmes, G., Pfahringer, B.: Accurate ensembles for data streams:
combining restricted hoeffding trees using stacking. J. Mach. Learn. Res. (2010)
18. Tomás, C.C., Oliveira, E., Sousa, D., et al.: Proceedings of the 3rd IPLeiria’s international
health congress. BMC Health Serv. Res. (2016). https://doi.org/10.1186/s12913-016-1423-5
19. Zhang, H., Wu, J., Norris, J., et al.: Predictors of preference for caesarean delivery among
pregnant women in Beijing. J. Int. Med. Res. (2017). https://doi.org/10.1177/030006051769
6217
20. Gomes, H.M., et al.: Adaptive random forests for evolving data stream classification. Mach.
Learn. 106(9–10), 1469–1495 (2017). https://doi.org/10.1007/s10994-017-5642-8
21. Arya, M., Choudhary, C.: Improving the efficiency of ensemble classifier adaptive random
forest with meta level learning for real-time data streams. In: Bhateja, V., Satapathy, S.C.,
Zhang, Y.-D., Aradhya, V.N.M. (eds.) ICICC 2019. AISC, vol. 1034, pp. 11–21. Springer,
Singapore (2020). https://doi.org/10.1007/978-981-15-1084-7_2
22. Gemaque, R.N., Costa, A.F.J., Giusti, R., dos Santos, E.M.: An overview of unsupervised
drift detection methods. Wiley Interdiscip. Rev. Data Min. Knowl. Discov (2020)
23. Nishida, K., Yamauchi, K.: Detecting concept drift using statistical testing. In: Corruble, V.,
Takeda, M., Suzuki, E. (eds.) DS 2007. LNCS (LNAI), vol. 4755, pp. 264–269. Springer,
Heidelberg (2007). https://doi.org/10.1007/978-3-540-75488-6_27
24. Misra, S., Biswas, D., Saha, S.K., Mazumdar, C.: Applying Fourier inspired windows for
concept drift detection in data stream. In: 2020 IEEE Calcutta Conference, CALCON 2020
- Proceedings (2020)
25. Yu, S., Abraham, Z.: Concept drift detection with hierarchical hypothesis testing. In:
Proceedings of the 17th SIAM International Conference on Data Mining, SDM 2017 (2017)
26. Goldenberg, I., Webb, G.I.: Survey of distance measures for quantifying concept drift and
shift in numeric data. Knowl. Inf. Syst. 60(2), 591–615 (2018). https://doi.org/10.1007/s10
115-018-1257-z
128
I. Rabiu et al.
27. Costa, F.G.d., Duarte, F.S.L.G., Vallim, R.M.M., Mello, R.F.d.: Multidimensional surrogate
stability to detect data stream concept drift. Expert Syst. Appl. 87, 1339–1351 (2017). https://
doi.org/10.1016/j.eswa.2017.06.005
28. Gama, J., Sebastião, R., Rodrigues, P.P.: On evaluating stream learning algorithms. Mach.
Learn. 90(3), 317–346 (2012). https://doi.org/10.1007/s10994-012-5320-9
29. Polikar, R.: Ensemble based systems in decision making. IEEE Circuits Syst. Mag. (2006)
30. McAuley, J., Leskovec, J.: Hidden factors and hidden topics: understanding rating dimensions
with review text. In: RecSys 2013 - Proceedings of the 7th ACM Conference on Recommender
Systems (2013)
31. Zhang, Y., Chu, G., Li, P., et al.: Three-layer concept drifting detection in text data streams.
Neurocomputing (2017). https://doi.org/10.1016/j.neucom.2017.04.047
32. Du, L., Song, Q., Jia, X.: Detecting concept drift: an information entropy based method using
an adaptive sliding window. Intell. Data Anal. 18, 337–364 (2014). https://doi.org/10.3233/
IDA-140645
33. Barros, R.S.M., Cabral, D.R.L., Gonçalves, P.M., Santos, S.G.T.C.: RDDM: reactive drift
detection method. Expert Syst. Appl. (2017). https://doi.org/10.1016/j.eswa.2017.08.023
34. Sebastião, R., Fernandes, J.M.: Supporting the page-hinkley test with empirical mode decomposition for change detection. In: Kryszkiewicz, M., Appice, A., Śl˛ezak, D., Rybinski, H.,
Skowron, A., Raś, Z.W. (eds.) ISMIS 2017. LNCS (LNAI), vol. 10352, pp. 492–498. Springer,
Cham (2017). https://doi.org/10.1007/978-3-319-60438-1_48
35. Kolter, J.Z., Maloof, M.A.: Using additive expert ensembles to cope with concept drift. In:
ICML 2005 - Proceedings of the 22nd International Conference on Machine Learning (2005)
36. Ditzler, G., Polikar, R.: Hellinger distance based drift detection for nonstationary environments. In: IEEE SSCI 2011: Symposium Series on Computational Intelligence - CIDUE
2011: 2011 IEEE Symposium on Computational Intelligence in Dynamic and Uncertain
Environments (2011)
Rainfall Forecasting Using the Group Method
of Data Handling Model: A Case Study
of Sarawak, Malaysia
Azlina Narawi1,2(B) , Dayang Norhayati Abang Jawawi2 , and Ruhaidah Samsudin2
1 Universiti Teknologi MARA Cawangan Sarawak, Kampus Samarahan 2,
94300 Kota Samarahan, Sarawak, Malaysia
azlina_14@uitm.edu.my
2 School of Computing, Faculty of Engineering, Universiti Teknologi Malaysia, 81310
Skudai, Johor, Malaysia
{dayang,ruhaidah}@utm.my
Abstract. Time series forecasting has led to the emergence of various forecasting models applied to arrays of time series problems, such as rainfall forecasting,
dengue forecasting, tourism forecasting, and others. The Artificial Neural Network (ANN) is a popular Artificial Intelligence (AI) model extensively employed
in much research for time series forecasting due to its nonlinear modeling ability.
The group method of data handling (GMDH) is an AI model with the characteristics of heuristic self-organizing capability. This model has shown successful
results in many areas. Nowadays, rainfall forecasting remains a vital interest and
is still actively researched, where researchers use different soft computing techniques. The ANN has been popularly studied for rainfall forecasting because of its
ability to efficiently train a large amount of data and completely detect complex
connections between nonlinear dependent and independent variables. However,
research on rainfall forecasting using the GMDH model is limited. Hence, this
paper designates the GMDH model and its application to rainfall forecasting.
The conventional GMDH model uses the polynomial transfer function. The sigmoid transfer function is proven to solve the multicollinearity issue caused by
the quadratic polynomial of the GMDH model. Hence, this research tackled the
multicollinearity issue of using different transfer functions in GMDH modeling
and forecasting. The study compares the results of using polynomial and sigmoid transfer functions for the GMDH model development. This research uses
the Malaysia rainfall dataset of the Sarawak regions from 2010 until 2019 as a
case study to evaluate the effectiveness of the GMDH models in this research. The
results exhibit that the polynomial transfer function is dominant in achieving the
smallest RMSE and MSE values in all regions.
Keywords: Group method of data handling · GMDH · Time series · Rainfall ·
Forecasting
© The Author(s), under exclusive license to Springer Nature Switzerland AG 2022
F. Saeed et al. (Eds.): IRICT 2021, LNDECT 127, pp. 129–140, 2022.
https://doi.org/10.1007/978-3-030-98741-1_12
130
A. Narawi et al.
1 Introduction
Forecasting of time series involves historical data to make a prediction. Forecasting
time series data is a challenging problem, and it has attracted many researchers over
the years, making it an active research area. Time series forecasting has led to the
emergence of various forecasting models applied to arrays of time series problems, such
as in rainfall forecasting [3, 15], dengue forecasting [14], tourism forecasting [6], and
others. In forecasting of time series, the challenge is due to the pattern in the data. It
is rare to find time series data that are purely linear or nonlinear. They are usually a
mixture of both patterns [35]. The complex underlying nonlinear relationship in the data
is not straightforward to understand. Numerous models have been employed by past
researchers in conducting time series forecasts.
However, research on Artificial Intelligence (AI) model development has received
much attention recently. The Artificial Neural Network (ANN) is a popular AI model
extensively employed in much research for time series forecasting due to its capability
in nonlinear modeling [25, 37]. On the other hand, the group method of data handling
(GMDH) has gained research attention recently, which offers several advantages over
the ANN. The GMDH is a self-organizing heuristic AI model introduced by a Russian
mathematician, Ivakhnenko, in 1968. It can automatically structure its networks without
human interventions. At first, Prof. Alexey G. Ivakhnenko introduced the GMDH model
in the 1960s to identify the nonlinear relations between the input and output variables,
modeling complex systems, pattern recognition, data clustering, and prediction [16].
Farlow (1981) reported that Ivakhnenko’s inspiration to develop GMDH came from
his frustration with the causal model, which requires practitioners to know the system
beforehand [12]. The GMDH model works for small datasets, where according to Tamura
and Kondo (1978) is a valuable practical technique to identify nonlinear input-output
relationships in complex systems, even if small datasets are involved [31]. Contrarily the
ANN requires a massive amount of historical data. The setting of parameters is seen to
be one of the main issues when implementing the ANN model, including the number of
neurons and layers. On the other hand, the GMDH model can self-organize its structure
in the training procedure; the initial guessing of the neurons number in a layer and the
number of layers is unrelated [32]. Before forecasting, essential parameters in the GMDH
model must be set the highest layers number, highest neurons number, and the selection
pressure [13]. The ANN tends to overfit while the GMDH can resist overfitting [32].
The GMDH can avoid biases and misjudgments due to its ability to automatically selforganize without any human involvement, allowing it to discover the optimal solution
for a given problem [2]. The GMDH model can generate explicit expressions, whereas
the ANN generates implicit models (black box in nature). This unique feature of the
GMDH model helps find the most influential variables and has been previously applied
as an input selector [33].
The GMDH model has gradually received researchers’ attention and has been
explored in much research. It is an AI model that has comparatively related structures
to the ANN. In previous literature, comparisons between ANN and GMDH have frequently been made where their performances vary. For instance, in the research work
of [34] in comparing the GMDH and ANN performance, it was claimed that the ANN
performed better than the GMDH. Instead, according to [13] the GMDH was far more
Rainfall Forecasting Using the Group Method of Data Handling Model
131
successful than the ANN in prediction. Nevertheless, Varahrami (2012) stated that the
GMDH is more reliable than the ANN when the system at hand is very complex, and
the underline input-output relationship is not entirely comprehensible or if the system
exhibits a chaotic pattern [35].
The GMDH model’s advantages encourage us to implement the model for rainfall
forecasting. Nowadays, rainfall forecasting remains a vital interest and is still actively
researched, where researchers use different soft computing techniques like the ANN,
Genetic Algorithm, Support Vector Regression, Particle Swarm Optimization, and Fuzzy
logic [5, 9, 17, 21, 28, 36]. The ANN has been popularly researched for rainfall forecasting because it can train a large amount of data efficiently and can detect complex
connections between nonlinear dependent and independent variables altogether [11]. On
the other hand, Onwubolu et al. (2007) applied the GMDH model for rainfall forecasting [27]. They spread the self-organizing enhanced GMDH (e-GMDH) model for daily
pressure, daily temperature, and monthly rainfall. The weather data used were the daily
temperature and pressure from 2000 until 2007 and a chaotic rainfall dataset for the city
of Suva from 1990 to 2002. The e-GMDH enhanced the polynomial GMDH with several better features like thresholding schemes coefficient rounding and pruning through
a half-randomized selection method. The research results reported that the e-GMDH
outperformed the polynomial neural network and the enhanced polynomial neural network for daily temperature. However, for the monthly rainfall and daily temperature, the
e-GMDH did not perform well compared to the other methods.
Table 1 summarizes various methods used in rainfall forecasting.
Table 1. Summary of methods used in rainfall forecasting.
Authors
Data
Rainfall
predicting
variables
Methods
Accuracy
measure
[30]
The South
Tangerang,
Indonesia
6 years data
Rainfall and
temperature
ANFIS technique
RMSE
MSE
[10]
Iran rainfall
data Mean
annual rainfall
data (25 years,
1990–2014)
Stations,
latitude,
elevation, min,
max, mean,
coefficient of
variation
A hybrid rainfall forecasting
model using support vector
regression and firefly
(SVR-FFA) The hybrid
SVR-FFA was reported to
outperform the SVR and
GP-based multigene genetic
programming MGGP
significantly
RMSE
NSE
(continued)
132
A. Narawi et al.
Table 1. (continued)
Authors
Data
Rainfall
predicting
variables
Methods
Accuracy
measure
[23]
Predictand data
from Kuching
airport rainfall
station
Monthly
averages of
GCM
climatological
variables
(predictors),
and observed
local monthly
average
precipitation
data
(predictand)
Cuckoo Search Optimization
Neural Network model to
forecast. Benchmarked the
Levenberg-Marquardt (LM)
optimisation method and Scale
Conjugate Gradient (SCG).
The CS algorithm with the
Feedforward Neural Network
besides Recurrent Neural
Network, CSOFNN and
CSORNN respectively. The
CS algorithm outperformed
the SCG and LM optimization
methods
RMSE
MAE
MB (mean
bias)
R (correlation
coefficient)
[7]
42 cities data in Rainfall
Europe and the amount
USA
Decomposition Genetic
Programming (DGP)
performed on a different
regression equation based on
the rainfall level. The DGP
was reported to significantly
outperform all other
algorithms
RMSE
MSE
[24]
The Iranian
meteorological
dataset from
1981 to 2012
The proposed combined
monthly rainfall prediction
models using Artificial Neural
Network–Autoregressive
Conditional Heteroscedasticity
as well as Gene Expression
Programming–Autoregressive
Conditional Heteroscedasticity
abbreviated as ANN-ARCH
and GEP-ARCH respectively.
The hybrid models had
outperformed the ANN and
GEP models. The
ANN-ARCH model was
reported to surpass the
GEP-ARCH model
RMSE
R2 (coefficient
of
determination)
The monthly
rainfall
Rainfall Forecasting Using the Group Method of Data Handling Model
133
The conventional GMDH model by Ivakhnenko uses the polynomial transfer function. Nevertheless, Jirina (1994) proposed a logistic sigmoid transfer function to replace
the polynomial function to solve the multicollinearity caused by the quadratic polynomial of the GMDH model. Further, through their experimental results, Kondo and
Pandya (2003) reported that the GMDH model that uses the sigmoid transfer function
performed better than the GMDH model that uses the radial basis function and ANN.
They testified that using sigmoid as the transfer function helps identify the nonlinear
system as the neural network architecture handled to fit the complex nonlinear system
[22]. On the other hand, the implementation of different transfer functions was done by
Tauser and Buryan (2011), who implemented eight different functions, namely polynomial, harmonic (cosine), square root, inverse polynomial, logarithmic, arc tangent and
exponential in their GMDH network [32]. Hence, this research would investigate the
effectiveness of the polynomial and sigmoid transfer functions for the GMDH model in
solving the multicollinearity issues, particularly for rainfall forecasting.
2 The Group Method of Data Handling Model
Prof. Ivakhnenko invented a model that focuses solely on input and output relationships
and requires no human interventions. Thus, the GMDH model is considered a datadriven model. Ivakhnenko proposed the basic GMDH model, which is especially useful
in identifying complex as well as the unknown nonlinear system as testified by [12,
21], and [35]. Like the ANN, the GMDH model entails the three layers: input, hidden,
and output. Simple neurons are created via a two-variable combination in every hidden
layer that implements its transfer function of a quadratic polynomial. The neurons in
the following layer will receive the outputs from this layer. However, the reduction of
inefficient neurons will happen via some threshold value. The best-performing neurons
will be retained, while the lowest-achieving ones will be removed. In the final layer, only
one neuron exists; thus, this last layer’s output will represent the entire network’s output.
The GMDH basic process is like the principle of a traditional neural network created
using the forward propagation of signals via neurons. The strong point of GMDH lies
in its capability to naturally organize its structures in a heuristic manner [2]. GMDH
has the criteria for automatically generating the neuron number in a layer and the layer
number with no human intervention. It also has a self-organizing feature, which allows it
to discover the ideal solution for a given problem while avoiding bias and misjudgments
[2]. Thus, this feature of the GMDH also contributed to it having a small number of
parameters tuned: the highest neurons number, the highest layers number, and pressure
of selection, making it a reliable and straightforward AI model [13].
In the conventional GMDH, the connection between inputs and outputs variable can
be modelled by the Kolmogorov-Gabor polynomial [16] as presented in the equation
below;
y = a0 +
n
i=1
ai xi +
n
n
i=1 j=1
aij xi xj +
n
n
n
aijk xi xj xk + . . .
(1)
i=1 j=1 k=1
According to Tamura and Kondo (1978), the complete description in Eq. 1 is most
widely used because nearly all real-life systems can be described using the equation
134
A. Narawi et al.
above [31]. The Kolmogorov-Gabor polynomial plays a big role in GMDH modelling
as it acts as a universal approximator to estimate unknown functions in a system [20].
Essentially, the complete description above is formed by joining the following second
order polynomials of paired variables in each layer.
yk = a0 + a1 xi + a2 xj + a3 xi2 + a4 xj2 + a5 xi xj
(2)
The above equation is identified as the Partial Description (PD), and yk is the intermediate variable. In Step 1: The data is divided into training and testing sets. The coefficient
approximation is made via the training data while the testing data is required to select
intermediate variables. Next, Step 2: Based on the combination of two input variables
xi and xj the parameters a0 , a1 , a2 , a3 , a4 and a5 in Eq. 2 are estimated using least
square method via training data. Step 3: The regularity criterion for the checking data is
calculated by using the PD estimated in Step 2. In traditional GMDH, MSE is used as
the regularity criterion. The intermediate variables which give the smallest MSE will be
selected as useful variables. Lastly, Step 4: Variables xi and xj are replaced by yi and yj
respectively. Steps 2 to 5 are repeated until the performance of the variables cannot be
further improved. Figure 1 shows the GMDH block diagram, where x1 , x2 , … xm are
training data and m is the frequency of observations.
Fig. 1. The basic GMDH block diagram.
The diagram in Fig. 1 can be briefly described:
P: All the training data are merged into pairs to form a partial quadratic polynomial.
Q: The partial quadratic polynomial coefficients are computed using least square method.
R: The performance of the outputs obtained from the neuron is measured using MSE. A
threshold will be used to filter the outputs based on their performances.
On the other hand, this study also employs the logistic sigmoid transfer function as an
alternative to the polynomial transfer function. Besides the polynomial transfer function,
which was used in the GMDH models [4, 8, 21, 32], the sigmoid transfer function is
also popularly employed in the GMDH models [4, 18, 21, 22].
The GMDH model employs the logistic sigmoid function using the following
equation:
ysig =
1
1 + e−zk
(3)
Rainfall Forecasting Using the Group Method of Data Handling Model
135
The calculation for the transfer function of the logistic sigmoid is using the following
formula:
∅
zk = log
(4)
1 − ∅
where, φ is the normalized output variable (0–1) and φ is the output variable. Then the
model calculates the coefficient zk using regression.
3 Methods
3.1 Dataset
This study uses the monthly rainfall average for January 2010 until December 2019 for
Sarawak regions, including Kuching, Sri Aman, Sibu, Miri, and Bintulu. The dataset was
obtained from the Department of Meteorology Malaysia. Figure 2 shows the monthly
average rainfall for Kuching, Miri, Bintulu, Sibu, and Sri Aman from 2010 until 2019.
Generally, the rainfall distribution is higher in Kuching than other regions, with the
highest value of 20.19 and an overall average of 12.38. Meanwhile, the lowest distribution
occurs in Miri, with the highest value of 12.09 and an overall average of 7.88.
A dataset needs to undergo the pre-processing data stage before entering a forecasting
model. In this research, with the aims to perform time series forecasting, the steps
Fig. 2. Monthly average rainfall in Sarawak Region for the period of 2010–2019
136
A. Narawi et al.
concerned include data transformation, division of the data into the training and testing
sets, lagging the data, and choosing suitable inputs.
For data transformation, the data is rescaled into a specific smaller range such as
between 0 to 1, −1 to 1, and others. Smaller numbers are essential to avoid calculating
huge numbers. In this research, the data is normalized into the range of 0 to 1, using the
following formula [26]:
Y1 =
Y −b
a−b
(5)
where Y1 is the normalized data, Y is the actual data, a is the maximum values of the
actual data and b is the minimum values of actual data.
Enormous computation problems may exist when forecasting uses the daily rainfall
data for ten years to predict daily rainfall. As an alternative, we selected monthly rainfall
averages. The data is further divided into training and testing sets. Further, division the
data into the training and testing sets where the training sets are used to develop the
model, while the testing sets are used to test the model accuracy. After a model has been
developed using the training sets, the model is tested by making predictions against the
testing sets. If all the data are used for both model development and forecast, the model
might experience overfitting. In this study, the chosen meteorological parameters will
be trained and tested to forecast rainfall. The training data size is 90%, whereas 10% for
testing.
3.2 Experimental Results
Performance measurement is vital to evaluate the dispersion between the observed data
and the forecasted data. Additionally, it is used to accurately examine the reliability and
strength of the model in forecasting. Moreover, performance measurements enable the
comparisons between different forecasting models possible to be made. RMSE and MSE
are among the well-known measures often used in time series forecasting [1, 19, 29].
Each model’s performance for both the training and test data is evaluated and selected
according to the Mean Squared Error (MSE) and Root-Mean-Square Error (RMSE). The
results of rainfall forecasting via the GMDH model are also evaluated using MSE and
RMSE. The following shows the equations for calculating RMSE and MSE, respectively.
n
1
(yt − ŷt )2
(6)
RMSE =
n
t=1
RMSE =
1
n
n
(yt − ŷt )2
(7)
t=1
Where yt is the original value, ŷt is the is the forecasted value and n is the size of the
sample. In the evaluation process, smaller values obtained for RMSE and MSE of a
given distribution are better. These two measures are used to compare the performances
of the GMDH models, wherein the best model reflects the one that obtains the smallest
RMSE and MSE. Tables 1 and 2 present the MSE and RMSE results obtained in this
Rainfall Forecasting Using the Group Method of Data Handling Model
137
study. The GMDH models which use the polynomial and sigmoid transfer functions are
denoted as GMDH-Poly and GMDH-Sig, respectively. The best results in Tables 2 and
3 are in bold.
Table 2. MSE Performance results for the training and testing sets.
Region
Kuching
Train MSE
Test MSE
GMDH-Poly
GMDH-Sig
GMDH-Poly
GMDH-Sig
0.0094721
0.0172605
0.0172605
0.0086596
Miri
0.0214740
0.0241085
0.0241085
0.0764576
Bintulu
0.0301350
0.0393166
0.0393166
0.0528348
Sibu
0.0142780
0.0238548
0.0238548
0.0193620
Sri Aman
0.0286880
0.0320923
0.0320923
0.0611177
Table 3. RMSE performance results for the training and testing sets.
Region
Train RMSE
Test RMSE
GMDH-Poly
GMDH-Sig
GMDH-Poly
GMDH-Sig
Kuching
0.0973250
0.1313793
0.0962950
0.0930569
Miri
0.1465400
0.1552690
0.2131400
0.2765097
Bintulu
0.1735900
0.1982842
0.1833100
0.2298583
Sibu
0.1194900
0.1544501
0.1642800
0.1391474
Sri Aman
0.1693800
0.1791433
0.7049500
0.2472199
From Tables 2 and 3, it is observed that, the GMDH-polynomial obtained the smallest
MSE and RMSE values for every region for the training sets. However, for the testing
set the GMDH-sigmoid obtained the smallest MSE for Kuching and Sibu. The GMDHpolynomial obtained the smallest testing MSE for Miri, Bintulu and Sri Aman. Further,
the results for RMSE for testing sets show that the GMDH-sigmoid obtained the smallest
values for Kuching, Sibu and Sri Aman whereas the GMDH-polynomial obtained the
smallest testing RMSE for Miri and Bintulu. Table 3 summarizes the performances of
the GMDH-polynomial and GMDH-sigmoid. The ‘*’ symbol denotes the best result
obtained in the study.
Table 4 generally shows that the GMDH-polynomial dominates the MSE and RMSE
for training and testing sets.
138
A. Narawi et al.
Table 4. Performance comparison for the training and testing sets
Region
GMDH-Poly
Train
MSE
Test
MSE
GMDH-Sigmoid
Train
RMSE
Test
RMSE
Kuching
*
*
Miri
*
*
*
*
Bintulu
*
*
*
*
Sibu
*
*
*
Sri Aman
*
*
*
Train
MSE
Test
MSE
Train
RMSE
Test
RMSE
*
*
*
*
*
4 Conclusion
Rainfall forecasting is one of the time series problems which is still studied frequently.
The ANN is a popular model in this study area. On the other hand, the GMDH model has
increasingly attracted research attention due to its ability to self-organize and have advantages over the ANN model. The conventional GMDH model uses the polynomial as a
transfer function was reported in previous work not being able to solve multicollinearity
issues. This research experimented with the different transfer functions using the polynomial and the sigmoid functions for rainfall data of the Sarawak region in Malaysia.
The results demonstrate that the polynomial transfer function has dominated the performance result compared to the sigmoid transfer function. Different transfer functions
will be considered in future studies. In addition, a GMDH model that is integrated with
another optimization strategy will be studied.
Acknowledgement. Special thanks to the Meteorology Department of Malaysia for its data
contribution.
References
1. Ahmad, A.S., et al.: A review on applications of ANN and SVM for building electrical energy
consumption forecasting. Renew. Sustain. Energy Rev. 33(1), 102–109 (2014)
2. AlBinHassan, N.M., Wang, Y.: Porosity prediction using the group method of data handling.
Geophysics 76(5), O15–O22 (2011)
3. Altunkaynak, A., Nigussie, T.A.: Prediction of daily rainfall by a hybrid wavelet-season-neuro
technique. Elsevier J. Hydrol. 529(2015), 287–301 (2015)
4. Basheer, H., Khamis, A.B.: A hybrid group method of data handling (GMDH) with the
wavelet decomposition for time series forecasting: a review. ARPN J. Eng. Appl. Sci. 11(18),
10792–10800 (2016)
5. Caraka, R.E., Chen, R.C., Toharudin, T., Tahmid, M., Pardamean, B., Putra, R.M.: Evaluation
performance of SVR genetic algorithm and hybrid PSO in rainfall forecasting. ICIC Express
Lett. Part B: Appl. ICIC Int. 11(7 July 2020), 631–639 (2020). ISSN 2185-2766
6. Claveria, O., Torra, S.: Forecasting tourism demand to Catalonia: neural networks vs. time
series models. Econ. Model. 36, 220–228 (2014)
Rainfall Forecasting Using the Group Method of Data Handling Model
139
7. Cramer, S., Kampouridis, M., Freitas, A.A.: Decomposition genetic programming: an extensive evaluation on rainfall prediction in the context of weather derivatives. Elsevier Appl. Soft
Comput. 70(2018), 208–224 (2018)
8. Dag, O., Yozgatligil, C.: GMDH: an R package for short term forecasting via GMDH-type
neural network algorithms. R J. 8(1), 379–386 (2016)
9. Danandeh Mehr, A.: Seasonal rainfall hindcasting using ensemble multi-stage genetic programming. Theoret. Appl. Climatol. 143(1–2), 461–472 (2020). https://doi.org/10.1007/s00
704-020-03438-3
10. Danandeh Mehr, A., Nourani, V., Karimi Khosrowshahi, V., Ghorbani, M.A.: A hybrid support
vector regression-firefly model for monthly rainfall forecasting. Int. J. Environ. Sci. Technol.
(IJEST) 16(1), 335–346 (2019)
11. Darji, M.P., Dabhi, V.K., Prajapati, H.B.: Rainfall forecasting using neural network: a survey.
In: 2015 International Conference on Advances in Computer Engineering and Applications
(ICACEA), India (2015)
12. Farlow, S.J.: The GMDH algorithm of Ivakhnenko. Am. Stat. 35(4), 210–215 (1981)
13. Ghazanfari, N., Gholami, S., Emad, A., Shekarchi, M.: Evaluation of GMDH and MLP
networks for prediction of compressive strength and workability of concrete. Bulletin de la
Société Royale des Sciences de Liège 86(special edition), 855–868 (2017)
14. Guo, P., et al.: Developing a dengue forecast model using machine learning: a case study in
China. Research Article, PLOS Neglected Trop. Dis. (2017)
15. Hernández, E., Sanchez-Anguix, V., Julian, V., Palanca, J., Duque, N.: Rainfall prediction: a
deep learning approach. In: Martínez-Álvarez, F., Troncoso, A., Quintián, H., Corchado, E.
(eds.) HAIS 2016. LNCS (LNAI), vol. 9648, pp. 151–162. Springer, Cham (2016). https://
doi.org/10.1007/978-3-319-32034-2_13
16. Ivakhnenko, A.G.: Polynomial theory of complex systems. IEEE Trans. Syst. Man Cybern.
4, 364–378 (1971)
17. Janarthanan, R., Balamurali, R., Annapoorani, A., Vimala, V.: Prediction of rainfall using
fuzzy logic. Elsevier Mater. Today Proc. 37, 959–963 (2021)
18. Jirina, M.: The modified GMDH: sigmoidal and polynomial neural net. IFAC Proc. Vol. 27(8),
611–613 (1994)
19. Khosravia, K., et al.: A comparative assessment of flood susceptibility modeling using
multi-criteria decision-making analysis and machine learning methods. Elsevier J. Hydrol.
573(2019), 311–323 (2019)
20. Kock, A.B., Terasvirta, T.: Forecasting with nonlinear time series models. In: CREATES
Research Paper, 2010-1, pp. 1–31 (2010)
21. Kondo, T.: GMDH neural network algorithm using the heuristic self-organization method and
its application to the pattern identification problem. In: Proceedings of the 37th SICE Annual
Conference 1998, International Session Papers, pp. 1143–1148. IEEE (1998)
22. Kondo, T., Pandya, A.S.: Structural identification of the multi-layered neural networks by
using revised GMDH-type neural network algorithm with a feedback loop. In: SICE 2003
Annual Conference (IEEE Cat. No. 03TH8734), vol. 3, pp. 2768–2773. IEEE (2003)
23. Kueh, S.M., Kuok, K.K.: Forecasting long term precipitation using cuckoo search optimization neural network models. Environ. Eng. Manag. J. 17(6), 1283–1291 (2018)
24. Mehdizadeh, S., Behmanesh, J., Khalili, K.: New approaches for estimation of monthly rainfall
based on GEP-ARCH and ANN-ARCH hybrid models. Water Resour. Manag. 32(2), 527–545
(2017). https://doi.org/10.1007/s11269-017-1825-0
25. Neto, P.S.G.D.M., Firmino, P.R.A., Siqueira, H., Tadano, Y.D.S., Alves, T.A., JOÃO Oli,
F.L.D.: Neural-based ensembles for particulate matter forecasting. IEEE Access 9 (2021).
Electronic ISSN 2169-3536
26. Nourani, V., Komasi, M.: A geomorphology-based ANFIS model for multi-station modeling
of rainfall-runoff process. J. Hydrol. 490, 41–55 (2013)
140
A. Narawi et al.
27. Onwubolu, G.C., Buryan, P., Garimella, S., Ramachandran, V., Buadromo, V., Abraham, A.:
Self-organizing data mining for weather forecasting. In: IADIS European Conference Data
Mining (2007)
28. Refonaa, J., Lakshmi, M., SrinivasaRao, R.S.S., Prasad, E.: Rainfall prediction using genetic
algorithm. Int. J. Recent Technol. Eng. (IJRTE) 8(2S3) (2019). ISSN 2277-3878
29. Shabri, A., Samsudin, R.: A hybrid GMDH and Box-Jenkins models in time series forecasting.
Appl. Math. Sci. 8(62), 3051–3062 (2014)
30. Suparta, W., Samah, A.A.: Rainfall prediction by using ANFIS times series technique in
South Tangerang, Indonesia. Elsevier Geodesy Geodyn. 11, 411–417 (2020)
31. Tamura, H., Kondo, T.: Revised GMDH algorithm using prediction sum of squares (PSS) as
a criterion for model selection. Trans. Soc. Instrum. Control Eng. 14(5), 519–524 (1978)
32. Tauser, J., Buryan, P.: Exchange rate predictions in international financial management by
enhanced GMDH algorithm. Prague Econ. Papers 20(3), 232–249 (2011)
33. Teng, G., Xiao, J., He, Y., Zheng, T., He, C.: Use of group method of data handling for
transport energy demand modeling. Energy Sci. Eng. 5(5), 302–317 (2017)
34. Ugrasen, G., Ravindra, H.V., Prakash, G.N., Keshavamurthy, R.: Estimation of machining
performances using MRA, GMDH and artificial neural network in wire EDM of EN-31.
Procedia Mater. Sci. 6, 1788–1797 (2014)
35. Varahrami, V.: Good prediction of gas price between MLFF and GMDH neural network. Int.
J. Finance Acc. 1(3), 23–27 (2012)
36. Wu, J., Zhou, J.: Support vector regression based on particle swarm optimization and projection pursuit technology for rainfall forecasting. In: 2009 International Conference on
Computational Intelligence and Security (2009)
37. Zhang, G.P.: Time series forecasting using a hybrid ARIMA and neural network model.
Neurocomputing 50, 159–175 (2003)
Detecting Public Outlook Towards Vaccination
Using Machine Learning Approaches:
A Systematic Review
Sheikh Md. Hanif Hossain
and Suriani Sulaiman(B)
Department of Computer Science, International Islamic University Malaysia (IIUM),
Kuala Lumpur, Malaysia
ssuriani@iium.edu.my
Abstract. Vaccination is an effective measure to prevent the spread of harmful
diseases. The prevalence towards vaccine hesitancy, however, has been growing
throughout the years and expressed openly in various social media platforms.
Research works on automating the detection of public’s opinion towards vaccination in social media has recently gained significant popularity with the rise of
the COVID-19 pandemic. This paper presents a systematic review on the machine
learning approaches used by researchers to detect the inclination of the public
towards vaccination. We analyzed the research work conducted within the past
five years and summarized their findings. Our systematic review reveals that Support Vector Machine is the most widely used machine learning technique in identifying public sentiment towards vaccination producing the best performance with
an F1-score of 97.3, while Twitter is found to be the most popular platform for
extracting source of data.
Keywords: Machine learning · Vaccine hesitancy · Anti-vaccine · Deep
learning · Ensemble learning · Vaccine sentiment detection
1 Introduction
Negative outlook towards vaccination such as vaccine hesitancy or anti-vaccination can
lead a country or a society towards greater risks of pandemic. The recent outbreak of
the COVID-19 pandemic manifests the importance of getting vaccinated to lower the
risks of infections. Over the past decades, a variety of vaccines have been developed
and proven to be very successful to cure diseases. However, there is a growing group of
individuals who perceive vaccination as unsafe and unnecessary, either due to political
gains, cultural, psychosocial, spiritual and cognitive factors [1, 2] or personal preference
and doubts [3].
Vaccine misinformation and hesitancy are spreading over social media at a tremendously fast pace which leads to more individuals openly demonstrating negative sentiments towards vaccination [4]. It is thus crucial to stop the influence of vaccine related
misinformation and hesitancy on majority of the public through social media, that may
further develop as healthcare threats in countering diseases that can be safely prevented
© The Author(s), under exclusive license to Springer Nature Switzerland AG 2022
F. Saeed et al. (Eds.): IRICT 2021, LNDECT 127, pp. 141–150, 2022.
https://doi.org/10.1007/978-3-030-98741-1_13
142
S. Md. H. Hossain and S. Sulaiman
through vaccine intakes. Research communities are actively working on this issue to
find efficient ways to prevent such spreading [5, 6].
Many machine learning approaches have been proposed to detect anti-vaccines [7]
and vaccine misinformation in social media [8, 9]. Some of them are very promising
and can be implemented in real life to prevent the spread of misinformation regarding
vaccines. However, a systematic review for the detection of vaccine misinformation
and hesitancy using machine learning approaches can help researchers to identify the
current research gaps and possible areas of improvement in this field. For these reasons,
we conducted a systematic review to investigate the types of machine learning algorithms
used in the detection of public outlook towards vaccination, their efficiency in detecting
vaccine hesitancy, the platforms in which the data are collected and ways to improve
current approaches. The main contributions of this systematic review are as follows:
1. A source of reference for more accurate and recent information on previously implemented machine learning approaches for the detection of public outlook towards
vaccination.
2. A guide for researchers to make better research decisions in terms of choosing
suitable machine learning models and data sources for vaccine hesitancy detection.
The rest of this article is organized as follows; Sect. 2 outlines the theoretical background of the study, Sect. 3 describes the systematic review process, Sect. 4 provides
the summary of results while Sect. 5 concludes the review and proposes future works.
2 Theoretical Background
Vaccination is crucial for us as it protects us from serious diseases like Diphtheria,
Hepatitis and COVID-19. However, there have been many negative sentiments towards
vaccination since the time the vaccine was invented. Some of them relate to vaccine hesitancy, vaccine misinformation and anti-vaccination. WHO defines vaccine hesitancy
as a “delay in acceptance or refusal of vaccines despite availability of vaccination services” [10]. Vaccine misinformation refers to the propagation of misinformation about a
vaccine without having fundamental understanding about it. Anti-vaccine means someone, or some groups, who decides to simply refuse vaccination for some reasons which
may include political gains. All these negative sentiments regarding vaccination are
circulating rapidly through social media.
Machine learning (ML) refers to an algorithm which learns based on examples. Deep
learning (DL) is a branch of machine learning which utilizes more advanced algorithms
to learn from the examples. Both ML and DL are being used in computer related classification problems such as image classification, text classification and hate speech detection
[11]. Deep learning has recently been gaining popularity among research communities.
Many researchers are trying to detect vaccine misinformation by using this method.
Detecting Public Outlook Towards Vaccination
143
3 Systematic Review
When developing machine learning algorithms, researchers often look for current implementation and data sources in the field. The right selection of algorithms and data is
crucial for successful research. This systematic review has the following goals:
1. To identify state-of-the-art machine learning algorithms for detecting vaccine
hesitancy and misinformation.
2. To identify the data sources that have been used for the detection of public outlook
towards vaccination.
3. To suggest future improvement for research work in vaccine hesitancy detection
based on machine learning methods.
This systematic review has one restriction. We decided to include peer-reviewed
scientific research work which has explicit and comprehensive implementation of
machine learning algorithms. Hence, general studies or descriptive analyses without ML
implementations are excluded. This review testifies the following research questions:
1. RQ1: What are the most used machine learning algorithms for detecting vaccine
hesitancy and misinformation?
2. RQ2: What is the source of data used to train the machine learning model?
To examine RQ1, we have gathered all the related papers and the algorithms that
are being used to detect public outlook towards vaccination using machine learning
approaches. Based on the frequency of the algorithm used, we determine the most popular
algorithm. As for RQ2, we compare the type of data being used versus the accuracy of the
algorithm. After we have selected the related papers based on specific search queries and
exclusion criteria discussed below, a summarization of the papers is done by reviewing
the paper carefully from beginning to end. To keep our systematic review solid, we come
up with the following exclusion criteria:
1. EC1: Publications must have been published in indexed journals or indexed
conference proceedings and they must be peer reviewed.
2. EC2: Publications must contain research work on machine learning algorithms.
3. EC3: Publications must be in English and unique (i.e., published only once). For
repeated copies of a publication, only one copy is preserved.
4. EC4: Publications must be published within the past 5 years from the year of
systematic review.
Vaccine hesitancy and resistance have been described in various terms. Some authors
like to use the term “anti-vaccination”, “anti-vaccine”, “vaccine hesitancy” or “vaccine
misinformation”. The term machine learning is found to appear together with closely
related methods such as “deep learning”, “ensemble learning” and “transfer learning”.
Thus, our systematic review has the following search criteria:
144
S. Md. H. Hossain and S. Sulaiman
• TITLE-ABS-KEY ((vaccine OR vaccination OR anti-vaccination OR vaccine hesitancy OR vaccine resistance) AND (machine learning OR deep learning OR ensemble
learning OR transfer learning))
This search query returns vaccine related papers which contain the term ‘machine
learning’ and ‘vaccine’ in the title, abstract or keywords. After we applied the search
terms in google scholar, Scopus, MDPI, Elsevier and IEEE databases, we downloaded
the papers by reading the titles and the abstracts. The total number of downloaded papers
is 31 and after applying the exclusion criteria (EC) mentioned above, only 13 papers
were retained for the final systematic review. The summary of all the final papers is
presented in the following section. We organize the summary of the papers into three
categories; machine learning based model, deep learning based model and ensemble
learning based model.
3.1 Machine Learning Models
Using machine learning to compare pro-vaccine and anti-vaccine discourse among the
public on social media was proposed by [12]. [12] categorized vaccine related tweets
into three; pro-vaccine, anti-vaccine and neutral. A logistic regression model was used
and achieved an F1-score of 95.7. Similar study was conducted by [13]. Tweets related
to measles, mumps, and rubella (MMR) vaccines were collected and classified into three
categories: pro-vaccine, anti-vaccine and neutral. Several supervised machine learning
models were trained. Among them, the support vector machine (SVM) performed the
best with an F1-score of 73.13 on the test dataset.
An automated classification of web pages about early childhood vaccination using
supervised machine learning was discussed in [14]. Webpages were manually classified
as reliable or not reliable and a naïve bayes classifier was trained. The model achieved
an overall F1-score of 88.0.
A project called MAVIS [15] aimed to study the social media sentiments published in
Spanish language on disease and vaccination. Data was collected from Twitter and Instagram and trained with a random forest model. By applying the SMOTE method to balance
the dataset, the best accuracy was an ROC of 85.1. Almost identical research was conducted by [16] in which the researchers conducted sentiment analysis on Human Papillomavirus (HPV) vaccine related tweets using machine learning. 6,000 HPV vaccines
related tweets were manually annotated and trained with support vector machine (SVM)
algorithms. An F1-score of 74.42 was achieved with an optimized feature set. Another
similar approach was proposed to identify vaccine hesitancy in social media by [17].
The dataset spanning approximately 8 years from 1 June 2011 to 30 April 2019 consists
of 1,499,227 vaccine-related tweets published on Twitter. A support vector machine
(SVM) was trained using the dataset and the model achieved 85% accuracy on the test
set. Further analysis from the dataset showed that the number of negative and positive
tweets was increasing over time while the number of neutral tweets was decreasing.
Detecting Public Outlook Towards Vaccination
145
3.2 Deep Learning Models
Public outlook towards vaccination was analyzed using twitter data by [18]. At first, the
authors classified tweets into two groups; relevant and not relevant. The relevant tweets
were then further categorized into pro-vaccination, anti-vaccination and neutral outlook.
The neural network model’s performance was the best in terms of classifying vaccine
outlook with an F1 score of 58.0. Sentiment analysis was performed on related tweets
for HPV vaccine using transfer learning [19]. Among the previously compared models,
the fine-tuned Bidirectional Encoder Representations from Transformers (BERT) model
performed the best in analyzing vaccine sentiments with an average F1 score of 76.9.
Identification of anti-vaccination tweets using machine learning was proposed by
[20] and [21] during COVID-19 pandemic. Several machine learning and deep learning
models were trained and evaluated using twitter dataset. The performance of the BERT
model with an F1-score of 95.5 was achieved by [20] which was the best compared to
the other models used whereas [21] reported the performance of the BERT model with
an F1-score of 79.2.
The detection of stigmatized behavior towards vaccination using predictive modelling was discussed in [22]. Facebook comments were extracted and categorized into
anti-vaccination and pro-vaccination. Several machine learning models were trained and
tested using the dataset. Among them, the fastText model performed the best with an
average accuracy of 75% to classify anti-vaccine and pro-vaccine related comments.
3.3 Ensemble Learning Models
The use of multimodal deep learning for the detection of medical misinformation on
vaccination was proposed by [23]. In this research, [23] collected the dataset from
Instagram, which consists of images, hashtags as well as text descriptions. The models
have three branches; hashtag branch with word-level feature extractor, text branch with
sentence level feature extractor and an image branch with visual feature extractor. A
semantic and task level attention mechanism layer were used to produce better output of
the model. Each branch was trained with a different deep learning model. An ensemble
model was then produced by adding another branch called the three-branch model which
includes features from all prior three branches. Output of these four-prediction models
were combined as four-dimensional features. Finally, an SVM algorithm with radial
basis function (RDF) kernel was trained with these four features. The ensemble model
achieved an F1-score of 97.3.
Vaccination behavior detection involves prediction of a person who received or was
about to receive a vaccine. To detect vaccination behavior, an ensemble-based machine
learning method, rule-based method and a deep learning method were proposed by [24].
The ensemble machine learning method consists of three algorithms; logistic regression, support vector machine and random forest. Tweets from twitter were used as the
source of data. A tweet identified to be positive must be classified as positive by at
least two classifiers. The F1-score for this method was reported to be 80.75. In the rulebased approach, if a tweet contains certain positive keywords (e.g., give, take, gave,
receive), the tweet was classified as positive. Otherwise, it was classified as negative.
146
S. Md. H. Hossain and S. Sulaiman
F1-score of 40.84 was achieved for this method. Five deep learning models such as sentence vector, dense neural network, Bidirectional Long Short-term Memory (BiLSTM),
Convolutional Neural Network (CNN) and Long Short-term Memory Language Model
(LSTM-LM) were trained separately to identify vaccination behaviors. Among these
deep learning models, LSTM-LM performed the best with an F1- score of 80.87.
4 Systematic Review Results
Table 1 summarizes the findings of our systematic literature review. For research papers
with comprehensive analysis, we include only one machine learning model per research
if there were more than one machine learning models being evaluated. The following
criteria are taken into considerations while selecting the model for each research:
• The model which produced the best performance among other models.
• The model that was implemented to detect public outlook or sentiment.
Table 1. Summary of findings on the use of machine learning approaches in the detection of
public outlook towards vaccination in the order of the most recent year of publications.
Ref.
Year
Model
Best performance
Data source
Related vaccine
[12]
2021
Logistic Regression
F1-score: 95.7
Twitter
Multiple/general
[14]
2021
Naïve Bayes
F1-score: 88
Webpage
Multiple/general
[17]
2021
SVM
Accuracy: 85
Twitter
Multiple/general
[23]
2021
SVM
F1-score: 97.3
Instagram
Multiple/general
[20]
2021
BERT
F1-score: 95.5
Twitter
COVID-19
[21]
2021
BERT
F1-score: 79.2
Twitter
COVID-19
[15]
2020
Random Forest
ROC: 85.1
Twitter
Multiple/general
[19]
2020
BERT
F1-score: 76.9
Twitter
HPV
[18]
2019
Neural Network
F1-score: 58
Twitter
Multiple/general
[24]
2019
LSTM-LM
F1-score: 80.87
Twitter
COVID-19
[22]
2019
fastText
Accuracy: 75
Facebook
Multiple/general
[13]
2018
SVM
F1-score: 73.13
Twitter
Multiple/general
[16]
2017
SVM
F1-score: 74.42
Twitter
HPV
This systematic review focuses on discussing the machine learning models used to
detect public outlook towards vaccination, the performance of the models and the sources
of collected data. After reviewing each paper in detail, we have come up with several
insights which are reported in the figures that follow.
Figure 1 demonstrates the frequency of machine learning models used to detect the
public outlook towards vaccination as described in the reviewed papers. SVM was found
to be the most frequently used machine learning model followed by BERT.
Detecting Public Outlook Towards Vaccination
147
Fig. 1. Frequency of machine learning models used in the detection of public outlook towards
vaccination.
In terms of the performance, SVM was also found to be the model that achieved the
highest score in terms of accuracy and F-measure. Text classification problems usually
have high dimensional feature spaces and are linearly separable [25]. SVM has overfitting
protection and can find linear separators very easily, thus the SVM model performs the
best in detecting public outlook from textual data. Figure 2 illustrates the performance
of the models used in the reviewed literatures in the detection of public outlook towards
vaccination. Both Figs. 1 and 2 answered our RQ1.
Fig. 2. The best performance scores of the different machine learning models used in the detection
of public outlook towards vaccination
148
S. Md. H. Hossain and S. Sulaiman
Figure 3 demonstrates that Twitter is the most widely used social media platform
by researchers in extracting the data source for the detection of public outlook through
machine learning approaches. Figure 3 answered our RQ2.
Fig. 3. Data sources from social media platforms for analyzing public outlook towards vaccination
Figure 4 illustrates the mostly studied types of vaccine for detecting public views
towards vaccination using machine learning approaches. Three studies, [20, 21, 24]
specifically focused on COVID-19 vaccine while two more studies, [16, 19] focused on
the HPV vaccine. The rest of the studies discussed other types of vaccines such as MMR
or various other vaccines in general.
Fig. 4. Number of research conducted per vaccine type
5 Conclusion
An effective machine learning model is required to accurately detect the public outlook
towards vaccination on social media which can be a great contribution to the entire healthcare system in battling vaccine hesitancy. From this systematic review, we can sense that
Detecting Public Outlook Towards Vaccination
149
deep learning and ensemble-based models perform better than classical machine learning models. Incorporating image and hashtag information into the training data can be
useful to achieve better accuracy. However, more research work is required in deep
learning and ensemble methods along with image and hashtag information to detect
public outlook. Further improvements to the current machine learning implementations
in this field can also be done by including data from multiple sources to train the model.
Machine learning models with multiple data sources from various social media platforms
of diverse input types, are expected to perform and generalize better with reduced bias,
beside presenting more meaningful insights. Integrating emotional features expressed in
texts extracted from the inherently dynamic nature of social media may also add more
significant features in improving classification performance and model accuracy.
References
1. Kennedy, J.: Populist politics and vaccine hesitancy in Western Europe: an analysis of nationallevel data. Eur. J. Publ. Health 29(3), 512–516 (2019). https://doi.org/10.1093/eurpub/ckz004.
PMID: 30801109
2. Dube, E., Laberge, C., Guay, M., Bramadat, P., Roy, R., Bettinger, J.: Vaccine hesitancy: an
overview. J. Hum. Vaccines Immunotherapeutics 9(8), 1763–1773 (2013)
3. Pullan, S., Dey, M.: Vaccine hesitancy and anti-vaccination in the time of COVID-19: a Google
trends analysis. Vaccine 39(14), 1877–1881 (2021). https://doi.org/10.1016/j.vaccine.2021.
03.019
4. Muric, G., Wu, J., Ferrara, E.: COVID-19 vaccine hesitancy on social media: building a public
Twitter dataset of anti-vaccine content, vaccine misinformation and conspiracies, May 2021.
http://arxiv.org/abs/2105.05134
5. Ruiz, J.B., Featherstone, J.D., Barnett, G.A.: Identifying vaccine-hesitant communities on
Twitter and their geolocations: a network approach. In: Proceedings of the 54th Hawaii
International Conference on System Sciences, pp. 3964–3969. HICSS, Hawaii (2021)
6. Yousefinaghani, S., Dara, R., Mubareka, S., Papadopoulos, A., Sharif, S.: An analysis of
COVID-19 vaccine sentiments and opinions on Twitter. Int. J. Infect. Dis. 108, 256–262
(2021). https://doi.org/10.1016/j.ijid.2021.05.059
7. Garay, J., Yap, R., Sabellano, M.J.: An analysis on the insights of the anti-vaccine movement
from social media posts using k-means clustering algorithm and VADER sentiment analyzer.
In: IOP Conference Series: Materials Science and Engineering, vol. 482, no. 1 (2019). https://
doi.org/10.1088/1757-899X/482/1/012043
8. Kwok, S.W.H., Vadde, S.K., Wang, G.: Tweet topics and sentiments relating to COVID-19
vaccination among Australian Twitter users: machine learning analysis. J. Med. Internet Res.
23(5), e26953 (2021). https://doi.org/10.2196/26953
9. Du, J., et al.: Use of deep learning to analyze social media discussions about the Human
Papillomavirus Vaccine. JAMA Netw. Open 3(11), e2022025 (2020). https://doi.org/10.1001/
jamanetworkopen.2020.22025
10. MacDonald, N.E.: Vaccine hesitancy: definition, scope and determinants. Vaccine 33(34),
4161–4164 (2015)
11. Salur, M.U., Aydin, I.: A novel hybrid deep learning model for sentiment classification. IEEE
Access 8, 58080–58093 (2020). https://doi.org/10.1109/ACCESS.2020.2982538
12. Argyris, Y.A., Monu, K., Tan, P.-N., Aarts, C., Jiang, F., Wiseley, K.A.: Using machine
learning to compare provaccine and antivaccine discourse among the public on social media:
algorithm development study. JMIR Publ. Health Surveill. 7(6), e23105 (2021). https://doi.
org/10.2196/23105
150
S. Md. H. Hossain and S. Sulaiman
13. Yuan, X., Crooks, A.T.: Examining online vaccination discussion and communities in Twitter.
In: ACM International Conference Proceeding Series, pp. 197–206 (2018). https://doi.org/
10.1145/3217804.3217912
14. Meppelink, C.S., Hendriks, H., Trilling, D., Van Weert, J.C.M., Shao, A., Smit, E.S.: Reliable
or not? An automated classification of webpages about early childhood vaccination using
supervised machine learning. Patient Educ. Couns. 104(6), 1460–1466 (2021). https://doi.
org/10.1016/j.pec.2020.11.013
15. González, A.R., et al.: Creating a metamodel based on machine learning to identify the
sentiment of vaccine and disease-related messages in Twitter: the MAVIS study. In: IEEE 33rd
International Symposium on Computer-Based Medical Systems (CBMS), vol. 1, pp. 245–250
(2020). https://doi.org/10.1109/CBMS49503.2020.00053
16. Du, J., Xu, J., Song, H., Liu, X., Tao, C.: Optimization on machine learning based approaches
for sentiment analysis on HPV vaccines related tweets. J. Biomed. Semant. 8(1), (2017).
https://doi.org/10.1186/s13326-017-0120-6
17. Piedrahita-Valdés, H., et al.: Vaccine hesitancy on social media: sentiment analysis from June
2011 to April 2019. Vaccines 9(1), 1–12 (2021). https://doi.org/10.3390/vaccines9010028
18. Baru, C.: Analyzing public outlook towards vaccination using Twitter. Inst. Electr. Electron.
Eng. IEEE Comput. Soc. (2019)
19. Zhang, L., Fan, H., Peng, C., Rao, G., Cong, Q.: Sentiment analysis methods for HPV vaccines
related tweets based on transfer learning. Healthcare 8(3), 307 (2020). https://doi.org/10.3390/
healthcare8030307
20. To, Q.G., et al.: Applying machine learning to identify anti-vaccination tweets during the
covid-19 pandemic. Int. J. Environ. Res. Publ. Health 18(8), 4069 (2021). https://doi.org/10.
3390/ijerph18084069
21. Liu, S., Li, J., Liu, J.: Leveraging transfer learning to analyze opinions, attitudes, and behavioral intentions toward COVID-19 vaccines: social media content and temporal analysis. J.
Med. Internet Res. 23(8), e30251 (2021)
22. Straton, N., Ng, R., Hyeju, J., Vatrapu, R.K., Mukkamala, R.R.,: Predictive modelling of stigmatized behaviour in vaccination discussions on Facebook. In: IEEE International Conference
on Bioinformatics and Biomedicine (BIBM) (2019)
23. Wang, Z., Yin, Z., Argyris, Y.A.: Detecting Medical misinformation on social media using
multimodal deep learning. IEEE J. Biomed. Health Inform. 25(6), 2193–2203 (2021). https://
doi.org/10.1109/JBHI.2020.3037027
24. Joshi, A., Dai, X., Karimi, S., Sparks, R., Paris, C., MacIntyre, C.R.: Shot or not: Comparison
of NLP approaches for vaccination behaviour detection. In: Proceedings of the 2018 EMNLP
Workshop SMM4H: The 3rd Social Media Mining for Health Applications Workshop and
Shared Task, pp. 43–47. Association for Computational Linguistics, Brussels (2019). https://
doi.org/10.18653/v1/w18-5911
25. Joachims, T.: Text categorization with support vector machines: Learning with many relevant
features. In: Nédellec, C., Rouveirol, C. (eds.) ECML 1998. LNCS (LNAI), vol. 1398, pp. 137–
142. Springer, Heidelberg (1998). https://doi.org/10.1007/BFb0026683
Forecasting Carbon Dioxide Emission
for Malaysia Using Fractional Order
Multivariable Grey Model
Assif Shamim Mustaffa Sulaiman1(B) , Ani Shabri1 , and Rashiq Rafiq Marie2
1 Department of Mathematical Science, Faculty of Science, Universiti Teknologi Malaysia,
Skudai, Malaysia
assifshamim@graduate.utm.my, ani@utm.my
2 Information System Department, College of Computer Science and Engineering, Tahibah
University, Medina, Kingdom of Saudi Arabia
Abstract. Forecasting the amount of carbon dioxide (CO2 ) emissions has been
crucially important to the civilisation of society to ensure that we can inhabit this
planet in years to come. Hence, the study that focuses on the prediction on the
amount of CO2 releases into the environment has always been the focal point in
any international level climate change conferences to ensure the target set would be
considerably reached in the future. As the conventional multivariable grey model
or GM (1,N) model has widely been used in the study to forecast short-term
sample size data, this model possessed issues when dealing with prioritization of
information as the weightage was evenly spread across all data points, causes an
ineffective forecasting result. This study will use the fractional order multivariable
grey model, or FAGM (1,N) model to predict the amount of CO2 emissions for
Malaysia within the 10 years timeframe data set. As the FAGM (1,N) model
focuses on the prioritization of newer information, the proposed model will be
able to forecast the CO2 emissions better compared to the GM (1,N) model even
with a small sample size data.
Keywords: Carbon dioxide emissions · Short-term forecast · Fractional order
multivariable grey model
1 Introduction
The term “grey” in the grey system theory often deals with incomplete and uncertain data,
which frequently has a small sample size [1]. With the monotonic addition property that
permits data to be built up the system, as well as the ease of use mechanism, it is evident
that researchers would employ this method when dealing with any type of short-term
data for forecasting purposes [2]. The grey forecasting model has been widely used in a
range of sectors to undertake short-term forecasts, ranging from demographic type data
[3], to forecasting environmentally impacted data [4–7]. As a result, the grey forecasting
model has been proven to be a useful tool for forecasting.
© The Author(s), under exclusive license to Springer Nature Switzerland AG 2022
F. Saeed et al. (Eds.): IRICT 2021, LNDECT 127, pp. 151–159, 2022.
https://doi.org/10.1007/978-3-030-98741-1_14
152
A. S. M. Sulaiman et al.
The capacity to weigh and distribute the value of information evenly from the accumulation generating coefficient (AGO) process is one of the notable benefit when applying the grey forecasting model. However, it’s also vital to remember that the system’s
newer sets of data should be given more weight than the older data that the standard GM
(1,1) model is not capable of. The rolling mechanism introduced by Chang et al. able
to restructure the forecast ability when the newest information replaces the oldest information in the system [8, 9]. Though the contribution of the research brings a significant
impact on the grey forecasting model, however, the process is strenuous. As a result,
fractional order accumulation, an enhanced variation of grey forecasting model, may
reflect the importance of newer information in the system, and will be studied further in
this paper.
The fractional order form of grey forecasting model, better known as the FAGM (1,1)
model, was introduced by Wu et al. [10]. It replaces the typical one-order AGO (1-AGO)
process in the GM (1,1) model with a fractional order accumulation (r th -order accumulated generating sequence). The FAGM (1,1) model’s two main ideas are information
disparities and the prioritization of newer information. Firstly, newer information should
be considered differently than older information, and each piece of information in the
system will be evaluated differently if the r th -order accumulation generating sequence
is used. Second, newer information will be prioritized over older information by giving
newer information more weight, which will minimize primitive sequence randomness
and increase the model’s forecast accuracy significantly.
Many academics have used the FAGM (1,1) model in their research, and the findings
have been positive when compared to the classic GM (1,1) model. Wang et al. employed
the FAGM (1,1) model to investigate gear fault trend prediction [11]. The results strongly
suggest that the FAGM (1,1) model outperformed other commonly used forecasting
models model in terms of model error. Another study by Sahin & Sahin looked at
the number of confirmed COVID-19 cases in three major nations by implementing the
FANGBM (1,1) model, which is a nonlinear grey Bernoulli variant of FAGM (1,1) [12].
This study’s in-sample employs a 35-day daily case range and forecasts the following
30 days. The FANGBM (1,1) model gave the lowest MAPE, RMSE, and model errors
values when compared to the GM (1,1) and NGBM (1,1) models.
We will now look into specific studies that use the FAGM (1,1) model to forecast
CO2 emissions related data. Based on the proposed novel FAGM (1,1) model by Wu
et al., the authors use the FAGM (1,1) model to investigate Taiwan’s CO2 emissions
data [10]. The result reveals that when the r value for the FAGM (1,1) model is 0.1
(for r th -order accumulation generating sequence), the FAGM (1,1) model produced the
lowest MAPE value for in-sample data, suggesting that with suitable r value, the better
the fitting error of the GM (1,1). They further analysed the model with different r values
and discovered that it yielded low MAPE values for both the in-sample and out-sample.
This shows that the overall amount of CO2 emissions for each subsequent year has a
close link, as evidenced by the strong correlation in the grey system.
There are a few studies on the CO2 emissions forecast that attempted to enhance
the current FAGM (1,1) model. A study to analysed China’s CO2 emissions from 1999
to 2012, Gao et al. presented the discrete FAGM (1,1) model called FAGM (1,1,D)
[13]. The fractional accumulation value in the FAGM (1,1) model is optimised using a
Forecasting Carbon Dioxide Emission for Malaysia
153
technique known as the particle swarm optimization, PSO method. The MAPE value
was used as the optimization objective in the model, while the value of r was used
as the search parameter. According to the findings, both the FAGM (1,1) and FAGM
(1,1,D) models produce low MAPE values, with forecasted values for the next three
years that are practically indistinguishable between the two models when compared to
other conventional grey models.
Next, an optimised FAGM (1,1) model is used to forecast the top 20 nations with the
biggest CO2 emissions contributors. The authors employ the genetic algorithm method,
GA method, to identify the appropriate model parameters rather than the traditional
least squares (OLS) method [14]. The proposed GA-FAGM (1,1) model has various
distinguishing characteristics, including the use of a single variable model as a development basis and fractional order accumulation during control variable determination. In
comparison to existing grey forecasting methods, the suggested GA-FAGM (1,1) model
provided the smallest MAPE value in 11 of the 20 nations studied, demonstrating the
superiority of the FAGM (1,1) model in forecasting emissions related data.
Hence, this research will implement the FAGM (1,N) model to forecast Malaysia’s
CO2 emissions data in order to demonstrate its superiority over the traditional GM (1,N)
model. This paper will be structured as accordingly: The technique of the FAGM (1,N)
model and the usage of assessment metrics will be presented in Sect. 2, and the results
of the models’ performance will be shown in Sect. 3 along with discussions. Finally,
Sect. 4 will bring this paper to a close.
2 Methodology
2.1 Fractional Order Multivariable Grey, FAGM (1,N) Model
The grey forecasting model, which was first developed by Deng, has been widely
employed in a variety of fields, with a large range of grey forecasting models [15]. The
multivariable grey model, also known as the GM (M,N), belongs to the grey forecasting
model family, with M indicating the order’s number and N indicating the variable’s number. This study focuses on the fractional order accumulation form of the grey forecasting
model, often known as the FAGM (1,N) model. As this paper is using the emissions in
Malaysia data, the initial series of the emissions is denoted as
(1)
X (0) = X (0) (1), X (0) (2), X (0) (3), . . . , x(0) (n)
where i = 1, 2, …, N denoting the total variable’s numbers and n denoting data entries
for modelling sets of data. The r th -AGO in Eq. (1) is implemented to give prioritization
of new information by distributing difference weightage among the information of the
system based on the relevancy of information. The new sequence series of X (r) is given
in Eq. (2).
X (r) = X (r) (1), X (r) (2), X (r) (3), . . . , X (r) (n)
(2)
where
x(r) =
k
i=1
x(r−1) (i); k = 1, 2, . . . , n
(3)
154
A. S. M. Sulaiman et al.
The r th -AGO of the initial series, X (0) is denoted as
α (r) X (0) = α (r) x(0) (1), α (r) x(0) (2), . . . , α (r) x(0) (n)
(4)
where
α (r) x(0) (k) = α (r−1) x(0) (k) − α (r−1) x(0) (k − 1)
(5)
and k = 2, …, n.
By assuming the initial series X (0) is a series of non-negative sequence, for r =
1,2,…,n,
X (r) (k) = x(r) (1), x(r) (2), . . . , x(r) (n)
(6)
Equation (6) is denote as the r th -AGO sequence of X (0) , hence we will obtain
k
k − i + r − 1 (0)
x (k) =
x (i), k = 1, 2, . . . , n
k −i
(r)
(7)
i=1
where
k −i+r−1
k −i
=
(k − i + r − 1)(k − i + r − 2) . . . r
(k − 1)!
(8)
As the order of r (0 < r ≤ 1) of X (0) AGO, we have
α (r) X (0) = α (1) X (1−r) (k)
= α (1) X (1−r) (1), . . . , α (1) X (1−r) (n)
(9)
Hence,
x(r−1) (k) + az (r) (k) =
N
bx(r) (k)
(10)
i=2
is the general form of FAGM (1,N) model. The parameter a is denote to as developing
coefficient of the grey system, whereas b is the control variable of the system. When the
r = 1, the FAGM (1,N) model will be simplified to the GM (1,N) model in its traditional
form.
The sequence of z (r) (k)
z (1) = z (1) (2), z (1) (3), z (1) (4), . . . , z (1) (k)
(11)
is referred as the mean equation from Eq. (2), as shown in Eq. (12)
z (1) (k) = ωx(1) (k) + (1 − ω)x(1) (k − 1)
(12)
Forecasting Carbon Dioxide Emission for Malaysia
155
where conventionally the value of ω = 0.5.
The FAGM (1,N) model uses the ordinary least square (OLS) method to calculate
both parameters a and b using Eq. (13).
−1
T
BT YN
(13)
[a,b] = BT B
where.
⎡
⎤
⎡ (r−1) ⎤
(r)
(r)
−z (r) (2) x2 (2) . . . xN (2)
x
(2)
⎢ (r)
⎥
(r)
(r)
(r−1)
⎢
x
(3) ⎥
⎢ −z (3) x2 (3) . . . xN (3) ⎥
⎥
⎥, and Y = ⎢
B=⎢
⎢
⎥
.
.
.
.
..
⎢
⎥
.
.
.
.
⎣
⎦
.
.
⎣
.
.
. ⎦
(r)
(r)
(14)
x(r−1) (n)
−z (r) (n) x2 (n) . . . xN (n)
Let
â = [a, b1 , b2 , ..., bN ]T = (BT B)−1 BT Y
dx
(1)
(1)
the whitenization solution of FAGM (1,N) model for equation dt1 + ax1
N
(1) is
i=2 bx
N
N
(1)
−at
(1)
at
(1)
(1)
bx (t)e + x (0) −
b x (0)dt
x (t) = e
=e
−at
i=2
i=2
(1)
x1 (0) − t
N
bx
(1)
(0) +
i=2
N
bx
=
(1)
at
(t)e dt
(15)
i=2
(1)
The forecasted values of the series point Xi from r th -AGO is expressed as
N
N
1 (1)
1 (1)
(0)
(0)
b x (k + 1) e−at +
b x (k + 1)
x̂1 (k + 1) = x1 −
a
a
i=2
(16)
i=2
(1)
(0)
where value of X1 (0) takes on the value of X1 (1).
Lastly, the restored values of inverse accumulation of FAGM (1,N) model is
(0)
(1)
(1)
x̂1 (k + 1) = x̂1 (k + 1) − x̂1 (k)
(17)
2.2 Forecast Accuracy Measurement
The mean absolute percentage error (MAPE), which measures the proximity between
the actual and forecasted values, is the accuracy precision measurement used to evaluate
the performance of the proposed FAGM (1,N) model, using Eq. (18).
1 (x̂(1) − x(0) )
(18)
MAPE =
× 100%
m
x(0)
The number of observations of the system is denoted by m. In conclusion, we may
conclude that the smaller the value of MAPE, the higher the level of accuracy of the
proposed model.
156
A. S. M. Sulaiman et al.
2.3 Conceptual Framework
A conceptual framework depicts the cause-and-effect relationship for the task in question, which was carried out to meet the research objectives depicted in Fig. 1. This
paper is initiated by the data collection process of CO2 emissions, population, Gross
Domestic Product (GDP), and energy consumption. Next, we will begin the process of
model building by performing the calculation of FOA method, or r th -order AGO using a
pre-determined ω value of 0.5 into the GM (1,N) model. The step taken to search for the
optimal r value, the value of MAPE of modelling will serve as the objective of this study.
When we have found the best MAPE value, we will use the r value into the FAGM (1,N)
model to forecast, and the error forecast will be recorded. A new set of forecasted value
using the proposed FAGM (1,N) model is obtained and compared against the traditional
multivariable grey model, GM (1,N) model.
Fig. 1. Conceptual framework flowchart
Forecasting Carbon Dioxide Emission for Malaysia
157
3 Result and Discussion
This paper uses the data for CO2 emissions in Malaysia, with subsequent factors such as
population, GDP, and energy consumption from the year 2010 to 2019. The data for CO2
emissions and energy consumption are extracted from the International Energy Agency
(IEA), whereas population and GDP are extracted from World Bank Data. To validate
the proposed models, data from 2010 to 2016 will serve as the testing set of data while
the remaining subsequent 3 years will be for the forecasting purpose.
Table 1. Original Malaysia’s CO2 Emissions data from year 2010 to 2019
Year
Carbon dioxide
emissions (Mt)
Population (million
people)
GDP (million USD)
Energy consumption
(Mtoe)
2010
189.9
28.2
225,017
24.0
2011
191.5
28.7
297,952
23.6
2012
192.8
29.1
314,443
24.1
2013
208.7
29.5
323,277
28.1
2014
220.2
29.9
338,062
29.3
2015
220.2
30.3
301,355
27.5
2016
216.3
30.7
301,255
28.3
2017
210.8
31.1
319,112
28.9
2018
228.0
31.5
358,715
28.3
2019
236.6
31.9
364,681
29.5
Table 1 above depicts the original Malaysia’s CO2 emissions along with its subsequent variables. This paper will demonstrate the effectiveness of implementing the
FAGM (1,4) model against the conventional GM (1,4) model for comparison. Using
(r)
Eq. (1), we will denote the Malaysia’s CO2 emissions as x1 and its subsequent vari(r)
(r)
ables will be denoted as x2 . . . x4 . The values for r are non-negative within the range of
th
0.1 to 2, which reflects the r -order accumulated generating sequence using the FAGM
(1,4) model. Both GM (1,4) and FAGM (1,4) models use the OLS method to calculate
the parameters for both equations, using Eq. (13). The values of parameters for both
models are shown in Table 2 below.
Table 2. Parameter’s values for GM (1,4) and FAGM (1,4) models
Parameters
GM (1,4)
FAGM (1,4)
a
1.8197
1.9370
b2
3.7931
7.3467
b3
−0.0001
0.0002
b4
5.0546
5.3378
158
A. S. M. Sulaiman et al.
The value of r selected for this paper is 0.9. The selection of the r value is determined by setting the MAPE as the optimization objective and r as the search parameter.
Essentially, the value of r shall be used when the MAPE value prompted is the smallest.
Hence, Table 3 displays the forecasted values for both the GM (1,4) and FAGM (1,4)
models. The MAPE values for FAGM (1,4) model outperform the GM (1,4) model by
showcasing a smaller value, 2.72% against GM (1,4) model which is 5.33%. This can be
achieved as the r th - order accumulated generating sequence in the FAGM (1,4) is able
to transform the values in the data to prioritize the newer information compared to the
older information by applying more weightage on newer information. As a result, the
authors conclude that the FAGM (1,4) model is superior to the GM (1,4) model. Figure 1
below illustrates the graph of actual versus the forecasted values of CO2 emissions in
Malaysia.
Table 3. Forecasted values for GM (1,4) and FAGM (1,4) models
Year
Original values
GM (1,4)
2010
189.9
189.9
189.9
2011
191.5
168.0
174.2
2012
192.8
214.6
219.1
2013
208.7
220.8
222.4
2014
220.2
220.8
224.2
2015
220.2
216.5
216.5
2016
216.3
221.6
219.8
2017
210.8
223.8
6.14%
224.3
6.41%
2018
228.0
217.4
4.66%
227.6
0.20%
2019
236.6
224.3
5.20%
232.9
1.55%
Forecasted values
MAPE (%)
FAGM (1,4)
APE (%)
5.33%
Forecasted values
APE (%)
2.72%
4 Conclusion
The primary goal of this work is to demonstrate that using the FAGM (1,N) model to
undertake a short-term forecast based on CO2 emissions data is superior. The criteria
that set apart between the GM (1,N) model with FAGM (1,N) model is its ability to
prioritize new information that is better reflected with the r th -order accumulated generating sequence when the in-sample size of the data is small. To minimize the MAPE
values for the FAGM (1,N) model, the MAPE will serve as the optimization objective
with the r act as the search parameter. Upon determining the most suitable r value, it
can be used to forecast and compare against the conventional GM (1,N) model. The
indication of MAPE value proved that FAGM (1,4) model is the better model used to
Forecasting Carbon Dioxide Emission for Malaysia
159
forecast Malaysia’s CO2 emissions data. With these hints, it may be served as guidelines
for us on what are the effects of global warming, and the increase of the number of
CO2 emissions into the environment may harm the future generations to have a safe
and conducive living place to inhabit. As we approach a tipping point of no return that
will catastrophe our chances of surviving on this planet, more actions and initiatives
should be implemented from all sectors to ensure a promising land for the next decades
incoming.
References
1. Xiao, L., Wang, H., Duan, M.: The optimization of grey model GM (1,1) based on posterior
error. In: 2020 5th International Conference on Control Robot cybernetics CRC 2020, pp. 87–
91
2. Hu, Y.-C.: Energy demand forecasting using a novel remnant GM(1,1) model. Soft. Comput.
24(18), 13903–13912 (2020). https://doi.org/10.1007/s00500-020-04765-3
3. Ma, L., Li, J., Zhao, Y.: Population forecast of China’s rural community based on CFANGBM
and improved aquila optimizer algorithm, 1–30 (2021)
4. Qian, W., Sui, A.: A novel structural adaptive discrete grey prediction model and its application
in forecasting renewable energy generation. Expert Syst. Appl. 186, 115761 (2021)
5. Duan, H., Liu, Y.: Research on a grey prediction model based on energy prices and its
applications. Comput. Ind. Eng. 162, 107729 (2021)
6. Xiong, P., Li, K., Shu, H., Wang, J.: Forecast of natural gas consumption in the Asia-Pacific
region using a fractional-order incomplete gamma grey model. Energy 237, 121533 (2021)
7. Zhao, Y.-F., Wang, Z.-X., He, L.-Y.: Forecasting the seasonal natural gas consumption in the
US using a gray model with dummy variables. Appl. Soft Comput. 113, 108002 (2021)
8. Chang, S.C., Lai, H.C., Yu, H.C.: A variable P value rolling grey forecasting model for Taiwan
semiconductor industry production. Technol. Forecast Soc. Change 72, 623–640 (2005)
9. Mustaffa, A.S., Shabri, A.: An improved rolling NGBM(1,1) model with GRG nonlinear
method of optimization for fossil carbon dioxide emissions in Malaysia and Singapore. In:
2020 11th IEEE Control and System Graduate Research Colloquium (ICSGRC 2020), pp
32–37 (2020)
10. Wu, L., Liu, S., Yao, L., Yan, S., Liu, D.: Grey system model with the fractional order
accumulation. Commun. Nonlinear Sci. Numer. Simul. 18, 1775–1785 (2013)
11. Wang, J., Sun, C., Sun, Q., Yan, H.: Gear fault trend prediction based on FGM(1, 1) model.
In: Proceeding of 2017 32nd Youth Academic Annual Conference of Chinese Association of
Automation, YAC 2017, pp. 827–831 (2017)
12. Şahin, U., Şahin, T.: Forecasting the cumulative number of confirmed cases of COVID-19 in
Italy, UK and USA using fractional nonlinear grey Bernoulli model. Chaos Solitons Fractals
(2020). https://doi.org/10.1016/j.chaos.2020.109948
13. Gao, M., Mao, S., Yan, X., Wen, J.: Estimation of Chinese CO2 emission based on a discrete
fractional accumulation grey model. J. Grey Syst. 27, 114–130 (2015)
14. Hu, Y.C., Jiang, P., Tsai, J.F., Yu, C.Y.: An optimized fractional grey prediction model for
carbon dioxide emissions forecasting. Int. J. Environ. Res. Publ. Health 18, 1–13 (2021)
15. Ju-Long, D.: Control problems of grey systems. Syst. Control Lett. 1, 288–294 (1982)
A Hybrid Algorithm for Pattern Matching:
An Integration of Berry-Ravindran and Raita
Algorithms
Abdulwahab Ali Almazroi1 , Fathey Mohammed2(B) , Muhammad Ahsan Qureshi1 ,
Asad Ali Shah1 , Ibrahim Abaker Targio Hashim3 , Nabil Hasan Al-Kumaim4 ,
and Abubakar Zakari5
1 College of Computing and Information Technology at Khulais, Department of Information
Technology, University of Jeddah, Jeddah, Saudi Arabia
aalmazroi@uj.edu.sa
2 School of Computing, Universiti Utara Malaysia (UUM), 06010 Sintok, Kedah, Malaysia
3 Department of Computer Science, College of Computing and Informatics,
University of Sharjah, Sharjah 27272, UAE
4 Faculty of Technology Management and Technopreneurship, Center of Technopreneurship
Development (CTeD), Universiti Teknikal Malaysia Melaka (UTeM), 75460 Melaka, Malacca,
Malaysia
5 Department of Computer Science, Kano University of Science and Technology,
Wudil P.M.B 3244, Kano, Nigeria
Abstract. Due to the quick actions of technology, a complicated and huge volume of data deriving from biological sciences are generated which makes string
matching patterns a challenging task. This direction has the aim to make the utilization of an individual algorithm for string searching nearly ineffectual as the
number of tries and the number of observations continues to increase. So, the solution is in the grouping of more than one algorithm to create a hybrid algorithm
for quicker performance. The proposed hybrid algorithm uses the best features of
Raita algorithm and Berry-Ravindran algorithm. The reason for choosing these
two algorithms is because they achieve better performance in “number of attempts”
and “number of character comparisons” tests. New Hybrid Algorithm (BRR) is
able to produce better results by decreasing the effort and character comparisons.
The data types used to evaluate performance are English text, DNA, and protein.
In number of attempts evaluation, for DNA, English, and protein text datasets, the
improvement of the hybrid algorithm was 18%, 50%, and 50% in comparison to
Berry-Ravindran algorithm and it was 71%, 74%, and 70% in comparison to Raita
algorithm. The results show that regardless of the size of the data used, the mix
of algorithms yields better results and improved performance than the original
algorithm.
Keywords: Hybrid algorithm · Pattern · String searching · String matching
© The Author(s), under exclusive license to Springer Nature Switzerland AG 2022
F. Saeed et al. (Eds.): IRICT 2021, LNDECT 127, pp. 160–172, 2022.
https://doi.org/10.1007/978-3-030-98741-1_15
A Hybrid Algorithm for Pattern Matching
161
1 Introduction
Since the beginning of computer science, the problem of string-matching has gained a
lot of interest from researchers, and it plays a basic role in assuring pattern matching
and string search from multiple biological resources, such as protein and DNA data
[1–4]. The importance of string matching involves a wide range of interests, such as
applications, biometrics, internet search engines, spell checkers, text processing, and
more [5–9].
In simple terms, the string-matching algorithm is a technique for finding occurrences
of a pattern in a text-based based document [10]. The main problem with the algorithms
is knowing the way to slide the window during the search phase so as to compare the
pattern in a big text pool [11].
The algorithms typically work through scanning a set of texts in a window [12]. If
a match or mismatch happens, the window includes the length of the pattern. Formerly,
characters in the text and the pattern were compared; the text in the window is arranged
in rows until a match is found. Matches or mismatches typically occur throughout the
search phase [13]. When this event occurs, the window moves to the rightmost portion
to start aligning the text going right to left at the start of a given search [14].
The biological science data has been increasing due to the rapid advancement in
technology in the last few years. Therefore, instead of using one string search algorithm
to resolve these complicated search problems, two algorithms are integrated to decrease
number of comparisons performed improve the searching time when performing string
matching. Therefore, the focus of recent attention has been on the development of hybrid
algorithms due to improved performance and better solutions [9, 15–20]. The reason
being the fact that scientific data is getting stronger [21].
With regards to this development, a new hybrid algorithm called the hybrid Berry
Ravindran-Raita algorithm (BRR) is proposed, which basically involves a process combining the vital features of the Berry-Ravindran (BR) and Raita(R) algorithms to improve
search effectiveness. The purpose of selecting these algorithms to create a hybrid
algorithm is that the Raita(R) algorithm has the best practical behavior [22] and the
performance of the search pattern in English text because it has character dependence.
With respect to Berry-Ravindran (BR) algorithm, it is known to have two good
characters with good shift values [8]; by using the bad character table (brBc) during the
search stage, the BR is simply shifted to the highest Bit distance.
1.1 Problem Statement
The rapid development of technology has made it necessary to generate complex and
large amount of biological data are generated making pattern matching a daunting job.
Hence, the developments are intended to make the utilization of an algorithm for string
search virtually ineffectual, as the amount of tries and the number of comparisons stays
comparatively high. Consequently, a hybrid algorithm may be created by the grouping
of more than one algorithm in order to improve performance is the way forward.
162
A. A. Almazroi et al.
2 Related Studies
Early research efforts have confirmed that the good performance of integrating the two
algorithms leads to enhanced mixing performance in the search stage, because each
algorithm has specific advantages and can improve output when properly combined.
The hybrid algorithm is called KMPBS which uses a combination of two algorithms
including the Boyer Moore (BM) and the Knuth-Morris-Pratt (KMP) algorithms [15].
This hybrid algorithm decreases the first or last character that did not attain the condition
to decrease the number. Compare and promote the implementation of pattern matching.
The improvements are made in the pre-processing and search phases by using KMP’s
algorithm Next function and the BMHS algorithm’s Right p [j] values.
In another study, the combination of the two algorithms forms a hybrid algorithm
named ZTFS [18]. This algorithm is a combination of Fast Search (FS) and Zhu-Takaoka
(ZT). The hybrid algorithms uses processes from both FS and ZT algorithms, which
addresses bad character heuristics and BM good suffix heuristics for demonstrating
characters, and ztBc (a) giving maximum shift value. The b) function, as well as the
bmGs(j) function, also prefix the pattern in the preprocessing stage.
Another hybrid algorithm that has been put into use includes the Aho-Corasick (AC)
and the Backward Hashing (BH) algorithms [17]. These algorithms are suitable for
scanning and tracking information about text viruses. One of the methods used by the
hybrid algorithm is to use the Prefix Sliding Window (PSW) to index the shift table.
Moreover, the Backward Hashing (BH) algorithm checks for lengthier modes in the
PSW and is checked since the shift value did not exceed the PSW, as a result, helps save
time.
A hybrid ZTBMH was also implemented. This hybrid consists of the Boyer-MooreHorspool (BMH) and Zhu-Takaoka (ZT) algorithms [23]. The algorithm can be used
in searching biological sequence database, specifically for minor letters and lengthy
patterns. Performance improvements are obtained by utilizing a function in the preprocessing stage that handles characters’ bad character heuristic. Additionally, a function is
used that provides the largest shift. value. The search stage uses these functions to calculate the highest shift value in all attempts. In the case of a mismatch, the bad character
shift value is used.
The ShiftAnd-BMS algorithm is a hybrid algorithm [16] that searches for regular
strings and uncertain strings in English text. The algorithm integrates ShiftAnd and BMS
algorithm. The hybrid algorithms performance is enhanced by using several techniques
provided by the individual algorithm. Firstly, it uses the shifting technique provided by
the BMS algorithm. Secondly, in the case the match is found at the end of pattern then
the hybrid algorithm transfers to the ShiftAnd matching instead. This continues till no
match is identified at the existing point, then jumps to the next one before the final BMS
shift position.
The integration of Skip Search and Berry-Ravindran algorithms was performed to
propose a hybrid algorithm to improve search effectiveness. The algorithm performed
better in terms of search results as compared to the original algorithms [20].
A Hybrid Algorithm for Pattern Matching
163
In another study [19], a grouping of Alpha Skip Search and Berry Ravindran algorithms is experimented on biological data and English textual data. The results of experiment exhibited superiority of this integration over original algorithms on English text
and DNA protein datasets.
Researchers also proposed a hybrid algorithm that reduces the number of character comparisons in string matching to improve performance. They named it Fast Online Hybrid Matching Algorithm [24]. This hybrid algorithm uses techniques of three
algorithms including 1) quick search, 2) SSABS [25] and ABSBMH [26]. The results
showed the proposed hybrid approach performing better than ABSBMH algorithm by
taking fewer attempts.
The Atheer algorithm is also a hybrid algorithm that uses a combination of efficient
string-matching algorithm [27]. The proposed algorithm uses features of Karp–Rabin,
Raita, and Smith algorithms. The proposed hybrid algorithm performed more efficiently
in comparison to several algorithms (Horspool, Quick search, Two-way, Fast search,
SSABS, TVSBS, AKRAM, and Maximum shift).
An improved hybrid algorithm that performs better than the Atheer algorithm was
also proposed [28]. The new hybrid algorithm accomplishes this by using the searching
features from the Atheer algorithm, and the shifting techniques of the Berry-Ravindran
algorithms. This allowed the hybrid algorithm to perform better in both evaluation metrics including 1) number of attempts and 2) less character comparisons, in contrast to
the original algorithms, even when evaluation was performed on multiple datasets.
Researchers proposed a hybrid algorithm capable of reducing character comparisons
made [26]. The proposed called ABSBMH algorithm is based on two algorithms. This
includes SSABS algorithm and a modified version of the Horspool algorithm. However,
the algorithm did little to no improvement in number of attempts evaluation.
Researchers proposed an algorithm that aimed at improving string matching performance in both “number of attempts” and “number of character comparisons” [9]. It was
named after the evaluations metrics, and thus called Minimum Attempts and Character
Comparisons (MACC) hybrid algorithm. The hybrid algorithm uses a novel technique to
improve performance in addition to using index-based shifting and the Berry-Ravindran
algorithm. The algorithm performed better than both original algorithms and techniques
used in the hybrid algorithm.
3 Materials and Methods
The study first determined the advantages and disadvantages of the string search algorithms before deciding on the R and BR algorithms. Then extract the finest attributes of
these algorithms. The shift value from the initial stage (pre-processing) is calculated to
choose a larger shift value for window in the search stage.
The hybrid approach ensures that when two or more algorithms are incorporated, the
hybrid algorithm provides optimal properties of original algorithms are preserved and
performance is improved. BR utilizes two consecutive characters to provide the best shift
value. Nevertheless, the drawback of the algorithm is it do not search the initial stage as
a first phase. The Raita algorithm is beneficial when searching for patterns specific to
English text [22], and in practice it has a good behavior in performance because of the
existence of character reliance.
164
A. A. Almazroi et al.
Raita algorithm performs its searching functions by beginning every initial attempt
through the comparisons of character between the pattern’s last and first characters
positioned in the window. When a match occurs, comparisons are done as follows;
firstly, comparison among pattern’s starting character and the last left character in the
window, secondly, the center character is also compared, and lastly, before comparing
the rest of the character beginning from the second to the last but one, and then back to
the central point character comparisons again when a match is existed.
The BRR may exhibit good performance because tests are performed at every beginning point and at every attempt leading to a higher shift value than the original algorithm, and subsequently the weaknesses are overcome by the hybrid which applied their
advantages in the searching stage.
3.1 Hybrid Algorithm Pre-processing Phase
The preprocessing stage has been developed using a hybrid algorithm [29], and at this
stage the hybrid algorithm does perform the construction of the bad character table,
brBc, that is built through utilizing the Berry-Ravindran formula, as shown in formula.
1:
⎧
⎫
1
If x[m − 1] = m
⎪
⎪
⎪
⎪
⎨
⎬
m − i + 1 If x[i] × [i + 1] = mn
brBc[m, n] = min
(1)
⎪
⎪
m+1
If x[0] = n
⎪
⎪
⎩
⎭
m+2
Otherwise
3.2 Hybrid Algorithm Searching Phase
In this stage, it commences by using the pattern length. The following processes are
conducted in this phase:
• The text’s m length characters will be scanned to break down the potential starting
search points.
• Checking of the last character of the text window. If there is a mismatch with the
pattern, then move the Berry-Ravindran shift value by applying the rightmost two
next characters immediately once detecting the m-length character.
• If scanned characters in the pattern are found, the character are arranged from the start
of the search point and the pattern with the corresponding position in the pattern.
• Matching is started from the end with the character at the far right in the text window,
and when it matches, a comparison will be made of the first initial character together
with the character in the text window that is at the left-end. Lastly, the match occurs.
The second character is compared to the last. Other characters of one character.
• If a given match or mismatch happens, the process involves moving the pattern. This is
done by determining the Berry-Ravindran shift value of the two characters following
the window, i.e., the right-end character.
A Hybrid Algorithm for Pattern Matching
165
4 Analysis
The new hybrid consists of the preprocessing stage of Berry-Ravindran, it represents
the O(m + σ2 ) time complexity [6], so the time complexity of the preprocessing stage
is O(m + σ2 ). The time complexity of the search stage is classified as follows.
4.1 Lemma 1: The Worst-Case Scenario with Respect to Time Complexity is
Defined as O(Mn).
Proof: The worst-case interpretation of the hybrid algorithm denotes that the whole
character in the text is matched and cannot be larger than m times. The worst-case commonly happens all the way through the process, in case pattern’s characters are similar
to the characters present in the next text. For instance, with the text T = “aaaaaaaaaaaaa”
and the pattern P = “aaaaa”, it is noted that O(mn) is the worst-case time complexity.
4.2 Lemma 2: The Best-Case Scenario with Respect to Time Complexity is
O(N/(M + 2)).
Proof: In each attempt, when the character being checked in the pattern does not exist,
the shift value is going to be m + 2, this is calculated by the Berry-Ravindran function in
the preprocessing stage. The best-case scenario would arise if the characters used in the
pattern do not occur in the text given. For instance, with the text T = “aaaaaaaaaaaaaaa”
and the pattern P = “bbbbb”, the shift value will equate to m + 2, this is performed for
each attempt of the search stage, therefore the best-case time complexity is O(n/(m) +
2)).
The features used to evaluate the mean time complexity include the alphabet pool size
and the likelihood of each character being present in each text. Therefore, the maximum
offset to be implemented is expressed as m + 2, and the minimum character comparison
is normally between 1 − m, and it is a random sum established on the input data. The
average time complexity is often not predictable due to its randomness and no actual
estimates.
4.3 Evaluation
In evaluating the performance of the hybrid and original algorithms, three distinct forms
of data are utilized as test data for each algorithm, and the graphs obtained from each
algorithm are utilized as a comparison between each algorithm. The data selected for
the test algorithm is the benchmark for evaluating the performance of the algorithm [18]
when given characters and patterns of different sizes. Similarly, the experimental results
obtained from the proposed hybrid and 8 executions of the original algorithm.
The data type utilized for the evaluation have various letter sizes, where σ indicates
the letter size. This includes DNA data having σ = 4, protein data having σ = 20, and
English text having σ = 100. This research acquired English texts and DNA data are
from the Gutenberg project [30], while the protein data was acquired from the Swiss-Prot
database [31].
166
A. A. Almazroi et al.
The algorithm was executed on a computer having the specifications including 3 GB
RAM and an Intel Core 2 Duo processor having 1.93 GHz speed. The evaluation platform
was running Microsoft Windows Vista operating system and used the programming
editor C++ 2010 Architect. We measured the performance of the new hybrid BRR
algorithm using the number of attempts and the number of character comparisons.
Number of Attempts
The starting point for this technique is that the initial character in the pattern is mapped
to a particular character within the text and then carry on moving until the text ends to
ascertain if a match or mismatch has occurred before the text arrives. The anticipated
amount of transfers to the end of the text is called the number of attempts [32].
Number of Character Comparisons
The portion of the text signifies the beginning point in the text moving to the text letter
at the end, where the characters of the pattern are taken individually and matched to the
text characters to determine if there is a match or no match [14].
5 Results
Results are tested by utilizing data size of 50 MB comprising DNA, English text and
protein data types. Moreover, the performances of the algorithms are evaluated by using
various pattern lengths. The proposed algorithm was evaluated with pattern lengths 5,
10, 15, 20, 30, 40, 50, 60, 70, 80, 90 and 100 characters. The following Figures reveal
the two criteria for the evaluation. The evaluation criteria include 1) number of attempts
and 2) number of characters comparisons.
The results acquired from Figs. 1, 2, 3, 4, 5 and 6 illustrate that the BRR hybrid
algorithm demonstrates enhanced performance by the attempts number and the character
Fig. 1. The number of attempts in DNA data
A Hybrid Algorithm for Pattern Matching
167
comparisons number. In view of this, the combination of the algorithms exploits the good
properties of each to improve the mixing performance. For instance, the results obtained
from the English text, protein, and DNA of the hybrid algorithm confirm the performance
is greater to the original algorithm, mainly due to the use of Berry-Ravindran’s bad
character shift function (brBc) to achieve a larger conversion window. The value thus
improves the performance of the hybrid algorithm.
Fig. 2. The number of character comparisons in DNA data
Fig. 3. The number of attempts in protein data
168
A. A. Almazroi et al.
Fig. 4. The number of character comparisons in protein data
Fig. 5. The number of attempts in English text
A Hybrid Algorithm for Pattern Matching
169
Fig. 6. The number of character comparisons in English text
6 Discussion
As mentioned earlier, the purpose of this study is to incorporate two algorithms to create
a hybrid algorithm to improve the performance of string search, as the biological science
database becomes larger and larger. To assess the performance of the new BRR hybrid
algorithm, the data consisted of three forms: DNA, English text and protein. The results
indicate that the BRR has a significant attempts number and a reduction in the number of
character comparisons, and further improves the performance of the original algorithm.
The proposed hybrid algorithm produced much better results in comparison to both
Berry-Ravindran algorithm and Raita algorithm. The proposed hybrid algorithm results
are enhanced by 18%, 50%, and 50% over the Berry-Ravindran algorithm, and are
enhanced by 71%, 74%, and 70% over the Raita algorithm, when performing tests on
DNA, English text, and protein data types respectively.
The results really describe why the mix of algorithms should be taken seriously
because it has a bright future and ensures faster processing, rather than a single algorithm
for string searching, which does not meet today’s complex data needs. The achievement
of the new hybrid algorithm further indicates that in order to achieve the necessary
balance in the improved performance, it is very important to choose the appropriate
algorithm to form the mixture, because not all algorithms complement each other, so we
must carefully study the two algorithms to form Finished before mixing. The results further confirmed the feasibility of integrating two string search algorithms, which brought
good benefits by improving search and matching mode performance.
Hence, looking at the results obtained, we strongly recommend the hybrid algorithm to be applied to future string search development, because it is one of the best
ways to improve the performance of string search, because the biological science data
is increasing, so a powerful search algorithm is needed. Looking at the results obtained,
170
A. A. Almazroi et al.
we strongly recommend the hybrid algorithm to be applied to future string search development, because it is one of the best ways to improve the performance of string search,
because the biological science data is increasing, so a powerful search algorithm is
needed.
7 Conclusion
In this study, a new hybrid algorithm named BRR was proposed. The algorithm integrates
the Berry-Ravindran and Raita algorithms. When utilizing distinct forms of data sizes
and pattern lengths of 5–100 characters, the hybrid algorithm confirms the number of
improved attempts and the amount of character comparisons, so the hybrid algorithm
can be used to search for DNA, English text, and protein. The result also proves that
the utilization of hybrid algorithms will result to better performance than individual
algorithms, because the biological science sequence database becomes complex and
huge in today’s times.
References
1. Chen, Y.: A new algorithm for subset matching problem. J. Comput. Sci. 3(12), 924–933
(2007)
2. Mohammad, A., Saleh, O., Abdeen, R.A.: Occurrences algorithm for string searching based
on brute-force algorithm. J. Comput. Sci. 2(1), 82–85 (2006)
3. Kociumaka, T., Pissis, S.P., Radoszewski, J.: Pattern matching and consensus problems on
weighted sequences and profiles. Theory Comput. Syst. 63(3), 506–542 (2019). https://doi.
org/10.1007/s00224-018-9881-2
4. Neamatollahi, P., Hadi, M., Naghibzadeh, M.: Simple and efficient pattern matching
algorithms for biological sequences. IEEE Access 8, 23838–23846 (2020)
5. Sleit, A., AlMobaideen, W., Qatawneh, M., Saadeh, H.: Efficient processing for binary
submatrix matching. Am. J. Appl. Sci. 6(1), 78 (2009)
6. Yuen, C.T., Rizon, M., San, W.S., Seong, T.C.: Facial features for template matching based
face recognition. Am. J. Appl. Sci. 6(11), 1897–1901 (2009)
7. Radhakrishna, V., Phaneendra, B., Kumar, V.S.: A two way pattern matching algorithm using
sliding patterns. In: 2010 3rd International Conference on Advanced Computer Theory and
Engineering (ICACTE), pp. V2-666-V2-670. IEEE (2010). https://doi.org/10.1109/ICACTE.
2010.5579739
8. Neamatollahi, P., Hadi, M., Naghibzadeh, M.: Efficient pattern matching algorithms for
DNA sequences. In: 2020 25th International Computer Conference, Computer Society of
Iran (CSICC), pp. 1–6. IEEE (2020)
9. Mahmud, P., Rana, M.S., Talukder, K.H.: An efficient hybrid exact string matching algorithm
to minimize the number of attempts and character comparisons. In: 2018 21st International
Conference of Computer and Information Technology (ICCIT), pp. 1–6. IEEE (2018)
10. Deusdado, S., Carvalho, P.: GRASPm: an efficient algorithm for exact pattern-matching in
genomic sequences. Int. J. Bioinform. Res. Appl. 5(4), 385–401 (2009)
11. Hudaib, A., Al-Khalid, R., Suleiman, D., Itriq, M., Al-Anani, A.: A fast pattern matching
algorithm with two sliding windows (TSW). J. Comput. Sci. 4(5), 393 (2008)
12. Raju, V., Vinayababu, A.: Parallel algorithms for string matching problem on single and
two-dimensional reconfigurable pipelined bus systems. J. Comput. Sci. 3(9), 754–759 (2007)
A Hybrid Algorithm for Pattern Matching
171
13. Nadarajan, K., Zukarnain, Z.A.: Analysis of string matching compression algorithms. J.
Comput. Sci. 4(3), 205–210 (2008)
14. Kalsi, P., Peltola, H., Tarhio, J.: Comparison of exact string matching algorithms for biological
sequences. In: Elloumi, M., Küng, J., Linial, M., Murphy, R.F., Schneider, K., Toma, C. (eds.)
BIRD 2008. CCIS, vol. 13, pp. 417–426. Springer, Heidelberg (2008). https://doi.org/10.1007/
978-3-540-70600-7_31
15. Xian-feng, H., Yu-bao, Y., Lu, X.: Hybrid pattern-matching algorithm based on BM-KMP
algorithm. In: 2010 3rd International Conference on Advanced Computer Theory and Engineering (ICACTE), pp. V5-310-V5-313. IEEE (2010). https://doi.org/10.1109/ICACTE.
2010.5579620
16. Smyth, W.F., Wang, S.: An adaptive hybrid pattern-matching algorithm on indeterminate
strings. Int. J. Found. Comput. Sci. 20(06), 985–1004 (2009)
17. Lin, P.-C., Lin, Y.-D., Lai, Y.-C.: A hybrid algorithm of backward hashing and automaton
tracking for virus scanning. IEEE Trans. Comput. 60(4), 594–601 (2010)
18. Cai, G., Nie, X., Huang, Y.: A fast hybrid pattern matching algorithm for biological sequences.
In: 2009 2nd International Conference on Biomedical Engineering and Informatics, pp. 1–5.
IEEE (2009)
19. Almazroi, A.A.: A fast hybrid algorithm approach for the exact string matching problem via
Berry Ravindran and alpha skip search algorithms. J. Comput. Sci. 7(5), 644–650 (2011)
20. Al-Mazroi, A.A., Rashid, N.A.A.: A fast hybrid algorithm for the exact string matching
problem. Am. J. Eng. Appl. Sci. 4(1), 102–107 (2011)
21. Klaib, A.F., Osborne, H.: BRQS matching algorithm for searching protein sequence databases.
In: 2009 International Conference on Future Computer and Communication, pp. 223–226.
IEEE (2009)
22. Sheik, S., Aggarwal, S.K., Poddar, A., Sathiyabhama, B., Balakrishnan, N., Sekar, K.: Analysis of string-searching algorithms on biological sequence databases. Curr. Sci. 89(2), 368–374
(2005)
23. Huang, Y., Pan, X., Gao, Y., Cai, G.: A fast pattern matching algorithm for biological sequences. In: 2008 2nd International Conference on Bioinformatics and Biomedical
Engineering, pp. 608–611. IEEE (2008)
24. Islam, T., Talukder, K.H., Faisal, R.H.: A fast on-line hybrid matching algorithm for exact
string matching. Barisal Univ. J. Part 1 4(2), 399–411 (2017)
25. Sheik, S., Aggarwal, S.K., Poddar, A., Balakrishnan, N., Sekar, K.: A fast pattern matching
algorithm. J. Chem. Inf. Comput. Sci. 44(4), 1251–1256 (2004)
26. Al-Dabbagh, S.S.M., Barnouti, N.H.: A new efficient hybrid string matching algorithm to
solve the exact string matching problem. J. Adv. Math. Comput. Sci. 20(2), 1–14 (2017)
27. AbdulRazzaq, A.A., Nur’Aini Abdul Rashid, M.A., Abu-Hashem, A.A.H.: A new efficient
hybrid exact string matching algorithm and its applications. Life Sci. J. 11(10), 474–488
(2014)
28. Abdul Razzaq, A.A., Rashid, N.A.A., Abbood, A.A., Zainol, Z.: The improved hybrid algorithm for the atheer and Berry-Ravindran Algorithms. Int. J. Electr. Comput. Eng. 8(6),
4321–4333 (2018). (2088–8708)
29. Klaib, A.F., Osborne, H.: RSMA matching algorithm for searching biological sequences. In:
2009 International Conference on Innovations in Information Technology (IIT), pp. 195–199.
IEEE (2009)
172
A. A. Almazroi et al.
30. Kärkkäinen, J., Na, J.C.: Faster filters for approximate string matching. In: 2007 Proceedings
of the Ninth Workshop on Algorithm Engineering and Experiments (ALENEX), pp. 84–90.
SIAM (2007)
31. Huang, Y., Ping, L., Pan, X., Jiang, L., Jiang, X.: A fast improved pattern matching algorithm
for biological sequences. In: 2008 International Symposium on Computational Intelligence
and Design, pp. 375–378. IEEE (2008)
32. Jun-bo, W., Fei, K., Yang, L.: A fast single pattern matching algorithm for the longer pattern.
In: 2010 2nd International Conference on Future Computer and Communication, pp. V2-128V2-131. IEEE (2010). https://doi.org/10.1109/ICFCC.2010.5497356
A Survey of the Hybrid Exact String Matching
Algorithms
Abdulwahab Ali Almazroi1(B) , Asad Ali Shah1,2 , Abdulaleem Ali Almazroi3 ,
Fathey Mohammed4 , and Nabil Hasan Al-Kumaim5
1 College of Computing and Information Technology at Khulais, Department of Information
Technology, University of Jeddah, Jeddah, Saudi Arabia
aalmazroi@uj.edu.sa
2 Department of Computing, School of Electrical Engineering and Computer Science,
National University of Sciences and Technology, Islamabad, Pakistan
3 Department of Information Technology, Faculty of Computing and Information Technology,
King Abdulaziz University, Rabigh 21911, Saudi Arabia
4 School of Computing, Universiti Utara Malaysia (UUM), 06010 Sintok, Kedah, Malaysia
5 Faculty of Technology Management and Technopreneurship, Center of Technopreneurship
Development, Universiti Teknikal Malaysia Melaka, 75460 Melaka, Malacca, Malaysia
Abstract. The matching of search string patterns has become a bigger issue of
concern because biological sequence databases are growing rapidly at overwhelming proportions so string matching algorithm is an essential scientific tool to assist
in solving composite string search problems. At present, the shift of focus is geared
towards hybrid algorithms as they provide better performance in various evaluation metrics. Thus, researchers and experts view a hybrid algorithm as the way
forward for resolving string search difficulties. Therefore, the concentration will
be on the various kinds of hybrid algorithms that have been implemented, their
processes, and their performances. This research has performed a systematic literature review by reviewing over 30 papers and identifying 15 string matching hybrid
algorithms. When reviewing these hybrid algorithms, it is found that by combining
different original algorithms, the hybrid algorithm can outperform the individual
algorithms in different evaluation metrics. The purpose, enhanced concepts, and
results of these algorithms have been highlighted in the article. This article has
critically reviewed different string matching hybrid algorithms and provided useful information for experts and researchers that can utilize strong-matching hybrid
algorithms in their systems.
Keywords: Approximate string match · Exact string match · Hybrid string
matching algorithm · Pattern search · String search
1 Introduction
The persistent progress in the area of biological science databases has necessitated the
burning desire for enhanced and better-performing string searching algorithms. Over
the years, researchers and experts have preferred hybrid string searching algorithms,
© The Author(s), under exclusive license to Springer Nature Switzerland AG 2022
F. Saeed et al. (Eds.): IRICT 2021, LNDECT 127, pp. 173–189, 2022.
https://doi.org/10.1007/978-3-030-98741-1_16
174
A. A. Almazroi et al.
which are the combination of two or more algorithms instead of the frequent usage of a
single search string algorithm implementations [1–3]. For many years, search string and
pattern matching algorithms had been the fundamental basis for computer science applications, biological sciences, text processing, bioinformatics, and artificial intelligence
[4]. A String matching algorithm searches for all the possible occurrences of a specific
pattern(s) in a very large chunk of a given text of alphabets. In other words, it is the
discovery of one or more precise instances of a particular pattern found in a document
or text.
String matching-based algorithms comprise two major components including 1) preprocessing phase and 2) searching phase. The pre-processing phase is responsible for
reviewing patterns in the given text, while the searching phase involves searching text
or the sequence pattern iteratively [5, 6]. Essential information is gathered in the preprocessing phase through iterative procedures of testing and shifting. This information
is then passed on to the searching phase for further processing. The searching phase
identifies the exact patterns in successive windows. The goal of these algorithms, when
processing data, is to lessen the number of attempts and to ensure a greater shift value.
This is how a good string matching algorithm is evaluated.
Given the importance of hybrid exact string matching algorithms, researchers and
experts need to be aware of the possible algorithms available and the combinations that
should be used to produce better results. To the best of our knowledge, there is little
research available that has reviewed hybrid exact string matching algorithms extensively. Al-Khamaiseh, Alshagarin [7] survey on string matching algorithms provides
an overview and general working on all types of algorithms including exact, approximate, and hybrid algorithms. In comparison, this research focuses on hybrid exact string
matching algorithms only. Alhendawi, Baharudin [8] research provides a short survey
on string matching algorithms, their pseudocode, and time complexities. However, this
research also does not highlight the purpose of the algorithms and their results. This
research reviewed existing hybrid exact string matching algorithms and highlighted the
combination of algorithms used, where the hybrid system can be used ideally and the
results achieved by the system.
At later stages, the attention will be directed towards most of all the hybrid algorithms
having been implemented currently and more essentially their usefulness in enhancing
the pattern searching. The use of hybrid algorithms is seen as the way forward for
solving most of the string searching problems due to voluminous types of scientific data
being generated today [9, 10]. There are two main approaches used by string matching
algorithms. These include 1) exact string matching algorithms and 2) approximate string
matching algorithms. Both are these approaches are discussed in Sect. 2. In Sect. 3,
the evaluation approaches applied for testing the hybrid algorithms’ performances are
highlighted. In Sect. 4, the existing hybrid algorithms are listed, compared, and discussed
in terms of enhanced concepts and results. Section 4 covers the discussion while Sect. 5
concludes the paper’s findings.
A Survey of the Hybrid Exact String Matching Algorithms
175
2 String Matching Algorithms
It is the discovery of one or many of all instances of a pattern present in the text provided.
In string matching. there are two main approaches. These include 1) exact string matching algorithm and 2) approximate string matching algorithm. Different string search
algorithms are grouped under either one of these two approaches, and their distinctions
are of great importance as they form the main categorization and performance of all
string matching algorithms [7].
2.1 Exact String Matching Algorithm
As the name suggest involves the process of finding out the specific pattern(s) in a given
text, for instance, given that, T = t1 t2… tn , and a pattern made up of P = p1 p2 … pm , the
aim for this algorithm is to discover if P appears in and if P can be found in T, where is
the location to be found [11, 12]. In recent years, however, research has proven that exact
string algorithms are more suitable for string searching as their prediction, estimation,
and performance are considered to be exact to searching and matching patterns in a text.
2.2 Approximate String Matching Algorithm
This approach also tries to find the pattern from a given text document, but instead of
finding the exact match, it approximates the occurrence instead. In a text document T
with pattern P to search for, the notion involves the discovery of the approximate or the
nearest occurrences of all P in T. The procedures involve finding all the substrings of a
text that are quite close to the given pattern, but may or may not be the same. For example,
given a string N1 and another string N2 , transformations are from N2 to N1 normally
implemented by three functions namely; deletions, insertions, and substitutions [13].
1. Deletion Operation: Given that N1 = btcga, and N2 = btccgga, the deletion of (c)
is at the position (4) and the deletion of (g) is at the position (5) from N2 . After the
deletion operations, a transformation has taken place where N2 is transformed to N1 .
2. Insertion Operation: For this function of approximate string matching when given
that N1 = bactgt, and N2 = bctt, insert (a) in the position (2) and (g) in the position
(5) of N2 . After the insertion, N2 is transformed into N1 .
3. Substitution Operation: When given a text and pattern and N1 = tactgta, and N2
= tbctata, the transformation N2 to N1 is applied by the substitution operation at
positions (2) and (5) respectively of N2 , where at position (2), (b) is substituted by
(a), and at position (5), (a) is substituted by (g).
Apart from the above function descriptions for approximate string matching, the
other functions are the Hamming distance and Levenshtein or Edit distance. In Hamming
distance [14], the function denotes two strings having the same string length. Then
it finds the number of locations where both the strings have mismatching characters.
The hamming distance function is used in approximate string searching algorithms.
In such algorithms d indicates the hamming distance while k indicates the instances
where two strings were mismatched. On the other hand, Levenshtein distance calculates
176
A. A. Almazroi et al.
the distance, by comparison, two different strings of different sizes. It comprises the
smallest number of character insertions, deletions, and substitutions with the central
goal of transforming one string into another. It is also known as string searching with k
differences or k errors [15].
3 Evaluation Approaches
The evaluation approaches applied for testing the performances for all the hybrid algorithms discussed below all follows similar trends including the varying degree of data
set made up of amino acids, DNA, English text, UNIX dictionary (e.g. BR algorithm),
nucleotides sequences (e.g. BMBR algorithm) and protein sequences and other data
obtained from databases such as Genome (Arabidopsis Thaliana) and Swiss-Prot containing 8740 proteins and used by most of the hybrid algorithms. Moreover, the algorithms reviewed showed that when using the same alphabet size it was set four letters
(σ = 4), while bigger alphabet sizes were set to 20 (σ = 20) by many algorithms as
the test data. The algorithms have been tested in different environments, such as different processing speeds, process generation, different RAM generation and size, different
operating systems, and so forth. There are three evaluation metrics for calculating performance in search string algorithms, which are 1) the “number of attempts” conducted
by the algorithm, 2) “the number of character comparisons”, and 3) the “searching time”
taken by the algorithm to find the results. These are the recommended metrics for evaluating search string algorithms and understanding their behavior when changing different
parameters such as the alphabet and pattern size.
1. The number of attempts: It is described as the process where the beginning area of
the first pattern character is the link to a specific character in the text, and which then
carry on shifting till the end of the text document to ascertain if there is a match or
mismatch that had occurred at the end of processes. The number of times it is shifted
to ascertain that a match is found is known as the number of attempts [16].
2. The number of character comparisons: This evaluation metric calculates by initiating
a point inside a given text to the last character of the text, showing how the character
of patterns are extracted separately and then equated with the given text to find out
the occurrence of a match or mismatch [17].
3. Searching time: Also known in string searching as execution time or elapsed time
is the processing times needed by the CPUs to execute functions to complete the
search, and matching all the patterns within a given text to determine the time taken
to achieve a specific result [18].
4 Review on Hybrid Algorithms
Recent years have seen tremendous emphasis and progression towards the use of hybrid
algorithms for string searching. This is because they provide the best performances and
results than the application of a single-string algorithm. As data is becoming more complex, hybrid algorithms are seen as the direction to follow because they can march the
tedious rigors involved in string searching of voluminous data. The hybrid algorithms
A Survey of the Hybrid Exact String Matching Algorithms
177
summary is provided in Table 1, which shows the hybrid algorithm name, algorithms
used, the purpose for which the algorithm should be used, and results obtained during implementations. The algorithms are discussed in greater detail in their respective
sections.
Table 1. Summary of string matching hybrid algorithms
The algorithm
Algorithms used
Purpose
Results
Berry-Ravindran
Hybrid Algorithm
Quick Search
Searching English text +16.66%
Zhu-Takaoka algorithms
performance
SSABS Hybrid
Algorithm
Quick Search
Raita algorithms
Searching biological
sequence
Elapsed time = 40 s
FJS Hybrid
Algorithm
Boyer-Moore
Knuth-Morris-Pratt
Searching DNA
sequence
Faster times when
alphabet sizes are ≥
15
TVSBS Hybrid
Algorithm
Berry-Ravindran
SSABS
Searching biological
sequence
TVSBS took
4,984,654 number of
attempts
BMBR Hybrid
Algorithm
Boyer-Moore
Berry Ravindran
Searching biological
sequence
Less average time
ZTBMH Hybrid
Algorithm
Zhu-Takaoka
Boyer-Moore-Horspool
Searching biological
sequence nucleotides
sequences
Lower average time
than BMH, BM, FS,
ZT
BRFS Hybrid
Algorithm
Fast Search
Berry-Ravindran
Useful for small
alphabets and long
patterns searching
biological sequence
More efficient than
the original
algorithms
BRBMH Hybrid
Algorithm
Berry-Ravindran
Boyer-Moore Horspool
Searching protein
sequence
Achieved the lowest
number of character
comparisons when
compared to other
algorithms
BRQS Hybrid
Algorithm
Berry-Ravindran
Quick Search algorithm
Searching protein
sequence
Recorded the better
performance at 1240
in comparison to
other algorithms
ZTFS Hybrid
Algorithm
Zhu-Takaoka
Fast-Search algorithms
Nucleotides sequences The average time
Long patterns
taken is less than
other algorithms
(continued)
178
A. A. Almazroi et al.
Table 1. (continued)
The algorithm
Algorithms used
Purpose
Results
RSMA-BR Hybrid Berry-Ravindran
Algorithm
Random String
Matching
Searching protein
sequence
Less average time
and number of
comparisons
performed than QS
and BMH
ShiftAndBMS
Hybrid Algorithm
ShiftAnd
BMS
Searching English text Execution time better
than BMS
BRSS Hybrid
Algorithm
Berry-Ravindran
Skip Search
Small alphabets
Long patterns
Better in all
evaluation metrics
compared to
Berry-Ravindran
BHAC Hybrid
Algorithm
Backward Hashing
Aho-Corasick
Scanning string
information on
computer virus
The algorithm
performed quicker
than the original
implementations
KMPBS Hybrid
Algorithm
Boyer-Moore
Knuth-Morris-Pratt
Searching English text More efficient in the
number of character
comparison
evaluations than
original algorithms
4.1 Berry-Ravindran Hybrid Algorithm
Berry-Ravindran (BR) entails two algorithms involving Quick Search (QS) and ZhuTakaoka (ZT) algorithms [19, 20], and it is applicable for searching English text specifically tested using UNIX dictionary. The intention for the algorithm was to conduct a
random text that can lead to a simulation of a tangible English text, and all the characters
used in the UNIX dictionary were in lower cases to increase the possibility of a match.
Enhancement concepts: The improvements are through each of the two algorithms
and not one, the shift value for the algorithm is from a two-dimensional table composed
of bad character tables of BR and QS. QS algorithm uses another function and not the
good suffix function to compute the shifts. It applied a reformed version of the last
occurrence function, the function defines the rightmost instance. If it is not present, the
pattern is then shifted by m + 1 positions. ZT instead applied the good suffix function
for the shift, if a mismatch occurs the last occurrence function defines the rightmost
occurrence of the text in the pattern, so the computations from both forms good shift
values from each algorithm which enables the new algorithm to be more proficient.
Results: The decisions on the BR at the end established through the outcome that
the algorithm performances were boosted when the comparison is made because at any
pattern length as it shows 16.66% improvement in two evaluation metrics. This includes
the character comparison and searching time. It performed better as compared to the other
original algorithms such as BM 43.29%, Raita 42.82%, ZT 26.09%, and QS 29.72%.
A Survey of the Hybrid Exact String Matching Algorithms
179
Additionally, ZT functions better recording a total percentage figure of 26.09% over QS
which shows almost 29.72% during the number of comparisons when all the maximum
pattern length 22 was calculated.
4.2 SSABS Hybrid Algorithm
SSABS combines two search algorithms namely Quick Search (QS) and Raita algorithms
[21, 22] to form a hybrid algorithm and it is useful for searching biological sequence
databases. The algorithm was also designed for other database uses, for instance, searching other databases such as Protein databases containing protein sequences and information about protein motifs and features of protein structures from Swiss Prot and Protein
Data Bank (PDB), Swiss Institute of Bioinformatics (SIB) and among others.
Enhancement concepts: SSABS algorithm improvements were achieved through
these procedures; in the new algorithm there is a fixed point for the direction character
comparisons that is done among the window and the search string at every attempt. The
pattern is checked against the string from right to left of the window. The shifting of the
window is calculated by discovering the location of the bad character in the string when
a match or mismatch happens.
Results: Experiment results were on elapse time and in the end, it corroborates that
any given length the SSABS algorithm is more valuable on protein sequences with size
= 20, and regardless of the size and the string search length involved than the other
algorithms the lowest elapsed time of 40 s at the maximum length of character. At the
same stage also Raita Algorithm performance is better when reviewed with QS with
elapse time of 41 s as against 55 s by QS.
4.3 FJS Hybrid Algorithm
The algorithm is the hybrid of Boyer-Moore (BM) and Knuth-Morris-Pratt algorithms
(KMP) [23, 24], and it is used for searching DNA sequence databases. The perfection
of this hybrid algorithm FJS was due to the significant accuracy of the BMS and KMP
which complement each other very well. Moreover, any BM-derived algorithm is flexible
for the active use of indexed alphabets of variable size. The goal of the algorithm is to
include the advantages and performance of the BM, which also addresses some of the
scenarios where the KMP algorithm performs inadequately.
Enhancement concepts: The improvements are from both algorithms to improve
performance in elapsed time. This is done by introducing two arrays namely Sunday’s
array and KMP array in the pre-processing stage. To avoid numerous string matches, in
the case of the worst-case scenario, the KMP-type letter assessments are used over the
remaining characters to improve efficiency.
Results: Derived experiment results quoting from the paper on elapse time gives
the benefits to the new algorithm owing to the certainty that the FJS displays the best
improvements and is executed at faster times when alphabet sizes are ≥ 15 with an
average time of 5–10% better than the BM and KMP at about 20 s when pattern size
is at maximum 2 MB and almost having a dominant effect when alphabet size is ≥ 8.
Meanwhile, BM also executed much quicker than BMH at 28 s as compared to BMH at
42 s, so it was considered the second-best.
180
A. A. Almazroi et al.
4.4 TVSBS Hybrid Algorithm
The algorithm is composed of Berry-Ravindran and SSABS algorithms [17, 25], all of
which are hybrid algorithms by their nature of implementation. This algorithm is suitable
for searching biological sequence databases specifically nucleotide and amino acid. This
algorithm shows great strength and it is easily adapted for exact pattern applications and
exhibits the best and worst-case complexities.
Enhancement concepts: The enhancement of the TVSBS algorithm was due to the
good functions from BR which are coupled with SSABS. For example, the BR bad
character (brBc) function is known to be more efficient at the pre-processing phase.
Moreover, character comparisons are done starting from the last character in the pattern,
where the window is skipped in the event of finding two characters in succession in the
string. This enables the brBc function to achieve the maximum shift values and thereby
decreasing the comparisons performed.
Results: Performance indicators during the implementation number of comparison
and execution time announced, the TVSBS as the more proficient as the number of
comparisons was 4,984,654 compared to SSABS of 8,564,471 when pattern length is
30 and alphabet size was 20, and at any pattern length the new algorithm still performs
better. Moreover, the average time of 108 s compared to 110 s when alphabet size is 20.
4.5 BMBR Hybrid Algorithm
The hybrid algorithm consists of Boyer-Moore and Berry Ravindran algorithms [26,
27]. Chicago is normally referred to as BMBR. This hybrid algorithm is very useful in
biological sequence databases for search pattern matching. It also absorbs the idea of BR
that is noted for attaining maximum shift values and applied the mismatch information
at the searching phase Additionally it is an applicable algorithm for small alphabets and
long patterns which shows that the longer the pattern the best performance derived from
the algorithm.
Enhancement concepts: The concepts of enhancements for this algorithm were made
possible by the implementation of two functions from the algorithms. The first is the
good suffix heuristics offered by the BM algorithm. The BR algorithm complements
the algorithm by providing bad character heuristics. This allows the hybrid algorithm to
achieve a better working of the shift function while also attaining the best shift distance,
thus, improving performance.
Results: Using the number of comparisons and average time, the results mark BMBR
algorithm was the enhanced performance through the figures obtained where the average
time taken was lesser than all other the algorithms. The algorithm was compared against
BM, BMH, BR, QS, SSABS, and TVSBS algorithms. In the first test, the researchers
tested the algorithm by setting the length of the short pattern is to 28. In this scenario
the average time is taken by BMBR to other algorithms considered (as per the order
mentioned above) is 70%, 61%, 87%, 45%, 48%, and 87% respectively. In the second
test, when the length of the long pattern is set to 1024, the average time taken by BMBR
to other algorithms is 76%, 44%, 79%, 79%, 35%, and 73% respectively. The original
algorithms also exhibited different results with BM better than BR on both short and
long patterns recording 70% and 76% while BR was 87% and 79% of average times.
A Survey of the Hybrid Exact String Matching Algorithms
181
4.6 ZTBMH Hybrid Algorithm
The hybrid algorithm is a hybrid of Zhu-Takaoka (ZT) and that of Boyer-MooreHorspool (BMH) algorithms [28, 29]. The algorithm is designed to be used in the biological sequence database. However, it also works well nucleotides sequences and long
patterns. With this algorithm the longer the length of the pattern, the better it performs.
Enhancement concepts: One of the changes made by the hybrid algorithm to increase
the performance was the introduction of a single function in the pre-processing phase.
The function utilized both the bad character heuristic and the maximum shift value. In
the searching phase, the function computes the maximum shift value after every attempt.
Moreover, the window is skipped in the case a match is not found. The algorithm utilizes
the bad character shift value in the case of a mismatch.
Results: The elapsed time was applied to gauge the final output and the results
confirmed ZTBMH as the best algorithm than the rest of the algorithms including BM,
BMH, FS, and ZT. The algorithm better performed better in both average times for
short and long patterns. In the first test, when the short pattern length is set to 28, the
average time taken by ZTBMH compared to other algorithms (in the order given above)
is 50%, 38%, 50%, and 89% respectively. In the second test, where the pattern length
is set to 1024, the average time taken by the ZTBMH algorithm compared to other
algorithms is 54%, 30%, 54%, and 99% respectively. For individual original algorithms,
BMH improved over ZT over 38% for short patterns and 30% for long patterns with ZT
recording 89% and 99.
4.7 BRFS Hybrid Algorithm
BRFS hybrid algorithm uses Fast Search (FS) and Berry-Ravindran (BR) algorithms
[28, 30]. The hybrid algorithm is ideal when searching databases involving biological
sequences, but it can also be used for both short and long patterns. The algorithm follows
the style of algorithms, which are noted for having a very good shift value such as Boyer
Moore (BM), and applied the good concepts of BR and FS.
Enhancement concepts: The enhancement of BRFS came about through the extraction of two functions. The first is the inclusion of bad character (brBc) suffixes heuristic
from the Berry–Ravindran algorithm and good suffix heuristic bmGs(j) from the Boyer
Moore (BM) algorithm. These are added at the pre-processing phase. In addition to this,
the algorithm also stores the shift value in one-dimensional called the brBc array. In
the searching phase, after every attempt, the window skip is commutated through the
brBc function and the window for maximum skip when characters do not appear in the
pattern.
Results: It was measured on the number of comparisons and elapse time, and the
results proved BRFS is more efficient than the original algorithms. The BRFS algorithm was evaluated against other algorithms including BM, BMH, BR, QS, SSABB,
and TVSBS algorithms. In the first evaluation test, the pattern length was set to 28 for
evaluating performing in short patterns. In this test, the average time taken by the proposed hybrid algorithm attained 70%, 61%, 87%, 45%, 48%, and 87% compared to
other algorithms in the order given above respectively. In the second test, the length of
the pattern length was set to 1024 to evaluate the hybrid algorithm for long patterns.
182
A. A. Almazroi et al.
In the second test, the average time taken by the hybrid algorithm compared to other
algorithms was 76%, 44%, 79%, 33%, 35%, and 73% respectively. Moreover, for each
respective algorithm, BR performed better compared to QS by over 8% on the average
running number of comparisons with a maximum pattern length of 28.
4.8 BRBMH Hybrid Algorithm
The BMBM hybrid algorithm comprises features from both Berry-Ravindran (BR) and
Boyer-Moore Horspool (BMH) algorithms [31, 32]. The hybrid algorithm is a deal
when searching protein sequence databases but can also be used in other string search
applications. The algorithm improves the performance by using the pre-processing phase
of BR and the searching phase of BMH.
Enhancement concepts: As stated before, the BRBMH algorithm uses good features
from both BR and BMH algorithms. This includes the bad-character shift function in
BMH and BR algorithms. The difference between them is that BMH defines one for text
the search window to the text window. This improves the pre-processing phase where
the pattern characters are compared by using the shift values instead of counting the text
characters. Afterward, the shift values are stored in a one-dimensional array which is
easily accessible in the searching phase.
Results: The principle used was elapsed time and the results established, the new
hybrid algorithm from the low pattern length of 32 through to the high of 1024, indicated
that BRBMH displayed the lowest number of character comparisons when compared
to other algorithms, at maximum pattern length of 1024, the character compared by
BRBMH was 1239, other algorithms recorded higher values like 1243, 2647 for TVSBS
and QS respectively. Moreover, elapse time for BRMMH was about less than 5 s as
compared to QS which was executed at a high value of 18 s and BRFS of about less than
10 s.
4.9 BRQS Hybrid Algorithm
The hybrid algorithm uses the good features of the two algorithms. This includes 1)
Berry-Ravindran (BR) and 2) Quick Search algorithm (QS) algorithms [33]. This algorithm is suitable for searching protein sequence databases and many other string applications. The purpose of the algorithm was to accomplish maximum effectiveness in the
shifting values and the search patterns within the given text. Moreover, the algorithms
also decrease the attempts for string search and elapsed time when searching using long
patterns.
Enhancement concepts: The BRQS algorithm’s performance is improved due to two
features. The first feature is the bad-character shift function provided by the QuickSearch algorithm. The second feature used is the BR bad-character shift function that
is provided by the Berry-Ravindran algorithm. The difference between both of them is
that one is using one character, while the other uses two characters next to the search
window. This allows the algorithm to achieve maximum shift values. Moreover, storing
the results in a one-dimensional array allows faster accessibility during the searching
phase.
A Survey of the Hybrid Exact String Matching Algorithms
183
Results: From the experiment results publicized on the number of comparisons and
elapse time, the BRQS recorded the better performance at 1240 in terms of the number
of comparisons when pattern length is at a maximum 1024 better in terms of the number
of comparisons and elapse time is below 5 s over the than the original algorithms.
Also BRFS, TVSBS results were 1282, 1243 respectively which is better than the QS
algorithm having 2647 on the number of character comparisons. On elapse time results
BRFS was about 10 s with QS 20 s.
4.10 ZTFS Hybrid Algorithm
ZTFS hybrid algorithm uses the best features of two algorithms. The first one is the
Zhu-Takaoka (ZT) algorithm. The second algorithm used by the hybrid algorithm is
the Fast-Search (FS) algorithm [30, 34]. The hybrid algorithm is ideal when searching
for exact patterns in the biological sequence database. The proposed algorithm is much
useful for small alphabets. For example, nucleotides sequences and long patterns.
Enhancement concepts: The performance of the ZTFS hybrid algorithm is improved
due to the use of two functions. The first function is the good suffix heuristic provided by
the bmGs(j) function of BM. The second is the bad character heuristic ztBc(a, b) function
for ZT. The ztBc(a, b) function also supplies the maximum shift values. Moreover, the
bmGs(j) function provides the prefix of the pattern during the pre-processing phase.
At the searching phase, Zhu-Takaoka bad character shift value is applied. However
whenever a mismatch occurs the shift is taken over by the bmGs function.
Results: The algorithm was evaluated against six other algorithms, including FS,
TVSBS, and ZT algorithms, for different evaluation metrics. The algorithm achieved
better elapsed time results in comparison to other algorithms. When the pattern length
is set to 28, for short patterns, the average time taken by ZTFS to other algorithms (as
per the order given above) is 51%, 83%, and 90% respectively. The hybrid algorithm
was also tested for long patterns by setting the pattern length to 1024. In the test, the
average time taken by ZTFS to other algorithms is 53%, 74%, and 97% respectively.
Furthermore, FS time taken was 51% for short pattern and 53% for longer pattern during
execution so it is better than ZT which shows high figures.
4.11 RSMA-BR Hybrid Algorithm
This hybrid algorithm is the mixture of Berry-Ravindran (BR) and Random String Matching (RSMA) algorithm [1, 35] and can be applied in the protein sequence database. The
major objective of this hybrid algorithm is to reduce the number of attempts during
the searching phase and to increase the shift values for the patterns. This will allow
the hybrid algorithm to perform better in comparison to other algorithms such as Brute
Force (BF), KMP, BM, and Boyer Moore Horspool (BMH).
Enhancement concepts: The enrichment RSMA-BR algorithm were made possible
by the application of good attributes from both algorithm by the first brBc function
which counts shift values on every character in the pattern, then stored them in brBc
one-dimensional array at the pre-processing phase, from the searching phase it applies a
function known as Random Division (RD) value to do the comparison before counting
the Text through a method known as Text Division value (TD).
184
A. A. Almazroi et al.
Results: The results include the number of comparisons and elapse time used as the
performance yardstick, and the hybrid algorithm was judged the best, as in any pattern
length range from 32 to 1024 than the rest of the algorithm, where at 1024 the of the
number of comparisons was 1129 as compared to QS 2647 and BMH 2186. For elapse
time, the running times were less than 5 s when compared to QS of about 20 s, BMH of
around 18 s, and other algorithms which show high numbers.
4.12 ShiftAndBMS Hybrid Algorithm
The algorithm is the combination of ShiftAnd and BMS algorithms [36, 37]. It is used is
for searching English text such as both regular string and indeterminate strings. The idea
was the cautious mixture of algorithms by flip-flopping among two or more processes,
and from one another according to the local environments sections of text.
Enhancement concepts: the algorithm is improved by using the good features of
both BMS and ShiftAnd matching algorithms. In the searching phase, the algorithm
uses the BMS shift operation by default. However, it switches to the SwiftAnd function
if the match is found at the end of the pattern, allowing it to improve performance. The
algorithm switches back to BMS shift operation in the case no match was found in the
current comparison.
Results: The printed outcome of the results in the paper on the criteria execution time,
illustrate the new algorithm execution time was much better among the other algorithms,
having an overall total figure of 11862 ms per million letters when compared to 12341 ms
for BMS and 27888 ms for ShiftAnd. During the same time, BMS performed better than
ShiftAnd executing at a time of 12341 ms per million letters as compared to ShiftAnd
algorithm time at 27888 ms per million letters.
4.13 BRSS Hybrid Algorithm
This hybrid algorithm [12] is the combination of two algorithms. This includes the 1)
Berry-Ravindran (BR) and 2) Skip Search (SS) algorithms. The key benefits of using
this hybrid algorithm are that the BR algorithm provides the best shift value. This is
achieved using the bad character table calculated from the two consecutive characters
immediately after the window. Moreover, the SS algorithm is useful for both small and
long patterns. Additionally, the hybrid algorithm performs processing on the characters
in the pattern before initializing the search phase.
Enhancement concepts: As stated before, the hybrid algorithm has the bad-character
shift mechanism from the Berry-Ravindran algorithm to improve performance. The
feature checks the window’s right side for two successive text characters located. In the
pre-processing phase, each character pair is computed. In the searching phase when a
match or mismatch occurs, the shift value depends on the two successive text characters
located at the window’s right side, and is calculated from the Berry-Ravindran bad
character table, normally represented bybrBc function. Additional enhancement features
also came from SS shift value which computes the bucket list in the pre-processing stage
and the derived bucket list results are used in the searching stage to ensure a bigger shift
value. But here both BR and SS shift values are compared and the bigger shift value is
chosen for shifting the pattern.
A Survey of the Hybrid Exact String Matching Algorithms
185
Results: The hybrid algorithm performed better in all evaluation metrics in comparison to Berry-Ravindran in DNA, Protein, and English text. The results in these
texts are 50%, 43%, and 44% respectively. Moreover, the hybrid algorithm also showed
improvements over the Skip Search algorithm. The results show that in DNA, Protein,
and English text, the algorithm improved by 20%, 30%, and 18% respectively. Consequently, the SS algorithm is better than the BR algorithm from pattern lengths ranging
from 5–100 characters applying all the three different sets of data as well namely DNA,
Protein, and English text.
4.14 BHAC Hybrid Algorithm
This hybrid algorithm comprises two algorithms. This includes 1) Backward Hashing
(BH) and 2) Aho-Corasick (AC) algorithms [38]. The algorithm is ideal when used for
scanning string information in a computer virus search. The BM is appropriate for long
patterns while AC searches for a shorter length of the pattern.
Enhancement concepts: The improvements were due to the use of the two algorithm’s
best features. The first is the superior heuristic which defines the shift distance. This
technique indexes the shift table. This is done using the Prefix Sliding Window (PSW)
that is required to be performed before initiating the search phase. Moreover, BH is
also used in long pattern searches if the characters lie within the PSW. This procedure
reduces the elapsed time of the algorithm. Secondly, another improvement is the badblock heuristic that helps to decrease the false-positive rate while at the same time
engineering a bigger shift value and maintaining the Block-size to appreciable levels.
Results: The results from the paper evaluated on execution time implies the hybrid
algorithm improved overall throughput. The results showed that was increased from
19.44 Mbps (original algorithm) to 53.81 Mbps (hybrid algorithm). Thus an increase
of 277% is achieved showing faster times than the rest of the algorithms when the size
of the bloom filter is 512 KB. In the implementation, the results also show that the BH
algorithm is also quicker. The time taken by the original implementation is 14.19 s, while
the AC algorithm took a time of 15.74 s during execution.
4.15 KMPBS Hybrid Algorithm
KMPBS is a combination of two algorithms. The hybrid algorithm includes 1) BoyerMoore (BM) and 2) Knuth-Morris-Pratt (KMP) algorithms [39]. The algorithm is good
for searching English text. The algorithm is ideal for scenarios where the character is
positioned at the end of the window, which allows the algorithm to attain maximum
shifts.
Enhancement concepts: The KMPBS improvements were made using the good
attributes of the algorithm. This includes the pre-processing phase and the searching
phase of the KMP algorithm. Moreover, from the BMHS algorithm, the number of letters from the string are grouped as one character for a single function. The calculation
for the Next Function value for KMP string P is used and the BM algorithm applied the
next character to determine the value string pattern P to be shifted.
Results: Results obtained from assessing the performance on the number of comparison shows, the KMPBS is more efficient as the number of character comparisons
186
A. A. Almazroi et al.
stood at 35 times when pattern length is 267 than KMP algorithm figure of 468 times
when the same pattern size was applied. Meanwhile, BM performs better than KMP with
367 times the number of comparisons as compared to KMP which estimated number of
comparisons stood at 789 times.
5 Discussion
All the hybrid algorithms reviewed have varying degrees of factors that influence their
performances and while some are useful for short alphabets (e.g. BMBR), long patterns
(e.g. BH), and large alphabets (FJS). From the review, one essential point that stood
out was that the purpose for all the algorithms was the belief of trying to reduce the
number of attempts on character comparisons and to decrease searching times hence
the mixing of good properties extracted from each algorithm. And these enhancements
were accomplished either through the combination of two functions extracted from each
algorithm for the pre-processing phases and then later pass on to the searching phases
or solely based on only one function extracted from the algorithm for the pre-processing
phase (e.g. BR with SSABS, where only brBc function was used for the new algorithm),
the main concern for all these processes was to derive the maximum shift values to be
used for shifting the window. Some of the hybrid algorithms also do perform better
at certain length pattern sizes e.g. FJS when size ≥ 8, and also ZTBMH, ZTFS that
demonstrated that the longer the pattern the better the performance of the algorithms.
Moreover, another area for enhanced performance can be attributed to the different
types of data and environments such as PC GHz processor, Operating System, type
of database (Swiss-Prot Database), string length, pattern occurrence frequency, pattern
length, and alphabet size. For example in the BR experiment results the test data set
amounted to 1,500,000 separate tests carried out, that of RSMA-BR algorithm data
set obtained from the Swiss-Prot database contains about 8740 proteins. The results
for the number of comparisons, elapsed time, and the number of attempts, were the
major improvements accomplished by each algorithm which was mostly due to the
different extraction of the good properties from each of the algorithms. Though most
of the algorithms do have limitations, the positive evidence is that whenever algorithms
are combined, the overall performance of the algorithm is enhanced significantly than
the previous ones. Some are also very suitable for a specific choice of data set but are
not a suitable choice for others, for example, FJS which is good for protein molecules
containing amino acids but cannot optimize performance for DNA for pattern size starts
to get bigger.
6 Conclusion
The research undertaken focuses on almost all various types of hybrid algorithms currently implemented for string searching. The initiative was to review and highlight string
matching hybrid algorithms and give a summary of their functions and improvements
attributes when the two algorithms are combined and how that can boost the performance
of string searching and matching of patterns. The result realized from the research does
give a free and fair view of all the hybrid algorithms being in use now. In the future,
A Survey of the Hybrid Exact String Matching Algorithms
187
another research will be conducted on the more recent invention of newer algorithms
which is yet to challenge the traditional ones that have been tried and tested.
References
1. Al-Mazroi, A.A., Rashid, N.A.A.: A fast hybrid algorithm for the exact string matching
problem. Am. J. Eng. Appl. Sci. 4(1), 102–107 (2011)
2. Markić, I., Štula, M., Zorić, M., Stipaničev, D.: Entropy-based approach in selection exact
string-matching algorithms. Entropy 23(1), 31 (2021)
3. Prabha, K.S., Mahesh, C., Raja, S.: An enhanced semantic focused web crawler based on
hybrid string matching algorithm. Cybern. Inf. Technol. 21(2), 105–120 (2021)
4. Deusdado, S., Carvalho, P.: GRASPm: an efficient algorithm for exact pattern-matching in
genomic sequences. Int. J. Bioinform. Res. Appl. 5(4), 385–401 (2009). https://doi.org/10.
1504/ijbra.2009.02751
5. Qu, J., Zhang, G., Fang, Z., Liu, J.: A parallel algorithm of string matching based on message
passing interface for multicore processors. Int. J. Hybrid Inf. Technol. 9(3), 31–38 (2016).
https://doi.org/10.14257/ijhit.2016.9.3.04
6. Moh’d Mhashi, M., Alwakeel, M.: New enhanced exact string searching algorithm. IJCSNS
10(4), 193–202 (2010)
7. Al-Khamaiseh, K., Alshagarin, S.: A survey of string matching algorithms. Int. J. Eng. Res.
Appl. 4(7), 144–156 (2014). (Version 2)
8. Alhendawi, K., Baharudin, A.S.: String matching algorithms (SMAs): survey & empirical
analysis. J. Comput. Sci. Manag. 4(7), 2637–2644 (2013). (Version 2)
9. Gladkov, L., Leyba, S., Gladkova, N.: The development of hybrid algorithms and program
solutions of placement and routing problems. In: Silhavy, R., Silhavy, P., Prokopova, Z.,
Senkerik, R., Kominkova, Z. (eds.) CSOC 2017. AISC, vol. 575, pp. 406–415. Springer,
Cham (2017). https://doi.org/10.1007/978-3-319-57141-6_44
10. Javangula, P., Modarre, K., Shenoy, P., Liu, Y., Nayebi, A.: Efficient hybrid algorithms for
computing clusters overlap. Procedia Comput. Sci. 108, 1050–1059 (2017)
11. Lecroq, T.: Fast exact string matching algorithms. Inf. Process. Lett. 102(6), 229–235 (2007).
https://doi.org/10.1016/j.ipl.2007.01.002
12. Almazroi, A.A.: A fast hybrid algorithm approach for the exact string matching problem via
Berry Ravindran and alpha skip search algorithms. J. Comput. Sci. 7(5), 644 (2011)
13. Yeh, M.-C., Cheng, K.-T.: A string matching approach for visual retrieval and classification. In:
Proceedings of the 1st ACM International Conference on Multimedia Information Retrieval,
Vancouver, British Columbia, Canada, pp. 52–58. Association for Computing Machinery
(2008)
14. Navarro, G.: A guided tour to approximate string matching. ACM Comput. Surv. 33(1), 31–88
(2001). https://doi.org/10.1145/375360.375365
15. Michailidis, P.D., Margaritis, K.G.: On-line approximate string searching algorithms: survey
and experimental results. Int. J. Comput. Math. 79(8), 867–888 (2002)
16. Hudaib, A., Al-Khalid, R., Suleiman, D., Itriq, M., Al-Anani, A.: A fast pattern matching
algorithm with two sliding windows (TSW). J. Comput. Sci. 4(5), 393 (2008)
17. Thathoo, R., Virmani, A., Lakshmi, S.S., Balakrishnan, N., Sekar, K.: TVSBS: a fast exact
pattern matching algorithm for biological sequences. Curr. Sci. 91(1), 47–53 (2006)
18. Kalsi, P., Peltola, H., Tarhio, J.: Comparison of exact string matching algorithms for biological
sequences. In: Elloumi, M., Küng, J., Linial, M., Murphy, R.F., Schneider, K., Toma, C. (eds.)
Bioinformatics Research and Development. Communications in Computer and Information
Science, vol. 13, pp. 417–426. Springer, Heidelberg (2008). https://doi.org/10.1007/978-3540-70600-7_31
188
A. A. Almazroi et al.
19. Berry, T., Ravindran, S.: A fast string matching algorithm and experimental results. In: Proceedings of the Prague Stringology Club Workshop 1999, Collaborative Report DC-99-05,
Czech Technical University, Prague, 16–26 (2001)
20. Vijayarani, S., Janani, R.: String matching algorithms for reteriving information from desktop—comparative analysis. In: 2016 International Conference on Inventive Computation
Technologies (ICICT), pp. 1–6. IEEE (2016)
21. Sheik, S., Aggarwal, S.K., Poddar, A., Sathiyabhama, B., Balakrishnan, N., Sekar, K.: Analysis of string-searching algorithms on biological sequence databases. Curr. Sci. 89(2), 368–374
(2005)
22. Al-Mayyahi, M.H.N., Hazim, N., Al-Dabbagh, S.S.M.: Fast hybrid string matching algorithm
based on the quick-skip and tuned Boyer-Moore algorithms. Education 8(6), 117–127 (2012)
23. Franek, F., Jennings, C.G., Smyth, W.F.: A simple fast hybrid pattern-matching algorithm. J.
Discrete Algorithms 5(4), 682–695 (2007)
24. Didier, G., Tichit, L.: Designing optimal-and fast-on-average pattern matching algorithms. J.
Discrete Algorithms 42, 45–60 (2017)
25. Zavadskyi, I.O.: A family of exact pattern matching algorithms with multiple adjacent search
windows. In: Stringology, pp. 152–66 (2017)
26. Huang, Y., Ping, L., Pan, X., Jiang, L., Jiang, X.: A fast improved pattern matching algorithm
for biological sequences. In: 2008 International Symposium on Computational Intelligence
and Design 2008, pp. 375–378 (2008)
27. Kuthadi, V.M.: Detection of proficient and distinct motifs in sequence data sets using PSM. In:
2013 7th International Conference on Intelligent Systems and Control (ISCO), pp. 354–358.
IEEE (2013)
28. Huang, Y., Pan, X., Gao, Y., Cai, G.: A fast pattern matching algorithm for biological sequences. In: 2008 2nd International Conference on Bioinformatics and Biomedical
Engineering, pp. 608–611. IEEE (2008)
29. Prasad, J., Panicker, K.: Single pattern search implementations in a cluster computing environment. In: 4th IEEE International Conference on Digital Ecosystems and Technologies,
pp. 391–396. IEEE (2010)
30. AbdulRazzaq, A.A., Nur’Aini Abdul Rashid, M.A., Abu-Hashem, A.A.H.: A new efficient
hybrid exact string matching algorithm and its applications. Life Sci. J. 11(10), 474–488
(2014)
31. Prasad, J.C., Panicker, K.: Prediction of multiple string searching algorithm performance on
two Beowulf cluster configurations. J. Comput. Math. Sci. 3(1), 19–35 (2012)
32. Klaib, A.F., Osborne, H.: Searching protein sequence database using BRBMH matching
algorithm. Int. J. Comput. Sci. Netw. Secur. (IJCSNS) 8(12), 410–414 (2008)
33. Klaib, A.F., Osborne, H.: BRQS matching algorithm for searching protein sequence databases.
In: 2009 International Conference on Future Computer and Communication, pp. 223–226.
IEEE (2009)
34. Cai, G., Nie, X., Huang, Y.: A fast hybrid pattern matching algorithm for biological sequences.
In: 2009 2nd International Conference on Biomedical Engineering and Informatics, pp. 1–5.
IEEE (2009)
35. Klaib, A.F., Osborne, H.: RSMA matching algorithm for searching biological sequences. In:
2009 International Conference on Innovations in Information Technology (IIT), pp. 195–199.
IEEE (2009)
36. Smyth, W.F., Wang, S.: An adaptive hybrid pattern-matching algorithm on indeterminate
strings. Int. J. Found. Comput. Sci. 20(6), 985–1004 (2009)
A Survey of the Hybrid Exact String Matching Algorithms
189
37. Crochemore, M., Iliopoulos, C.S., Kociumaka, T., Radoszewski, J., Rytter, W., Waleń, T.:
Covering problems for partial words and for indeterminate strings. Theoret. Comput. Sci.
698, 25–39 (2017)
38. Lin, P.-C., Lin, Y.-D., Lai, Y.-C.: A hybrid algorithm of backward hashing and automaton
tracking for virus scanning. IEEE Trans. Comput. 60(4), 594–601 (2010)
39. Xian-feng, H., Yu-bao, Y., Lu, X.: Hybrid pattern-matching algorithm based on BM-KMP
algorithm. In: 2010 3rd International Conference on Advanced Computer Theory and
Engineering (ICACTE), pp. V5-310-V5-313. IEEE (2010)
Data Science
C-SAR: Class-Specific and Adaptive
Recognition for Arabic Handwritten Cheques
Ali Hamdi1(B) , Qais Al-Nuzaili2,5 , Fuad A. Ghaleb3 , and Khaled Shaban4
1 School of Computing Technologies, RMIT University, Melbourne, Australia
alihamdif@gmail.com
2 Faculty of Engineering and Computer Science, Al-Nasser university, Sana’a, Yemen
3 School of Computing, Faculty of Engineering, University of Technology, Johor Bahru,
Malaysia
4 Computer Science and Engineering Department, College of Engineering, Qatar University,
Doha, Qatar
5 Faculty of Engineering and Information Technology, Amran University, Sana’a, Yemen
Abstract. We propose C-SAR, a Class-specific and Adaptive Recognition algorithm for Arabic handwritten Cheques. Existing methods suffer from low accuracy
due to the complex structure of Arabic script and high-dimensional datasets. In
this paper, we present an adaptive algorithm that implements a class-specific classification to address these challenging issues. C-SAR trains a set of class-specific
machine learning models of Support Vector Machines and Artificial Neural Networks features extracted using angular pixel distribution approach. Furthermore,
we propose a class-specific taxonomy of Arabic cheque handwritten words. The
proposed taxonomy divides the Arabic words into groups over three layers based
on their structural characteristics. Accordingly, C-SAR performs classification on
three phases, i.e., 1) similar and non-similar structures, for binary classification,
2) classes with similar structures into another two categories, and 3) class-specific
models to recognize the Arabic word from the given image. We introduce benchmark experimental results of our method against previous methods on the Arabic
Handwriting Database for Text Recognition. Our method outperforms the baseline
methods with at least 5% accuracy having 90% average classification accuracy.
Keywords: Handwritten recognition · Image classification
1 Introduction
Computer vision and image processing methods has been utilised in various pattern
recognition tasks such as image classification [1–4], few-shot learning [5, 6], object
tracking [7, 8] and handwriting recognition [9–12]. Handwriting recognition is a key
component of various applications such as digitizing handwritten manuscripts. Research
on Arabic handwriting recognition has gained increased attention during the last two
decades [13]. Many datasets have been developed to cover different types of documents
written in Arabic [14–16] Arabic Handwriting Data Base for Text Recognition (AHDB)
had been used for cheque literal amount recognition [17]. Existing studies present various
© The Author(s), under exclusive license to Springer Nature Switzerland AG 2022
F. Saeed et al. (Eds.): IRICT 2021, LNDECT 127, pp. 193–208, 2022.
https://doi.org/10.1007/978-3-030-98741-1_17
194
A. Hamdi et al.
methods to increase the cheque word prediction accuracy. However, it has always been
a challenging recognition task due to the characteristics of the Arabic language syntax
and script structure. Processing Arabic is a challenging task in handwriting recognition
and Natural Language Processing. The Arabic language is written in a right-to-left script
system. This system mandates to join word letters in a cursive format that has one or
more components. Thus, Arabic letters are designed to be connected from one or two
sides with other letters. The Arabic language has 29 letters each of which has four
designs according to their position in the written word. Letters in Arabic script can be
grouped based on similar shapes. These challenging characteristics make the recognition
of Arabic handwritten scripts a difficult task. The main research question is how to find
the best discriminative features that produce high accuracy word recognition.
Fig. 1. The C-SAR methodology for Arabic handwritten literal amount in bank cheques.
To address this question, we revisit the baseline methods in statistical feature computing and train machine learning on class-specific approach [18]. We propose C-SAR, a
Class-specific-based Adaptive Recognition Algorithm for Arabic Handwritten Cheque.
We develop an angular feature extraction method that calculates the pixel distribution
over different word-image regions. In this paper, we utilize the AHDB benchmark dataset
of Arabic handwritten literal amounts for bank cheques. However, the dataset has more
than sixty word-classes. Such a relatively high dimensional dataset leads to poor recognition accuracy. Thus, a class-specific taxonomy is proposed for the AHDB dataset based
on the Arabic number syntax and structure characteristics. The proposed taxonomy facilitates the utilization of a class-specific machine learning mechanism. Specifically, we
divide the dataset into groups based on the visual similarity among the Arabic letters.
To train accurate machine learning models by partitioning each group into sub-groups
based on a class-specific similar design. Figure 1 shows the architecture design of the
proposed C-SAR, an Adaptive Recognition for Arabic Handwritten Cheques. C-SAR
performs classification in three phases. First, we partition the dataset classes, according
to the Arabic numbers’ discriminative structural characteristics, into two main groups,
i.e., similar and non-similar structures, for binary classification. Second, we group the
C-SAR: Class-Specific and Adaptive Recognition for Arabic Handwritten Cheques
195
classes with similar structures into two categories. Third, we run the class-specific models to recognize the Arabic word from the given image. This paper presents a set of
contributions to build an accurate recognition system for Arabic handwritten cheque
words, as follows:
1. An implementation of angular statistical feature extraction as a patch-based mechanism that offers a better understanding of the word segments and learns discriminative
pixel distribution features.
2. A novel taxonomy of Arabic cheque words based on the Arabic grammar and visual
structure of each word.
3. Class-specific machine learning according to the proposed taxonomy.
4. An extensive experimental work on AHDB literal amount word recognition.
The rest of this paper is organized as follows. Section 2 presents the related work.
In Sect. 3, the proposed adaptive recognition algorithm is described. The results are
explained in Sect. 4 and the study is concluded in Sect. 5.
2 Related Work
Pixel distribution-based approach is one of the common statistical methods which have
been used in several studies for Arabic digits and text recognition. This approach can be
implemented in different ways such as sliding windows or dividing the text/digit image
horizontally, vertically, or using an angular concept.
Mahmoud and Olatunji [19], have investigated the pixel distribution-based features
on Arabic (Indian) digits using four methods, namely angle, ring, horizontal, and vertical
span methods. In the Angular method, they have used 72 and 36 features produced at
5 and 10 angle span degrees. The average recognition rates were 98.75% and 99.09%
respectively using Support vector machines (SVM). The used dataset contains 21120
Arabic digit images which are divided into two parts: a training set with 75% and
testing set with 25%. Arabic handwriting words recognition has been explored by Mario
and Volker [20]. In their study, the pixel distribution based features were extracted
using a sliding window approach from right to left on normalized images that belong to
IFN/ENIT dataset. This system has achieved an 82% accuracy rate of Arabic handwriting
words recognition. Farah et al. [21] used statistical features with an ANN classifier to
recognize the Arabic word from the bank cheque legal amounts. The recognition accuracy
rate was (74.17%) applied on a dataset of 4,800 words. The dataset was divided into two
equal parts (training and testing sets).
A system for Arabic bank cheque recognition using Hidden Markov Model (HMM)
has proposed also by Cheriet and Al-Ohali [22]. It has used the features from the pen
trajectory that has been extracted from the (Non-touching sub-word) of the legal amount
of CENPARMI database. The system recognition accuracy was 73.53%. In [15, 16]
Al-Ma’adeed et al. studied the Arabic handwritten words on bank cheques using AHDB
dataset. They used 4,700 handwritten words for training and testing. Hidden Markov
Model (HMM) with local statistical and structural features extracted from the Arabic
word bank images achieved a 45% recognition rate, while structural global features
196
A. Hamdi et al.
with neural network accomplished a 63% recognition rate. For Arabic handwritten word
recognition, Al-Nuzaili et al. [23–25] proposed two feature extraction models called
Pixel Distribution feature Model (PDM) and Perceptual Feature extraction Model(PFM).
PDM is a statistical pixel distributed-based feature extraction method that combined
angular, distance, horizontal, and vertical features in one vector. Angular span method
alone with 30 features has achieved a 44.84% recognition rate, while the combination
of all methods (PDM Model) achieved 63.35%. PFM has a structural feature extraction
model. The best recognition rate that PFM has achieved was 77.39%. Both models
have used Extreme Learning Machine (ELM) classifier with AHDB dataset. In [26],
Al-Nuzaili presented Quadratic Angular Model (QAM) to improve the recognition rate
of Arabic handwritten literal amount. QAM has extracted 120 features by dividing the
word image into 4 equal parts. Then, the angular method was applied to every part to
produce 30 features for every part. This model outperformed the conventional Angular
method with a 59.20% recognition rate. Moreover, the combinations of QAM + PDM
and QAM + PFM have archived a better recognition rate with 68.31% and 83.06%,
respectively.
These exiting studies produce poor accuracy due to the characteristics of the Arabic
language syntax and script structure. This paper introduces a new methodology to incorporate the state-of-art advances within a novel class-specific approach that trains a set of
adapted machine learning classifiers according to the Arabic language characteristics.
3 Adaptive Recognition for Arabic Handwritten Cheques
The main problem in the Arabic cheque handwritten recognition is the low accuracy
due to the high dimensionality of the datasets (i.e. 67 classes). The main objective of
this research is to increase classification accuracy. In this paper, we propose an Adaptive Angular Arabic Cheque recognition algorithm. The proposed algorithm is adaptive
because it performs the machine learning classification in three phases according to
the Arabic cheque dataset classes groups, and angular because it uses pixel angular
distribution features methods.
3.1 Angular Feature Extraction Method
There are different statistical methods to calculate the pixel distribution feature. In this
paper, we employ the angular method that has been recently utilized in Arabic handwritten script recognition on the whole word image and image patches [23, 26, 27]. We
combine the angular features with features from the image patches. We slice the given
image into four equal non-overlapping patches. For the original image and each patch,
we compute the angular features as follows. We compute centre of gravity (xc , yc ) as in
Eq. (1).
m n
m n
j=1
i=1 i[ i, j
j=1
i=1 jI i, j
(1)
(xc , yc ) = m n , m n
j=1
i=1 I i, j
j=1
i=1 I i, j
where I is a binary image of dimension m × n, xc and yc are the x- and y- coordinates of
the word COG. We then slice the word image/patch using angular lines with angles of
C-SAR: Class-Specific and Adaptive Recognition for Arabic Handwritten Cheques
197
α degree. The number of black pixels in each slice, i.e., between every two consecutive
lines, is calculated as in Eq. 2.
y = mx + b
(2)
where m denotes the slope of the line, b refers to the y-intercept, m equals to tan (θ)
and θ is the line inclination angle. The number of black pixels in each slice is divided
by the total number of black pixels in the whole word image/patch to compute angular
features. The Number of Angular Features (NOAF) can be calculated as in Eq. (3).
NOAF = 360/α
(3)
Where α refers to the angle degree between every two consecutive lines. After angular
features are extracted, the feature vector is constructed. For example if our parameter
value (α = 12), then NOAF = 360/12 = 30 features.
3.2 Arabic Numbers
The grammar related to the numbers in Arabic is considered to be the most complicated
thing about the language [28]. Table A1 shows the Arabic numbers, their transliteration
and the Indian numbers which used in the Arabic script. The Arabic grammar for numbers
1 and 2 are different from the numbers 3 to 10. The number 1 has in the Arabic language
has many different forms:
1.
2.
3.
4.
/wa.h.idun / for masculine.
/wa.h.dẗ/ for feminine.
/a.̉h.d/ in eleven;
/a.̉h.d shr/ for masculine.
/a.̹ h.dy̱ / in eleven;
/a.̹ h¯. dy̱ shrẗ/ for feminine.
¯
The number Two refers to duals and can be written in different forms:
/a.̹ th˚ na.n/ for masculine nominative.
1.
¯
2.
/a.̹ th˚ a.th˚ naẙni/ for masculine accusative/genitive.
¯ ¯
3.
/a.̹ th˚ nata.ni/ for feminine nominative.
¯
4.
/a.̹ a.th˚ nataẙni/ for feminine accusative/genitive.
¯
5.
/a.th˚ nā/ in twelve;
/a.th˚ nā ashara/ for masculine nominative.
¯
¯
˚
/a.thnaẙ/ in twelve; ¯
/a.th˚ naẙ ashara/ for masculine
6. “
¯
¯
¯
accusative/genitive.
˚
˚
˚
/a.thnatā/ in twelve;
/a.thnatā ashraẗa/ for feminine nominative.
7.
¯ th˚ nataẙ/ in twelve;
¯
/a
/a¯. th˚ nataẙ ash˚ raẗa/ for feminine
8.
.
¯
¯
¯
accusative/genitive.
For plural, the used numbers are from 3 to 10 and have two different forms according
/thla.thẗ/ a feminine used for
to a principle known as a reverse agreement where:
¯ and
¯ the masculine
/thla.thẗ rja.l/; “three men”
masculine entities such as
¯
¯
/thla.th/ is used with feminine such as
/thla.th nsa./; “three women”. This rule
¯ ¯
¯ ¯
198
A. Hamdi et al.
is generalized for the numbers 3–10 such as the number 4
/a.̉rb/ or
/a.̉rbẗ/.
Table A2 illustrates the numbers from 11 to19. The numbers from 20 to 99 are composed
of the even tens and the earlier discussed 1–9. Table A3 shows from 20 to 90. Table A4
/mỷta.ni/
displays the numbers from 100 to 900 except 200 which differs where
/mỷtyn/ for accusative/genitive.
for nominative and
3.3 Class-Specific Taxonomy of Arabic Cheque Words
We propose a class-specific taxonomy to train a set of machine learning models based
on the above-mentioned Arabic numbering characteristics. The proposed algorithm is
adaptive as it performs the machine learning classification in three phases according to
the grouping of the Arabic cheque dataset classes, and angular that uses pixel angular
distribution features methods. In the first phase, the classes could be grouped into two
main groups, named binary, included group a and group b as stated in Table B1. In group
a, the non-similar discrimination classes are grouped. While in group b, the numbers
from three to ten are together. In the second phase, group a are grouped into 8 groups as
shown in Table B2, and group b are grouped into 8 groups (see Table B3). The third phase
is to recognize the target class. In the next subsection, we discuss the angular feature
extraction method, grammar of Arabic numbers, our proposed class-specific taxonomy
based on that grammar, and modelling SVM and ANN machine learning algorithms.
Figure 2 shows two examples for using the proposed Adaptive Angular Arabic Cheque
/ or class fiveb, and two
recognition algorithm. The two classified examples are, five /
thousands / / of class twoh. In the first example fiveb, the proposed algorithm firstly
classified the binary to be in groups b, secondly classified which class in groups b to
and resulted the group five, and finally classified the discriminator b and return the class
Fig. 2. Examples of C-SAR classification
C-SAR: Class-Specific and Adaptive Recognition for Arabic Handwritten Cheques
199
fiveb. On the other hand, in the example twoh, the algorithm task 1 binary classified the
example to be in group a and task 2 classified the example to be in thousand group which
contains the thousand, thousands, twoth and twothb, therefore in task 3 the proposed
algorithm classified it as twoth.
3.4 Machine Learning Models
The extracted angular features are used by SVM and ANN architecture to train classspecific models for each group of words according to the proposed taxonomy. The two
implemented models are down-stream supervised learning tasks over the angular features
representations. SVM computes the classification scores over a set of hyper-planes. It
solves the classification problem by maximizing the separation between the data points.
This maximum separation is achieved over iteration of learning the best hyper-plane that
has largest distances to the data examples. We implement a linear version of SVM that
takes a set of data points each of which is represented as multi-dimensional real vector.
The linear SVM finds the maximum separating hyper-plane. The SVM is implemented
to solve that optimization problem in an unconstrained set up according to the following
loss function:
1
ξ (w; xi , yi )
min wT w + C
w 2
l
(4)
i=1
where w is a feature vector of a set of x and y and C denotes a penalty score greater than
0. An x point is positive if wT w > 0 [29].
We also developed a feed-forward artificial neural network (ANN) to classify handwritten Arabic cheque words as visualized in Fig. 3. The ANN architecture has three
layers. An input layer feeds the angular pixel distribution statistical features into a hidden
layer. The features are fully connected to one hidden layer that calculates the network bias
and weights. The final classification label is computed at an output layer. The weights
of the hidden neurons are calculated based on the weights of the connected features
and bias as shown in examples (z1 and z2) in Eqs. (5, 6 and 7). Equation 7 shows the
computing of the prediction output (o).
z1 = x1 w11 + x2∗ w12 + x3∗ w13 + b1
(5)
z2 = x1∗ w21 + x2∗ w22 + x3∗ w23 + b2
(6)
o = a1 w31 + a2 w32 + b3
(7)
The implemented ANN is described by matrices of the hidden and output layers described
in Eqs. (8 and 9).
x1 x2
w11 w12 w13
w21 w22 w23
⎡
⎤ ⎡ ⎤
x1 w11 + x2 w21
h1
= ⎣ x1 w12 + x2 w22 ⎦ = ⎣ h2 ⎦
x1 w13 + x2 w23
h3
(8)
200
A. Hamdi et al.
⎡
⎤ ⎡ ⎤
h1
1
⎣ h2 ⎦ ⎣ 1 ⎦ = h1 + h2 + h3 = y
h3
1
(9)
Fig. 3. The architecture of the implemented ANN.
The classification output score is calculated as the input features’ element-wise dot
product and a weights matrix kernel. An activation function, e.g., Rectified Linear Units
(ReLU) as in Eq. 10, is then applied on layers weights before computing the final output.
z z>0
ReLU (z) =
(10)
0 z <= 0
Applying ReLU activation is helpful to avoid vanishing gradient. Other activation functions that can be utilised such as Sigmoid and tanh. ReLU requires fewer
computational resources due to its simple mathematical operations.
4 Experiment Results
We run multiple experiments to train and test SVM and ANN on the AHDB groups
according to our proposed taxonomy. The experiments follow the proposed architecture,
as visualized in Fig. 1. We have implemented C-SAR on five main steps as follows:
1. Implement angular method for statistical feature extraction. We first compute the
pixel distribution features of 30 slices on the whole image. Then, we divide the word
image into four equal, non-overlapping patches. Each patch is used to compute the
angular features. Therefore, we compute total 150 angular features; 30 of the original
image and 120 of the four patches.
2. We prepare a mapping dictionary to retrieve sub-sets from the AHDB according to
the proposed C-SAR taxonomy.
3. We then train SVM and ANN models for the three-layer class-specific methodology.
We first train the models to learn the binary groups, i.e., a and b. Then, we train other
models to learn the classification of sub-sets of each of these groups. Finally, we
train the third-layer models to classify the word images classes.
C-SAR: Class-Specific and Adaptive Recognition for Arabic Handwritten Cheques
201
4. We train various models using the different angular feature sets and class-specific
taxonomy groups.
5. All models are evaluated on 10K cross-validation 70% and 30% for train and test.
Table 1 lists the cross-validation results of using different angular features sets, e.g.,
30, 120 and 150 for the whole image, images patches and both, respectively. The results
are shown for taxonomy level groups such as binary, group a and group b, etc. The
experiment results show that the utilized ANN mostly has the best word classification
accuracy over the SVM. Classifying the binary groups has 91% accuracy using the ANN.
The accuracy varies from group to another. This fact highlights the significance of our
proposed C-SAR taxonomy. It harnesses the similarity between each group of classes
while ignoring other noisy classes. That process leads to having 99% accuracy in some
models. Using the combination of the 150 features tends to have the best accuracy in most
cases. However, in some cases, such as group a ethna, using only 30 angular features has
the best results. Another example, using the 120 features for the four image patches have
the best accuracy with multiple class-specific models. This is another benefit of training
classes’ models on other different feature sub-sets. We then select the best performing
model of each group and use them in the final C-SAR framework.
We compare the accuracy of C-SAR with baseline models that are tested on the
AHDB dataset. Table 2 lists the benchmark results and shows that C-SAR outperforms
all other models. The PDM + PFM + QAM combination of models had the previous
best accuracy of 85.85%. We list four different ablations of our proposed model. First,
C-SAR 30 is implemented using the 30 angular features of the whole image. This version
Table 1. 10K cross-validation results using different angular features.
Level
30
120
150
Best
SVM
ANN
SVM
ANN
SVM
ANN
Accuracy
Binary
77%
89%
74%
91%
80%
90%
91%
Groups_a
64%
84%
74%
89%
79%
90%
90%
– Groups a ahad
81%
90%
84%
90%
84%
92%
92%
– Groups a ethna
71%
84%
70%
79%
73%
82%
84%
– Groups a hundered
59%
85%
83%
90%
82%
89%
90%
– Groups a twoh
60%
83%
69%
86%
71%
88%
88%
– Groups a thousand
63%
80%
72%
80%
73%
83%
83%
– Groups a qatari
81%
92%
99%
99%
99%
97%
99%
– Groups a ryal
78%
90%
80%
91%
80%
90%
91%
– Groups a others
91%
91%
87%
94%
91%
95%
95%
Groups b
58%
81%
67%
86%
73%
90%
90%
Groups b discriminators
50%
75%
59%
78%
65%
81%
81%
Average Accuracy
69%
85%
77%
88%
79%
89%
90%
202
A. Hamdi et al.
has 85% average accuracy. Second, C-SAR 120, of the four image patches, has improved
the accuracy to 88% outperforming the baseline models. Third, C-SAR 150 combines
the features of the whole image and its patches. This one has 89% average accuracy
using the ANN. Finally, we list the C-SAR, on the selected model with the best accuracy
in each group. C-SAR has 90% average accuracy outer performing both other versions
and baseline models.
Table 2. Benchmark results.
Model
Recognition accuracy %
Quadratic Angular Model
(QAM)
59.20
PDM Model
64.36
PFM Model
77.39
Combination of PDM +
QAM
68.31
Combination of PDM +
PFM
81.95
Combination of PFM +
QAM
83.06
CFM Model Combination 85.85
of PDM + PFM + QAM
C-SAR 30
85%
C-SAR 120
88%
C-SAR 150
89%
C-SAR
90%
5 Conclusion
We present C-SAR, a class-specific adaptive recognition algorithm for handwritten literal
amount cheque word recognition. C-SAR extracts the angular features and combines
them with features from the image patches. Then, such features are fed to SVM and
ANN-based classifiers. C-SAR is designed on a new taxonomy of class-specific machine
learning models trained on the AHDB dataset. The hypothesis behind the taxonomy is
to reduce the noise and focus the training on the correlated groups of images. The
results show the significance of the proposed method advancing the baseline accuracy
to new state-of-the-art accuracy of 90% on average improving the baseline accuracy by
around 5% on average with some classes reaching 99%. Future research should consider
implementing the class-specific approach within recent Deep Learning mechanism such
as Graph Convolutional Networks and attentional transformers.
Supplemental Material on the Paper “C-SAR: Class-specific and Adaptive
Recognition for Arabic Handwritten Cheques”.
C-SAR: Class-Specific and Adaptive Recognition for Arabic Handwritten Cheques
Appendix A
Table A1. Arabic numbers
Table A2. Numbers from 11–19 in the Arabic language.
Table A3. The Arabic numbers from 20 to 90.
Table A4. The Arabic numbers from hundred to nine hundred except two hundred
203
204
A. Hamdi et al.
Appendix B
Table B1. The proposed binary grouping
a
b
ahad
thousands
three
five
seven
nine
ahda
twoth
threeb
fifty
sevenb
nineb
one
twothb
threeh
fiftyb
sevenh
nineh
ethna
qatari
threehb
fiveb
sevenhb
ninehb
two
qatarya
thirty
fiveh
seventy
ninety
twob
ryal
thirtyb
fivehb
seventyb
ninetyb
hundered
ryala
four
six
eight
ten
hunderedb
gayr
fourb
sixb
eightb
tenb
twoh
milion
fourh
sixh
eighth
twenty
twohb
no
fourhb
sixhb
eighthb
twentyb
thousand
tm
fourty
sixty
eighty
fourtyb
sixtyb
eightyb
Table B2. The non-similar discrimination groups a
Groups a
ahad
ethna
hundered
twoh
thousand
qatari
ryal
others
ahad
ethna
hundered
twoh
thousand
qatari
ryal
gayr
ahda
two
hunderedb
twohb
thousands
qatarya
ryala
milion
one
twob
twoth
no
twothb
tm
Table B3. The similar discrimination groups b
Groups b
three
four
five
six
seven
eight
nine
ten
three
four
five
six
seven
eight
nine
ten
threeb
fourb
fifty
sixb
sevenb
eightb
nineb
tenb
threeh
fourh
fiftyb
sixh
sevenh
eighth
nineh
twenty
threehb
fourhb
fiveb
sixhb
sevenhb
eighthb
ninehb
twentyb
thirty
fourty
fiveh
sixty
seventy
eighty
ninety
thirtyb
fourtyb
fivehb
sixtyb
seventyb
eightyb
ninetyb
C-SAR: Class-Specific and Adaptive Recognition for Arabic Handwritten Cheques
205
Table B4. The discriminators.
Discriminators
NONE
b
h
hb
y
yb
three
threeb
hundered
hunderedb
twenty
twentyb
four
fourb
threeh
threehb
thirty
thirtyb
five
fiveb
fourh
fourhb
fourty
fourtyb
six
sixb
fiveh
fivehb
fifty
fiftyb
seven
sevenb
sixh
sixhb
sixty
sixtyb
eight
eightb
sevenh
sevenhb
seventy
seventyb
nine
nineb
eighth
eighthb
eighty
eightyb
ten
tenb
nineh
ninehb
ninety
ninetyb
Appendix C
Table C1. C-SAR using SVM and ANN on 30 Angular features of the whole image.
Level
binary
Accuracy
Precision
Recall
f1-score
SVM
ANN
SVM
ANN
SVM
ANN
SVM
ANN
77%
89%
77%
89%
89%
77%
74%
89%
groups_a
64%
84%
66%
84%
85%
64%
61%
84%
groups a ahad
81%
90%
82%
90%
91%
81%
81%
90%
groups a ethna
71%
84%
77%
85%
87%
71%
65%
84%
groups a hundered
59%
85%
34%
85%
86%
59%
43%
85%
groups a twoh
60%
83%
76%
83%
84%
60%
47%
83%
groups a thousand
63%
80%
63%
80%
81%
63%
59%
80%
groups a qatari
81%
92%
86%
92%
93%
81%
80%
92%
groups a ryal
78%
90%
84%
89%
90%
78%
76%
90%
groups a others
91%
91%
93%
91%
92%
92%
91%
91%
groups b
58%
81%
60%
81%
82%
58%
55%
81%
groups b discriminators
50%
75%
49%
75%
77%
50%
48%
75%
206
A. Hamdi et al.
Table C2. C-SAR using SVM and ANN on 150 Angular features of the whole image.
Level
Accuracy
Precision
Recall
SVM
SVM
SVM
ANN
ANN
f1-score
ANN
SVM
ANN
binary
80%
90%
79%
88%
80%
90%
78%
89%
groups_a
79%
90%
80%
90%
79%
90%
79%
90%
groups a ahad
84%
92%
85%
93%
84%
92%
84%
92%
groups a ethna
73%
82%
74%
83%
74%
82%
73%
82%
groups a hundered
82%
89%
83%
90%
83%
89%
82%
89%
groups a twoh
71%
88%
71%
89%
71%
88%
71%
88%
groups a thousand
73%
83%
73%
85%
73%
83%
73%
83%
groups a qatari
99%
97%
98%
97%
98%
97%
98%
97%
groups a ryal
80%
90%
82%
91%
81%
90%
80%
91%
groups a others
91%
95%
91%
95%
91%
95%
90%
95%
groups b
73%
90%
73%
90%
73%
90%
73%
90%
groups b discriminators
65%
81%
65%
82%
65%
81%
65%
81%
Table C3. C-SAR using SVM and ANN on 120 Angular features of the whole image.
Level
Accuracy
Precision
Recall
SVM
ANN
SVM
ANN
SVM
ANN
SVM
f1-score
ANN
binary
74%
91%
72%
91%
74%
91%
72%
91%
groups_a
74%
89%
74%
89%
74%
89%
74%
89%
groups a ahad
84%
90%
85%
90%
84%
90%
84%
90%
groups a ethna
70%
79%
70%
80%
71%
79%
70%
79%
groups a hundered
83%
90%
85%
90%
84%
90%
84%
90%
groups a twoh
69%
86%
70%
87%
70%
86%
69%
86%
groups a thousand
72%
80%
71%
82%
71%
80%
71%
81%
groups a qatari
99%
99%
98%
99%
98%
99%
98%
99%
groups a ryal
80%
91%
82%
92%
81%
91%
80%
91%
groups a others
87%
94%
88%
95%
87%
94%
87%
94%
groups b
67%
86%
67%
86%
67%
86%
66%
86%
groups b discriminators
59%
78%
59%
80%
59%
78%
59%
78%
C-SAR: Class-Specific and Adaptive Recognition for Arabic Handwritten Cheques
207
References
1. Hamdi, A., Kim, D.Y., Salim, F.D.: flexgrid2vec: learning efficient visual representations
vectors. arXiv preprint arXiv:2007.15444 (2020)
2. Hamdi, A., et al.: Signature-graph networks. arXiv preprint arXiv:2110.11551 (2021)
3. Li, B., Li, Y., Eliceiri, K.W.: Dual-stream multiple instance learning network for whole
slide image classification with self-supervised contrastive learning. In: Proceedings of the
IEEE/CVF Conference on Computer Vision and Pattern Recognition (2021)
4. Rao, Y., et al.: Global filter networks for image classification. In: Advances in Neural
Information Processing Systems 34 (2021)
5. Hamdi, A., Salim, F., Kim, D.Y.: GCCN: global context convolutional network. arXiv preprint
arXiv:2110.11664 (2021)
6. Liu, S., Wang, Y.: Few-shot learning with online self-distillation. In: Proceedings of the
IEEE/CVF International Conference on Computer Vision (2021)
7. Hamdi, A., Salim, F., Kim, D.Y.: Drotrack: high-speed drone-based object tracking under
uncertainty. In: 2020 IEEE International Conference on Fuzzy Systems (FUZZ-IEEE). IEEE
(2020)
8. Wang, Y., Kitani, K., Weng, X.: Joint object detection and multi-object tracking with graph
neural networks. In: 2021 IEEE International Conference on Robotics and Automation
(ICRA). IEEE (2021)
9. Ahlawat, S., et al.: Improved handwritten digit recognition using convolutional neural
networks (CNN). Sensors 20(12), 3344 (2020)
10. Kulkarni, S.R., Rajendran, B.: Spiking neural networks for handwritten digit recognition—
supervised learning and network optimization. Neural Netw. 103, 118–127 (2018)
11. Qiao, J., et al.: An adaptive deep Q-learning strategy for handwritten digit recognition. Neural
Netw. 107, 61–71 (2018)
12. Rabby, A.S.A., et al.: Ekushnet: using convolutional neural network for Bangla handwritten
recognition. Procedia Comput. Sci. 143, 603–610 (2018)
13. Memon, J., et al.: Handwritten optical character recognition (OCR): a comprehensive
systematic literature review (SLR). IEEE Access 8, 142642–142668 (2020)
14. Mozaffari, S., Soltanizadeh, H.: ICDAR 2009 handwritten Farsi/Arabic character recognition
competition. In: 2009 10th International Conference on Document Analysis and Recognition.
IEEE (2009)
15. Khayyat, M., Lam, L., Suen, C.Y.: Learning-based word spotting system for Arabic
handwritten documents. Pattern Recogn. 47(3), 1021–1030 (2014)
16. Mezghani, A., et al.: A database for Arabic handwritten text image recognition and writer
identification. In: 2012 International Conference on Frontiers in Handwriting Recognition.
IEEE (2012)
17. Al-Ma’adeed, S., Elliman, D., Higgins, C.A.: A data base for Arabic handwritten text recognition research. In: Proceedings Eighth International Workshop on Frontiers in Handwriting
Recognition. IEEE (2002)
18. Hamdi, A., Shaban, K., Zainal, A.: CLASENTI: a class-specific sentiment analysis framework. ACM Trans. Asian Low-Resour. Lan. Inf. Process. (TALLIP) 17(4), 1–28 (2018)
19. Mahmoud, S., Olatunji, S.O.: Handwritten Arabic numerals recognition using multi-span
features & support vector machines. In: Proceedings of the 2010 10th International Conference
on Information Sciences Signal Processing and their Applications (ISSPA), Kuala Lumpur,
Malaysia. IEEE (2010)
20. Mario, P., Volker, M.: HMM based approach for handwritten Arabic word recognition
using the IFN/ENIT- database. In: Proceedings of the Seventh International Conference on
Document Analysis and Recognition, Edinburgh, Scotland. IEEE Computer Society (2003)
208
A. Hamdi et al.
21. Farah, N., Souici, L., Sellami, M.: Arabic word recognition by classifiers and context. J.
Comput. Sci. Technol. 20(3), 402–410 (2005)
22. Cheriet, M., et al.: Arabic cheque processing system: issues and future trends. In: Chaudhuri,
B.B. (ed.) Digital Document Processing. ACVPR, pp. 213–234. Springer, Heidelberg (2007).
https://doi.org/10.1007/978-1-84628-726-8_10
23. Al-Nuzaili, Q., et al.: Pixel distribution-based features for offline Arabic handwritten word
recognition. Int. J. Comput. Vis. Robot. 7(1/2), 99–122 (2017)
24. Al-Nuzaili, Q., et al.: Feature extraction in holistic approach for Arabic handwriting recognition system: a preliminary study. In: 2012 IEEE 8th International Colloquium on Signal
Processing and its Applications (CSPA). IEEE (2012)
25. Perez, C., et al.: Gender classification from face images using mutual information and feature
fusion. Int. J. Optomechatronics 6(1), 92–119 (2012)
26. Al-Nuzaili, Q., Hamdi, A., Hashim, S., Saeed, F., Khalil, M.: An enhanced quadratic angular
feature extraction model for Arabic handwritten literal amount recognition. In: Saeed, F.,
Gazem, N., Patnaik, S., Saed Balaid, A.S., Mohammed, F. (eds.) IRICT 2017. LNDECT, vol.
5, pp. 369–377. Springer, Cham (2018). https://doi.org/10.1007/978-3-319-59427-9_40
27. Al-Nuzaili, Q., et al.: Enhanced structural perceptual feature extraction model for Arabic
literal amount recognition. Int. J. Intell. Syst. Technol. Appl. 15(3), 240–254 (2016)
28. Abboud, P.F., McCarus, E.N.: Elementary Modern Standard Arabic: Volume 1, Pronunciation
and Writing; Lessons 1–30. Cambridge University Press, Cambridge (1983)
29. Keerthi, S.S., et al.: A sequential dual method for large scale multi-class linear SVMs. In:
Proceedings of the 14th ACM SIGKDD International Conference on Knowledge Discovery
and Data Mining (2008)
Extraction of Spatiotemporal Association Rules
for Forest Fires Prediction
Mongi Boulehmi1(B) and Amira Ayadi2
1 VPNC Laboratory, Economics and Management Sciences of Jendouba, University of Legal
Sciences, University of Jendouba, Jendouba, Tunisia
mongiboulehmi@gmail.com
2 VPNC Laboratory, National School of Computer Science ENSI Manouba, Manouba, Tunisia
Abstract. Spatiotemporal association rules extraction is an important and challenging task. It takes into the presence of the spatial and the temporal aspects.
To extract this kind of association, the Support and Confidence measures can be
used. But the application of only these two measures can generate hundreds to
thousands of rules; many of them are redundant and/or trivial. Here we can’t considered them efficient measures because they don’t give good results. In order to
ensure the quality of association rules In this paper we will uses the Apriori algorithm with the Support, the Confidence and the Lift measures of interest to extract
relevant spatiotemporal association rules for the prediction of the forest fires in
the park of Montesinho of Portugal. It is shown that the association of these three
measures can be used effectively.
Keywords: Apriori algorithm · Confidence · Lift · Spatiotemporal association
rules · Support
1 Introduction
With the explosion of new technologies (mobiles, sensors, etc.), large amounts of data
located in space and time have become available. Associated databases are called spatiotemporal databases since each datum is described by space (a city, a neighborhood, a
river, etc.) and by time (the date of an event) information. The extraction of association
rules from this kind of databases is a complex problem. To face these new challenges,
new processes and methods should be developed to better exploit the available data [1].
Our work is within the framework of the spatiotemporal association rule validation,
which is a delicate and interesting step in the process of knowledge extraction. There
are several measures of interest for the evaluation of traditional association rules, but
there are no quality measures specific to spatiotemporal ones. Our research problem is
the choice of the most appropriate quality measures to generate relevant spatiotemporal
association rules. The support and confidence measures of interest are often efficient
but insufficient to generate relevant and adequate results. It is shown, in this work,
that the adding of a third measure, which is the lift, can ensure the quality by limiting
the extracted association rules to more interesting ones. In this paper, we study the
© The Author(s), under exclusive license to Springer Nature Switzerland AG 2022
F. Saeed et al. (Eds.): IRICT 2021, LNDECT 127, pp. 209–218, 2022.
https://doi.org/10.1007/978-3-030-98741-1_18
210
M. Boulehmi and A. Ayadi
extraction of relevant spatiotemporal association rules for predicting forest fires, through
the case study: the Montesinho park in Portugal [2]. The measures of interest “Support”,
“Confidence” and “Lift” are used in the Apriori algorithm which is implemented in a
Matlab environment. It is shown that the use of the lift measure is effective and interesting
spatiotemporal association rules can be obtained [3].
2 Spatiotemporal Association Rule
A spatiotemporal association rule is of the form [4]:
(X , t1) → (Y , t2)
(1)
Where X and Y are sets of spatiotemporal or non-spatiotemporal predicates. The
spatiotemporal association rules have the following form:
(P1, t1) ∩ Pm, t1) → (Q1, t2) ∩ (Qn, t
(2)
Where: at least one of the predicate Pi or Qi is spatial predicate. t1 is a time (interval,
date, time) during which Pi is checked. t2 is a time (interval, date, time) during which Qi
is checked. Knowing that t1 < t2. The subsets (P1, t1) . . . (Pm, t1), (Q2, t2), (Qn, t2)
form the spatiotemporal predicates.
3 Extraction of Spatiotemporal Association Rules Process
Figure 1 shows the spatiotemporal association rules extraction process. It starts by
reading the spatiotemporal database and ends by displaying the association rules extract.
Fig. 1. Steps of the extraction of spatiotemporal association rules
3.1 Pretreatment
In our case, data is heterogeneous and complex and can not be used in its primary form.
Thus, we have to deal with a complex data mining problem. Some transformations and
pretreatments should be done to adapt the original data for use. We adopt, here, the
categorization and the discretization.
Extraction of Spatiotemporal Association Rules for Forest Fires Prediction
211
– Categorization: Categorization consists of placing a set of objects in different categories (classes, types) according to their similarities or common criteria. It is a
fundamental cognitive process in the perception and understanding of concepts and
objects, in decision-making and in all forms of interaction with the environment [5].
– Discretization: Discretization makes possible to modify the characteristics of data
in order to make the subsequent statistical algorithms more efficient, such as the
correction of highly asymmetrical distributions [6].
3.2 Algorithm and Interest Measures Used
Once data are ready to be use, we can apply the appropriate algorithm to extract spatiotemporal association rules. It is with Khoshahval et al. [7], that we have the appearance
of the first association rule extraction algorithm.
This algorithm whose pseudo code is presented in Fig. 2 is called “Apriori”.
Fig. 2. Apriori algorithm (http://software.ucv.ro/˜cmihaescu/ro/teaching/AIR/docs/Lab8-Apr
iori.pdf)
As mentioned before, the support and the confidence measures of interest are used to
extract association rules. and to ensure the quality of the results, a third measure, which
is the lift, is also integrated [8]:
– The support indicates the number of transactions in the database that supports the
rule. It allows measuring the frequency of the association. The support is expressed
as:
Support(X → Y ) = freq(X ∪ Y )
(3)
– The Confidence is the proportion of transactions containing X that carry Y. The
Confidence level is a measure of the strength of the association. The Confidence
is mathematically formulated as:
Conf (X → Y ) = prob(Y |X ) = freq(X ∪ Y )/f req(X )
(4)
– The Lift: Confidence of the rule divided by the expected value of Confidence.
Mathematically, it is given by:
Lift(X → Y ) = p(X ∩ Y )p(X ).p(Y )
(5)
212
M. Boulehmi and A. Ayadi
3.3 Post-treatment
Once data are treated, a post-treatment phase is still necessary to get readable results.
We use, in our case, decryption which consists of adapting the results in a displayable
form.
4 Experimental Design
The Apriori Algorithm is implemented in a Matlab environment based on a hp machine
with a Windows 7 operating system, having a 2.4 GHz Intel Core i5 processor and a 4 GB
of RAM. The database is that of forest fires in Montesinho park in Portugal, collected
by using the Canadian method [9], Fig. 3.
Fig. 3. The Canadian fire information system diagram (Cortez 2007)
An extract of this database is presented in Table 1.
Table 1. The Canadian fire information spatiotemporal forest fire database (http://archive.ics.uci.
edu/ml/machinelearning-databases/forest-fires/)
X Y Month Day
FFMC DMC
7
5
Mar
Fri
86.20
26.20
7
4
Oct
Tue
90.60
7
4
Oct
Sat
90.60
8
6
Mar
Fri
8
6
Mar
8
6
Aug
8
6
Aug
Mon 92.30
DC
94.30
ISI
Wind Rain Area
8.20 51.00 6.70
0.00
0.00
35.40 669.10
6.70 18.00 33.00 0.90
0.00
0.00
43.70 686.90
6.70 14.60 33.00 1.30
0.00
0.00
97.70
33.00
9.00
0.20
0.00
Sun
89.30
51.30 102.20
9.60 11.40 99.00 1.80
0.00
0.00
Sun
92.30
85.30 488.00 14.70 22.20 29.00 5.40
0.00
0.00
88.90 495.60
0.00
0.00
77.50
5.10
Temp RH
8.30 97.00 4.00
8.50 24.10 27.00 3.10
(continued)
Extraction of Spatiotemporal Association Rules for Forest Fires Prediction
213
Table 1. (continued)
X Y Month Day
FFMC DMC
DC
ISI
8
6
Aug
Mon 91.50
145.40 608.20 10.70
8
6
Sep
Tue
91.50
7
5
Sep
Sat
92.50
Temp RH
Wind Rain Area
8.00 86.00 2.20
0.00
0.00
129.50 692.60
7.00 13.10 63.00 5.40
0.00
0.00
88.00 698.60
7.10 22.80 40.00 4.00
0.00
0.00
With: X: Coordinate of the x-axis (from 1 to 9). Y: Coordinate of the y-axis (from
1 to 9). Month: Month of the year (from January to December). Day: Day of the week
(Monday to Sunday) [10]:
•
•
•
•
•
•
•
FFMC: Fine Fuel Moisture Code. DMC: Duff Moisture Code.
DC: Drought Code.
ISI: Initial Spread Index.
Temp: Outside temperature (in Celsius degrees).
RH: Relative Outdoor Moisture (in %).
Wind: Wind speed outside (in Km/h). Rain: Outside rain (in mm/mm2 ).
Area: Total burned area (in ha).
The full database can be found in (http://archive.ics.uci.edu/ml/machine-learning
databases/forest-fires/), the map of the Montesinho natural park is given in [11] and
the Fire Weather Index (FWI) used is structured as presented in Table 2.
Table 2. Fire Weather Index categorization (http://cwfis.cfs.nrcan.gc.ca/background/summar
y/fwi)
Index
Low
Moderate
High
Very high
Extreme
FFMC
0–81
81–88
88–90.5
90.5–92.4
92.5+
DMC
0–13
13–28
28–42
42–63
63+
DC
0–80
80–210
210–274
274–360
360+
ISI
0–4
4–8
8–11
11–19
19+
DUI
0–19
19–34
34–54
54.77
77+
FWI
0–5
5–14
14–21
21–33
33+
It is important to remember that our approach consists of using interest measures
[12] Support and Confidence to extract association rules for the prediction of forest
fires. To ensure the quality of the obtained rules, the Lift is applied. Categorization and
discretization are used for the pretreatment of data while decryption is for getting readable
results. In the following part, some results of the Apriori algorithm implementation on
the spatiotemporal database abovementioned are given.
214
M. Boulehmi and A. Ayadi
5 Association Rules Obtained and Interpretation
For a minimum Support of 30 and a minimum Confidence of 50, 467 association rules
were obtained and could be interpreted in several ways. We present in Fig. 4 some
extracted association rules where area is considered negligible if it is less than 100 m2
[13].
Fig. 4. Frequent motifs obtained from the database studied
For example, the extracted association rule number 69, which is considered important, can be analyzed and evaluated as follows: we can note that the northwestern region
is the most affected area, and the summer season is the most appropriate for fires in
the Montesinho park. The DC and DMC indexes with extreme values are also present
in this significant motif [14]. These indexes accompany a light rain because of the relative increase in temperature, with negligible amounts of rain, which generates a high
probability for significant areas of the park to be burned. But in this rule, we notice the
absence of the area attribute, which can be explained by the fact that a small negligible
area can be fired under the same atmospheric conditions as before
Rule #69
Region = NorthWest|Quarter = T3|DC = Extreme|→ Rain
= lowcontinuous|
DMC = Extreme
Support = 0.30792; confidence = 0.98565, Lift = 1.3402
Another notable association rule obtained is the rule number 31. It shows a strong
correlation between (Rain = low and continuous), the quarter 3 which is summertime,
Extraction of Spatiotemporal Association Rules for Forest Fires Prediction
215
an extreme DC and a day other than the week-end. It is important to note that for the
rain, we have used the categorization shown in Table 3.
Rule #31
Rain = Low and continuous|Quarter = T3|Day
= otherthan week − end → DC = Extreme|
Support = 0.44843; confidence = 1, Lift = 1.3143
Table 3. Rain categorization 1
Low and continuous:
1_3 mm/hour
Moderate rain:
4_7 mm/hour
Heavy rain:
8 mm/hour and more
We present, in Fig. 5, the Lift measure and its impact on the number of association
rules. We can note that the number of rules that have a (Li ft ≥ 1) is more significant
than those which have a (Li ft < 1). We should mention that we have to deal only with
the association rules whose Lift value exceeds 1.
Fig. 5. Representative chart of the number of association rules according to the Lift value
We illustrate, in Fig. 6, the variation of the number of association rules according
to interval 0.1 of the Lift. – We note that the majority of rules have a Lift between 1.3
and 1.4, (1.3 ≤ Li ft ≤ 1.4): which explains that the results of the rule have positively
correlated with the premises of the rules.
– In the neighborhood of 1, we have almost 100 rules, which implies that they are not
of interest and that the items are independent.
– But, if the Lift is less than 1, the number of rules is less important showing items that
are negatively correlated.
216
M. Boulehmi and A. Ayadi
Fig. 6. Variation of the number of association rules according to interval 0.1 of the lift
Figure 7 illustrates the frequency of spatial and temporal items in spatiotemporal
association rules. We can observe that forest fires in Montesinho park are probably
triggered at the beginning and/or in the middle of the week of the third quarter of the
year, namely June, July and August, and this is in the north-west region of the park, to
ravage significant areas of it.
Fig. 7. Representative chart of occurrences of spatiotemporal items in spatiotemporal association
rules
The frequency of appearance of the items set in the association rules is presented in
Fig. 8.
Extraction of Spatiotemporal Association Rules for Forest Fires Prediction
217
Fig. 8. Items frequency of occurrence in association rules
6 Conclusion
To sum up, in this paper, we have studied the spatiotemporal association rules extraction.
Because forest fire is a natural disaster which can touch many countries in the world such
as Tunisia, we have used the forest fire database in Montesinho park of Portugal as a
case study to implement our approach. Discretization and categorization are done for the
data pretreating. The Support, the Confidence and the Lift are applied using the Apriori
algorithm in a Matlab environment. To get readable results, a decryption technique is
implemented. The spatiotemporal association rules obtained confirm the validation of
the approach for this kind of problem. To approve the fiability of Matlab environment
we will implement Apriori alghorithm with another environment like python.
References
1. Burrough, P.A., McDonnell, R.A., Lloyd, C.D.: Principles of Geographical Information
Systems. Oxford University Press, Oxford (2015)
2. Boulila, W., Farah, I.R., Hussain, A.: A novel decision support system for the interpretation
of remote sensing big data. Earth Sci. Inf. 11(1), 31–45 (2017). https://doi.org/10.1007/s12
145-017-0313-7
3. Aguirre, L.A., Teixeira, B.O.S., Barbosa, B.H.G., Teixeira, A.F., Campos, M.C.M.M.,
Mendes, E.M.A.M.: Development of soft sensors for permanent downhole gauges in
deepwater oil wells. Control Eng. Pract. 65, 83–99 (2017)
218
M. Boulehmi and A. Ayadi
4. Xue, C., Song, W., Qin, L., Dong, Q., Wen, X.: A spatiotemporal mining framework for
abnormal association patterns in marine environments with a time series of remote sensing
images. Int. J. Appl. Earth Obs. Geoinf. 38, 105–114 (2015)
5. Brosch, T., Pourtois, G., Sander, D.: The perception and categorisation of emotional stimuli:
a review. Cogn. Emotion 24(3), 377–400 (2010)
6. Coulibaly, L., Kamsu-Foguem, B., Tangara, F.: Rule-based machine learning for knowledge
discovering in weather data. Future Gener. Comput. Syst. 108, 861–878 (2020)
7. Khoshahval, S., Farnaghi, M., Taleai, M.: Spatio-temporal pattern mining on trajectory data
using arm. Int. Arch. Photogramm. Remote Sens. Spat. Inf. Sci. 42, 395–399 (2017)
8. Grabot, B.: Rule mining in maintenance: analysing large knowledge bases. Comput. Ind. Eng.
139, 105501 (2020)
9. Al-Kahlout, M.M., Ghaly, A.M.A., Mudawah, D.Z., Abu-Naser, S.S.: Neural network approach to predict forest fires using meteorological data. Int. J. Acad. Eng. Res. (IJAER) 4(9),
68–72 (2020)
10. Al-Zebda, A.K., Al-Kahlout, M.M., Ghaly, A.M.A., Mudawah, D.Z.: Predicting forest fires
using meteorological data: an ANN approach (2021)
11. Loia, V., Orciuoli, F., Pedrycz, W.: Towards a granular computing approach based on formal
concept analysis for discovering periodicities in data. Knowl.-Based Syst. 146, 1–11 (2018)
12. Chen, X., Lawrence Zitnick, C.: Mind’s eye: a recurrent visual representation for image
caption generation. In: Proceedings of the IEEE Conference on Computer Vision and Pattern
Recognition, pp. 2422–2431 (2015)
13. Coulibaly, L., Kamsu-Foguem, B., Tangara, F.: Rule-based machine learning for knowledge
discovering in weather data. Future Gener. Comput. Syst. 108, 861–878 (2020)
14. Liu, Y., You, M., Zhu, J., Wang, F., Ran, R.: Integrated risk assessment for agricultural drought
and flood disasters based on entropy information diffusion theory in the middle and lower
reaches of the Yangtze River, China. Int. J. (2019)
Opinion Mining Using Topic Modeling:
A Case Study of Firoozeh Dumas’s Funny
in Farsi in Goodreads
Muhamad Aiman Zikri Bin Muhamad Asri1 , Pantea Keikhosrokiani1(B) ,
and Moussa Pourya Asl2
1 School of Computer Sciences, Universiti Sains Malaysia, 11800 Minden, Penang, Malaysia
pantea@usm.my
2 School of Humanities, Universiti Sains Malaysia, 11800 Minden, Penang, Malaysia
Abstract. The rapid growth of the Internet and the social networking services
(SNS) has allowed readers from across the globe to share their thoughts and feelings about literary works through social media platforms like Twitter, Goodreads,
and Facebook, to name only a few. This study aims to perform text mining techniques—opinion mining using topic modeling—to examine the range of topics
that are explored within reader reviews in social media. In pursuit of this goal, the
study focuses on 844 Goodreads reviews of the Iranian diasporic writer Firoozeh
Dumas’s Funny in Farsi to analyze the variety of topics that are covered in readers’
responses. As topic modelling techniques, LDA and LSA are utilized to detect,
compare and evaluate the major topics within the dataset. The optimum number
of topics for both LDA and LSI is 3 with a coherence score of 0.50451438 and
0.4573542, respectively. Based on the overall performance, LDA is considered
the best topic modelling method for this study.
Keywords: Opinion mining · Social media analytics · Topic modelling ·
Goodreads · Funny in Farsi
1 Introduction
The rapid growth of the Internet and the social networking services (SNS) has provided
people around the world with a platform to express their opinions about a particular
product, subject or topic. With regards to literary works and creative writings, readers
from across the globe are now sharing their ideas, thoughts and feelings through social
media platforms like Twitter, Goodreads, and Facebook, to name only a few. Observing
and analyzing reader reviews are of great importance for publishers, booksellers and
libraries for various reasons such as marketing and prize endowment. Previous studies
have pointed to the impact of social networking services for product and service improvement among users [1, 2]. However, observing reader responses and analyzing the major
topics of discussion, or areas of interest and dissatisfaction, from a huge number of
reader reviews pose an enormous technical and methodological challenge.
© The Author(s), under exclusive license to Springer Nature Switzerland AG 2022
F. Saeed et al. (Eds.): IRICT 2021, LNDECT 127, pp. 219–230, 2022.
https://doi.org/10.1007/978-3-030-98741-1_19
220
M. A. Z. B. M. Asri et al.
This study aims to perform text mining techniques—that is, opinion mining using
topic modeling—to examine the range of topics that are explored within reader reviews
in social media. In pursuit of this goal, the study focuses on the Goodreads reviews of
the Iranian diasporic writer Firoozeh Dumas’s Funny in Farsi: A Memoir of Growing
Up Iranian in America to analyze the variety of topics that are covered by readers across
the world. Published in 2003, the novel has drawn a lot of public and critical responses
from fans and critics in form of short comments or brief reviews.
Text mining is a form of data mining where the data is extracted from a huge amount of
text-based to produce a piece of meaningful information [3–6]. It is a process to transform
the unstructured data format to the structured format [7] that can show clear patterns
of their relationships with others. Unstructured data is raw data with no predefined
data format such as text from social media, video, and audio. Structured data is in
contrast with the unstructured data where the data is standardized with the predefined
data format such as in a tabular form that consists of rows and columns and has inputs
such as name, age, ID, etc. The structured data is used for further inspection in decision
making, product planning, improvisation, etc. The text data for text mining uses natural
language processing (NLP) and machine learning that allow the machine to understand
and process the human language. Despite the advantages of text mining, using this
technique might pose two potential difficulties that this study will seek to overcome:
First, the extraction of text from users’ reviews in Goodreads can be challenging because
of readers’ usage of various languages, text abbreviations and emotion icons (emoji).
This might lead to detection of unnecessary, unrecognized, and repeated words that can
reduce the accuracy of the results. Second, assigning a topic based on users’ reviews is
not as easy as assigning a topic from a digital-based document because it might contain
a variety of text and emojis.
Therefore, in this paper, we conduct social media mining where the data is in textual
form and scraped from users’ reviews. Then, further analysis with the help of topic
modelling tools is performed on the data to extract the major topics within the reviews.
It is hoped that the study’s observations on how the tools work on the text data can benefit
service providers in policy and decision makings.
2 Literature Review
2.1 Social Media Mining
Social media has become a popular medium for communication in this modern day.
People around the world can communicate with each other without any boundaries
separating them from doing so. Social media also contains a huge amount of data that
can be useful if properly analysed. For instance, they can increase the popularity of a
literary work, movie or product in business. So, a new field of study has been created
with a combination of big data and social media which is called social media mining.
Social media mining is the process of analysing, representing, and extracting patterns
of the data collected from social media [8, 9]. Facebook, Twitter, and Instagram are
examples of common social media services used in social media mining to analyse the
popular topic among users and draw the conclusion for various purposes.
Opinion Mining Using Topic Modeling
221
2.2 Topic Modelling
Topic modelling is a statistical model-based technique for inferring hidden topics that
exist in text documents. A series of documents that exist in raw data may consist of many
hidden or undiscovered topics where each text should belong and connect between text
and topic [2]. The process of classifying text to their corresponding topic is called topic
modelling. There are many tools used for topic modelling; some of the famously used
tools are Latent Dirichlet Allocation (LDA) [10] and Latent Semantic Indexing (LSI)
[11]. In this way, a variety of topics can be extracted from a large document set in a short
time thus producing a meaningful result.
Latent Semantic Analysis (LSA), also known as Latent Semantic Indexing (LSI),
is a word modelling and simulation method in search of their meaning by analysing
the natural text corpora representative. It is commonly used in text summarization,
classification, and dimension reduction. LSA generates a document-term matrix in the
corpus from the words present in the documents’ paragraphs. The row represents unique
words found in each paragraph while the column represents each paragraph. TF-IDF
score is used within the document-term matrix to replace the raw counts. LSA also used
singular value decomposition (SVD) to perform matrix decomposition that reduces the
matrix number of rows [12].
Probabilistic Latent Semantic Analysis (pLSA), a novel technique proposed by
Thomas Hoffman [13] is an LSA model with the probabilistic method instead of SVD to
find a probabilistic model with latent topics that can generate data observe in a documentterm matrix and for the analysis of two-mode and co-occurrence data. pLSA used the
expectation-maximization (EM) algorithm to train the multinomial distribution. It is a
method that finds the parameter likeliest estimates for a model which is unobserved
latent variables dependant.
Latent Dirichlet Allocation (LDA), proposed by David M. Blei et al. [10], is a
Bayesian version pLSA. It is a corpus generative probabilistic model. Dirichlet distribution is used for document-topic and word-topic distributions that make the new
document generalization better than LSA and pLSA. The Dirichlet distribution is a way
of sampling probability distributions of a specific type.
3 Methodology and Materials
The methodology adopted for this study is based on the Cross Industry Process for Data
Mining (CRISP-DM) which is a six phases process model to represent the data science
life cycle. The six phases consist of business understanding, data understanding, data
preparation, modelling, evaluation, and deployment. Normally, in real-life situations, all
six phases will be executed depends on the goal of our data science study. Currently, the
CRISP-DM has been modified a little bit for this study where the deployment phase is
eliminated.
Figure 1 shows the framework for this study that includes business understanding,
data understanding, data preparation, modelling, and evaluation. For topic modelling,
LDA and LSA were utilized, and the results are compared.
The data used for this study is taken from Goodreads. A number of 844 readers’
reviews of the Iranian writer Firoozeh Dumas’s Funny in Farsi: A Memoir of Growing
222
M. A. Z. B. M. Asri et al.
Up Iranian in America is extracted for the purpose of opinion mining. The memoir
describes the author’s move from Iran to the United States in the 1970s and the ensuing
challenges of cultural encounters. In recent decades, diasporic life writings by Iranian
women have attracted international attention [14, 15]. Funny in Farsi has likewise evoked
considerable public and media responses that deserve critical examination.
Fig. 1. Data science lifecycle
4 Results
In this study, the data was gathered from the Goodreads website based on the reviews of
the novel. First, the extracted data will undergo text normalization while performing data
cleaning related processes to remove any repetition and unnecessary data for producing
high-quality data before the next process.
Then, topic modelling and sentiment analysis are performed to analyse and extract
patterns or relations of the data which is the main purpose of this study. The following
obtained results are explained below.
4.1 Text Normalization
Figure 2 shows the result of the book’s rating against the number of users. Based on
the data scraped from the reviews of Goodreads website for a book, Funny in Farsi: A
Memoir of Growing Up Iranian in America, there was a total of 848 users’ reviews but
Opinion Mining Using Topic Modeling
223
only 819 users’ reviews were showed in the bar chart above as 29 of them did not rate
the book. The figure above shows the number of users’ reviews that were rated from 1
to 5 stars where the 4 stars form the majority of ratings (338 users) and the 1 star has
the least number of users of 23 users. To conclude this bar chart, this book received a
positive rating among the majority of users.
Fig. 2. Bar chart of book’s rating
As for the next diagram, data cleaning was performed to remove the stop words
found in the users’ reviews that can reduce result accuracy for the rest of the process.
Then, the lemmatization process is done to link the words that have similar meanings
by grouping them, thus avoiding redundancy.
4.2 Text Visualization
Text visualization is a technique to illustrate the outcome of processes for human reading.
For this section, a bar chart, Wordcloud and pie chart were used to present the results
after data cleaning was executed. In this way, a better inspection can be conducted to
view the pattern of the data.
Fig. 3. Diagram of bar chart of top 10 common words
224
M. A. Z. B. M. Asri et al.
Figure 3 above shows the occurrence of common words counted from 844 reviews.
The figure above shows that the word ‘family’, is the most frequent word presented which
counted 532 times followed by ‘funny’ with 455 counts and ‘iranian’ with 422 counts.
The words ‘firoozeh’, ‘culture’, ‘people’, ‘america’, ‘american’, ‘life’, and ‘immigrant’
have a slight count’s difference when compared together and significant count’s difference when compared with the top three words stated before. This bar chart also shows
the relationship of these words with the storyline of the book which points out the book’s
theme.
Figure 4 shows a bigram words diagram where each sentence consists of two words
that appeared frequently in the users’ reviews. As we can see, “funny farsi” appeared
with the biggest bigram font size and was indicated as the highest frequency bigram. This
is also followed by “firoozeh duma”, “iranian culture”, and “immigrant experience”. The
appeared bigram in this figure is based on a collection of 100 frequent words that exist
from the reviews. From this figure, we can conclude that as the bigram words’ size is
increased, it shows that the words’ frequency is higher.
Based on the result above, most of the bigram words shown are meaningful and are
related to the book’s story. The “funny farsi” and “firoozeh duma” refer to the title and
author of this book, respectively. This book was based on the life of an Iranian in the
United States of America as an immigrant facing many challenges.
Fig. 4. Diagram of bigram wordcloud
Figure 5 shows a trigram words diagram where each sentence consists of three words
frequently used by the users in their reviews. A trigram with the biggest font size is the
most frequent word used by the users. As we can see from the figure above, both “big
fat greek” and “fat greek wedding” are the most frequent trigram occurred in the users’
reviews. The result above is gathered based on 100 trigrams processed from the users’
reviews.
Based on the result of the trigram words above, all these words are meaningful. The
“big fat greek” and “fat greek wedding” trigrams are related to a movie titled My Big
Fat Greek Wedding whose storyline is quite similar to this book and is differentiate only
by their nationality. The “religion” related trigram can be found in some reviews where
they quoted it from the book as follow: “… There are good and bad people in every
religion.”.
Opinion Mining Using Topic Modeling
225
Fig. 5. Diagram of trigram wordcloud
4.3 Topic Modeling
Topic modelling is an unsupervised machine learning technique used for clustering
words and similar expressions in form of a topic or more that best characterize a set
of documents. This can be done using topic modelling models such as Latent Semantic
Analysis (LSA) and Latent Dirichlet Allocation (LDA). The results presented below
were processed and acquired using LDA.
Fig. 6. Top 30 words for whole topics
Figure 6 above shows the top 30 words that regularly appeared in users’ reviews with
3 bubbles of topic. This figure shows the overall result for the topic available based on
the users’ reviews together with their most occurrence words. As we can see from the
figure above, the words such as ‘funny’, ‘family’, ‘iranian’, ‘firoozeh’ and ‘duma’ have
occurred in the reviews with high frequency compared to others.
Figure 7 shows the top 30 words that appeared in the users’ comments for topic 1.
Topic 1 has the biggest bubble compared to topic 2 and topic 3. Roughly, this shows topic
226
M. A. Z. B. M. Asri et al.
1 is the most common topic discussed in the reviews. The words such as ‘funny’, ‘family’,
‘iranian’, ‘american’, and ‘duma’ are the most frequently appeared in the reviews and
highlighted with the blue bar. The red bar that overlaps with the blue bar indicates the
most common word used in the reviews belonging to this topic where ‘funny’, ‘family’
and ‘iranian’ have the highest frequency of occurrence as these words mainly discuss
the title and some expression towards this book. In addition, the red bars that appeared
in this topic have the highest cumulative words frequency compared to other topics that
strongly made it a major topic among reviewers.
Fig. 7. Top 30 words for topic 1
From 30 words listed in the figure above, the word, ‘funny’, ‘iranian’, ‘memoir’,
‘author’ and ‘america’ are related to the title and storyline of this book where the author,
an Iranian migrated to America, thus created meaningful memories in her life as a
foreigner. Some words such as ‘fun’, ‘great’, ‘good’ and ‘interesting’ were related to the
reviewers’ expression towards the story of this book. To conclude, this topic was mixed
between the title and expression of the book based on the frequent words in the figure
above, but these words are meaningful and relatable.
Figure 8 shows the top 30 words presented in the users’ reviews for topic 2. Based on
the intertopic distance map, the topic 2 bubble resides below topic 1 on the right side of
the line. This may show that topic 2 might have similarities with topic 1 or continuation
of the latter topic but both were distanced from each other and never overlap. Mostly, the
top 30 words appeared in topic 2 have similarity with the topic 1 and some of the words
are different. The words appearance in topic 2 show that the users were discussing the
characters and scenes of the story plot. For example, according to one of the reviewers,
‘family, ‘father’ and ‘engineer’ were the words that pointed to the author’s father who
was a senior engineer and head of her family. ‘School’ is another word that pointed to a
scene where the author was on her first day at elementary school in America.
Opinion Mining Using Topic Modeling
227
Fig. 8. Top 30 words for topic 2
In conclusion, the stated examples and the storyline of this book was relatable and
connected. This topic shows how the reviewers’ discussion was related to this book with
the frequent words that appeared in the figure above.
Fig. 9. Top 30 words for topic 3
Figure 9 above shows the result of the top 30 words that appeared in users’ reviews
for topic 3. Topic 3 has the smallest bubble compared to topics 1 and 2 which indicates it
is not commonly used or high frequency of appearance in the users’ reviews. Out of 30
words found based on the figure above, only a few words have higher counts highlighted
in blue colour such as ‘nice’, ‘page’, ‘age’, ‘week’, etc. In this topic, some appeared
words can be categorized as impression towards the story of this book were ‘boring’,
‘nice’, shame’, ‘regret’, ‘weird’ and ‘sadness’ are words related to emotional expression.
As for this topic, it shows users’ expression or criticism towards this book and its story
that contribute to the quality and popularity of this book.
228
M. A. Z. B. M. Asri et al.
Based on the frequent words in the figure, some reviewers expressed their thought
on this book or its story as boring while some of them expressed it as nice. There was
not much to discuss in this topic among the reviewers thus rank in the smallest bubble
among the other topics.
5 Discussion and Conclusion
The text analysis performed on data collected from readers’ reviews posted in Goodreads
website has given us an overview of how topic modelling operates. The major topic
discussed among 844 users was evaluated as explained in the result section. The obtained
results encountered some unnecessary and repetitive data that could affect the accuracy
of results.
In this study, we used the scraping method to extract reviews directly from Goodreads
website for the book titled Funny in Farsi as our data for discovering major topics. For
observing the major topic, LDA and LSI were used to test several topics from 1 to 10
and each topic was computed with a coherence score. The highest computed coherence
score is indicated with the number of optimum topics as their best topic. Below is the
graph of comparison between LDA and LSI to show the difference of coherence score
for each topic.
Based on Fig. 10, we can see that the LDA’s coherence score for each topic has a
slight difference from the LSI’s. The optimum number of topics for both LDA and LSI
is 3 with a coherence score of 0.50451438 and 0.4573542, respectively. When measured
in terms of the score for each topic, the LDA took a lead where it has a better and higher
score compared to LSI even for a small difference. Based on the overall performance,
LDA is considered the best topic modelling method for this study.
The analysis made on the overall results shows that the majority of users were discussing the book’s author, the story backgrounds and some characters that appeared in the
book. This is supported by the bar chart and bigram Wordcloud in the text visualization
section and 3 topics in the topic modelling section.
Furthermore, a detailed observation has been made and weaknesses were found
where the results were affected. As for the beginning, the scrapped data as a basis for
this study were limited to 900 reviews and left with 844 unique reviews after 56 duplicate
reviews were removed. The existing data was not sufficient to provide the best result for
the whole remaining process, thus reducing the tools potential to perform analysis on the
data. The stop words used in the study codes only contain the whole word while short
form or abbreviation is excluded. Moreover, the data words result still contain some
stop words even though the cleaning has been made. It has caused unnecessary data to
accumulate and be scattered in the pool of data and affect the entire result. Some reviews
contained words and sentences in languages other than English. Since this study only
accepts English words, and to maintain all data in English, we performed another data
cleaning to remove those words and sentences, thus reducing more of our data.
The growing popularity of the digital platforms and social network services has created an opportunity for service providers such as publishers and booksellers to understand users and readers’ thoughts and expressions about a product or a literary work.
By performing topic modelling analysis on the readers’ responses in Goodreads to the
Opinion Mining Using Topic Modeling
229
Coherence Score
Coherence Score of LDA and LSI
0.6
0.4
0.2
0
1
2
3
4
5
6
7
8
9
Number of Topic
LDA
LSI
Fig. 10. Comparison of coherence score for topic modeling models
novelist Firoozeh Dumas’s Funny in Farsi, this study highlighted major topic values
shared among the public. The satisfaction and dissatisfaction come across users’ mind
cannot be taken for granted as it might affect their public relations. From the users’
reviews, the discovered topics also draw attention to important areas for improvement
and further analysis. This should trigger the decision making on satisfying the readers’
needs and eliminate any flaws.
In the future, we hope that the limitations found in this study can be improved and
fixed so that any unwanted fault can be reduced or gone. Data mining is a crucial and
risky task because it involves analyzing data that may contain personal and governmentrelated information where it may lead to any illegal cases such as data fraud, data breach
and privacy infringement. Moreover, machine learning and natural language processing
is evolving where more functions are added, and old functions are revised so that they
can support many occurrence events in future.
References
1. Ghose, A., Ipeirotis, P.G.: Estimating the helpfulness and economic impact of product reviews:
mining text and reviewer characteristics. IEEE Trans. Knowl. Data Eng. 23, 1498–1512
(2011). https://doi.org/10.1109/TKDE.2010.188
2. Jeong, B., Yoon, J., Lee, J.M.: Social media mining for product planning: a product opportunity
mining approach based on topic modeling and sentiment analysis. Int. J. Inf. Manag. 48,
280–290 (2019). https://doi.org/10.1016/j.ijinfomgt.2017.09.009
3. Hashimi, H., Hafez, A., Mathkour, H.: Selection criteria for text mining approaches. Comput.
Hum. Behav. 51, 729–733 (2015). https://doi.org/10.1016/j.chb.2014.10.062
4. Jung, H., Lee, B.G.: Research trends in text mining: Semantic network and main path analysis
of selected journals. Expert Syst. Appl. 162, 113851 (2020). https://doi.org/10.1016/j.eswa.
2020.113851
5. Ying, S., Keikhosrokiani, P., Asl, M.: Comparison of data analytic techniques for a spatial
opinion mining in literary works: a review paper. In: Saeed, F., Mohammed, F., Al-Nahari,
A. (eds.) IRICT 2020. LNDECT, vol. 72, pp. 523–535. Springer, Cham (2021). https://doi.
org/10.1007/978-3-030-70713-2_49
230
M. A. Z. B. M. Asri et al.
6. Malik, E.F., Keikhosrokiani, P., Asl, M.P.: Text mining life cycle for a spatial reading of
Viet Thanh Nguyen’s the refugees (2017). In: 2021 International Congress of Advanced
Technology and Engineering (ICOTEN), pp. 1–9 (2021)
7. IBM: Text Mining. https://www.ibm.com/cloud/learn/text-mining
8. McCourt, A.: Social Media Mining: The Effects of Big Data In the Age of Social
Media. https://law.yale.edu/mfia/case-disclosed/social-media-mining-effects-big-data-agesocial-media
9. Keikhosrokiani, P., Asl, M.P. (eds.): Handbook of Research on Opinion Mining and Text
Analytics on Literary Works and Social Media, pp. 1–462. IGI Global, Hershey (2022).
https://doi.org/10.4018/978-1-7998-9594-7
10. Blei, D.M., Ng, A.Y., Jordan, M.I.: Latent Dirichlet allocation. J. Mach. Learn Res. 3, 993–
1022 (2003)
11. Deerwester, S., Furnas, G.W., Landauer, T.K., Harshman, R.: Indexing by latent semantic
analysis Scott. Kehidupan 3, 34 (2015)
12. Xu, J.: Topic Modeling with LSA, PLSA, LDA & lda2Vec. https://medium.com/nanonets/
topic-modeling-with-lsa-psla-lda-and-lda2vec-555ff65b0b05
13. Hofmann, T.: Probabilistic latent semantic indexing. In: Proceedings of the 22nd Annual International ACM SIGIR Conference on Research and Development in Information Retrieval,
SIGIR 1999, pp. 50–57 (1999). https://doi.org/10.1145/312624.312649
14. Asl, M.P.: Micro-physics of discipline: spaces of the self in Middle Eastern women life
writings. Int. J. Arabic-English Stud. 20 (2020). https://doi.org/10.33806/ijaes2000.20.2.12
15. Asl, M.P.: Gender, space and counter-conduct: Iranian women’s heterotopic imaginations in
Ramita Navai’s City of Lies. Gender Place Cult. (2021). https://doi.org/10.1080/0966369X.
2021.1975100
Opinion Mining Using Sentiment Analysis:
A Case Study of Readers’ Response on Long Litt
Woon’s The Way Through the Woods
in Goodreads
Ezqil Fasha Bin Kamal Fasha1 , Pantea Keikhosrokiani1(B) , and Moussa Pourya Asl2
1 School of Computer Sciences, Universiti Sains Malaysia, 11800 Minden, Penang, Malaysia
pantea@usm.my
2 School of Humanities, Universiti Sains Malaysia, 11800 Minden, Penang, Malaysia
Abstract. In recent years, advancements in computer mediated technologies,
such as internet, have greatly impacted disciplines like literary studies. Previous studies have shown that on-line discussion spaces have helped readers across
the globe to co-construct their interpretations of a text. The increasing popularity
of digital writing has prompted the book industry—that is publishers, book seller
and libraries—to take close heed of readers’ writings and responses in order to
improve book suggestions, offer personalized book recommendations and increase
their sales. The purpose of this study is to propose an analytical model to examine
the dominant feeling in public’s reaction to a text. To achieve this goal, the study
focuses on readers’ feedback in Goodreads website on Long Litt Woon’s memoir The Way Through the Woods: Of Mushrooms and Mourning (2017). To carry
out this study, this project uses a text mining technique that employs sentiment
analysis using VADER and TextBlob. The results of opinion mining shows 89
positive sentiments, 5 neutral, and 28 negative sentiments using VADER whereas
TextBlog results depicts 99, 5, 18 for positive, neutral, and negative sentiments
respectively.
Keywords: Text analytics · Opinion mining · Sentiment analysis · Goodreads ·
The Way Through the Woods: On Mushrooms and Mourning
1 Introduction
In recent years, advancements in computer mediated technologies, such as internet,
have greatly impacted disciplines like literary studies. Previous studies have shown that
on-line discussion spaces have helped readers across the globe to co-construct their
interpretations of a text. Digital writing is now a popular way for individuals not only
to express and share their feelings about a text but also to find and share books of their
interest. The increasing popularity of digital writing has prompted the book industry—
that is publishers, book seller and libraries—to take close heed of readers’ writings and
© The Author(s), under exclusive license to Springer Nature Switzerland AG 2022
F. Saeed et al. (Eds.): IRICT 2021, LNDECT 127, pp. 231–242, 2022.
https://doi.org/10.1007/978-3-030-98741-1_20
232
E. F. B. K. Fasha et al.
responses in order to improve book suggestions, offer personalized book recommendations and increase their sales. However, the analysis of the huge bulk of collected data
in order to assess readers’ feelings towards a text requires an automated technique.
The purpose of this study is to propose an analytical model to examine the dominant
feeling in public’s reaction to a text. To achieve this goal, the study focuses on readers’
feedback in Goodreads website on Long Litt Woon’s memoir The Way Through the
Woods: Of Mushrooms and Mourning (2017). Goodreads is an online platform that
allows readers to annotate, quote, and review a book. It also helps readers to find out if a
book is a good fit for you from our community’s reviews. As Woon’s memoir explores
universal issues such as the connections between humans, nature, grief, and healing, it
has growingly drawn readers’ response in social media from around the world. Data is
being generated at an astonishing rate and volume in today’s world of internet and online
services. Data analysts and scientists typically work with relational or tabular data. The
data in these tabular data columns can be numerical or categorical. Text, image, audio,
and video are just few of the structures that can be found in generated data. Unstructured
textual data is generated by online activities such as articles, website text, blog posts, and
social media posts. The textual data must be evaluated to comprehend client responses,
opinions, and sentiments.
To carry out this study, the text analytics technique of Text Mining and Sentiment
Analysis are used. Text mining, also known as text data mining [1, 2] or textual database
knowledge discovery [3], is the means of obtaining interesting and non-trivial patterns or
knowledge within unstructured text documents. Data mining or information exploration
from (structured) databases can be used as an extension of this. Information processing,
text analysis, information extraction, clustering, categorization, visualization, database
technology, machine learning, and data mining are all forms of text mining. Sentiment is a
feeling-driven attitude, idea, or judgement. Sentiment analysis, often known as opinion
mining, is the study of people’s feelings toward specific entities. People can upload
their own content on various social media platforms, such as forums, microblogs, and
online social networking sites, from the perspective of the user. From the standpoint of
a researcher, many social media sites expose their application programming interfaces
(APIs), allowing researchers and developers to collect and analyse data. However, there
are various limitations in this form of internet data that could make sentiment analysis
difficult. The first one is that because people can publish whatever they want, the quality
of their opinions cannot be guaranteed. The second issue is that such internet data does
not necessarily have a ground truth. A ground truth is more comparable to a label for a
certain viewpoint, stating whether it is good, bad, or impartial.
2 Literature Review
2.1 Social Media and Opinion Mining
Opinion mining and text analytics are widely employed in today’s culture to get insight
into people’s opinions, sentiments, and positions across a wide range of disciplines and
fields. This information is quite useful and may be put to a variety of uses. As a result,
to better understand audiences, an in-depth examination of how opinion mining and text
analytics connect to social media and literature is required [4]. The role of users and
Opinion Mining Using Sentiment Analysis: A Case Study of Readers’ Response
233
readers in our information-driven society is one of the most significant changes brought
about by the Internet. The rise of social media has tipped the scales in users’ favor.
Traditional marketing messages that were carefully orchestrated by companies are no
longer binding on individuals. Social networking is the interaction between people who
build, share, or exchange information and ideas in virtual communities and networks.
The structure of social media data is disorganized, and it is presented in a variety of
formats, including text, speech, photographs, and videos [5]. Furthermore, social media
generates a huge amount of continuous real-time data, rendering conventional statistical
approaches ineffective for analyzing this massive data [6]. As a result, data mining
techniques may play a critical role in resolving this problem.
Data is being collected at a pace never seen before by companies through web outlets, cellular phones, and social media. SMM is the method of extracting meaningful
or actionable information from vast amounts of user-generated data in the social media
realm. This information can be used to enhance business intelligence, allowing businesses to offer better services and explore new opportunities. SMM is needed to make
large quantities of social media driven UGC sensible and accessible. Sentiment analysis, electronic word-of-mouth (eWOM), the Web mining method, customer purchasing
behaviour, and risk management are all components of SMM. These elements are analytical tools that take raw UGC and transform it into actionable data. This data will help
companies increase sales by increasing customer satisfaction and advocacy, assisting in
the development of successful campaigns, and facilitating customer retention.
2.2 Sentiment Analysis
Sentiment analysis is the method of analyzing consumer sentiment using natural language processing, text analysis, and statistics. Sentiment analysis is a branch of Natural
Language Processing that focuses on the exploration of subjective thoughts or feelings
about a topic gathered from different sources. The best companies are aware of their
customers’ feelings like what they’re doing, how they’re doing it, and what they mean.
Tweets, articles, reviews, and other places where people mention your brand will reveal
customer sentiment. Sentiment Analysis is the domain of using software to grasp these
feelings, and it’s a must-know for developers and business leaders in today’s workplace
[7–9].
As in many other domains, advances in deep learning have propelled sentiment analysis to the forefront of cutting-edge algorithms. To extract and categorize the sentiment
of words into positive, negative, or neutral categories, we now use natural language
processing, statistics, and text analysis.
To have a better understanding of sentiment analysis, one must first study the various
types of sentiment analysis which are available. The primary types of sentiment analysis
are further explained below.
The First Form. The polarity of an opinion is determined in fine-grained sentiment
analysis. It may be a straightforward binary positive/negative sentiment distinction.
Dependent on the use case, this form may also go into the higher specification (for
example, very positive, positive, neutral, negative, very negative) (for example, as in
five-star Amazon reviews).
234
E. F. B. K. Fasha et al.
The Second Form. Emotion detection is a technique for detecting signals of specific emotional states in a document. In certain cases, lexicons and machine learning
algorithms are used to decide what is what and why.
The Third Form. Aspect-based sentiment analysis is even more detailed and refined.
Its goal is to learn what people think about a specific feature of the product. Consider
the brightness of the flashlight on your smartphone. Aspect-based analysis is commonly
used in product analytics to analyse how customers perceive a product and its strengths
and faults.
The Fourth Form. The action is the focus of intent analysis. Its aim is to figure out what
kind of message intention is being conveyed. It is widely used to streamline the process
in customer service systems.
There are two main types of sentiment analysis techniques. Rule-based approach
is an algorithm with a clearly described definition of an opinion to classify is used in
rule-based sentiment analysis. Identifying subjectivity, polarity, or the object of one’s
opinion is included. A simple Natural Language Processing routine is used in the rulebased approach. It entails the following operations on the database or text corpus: Parsing,
Stemming, Lexicon analysis (depending on the relevant context), Part of speech tagging,
and Tokenization.
The other is Automatic Sentiment Analysis. Although rule-based sentiment analysis is more of a toy than a serious tool, automated sentiment analysis is the real deal.
It’s the only method that really drills into the text and delivers. This form of sentiment
analysis uses machine learning to find out the gist of the message instead of explicitly described guidelines. As a result, the operation’s precision and accuracy improve
dramatically, and you can process data on a variety of parameters without being too
complicated. Overall, the following types of classification algorithms can be used in
sentiment analysis: Naive Bayes, RNN derivatives LSTM and GRU, Support Vector
Machines, and Linear Regression.
3 Methodology and Materials
Figure 1 shows the data science life cycle for this study.
The first step focuses on the business understanding which focuses on the problem
statement and the goal of the study. The second step which is data collection focuses
on the book reviews of The Way Through the Woods: On Mushrooms and Mourning
by scrapping the reviews from Goodreads. Data preparation and understanding focuses
on exploring the data. The next step is data preprocessing which applies data cleaning,
text normalization, removal of stopwords, and lemmatization techniques. In modelling
step, two sentiment analysis techniques including VADER (Valence Aware Dictionary
for Sentiment Reasoning) model and TextBlob were utilized to find the positive and
negative sentiments of the Goodreads reviews. Finally, evaluation step focuses on the
interpretation of the results as well as comparison of the results of sentiment analysis
using VADER and TextBlob.
Opinion Mining Using Sentiment Analysis: A Case Study of Readers’ Response
235
Fig. 1. The proposed framework for data science lifecycle
Python is an open-source integrated development environment (IDE) with a built-in
interpreter that converts high-level programming languages into machine language that
a computer can understand. Python also has a rudimentary IDE with only the most basic
functionality. Several important libraries for data analytics must be installed. Some relevant libraries such as NLTK, Pandas (for data preprocessing and munging), Matplotlib
(for plotting: graph, histogram, etc.), Gensim, Seaborn (for data visualization), Spacy,
Numpy (holds mathematical functions), Scikit-learn (open-source learning framework
for machine learning and modelling), and Pyldavisare used in this study.
The data used for this study is taken from Goodreads. A total of 122 readers’ reviews
of the Malaysian diasporic writer Long Litt Woon’s memoir The Way Through the Woods:
Of Mushrooms and Mourning (2017) is extracted for the purpose of opinion mining. The
memoir narrates the story of two journeys: a personal journey of grief and mourning, and
the outer journey into the nature. In recent decades, diasporic life writings by women
writers have attracted international [10, 11]. The Way Through the Woods has likewise
attracted enormous public and media attention that recommend the readers’ responses
for critical analysis.
4 Analysis and Results
4.1 Text Exploration and Visualization
The bar chart illustrated in Fig. 2 is a visualization of data regarding the number of users
and the ratings of the book given by the users. The y-axis and x-axis are represented
by the number of user and rating, respectively. There was a total of 122 unique user
reviews for the book The Way Through the Woods: Of Mushrooms and Mourning (2017)
by Long Litt Woon, based on data scraped from the Goodreads website, but only 116
were shown in the bar chart above since 6 of them did not provide a rating. The graph
above depicts the number of user reviews that were rated on a scale from 1 to 5.
The average rating given of this book by the number of users is 3.79 which was
calculated by the summation of product of the book ratings (440) divided by the total
number of ratings given (116).
It is clear that the modal group of the ratings given by the number of users is a rating
of 4.0 as it is the most frequent rating given by the users. There is a significant difference
236
E. F. B. K. Fasha et al.
between the highest frequency rating given (4.0) and the lowest frequency rating given
(1.0) which is 30 users.
Fig. 2. Bar chart of book’s rating
Fig. 3. Pie chart of book’s rating
The pie chart in Fig. 3 shows the biggest majority of the ratings given by the users is
a rating of 4.0 with 34.5%. Following that, is a rating of 3.0 with 30.2%, and a rating of
5.0 with 26.7% which leaves the rating of 2.0 being the smallest majority of the ratings
given by the users. This indicates that a significant majority of the users find the book
to be an above average book to read.
Figure 4 shows the visualization of data regarding the top 10 common words used by
users in their reviews of the book. The y-axis and x-axis are represented by the count of
words and the word itself, respectively. The top 10 common words used in the reviews
are mushroom, grief, husband, life, way, woon, author, world, new, and long. The modal
word of the reviews given by users is ‘mushroom’ as it is the most word used in the
users’ reviews. There is a significant difference between the most common word which
is ‘mushroom’ and the second most common word which is ‘grief’ as the difference
in is 179, count wise. Following the second most common word, the count decreases
gradually.
Fig. 4. Bar chart of top 10 common words
Opinion Mining Using Sentiment Analysis: A Case Study of Readers’ Response
237
Figure 5 shows the most frequent occurring bigrams in the reviews. According to
the data that has been extracted from the book reviews given by the users, ‘way wood’
(19), ‘world mushroom’ (15), ‘long woon’ (13), are the top 3 most frequently occurring
bigrams. On the other hand, ‘day husband’ (2), ‘foreign land’ (2), and ‘memoir author
(2)’ are the top 3 least frequently occurring bigrams. In general, these are the bigrams
used in the book reviews of the users.
Fig. 5. Bigram wordcloud
Fig. 6. Trigram wordcloud
Figure 6 shows the most frequent occurring Trigram of the reviews. According to
the data that has been extracted from the book reviews given by the users, ‘husband
sudden death’ (4), ‘exchange honest review’ (3), ‘long woon husband’ (3), are the top
3 most frequently occurring trigrams. On the other hand, ‘interest section way’ (1),
‘new interest section’ (1), and ‘mourning new interest’ (1) are the top 3 least frequently
occurring trigrams. In general, these are the bigrams used in the book reviews of the
users.
4.2 Sentiment Analysis Results Using VADER and TextBlob
The results of the Vader algorithm and TextBlob, two Python libraries for sentiment
analysis are included in this section. Machine learning algorithms can be used to classify
texts in a variety of ways. Sentiment analysis is the method in which an algorithm
determines whether a text is positive, negative, or unbiased based on its topic. We employ
the Vader and TextBlob algorithms for this operation. Furthermore, on the text clustering
side, the results were obtained using the clustering K-Means Approach, which is an
unsupervised learning algorithm (meaning there are no goal labels) that allows you to
identify comparable groupings or clusters of data points within your data.
To demonstrate the results, we used VADER, a lexicon and rule-based sentiment
analysis tool. The sentiment score generated by the Vader algorithm ranges from -1 to
1, with -1 being the most negative and 1 being the most positive. The Way Through the
Woods: Of Mushrooms and Mourning by Long Litt Woon has a total of 122 reviews.
Figure 7 depicts the first five reviews out of a total of 122. We can observe from the
graphic that the score has been divided into four categories: compound, negative, neutral,
and positive. Positive, negative, and neutral ratings are combined to create the compound
score, which is then standardized between −1 and +1. The text is more favorable if the
compound score is nearer to +1. To calculate the sentence’s score, VADER uses a series
of rules that include punctuation, capitalization, booster words, and more to account for
the impact of each sub-text on the perceived intensity of sentiment in sentence-level text.
238
E. F. B. K. Fasha et al.
Fig. 7. First 5 reviews using VADER
Figure 8 depicts the top ten positive statements from a total of 122 user reviews for
Long Litt Woon’s book The Way Through the Woods: Of Mushrooms and Mourning.
According to the data, the positive score for 10 reviews is slightly greater than the negative
score. The highest compound score is 0.9985 in review number 80. The stronger the text’s
positivity, the closer the compound score is to +1.
The terms “surprising” and “original” appear in the line “This is one of the most surprising and original…” in review number 103. Because it expresses a positive sentiment,
these words play a vital role in deciding the sentence score.
Fig. 8. Top-10 positive sentences using VADER
The top 10 negative sentences discovered in the 122 user reviews for this book are
shown in Fig. 9. Even though each of the sentences is in opposition to the positive
sentences in Fig. 9, they all received a high score on neutral perspective. The positive
and negative score of the sentences can be used to compare the positive and negative
nature of the feeling. Each sentence’s negative score is slightly greater than its positive
value in the graph above. Based on the compound score, the reviews were sorted in
increasing order. The lowest compound score is found on the first line of the graphic,
which is line 46.
Textblob is a python module that analyses text and generates an emotion score.
Textblob returns the polarity and subjectivity of a statement. The quantity of good and
negative emotions in a paragraph, as well as character level sentiment, are used to
Opinion Mining Using Sentiment Analysis: A Case Study of Readers’ Response
239
Fig. 9. Top-10 negative sentences using Vader algorithm
determine sentiment. All sentences with a positive sentiment are given a 1 rating, while
those with a negative rating are given a −1 rating.
The text’s polarity and subjectivity are determined in TextBlob. The polarity is a float
with a value ranging from −1 to 1. A negative polarity score implies negative emotion,
whereas a positive polarity score suggests positive emotion. Subjectivity is also a float
that ranges from 0 to 1. The subjectivity of the statement is determined by its level of
subjectivity. Opinion, emotion, or judgement are all examples of subjectivity.
Figure 10 depicts a list of user reviews. The number 1 sentence has a polarity of
0.215556, indicating that it has more positive sentiment, whereas the number 0 sentence
has a polarity of 0.099181, indicating that the user has less positive feeling in their
submitted review.
Fig. 10. First 5 reviews using TextBlob algorithm
The top ten positive sentences from the 122 reviews for Long Litt Woon’s book The
Way Through the Woods: Of Mushrooms and Mourning are displayed in Fig. 11. Based
on the polarity score, the reviews were sorted in descending order. The first line in the
figure, line 91, has the greatest polarity score of 0.712121, indicating that the statement
is more positive than others, while line 27 has a subjectivity value of 1.00000, indicating
that the sentence mostly involves opinions rather than factual facts.
The top ten negative sentences from the 122 reviews for Long Litt Woon’s book The
Way Through the Woods: Of Mushrooms and Mourning are depicted in Fig. 12. Based
240
E. F. B. K. Fasha et al.
Fig. 11. Top 10 positive reviews using TextBlob
on the polarity score, the reviews were sorted in ascending order. The first line of data,
line 63, has the lowest polarity score of −0.304167, indicating that the statement is more
negative than others, while line 68 has a rating of 0.850000 subjectivity, indicating that
the sentence mostly involves personal opinion rather than factual facts.
Fig. 12. Top-10 negative reviews using TextBlob
5 Discussion
The text analysis done on data acquired from Goodreads users’ reviews has provided
us with an understanding of how topic modelling and sentiment analysis are carried out.
The main topic of discussion in the 112 unique reviews out of the 159 total reviews by
the users, as well as each user’s sentiment, were assessed, as indicated in the results
section. The gathered results come across some redundant and superfluous data, which
affects the reliability of the results.
When it comes to sentiment analysis, a statement should be read in its whole before
being classified as positive, negative, or neutral. The entire statement becomes a negative
sentence since one or more words are labelled as negative. For instance, a sentence like
“This book was amazing, insightful, wonderful, and well-written,” with a sentiment
analysis result of 626, is supposed to be a positive sentence but is incorrectly labelled as
negative, which could be caused by reading a word but not the entire sentence.
Also, we utilized two distinct approaches to implement sentiment analysis. The
VADER algorithm and the Textblob algorithm are those two algorithms. As we can see
from the above outcomes, the VADER algorithm is used to detect the degree of positive
or negative expression in the text, as well as the intensity of the emotion, in the Goodreads
platform with the supplied topic. It was discovered that the top ten positive or negative
Opinion Mining Using Sentiment Analysis: A Case Study of Readers’ Response
241
statements taken from the data were assessed using Score Compound in four categories:
score compound, score neutral, score negative, and score positive. On the other hand,
Textblob algorithm usually outputs the polarity and subjectivity of a sentence or text.
Subjectivity gauges the degree of emotional opinion and fact information in the text, as
shown in the findings in Table 1.
Table 1. Comparison table: Vader algorithm and TextBlob algorithm
Sentiment analysis model
Positive
Neutral
Negative
VADER
89
5
28
TextBlob
99
5
18
6 Conclusion
By using topic modelling and sentiment analysis on reader reviews in Goodreads, this
project has shown that significant topics and sentiment values have great impact on
public interest. The satisfaction levels that user-readers experience should not be taken
for granted because it may influence the success of a literary work. The reason for this
is that digital platforms and social networks have grown so much in recent years that
the book industry now has the opportunity to better understand readers’ thoughts and
sentiments, which may help them enhance their products and services to satisfy their
customers’ needs. The uncovered topics, based on user feedback, also help to focus
attention on what is most vital to optimise and get better. This should prompt relevant
parties to decide about how to meet the readers’ needs and fix potential problems or
issues.
Not to be neglected, there are a few limitations that were found throughout the
course of this project that could certainly be improved and overcame. Sentiment analysis
may have difficulties distinguishing unique content or humor, as it may be difficult to
comprehend. With only a few sentences and a bit of text, there may not be enough context
for a reliable sentiment analysis.
In a nutshell, machine learning and natural language processing are growing,
with new functions and libraries being introduced along with existing functions being
upgraded to handle more complex algorithms and procedures. Therefore, this implies
that this project is no more than just a steppingstone in the vast number of possibilities
or ways to improve in the future.
References
1. Malik, E.F., Keikhosrokiani, P., Asl, M.P.: Text mining life cycle for a spatial reading of
Viet Thanh Nguyen’s the refugees (2017). In: 2021 International Congress of Advanced
Technology and Engineering (ICOTEN), pp. 1–9 (2021)
242
E. F. B. K. Fasha et al.
2. Ying, S., Keikhosrokiani, P., Asl, M.: Comparison of data analytic techniques for a spatial
opinion mining in literary works: a review paper. In: Saeed, F., Mohammed, F., Al-Nahari,
A. (eds.) IRICT 2020. LNDECT, vol. 72, pp. 523–535. Springer, Cham (2021). https://doi.
org/10.1007/978-3-030-70713-2_49
3. Feldman, R., Dagan, I.: Knowledge discovery in textual databases (KDT). In: International
Conference on Knowledge Discovery and Data Mining (KDD), pp. 112–117 (1995)
4. Keikhosrokiani, P., Asl, M.P. (eds.): Handbook of Research on Opinion Mining and Text
Analytics on Literary Works and Social Media, pp. 1–462. IGI Global, Hershey (2022).
https://doi.org/10.4018/978-1-7998-9594-7
5. Kavanaugh, A.L., et al.: Social media use by government: from the routine to the critical.
Gov. Inf. Q. 29, 480–491 (2012). https://doi.org/10.1016/j.giq.2012.06.002
6. Chen, H., Chiang, R.H.L., Storey, V.C.: Business intelligence and analytics: from big data to
big impact. MIS Q. 36, 1165–1188 (2018)
7. Mansour, S.: Social media analysis of user’s responses to terrorism using sentiment analysis
and text mining. Procedia Comput. Sci. 140, 95–103 (2018). https://doi.org/10.1016/j.procs.
2018.10.297
8. Chintalapudi, N., Battineni, G., di Canio, M., Sagaro, G.G., Amenta, F.: Text mining with
sentiment analysis on seafarers’ medical documents. Int. J. Inf. Manag. Data Insights 1,
100005 (2021). https://doi.org/10.1016/j.jjimei.2020.100005
9. Daudert, T.: Exploiting textual and relationship information for fine-grained financial sentiment analysis. Knowl.-Based Syst. 230, 107389 (2021). https://doi.org/10.1016/j.knosys.
2021.107389
10. Asl, M.P.: Gender, space and counter-conduct: Iranian women’s heterotopic imaginations in
Ramita Navai’s City of Lies. Gender Place Cult. (2021). https://doi.org/10.1080/0966369X.
2021.1975100
11. Asl, M.P.: Micro-physics of discipline: spaces of the self in Middle Eastern women life
writings. Int. J. Arabic-English Stud. 20 (2020). https://doi.org/10.33806/ijaes2000.20.2.12
Opinion Mining of Readers’ Responses
to Literary Prize Nominees on Twitter:
A Case Study of Public Reaction to the Booker
Prize (2018–2020)
Punetham a/p Paremeswaran1 , Pantea Keikhosrokiani1(B) , and Moussa Pourya Asl2
1 School of Computer Sciences, Universiti Sains Malaysia, 11800 Minden, Penang, Malaysia
pantea@usm.my
2 School of Humanities, Universiti Sains Malaysia, 11800 Minden, Penang, Malaysia
moussa.pourya@usm.my
Abstract. The award of literary prizes such as the Booker Prize has a great impact
on production and reception of literary works. In recent years, the Booker Prize
awarding committee has faced challenges in selecting books that are more readable
and popular. This study suggests that one feasible way to address this issue is to
analyze readers’ response and public reaction to literary works in social media. In
this regard, the present study aims to develop a data analytics technique that can
analyze literary readers’ responses in Twitter and predict a potential prize winner.
To achieve this focal goal, a Sentiment Analysis and Topic Modelling approach is
designed to classify the public reactions to The Booker Prize nominees in Twitter.
The data is extracted for three consecutive years of 2018, 2019 and 2020. In
addition, the study utilizes Machine Learning to propose a prediction technique
in selecting the best possible Booker Prize winner based on public opinion. The
results reveal the main topics frequently appearing in the data as well as the positive
and negative sentiments attached to them.
Keywords: Booker prize · Reader response · Opinion mining · Topic
modelling · Clustering · Sentiment analysis · Twitter
1 Introduction
The award of literary prizes such as the Booker Prize has a great impact on the production
and reception of literary works. The Booker Prize is a literary award that is given every
year to the best novel written in English and published in the United Kingdom or Ireland.
Previous studies have shown that winning the Booker Prize has an undoubted commercial
impact as the publishing companies receive a quick mandate to produce and sell more
copies [1, 2]. Statistical evidence confirms the impact of the Booker Prize on sales and
figures of winners and shortlisted books [3]. Despite the enormously positive influence
of the Booker Prize on commodifying and canonizing literary books, the prize has
sparked off intense debate on how the winners are decided [4–6]. To resolve the dispute,
© The Author(s), under exclusive license to Springer Nature Switzerland AG 2022
F. Saeed et al. (Eds.): IRICT 2021, LNDECT 127, pp. 243–257, 2022.
https://doi.org/10.1007/978-3-030-98741-1_21
244
P. a/p Paremeswaran et al.
the awarding committee has recently drawn up an agenda for change, aiming to select
books that they deem to be readable and popular. However, no large-scale reader survey
currently exists to help predict and clarify the attitudes of book readers and buyers. This
study suggests that one feasible way to address this issue is to analyze readers’ responses
and public reactions to literary works in social media.
In recent years, participation in social networking websites such as the microblogging site Twitter has become commonplace. Literary enthusiasts around the world
increasingly use Twitter as a platform to share their thoughts on their favorite books [7,
8]. As a result, this digital space is a potential gold mine of readers’ responses and public
reactions for awarding committees interested in understanding growing trends.
This study aims to develop a data analytics technique that can analyze literary readers’ responses in Twitter and predict a potential prize winner. To achieve this focal goal,
a Sentiment Analysis and Topic Modelling approach is designed to classify the public
reactions to The Booker Prize nominees in Twitter. The data is extracted for three consecutive years of 2018, 2019 and 2020 to increase the validity of the results. Moreover,
the study utilizes Machine Learning to propose a prediction technique in selecting the
best possible Booker Prize winner based on public opinion.
This paper consists of 6 sections: introduction, literature review, materials & methodology, results and discussion, conclusion and references. Literature review includes subsections such as Topic Modelling, Sentiment Analysis and Clustering. Materials and
methodology section similarly consists of sub-sections such as data science project lifecycle and implementation of tools and techniques. Results and discussion section also
have sub-sections such as Topic Modelling, Sentiment Analysis and Clustering.
2 Literature Review
2.1 Topic Modelling
Topic Modelling is an unsupervised machine learning used for identifying abstract Topics
that appear in a text file. Topic Modelling is usually used to analyze a text data to identify a
cluster of words, that is by counting the words and grouping the words into word clusters
[9, 10]. The identified words will be highlighted and used as “Topic”. What makes Topic
Modelling easy is that the technique does not require data training. Therefore, it is known
as ‘unsupervised’ machine learning technique. Topic Modelling consists of two common
techniques, such as Latent Semantic Analysis (LSA) and Latent Dirichlet Allocation
(LDA). LDA has the capability of creating valid dictionaries and using prior knowledge
to forecast topics in new collections of documents whereas LSA recovers the space’s
original semantic form as well as its original dimensions. The updated measurements
derived from LSA research include a more accurate description of documents and queries
[11, 12].
2.2 Sentiment Analysis
Sentiment analysis, also known as opinion mining, is a method of forecasting people’s
feelings or emotions about a person or a topic. Given the ease of access to such vast
Opinion Mining of Readers’ Responses to Literary Prize Nominees on Twitter
245
amounts of information on the internet, it becomes error-prone to manually analyze the
data. As a result, methods like Sentiment Analysis are needed for automatic analysis.
Sentiment Analysis is carried out at three different levels: Document level, sentence
level and feature level. In the Document level, findings are focused on feelings contained
in the overall paper. Each sentence in the Sentence level is graded as positive or negative.
At the Feature level, there is the possibility of a single statement expressing multiple
Table 1. Comparison of existing works for sentiment analysis
Author
Title
Technique
[19]
Improved Twitter Sentiment K-Means
Prediction through
‘Cluster-then-Predict Model’
The combination of
supervised and unsupervised
K-Means learning models
enhanced sentiment
prediction on Twitter
[20]
Opinion Mining on Twitter
Data using Unsupervised
Learning Technique
Means
As Eigen vectors are used to
initialize k-means, the
original and final objective
function values are
improved, as are the
clustering effects
[21]
Clustering on Twitter: case
study Twitter account of
higher education institution
in Indonesia
Affinity Propagation
Algorithm
Higher education in
Indonesia mostly utilizes
Twitter to post general
information, news, agenda,
announcement, information
to the new students, and
achievement
[22]
Classification Connection of K-Means
Twitter Data using K-Means
Clustering
The centroids for K-Means
clustering are chosen and
given. Centroids that are
similar to a decent solution
seem to perform the best,
and using small clusters is
appropriate in terms of
reliability in time to iterate
over all of the cluster’s data
points
[23]
Analysis of Twitter Data
Using a Multiple-level
clustering Strategy
Effective at learning new
things. For a small dataset,
performance is surprisingly
poor. Clustering time: 2 min
and 9 s It is possible that
large datasets would not
scale well
DBSCAN
Result
246
P. a/p Paremeswaran et al.
feelings. Experimenting on twitter data, sentence level will be done because of the tweets’
length restrictions [9, 13, 14].
There are 2 main sentiment analysis approaches: Lexicon-based approach and
machine learning. The first makes use of lexicons or dictionaries. The semantic orientation or polarity of words or phrases in the text is used here to calculate the language
orientation. The lexicon-based approach does not necessitate the handling of a vast
amount of data, as a machine learning approach does. It computes the orientation of a
text using a lexicon or dictionaries. Semantic Orientation (SO) is a measure of textual
subjectivity and judgment that captures the polarity and power of terms or phrases. The
overall sentiment orientation of the text is determined by both of these terms. Opinion
lexicons can be produced manually or automatically. The manual approach to developing
the opinion lexicon can be time-consuming, so it must be combined with other automated approaches [13]. Machine learning based approach consists of supervised learning
method, unsupervised learning method and semi-supervised learning method [15–18].
Table 1 listed some of the related works that utilized sentiment analysis techniques.
2.3 Clustering
As an unsupervised learning approach, Clustering refers to grouping a population or
set of data points into groups so that data points in the same group are analogous to
other data points in the same group and dissimilar to data points in other groups. There
are several types of algorithm; K means clustering, Hierarchical clustering, Fuzzy C
Means, Mean shift clustering, Density based and Gaussian Mixed Models [24, 25]. K
means clustering Can be generalized to any kind of data as long as it contains numerical
(continuous) entities. It is better than most algorithms.
3 Materials and Methodology
Data science life cycle for this study is shown in Fig. 1 which includes data collection,
topic modelling, sentiment analysis and clustering.
Tweets on shortlisted novels were extracted for an empirical analysis based on likes
and dislikes. Shortlisted titles in 3 years of 2018, 2019 and 2020 were selected for data
collection. As 6 shortlisted novels are announced each year, there are 18 nominees among
which are some diasporic writers [29–31]. Table 2 shows shortlisted novels for Booker
prize in the years of 2018, 2019 and 2020.
This work explores the latent meaning through the results of various text mining
techniques and explores the sentiment of data using the best algorithm. Twitter has
public’s opinion on the nominees in terms of favorable and unfavorable tweets. The tool
utilized in this phase is snscrape library. Snscrape is a library to be installed in Jupyter
notebook and gives access to Twitter data without limitation.
Three various analyses are conducted. Firstly, topic modelling is performed in three
stages. First, collecting the data to which the developed model was applied. Then, data
cleaning and pre-processing such as normalization and tokenization was performed to
transform unstructured data into suitable data for topical modeling. Finally, data analysis:
Proposed algorithm for Topic Modelling is LDA. Through topic modelling, LDA is the
Opinion Mining of Readers’ Responses to Literary Prize Nominees on Twitter
247
Fig. 1. The proposed data science life cycle for this study.
Table 2. Shortlisted novel of Booker prize for the year of 2018, 2019 and 2020.
Booker prize
2018
Tweets no. Booker prize
2019
Tweets no. Booker prize
2020
Tweets no.
– Milkman
– 990
– The testaments – 2001
– Real life
– 2001
– Washington
black
– 98
– Ducks,
Newburyport
– 287
– Shuggie bain
– 183
– Everything
under
– 1574
– Girl, Woman,
Other
– 48
– The new
wilderness
– 46
– The mars room – 59
– An orchestra
of minorities
– 39
– Burnt sugar
– 193
– The overstory
– 65
– Quichotte
– 205
– This
mournable
body
– 41
– The long take
– 42
– 10 min 38 s in
this strange
world
– 50
– The shadow
king
– 135
best to analyze the public reactions as it finds the hidden themes to discover topics of
discussion [26, 27]. Next wass checking the coherence score with LDA and LDA mallet
to improve the quality of topic modelling analysis. Frequency of topics derived from
analysis was conducted and topic with keywords was visualized.
Then, sentiment analysis was also performed to categorize opinions of people on
Twitter towards tweets. First, we did pre-processing such as normalization, stemming
and vectorization of data by converting unstructured text data into a structured form. For
248
P. a/p Paremeswaran et al.
the sentiment analysis, a twitter data consisting of 1.6 million tweets utilized as training
set, to test on the collected tweet datasets. Various algorithm for NLP utilized to train
the training set. Logistic regression and naive bayes are the popular algorithm for NLP,
supervised learning method algorithm is proposed it performs well for a wide range of
text classification problems and needs a small number of training samples. Classified
sentiments are reviewed into positive and negative sentiments.
Then, dataset is constructed for each of the shortlisted novels. Clustering was conducted using k-means algorithm on the dataset created. Later, both datasets were identified as imbalanced dataset, hence some methods were implemented to balance the
dataset. The stages in the clustering process included balancing the dataset and computing the specific number of k for prediction. K-Means clustering algorithm was used in
this phase as it is the most used unsupervised machine learning algorithm for partitioning a given data set into a set of k groups. Implementation of K-Means on Twitter data
resulted in enhancement of sentiment prediction. Moreover, K-Means algorithm can be
generalized to any kind of data and is simple to comprehend and perceive. Clustering
centroids is used to predict to which cluster the new shortlisted novel belongs.
4 Results and Discussion
4.1 Topic Modelling
LDA model was built using Gensim implementation to establish the baseline and visualize the topics. The number of topics was set to 5 based on the coherence scores. Only 4
datasets were selected to be analyzed for topic modelling because the selected datasets
have higher number of tweets. The selected datasets are ‘The_testaments.csv’, ‘Milkman.csv’, ‘Everything_under.csv’ and ‘Real_life.csv’. The results of analysis on topic
modelling are keywords of each topic with its weightage. LDAmallet implementation
often gives a better quality of topics as shown in Table 3. We can identify by checking
the improvement in coherence score after LDAmallet.
Table 3. Coherence score with LDA and LDAmallet algorithm
Dataset
LDA
LDAmallet
The_testaments.csv
0.5127999379950294
0.2716340140758931
Milkman.csv
0.3800795274873436
0.5442869713910351
Everything_under.csv
0.4451578345231527
0.4510800869095564
Real_life.csv
0.49166186274769863
0.42175786849926694
Analyzing The_testaments.csv dataset, the most frequent topic is ‘tale’ which is
representative theme of 10 keywords that can be explained by words such as ‘testament’, ‘read’, ‘atwood’, ‘tale’, ‘book’, ‘handmaid’, ‘margaretatwood’, ‘finish’, ‘sequel’
and ‘good’. Table 4 shows the topics with highest coherence scores for the book The
testament.
Opinion Mining of Readers’ Responses to Literary Prize Nominees on Twitter
249
Table 4. Keywords of each topic for the book The testaments
Topics names
Keyword
Testament
0.074 * “testament” + 0.027 * “copy” + 0.026 * “get” + 0.026 * “today” +
0.016 * “read” + 0.015 * “margaretatwood” + 0.014 * “day” + 0.014 * “go”
+ 0.013 * “wait” + 0.010 * “arrive”
Amazon
0.045 * “testament” + 0.017 * “institute” + 0.009 * “people” +
0.008 * “amazon” + 0.008 * “atwood” + 0.007 * “enough” +
0.007 * “ebook” + 0.006 * “available” + 0.006 * “add” + 0.006 * “tell”
Launch
0.068 * “testament” + 0.024 * “launch” + 0.015 * “atwood” +
0.012 * “handmaid” + 0.012 * “audiobook” + 0.010 * “tale” + 0.007 * “hit”
+ 0.007 * “call” + 0.005 * “margaret” + 0.005 * “el”
Tale
0.094 * “testament” + 0.053 * “read” + 0.029 * “atwood” + 0.026 * “tale” +
0.026 * “book” + 0.022 * “handmaid” + 0.020 * “margaretatwood” +
0.015 * “finish” + 0.013 * “sequel” + 0.012 * “good”
Order
0.028 * “testament” + 0.017 * “order” + 0.015 * “bad” + 0.011 * “amp” +
0.009 * “copy” + 0.009 * “waterstone” + 0.006 * “preorder” +
0.006 * “include” + 0.006 * “find” + 0.005 * “sign”
Table 5. Keywords of each topic for the book Milkman
Topics names
Keyword
Deliver
0.074 * “milkman” + 0.015 * “require” + 0.008 * “show” +
0.007 * “deliver” + 0.006 * “fast” + 0.006 * “great” + 0.006 * “west” +
0.006 * “fuck” + 0.005 * “ernie” + 0.005 * “new”
Milkman
0.038 * “milkman” + 0.016 * “say” + 0.013 * “want” + 0.010 * “year” +
0.010 * “milk” + 0.010 * “tell” + 0.010 * “go” + 0.010 * “new” +
0.007 * “job” + 0.007 * “eye”
Manbooker
0.091 * “milkman” + 0.023 * “shortlist” + 0.013 * “look” +
0.012 * “overstory” + 0.011 * “get” + 0.011 * “manbooker” +
0.010 * “booker” + 0.009 * “long_take” + 0.009 * “esi_edugyan” +
0.009 * “go”
Delicious
0.074 * “milkman” + 0.038 * “milk” + 0.014 * “bottle” + 0.013 * “ball” +
0.012 * “deliver” + 0.010 * “bring” + 0.009 * “get” + 0.008 * “name” +
0.007 * “put” + 0.007 * “delicious”
Work
0.035 * “milkman” + 0.016 * “good” + 0.015 * “day” + 0.011 * “see” +
0.010 * “get” + 0.010 * “know” + 0.009 * “work” + 0.009 * “make” +
0.008 * “first” + 0.008 * “people”
Analyzing the Milkman.csv dataset, the most discussed topic is topic 0 named
‘Deliver’ and representative theme of 10 keywords which can be explained by words
such as ‘milkman’, ‘require’, ‘show’, ‘deliver’, ‘fast’, ‘great’, ‘west’, ‘fuck’, ‘ernie’ and
‘new’. Table 5 shows the topics with highest coherence scores for the book Milkman.
250
P. a/p Paremeswaran et al.
Analyzing the Everything_under.csv dataset, the most discussed topic is topic 3
named ‘Sun’ and representative theme of 10 keywords which can be explained by words
such as ‘sun’, ‘time’, ‘get; ‘talk’, ‘wanna’, ‘moon’, ‘need’, ‘go’, ‘tune’ and ‘come’. Table
6 shows the topics with highest coherence scores for the book Everything under.
Table 6. Keywords of each topic for the book Everything under
Topics names
Keyword
Shortlist
0.018 * “shortlist” + 0.017 * “manbooker” + 0.017 * “sun” +
0.017 * “read” + 0.015 * “overstory” + 0.014 * “make” +
0.014 * “milkman” + 0.014 * “people” + 0.011 * “long_take” +
0.010 * “see”
Control
0.030 * “sun” + 0.027 * “control” + 0.026 * “get” + 0.016 * “feel” +
0.014 * “go” + 0.014 * “day” + 0.014 * “life” + 0.011 * “love” +
0.008 * “always” + 0.008 * “let”
Time
0.078 * “control” + 0.015 * “think” + 0.015 * “god” + 0.014 * “get” +
0.011 * “time” + 0.009 * “amp” + 0.009 * “good” + 0.008 * “know” +
0.007 * “today” + 0.007 * “sun”
Sun
0.079 * “sun” + 0.024 * “time” + 0.018 * “get” + 0.016 * “talk” +
0.013 * “wanna” + 0.012 * “moon” + 0.011 * “need” + 0.011 * “go” +
0.009 * “tune” + 0.009 * “come”
People
0.029 * “sun” + 0.015 * “amp” + 0.012 * “people” + 0.010 * “take” +
0.009 * “know” + 0.008 * “make” + 0.007 * “shit” + 0.007 * “rug” +
0.007 * “give” + 0.007 * “woman”
Analyzing the Real_life.csv dataset, the most discussed topic is topic 0 named ‘Twitter’ and representative theme of 10 keywords which can be explained by words such as
‘life’, ‘real’, ‘shit’, ‘get’, ‘know’, ‘people’, ‘twitter’, ‘really’, ‘go’ and ‘bitch’. Table 7
shows the topics with highest coherence scores for the book Real life.
In Topic modelling analysis, the length of documents is important. When documents
are too short, even if there are a great number of them, the LDA’s performance is likely
to suffer [28]. Due to this limitation, some datasets which consist of very tiny number
of tweets cannot be analyzed in Topic Modelling. The amount of the tweet must be
sufficient in order to perform Topic Modelling analysis.
Opinion Mining of Readers’ Responses to Literary Prize Nominees on Twitter
251
Table 7. Keywords of each topic for the book Real Life
Topics names
Keyword
Twitter
0.128 * “life” + 0.127 * “real” + 0.020 * “shit” + 0.016 * “get” +
0.014 * “know” + 0.014 * “people” + 0.014 * “twitter” + 0.012 * “really”
+ 0.012 * “go” + 0.011 * “bitch”
Logic
0.076 * “life” + 0.076 * “real” + 0.075 * “wonder” + 0.074 * “hit” +
0.073 * “logic” + 0.070 * “pre” + 0.070 * “fame” + 0.054 * “feel” +
0.005 * “light” + 0.003 * “pretty”
Feel
0.097 * “life” + 0.097 * “real” + 0.064 * “different” + 0.023 * “feel” +
0.012 * “get” + 0.011 * “people” + 0.010 * “see” + 0.009 * “good” +
0.008 * “know” + 0.008 * “look”
Relationship
0.010 * “life” + 0.010 * “real” + 0.009 * “human” + 0.008 * “leave” +
0.008 * “sex” + 0.007 * “character” + 0.007 * “video” +
0.007 * “relationship” + 0.007 * “mean” + 0.006 * “point”
Stress
0.028 * “real” + 0.027 * “life” + 0.014 * “tell” + 0.009 * “kid” +
0.009 * “play” + 0.008 * “stress” + 0.007 * “mad” + 0.006 * “sa” +
0.005 * “win” + 0.005 * “call”
4.2 Sentiment Analysis
As for classification of sentiment in NLP, Naive Bayes and Logistic regression algorithms
are quite popular. Hence, these two algorithms are implemented in this study. Naive
Bayes accuracy is approximately 76.85% whereas Logistic Regression archives 78.78%
of accuracy. Based on the accuracy, implementation of Logistic Regression shows better
results compared to Naive Bayes algorithm. Since Logistic regression is very effective
on text data classification, it is tested on the extracted dataset.
The results show that words expressing positive emotions (Table 8) for Booker prize
2018, 2019 and 2020. Therefore, it can be determined that public like the novel’s content
and expressed positive emotions via the tweets. Words that expressed negative feelings
such as ‘return the overstory’. These keywords show that public want to return the novel
as they dislike the novel’s content.
The dataset includes only the tweets whose sentiment we need to identify. Every
dataset implemented in this project consists of small number of tweets, hence it is
inappropriate to split into training set and test set. A training set consisting of 1.6 million
tweets, categorized into 3 sentiments, are chosen for sentiment analysis. In order to label
the sentiment of a tweet, the training data has been utilized as training set.
252
P. a/p Paremeswaran et al.
Table 8. Sentiment analysis of Booker prize shortlisted novel datasets.
Shortlisted novel Sentiment Number Tweet
The testaments
Milkman
Positive
1422
– “Being able to read and write did not provide the
answers to all questions. It led to other questions,
and then to others.” The Testaments
@MargaretAtwood
– “I may have hold off on ‘The Song of the Lark’
while I read ‘The Testaments’” is probably the
gayest thing I’m going to say in these
@TheAdvocateMag offices today. #TheTestaments
Negative
579
– “Why hadn’t the authorities closed down the
nuclear reactors before it was too late “ Aunt Lydia
in The Testaments by Margaret Atwood
– “But it can put a lot of pressure on a person to be
told they need to be strong.” --Margaret Atwood,
“The Testaments”
Positive
738
– “Milk Wars”, which is a DC Universe/Young
Animals crossover, was such a wild ride…
definitely worth checking out, especially if you like
milk, Batman as a priest, Superman as a milkman
and Wonder Woman breastfeeding a
hand-vacuumcleaner
– “The milkman delivers penguins with their
chinking atonal fuss” Craig Raine
#NationalPoetryDay2018
Negative
252
– “By evening she was back in love again, though
not so wholly but throughout the night she woke
sometimes to feel the daylight coming like a
relentless milkman up the stairs.” A. Rich
– “Never trust a crying women and a milkman”
Irfann Khan says
#Karwaan
1082
– “All that’s to come, and everything under the sun is
in tune, but the sun is eclipsed by the moooon”
– “If you have everything under control, you aren’t
moving fast enough.” -Mario Andretti
(continued)
Everything under Positive
Opinion Mining of Readers’ Responses to Literary Prize Nominees on Twitter
253
Table 8. (continued)
Shortlisted novel Sentiment Number Tweet
Real life
Negative
492
– “For the first time in my life, I’ve got everything
under control.” She just jinxed it lmao #Supergirl
– “I’ve got everything under control”, said the
biggest liar
Positive
1367
– “Escobar: Paradise Lost” (2014) is the product of
love of Andrea Di Stefano. Inspired by Greek
tragedies, the actor turned director mixes real life
characters with fiction to tell a story about good
and evil. Excellent performances from Benicio Del
Toro and Josh Hutcherson!
– “I believe comic books are based loosely on reality
-- I believe there are real life equivalents of the
heroes in those books that walk the earth -- I
believe your husband is one of those individuals.”
Negative
634
– “Why are you annoying on the internet but so quiet
in real life?” ANXIETY BITCH THATS WHY ðŸ˜
– & now that I think about it. They did that shit in
real life too
4.3 Clustering
The dataset used in this study was created based of the number of tweets and the winner of
literary prize. A dataset was created for Booker prize which includes four main attributes
as listed in Table 9. Logistic regression model applied to check the accuracy. In this study,
K-means algorithm is selected for clustering and prediction.
Table 9. Description of dataset for clustering
Attributes
Description
Shortlisted novel
The novel shortlisted in the year of 2018, 2019 and 2020
Tweet
Number of tweets extracted based on shortlisted novel
Positive
Number of tweets classified into positive sentiment
Negative
Number of tweets classified into negative sentiment
Accuracy before (88.89%) and after (85.71%) the implementation of random oversampling method was recorded using logistic regression model. Although the accuracy
is slightly decreased, but it is still quite high and acceptable. This accuracy is more
meaningful as a performance metric. The Elbow method is used for computing k-means
for a range of different values of k. The elbow or bend of the plot is considered to be
the appropriate number of clusters. The elbow method for Booker prize in Fig. 2 shows
254
P. a/p Paremeswaran et al.
the bend point at 2. Hence, number of clusters chosen as 2 for Booker prize clustering
prediction.
Fig. 2. Elbow method for Booker prize.
Next step is to select k centers for each cluster. Cluster centroids describe the typical new shortlisted novel for each group or cluster. Figure 3 shows that Booker prize
nominees in cluster 0 have winning range of 0.142857, and losing range of 0.857143
which is higher than winning range if the nominees receive positive tweets in the range
of 85.071429 and negative tweets in the range of 21.50. The Booker prize nominees
in cluster 1 have winning range of 0.5 and losing range of 0.5 if the nominees receive
positive tweets in the range of 1152.25 and negative tweets in the range of 489.25.
Fig. 3. Centroid of International Booker prize clusters.
Based on the results obtained from clustering using k-means clustering, we can
identify that the number of positive tweets was a good predictor of the winner for literary
prize. In the case presented here, juries only have to analyze the cluster centroids to know
that the shortlisted novel with a higher number of positive tweets can receive the literary
prize award and the shortlisted novel with the lowest number of positive tweets is least
expected to win the prize. Another predictor is that in predicting the winner, negative
tweets contribute less than the positive tweets.
5 Conclusion
This project aimed to predict the Booker prize winner through using readers’ responses
from twitter. The objective was to analyze the tweet data using Topic modelling to
discover the main topics of discussion and using Sentiment analysis to classify the
sentiments into positive and negative. To do this, the first task was the extraction of tweet
data from twitter based on the Booker prize shortlisted novels in the years 2018, 2019 and
2020. As considering the type of tweets, snscrape library was chosen and implemented in
Opinion Mining of Readers’ Responses to Literary Prize Nominees on Twitter
255
Jupyter notebook using python programming language to extract the tweets from 2018,
2019 and 2020. Following the extraction, analysis of public reactions to the Booker prize
nominees was conducted using Topic Modelling and Sentiment Analysis. TM analysis
was used to determine cluster words for a set of tweet data. SA was used to classify
the sentiment of tweets into positive and negative. LDA algorithm was chosen for Topic
Modelling analysis. LDAmallet algorithm was applied to check whether this algorithm
gives better results. LDA algorithm gives better result compared to LDA mallet. LDA
algorithm has a limitation that can only be applied on big datasets. Hence, only on 4
datasets, LDA Topic Modelling analysis has been applied. LDA algorithm with optimal
number of k was applied to obtain the better quality of topics.
For Sentiment Analysis, a training dataset was utilized as a training set to classify
the sentiments of tweets. In smaller datasets, splitting into training and testing set is not
practical. Training set was balanced to have high number of attributes. The training set
utilized in this project consisted of tweet data attributes. The training set was trained
using logistic regression and naive bayes. Based on highest accuracy, logistic regression
algorithm was applied on test set.
Lastly, clustering was conducted to predict the winner using the results from analysis. The dataset was created to predict the winner of Booker prize. Later, the dataset
was identified as imbalanced dataset because the number of non-winners was higher
than number of winners. To overcome this imbalanced dataset, random oversampling
method was utilized. Then the balanced dataset was used for K-means clustering to
predict the cluster of winners. The number of clusters was chosen based on the elbow
method. Accuracy of dataset before implementation of random sampling method and
after implementation was recorded. Although the accuracy is slightly decreased, it is
still quite high and acceptable. Finally, we could analyze that positive tweets contribute
more for the prediction compared to other attributes.
References
1. Roberts, G.: Prizing Literature. University of Toronto Press, Toronto (2018)
2. Squires, C.: Book marketing and the booker prize. In: Moody, N., Matthews, N. (eds.) Judging
a Book By Its Cover: Fans, Publishers, Designers, and the Marketing of Fiction, pp. 71–82.
Ashgate, London, Aldershot (2007)
3. Moseley, M.: On the man booker prize. Sewanee Rev. 125(2), 296–309 (2017)
4. Asl, M.P.: Gender, space and counter-conduct: Iranian women’s heterotopic imaginations in
Ramita Navai’s city of Lies: love, sex, death, and the search for truth in Tehran. Gender Place
Cult. (2021). https://doi.org/10.1080/0966369X.2021.1975100
5. Jordison, S.: What happened? The Booker prize and concerns about process. TLS Times
Literary Suppl. 6082, 26–27 (2019)
6. Tiwari, S., Chaubey, A.K.: Politics of the man booker prize (s): the case of the white Tiger
and sea of Poppies. Rupkatha J. 10(3) (2018). https://doi.org/10.21659/rupkatha.v10n3.10
7. Al Sharaqi, L., Abbasi, I.: Twitter fiction: a new creative literary landscape. Adv. Lang.
Literary Stud. 7(4), 16–19 (2016)
8. Driscoll, B.: Twitter, literary prizes and the circulation of capital. In: Stinson, E. (ed.), pp. 103–
119. Monash University Publishing (2013)
256
P. a/p Paremeswaran et al.
9. Ying, S.Y., Keikhosrokiani, P., Asl, M.P.: Comparison of data analytic techniques for a spatial
opinion mining in literary works: a review paper. In: Saeed, F., Mohammed, F., Al-Nahari,
A. (eds.) IRICT 2020. LNDECT, vol. 72, pp. 523–535. Springer, Cham (2021). https://doi.
org/10.1007/978-3-030-70713-2_49
10. Keikhosrokiani, P., Asl, M.P. (eds.): Handbook of Research on Opinion Mining and Text
Analytics on Literary Works and Social Media, pp. 1–462. IGI Global, Hershey (2022).
https://doi.org/10.4018/978-1-7998-9594-7
11. Qomariyah, S., Iriawan, N., Fithriasari, K.: Topic modeling twitter data using latent
Dirichlet allocation and latent semantic analysis. AIP Conf. Proc. 2194(1), 020093 (2019)
12. Pirri, S., et al.: Topic modeling and user network analysis on Twitter during World Lupus
Awareness Day. IJERPH Int. J. Environ. Res. Public Health 17(15), 5440 (2020)
13. Manda, K.R.: Sentiment Analysis of Twitter Data Using Machine Learning and Deep Learning
Methods, in Faculty of Computing. Blekinge Institute of Technology, Sweden (2019)
14. Malik, E.F., Keikhosrokiani, P., Asl, M.P.: Text mining life cycle for a spatial reading of Viet
Thanh Nguyen’s the refugees (2017). In: 2021 International Congress of Advanced Technology and Engineering (ICOTEN) (2021). https://doi.org/10.1109/ICOTEN52080.2021.949
3520
15. Anjaria, M., Guddeti, R.M.R.: Influence factor based opinion mining of Twitter data using
supervised learning. In: 2014 Sixth International Conference on Communication Systems and
Networks (COMSNETS) (2014)
16. Mukhtar, N., Khan, M.A.: Urdu sentiment analysis using supervised machine learning
approach. Int. J. Pattern Recogn. Artif. Intell. 32(02), 1851001 (2018)
17. Hu, X., et al.: Unsupervised sentiment analysis with emotional signals. In: Proceedings of the
22nd International Conference on World Wide Web (2013)
18. Azzouza, N., et al.: A real-time Twitter sentiment analysis using an unsupervised method. In:
Proceedings of the 7th International Conference on Web Intelligence, Mining and Semantics
(2017)
19. Soni, R., Mathai, K.J.: Improved Twitter sentiment prediction through cluster-then-predict
model. arXiv preprint arXiv:1509.02437 (2015)
20. Unnisa, M., Ameen, A., Raziuddin, S.: Opinion mining on Twitter data using unsupervised
learning technique. Int. J. Comput. Appl. 148(12), 975–8887 (2016)
21. Hamzah, A., Hidayatullah, A.F.: Clustering on Twitter: case study Twitter account of higher
education institution in Indonesia. MATEC Web Conf. 154, 03010 (2018). https://doi.org/10.
1051/matecconf/201815403010
22. Patil, R., Algur, S.: Classification connection of Twitter data using k-means clustering. Int. J.
Innov. Technol. Exploring Eng. 8(6), 14–22 (2019)
23. Baralis, E., Cerquitelli, T., Chiusano, S., Grimaudo, L., Xiao, X.: Analysis of Twitter data
using a multiple-level clustering strategy. In: Cuzzocrea, A., Maabout, S. (eds.) MEDI 2013.
LNCS, vol. 8216, pp. 13–24. Springer, Heidelberg (2013). https://doi.org/10.1007/978-3-64241366-7_2
24. Sadeghi Moghadam, M.R., Safari, H., Yousefi, N.: Clustering quality management models
and methods: systematic literature review and text-mining analysis approach. Total Qual.
Manag. Bus. Excellence 32(3–4), 241–264 (2021)
25. Rejito, J., Atthariq, A., Abdullah, A.: Application of text mining employing k-means algorithms for clustering tweets of Tokopedia. J. Phys. Conf. Ser. 1722(1), 012019 (2021). https://
doi.org/10.1088/1742-6596/1722/1/012019
26. Annisa, R., Surjandari, I., Zulkarnain: Opinion mining on Mandalika hotel reviews using
latent Dirichlet allocation. Procedia Comput. Sci. 161, 739–746 (2019)
27. Poria, S., et al.: Sentic LDA: improving on LDA with semantic similarity for aspect-based
sentiment analysis. In: 2016 IJCNN (2016)
Opinion Mining of Readers’ Responses to Literary Prize Nominees on Twitter
257
28. Jian, T., et al.: Understanding the limiting factors of topic modeling via posterior contraction
analysis, pp. 190–198. PMLR (2014)
29. Asl, M.P.: Micro-physics of discipline: spaces of the self in Middle Eastern women life
writings. Int. J. Arabic-English Stud. 20 (2020). https://doi.org/10.33806/ijaes2000.20.2.12
30. Asl, M.P.: Foucauldian rituals of justice and conduct in Zainab Salbi’s between two worlds.
J. Contemp. Iraq Arab World 13(2–3), 227–242 (2019). https://doi.org/10.1386/jciaw_000
10_1
31. Asl, M.P.: Spaces of change: Arab women’s reconfigurations of selfhood through heterotopias
in Manal al-Sharif’s daring to drive. KEMANUSIAAN Asian J. Humanit. 27(2), 123–143
(2020). https://doi.org/10.21315/kajh2020.27.2.7
Dictionary-Based DGAs Variants Detection
Raja Azlina Raja Mahmood(B) , Azizol Abdullah , Masnida Hussin ,
and Nur Izura Udzir
Faculty of Computer Science and Information Technology, Universiti Putra Malaysia (UPM),
43400 Serdang, Malaysia
raja_azlina@upm.edu.my
Abstract. Domain Generation Algorithm (DGA) has been used by botnets to
obfuscate the connections between the bot master and its bots. The recent DGAs,
namely dictionary-based, or word-list DGAs are more sophisticated and difficult
to detect. They have high resemblance with the legit domain names as they use
a set of words from the dictionary to construct meaningful substrings. In this
study, we investigate the performance of Logistic Regression, Naïve Bayes, Support Vector Machine, Decision Tree, Random Forest and Bagging Decision Tree
algorithms in detecting the dictionary-based DGAs variants. A total of 21 humanengineered features were extracted from Banjori, Gozi, Matsnu, Suppobox and
CharBot DGAs variants to train these machine learning models. The accuracy and
area under receiver-operating characteristic curve (AUC) values of these classifiers were evaluated. Both Random Forest and Bagging Decision Tree ensemble
models outperformed other classifiers in accuracy and AUC scores. Banjori, Matsnu and Gozi variants are easily detected by the classifiers, but it is difficult to
distinguish Suppobox and CharBot DGAs from the benign domains. In addition,
we performed feature selection based on Decision Tree classifier and determine
the most important features for these variants using weighted feature importance
values. The identified top features include the subdomain length mean, ratio of
consecutive consonants, domain length, vowel ratio and number subdomains.
Keywords: Domain generation algorithms · Machine learning classifiers ·
Feature selection
1 Introduction
Bots are malware-infected computers that are remotely controlled by the commandand-control server (C&C) or bot master to perform malicious activities such as sending
massive spams, phishing, performing scams or DDOS attacks. For many years, domain
generation algorithms (DGAs) have been used to obfuscate the call back communication
between these bots and the bot master by generating large number of pseudo-random
domain names as well as changing the generated domain names frequently. The bot
master registers one or few of these domains and waits for the bots to resolve the DNS
queries and then establish the communication for a short period of time. These thousands
of short-lived malicious domains need to be detected in timely manner to reduce the damage caused by these malwares. There are many DGAs families which can be generally
© The Author(s), under exclusive license to Springer Nature Switzerland AG 2022
F. Saeed et al. (Eds.): IRICT 2021, LNDECT 127, pp. 258–269, 2022.
https://doi.org/10.1007/978-3-030-98741-1_22
Dictionary-Based DGAs Variants Detection
259
classified into their specific generation schemes namely arithmetic-based, hash-based,
word list-based or permutation-based [1]. The arithmetic-based DGAs are the most common type of DGAs, created using sequence or partial ASCII values. Hash-based DGAs
use MD5 and SHA256 hash to generate the malicious domains. Dictionary-based or
word list-based DGAs create domains by concatenating words from certain wordlists.
Permutation-based DGAs permute initial domain names to generate malicious domains.
The dictionary-based DGAs have high resemblance with the legit domain names. It uses
a set of words from the dictionary to construct meaningful substrings and hence difficult
to distinguish them from the benign domain names.
Detecting DGAs can be done solely based on domain name itself or based on context
information such as IP addresses and query traffic patterns by the infected machines. Our
study focuses on the former approach, due to lack of the network and data traffics with
DGAs. In this paper, we focus on detecting dictionary-based DGAs variants using classical machine learning algorithms namely Logistic Regression, Naïve Bayes, Support
Vector Machine and Decision Tree. We also implement two ensemble classifiers namely
Random Forest and Bagging Decision Tree. The Banjori, Gozi, Matsnu and Suppobox
dictionary-based DGAs variants are reproduced using the algorithms shared in several
public DGA repositories. In this study, we also detect the newly proposed dictionarybased generated domains, the CharBot DGAs [2]. CharBot is a character-based DGA that
randomly modifies two characters in well-known domains from the Alexa top domain
names [3] and hence very similar to legit domains. We extract 21 features from the
domain names, indicated in [4] and use them to train the machine learning models to
distinguish benign and malicious domain names using labels. The performance of these
classifiers, in terms of accuracy and area under the receiver operating characteristic
curve (AUC) values are then discussed. Feature selection algorithms find the features
that have high correlation with their respective results [5]. Feature selection enables
the non-important or noisy features to be removed, hence reduces the dimensions and
computational complexity during the model training as well as improving the inference
accuracy. We implement Decision Tree feature importance on these extracted features
for all variants and then calculate the weighted feature importance values to generalize
the most important and least important features for dictionary-based DGA variants.
2 Related Works
In recent years, the increasingly popular machine learning approaches have been applied
to detect DGAs variants by many researchers. In the supervised learning method, human
defined features such as domain name length are manually extracted from the domain
names [4, 6–9]. Many researchers proposed different combinations of features to achieve
best detection results in this “featureful” method. FANCI [4] for example used 21 features
meanwhile B-RF [10] used 26 features in training their respective random forest classifiers. Alternatively, the “featureless” approach relies on the learning models to automatically discover good features from the domain names during the training process. Deep
neural networks models including Long Short-Term Memory (LSTM), Convolutional
Neural Networks (CNN) and hybrids have been used [11–15] and they outperformed
the featureful methods due to the complex and sophisticated nature of the algorithms.
260
R. A. R. Mahmood et al.
The following paragraphs discuss some of the works related to DGAs detection using
machine learning.
PHOENIX by Schiavoni et al. [9] used linguistic features, in particular meaningful character ratio, n-gram score and the statistical linguistic to differentiate malicious
domains from normal domains. They analyzed Conficker, Torpig and Bamital DGAs,
which are the early DGAs variants that exhibit a certain degree of linguistic randomness
and hence can be easily distinguished from normal domains. In addition, PHOENIX fingerprints groups of domains and clusters them according to their linguistic and IP-based
properties similarities. The proposed system managed to associate previously unknown
DGAs into newly formed clusters and hence able to track the DGAs evolving behavior.
In 2016, Daniel Plohmann et al. provided a comprehensive survey on various domain
generative malware families and variants [1]. A total of 43 DGAs been analyzed which
have been categorized into four different generation schemes: arithmetic-based, hashbased, word list-based and permutation based DGAs. Their study shows that the domain
randomness or the entropy of the word-list based DGAs, Gozi, Matsnu and Suppobox
is significantly low than the other DGAs families. They recognize the complexity in
distinguishing these DGAs variants from the legit domains.
Feature-based Automated NXDomain Classification and Intelligence (FANCI)
detection system uses 21 features with random forest and SVM classifiers to detect
59 DGAs variants generated from large public DGArchive, large campus network and
internal company network [4]. They performed grid search to find the optimal parameters for the classifiers. As anticipated, random forest yields high accuracy percentage at
low false positive rate in comparison to SVM, in detecting both mixed DGAs and single
DGA on different networks.
CharBot by [2] was proposed as an efficient black-box adversarial attack that introduces small perturbations to a set of legit domains and hence difficult to be detected.
FANCI [4], B-RF [10] and LSTM.MI [11] were implemented to detect CharBot DGAs.
The AUC results show the deep learning approach with score 98.89% performs better
than the random forest-based methods. For the random forest methods, B-RF scores
94.67% and outperforms FANCI of score 80.46%. The authors believe this is due to
the different feature sets used in both systems, which are 26 in B-RF and 21 features in
FANCI.
Highnam et al. [16] proposed Bilbo, a new deep learning solution to detect dictionarybased DGAs variants, namely Matsnu, Suppobox and Gozi in real time. Bilbo is a hybrid
model that processes domains names using LSTM and CNN layer in parallel. The outputs
of these two architectures are then aggregated by a single-layer artificial neural network.
Bilbo consistently outperforms other deep learning models in AUC, accuracy and F1
score. Bilbo was applied for several hours in live network and was reported to be able
to discover at least five potential C&C networks effectively.
Kim et al. [17] performed the Recursive Feature Elimination (RFE) feature selection
algorithm with Decision Tree, Random Forest and Extra-Random Forest classifiers to
detect different type of malware: Trojan, Adware, Downloader and Backdoor. RFE
creates a model that starts with all the features, then eliminate those with the lowest
importance, checks the results and then repeats the process to create a new model. Out
of 804 total features, RFE with Decision Tree selected 291, RFE with Random Forest
Dictionary-Based DGAs Variants Detection
261
selected 202 and RFE with Extra Random Forest selected 456 features. Performance
evaluation on all features and reduced features by RFE were performed and a comparable
performance was achieved even with the reduced features with difference was 3% on
average,
Abawajy et al. [18] implemented few commonly filter-based feature selection methods namely Pearson, Information Gain, Anova, Chi-Square and Mutual Information
to detect Android malware. The top features selected by all these methods were compared with almost all rank SMS related permissions at the top. The feature selection
improves the accuracy when evaluated using Support Vector Machine, Naïve Bayes,
K-Nearest Neighbours and Logistic Regression. The Naïve Bayes classifier shows significant improvement in detection results when using a subset of features as opposed to
all features.
3 Methodology
3.1 Dictionary-Based DGAs
A domain name is a sequence of characters with few subdomains separated by dots,
including these legit domains: irict.co, kali.tools and xn--80aaf6awgebgaa.xn--p1ai. The
dictionary-based DGAs have high resemblance with the legit domains as they are composed of valid English words and hence this family variants are more difficult to detect.
Moreover, the Internationalized Domain Names (IDNs) project by ICANN allows the
use of domain names in few languages and scripts, such as Arabic, Chinese, Cyrillic or Devanagari which are encoded by the Unicode standard [19]. Detecting malicious
domains becomes more challenging in years to come as the word corpus becomes increasingly large. In this work, we focus on detecting English-based malicious domains that
are generated by five dictionary-based DGAs variants namely Banjori, Gozi, Matsnu,
Table 1. Samples of legit and malicious domain names.
Variant
Examples of domain names
Source
Alexa top domains
vocetelecom.vc
marketlinx.com
https://www.alexa.com
Banjori
xpcfestnessbiophysicalohax.com
vlkkestnessbiophysicalohax.com
https://data.netlab.360.com
Matsnu
userbasesteplunchnarrowtree.com
girlfriendjoinapplytourtransition.com
https://github.com/andrewaeva
Gozi
thistheimpofrtandwork.ru
publicworklewacarrythe.ru
https://github.com/baderj
Suppobox
classwrite.net
withingarden.net
https://github.com/baderj
CharBot
m1rkftingbank.pl
tinnsalt.info
[2]
262
R. A. R. Mahmood et al.
Suppobox and CharBot. Table 1 shows some of the samples of both legit and malicious
dictionary-based domain names used in our work.
3.2 Extracted Features
Following the work of [4], 21 features have been extracted from each domain string in
this study. Each of this extracted feature is either a single scalar or vector scalars. As
a result, a final feature vector of size 41 has been generated for each domain string.
Thousands of these feature vectors are then used to train the respective classifiers for
effective inference, resulting to efficient DGAs detection. These 21 features have been
categorized into structural, linguistic, and statistical features. There are 12 structural
properties and 7 linguistic properties of the domain string been considered in this work,
as depicted in Table 2. Table 3 lists 2 statistical features used in this study which include
n-grams. The details of these extracted features have been elaborated by the authors with
FANCI codes are available on GitHub [20].
These tables contain the list of the features and the generated vector values of the
respective domain strings: vocetelecom.vc denoted by f(d1 ) is a benign domain name
Table 2. 12 structural features (1–12) and 7 linguistic features (13–19).
No Feature
f(d1 ) f(d2 ) f(d3 ) f(d4 ) f(d5 ) f(d6 )
1
Domain name length
14
30
31
24
14
16
2
Number of subdomains
1
1
1
1
1
1
3
Subdomain length mean
11
26
27
21
10
13
4
Has www prefix
0
0
0
0
0
0
5
Has valid TLD
1
1
1
1
1
1
6
Contains single-character subdomain
0
0
0
0
0
0
7
Is Exclusive prefix repetition
0
0
0
0
0
0
8
Contains TLD as subdomain
0
1
1
1
1
1
9
Ratio of digit-exclusive subdomains
0
0
0
0
0
0
10
Ratio of hexadecimal-exclusive subdomains 0
0
0
0
0
0
11
Underscore ratio
0
0
0
0
0
0
12
Contains IP address
0
0
0
0
0
0
13
Contains digits
0
0
0
0
0
1
14
Vowel ratio
0.45
0.31
0.37
0.29
0.3
0.17
15
Digit ratio
0
0
0
0
0
0.08
16
Alphabet cardinality
7
15
14
15
9
11
17
Ratio of repeated characters
0.43
0.6
3.56
0.33
0.11
0.18
18
Ratio of consecutive consonants
0
0.54
0.56
0.71
0.6
0.69
19
Ratio of consecutive digits
0
0
0
0
0
0
Dictionary-Based DGAs Variants Detection
263
whereas xpcfestnessbiophysicalohax.com denoted by f(d2 ) is a Banjori DGA, userbasesteplunchnarrowtree.com denoted by f(d3 ) is a Matsnu variant, thistheimpofrtandwork.ru
denoted by f(d4 ) is a Gozi DGA, classwrite.net denoted by f(d5 ) is a Suppobox DGA
and m1rkftingbank.pl denoted by f(d6 ) is a CharBot DGA.
Table 3. Statistical features.
No
Feature and vector values
20
N-Gram distribution (n = 1, 2, 3)
f(d1 ) (0.73, 1.0, 1.57, 1, 3, 1.0, 2.0), (0.0, 1.0, 1.0, 1, 1, 1.0, 1.0), (0.0, 1.0, 1.0, 1, 1, 1.0,
1.0)
f(d2 ) (0.77, 2.0, 1.73, 1, 4, 1.0, 2.0), (0.2, 1.0, 1.04, 1, 2, 1.0, 1.0), (0.0, 1.0, 1.0, 1, 1, 1.0,
1.0)
f(d3 ) (1.22, 1.5, 1.93, 1, 5, 1.0, 2.0), (0.2, 1.0, 1.04, 1, 2, 1.0, 1.0), (0.0, 1.0, 1.0, 1, 1, 1.0,
1.0)
f(d4 ) (0.61, 1.0, 1.4, 1, 3, 1.0, 2.0), (0.22, 1.0, 1.05, 1, 2, 1.0, 1.0), (0.0, 1.0, 1.0, 1, 1, 1.0,
1.0)
f(d5 ) (0.31, 1.0, 1.11, 1, 2, 1.0, 1.0), (0.0, 1.0, 1.0, 1, 1, 1.0, 1.0), (0.0, 1.0, 1.0, 1, 1, 1.0,
1.0)
f(d6 ) (0.39, 1.0, 1.18, 1, 2, 1.0, 1.0), (0.0, 1.0, 1.0, 1, 1, 1.0, 1.0), (0.0, 1.0, 1.0, 1, 1, 1.0,
1.0)
21
Entropy
f(d1 ) = 2.66, f(d2 ) = 3.78, f(d3 ) = 3.56, f(d4 ) = 3.78, f(d5 ) = 3.12, f(d6 ) = 3.39
3.3 Data Sets and Classifiers
We generate many DGAs using the algorithms from public DGA repositories as well
as acquiring the datasets from the authors. The benign domain names taken from the
Alexa site and malicious domain names are labelled accordingly. A balanced number of
domains are randomly selected from both benign and DGAs databases and merged into
data sets of various sizes. We prepared 5 sample datasets of various sizes and hence a
total of 900 processing files were involved: 6 classifiers * 5 DGAs * 6 sample sizes * 5
sets. We then randomly split the train and test sets into 70:30 ratio. The machine learning
model learns from the training data and then predict the test data.
The Python scikit-learn classifiers with default settings have been used in this experiment. No cross-validation or optimization was performed in this preliminary study. We
evaluate the performance of these classifiers by calculating the average accuracy and
AUC values. Accuracy is defined as ACC = |TP| + |TN|/|population|, where |TP| is total
true positives and |TN| is total true negatives. Table 4 lists the parameters used in this
experiment. We implemented the classical classifiers together with two ensemble models
that are supported by scikit-learn package. The Bagging Decision Tree algorithm uses
264
R. A. R. Mahmood et al.
all the features to decide the best split, meanwhile random forest uses a random subset
of features at every node to decide the best split. The experiments were performed on an
Intel(R) Xeon(R) Silver 4110 CPU @ 2.10 GHz server accelerated by NVIDIA Tesla
V100.
Table 4. List of parameters and values.
Parameters
Values
Balanced data sample size
10K, 20K, 30K, 40K, 50K and 60K
Number sets per sample size 5 sets (each set contains a balanced number of randomly
selected benign domains and DGAs)
Train and test split
70% (train) and 30% (test)
Python scikit-learn modules
LogisticRegression(), GaussianNB(), SVC(),
DecisionTreeClassifier(), RandomForestClassifier(n_estimators
= 20) and BaggingClassifier(DecisionTreeClassifier(),
max_samples = 0.5, max_features = 1.0, n_estimators = 20)
Performance metrics
Accuracy and area under ROC curve (AUC)
3.4 Feature Selection
The 21 extracted features resulting to 41 data dimensions that need to be computed
and processed. To train 42,000 domains (or 70%) from our 60K sample data, a total of
42,000 × 41 or 1,722,000 computations needs to be performed to create a trained model.
Hence, to reduce the computational complexity, we perform feature selection (FS) by
calculating the feature importance values using the Decision Tree classifier model on one
of the sample datasets. The feature importance values of each feature for data size from
10K to 60K of each variant were collected. For every sample size of each variant, we
run the scikit-learn compute_feature_importances() and record the feature importance
values for each vector. We collected a total of 41 vectors × 6 sample sizes × 5 DGA
variants or 1,230 absolute feature importance values (ranging from value 0 to 0.499). We
identified the top 5 vectors with the highest features values from each sample size, called
the top_feat element and assigned weight value 1 to each of them. The other vectors
with non-zero features values, called the nontop_feat elements have been assigned with
weight value of 0.25. We then determine the weighted feature importance values of each
vector by summing the total number of both elements for every sample size of each
variant. We consider the relative importance by assigning respective weight to top_feat
and nontop_feat elements, as well as the frequency of them occurring in each vector to
determine the rank of each feature.
4 Results and Discussion
We evaluate the performance of the classifiers on our balanced datasets using the average
accuracy and average AUC values as depicted in Table 5. For each classifier, we record
Dictionary-Based DGAs Variants Detection
265
the accuracy and AUC values in detecting each variant, which have 5 different sample
datasets and with different sizes per sample. These collected values are then averaged and
presented in Table 5. Figures 1, 2, 3, 4 and 5 depict the absolute accuracy values and AUC
values taken from one sample dataset of specific size of each DGA variant to observe the
performance of the classifiers. The bold values in the table show the significantly low
detection rates by Naïve Bayes (NB). In general, NB only performed well on Banjori
dataset but did not match well with other classifiers when predicting different variants.
NB algorithm assumes all features are equally important and not related to each other
and has been observed unable to detect sophisticated dictionary-based DGAs variants
that may have high correlated features. The other classifiers have similar good detection
results with the ensemble methods, the Random Forest (RF) and Bagging Decision Tree
(BGDT) always outperformed the others as shown in Table 5.
Table 5. Summary of the classifiers’ performance in terms of accuracy and AUC.
Variant
Average Accuracy Values (%) of LR,
NB, SVM, DT, RF, BGDT
Average AUC Values of LR, NB, SVM,
DT, RF, BGDT
Banjori
99.69, 99.92, 99.9, 99.98, 99.99, 99.97 0.9986, 0.9998, 0.9999, 0.9998,
0.9999,0.9999
Matsnu
99.4, 85.35, 99.62, 99.45, 99.7, 99.72
0.9972, 0.9271, 0.9973, 0.9948, 0.9977,
0.9977
Gozi
99.4, 85.35, 99.62, 99.45, 99.7, 99.72
0.9733, 0.625, 0.9792, 0.9978, 0.9999,
0.9997
Suppobox
92.98, 61.77,94.61, 99.76, 99.87, 99.7 0.8176, 0.6049, 0.8479, 0.8342, 0.8644,
0.872
CharBot
81.1, 58.01, 80.86, 79.07, 79.9, 80.47
0.8761, 0.5839, 0.8737, 0.8233, 0.8812,
0.8899
The AUC determines the classifier’s efficiency in distinguishing the classes correctly.
The higher the AUC values, the better the model. An ideal classifier has AUC score of 1,
which can be seen only in Fig. 1(b) when predicting Banjori DGAs. In detecting Banjori,
on average, all the classifiers score above 99.6% in accuracy and score above 0.99 in
AUC and hence conclude that this type of variant can be predicted easily. In detecting
Matsnu and Gozi variants, all the classifiers, with the exception NB, performed well as
shown in both Figs. 2 and 3. The average accuracy score for other-than-NB classifiers
are above 99.4% while NB scores only 85.35% in both variants. The average AUC value
for NB is significantly low when detecting Gozi variant, with 0.625 score. In detecting
Suppobox and CharBot variants, NB’s performance worsens with average accuracy
values of 61.77% and 58% respectively (refer Figs. 4 and 5). The average NB AUC’s
score in detecting CharBot is around 0.58 which indicate the inability of the algorithm
to correctly predict this variant, while others are performing well with score above 0.82.
In general, both RF and BGDT consistently outperformed others as reflected by both of
their average accuracy and AUC scores, except when detecting CharBot. Both Logistic
Regression (LR) and Support Vector Machine (SVM) have higher accuracy scores than
266
R. A. R. Mahmood et al.
RF and further analysis is to be carried out to fully understand the causes of it. Finally,
based on the detection scores of the classifiers we can conclude that Banjori, Matsnu and
Gozi variants are easy to detect by most of the classifiers in comparison to Suppobox
and CharBot.
Fig. 1. (a) Average accuracy and (b) AUC results in detecting Banjori.
Fig. 2. (a) Average accuracy and (b) AUC results in detecting Matsnu.
Based on the weighted feature importance results shown in Fig. 6, we can conclude
that the top 5 important features in detecting the dictionary-based DGA variants are as
follows: (1) f3 or the subdomain length mean, (2) f18 or ratio of consecutive consonants,
(3) f1 or domain length, (4) f14 or vowel ratio and (5) f2 or number subdomains. The
n-gram values or f20 are not included in top 5 due to the inconsistency of the results
for this sample data and further experiments are needed. It is worth noting that f3 or
subdomain length mean feature has a maximum weighted value of 30 as it is listed
in top 5 of each sample size in each variant, and in fact this feature has the highest
absolute feature importance value for every scenario. However, these highest absolute
feature importance values vary significantly from one variant to another due to the
different generation algorithms, hence different resulting domain strings of each variant,
as depicted in Table 1. For example, in dataset size 50K, its highest importance value
Dictionary-Based DGAs Variants Detection
Fig. 3. (a) Average accuracy and (b) AUC results in detecting Gozi.
Fig. 4. (a) Average accuracy and (b) AUC results in detecting Suppobox.
Fig. 5. (a) Average accuracy and (b) AUC results in detecting CharBot DGAs.
267
268
R. A. R. Mahmood et al.
for Banjori is 0.499, 0.3684 for Gozi, 0.4937 for Matsnu, 0.124 for Suppobox and
0.053 for CharBot. As the range of these absolute feature importance values of each
variant vary significantly, it is not accurate to include these values in generalizing the
top features for all the dictionary-based DGAs variants. Instead, we assigned different
weight values for features with high and low absolute feature importance values. In
addition, we determine the nonimportant features, which can be removed later to reduce
the computational complexity of training a machine learning model. The zero important
features identified by the Decision Tree classifier are f5, f6, f7, f11 and f12. In addition,
the other identified least important features include f4, f9, f10 and f19.
Fig. 6. Weighted feature importance values for each feature
5 Conclusion
We implemented different machine learning models to detect five dictionary-based
DGAs family variants. Banjori, Matsnu, Suppobox and Gozi DGAs variants have been
studied in few literatures but to the best of our knowledge, very few involved CharBot DGAs in their works. In our preliminary work, we evaluate the performance of
few classical as well as ensemble classifiers in detecting these variants. As anticipated,
the ensemble classifiers outperformed others consistently in accuracy and area under
receiver-operating characteristic curve (AUC) values. The experimental results show
that Suppobox and CharBot are difficult to distinguish from the benign domains in comparison to other variants. Additionally, feature selection has been performed using the
Decision Tree classifier feature importance attribute for each variant. We identified the
most, the least and zero important features of these dictionary-based DGA variants using
the proposed weighted feature importance values. An extensive in-depth study will be
performed to validate our preliminary findings and more robust feature selection method
such as Recursive Feature Elimination (RFE) will be considered in the future.
Dictionary-Based DGAs Variants Detection
269
References
1. Plohmann, D., Yakdan, K., Klatt, M., Bader, J., Gerhards-Padilla, E.: A comprehensive
measurement study of domain generating malware. In: 25th Proceedings of the USENIX
Conference on Security Symposium, Austin, USA, pp. 263–278 (2016)
2. Peck, J., et al.: CharBot: a simple and effective method for evading DGA classifiers. IEEE
Access 7, 91759–91771 (2019)
3. Alexa Top 1M sites. https://www.alexa.com/topsites. Accessed 13 Jan 2021
4. Schuppen, S., Teubert, D., Herrmann, P., Meyer, U.: FANCI: feature-based automated NXDomain classification and intelligence. In: 27th USENIX Security Symposium, Batimore, USA,
pp. 1165–1181 (2018)
5. Dash, M., Liu, H.: Feature selection for classification. Intell. Data Anal. 1(3), 131–156 (1997)
6. Antonakakis, M., Perdisci, R., Nadji, Y., et al.: From throw-away traffic to bots: detecting the
rise of DGA-based malware. In: 21st USENIX Conference on Security Symposium, Bellevue,
USA, pp. 491–506 (2012)
7. Wang, Z., Jia, Z., Zhang, B.: A detection scheme for DGA domain names based on SVM. In:
International Conference on Mathematics, Modelling, Simulation and Algorithms. Atlantis
Press, Chengdu (2018)
8. Li, Y., Xiong, K., Chin, T., Hu, C.: A machine learning framework for domain generation
algorithm DGA-based malware detection. IEEE Access 7, 32765–32782 (2019)
9. Schiavoni, S., Maggi, F., Cavallaro, L., Zanero, S.: Phoenix: DGA-based botnet tracking and
intelligence. In: Dietrich, S. (ed.) DIMVA 2014. LNCS, vol. 8550, pp. 192–211. Springer,
Cham (2014). https://doi.org/10.1007/978-3-319-08509-8_11
10. Sivaguru, R., Choudhary, C., Yu, B., Tymchenko, V., Nascimento, A., De Cock, M.: An
evaluation of DGA classifiers. In: Proceedings of 2018 IEEE International Conference on
Big Data, Seattle, USA, pp. 5051–5060 (2018)
11. Woodbridge, J., Anderson, H.S., Ahuja, A., Grant, D.: Predicting domain generation
algorithms with long short-term memory networks. PreprintarXiv:1611.00791 (2016)
12. Saxe, J., Berlin, K.: Expose: a character-level convolutional neural network with embeddings
for detecting malicious URLs, FLE paths and registry keys. Preprint arXiv:1702.08568 (2017)
13. Shaofang, Z., Lanfen, L., Yuan, J., Wang, F., Ling, Z., Cui, J.: CNN-based DGA detection with
high coverage. In: IEEE International Conference on Intelligence and Security Informatics,
Shenzen, China, pp. 62–67 (2019)
14. Lison, P., Mavroeidis, V.: Automatic detection of malware-generated domains with recurrent
neural models. Preprint arXiv:1709.07102 (2017)
15. Yu, B., Pan, J., Hu, J., Nascimento, A., Cock, MD.: Character level based detection of dga
domain names. In: International Joint Conference on Neural Networks, Rio de Janeiro, Brazil,
pp. 1–8 (2018)
16. Highnam, K., Puzio, D., Luo, S., Jennings, N.R.: Real-time detection of dictionary DGA
network traffic using deep learning. SN Comput. Sci. 2(2), 1–17 (2021). https://doi.org/10.
1007/s42979-021-00507-w
17. Kim, D.-W., Shin, G.-Y., Han, M.-M.: Analysis of feature importance and interpretation for
malware classification. Comput. Mater. Continua 65(3), 1891–1904 (2020)
18. Abawajy, J., Darem, A., Alhashmi, A.A.: Feature subset selection for malware detection in
smart IoT platforms. Sensors 21(4), 1374 (2021)
19. ICANN. https://www.icann.org/resources/pages/idn-2012-02-25-en. Accessed 3 June 2021
20. FANCI. https://github.com/fanci-dga-detection/fanci. Accessed 10 Feb 2021
Comparison of Unsupervised Machine Learning
Analysis Using K-Means, Hierarchical
Clustering, and Principal Component Analysis
in Horticulture Agribusiness: Shallot
and Tomato Productivity in Indonesia
Junita Juwita Siregar1(B) and Eka Budiarto2
1 Computer Science Department, School of Computer Science, Bina Nusantara University,
Jakarta 11480, Indonesia
juwita_siregar@binus.ac.id
2 Master of Information Technology, Swiss German University, Tangerang, Indonesia
eka.budiarto@sgu.ac.id
Abstract. Horticulture agribusiness needs effective planning to boost productivity. This planning needs to be adjusted to the characteristic of the planting area. To
help with grouping, clustering methods using k-means and hierarchical clustering
(single link and complete link approaches) were used with case study data about
shallot and tomato productivity in 33 provinces in Indonesia from 2015 to 2019.
A principal component analysis was used to reduce the number of features in the
transformed data. Both normalized original and transformed data were used in
this study, and the results were compared. The results showed that clustering can
detect general trends in productivity as well as any anomalies. The main characteristics found were high, low, and especially high average productivity as well as
one case of an anomaly. Different clustering highlighted different aspects of the
characteristics. The principal component analysis also provided insights into what
is actually important in the productivity data. In this case, principal components
highlighted the average productivity and anomaly. It is hoped that this result could
be extended to more detailed data that can then be used to significantly increase
productivity.
Keywords: K-Means · Principal component analysis · Horticulture productivity
1 Introduction
Horticulture needs planning to maximize productivity. This becomes increasingly important due to the population growth, giving rise to the concept of Agriculture 4.0 [1], where
productivity is increased by considering the careful allocation of resources, adaption to
climate change, and avoidance of food waste. In horticulture, planning should start with
identifying groups within the production regions. If the groups are meaningful, then
different actions or solutions can be applied according to the groups. Unfortunately, it
© The Author(s), under exclusive license to Springer Nature Switzerland AG 2022
F. Saeed et al. (Eds.): IRICT 2021, LNDECT 127, pp. 270–282, 2022.
https://doi.org/10.1007/978-3-030-98741-1_23
Comparison of Unsupervised Machine Learning Analysis
271
is not always straightforward to make groupings, especially if the number of variables
to be considered is large. One way to find the groupings is by using clustering, an unsupervised learning method that makes groups or clusters based on similarity (distance)
within the data. Clustering has been used for many applications in agriculture, such
as rice yield estimation from images taken by an unmanned aerial vehicle (UAV) [2],
rice crop clustering over provinces [3], feasibility study of corn planting areas [4], the
dynamic monitoring of wheat yield crop traits [5], and forestry harvesting productivity
[6].
Previous research has examined the k-means clustering method:
Jepry et al. [17] found that k-means is used to classify the stages of maturity under
ripe and overripe based on the relationship between palm oil and fruit color, where different color intensities used fuzzy classification. Kalaivani et al. [22] presented color
segmentation using a tomato plant grading system with a k-means clustering algorithm.
The study measured nutrient levels and health status based on leaf color, forming groups
based on the matrix similarity. Ginne, M. J [19] examined tomato disease using segmentation. Tomato image samples were collected from the local market and used for further
processing. The disease section was segmented into 5 different cluster processes using
the k-means clustering algorithm. After all iterations, the last image was displayed in
the fifth cluster. The intensity value of each centroid was a plot based on the red, green,
and blue pixels for the infected part.
In this paper, a study of clustering applied to horticulture productivity was carried
out, specifically for shallots and tomatoes in Indonesia, where clustering was done on the
combination of both products. This approach was used to investigate whether groupings
could also be done on a combination of products. Several methods in this case k-means
and hierarchical clustering [20, 23], combined with principal component analysis [21]
were used to identify the differences in the clustering results. The aim was to investigate
the potential of using clustering to group the horticulture production areas. Using these
groups, it is hoped that specific actions can be done for each group according to its
characteristic in order to increase productivity.
2 Methods
2.1 Data
Data for this study included productivity information related to tomato and shallot production in 34 provinces in Indonesia from 2015 to 2019. These data were gathered from
the Ministry of Agriculture, Republic of Indonesia [7]. Data for the DKI Jakarta province
were removed due to not being complete (i.e., a lot of missing data). The tomato and
shallot horticulture products were chosen for this study due their data completeness (i.e.,
no missing data). Missing data are a problem that has to be solved before the data analytics method, including the clustering method, can be executed to obtain good results.
Unfortunately, the authors did not have enough information to deal with the missing data
in shallot and tomato production.
272
J. J. Siregar and E. Budiarto
2.2 Clustering Methods
Clustering is part of an unsupervised machine learning method [20]. In this study, several
clustering methods were used: k-means and hierarchical clustering [20, 23]. The results
of these two clustering methods were compared and analyzed. In clustering, the data
are grouped based on similarities [18], which are usually measured using distances. The
distances between the data points are usually computed using Euclidean distance due to
its simplicity, which was also used in this study. Features are treated the same despite
the scales of the numerical values of the data, and all data were normalized before the
clustering process was carried out. A good cluster is one where the distances between
data points within a cluster are small while distances between data points in other clusters
are large. The silhouette score [8], which is usually used as a performance measure of
a clustering result, is determined by measuring and comparing these distances. A good
clustering will have a silhouette score near 1, which is the score used in this study.
K-means. K-means is a popular clustering method [9] that has been used in many
applications, such as the analysis of average traffic speed using unmanned aerial vehicle
(UAV) data [10], agriculture and crop yields such as for rice [2, 3], and air pollution
[11]. The method is based on the iterative determination of centroids (the centers of
the clusters), which are computed as the means of the data points in that cluster. There
are several ways of defining the initial centroids, but in this study random initialization
was used. The data points are then clustered according to the nearest centroid [1]. The
number of clusters (usually referred as “k”) to be created is determined before the method
is executed. The value of k was determined using the average silhouette [18] score in
this study. The k-means clustering algorithm is as follows:
1. Define k as the sum cluster you want to form. Group areas based on soil and climatic
conditions according to crop needs.
2. Select the initial k centroid randomly to determine the initial cluster center and
generate random numbers.
3. To calculate distance, process each piece of data for each of the centroids taken from
the data value and define the value of the cluster center.
4. Choose each data centroid with the closest distance; using the results, compare and
select the shortest distance between data and center clusters.
5. Determine the position of the new centroid by calculating the average value of the
data located on the same centroid.
6. If the new centroid position is not the same as the old centroid go back to step 3.
Hierarchical Clustering. As stated in the name, hierarchical clustering involves clusters of clusters. A review of some methods for doing hierarchical clustering can be seen
in [12]. As stated in the name, hierarchical clustering involves clusters of clusters. A
review of some methods for doing hierarchical clustering can be seen in [12]. In this
study, agglomerative hierarchical clustering was used, where clusters were created by
combining smaller clusters, starting with each data point as a cluster. Clusters that are
near or similar are combined together. There are several ways to define the distances
between two clusters, such as the distance between the nearest members of the two
Comparison of Unsupervised Machine Learning Analysis
273
clusters (single link) and the distance between the furthest members of the two clusters
(complete link). Both single link and complete link approaches were investigated in this
study.
2.3 Principal Component Analysis (PCA)
Principal component analysis (PCA) is a multivariate statistical method that extracts the
weighted combinations of features (called principal components) that represent most of
the variance in the data. PCA is based on the decomposition of the covariance matrix
of the data into their eigenvectors and eigenvalues (see, for example, [13]). In machine
learning applications, PCA has often been used to reduce the number of features used
for the analysis, effectively reducing the dimension of the problem [14]. This kind of
application of PCA was investigated in this study, combined with the clustering methods.
In this study, PCA computation was based on non-normalized original data. The resulting
principal components were then analyzed to give some additional insights.
2.4 Experimental Design
As previously mentioned, the data for this study related to shallot and tomato productivity
in Indonesia for 33 provinces. The data were available on yearly basis, from 2015
to 2019. The features of the data were the yearly shallot and tomato productivity (in
total, 10 features). The names of the provinces were not used to make clustering, but
they were used to identify the samples. The data were represented in a matrix with 11
columns (including the names of the provinces) and 33 rows. PCA was used to extract the
principal components from the original data. These principal components were used as
new features (replacing the 10 original features) in the transformed data. The transformed
data were also analyzed in this study. Using these original and transformed data, four
kinds of experiments were carried out:
i.
ii.
iii.
iv.
Clustering using k-means on original data.
Clustering using hierarchical clustering (single and complete link) on original data
Clustering using k-means on PCA-transformed data.
Clustering using hierarchical clustering (single and complete link) on PCA
transformed data.
The results of these experiments were compared and analyzed. The weights of the
principal components were also analyzed to get additional insights. All the computations
were done using Orange Data Mining software [15], which is free software.
3 Results and Discussion
PCA done on the non-normalized data found that 91.2% of the variance in the data could
be represented by using only 2 principal components. These 2 principal components
were then used as new features in the transformed data, replacing the original ones.
274
J. J. Siregar and E. Budiarto
The principal components were weighted combinations of the original features. The
distribution of the weights can be seen in Fig. 1, which shows that the first principal
component was a weighted average of the original features of the data. The second
principal component was more interesting, as it highlighted shallot productivity in 2019.
As the clustering results demonstrate, shallot productivity in 2019 was indeed a special
feature that indicated an anomaly in the data. Before determining the number of clusters
to be used in k-means clustering, both on normalized original data and normalized PCAtransformed data, average silhouette scores were computed. The two highest results of
these score computations are shown in Table 1.
Table 1. Average silhouette scores for different numbers of clusters using k-means with different
normalized data.
Number of clusters
Normalized original
data
Normalized
transformed data
2
0.497
0.772
3
0.504
0.606
The complete list clustering results for both 2- and 3-cluster schemes with different
methods, including hierarchical clustering, can be seen in Table 2. The plots of yearly
productivity for the resulting clusters using k-means and hierarchical clustering methods
can be seen in Figs. 2, 3, and 4, respectively.
PC1
PC2
1
Weight
0.8
0.6
0.4
0.2
0
-0.2
Features
Fig. 1. Weight distribution of the principal components (PC-s).
The first principal component was a kind of weighted average of the original features,
while the second one highlighted shallot productivity in 2019, corresponding to the
anomaly in the data. Figure 2 shows the results of the k-means clustering. It can be
Comparison of Unsupervised Machine Learning Analysis
275
seen in these plots of shallot and tomato productivity that there was a province (North
Kalimantan) with abnormal behavior namely, a sudden increase in shallot productivity
in 2019. The abnormal behavior was more prominent if the data were transformed using
PCA, where a clustering of just 2 clusters divided the data into normal and abnormal
behaviors. This corresponds well to the second principal component profile (see Fig. 1).
The first principal component, which represented average productivity (also see Fig. 1),
helped divide the data into 3 clusters: high and low average productivity as well as
the abnormal increase in shallot productivity in 2019. Without PCA, similar clustering
was also obtained using k-means. Comparing the data points in Table 2, it appears
that one province, Yogyakarta, was clustered as low productivity in PCA-transformed
data while this province was a member of the high productivity cluster in the original
data. The silhouette score showed that this change created a better 3-group clustering
(see Table 1). Further investigation also showed that Special Region of Yogyakarta
contributed a negative silhouette score in the 3-cluster results for the original data,
suggesting that this province might be badly clustered. For transformed data, no province
had a negative silhouette score.
Unlike k-means clustering, hierarchical clustering with a single link approach identified the anomaly as a cluster in the 2-cluster scheme, even without using the PCA
transformed data (see Fig. 3). In the 3-cluster scheme, the single link approach identified
the clusters as low productivity, very high productivity, and an anomaly. The single link
approach combines the clusters by measuring the distances between the closest members of the clusters; therefore, it is indeed likely to combine all the common data points
together and leave out the outliers (in this case, the anomaly and very high productivity)
as other clusters.
Table 2. Clustering results for 2- and 3-cluster-schemes with different clustering methods
K-means
Hierarchical clustering
Single link
Province
name
Complete link
Original
data
Transformed
data
Original
data
Transformed
data
Original
data
Transformed
data
2
3
2
3
2
3
2
3
2
3
2
3
Aceh
H
H
N
H
N
V
N
V
H
H
N
V
North
Sumatra
H
H
N
H
N
C
N
C
H
H
N
V
West
Sumatra
H
H
N
H
N
V
N
V
H
H
N
V
Riau
L
L
N
L
N
C
N
C
L
L
N
L
Jambi
L
L
N
L
N
C
N
C
H
H
N
L
South
Sumatra
L
L
N
L
N
C
N
C
H
H
N
L
Bengkulu
L
L
N
L
N
C
N
C
L
L
N
L
(continued)
276
J. J. Siregar and E. Budiarto
Table 2. (continued)
K-means
Hierarchical clustering
Single link
Province
name
Complete link
Original
data
Transformed
data
Original
data
Transformed
data
Original
data
Transformed
data
2
3
2
3
2
3
2
3
2
3
2
3
Lampung
L
L
N
L
N
C
N
C
H
H
N
L
Bangka
Belitung
Islands
L
L
N
L
N
C
N
C
L
L
N
L
Riau
Islands
L
L
N
L
N
C
N
C
L
L
N
L
West Java
H
H
N
H
N
V
N
V
H
H
N
V
Central
Java
H
H
N
H
N
C
N
C
H
H
N
V
Special
H
Region of
Yogyakarta
H
N
L
N
C
N
C
H
H
N
L
East Java
H
H
N
H
N
C
N
C
H
H
N
V
Banten
L
L
N
L
N
C
N
C
L
L
N
L
Bali
H
H
N
H
N
V
N
V
H
H
N
V
West Nusa
Tenggara
H
H
N
H
N
C
N
C
H
H
N
V
East Nusa
Tenggara
L
L
N
L
N
C
N
C
L
L
N
L
West
L
Kalimantan
L
N
L
N
C
N
C
L
L
N
L
Central
L
Kalimantan
L
N
L
N
C
N
C
L
L
N
L
South
L
Kalimantan
L
N
L
N
C
N
C
L
L
N
L
East
L
Kalimantan
L
N
L
N
C
N
C
H
H
N
L
North
L
Kalimantan
A
A
A
A
A
A
A
L
A
A
A
North
Sulawesi
L
L
N
L
N
C
N
C
L
L
N
L
Central
Sulawesi
L
L
N
L
N
C
N
C
L
L
N
L
(continued)
Comparison of Unsupervised Machine Learning Analysis
277
Table 2. (continued)
K-means
Hierarchical clustering
Single link
Province
name
Complete link
Original
data
Transformed
data
Original
data
Transformed
data
Original
data
Transformed
data
2
3
2
3
2
3
2
3
2
3
2
3
South
Sulawesi
H
H
N
H
N
C
N
C
H
H
N
V
Southeast
Sulawesi
L
L
N
L
N
C
N
C
L
L
N
L
Gorontalo
L
L
N
L
N
C
N
C
L
L
N
L
West
Sulawesi
L
L
N
L
N
C
N
C
L
L
N
L
Maluku
L
L
N
L
N
C
N
C
L
L
N
L
North
Maluku
L
L
N
L
N
C
N
C
L
L
N
L
West Papua L
L
N
L
N
C
N
C
L
L
N
L
Papua
L
N
L
N
C
N
C
L
L
N
L
L
(L = low productivity, H = high productivity, V = very high productivity, A = abnormal, N =
normal, C = common, not very high).
Figure 2 shows the yearly plots of productivity in the hierarchical clustering using the
complete link approach. Using the original data, the complete link approach delivered
a two-group clustering that did not register any anomalies, only high productivity and
low productivity. The anomaly was only used as a cluster in the 3-cluster scheme for this
approach using original data. The complete link approach combines the clusters by evaluating the distances between the most distant members of the clusters, so this approach
tends to absorb outliers (in this case, the anomaly) into the bigger clusters. Interestingly,
the high productivity clustering in complete link results included some provinces that
were clustered as low productivity regions using other methods namely, Lampung, South
Sumatra, Jambi, and East Kalimantan (see Table 2). These provinces were indeed in the
overlapping regions in productivity plots in Fig. 2 and actually contributed negative silhouette scores in the 3-cluster scheme of hierarchical clustering results using the original
data and complete link approach. A comparison of Table 1 and Table 3 also shows that
these changes make the hierarchical clustering with a complete link worse than k-means
and single link results for the same configuration (3 clusters, original data).
When PCA-transformed data were used in hierarchical clustering with a complete
link, the anomaly was registered as a cluster starting in the 2-cluster scheme. This is, of
course, related to the second principal component that indeed highlighted the anomaly
(see Fig. 2). A comparison of Fig. 3 and Fig. 4 shows a similar grouping for the 2and 3-cluster schemes on PCA-transformed data for hierarchical clustering using the
single and complete link. Actually, the members of the very high productivity cluster in
278
J. J. Siregar and E. Budiarto
(a) Clustering using k-means with 2
clusters for original data
(c) Clustering using k-means with 3
clusters for transformed data
(b) Clustering using k-means with 2
clusters for transformed data
(d) Clustering using k-means with 3
clusters for original data
Fig. 2. Plots of productivity (y-axis) versus shallot and tomato productivity (x-axis) in 5 years
(2015–2019) for normalized original data and normalized PCA-transformed data using k-means.
The lines are the productivity means for each cluster.
the complete link were a bit different from the ones for the single link, but the average
silhouette scores in Table 3 indicate that the changes in the complete link results actually
created better clustering in this case.
In general, the silhouette score indicate that clustering is good. Nevertheless, a manual inspection of the clustering results might be beneficial. For example, the 2-scheme
clustering for k-means using transformed data had the best silhouette score, but this
clustering did not capture the anomaly, which might be interesting.
Comparison of Unsupervised Machine Learning Analysis
(a) Results of hierarchical clustering
(single link) with 2 clusters for original
(b) Results of hierarchical clustering (single
link) with 2 clusters for transformed data
(c) Results of hierarchical clustering
(single link) with 3 clusters for original
(d) Results of hierarchical clustering
(single link) with 3 clusters for transformed data
279
Fig. 3. Plots of productivity (y-axis) versus shallot and tomato productivity (x-axis) in 5 years
(2015–2019) for normalized original data and normalized PCA-transformed data using hierarchical clustering with a single link approach. The lines are the means for each cluster.
Table 3. Average silhouette scores for hierarchical clustering results.
Experiment
2-cluster scheme
3-cluster scheme
Hierarchical, single link,
original data
0.529
0.565
Hierarchical, single link,
transformed data
0.576
0.626
Hierarchical, complete link,
original data
0.372
0.398
Hierarchical, complete link,
transformed data
0.576
0.633
280
J. J. Siregar and E. Budiarto
(a) Results of hierarchical clustering
(complete link) with 2 clusters for original data
(b) Results of hierarchical clustering (complete
link) with 2 clusters for transformed data
(c) Results of hierarchical clustering
(d) Results of hierarchical clustering (complete
(complete link) with 3 clusters for original data
link) with 3 clusters for transformed data
Fig. 4. Plots of productivity (y-axis) versus shallot and tomato productivity (x-axis) in 5 years
(2015–2019) for normalized original data and normalized PCA-transformed data using the hierarchical clustering method with the complete link approach. The lines are the means for each
cluster.
4 Conclusion
In this study, the unsupervised machine learning method using k-means and hierarchical
clustering have been shown to be able to capture characteristics of the horticulture
productivity data, even for a combination of products. In particular, the anomaly can
be identified, as can the low and high productivity regions. Principal components can
be used to further highlight interesting characteristics. Therefore, this study offers a
promising way to make groupings for horticulture productivity planning.
References
1. Zhai, Z., Martínez, J.F., Beltran, V., Martínez, N.L.:Decision support systems for agriculture
4.0: Survey and challenges. Comput. Electron. Agric. 170, 105256 (2020). https://doi.org/10.
1016/J.COMPAG.2020.105256
2. Reza, M.N., Na, I.S., Baek, S.W., Lee, K.H.: Rice yield estimation based on K-means clustering with graph-cut segmentation using low-altitude UAV images. Biosyst. Eng. 177, 109–121
(2019). https://doi.org/10.1016/j.biosystemseng.2018.09.014
Comparison of Unsupervised Machine Learning Analysis
281
3. Sudirman, Windarto, A.P., Wanto, A.: Data mining tools|rapidminer: K-means method on
clustering of rice crops by province as efforts to stabilize food crops in Indonesia. IOP Conf.
Ser. Mater. Sci. Eng. 420 (2018). https://doi.org/10.1088/1757-899X/420/1/012089
4. Aldino, A.A., Darwis, D., Prastowo, A.T., Sujana, C.: Implementation of K-Means algorithm
for clustering corn planting feasibility area in south Lampung regency. J. Phys. Conf. Ser.
1751 (2021). https://doi.org/10.1088/1742-6596/1751/1/012038
5. Marino, S., Alvino, A.: Vegetation indices data clustering for dynamic monitoring and classification of wheat yield crop traits. Remote Sens. 13, 1–21 (2021). https://doi.org/10.3390/
rs13040541
6. Rossit, D.A., Olivera, A., Viana, C.V., Broz, D.: A Big Data approach to forestry harvesting
productivity. Comput. Electron. Agric. 161, 29–52 (2019). https://doi.org/10.1016/j.compag.
2019.02.029
7. Ministry of Agriculture Republic of Indonesia 5-year agricultural data. https://www.pertan
ian.go.id/home/?show=page&act=view&id=61. Accessed 5 Oct 2021
8. Shahapure, K.R., Nicholas, C.: Cluster quality analysis using silhouette score. In: Proceedings
of the 2020 IEEE 7th International Conference Data Science Advanced Analytics DSAA 2020,
pp. 747–748 (2020). https://doi.org/10.1109/DSAA49011.2020.00096
9. Sinaga, K.P., Yang, M.S.: Unsupervised K-means clustering algorithm. IEEE Access 8,
80716–80727 (2020). https://doi.org/10.1109/ACCESS.2020.2988796
10. Ke, R., Kim, S., Li, Z., Wang, Y.: Motion-vector clustering for traffic speed detection from
UAV video. In: IEEE 1st International Smart Cities Conference ISC2 (2015). https://doi.org/
10.1109/ISC2.2015.7366230
11. Govender, P., Sivakumar, V.: Application of k-means and hierarchical clustering techniques
for analysis of air pollution: a review (1980–2019). Atmos. Pollut. Res. 11, 40–56 (2020).
https://doi.org/10.1016/J.APR.2019.09.009
12. Murtagh, F., Contreras, P.: Algorithms for hierarchical clustering: an overview. Wiley
Interdiscip. Rev. Data Min. Knowl. Discov. 2, 86–97 (2012). https://doi.org/10.1002/WID
M.53
13. Abdi, H., Williams, L.J.: Principal component analysis. Wiley Interdiscip. Rev. Comput. Stat.
2, 433–459 (2010). https://doi.org/10.1002/WICS.101
14. Salem, N., Hussein, S.: Data dimensional reduction and principal components analysis.
Procedia Comput. Sci. 163, 292–299 (2019). https://doi.org/10.1016/j.procs.2019.12.111
15. Orange Data Mining - Data Mining. https://orangedatamining.com/. Accessed 8 Sep 2021
16. Ginne, M., James, T., Punitha, S.C.: Disease segmentation using K-means clustering. Int. J.
Comput. Appl. (2016). https://doi.org/10.5120/ijca2016910270
17. Jafar, A., Jaafar, R., Jamil, N., Low, C.Y., Abdullah, B.: Photogrammetric grading of oil palm
fresh fruit bunches. Int. J. Mech. Mechatron. Eng. (IJMME) 9(10), 18–24 (2009)
18. Veenadhari, S., Misra, B., Singh, C.D.: Data mining techniques for predicting crop
productivity – a review article. Int. J. Comput. Sci. Technol. IJCST 2(1), 90–100 (2011)
19. Ginne, M.J.: Tomato disease segmentation using K-means clustering. Int. J. Comput. Appl.
(2016). https://doi.org/10.5120/ijca201691027
20. Dabbura, I.: K-means clustering: algorithm, applications, evaluation methods, and drawbacks (2019). https://towardsdatascience.com/k-means-clustering-algorithm-applicationsevaluation-methods-and-drawbacks-aa03e644b48av2021. Accessed 10 Oct (2021)
21. Klompenburga, T., Van Kassahuna, A., Catalb, C.: Crop yield prediction using machine
learning: a systematic literature review. Int. J. Comput. Electron. Agric. 177 (2020). https://
doi.org/10.1016/j.compag.2020.105709
282
J. J. Siregar and E. Budiarto
22. Jolliffe, I.T., Cadima, J., Ian, T.: Jorge Cadima Secção de Matemática.: college of engineering
principal component analysis: a review and recent developments (2015). https://royalsociety
publishing.org/doi/10.1098/rsta.2015.0202
23. Kalaivani, R., Murugan, S., Periasamy, A.: Identifiying the quality of tomatoes in iamage
processing using Matlab. Int. J. Adv. Res. Electr. Electron. Instrum. Eng. (An ISO 3297:
2007 Certified Organization) 2(8) (2013). http://www.ijareeie.com/upload/2013/august/4_
IDENTIFYING.pdf
24. Khaur, N., Arma, Shahiwal, K., Punjab, B.: Efficient K-means clustering algorithm using
ranking method. Int. J. Comput. Eng. Technol. 1(3), 85–91 (2012)
Arabic Auto-CON: Automated Arabic
Concordancer Construction from Arabic
Corpus
Abdullah H. Almuntashiri1(B) , Mohammed Al-Sarem2,3 , Omar F. Aloufi2 ,
Abdel-Hamid Emara2,4 , and Mhd Ammar Alsalka5
1 Applied College, Najran University, Najran, Saudi Arabia
ahalmontashiri@nu.edu.sa
2 College of Computer Science and Engineering, Taibah University,
Medina 42353, Saudi Arabia
{msarem,abdemara}@taibahu.edu.sa
3 Department of Computer Science, Saba’a Region University, Mareb, Yemen
4 Department of Computers and Systems Engineering, Faculty of Engineering,
Al-Azhar University, Cairo 11884, Egypt
5 School of Computing, University of Leeds, Leeds 9.11f, Leeds, UK
Abstract. The use of tools and apps to understand more about a language has
become popular in recent years. This technology assists the learner in gaining
more knowledge about a specific language’s vocabulary, collocations, grammar,
etc. An example is a concordancer, which is a kind of program that can offer valuable knowledge in multiple contexts regarding the frequency of terms or word.
The production of such a tool for Arabic has been limited for several years due to
the complexities of the language. The purpose of this paper is therefore to create
an automatic Arabic concordancer (auto-CON) with a simple GUI. The proposed
method extracts information from a corpus and then provide the needed information depending on a user query. The main aim of the proposed concordance is to
provide users with more information on the search word, including the concordance of the word entered, the origin of the word, the domain of each concordance,
and the terms extracted from the same root word. The auto-CON tool relies on
the creation of two dictionaries: the first dictionary contains all the occurrences
and concordances of the word in the corpus, while the second dictionary provides
the roots of the words and the words derived from those roots. Therefore, the
auto-CON tool is designed to be an educational tool that could support learners
of Arabic and Arabic societies. In addition, it can serve as a convenient method
for people of different ages to gain more comprehensive knowledge about Arabic words and their concordances. The contribution of this tool is to develop the
domain of Arabic NLP. This proposed approach was examined by user testing,
in which two Arabic speakers and Arabic learners (international students) were
asked to test the approach and provide feedback. The result of the user testing
presented the effectiveness of the proposed method.
Keywords: Dictionary · Arabic concordancer · Word occurrence · ISRI
stemmer · Tokenization
© The Author(s), under exclusive license to Springer Nature Switzerland AG 2022
F. Saeed et al. (Eds.): IRICT 2021, LNDECT 127, pp. 283–294, 2022.
https://doi.org/10.1007/978-3-030-98741-1_24
284
A. H. Almuntashiri et al.
1 Introduction
In all life fields, particularly for learning purposes, the use of a dictionary has been
increased. A dictionary is an ensemble of terms/words that contain various details, for
example meanings, phonetics and pronunciations in a specific language or topic ([1–4].
Dictionaries often list alphabetically sentences and words of a particular language, then
translated them to another language [5]. However, the use of paper-based dictionaries
has declined with technological advances, replaced by automated dictionary and other
learning tools which play a role in the science and could be produced by some computer
scientists. In order to help people getting a comprehensive insight of the requested
word, some basic detail should be included in a dictionary. One such information is
concordance which refers to a list of phrases or references that reflect on the appearance
of a single term in multiple contexts [6]. With the advancement of the Natural Language
Processing (NLP) domain, developing NLP-based learning tools have increased [7].
These tools can allow learners to develop a comprehensive understanding and knowledge
related to the language studied. One of these tools is the concordancer, which is used
to scan and retrieve the concordance of a particular word from the corpora [8]. As
such learning tools are unavailable in some areas of the Arabic language, as part of a
digital dictionary initiative, an automated concordance based on an Arabic corpus was
constructed. This paper is aimed at presenting an automatic concordance based on the
Arabic corpus (Arabic Auto-CON) which primarily extracts the Arabic words and their
concordances. In addition, the proposed tool executes many other tasks, such as the
determination of a word root (stem), the provision of derivative words from the same
root, and the identifying of the domain of the extracted concordances from the corpora.
The advantage of the proposed method is to support and deal with the complexity of the
Arabic language, such as presenting the concordances from right to left and providing
the roots of extracted words.
The proposed Arabic Auto-Con tool can help Arabic speakers as well as Arabic learners by preventing manual searches and therefore accelerating gaining more knowledge
about the words being sought. This tool may also allow developers to better understand
the occurrences of Arabic words in sentences (concordance) which leads to enrich Arabic dictionaries. The tool is publicly available on https://github.com/AbdullahHamed1/
Almuntashiri_Concordancer.git.
The rest of the paper is structured as follows: The related works on existing concordnacers is given in Sect. 2. In Sect. 3, we introduce the proposed tool and how it
is implemented, the used corpus, process of finding concordance, the GUI and the tool
evaluation. Finally, conclusions, perspectives, and thoughts on future work are discussed
in Sect. 4.
2 Related Work
Concordance is a series of phrases/sentences relating to words occurring in a context.
Each concordance can be in its own textual environment [9]. Surveying literature, there
is a lack of developing concordance tools (hereafter, “concordance” will be used) in
the low-resources languages, including Arabic language. The main objective of using
Arabic Auto-CON
285
concordances is locating a word in the context and its presence in texts for the purpose of
searching in corpora [8]. There can be several obstacles to building such tool in Arabic.
One of the reasons for the lack of Arabic concordance tools is the ambiguity of the
Arabic language, its complexity [10–12]. Thus, designing an Arabic concordance could
be challenging task for developers. One of the most common problems faced when
constructing an Arabic concordancer is the peculiarity of the Arabic script [10, 11, 13].
In addition, most of letters in an Arabic word are interlinked, which means they usually
cannot be written separately.
There are several tools that were constructed for those who work with corpus linguistically like WordSmith [14], AntConc [15], arTenTen [16], aConCorde [17]. However,
after examining these tools, we noted that they do not fully support Arabic script and
cannot deal with diacritics as in [14]. In addition, the GUI of such tools is not appropriate
for Arabic speakers. We also noted that the arTenTen tool has an issue with dealing with
question mark when the text is written in Arabic.
To overcome the issues above, another tool called Ghawwas (‘diver’ in English) was
proposed [18]. Ghawwas is an open-source tool for Arabic language processing with
an Arabic/English interface. Currently, Ghawwas is compatible with many operating
systems and can deal generally with texts from Arabic, English, and French. Additionally,
it has many functionalities such as providing user with lists of frequency, comparing
corpora, and performing pre-processing tasks, such as removing numbers and Latin
characters and removing diacritics for normalizing texts. Although that, Ghawwas has
no support for UTF-16 encoding.
aConCorde is a concordance platform that promotes a multi-lingual corpus, with a
focus on the Arabic language. It supports an extensive variety of character encodings,
including UTF-16 and ASCII [19], offers user a good set of query options, keyword,
proximity, and expression. However, despite these advantages, the term/word in the
sentence is shown without offering the domain of a full context or displaying Arabic
roots/stems even though they have no concordances. Another limitation is that it is not
capable of printing Arabic diacritics, which leads to losing meanings of Arabic words
in case of unknown contexts.
3 Material and Method
In this section, we propose a novel Arabic concordance tool called Arabic Auto-CON
tool to address limitations that were observed during analyzing the existing concordancers presented in the previous section. The main flow that we use during designing
the proposed Arabic Auto-CON tool is shown in Fig. 1.
3.1 Arabic Auto-CON
The concordance tool that we aim to develop could assist Arabic learners and Arabic
speakers to recognise concordances of words in different contexts. The implementation
of this system was initially carried out as a console output, after which an interface of
the desktop application for Mac OS was built. As stated earlier, the aim of this tool is
to extract words and their concordances as well as other information from a corpus.
286
A. H. Almuntashiri et al.
Fig. 1. An overview of the proposed tool
The building process as shown in Fig. 1 was divided into many sub-systems that are
implemented and carried out separately, with each sub-system having a well-defined
task. The block diagram in Fig. 2 illustrates the sub-systems; the tool will start when
the user enters a word and ends with presenting the result – the concordances and other
related information.
Fig. 2. The sequence diagram of the concordancer system
Arabic Auto-CON
287
The proposed tool provides some text pre-processing tasks such as removal of words
and expressions that are not related to the Arabic language. This sub-system is one of the
most important in obtaining the correct Arabic texts without issues. Then, the extracted
text is stored in temporary document storage and passed later after tokenization into to
next stage. Finally, at construction stage, two types of dictionaries are built: (i) word
dictionary that comprises the tokenized words, and (ii) root dictionary that contains the
root of Arabic word.
3.2 Implementation Process
This section discusses and explain in detail the implementation stage of the proposed
tool. This first part of this section discusses the tools that were used in building this
software, including the programming language, libraries, and the Arabic corpus. The
second part discusses the way of implementing the Arabic Auto-CON tool.
The Used Tools. Some tools were appended to facilitate the construction of the software, which will be discussed and explained in this section. The first tool was to find
an Arabic corpus. Although many types of corpora were found, our aim was to find a
monolingual corpus, i.e., a corpus containing texts in one language only. Some monolingual Arabic corpora were found on the internet, and several of these were identified
and compared to choose a suitable corpus. In this work and after an extensive analysis,
we decided to use Corpus of Contemporary Arabic (CCA) [20].
Stemmers. Obtaining the roots of words is a part of the main objectives of the proposed
tool. Searching for existing stemmers was accomplished and several stemmers that support the Arabic language were found. The stemmers were tested and compared to each
other.
Therefore, the ISRI Arabic Stemmer was chosen1 . It is one of the NLTK2 packages
and it could be called as any library of that package. The ISRIStemmer()function was
called to provide the needed roots.
3.3 Implementation of Auto-CON
To write and build the software, various programming languages were researched and
compared, and Python was selected to write the automated concordancer. There were
many reasons for choosing Python, the most important of which was its comprehensive
standard library, which only needed to be imported. In addition, using Python allowed
the programmer to dispense with auxiliary programmes. Moreover, Python is one of
the most common programming languages due to its popularity and its usability [21].
Table 1 presents the needed libraries and their functions.
1 https://www.nltk.org/_modules/nltk/stem/isri.html.
2 https://www.nltk.org/install.html.
288
A. H. Almuntashiri et al.
Table 1. The used Libraries.
The needed libraries
The names of libraries
The functions of the libraries
The libraries for reading
files
Os and os.path libraries
They used in this software to
read the files of the corpus
The libraries for text
pre-processing
Regular expression operations
library (re)
It used for text processing
services
The libraries for saving
words and results
The JSON library
It used in the software to save a
range of data
The libraries for
tokenization processes
The Natural Language Toolkit
(NLTK)
It used in the software to split
the sentences of texts into
words and to split blocks of
texts into sentences
The libraries for text
coloration
The Termcolor library
It used to present the required
results in different colours
The libraries for creating
Graphical User Interface
(GUI)
PyQt5 library
It used in the software to create
a GUI
As stated earlier in Sect. 3.1, there are five main phases that Auto-CON has to perform
to find the right root and concordances. Below, we present in detail how these phases
were implemented:
• The reading files phase is considered as the first step, and it is aimed at accessing and reading the content of the CCA. It was assisted by calling os and
os.path libraries, which helped to specify the paths of the corpus files. In addition,
xml.etree.ElementTree library was used to parse the corpus files.
• The text pre-processing phase is considered the second sub-system of the software.
After the capability to access the corpus files to read and extract the inside texts was
verified, the texts should be prepared to extract and store the document. The meaning
of preparing here is the practice of cleaning texts from some issues that could cause
obstacles to the analytic processes. Several techniques of text pre-processing were
done through many steps. These steps were helped by some methods of (re) library
and NLTK library.
• The aim of the third sub-system is to build a list of documents to store the extracted
texts, which were prepared via text pre-processing, from the corpus. This step was
taken for several reasons: (i) after storing the texts in this list as sentences, they would
not need to be extracted again from the corpus, (ii) the text pre-processing phase would
not be applied again, and (iii) because the texts were already saved in this list, the time
spent by users making queries after the first query would be decreased, as they could
return to the list to continue with the next phases to obtain the final result. The list type
is a set of arbitrary objects, similar to an array, and one of its main features is having
more flexibility. It could be defined in the Python language by enclosing a sequence
of objects, separated by commas, in square brackets ([]). The list type includes an
Arabic Auto-CON
289
index and value, with each value in the list corresponding to an index number that
starts with index 0. In the previous phase, each text in each file was tokenized/split
into sentences. Therefore, when building this list, each file of the corpus was stored
as a document in the list. Each document has an index number that started with 0 and
the value that was a collection of extracted sentences and other useful information
such as the file name and the domain.
• The word tokenization phase is the fourth sub-system of the entire system. Its purpose
was to tokenize the stored sentences in the list into words to be used for the following
stages. It is considered as one of the most important phases in this system because
its results were used for several other tasks. Moreover, it was helpful to use some
methods of the NLTK library to implement this phase:
o The WordPunctTokenizer() function, which tokenizes any text into a series of
alphabetic and non-alphabetic letters, was called. The word_tokenize() method
was utilised, added to it the sentence that token from the list to be tokenized into
words (tokens).
o A condition was added, the isalpha() method, to ensure that the tokenized word
was from the alphabet (string) because there are some other symbols, such as a dot
and a comma. These symbols were not removed in the text pre-processing phase
due to their importance in determining the meaning of the text.
• The fifth sub-system is to structure the flowed data from the previous phase in a data
structure way. The meaning of the data structure is to hold some data together or to
store a set of related data. The chosen type of data structure in this stage is a dictionary,
which consists of key-value pairs (see Fig. 3). However, the aim of this phase is to
build two dictionaries: (i) the first dictionary stored each extracted word as a key,
Fig. 3. The structure of the words dictionary
290
A. H. Almuntashiri et al.
and the value corresponded to a list of the sentences in which the word occurred (the
concordances) and (ii) the second dictionary is executed in the second iteration that
aimed to store the root/stem of the extracted word as a key and the derived words
of this root as a value, in which the derived words were the extracted word from the
previous phase.
3.4 Finding Concordance
The dictionary included words extracted from sentences as a key and their contexts in
the sentences as a value, which was stored in the created list in the building a list of
documents phase. Once the sentences were tokenized into words, the root of each word
and all the derived forms taken from it can be obtained. For this purpose, the ISRI Arabic
stemmer is used. The purpose of stemming is to return the extracted word to its root
by removing prefixes and suffixes in the word and obtaining the ‘bare form’. At the
last stage, the finding results are presented to the user. This phase is divided into two
functions:
o to receive the word from users and then search for it in the words dictionary to provide
the concordances and the domain of each concordance (e.g. in an educational context,
a sport context, etc.)
o to provide users with the root of the received word and the derived words, which are
from the same root of the entered word. These two functions will be discussed and
described in detail.
In providing the concordances and the domain function, several steps were applied to
achieve the required result. Firstly, the user was enabled to enter the word for which he or
she wanted concordances and other information. Then, the required words are searched
for in the words dictionary. Next, due to concordances being presented to users in a
different form, a list of set types is identified to save the information obtained from the
words dictionary after processing it. After that, the received word form would be checked
if it is from the words extracted from the corpus or not, and the (if…. else) function was
used to do this work. If the received word was not found in the words dictionary, the
users would see a message, ‘There are no concordances for this word’, and they could
then enter another word if they wanted. If the received word was found in the dictionary,
then the list of sentences and its domains (the value) would be extracted to this function.
Some changes would take place in the sentences before presenting them – each sentence
would be tokenized into words in order to distinguish the word entered by the user
from other words in the sentence. The colored () method, which is a subsidiary of the
Termcolor library, was used, and cyan was selected to mark the entered word, whereas
other words were white-coloured or black-coloured when presenting the concordances
on the console (see Fig. 4).
The function of providing the root and the derived words are to provide the root of
the entered word and the derived words taken from the same root. This function was
implemented in several steps. Moreover, it was done through calling the roots dictionary.
Firstly, after completing the previous function, this function was called and given the
Arabic Auto-CON
291
Fig. 4. The result of providing the concordances and the domain in console
entered word by the user. Secondly, the root of the words was extracted by calling the
ISRIStemmer() package and using the stem() method. After that, this root would be
printed to users. Then, this root was taken to check if it is from the stored roots in the
roots dictionary. This step was completed by using the (if…. else) function to determine
whether the root was found in the roots dictionary; if not, then the user would get a
message stating that this root was not provided. Otherwise, the user would receive a list
of the derived words that were already stored as a value of the root (the key).
3.5 The GUI of Auto-CON Tool
After completing the main tasks, it is suggested to create a GUI. One of the features of
a GUI is its ability to adapt to Arabic and English. It was created in a simple way to be
convenient for people of different ages. Moreover, the presented results can be stored in
the JSON format. Currently, the GUI supported only Mac OS. Figure 5 illustrates the
result of this function. The result includes the concordances of the word, the domain of
each concordance, the root of the word, and the derived words from the same root. The
figure presents the GUI in both languages.
3.6 The Evaluation of the Tool
The suggested tool was evaluated and tested on two distinct user groups: native Arabic
speakers and Arabic learners (foreign students). The number of people who conducted
testing during each iteration was restricted to a single individual from each group. In
addition, nine individuals assessed the final version of the software. The evaluation
process goes through three iterations as follows:
o During the first iteration, many tasks were completed. One of these responsibilities
was to provide users with concordances for the words they inputted. Following that,
many helpful observations were received, which were included in the second iteration
and summarized as follows:
292
A. H. Almuntashiri et al.
Fig. 5. The result of running the GUI
• Overall, satisfaction was very good, and the outcomes were acceptable.
• The foreign student suggested that the entered word be highlighted in a different
color.
• One of the findings was that the concordances were too lengthy, so it was suggested
that they be shortened.
• A helpful idea for Arabic learners was to provide the root of the entered word.
o In the second iteration, the concordance result was decreased to a maximum of 15
words based on user feedback. Additionally, the root of the word was included,
which helps users know the origin of a word. Furthermore, various colors were used to
enhance the results and attract people to the tool. In addition, a new characteristic was
added that helps users to discover other words derived from the same root (derived
words). The following is a collection of observations made by users during this
iteration of the software:
• The users were satisfied with the provided results in general.
• The users found that the changes regarding the output were good.
• As the Arabic learner stated, adding the derived terms was a beneficial task.
o In the third iteration, the users’ recommendations from the previous iteration were
considered in the development of this tool. To simplify usage, a simple interface
was developed. Due to our emphasis on Arabic, the GUI supports both Arabic and
English. Each concordance now includes a general context (the domain). Users were
asked to re-evaluate the system after completing the tasks in this iteration. Several
helpful observations are provided in the findings, including the following:
• Satisfaction with the software was high in this iteration.
Arabic Auto-CON
293
• As the Arabic learner stated, the GUI’s design is simple, and the results are
straightforward.
According to the Arabic speaker, adding the domain of concordances was a significant
and unprecedented step in the tool, and it may aid in obtaining good knowledge of the
words’ occurrences in various domains.
4 Conclusion and Future Work
Although the technological development, the Arabic language has a lack of software
that help its speakers and learners to effectively acquire more skills and information
about the language. Therefore, in this work, we suggested an Arabic concordance tool
Auto-CON that would assist Arabic communities and, particularly, non-native learners
of Arabic language. In addition, the proposed tool endeavored to provide for users some
relevant information, such as the stem, which is the word’s root, the derivatives of the
word that is derived from the same root, and the domain of the concordances. It was
basically depending on an Arabic corpus that included of a set of Arabic texts. The tool
automatically extracted all words and their concordances from an Arabic corpus.
The main target was to construct a concordance tool, which was completely achieved.
The aim of designing the concordancer was to extract texts from an Arabic corpus and
present the concordances for the word that the user entered. Moreover, the tool provides
the root of the word (stem), the words that are derived from the same root and the
concordances’ do-mains. The Auto-CON tool provides a simple GUI that can support
both Arabic and English languages. However, building this tool faced many obstacles
during its phases. The main obstacle was demonstrated by the lack of Arabic resources,
such as the public corpora of the Arabic language and the public stemmers of the Arabic
language.
Despite the main aim and the other objectives of this tool were achieved, there
were limitations on the results that need to be mentioned. The first limitation was the
small number of participants who assessed the tool, i.e., nine users. Moreover, due to
the inaccuracy of the stemmer, many incorrect roots were provided. In the future, we
intend to improve the performance of the proposed tool by examining the impact of
other stemmer techniques and prefix removal. We also aim at support corpora that have
other types of formats such as TXT, HTML, JSON etc. Extend the ability of the tool to
provide further information about the entered word, such as the definition of the word
and focus on adding other useful lexical information that could help Arabic learners in
gaining more knowledge would be worthwhile.
References
1. Abdullayevna, M.D.: Teaching vocabulary as the most important component of speech activity
in a foreign language lesson. Int. J. Discourse Innov. Integr. Educ. 1(4), 199–203 (2020)
2. Kohita, R., Yoshida, I., Kanayama, H., Nasukawa, T.: Interactive construction of user-centric
dictionary for text analytics. In: Proceedings of the 58th Annual Meeting of the Association
for Computational Linguistics, pp. 789–799, July 2020
294
A. H. Almuntashiri et al.
3. Pratama, R.A., Suryani, A.A., Maharani, W.: Part of speech tagging for javanese language
with hidden Markov model. J. Comput. Sci. Inform. Eng. (J-Cosine) 4(1), 84–91 (2020)
4. Bergenholtz, H.: What is a Dictionary? Lexikos 22(1), 20–30 (2012). https://doi.org/10.5788/
22-1-995
5. Erali, R.: Semiological analysis of monolingual dictionaries. JournalNX 6(10), 435–438
(2020)
6. Collins English Dictionary: Concordance definition and meaning. Collins Dictionary (2020).
Accessed 15 March 2020 https://www.collinsdictionary.com/dictionary/english/dictionary
7. Wambsganss, T., Weber, F., Söllner, M.: Design and evaluation of an adaptive empathy learning tool. In: Proceedings of the 54th Hawaii International Conference on System Sciences,
p. 54, January 2021
8. Kwary, D.: A corpus and a concordancer of academic journal articles. Data Brief 16, 94–100
(2018)
9. Sinclair, J.: Corpus, Concordance, Collocation. Oxford University Press, Oxford (1991)
10. Al-Sarem, M., Saeed, F., Alsaeedi, A., Boulila, W., Al-Hadhrami, T.: Ensemble methods for
instance-based Arabic language authorship attribution. IEEE 8, 17331–17345 (2020)
11. Bahassine, S., Madani, A., Al-Sarem, M., Kissi, M.: Feature selection using an improved Chisquare for Arabic text classification. J. King Saud Univ.-Comput. Inf. Sci. 32(2), 225–231
(2020)
12. Guellil, I., Saâdane, H., Azouaou, F., Gueni, B., Nouvel, D.: Arabic natural language
processing: an overview. J. King Saud Univ. Comput. Inf. Sci. 33, 497–507 (2019)
13. Al-Sarem, M., Cherif, W., Wahab, A.A., Emara, A.H., Kissi, M.: Combination of stylobased features and frequency-based features for identifying the author of short Arabic text.
In: Proceedings of the 12th International Conference on Intelligent Systems: Theories and
Applications, pp. 1–6, October 2018
14. Yuliawati, S., Suhardijanto, T., Hidayat, R.S.: A corpus-based analysis of the terminology
of the social sciences and humanities. In: IOP Conference Series: Earth and Environmental
Science, vol. 175(1) (2018)
15. Anthony, L.: AntConc: design and development of a freeware corpus analysis toolkit for
the technical writing classroom. In: International Professional Commu-nition Conference,
pp. 729–737. IEEE, Limerick, Ireland (2005)
16. Arts, T., Belinkov, Y., Habash, N., Kilgarriff, A., Suchomel, V.: arTenTen: arabic corpus and
word sketches. J. King Saud Univ. Comput. Inf. Sci. 26(4), 357–371 (2014)
17. Roberts, A., Al-Sulaiti, L., Atwell, E.: aConCorde: towards an open-source, extendable
concordancer for Arabic. Corpora 1(1), 39–60 (2006)
18. Al-Thubaity, A., Khan, M., Al-Mazrua, M., Al-Mousa, M.: New language resources for
Arabic: corpus containing more than two million words and a corpus processing tool. In:
2013 International Conference on Asian Language Processing (2013)
19. Almujaiwel, S.: A comparative evaluation of POS tagging and N-gram measures in Arabic
corpus resources and tools. Int. J. Comput. Linguist. (IJCL) 11(1), 1–17 (2020)
20. Al-Sulaiti, L., Atwell, E.: The design of a corpus of Contemporary Arabic. Int. J. Corpus
Linguist. 11(2), 135–171 (2006)
21. Srinath, K.R.: Python–the fastest growing programming language. Int. Res. J. Eng. Technol.
4(12), 354–357 (2017)
Sentiment Analysis of Restaurants Customer
Reviews on Twitter
Nouf Alharbi(B) , Ohoud Moqbel Al-Mohammadi, Raghad Abdullah Al-Rehaili,
Shatha Abdulhadi Al-Rehaili, and Heba Abdullah Al-Harbi
College of Computer Science and Engineering, Taibah University, Medina 42353, Saudi Arabia
{nmoharbi,Ra.habib}@taibahu.edu.sa
Abstract. With the spread of using the Internet around the world and a huge
number of social media users, social media platforms have become a popular place
to share customers’ opinions and experiences on a variety of services and products,
such as restaurants and different consumables etc. These data can be utilized to
assist in decision-making. However, collecting and managing customers’ opinions
on different social media platforms is a complicated and challenging task. The
customers express their opinions in their colloquial language that contains spelling
errors and repetition of letters, so the preprocessing stage solves these problems
and enhances the quality of data to become ready to conduct sentiment polarity
and calculate reputation scores. In this paper, the Saudi customers’ tweets are
collected for four restaurants in Madinah. The Polarity Lexicon for the Saudi
dialect (PLSD) and Emoji Lexicon for Sentiment Analysis (ELSA) are developed
as a core component in our system to classify the extracted tweets into positive,
negative, and neutral. Next, the Net Brand Reputation (NBR) is used to derive the
reputation score from the lexicon feedback. Experimental evaluation demonstrates
that the results from the proposed approach were compatible with the results
extracted from Foursquare, an application that measures restaurants’ reputations
based on customer ratings and comments.
Keywords: Polarity · Sentiment analysis · Reputation score · Lexicon · PLSD ·
ELSA
1 Introduction
Sentiment analysis is a field of study that analyzes and classifies opinions, sentiments
from the written language to positive or negative sentiments. It is one of the foremost
research areas in text mining [1]. Customer satisfaction is the level to which a customer
understands that an individual or business has successfully delivered a service that meets
her/his needs [2].
Today, many people communicate and exchange their opinions on varieties of topics,
products, or services on the social media platforms such as Twitter. In the statistics for
the year 2020, the number of Twitter users in Saudi Arabia reached 20.03 million users
[3]. Customer reviews become a very important and more reliable reference for people
© The Author(s), under exclusive license to Springer Nature Switzerland AG 2022
F. Saeed et al. (Eds.): IRICT 2021, LNDECT 127, pp. 295–308, 2022.
https://doi.org/10.1007/978-3-030-98741-1_25
296
N. Alharbi et al.
and also for service providers as they can be utilized and used to increase the popularity
of these service providers.
Among these fields that benefit from customer reviews is the world of restaurants.
A restaurant is a workplace where people choose foods that are prepared for them
against a certain amount of payment [4]. Recently, the restaurant industry has expanded
significantly, and restaurants develop and produce the best quality of services in a way
that competes with the global market in line with the 2030 vision of Saudi Arabia. There
is a huge amount of data published about restaurants on the Twitter platform, including
opinions, suggestions, or even photos that customers share on their personal accounts or
also in public hashtags.
By using sentiment analysis, this big data can be utilized and can be turned into
useful information which can be used to benefit both customers and business owners.
The business owner’s benefits can be in the form of improving the quality of the served
food by identifying the level of services that are provided to the customers. Additionally,
this information can help customers to find the appropriate restaurants based on their
needs.
In this paper, the customer’s reviews in the Arabic language about restaurants will
be collected from the Twitter platform, and the sentiment analysis techniques will be
applied to them. These collected reviews will serve as a guide according to the taste of
customers for those who want to start such projects, which will be created according
to the opinions and suggestions of customers provided through the Twitter platform.
However, there is a lack of a proper Saudi dialect lexicon in the restaurant field. To
tackle these issues, the proposed work has the following contributions:
• Create a Polarity Lexicon for the Saudi dialect (PLSD) and the emojis lexicon (ELSA)
with positive and negative words to help categorize tweets in the restaurant field.
• The SauDiSenti lexicon [5] is combined with the PLSD lexicon in order to enrich the
lexicon’s vocabularies.
• Calculate sentiment analysis of customer reviews for each restaurant for the past five
years.
• Calculate the reputation score of each restaurant and evaluate it during the past five
years, which can be used later by business owners to improve the provided services
In this work, a customer sentiment analysis will be conducted on the data that has
been extracted from the Twitter platform via the API service. Next, the extracted data
will be turned into useful and concise information that benefits both the business owner
and customers together. Figure 1 shows the main stages of the proposed framework,
which are as follows: data collection, data preprocessing, sentiment analysis, and finally,
reputation score calculation [6].
2 Related Works
Reputation systems are defined as algorithms that enable users in online communities
to rate each other to create trust through reputation [7]. Reputation is the perception
or belief that the individual has about something, like about a company, services, or
Sentiment Analysis of Restaurants Customer Reviews on Twitter
297
standing of a person [8]. And it is represented by a measure of reliability that is made
by gathering customer reviews and comments about something.
The reputation of the brand was calculated depending on positive and negative polarities from the classification phase by using them in the Net Brand Reputation (NBR)
index as “the percentage of positive mentions minus the percentage of negative mention
as follows [9]:
NBR =
Positive Polarity − Negative Polarity
∗ 100
Positive Polarity + Negative Polarity
The work proposed in [10] deals with the analysis of Arabic sentiment, especially Arabic
tweets, and classifies them into positive, negative, or neutral. These tweets were brought
from Twitter according to the specific search keyword. They used crowdsourcing to
collect a large group of tweets to create a precise tool that helps in commenting on
tweets, as well as creating an API that enables the user to log in and view the tweet
associated with one of the following four categories: negative, positive, neutral or not
applicable. The tweets were selected based on the following criteria: each tweet consists
of at least 100 characters, the hashtag in the tweet should not exceed 4, the tweet content
should be freed from links, and finally, the words should not be repeated. After that,
the filtered tweets were collected in a small dataset called ToBeRated to be labeled
by the user from his point of view via the API interface. The tweet is displayed to
him, then he labels it to (positive-negative - neutral), and the classification is saved in
the database. In the processing stage, they used Rapidminer to modify the texts and
extend them to all aspects of the research. In the classification, they used three classifiers
combined in Rapidminer (Naive Bayes (NB), K-nearest neighbor (KNN), and support
vector machines (SVM). The main contributions of this work are building a dictionary
in the Jordanian dialect by turning 100 long shots among Jordanian users and building
a dictionary of negative words and merging it with Rapidminer to solve the problem of
equating negative words with stop words.
Another work proposed the use of a machine learning approach to analyze Arabic
sentiments, specifically the Saudi dialect that related to the topic of girls’ sports in
Saudi Arabia [11]. The data was extracted from the Twitter platform by creating a
search query using Rapidminer. In the preprocessing phase, the data were processed
using the following techniques: Rapidminer Tokenizer, Stemmer (Arabic), Stemmer
(light, Arabic), Filter Tokens by length, Stopwords remover (Arabic), Generate-n-Grams
(Terms). Next, in the sentiment classification phase, the data were classified using three
models of supervised machine learning (NB, SVM, and KNN). For validation purposes,
the data with the 10-folds cross-validation method was used. Experiments were applied
using Rapidminer and Text processing extension on the collected and annotated dataset
that contains 1,415 positives, 2,434 negatives, and 1,634 neutral processed tweets. The
results of the experiments show that the KNN with no stemming and SVM with stemming
classifier outperformed the NB classifier. The main contributions of this work can be
summarized into two points. First, training and processing the data set using three types
of classifiers: NB, SVM, and KNN with three conditions for each one: with no stemming,
with light stemming, and with stemming. Second, the replacement of tokens approach
was conducted to enhance the classifiers accuracy during the learning and testing process.
By replacing the Saudi dialect terms with modern terms in Standard Arabic, the results
298
N. Alharbi et al.
were improved, and the classifiers’ accuracy was enhanced when tested on a subset of
the dataset. The main limitation of this work is the manual annotation of data, and it can
be improved by using crowdsourcing or a tool for semi-annotation.
The approach in [12] proposed specifically to solve the problem of a lack of annotated
data for the Tunisian dialect. The Machine learning approaches result in using annotated
data sets to train the classifier. A dataset for the Tunisian dialect (TSAC) was created
from the comments of multiple domains such as social, education, and politics. This
work was performed different experiments using several machine learning algorithms
(MLP, NB, SVM) on three training sets (OCA, LABR, TSAC). The key goals of this
research are to find the most suitable Tunisian Dialect that can be used as training
datasets for the Tunisian dialect sentiment analysis task. The results showed that the
Tunisian training corpus (TSAC) provides the best sentiment analysis performance for
the Tunisian dialect. The main contributions of this work are as follows: introduce
a review of the available Arabic language resources include modern standard Arabic
(MSA) and dialectal, create a multi-purpose sentiment analysis training corpus in the
Tunisian dialect, and assess the Tunisian dialect sentiment analysis system’s performance
in many different configurations.
Sentiment analysis in Sudanese dialectal tweets is proposed in [13]. The utilization
of social media platforms results in building a new lexicon for the Sudanese dialect that
contains 2500 tweets categorized manually to positive and negative. The Twitter API
search tool was used to collect this dataset. In the preprocessing phase, the tokenization
and stemming were performed using the Rapidminer tool. Additional steps in this phase,
including stopwords removing and normalization, were clear with some examples of
Tweet status after applying each of these steps. The classification phase has been applied
in this work using three classifiers SVM, NB, and KNN. The result was illustrated in
a diagram showing the difference between the output of each of these three classifiers
in terms of precision, recall, accuracy, and F-measure. The results show that the SVM
classifier has achieved the best recall, accuracy, and F-measure, whereas the NB has
achieved the best precision score. The main contributions of this work are building the
Sudanese dialect lexicon that contains 2500 tweets and assessing the Sudanese dialect
sentiment analysis performance in many different classifiers. However, the limitation of
this work is the reliability of the dictionary has not been tested using different specialist
Arabic annotators, and this helps greatly in clarifying and confirming the accuracy of
classification results.
Categorizing customer reviews into positive and negative for Surabaya restaurant
was proposed in [14]. This data was obtained from the Tripadvisor website using WebHarvy software, which is a tool that enables the collection and extraction of data from any
webpage and removes punctuation and stopwords. Then the data were classified using
the Waikato Environment for Knowledge Analysis (WEKA) software, one of its advantages that its ability to classify the data either with or without supervision by using the
Naïve Byes (NB) algorithm and the TextBlob algorithm. When the results were obtained
using NB, they compared against the one from the TextBlob. By analyzing classifiers’
outcomes, it was found that the NB algorithm is more accurate than TextBlob, at a rate
of 2.9%. The main contributions of this approach are the collection of 337 data samples,
of which 269 were for data training and 68 were for data testing. Also, two algorithms
Sentiment Analysis of Restaurants Customer Reviews on Twitter
299
were used to classify data, the Naive Bayes algorithm, and the TextBlob algorithm, and
the results were compared against each other to identify the highest accuracy model.
Recently, the work that aims to analyze the tweets’ feelings on the ATSAD dataset
is proposed in [15]. The ATSAD dataset was imported from Twitter API to build a
dictionary of emojis and add feelings to them from the Emojis sentiment ranking lexicon,
and then use it to classify the tweets. They cleaned the Tweets by removing all metadata,
non-Arabic characters, links, diacritics from the text, and duplicate tweets. They used two
methods to evaluate the corpus, intrinsic by evaluating the corpus directly for accuracy
and quality. To check whether the rule-based annotation (simply an emojis annotation)
can be used to build a reliable corpus and use it effectively in the desired functionality.
In an external evaluation, the impact of the data in the sentiment analysis field. To
ensure the quality of the collected data, they used two commentators, one of whom is an
expert in NLP and the other is an Arabic speaker. To annotate subsets of the corpus. The
main contributions of this work are building a dictionary of emojis and classifying them
from an Emojis sentiment ranking lexicon. Also, they released 8,000 tweets manually
categorized and compared to human classification and pre-trained sentiment analysis
models. They are also building a sentiment analysis machine learning model with the
unigram features as a baseline and a complex model that uses utilizes word grams and
character grams.
Fig. 1. Component diagram of the proposed system
3 Proposed Approach
The proposed approach consists of four main phases, which are as follows: data collection, data preprocessing, classification (sentiment analysis), and reputation score, as
shown in the component diagram in Fig. 1 (Fig. 2).
300
N. Alharbi et al.
Fig. 2. The stages of the proposed framework
First, two lexicons were created, the PLSD lexicon (Polarity Lexicon for Saudi
Dialect) and the ELSA lexicon (Emojis Lexicon for Sentiment Analysis). To create
a lexicon of words, four main steps were followed: collecting dataset from Twitter
through which used to obtain the words of the lexicon, preprocessing and filtering the
collected dataset, classifying the extracted words from the previous two steps manually
into positive and negative vocabularies, and finally enriching lexicon vocabularies with
their synonyms.
3.1 The PLSD Lexicon Creation
Fig. 3. Example of search hashtags
Data Collection Phase. In this phase of lexicon creation, a dataset was collected from
the Twitter platform using the API service by searching with random keywords and
hashtags related to the restaurant industry in a specific period (from January 2015 until
Sentiment Analysis of Restaurants Customer Reviews on Twitter
301
November 2020), refer to Fig. 3 for some examples of the hashtags. The result of the
collection phase was 300 unprocessed tweets. It will be processed in the next phase to
obtain a group of words that indicate sentiment.
Data Preprocessing Phase. The data preprocessing phase helps to classify the data
more easily and accurately, as people differ in the way of writing words through which
they express their opinions. For example, some express their opinions by writing (
)/(sweeeet) while others express it by writing (
)/(sweeet). In the preprocessing
phase, both words are processed to be treated as one word and become " "/(sweet).
To prepare the data and filter the collected tweets, several preprocessing methods as in
[16] were used to clean and prepare the dataset for the classification phase as follows:
1. Removing all of the diacritics marks and all non-Arabic letters and words, hashtags,
mention, retweet for tweets, removing duplicate characters in words, for example (
)/(Do you agree that this is the best restaurant?).
2. Tokenizing the text.
3. Removing all symbols such as punctuation marks, commas, and dots, also remove
numbers, selected stopwords such as the letters and words used to connect sentences
)/(on, to, from…)
and not add meaning, such as (
4. Stemming the text.
The final result of the data preprocessing phase was 2937 words. These words were
examined, and only those unique words that indicate feelings were selected. The total
number of words after filtering becomes 300 unclassified words. These words will be
classified based on their sentiment and enriched with their synonyms at the next phases.
Classification Phase. The data classification phase is the most important phase for
completing the PLSD lexicon building. After selecting 300 words that indicate sentiment from the previous phase. Classification of these words is conducted manually by
five annotators, into positive words expressed with the number “1” and negative words
expressed with the number “−1”. To expand the PLSD lexicon, these words will be later
enriched with their synonyms.
Vocabulary Enrichment Phase. Linguistic enrichment is the last phase in building the
PLSD lexicon. In this phase, all the 300 sentiment words extracted from the previous
phases were enriched with their synonyms. At first, we decided to use the wordnet
libraries to accomplish this task. However, there were no such libraries that support the
Arabic language adequately, and therefore, these words were enriched manually, like all
forms of the word were found in the case of masculine, feminine, singular, and plural
)/(Appropriate) through the Arabic linguistic
such as (
dictionaries or by the help of the five annotators. These different forms of the words will
be assigned the same labels as the original word. Additionally, the resulted lexicon is
expanded by adding the vocabularies of the SauDiSenti lexicon [5]. After the enrichment
phase was conducted, the total number of words reached 1372, with 637 words were
classified as positive lexicons and 734 words were assigned as negative lexicons.
302
N. Alharbi et al.
3.2 The ELSA Lexicon Creation
Due to the fact that the majority of Twitter users use emoji to express their opinions
about restaurants, a special lexicon for emoji named Emojis Lexicon for Sentiment
Analysis (ELSA) was manually created that includes about 500 emoji. In order to make
the classification stage accurate, this lexicon was created manually and then categorized
into positive “1” and negative “−1”. To use the ELSA emojis lexicon in the classification
phase, each emoji was converted to the corresponding code in the emoji library using the
corresponds to it “red_heart:”
demojize built-in function in Python. For example,
Following that, all emojis within the tweet files were converted in the same way to
facilitate the matching process between them and the customers’ review tweets during
the classification phase.
3.3 The Customers’ Reviews Dataset Collection
Once the essential lexicons are created, the next step is to collect the customers’ reviews
dataset that will be used to assess the four restaurants’ reputation scores in Madinah.
Here we will present the steps that have been followed to collect the required dataset.
Data Collection Phase. The collected data is a corpus of tweets of four different restaurants. They are collected in the same way as the PLSD lexicon tweets were collected.
However, in addition to using the Twitter API service, Twitter’s advanced search was
used to search for the four restaurants’ Tweets in the specified period. These restaurants
namely (Al Baik, Domino’s Pizza, Maestro Pizza, and Shawarma Al Harraq Abu Siiah
Restaurants). The tweets were collected for the period from January 2016 to November
2020, considering the location of the tweets, so that only the tweets that were located in
Madinah and were indicated sentiment are collected (Table 1).
Table 1. Number of collected tweets for each restaurant
Restaurant name
Al Baik
Domino's Pizza
Shawarma Al Haraq (Abo Siiah)
Number of tweets
500
499
209
Maestro Pizza
292
Data Preprocessing Phase. The restaurants’ data preprocessing phase is not different from the PLSD lexicon data preprocessing. The same preprocessing methods were
applied to the customers’ reviews dataset. The only difference in the preprocessing phase
here is that we did not apply “Stemming the text” as applying this measure to the text
might lead to changes in the meaning of the tweet. Often the extracted roots were wrong,
and the reason for this is that the Arabic language is a multi-dialect language.
Sentiment Analysis of Restaurants Customer Reviews on Twitter
303
Data Classification Phase. The classification phase for the restaurants’ dataset is completely dependent on the previously created PLSD and ELSA lexicons. At the same time,
the words and emojis in each tweet of each restaurant will be classified as positive or
negative by comparing them against the PLSD lexicon and the ELSA emojis lexicon. If
the word in the tweet matches a word in the positive lexicon, it is counted as a positive
word, and if it matches a word in the negative lexicon, it is counted as a negative word.
The same goes for emojis with positive and negative ELSA lexicon. Otherwise, the word
is considered neutral and weighted as zero. Next, if the number of positive words and
emojis in the tweet, based on the PLSD and ELSA lexicons, is greater than the number of
negative words and emojis in the tweet, then the classification for this tweet is positive,
and it is assigned a value of “1”, but if the number of positive words and positive emojis
is less than negative, then this tweet will be classified as a negative tweet and a value of
“−1” is assigned to it. Otherwise, the tweet is classified as neutral and assigned 0 value.
)/(I
For example, consider the following tweet (
love the vanilla ice cream from Al Baik restaurant is the best), in this tweet the word
/“love” was counted as a positive word, the emoji
as a positive emoji, and
as a negative one. So the sum of the positive in the tweet is “2” and the negative is
“1.” So, the Tweet will be classified as positive, and it will be given a value of “1”.
Reputation Score Phase. The reputation score calculation process was based on the
Net Brand Reputation Equation (NBR), so we calculate the reputation of all the four
restaurants during five years (2016–2020), then calculate the reputation score for the
restaurant as a whole.
NBR =
Positive Polarity − Negative Polarity
× 100
Positive Polarity + Negative Polarity
Calculating the annual reputation score for each of the four restaurants and then
calculating its average over the five years.
4 Experimental Results
In this section, a set of experiments were conducted to evaluate the performance of the
proposed approach. First, the results of restaurants’ reputation scores were compared
against their reputation scores extracted from the Foursquare website [17] that evaluates
restaurants globally, including Saudi Arabia. Second, the sentiment analysis outcomes
were examined against a ground truth of the same dataset that is manually labeled by
five different annotators to positive, negative, or neutral. Finally, the Naïve Bayes (NB)
model is trained on the part of the dataset that includes the automatic sentiment labels
obtained by the proposed approach to validating the quality and efficiency of the system
approach to classify customers’ tweets.
First Experiment: To evaluate the proposed approach, the calculated restaurants’ reputation scores were compared against these restaurants’ reputation scores extracted from
the Foursquare website [17] that evaluates restaurants globally, including Saudi Arabia.
The resulted reputation scores were almost consistent with those from Foursquare, as
304
N. Alharbi et al.
shown in Table 2. However, it was noticed that the scores of Al-Baik and Domino’s
could be slightly higher due to the high number of negative emojis used by customers
to express their unbridled desire to order and eat specific meals from these restaurants.
Unfortunately, these emojis result in misclassifying their tweets and labeling them as
/“I’m craving Al Baik
negative sentiments. For example,
” Here the broken heart was used as a reference to
spicy chicken yummy
a positive meaning in the context of the sentence, but it was calculated as negative,
which led to decrease of the expected classification results. We also see another examin a positive sense, and it was classified as negaple of using the following emoji
/“I have a craving for pizza, to domino’s DUDE!
tive
”.
Table 2. Calculated restaurants reputation scores against Foursquare scores
Restaurant name
Reputation
Foursquare
Al Baik
65.9
8.5
Domino’s Pizza
56.5
7.4
Abo Siiah
68.6
9
Maestro Pizza
56.9
7.4
Figure 4 shows the average reputation scores for the four restaurants over five years.
We observed a remarkable decrease in the “Abu Saiih” restaurant in 2019, where the
reputation level reached 28, and after searching for the reason, it was noticed that this
decrease was due to two reasons: First, customers’ complaints about changing the quality
of the food provided and crowding due to the smallness of the shop. Second, the emoji in
this year’s tweets were wrongly evaluated, as we mentioned earlier. Regarding Domino’s
Restaurant and Al Baik Restaurant, they are volatile, and we observe that Maestro Pizza
in 2017 reached the reputation score of 80, which is the highest score obtained, but it
began to decline slightly in the following years.
Second Experiment: In this study, the performance of the lexicon-based approach
should be evaluated, and the correctness of sentiment analysis results needs to be examined. The performance here stands for the sentiment classification accuracy, and due to
the fact that our dataset was created by us and we were unable to compare the results
against other works, human annotation is considered as a good alternative. To achieve
this task, five human annotators were asked to label each tweet in our dataset to one
of these values (1, 0, −1). A value of “1” is given if the number of positive words and
positive emojis in the tweet is more than words and emojis negative, and if the opposite happens, a value of “−1” is given. Finally, a value of “0” is given in the event of
equality between them. Next, these manual annotations were considered as ground truth
in our experiment. The automatic classification of the tweets resulting from our system
is compared against the ground truth, and the accuracy is calculated according to the
Sentiment Analysis of Restaurants Customer Reviews on Twitter
305
Fig. 4. Reputation scores for all restaurants over the five years
following equation.
Accuracy =
TP + TN
× 100
TP + TN + FP + FN
Where TP refers to the true positive, TN stands for true negative, FP means the false
positive, and FN refers to the false negative. A total of 1205 tweets were correctly classified by the proposed approach, and 80% accuracy was achieved compared to manual
annotation references. And Fig. 5 shows the number of positive and negative words in
the classified restaurants’ tweets. The number of positive words in the ranked tweets is
approximately three times the number of negative words.
Fig. 5. Number of pos & neg words for each restaurant
306
N. Alharbi et al.
Third Experiment: Conducting the second experiment proves the validity of our dataset
against the human annotation dataset with high accuracy. Next, the Naïve Bayes (NB)
model is applied to our dataset to assess the efficiency of the classification phase. The NB
is a simple probabilistic classifier that is mainly established on the concept of applying the
Bayes’ theorem with strong independence assumptions between the features [18].
To conduct this experiment, the Sklearn library in Python is used to build the NB
classifier. The classifier is built with the default parameters. Then, the dataset is divided
into dependent (features) and independent (label) variables. Next, those variables are
divided into training and testing sets. To fit the model, the training set is used while the
prediction is performed on the testing set. The classification accuracy was measured, and
it was relatively higher than the human annotation accuracy with 83%. The precision
and recall were 79% and 76%, respectively, with low instances of FN and FP.
Table 3. The classification confusion matrix
Predected:1
Predected:0
Predected: -1
Actual: 1
51
23
0
Actual: 0
4
59
22
Actual: -1
0
29
263
As shown in the confusion matrix in Table 3, the NB achieved promising classification
results despite its simplicity. That fact is well-known in the information retrieval field as
NB outperforms many sophisticated models [19]
Figure 6 below shows a sample of the results of the proposed approach compared to
a sample of the results of the ground truth process.
As it turns out, there are results that are correctly rated by the classifier in the proposed
approach, such as the first sample rated with −1 from both classifiers. Also, there are
samples that are not properly categorized by the classifier in the proposed approach.
Fig. 6. Samples of results
Sentiment Analysis of Restaurants Customer Reviews on Twitter
307
This is due to several reasons, including the difference in the way people express their
opinion, as well as the difference in the local Saudi dialects that the classifier did not
recognize correctly.
5 Conclusion
In this paper, we described the main phases to analyze the sentiment in the Arabic language. In our work, a lexicon-based approach was implemented to obtain the customers’
tweets sentiment and calculate the reputation score for four specific restaurants in Madinah. The dataset was collected using the Twitter platform. This study was motivated
by the diversity and rapid spread of restaurants today, which has led to some challenges
for both customers and business owners who can benefit from the proposed system. The
PLSD (Polarity Lexicon for Saudi Dialect) is an Arabic lexicon that contains a binary
classification of words in the Arabic dialect into positive and negative, and the ELSA
lexicon (Emojis Lexicon for Sentiment Analysis) also contains a positive and negative classification of emojis based on the classifications of 5 annotators. Our approach
consists of four basic phases: the data collection phase, the preprocessing phase, the
classification phase, which is conducted with the help of two lexicons (PLSD and ELSA
lexicons), and finally, the reputation score phase.
References
1. Liu, B.: Sentiment Analysis and Opinion Mining. Morgan & Claypool (2012)
2. Cengiz, E.: Measuring customer satisfaction: must or not. J. Naval Sci. Eng. 6(2), 76–88
(2010)
3. Sommerville, I.: Software Engineering,” 11th ed., Addison-Wesley, 2015. Globalmediainsight.com 2020. Saudi Arabia Social Media Statistics 2020 (Infographics) - GMI
Blog
4. “RESTAURANT|meaning in the Cambridge English Dictionary”, Dictionary.cambridge.org.
https://dictionary.cambridge.org/dictionary/english/restaurant. Accessed 7 Oct 2020
5. Al-Thubaity, A., Alqahtani, Q., Aljandal, A.: Sentiment lexicon for sentiment analysis of
Saudi dialect tweets. Proc. Comput. Sci. 142, 301–307 (2018)
6. Al-Hussaini, H., Al-Dossari, H.: A lexicon-based approach to build service provider reputation
from Arabic tweets on Twitter. Int. J. Adv. Comput. Sci. Appl. 8(4), 445–454 (2017)
7. Wikipedia: Reputation system (2020). https://en.wikipedia.org/wiki/Reputation_system
2020. Accessed 18 Oct 2020
8. Blogreputationx: What is reputation? (2020). https://blog.reputationx.com/whats-reputation.
Accessed 18 Oct 2020
9. Vidya, N.A., Fanany, M.I., Budi, I.: Twitter sentiment to analyze the net brand reputation of
mobile phone providers. Proce. Comput. Sci. 72, 519–526 (2015)
10. Duwairi, R.M., Marji, R.: Sentiment analysis in Arabic tweets, p. 7 (2014)
11. Emam, A., Al-Harbi, W.: Effect of Saudi Dialect Preprocessing on Arabic Sentiment Analysis,
p. 10 (2015)
12. Mdhaffar, S., Bougares, F., Estève, Y., Hadrich-Belguith, L.: Sentiment analysis of Tunisian
dialects: linguistic resources and experiments. Third Arabic Natural Language Processing
Workshop (WANLP), Valence, Spain, pp. 55–61, April 2017
308
N. Alharbi et al.
13. Abdelhameed, H., Muñoz-Hernández, S.: Sentiment analysis of Arabic tweets in Sudanese
dialect. Int. J. New Technol. Res. 5(6) (2019)
14. Laksono, R.A., Sungkono, K.R., Sarno, R., Wahyuni, C.S.: Sentiment analysis of restaurant
customer reviews on TripAdvisor using Naive bayes, p. 7 (2019)
15. Kwaik, K.A., Saad, M., Chatzikyriakidis, S., Dobnik, S., Johansson, R.: An Arabic tweets
sentiment analysis dataset (ATSAD) using distant supervision and self training, p. 8 (2020)
16. Al-Twairesh, N., Al-Khalifa, H., Al-Salman, A., Al-Ohali, Y.: AraSenTi-Tweet: a corpus for
Arabic sentiment analysis of Saudi tweets. Proc. Comput. Sci. 117, 63–72 (2017)
17. Foursquare: Food Saudi Arabia (2021). https://foursquare.com/explore?ll=24.446102%
2C39.662128&mode=url&q=Food . Accessed 12 April 2021
18. McCallum, A.: Graphical Models, Lecture2: Bayesian Network Representation” (PDF).
Accessed 12 Apr 2021
19. Medium 2021: Intro to types of classification algorithms in Machine Learning. https://med
ium.com/sifium/machine-learning-types-of-classification-9497bd4f2e14. Accessed 12 April
2021
An Analysis of Students’ Academic Performance
Using K-Means Clustering Algorithm
Maryam Ahmad(B)
, Noreen Izza Bt Arshad, and Aliza Bt Sarlan
Universiti Teknologi PETRONAS, Seri Iskandar, Malaysia
maryam_20000052@utp.edu.my
Abstract. A massive amount of data is often used to evaluate the academic performance of students in higher education. Analysis can solve this challenge through
various strategies and methods. Due to the spread of the pandemic Covid-19, traditional modes of education have shifted to include online learning. This study aims
to analyze the academic performance of students through data mining techniques.
The objective aims to investigate the academic performance of business students
at a private university in Malaysia using Educational Data Mining techniques. Students’ academic performance data of a private university in Malaysia is used to
analyze students’ performance using demographic and academic attributes. This
study used students’ academic performance in the learning method to identify
the patterns before and during Covid-19 using the K-Means data mining clustering technique. The results of the k-means clustering analysis showed that students
were achieving higher CGPA during Covid-19 online learning compared to before
Covid-19.
Keywords: Covid-19 · Educational data mining · Clustering · K-Means
1 Introduction
The number of distant education and learning methods offered in the higher education
sector has risen substantially over the last decade. An individual’s choice of educational
delivery method is influenced by various variables [1, 2].
Coronavirus (Covid-19) has impacted the traditional education system from elementary to tertiary levels all over the world. Implementing a movement control order
(MCO) in Malaysia as a preventive measure in response to the Covid-19 pandemic has
hastened public acceptance of remote/distance learning. The shift to e-learning allows
students and educators to mimic the traditional classroom while avoiding close contact
and minimizing the danger of transmission of the virus. It is critical to establish whether
greater use and availability of online teaching-learning and teaching resources and the
employment of an online learning method have had a good impact on students’ academic
performance, as evidenced by improved learning outcomes.
The advancement of technology allows higher education institutions (HEIs) to divide
large amounts of students’ learning data across different learning methods and years of
study. Data analytics-driven decision-making refers to the process of analyzing data to
© The Author(s), under exclusive license to Springer Nature Switzerland AG 2022
F. Saeed et al. (Eds.): IRICT 2021, LNDECT 127, pp. 309–318, 2022.
https://doi.org/10.1007/978-3-030-98741-1_26
310
M. Ahmad et al.
formulate decisions and conclusions about the current path [1]. Data mining is a process
utilized for identifying hidden patterns in large data sets. Educational data mining is
a field of research that uses the collected data from educational databases to improve
the understanding of educational performance [3]. Evaluating students’ performance is
a complex issue, and the analysis can do that in various ways. Educators can use data
mining to uncover the reasons behind their students’ performance.
Grade Point Average (GPA) or Cumulative Grade Points Average (CGPA) is an indicator that is frequently used for the academic performance of students [4]. Several HEIs
set a minimum achievable GPA that the students must maintain throughout the semesters
for successful completion of their studies. Unfortunately, many students face difficulties
in obtaining a high CGPA. Still, these factors could be targeted by the academic community in developing strategies to evaluate students learning and improve their academic
performance by monitoring the progression of their performance [5]. Due to technological improvements and internet accessibility, education has seen a considerable transition
in recent years.
This paper aims to develop a method that will allow educators and students to collect
and monitor the academic performance of their students during their entire duration of
studies. Being updated on their performance will allow them to help improve their
teaching and learning strategies.
The paper is structured as follows: Literature Review, Methodology, Results &
Analysis, and Conclusion and Future Work.
2 Literature Review
Although the researchers mainly focused on data mining for educational purposes, they
also consider online education as a feasible alternative to conventional education.
2.1 Background
The learning techniques are divided into three categories: clustering, prediction, and
association. The primary learning techniques are presented as Naïve Bayes, Decision
Tree, etc. The techniques for prediction are linear regression, multi-linear regression,
and association. Data mining is a process that collects data from various sources. It uses
various techniques to extract information from the data [3].
Clustering is a process of grouping similar objects in a cluster. The objects are
arranged in a different order in a cluster. It is a widely used algorithm for various applications. Some of these include data mining, pattern recognition, and machine learning.
The K-Means algorithm divides the number of observations into k-clusters, where the
nearest mean is the cluster with the most observations. This algorithm can be used to
determine the number of clusters in each data set. Clustering analysis should choose it
with the goal of achieving the best possible performance. The value of ‘K’ is determined
using the elbow method [6]. It is a visual method to calculate the cost of training. It
is usually started with K = 2 and then kept increasing it in each step. The goal is to
reach a plateau where the K value drops dramatically. The analysis is performed using
RapidMiner Studio, open-source software that provides tools for text mining, machine
An Analysis of Students’ Academic Performance
311
learning, and predictive analysis. RapidMiner is a handy tool for data analysis as it
provides quick and effective data analysis.
Figure 1 explains different stages of mining information on educational data for
academic decision-making.
Fig. 1. Stages of data mining process [7]
2.2 Related Work
The students’ performance in [8] was evaluated using various classification algorithms:
naïve Bayes, random forest, decision trees, multilayer perception, and coting classifiers.
The accuracy reached 80.6% for the voting algorithm using the xAPI database. Finally,
[9] presented an experiment that explored the use of fuzzy rules to evaluate the students in
an E-learning environment where the results showed that there is a considerable variation
when compared to classical approaches.
During the pandemic, students lacked collective activities that resulted in impairing
their learning. K-Means clustering was performed over a large dataset by [10] to obtain
four different clusters. The study also used the learning algorithms SVM, Random Forest,
Naïve Bayes, KNN, and Multilayer perception was used to determine which learning
mode was most suitable for learning. The results showed 81.5% accuracy. A framework
using Association rules [11] aims to benefit the participants and educators of an online
learning environment. It includes rules and procedures that are designed to promote the
relationship between learning and achievement.
An investigation by [12] was of the academic performance of the same students in
three different online and traditional courses where it was discovered that the online.
The technique produced lower grades than the traditional method. An analysis of studies conducted over 10,000 students revealed that those who studied through blended
learning courses were more satisfied than those who used other learning methods [13–
16]. Different learning styles must be designed to achieve optimal results in different
312
M. Ahmad et al.
educational environments [17]. The implementation of EDM in the previous research
has become the method and tool used in analyzing available data in HEIs. It is in an
interactive cycle of hypothesis formation, testing, and refinement where educators are
responsible for designing, planning, building, and maintaining the educational systems.
For information discovery from databases, several algorithms and methods such as
Clustering, Regression, Classification, Neural Networks, Artificial Intelligence, Decision Trees, Nearest Neighbor, Association Rules approach, and so on are employed. In
addition, visualization through data mining techniques can combine the tools to envision
patterns of interest [2].
This study revealed that studying students’ performance before and during pandemic
Covid-19 is necessary. One of the strategies used to analyze students’ academic performance is based on the concept of clustering. This method aims to identify and compare
students’ academic performance using various attributes during their learning methods.
3 Methodology
The study aims to analyze and compare the academic performance of students using
various learning methods. It uses the concept of clustering. The study is carried out using
data collected from a private university. The study’s objective is to identify the impact of
various learning methods on the performance of undergraduate business students. The
steps adopted in this research work are illustrated in Fig. 2, and further explained in the
following paragraphs.
Fig. 2. Methodology adopted
The initial stage, as shown in Fig. 2, was to retrieve data from an institutional database.
The data was collected from the university’s repository for undergraduate business students for the year 2020. Each semester is four months of duration. Next, the data set was
analyzed using the pre-processing method that helps gather essential details about the
data.
An Analysis of Students’ Academic Performance
313
1. The first step is to collect educational data.
2. The second step is where the data is pre-processing, including some being
normalized.
3. The third step follows the pre-processing step, where data cleaning is carried out to
remove any missing or incorrect data.
4. The fourth step is examining each attribute and its implication of which attributes
should be selected for the analysis.
5. The fifth step is using the K-Means clustering algorithm to locate students with
similar characteristics based on the given attributes.
The following section will explain the steps in further detail in the paragraphs that
follow.
Data Set. The collected institutional was retrieved from the university’s repository. A
sample of 466 data sets was collected. The data set was pre-processed for missing and
incorrect values. The analysis showed no missing or incorrect values obtained from the
data set. This study considered various attributes for analyzing students’ performance
are shown in Table 1.
Table 1. Attributes selection for analysis
Attributes
Description
Student ID
ID for each student
Student name
Name of student
Gender
Male/Female
Program
Business information system
CGPA
Cumulative grade point average
GPA
Grade point average
Student status
Pass, fail, or incomplete
Enrollment year
The year of studying
Selected
√
√
√
√
Some of the irrelevant attributes were removed or not used.
Identification of ‘K’. This method will aid in identifying areas where the students have
a similar range of results to distinguish between their performance from good to bad.
The value of ‘K’ was determined using the elbow method, as shown in Fig. 3. The index
of k = 3 was found to be the optimal number of the cluster where the average is 0.47.
314
M. Ahmad et al.
Fig. 3. Identification of elbow point
The attributes being considered to analyze the results obtained are further discussed
as follows, referring to Fig. 3:
•
•
•
•
There is a curve at k = 2 and k = 3
K = 2 achieved a weak accuracy of 27%
K = 3 achieved 55% of accuracy
Hence k = 3 is considered a good number for data clustering.
The selected attributes are processed via the RapidMiner tool used for doing analysis.
Refer to Fig. 4 for the arrangement of operators in the RapidMiner tool:
Fig. 4. Operator arrangement
The read Excel operator is used to import Excel files that have normalized data.
Finally, the clustering operator is used to generate clusters based on the input data.
An Analysis of Students’ Academic Performance
315
4 Results and Analysis
In this section, the analysis results are presented for the student’s academic performance
before and during the Covid-19 pandemic for the same students. The study found interesting results based on the clusters that are further discussed in the following paragraphs
in each of the results. The clustering algorithm produced a model with three clusters are
shown below. Clustering Analysis of students’ data before Covid-19.
Fig. 5. Clusters plot based on CGPA and GPA of 466 students
Figure 5 above depicts a graphical representation of the distribution of the clusters
for the analysis of two attributes: CGPA and GPA of the students. These two attributes
were chosen to reduce the number of errors to plot the clusters easily. Table 2 presents
the centroids of Fig. 5.
Table 2. Centroids of clusters of data before Covid-19
Attributes
Cluster 0
Cluster 1
Cluster 2
GPA
3.238
1.995
3.643
CGPA
3.002
2.254
3.502
Cluster 0. Based on the cluster analysis in cluster 0, it is observed that data obtained in
the semester before Covid-19 for the business program students had the second-highest
316
M. Ahmad et al.
data (210) among the other clusters being analyzed. Therefore, this cluster falls between
2.00 to 3.40 CGPA that indicates the student’s status under this cluster is ‘Pass.’
Cluster 1. Based on the cluster analysis in cluster 1, it is observed that data obtained
in the semester before Covid-19 for the business program students had the least amount
of data (27) the other clusters being analyzed. Therefore, this cluster falls between 1.30
to 3.10 CGPA that indicates the student’s status under this cluster is ‘Pass,’ but the ones
that are below 2.00 are at a higher risk of ‘Academic Dismissal.’
Cluster 2. Based on the cluster analysis in cluster 2, it is observed that data obtained in
the semester before Covid-19 for the business program students had the highest amount
of data (233) the other clusters being analyzed. Therefore, this cluster falls between
3.00 to 4.00 CGPA that indicates the student’s status under this cluster is ‘Pass,’ ‘Good
Standing’ or ‘Deans List.’
4.1 Clustering Analysis of Students’ Data During Covid-19
Fig. 6. Clusters plot based on CGPA and GPA of 470 students
Figure 6 above depicts a graphical representation of the distribution of the clusters
to analyze two attributes: CGPA and GPA of the students. These two attributes were
chosen to reduce the number of errors to plot the clusters easily. Table 3 presents the
centroids of Fig. 6.
An Analysis of Students’ Academic Performance
317
Table 3. Centroids of clusters of data during Covid-19
Attributes
Cluster 0
Cluster 1
Cluster 2
GPA
3.065
3.631
1.076
CGPA
2.897
3.471
1.254
Cluster 0. Based on the cluster analysis in cluster 0, it is observed that data obtained in
the semester during Covid-19 for the business program students had the second-highest
data (153) among the other clusters being analyzed. Therefore, this cluster falls between
2.00 to 3.50 CGPA that indicates the student’s status under this cluster is ‘Pass’ or ‘Good
Standing.’
Cluster 1. Based on the cluster analysis in cluster 1, it is observed that data obtained in
the semester during Covid-19 for the business program students had the highest amount
of data (296) the other clusters being analyzed. Therefore, this cluster falls between
2.75 to 4.00 CGPA that indicates the student’s status under this cluster is ‘Pass,’ ‘Good
Standing’ or ‘Deans List.’
Cluster 2. Based on the cluster analysis in cluster 2, it is observed that data obtained
in the semester during Covid-19 for the business program students had the least amount
of data (17) the other clusters being analyzed. Therefore, this cluster falls between 0.50
to 2.75 CGPA that indicates the student’s status under this cluster is ‘Pass,’ but the ones
that are below 2.00 are at a higher risk of ‘Academic Dismissal.’
Based on the clustering analysis performed, the variables that were analyzed are
CGPA and GPA. Comparing the highest cluster, before Covid-19, that falls under cluster 2 (233 students) and during Covid-19 falls under Cluster 1 (296 students), this shows
that a higher number of students obtained better CGPA after their online learning implementation. Whereas for the least number of students in cluster 1 before Covid-19 and
cluster 2 (27) during Covid-19 (17), it is observed that lower students were in the range
of failing or academic dismissal after online learning was implemented.
5 Conclusion
Academic institutions worldwide are concerned about their students’ academic performance, especially during the pandemic Covid-19. The hidden knowledge that may be
gleaned from this data improves students’ academic performance in higher education
institutions. The CGPA and GPA characteristics are crucial to assess students’ academic
performance, as seen in the preceding study. This study analyzed the academic performance of students using a data mining algorithm. It was able to identify the consistent
improvement in the students’ performance. This paper presented an algorithm for determining the GPA and CGPA of undergraduate students. The algorithm is K-Means and is
easily implemented. This work can be further extended using other clustering techniques
like Fuzzy and DB Scan.
Furthermore, the clusters can be ranked or classified to get an enhanced students’
performance analysis.
318
M. Ahmad et al.
References
1. Picciano, A.G.: The evolution of big data and learning analytics in American higher education.
J. Asynchronous Learn. Netw. 16(3), 9–20 (2012)
2. Thompson, N.L., Miller, N.C., Franz, D.P.: Comparing online and face-to-face learning experiences for nontraditional students: a case study of three online teacher education candidates.
Q. Rev. Distance Educ. 14(4), 233 (2013)
3. Bakhshinategh, B., Zaiane, O.R., ElAtia, S., Ipperciel, D.: Educational data mining applications and tasks: a survey of the last 10 years. Educ. Inf. Technol. 23(1), 537–553 (2017).
https://doi.org/10.1007/s10639-017-9616-z
4. Sansgiry, S.S., Bhosle, M., Sail, K.: Factors that affect academic performance among
pharmacy students. Am. J. Pharmaceut. Educ. 70(5) (2006)
5. Oyelade, O., Oladipupo, O.O., Obagbuwa, I.C.: Application of k means clustering algorithm
for prediction of students academic performance. arXiv preprint arXiv (2010)
6. Ng, A.: Clustering with the k-means algorithm. Mach. Learn. (2012)
7. Durairaj, M., Vijitha, C.: Educational data mining for student performance prediction using
clustering algorithms. Int. J. Comput. Sci. Inf. Technol. 5(4), 5987–5991 (2014)
8. Uzel, V.N., Turgut, S.S., Özel, S.A.: Prediction of students’ academic success using data
mining methods. In: 2018 Innovations in Intelligent Systems and Applications Conference
(ASYU). IEEE (2018)
9. Wardoyo, R., Yuniarti, W.D.: Analysis of fuzzy logic modification for student assessment in
e-Learning. IBID 9(1), 29–36 (2020)
10. Lu, D.-N., Le, H.-Q., Vu, T.-H.: The factors affecting acceptance of e-learning: a machine
learning algorithm approach. Educ. Sci. 10(10), 270 (2020)
11. Bhuvaneswari, K.: Clustering based e-learning in data analytics on basis of mining prediction,
vol. 9, pp. 519–524 (2020)
12. Driscoll, A., et al.: Can online courses deliver in-class results? A comparison of student
performance and satisfaction in an online versus a face-to-face introductory sociology course.
Teach. Sociol. 40(4), 312–331 (2012)
13. Castle, S.R., McGuire, C.J.: An analysis of student self-assessment of online, blended, and
face-to-face learning environments: implications for sustainable education delivery. Int. Educ.
Stud. 3(3), 36–40 (2010)
14. Collopy, R., Arnold, J.M.: To blend or not to blend: online-only and blended learning
environments. Issues Teach. Educ. 18(2) (2009)
15. Farley, A., Jain, A., Thomson, D.: Blended learning in finance: comparing student perceptions
of lectures, tutorials and online learning environments across different year levels. Econ.
Papers J. Appl. Econom. Policy 30(1), 99–108 (2011)
16. Martínez-Caro, E., Campuzano-Bolarín, F.: Factors affecting students’ satisfaction in engineering disciplines: traditional vs. blended approaches. Euro. J. Eng. Educ. 36(5), 473–483
(2011)
17. Vasileva-Stojanovska, T., et al.: Impact of satisfaction, personality and learning style on
educational outcomes in a blended learning environment. Learn. Individ. Differ. 38, 127–135
(2015)
The Effect of Kernel Functions
on Cryptocurrency Prediction Using Support
Vector Machines
Nor Azizah Hitam1(B) , Amelia Ritahani Ismail1 , Ruhaidah Samsudin2 ,
and Eman H. Alkhammash3
1 Department of Computer Science, International Islamic Unicersity Malaysia (IIUM), Kuala
Lumpur, Malaysia
ezajaan032@gmail.com, amelia@iium.edu.my
2 Department of Information Systems, Faculty of Computing, Universiti Teknologi Malaysia,
Skudai, Johor, Malaysia
ruhaidah@utm.edu.my
3 Department of Computer Science, College of Computers and Information Technology, Taif
University, P.O. Box 11099, Taif 21944, Saudi Arabia
Eman.kms@tu.edu.sa
Abstract. Forecasting in the financial sector has proven to be a highly important
area of study in the science of Computational Intelligence (CI). Furthermore, the
availability of social media platforms contributes to the advancement of SVM
research and the selection of SVM parameters. Using SVM kernel functions, this
study examines the four kernel functions available: Linear, Radial Basis Gaussian
(RBF), Polynomial, and Sigmoid kernels, for the purpose of cryptocurrency and
foreign exchange market prediction. The available technical numerical data, sentiment data, and a technical indicator were used in this experimental research, which
was conducted in a controlled environment. The cost and epsilon-SVM regression
techniques are both being utilised, and they are both being performed across the
five datasets in this study. On the basis of three performance measures, which are
the MAE, MSE, and RMSE, the results have been compared and assessed. The
forecasting models developed in this research are used to predict all of the outcomes. The SVM-RBF kernel forecasting model, which has outperformed other
SVM-kernel models in terms of error rate generated, are presented as a conclusion
to this study.
Keywords: Cryptocurrency · Computational Intelligence (CI) · Support Vector
Machine (SVM) · Radial Basis Gaussian (RBF) kernel · Linear Kernel ·
Polynomial Kernel · Sigmoid Kernels
1 Introduction
The most rapid transformation of the Internet of Things (IoT) that is occurring around
the world is known as a cryptocurrency. It is exciting to note that it also changing the
way investors and traders perception towards the cryptocurrency. Social media platforms
© The Author(s), under exclusive license to Springer Nature Switzerland AG 2022
F. Saeed et al. (Eds.): IRICT 2021, LNDECT 127, pp. 319–332, 2022.
https://doi.org/10.1007/978-3-030-98741-1_27
320
N. A. Hitam et al.
turn to be one of the important sources where people share their insights and predictions
of the price movements [1]. This paper aims to predict the future price of the selected
cryptocurrency and benchmarked datasets from Forex. The tweets on selected cryptocurrency were analyzed to assign the polarity scores of neutral, positive, and negative
while the historical data were extracted from the relevant sources and merged with the
sentiment data that was analyzed earlier and further experimented using SVM as a based
algorithm. SVM is extensively utilized in the solution of regression and classification
problems. Consequently, while utilizing the SVM to solve the highlighted issues, kernel
selection is critical to ensuring that we obtain better outcomes. Choosing the right kernel
function and parameters to produce a successful SVM classifier with a simple structure
and a high degree of generalization [2–7] is of a paramount important. Kernel function
parameters are the most central variables influencing SVM classification performance,
but the technique for selecting the parameters, experimental comparison, and a broad
range of search optimization are drawing many studies [8]. In their publications, [8]
presented three parameter selection methods: (1) the rule of SVM generalization ability;
(2) the introduction of matrix similarity measurement and the use of a kernel calibration
method to determine kernel parameters; and (3) the introduction of optimization strategies. A defined kernel functions which derived from mathematical functions are used
broadly in the SVM algorithm. There are different types of SVM kernel functions such
as linear, polynomial, sigmoid and radial basis function (RBF). This paper, on the other
hand, will concentrate on the kernel hyperparameter selection and tuning of the SVM.
The scope is limited to 5 datasets and four years of sentiment and historical data.
2 Literature Review
Most time series prediction approaches have relied on traditional statistical methods.
Many academics have used computational intelligence (CI) methods to improve forecast
performance in financial markets. Artificial neural networks, fuzzy logics, support vector
machines, and convex with various metaheuristic algorithms such as particle swarm
optimization (PSO), Moth-Flame Optimization (MFO), and ant colony optimization are
among the methods used (ACO). [9] stated that further research is required to improve
the accuracy rate of the existing models, which is consistent with what [10] reported
in their article. In addition, hybrid approaches combine many strategies and benefits
of different methods to solve issues in initial feature selection, data preparation, data
reduction, accuracy rate, and other areas of data science [11, 12].
[13] created the forecasting model in his work by utilizing the Gaussian radial basis
function (RBF) to enhance the accuracy rate, and it was also discovered that the suggested model meets the expectations of various shareholders. Siddique et al. developed
a hybrid of the OFS-SVR-TLBO model for forecasting Tata Steel stock value in [10].
[14] utilized the SVM model to evaluate the performance of five Moroccan banks’ stock
prices, while [15, 16] use the SVM with PSO for FTSE and Bursa Malaysia KLCI
forecasting and cryptocurrency, respectively. Other hybrid techniques for commodities
market, cryptocurrency, and Forex price prediction include the Qiao et al. method [17]
and a convex method combining SVM with Whale Optimization Algorithm (WOA) in
[18].
The Effect of Kernel Functions on Cryptocurrency Prediction
321
This paper consists of six sections. Section 2 presents the literature review. Section 3
reported the development of a forecasting models and the experiments. The nonlinear
SVM, parameter selection and hyper parameter tuning are described in detail in the same
section. The results and discussions of the experiments followed by the conclusions
drawn from this study are presented in Sect. 4 and 5.
3 Literature Review
This section provides the SVM regression model and the kernels, followed by kernel
parameter optimization techniques, and then evaluates the performance of SVM kernel
parameters using a simulation experiment. This work employs the first technique of [8]
in which the model employs the rule of SVM generalization ability, followed by rule
determination by optimizing the kernel parameters in the SVM.
The performance of the SVM model is strongly reliant on many factors, including
the value of C, the type of kernel function, kernel function parameters, and the value of
ε for the ε-insensitive loss function [19]. The parameter C is used to calculate the cost
of minimizing training error while also minimizing model complexity. When the value
of C is low, it implies that the number of training errors is large. The kernel function
parameters define the nonlinear mapping from the input space to the high-dimensional
feature space [20]. The value of SVM determines the number of support vectors. It
includes four kernels that may be utilized in both linear and nonlinear applications:
radial B sigmoid, polynomial, and linear kernels. Non-linear regression issues are usually
addressed using RBF or polynomial kernels, and they have garnered a great deal of
attention from academics [15, 20–22]. In Sect. 3.1, the non-linear support vector machine
model is described in depth.
3.1 Nonlinear Support Vector Machine
According to Akay et al. in [20] for nonlinear regression problems, a nonlinear mapping
of the input space onto a higher dimension feature space may be utilized, and then linear
regression can be conducted in the space. The nonlinear model is denoted by
(1)
where
ω=
(αi − αi∗ )φ(xi ),
i=1
ω, ϕ(x) =
(αi − αi∗ )φ(xi ), φ(x)
i=1
=
(αi − αi∗ )K(xi , x),
i=1
(2)
322
N. A. Hitam et al.
b=−
1
(αi − αi∗ )K(xi , xr ) + K(xi , xs ))
2
i=1
where xr and xs denote support vectors. It is worth noting that the dot products are
using a kernel function that meets Mercer’s criteria.
Equation (1) may be expressed as follow: if the term b is included in the kernel
function,
i = 1(αi − αi∗)K(xi, x),
(3)
The radial basis function (RBF) has gotten a lot of attention recently, most commonly
with a Gaussian of the form
2
−x − x
K x, x = exp
(4)
2y2
Where γ is the RBF’s kernel’s width. The Sigmoid kernel is one of the other kernel
functions,
(5)
K x, x = tanh αxT x + c ,
where α is the slope, and c is the intercept constant, and is the polynomial kernel
K x, x = tanh αxT x + c
d
,
(6)
where α is the slope, c is the constant term, and d is the degree of the Polynomial.
3.2 Methodology: SVM Parameter Selection and Hyperparameter Tuning
SVM parameter selection and optimization should be carried out with the goal of determining the optimum kernel parameter values (C, ε, kernel parameters) so the testing data
can be predicted with minimum error values so that the testing data may be predicted
with the least amount of error. One method is to use a grid search and cross-validation,
and other publications [8, 20]. To construct the SVM model in this work, the package
‘e1071’ in the software ‘R’ is utilized. We used the grid-search technique to determine
the best SVM parameters. According to [8], despite the fact that the grid search takes
longer (because to the large number of computations), the results are more accurate and
readily accessible [23]. [8] shows that the grid search method takes the values of M and
N for C and γ , which the combination of M*N (C and γ ). It then proceeds with the training process and estimates the accuracy rate, when the highest rate in M*N combination
of (C and γ ) will be considered as the optimum parameter. The grid search technique
gives high accuracy rate however it rich in its computational time. For it has the independent parallel processing of each and every training in SVM algorithm, it becomes the
advantage of grid search technique in the SVM algorithm. Next is the kernel parameter
selection. Kernel parameters selection is performed by using the 10-fold cross validation
The Effect of Kernel Functions on Cryptocurrency Prediction
323
process. The kernel parameters are then chosen. The 10-fold cross validation procedure
is used to determine kernel parameters. The cross-validation procedure is well-known
for being an efficient technique for choosing parameters for machine learning algorithms
to prevent overfitting [24] but it is computationally costly. This will be the first step in
the SVM’s experimental setup, selecting the parameters that are most suitable for the
SVM before constructing the forecasting model.
As stated in Sect. 3.1, this study investigated four different SVM kernels. The goal
was to find the best kernel for classifying the data and to create a well-defined hyperplane
for separating different sets of data. The data may be separated in each of these cases. In
this case, SVM wants to soften the border in order to separate as many data as possible.
Four different kernels as mentioned in the Sect. 3.1. Initially, we use four kernel functions,
however, the polynomial function takes longer to train the SVM and performs worse in
the pilot study than the RBF. As a result, since it has a simple structure and a high
degree of generalization, the RBF function is used as the kernel function of SVMs in
this research [2–4, 6, 7, 20, 25]. The grid search method was utilized to find the best
RBF classifier parameters for softening the margin [3, 8, 26–28].
The optimum RBF classifier parameters are determined by adjusting the width of
the SVM-RBF classifier with the parameters, constant C and epsilon, ε which governs
the margin of classification. This is also signified as the hyper parameter tuning. SVM
hyperparameter tuning entails defining parameters that do not change throughout the
learning process. The aim of this search was to identify the optimum pair of parameters
during the in-sample phase to maximize out-of-sample accuracy to the greatest extent
feasible. Both parameters in R had default values of “1” for parameter C and “0.5” for
parameter ε. The parameter tuning process starts with tuning of functions using the grid
search method, which takes the value of parameters, the supplied parameter ranges, C
and γ ., in this paper, the value of the cost function, C and epsilon,ε ranges between 0–1
and will take steps of 0.1, while for cost function from 0–9 and will take the exponential
steps of 2. Figure 1 depicts the constant C and epsilon, ε values used in this study, which
will be tested on the 9 datasets and 2 kernel functions. The parameter C was not changed
at the conclusion of our effort. Instead, it stayed constant since, after we adjusted it for
the optimum sigma value for the RBF kernel, further modifying the parameter C would
have resulted in a softer margin for classification, resulting in a sluggish response of
the classifier (keeping the classification rate oat 1 or 0 for a long period of time). This
involves a search across the hyper-parameter space, training the models, and evaluating
predictions for each possible combination of hyper-parameter values in order to identify
the best set of values. This is followed by the process of re-tuning the SVM parameters.
The training set will be used in this tuning process, and the outcome will be the best model
from the tune process. The mean absolute error (MAE), mean squared error (MSE), root
mean squared error (RMSE), are used to assess, and compare the performance of the
collection of parameters.
324
N. A. Hitam et al.
Hyper Parameter
Epsilon,
Cost,
OpƟons
0, 0.1, 0.2,0.3, …., 0.9, 1.0
1, 2, 4, 8, 16, …., 512
Fig. 1. Hyper parameters tuning
Figure 2 depicts the suggested approach’s flowchart. The suggested method consists
of nine stages. As shown in [9, 16, 18], data is first collected from appropriate sources.
Using 10-fold cross-validation, the datasets are then partitioned into two independent
portions, the training and testing sets. The second step is to normalize all of the data sets
into SVM predictor variables such that they have a ‘0’ zero mean and a variance of unity.
This is done to prevent predictor variables with larger numeric ranges overwhelming
those with lower numeric ranges in the calculation. The third step is to use 10-fold crossvalidation on the training set to determine the best values of (C, ε, kernel parameters).
The training data is randomly partitioned into 10 equal-sized subgroups for 10-fold
cross-validation. In the fourth step, one of the 10 subsets is retrained as validation data
for testing the model, while the other nine are utilized as training data. C and ε searching
range have been selected as shown in Fig. 1. In step five, each value of the pair value of C
and ε has been tested. The cross-validation procedure is performed ten times, with each
of the ten subsets serving as the validation data precisely once. Then, 10 folds’ findings
were averaged to create a single estimate. Steps six and seven include selecting the double
(C and ε, kernel parameters) that results in the lowest cross-validation to train the training
set and produce the forecasting model. The forecasting model was used in step eight
to predict the cryptocurrency and Forex price in the test subset, and it is followed by
step nine, which compares and assesses the forecasting model’s performance using the
three-performance metrics, MAE, MSE, and RMSE.
The Effect of Kernel Functions on Cryptocurrency Prediction
Training Set
Testing Set
Standardize predictor variables to
have zero mean
New Training Set
New Training Set
Kernel Parameter Selection
Cross-Validation (Equation (3)(6)
Hyper Parameters Tuning (C, ε,
kernel parameters)
Grid Search
Train New Training set with the
optimized parameters to obtain
the SVM Forecasting Model
Forecast cryptocurreny using
SVM Forecasting Model
Calculate MAE, MSE, RMSE
(Equation (7)-(9)
Compare and Evaluate
Performance
Fig. 2. Flowchart of the SVM-RBF-Kernel model for cryptocurrency forecasting
325
326
N. A. Hitam et al.
4 Results and Discussion
A set of performance measurements based on regression model accuracy metrics are
used to assess the forecasting model’s measurement [29]. Choosing and using a range
of forecasting techniques is very beneficial to investors. It allows for comparisons to be
conducted between various forecasting models. The forecasting model’s performance is
assessed using statistical evaluation metrics such as mean absolute error (MAE), mean
square error (MSE), root mean square error (RMSE), which are among the noteworthy
measures utilized by academics [29–32]. The following are the definitions of these
criteria: n
1
xi − xj i, j = 1, 2, . . . , n
n
(7)
n
2
1
xi − xj i, j = 1, 2, . . . , n
n
(8)
MAE =
i,j=1
MSE =
i,j=1
RMSE =
n
2
1
xi − xj i, j = 1, 2, . . . , n
n
(9)
i,j=1
The greater the forecast accuracy, the lower the values of the three indices. Where:
xi denotes the actual values; x j denotes the prediction values; n denotes the number of
samples. We used five datasets as shown in Table 1. The features of the datasets used in
this paper are depicted in Table 2.
Table 1. Datasets
Instruments
Sample size
Training set
Testing set
Bitcoin
1105
880
218
Dash
1126
880
218
Ethereum
1126
881
218
AUDUSD
783
622
154
USDCAD
781
621
153
Data normalization has been completed for all data sets, as described in Sect. 3.2.
The following formula will be used to normalize all variables to the range [0,1]:
x = (x1− xmin )/(xmax− xmin )
(10)
Where x is the normalization data, xmax and xmin are the maximum and minimum
values in the series data in that order.
The Effect of Kernel Functions on Cryptocurrency Prediction
327
Table 2. Features
No Features
Description
1
Date
Date of the instrument on the trading day
2
Open
Opening price of the instrument on the trading day
3
High
Highest price of the instrument on the trading day
4
Low
Lowest price of the instrument on the trading day
5
Close
Closing price of the instrument on the trading day
6
Sentiment Sentiment polarity of the instrument on the trading
day
7
CCI
Technical indicator of the instrument on the trading
day
The MAE, MSE, and RMSE values for all forecasting models (SVM-Linear, SVMRadial, SVM-Polynomial, and SVM-Sigmoid, respectively) used to predict the cryptocurrency markets of Bitcoin, Dash, and Ethereum, as well as the Forex markets of
AUDUSD and USDCAD, are shown in Tables 3,4,5, and 6.
The results indicate that the optimum C and gamma for the SVM-Linear Kernel
model are 0.42 and 1, respectively, for all datasets in the SVM with a linear kernel
forecasting model. The optimum C, gamma, and epsilon for the SVM-Basis Gaussian
(RBF) kernel forecasting model are 1.0, 0.19, and 0.1, respectively. The optimal C, d, and
gamma for the SVM-Polynomial kernel forecasting model are 1, 1, and 0.1, respectively,
while for the SVM-Sigmoid kernel forecasting model, they are 1, 0.167, and 0.1 for C,
gamma, and epsilon. Furthermore, nearly all MAE, MSE, and RMSE errors are lowest
for SVM-RBF when compared to the other three SVM-Linear, SVM-Polynomial, and
SVM-Sigmoid. Figure 3 depicts the optimum epsilon and cost factor for the SVM-RBF
kernel.
Furthermore, after fitting and tuning all models, the results indicate that the SVM
with RBF kernel model performs the best. Bitcoin, Dash, Ethereum, and USDCAD had
the lowest MAE, MSE, and RMSE among the five datasets tested. While the AUDUSD
has the lowest MAE, MSE, and RMSE. The lowest RMSE value indicates the model’s
ability to generate predictions that are close to the actual value. Among the SVMkernel models, the SVM-Sigmoid model provided the least accurate results, followed
by the SVM-Polynomial and SVM-Linear kernel models. This indicates that, among the
models studied in this research, the SVM-RBF model is the best SVM kernel model for
modelling both cryptocurrency and Forex data (Table 7).
When the optimized SVM kernel models’ results are compared to the benchmark
model’s results, the optimized SVM models outperform all of the benchmark models.
In the case of Bitcoin, the optimized SVM-RBF model with the lowest MAE, MSE,
and RMSE values of 0.0261, 1.48684, and 0.0386 outperformed the best performing
benchmark model. The optimized SVM-RBF model has the lowest MAE, MSE, and
RMSE values for the Dash dataset, which are 1.0440, 5.7901, and 2.4063, respectively,
when compared to its benchmark model, the results of which are shown in Table 6,
328
N. A. Hitam et al.
Fig. 3. Epsilon and cost factor for SVM-RBF kernel
Table 3. SVM-Linear Kernel
SVM-Linear
C
γ
0.2311
0.1276
0.3572
0.42
1
Dash
55.6969
58.8288
76.7000
0.42
1
Ethereum
70.5313
923.8904
96.1192
0.42
1
AUDUSD
0.0020
0.00001
0.0025
0.42
1
USDCAD
0.0025
0.0000
0.0033
0.42
1
C
γ
ε
1.0
0.19
0.1
Metrics
Bitcoin
MAE
MSE
RMSE
Table 4. SVM-Radial Kernel
SVM-Radial Basis Gaussian (RBF)
Metrics
MAE
Bitcoin
0.0261
MSE
1.48684
RMSE
0.0386
Dash
1.0440
5.7901
2.4063
1.0
0.19
0.1
Ethereum
7.0236
11.86161
10.8911
1.0
0.19
0.1
AUDUSD
0.0019
0.000006
0.0025
1.0
0.19
0.1
USDCAD
0.0025
0.0000016
0.0032
1.0
0.19
0.1
The Effect of Kernel Functions on Cryptocurrency Prediction
329
Table 5. SVM-Polynomial Kernel
SVM-Polynomial
Metrics
MAE
Bitcoin
MSE
RMSE
C
d
ε
2.3090
0.1275
0.3570
1
1
0.1
56.3903
605.5746
77.8187
1
1
0.1
Ethereum
7.5450
10.3500
10.2000
1
1
0.1
AUDUSD
0.0020
0.000006
0.0025
1
1
0.1
USDCAD
0.0025
0.00001
0.0033
1
1
0.1
Dash
Table 6. SVM-Sigmoid Kernel
SVM-Sigmoid
Metrics
MAE
MSE
RMSE
C
γ
ε
Bitcoin
20.080
58.710
24.231
1.0
0.167
0.1
Dash
2.114
7.568
2.751
1.0
0.167
0.1
Ethereum
14.713
31.060
17.625
1.0
0.167
0.1
AUDUSD
0.614
0.561
0.749
1.0
0.167
0.1
USDCAD
0.166
0.042
0.206
1.0
0.167
0.1
Table 7. SVM-Benchmark Models.
SVM
Metrics
Bitcoin
MAE
0.0291
MSE
20.1530
RMSE
0.0449
Dash
30.50323
2917.1102
54.010
Ethereum
10.6959
263.2240
16.224
AUDUSD
0.0165
0.0004
0.019
USDCAD
0.0026
0.000012
0.0034
where the MAE, MSE, and RMSE are 30.50323, 2917.1102, and 54.010, respectively.
The same thing is happening with Ethereum, AUDUSD, and USDCAD. Even though
the SVM-Linear beats the SVM-RBF on the AUDUSD dataset, the difference is just
0.02 points. As a result, SVM-RBF is still recognized as the best prediction model in
this study.
330
N. A. Hitam et al.
5 Conclusion
To recapitulate, the study’s goal is to use the SVM and its four kernel functions to get an
accurate forecast of financial instruments, namely the Bitcoin and Forex markets. This
article initially presents an SVM model that uses the rule of SVM generalization ability,
followed by the rule’s determination by optimizing the SVM’s kernel parameters. The
findings show that when the optimum hyper parameters are combined with the sentiment
and the technical indicator, the model produces the least amount of error, demonstrating
the proposed model’s generalizability. The SVM-RBF model is more predictive than the
other models due to an enhanced part of the kernel function. Four kernels are used for
comparison, and they are compared and assessed.
According to the final findings, SVM-RBF beat other SVM-kernel forecasting models. The variations in the prices of the instruments are also observed to be affected by the
other components, which are the CCI and sentiment data. Further study in SVM with
other optimization methods is required in the future to understand the role of kernels
in Computational Intelligence (CI). Correspondingly, since the accuracy rate was influenced by a variety of parameters, future research will focus on constructing forecasting
models that take into account a wider range of time spans and dataset types, as indicated
in the introductory section.
References
1. Tandon, C., Revankar, S., Palivela, H., Parihar, S.S.: How can we predict the impact of the
social media messages on the value of cryptocurrency? Insights from big data analytics,” Int.
J. Inf. Manag. Data Insights 1(2), 100035 (2021)
2. Kim, K.J.: Financial time series forecasting using support vector machines. Neurocomputing
55(1–2), 307–319 (2003)
3. Alali, A.: Application of Support Vector Machine in Predicting the Market’ s Monthly Trend
Direction, pp. 12–22 (2013)
4. Kazem, A., Sharifi, E., Hussain, F.K., Saberi, M., Hussain, O.K.: Support vector regression
with chaos-based firefly algorithm for stock market price forecasting. Appl. Soft Comput.
13(2), 947–958 (2013)
5. Wang, G.L.G., et al.: The performance of PSO-SVM in inflation forecasting. In: 2017 10th
Int. Conf. Intell. Comput. Technol. Autom. 1(1), 259–262 (2016)
6. Panigrahi, S.S., Reader, D.J.K.M.: Epsilon-SVR and decision tree for stock market forecasting, pp. 761–766 (2012)
7. Zhu, J.P., Zhou, L.C., Liu, C.B.: Modeling of fermentation process based on MOACO
and ε-SVM. In: 2009 International Conference on Artificial Intelligence and Computational
Intelligence AICI 2009, vol. 2, pp. 234–239 (2009)
8. Xiao, T., Ren, D., Lei, S., Zhang, J., Liu, X.: Based on grid-search and PSO parameter
optimization for support vector machine. In: Proceedings of the World Congress on Intelligent
Control Automation, vol. 2015-March, no. March, pp. 1529–1533 (2015)
9. Hitam, N.A., Ismail, A.R.: Comparative performance of machine learning algorithms for
cryptocurrency forecasting. Indones. J. Electr. Eng. Comput. Sci. 11(3), 1121–1128 (2018)
10. Siddique, M., Mohanty, S., Panda, D.: A hybrid model for forecasting of stock value of tata
steel using orthogonal forward selection, support vector regression and teaching learning
based optimization. Far East J. Math. Sci. 113(1), 95–114 (2019)
The Effect of Kernel Functions on Cryptocurrency Prediction
331
11. Delimata, P., Suraj, Z.: Hybrid methods in data classification and reduction. Intell. Syst. Ref.
Libr. 43, 263–291 (2013)
12. Yang, Z., Shi, K., Wu, A., Qiu, M., Hu, Y.: A hybird method based on particle swarm optimization and moth-flame optimization. In: Proceedings - 2019 11th International Conference on
Intelligent Human-Machine Systems Cybernetics IHMSC 2019, vol. 2, pp. 207–210 (2019)
13. Chen, R.: Using SVM with financial statement analysis for prediction of stocks. Analysis
7(4), 63–72 (2007)
14. Nahil, A., Lyhyaoui, A.: Stock price prediction based on SVM : the impact of the stock market
indices on the model performance, vol. 21, pp. 91–95 (2017)
15. Zhen, L.Z., Ch, Y., Muda, A.K.: Forecasting FTSE bursa Malaysia KLCI Trend with Hybrid
Particle Swarm Optimization and Support Vector Machine Technique (2013)
16. Hitam, N.A., Ismail, A.R., Saeed, F.: An optimized Support Vector Machine (SVM) based on
Particle Swarm Optimization (PSO) for cryptocurrency forecasting. Procedia Comput. Sci.
163, 427–433 (2019)
17. Qiao, Y., Peng, J., Ge, L., Wang, H.: Application of PSO LS-SVM forecasting model in oil
and gas production forecast. In: Proceedings of the 2017 IEEE 16th International Conference
on Cognitive Informatics and Cognitive Computing (ICCI “CC” 17), pp. 470–474 (2017)
18. Hitam, N.A., Ismail, A.R., Samsudin, R., Ameerbakhsh, O.: The Influence of Sentiments in
Digital Currency Prediction Using Hybrid Sentiment-based Support Vector Machine with
Whale Optimization Algorithm (SVMWOA), pp. 1–7 (2021)
19. Kouziokas, G.N.: SVM kernel based on particle swarm optimized vector and Bayesian optimized SVM in atmospheric particulate matter forecasting. Appl. Soft Comput. J. 93, 106410
(2020)
20. Akay, M.F., Abut, F., Daneshvar, S., Heil, D.: Prediction of upper body power of cross-country
skiers using support vector machines. Arab. J. Sci. Eng. 40(4), 1045–1055 (2015)
21. Lu, Y., Zhu, J., Zhang, N., Shao, Q.: A hybrid switching PSO algorithm and support vector machines for bankruptcy prediction. In: 2014 International Conference on Mechatronics
Control, no. ICMC, pp. 1329–1333 (2014)
22. Shehab, M., Alshawabkah, H., Abualigah, L., AL-Madi, N.: Enhanced a hybrid moth-flame
optimization algorithm using new selection schemes. Eng. Comput. 37(4), 2931–2956 (2020).
https://doi.org/10.1007/s00366-020-00971-7
23. Law, T., Shawe-Taylor, J.: Practical Bayesian support vector regression for financial time
series prediction and market condition change detection. Quant. Financ. 17(9), 1403–1416
(2017)
24. Xu, S., Chan, H.K.: Forecasting medical device demand with online search queries: a big data
and machine learning approach. Proc. Manuf. 39(2019), 32–39 (2019)
25. Lin, X., Tang, Y.: Interbank offered rate forecasting using PSO-LS-SVM. In: Proceedings
- 2015 11th International Confernce on Computational Intelligent and Security CIS 2015,
pp. 26–29 (2016)
26. Yeh, C.-Y., Huang, C.-W., Lee, S.-J.: A multiple-kernel support vector regression approach
for stock market price forecasting. Expert Syst. Appl. 38(3), 2177–2186 (2011)
27. Rauber, T.W., Berns, K.: Kernel multilayer perceptron. In: Proceedings - 24th SIBGRAPI
Conference and Graphics, Patterns and Images, no. August, pp. 337–343 (2011)
28. Long, W., Song, L., Tian, Y.: A new graphic kernel method of stock price trend prediction
based on financial news semantic and structural similarity. Expert Syst. Appl. 118, 411–424
(2019)
29. Castoe, M.: Predicting Stock Market Price Direction with Uncertainty Using Quantile
Regression Forest, no. November (2020)
30. Zeng-min, W.: Application of Support Vector Regression Method in Stock Market Forecasting, no. 3, pp. 1–4 (2010)
332
N. A. Hitam et al.
31. Lahmiri, S.: Minute-ahead stock price forecasting based on singular spectrum analysis and
support vector regression. Appl. Math. Comput. 320, 444–451 (2018)
32. Chanklan, R., Kaoungku, N., Suksut, K., Kerdprasop, K., Kerdprasop, N.: Runoff prediction
with a combined artificial neural network and support vector regression. Int. J. Mach. Learn.
Comput. 8(1), 39–43 (2018)
Comparative Study of Service-Based Sentiment
Analysis of Social Networking Sites Fanatical
Contents
Salisu Garba1(B) , Marzuk Abdullahi2 , Reem Alkhammash3 , and Maged Nasser1
1 School of Computing, Faculty of Engineering, Universiti Teknologi Malaysia,
81310 UTM Skudai, Johor, Malaysia
Salisu.garba@graduate.utm.my, msnmaged2@live.utm.my
2 School of Computer Sciences, University Sains Malaysia, 11800 USM Pulau Pinang, Malaysia
3 English Department, University College, Taraba, Taif University,
P.O. BOX 11099, Taif 21944, Saudi Arabia
Abstract. The proliferation of mobile web services (MWS) for sentiment analysis makes it hard to identify the best MWS for sentiment analysis of social
networking sites’ fanatical contents. This paper carries out a comparative study
of service-based sentiment analysis of social networking sites’ fanatical contents.
This is achieved by cleaning, transformation, and reduction of fanatical contents
from the publicly available social media dataset, and multiple MWS are selected
for comparison using the application programming interface (API) key of the
MWS. To evaluate the service-based sentiment analysis, standard measures such
as accuracy, precision, recall, and f-measures of sentiment result for each MWS
are used. The result shows that Dandelion SA performs better in terms of accuracy (72.5%) and recall (76.9%), while Wingify SA performs better in terms of
precision (88.6%) and f-measure (75.5%), though AlchemyAPI offers the most
crucial elements in analyzing sentiments such as emotion, relevance score, and
sentiment type. The outcomes of this paper will benefit the sentiment analysis service developers, sentiment analysis service requesters as well as other researchers
in the social media fanatical content domain.
Keywords: Sentiment analysis · Mobile web service · Social media · Fanatical
contents
1 Introduction
In modern society, social networking sites (SNS) have become an integral platform for
interaction between people across the world. SNS like Twitter and Facebook are widely
used for sharing and accessing all sorts of content such as personal points of view, an
emotion about certain topics, etc. [1]. These SNS has undoubtedly generated a massive
amount of data in the form of tweets, status updates, posts, reviews, and comments which
contain a lot of fanatical content. Fanatical contents are normally shared by individuals
with extreme political or religious views, particularly those who advocate illegal, violent,
or other extreme action [2].
© The Author(s), under exclusive license to Springer Nature Switzerland AG 2022
F. Saeed et al. (Eds.): IRICT 2021, LNDECT 127, pp. 333–342, 2022.
https://doi.org/10.1007/978-3-030-98741-1_28
334
S. Garba et al.
One of the global scenarios of fanaticism is about how religion has been widely
blamed for violence [3]. With the rise of issues on fanaticism, there need to control the
rate of users expressing or disseminating fanatical rage on SNA. It is also important to
counter this kind of threat to maintaining the wellbeing of societies across the globe.
As such, Natural Language Processing (NLP) techniques such as sentiment analysis are
used to identify fanatical contents from the SNS to create awareness among society as
it has established quite an active online presence nowadays [4]. SA deals with many
challenges through NLP because it is a difficult task. It has been proven in the study
made by [2], that it is extremely challenging to study the text effectively at an arbitrary
level of detail as outlined in the definition, and not to forget, most of the data gathered
are subjective.
A lightweight software system designed to support interoperable machine-tomachine interaction across a network with an interface described using adaptable protocols, RESTful description, smaller message formats popularly known as Mobile Web
Service (MWS) are now used for SA [5, 6]. There are various choices of MWS, each has
its specialty that help researchers in identifying sentiment [7]. However, not all MWS
offer the same functions. Some may just allow a user to check the sentiment polarity of
a text without being able to view the confidence score. Thus, in this case, it should be
stressed that SA should not only aim to achieve sentiment polarity from data but also
to discover the most accurate result generated by the MWS. The proliferation of MWS
for sentiment analysis makes it hard to identify the best MWS for sentiment analysis of
SNS fanatical contents.
Based on the existing research, not many researchers have studied MWS for SA. In
rare cases, [7] compared 15 different web services specialized in sentiment analysis of
three types of datasets which is from large movie dataset, Twitter dataset, and Amazon
product review dataset. However, the comparative analysis of MWS for SA focused
more on two datasets (movie and product review) instead of MWS for SA of fanatical
contents in SNS. Knowing that SNS is widely used nowadays, the idea of extracting data
from it is acceptable as it gives different accuracy results when tested in different MWS.
Therefore, the focus of this research is to see how accurate each MWS is in generating
sentiment results by comparing its mean square error. For the least mean square error, a
value that is closer to zero will indicates a better result [8].
In this study, data is gathered from two social networking sites (Twitter and Facebook) for service-based sentiment analysis to identify fanatics-related content. multiple
MWS designs for SA such as MonkeyLearn, Semantria, ParallelDots, Text2Data, etc.
are selected for comparison using the application programming interface (API) key of
the MWS. Standard measures such as accuracy, precision, recall, and f-measures, are
used to evaluate the service-based sentiment analysis so as to find the best MWS for
analyzing sentiment on social networking sites’ fanatical contents.
As a contribution, this paper presents an extensive and deeper critical evaluation of
the main functionalities of six SA-related MWS. This research will help in proving the
best MWS in terms of giving an accurate result of SA. Moreover, it will enable other
researchers to have sufficient information on the capabilities of these MWS and helps
them to choose the most suitable one to be used for their specific purposes especially
in analyzing sentiment related to serious issues like fanatism so as to create awareness,
Comparative Study of Service
335
stimulate big techs and policymakers to control this issue from wide-spreading around
the world. The remaining of the paper is organized as follows. In Sect. 2, the related works
are discussed. In Sect. 3, the methodology is presented. The results and discussions are
presented in Sect. 4. Finally, the conclusions and future recommendations are given in
Sect. 5.
2 Related Work
This section reviews various works related to this research. These include social media
fanatical content, sentiment analysis, and mobile web service.
2.1 Fanatical Contents Sentiment Analysis
Over the years, social networking sites such as Twitter, Facebook, and other discussion
forums are abused by fanatics, radicals, extremists, propagandists, etc. to share and promote hate speech, offensive comments, religious ambiguity with deceptive intentions,
manipulated political and social views [1]. Researchers from different domains e.g.
sociology, data science, and software engineering, etc. are continually creating tools to
help individuals, societies, big techs, and policymakers battle and conquer these issues
of manipulation, radicalization, etc. from wide-spreading around the world [4]. Subsequently, SNS sentiment analysis and automatic detection of fanatical contents is a
significant issue for peace and security. Sentiment Analysis (SA), also called Opinion
Mining aims to analyze the sentiments, opinions, attitudes, and emotions of individuals
towards subjects, products, individuals, organizations, and services [9–11]. SA involves
the classification of sentiment text into classes such as positive, negative, and neutral.
There are numerous researches related to sentiment analysis of social networking
sites’ fanatical contents. For example, [6–8] highlighted the use of lexicon-based and
machine learning approaches. A piece of a text message is represented as a bag of words
in a lexicon-based approach. Following this representation of the message, all positive
and negative words or phrases within the message are assigned to either dictionary-based
sentiment values or corpus-based sentiment values. Moreover, [2, 4] experimented with
models such as the unigram model, a feature-based model, and a tree kernel-based model
to classify sentiment analysis on Twitter data where combining prior word polarity with
their Part of Speech (POS) tags play an important role in a classification task. It’s also
observed that POS can be assigned to an input sequence word based on POS tag from
relevant words in relevant training sequence identified using global semantic information.
2.2 Web Service-Based Sentiment Analysis
Several authors have recognized the importance of web service-based sentiment analysis
[7, 8, 13, 14]. These software systems designed to support interoperable machine-tomachine interaction known as Mobile Web Service (MWS) are now used for SA and the
capabilities of MWS in examining the accurate result in analyzing sentiment is the key
performance indicator for determining the quality of service. According to [7], document
level SA was proven as the most used feature among all levels of SA. In this features,
336
S. Garba et al.
the various task is provided including three different classifications of sentiment which
is positive, negative, and neutral. Compared to the other features that mostly provide
only positive and negative classes, the document level SA deals with tagging individual
documents to find sentiment polarities with three different classes. Therefore, in this
research, only MWS that offers document-level SA and polarity will be considered.
Several researchers have used different techniques in evaluating the capability of
MWS in terms of accuracy and polarity of sentiment. For example [7, 8, 14] focus on
analyzing the capabilities of MWS to classify and score various texts with regards to the
sentiments in it. most of the MWS uses various categorization of SA techniques which
are machine learning approach and lexicon-based approach, dictionary-based lexicon
approach, and corpus-based lexicon approach. The corpus-based approach in [7, 8, 14]
mainly relies on a sentiment lexicon and has statistical and semantic techniques which
measure a perceived meaning of an object that led to a result of sentiment analysis. These
researches focused on three different datasets which were from large movie reviews,
Twitter, and Amazon product reviews.
Despite the many contributions of [1–3, 7, 8, 12–14], the comparative analysis of
MWS for SA focused more on very few MWS that does not consider sentiment polarity
of a text. Given that SNS like Twitter and Facebook are widely used for sharing fanatical
contents by individuals (fanatics, radicals, extremists, propagandists, etc.) with extreme
political or religious views, particularly those who advocate illegal, violent, or other
extreme action [1, 2], there is a clear lack of focus on fanatical contents and only focused
on one dataset from SNS which is Twitter, while the other two datasets are from movie
and product review. Because of these shortcomings, the idea of a comparative study of
service-based sentiment analysis of social networking sites’ fanatical contents is very
motivating and important. The focus of this research is to see how accurate each MWS
is in generating sentiment results.
3 Methodology
The methodology used in conducting the comparative study of service-based sentiment
analysis of social networking sites’ fanatical contents comprises of four stages (data
collection, data pre-processing, service-based sentiment analysis, and comparison of
service-based sentiment analysis). The four stages are explained in Sect. 3.1, 3.2, 3.3,
and 3.4 respectively.
3.1 Data Collection
Datasets from social networking sites (Twitter and Facebook) provide a large data for
service-based sentiment analysis of fanatical contents, therefore, tweets and posts gathered from Twitter [15] and Facebook [16] are used as our benchmark data. Concerning
the first collection of datasets (from Twitter), the tweets contain a lot of opinions that
were expressed by different users. The second collection of datasets (from Facebook)
did not show much difference from the first collection except for the longer length of
sentences. Both of it contains neutral opinion as well as positive and negative opinion.
However, to assess the performance of MWS, only a few documents from the whole
Comparative Study of Service
337
datasets will be used. All the datasets were extracted based on the list of keywords that
are associated with fanatical content.
3.2 Data Pre-processing
Pre-processing of dataset helps in preparing the raw data that has been gathered for
the service-based sentiment analysis of social networking site fanatical contents. These
involve text cleaning, white space removal, expanding abbreviation, stemming, stopping
words removal, negation handling, etc. [3, 15, 16]. The processed dataset is further
used for feature extraction to compute the polarity of the sentence which is useful in
determining opinion. The RStudio provides an ability to pre-process data. Therefore,
RStudio is used for cleaning, transformation, and reduction of fanatical contents from
the publicly available social media dataset.
3.3 Service-Based Sentiment Analysis
Several MWS for sentiment analysis are chosen for the comparative study of servicebased sentiment analysis of social networking sites’ fanatical contents [7, 8, 14]. Considering that the document level SA deals with tagging individual documents to find
sentiment polarities with three different classes (positive, negative, and neutral), ten
MWS (DeepAI SA, AlchemyAPI, Lymbix SA, Musicmetric, Twinword SA, Semantria,
ParallelDots SA, Dandelion SA, Wingify, and Sentimetrix) are selected from the programmableweb.com. Popularity, ease of use, and the maximum amount of data that each
MWS can handle are used as the basis for selecting the ten MWS for sentiment analysis.
Mobile Web Service (MWS) bringing about convenience and simplicity in accessing
web service through mobile devices. The sentiment analysis service provider publishes
its services to the local registry. A service request is sent to the local registry. The communication between the request and the response is carried out through API. Lightweight
protocols such as kXML2, kSOAP2, are adapted to overcome the significant overhead
of the original SOAP implementation. Figure 1 shows the overview of MWS communication architecture. The MWS is called through the API after authentication and the
dataset is parsed after which the MWS functionality is applied to obtain the SA result.
Fig. 1. Overview of MWS communication architecture.
338
S. Garba et al.
3.4 Performance Evaluation of the Mobile Web Services
The performance of each MWS is measured by accuracy, precision, recall, and f- measure. Accuracyis the level of closeness between sentiment polarity obtained from the
MWS and the actual value of the sentiment polarity, the accuracy is calculated using
Eq. 1. Precision is used to measure the level of correctness of the sentiment analysis
results generated by each MWS, the precision is calculated using Eq. 2. The recall is
used to measure the ability of each MWS to find sentiment polarities with three different
classes (positive, negative, and neutral) within the dataset, the recall is calculated using
Eq. 3. F-measure is the harmonic mean or weighted average of the precision and recall.
The F-measure is calculated using Eq. 4. Four classifications are used to measure the
performance of each MWS. These are True Positive (TP), False Positive (FP), False
Negative (FN), and True Negative (TN).
Accuracy =
TP + TN
TP + TN + FP + FN
(1)
TP
(TP + FP)
(2)
Precision =
Recall =
F-Measure = 2 ∗
TP
(TP + FN )
(3)
Precision ∗ Recall
Precision + Recall
(4)
4 Results and Discussions
The performance of each MWS is obtained after experimental evaluation. The evaluation
results are based on four criteria (accuracy, precision, recall, and f-measure). Table 1
presents the results of the comparative study of service-based sentiment analysis of social
networking sites fanatical contents. The MWS with good accuracy are Dandelion SA,
Twinword SA, AlchemyAPI, and Lymbix SA which has an accuracy of 72.5%, 69.2%,
63.4%, and 62.8% respectively.
Looking into the overall result for each MWS in Table 1 below, the MWS with a good
precision are Wingify, Sentimetrix, Musicmetric, and Dandelion SA which has a precision of 88.6%, 82.4%, 75.2%, and 67.3% respectively. The MWS with a good recall are
Dandelion SA, Twinword SA, Lymbix SA, and Semantria which has a recall of 76.9%,
70.5%, 68.2%, and 67.6% respectively. The MWS with good accuracy are Wingify,
Dandelion SA, AlchemyAPI, and Sentimetrix which have an accuracy of 75.5%, 71.8%,
65.9%, and 65.5% respectively.
Comparative Study of Service
339
Table 1. The performance of each mobile web service for SA.
MWS
Accuracy
Precision
Recall
F-measure
DeepAI SA
0.614
0.560
0.597
0.578
AlchemyAPI
0.634
0.672
0.647
0.659
Lymbix SA
0.628
0.615
0.682
0.647
Musicmetric
0.527
0.752
0.531
0.622
Twinword SA
0.692
0.591
0.705
0.643
Semantria
0.619
0.571
0.676
0.619
ParallelDots SA
0.562
0.510
0.564
0.536
Dandelion SA
0.725
0.673
0.769
0.718
Wingify
0.591
0.886
0.658
0.755
Sentimetrix
0.571
0.824
0.543
0.655
Dandelion SA presents the highest accuracy result with 72.5%. It also computes the
highest results in recall as shown in Fig. 2. Dandelion SA might seem the best MWS to
classify positive text. This is because it gives the highest amount of positive sentiment
among all MWS. Moreover, the amount of negative classified sentiment from Dandelion
SA is the lowest. Wingify SA presents the highest precision result with 88.6%. It also
computes the highest results in f-measure. Dandelion SA might seem the best MWS to
classify both positive text and negative text. This is because it provided a better level of
correctness in terms of positive sentiment and negative sentiments among all the MWS.
AlchemyAPI gave a comparable number for all the four criteria (accuracy, precision,
recall, and f-measure) as shown in Fig. 1 and Fig. 2. It portrays a balance in terms of
reviews of positive (precision and recall) and f-measures. Though it’s limited when
compared with other MWS such as Dandelion SA, Wingify. On average, Twinword SA,
and Sentimetrix also gives a good result during testing as it appears as the second-best
group of MWS (after Wingify and Dandelion SA) in terms of the four evaluation criteria.
While ParallelDots SA and DeepAI SA perform slightly less than their counterpart in
terms of service-based sentiment analysis of social networking sites fanatical contents.
Based on the analysis of the results, it is noticeable that all the MWS do offer a
slightly higher than average result for an accurate polarity (positive, negative, or neutral) especially for service-based sentiment analysis of social networking sites fanatical
contents. Contrary to what has been stated in [2, 7, 8, 14], it is proven that ParallelDots
SA and Twinword SA are the most widely used MWS that classify both short and long
text. While ParallelDots SA and Wingify show the best accuracy and precision respectively. However, when working with larger text, all the MWS have shown no problem
in performing sentiment analysis. Despite the ironic nature of fanatical content in social
networking sites, which could be regarded as very difficult to detect, it is noteworthy the
fact that all the MWS can perform reasonably well. And lastly, it is essential to say that
artificial intelligence-based MWS like DeepAI SA might hold the key for service-based
340
S. Garba et al.
sentiment analysis of social networking sites’ fanatical contents given the trajectory of
AI successes (Fig. 3).
Fig. 2. The accuracy and recall of the service-based SA.
Fig. 3. The precision and f-measure of the service-based SA.
5 Conclusion and Future Work
This presented a comparative study of service-based sentiment analysis of social networking sites fanatical contents. To ease the selection of the most suitable MWS for
fanatical contents sentiment analysis, ten MWS are selected for comparison using the
application programming interface (API) key of the MWS, while the datasets from social
networking sites (Twitter and Facebook) provide a large data for service-based sentiment analysis of fanatical contents is used as our benchmark data. Despite the ironic
nature of fanatical content in social networking sites, which could be regarded as very
difficult to detect, overall, the results demonstrate that Dandelion SA has the highest
accuracy (72.5%) and recall (76.9%) results. While Wingify SA presents the highest
precision (88.6%) and f-measure (75.5%) result. The outcomes of this paper will benefit
the sentiment analysis service developers, sentiment analysis service requesters as well
Comparative Study of Service
341
as other researchers in the social media fanatical content domain. The future work aims
at exploiting the non-functional correlation between the MWS for sentiment analysis
service developers to further improve the precision and accuracy as close to 100% as possible. Moreover, it is essential to explore artificial intelligence-based MWS like DeepAI
SA which might hold the key for service-based sentiment analysis of social networking
sites’ fanatical contents given the trajectory of AI successes.
References
1. Adek, R.T., Bustami, Ula, M.: Systematics review on the application of social media analytics
for detecting radical and extremist group. IOP Conf. Ser. Mater. Sci. Eng. 1071(1), 012029
(2021)
2. Asif, M., Ishtiaq, A., Ahmad, H., Aljuaid, H., Shah, J.: Telematics and Informatics Sentiment
analysis of extremism in social media from textual information. Telemat. Inform. 48, 101345
(2020)
3. Karampelas, P., Bourlai, T., Surveillance, C., Wei, Y., Singh, L.: Detecting users who share
extremist content on twitter. In: Karampelas, P., Bourlai, T. (eds.) Surveillance in Action,
pp. 351–368. Springer, Cham (2018). https://doi.org/10.1007/978-3-319-68533-5_17
4. Kursuncu, U., et al.: Modeling islamist extremist communications on social media using
contextual dimensions: Religion, ideology, and hate. In: Proceedings of the ACM HumanComputer Interaction, vol. 3, no. CSCW (2019)
5. Garba, S., Mohamad, R., Saadon, N.A.: Web service discovery approaches for dynamic mobile
environment. Int. J. E-Serv. Mob. Appl. 13(4), 16–38 (2019)
6. Garba, S., Mohamad, R., Saadon, N.A.: Search space reduction approach for self-adaptive
web service discovery in dynamic mobile environment. In: Saeed, F., Mohammed, F., Gazem,
N. (eds.) IRICT 2019. AISC, vol. 1073, pp. 1111–1121. Springer, Cham (2020). https://doi.
org/10.1007/978-3-030-33582-3_104
7. Serrano-guerrero, J., Olivas, J.A., Romero, F.P., Herrera-viedma, E.: Sentiment analysis: a
review and comparative analysis of web services. Inf. Sci. (NY) 311, 18–38 (2015)
8. Basmmi, A.B.M.N., Abd Halim, S., Saadon, N.A.: Comparison of web services for sentiment analysis in social networking sites. In: IOP Conference Series: Materials Science and
Engineering, vol. 884, no. 1, p. 12063 (2020)
9. Alam, M., Abid, F., Guangpei, C., Yunrong, L.V.: Social media sentiment analysis through
parallel dilated convolutional neural network for smart city applications. Comput. Commun.
154, 129–137 (2020)
10. Sawarn, A., Gupta, M.: Comparative analysis of bagging and boosting algorithms for
sentiment analysis. Procedia Comput. Sci. 173, 210–215 (2020)
11. Atoum, I.: A novel framework for measuring software quality-in-use based on semantic
similarity and sentiment analysis of software reviews. J. King Saud. Univ. Comput. Inf. Sci.
32(1), 113–125 (2020)
12. Ferrara, E.: Contagion dynamics of extremist propaganda in social networks. Inf. Sci. (NY)
418–419, 1–12 (2017)
13. Khan, H.U., Peacock, D.: Possible effects of emoticon and emoji on sentiment analysis web
services of work organisations. Int. J. Work Organ. Emot. 10(2), 130–161 (2019)
14. Gao, S., Hao, J., Fu, Y.: The application and comparison of web services for sentiment analysis
in tourism. In: 12th International Conference on Service Systems and Service Management
(ICSSSM), pp. 1–6 (2015)
15. Pak, A., Paroubek, P.: Twitter as a corpus for sentiment analysis and opinion mining. In:
Proceedings of the 7th International Conference on Language Resource Evaluation Learning
2010, pp. 1320–1326 (2010)
342
S. Garba et al.
16. Ortigosa, A., Martín, J.M., Carro, R.M.: Sentiment analysis in Facebook and its application
to e-learning. Comput. Hum. Behav. 31(1), 527–541 (2014)
Networking and IoT
An Overview on LoRaWAN Technology
Simulation Tools
Mukarram A. M. Almuhaya1,2(B) , Waheb A. Jabbar1,3 , Noorazliza Sulaiman1 ,
and A. H. A. Sulaiman1
1 Faculty of Electrical and Electronic Engineering Technology, Universiti Malaysia Pahang,
26600 Pekan, Pahang, Malaysia
almohia82@yahoo.com, waheb@ieee.org
2 Sana’a Community College (SCC), Sana’a, Republic of Yemen
3 Centre of Software Development and Integrated Computing, University Malaysia Pahang,
26300 Gambang, Pahang, Malaysia
Abstract. Low-Power Wide Area Networks (LPWAN) technologies are playing
a pivotal role in the IoT applications owing to their capability to meet the keys
IoT requirements, i.e., long-range, low cost, small data volumes, massive devices
number, and low energy consumption. The creation of new public and private
LoRaWAN networks necessitates the use of avoiding node limits and collision
prevention measures. Designers of IoT systems confront difficulty in determining the scalability of a given technology, with an emphasis on unlicensed frequency bandwidth (ISM) transmission in densely populated locations. However,
picking the best simulation software might be a challenge. To provide a conceptual overview of seven LoRaWAN simulation tools, this paper outlines their key
characteristics and the sorts of experiments they support. LoRaWAN simulators,
resource utilization, and performance evaluation are all covered in-depth in this
report. Furthermore, we classify and compare the most important simulation tools
for investigating and analyzing LoRa/LoRaWAN network emulators that have
been developed recently. This article will be used to help other researchers decide
whether LoRaWAN simulation tool is best for their specific requirements.
Keywords: IoT · LPWAN · LoRa · LoRaWAN · LoRa simulation tools
1 Introduction
The LoRa is LPWAN technology which acquiring increasing attention from both
academia and industry. To provide connectivity to a wide field of IoT devices, it is ideal for
a low-power wide-area network’s internet requirements(LPWAN). Chirp Spread Spectrum (CSS) modulation establishes a distinct radio layer from other types of wireless
networks that use other modulations. Due to its high sensitivity, the LoRa CSS modulation allows for indoor transmissions with a range of several kilometres.[1]. To connect
to the network server, the LoRaWAN device needs to be awakened and immediately
transmits a packet to the network server through the gateway. This is similar to how
ALOHA works [2]. The LoRaWAN systems that are spreading to various architectures
© The Author(s), under exclusive license to Springer Nature Switzerland AG 2022
F. Saeed et al. (Eds.): IRICT 2021, LNDECT 127, pp. 345–358, 2022.
https://doi.org/10.1007/978-3-030-98741-1_29
346
M. A. M. Almuhaya et al.
are becoming increasingly complex, heterogeneous and pervasive. As such, it has proved
difficult to research and design such systems. The lack of suitable modelling and simulation platforms to provide an end-to-end depiction of Connected IoT devices, i.e. from
the basic IoT end-nodes to the cloud application and the fundamental networking infrastructure [3, 4]. Maximum node count constraints and collision avoidance algorithms
are critical in the creation of new public and private LoRaWAN networks. The simulators mentioned in this article are used to model these issues. LoRaWAN techniques
are equally important to model topological networks. The main challenges facing computer simulation environments are algorithms that support the positioning of gateways
in combination with radio range modelling in urban environments. To assist practitioners and researchers overcome these challenges we propose this work as comparing
between the commonly used LoRa/LoRaWAN simulation tools by highlighting their
capabilities and features for enabling researchers to select the most suitable simulator
based on their needs and programming skills. The platforms can model heterogeneous
LoRa nodes (sensors, gateways, network servers, and so on) with quite well details
(mobility, energy profile, scalability, and so on), diverse application logic and network
connectivity models, as well. The proposed work is distinct from the existing literature, presents a comparative review of a selected seven driving LoRaWAN Simulators
LoRaSim, NS3, Cupcurpon, FloRa, SimpleIoTSimulator and Mbed simulator, and gives
a rundown of the most popular LoRa MAC network simulators and highlighted their
most important features.
The rest of this paper is organized as follows: in Sect. 2, we exhibit an overview of
the LoRa/LoRaWAN technology. Then Sect. 3 surveys the available simulation tools to
analyze LoRa/LoRaWAN performance. Discussion of the comparison in Sect. 4. Finally,
we conclude the article in Sect. 5.
2 LoRal/LoRaWAN
LoRa is a modulation technology patented and acquired by Semtech Corporation in 2012
for wireless communications [5]. LoRa is created to operate on a sub-GHz frequency,
specifically on unlicensed bands such as 915 MHz, 868 MHz, or 433 MHz, in accordance
with the regional area regulations. LoRa is a physical layer based on the Chirp Spread
Spectrum (CSS) modulation, not similar to other modulations which using in other
wireless networks [6]. LoRa was designed to be low-rate, low-power, and transmission
with very long-range in line-of-sight or rural areas situations up to 10 or 20 km for
outdoor, as a result of the higher sensitivity of LoRa CSS modulation, which enabling
long distances connectivity [2]. Its low energy consumption, coupled with long-distance
communication, makes LoRa be one of the potential candidates of LPWAN technologies
for IoT applications [7]. As one of the most significant benefits of LoRa, the great receiver
sensitivity is accompanied by an extremely wide communication connection budget.
When utilizing LoRa modulation, typical values of SNR for 10 and 12 spreading factors
are −20 dB and −15 dB, respectively, resulting in receiver sensitivities of −134 dBm and
−129 dBm, according to the manufacturer. However, these values are only somewhat
equivalent to the average sensitivity of Wi-Fi or Bluetooth receivers, which is typically
in the range of 40 dBm to 80 dBm [6].
An Overview on LoRaWAN Technology Simulation Tools
347
LoRaWAN networks can be generally utilized for fairly dense deployments with
relaxed latency or reliability requirements. LoRaWAN offers many advantages in terms
of low bit rate, power consumption, wide coverage, simplicity, and ease of management.
While the LoRa modulation is proprietary, the LoRaWAN is an open standard being
developed by the LoRa Alliance [8]. Each gateway in LoRaWAN networks receives
messages from numerous end devices directly via a star topology. Transmitters employ
TCP/IP protocols to communicate with network servers over a network connection.
LoRaWAN’s MAC uses Pure-ALOHA as its foundation. The LoRa specification defines
three device classes that the end nodes must operate in, Class A, Class B and Class C.
A LoRaWAN technology architecture defines three fundamental types of devices as
follows [9]:
• End-devices (ED): These are devices that either take downlink (DL) traffic from the
network server or generate uplink (UL) traffic for transmission to the gateways,
• Gateways (GW): These are the devices that demodulate LoRa communication and
transmit it between the network server and the end devices in a wireless network.
Wired or wireless access points link gateways to the Internet. The LoRaWAN Gateway is sophisticated, concurrently listening radio on several channels and delivering
thousands of ENs simultaneously.
• Network Server (NS): The device which serves as the core backend of a LoRaWAN
network, collecting traffic from all end-devices in the network and processing it on
an application server
3 LoRa/LoraWAN Simulator Tools
Computer modelling and simulation is the proper method to enrich the exploration of
systems performance and evaluate tactics for its functioning in imaginative or predictive
approaches. A simulation model is a design that considers computing algorithms, physical and mathematical terms, and engineering formulas that summarise the behaviour
and performance of a system’s intangible world case studies. LoRa net-work simulation
is more significant since it can be exploited without costly implementation or before
the actual execution of the framework to design and evaluate a LoRa-based app. The
field of LoRa offers highly specialized and freely available simulation tools. All these
LoRa simulators have been developed and utilized in the literature for examining different LoRa scenarios, however, to the best of our understanding, none of the previous
review studies compared in detail these simulation tools enough. Therefore, an overview
of the most commonly used simulators to investigate Lo-Ra/LoRaWAN performance is
presented in this section.
3.1 LoRaSim
LoRaSim has been developed based on SimPy as a discreet event simulator using
Python to simulate, investigate, and analyze the LoRaWAN network scalability and
collision functionality [10]. LoRaSim includes many Python scripts, the base of them
are namely: loraDir.py, loraDirMulBs.py, directionalLoraIntf.py, and oneDirectionalLoraIntf.py, LoRaWAN.py, LoRaEnrgysim.py. The first script is for a lone gateway
348
M. A. M. Almuhaya et al.
simulation, while loraDirMulBs.py is utilized to emulate several gateways (up to 24).
DirectionalLoraIntf can emulate devices that are equipped with directional antennae
and many networks, whereas oneDirectionalLoraIntf.py is for emulating gateways with
directional antennae and many networks. A radio propagation model is implemented
in LoRaSim depending on the well-known long-distance path loss model. The radio
transceiver sensitivity at room temperature concerning various LoRa SFs and BWs settings is estimated. It also considers many related parameters such as the thermal noise
power across, receiver bandwidth, noise figure, and SNR. Several packages are required
for running LoRaSim smoothly, such as matplotlib, SimPy, and NumPy. LoRaSim offers
a plots view of deployments with no graphical interface, as shown in Fig. 1. In contrast,
it can show a data plot when users execute graphical code. Many improvements for
LoRaSim were proposed to make it multipurpose [11–16] and support downlink due
to the original version supported uplink only; thus, it can test scalability and energy
consumption, and other matric performance. Many of the information is seen on the
command line and exported to File-Name.dat, which can show its content data using
other graphical programs such as Gnuplot, seaborn, Mplot, or others.
Fig. 1. LoRaSim network topology deployment
3.2 Ns-3
Ns-3 is an open-source discrete-event network simulator that was initiated in mid-2006
[17, 18] and is still under heavy development now, written by C++ and Python. The
ns3 simulator supports a wide variety of protocols such as Wi-Fi, LTE, IEEE 802.15.4,
SigFox, LoRa, further networks and also implements an IP networking, supports both
simulation and emulation using sockets that aim to academic and research [19]. The ns-3
can be executed with pure C++, and some simulation components can be written with
An Overview on LoRaWAN Technology Simulation Tools
349
Python. It is designed to be modular and can function in both graphical and commandline interfaces netanm for C++ and PyViz for Python. It also produces pcap tracks that
can be used to debug. Standard software such as Wireshark [20] can be used to read trace
files for network traffic analysis. The ns-3 offers a practical and well-structured setting
with animation support using NetAnim, as shown in Fig. 2. A LoRaWAN Module was
developed and implemented in ns-3 to provide a powerful tool for enabling the simulation
of a real LoRaWAN network instead of simulating a simplified MAC protocol. This addon module allows the research community and developers to more understanding of the
behaviour of physical and MAC layers in LoRa networks. Credits to the LoRaSim that
allows the users to test a network with varying SFs based on gateway feedbacks.
Fig. 2. This is Ns3 NetAnim environment
The LoRaWAN ns-3 module may be used to simulate LoRaWAN networks, and it is
available for download here. Beyond the models created to represent different components of the network and the integrated helpers used to set them up, the ns-3 LoRaWAN
module includes a packet tracker that can be used to monitor network behaviour and
analyze its performance. It also includes facilities for storing the network topology in a
file to debug and monitor. It also provides many scenarios as an example of simple to
complex network use cases. The integrated LoRaWAN module meets the requirement of
Class A devices. That means it can simulate the use cases where devices send uplinks and
receive downlinks from the server. In comparison to LoRa’s two other available classes
(Class b and Class C), the most power-efficient end-devices is this class. To deliver a
highly configurable, agile solution, the physical layer, MAC layer, and transport and
use are built. Concerning the LoRaWAN-based ns-3 module’s primary features, they are
installation of the network server, ADR, confirmed messages and support for multi-GW.
Configurability of the LoRaWAN ns-3 module proposed and allows new algorithms
to be implemented on the server-side in [21]. Also, the investigational evaluation of
LoRaWAN conducted by ns-3 in [22], Improving LoRa performance with CSMA [23],
350
M. A. M. Almuhaya et al.
the power consumption model [24], scalability analysis model for significant-scale [19]
and several of models in [25–29].
3.3 FloRa
Framework for LoRa (FloRa) simulator was developed to evaluate LoRa networks performance using ADR mechanism. It proved the effectiveness of ADR in increasing the
PDR with improving energy efficiency. FLoRa is an end-to-end simulation framework
for LoRa networks rely on the OMNeT++ network simulator and also utilizes INET
system components [30]. An open-source OMNeT++ library was designed to support
the experimentation process for various network protocols. FloRa code is created by
C++, and it enables the development of LoRa networks that support the integration of
LoRa nodes, gateways, and network server modules. Application logic can be implemented as separate modules that are linked to a network server. The network server
and nodes support dynamic configuration parameters controlling via the ADR and considering collisions and capture effect. The module includes an accurate modelling of
the backhaul network and can simulate multiple gateways. At the end of the simulation, energy consumption statistics can be collected in each node and over the entire
network [31]. Besides, the modules of the LoRaWAN MAC protocol strive to simulate
the physical layer [32]. This offers a very strong graphical interface as opposed to the
other simulation applications since it is based on OMNeT++ and a graphical network
description. The developed simulation module includes a sample scenario in the FLoRa
simulations directory. The scenario has several features to simulate a network with ten
nodes that are placed randomly in a square network topology with one gateway that is
linked to a network server. Each node transmits a packet at a time based on an exponential distribution with a defined mean. For simulating a LoRa network, several parameters
Fig. 3. FLoRa environment [30]
An Overview on LoRaWAN Technology Simulation Tools
351
need to be selected, such as simulation time and warm-up period, SF, the transmission
power for each LoRa end-node, backhaul network configuration, and links. The simulation statistics and tracing files are generated on completion of the run. The simulation
statistics can be viewed through the OMNeT++ GUI as in Fig. 3.
3.4 CupCarbon
Carbon is an emerging framework for simulating Smart City and IoT WSNs (SCI-WSN)
[33]. It aims to design, visualise, debug, and validate distributed algorithms for environment observing and data gathering. It is used to simulate various IoT application
scenarios for educational and development scientific projects. In addition, to visually
explain the basic concepts of WSNs, it also supports the testing of different wireless
topologies, protocols, and applications. CupCarbon supports two simulation environments that enable the design of mobility scenarios (fires and gas scenarios, vehicles and
UAVs, insects) and a discrete event simulation of WSNs and IoT applications. Networks
can be simulated via an ergonomic and user-friendly GUI utilizing the OpenStreetMap
framework to deploy sensors clearly on the map. It has a script named SenScript that
enables the programming and configuration of sensor nodes individually and generates
codes to be used in hardware platforms like Arduino, Raspberry Pi, and XBee. The nodes
can be configured dynamically to distribute nodes into individual networks.
CupCarbon supports the calculation of energy consumption and displays it as a
function of the simulation time. Such functionality permits clarification of network
structure and realistic implementation before real deployments. It integrates propagation
visibility with interference models and supports different communication interfaces,
including, LoRa, Wi-Fi and ZigBee protocols [34]. CupCarbon is the fundamental kernel
of the PERSEPTEUR ANR project aimed at developing algorithms for the accurate
simulation of signal transmission in a 3D city area [35]. The ground elevation model
Fig. 4. CupCarbon environment
352
M. A. M. Almuhaya et al.
can be imported into a CupCarbon project by Google Elevation API [36]. Many recent
studies were utilized CupCarbon to analyze LoRa/LoRaWAN performance [34, 37, 38].
CupCarbon offers several objects which are easy to use and easy to customize [39].
CupCarbon offers a multi-agent simulation environment that enables simulations to be
conducted and events and adjustments over time to be tracked and allows the reproduction
of a 3D environment consist of a floor, buildings, and different objects such as sensor
nodes as illustrated in Fig. 4.
3.5 PhySimulator
PhySimulator was used as a link level assessment for LoRa, which shows that, although
theoretical consideration is that spreading factors can be considered orthogonal, LoRa
has a real problem with inter-spread factor collisions [5]. The objective of the PHY
Simulator is to enforce LoRa’s relation level. MATLAB writes PhySimulator. The purpose of the simulator shall test the reception of two LoRa transmissions interfering with
various diffraction variables [40]. In particular, each spread factor output is influenced
by the packet, symbol, and bit error rate that interfered with some other spread factor.
The user can use this simulator to edit several parameters (change the values of the
variables codes). For instance, bandwidth, payload, and maximum tests can be modified
per phase, etc. Unable to alter all these factors via a graphical interface, the user must
edit them directly by changing the MATLAB code. Field test and Capacity simulation
of LoRaWAN in a seaport area conducted in [41], An Effective Algorithm for Vehicular
Ad-Hoc Network Load Balancing in [42], smart city [43], Realistic Network Planning
[44], latest update by H.Mroue called it LoRa+ [45].
3.6 SimpleIoTSimulator
Many popular IoT protocols are supported by SimpleIoTSimulator like (MQTT, MQTTSN, MQTT Broker, HTTP/s client/server, Modbus Over TCP, BACnet/IP server, LoRa
device, LoRa gateway). LoRa Device simulator part supports the Class A, B and C
devices specifications and communicates produced LoRa frames (PHY Payload) over
UDP to one or more associated LoRa Gateways. It promotes both Over-the-Air Activation (OTAA) and Over-the-Air Activation (ABP) for security key configuration, as
illustrated in Fig. 5. When talking to certain gateways, signal strength, signal-to-noise,
and channels can be specified [46]. The loading of data can be adjusted to display various
sensor behaviour. LoRa Gateway is sent to a designated LoRa Network Server to receive
LoRa frames (PHYPayload) from LoRa devices via UDP, encapsulated into Semtech
UDP Packet Forwarder (Gateway Message Protocol-GWMP) or Semtech Basic Station
(WebSockets) packets. Upon receipt of Network Server messages, downstream the frame
payload is extracted and forwarded over UDP to the corresponding device.
An Overview on LoRaWAN Technology Simulation Tools
353
Fig. 5. SimpleIoTSimulator environment
3.7 Arm Mbed OS Simulator
The simulator is available in two versions: an online version that runs entirely within the
browser and an offline version that can be used with any Mbed OS 5 project, as illustrated
in Fig. 6. The online Mbed Simulator is the simplest. Running the simulator offline on
any Mbed OS 5 project is also possible [47]. This makes it possible to incorporate the
simulator into your development process. LoRa alliance supports this simulator. The
simulator employs a bogus LoRaWAN radio driver in order to run the LoRaWAN stack.
Fig. 6. Arm Mbed OS simulator
354
M. A. M. Almuhaya et al.
When the LoRaWAN stack tries to drive the radio, the counterfeit radio intercepts the
packet. This is low enough to encrypt only the packets, data rate, and frequency. This
data is then sent directly to a LoRaWAN network server that isn’t actually a LoRaWAN
device. This method performs well because bidirectional data, recognitions and OTAA
all come together [47].
4 Discussion
We compare the features of the considered simulators in this section to come out with a
useful conclusion about the preferences of each simulator. The operating system support,
the type of license, interface, the availability of energy usage statistics, and the simulator
programming language or environment, latest version, and update are among the feature’s
comparison in Table 1.
All simulators are discrete events and support the LoRaWAN protocol and can model
the network as a cycle of discrete events in the time domain. This authorizes the simulators to switch to the next event if two consecutive events do not change, so the system
does not need to be monitored continuously. Regarding the languages of programming
used in Simulators’ implementation, all simulators are designed on well-known, supportive community programming environments. This is very important as a specialist
can quickly extend the capability of the simulator with the implementation of new modules as extensions for the existing simulators (e.g., enhance new network protocols,
incorporation of further tools in the current environment).
In brief, Java is used for CupCarbon implementation; C++ is used for FloRa; Matlab
is used for PhySimulator, Python is used for LoRaSim, and the C++ and Python implementation are used for the Ns-3 LoRaWAN module. In contrast to other simulators,
CupCarbon via 2D and 3D environment, FLoRa via OMNeT++, and Ns-3 via NetAnim
and PyViz have a broader graphical GUI for C++ and Python module, respectively.
Whereas Only a few plots offer PhySimulator and LoRaSim, MATLAB, and Pychrom
environments in that order. All of the simulators studied were published in the scientific
community, and according to the official websites of each simulator: CupCurbon, FloRa,
and PhySimulator have more than two related publications, but PhySimulator has been
updated by another version named LoRa+. Whilst Module ns-3 includes more than 20
related publications, and LoRaSim has 11 related publications according to the SCOPUS database, the last update was in Nov 2020, but some simulator has many extended
versions with different names, not included in these statistics. The ns-3 is nevertheless
an open-source project with a large, large community supporting it [18]. The module
ns-3 and LoRaSim have more publications in comparison to PhySimulator, CupCurbon, and FloRa. Therefore, some of the simulators provide more detailed details on the
installation process and the use of the equipment on their websites. All of them are open
source, and GitHub provides their codes. Whiles SimpleIoTSimulator [46] and Arm
Mbed Simulator [47] are more technical using but haven’t enough publication projects
in spite of the Arm Mbed simulator being adopted by LoRa alliance.
An Overview on LoRaWAN Technology Simulation Tools
355
Table 1. Lora simulators comparison.
Features
LoRaSim
NS-3
Flora
CupCarbon
SimpleIoTSimulator
Mbed
PHY Simulator
Simulator
License type
Source is open
Source is open
Source is
open
Free
(education)
Not Free
Free
Free
Operating
macOS, Linux,
Linux, Windows,
Linux,
macOS
Linux: RedHat,
Windows.Mac
MacOS,
system
Windows
Ubuntu, CentOS
os,
Linux
Windows
Installation
SimPy, NumPy,
Import all library
OMNeT++
n/a
Online,
Matlab
requirements
matplotlib
online
6 and
INET 4.3.1
Type
Python
C++, Python
C++
Java
C++
Java
MATLAB
Only plot
Yes
Yes
2D/3D with
yes
Yes
Only plot
Windows,
macOS
Java
MbedCLI
Python 2.7,Git
language
GUI
OSM
Community
support
Limited
Very good
Limited
Good
limited
LoRa allaince
Good
Last update
2020
October 2020
Nov 2020
2020
2019
May 2019
2020
Last version
n/a
ns-3.32
6.0
3.8
n/a
n/a
n/a
Popularly
High
High
medium
Little
Rarely
High
High
Studies
achieved by
[10, 12, 14, 48–56]
[19, 21–29, 57, 58]
[30, 32]
[34, 36–39]
n/a
n/a
[41–45, 59–62]
simulators
5 Conclusions
In the networking and communication environment, simulation has proved an important
tool to evaluate new solutions. However, the simulator must provide an environment similar enough to the re-created environment to produce realistic results and evaluate those
solutions appropriately. There are multiple simulators on LoRaWAN, but each has different features that can be tailored to specific assessments. The paper provides a conceptual
review of seven LoRaWAN simulators, LoRaSim, NS3, Cupcurpon, FloRa, SimpleIoTSimulator and Mbed simulator. This paper provides a conceptual assessment. The only
open-source emulation tools and the most popular in the academic area are LoRaSim,
NS3, the Physimulator compared to the other three simulation tools, which are more
techniques used. Unlike the basic implementation, the simulators provided in this work
add new features to the MAC sublayer that are not available in the basic version. They
have been published and are written in a variety of programming languages. To achieve
this, there is no need to construct complex real-world networks or sophisticated testbeds.
The results of a study that included a review of the literature and research using current simulators revealed that open-source programming environments are capable of
modelling the vast majority of MAC layer mechanisms in a LoRaWAN network.
Acknowledgement. This study was supported by the Universiti Malaysia Pahang (www.ump.
edu.my), Malaysia, under the Post Graduate Research Scheme PGRS200340.
356
M. A. M. Almuhaya et al.
References
1. Mikhaylov, K., Petäjäjärv, J., Hänninen, T.: Analysis of the capacity and scalability of the
lora wide area network technology (2016)
2. Attia, T., et al.: Experimental characterization of LoRaWAN link quality. In: 2019 IEEE
Global Communications Conference (GLOBECOM) (2019)
3. Salama, M., Elkhatib, Y., Blair, G.: IoTNetSim: a modelling and simulation platform for
End-to-End IoT services and networking, pp. 251–261 (2019)
4. Piechowiak, M., Zwierzykowski, P.: Simulations of the MAC Layer in the LoRaWAN
Networks. J. Telecommun. Inf. Technol. (2020)
5. Hornbuckle, C.A.: Fractional-N synthesized chirp generator. Google Patents (2010)
6. Semtech, SX1272/3/6/7/8: LoRa Modem Designer’s Guide (2013). www.semtech.com
7. Bouguera, T., et al.: Energy consumption model for sensor nodes based on LoRa and
LoRaWAN. Sensors 18(7) (2018)
8. Augustin, A., et al.: A study of LoRa: long range & low power networks for the Internet of
Things. Sensors 16, 1466 (2016)
9. Raza, U., Kulkarni, P., Sooriyabandara, M.: Low power wide area networks: an overview.
IEEE Commun. Surv. Tutor. (2017)
10. Bor, M., et al.: Do LoRa Low-Power Wide-Area Networks Scale? (2016)
11. Farooq, M.O., Pesch, D.: Poster: extended LoRaSim to simulate multiple IoT applications in
a LoRaWAN. In: EWSN (2018)
12. Farooq, M., Pesch, D.: Extending LoRaSim to simulate multiple IoT applications in a
LoRaWAN (2018)
13. Zorbas, D., et al.: Optimal data collection time in LoRa networks—a time-slotted approach.
Sensors 21(4), 1193 (2021)
14. Abdelfadeel, K., Farrell, T., Pesch, D.: How to make firmware updates over LoRaWAN
possible (2020)
15. Zorbas, D., Kotzanikolaou, P., Pesch, D.: TS-LoRa: time-slotted LoRaWAN for the industrial
Internet of Things. Comput. Commun. 153, 1–10 (2020)
16. Abdelfadeel, K.Q., et al.: FREE—fine-grained scheduling for reliable and energy-efficient
data collection in LoRaWAN. IEEE Internet Things J. 7(1), 669–683 (2020)
17. Henderson, T.R., et al.: ns-3 project goals. In: Proceeding from the 2006 Workshop on ns-2:
the IP Network Simulator (2006)
18. Simulator, N.: https://www.nsnam.org/. Accessed Nov 2020
19. Abeele, F.V.D., et al.: Scalability Analysis of Large-Scale LoRaWAN Networks in ns-3. IEEE
Internet Things J. 4(6), 2186–2198 (2017)
20. Bilalb, S.M., Othmana, M.: A performance comparison of network simulators for wireless
networks. arXiv preprint arXiv:1307.4129 (2013)
21. Reynders, B., Wang, Q., Pollin, S.: A LoRaWAN module for ns-3: implementation and
evaluation. In: Proceedings of the 10th Workshop on ns-3 - WNS3 2018, pp. 61–68 (2018)
22. Khan, F.H., Portmann, M.: Experimental evaluation of LoRaWAN in NS-3. In: 2018 28th
International Telecommunication Networks and Applications Conference (ITNAC), pp. 453–
460 (2018)
23. To, T., Duda, A.: Simulation of LoRa in NS-3: improving LoRa performance with CSMA.
In: 2018 IEEE International Conference on Communications (ICC) (2018)
24. Finnegan, J., Brown, S., Farrell, R.: Modeling the energy consumption of LoRaWAN in
ns-3 based on real world measurements. In: 2018 Global Information Infrastructure and
Networking Symposium (GIIS) (2018)
25. Stellin, M., Sabino, S., Grilo, A.: LoRaWAN networking in mobile scenarios using a WiFi
Mesh of UAV gateways. Electronics 9(4) (2020)
An Overview on LoRaWAN Technology Simulation Tools
357
26. Hariprasad, S., Deepa, T.: Improving unwavering quality and adaptability analysis of
LoRaWAN. Procedia Comput. Sci. 171, 2334–2342 (2020)
27. Finnegan, J., Farrell, R., Brown, S.: Analysis and enhancement of the LoRaWAN adaptive
data rate scheme. IEEE Internet Things J. 7(8), 7171–7180 (2020)
28. Khan, F.H., Jurdak, R., Portmann, M.: A model for reliable uplink transmissions in LoRaWAN.
In: 2019 15th International Conference on Distributed Computing in Sensor Systems (Dcoss),
pp. 147–156 (2019)
29. Finnegan, J., Brown, S., Farrell, R.: Evaluating the scalability of LoRaWAN gateways for
class B communication in ns-3. In: 2018 IEEE Conference on Standards for Communications
and Networking (IEEE CSCN) (2018)
30. Mariusz Slabicki, G.P., Di Francesco, M.: https://omnetpp.org/download-items/FLoRA.html
Accessed 2020. 2017
31. site., F.o., FLoRa. 2020
32. Mariusz Slabicki, G.P., Di Francesco, M.: Adaptive Configuration of LoRa Networks for
Dense IoT Deployments by OMNet++ (FLORA) simulator (2018)
33. Cupcarbon., Cupcarbon. http://cupcarbon.com. Accessed 2020
34. Lopez-Pavon, C., S. Sendra, Valenzuela-Valdés, J.F.: Evaluation of CupCarbon network
simulator for wireless sensor networks. Netw. Protoc. Algorithms 10(2), 1–27 (2018)
35. Cupcarbon. Cupcarbon User Guide (2020). https://cupcarbon.com/cupcarbon_ug.html
36. Lounis, M., et al.: 3D Environment for IoT Simulation Under CupCarbon Platform (2017)
37. Sanchez, E.B., Sadok, D.F.H.: LoRa and LoRaWAN protocol analysis using cupcarbon. In:
Mata-Rivera, M.F., Zagal-Flores, R., Barria-Huidobro, C. (eds.) WITCOM 2020. CCIS, vol.
1280, pp. 352–376. Springer, Cham (2020). https://doi.org/10.1007/978-3-030-62554-2_26
38. John, A., Ananth Kumar, T., Adimoolam, M., Blessy, A.: Energy management and monitoring
using iot with cupcarbon platform. In: Balusamy, B., Chilamkurti, N., Kadry, S. (eds.) Green
Computing in Smart Cities: Simulation and Techniques. GET, pp. 189–206. Springer, Cham
(2021). https://doi.org/10.1007/978-3-030-48141-4_10
39. Mehdi, K., et al.: CupCarbon: a multi-agent and discrete event wireless sensor network design
and simulation tool (2014)
40. Croce, D., M.G., Mangione, S., Santaromita, G., Tinnirello, I. (2018). http://lora.tti.unipa.it/
41. Bardram, A.V.T., et al.: LoRaWan capacity simulation and field test in a Harbour environment.
In: 2018 Third International Conference on Fog and Mobile Edge Computing (Fmec), pp. 193–
198 (2018)
42. Abbas, A.H., Audah, L., Alduais, N.A.M.: An efficient load balance algorithm for vehicular ad-hoc network. In: 2018 Electrical Power, Electronics, Communications, Controls and
Informatics Seminar (EECCIS) (2018)
43. Yu, F.H., Zhu, Z.M., Fan, Z.: Study on the feasibility of LoRaWAN for smart city applications.
In: 2017 IEEE 13th International Conference on Wireless and Mobile Computing, Networking
and Communications (Wimob), pp. 334–340 (2017)
44. Dalela, P.K., Sachdev, S., Tyagi, V.: LoRaWAN network capacity for practical network
planning in India. In: 2019 Ursi Asia-Pacific Radio Science Conference (Ap-Rasc) (2019)
45. Mroue, H., et al.: LoRa+: An extension of LoRaWAN protocol to reduce infrastructure costs
by improving the Quality of Service. Internet Things 9, 100176 (2020)
46. SimpleSoft. SimpleIoTSimulator (2019). https://www.simplesoft.com/SimpleIoTSimulator.
html. Accessed 23 Jun 2021
47. Lab, M. Mbed Simulator (2019). https://os.mbed.com/blog/entry/introducing-mbed-simula
tor/. Accessed 23 Jun 2021
48. Farooq, M.O., Pesch, D.: Evaluation of multi-gateway LoRaWAN with different data traffic
models. In: 2018 IEEE 43rd Conference on Local Computer Networks (LCN) (2018)
49. Hassan, K.: Resource Management and IP Interoperability for Low Power Wide Area
Networks (2020)
358
M. A. M. Almuhaya et al.
50. Abdelfadeel, K., Cionca, V., Pesch, D.: A Fair Adaptive Data Rate Algorithm for LoRaWAN
(2018)
51. Bor, M., Roedig, U.: LoRa transmission parameter selection. In: 2017 13th International
Conference on Distributed Computing in Sensor Systems (DCOSS) (2017)
52. Voigt, T., et al.: Mitigating inter-network interference in LoRa networks (2016)
53. Bor, M., King, A., Roedig, U.: Lifetime bounds of wi-fi enabled sensor nodes. Procedia
Comput. Sci. 52, 1108–1113 (2015)
54. Bor, M., Roedig, U.: OpenCL as wireless sensor network programming abstraction (2014)
55. Ta, D.-T., et al.: LoRa-MAB: a flexible simulator for decentralized learning resource allocation
in IoT networks, pp. 55–62 (2019)
56. Ta, D., et al.: LoRa-MAB: toward an intelligent resource allocation approach for LoRaWAN.
In: 2019 IEEE Global Communications Conference (GLOBECOM) (2019)
57. Reynders, B., et al.: Improving reliability and scalability of LoRaWANs through lightweight
scheduling. IEEE Internet Things J. 5(3), 1830–1842 (2018)
58. Magrin, D., Centenaro, M., Vangelista, L.: Performance evaluation of LoRa networks in a
smart city scenario thesis. in book. (2017)
59. Tomic, I., et al.: The limits of LoRaWAN in event-triggered wireless networked control
systems. In: 2018 Ukacc 12th International Conference on Control (Control), pp. 101–106
(2018)
60. Croce, D., et al.: Impact of LoRa imperfect orthogonality: analysis of link-level performance.
matlab. IEEE Commun.s Lett. 22(4), 796–799 (2018)
61. Gucciardo, M., Tinnirello, I., Garlisi, D.: Demo: a cell-level traffic generator for LoRa
networks. matlab. ACM (2017)
62. Marini, R., Cerroni, W., Buratti, C.: A novel collision-aware adaptive data rate algorithm for
LoRaWAN networks. IEEE Internet Things J. 8(4), 2670–2680 (2021)
Applying a Lightweight ECC Encryption
in Multi-topology Sensor Networks to Enhance
Intelligent IoT Low-Cost Transportation
Platforms Security Based on CoAP Constrained
Protocol
Salma Ait Oussous1(B) , Mohammed Yachou1 , Sanaa El Aidi1 , Siham Beloualid1 ,
Taoufiq El Harrouti2 , Abdelhadi El Allali1 , Abderrahim Bajit1 , and Ahmed Tamtoui3
1 Laboratory of Advanced Systems Engineering (ISA), National School of Applied Sciences,
Ibn Tofail University, Kenitra, Morocco
{salma.aitoussous,yachou.mohammed,sanaa.elaidi,siham.beloualid,
abderrahim.bajit}@uit.ac.ma
2 Department of Computer Science, Logistics and Mathematics (ILM) Engineering Science
Laboratory, National School of Applied Sciences, Ibn Tofail University, Kenitra, Morocco
taoufiq.elharrouti@uit.ac.ma
3 Laboratory of Advanced Systems, National Institute of Posts and Telecommunications, SC
Department, Mohammed V University, Rabat, Morocco
tamtaoui@inpt.ac.ma
Abstract. Currently, road traffic has experienced an expansion of de- mand due
to a significant increase in the vehicle fleet, which has caused an environmental
nuisance due to the existing transport systems (congestion, pollution, travel time).
Efforts have been made to overcome this problem, and electric mobility was one of
the solutions via the insertion of the tramway in the interurban transport mode, but
this mode could not be generalized on the whole network of the agglomeration for
reasons of infrastructure and lack of financial means for the investment. Our work
consists in proposing a mode of transport aiming at the minimization of transport
cost and the optimization quality of the environment. Moreover, planning and
modeling transportation systems must focus on reducing greenhouse gas emissions
and promoting the deployment of emissions and renewable energy. To do this, we
developed a synchronized, secure IoT platform that consists of an all-electric
multimodal urban transportation network including road and streetcar networks,
with a green energy source powering the charging stations. It is used to guide the
MBE to take the shortest path with the maximum number of people and avoid
stops as much as possible, by proposing 3 approaches to find the suitable one in
terms of execution time and memory consumption. We also studied the impact of
multi-topologies on the functioning of our platform, and to achieve this work, we
used the CoAP protocol and a security method Elliptic Curve Cryptography ECC,
the obtained results show the performance of the proposed strategy.
Keywords: Traffic vehicular parc Cost transportation IoT · Intelligent
transportation · CoAP constrained IoT protocol · Star/Tree/Cluster- Tree/Mesh
© The Author(s), under exclusive license to Springer Nature Switzerland AG 2022
F. Saeed et al. (Eds.): IRICT 2021, LNDECT 127, pp. 359–370, 2022.
https://doi.org/10.1007/978-3-030-98741-1_30
360
S. Ait Oussous et al.
sensor network topologies · RSA-SHA256/AES-SHA256 · Elliptic Curve
Cryptography ECC
1 Introduction
Given the urban expansion that Rabat-Sale has experienced, which has caused an
increased demand for mobility in parallel with an increase in the number of vehicles,
which has environmental nuisance due to the existing transport systems such as congestion transportation systems and pollution as well as the cost of transport [1, 2], we
thought to create an intelligent and secure transportation IoT platform that will work in
an existing environment such as cities without the complexity of integration with the
network or other existing infrastructure. This platform is a model of an electric bus with a
capacity of 50 citizens. Its role is to take the optimal path to minimize emissions of CO2,
power consumption, distance traveled, and transport costs for citizens by applying 3 different approaches, and we will secure our data with ECC and also apply multi- topology
sensor networks to choose the right one. The benefit of star topology is it establishes
central management for network operations and makes it simple to add a new node to
the network. And nodes are depending on the coordinator to transmit messages via the
network [3]. For trees, multiple connected components are grouped in the shape of tree
branches, it creates a natural hierarchy of parents and children because each node can
only have one mutual link [4]. However, mesh doesn’t have a hierarchical relationship,
there is one coordinator and a set of nodes coupled where each node acts as a router,
allowing other nodes to connect to it to ensure the distribution of most transmissions
even when one of the connections goes down [5]. And Cluster-tree is defined in 802.15.4
standards as a simple hierarchical father-child relationship with multiple trees [6].
IoT provides an opportunity for the physical and digital worlds to interact with each
other via sensors and actuators, which play a critical part in the data collection that must
be recorded and processed. On the other hand, data processing can take place at the
network’s edge, on a remote server, or in the cloud. Moreover, the available resources,
which are limited by size, energy, power, and computing capability, limit the storage and
processing capabilities of an IoT device [7]. We also employed artificial intelligence AI,
specifically facial recognition for detection and processing images. AI is important in
IoT, and it is useful for real-time processing, as well as vice versa [8, 9]. In our platform,
IoT has been used to connect camera nodes to the internet, to collect face detections
data about citizens in each station to process and calculate to choose the optimal path,
using different topologies to find the best one in terms of execution time and memory
consumption with and without security layer.
Additionally, we focused on implementing the CoAP protocol which is an IoT web
transfer protocol for communication-based on Representational State Transfer (REST)
and designed for resource-constrained devices on an IP network and with limited devices
in mind [10]. Furthermore, the CoAP’s messages are encoded in a binary format, and its
packets are simple to be processed with less energy consumption [11]. To secure CoAP,
they are many secure protocols, like DTLS and IPsec [12], but to have an efficient
security layer, we added lightweight ECC to study its impact on the functioning of our
platform and compare it with AES-SHA256.
Applying a Lightweight ECC Encryption
361
2 Intelligent Transport Construction and Goals
The goal of this work is to choose the optimal path by detecting the number of people’s
faces in each station, which is in our case a maximum of 50 people, to minimize the
cost, time, and CO2 emissions applying ECC security.
Figure 1 illustrates the architecture of our platform. First, the camera nodes captured
the faces of people in each station, then this data was sent to the webserver via the
CoAP server. Secondly, at the webserver, we calculated the number of faces detected
per station and detected the optimal path that the minibus can take, this path must have
a high density of faces. Moreover, the data flowing between the nodes, the CoAP server,
and the webserver must be secured to guarantee confidentiality, integrity, and availability,
for this we added the ECC security layer. Then, we have studied the impact of topologies
on the functioning of our platform. The images taken by the IoT camera nodes will be
encrypted and sent to the CoAP server, which also sends them to the webserver where
the data will be decrypted for further processing.
Fig. 1. Intelligent and secured transportation IoT platform Architecture based on CoAP protocol.
3 Methodology
An electric bus is supposed to transport 3 categories of people: a driver of a car VP1,
driver and his companion VP2 and driver and his 2 companions VP3. The probability
that a person getting into the MBE belongs to VPk, (k = 1;2;3) is pk. Our payoff is that
the person getting into the MBE is a driver. An elementary probability calculation shows
that: P(driver) = p1 + ½p2 + 2/3p3 .
Let N be the capacity of the MBE, so the number of cars that remained in the
garages is N*P(driver) = Nv . Each car Vj (j = 1;…; Nv ) travels a distance DJ during
one day. Let ns be the number of gasoline-fueled cars, and nd the number of dieselfueled cars (ns + nd = Nv ). Assume we have a fleet of K MBEs, and each MBE makes
αm rounds per day (m = 1;…; K) with a total distance traveled Dm. To cover the hole
transport area, coupling between an MBE and a streetcar is realized. The role of the
362
S. Ait Oussous et al.
MBE is to connect the population living in areas not covered by the streetcar. This
allows extending the coverage of the electric mobility network. A proximity service and
electric mobility via MBE will connect these areas to the tramway network. Several
pick-up scenarios are considered, but the key is to provide the customer with benefits
to motivate people to use this mode of transport, such as travel time, cost, comfort,
and environment. This vehicular infrastructure allows the detection of several people’s
faces from camera nodes, to detect the monitored area and have a high density of faces;
involving search and detection models of vehicular objects and human faces of AI. The
communication between the MBEs and the cameras is realized via an Adhoc network
that allows having direct communication between them to build an autonomous system.
The route of the MBE is between source points and destination points. And our model is
to describe a movement of people from k sources Si (1 ≤ I ≤ k) that serve as pickup/load
stations, to n destinations Sj (1 ≤ j ≤ n) that serve as discharge stations. However, this
movement occurs through an intermediate means which is the streetcar stations (1 ≤ l
≤ p) that serve as (load/unload) transfer points.
To achieve this work with higher security, we added ECC encryption, which implements a discrete logarithm problem that existed several years ago using an elliptic curve
(EC). When it comes to public-key cryptography, there are 2 challenging mathematical difficulties to consider; problems with factors decomposition, and problems with
discrete logarithms [13]. ECC is the process of transferring an existing encryption technique to an EC. It implements digital signatures [14]. And its essence is to use a safe
EC to execute a classical encryption technique. For example, in RSA, they were known
as common modular addition and modular multiplication, but after being transferred to
an EC, they are known as elliptic addition and elliptic multiplication [15]. To build it,
we should choose a safe finite field to make modular addition and multiplication faster.
Background finite fields are comparable for all public-key algorithms (RSA, ECC…).
Researchers are interested in 2 types of finite fields, a finite field of characteristic 2, and a
finite field of a big prime number. It has been proven that EC discrete logarithm problems
are equally tough in mathematics for prime field and finite field of characteristic 2 whose
fields are approximately equal [16]. It’s hard to comprehend the calculation in the finite
field of characteristic 2, which isn’t addition, subtraction, multiplication, or division as
we know them. There are significant distinctions between the two types of finite fields
[17]. For factors, use binary code. Transform into binary integers in one mode, or choose
a base from a mathematical point and utilize bases in the field to represent all factors in
a finite field in another. Different of them are selected by RSA and ECC. Field factors
have distinct representation methods based on different finite fields, which is relevant to
all public key algorithms [18]. Many EC exists, and the secure curves that cryptography
can employ should be chosen. The equation for an EC is known as the EC equation. The
following is the Weierstrass equation in Descartes’ coordinate system: y2 + a1 xy + a3 y
= x 3 + a2 x 2 + a4 x + a6 Prime field equation: y2 = x 3 + ax + b; among 4a3 + 27b2 =
0(modp). And the binary field equation is: y2 + xy = x 3 + ax 2 + b; (a, b ∈ (GF )(2n )),
b = 0 [19].
Applying a Lightweight ECC Encryption
363
4 Related Works
The authors of this study [1] attempted to solve the challenge of optimizing the electric vehicle EV distribution path with various distribution centers. Then, to find EV
distribution paths with high resilience, low susceptibility to uncertainty factors, and
precise route-by-route schemes, the EV distribution path issue must be optimized with
various distribution channels and charging facilities in mind. Based on Bertsimas’ theory of robust discrete optimization, a robust EV distribution path optimization model
with customizable robustness is constructed to minimize transportation time. The model
is additionally solved using an up-graded three-segment genetic algorithm so that the
optimal distribution scheme initially comprises all of the route-by-route data utilizing
the three-segment mixed coding and decoding approach. For the EV distribution path
problem with many distribution centers, this approach evaluated three challenges. The
first step is to choose to identify market areas for each service center; the second is
to determine each distribution center’s delivery sequence; and finally, the distribution
path toward the demand points and returning to the distribution centers is determined.
Secondly, in this research paper [2], a novel autonomous tracking control (ATC) for
intelligent electric vehicles IEVs is created using lane identification and sliding-mode
control to implement precise path tracking and optimal torque distribution between the
motors of IEVs. The camera first ac- quired the road image, which was then processed to
extract the lane markers and determine the needed steering angle using the lateral trajectory and lateral direction tracking errors. After that, an optimal preview linear quadratic
regulator (OP LQR) based on the sliding mode technique with a 2-DOF vehicle model
was presented to accurately track the target path. The marking identification analysis
and optimization results, as well as the traditional three controllers, are obtained and
compared to prove the usefulness of the new OP LQR strategy. The lane marker identification algorithm has a high level of accuracy, according to the results. Furthermore, the
suggested method allows the real path to better track the desired trajectory, and suitable
differential braking torques are distributed among the four wheels. Based on these articles, we came up with the idea of creating a transportation system whose purpose is to
reduce trip time by finding the most efficient route. In this article [20], the authors have
created a solution that is an electric minibus, which allows detecting the optimal path
that MBE will take to reduce CO2, energy consumption, time, and cost of transport, by
detecting the faces of people in each station and applying two approaches, illustrated by
these two algorithms.
For the first approach, the bus drives to all stations until it achieves its 50 personal
capacities, then it transfers to the nearest streetcar station. For the second approach, the
webserver made three tests; for citizens bigger than 50 for 3 stations maximum, or 4
stations maximum, or 5 stations maximum, using AES-SHA256 algorithm. For more
details, check the document mentioned above.
364
S. Ait Oussous et al.
5 The Proposed Approach
The goal of our proposed approach is to meet the same need as the previous ones. Well,
after we get the number of people in each station, we ranked the 3 biggest numbers
MAX1, MAX2, and MAX3. Then, we will apply our test. if MAX1 is greater than the
capacity, it will move to the station with the largest number of people S(MAX1), if
the opposite the sum of the two largest numbers will be calculated. Next, if the sum is
greater than the capacity, it will move to the station with the largest number of people
S(MAX1), Otherwise, the sum of the three largest numbers will be calculated. If the
sum of the three largest numbers is greater than the capacity, it will move to the station
Applying a Lightweight ECC Encryption
365
with the largest number of persons S(MAX1) and S(MAX2), otherwise, it will move to
the station with the largest number of persons S(MAX1) and S(MAX2) and S(MAX3).
Figure 2 and Fig. 3 show three examples of getting the optimal path using our
proposed approach. In the first case (1 station at maximum), the bus becomes full in
station 4, it moves to the nearest station which is S.Tram4. In the second case (2 stations
at maximum), the bus starts from station 2, moving to station 8 where it becomes full,
then it will stop in S.Tram3. And for the last case (3 stations at maximum), the bus starts
from station2, moving to station 4 and in station 8, it becomes full, so it moves to the
nearest station which is S.Tram3.
Fig. 2. Approach’3 optimal path for 1 station or 2 stations at maximum.
366
S. Ait Oussous et al.
Fig. 3. Approach’3 optimal path for 3 stations at maximum.
6 Discussion and Results
The goal of this article is to apply the AES-SHA256 and ECC encryption methods on
our platform, as well as to improve it according to network topologies to examine the
impact of each one on the platform, taking into account that CoAP is a high constraint
protocol, so it’s essential to preserve the power of IoT nodes while also reducing memory
usage and execution time.
The comparative outcomes of the scenario given by our platform are shown in the
following figures (Fig. 4, Fig. 5). When examining the security aspect of the results,
it is evident that AES-SHA256 is more expensive in terms of memory occupation and
execution time, as it takes longer to execute and consumes more memory, as opposed to
ECC, which is more feasible in our case as it has almost no effect on platform performance
while also being a powerful encryption algorithm. Furthermore, ECC does not take a
long time to process, it has excellent performance, it can quickly encrypt and decode a
huge volume of data, and has low resource and memory requirements. When examining
the results of each topology, it is clear that tree topology has the best memory and time
performance when compared to the other topologies.
A tree topology is a hierarchical network structure in which the root node creates
services for client nodes, which then transfer those services to lower-level nodes. Every
level of nodes in this architecture can construct a star network with the nodes it serves.
In this scenario, the tree topology structure inherits the drawbacks of star topology.
Although star topology is a dependable, efficient, and simple to construct and manage
solution, it is only appropriate for components that are close to one another since a long
communication link between the coordinator and the end node means that more power
is required to convey messages. This is the polar opposite of what we’re looking for on
our platform. Even though these two topologies (star and tree) do not consume a lot of
memory and processing time, they are not recommended for IoT platforms, since in this
research area, we need real-time responses without losing data, and if we get to choose
between mesh and cluster-tree, we will choose mesh because it is based on features such
as a network node remaining energy, the number of links, and the proximity between
both the single node’ devices or a node and the focus. This architecture can offer all of
the gains of signal mode synchronization, Quality compatibility by assured segments,
and the ability to build massive networks that cover vast areas.
Applying a Lightweight ECC Encryption
367
Fig. 4. Execution time unsecured and secured by topologies.
Fig. 5. Memory consumption unsecured and secured by topologies.
Moreover, according to the results shown in Fig. 6, we found that the average memory
consumption by AES-SHA256 is higher and the mesh topology consumes less than the
others even it takes more time because of its stronger structure. We made another test
concerning the calculation of the gain of each topology by security in terms of average
368
S. Ait Oussous et al.
Fig. 6. Average memory consumption and execution time by topology & security.
Table 1. Average time execution of the scenario.
Time
Topology
Star
Tree
Mesh
Cluster tree
ECC
20.78
22.15
33.48
26.74
AES
23.93
21.73
35.69
28.84
Unsecured
20.89
23.21
36.18
26.05
Table 2. Average memory consumption of the scenario.
Memory
Topology
Star
Tree
Mesh
Cluster tree
ECC
19.97
17.45
17.68
17.97
AES
20.91
18.67
20.07
20.5
Unsecured
14.29
17.43
18.3
17.37
Table 3. ECC gain table comparing with AES.
Topology
Time
ECC % AES
Memory
ECC % AES
Star
12.70%
4.49%
Tree
−6.81%
6.53%
Mesh
−1.37%
11.90%
9.67%
12.34%
Cluster tree
execution time (Table1) and average memory consumption (Table 2). The results show
that ECC is less consumable of time and memory, but mesh takes more time than the
others. However, for memory, it doesn’t consume much compared to the others. So,
according to Table 3 that represents the ECC gain table compared with AES, we found
Applying a Lightweight ECC Encryption
369
that ECC had benefits over AES, it saves time as well as memory when using different
topologies except in some cases, but in principle, we can say that ECC consumes less
memory and takes less time than others, and since it has a high level of security and
performance, then we can suggest that ECC is a good solution to secure our data.
Based on the results presented in the figures and tables mentioned before, we can
deduce that the use of a mesh topology for this platform is more efficient and reliable
in terms of efficiency and reliability because the connectivity of endpoints makes them
extremely resilient to failures, and there may be different routes among devices in the
system. For security, the setup is secure from any agreement, processing time, and
memory requirement.
7 Conclusion and Perspectives
In this given work, we were able to create a secure intelligent transport IoT platform
and make it more efficient and secure by using CoAP protocol with secure algorithms
for encryption and decryption payloads.
The objective of this study was to apply the AES-SHA256 and ECC encryption
methods on the platform, using different topologies to analyze the impact of each of them
on the platform, to preserve the power of the IoT nodes, in addition to reducing their
memory occupation and execution time. The results obtained assume that the security
with ECC is suitable as well as the mesh topology for our platform.
In future works, we will implement another protocol which is 6lowpan with and
without security layer, to study its impact on the operation of our platform to choose the
best protocol, encryption algorithm, and suitable topology.
References
1. Ma, C., Hao, W., He, R., Jia, X., Pan, F., Fan, J., et al.: Distribution path robust optimization
of an electric vehicle with multiple distribution centers. PLoS ONE 13(3), e0193789 (2018).
In: Xiaosong Hu, Chongqing University, CHINA (2018)
2. Zhang, X., Zhu, X.: Autonomous path tracking control of intelligent electric vehicles based
on lane detection and optimal preview method. Expert Syst. Appl. 121, 38–48 (2019)
3. Pramono, S., Putri, A.O., Warsito, E., Basuki, S.B.: Comparative analysis of star topology and
multihop topology outdoor propagation based on Quality of Service (QoS) of wireless sensor
network (WSN). In: 2017 IEEE International Conference on Communication, Networks, and
Satellite (Comnetsat), pp. 152–157 (2017)
4. Celtek, S.A., Durdu, A., Kurnaz, E.: Design and simulation of the hierarchical tree topology
based wireless drone networks. In: 2018 International Conference on Artificial Intelligence
and Data Processing (IDAP), pp. 1–5 (2018)
5. Reza Permana, I.M., Abdurohman, M., Putrada, A.G.: Comparative analysis of mesh and
star topologies in improving smart fire alarms. In: 2019 Fourth International Conference on
Informatics and Computing (ICIC), pp. 1–5 (2019). https://doi.org/10.1109/ICIC47613.2019.
8985889
6. Ouadou, M., Zytoune, O., Aboutajdine, D., El Hillali, Y., Menhaj-Rivenq, A.: Improved
cluster-tree topology adapted for indoor environment in zigbee sensor network. Procedia
Comput. Sci. 94, 272–279 (2016)
370
S. Ait Oussous et al.
7. Garg, H., Dave, M.: Securing IoT devices and securely connecting the dots using REST
API and middleware. In: 2019 4th International Conference on Internet of Things: Smart
Innovation and Usages (IoT-SIU), pp.1–6, Published 18 April 2019
8. Zhou, J., Wang, Y., Ota, K., Dong, M.: AAIoT: accelerating artificial intelligence in IoT
systems. IEEE Wirel. Commun. Lett. 8(3), 825–828 (2019). https://doi.org/10.1109/LWC.
2019.2894703
9. Barodi, A., Bajit, A., El aidi, S., Benbrahim, M., Tamtaoui, A.: Applying real-time object
shapes detection to automotive traffic roads signs. In: 2020 International Symposium on
Advanced Electrical and Communication Technologies (ISAECT), Proceeding, Morocco,
Kenitra, pp. 1–6 (2020)
10. Bellavista, P., Zanni, A.: Towards better scalability for IoT-cloud interactions via combined
exploitation of MQTT and CoAP. In: 2016 IEEE 2nd International Forum on Research and
Technologies for Society and Industry Leveraging a better tomorrow (RTSI), pp. 1–6 (2016)
11. Naik, N.: Choice of effective messaging protocols for IoT systems: MQTT, CoAP, AMQP
and HTTP. In: 2017 IEEE International Systems Engineering Symposium (ISSE), pp. 1–7
(2017)
12. Kayal, P., Perros, H.: A comparison of IoT application layer protocols through a smart parking
implementation. In: 2017 20th Conference on Innovations in Clouds, Internet and Networks
(ICIN), Paris, pp. 331–336 (2017)
13. Majumder, S., Ray, S., Sadhukhan, D., Khan, M.K., Dasgupta, M.: ECC-CoAP: elliptic curve
cryptography based constraint application protocol for Internet of Things. Wireless Pers.
Commun. 116(3), 1867–1896 (2020). https://doi.org/10.1007/s11277-020-07769-2
14. Alese, B., Philemon, E., Falaki, S.: Comparative analysis of publickey encryption schemes.
Int. J. Eng. Technol. 2(9), 1552–1568 (2012)
15. Bos, J., Kaihara, M., Kleinjung, T., Lenstra, A.K., Montgomery, P.L.: On the security of
1024-bit RSA and 160-bit Elliptic Curve Cryptography. IACR Cryptol. ePrint Arch., Vol.
2009, 389 (2009)
16. Mahto, D., Khan, D.A., Yadav, D.K.: Security analysis of elliptic curve cryptography and
RSA. In: Proceedings of the World Congress on Engineering., Vol I WCE 2016, June 29 July 1, 2016, London, U.K (2016)
17. Shantha, A., Renita, J., Edna, E.N.: Analysis and implementation of ECC algorithm
in lightweight device. In: 2019 International Conference on Communication and Signal
Processing (ICCSP), pp. 0305–0309 (2019)
18. Shaikh, J.R., Nenova, M., Iliev, G., Valkova-Jarvis, Z.: Analysis of standard elliptic curves for
the implementation of elliptic curve cryptography in resource-constrained E-commerce applications. In: 2017 IEEE International Conference on Microwaves, Antennas, Communications
and Electronic Systems (COMCAS), pp. 1–4 (2017)
19. Patel, C., Doshi, N.P.: Secure lightweight key exchange using ECC for user-gateway paradigm.
In: 11th IEEE Transactions on Computers, vol.70, pp. 1789–1803. IEEE Computer Society,
Los Alamitos, CA, USA (2021)
20. Yachou, M., et al.: Applying advanced IOT network topologies to enhance intelligent city
transportation cost based on a constrained and secured applicative IOT CoAP protocol. In: The
International Conference on Information, Communication & Cybersecurity (ICI2C 2021),
(2021)
A Review on 5G Technology in IoT-Application
Based on Light Fidelity (Li-Fi) Indoor
Communication
Yousef Fazea1(B) , Fathey Mohammed2 , and Abdulaziz Al-Nahari3
1 Department of Computer and Information Technology, Marshall University, 1 John Marshall
Drive, Huntington, WV 25755, USA
fazeaalnades@marshall.edu
2 School of Computing, University Utara Malaysia, Kedah Darul Aman, 06010 Sintok, Malaysia
fathey.mohammed@uum.edu.my
3 Department of Information Technology, Faculty of Business and Technology, UNITAR
International University, Petaling Jaya, Malaysia
abdulaziz.yahya@unitar.my
Abstract. Representing a significant advancement over the 4G LTE network, 5G
paves the door for the widespread use of IoT applications. This paper explored
5G technology in IoT applications across indoor communication employing Light
fidelity (Li-Fi) technology. A comparative analysis between Wi-Fi and Li-Fi was
conducted to explore the potential of 5G in IoT applications. Furthermore, by
analyzing the literature related to integrating Li-Fi into the 5G and IoT-application,
the issues and challenges of this integration have also been highlighted. This study
illustrated that combining Li-Fi with 5G and IoT is fascinating area of study, and
it might lead to further research.
Keywords: 5G · IoT · Light Fidelity · Indoor communication
1 Introduction
In recent decades, it has been demonstrated that technologies, such as smartphones, has
risen rapidly and grown with time. Previous studies discovered that with the development
of Fifth Generation (5G) technology into wireless network technology and the entrance
of the Internet of Things (IoT), both technologies have been intriguing, but hard, issues to
study [1]. Although the most intriguing study on this technology is on the 5G Technology
in IoT-Application [2–5], because the main reason for the introduction of 5G is due to
the IoT itself. According to an International Data Corporation (IDC) research global
5G networks will drive 70% of companies to spend $1.2 billion on communication
management services [6]. In the next years, new IoT applications and business models
will necessitate new performance requirements for many IoT devices, such as enormous
connectivity, security, trusted wireless communication coverage, ultra-low latency, ultrareliability, and throughput [7]. To satisfy these needs, future Long-Term Evolution (LTE)
and 5G technologies are projected to introduce new networking interfaces for future IoT
applications [8].
© The Author(s), under exclusive license to Springer Nature Switzerland AG 2022
F. Saeed et al. (Eds.): IRICT 2021, LNDECT 127, pp. 371–384, 2022.
https://doi.org/10.1007/978-3-030-98741-1_31
372
Y. Fazea et al.
Fig. 1. 5G wireless communication relation with IoT concept
IoT in the 5G system would be a major change in future generations. It will pave the
way for new intelligent services and wireless architectures [2]. As most of the sector’s
forthcoming services and applications will need smart cities, IoT has the potential to
play the most important role in guaranteeing this [3], alongside 5G technology for the
wireless infrastructure. As a result, the use of 5G network technology in IoT applications
may pave the way for more advanced technologies in the coming decade. As depicted
in Fig. 1, with the fast development and consideration toward smart technologies, 5G
technology gives the advantage of the ability to merge with IoT services and application.
As a result, there is no denying that the adoption of 5G and IoT will exist in our daily
activities. Challenging of introducing these technologies to the community needs to be
addressed to decrease the gap between the community and the adoption of the new
technologies and precisely the different applications [9]. The requirement of applying
these applications would be the high bandwidth, the accessibility and fast connectivity
of the different devices with less time delay and high throughput is also a challenging
task that require attention for the adoption of 5G and IoT.
This paper organized as follows; Sect. 1 presents the introduction. Section 2 presents
the concept of 5G and IoT. Section 3 presents Li-Fi in 5G based on IoT. Section 4 presents
the issues and challenges. Then the conclusion of the paper is presented in Sect. 5.
2 5G Concepts
The fifth generation, or 5G, wireless network of the next decade promises to make
substantial improvements in service quality, such as greater throughput and reduced
latency [10-12]. Although 5G is a significant advancement over its predecessor, 4G LTE
technology, its deployment is difficult since it is still new and not reliable enough to be
extensively used. The deployment of the upcoming 5G generation is in its early stages,
with a focus on innovative radio access technology (RAT), antenna upgrades, greater
frequency usage, and infrastructure development. However, the transition from 1G to
A Review on 5G Technology in IoT-Application
373
4G technologies has revealed numerous problems in the design of physical and network
structures, as well as their implementation details. Despite all of the limitations of the
present network, 5G has resulted in a significant advancement in cellular technology. 5G
technologies require high bandwidth, which can be reached by using MIMO antenna and
millimeter wave technology, and cellular networks may achieve spectrum effectiveness
by allowing customers to use both licensed and unlicensed frequency bands.
2.1 5G Internet Key Features
5G offers three important features not seen in networks from the previous decade, demonstrating the advancement achieved in wireless technology since 4G. To begin, a tremendous amount of data is generated. According to the International Telecommunication
Union (ITU), there are over 7.5 billion mobile devices in the globe in 2017, with the
number expected to increase to 25 billion by 2020, resulting in ultra-dense networks. As
a result, data volume increased explosively from 16.5 exabytes in 2014 to an expected
500 exabytes in 2020, resulting in a 30-fold growth rate [6]. Second, in order to allow
highly interactive applications, rigorous Quality of Services (QoS) standards, demanding
ultra-low latency and high throughput, are enforced. 5G is presently being standardized,
and among other things, it covers new URLLC services. These are differentiated by the
requirement to promote efficient communication, where successful data transfer can be
ensured at a low failure rate while adhering to low latency limitations, such as 1 millisecond (ms) [13]. Finally, heterogeneous environments must be supported to enable
interoperability of a broad range of user devices such as smartphones and tablets, QoS
standards such as various latency and throughput levels for multimedia applications, network types such as IEEE 802.11 and IoT. As a result, it is apparent that 5G technology
may be a step forward in the network industry.
2.2 Architecture of 5G Network
The 5G infrastructure will be built on cloud technologies, with software-defined infrastructure used in the Software Defined Radio (SDR), radio access network (Cloud
RAN), and core network. Full virtualization of 5G infrastructure network operations
would provide for greater control over service quality, priority, and traffic processing
regulations.
374
Y. Fazea et al.
Fig. 2. 5G architecture (Source: TutorialsPoint)
According to Fig. 2, the 5G architecture consists of components that have already
been utilized and are recognizable to the user. GPRS/Edge, 3G, WLAN, and LTE are
among the technologies and components listed. All of this technology has already been
utilized in communication, such as 1G, 2G, 3G, and 4G, and has now been merged
and unified into a single 5G technology. With this cutting-edge technology, there is no
dispute about the speed, performance, and other benefits of 5G technology for internet
connection.
2.3 Implementation of 5G Towards User Devices
There has been much discussion regarding 5G new radio (NR) for future wireless applications such as connected and driverless cars, ultra-HD (UHD), and 3D video streaming
[14, 15]. The first generation of 5G mobile networks are scheduled to be launched in
the early 2020s. To enable the expansion of millimeter Wave 5G applications, the user
scenario must expand beyond 5G infrastructures and eventually include personal user
devices such as cellular smartphones.
As a result, the article investigated by [14] offers a unique hybrid antenna module
design at millimeter-waves to accomplish spherical beam steering coverage that is structurally and systematically compatible with modern cellular devices. [14] has therefore
utilized the concept of the hybrid antenna module consistently integrating two existing
principles-the AiP (Antenna-in-Package) and AoD (Antenna-on-Display) to guide the
primary lobe of the antenna in the end-fire and broadside direction.
As shown in Fig. 3, this approach finally benefited the majority of user devices.
The implementation of devices such as smartphones may be critical, but it is one of
the most important implementations for next generation smartphones. It also suggests a
strong connection between IoT-applications and 5G wireless networks, with smartphones
serving as ideal gateways.
A Review on 5G Technology in IoT-Application
375
Fig. 3. Hybrid antenna module (Source: [14])
2.4 IoT as Part of 5G Network Wireless Technology
The concept and objective of 5G IoT is to link several device numbers to the similar
network connectivity. Many innovative technologies of 5G wireless such as smart cities,
car internet or Internet of Vehicle (IoV), smart factories, smart agriculture and smart
healthcare are contributing to the IoT movement. It is expected that such a large variety
of smart apps will be enabled with high-speed huge networking under the same roof as
5G wireless communication.
Furthermore, IoT should include low-cost sensors and devices, as well as low-cost
installation expenditures. Concerning the IoT system, roughly 80 billion IoT devices
are expected to be linked across a network, resulting in an increase in the number of
connected applications. Furthermore, because the gadgets are smart and use more power,
charging capacity and battery recovery should be enhanced [16]. Figure 4 shows 5G IoT
network architecture scene diagram.
3 Analysis of Li-Fi in 5G Based on IoT
The Internet of Things is reshaping our daily lives by enabling a plethora of innovative
apps that make use of smart and extremely diverse device settings [7]. Many studies
on challenging problems for 5G and IoT, as well as critical IoT standards, have been
undertaken in recent years. To meet this issue, a complete analysis with a wide variety
of suggestions, as well as critical study and research, is necessary. The most intriguing
study then focused on Light Fidelity (Li-Fi) wireless technology as part of the 5G and
IoT integration.
3.1 Li-Fi Network Technology
According to numerous research [18-21], the wide optical band is a viable alternative
for the deployment of high density and high bandwidth 5G and IoT networks. Li-Fi
will make a far greater contribution to radio frequency (RF) as a signal carrier than
existing technologies. It is an older technology with high data transfer speeds, human
usage protection, and security [22]. Furthermore, combining lighting and communication technologies from the same source reduces infrastructure complexity and energy
376
Y. Fazea et al.
Fig. 4. The 5G IoT network architecture scene diagram (Source [17])
consumption significantly. Li-Fi technology enables new methods of transferring data at
high rates and for a variety of purposes via networks. As a license-free, high-speed, bidirectional, and secure wireless communication, Li-Fi is an additional building element
for fifth generation (5G) mobile networks.
Li-Fi might be one of the most efficient ways of becoming bridges towards both
technologies in assuring the installation or integration of 5G and IoT-applications, such
as smart house technology, that require within-indoor connectivity. Any Li-Fi attocell
network may add wireless power to RF networks that are currently operating without
interference. As a result, Li-Fi attocell networks may cost-effectively expand 5G cellular
systems [23]. In other words, by using Li-Fi wireless technology, interference between
5G modems and any IoT-applications that require a signal to begin the job requested by
the user may be avoided. Figure 5 represents the attocell in heterogenous network.
Light-Fidelity (Li-Fi) pushes visible light communication (VLC) even farther by
utilizing light emitting diodes (LEDs) to comprehend fully networked wireless networks.
As lights transform into Li-Fi attocells for the Internet-of-Things (IoT), 5G, and beyond,
synergies are leveraged, resulting in increased wireless capability [25]. When compared
to femtocell networks, the Li-Fi attocell network has the potential to achieve a 40–
1800 greater area data rate. Furthermore, to attain the same efficiency as a Li-Fi attocell
with Poisson Point Process (PPP) random Access Point (AP) deployment, frequency
reuse of 3, and cell radius of 1 m, the highest femtocell performance will necessitate a
total channel bandwidth of 600 MHz. The Li-Fi attocell network substantially increases
wireless efficiency in all cases when the Li-Fi AP cell coverage is strong, and the extra
theoretical throughput is between 12 and 48 Gbps for the allocated office of 400 m2 .
Finally, the new wireless Li-Fi networking architecture delivers the predicted efficiency
benefits from 5G, and it will provide an infrastructure for the forthcoming IoT owing to
the ubiquitous usage of light emitting diodes.
A Review on 5G Technology in IoT-Application
377
Fig. 5. The attocell in heterogenous network (Source: [24])
Fig. 6. The concept of Li-Fi attocell architecture within indoor communication (Source: [23])
Based on the study examined by [23], Fig. 6 depicts the concept of a Li-Fi Attocell
network. The space is illuminated by a number of light fixtures that offer illumination.
Because each light is powered by a Li-Fi modem or Li-Fi chip, it also serves as an
optical base station or access point. The optical base stations are linked to the core
network through high-speed backhaul connections. The light fixtures frequently contain
an inbuilt infrared detector to relay signals from the terminals [23]. The light fixtures
frequently contain an inbuilt infrared detector to relay signals from the terminals. The
lighting lights are modified at fast rates.
378
Y. Fazea et al.
3.2 Comparative Analysis between Wi-Fi and Li-Fi
As a VLC technology, Li-Fi has succeeded in offering effective speed in wireless communication networks. Because of its resemblance to Wi-Fi, it was given the moniker ‘Li-Fi,’
but instead of radio waves, it communicates using light [26]. The radio frequency band is
typically located between the electromagnetic spectrum of 3 kHz and 300 GHz [18, 19].
However, because of the beneficial connection features, existing wireless technologies
typically employ frequencies below 10 GHz, causing the situation to be nearly exhausted
and unable to satisfy 5G and IoT standards. Furthermore, this band is closely regulated
by both domestic and international agencies. Therefore, when it comes to managing
high data rate transmission, optical wireless networking technologies are a good choice.
According to [20], the diversity of applications will meet the requirement for high 5G
technology services data rates and massive IoT device connectivity.
Fig. 7. The comparative analysis of frequencies for VLC and RF (Source: [27])
According to [28], based on Fig. 7, it was revealed that there were a few important
differences that may offer us a better knowledge of the consequences of Li-Fi deployment. Li-Fi is built with a better and more future-proof basis than Wi-Fi since the visible
light spectrum is 10,000 times wider than the radio frequency spectrum [29, 30]. As a
result, because the frequency is high enough, there is a good chance of transmitting a
large amount of data.
3.3 The Integration of Li-Fi Technologies into 5G and IoT
The application of Li-Fi for IoT has been the topic of the majority of recent related studies,
with most early research addressing the energy-harvesting component of Li-Fi for IoT
nodes or the hybrid operation of Li-Fi with RF [31]. In terms of 5G communication,
service quality criteria such as data rate, latency, power use, and connection number
are quite high. Furthermore, enormous connection is required for the IoT. According to
[18], optical wireless networking technologies like as visible light communication, light
fidelity, optical camera communication, and free space optical communication would be
useful in successfully implementing 5G and IoT. Although the data rate of transmission
in Li-Fi is great, the research of Li-Fi in indoor communication settings revealed that
it is hard due to various issues [32]. The highlighted difficulty was the placement or
A Review on 5G Technology in IoT-Application
379
orientation of the mobile device, which was stated in previous study articles [33-36]
and overreliance on distance [37]. Another source of worry is accurate human motion
modeling; while realistic models of human motion are available, combining them with
complete channel characterization remains difficult [38]. As a result, an enabler to this
problem has been researched. Demirkol et al. [39] proposed the Li-Fi approach, which
is based on off-the-shelf LEDs, as an enabler for IoT in indoor environments. The article
proposes LiFi4IoT, a system that, in addition to connection, provides three important
functions that radio frequency (RF) IoT networks struggle to provide: The device’s
exact location; the ability to provide power since light can extract energy; and intrinsic
protection owing to the propagation characteristics of visible light.
Fig. 8. The system architecture of Li-Fi4IoT (Source: [39])
Based on Fig. 8, the study [39] offers an AP solution consisting of a modulation
technique that, depending on the considered uplink technologies, regulates the intensity
of light of an off-the-shelf LED through the driver and optional receiver modules. The
AP communicates with the LiFi4IoT devices through downlink by varying the intensity
of the light. Furthermore, communication between APs is managed by a Li-Fi controller.
The Li-Fi controller can communicate with the IP network and Radio Access Networks
(RAN), which are required for hybrid motes that incorporate RF and Li-Fi technologies.
Additional features and problems, such as the calculation and technique used to manage
mobile orientation, should be examined to ensure that this enabler is operating effectively. Research papers such as [34, 40] examined an indoor VLC distribution downlink
option including numerous LEDs, where a single LED supplies a single user at any given
time. VLC is a developing technology that can provide illumination and communication
while also increasing energy efficiency by utilizing current lighting infrastructure [41].
Next-generation wireless networks based on VLC methods promise to be much more
interesting when combined with the widespread adoption of energy-efficient light emitting diodes (LEDs) as primary light emitting diodes. Spreading over VLC channels can
be very directed [37], and contact is largely dependent on the availability of links to the
380
Y. Fazea et al.
line of sight (LOS). The depicted model ensures that the problem of mobile orientation
towards the integration of Li-Fi towards 5G and IoT has opened up to various approaches
and ways to assure the integration itself. The equivalent direct current (DC) channel gain
is formulated as:
(γ + 1)ARg
θ
γ
(1)
cos
(φ)
cos(θ
)
h=
2
2π r
Where the LOS distance between the LED and the user is defined as r, ϕ is the luminosity
angle, θ is the angle of incidence, γ = −1/ log2 (cos(Φ1/2)) is the Lambertian order,
Φ 1/2 is the LED’s half-power beamwidth, AR is the detection region of the receiver,
and g is the gain of the optical concentrator given n2 ref/ sin2 () with nref being the
refractive index, and Θ is the FOV angle of the receiver.
1 |x| ≤ 1
Π (x)
(2)
0 |x| > 1
where Π (θ /Θ) indicates that the channel gain is 0 if θ is greater than Θ, or the LED
is beyond the receiver field of view [34]. With the calculation provided, it is possible to
verify that mobile orientation is not an issue in terms of user device consistency while
connection to Li-Fi network.
4 Issues and Challenges
This study area is still available for investigation. Because the majority of the technology
mentioned is still in its early stages, there is little question that there is room for further
research into other methods of improving the implementation and integration of these
technologies. However, because the technology is still recently created’ in the network
and communication fields, there is no doubt that its application might result in potentially
unstable technology, leading to the problem and issue with this technology.
4.1 5G Wireless Initial Issues
Communication networks have grown fast over time and have gotten more sophisticated as network-based applications have proliferated, resulting in a large-scale and
heterogeneous network architecture [6]. Because of the increasing number of users on
mobile wireless networks, a reduction in cell size is necessary to enhance multi-user
capacity in wireless networks [42]. 5G is a more efficient, all-in-one air interface. It
has been designed with the enhanced ability to support next-generation consumer interfaces, enable new implementation models, and deliver new services. However, because
it is young, it may have an unstable condition, which adds to the complexity of this
work. Implementing 5G millimeter-wave (mm Wave) antenna systems within the UE,
according to Junho Park et al. [14], remains one of the most challenging issues due to
smartphone intrinsic features such as tight form factor, limited real-estate, and power
capabilities. Wireless network transmission speed has grown more than 10,000 times in
recent decades, compared to a five-fold growth in battery capacity over the same time
span.
A Review on 5G Technology in IoT-Application
381
4.2 Challenges Faced by IoT
In actuality, because of their significant technological potential and community benefits,
IoT technologies are currently regarded as one of the key pillars of the fourth industrial
revolution [43]. Despite the fact that IoT has been studied extensively in the research area,
the technology cannot avoid the problems that it faces. According to recent publications
[44], IoT has been confronted with difficulties such:
• Standards: Technology conventions, such as network and communication protocols
and data aggregation conventions, are the synthesis of information received from
numerous sensors for activities such as information management, processing, and
storage.
• Integration and Reliability: IoT is growing in a dominant manner. It incorporates
numerous improvements and will ultimately evolve into a convention. This will
offer substantial problems and will necessitate the development of new software and
hardware to enable device connection.
• Connectivity: Connecting many devices would be one of the most difficult issues of
the future of IoT, and this connectivity would most likely reject the existing structure
and the technology connected with it.
• Security: The Internet of Things has raised major security issues, attracting the attention of the world’s various public and private sector businesses. Adding such a large
number of additional hubs to networks and the internet would give a larger venue
for attackers to infiltrate the system, especially at a time when many people are
experiencing the harmful effects of security flaws.
4.3 Limitation Toward Li-Fi
As a new and promising technology, Li-Fi wireless technology could not avoid the
drawbacks that any new and growing technology faces. As an example, the limitations
that Li-Fi may encounter, as agreed by [22, 25, 42], are as follows:
• Light does not travel through things, if an opaque item blocks the receiver, the signal
is instantly turned off.
• It requires a perfect line-of-sight to receive data.
• It is a wireless short-range networking method. It is also highlighted that significant
advancements have been made in data speeds, ranges, and coverage.
• In order to transfer data, the light must be on at all times. This is inefficient and may
be expensive to the user.
• Interference is caused by other light sources, such as sunlight and incandescent lamps.
Most modern Li-Fi devices, however, have solved this limitation since Li-Fi relies
on sensing fast changes in light intensity rather than the gradually changing levels
generated by natural disturbances in daylight or sunshine.
All of the difficulties and obstacles mentioned above arose as a result of this implementation and integration. With such constraints, it is also not a simple path to contribute
to this article. As the issue arose, the integration of IoT and 5G technologies into the
382
Y. Fazea et al.
present network appeared to be unachievable, resulting in one indoor communication.
However, with good Li-Fi architectural planning and component implementation, there
is little question that the difficulties encountered may be resolved.
5 Conclusion
This study offered a review on 5G wireless technology in IoT-applications employing
Li-Fi Indoor Communication. A brief description of the core concept of 5G, as well as
its main features in comparison to its predecessor technology, and the innovative hybrid
antenna module design that is utilized for user devices, has also been stated. Critical
examination of Li-Fi, which is viewed as a viable option for the deployment of 5G
and IoT networks due to greater data transfer than RF, which may open the door to
various ways for securing the integration of the 5G and IoT technologies itself. While
considering a popular technique such as LiFi4IoT, a technique that, in addition to the
indoor VLC distribution downlink model with the calculation to provide consistency
towards the orientation of user devices such as smartphones, is designed to address
issues such as user device movement or mobile orientation that could potentially disrupt
Li-Fi connections. The idea of combining Li-Fi with 5G and IoT is fascinating, and it
might lead to further research and studies.
References
1. Attaran, M.: The impact of 5G on the evolution of intelligent automation and industry digitization. J. Amb. Intell. Hum. Comput. 1–17 (2021). https://doi.org/10.1007/s12652-020-025
21-x
2. Chettri, L., Bera, R.: A comprehensive survey on Internet of Things (IoT) toward 5G wireless
systems. IEEE Internet Things J. 7(1), 16–32 (2019)
3. Borkar, S., Pande, H.: Application of 5G next generation network to Internet of Things. In:
2016 International Conference on Internet of Things and Applications (IOTA), pp. 443–447.
IEEE (2016)
4. Hassan, N., Yau, K.-L.A., Wu, C.: Edge computing in 5G: a review. IEEE Access 7, 127276–
127289 (2019)
5. York, S., Poynter, R.: Global mobile market research in 2017. In: Theobald, A. (ed.) Mobile
Research, pp. 1–14. Springer, Wiesbaden (2018). https://doi.org/10.1007/978-3-658-189
03-7_1
6. (2018, 10/14/2021) 5G and IoT: the mobile broadband future of IoT,” i-scoop, 06-Oct-2020.
https://www.i-scoop.eu/internet-of-things-iot/5g-iot/
7. Li, S., Da Xu, L., Zhao, S.: 5G Internet of Things: A survey. J. Ind. Inf. Integr. 10, 1–9 (2018)
8. Sutton, A.: 5G network architecture. J. Inst. Telecommun. Professionals 12(1), 9–15 (2018)
9. Rana, A., Taneja, A., Saluja, N.: Accelerating IoT applications new wave with 5G: a review.
Materials Today: Proceedings 22 April 2021 (2021)
10. Fattah, H.: 5G LTE Narrowband Internet of Things (NB-IoT). CRC Press, Boca Raton (2018)
11. Xu, L., Jurcut, A.D., Ahmadi, H.: Emerging challenges and requirements for internet of things
in 5G. In: 5G-Enabled Internet of Things, pp. 29–48. CRC Press (2019)
12. Liu, L., Han, M.: Privacy and security issues in the 5g-enabled internet of things. In: 5GEnabled Internet of Things, pp. 241–268. CRC Press (2019)
A Review on 5G Technology in IoT-Application
383
13. Sachs, J., Wikstrom, G., Dudda, T., Baldemair, R., Kittichokechai, K.: 5G radio network
design for ultra-reliable low-latency communication. IEEE Network 32(2), 24–31 (2018)
14. Park, J., Lee, S.Y., Kim, Y., Lee, J., Hong, W.: Hybrid antenna module concept for 28 GHz
5G beamsteering cellular devices. In: 2018 IEEE MTT-S International Microwave Workshop
Series on 5G Hardware and System Technologies (IMWS-5G), pp. 1–3. IEEE (2018)
15. Roh, W., et al.: Millimeter-wave beamforming as an enabling technology for 5G cellular
communications: theoretical feasibility and prototype results. IEEE Commun. Mag. 52(2),
106–113 (2014)
16. Jurcut, A., Niculcea, T., Ranaweera, P., LeKhac, N.-A.: Security considerations for Internet
of Things: a survey. SN Comput. Sci. 1, 1–19 (2020)
17. Yang, D., Zhou, Y., Huang, W., Zhou, X.: 5G mobile communication convergence protocol
architecture and key technologies in satellite internet of things system. Alex. Eng. J. 60(1),
465–476 (2021)
18. Chowdhury, M.Z., Hasan, M.K., Shahjalal, M., Shin, E.B., Jang, Y.M.: Opportunities of
optical spectrum for future wireless communications. In: 2019 International Conference
on Artificial Intelligence in Information and Communication (ICAIIC), pp. 004–007. IEEE
(2019)
19. Chowdhury, M.Z., Hossan, M.T., Islam, A., Jang, Y.M.: A comparative survey of optical
wireless technologies: architectures and applications. IEEE Access 6, 9819–9840 (2018)
20. Lu, H.-H., et al.: A 56 Gb/s PAM4 VCSEL-based LiFi transmission with two-stage injectionlocked technique. IEEE Photonics J. 9(1), 1–8 (2016)
21. Dat, P.T., Kanno, A., Inagaki, K., Umezawa, T., Yamamoto, N., Kawanishi, T.: Hybrid optical wireless-mmWave: ultra high-speed indoor communications for beyond 5G. In: IEEE
INFOCOM 2019-IEEE Conference on Computer Communications Workshops (INFOCOM
WKSHPS), pp. 1003–1004. IEEE (2019)
22. Albraheem, L.I., Alhudaithy, L.H., Aljaser, A.A., Aldhafian, M.R., Bahliwah, G.M.: Toward
designing a Li-Fi-based hierarchical IoT architecture. IEEE Access 6, 40811–40825 (2018)
23. Haas, H.: LiFi is a paradigm-shifting 5G technology. Rev. Phys. 3, 26–31 (2018)
24. Gismalla, M.S., Abdullah, M.F.L.: optimization of received power and SNR for an indoor
attocells network in visible light communication. Communication 14(1), 64–69 (2019)
25. Haas, H., Yin, L., Wang, Y., Chen, C.: What is lifi? J. Lightwave Technol. 34(6), 1533–1544
(2016)
26. Khandal, D., Jain, S.: Li-fi (light fidelity): the future technology in wireless communication.
Int. J. Inf. Comput. Techn. 4(16), 1687–1694 (2014)
27. Hussein, Y.S., Annan, A.C.: Li-Fi technology: high data transmission securely. J. Phys. Conf.
Ser. 1228(1), 012069 (2019). IOP Publishing
28. Pall, M.L.: Wi-Fi is an important threat to human health. Environ. Res. 164, 405–416 (2018)
29. Shetty, A.: A comparative study and analysis on Li-Fi and Wi-Fi. Int. J. Comput. Appl. 150(6),
43–48 (2016)
30. Minoli, D., Sohraby, K., Occhiogrosso, B.: IoT considerations, requirements, and architectures for smart buildings—energy optimization and next-generation building management
systems. IEEE Internet Things J. 4(1), 269–283 (2017)
31. Sharma, P.K., Jeong, Y.-S., Park, J.H.: EH-HL: effective communication model by integrated
EH-WSN and hybrid LiFi/WiFi for IoT. IEEE Internet Things J. 5(3), 1719–1726 (2018)
32. Bykhovsky, D.: Coherence time evaluation in indoor optical wireless communication
channels. Sensors 20(18), 5067 (2020)
33. Wang, J.-Y., Li, Q.-L., Zhu, J.-X., Wang, Y.: Impact of receiver’s tilted angle on channel
capacity in VLCs. Electron. Lett. 53(6), 421–423 (2017)
34. Eroğlu, Y.S., Yapıcı, Y., Güvenç, I.: Impact of random receiver orientation on visible light
communications channel. IEEE Trans. Commun. 67(2), 1313–1325 (2018)
384
Y. Fazea et al.
35. Soltani, M.D., Purwita, A.A., Zeng, Z., Haas, H., Safari, M.: Modeling the random orientation
of mobile devices: measurement, analysis and LiFi use case. IEEE Trans. Commun. 67(3),
2157–2172 (2018)
36. Goswami, P., Shukla, M.K.: Design of a li-fi transceiver. Wirel. Eng. Technol. 8(04), 71 (2017)
37. Pathak, P.H., Feng, X., Hu, P., Mohapatra, P.: Visible light communication, networking, and
sensing: A survey, potential and challenges. IEEE Commun. Surv. Tutor. 17(4), 2047–2077
(2015)
38. Miramirkhani, F., Narmanlioglu, O., Uysal, M., Panayirci, E.: A mobile channel model for
VLC and application to adaptive system design. IEEE Commun. Lett. 21(5), 1035–1038
(2017)
39. Demirkol, I., Camps-Mur, D., Paradells, J., Combalia, M., Popoola, W., Haas, H.: Powering
the Internet of Things through light communication. IEEE Commun. Mag. 57(6), 107–113
(2019)
40. Luo, J., Fan, L., Li, H.: Indoor positioning systems based on visible light communication:
state of the art. IEEE Commun. Surv. Tutor. 19(4), 2871–2893 (2017)
41. Eroğlu, Y.S., Güvenç, I., Şahin, A., Yapıcı, Y., Pala, N., Yüksel, M.: Multi-element VLC
networks: LED assignment, power control, and optimum combining. IEEE J. Sel. Areas
Commun. 36(1), 121–135 (2017)
42. Dinev, D.Z.: Simulation framework for realization of horizontal handover in li-fi indoor
network. In: 2019 IEEE XXVIII International Scientific Conference Electronics (ET), pp. 1–4.
IEEE (2019)
43. Nižetić, S., Šolić, P., González-de, D. L.-D.-I., Patrono, L.: Internet of Things (IoT): Opportunities, issues and challenges towards a smart and sustainable future. J. Clean. Prod. 274,
122877 (2020)
44. Jindal, F., Jamar, R., Churi, P.: Future and challenges of internet of things. Int. J. Comput.
Sci. Inf. Technol. (IJCSIT) 10(2), 13–25 (2018)
Effect of Optimal Placement of Shunt Facts
Devices on Transmission Network Using Firefly
Algorithm for Voltage Profile Improvement
and Loss Minimization
S. O. Ayanlade1 , E. I. Ogunwole2(B) , S. A. Salimon3 , and S. O. Ezekiel4
1 Lead City University, Ibadan, Nigeria
samson.ayanlade@lcu.edu.ng
2 Cape Peninsula University of Technology, Cape Town, South Africa
221597999@mycput.ac.za
3 Ladoke Akintola University of Technology, Ogbomoso, Nigeria
sasalimon@lautech.edu.ng
4 Olabisi Onabanjo University, Ago-Iwoye, Nigeria
ezekiel.sunday@oouagoiwoye.edu.ng
Abstract. Flexible alternating current transmission systems (FACTS) are power
electronics-based static controllers which control the transmission network parameters to improve system performance. They are used to solve various power system problems which include; voltage stability, voltage deviation and power losses.
However, these devices need to be optimized to achieve desired results. This paper
presents the application of firefly algorithm (FA) to optimize Static Var Compensator (SVC) and Static Synchronous Compensator (STATCOM) for voltage profile
improvement and power loss minimization on IEEE 14 bus system. The results
showed that the active and reactive power losses were minimized by 8.7 and 10.1%,
respectively with FA optimized SVC and 10.7 and 14.7%, respectively with FA
optimized STATCOM. Therefore, the optimal allocation of SVC and STATCOM
improve the performance of the network which indicates the effectiveness of FA
in optimizing SVC and STATCOM.
Keywords: FACTS · STATCOM · SVC · FA · Voltage magnitude · Power loss
1 Introduction
Electrical power is conveyed from generating station to load through an extensive transmission and distribution networks. Nowadays, as population and industrialization are
increasing exponentially, so also the power demanded. This results in an increase in
losses on the transmission network and consequently poor voltage profile, which is due
to shortage of reactive power. Voltage profile deviation and insufficient reactive power in
a transmission system usually lead to total system collapse and consequently, disruption
of power to the consumers and high economic loss for manufacturing industries [1].
© The Author(s), under exclusive license to Springer Nature Switzerland AG 2022
F. Saeed et al. (Eds.): IRICT 2021, LNDECT 127, pp. 385–396, 2022.
https://doi.org/10.1007/978-3-030-98741-1_32
386
S. O. Ayanlade et al.
There are two ways to solve these problems; firstly, the expansion of the existing
transmission network and secondly, the use of traditional procedures such as placement of
capacitor bank and FACTS devices. The first method is ineffective, tedious, challenging
and very expensive. The second method, which is simpler and the most comfortable,
entails compensating the reactive power in the network. It is inexpensive than to construct
or expand the transmission network [2].
The advancement of technology in power electronics brought about FACTS devices,
and they are power electronics based. According to IEEE, FACTS controllers are power
electronics-based static controllers that enhance the controllability of the network. They
have been effectively utilized on transmission network for power flow control, loss
reduction, voltage regulation, transient stability enhancement, and system oscillation
mitigation by regulating their parameters. Also, FACTS devices can control various
network parameters to improve the network performance [3]. They also help in the
reduction of overloading of the lines and minimization of the I 2 R losses in the network
when utilized to integrate the transfer capability of the system from sending end to
receiving end [4].
To serve the primary purpose of these FACTS devices on the transmission network,
they must be appropriately placed in the best position referred to as the optimal position.
Their performances depend mostly on their appropriate placement on the network. Quite
a lot of methods have been used to solve FACTS controllers optimal placement problems
on transmission networks [5].
These methods include evolutionary programming (EP), particle swarm optimization
(PSO), cuckoo search algorithm (CSA), genetic algorithm (GA), biogeography based
optimization (BBO), simulated annealing (SA), chaotic ant swarm optimization (CASO),
firefly algorithm (FA) etc. [6]. Also, majority of the works carried out in this field of
study only consider the optimal placement of a single type of FACTS controllers in
improving the performance of the network but do not seek to compare the effects of
different types of FACTS controllers on transmission networks. This paper therefore,
utilized FA for optimal allocation of SVC and STATCOM to compare their effectiveness
in reducing voltage magnitude deviations and power losses in transmission networks.
Matlab programme was used to perform the simulations on IEEE 14-bus network.
2 STATCOM Structure and Operation Mode
It is a switching converter static VAR generator that is parallel-connected which could
either absorb or generate reactive power through different kinds of switching operations
within the converter, without the use of any energy storages [7]. Reactive power in the
transmission system, could be effectively compensated by the optimal placement of this
controller. Reactive power is generated or absorbed from the network to improve the
efficiency and reliability of the network [8]. The configuration of STATCOM is shown
in Fig. 1. It comprises voltage source converter (VSC), a dc capacitor, and a coupling
transformer. The DC voltage in the configuration is converted to 3-phase output voltages
with appropriate frequency, amplitude, and phase by the VSC electronic part [9].
The reactive power exchange between the power network and the device is regulated
by varying the 3-phase voltage magnitude, V vsc , of the converter. When V vsc of the
Effect of Optimal Placement of Shunt Facts Devices
387
converter is greater than V ac (i.e. V vsc > V ac ), the STATCOM injects reactive power
to the system. Otherwise, if V vsc is lesser than V ac (i.e. V vsc < V ac ), reactive power
is absorbed from the network. Also, if V vsc and V ac are equal in magnitudes (i.e. V vsc
= V ac ), the STATCOM is in standby mode. The power flow equations for STATCOM
controller are given in Eqs. 1–4.
Pm = Psh +
N
|Vm |Vj Ymj cos θmj − δmj
(1)
j=1
Qm = Qsh +
N
|Vm |Vj Ymj sin θmj − δmj
(2)
j=1
Psh = Gsh |Vm |2 − |Vm ||Vsh ||Ysh |cos(θmsh − δsh )
(3)
Qsh = Bsh |Vm |2 − |Vm ||Vsh ||Ysh |sin(θmsh − δsh )
(4)
where, Vm θm = voltage at bus m, Vsh θsh = injected shunt voltage, Qm , Pm and Qsh ,
Psh are the reactive and active powers at bus m and STATCOM, respectively, Gsh , Y sh and
Bsh are the STATCOM conductance, admittance and susceptance, respectively, Ymj δmj
= admittance between buses m and j, N = bus number at bus m.
Vac
Coupling
Transformer
Vvsc
Voltage
Sourced
Converter
+
−
Vdc
Fig. 1. STATCOM basic structure
3 SVC Structure and Operation Mode
SVC is a parallel-connected FACTS controller type, which comprises a series thyristorswitched-reactor (TSR), which absorbs reactive power and thyristor-switched-capacitor
(TSC), which injects reactive power to the system at the required time of need. It also
comprises various filters to filter harmonics out of the system. Figure 2 shows a typical
configuration of SVC connected in a transmission network. SVC works on the basic
principle of controlling shunt susceptance. Generally, SVC is subdivided into two viz;
388
S. O. Ayanlade et al.
fixed-capacitor thyristor-controlled reactor (FC-TCR) and thyristor-switched capacitor
thyristor-controlled reactor (TSC-TCR).
In this paper, TSC-TCR was adopted because of its flexibility and very low rating
of the reactor that generates fewer harmonics that can easily be mitigated with the help
of a filter. The SVC voltage control equations can be expressed as:
(5)
V = Vref + Xs −Bc,max < B < B1,max
I
Bc,max
I
V =
B1,max
V =
(for inductive SVC)
(6)
(for capacitive SVC)
(7)
where, V and V ref are the positive sequence and reference voltages respectively, Bc,max
and B1,max = maximum capacitive and inductive susceptance, respectively, I = reactive
current, X s = droop/slope reactance.
The slope values are required to avoid hitting limit for little bus voltage variation
and they are in 0.02–0.05 p.u. range. Just like STATCOM, SVC equations were also
incorporated into the Newton Raphson power flow algorithm for modification, and the
results of both shunt FACTS devices are compared and presented.
Fig. 2. Typical configuration of SVC.
4 Problem Formulation
4.1 Load Flow Analysis
Newton Raphson load flow method has proved to be most successful, due to their
strong convergence characteristics, as a reliable solution to real-life transmission systems. Therefore, Newton Raphson power flow solution technique was adopted to solve
Effect of Optimal Placement of Shunt Facts Devices
389
the non-linear load flow algebraic steady state equations of the transmission network.
SVC and STATCOM equations were integrated into the Newton Raphson power flow
algorithm.
4.2 Objective Function
FACTS device placement in transmission network minimizes network power losses,
subjected to voltage constraints. Minimization of the transmission active power loss is
the objective function, which is expressed mathematically as in Eq. 8:
Min Ploss =
n
Gi (Vi2 + Vj2 − 2Vi Vj cos δij )
(8)
i=1
Subjected to the constraints as follows:
Equality Constraints. The balanced power flow equations that are expressed as Eq. 9
and Eq. 10, below [10]:
PGi − PDi = Pi (V , δ)
(9)
QGi − QDi = Qi (V , δ)
(10)
Inequality Constraints. These are voltage and reactive power generation limits
imposed on load (PQ) constraints on the network generator (PV) buses and STATCOM
as given in Eqs. 11 and 12
i
i
Vmin
≤ Vi ≤ Vmax
(11)
min
max
QGi
≤ QGi ≤ QGi
(12)
4.3 Firefly Algorithm
FA is a nature-based algorithm developed by Yang to solve continuous optimization
problems. It is an algorithm for solving optimization problems especially in power
system [11].
It was developed on three rules.
1. Artificial fireflies are unisex.
2. Attractiveness depends on flashing brightness of the fireflies and it is inversely proportional to the distance from the other firefly. As the most attractive firefly is the
brightest one, it attracts the neighboring fireflies and if there is no brighter one, it
moves randomly [12].
3. The flashing light brightness is the objective function to be optimized. The intensity
of light is dependent on the objective function magnitude for problem maximization.
390
S. O. Ayanlade et al.
Using FA, the intensity of light and brightness represent the objective function,
and attraction and movement towards the brightest firefly resemble reaching an optimal
solution. The factors that affect the algorithm are discussed below:
Attractiveness. The firefly attractiveness is a function of its brightness and is given in
Eq. 13.
β(r) = βo e−yr
2
(13)
where, βo = firefly attractiveness value at r = 0, γ = media light absorption coefficient.
Distance. The distance r i between two fireflies ith and jth located at x i and x j ,
respectively, is given as
d
2
(14)
xi , k − xj , k
rij = xi − xj =
k=1
Movement. A firefly ith is attracted to a more attractive firefly jth as in Eq. 15.
xit+1 = xit + βo e
−yrij2
xjt − xit + α(rand − 0.5)
(15)
where, t = current iteration number, x i = less bright firefly, x j = brighter firefly location,
α = randomization parameter, γ is the absorption coefficient.
In Eq. 15, above, the second term is as a result of relative attraction, and the third
term is a randomization parameter which is usually selected to be in the range 0–1 and
rand is a number generated randomly between 0–1. γ parameter is used to introduce the
attractiveness variation and it is between the range of 0.01–10. The algorithm approaches
the global optima when n → ∞, and the iteration number exceeded one but in reality, it
converges rapidly [13].
The algorithm compares the new firefly attractiveness position with the previous
value. When a higher attractiveness value is produced by the new position, the firefly
moves to a new position; else, the firefly remains in the previous position. FA termination criterion is dependent on a predefined fitness value. The random movement of the
brightest firefly is given in Eq. 16 [14]:
xit+1 = xit + αεi
(16)
εi = (rand − 0.5)
(17)
The optimal solution is obtained by maximizing light intensity, I m , function. The
function is obtained by transforming the power loss function of Eq. 8, and the voltage
constraints of Eq. 11, to function in Eq. 18.
Max.Im =
1
1+
(18)
Effect of Optimal Placement of Shunt Facts Devices
391
where,
= Ploss +
Vilim it
=
i∈
⎧ min
⎨ Vi
V max
⎩ i
Vi
Vi − Vilim it
2
if Vi < Vimin
if Vi > Vimax
otherwise.
(19)
(20)
It is to be noted that, within the load flow technique, the limits of reactive power
generated are varied and needed not to be controlled via the intensity function. By using
Eq. 18, each firefly intensity is calculated from the randomly generated firefly population.
Depending on the intensity of light, each of the fireflies moves to the optimal solution
by Eq. 15, and the iteration continues until convergence is achieved. Figure 3 illustrates
the flowchart for the proposed method.
Start
Input Firefly
Optimization Parameters
Create Initial Population
Run the Load Flow with STATCOM and
SVC then obtain the brightness of fireflies
Compute the Distance of Firefly with
other Fireflies
Move the Firefly towards Brightest
Firefly
Iteration Count = Count + 1
No
Is Maximum Iteration
Reached?
Yes
Print Optimization
Solution
Stop
Fig. 3. Flowchart of the proposed methodology
5 Results and Discussion
The method was applied to IEEE 14-bus system and the results discussed under three
sub-sections. The results were presented in line with voltage profile improvement, active
392
S. O. Ayanlade et al.
and reactive loss minimizations. Table 1 shows the limits for the control, dependent
variables and range for the FA parameters. The optimal location of STATCOM and SVC
as determined using FA was bus 9 and the optimal size was 9.54 MVAr.
Table 1. Optimal values of FA parameters
Min
Max
0.95
1.05
Power system variable
Voltage Magnitude (p.u)
QSTAT (MVar)
−50
Firefly algorithm parameters
Randomness (α)
0.0
0.2
Attractiveness (β)
0.4
1.0
Absorption (γ )
0.1
1.0
No. of Dimension (d)
0.0
0.2
Population Size
3.0
0.0
No. of Iterations
–
200
5.1 Voltage Profile Improvement with Firefly Algorithm Placed SVC
and STATCOM
The effect of optimal SVC and STATCOM placements using FA, on the system voltage
profile is presented in Table 2. Buses 7 and 13 violated upper voltage limit but were
reduced to values which lie within acceptable voltage limits when 9.54 MVAr of SVC
and STATCOM controllers were placed at bus 9.
The incorporation of these controllers with FA eliminates voltage limit violation at
any of the buses and also, there is further overall network voltage profile enhancement.
With the incorporation of SVC controller at bus 9, the voltages at buses 7 and 13 were
minimized to 1.04 and 1.035 p.u., respectively which fall within acceptable voltage
limits compared to their initial magnitudes of 1.068 and 1.067 p.u., respectively. Also,
when STATCOM controller was incorporated at bus 9, the voltages at buses 7 and
13 were minimized to 1.043 and 1.038 p.u., respectively which also fall within the
acceptable voltage limits. This implies that STATCOM proved superior in improving
the network voltage profile compared to SVC. However, the incorporation of these
controllers resulted in improved network voltage profile and stable network operation
and performance.
Effect of Optimal Placement of Shunt Facts Devices
393
Table 2. Voltage comparison of IEEE 14 Bus
Bus no
Base case
SVC (FA Placed)
STATCOM (FA Placed)
Vm (p.u.)
Vm (p.u.)
Vm (p.u.)
1
1.060
1.060
1.060
2
1.045
1.048
1.046
3
0.960
0.982
0.985
4
0.969
0.978
0.981
5
0.963
0.978
0.981
6
1.020
1.012
1.015
7
1.068
1.040
1.043
8
0.990
0.972
0.975
9
1.027
1.026
1.029
10
1.033
1.031
1.034
11
1.030
1.025
1.028
12
1.033
1.026
1.029
13
1.067
1.035
1.038
14
1.047
1.044
1.047
5.2 Effect of Firefly Algorithm Placed SVC and STATCOM on Active Power
Loss
Figure 4 illustrates an obvious comparison of the performance of both FACTS devices for
the target objective of active loss reduction. It can be seen clearly that all the transmission
lines recorded loss minimizations when SVC and STATCOM controllers were located
with FA. Nevertheless, loss minimization differs for the two controllers. It is obvious
that loss minimizations in the lines with FA placed STATCOM supersede that with FA
placed SVC.
The base case total loss was 6.251 MW but was minimized to 5.707 and 5.581 MW
when SVC and STATCOM were optimally placed, respectively. The reduction of 0.544
and 0.670 MW corresponding to 8.7 and 10.1%, respectively were achieved when SVC
and STATCOM were optimized with FA. With FA placed STATCOM, the total active
power loss was significantly reduced when compared with FA placed SVC. Notwithstanding, with the optimal locations of these two controllers, the total active loss was
minimized.
394
S. O. Ayanlade et al.
Fig. 4. Active loss minimization of the three cases
5.3 Effect of Firefly Algorithm Placed SVC and STATCOM on Reactive Power
Loss
Figure 5 illustrates an obvious comparison of the performance of both FACTS devices
for the target objective of reactive loss reduction. The total reactive loss as well as the
total active loss reductions are depicted in Fig. 6 to better appreciate the performance of
FA for SVC and STATCOM optimizations. The reactive power loss, which was 14.256
MVAr without the controllers, was minimized to 12.818 and 12.156 MVAr when SVC
and STATCOM were optimally allocated, respectively using FA. There is an achievement
Fig. 5. Reactive power minimization for all three cases
Effect of Optimal Placement of Shunt Facts Devices
395
of 1.438 and 2.100 MVAr total reduction corresponding to 10.1 and 14.7%, respectively.
Also, FA placed STATCOM gave better results when compared with FA placed SVC.
However, optimal placements of both controllers result in an optimal achievement of the
desired objectives.
Fig. 6. Total real and reactive power reduction for all three cases
6 Conclusion
The use of FA for optimal location of shunt FACTS devices has been presented. It was
observed that optimal size and placement of STATCOM and SVC controllers improved
the network voltage profile and simultaneously reduced the active and reactive power
losses. However, STATCOM performed better than SVC in both voltage profile improvement and loss minimizations. Hence, this work demonstrated the efficacy of FA to
optimally place SVC and STATCOM on transmission network.
Contribution. The contribution of this paper is the establishment of the superiority of optimal
allocation of STATCOM over SVC in reducing power losses and enhancing the transmission
network voltage profile.
References
1. Damor, K.G., Patel, D.M., Agrawal, V., Patel, H.G.: Comparison of different fact devices. Int.
J. Sci. Eng. 1(1), 372–375 (2014). https://doi.org/10.1109/APCC.2016.7581484
2. Ayanlade, S.O., Komolafe, O.A., Adejumobi, I.O., Jimoh, A.: Distribution system power
loss minimization based on network structural characteristics of network. In: 1st Faculty of
Engineering and Environmental Sciences Conference Proceedings, pp. 849–861, Uniosun,
Osogbo, Nigeria (2020)
3. Ayanlade, S.O., Komolafe, O.A.: Distribution system voltage profile improvement based
on network structural characteristics of network. In: 2019 OAU Faculty of Technology
Conference (OAU TekCONF 2019) Proceedings, pp. 75–80, OAU, Ile-Ife, Nigeria (2019)
396
S. O. Ayanlade et al.
4. Manoj, R.H., Kavita, S.G., Jogi, V.: Voltage regulation of STATCOM using flexible PI control.
In: 2017 2nd International Conference on Communication and Electronic Systems (ICCES)
2017 Proceedings, pp. 128–133 (2017). https://doi.org/10.1109/CESYS.2017.8321248
5. Adewolu, B.O., Saha, A.K.: Performance evaluation of FACTS placement methods for available transfer capability enhancement in a deregulated power networks. In: 2020 International SAUPEC/RobMech/PRASA Conference Proceedings, pp. 1–6 (2020). https://doi.org/
10.1109/SAUPEC/RobMech/PRASA48453.2020.9041146
6. Okelola, M.O., Ayanlade, S.O., Ogunwole, E.I.: Particle swarm optimization for optimal
allocation of STATCOM on transmission network. J. Phys. Conf. Ser., CMVIT 1880(012035),
1–7 (2021). https://doi.org/10.1088/1742-6596/1880/1/012035
7. Chirantan, S., Swain, S.C., Panda, P.C., Jena, R.: Enhancement of power profiles by various
FACTS devices in power system. In: 2nd International Conference on Communication and
Electronic Systems (ICCES) 2017 Proceedings, pp. 896–901 (2018). https://doi.org/10.1109/
CESYS.2017.8321212
8. Tamboli, A.S., Jadhav, H.T.: Hybrid STATCOM for reactive power compensation. In: 2018
International Conference on Current Trends Towards Converging Technologies (ICCTCT
2018) Proceedings, pp. 1–5 (2018). https://doi.org/10.1109/ICCTCT.2018.8550889
9. Ceaki, O., Vatu, R., Golovanov, N., Porumb, R., Seritan, G.: Analysis of SVC influence
on the power quality for grid-connected PV plants. In: 2014 International Symposium on
Fundamental Electrical Engineering, (ISFEE) 2014 Proceedings, pp. 1–5 (2015). https://doi.
org/10.1109/ISFEE.2014.7050604
10. Laifa, A., Boudour, M.: Optimal placement and parameter settings of unified power flow
controller device using a perturbed particle swarm optimization. In: 2010 IEEE International
Energy Conference Proceeding, pp. 205–210 (2010). https://doi.org/10.1109/ENERGYCON.
2010.5771677
11. Wang, J., Liu, G., Song, W.W.: Firefly algorithm with proportional adjustment strategy. In:
Hacid, H., Sheng, Q.Z., Yoshida, T., Sarkheyli, A., Zhou, R. (eds.) QUAT 2018. LNCS, vol.
11235, pp. 78–93. Springer, Cham (2019). https://doi.org/10.1007/978-3-030-19143-6_6
12. Xing, B., Gao, W.-J.: Innovative Computational Intelligence: A Rough Guide to 134 Clever
Algorithms. Springer, Cham (2014). https://doi.org/10.1007/978-3-319-03404-1
13. Yang, X.S., He, X.: Firefly algorithm: recent advances and applications. Int. J. Swarm Intell.
1(1), 36 (2013). https://doi.org/10.1504/ijsi.2013.055801
14. Selvarasu, R., Kalavathi, M.S., Rajan, C.C.A.: SVC placement for voltage constrained loss
minimization using self-adaptive firefly algorithm. Arch. Electr. Eng. 62(4), 649–661 (2013).
https://doi.org/10.2478/aee-2013-0051
Efficient and Secure Topology Discovery
in SDN: Review
Olomi Isaiah Aladesote(B)
and Azizol Abdullah
Faculty of Computer Science and Information Technology, Universiti Putra Malaysia,
Seri Kembangan, Selangor, Malaysia
gs57427@student.upm.edu.my
Abstract. Effective and efficient management of the Software-Defined networks
(SDN) requires that the controller has the current or detailed information on the
network, and its topology. The controller achieves topology discovery in SDN
when an appropriate channel; that permits all network devices and communication
channels between links to be recognized by it, such that the controller connects with
the forwarding elements positioned at a higher level using OpenFlow channels.
The use of OpenFlow Discovery Protocol (OFDP) that leverages on the Link
Layer Discovery Protocol (LLDP) packet for link topology discovery has shown
to be inefficient and insecure. LLDP is vulnerable to attacks (Flooding, Replay,
and Poisoning) due to the lack of packet authentication, the absence of integrity
check, and the reuse of static packets. Many researchers have proffered stateof-the-art solutions to an efficient and secure topology discovery. Therefore, this
study provides an overview of the Architecture and topology discovery in SDN.
In addition, this study also discusses the state-of-the-researches that provided
solutions to an efficient and secured topology discovery. Also, the study suggests
challenges and future directions.
Keywords: SDN · Topology discovery · OFDP · Topology discovery attacks ·
LLDP
1 Introduction
SDN helps to address the defeat of visibility of network devices (routers, switches)
which is achieved by installing a monitoring system in the traditional network [1], and it
is a state-of-the-art computer networking strategy that seeks to fix the shortcomings of
traditional networking. In modern data networks, it is a novel method for programming
the switches used [2]. It is an evolving network standard that separates the data layer
from the control layer; this makes it better at solving practical problems than traditional
networks [3–7]. SDN is the recent network notion that simplifies the management of
the network through the implementation of logically centralized controller, known as
the brain of the network or network operating system that interacts via the southbound
interface with the data layer and also via the northbound interface with the application
layer [8, 9].
© The Author(s), under exclusive license to Springer Nature Switzerland AG 2022
F. Saeed et al. (Eds.): IRICT 2021, LNDECT 127, pp. 397–412, 2022.
https://doi.org/10.1007/978-3-030-98741-1_33
398
O. I. Aladesote and A. Abdullah
SDN transition to a highly scalable and centralized network management design
conforms to the increasingly high networks occurring in large data centers today [10,
11]. Instead of attempting to force application-specific forwarding into outdated systems
that are inappropriate for the task, SDN allows developers to direct the flow of traffic
through programming an open software-based controller. Network administrator(s) can
set up network services and assign virtual resources to one centralized location to direct
the network infrastructure in real-time mode.
In SDN, a logically centralized controller plays an important role. One of the functions of the controller is to conduct a correct, secure, and almost real-time discovery of
topology that offers a current view of the network [12]. The Discovery of a switch, the
link, and host are three sections in topology management and their results in global view
in SDN [13, 14]. In switch discovery, information about the switch is obtained when a
connection is established between an OpenFlow switch and an OpenFlow enabled controller; link discovery enables the controller to have the knowledge and information of all
the devices in the network, coupled with links through which information is exchanged
[15]. The identification of hosts provides the controller with valuable information used
in network management roles [16].
OFDP is used in discovery links in legacy networks before it is adopted for the
same purpose in SDN. OFDP leverages LLDP to perform link topology discovery in
SDN, however, it is susceptible to attacks such as poison, replay, and flooding attacks
[17, 18], due to lack of SDN standardization and authentication techniques [19]. The
risks associated with the current link topology discovery have prompted researchers to
propose effective, secure, and reliable link discovery methods.
The main contribution in this review work, therefore are to present a background
knowledge of SDN, including the topology discovery; to provide a comprehensive review
of an efficient and secure link topology discovery, and to provide challenges and future
directions. To achieve this, we carefully select the required articles in this domain by
excluding the unsuitable ones by critically studying the titles, abstract, full text and the
year of publication.
The remainder of the paper is as follows: the second section introduces SDN architecture. Section 3 presents the topology discovery in SDN, the state-of-the-art researches are
presented in 4. Section 5 discusses challenges and future directions, and the conclusion
in Sect. 6.
2 Overview of SDN Architecture
SDN is a networking concept that alters the existing architecture of a conventional
network by removing the control modules from the switch or router and positioning
them on a central location, called the controller [20]. The principles of separating the
two planes (the control layer from the data layer) through a Southbound API are the
result of the numerous plane separation efforts made by academia and researchers in
the following researches on Open signaling [21], Active Networking [22], RADIUS
[23], Orchestration [24], SANE [25], ForCES [26], 4D [27], Ethane [28]. There are
three layers or planes to categorize the SDN architecture: infrastructure, control, and
application [29, 30]. Besides the layers in SDN, there exist many application program
Efficient and Secure Topology Discovery in SDN: Review
399
interfaces (APIs): northbound and southbound [31]. We introduce the three layers or
planes of SDN architecture [32] with the interfaces here.
2.1 Infrastructure Layer
The infrastructure layer, referred to as the data plane [33], is made up of network equipment such as switch/router, used explicitly for forwarding packets, coupled with other
network elements that are SDN-enabled [34, 35]. In logic, each network element stands
for all or part of the resources of the physical network [36]. It is an OpenFlow-based
switch that contains a flow table. The flow table majorly stores flow entries, but the
packets are processed based on the matched flow entry. Its role is to relay packets based
on the instructions or policies issued by the controller [37, 38].
2.2 Control Layer
The control layer is also called the controller, and the brain of the network helps establish
network devices and enables data and control planes communication via southbound API
[39]. It is logically centralized to interpret the specifications from the application layer
to the data layer. The functions of the control layer include management of topology,
the configuration of the network, policy implementation, the discovery of links, entry of
the flow table, among others [33]. The SDN controller’s task is to monitor the network
as a whole.
2.3 Application Layer
An application plane contains SDN applications, which are programs that clearly and
systematically communicate through a northbound interface [40]. The application layer
consists of an application or more, with each having complete influence over SDN
controllers exposed to a collection of resources [41].
2.4 Southbound API
Southbound interfaces are APIs that allow interaction between the data layer and the
control layer using OpenFlow protocol [33, 34]. That is, OpenFlow is a protocol that
defines how OpenFlow-enabled switches communicate with one or more control servers.
An OpenFlow controller places flow entries in switches by an OpenFlow controller so that
these OpenFlow switches can redirect traffic based on such flow entries [35]. OpenFlow
is a protocol specification that defines how OpenFlow switches and OpenFlow controllers
communicate [42].
2.5 Northbound API
It is the API that exists in-between the control layer and the application layer. It permits
communication between the two layers and offers a network abstraction interface to both
applications and management systems on top of SDN architecture [43].
400
O. I. Aladesote and A. Abdullah
3 Topology Discovery in SDN
Discovering the topology of the network is one of the important processes for the SDN to
function efficiently. In this process, the controller must have current or detailed information about the network, including its topology, to function as a centralized controller and
handle data plane forwarding requests [44]. The controller achieves topology discovery
in SDN when an appropriate channel; that permits all network devices and communication channels between links to be recognized by it, such that the controller connects
with the forwarding elements positioned at a higher level using OpenFlow channels. The
forwarding elements at the higher level further connect with both forwarding elements
at the lower level and forwarding elements with Access Point (AP) using links between
switches. Network applications such as load-balancing, routing, etc., and services largely
depend on an up-to-date and overall view of the network to function efficiently [45].
SDN accomplishes network topology in three ways: Switch discovery, host discovery,
and link discovery [46].
3.1 Switch Discovery
An OpenFlow switch initiates a session with the SDN controller through the handshake.
During the initiation, the switch sends information on its identity, characteristics, active
ports, and support functions via the exchange of “Features Request/Reply” messages
to the controller. The controller then uses a periodic Echo (Request / Reply message)
mechanism to keep the node in good working order. An OF switch can send out PortStatus messages to alert the controller when a state port changes. TCP communication
is used for switch discovery and can be protected with Transport Layer Security (TLS)
[47].
3.2 Host Discovery
The approach to the host discovery is centered on the principle that whenever there is a
table-miss, packet_in messages are sent to the controller. Thus, when a host sends traffic
to the switch because there are no flow rules yet installed for the incoming flow, the
switch transmits the first packet as a packet in message to the controller, and this enables
the controller to discover the host. The host discovery is done with the help of traffic
provided by the hosts and this affects its mobility and the identification of hosts provides
the controller with valuable information that can be used in network management roles
before traffic is generated. To discover hosts on the network, different controllers use
different host tracking applications [48].
3.3 Link Discovery
Links are discovered with the use of OFDP. The link discovery enables the controller
to have the knowledge and information of all the devices in the network, coupled with
links through which information is exchanged [15]. Different controller platforms utilize
separate link discovery services to discover network links.
Efficient and Secure Topology Discovery in SDN: Review
401
4 State-of-the-Art Studies in Link Discovery Topology
It is worth noting that OFDP uses LLDP packets to accomplish SDN topology discovery.
However, the OFDP is inefficient, and LLDP is insecure due to the inability of the
controller to identify genuine LLDP control messages, reuse static packets, and its failure
to determine the source authentication of LLDP packets. OFDP is a distributed protocol
that most SDN controllers use as a core protocol for discovering network topology, such
that each port on each switch receives its own LLDP packet from the SDN controller; It
means that during an OFDP discovery round, a controller must send the same number
of packet-out messages as the number of ports in the network.
Numerous authors have presented several state-of-the-art studies to improve the efficiency of protocol. Authors in [49, 50] amended the existing topology discovery method
to improve the efficiency and reduce the control load of a controller. The de facto standard
of the topology discovery is adjusted to form OFDPv2 with similar performance with
OFDP by sending an LLDP frame per switch, which leads to a reduction in the number
of LLDP messages. Furthermore, a switch sends (broadcasts) the LLDP packet to all of
its active ports. It leads to a decrease in controller load and outstanding performance.
Researchers in [51, 52] presented sOFTDP, a Secure and Efficient Topology Discovery
Protocol, to resolve the reliability and scalability issue of OFDP. The bidirectional forwarding detection (BFD) technique helps to detect link topology asynchronously and
notify the controller; packets are encrypted with hash values to prevent spoofing attacks
and controller fingerprinting. Nevertheless, the study has not been assessed in larger
testbeds and cannot reliably detect fabricated links.
To successfully manage topology discovery in SDN, Tarnaras et al. [53] introduced
a ForCES-based structure that automatically discovers network topology. In this work,
the neighbors update their flow tables when the controller and the switch exchange
LLDP packet. The controller polls the topology information regularly and calculates the
learning time. As a result, there is a reduction in controller load and network resource
utilization. However, ForCES lacks open implementation, which leads to its rejection.
The authors in [54] designed SD-TDP to address the lack of a topology discovery process
based on layer two approaches. SD-TDP, an enhancement to OFDP, allows only a few
switches to send information to the controller. A TDP – Request permits the information
exchange during the interaction between the father node (FN) and active nodes (AN).
AN sends messages to the closest or nearest node via active ports. All TDP messages of
each AN in the network are taken by FN. After which, the controller can acquire the FN
topology structure and create the entire network topology. The state is changed to AN
whenever network changes occur and FN does not have AN connection. It enhances the
performance of topology discovery in SDN by reducing the number of messages and
discovery time. However, it does not address LLDP based security threats.
Hong et al. [55] introduced a defense mechanism tagged TopoGuard, that focuses
on securing flaws in the OpenFlow controller’s host monitoring and communication
discovery services when the security of topology discovery became a serious concern.
It keeps track of the host identity and the authorized user to ensure smooth operation.
When the controller’s identity and the host’s identity don’t fit, the machine creates a
new profile and checks LLDP packets for network topology poisoning attacks using
the incoming port information. It adds a keyed-hash-based message authentication code
402
O. I. Aladesote and A. Abdullah
(HMAC) to LLDP packets to improve their authenticity and helps in preventing poison
attacks. Nevertheless, the research failed to analyze the effect of the link spoofing attack
on routing, and also it is not free from replay attacks. Nguyen & Yoo [56] prevent the link
spoofing attack orchestrated by injecting a fabricated LLDP packet into the network by
adding a controller-based authenticator TLV into the packet. The HMAC approach helps
determine the packet originality in the network. However, the study does not include the
development of the preventive measures of the attacks.
Alharbi et al. [57] enhance TopoGuard (Hong et al., 2015) by proposing a technique
to tackle the security challenges in OFDP caused by a deficiency of LLDP packets
validation that exposes packets to falsification. The study uses a cryptographic Message
Authentication Code (HMAC) method to validate the genuineness of LLDP packets.
The HMAC, with a dynamic key, is used to determine (calculate) the MAC code, which
prevents both replay and poison attacks. The technique makes it difficult for attackers
to launch an effective attack, as it is tough to compute the MAC value owing to the
difficulties in determining or guessing the key.
Rojas et al. [58] propose the Tree exploration discovery protocol (TEDP), a mechanism that allows switches to discover network topology automatically. The controller
sends only one probe frame, which floods the network instead of neighbouring switches
to send and receive messages. Two forms of TEDP: TEDP-S and TEDP-H, create a direct
route throughout the discovery process with no additional messages. TEDP approach is
different from LLDP, as it launches a probe frame by distributing routing information in
the network and discovering the network topology at the same time. Nevertheless, the
network may experience a delay during network discovery in a large data centre.
The existing approaches to preventing link fabrication attacks suffered from time
delays, and also the creation of fake links by attackers drastically affect the network performance. The authors proposed ESLD [59] to address the stated challenges by sending
LLDP packets to all ports except those attached to the hosts. It involves three stages
(port classification, LLDP packets sending, and link detection). A time-marked HMAC
(tHMAC) verification technique is used to prevent link fabrication attacks. For the SDN
to function optimally, there is a need to secure both the network topology and the data
layer against any form of attack. To achieve this, Sphinx [60] is introduced to detect any
attack from compromised hosts and switches in the network topology and the forwarding
plane, such as poison. It creates a flow graph for each type of traffic and regularly updates
the network. It scans the networks for abnormal traffic and triggers a warning if found.
To improve the performance of an SDN controller by reducing its traffic, SHTD [61]
adopts the concept of assigning resources to the data plane to cater for the absence of an
integrated method for discovering links between switches and provision of control plane
fault recovery without involvement of SDN Controller. Topology is discovered by sending a top request message from the controller. This multicast message propagation uses
nodes that have non-discovered, leaf, v-leaf, or core features. Controlled components
and autonomic managers help the system recover from port failure.
Similarly, lm-OFDP [62], an improvement on OFDP, formulates rules for the discovery process, as it alters the switch response to LLDP packets from other switches to
enhance the topology discovery protocol. The receiving switch returns the LLDP packet
to the sending switch rather than sending the LLDP packet as a packet-in message to the
Efficient and Secure Topology Discovery in SDN: Review
403
controller. The sending switch directly sends the packet to the controller as a packet-in
message to establish a bidirectional link between the sending and the receiving switches.
It can only protect against link fabrication attacks while also reducing controller load.
However, it is not a secured system as it is vulnerable to flooding attacks. This study proposes a Lightweight Automatic Discovery [63] to strengthen the inefficiency of OFDP
and work on the unsuitability of LLDP for SDN. The controller randomly chooses a core
switch and forwards the packet-out message to it. The LLDP message is then sent from
the core switch to its nearby switches, who subsequently pass it to their neighbours,
and so on. Every switch must forward the received LLDP message as a packet-in to the
controller. The OpenFlow protocol is combined with a meter table to prevent flooding.
However, it takes a longer time to discover the links between switches. It is vulnerable
to attacks, as attacks can occur before introducing the block-ports.
Authors in [64] introduced TILAK, a token-based prevention technique that would
handle both authentication and integrity checks on LLDP packets. The packets are legitimate if they hold authentic tokens upon verification since SDN controllers have no
security approach to safeguard network topology information. Also, the port of transmission is on the eligible port table. Nevertheless, this is a need for a secure and efficient
link discovery protocol to address collaborating LLDP attacks. The drawbacks in [51,
55, 56, 58] motivated authors in [65] to propose a secure and lightweight approach to
link discovery protocol aimed to avoid, identify, and reduce the security risks of LLDP,
which are poison, replay, and flooding attacks. Their work uses an eligible port checklist
to prevent attacks, and packets are received only from ports found in the port checklist
for processing. In this way, it has a better performance in overhead. However, at the
initial iteration, that is, at network start-up, all ports in each switch are eligible; as a
result, the network is vulnerable to attacks as the controller cannot prevent packets from
any of the ports.
The limitation found in [65] prompted Chou et al. [66] to prevent attackers from
exploiting the insecure nature of OFDP to perform various degrees of attacks. The study
analyzes the time difference between round-trip times of each Link Layer Discovery
Protocol, finds the correlation between links in the network and determines whether
there is an attack or not. A match of generated verification keys with details of the
packets_in messages received by the controller and comparing the number of received
packets with the number of fabricated LLDP packets help determine an attack. However,
blocking a port that sends more LLDP packets without further investigation can cause
the removal of a legible port from the transmission.
To further improve bandwidth consumption and remove unnecessary fields in the
LLDP packet, the study proposes OFDPx [67], an extended OFDP that uses a 14-byte
packet format. The study splits the network view into many paths, and a packet probe is
responsible for detecting links in the same path. There is a reduction in the number of
packets used for the discovery and effective use of bandwidth resources. However, the
discovery time may be high as OFDP is used to resolve faulty links.
Baidya & Hewett [68] explore a link validation approach to securing the network
topology discovery. Their work addressed security threats associated with compromised
hosts and switches by generating a table to store all active links, ports, and switches.
Any link whose properties show that its port is either a host port or connects to two
404
O. I. Aladesote and A. Abdullah
different switches is an illegal link. Nevertheless, the routing approach is unsuitable
for tree & fat topologies, and attackers can forge LLDP packets. Chang et al. [69]
propose a delegation function approach that uses LLDP-enabled switches to transmit
and receive LLDP frames between neighbouring switches and report links back to the
topology manager in the controller. The study is to reduce the resources required and
to prevent resource conflicts between topology discovery and rerouting. It reduces the
CPU utilization, traffic load, and also the number of packets for the discovery.
Authors in [70] propose an ICLF to determine links between OpenFlow switches and
legacy switches in a hybrid SDN. In this study, the controller sends a single packet_out to
the legacy switch, and in turn, transmits it within the network to determine bidirectional
links. However, the controller is insecure, which makes the network vulnerable to attacks.
The summary of the approaches to Efficient and Secure Link Topology Discovery is
presented in Table 1.
Fig. 1. Timeline for the development of Topology Discovery in SDN
Table 1. Comparison of approaches to Efficient and Secure Link Topology Discovery
Reference
Packet used
Technique
proposed
Merits
Limitation
Pakzad et al.
[49]
LLDP packet
OFDPv2
Two modified
versions are better
than OFDP in terms
of the reduction in
CPU overload and
control traffic
It operates
regularly; this can
lead to needless
discovery traffic,
and it is unreliable
when applied in a
large network
environment
Azzouni et al.
[51]
LLDP packet
sOFTDP
It reduces CPU
utilization and
learning time, and
the study can detect
and prevent
spoofing attacks and
controller
fingerprinting
The study has not
been assessed in
larger testbeds and
cannot reliably
detect fabricated
links
(continued)
Efficient and Secure Topology Discovery in SDN: Review
405
Table 1. (continued)
Reference
Packet used
Technique
proposed
Merits
Limitation
Tarnaras et al.
[53]
LLDP packet
ForCES
It helps in resources
utilization and
effectively carries
out topology
discovery
Lacks open
implementation,
which leads to its
rejection and the
LLDP exchange
time is not
considered
Ochoa-Aday
et al. [54]
LLDP packet
SD-TDP
It enhances the
It does not address
performance of
the LLDP-based
topology discovery security threats
in SDN by reducing
the number of
messages and
discovery time
Hong et al. [55] LLDP packet
TopoGuard
The prototype is
effective to prevent
poison attacks with
minimal overhead
It is unreliable and
susceptible to replay
attacks since it
employs a static key
with no nonce
Nguyen & Yoo LLDP packet
[56]
OFDP
The study proves or
establishes that link
discovery is
vulnerable to
attacks
The study does not
include the
development of the
preventive measures
of the attacks
Alharbi et al.
[57]
LLDP packet
OFDP
Difficult for
It causes time delay
attackers to initiate and leads to
an effective Poison increased overhead
and replay attack,
and it carries out the
impact evaluation
on routing
Rojas et al. [58] TEDP frame
TEDP
There is a reduction
in CPU usage and
the amount of
bandwidth used
In a large data
centre, there is the
probability that the
network will
experience a delay
while discovering
topology
(continued)
406
O. I. Aladesote and A. Abdullah
Table 1. (continued)
Reference
Packet used
Technique
proposed
Merits
Limitation
Zhao et al. [59] LLDP packet
ESLD
Reduction of
packet-out
messages and can
prevent link
fabrication attacks
A Port classification
stage of ESLD
requires a
significant number
of messages, and
there is an increase
in CPU usage
Dhawan et al.
[60]
LLDP
packet
Sphinx
Able to detect
It has a single point
abnormal behaviour of failure
in network topology
and data plane
Ochoa-Aday
et al. [61]
LLDP
packet
SHTD
It allows network
devices to recover
from port failure
with less overhead
It cannot recover
from network
failure
Gu et al. [62]
LLDP packet
Im-OFDP
Reduction in
controller load
It is susceptible to
other attacks like
flooding
Jia et al. [63]
LADP frame
OFDP
Efficient and
reduces the
controller load with
no modification to
OFDP
It takes a long time
to discover the links
between switches
and is vulnerable to
attacks, as attacks
can occur if a
compromised host
links to a switch
before the
block-ports list
installation
Nehra et al.
[64]
LLDP packet
TILAK
It shows that all
controllers under
review are
vulnerable to one
attack or the other
Ineffective in
handling packet
integrity and it
consumes
bandwidth
Nehra et al.
[65]
SLDP frame
OFDP
It performs well in
terms of overhead
At the initial
iteration, the
network is
vulnerable to
attacks and its
efficiency need to be
improved upon
(continued)
Efficient and Secure Topology Discovery in SDN: Review
407
Table 1. (continued)
Reference
Packet used
Technique
proposed
Merits
Limitation
Chou et al. [66] CTAD LLDP
format
OFDP
It has the capacity
to detect abnormal
packets
Blocking a port that
sends more LLDP
packets without
further investigation
can cause the
removal of a legible
port from the
transmission
Tong et al. [67] Ethernet frame
OFDPx
There is a reduction
in the number of the
packet used and
effective use of
bandwidth
resources
The discovery time
may be high as
OFDP is used to
resolve faulty links
Baidya &
Hewett [68]
LLDP frame
OFDP
It can detect
poisoning attacks
from compromised
hosts and switches
It is not a secure
system as it can
only prevent
poisoning attacks,
and attackers can
forge LLDP packets
Chang et al.
[69]
LLDP
packet
OFDP
Reduction in both
the discovery time
and messages used
The study fails to
secure the topology
discovery
Hussain et al.
[70]
ICLF
ICLF
Capable of
discovering links in
a hybrid SDN and
there is a reduction
in packet_in
messages
It does not perform
well when there is
an increase in the
number of legacy
switches in an
Atlanta Topology
5 Challenges and Future Directions
Figure 1 depicts the progress made in the topology discovery in SDN over the past seven
years. Despite the significant progress made in pursuit of an efficient and secure link
topology discovery in SDN, several questions remain unanswered:
5.1 Standard Evaluation Metrics
The articles [50, 53], [72], [56, 59, 67, 69, 70] work on an efficient topology discovery,
the following researchers [55-57, 60, 63, 64, 66, 68] focus on a secure topology discovery
while [51, 57, 60] work on both efficient and secure topology discovery. These studies
use some of the following parameters to measure the performance of their work: number
408
O. I. Aladesote and A. Abdullah
of packet_out and packet_in messages sent and received by the SDN controller, CPU
utilization, learning time, mode of operation, bandwidth consumption, control location
for the discovery and discovery time. However, standard assessment criteria for measuring the performance of efficient and secure topology discovery are needed, as this will
aid in evaluating the quality of research in this area.
5.2 Need for Standardized Protocol
Efficient link discovery begins with the use of OFDP, in which the controller encapsulates
packet_in message with LLDP packet such that the controller sends packets to all switch
ports. It results in sending numerous packets to discover links between switches. Some
researchers [50, 55, 60, 61, 64, 67–69, 71] made minor modifications to enhance and
improve OFDP, by sending a packet_in message to the SDN switch with an instruction to
forward the packet into its ports. Other studies [51, 53, 56, 59],{Formatting Citation} use
a different protocol for the discovery. Each one creates a research gap that necessitates
additional investigation. Therefore, a standardized link discovery protocol is required.
5.3 Secured Cryptography Development
The link topology uses cryptography techniques such as HMAC, hash values, tHMAC,
MD5, etc., and a token-based approach to preventing attackers from carrying out malicious acts during the operation. It is worthy of note that the use of these cryptography
techniques has been ineffective in preventing attacks during the topology discovery [66],
and no other approach has guaranteed a secure system; without the assumption that one
or more of the following (the controller, switch, or host) is free from attacks. However,
there is the need for algorithms that will guarantee a secure system in topology discovery.
5.4 Hybrid Parameters Formation
All the researchers use one or both nodes (the controller, switch) to hold the control logic.
However, none of these researchers has conducted a single experiment employing the
above parameters to determine the optimum node. Therefore, more research is required
to develop a secure link topology discovery that identifies which node is the best to hold
the control logic.
6 Conclusion
We present a detailed analysis of the recent cutting-edge techniques for effective and
secure link topology discovery in SDN. We examine the packets, protocol/technique,
security technique, and controller used, all of which are important to the current study.
Each study is spotlighted, and the benefits and drawbacks of each are weighed. Also,
we provide performance evaluation metrics used in existing studies and also state future
research works. This survey paper can be useful for beginners and researchers who
want to conduct a new and additional study in link discovery topology. Beginners and
researchers who desire to conduct a new or further study in topology discovery may find
this survey article interesting.
Efficient and Secure Topology Discovery in SDN: Review
409
References
1. Mishra, S., AlShehri, M.A.R.: Software defined networking: research issues, challenges and
opportunities. Indian J. Sci. Technol. 10(29), 1–9 (2017)
2. Nisar, K., Welch, R., Hassan, R., Sodhro, A.H., Pirbhulal, S.: A Survey on the Architecture,
Application, and Security of Software Defined Networking. Internet of Things, 100289 (2020)
3. Yang, C.T., Chen, S.T., Liu, J.C., Su, Y.W., Puthal, D., Ranjan, R.: A predictive load balancing
technique for Software Defined Networked Cloud Services. Computing 101(3), 211–235
(2019)
4. Zhang, H., Cai, Z., Liu, Q., Xiao, Q., Li, Y., Cheang, C.F.: A survey on security-aware
measurement in SDN. Secur. Commun. Networks (2018)
5. François, J., Festor, O., Dolberg, L., Engel, T.: Network security through Software Defined
Networking: a survey. In: 14th Proceedings of the Conference of Principles, Systems and
Applications of IP Telecommunication (IPTComm), vol. 4, pp. 1–8 (2014)
6. Kreutz, D., Yu, J., Ramos, F.M.V., Esteves-Verissimo, P.: Anchor: logically centralized
security for software-defined networks. ACM Transactions on Privacy and Security 22(2),
2019
7. Alsaeedi, M., Mohamad, M.M., AlRoubaiey, A.A.: Toward adaptive and scalable OpenFlowSDN flow control: a survey. IEEE Access 7, 107346–107379 (2019)
8. Cox, J.H., et al.: Advancing software-defined networks: a survey. IEEE Access 5, 25487–
25526 (2017)
9. Shaghaghi, A., Kaafar, M.A., Buyya, R., Jha, S.: Software-Defined Network (SDN) data plane
security: issues, solutions, and future directions. In: Handbook of Computer Networks and
Cyber Security: Principles and Paradigms, pp. 341–387 (2019)
10. Kim, H., Feamster, N.: Improving network management with software defined networking.
IEEE Commun. Mag. 51(2), 114–119 (2013)
11. AlShammari, W.M., Alenazi, M.J.F.: BL-Hybrid: a graph-theoretic approach to improving software-defined networking-based data center network performance. Trans. Emer.
Telecommun. Technol. 32(1), 1–20 (2021)
12. Li, W., Meng, W., Kwok, L.F.: A survey on openflow-based software defined networks:
security challenges and countermeasures. J. Netw. Comput. Appl. 68, 126–139 (2016)
13. Blial, O., Ben Mamoun, M., Benaini, B.: An overview on SDN architectures with multiple
controllers. J. Comput. Networks Commun. (2016)
14. Marin, E., Bucciol, N., Conti, M.: An in-depth look into SDN topology discovery mechanisms:
Novel attacks and practical countermeasures. In: Proceedings of the ACM Conference on
Computer and Communications Security, pp. 1101–1114 (2019)
15. Phemius, K.: DISCO: Distributed Multi-domain SDN Controllers. https://hal.archives-ouv
ertes.fr/hal-00854899v2/document. Accessed 13 Feb 2021
16. Manzanares-Lopez, P., Muñoz-Gea, J. P., Delicado-Martinez, F.M., Malgosa-Sanahuja, J., De
La Cruz, A.F.: Host discovery solution: An enhancement of topology discovery in OpenFlow
based SDN networks. In. Proceedings of the 13th International Joint Conference on e-Business
and Telecommunications, vol. 1, pp. 80–88 (2016)
17. Toufga, S., Abdellatif, S., Owezarski, P., Villemur, T.: OpenFlow based topology discovery
service in software defined vehicular networks: limitations and future approaches. In: IEEE
Vehicular Networking Conference (VNC), 1–4 (2019)
18. Huang, X., Shi, P., Liu, Y., Xu, F.: Towards trusted and efficient SDN topology discovery: a
lightweight topology verification scheme. Comput. Networks 170, 107119 (2020)
19. Li, D., Wang, X., Gu, Y.: A model to detect faked link in software defined network. In: 2018 3rd
International Conference on Computational Modeling, Simulation and Applied Mathematics
310(CMSAM), pp. 109–114 (2018)
410
O. I. Aladesote and A. Abdullah
20. Paliwal, M., Shrimankar, D., Tembhurne, O.: Controllers in SDN: a review report. IEEE
Access 6, 36256–36270 (2018)
21. Campbell, A.T., Katzela, I., Miki, K., Vicente, J.: Open signaling for ATM, internet and
mobile networks (OPENSIG’98)”. Comput. Commun. Rev. 29(1), 97–107 (1999)
22. Xia, W., Wen, Y., Foh, C.H., Niyato, D., Xie, H.: A survey on software-defined networking.
IEEE Commun. Surv. Tutor. 17(1), 27–51 (2015)
23. Trotsek, D.: 済無No title no title. J. Chem. Inf. Model. 110(9), 1689–1699 (2017)
24. Rotsos, C., et al.: Network service orchestration standardization: a technology survey.
Comput. Stand. Interf. 54, 203–215 (2017)
25. Casado, M., et al.: SANE: a protection architecture for enterprise networks. In: 15th USENIX
Security Symposium, pp. 137–151 (2006)
26. Breu, F., Guggenbichler, S., Wollmann, D.J.: Forwarding and Control Element Separation
(ForCES) Protocol Specification, pp. 1–124 (2008). http://medcontent.metapress.com/index/
A65RM03P4874243N.pdf. Accessed 17 Aug 2020
27. Greenberg, A., et al.: IMSLP25164-PMLP56458-Steibelt_-_Rondos_and_Sonatinas. In:
ACM SIGCOMM Computer Communication Review, vol. 35, no. 5, pp. 41–54 (2005)
28. Casado, M., Freedman, M.J., Pettit, J., Luo, J., McKeown, N., Shenker, S.: Ethane: taking
control of the enterprise. In: ACM SIGCOMM Computer Communication Review, pp. 1–12
(2007)
29. Paliwal, M., Shrimankar, D., Tembhurne, O.: Controllers in SDN: a review report. IEEE
Access 1(6), 36256–36270 (2018)
30. Khairi, M.H.H., Ariffin, S.H.S., Latiff, N.M.A., Abdullah, A.S., Hassan, H.K.: A review of
anomaly detection techniques and Distributed Denial of Service (DDoS) on Software Defined
Network (SDN). Technol. Appl. Sci. Res. 8(2), 2724–2730 (2018)
31. Bera, S., Misra, S., Vasilakos, A.V.: Software-defined networking for Internet of Things: a
survey. IEEE Internet Things J. 4(6), 1994–2008 (2017)
32. Open Networking Foundation: Software-Defined Networking: The New Norm for Networks
[White Paper], pp. 1–12 (2012). https://www.opennetworking.org. Accessed 06 Apr 2020
33. Zhang, Y., Cui, L., Wang, W., Zhang, Y.: A survey on software defined networking with
multiple controllers. J. Comput. Networks Comput. Appl. 103, 101–118 (2018)
34. Kreutz, D., Ramos, F.M.V.P., Verissimo, E., Rothenberg, C.E., Azodolmolky, S.D.S., Uhlig,
S.: Software-defined networking: a comprehensive survey. Proc. IEEE 103(1), 14–76 (2015)
35. Rawat, D.B., Reddy, S.R.: Software defined networking architecture, security and energy
efficiency: a survey. IEEE Commun. Surv. Tutor. 19(1), 325–346 (2017)
36. Fan, Z., Xiao, Y., Nayak, A., Tan, C.: An improved network security situation assessment
approach in software defined networks. Peer-to-Peer Network. Appl. 12(2), 295–309 (2017).
https://doi.org/10.1007/s12083-017-0604-2
37. Lin, C.H., Li, C.Y., Wang, K.: Setting malicious flow entries against SDN operations: attacks
and countermeasures. In: IEEE Conference on Dependable and Secure Computing (DSC),
pp. 1–8 (2019)
38. Isyaku, B., MohdZahid, M.S., BteKamat, M., AbuBakar, K., Ghaleb, F.A.: Software
defined networking flow table management of OpenFlow switches performance and security
challenges: a survey. Future Internet 12(9), 147 (2020)
39. Jo, H., Nam, J., S. Shin, J.: NOSArmor: Building a Secure Network Operating System.
Security and Communination Networks
40. Prajapati, A., Sakadasariya, A., Patel, J.: Software defined network: Future of networking. In:
Proceedings of the 2nd International Conference on Inventive Systems and Control, (ICISC),
pp. 1351–1354 (2018)
41. Open Networking Foundation (ONF). https://www.opennetworking.org/wp-content/uploads/
2014/11/TR_SDN-ARCH-1.0-Overview-12012016.04.pdf. Accessed 11 Feb 2019
Efficient and Secure Topology Discovery in SDN: Review
411
42. Goransson, P., Black, C., Culver, T.: Software defined networks: a comprehensive approach
53(9) (2017)
43. Tijare, P.V., Vasudevan, D.: The northbound APIs of software defined networks. Int. J. Eng.
Sci. Res. Technol. 5, 501–513 (2019)
44. Tarnaras, G., Athanasiou, F., Denazis, S.: Efficient topology discovery algorithm for softwaredefined networks. IET Networks 6(6), 157–161 (2017)
45. Ochoa Aday, L., Cervelló Pastor C., Fernández Fernández, A.: Current Trends of Topology
Discovery in OpenFlow-based Software Defined Networks, 1–6 (2015)
46. Nehra, A., Tripathi, M., Gaur, D.M.S.: Global view in SDN, pp. 303–306 (2017)
47. Nehra, A.: Architectural improvements for architectural improvements for secure SDN
topology discovery, Ph.D. thesis (2019)
48. Khan, S., Gani, A., Abdul Wahab, A.W., Guizani, M., Khan, D.M.K.: Topology discovery
in software defined networks: threats, taxonomy, and state-of-the-art. IEEE Commun. Surv.
Tutor. 19(1), 303–324 (2017)
49. Pakzad, F., Portmann, M., Tan, W.L., Indulska, J.: Efficient topology discovery in software defined networks. In: 8th International Conference Signal Processing Communination
Systems ICSPCS 2014
50. Pakzad, F., Portmann, M., Tan, W.L., Indulska, J.: Efficient topology discovery in OpenFlowbased Software Defined Networks. Comput. Commun. 77, 52–61 (2016)
51. Azzouni, A. Boutaba, R., Trang, N.T.M., Pujolle, G.: sOFTDP: secure and efficient topology discovery protocol for SDN. In: IEEE/IFIP Network Operations and Management
Symposium: Cognitive Management in a Cyber World, NOMS, pp. 1–6 (2018)
52. Azzouni, A. Trang, N. T. M., Boutaba, R., Pujolle, G.: Limitations of openflow topology
discovery protocol. In: 16th Annual Mediterranean Ad Hoc Networking Workshop, MedHoc-Net, pp. 9–11 (2017)
53. Tarnaras, G., Haleplidis, E., Denazis, S.: SDN and ForCES based optimal network topology discovery. In: 1st IEEE Conference on Network Softwarization: Software-Defined
Infrastructures for Networks, Clouds, IoT and Services, NETSOFT 2015 (2015)
54. Ochoa-Aday, L., Cervelló-Pastor, C., Fernández-Fernández, A.: Discovering the network
topology: an efficient approach for SDN. ADCAIJ Adv. Distrib. Comput. Artif. Intell. J. 5(2),
101–108 (2016)
55. Hong, S., Xu, L., Wang, H., Gu, G.: Poisoning network visibility in software-defined networks:
new attacks and countermeasures. In: 2015 Network and Distributed System Security (NDSS)
Symposium, pp. 8–11 (2015)
56. Nguyen T.H., Yoo, M.: Analysis of link discovery service attacks in SDN controller. In:
International Conference on Information Networking, pp. 259–261 (2017)
57. Alharbi, T., Portmann, M., Pakzad, F.: “The (In)Security of topology discovery in openflowbased software defined network. Int. J. Network Secur. Appl. 10(3), 01–16 (2018)
58. Rojas, E., Alvarez-Horcajo, J., Martinez-Yelmo, I., Carral, J.A., Arco, J.M.: TEDP: an
enhanced topology discovery service for software-defined networking. IEEE Commun. Lett.
22(8), 1540–1543 (2018)
59. Zhao, X., Yao, L., Wu, G.: ESLD: an efficient and secure link discovery scheme for softwaredefined networking. Int. J. Commun Syst 31(10), 1–18 (2018)
60. Dhawan, M., Poddar, R. Mahajan, K., Mann, V.: SPHINX: detecting security attacks in
software-defined networks, pp. 8–11(2015)
61. Ochoa-Aday, L., Cervello-Pastor, C., Fernandez-Fernandez, A.: Self-healing topology discovery protocol for software-defined networks. IEEE Commun. Lett. 22(5), 1070–1073
(2018)
62. Gu, Y., Li, D.. Yu, J.: Im-OFDP: an improved OpenFlow-based topology discovery protocol
for software defined network, pp. 628–630 (2020)
412
O. I. Aladesote and A. Abdullah
63. Jia, Y., Xu, L., Yang, Y., Zhang, X.: Lightweight automatic discovery protocol for OpenFlowbased software defined networking. IEEE Communun. Lett. 24(2), 312–315 (2020)
64. Nehra, A., Tripathi, M., Gaur, M.S., Battula, R.B., Lal, C.: TILAK: a token-based prevention
approach for topology discovery threats in SDN. Int. J. Commun. Syst. 32(17), 1–26 (2019)
65. Nehra, A., Tripathi, M., Gaur, M.S., Battula, R.B., Lal, C.: SLDP: a secure and lightweight
link discovery protocol for software defined networking. Comput. Netw. 150, 102–116 (2019)
66. Chou, L.D., et al.: Behavior anomaly detection in sdn control plane: a case study of topology
discovery attacks. In: 10th International Conference on ICT Convergence: ICT Convergence
Leading the Autonomous Future, pp. 357–362 (2019)
67. Tong, H., Li, X., Shi, Z., Tian, Y.: A novel and efficient link discovery mechanism in SDN,
pp. 357–362(2019)
68. Baidya, S.S., Hewett, R.: Link discovery attacks in software-defined networks: topology
poisoning and impact analysis. J. Commun. 15(8), 596–606 (2020)
69. Chang, Y.C., Lin, H.T., Chu, H.M., Wang, P.C.: Efficient topology discovery for softwaredefined networks. IEEE Trans. Netw. Serv. Manage. 18(2), 1375–1388 (2021)
70. Hussain, M.W., Reddy, K.H.M., Rodrigues, J.J.P.C., Roy, D.S.: An indirect controller-legacy
switch forwarding scheme for link discovery in hybrid SDN. IEEE Syst. J. 15(2), 3142–3149
(2021)
71. Azzouni, A., Boutaba, R., Trang, N.T.M., Pujolle, G.: SOFTDP: secure and efficient OpenFlow topology discovery protocol. In: IEEE/IFIP Network Operations and Management
Symposium: Cognitive Management in a Cyber World, pp. 1–7 (2018)
The Good, the Bad, and the Ugly: Review
on the Social Impacts of Unmanned Aerial
Vehicles (UAVs)
Mohammed Yaqot and Brenno Menezes(B)
Division of Engineering Management and Decision Sciences, College of Science and
Engineering, Hamad Bin Khalifa University, Doha, Qatar Foundation, Qatar
bmenezes@hbku.edu.qa
Abstract. Cutting-edge technologies in drones or unmanned aerial vehicles
(UAVs) have the potential to transform and disrupt businesses and economic sectors. UAV technology can reconfigure the design and operation of services, resulting in improved productivity expansion and economic growth. Multiple studies
extol the potential social, economic, and environmental tradeoffs of this technology by outlining processes that could be optimized along the value chain.
However, the picture does not have to be completely positive. Although UAVs
have the power to transform and significantly enhance our society, there are still
certain socio-techno-economic consequences associated with the way this technology is applied. This paper presents an overview of recent trends in researching,
developing, and deploying (RD&D) the most extensively UAVs applications usage
towards drones as a service (DaaS). These themes will be discussed in threefold
method: the ‘Good UAVs’ explores how these technological tools can promote
our societies; the ‘Bad UAVs’ discusses a more nuanced view of the potential
negative externalities generated by drones. Finally, the ‘Ugly UAVs’ investigates
the possible risks generated by commercial drones. All themes have been briefly
exemplified in the agriculture industry. The level of automation linked with the
human factor in-, on-, and out-the loop of cyber-physical systems should be given
more research attention, emphasizing and capturing inner social perspectives of
commercial UAVs. Deploying new technologies should be based on the quality
and value of the job itself to create a new class of human workers who can be
evolved and are not just be valuable but be valued.
Keywords: UAVs · Drones · Data · Social · Human-machine · Technology
1 Introduction
The current trend in academia and industries towards exploring, researching, developing, testing, and deploying novel apparatuses and operations in engineering management
within the so-called precision engineering is revolutionizing industrial sectors. The transformations in every working environment are accelerating at a never-before-seen pace
and scale. This fast shift has put labor markets off-kilter and produced a very volatile
© The Author(s), under exclusive license to Springer Nature Switzerland AG 2022
F. Saeed et al. (Eds.): IRICT 2021, LNDECT 127, pp. 413–422, 2022.
https://doi.org/10.1007/978-3-030-98741-1_34
414
M. Yaqot and B. Menezes
business environment in which competitive advantages are becoming more transitory.
Evolving market disruptions facilitate new ways of getting work done by emerging societies’ collective intelligence, where a talented workforce overtakes capital as a critical
driver of corporate success. Population growth rate, technological advancement, increasing over-choice, and state-of-the-art working environment are some key structural and
cyclical trends driving societies’ transformation.
Globally, the population is rapidly aging while birth rates are declining [1]. In the
technological society, employers are having a more challenging time finding employees
with the necessary skills. Organizations will need to better tap underutilized talent pools
like all the workers, glass ceiling, women, minorities, migrants, and people with disabilities. The fourth industrial revolution, or what is known as Industry 4.0 (I4), is evolving
at an unprecedented pace, lowering barriers and boosting transparency at all levels. Individuals are also finding it increasingly difficult to maintain their skills up to date, which
results in a growing bifurcation in the workforce between those with in-demand skills
and those without them. The technological revolution’s impact on work has started with
the rise of automation, robotics, and artificial intelligence to the emergence of new business models like the sharing economy, circular economy, crowdsourcing of expertise in
a freelancing fashion, and on-demand employment. Over time, multiple jobs and several
career waves are in constant need of new skills. The employer-employee relationship
is changing dramatically, where most individuals now concentrate on career security
(relying on up-to-date knowledge) rather than long-term positions in the working environment. This entails gaining the required skills and competencies to advance their
independence from their employer. Organizations are using big data and supply chain
strategies in their human resource functions, which has made recruiting and retention
more complex. The demand for real-time insights into workforce practices and work
requirements leads organizations to seek new ways to increase efficiency and boost
productivity.
This paper is a continued discussion opened by Yaqot et al. [2] and Yaqot and
Menezes [3] on UAVs applications from a socio-techno-economic perspective as an
efficient manpower replacement tool in engineering disciplines. In the current case, we
are emphasizing more the agriculture industry. Agricultural processes are still considered labor-intensive duties, where its level of automation is considered low compared to
other industries. In such a field, artificial intelligence (AI) has the potential to be manifested as the intelligent diversion and automation of processes with human in-on-out
of the loop of cyber-physical systems (CPS) for enhanced modeling to improve operational efficiencies. Agricultural communities and industries need to have a strategic
view on continuous improvement techniques through executing easier, better, faster, and
cheaper plans to maintain and further improve competitive operational excellence. Current debates indicate that investments in UAVs capabilities will remodel vast operational
processes under social pillar principles, resulting in a process system re-engineering [2].
Agricultural UAVs can enhance processes’ economies of scale coupled with eco-friendly
applications, but the social consequences are still controversial.
In this paper, the discussions on UAVs are explored in a threefold method. Initially,
we present the “Good” aspects as the potential vast benefits of UAVs and how likely
The Good, the Bad, and the Ugly
415
it increases as AI is on constant refinement, leading societies into a new era of enormous prosperity. In the “Bad”, we show the negative side of UAVs and their drawbacks
with arisen societal anxieties. In the “Ugly”, it presents why UAVs are not considered
destructive because of their misuse; rather, they become ugly by the fact that it would
obliterate many human jobs and cause major social disruption in the first place, as well
as to its overlooked hazardous risks. Automation is inevitable due to its economic advantages, but privacy, regulations, and technical issues are still in the development stage.
This argument aims to address how these three aspects of the same phenomena (UAVs
technology) with distinct objectives can be joined in a successful pathway for society.
2 The UAV Era
Drone or UAV is an ambiguous term that refers to any unmanned vehicle, irrespective of
its operating medium (land, sea, or air). Therefore, it is quite often referred to as drones,
despite the fact that the terminology used to describe drones and autonomous systems
might be perplexing at first. The literature has referred to UAVs as remotely piloted aircraft, remotely piloted vehicles, unmanned aircraft, remote sensor platforms, pilotless
aircraft, and robot planes, where UAV is a remotely piloted vehicle controlled from a
ground control station. In 2005, the Federal Aviation Administration (FAA) adopted
the idiom “unmanned aircraft system” (UAS) to refer to the whole integrated operation
system environment, which encompasses the air vehicle, the ground-based control station, and the communication modules, as seen in Fig. 1 [4]. The commercial UAVs are
being customized with new functionalities added in a vast scope of niche domains due
to the upgrowth and integration of inexpensive technologies. Massive customization of
UAV applications on a large scale is now viable, and human societies are becoming more
interlinked and intelligent due to technological advancements. The human-machine relationship in the division of work is always becoming vague and redefined in all disciplines
[5, 6]. The applications of UAS technology in the Industry 4.0 mandate have boomed as
a pre-necessity of evolving to the next generations of the so-called Society 5.0.
Fig.1. Typical UAS architecture.
416
M. Yaqot and B. Menezes
3 The Good of UAVs
In contrast to the past, the contemporary era is characterized by a focus on connection,
quality, quantity, dynamic changes, and service values. Service science has both tangible and intangible elements, and the interaction between them is active in the exchange
fusion and value creation. Drones are cracking massive boundaries in the way businesses
operate. With sophisticated airborne sensors and add-on technologies, it precisely allows
many enterprises to see, sense, move, and transform the physical world [7]. The resulted
forms of big data can be analyzed and processed using machine learning and artificial intelligence to create several applications, also known as data analytics (DA). DA
techniques ensure super-fast optimized decisions to maximize efficiency, minimize cost,
and, at the same time, promote safety, since UAV applications are industry agnostic with
specialization occurring using different robust sensors and DA techniques (descriptive,
detective, predictive, and prescriptive). With these DA techniques in an automated fashion, some sort of cognitive analytics can be reached to promote adaptive and learning
processes [8].
For example, multifunctional agriculture is a broad concept encompassing agricultural productivity, sustainable resource management, and socioeconomic viability [9].
As a labor-intensive industry and having lower levels of automation when compared
to other industries, a new stage of this industry, towards the so-called precision agriculture, aims to substantially increase the production of arable crop yields. By 2050,
global population growth is expected to exceed 9.7 billion people, 27% higher than in
2020, and meeting food demand is crucial [10]. In this stage, farmers are still seeking
innovative methods to save costs and maximize yields. By using UAVs, they can capture
data faster, perform precise monitoring, boost production, optimize efficiency, and automate unnecessary activities. For example, large-scale acres can be sighted and utilized
autonomously using agriculture UAV in an extremely fast timescale, resulting in accurate control resource management, e.g., water, spraying, fertilizers, and pesticides. As a
result, it is an eco-friendly tool where soil contamination is decreased since fewer herbicides are consumed. Furthermore, heavy fossil-fueled machinery does not create soil
compaction. It is also worth mentioning that agroecological farming is becoming more
feasible because of fewer emissions resulteding from low-altitude flights and effective
spraying technologies [3].
4 The Bad of UAVs
When it comes to commercial UAVs appraisal, social communities can be split into two
groups: enthusiasts or adversaries. As numerous sectors are altered by drones, social
views and behaviors, resulting from their impact on our everyday lives, change. The
advent of UAVs is challenging traditional conceptions in some interconnected dimensions of stability, technical security, personal privacy, data ownership, shared liability,
and administrative regulation. This conflict creates significant barriers to its inclusion
into present public and private companies, as well as personal use [11]. The arisen societal anxieties of UAVs can be categorized into three main domains; social, technical, and
systemic, in which each can be seen as an issue, obstacle, or barrier [12]. Social issues
The Good, the Bad, and the Ugly
417
are oriented on fear the new. It refers to anything a person inwardly comprehends, which
may or may not be built on fact and might even be driven by public media, common
understanding, cluelessness, or deception. On the other hand, technological issues refer
to the technical and procedural competencies (human-machine interaction) that stymie
UAVs’ evolution is influenced by contemporary expertise in the context of technology.
At the same time, people are negatively affected by the emotionless estimated vision
of where technological advances may go. Furthermore, it encompasses factors such as
safety, security, reliability, technological capability, trustworthiness, and fast scalability.
Finally, the systemic challenges that point to all issues linked with building up system solutions, are unparalleled in UAVs development speed for its integration into the
standard airspace aviation system and requirements.
These three domains (social, technical, and systemic) can be plotted within the triangle of the “good”, “bad”, and “ugly” on the implications of the UAV in society, as
seen in Fig. 2. Starting from the base of the triangle, in the orthogonal projection of
the “good”, there is nothing rather than the human (H), where, a) its replacement by
any technology, b) the desired requirement of systematic procedures, and c) any sort of
robustness from the merge of social, technical, and systemic aspects, are not mandatory.
This stage belonged to pre-industrial periods, although agricultural civilizations such
as the pre-Colombian ones (Inca, Azteca, Maya) applied techniques to agriculture in
a systematic way, in which the societal structure had been defined. After such time in
humankind’s history, in the industrial societies, demands of requirements of management of systems and cascade of workloads denoted that the human was controlling the
decisions to carry out actions in the progress of the processes. This stage is known as
human-in-the-loop (HITL), also named human-centric-automation.
Fig.2. Threefold social impact of UAVs.
Moving up inside the triangle in Fig. 2, from the basis of the social ground, there
was the period of history when started the requirements of systematic procedures and
advances in technology by the evolution of industry (from the mechanical and electrical
powers to the digital processing). In this era, the idea of human-on-the-loop (HOTL)
was initiated from when human beings have taken decisions based on information of
the systems. Today, as an aftermath of the so-called smart industry of the I4 mandate,
418
M. Yaqot and B. Menezes
the spread of the human-out-of-the-loop (HOOTL) cycle brings the state-of-the-art of
a fully automated decision-making environment without human intervention. In such a
place, the pace and path of the human-machine interaction push the robustness to the
targeted level of performance to be matched when starts the non-human cognition of the
artificial intelligence and advanced analytics techniques.
As an assessment of a field where UAV technologies are transforming the humanrelated work, Yaqot and Menezes [3] analyze the application of such mechanical, electrical, digital, and smart novelties in the agriculture industry. With radical new technologies
and working techniques, the digital transformation of farms is reshaping the agriculture
face and revolutionizing production, but this comes at social consequences due to the
current operating limitations. Digitizing key labor-intensive routine tasks in agriculture
will evoke a new set of social externalities for both farmers and farmworkers. For example, UAVs displaces farmworkers from time-consuming, tedious cultivation activities
(e.g., fertilizing, spraying, monitoring, inspection, etc.). In addition, employing agriculture drones will gradually force farmers to raise automation investments and make
it difficult for them to find enough skilled workers in such technologies. Farming has
always been seen as a risky working environment, with low-profit margins and more
frequently volatile inconsistent yields, such as rivalry for water and land, labor shortages, low wages, harsh conditions, labor justice, inadequate infrastructure, and rising
environmental regulations to an already onerous agenda [2]. However, there are direct
jobs for people who design, operate, extract, and maintain agricultural UAV applications. In addition, sometimes, complete new industries may be built on the applications
throughput, e.g., pre-production, production, and post-production farming activities. By
aligning business vision with digital strategies, complexities are simplified by integrating all agriculture’s entities and conceivable cloud computing models like infrastructure
as a service (IaaS), software as a service (SaaS), platform as a service (PaaS), and data
as a service (DaaS) to run a digital ecosystem into a single hub anything as a service
(XaaS), which in this case can be so-called drones as a service (DaaS). Nevertheless, the
forgotten part is the indirect effect of labor-saving inventions since organizations can do
more with less to expand and maybe add new large-scale processes.
5 The Ugly of UAVs
With the rise of UAV in society, what could best be described as ugly is that people will
not just be unemployed but being unemployable. The reason for this ugly scenario is
that the wealth that technology creates is not necessarily shared with all workers, especially the labor-intensive of the so-called blue-collars. This is known as sociotechnical
change. Such a situation can be proved when the income of most families stays flat
or in decline as the economy grows and the inflation rate is accumulated [13]. Even if
the unemployment rate remains low, automation may exacerbate economic inequality,
especially in the United States, which currently has an inequality higher than in most
other developed countries. However, since governments decide how a society confronts
disruptions, technology is not destiny, which worries people on all sides of the argument
regarding risks and the future of work.
According to a recent widely referenced analysis [14], robotics will overtake 47%
of United States jobs due to technological automation capabilities in the next one or two
The Good, the Bad, and the Ugly
419
decades. However, it did not attempt to determine the actual extent of automation or its
overall impact on employment. It also does not imply that new employment would occur
immediately (time gap) or would be placed in an exact location (geographic gap), nor
will it pay the same wage (skills gap) as the ones that were lost or replaced (Fig. 2). As
a result, the need for human work has not gone away.
Furthermore, the increased usage of UAVs has raised public concern and debate,
particularly over privacy and safety issues. Therefore, a detailed literature review [15] of
commercial UAVs spanning 2010 to 2015 is carried to investigate societal, governance,
privacy, and ethical dimensions of their usage, driven by a techno-ethical framework
which is the study of technology influence on ethical and moral values of societies. The
findings imply that, while commercial UAVs may help improve livelihood and boost efficiency, more attention must be made to unforeseen repercussions and potential negative
consequences in order to encourage commercial UAVs’ ethical use. While the agriculture
industry has begun a radical transformation in the last fifteen years, agriculture evolved
from a labor-intensive industry to mechanized and robotic-intensive production systems spanning the previous century. During this shift there was a constant labor outflow
from agriculture, primarily from standardized tasks within the production processes. In
today’s stage of the industrial evolution applied to engineering and society, which is
based on cost-effective methods facilitated by AI, UAVs can now be used to perform
non-standardized tasks (e.g., weed control, crop protection, etc.) formerly assigned for
human workers at a faster and more efficient pace. Consequently, automation in agriculture is no longer restricted to standardized tasks within production systems [16]. Even
though the robotic ecology has significant ethical, legal, and social implications, UAVs
will drastically collaborate with humans rather than eliminate them in many agriculture
instances.
6 Discussion
As the debate continues, scholars, labor entities, theoreticians, and practitioners involved
in any discussion on the advantages of new technology should include the quality and
value of the job itself. A new class of human workers can be developed who are not just
be valuable but be valued if we can use technological advancement to make them more
skilled, productive, and more efficient. The most cutting-edge technology on current
markets will eventually become standard and inexpensive tools, implying that the true
power and potential lie with the people who work (blue-collars) and, more specifically,
agriculture workers. Robotics involving UAVs are significantly faster, efficient, precise, and accurate in capturing, processing, analyzing, and extracting data compared to
powerless human capabilities. In robotics and integrated cyber-physical systems, a shift
in human-factor involvement from in-the-loop to on-the-loop to out-of-the-loop can be
observed, which is also widely noticeable in recent Internet of Things (IoT) applications.
Because of the rising amount of data from numerous sources that should be processed,
integrated, and then interpreted into decision-making, the transition from (in-on-out) of
the loop has exponentially evolved from a complete human interaction (H) to the humanin-the-loop (HITL), a type of a human-centric-automation engine, which denotes that
the human had the control or decision required to carry out an action in the system. In
420
M. Yaqot and B. Menezes
the further state, a human-on-the-loop (HOTL) represented human decisions relying on
information gathered from the system. That, with the rise of the widespread information and computing technologies (ICT) of the new century of Industry 4.0, yielded the
human-out-of-the-loop (HOOTL) within the autonomy of the processes (without human
intervention) in the decision-making environment (Fig. 3).
Fig. 3. Human-machine interaction and levels
Due to the extreme potential for rapid deployment and high return on investment,
the use of UAVs has become a hot topic in the business sector. However, UAVs are a
novel technology, and further research is needed to leverage positive societal impact on
our daily lives. Instead of prohibiting physical usage due to safety concerns, a new set
of systematic policies and regulations should have a broader social viewpoint.
From laboratory-level to mature industries, advanced manufacturing production systems are evolving to identify, design, and evaluate new opportunities in the way forward
of research, development, and deployment (RD&D) stages [17]. The three parameters
have been broken further to some key features and then evaluated based on the RD&D
stage, requirement, and whether good, bad, or ugly (Table 1).
The Good, the Bad, and the Ugly
421
Table 1. UAVs social impacts
Social
Technical
Systematic
Commercial UAVs impact
RD&D stage
Req. a
Type
Replacement
Research
↑↑☻
Ugly
Awareness
Research
↑↑☻
Bad
Trust
Research
↑↑☻
Ugly
Skills
Research
↑↑☻
Bad
Privacy
Research
↑↑☻
Ugly
Social safety
Research
↑↑☻
Bad
Job security
Research
↑↑☻
Ugly
Ethical use
Research
↑↑☻
Ugly
Harassment
Research
↑↑☻
Bad
Safety
Development
↑☻
Bad
Privacy
Development
↑☻
Ugly
Ownership
Development
↑☻
Ugly
Malfunctions
Development
↑☻
Bad
Security
Development
↑☻
Bad
Task-time
Deployment
↔
Good
Accuracy
Deployment
↔
Good
Efficiency
Deployment
↔
Good
Business model
Research - Development
↑↑
Bad
Operating system
Research - Development
↑↑
Bad
Liability
Development
↑↑☻
Bad
Regulation
Research - Development
↑↑☻
Bad
a Note: requitements, ↔: stable; ↑: demanded; ↑↑: highly demanded; ☻human risk
7 Conclusion and Future Work
The expansion of smart mobile applications, wireless communication systems, and
internet infrastructure has greatly influenced trade and development in a globalized
knowledge-based society. The interaction between information and communication technologies and human-machine aspects are critical for revolutionizing businesses, job
creation, e-commerce, and socio-economic growth. Governments are required to foster
productive and inclusive use of UAVs by providing the necessary physical infrastructure,
policy, institutional, legal, ethical, and socio-technical frameworks to create trust and
thereby more productive use of UAV applications in the agribusiness industry, among
others. Data analytics via drones as a service may aid in the conservation of biodiversity and ecosystems by providing farmers with information on sustainable and precise
farming practices as well as new market avenues.
422
M. Yaqot and B. Menezes
By the reduced literature on UAVs, we cannot provide in-depth coverage of certain
application domains. The agriculture industry is exemplified from a strategic business
point of view due to its low level of automation and towards the digital ecosystem. The
development and deployment of UAVs in numerous fields are the subjects of intense controversy, from where we focus on their societal implications. Finally, this work foresees
further investigation to involve needed socio-technical systems and level of automation
linked with human factor in-, on-, and out-the-loop of CPS studies through scholarly
research focusing on capturing inner perspectives on UAVs regulation. As such, surveys
need to be undertaken to gather practical procedures from UAVs specialists. Furthermore, an inherent quantitative approach on the impact of UAVs as complementarity
versus substitution of human workers is required.
References
1. World-Bank Homepage, World Population Prospects: 2019 Revision, World Bank Open Data
(2021)
2. Yaqot, M., Menezes, B.C., Al-Ansari, T.: Unmanned aerial vehicles in precision agriculture
towards circular economy: a process system engineering (PSE) assessment, pp. 1559–1565.
Computer Aided Process Engineering, Istanbul (2021)
3. Yaqot, M., Menezes, B.C.: Unmanned aerial vehicle (UAV) in precision agriculture: business
information technology towards farming as a service. In: 1st International Conference on
Emerging Smart Technologies and Applications, pp. 1–7. IEEE, Sanaa (2021)
4. Elias, B.: Unmanned aircraft operations in domestic airspace: US policy perspectives and the
regulatory landscape, pp. 1–29 Congressional Research Service (2016)
5. Doyle Kent, M., Kopacek, P.: Do we need synchronization of the human and robotics to
make industry 5.0 a success story? In: Durakbasa, N.M., Gençyılmaz, M.G. (eds.) ISPR 2020.
LNME, pp. 302–311. Springer, Cham (2021). https://doi.org/10.1007/978-3-030-62784-3_25
6. Jarrahi, M.H.: Artificial intelligence and the future of work: Human-AI symbiosis in
organizational decision making. Bus. Horizons 61(4), 577–586 (2018)
7. Maghazei, O., Netland, T.: Drones in manufacturing: exploring opportunities for research and
practice. J. Manuf. Technol. Manag. 31(6), 1237–1259 (2019)
8. Menezes, B.C., Kelly, J.D., Leal, A.G., Le Roux, G.C.: Predictive, prescriptive and detective
analytics for smart manufacturing in the information age. IFAC-Papers Online 52(1), 568–573
(2019)
9. Li, K., et al.: Field management practices drive ecosystem multifunctionality in a smallholderdominated agricultural system. Agr. Ecosyst. Environ. 313, 107389 (2021)
10. UN. http://www.ncbi.nlm.nih.gov/pubmed/12283219. Accessed 20 Aug 2021
11. Rao, B., Gopi, A.G., Maione, R.: The societal impact of commercial drones. Technol. Soc.
45, 83–90 (2016)
12. Kraus, J., Kleczatský, A., Hulínská, Š: Social, technological, and systemic issues of spreading
the use of drones. Transp. Res. Procedia 51, 3–10 (2020)
13. Charalampidis, N.: The U.S. Labor income share and automation shocks. Econ. Inq. 58(1),
294–318 (2020)
14. Frey, C.B., Osborne, M.A.: The future of employment: how susceptible are jobs to
computerisation? Technol. Forecast. Soc. Chang. 114, 254–280 (2017)
15. Luppicini, R., So, A.: A technoethical review of commercial drone use in the context of
governance, ethics, and privacy. Technol. Soc. 46, 109–119 (2016)
16. Marinoudi, V., Sørensen, C.G., Pearson, S., Bochtis, D.: Robotics and labour in agriculture.
A context consideration. Biosyst. Eng. 184, 111–121 (2019)
17. Menezes, B.C., Kelly, J.D., Leal, A.G.: Identification and design of industry 4.0 opportunities in manufacturing: examples from mature industries to laboratory level systems.
IFAC-PapersOnline 52(13), 2494–2500 (2019)
Big Data Analytics for Large Scale Wireless
Body Area Networks; Challenges,
and Applications
Haider Rasheed Abdulshaheed1 , Haider Hadi Abbas2
and Israa Al-Barazanchi1,4(B)
, Ehsan Qahtan Ahmed3 ,
1 Computer Engineering Techniques Department, Baghdad College of Economic Sciences
University, Baghdad, Iraq
haider252004@yahoo.com
2 Computer Technology Engineering Department, Al-Mansour University College (MUC),
Baghdad, Iraq
haider.hadi@muc.edu.iq
3 Department of Computer Science, AL Nahrain University, Baghdad, Iraq
Ehsan.qahtan@nahrainuniv.edu.iq
4 College of Computing and Informatics, Universiti Tenaga Nasional (UNITEN),
Kajang, Malaysia
Israa44444@gmail.com
Abstract. With the development of technology and connectivity, it is has become
easier to gather data regarding a necessity, and use that to analyze, observe and
provide solutions to day-to-day problems. The development of science and technology has brought immense benefit and comfort to human society allowing us
to venture further with ease. The same applies to Wireless Body Area Network
(WBAN), the system that measures the medical parameters of a human subject to
treat his or her ailments. The data gathered from various patients can be collected
and provided to the medical authority and doctors accordingly. This is used to generate patterns from a definitive source and provide clarity of the patient’s disease
and/or any condition to the doctors. However, doing that for many patients and
hospital records requires an immense amount of time and people. This is where
big data analytics comes into play, a cloud based analytics technology that scans
extraordinarily large amounts of data, identifies similarities and differences, and
observes the patterns to help doctors solve their patients’ diseases or conditions.
Using this technology prevents unnecessary deaths of patients. This paper will
explain the implementation process of big data analytics in large scale WBAN,
the difficulties and challenges that may occur, and its applications and benefits.
Keywords: Big data analytics · Large scale WBAN · Cloud · Wireless sensor
network
© The Author(s), under exclusive license to Springer Nature Switzerland AG 2022
F. Saeed et al. (Eds.): IRICT 2021, LNDECT 127, pp. 423–434, 2022.
https://doi.org/10.1007/978-3-030-98741-1_35
424
H. R. Abdulshaheed et al.
1 Introduction
Big data analytics is a business and commercially based analytical tool, based on the
existing methods of analyzation and with upgraded automation and cloud systems. It is
made to handle huge amounts of data, technically in terabytes and petabytes, and produce
accurate human-like, or better, analyzation results. The paper focuses on explaining the
methods and practices of both big data analytics and large scale WBAN individually,
and then the implementation process of big data in WBAN. The common challenges,
benefits, and the application of both the methods are discussed in detail with respect to the
implementation process. The process of implementing big data analytics in the healthcare
stream is simple and can be carried out using different methods. The first steps would
be the initialization of both big data analytics and WBAN separately, with a big data
analytics cloud system being set up correspondingly with the WBAN system. Each of
the systems has its own methods of action and usage, and each of them are to be carefully
designed depending on the end consumer. With the initialization completed, the WBAN
is connected to the cloud system through basic to high security measures and encryption
process depending on the sensitivity of the raw data. Once the primary implementation
is carried out, the overall processing is monitored and possible chances of errors in
the functioning of the system, analytical and pattern prediction errors, internal network
errors, and failure of sensor units. With this setup achieved, doctors and the hospital
management can then communicate with the patient either directly via the internet or
via private mobile apps to ensure the patient’s health condition improves. The sensor
measurements are constantly fed into the system, and possible critical health conditions
are easily predicted even before they occur. The methodology will be further elaborated
in depth in the following topics, [1, 2].
2 Big Data Analytics
Big Data Analytics simply refers to the analyzation of huge amounts of data in batches or
clusters. The idea was introduced to reduce human work and errors and reduce the time
consumption while increasing the accuracy of the analyzation results. Big data analytics
is a cloud based technology and, by means of the internet, companies can directly upload
their data records and process all the information of the analysis in no time. In recent
years, big data was brought into the healthcare field to improve treatment methodologies
and assisted living systems. Through the internet, all the data collected from the WBAN
installed on the patient is fed to the cloud system, where the analyzation process is
carried out by software frameworks and AI systems. This technique makes it faster and
easier to learn about a patient’s condition and treat him or her appropriately and it also
allows doctors to constantly check on their patients. The advantages of this are faster
and cheaper analytics, plus easily and remotely accessible information which is reliable
and accurate. The disadvantages are that traditional data analysts have lost their jobs,
also security attacks might sabotage the workflow and cause some vulnerabilities in the
system. Figure 1 shows the Big Data Analytics System [3, 4].
Big Data Analytics for Large Scale Wireless Body Area Networks
425
Fig. 1. Big data analytics system
2.1 Characteristics of Big Data Analytics
There are various characteristics that determine the type and usability of a big data
analytics system, explained as follows. Each of these characteristics may or may not
influence each other, depending on its magnitude [5–7].
• Velocity: Velocity refers to the continuous flow of data fed to the cloud base, and the
amount of data that can be processed at one time with respect to the rate of data flow.
his is providing a clarity of how much data and how fast the data is being processed by
the system. Since, data flows from various resources and aspects, and different priority
levels are provided for various sources, it is necessary to learn of this characteristic to
fully use the analytics system.
• Volume: Volume refers to the immense amount of data that are to be processed and
stored. This only requires an efficient cloud storage system. There is nothing much
to improvise here, except for a proper backup system, which will be managed by the
cloud storage system. Through this, the raw data, and processed data, from WBAN,
is collected by doctors and hospital authorities for further usage.
• Variety: Variety refers to the different sets of data, and how the system should be able
to distinguish them and process each data as defined by the user. This will widely vary
depending on the field in which big data analytics is used. For WBAN, the variety of
data may come from the heartbeat sensor, breathing levels, blood pressure and so on,
depending on the patient.
• Veracity/Value: Veracity or value refers to the quality of the data received. Some data
might become corrupted and provide different values than the original data, some data
might contain values that are too high or low, and the analysation process might suffer
and provide inaccurate results. For WBAN, this is solved by providing higher/lower
limits for data received, and by consistent maintenance of the whole WBAN system
and the physical sensors.
• Volatility: This refers to the validity of the data, or the time period after which the
data is rendered useless. This is for data that are constantly changing or data that has
already expired and cannot be processed, or in case the data can be processed the end
analysation will be fruitless due to the volatility of the data. This characteristic is very
important in terms of WBAN, since some factors might have short volatility and some
factors might have to be read for longer times.
426
H. R. Abdulshaheed et al.
2.2 Methods of Analytics
Big data analytics can be implemented using many different analytical methods, either a
singular or a hybrid method to perform the analyzation process. The methods, and their
advantages and disadvantages will be explained in relation to WBAN and healthcare
systems [8–13].
Data Mining: Data mining is the purpose of examining and observing patterns in unorganized data. The process works by comparing various random data and discovering the
pattern; therefore data mining is the most used and preferred analytical method, because
of its straightforward method and accuracy.
Data Management: Data management is a sub process of the analytics system, and
can subsequently with other analytical methods, allowing users to view their processed
data and records. The data management system makes it easier to store data, process
data, and organize and manage all the raw data and information making things easier for
both the user and the system. There are no considerable pros or cons for this system.
In-memory Analytics: In In-memory analytics, the entire raw data is stored in the Random Access Memory (RAM), which acts as a temporary memory. In-memory analytics
is preferred for faster analysation process; ‘In-Memory’ refers to 64 bit architecture with
RAM, meaning the time taken for the system to read and write from the hard storage is
greatly reduced since the entire user data and database and the processed information is
stored on the RAM drives.
Predictive Analysis: Predictive Analysis refers to the analytical method of predicting
the future trends and statistics. With the basic analytics carried out with data mining,
text analytics or machine learning, the resultant information is used to identify patterns
and predict and create future information about the field from which the raw data was
collected.
Machine Learning: Machine Learning is a significant big field, but when used with big
data, the whole process of analytics and producing benefiting results is greatly improved.
Machine Learning is the process of studying algorithms, statistics, and analytics instead
of coded instructions, and providing the system the power to process information through
patterns, references, and pre-existing data. This is like an Artificial Intelligence (AI)
system, and the analysation process is more effective in terms of quality result.
Deep Learning: Deep Learning is like machine learning, but better and it has a broader
range of operations. Deep learning is a system that reads raw data, identifies, and recognizes the different patterns that appear over the raw data and making it as collective
memory and proceeds with that to identify even more patterns, and by doing so the system can make human-like predictions and analyzations. This type of analytical method
is often necessary for fields like healthcare where it may help prevent medical deaths.
Hadoop: Hadoop is an open source distributed processing framework which can be
used to produce some of the many methods described above, or to generate a new set of
Big Data Analytics for Large Scale Wireless Body Area Networks
427
systems and collectible information that can perform analyzations, pattern recognitions
and predictions, without needing to correlate to other analytical methods. Any part of
the system or framework being developed or used, can be modified and certain versions
of the variables can be made into constants and vice versa [17] (Table 1).
Table 1. Comparison of various big data analytical methods
Method
Environment of use
Advantages
Data mining
Finance, Intelligence,
Healthcare,
Telecommunications,
Ecommerce, etc.…
1. Predicting future trends 1. Privacy/security
2. Decision making
issues may occur
3. Predicting user habits
2. Predicted results
might not be accurate
every time
Disadvantages
Data
management
Used in every field
requiring huge to
massive data
organization
1. Easily accessible data
modules
2. Specialized/customized
tools for data
organizations
Software interface
must be customized
depending on the field
of use and the overall
amount of data storage
In-memory
analytics
Big data analytical
systems that require
high end processing
power
High speed processing of
information and faster
data transfer between the
systems
Only preferred in
systems requiring high
speed data processing
Predictive
analysis
Assessing risk factors,
healthcare, sales
Forecasting, crisis
management and fraud
detection
Powerful decision
making, adaptive nature
and better
accuracy
Requires
supervision for
prediction regarding
WBAN and patient’s
health conditions and
other critical assets
Machine
learning
Used in place of
Artificial Intelligence,
in critical fields
Better analysis and higher Higher error
quality over time of usage susceptibility and
chances of procedural
mistakes, requires
human supervision at
times
Deep
learning
Used for deep pattern
identification and
accurate prediction
methods
Easier pattern
Requires more time
identification and accurate for initialization and
predictions
complex technical
work
Hadoop
Backend software
framework for big data
analytics system
Depending on the developers and the field of use,
advantages and disadvantages vary. Easier to adapt
existing system in concern with existing and future
problems
428
H. R. Abdulshaheed et al.
3 Large Scale WBAN
A Wireless Body Area Network is a network of sensors placed in various parts of the
patient’s body, to sense and track parameters and remotely transfer this information to
the relevant medical professional to process further. While Large Scale WBAN refers
to the system that interconnects a huge number of patients’ WBAN systems with the
hospital management, and the regularization and database management of all those data,
a basic WBAN consists of sensor nodes, gateway nodes and internet connectivity. The
sensor nodes consist of sensors attached to various parts of the human body, to measure
medical parameters and capsules/containers that inject certain medical fluids necessary to
improve the patient’s condition the sensor nodes transfer the measured data to the gateway
nodes. The gateway node is a device that can interact with these data and transfer them
accordingly and organized, through the internet to the concerned medical authority or
system. The gateway node may or may not encrypt data multiple times before transferring
them, depending on the amount of security needed to be implemented, this is in the case
of high level targets whose medical information is to be kept extremely confidential and
secure [18]. The second method is the Emergency Traffic, here when a sensor reading
goes higher or lower than the threshold’s medical standard, the emergency protocol is
initiated, the nearest medical authority is informed about the patient’s whereabouts, and
the rest of the medical procedures are carried out from there on. The third method would
be On-Demand Traffic. Figure 2 represents a simple loop diagram of the system.
Fig. 2. Large scale WBAN with big data analytics
3.1 Routing Protocols
A routing protocol is a method by which routers or nodes communicate and transfer
data to and from nodes. The routing protocols will help a network by directing and
redirecting data traffic, for smoother networking, reliability, and energy efficiency. The
commonly used routing protocols for WBAN are listed below. A WBAN may use one
or more routing protocols depending on the patient’s conditions and medical standards.
Posture Based Routing: Posture based (or position based) routing protocol is specified
by the positions of the sensors in the human body, and the distance between them.
Big Data Analytics for Large Scale Wireless Body Area Networks
429
Depending on the day to day activities performed, the distance between the sensors
varies, for example with exercise. With these changes in the distance, the nodes are
specified to direct traffic to the nearest neighbouring node at that time instance. In the
diagram below (Fig. 3), the node in the left hand is quite far from the gateway node,
hence it pairs with the nearby node which reroutes the data traffic back to the gateway
node path [19].
Fig. 3. Posture based routing
Temperature Based Routing: Temperature based routing is opted for nodes that may
become overheated. When a sensor or any node is made to handle data traffic continuously, the node may overheat and the neighbouring nodes will redirect the data traffic
through cooler nodes, to protect the sensor and gateway nodes from heat damage.
Cross Layer Routing: Cross layer routing is the integration or hybridization of different routing protocols depending on the need. Using cross layering to integrate multiple
protocol methods makes the WBAN system more dynamic and provides more comfort for the patient. This method also allows prioritization of certain nodes over others,
helping medical professionals to focus on critical areas.
Cluster Based Routing: Cluster based routing works on forming clusters which will
have a cluster head that connects to other cluster heads and direct traffic henceforth.
Figure 4 below explains the cluster based routing protocol method. Here, nodes N2, N4
and N5 are cluster heads, and through these the sensor data from other sensors are routed
to the other nodes or the modem.
Fig. 4. Cluster based routing
430
H. R. Abdulshaheed et al.
QOS Based Routing: Quality of Service (QOS) based routing uses data traffic methods, such that the delivered data to the end user is of high quality. The data here will be
re-routed less so that the quality is maintained, and in terms of long distance nodes the
data is routed through multiple neighbour nodes to maintain the quality (Table 2).
Table 2. WBAN routing protocols
Routing protocols
Environment of use
Posture based routing
Used for athletics, special physical training, and for some
medical testing
Temperature based routing
Used for monitoring critical sensor points that may become
overheated
Cross layer routing
Used for events where hybridization of routing methods is
required
Cluster based routing
Used for events requiring usage of several sensor units, or
requiring multiple sensors with varying data traffic from time to
time
QOS based routing
Used for events requiring higher data quality and data
consistency
3.2 Applications
There are various fields of applications for a WBAN or large scale WBAN, some are
listed below and it is explained how WBAN plays a vital role in those fields. The WBAN
is mainly used for medical diagnostics and physical testing [2022] however, major
applications are: General Purposes; Medical Diagnostics; Military Purposes; Assisted
Living.
4 Implementing Big Data Analytics for Large Scale WBAN
The implementation process is quite simple; the basic WBAN transfers data and alerts to
the hospital database, medical records, doctors, and the emergency medical team, while
the big data analytics system performs statistics and analytics from the received raw data.
The implementation of the big data analytics system is processed by transferring the raw
data from the WBAN sensors directly to the cloud system, and the big data analytics will
process the raw data and provide analytics and the different methods of analytics used,
and the hospital management and doctors are able to use this information to treat their
patients more effectively. Automating the analyzation of medical parameters saves time
and lives, and big data is commonly used for many different sets of patients depending
on their medical conditions [23] (Fig. 5).
Big Data Analytics for Large Scale Wireless Body Area Networks
431
Fig. 5. Implementation of big data analytics in large scale WBAN
The large scale WBAN consists of thousands of patients with various diseases
and health conditions. The testing purposes, all the diseases, conditions, and physical test protocols must be categorized and organized in the cloud storage, enabling easy
access for and to patients, doctors, athletes, hospital management, students, and medical
researchers/scientists. With the various active categories, it is easier for the analytical
system to process certain categories and make accurate predictions by studying the different variations observed from within a category. This makes the big data analytics
system more robust and reliable in the healthcare field.
4.1 Benefits of Big Data Analytics in WBAN
There are various benefits of implementing big data analytics in WBAN, the list below
provides WBAN-specific big data system benefits [24].
1. Provides analysis and almost accurate predictions concerning the patient’s health
condition
2. Provides better digital support and flexibility, when compared with the basic WBAN
3. Helps in identifying risks and failures in the WBAN system.
4. Cost effective and higher performance when compared with other methods.
5. Provides better control over user data, easier access and data organizing tools and
storage.
6. Online storage with remote accessibility.
7. Provides powerful predictive methods, helping in better treatment of patients and
optimized physical testing.
432
H. R. Abdulshaheed et al.
4.2 Implementation Challenges
There are a variety of challenges concerning the implementation process of big data
analytics in large scale WBAN. Possible challenges in the implementation process and
the internal challenges in WBAN which reflect the results of the analytical system
are: Security and privacy issues; Inter-operability; Sensor Validation; Data Consistency;
Network/Signal Interference; Sensor Data Management.
4.3 Application of Big data Analytics in Large Scale WBAN
There are numerous numbers of basic applications for big data in WBAN and hybrid
technologies and applications, but the most used applications are Remote Patient Monitoring; Rehabilitation; Biofeedback; Special Forces/Sport Training and Remote Assisted
Living [25, 26].
5 Conclusion
With the advancement of science in every field, implementation of one system over
another and hybridization has become very common and immensely helpful. The concept
of WBAN and automation has revolutionized the healthcare industry and provides remote
and automated care with its technologies and big data which allows analysing of various
results, in turn developing new ways of treatment. Both big data analytics and WBAN are
strong players and implementing big data in large scale WBAN has reduced the overall
burden on, and the time consumption of, both patients and medical professionals.
References
1. Rawat, D.B., Bhattacharya, S.: Wireless Body Area Network for Healthcare Applications.
Data Analytics in Medicine [Internet]. IGI Global 2002–17. http://dx.doi.org/10.4018/9781-7998-1204-3.ch100
2. Thumati, B.T., Siva Subramania, H., Shastri, R., Kalyana Kumar, K., Hessner, N., Villa, V.,
et al.: Large-scale data integration for facilities analytics: challenges and opportunities. In:
2020 IEEE International Conference on Big Data (Big Data) [Internet]. IEEE, 2020 December
10. http://dx.doi.org/10.1109/bigdata50022.2020.9378440
3. Awad, T., Mohamed, W., Abdellatif, M.M.: IoTIwC: IoT industrial wireless controller. In:
Hassanien, A.E., Darwish, A. (eds.) Machine Learning and Big Data Analytics Paradigms:
Analysis, Applications and Challenges. SBD, vol. 77, pp. 565–581. Springer, Cham (2021).
https://doi.org/10.1007/978-3-030-59338-4_27
4. Sahu, N.K., Patnaik, M., Snigdh, I.: Data Analytics and Its Applications in Brief. Advances
in Data Mining and Database Management [Internet]. IGI Global; 2021;115–25. http://dx.
doi.org/10.4018/978-1-7998-6673-2.ch008
5. Arya, A., Pathania, S., Kaushal, C.: Cloud-based wireless body area network for healthcare
monitoring system. In: Advances in Computer Science and Information Technology (ACSIT)
Print ISSN: 2393–9907; Online ISSN: 2393–9915; Volume 2, Number 8; April-June, 2015
pp. 1–5
Big Data Analytics for Large Scale Wireless Body Area Networks
433
6. Barazanchi, I.Al., Abdulshaheed, H.R., Shawkat, S.A., Binti, S.R.: Identification key scheme
to enhance network performance in wireless body area network. Period. Eng. Nat. Sci. 7,
895–906 (2019)
7. Sethi, D., Anand, J.: Big data and WBAN: prediction and analysis of the patient health
condition in a remote area. Eng. Appl. Sci. Res. 46(3), 248–255 (2019)
8. Anand, J., Sethi, D.: Comparative analysis of energy efficient routing in WBAN. In: 2017
3rd International Conference on Computational Intelligence & Communication Technology
(CICT): 9–10 February 2017, Ghaziabad, India. USA, pp. 1–6. IEEE (2017)
9. Barazanchi, I.Al., Abdulshaheed, H.R., Safiah, M., Sidek, B.: Innovative technologies of
wireless sensor network: the applications of WBAN system and environment. Sustain. Eng.
Innov. 1, 98–105 (2020)
10. Ha, I.: Even energy consumption and back side routing: an improved routing protocol for
effective data transmission in wireless body area networks. Int. J. Distrib. Sens. Netw. 12(7),
1–11 (2016). https://doi.org/10.1177/1550147716657932
11. Barazanchi, I.Al.: An analysis of the requirements for efficient protocols in WBAN. J.
Telecommun. Electron. Comput. Eng. 6, 43 (2014)
12. Barakah, D.M.; Ammad-uddin, M.: A survey of challenges and applications of wireless body
area network (WBAN) and role of a virtual doctor server in existing architecture. In: 2012
Third International Conference on Intelligent Systems, Modelling and Simulation (ISMS),
pp. 214,219, 8–10 February 2012. https://doi.org/10.1109/ISMS.2012.108
13. Xu, G., Wu, Q., Daneshmand, M., Liu, Y., Wang, M.: A data privacy protective mechanism for
wireless body area networks. In: Wireless Communication Mobile Computing, 24 November
2015. https://doi.org/10.1002/wcm.2649
14. Ullah, F., Islam, I.U., Abdullah, A.H., Khan, A.: Future of big data and deep learning for
wireless body area networks. In: Deep Learning: Convergence to Big Data Analytics. Springer
Briefs in Computer Science SCS, pp. 53–77. Springer, Singapore (2019). https://doi.org/10.
1007/978-981-13-3459-7_5
15. Shibghatullah, A., Barazanchi, I.Al.: A survey on Central Control Unit ( CCU ) in WBAN.
In: International Symposium Research Innovation Sustainability 2014 (ISoRIS 2014) 15–16
October 2014, Malacca, Malaysia 14, 15–16 (2014)
16. Acharjya, D.P., Kauser Ahmed, P.: A survey on big data analytics: challenges, open research
issues and tools. Int. J. Adv. Comput. Sci. Appl. 7(2) (2016)
17. Bangash, J., Abdullah, H., Anisi, H., Khan, A.W.: A survey of routing protocols in wireless
body sensor networks.. Sensors 14, 1322–1357 (2014). https://doi.org/10.3390/s140101322.
www.mdpi.com/journal/sensors
18. Barazanchi, I.Al., Abdulshaheed, H.R., Safiah, M., Sidek, B.: A survey: issues and challenges
of communication technologies in WBAN. Sustain. Eng. Innov. 1, 84–97 (2020)
19. Lin, R., Ye, Z., Wang, H., Wu, B.: Chronic diseases and health monitoring big data: a survey.
IEEE Rev, Biomed. Eng. PP(99), 1–1 (2018). https://doi.org/10.1109/RBME.2018.2829704
20. Du, Y., Hu, F., Wang, L., Wang, F.: Framework and challenges for Wireless body area networks
based on big data. In: IEEE International Conference on Digital Signal Processing (DSP),
July 2015. https://doi.org/10.1109/ICDSP.2015.7251922
21. Barazanchi, I.Al, Sahy, S.A., Jaaz, Z.A.: Traffic management with deployment of Li-Fi technology traffic management with deployment of Li-Fi technology. J. Phys. Conf. Ser. 1804
(2021)
22. Al-Barazanchi, I., Jaaz, Z.A., Abbas, H.H., Abdulshaheed, H.R.: Practical application of
IOT and its implications on the existing software. In: 2020 7th International Conference on
Electrical Engineering Computer Science Informatics (EECSI), Yogyakarta, Indones, pp. 10–
14 (2020). https://doi.org/10.23919/EECSI50503.2020.9251302
434
H. R. Abdulshaheed et al.
23. Quwaider, M., Jararweh, Y.: An efficient big data collection in Body Area Networks. In: 5th
International Conference on Information and Communication Systems (ICICS), Jordan April
2014. https://doi.org/10.1109/IACS.2014.6841986
24. Abdulshaheed, H.R., Yaseen, Z.T., Salman, A.M., Al_Barazanchi, I.: An evaluation study of
WiMAX and WiFi on vehicular ad-hoc networks (VANETs). IOP Conf. Ser. Mater. Sci. Eng.
Pap. 3, 1–7 (2020)
25. Oleiwi, S.S., Mohammed, G.N., AlBarazanchi, I.: Mitigation of packet loss with end-to-end
delay in wireless body area network applications. Int. J. Electr. Comput. Eng. (IJECE) 12(1),
460–470 (2022)
26. Barazanchi, I.A., Aborujilah, A., Hashim, W., Alkahtani, A.A.: Design and implementation
of WBAN smart system connection to control covide19 patients remotely. Period. Eng. Nat.
Sci. 9(4), 977–998 (2021)
A Review of the Role of Latency
in Multi-controller Placement
in Software-Defined-Wide Area Networks
Cindy Ujan1(B) , Mohd Murtadha Mohamad1 , and Anisah Kasim2
1 Universiti Teknologi Malaysia (UTM), 81310 Johor, Malaysia
ujan.cindy@graduate.utm.my
2 Universiti Teknikal Malaysia Melaka (UTeM), 76100 Melaka, Malaysia
Abstract. Software-Defined Networking (SDN) is a computer network technology that physically separates the traditional switch architecture’s control and data
planes into two separate systems enabling the configuration of SDN compliant
devices to become centralised and independent via the SDN controller. Essentially, the separation simplifies an administrator’s task of managing a computer
network and is cost-effective due to purchasing inexpensive switches with low processing power. Networks are then dynamically scalable as they can be partitioned
into multiple data planes and controllers with policies that can be synchronised
across the board. However, researchers have discovered that, in SDN, the location
of these controllers impacts a network’s performance capabilities and furthermore,
the control plane provides fault management and performance in SDN. Therefore,
knowing where to deploy and how many controllers are needed is fundamental. This paper surveys the recent literature on this ongoing issue known as the
Controller Placement Problem (CPP), its application to the Wide Area Network
(WAN), and the role latency plays in it.
Keywords: Software-Defined Networking · Controller Placement Problem ·
Wide Area Network · Latency
1 Introduction
The purpose of a traditional Wide Area Network (WAN) is to bridge an organisation’s
remote branch offices to its corporate headquarters and allow its authorised users and
employees access to its data and applications over the legacy, and costly Multiprotocol
Label Switching (MPLS) links. Thus, depending on the organisation’s business needs,
the traditional WAN may hinder its agility and growth—particularly with distributed
configuration, whereby every router and switch stores its configuration locally. Furthermore, any policy change would require each network device to be accessed individually
to implement the change needed. Therefore, depending on the number of network devices
that must be reconfigured, the reconfiguration can be a tedious and time-consuming task.
Some of the biggest known challenges of WANs are related to performance, complexity,
and cost. However, the Software Defined-Wide Area Network (SD-WAN) can change
© The Author(s), under exclusive license to Springer Nature Switzerland AG 2022
F. Saeed et al. (Eds.): IRICT 2021, LNDECT 127, pp. 435–445, 2022.
https://doi.org/10.1007/978-3-030-98741-1_36
436
C. Ujan et al.
the way WANs are deployed and managed. For example, when implemented as an overlay technology to an existing topology, SD-WAN is more beneficial over the legacy
MPLS as it can leverage the local broadband Internet and 5G/LTE connectivity at the
remote branch locations. Furthermore, by centralising control, organisations can expect
better performance and operational simplicity as well as cost-effectiveness. Saving cost
is essential since unnecessary spending drains business’ profits, and SD-WAN solves this
by enabling the option to choose the desired hardware and software based on necessary
specifications and protocol requirements.
1.1 Software-Defined Networking (SDN)
Software-Defined Networking (SDN) can be described as a computer network technology that physically separates the traditional switch architecture’s control and data planes
into two systems. The main network elements in SDN consist of the SDN controllers,
SDN-compliant switches, and their links [1] and these elements are often represented as
a graph G = (V, E, S), where V represents the set of switches, E the set of physical links,
and S the set of controllers [2]. The separation simplifies the network administrators’
day-to-day tasks of managing their networks as these SDN-compliant devices can now
be viewed as a whole and not individually, using SDN controllers. In addition, SDN
enables devices from different vendors to interoperate. Furthermore, these simplified
devices require less processing power and are therefore less expensive to purchase whilst
providing simple data forwarding functions [2]. However, the new switch-to-controller
and inter-controller communication introduce additional latencies and network traffic
[3], thus demanding urgent attention as this affects the overall network performance.
The SDN architecture comprises three layers: the application layer, the control layer,
and the infrastructure layer. Figure 1 describes an SDN architecture.
Application Layer. The application layer consists of SDN software. The software provides programmable algorithms and protocols for the controllers to manage the network
[2]. In addition, the application layer enables features such as load balancing, security monitoring, and access control to be implemented, thus eliminating the need for
middleboxes such as load balancers [4].
Control Layer. With a global view of the network topology, the control layer’s primary
responsibility is to determine the network paths or flows and distribute the flow tables
throughout the network to maintain synchronisation and prevent loops. The control layer
consists of one or more SDN controllers and network services. A controller communicates with the software in the application layer via the Northbound API and switches in
the infrastructure layer via the Southbound API. A famous example of the Southbound
API control protocol is OpenFlow. A third interface is the East-West API, which is for
the inter-controller communication within the control layer [4].
Infrastructure Layer. The infrastructure layer consists of SDN-compliant network elements such as switches or any packet-relaying node. These simplified switches have at
least three components: secure channel, control protocol, and flow table [5]. A switch
connects to a controller via the secure channel, communicates with the controller using
A Review of the Role of Latency in Multi-controller Placement
437
the control protocol for configuration information, and processes flow based on its flow
table—switches forward traffic based on primitive instructions given by their associated
controller. Furthermore, the flow table consists of an entry identifier, statistics, and action
fields to which a switch refers when determining whether a packet is to be forwarded or
dropped [4].
Fig. 1. A Software-Defined Networking (SDN) architecture.
1.2 Distributed Controller Architecture
Large-sized SDN-based networks rely on having distributed controllers. Thus the network has to have more than one controller in its control plane interacting with each other
via the East-West API. There are two types of distributed controller architecture: the
logically centralised but physically distributed and the fully distributed [6].
Horizontal (Flat) Design. In a logically centralised but physically distributed controller design, all the controllers are in the same level or flat, and all are logically designated as root controllers. Figure 2 describes an example of the horizontal (flat) design.
Every controller is responsible for its local network topology, but because it is also a root
controller, it must also maintain a global view of the network topology [6]. Hence, all
changes happening in other local network topologies are communicated to all controllers,
thus introducing unnecessary load to the controllers with every synchronisation.
Hierarchical Design. In a fully distributed design, the controllers consist of local controllers and a root controller. Figure 2 describes an example of the hierarchical design.
The local controller maintains a local view of the network topology, whereas the root
controller maintains the global view and is kept updated on any changes in the local
topologies by the local controllers. Furthermore, any interdomain interaction between
438
C. Ujan et al.
local controllers must go through the root controller [5]. Thus, only the root controller
bears the majority of the synchronisation load.
Fig. 2. A horizontal (flat) design (left) and a hierarchical design (right).
1.3 The Capacitated/Uncapacitated Controller
A controller’s load corresponds to the maximum number of requests it can manage per
second [7, 8]. Thus, the capacitated controller would imply the controller’s capacity is
considered, whereas, with an uncapacitated controller, the controller’s capacity is negligible [7]. For example, Wang et al. formulated a problem based on controller capacity and
proposed a solution to dynamically map switches to controllers according to variations
in the network [8]. However, not all proposed solutions to the controller load imbalance
consider the controller’s capacity. Most literature that does consider controller capacity,
however, views the controller as a single unit with fixed capacity instead of a virtualised
instance or controller module that’s dynamically configurable [9].
This paper reviews the most recent literature on the Controller Placement Problem
(CPP) for Software-Defined-Wide Area Networks (SD-WAN) while highlighting the
importance latency plays in it. The rest of this paper is organised as follows: Sect. 2
discusses the background and recent CPP literature and Sect. 3 concludes the paper.
2 Related Works
As the capacity of an SDN controller limits its capability to process its switches’ requests,
risks such as network bottlenecks and a Single Point of Failure (SPOF) are very likely to
occur in a single controller setup. Therefore, the multi-controller solution can mitigate
these risks to provide failover and load balancing capabilities. A decade ago, Heller et al.
[10] introduced this NP-hard dilemma as the Controller Placement Problem (CPP), which
focuses on discovering the SDN controllers’ optimal number and placement in the SDNbased network topology. They analysed the average- and worst-case propagation switchto-controller propagation latencies and concluded that a single controller is sufficient
A Review of the Role of Latency in Multi-controller Placement
439
for most medium-sized networks. To this day, their initial study still prompts other
researchers to investigate the topic further from various angles, mainly focusing on
large-sized networks that would require multiple controllers.
Furthermore, determining controller placements in large-sized networks like the
WAN is more significant due to its varying topologies and large non-negligible propagation latencies [11, 12]. Therefore, a near-optimal number of controllers is required
to process the connected switches’ load sufficiently and minimise costs, such as those
that may incur from the unnecessary purchase of additional controllers, thus remaining
within the approved budget. Subsequently, a near-optimal placement of controllers too is
required to minimise switch-to-controller or inter-controller propagation latency. Most
literature leverages the in-band control plane strategy [9], whereby both the control and
data planes share the same links [13] instead of the out-of-band strategy. Minimising
latency is a fundamental objective in any network as it affects its performance [1].
The following Sect. 2.1 reviews recent multi-latency-oriented controller placement
in CPP literature.
2.1 Multi-latency Objectives
In recent CPP literature, Zhang et al. [12] investigated the propagation latency tradeoffs achievable with the switch-to-controller (southbound interface) and inter-controller
(east-west interface) interactions. For example, evenly distributing the controllers
reduced the switch-to-controller propagation latency but increased the inter-controller
propagation latency. On the other hand, placing the controllers close to one another
reduced the inter-controller propagation latency but increased the switch-to-controller
propagation latency. Thus they viewed a controller’s perceived reactivity time as being
influenced by both and derived two operative models, namely the single and multiple
data-ownerships models with similarities to the horizontal and hierarchical distributed
controller designs.
Wang et al. [11] state that end-to-end switch-to-controller latency consists of three
parts, namely packet transmission latency, packet propagation latency and switch processing latency. However, processing latency is negligible in large-sized networks [9],
whereas transmission latency pertains to the data packets and port rates thus is usually
a fixed value [2]. Their clustering-based network partitioning algorithm is a variant of
the K-means that aims to shorten the worst-case end-to-end switch-to-controller and
controller queuing latencies, calculating the shortest path using Dijkstra with Haversine
distance, unlike the Euclidean distance typically used in K-means. However, it can be
assumed that queuing latency is negligible in unobstructed networks [2].
Schütz et al. [14] proposed a heuristic mathematical approach to minimise the number
of controllers and determine controller placement and switch assignments. In addition,
they aimed to satisfy the capacity, load balancing, and propagation latency constraints.
Particularly in switch assignments, they focused on minimising inter-switch distances to
achieve acceptable switch-to-controller and inter-controller latencies. Torkamani-Azar
et al. [15] had also considered heterogenous capacitated controllers to find the lowest
switch-to-controller propagation latency that satisfies the controller’s capacity and with
ports in a meta-heuristic approach. They used the Knapsack 0–1 problem to calculate
the controller’s different processing rates and costs and investigated the local optima
440
C. Ujan et al.
of meta-heuristic and cluster-based solutions by focusing on minimising intra-cluster
versus inter-cluster link propagation delays. In comparison, Singh et al. [16] proposed
another meta-heuristic approach to controller placement which focuses on propagation
latency while considering the capacitated controllers and dynamic load of switches. In
addition, they aimed to minimise the total average latency, and their results showed that
optimisation-based solutions perform better than cluster-based solutions.
Another proposed solution that considered the dynamic load incurred from the number of switches associated with the controller and the frequency of these switches encountering new flows was proposed by Ul Huque et al. [17] who aimed to minimise switch-tocontroller propagation latency. Liao et al. [18] and Jalili et al. [19] proposed variants of
the Non-dominated Sorting Genetic Algorithm – II, a heuristic population-based algorithm to solve the multi-objective problem; in addition, both authors investigated how
to minimise average switch-to-controller and inter-controller latencies with worst-case
controller load imbalance, with the former incorporating PSO mutation and the latter a
multi-start procedure.
In Virtualised SDN, switch-to-controller Packet_In messages pass through a hypervisor, thus introducing additional switch-to-hypervisor and hypervisor-to-controller propagation latencies. Therefore, Killi et al. [20] proposed a solution to optimise averageand worst-case propagation latencies while considering the optimal placement for both
the hypervisors and controllers. They then referenced maximum latency as the switchto-hypervisor-to-controller propagation latency, thus also aiming to optimise the maximum average and average maximum propagation latencies. Thus optimising controller
placement would require balancing the different latencies to best suit an organisation’s
network. Finally, Hans et al. [21] proposed a swarm intelligence-based approach for controller placement in SD-IoT networks. They focused on minimising inter-controller propagation latency due to significant packet propagation latency and irregular placements
of controllers in the topology.
However, all the above multi-latency solutions ignored the probabilities of link or
controller failures. Thus the following subsection reviews CPP literature that combines
multi-latency with other functional objectives while considering the link and controller
failures.
2.2 Multi-latency with Other Functional Objectives
When a controller fails, its associated switches must be reassigned to another controller.
However, the reassignment may cause a sharp increase in worst-case propagation latency
[22]. Petale et al. [23] proposed a solution using decision making under uncertainty and
aimed to minimise switch-to-controller and inter-controller latencies to achieve minimum latencies during controller failures. They also highlighted inter-switch latency
as part of the overall network latency, which none of the other papers reviewed here
have done. A disadvantage of heuristic algorithms is the local optima [15]. Thus Liao
et al. [24] proposed a switch density-based clustering algorithm to partition the network according to the subnetwork’s controller capacity. Furthermore, they state that the
inter-controller propagation latency affects the performance of end-to-end propagation
latency between different switches controlled by different controllers. Thus, controllers
must be deployed close to other subnetworks. They had considered link failures but not
A Review of the Role of Latency in Multi-controller Placement
441
controller failures. Killi et al. [22] had proposed a mathematical model for capacitated
controller placement that minimises the worst-case propagation latencies with and without failures by assigning more than one controller to every switch while considering
multiple constraints. However, according to [23], decision making under uncertainty
yields better results when compared to mathematical methods.
Fan et al. [25] proposed a meta-heuristic approach for multi-objective controller
placement. They considered at most one link failure and had focused on minimising
propagation latency on both primary and backup switch-to-controller links. However,
they ignored the controller and multiple link failures. In contrast, Kazemian et al. [26] had
considered multiple switch-to-controller link failures, thus proposing a meta-heuristic
based solution to minimise inter-controller and switch-to-controller propagation latencies by maximising multiple switch-to-controller connectivity paths. They state that
network connectivity can be increased by maximising the average switch-to-controller
disjoint paths. Similar to authors in [18] and [19], Hu et al. [13] had developed a variant
of the NSGA-II, but they had considered multiple link failures during problem formulation. They aimed to minimise the number of controllers and worst-case propagation
latency. However, controller failure was ignored.
Tanha et al. [7] state that a switch needs to be associated with more than one controller
to achieve resilient controller placement. Switch-to-controller static assignments can
further improve energy consumption and post-failure reassignment propagation latencies
compared to dynamic assignments. Thus their solution required every switch to be
associated with a primary master controller and a backup slave controller while satisfying
the maximum allowable propagation switch-to-controller and inter-controller latencies
during synchronisation. However, they did not consider multiple links failure. In contrast,
Sahoo et al. [27] had proposed having primary and backup switch-to-controller links to
achieve resiliency against single link failures while minimising propagation delay. Their
work aims to minimise inter-controller and switch-to-controller propagation latencies
while maximising multi-path connectivity. The flow conservation law had been applied
to both primary and backup paths and was used to determine the number of switch-tocontroller disjoint paths. However, they did not consider controller failure.
Huang et al. [28] state response time comprises the switch, controller, and scheduler’s
processing latencies, propagation latency, and transmission latency, although the transmission, switch and scheduler processing latencies are negligible. They highlighted the
importance of controller scheduling, thus proposing a gradient descent-based solution
to tackle both controller placement and scheduling. However, the scheduler introduced
must be installed locally on switches and easily implemented as a Virtual Network Functions (VNF) component, thus requiring the SDN to be executed on a Network Functions
Virtualisation (NFV) infrastructure. In an attempt to mitigate controller failure caused
by security attacks, Samir et al. [29] proposed to change the controller’s location virtually and dynamically to confuse attackers. They considered the latency metrics in their
controller placement and shifting solutions. However, they split the network while having three potential substitute locations in every subnetwork, thus inevitably increasing
deployment cost and energy consumption.
Table 1 describes the various combination of latencies in CPP literature.
442
C. Ujan et al.
Table 1. Latency combinations in CPP literature
Year
Solution Focus
Method
2017 [12]
Propagation latencies’ tradeoffs’
impact on controller reactivity time
perceived by switches
EVO-PLACE
2018 [11]
Propagation and queuing latencies’
impact on overall network latency
CNPA
2020 [14]
Propagation latencies’ impact on
controllers’ reaction to network
events
Mathematical formalisation
2020 [15]
Propagation latencies with
capacitated controllers
GSO with Knapsack 0–1
2020 [16]
Propagation latencies with
capacitated controllers and dynamic
load
Varna-based optimisation
2017 [17]
Propagation latencies with dynamic
flow management
LiDy+
2021 [18]
Propagation latencies with load
imbalance
MOGA with variant PSO
2017 [19]
Propagation latencies with memory
MHNSGA-II
2018 [20]
Propagation latencies with a
hypervisor
JHCP with ILP
2022 [21]
Propagation latencies with adaptive
fuzzy controllers
ESFO
2020 [23]
Propagation latencies with multiple
link failures
Decision under uncertainty
2017 [24]
Propagation latencies with fault
tolerance
DBCP
2016 [22]
Propagation latencies with controller
failure
Mathematical model
2020 [25]
Propagation latencies with a single
link failure
RALO
2021 [26]
Propagation latencies with multiple
disjoint paths
Antlion optimisation
2021 [13]
Propagation latencies with multiple
link failures
NSGA-II with HCPA
2018 [7]
Propagation latencies and capacitated Clique-based Graph Theory
controllers’ impact on resiliency
(continued)
A Review of the Role of Latency in Multi-controller Placement
443
Table 1. (continued)
Year
Solution Focus
Method
2018 [27]
Propagation latencies with multi-path PSO with FFA
connectivity
2020 [28]
Propagation and processing latencies CGA-CC with GD-based scheduling
with capacitated controllers and VNF
scheduling component
2021 [29]
Propagation latencies with controller
security
MTD with PAFR mechanism
3 Conclusion
To summarise, CPP is a fundamental component of the design phase of any large-sized
SDN-based network as it ideally determines the requirements for (i) the number of controllers, (ii) their placement in the network, and (iii) the network’s switch-controller/intercontroller mappings, whereby latency is known to play the utmost important role. However, only focusing on a solution based on multi-latency alone is insufficient and should
be complemented with other functional objectives to achieve a well-rounded outcome
that can be applied in real-life scenarios, even though combining these various latencies and functional objectives may prove conflicting. Therefore, it ultimately depends
on what an organisation is willing to compromise to achieve the desired goal for their
network.
References
1. Wang, G., Zhao, Y., Huang, J., Wang, W.: The controller placement problem in software
defined networking: a survey. IEEE Network 31, 21–27 (2017). https://doi.org/10.1109/
MNET.2017.1600182
2. Lu, J., Zhang, Z., Hu, T., et al.: A survey of controller placement problem in software-defined
networking. IEEE Access 7, 24290–24307 (2019). https://doi.org/10.1109/ACCESS.2019.
2893283
3. Alsaeedi, M., Mohamad, M.M., Al-Roubaiey, A.A.: Toward adaptive and scalable openflowSDN flow control: a survey. IEEE Access 7, 107346–107379 (2019). https://doi.org/10.1109/
ACCESS.2019.2932422
4. Killi, B.P.R., Rao, S.V.: Controller placement in software defined networks: a comprehensive
survey. Comput. Netw. 163, 106883 (2019). https://doi.org/10.1016/j.comnet.2019.106883
5. Zhang, Y., Cui, L., Wang, W., Zhang, Y.: A survey on software defined networking with
multiple controllers. J. Netw. Comput. Appl. 103, 101–118 (2018)
6. Shirmarz, A., Ghaffari, A.: Taxonomy of controller placement problem (CPP) optimization
in Software Defined Network (SDN): a survey. J. Ambient. Intell. Humaniz. Comput. 12(12),
10473–10498 (2021). https://doi.org/10.1007/s12652-020-02754-w
7. Tanha, M., Sajjadi, D., Ruby, R., Pan, J.: Capacity-aware and delay-guaranteed resilient
controller placement for software-defined WANs. IEEE Trans. Netw. Serv. Manage. 15, 991–
1005 (2018). https://doi.org/10.1109/TNSM.2018.2829661
444
C. Ujan et al.
8. Wang, T., Liu, F., Xu, H.: An efficient online algorithm for dynamic SDN controller assignment
in data center networks. IEEE/ACM Trans. Netw. 25, 2788–2801 (2017). https://doi.org/10.
1109/TNET.2017.2711641
9. Das, T., Sridharan, V., Gurusamy, M.: A survey on controller placement in SDN. IEEE
Commun. Surv. Tutorials 22, 472–503 (2020)
10. Heller, B., Sherwood, R., Mckeown, N.: The controller placement problem. Comput.
Commun. Rev. 42(4), 473–478 (2012)
11. Wang, G., Zhao, Y., Huang, J., Wu, Y: An effective approach to controller placement
in software defined wide area networks. In: IEEE Transactions on Network and Service
Management. Institute of Electrical and Electronics Engineers Inc., pp. 344–355 (2018)
12. Zhang, T., Giaccone, P., Bianco, A., de Domenico, S.: The role of the inter-controller consensus in the placement of distributed SDN controllers. Comput. Commun. 113, 1–13 (2017).
https://doi.org/10.1016/j.comcom.2017.09.007
13. Hu, T., Ren, Q., Yi, P., et al.: An efficient approach to robust controller placement for link
failures in Software-Defined Networks. Futur. Gener. Comput. Syst. 124, 187–205 (2021).
https://doi.org/10.1016/j.future.2021.05.022
14. Schütz, G., Martins, J.A.: A comprehensive approach for optimizing controller placement
in Software-Defined Networks. Comput. Commun. 159, 198–205 (2020). https://doi.org/10.
1016/j.comcom.2020.05.008
15. Torkamani-Azar, S., Jahanshahi, M.: A new GSO based method for SDN controller placement.
Comput. Commun. 163, 91–108 (2020). https://doi.org/10.1016/j.comcom.2020.09.004
16. Singh, A.K., Maurya, S., Srivastava, S.: Varna-based optimization: a novel method for capacitated controller placement problem in SDN. Front. Comp. Sci. 14(3), 1–26 (2019). https://
doi.org/10.1007/s11704-018-7277-8
17. Ul Huque, M.T.I., Si, W., Jourjon, G., Gramoli, V.: Large-scale dynamic controller placement.
IEEE Trans. Netw. Serv. Manage. 14, 63–76 (2017). https://doi.org/10.1109/TNSM.2017.265
1107
18. Liao, L., Leung, V.C.M., Li, Z., Chao, H.C.: Genetic algorithms with variant particle swarm
optimization based mutation for generic controller placement in software-defined networks.
Symmetry 13, 1133 (2021). https://doi.org/10.3390/sym13071133
19. Jalili, A., Keshtgari, M., Akbari, R.: Optimal controller placement in large scale software
defined networks based on modified NSGA-II. Appl. Intell. 48(9), 2809–2823 (2017). https://
doi.org/10.1007/s10489-017-1119-5
20. Killi, B.P.R., Rao, S.V.: On placement of hypervisors and controllers in virtualized Software
Defined Network. IEEE Trans. Netw. Serv. Manage. 15, 840–853 (2018). https://doi.org/10.
1109/TNSM.2018.2823341
21. Hans, S., Ghosh, S., Kataria, A., et al.: Controller placement in software defined internet of
things using optimization algorithm. Comput. Mater. Continua 70, 5073–5089 (2022). https://
doi.org/10.32604/cmc.2022.019971
22. Killi, B.P.R., Rao, S.V.: Optimal model for failure foresight capacitated controller placement
in Software-Defined Networks. IEEE Commun. Lett. 20, 1108–1111 (2016). https://doi.org/
10.1109/LCOMM.2016.2550026
23. Petale, S., Thangaraj, J.: Failure-based controller placement in Software Defined Networks.
IEEE Trans. Netw. Serv. Manage. 17, 503–516 (2020). https://doi.org/10.1109/TNSM.2019.
2949256
24. Liao, J., Sun, H., Wang, J., et al.: Density cluster based approach for controller placement
problem in large-scale software defined networkings. Comput. Netw. 112, 24–35 (2017).
https://doi.org/10.1016/j.comnet.2016.10.014
25. Fan, Y., Wang, L., Yuan, X.: Controller placements for latency minimization of both primary
and backup paths in SDNs. Comput. Commun. 163, 35–50 (2020). https://doi.org/10.1016/j.
comcom.2020.09.001
A Review of the Role of Latency in Multi-controller Placement
445
26. Kazemian, M.M., Mirabi, M.: Controller placement in software defined networks using multiobjective antlion algorithm. J. Supercomput (2021). https://doi.org/10.1007/s11227-021-041
09-4
27. Sahoo, K.S., Puthal, D., Obaidat, M.S., et al.: On the placement of controllers in softwareDefined-WAN using meta-heuristic approach. J. Syst. Softw. 145, 180–194 (2018). https://
doi.org/10.1016/j.jss.2018.05.032
28. Huang, V., Chen, G., Zhang, P., et al.: A scalable approach to SDN control plane management:
high utilization comes with low latency. IEEE Trans. Netw. Serv. Manage. 17, 682–695 (2020).
https://doi.org/10.1109/TNSM.2020.2973222
29. Samir, M., Azab, M., Samir, E.: SD-CPC: SDN controller placement camouflage based on
stochastic game for moving-target defense. Comput. Commun. 168, 75–92 (2021). https://
doi.org/10.1016/j.comcom.2020.11.019
Factors Influencing the Security of Internet
of Things Systems
Fayez Hussain Alqahtani(B)
King Saud University, Riyadh, Saudi Arabia
fhalqahtani@ksu.edu.sa
Abstract. The Internet of Things (IoT) is an IT-based innovation that could be
implemented in various domains, such as manufacturing, logistics and healthcare.
Things or objects in a particular domain can be tagged, sensed, and controlled
over the Internet with technologies in object identification, wireless networks,
sensors, and embedded systems. It is widely acknowledged that IoT systems are
potential targets for malicious attacks, spread and actuated from the Internet to the
physical world. Hence, IoT security is of utmost importance. This paper is part of
a wider research project and aims to explore the factors responsible for security
challenges that exist in IoT systems. A qualitative investigation was conducted
by interviewing twenty IoT industry experts. The findings show that there are
seven factors responsible for security challenges facing IoT systems, including
a lack of IoT standards, heterogeneity, vulnerability, resource constraints, trust,
pervasiveness, and manufacturing.
Keywords: Internet of Things · IoT security · Information security management
1 Introduction
The term Internet of Things (IoT) was first proposed by Ashton in [1] and Brock in [2] at
the Auto-ID centre of the Massachusetts Institute of Technology (MIT). Auto-ID refers
to identification technologies such as error reduction, improvement of efficiency, and
automation used in several applications. Things can be tagged, sensed, and controlled
over the Internet via wireless networks, sensors, embedded systems, and nanotechnologies. The IoT consists of a set of technologies to support communication and interaction
among a broad range of networked devices and appliances [3]. Several applications for
entertainment, manufacturing, administration, healthcare, logistics, etc. based on IoT
enterprise systems have already been developed [4].
The key factor behind the changes in almost all business processes is IT-based innovation [5]. IT is not only an innovative factor, but also acts as an opportunity to manage
innovative processes by acting as an enabler of innovation adoption. The use of IoT
technologies in business processes is a recent innovative trend that acts as an extension
to firms’ IT-based systems. Commentators in [6] defined the IoT as ‘the worldwide network of interconnected objects uniquely addressable based on standard communication
protocols’ (p. 1647).
© The Author(s), under exclusive license to Springer Nature Switzerland AG 2022
F. Saeed et al. (Eds.): IRICT 2021, LNDECT 127, pp. 446–457, 2022.
https://doi.org/10.1007/978-3-030-98741-1_37
Factors Influencing the Security of Internet of Things Systems
447
However, the practical realization of IoT subsystems depends on certain factors, such
as cost, power, energy, and lifetime [7]. In addition, there is a wide consensus that the
most challenging requirement is security [8]. It is a well-known fact that the potential for
malicious attacks is greatly spread and actuated from the Internet to the physical world,
and this highlights the importance of IoT security [9]. Securing information carried by
wireless links in the IoT network is of utmost importance [10].
The identification of relevant factors and how they influence the security of IoT
systems is critical. Therefore, the objectives of the current study are to 1) identify the
relevant factors responsible for IoT security challenges, and 2) explore how these factors
influence the security of IoT systems. Moreover, previous literature, such as [11–14],
and [15], has discussed several security challenges faced by IoT systems. However, little
attention has been paid in the literature to qualitatively investigating the factors that
influence IoT security.
The current study extends previous studies and identifies the core factors responsible
for security challenges encountered by present-day IoT systems based on empirical
investigation with a number of industry practitioners. The snowball sampling method was
used to recruit twenty IoT experts for individual interviews to enrich the understanding
of how relevant factors could influence the security of IoT systems. This research is
significant because it illustrates how the security of IoT systems can be threatened.
Hence, the practice of IoT security can take the identified factors and their associated
insights into consideration when implementing IoT systems.
The remainder of this paper is organised as follows. The Sect. 2 of this paper presents
important concepts related to IoT and the challenges of implementing IoT systems, as
discussed in the literature about IoT security. The Sect. 3 of this paper provides an
illustration of the research approach followed in this study. Next, the Sect. 4 reveals
the outcomes of this research. The Sect. 5 discusses the outcomes of this research, and
finally, the paper is concluded.
2 Literature Review
IoT refers to a wide variety of Internet-connected devices, such as smart bulbs,
smart locks, IP cameras, thermostats, electronic appliances, alarm clocks, and vending
machines. In IoT networks, the number of devices and objects is linked with the Internet
[15]. Such links with the Internet enable remote access and control of IoT devices and
objects with minimal human involvement. Reference [16] provides a three-layer IoT
framework and architecture consisting of perception, network, and application layers, as
presented in Fig. 1. A detailed overview of the network architecture of cloud-based IoT
has been presented by [17]. However, a number of issues result from linking different
IoT systems with each other via the internet.
Generally, IoT systems do not focus on security being front-and-centre, leading to
a scenario in which private information is disclosed to the public [18]. As mentioned
in [19], along with unprecedented convenience, accessibility, and efficiency, IoT has
caused acute security and privacy threats in recent years.
Several research projects have been conducted investigating a number of security
challenges in the arena of IoT systems. The researchers in [11] analysed the existing
448
F. H. Alqahtani
Fig. 1. Three-layer IoT architecture
protocols and mechanisms to secure communication in IoT networks, along with open
security challenges. Kesavan and Prabhu [20] revealed in their findings that the level
of service quality and the security of IoT systems and components are cornerstones in
implementing this kind of network. Furthermore, security and privacy issues IoT systems
have often attracted the interest of industry practitioners and those in academia, who have
investigated IoT systems from multiple perspectives [21]. As noted in [22], issues such as
the wide geographic spread of IoT devices and their limited power capacity and internet
connectivity make IoT systems vulnerable to cyber security attacks.
Researchers in [23] investigated the challenges encountered when implementing
security measures on the devices and components of IoT systems, which include limited resources such as the computation capabilities of IoT devices. Furthermore, this
research identifies the resulting IoT security threats. These researchers [24] proposed a
security framework model for authorising access to the IoT system. Several researchers
have raised concerns about the generation of huge volumes of data and the processing
capabilities of IoT systems. In [19], researchers divulged that due to the unique characteristics of resource constraints, self-organization, and short-range communication in
IoT, it always resorts to the cloud for outsourced storage and computation. This has
brought about a series of new, challenging security and privacy threats. Oracevic, Dilek,
and Ozdemir [25] mentioned that the enormous number of connected devices in an IoT
system are potentially vulnerable. This might generate a scenario in which highly significant risks emerge around issues of security, privacy, and governance, calling into
question the future of IoT.
Clearly, from a review of the previews studies, IoT security receives researchers’
attention. However, there is a need to further investigate this phenomenon for two reasons.
First, the reviewed studies researched IoT conceptually, but lacked empirical support.
Second, the literature has paid little attention to qualitatively investigating the factors
Factors Influencing the Security of Internet of Things Systems
449
that influence IoT security. Therefore, this research qualitatively explores insights into
the factors that influence the security of IoT systems by interviewing IoT practitioners.
3 Methods
This study is based on the explorative acquisition and analysis of data. As stated in
[26], a qualitative approach is better for explorative research. The present study aims to
explore the factors responsible for IoT security challenges. This explorative study seeks
to provide in-depth explanations for the responsible factors from an IoT practitioners’
perspective. Recker [27] mentions that the study of the use of IT ‘is multi-faceted and
comprehensive, yielding insights from a variety of perspectives and lenses’. The qualitative research approach is the most suitable method for social science research when
many uncontrollable variables are involved [28]. In our case, investigating IoT security based on practitioners from the industry is an appropriate situation for utilising the
qualitative research approach. It was assumed that the industry experts might provide
the best insight into the theme of this research. Thus, based on the findings in [29], the
qualitative approach was selected due to its suitability for the explorative nature of the
current study. Figure 2 presents the design of this study.
Fig. 2. Research design of the current study
3.1 Data Collection
This study utilised semi-structured interviews conducted on focused samples (IoT industry experts) as they are capable of providing a deep illustration of the research issue under
investigation. The interviews were performed using a number of predefined questions
related to the issues in implementing IoT systems and how they can lead to the security
challenges. The sole purpose of these interviews was to gather an in-depth and contextual
understanding of the subject under investigation.
450
F. H. Alqahtani
The snowball sampling method was used in this study. This method provides selective
feedback wherein the researcher requests that every participant in the study suggests
relevant persons to participate in the next interview [30]. The following assessment
criteria were pre-set for the nominated participants: first, participants should be working
or have worked in an organization regardless of the size or industry of these organizations.
However, these organizations should have already started or completed building IoT
systems. Second, participants have been actively involved in IoT implementation in
their respective organizations.
The sample size in this study consisted of twenty selectively chosen participants.
Out of these, ten participants were aged from twenty-five to twenty-nine; six were aged
from thirty to thirty-nine, and the remaining four were aged from forty to forty-nine. The
selected participants in this study are IoT cloud engineers, systems engineers, software
developers, and IT security personnel. Due to the nature of qualitative research and its
focus on meaning, the sample size of this study is adequate.
3.2 Data Analysis
Several qualitative data analysis techniques, such as content analysis, discourse analysis, grounded theory, and thematic analysis are used for exploratory studies [31]. Of
these, thematic analysis is considered one of the predominant techniques for qualitative
data analysis [32]. According to Braun and Clarke [31], thematic analysis is ‘a method
for identifying, analysing and reporting patterns (themes) within data’. Holloway and
Todres [33] describes it as a foundational analysis method for qualitative data. The thematic analysis method can be applied across several epistemological and theoretical
approaches, and that is the reason it better suits the objectives of this study.
Generally, there are six phases involved in the process of conducting thematic analysis: familiarising with gathered data, generating initial codes, searching for themes,
reviewing the themes, defining and naming the themes, and finally producing the report
[31]. The Table 1 below illustrates the data analysis steps.
Factors Influencing the Security of Internet of Things Systems
451
Table 1. Thematic data analysis steps
Steps
Description
Familiarising with gathered data
This step involves transcribing the interview data, and
reading the manuscript multiple times
Generate initial codes
This step involves generating initial codes/labels and
grouping interviews data under each code
Search for themes
This step involves grouping initial codes/labels into
potential themes
Review the themes
This step involves reviewing the initial themes with their
associated interview data
Define and name the themes
This step involves refining themes, as well as developing
theme definitions
Produce the report
This step involves writing up the finding by employing
themes, discussion and extracted evidence from the
interview data
After the interviews were conducted, they were transcribed with the help of a credible
professional transcriber. Moreover, all the interviews’ transcripts were reviewed and
checked against the interviews’ audio recordings. Data analysis of the interviews was
conducted using the thematic analysis technique [31]. This analysis technique facilitates
identifying important themes within the data. The research deductively analysed the
data, searching for relevant insight into the predefined factors. Additionally, inductive
examination of the data was used in this thematic analysis to identify emergent insights.
4 Findings
This study explores the causes or factors responsible for different security challenges
that exist in current IoT systems. These factors are a lack of IoT standards, heterogeneity,
vulnerability, resource constraints, trust, pervasiveness, and manufacturing (see Fig. 3).
4.1 Lack of IoT Standards
The worldwide development of IoT devices and applications does not have commonly
recognised standards. This leads to the perception that the interoperability among those
devices is difficult. As noted by one of the participants, there may be ‘…mismatch
among software in IoT systems, for example, with regard to authentication methods’ (ex.
5). This complicates privacy and authentication in IoT systems. The participants in the
current study divulged that the absence of common standards creates a vacuum in the
establishment of proper security mechanisms, as noted: ‘The absence of agreed upon
standards lead to security concerns in this heterogeneous system’ (ex. 18).
Furthermore, according to one participant, ‘it is very difficult for manufacturers in
the area of IoT to design IoT devices while there is lack of secure IoT solutions’ (ex. 2).
452
F. H. Alqahtani
Fig. 3. Factors influencing the security of IoT systems
There is an understanding that the lack of standards is the reason for poor interaction
among the devices; as mentioned: ‘those common standards are essentials to illustrate
the different methods of connecting different IoT devices and components with the IoT
systems’ (ex. 4).
4.2 Heterogeneity
The heterogeneous devices being used in IoT systems are exponentially increasing. Different manufacturers utilise ‘various models or frameworks for networking and various
security mechanisms for security’ (ex. 1). Few participants are of the opinion that heterogeneity among IoT devices might be a hindrance to mutual interaction, and ‘this is
because deferent IoT devices vary regarding their security requirements’ (ex. 9).
Several participants believe that heterogeneity may limit security capabilities. Since
different manufacturers set their own standards for various devices, some may stress
enhancing security features, while others might be of the opinion to keep the things
simple and easy going, bypassing the required security standards. As expressed by one
of the participants, ‘…it is very difficult to decide which security measure is most effective
to be used because of the heterogeneity nature of the Internet of Things’ (ex. 7).
4.3 Vulnerability
It has been observed that the fast growth of IoT devices and services has led to the
deployment of many vulnerable and insecure nodes. One of the participants was of the
opinion that: ‘…networked system accessibility is a significant vulnerability’ (ex. 17).
Others feel that attacks can be ‘…conducted remotely due to the accessibility of IoT
systems via the Internet’ (ex. 9).
Hardware vulnerability is another aspect of concern. Some of the participants pointed
out that ‘malicious people can physically access Internet of Things’s devices and components of the IoT system as these component are widely spread outside buildings, neighbourhoods, or cities’ (ex. 11). The open environment can be cities, hospitals, farms, and
Factors Influencing the Security of Internet of Things Systems
453
universities, where hardware components and interfaces are running and are subject to
attack. Therefore, it has been verified that vulnerability can be a cause of people losing
faith in the confidentiality of this kind of system.
4.4 Resource Constraints
The small size of IoT system components, such as sensors, determines the limited
resources of those components, such as memory and processing. Additionally, there
is ‘a networking constraint of IoT devices as these devices use low-power radio’ (ex.
13). All these constraints contribute to the challenge of implementing a strong algorithm
to secure IoT devices.
Resource-constrained IoT devices are vulnerable to attack because ‘…devices like
IoT are with humble abilities regarding storage and processing’ (ex. 15), as well as ‘the
intention of IoT manufacturers in not to make devices with very effective measures in
security’ (ex. 4). For example, encryption and decryption are resource-intensive tasks.
As mentioned by one participant, ‘the process of encryption and decryption requires
huge computational capacity in terms of processing and storage’ (ex. 16).
4.5 Trust
The IoT mainly focuses on the machine-to-machine (M2M) mode of communication.
For these communicating nodes, authentication is very important, as the intruders may
take advantage of trust among IoT devices and infiltrate IoT systems via a forged node.
This may create a security threat, as there are no authentication mechanisms for a massive
number of IoT devices, which creates a security hole that needs to be filled. As mentioned
by one participant, ‘while two or more nodes communicate with each other, first those
nodes should prevent themselves from being attacked by other nodes and this can be
done if each one authenticates the others’ (ex 16).
It is noted that an important challenge related to trust is protecting users’ private
information, ‘which importantly refers to preventing information discloser’ (ex. 17). As
observed, there are hardly any security mechanisms during data communication in IoT
systems due to trust among the devices. This may be a threat to the users’ private information, as ‘…the confidentiality of the data could be compromised due to the presence
of a counterfeit node’ (ex 12).
4.6 Pervasiveness
Pervasiveness or ubiquitous computing is a useful concept and computing capability that
‘support deceives and objects to connect and form a network of intelligent devices to
collect and manipulate data on the go’ (ex. 5). The pervasive IoT environment leads to the
emergence of several security challenges due to constrained resources, such as limited
memory and processing capabilities, topology change, and latency in IoT devices. These
constraints may be due to ‘…the behaviour of the network, the features of an individual
node, and constraints at the application level’ (ex.13). Most of these constraints are
application dependent and are common in pervasive applications.
454
F. H. Alqahtani
It has been observed that ‘for such a ubiquitous environment to be useful and relevant,
it should allow access, transmitting, and manipulating personal data of the users’ (ex. 9).
This is not a desired situation because the privacy and security of the system’s users is at
risk. Additionally, in a pervasive IoT ecosystem, there is a possibility that the ‘…number
of transmissions and receptions (communication) also increases’ (ex. 15). This creates a
situation in which demand becomes higher than available connectivity. This slows down
the system, restricting its availability.
4.7 Manufacturing
Companies in the device manufacturing sector of IoT have increased their production
manifold because of the wide acceptance of IoT applications around the world. Many
of these companies try to embed security features during manufacturing. However, it is
found that ‘…this causes an increase of the cost and then the return of investment would
be difficult to reach’ (ex. 6). Contrary to this, a group of manufacturers produce cheaper
IoT devices that are not equipped with security features and hence might be susceptible
to security breaches. It is witnessed that this generates questions about the integrity of
the system.
It is noted that with the increase of IoT, for example, in smart buildings, there is a
dramatic increase in security issues harming smart home applications of IoT systems.
This type of security threat is subject to end user awareness and compliance with security
best practices, as noted: ‘as users vary regarding their tending to regularly update their
firmware’ (ex. 19). This, at the end, leads to breaking down the level of security for these
devices and presents an authentication challenge.
5 Discussion
The results of this study reveal that a lack of standards is a crucial factor in the weakness
of an IoT system. The study further reveals that there is a greater chance of a forged node
intrusion or authentication issues due to the existence of varying standards. Heterogeneity
is yet another factor identified in this research. Due to the varying capabilities of the IoT
devices developed by several manufacturers, a resistance to mutual interaction among
the devices emerged. This study also found that network and hardware vulnerabilities
have a negative impact on the confidentiality and availability of IoT systems. This might
be the cause of security threats to IoT systems, such as disabling network availability
and accessing users’ personal information.
The focus of developing the IoT is to use devices that have the minimum power
consumption and memory capacity. These resource constraints hinder the use of strong
encryption algorithms and weaken the authentication process of the IoT system. Trust
was also found to have a significant effect on the security of IoT systems. Trust is a
highly complex factor gained by ensuring user safety and system security. Furthermore,
pervasive computing has been found to be a core for several security challenges in IoT.
The results of this research reveal that pervasiveness of the system can be the cause of
threats to confidentiality and availability of the system. Users’ privacy is at risk, as the
pervasive environment autonomously deals with users’ personal data.
Factors Influencing the Security of Internet of Things Systems
455
Manufacturing of IoT devices in the absence of common standards was found to
have a negative impact on the security of IoT systems. The findings also reveal that the
manufacturers concentrate on cost-effective solutions that might lead to challenges in
the authentication process.
6 Conclusions
The findings presented in this paper show that there are seven factors responsible for
security challenges facing IoT systems, including a lack of IoT standards, heterogeneity, vulnerability, resource constraints, trust, pervasiveness and manufacturing. These
findings add significantly to the existing literature, in which little empirical work has
been done to explore the factors influencing IoT system security. Furthermore, this paper
illustrates how the identified factors threaten IoT security. Hence, the practice of IoT
security can take the identified factors and their associated insights into consideration
when implementing IoT systems.
Like all research, this paper has limited scope, as it sheds light on the factors responsible for the security challenges in IoT systems. The aim of this paper was to explore
the important factors that should be considered to enhance IoT security. These findings
represent the context of the participants who were involved in the qualitative investigation. However, these findings might be applicable to other similar settings. Therefore,
the next phase of the researcher’s larger project is to build on the findings of this paper to
generalise its findings. More specifically, a quantitative measure will be developed based
on the seven factors of IoT security identified in this paper. The quantitative measure
will help in collecting large quantitative data from representative samples to generalise
the findings.
References
1. Ashton, K.: That “internet of things” thing. RFID J. 22, 97–114 (2009)
2. Brock, D.L.: The Electronic Product Code™ (EPC™) as a Meta Code. Massachusetts Institute
of Technology, USA (2003)
3. Yadav, K., Alharbi, A., Jain, A., Ramadan, R.A.: An IoT based secure patient health
monitoring system. CMC-Comput. Mater. Continua 70, 3637–3652 (2022)
4. Ancarani, A., Di Mauro, C., Legenvre, H., Cardella, M.S.: Internet of things adoption: a
typology of projects. Int. J. Oper. Prod. Manag. 40, 849–872 (2020)
5. Janiesch, C., et al.: The internet of things meets business process management: a manifesto.
IEEE Syst. Man Cybern. Mag. 6, 34–44 (2020)
6. Gubbi, J., Buyya, R., Marusic, S., Palaniswami, M.: Internet of things (IoT): a vision,
architectural elements, and future directions. Futur. Gener. Comput. Syst. 29, 1645–1660
(2013)
7. Rahmani, A.-M., et al.: Smart e-health gateway: bringing intelligence to internet-of-things
based ubiquitous healthcare systems. In: 12th Annual IEEE Consumer Communications and
Networking Conference (CCNC). IEEE, NV, USA (2015)
8. Samuel, R., Connolly, D.: Internet of things-based health monitoring and management
domain-specific architecture pattern. Issues Inf. Syst. 16, 58–63 (2015)
9. Agrawal, S., Vieira, D.: A survey on internet of things. Abakós, Belo Horizonte 1, 78–95
(2013)
456
F. H. Alqahtani
10. Alandjani, G.: Features and potential security challenges for IoT enabled devices in smart
city environment. Int. J. Adv. Comput. Sci. Appl. 9(8), 231–238 (2018)
11. Dihulia, S., Farooqui, T.: A literature survey on IoT security challenges. Int. J. Comput. Appl.
169(4), 975–8887 (2017)
12. Rao, T., Ul Haq, E.: Security challenges facing IoT layers and its protective measures. Int. J.
Comput. Appl. 179(27), 31–35 (2018)
13. Lin, H., Bergmann, N.: IoT privacy and security challenges for smart home environments.
Information 7(3), 44 (2016). https://doi.org/10.3390/info7030044
14. Omitola, T., Wills, G.: Towards mapping the security challenges of the internet of things (IoT)
supply chain. Procedia Comput. Sci. 126, 441–450 (2018)
15. Pathak, P., Vyas, N., Joshi, S.: Security challenges for communications on IOT & big data.
Int. J. Adv. Res. Comput. Sci. 8(3), 431–437 (2017)
16. Mahmoud, R., Yousuf, T., Aloul, F., Zualkernan, I.: Internet of things (IoT) security: current status, challenges and prospective measures. In: 2015 10th International Conference for
Internet Technology and Secured Transactions (ICITST), pp. 336–341 (2015)
17. Zhou, J., Cao, Z., Dong, X., Vasilakos, A.: Security and privacy for cloud-based IoT:
challenges, countermeasures, and future directions. IEEE Commun. Mag. 55(1), 26–33 (2017)
18. Liu, X., Zhao, M., Li, S., Zhang, F., Trappe, W.: A security framework for the internet of
things in the future internet architecture. Future Internet 9(3), 1–28 (2017)
19. Zhou, W., Jia, Y., Peng, A., Zhang, Y., Liu, P.: The effect of IoT new features on security
and privacy: new threats, existing solutions, and challenges yet to be solved. IEEE Internet
Things J. 6(2), 1606–1616 (2019)
20. Kesavan, M., Prabhu, J.: A survey, design and analysis of IoT security and QoS challenges.
Int. J. Inf. Syst. Model. Des. 9(3), 48–66 (2018)
21. Frustaci, M., Pace, P., Aloi, G.: Evaluating critical security issues of the IoT world: present
and future challenges. IEEE Internet Things J. 5(4), 2483–2495 (2018)
22. Somani, G., Gaur, M., Sanghi, D., Conti, M., Rajarajan, M.: Scale inside-out: rapid mitigation
of cloud DDoS attacks. IEEE Trans. Dependable Secure Comput. 15(6), 959–973 (2018)
23. Yang, Y., Wu, L., Yin, G., Li, L., Zhao, H.: A survey on security and privacy issues in
internet-of-things. IEEE Internet Things J. 4(5), 1250–1258 (2017)
24. Bouij-Pasquier, I., El Kalam, A., Ouahman, A., De Montfort, M.: A security frame-work for
internet of things. International conference on cryptology and network security, pp. 19–31.
Springer, Chem (2015). https://doi.org/10.1007/978-3-319-26823-1_2
25. Oracevic, A., Dilek, S., Ozdemir, S.: Security in internet of things: a survey. In: International
Symposium on Networks, Computers and Communications (ISNCC), pp. 1–6. Marrakech
(2017). https://doi.org/10.1109/ISNCC.2017.8072001
26. Remler, D., Ryzin, G.: Research Methods in Practice: Strategies for Description and
Causation. SAGE, Thousand Oaks CA (2011)
27. Recker, J.: Scientific Research in Information Systems: A Beginner’s Guide. Springer,
Heidelberg, New York (2013)
28. Wu, P.: Opening the black boxes of tam: Towards a mixed methods approach. In: The
International Conference on Information Systems, Phoenix, Arizona (2009)
29. Dudley, J.: Research Methods for Social Work: Being Producers and Consumers of Research,
2nd edn. Allyn & Bacon, Boston, MA (2010)
30. Fink, A.: How to Sample in Surveys, 2nd edn. Sage Publications, Thousand Oaks, CA (2003)
31. Braun, V., Clarke, V.: Using thematic analysis in psychology. Qual. Res. Psychol. 3(2), 77–101
(2006)
32. Christofi, M., Nunes, J., Peng, G.: Identifying and improving deficient business processes to
prepare SMEs for ERP implementation. In: UK Academy for Information Systems (UKAIS)
14th Annual Conference, St Anne’s College, University of Oxford, UKAIS, pp. 1–17
Factors Influencing the Security of Internet of Things Systems
457
33. Holloway, I., Todres, L.: The status of method: flexibility, consistency and coherence. Qual.
Res. 3(3), 345–357 (2003)
Cyber Security
Facilitate Security Event Monitoring
and Logging of Operational Technology (OT)
Legacy Systems
Kenny Awuson-David1(B) , James Thompson2,3 , Kiran Tuner1,3 ,
and Tawfik Al-Hadhrami3
1 The Office of Gas and Electricity Markets Ofgem London, London, United Kingdom
{kenny.awuson-david,kiran.tuner}@ofgem.gov.uk
2 EDF Energy United Kingdoms, Nottingham, United Kingdom
james.thompson@edfenergy.com
3 School of Science and Technology, Nottingham Trent
University, Nottingham, United Kingdom
tawfik.al-hadhrami@ntu.ac.uk
Abstract. Traditional networks with event monitoring and logging capability
have been successfully deployed and implemented for years. However, these solutions are not always suited to be deployed and configured within an industrial
control system (ICS) due to the legacy challenges and nature of devices running
on this ecosystem. It is essential to understand what system, device and application to monitor, which logs to collect, where to collect them, how to acquire,
secure, and preserve them as well as how best to use the collected logs. For example, users, assets, applications, and behaviours should be monitored and logged
with an easy-to-read dashboard that adds context to the acquired logs. There has
been a significant cyber threat to the ICS legacy system, such as malicious malware and advanced persistent threat (APT). In this paper, we propose a secure
virtualised architecture based on the Purdue Enterprises Reference Architecture
Model (PERA) for the ICS ecosystem that facilitates monitoring and logging of
ICS legacy systems. The proposed architecture uses an enhanced open-source
host-based intrusion detection system (HIDS) and network monitoring capability
to maintain log integrity on transit and storage. The current Operational Technology (OT) monitoring and logging tools and software are ineffective in collecting
and centralising OT legacy system logs. The novelty of the proposed virtualised
architecture has an endpoint visibility feature and critical alert capabilities that
detects an indication of compromise on the legacy and non-legacy systems in the
ICS ecosystem.
Keywords: APT · Cyber attack · ICS · IDS · OT · PERA
1 Introduction
An industrial control system involves three major components namely the Supervisory
Control And Data Acquisition (SCADA), Distributed Control Systems (DCS), and Programmable Logic Controller (PLC) [17, 18]. Securing the ICS system is vital as the
© The Author(s), under exclusive license to Springer Nature Switzerland AG 2022
F. Saeed et al. (Eds.): IRICT 2021, LNDECT 127, pp. 461–472, 2022.
https://doi.org/10.1007/978-3-030-98741-1_38
462
K. Awuson-David et al.
SCADA and its legacy devices do not have the same functionality mechanisms as the
traditional network [1, 19]. Furthermore, some of the OT core components are highly
automated and require no human intervention. For instance, the Safety Instrumented
System (SIS) reacts to a potentially unsafe system shutdown by restoring all functional
processes to a safe state [1, 18]. Further investigation then revealed that it was a sophisticated malware designed to target the vulnerabilities of OT protocols [12–14]. Decades
ago, OT networks were separate from traditional IT because they relied on different
technologies and functionality, including different security mechanisms. OT security
is highly safety-driven and needs constant availability of service [17, 18]. In contrast,
traditional networks depend on the confidentiality, integrity and availability (CIA) and
non-repudiation of data and applications associated with the network. The interconnection of these two different networks (OT and IT) have led to genuine concern about the
ICS system’s cyber resiliency, especially with the legacy challenges. In cyberspace, new
malicious malware is created by cyber adversaries designed to invade system security
mechanisms [15, 29, 31]. Research has revealed the sophistication of some of this malware. For instance, Stuxnet was designed with a zero-day payload in mind targeting an
OT system and its components [28].
Cybersecurity experts are skilled to secure and maintain the CIA of a system by
adopting cyber defence mechanisms learnt through practical experience. However, this
notion is different in the OT environment as the system is designed with availability in
mind. In addition, the convergence of OT and IT has also made the ICS ecosystem more
complex to maintain security at every level of the Purdue architectural reference model.
There is a need to make the ICS more resilient against cyber-attack using a security
event monitoring and logging approach to react to any indication of an attack [17, 28].
There has been a significant shift within the ICS community to revaluate current ICS
security measures through research and innovative ideas. Malicious malware such as
ransomware has continued to pose a significant threat to ICS systems [2, 3]. In 2020 and
2021, ransomware attacks increased, targeting government institutions, universities, and
national healthcare infrastructures, including the ICS system [4]. The threat of malicious
malware targeting an industrial control system was of genuine concern when a cyber
attack took down the Ukrainian power grid in 2015 [3, 4, 22]. The Ukrainian authorities
initially suspected a simple virus attack facilitated through a phishing campaign. It is
vital to have a real-time proactive logging and monitoring mechanism in the ICS system
that enables incident response, forensics, and recovery [5, 28]. This paper introduces
a virtualised architecture integrating Security Onion (SO), Wazuh, PfSense and Snort
to facilitate security events logging and monitoring of ICS assets [33, 34, 36]. The
virtualised ICS testbed is integrated with Siemens TIA Portal V16 running 1500 PLC.
It also has an API interface of WinCC and S7 and Profinet protocol with a ladder logic
program that mimics a hydro-power station. A single case study is used to evaluate the
proactive logging and monitoring approach. A scenario is used to validate whether the
acquired logs can highlight an indication of attack by alerting the ICS system security
operator.
The next section of this paper will look at related works, the methodology, and a
case study with the results of the proposed OT security event logging and monitoring
virtualised architecture. Finally, the conclusion with direction for future work.
Facilitate Security Event Monitoring and Logging
463
2 Related Works
The persistent cybersecurity threats to an industrial control system have prompted several
academic studies to carry out research to understand the need for data flow integrity in
the ICS ecosystem and to ensure operational safety at all times. This section introduces
related works from ICS security logging and monitoring.
2.1 The Industrial Control System (ICS)
Research has demonstrated that Modbus lacks the most modern security features that
could mitigate the ICS system malicious exploits [6, 17] proposed a high-level method
where ICS text-based logs are viewed, with the data aggregated statistics using the Kibana
dashboard. However, this paper could have been extended to enhance the Elastic Stack
capability in real-time ICS monitoring and logging of all security events, including ICS
application protocols [24, 35]. Additionally, [7] implemented a module for monitoring
a Modbus TCP traffic to detect any anomaly behaviour in the industrial control system.
This paper concept uses a multi-algorithm detection based on the EMERALD detection
and correlation mechanisms. This paper could have considered monitoring other ICS
protocols such as the Profinet, EtherNet/I.P. or Distributed Network Protocol (DNP3).
[8] proposed a DNP3 analyser intrusion detection framework based on Bro. The DNP3
analysis is a scenarios based approach, which involves a formatted network packet. The
concept of the DNP3 analyser is to detect any anomaly events associated with the DNP3
protocol. However, the limitation of the paper is that the DNP3 will not monitor Modbus
and other vendors’ protocols such as Profinet or BACnet. This paper [25] integrated
an Elastic Stack approach where data is primarily observed as aggregated statistics and
correlations in a SCADA environment.
3 Methodology
This paper adopted a virtual environment simulation methodology that validates a realtime simulation of an ICS environment [37]. It enables a virtual test environment for OT
legacy system logging and monitoring that combines physical system components. The
methodology was implemented in two phases. First, design and build an ICS architecture
with legacy systems integration. Secondly, Kali Linux was used to generate security event
network traffic. The logs were captured in real-time, and the server-generated incident
alerts, as demonstrated in Fig. 4. The advantage of virtual simulation methodology is the
ability to log and monitor legacy systems without impacting the operational environment
of an ICS system.
3.1 The Integrated Architectural Tool
Security Onion was adopted and enhanced to suit our virtualised ICS logging and monitoring architecture and the traditional PERA. Security Onion is a free and open Linux
distribution for threat hunting, enterprise security monitoring and log management. It
includes a suite of well-known security applications such as TheHive, Playbook and
464
K. Awuson-David et al.
Sigma, Fleet, Osquery, CyberChef, Elasticsearch, Logstash, Kibana, Suricata, Zeek,
Wazuh and supports many modules such as Sysmon.
Furthermore, the virtualised architecture environment logs are shipped from the OT
devices, including SCADA and the engineering workstation, to the centralised Security
Onion server for further analyses. The server will alert the system operator if there is
any malicious traffic on the network. The enhanced Security Onion solution is suitable
for endpoint visibility of the legacy devices, including network switches in the OT
ecosystem. Another aspect to note is the capability of the solution to sniff all network
traffic from our management LAN.
4 Security Logging and Monitoring in the ICS Ecosystem
This section describes how our architectural logging and monitoring testbed is designed
and built to support and enhance the ICS infrastructure with security, uptime and
resilience in mind. The paper looked at how possible it was to add endpoint visibility to the ICS system with the legacy system in mind. The paper examines security
logging and monitoring in the ICS space and defines the three main methods of security
monitoring and logging: passive, active, and threat hunting.
Passive Security Monitoring: There is a low risk in introducing passive monitoring
to the OT environment as it doesn’t disrupt the network, and the process makes this
suitable for legacy networks that might be unstable if additional traffic is introduced. It
provides extensive coverage of devices, and each switch configured includes a range of
all devices connected to that switch. There is less security risk as all monitoring clients
are separate from the ICS system, and there is no risk they could communicate to any
node that is part of the ICS system.
Active Security Monitoring: This is accomplished by developing a software agent
such as Wazuh to interrogate the host system and forward any anomaly behaviour with
the host system to a centralised logging server. Agents provide much more detail about the
computers. Current OT network monitoring and logging mechanisms detect only traffic
activities on the network and do not know the state of each node. In our virtualised
architecture solution, the agents can forward all logs, including monitoring security
events and running processes, file operations, PLC, HMI’s, USB etc. The novelty of the
architecture is its active and passive monitoring and logging of security events of legacy
and non-legacy systems within an ICS environment [1].
Threat Hunting: The threat hunting capability is still in its infancy in the ICS ecosystem. It is a process of actively interrogating all the security event evidence generated
by the passive and active monitoring mechanism in the ICS environment. With a threat
hunting capability, an incident responder could start investigating the generated suspicious flagged security events, alerts, software list, and captured network packets to prove
or disprove if a security incident has occurred or not [27, 28].
Facilitate Security Event Monitoring and Logging
465
4.1 Determine What to Monitor
There are hundreds of relevant event data generated by system devices within an ICS
environment. With this high rate of events, there is a need to pinpoint what needs logging
and monitoring on the different levels of the PERA. At the enterprise level, the following
assets could be monitored and logged: applications, user information, databases server,
Active Directory Domain Service (AD DS), client machines, firewall, wireless access
points (AP) and the DMZ. However, it is a complex solution in deciding what to log in
and monitor in the OT environment due to the critical nature of OT devices. OT assets
such as the PLC, remote terminal units (RTUs), intelligent electronic devices (IEDs),
human-machine interfaces (HMIs), and Historians servers should be monitored. The
monitoring should also be extended to the OT protocols such as Modbus.
4.2 ICS Cybersecurity Challenges
Research has demonstrated the continued probing of the industrial control system by
cybercriminals and nation-states whose mission is to disrupt and cause damage to their
target both economically and socially. There is a need for ICS system security operators
to be more effectively equipped with cybersecurity defence skills [20, 28, 32]. ICS
asset owners could also consider taking further ICS cybersecurity training for their staff
to improve their understanding of cyber threats and challenges. Figure 1 highlights a
triangle approach that could be adopted in the ICS environment to ensure cyber resiliency.
As shown in Fig. 1, if any of the three components, namely exploit, vulnerability and
threat, are removed, ICS cyber resiliency will be achieved. This is like having the fire
triangle components analogy for what a fire needs to burn: air, heat, and a fuel source
must be present. However, remove any of the three components, and the fire will not
start.
ICS
Migaon triangle
using a security event
monitoring and
logging mechanism
Threat
Fig. 1. Mitigation ICS triangle
There has been an increasing number of cyber-related attacks targeting the industrial
control system (ICS) and the Operations Technology (OT), ranging from the Stuxnet
466
K. Awuson-David et al.
attack in 2010 to the threats posed by the SolarWinds Orion/Sunburst breach and the
persistent advance threat of ransomware attacks. As reported on 13 December 2020, the
SolarWinds supply chain attack compromised about 300,000 organisations, of which
33,000 integrated the Orion platform, and 18,000 of their customers could have installed
the malicious updates [21, 22]. Proactive security logging and monitoring mechanisms
in the ICS ecosystem will strengthen the defence line of an ICS system by mitigating
the challenges of endpoint visibility and enhanced forensic readiness [11].
5 ICS Logging and Monitoring Visualised Architecture
The virtualised ICS architectural testbed enables reliable testing of ICS logging and
monitoring use cases. The virtual environment has its advantage. Firstly, it removes the
concern of running logging and monitoring use cases on an operational ICS environment, given the legacy nature of the current ICS system. Secondly, the proposed ICS
architecture is for a test environment rather than an operational one. However, as part
of the research for this paper, the concept is now being deployed on ICS operational
environment for a trial. Thirdly, the hardware components of the ICS virtualised environment are minimal and only requires a Windows 10 operating system with 32 GB of
RAM and one terabyte hard disk space. Additionally, on the software side, a VMware
workstation 16.
Pro was used to simulate the virtualised cloud environment highlighted in Fig. 2. At
the same time, Siemens TIA Portal SIMATIC STEP 7 and WinCC V13 were integrated to
mimic the ICS and SCADA environment. Furthermore, Kali Linux was used as an attacking node to represent an adversary [38]. Additionally, ICS reconnaissance experimental
scenario was conducted using NMAP and Metasploit in a controlled environment.
Fig. 2. ICS monitoring and logging visualised architectural
Facilitate Security Event Monitoring and Logging
467
The Enterprise-level of the architecture has the Active Directory (AD) running on
the Windows Server 2019 operating system. With an IP address of 192.168.146.147 and
the domain name EDCC.local.
In addition, we deployed a Windows 10 client on the same Enterprise level with an
IP address of 192.168.146.143. Furthermore, the LAN side of the pfSense firewall had
an IP address of 10.10.10.1 The Manufacturing level has the engineering workstation
with an IP address of 10.10.10.130 and the enhanced Security Onion centralised server
with an IP address of 10.10.10.10. Another essential point of the proposed logging and
monitoring architecture is the cell level where the Siemens TIA Portal SIMATIC STEP
7 with an IP address of 10.10.10.132 was integrated to simulate an OT environment.
It is essential to point out that the proposed, designed ICS architecture is for a test
environment rather than an operational one. However, as part of the research for this
paper the concept is now being deployed on ICS operational environment for a trial.
6 Case Study Scenario
The case study scenario demonstrates how an insider threat compromised the SCADA
system at the manufacturing level of the ICS and then went further to modify the users
logging credentials and authorised access to the application and PLC database. Due to
the sensitive nature of the experiment, the paper presents a result that highlights the
importance of having security event logging and monitoring in the ICS environment.
The paper demonstrated how a cyber-related incident was simulated to target OT devices
through an insider with a basic knowledge of the network topology. The attack was
captured, and an alert was flagged on the Kibana dashboard for the system administrator
Fig. 3. SCADA log
468
K. Awuson-David et al.
to view. Figure 3 highlights how the security event logging and monitoring system
captured SCADA activities with an accurate time stamp. Figure 4 captures all the legacy
and non-legacy assets on the network, including the HMI and WinCC database entries
in real-time. Furthermore, Fig. 5 captures the recognisance that the adversary initiated,
and Kali Linux was highlighted as the host machine used for the NMAP active scan.
Figure 6 and 7 present the security event logging and monitoring enhanced Security
Onion server that uses low bandwidth resources from the network.
Fig. 4. Captured OT security events
Fig. 5. ICS security event alert metrics
Figure 4 emphasises how the indication of attack was captured, then presents detailed
alerting information of the attacker’s intent including hostname as Kali Linux. The
Facilitate Security Event Monitoring and Logging
469
Kibana dashboard’s detailed information is crucial for ICS system operators and security
administrators to activate mitigation mechanisms that could make it difficult for the
attacker to succeed [30].
Fig. 6. ICS logging and monitoring server CPU usage
Fig. 7. ICS logging and monitoring server memory usage
7 Conclusion
This paper presents an industrial control system (ICS) virtualised architecture testbed that
validates proactive security event logging and monitoring. Research has demonstrated
that there is a need to solve ICS logging and monitoring challenges posed by the legacy
nature of the system. Academic literature was reviewed for a solution that mitigates the
complexity of endpoint visibility in the ICS ecosystem based on a centralised logging and
monitoring mechanism. We selected Security Onion and Elastic Stack open-source tool
to implement an ICS virtualised environment. An experimental scenario was conducted
and evaluated. The results highlighted how the proposed solution enables proactive
security monitoring and logging in the ICS ecosystem. The experiment demonstrated
how the tools could be used to collect logs and analyse data of any type with highperformance metrics. The result of the experiment could facilitate incident response and
a digital forensic readiness plan [30, 31]. The concept of this paper has been implemented
into an operational environment. Furthermore, future research and development will
focus on the integration of machine learning (ML) into the proposed architecture to add
another layer of logging and monitoring in the ICS ecosystem [9, 10].
470
K. Awuson-David et al.
Acknowledgment. The bulk of the ICS monitoring and logging research work was funded by
the UK Office of Gas and Electricity Markets (Ofgem) jointly with EDF Energy and Nottingham
Trent University. We would like to thank all other parties who contributed to this paper. This paper
is not intended as relevant guidance or as state of the art within the meaning of NIS Regulation 10
(3) and (4) [26]. Any reference to any organisation, service or product does not constitute or imply
the endorsement, recommendation, or favouring by Ofgem or any of its employees or contractors
acting on its behalf.
References
1. Look, B.G.: Handbook of SCADA/Control Systems Security. CRC Press, Boca Raton (2016)
2. Chen, Q., Bridges, R.A.: Automated behavioral analysis of malware: a case study of wannacry ransomware. In: 2017 16th IEEE International Conference on Machine Learning and
Applications (ICMLA), pp. 454–460. IEEE (2017)
3. Zimba, A., Wang, Z., Chen, H.: Multi-stage crypto ransomware attacks: a new emerging cyber
threat to critical infrastructure and industrial control systems. ICT Express 4(1), 14–18 (2018)
4. Alladi, T., Chamola, V., Zeadally, S.: Industrial control systems: cyberattack trends and
countermeasures. Comput. Commun. 155, 1–8 (2020)
5. Khan, R., Maynard, P., McLaughlin, K., Laverty, D., Sezer, S.: Threat analysis of blackenergy
malware for synchrophasor based real-time control and monitoring in smart grid. In: 4th
International Symposium for ICS & SCADA Cyber Security Research 2016, vol. 4, pp. 53–63
(2016)
6. Hamilton, J., Schofield, B., Berges, M.G., Tournier, J.C.: SCADA Statistics monitoring
using the elastic stack (Elasticsearch, Logstash, Kibana). In: International Conference on
Accelerator and Large Experimental Physics Control Systems (2018)
7. Cheung, S., Dutertre, B., Fong, M., Lindqvist, U., Skinner, K., Valdes, A.: Using model-based
intrusion detection for SCADA networks. In: Proceedings of the SCADA Security Scientific
Symposium, vol. 46, pp. 1–12 (2007)
8. Lin, H., Slagell, A., Di Martino, C., Kalbarczyk, Z., Iyer, R.K.: Adapting bro into SCADA:
building a specification-based intrusion detection system for the dnp3 protocol. In: Proceedings of the Eighth Annual Cyber Security and Information Intelligence Research Workshop,
pp. 1–4 (2013)
9. Li, G., et al.: Detecting cyberattacks in industrial control systems using online learning
algorithms. Neurocomputing 364, 338–348 (2019)
10. Phillips, B., Gamess, E., Krishnaprasad, S.: An evaluation of machine learning-based anomaly
detection in a SCADA system using the modbus protocol. In: Proceedings of the 2020 ACM
Southeast Conference, pp. 188–196 (2020)
11. Cornelius, E., Fabro, M.: Recommended practice: creating cyber forensics plans for control
systems (No. INL/EXT-08-14231). Idaho National Laboratory (INL) (2008)
12. Case, D.U.: Analysis of the Cyber Attack on the Ukrainian Power Grid. Electricity Information
Sharing and Analysis Center (E-ISAC), p. 388 (2016)
13. Sullivan, J.E., Kamensky, D.: How cyber-attacks in Ukraine show the vulnerability of the US
power grid. Electr. J. 30(3), 30–35 (2017)
14. Sun, C.C., Hahn, A., Liu, C.C.: Cyber security of a power grid: state-of the-art. Int. J. Electr.
Power Energy Syst. 99, 45–56 (2018)
15. Ackerman, P.: Industrial Cybersecurity: Efficiently Secure Critical Infrastructure Systems.
Packt Publishing Ltd, Birmingham (2017)
16. Stouffer, K., Falco, J., Scarfone, K.: Guide to industrial control systems (ICS) security. NIST
Spec. Publ. 800(82), 16 (2011)
Facilitate Security Event Monitoring and Logging
471
17. Bodungen, C., Singer, B., Shbeeb, A., Wilhoit, K., Hilt, S.: Hacking Exposed Industrial
Control Systems: ICS and SCADA Security Secrets & Solutions. McGraw Hill Professional,
New York (2016)
18. Kim, H.: Security and vulnerability of SCADA systems over IP-based wireless sensor
networks. Int. J. Distrib. Sens. Netw. 8(11), 268478 (2012)
19. Stouffer, K.A., Falco, J.A., Scarfone, K.A.: Guide to industrial control systems (ICS) security: supervisory control and data acquisition (SCADA) systems, distributed control systems
(DCS), and other control system configurations such as programmable logic controllers (PLC),
pp. 800–882 (2011)
20. Auffret, J.P., et al.: Cybersecurity leadership: competencies, governance, and technologies
for industrial control systems. J. Interconnection Netw. 17(01), 1740001 (2017)
21. Quoted in Kari Paul et al.: ‘SolarWinds Hack Was Work of “At Least 1,000 Engineers”, Tech
Executives Tell Senate’, Guardian, 24 February 2021. https://www.theguardian.com/techno
logy/2021/feb/23/solarwinds-hacksenate-hearing-microsoft
22. Willett, M.: Lessons of the SolarWinds Hack. Survival 63(2), 7–26 (2021). https://doi.org/
10.1080/00396338.2021.1906001
23. Knapp, E.D., Langill, J.T.: Industrial network security: securing critical infrastructure
networks for smart grid, SCADA, and other Industrial control systems. In: Syngress (2014)
24. Chhajed, S.: Learning ELK Stack. Packt Publishing Ltd, Birmingham (2015)
25. UK statutory instruments 2018/506. https://www.legislation.gov.uk/uksi/2018/506/made
26. Coletta, A., Armando, A.: Security monitoring for industrial control systems. In: Security of
Industrial Control Systems and Cyber Physical Systems, pp. 48–62. Springer, Cham (2015).
https://doi.org/10.1007/978-3-319-40385-4_4
27. Knapp, E.D., Langill, J.: Industrial Network Security: Securing critical infrastructure networks
for smart grid, SCADA, and other Industrial Control Systems. In: Syngress (2014)
28. Alsuhaym, F., Al-Hadhrami, T., Saeed, F., Awuson-David, K.: Toward home automation:
an IoT based home automation system control and security. In: International Congress of
Advanced Technology and Engineering (ICOTEN). IEEE (2021). https://doi.org/10.1109/
ICOTEN52080.2021.9493464
29. Alanzi, A., Al-Hadhrami, T., Saeed, F., Awuson-David, K.: Wireless remote control-security
system for entrances (WRC-SSE). In: International Congress of Advanced Technology and
Engineering (ICOTEN). IEEE (2021). https://doi.org/10.1109/ICOTEN52080.2021.9493429
30. Awuson-David, K., Al-Hadhrami, T., Alazab, M., Shah, N., Shalaginov, A.: BCFL logging:
an approach to acquire and preserve admissible digital forensics evidence in cloud ecosystem.
Futur. Gener. Comput. Syst. 122, 113 (2021)
31. Awuson-David, K., Al-Hadhrami, T., Funminiyi, O., Lotfi, A.: Using hyperledger fabric
blockchain to maintain the integrity of digital evidence in a containerised cloud ecosystem. In: International Conference of Reliable Information and Communication Technology,
pp. 839–848. Springer, Cham (2019). https://doi.org/10.1007/978-3-030-33582-3_79
32. Few, C., Thompson, J., Awuson-David, K., Al-Hadhrami, T.: A case study in the use of attack
graphs for predicting the security of cyber-physical systems. In: 2021 International Congress
of Advanced Technology and Engineering (ICOTEN), pp. 1–7. IEEE (2021)
33. Security Onion Homepage. https://securityonionsolutions.com/. Accessed 1 Nov 2021
34. Park, W., Ahn, S.: Performance comparison and detection analysis in snort and suricata
environment. Wireless Pers. Commun. 94(2), 241–252 (2016). https://doi.org/10.1007/s11
277-016-3209-9
35. Hamilton, J., Schofield, B., Berges, M.G., Tournier, J.C.: SCADA Statistics monitoring
using the elastic stack (Elasticsearch, Logstash, Kibana). In: International Conference on
Accelerator and Large Experimental Physics Control Systems. Barcelona, Spain (2017)
472
K. Awuson-David et al.
36. Negoita, O., Carabas, M.: Enhanced security using elasticsearch and machine learning. In:
Science and Information Conference, pp. 244–254. Springer, Cham (2020). https://doi.org/
10.1007/978-3-030-52243-8_19
37. Abd-Alhamid, F., Kent, M., Bennett, C., Calautit, J., Wu, Y.: Developing an innovative method
for visual perception evaluation in a physical-based virtual environment. Build. Environ. 162,
106278 (2019)
38. Najera-Gutierrez, G., Ansari, J.A.: Web Penetration Testing with Kali Linux: Explore the
Methods and Tools of Ethical Hacking with Kali Linux. Packt Publishing Ltd, Birmingham
(2018)
Validating Mobile Forensic Metamodel Using
Tracing Method
Abdulalem Ali1(B) , Shukor Abd Razak1 , Siti Hajar Othman1 , Rashiq Rafiq Marie2 ,
Arafat Al-Dhaqm1 , and Maged Nasser1
1 School of Computing, Faculty of Engineering, Universiti Teknologi Malaysia,
81310 Johor Bahru, Johor, Malaysia
almaldolah2012@gmail.com
2 Information System Department, College of Computer Science and Engineering,
Taibah University, Medina, Kingdom of Saudi Arabia
Abstract. Mobile Forensic (MF) is a branch of digital forensic used to collect
and analyze mobile device crimes. Several forensic models and frameworks have
been proposed in the literature for the MF domain to identify, acquire, and investigate MF crimes. However, these models are redundant and developed for specific
purposes. Therefore, the authors developed a metamodel to solve the redundancy
and heterogeneity of the MF domain called Mobile Forensic Metamodel (MFM).
However, the MFM has not been evaluated from the modeling perspective to evaluate the effectiveness of the MFM in terms of instantiation solution models for
the MF domain. Thus, this paper aims to evaluate the effectiveness of the MFM
using a tracing method. The tracing method is a common way of validating metamodels through reasonable reliability on the domain application of the metamodel
to assess the logical consistency of metamodels against domain models. For this
purpose, two real scenarios were selected to confirm the capabilities of developed
MFM in instantiate solution models for problems in hands. From real scenarios,
the developed MFM was found to be scalable, logical, complete, interoperable,
coherent, and useful for the MFM domain.
Keywords: Mobile forensic · Metamodel · Tracing method
1 Introduction
Mobile devices such as smartphones have become one of the most popular technologies
that exist today. The number of mobile phones subscriptions has increased to over 4.5 billion in 2017, and this number is growing exponentially [1, 2]. Advances in technologies
related to smartphones lead to an increase in the functionality of mobile phones. Also,
these devices are currently used for several activities in our daily lives. For instance,
check e-mail, take photos, browse the Internet, business transactions, and location data,
and do much more. In contrast, mobile phone crimes are rising, and cybercrime is now
moving to mobile devices such as smartphones. For instance, committing fraud via email, harassment through text messages, distribution of child pornography, terrorism,
and selling drugs, etc. [3, 4].
© The Author(s), under exclusive license to Springer Nature Switzerland AG 2022
F. Saeed et al. (Eds.): IRICT 2021, LNDECT 127, pp. 473–482, 2022.
https://doi.org/10.1007/978-3-030-98741-1_39
474
A. Ali et al.
MF is a subfield of digital forensics concerning to the recovery of digital evidence
from a mobile device under forensically sound conditions. Besides, MF is interconnected
with various elements which involves people, authority, investigators team, resources,
procedures, processes, and policies. The diversity of mobile devices as well as the sophistication of the digital crimes one of the major challenges to forensics investigators [5].
The previous research works viewed mobile forensics in terms of data acquisition and
problem-solving scenarios as a subset of computer forensics. However, they did not
extend mobile forensics beyond the computer forensics paradigm, nor did they focus on
modelling case domain information in investigations.
Additionally, previous MF domain research did not focus on modeling case domain
information involved in investigations. Therefore, Ali et al. [2] developed a complete/common framework called Mobile Forensic Metamodel (MFM) to solve complexity, heterogeneity, ambiguity, interoperability in the MF domain. The developed
MFM recognized, documented, collected, and matched various MF activities, tasks,
concepts, and processes from multiple MF models into a developed metamodel that
allowed practitioners to derive solution models easily. However, the developed MFM
was not evaluated by tracing method to prove its efficiency in the MF domain. Thus,
this paper aims to assess the capabilities of the MFM using the tracing technique. The
tracing method is presented to evaluate the rational consistency of metamodels compared to domain models. This evaluation method is more active than other evaluation
methods. For this aim, a real scenario was selected to evaluate the developed MFM from
the modeling perspective to ensure its consistency along with the MF domain.
The rest of this paper is prepared into five sections: Sect. 2 introduces the related
works in the MF domain. Section 3 offers the methodology, while Sect. 4 displays
discussion and analysis. The conclusion of this study is introduced in Sect. 5.
2 Related Works
Several research have been conducted in the MF domain. However, the majority of
them solely focused on understanding the MF professionals’ perception regarding the
lack of digital investigation processes that can be used to prepare forensic reports for
court cases [6, 7] stated that digital evidence in mobile phones is easily tampering
with overwritten or remote commands from the wireless network. The rapid change of
mobile phones on the market caused a demand for forensic examination of the devices,
which existing computer forensics techniques could not meet [8, 9]. In addition, Casey
et al. [10] mentioned that mobile devices hold a large amount of digital evidence for
digital investigation processes. In recent years, forensic investigation has relied heavily
on evidence gathered from mobile devices. In reference to real scenarios, mobile phone
evidence was cited in the prosecution of Ian Huntley, who murdered two young girls, as
well as in the search for and arrest of suspects in the 2007 failed attempt of London car
bombings.
Despite that, validated frameworks and methods for extracting data from mobile
devices are practically non-existent [11]. Casey [6] constanted growth of mobile devices
makes it difficult to design a single forensic tool or set of standards for the MF domain
that is specific to a single platform. In addition, Lessard and Kessler [12] stated that
Validating Mobile Forensic Metamodel Using Tracing Method
475
one of the major challenges in the MF domain is the lack of hardware, software, and
standardisation in mobile devices which makes the investigation procedure harder. With
the advancement in technology these days, as well as the wide range of mobile devices
and operating systems, make the development of common framework or standards model
a difficult effort [13–17]. Additionally, Khelalfa [18] stated that the main problem with
mobile devices is that there is currently no standard forensic model or process for forensic
analysis of smartphones. Therefore, forensic investigators face difficult challenges in
conducting the forensic investigation processes in digital crimes, particularly for mobile
phones [19, 20].
3 Methodology
A method has been adapted by [20–22] to validate the developed MFM [2]. It contains of
two main stages as shown in Fig. 1. To find the proper/appropriate validation technique,
this study should answer these two questions:
1) what are the existing metamodel validation techniques?
2) what are the pros and cons of the current metamodel validation techniques?
3.1 Stage I: Select Validation Technique
As long as this step aims to select the proper metamodel validation technique to verify
the completeness, logicalness, coherence, scalability, and usefulness of the developed
MFM, a list of existing metamodel validation techniques, and the advantages and disadvantages of these techniques are highlighted in this stage. Metamodels need to be
validated before being utilized as a representation of real application domains. The
quality of a metamodel is measured in view of how the metamodel can satisfy requirements during its creation [23]. In order to fulfill the completeness and effectiveness of
the developed MFM, several validation techniques were applied during the validation
stage. When the metamodel was developed, the question of how the metamodel can be
used for real-world problems was often asked. According to Al-Dhaqm et al. [21], the
criteria to select the best type of validation technique can be determined according to
metamodel type and the goal of its development (e.g., agent-based modeling, semantic and conceptual modeling, and mathematical and statistical modeling). For example,
the Bootstrap Approach [24], Cross-validation [25], and Multistage Validation [23] are
usually used for the validation of simulation metamodels. These approaches involve a
few cycles of comparison and need a large sample size to achieve validity. Since the
MF models used in the developed MFM are limited and the sample size is small, these
validation approaches were not suitable. With a smaller sample size, comparison against
other models [26], which does not require a large sample to achieve validity, was more
suitable. This study also needed to evaluate the metamodel’s completeness, logicalness,
coherence, scalability, and usefulness. Thus, the Tracing Technique [27] was used to
validate the capabilities of the MFM in terms of instantiation/derivation solution models
from the MFM.
476
A. Ali et al.
Fig. 1. Validate MFM using tracing method
Therefore, this paper validates the developed MFM using the tracing technique.
The tracing approach generally leads to thinking about and capturing the hierarchical
relations within a metamodel and ensuring that metamodel users can understand the
relationships that exist within and across the metamodel [22]. The behaviors of different
types of specific entities in the model are traced (followed) to determine if the logic of
the model is correct and if the necessary accuracy is obtained. In this evaluation, the
MFM is used to instantiate a specific mobile type. The behaviors of different kinds of
Validating Mobile Forensic Metamodel Using Tracing Method
477
particular entities in the model are traced (followed) to determine if the logic of the
model is correct and if the necessary accuracy is obtained [20]. This tracing validation
will determine an agreement between concepts in the metamodel and real MF scenarios.
3.2 Stage II: Conduct Validation
A real scenario was adapted to validate MFM from a modeling perspective [28], “an
employee at a large company has contacted HR regarding inappropriate messages and
phone calls he has received from a co-worker. To confirm the unwanted behavior, management authorizes the analysis of the harasser’s BlackBerry, which the company had
issued for business purposes. Management does not want to alert the subject in question
or other staff to the investigation. A note is sent to that group’s manager explaining
that their group is being targeted for BlackBerry firmware updates. A member of the
desktop support staff is dispatched to each PC. The staff member asks each user to enter
his/her PIN so that the device may be backed up. Support staff explains that a backup
is needed just in case the firmware update does not go smoothly. All backups are copied
to a network share, and the IPD file associated with the subject in question is taken for
analysis.”
Thus, to solve this scenario, an investigator needs to generate several M1-Models
from M2-MFM using the UML stereotype <<>> [29].
Generate M1-Verfiication Model from M2-MFM: To verify/validate the incident
in the scenario, author instantiated the M1-Verfication model from M2-MFM vertically to verify the incident. The M1-Vericication Model consists of eight (8) concepts as shown in the Fig. 2 <<Investigator>>, <<Identification>>, <<Crime>>,
<<Mobile Device>>, <<Crime Scene>>, <<Authorization>>, <<Potential
Evidence>>, and <<Recording>>. Therefore, the <<Investigator>> requires a
<<Authorization>> to achieve the investigation, then, seizes the <<MobileDevice>>
which has the <<Crime>> and conducts <<Verification>>. The <<Investigator>>
will secure the <<Crime Scene>> and <<Recording>> crime events. The MFM has
capabilities to instantiate the M1-Vrerfication model. Thus, concepts in the MFM covered most concepts in the scenario. For example, <<Crime>> concept in the MFM
covers <<Inappropriate Messages>> in the scenario, and the <<MobileDevice>> in
the MFM covers the <<BlackBerry>> concept in the scenario, and same thing for the
<<Recording>> and <<Potential Evidence>>.
Generate M1- Acquisition Model from the MFM: According to the scenario,
the investigator must acquire and preserve data from seized blackberry devices and
other resources. Thus, the author nominates/selects appropriate concepts from the
MFM to derive/instantiate a solution model, which is the M1-Acqussion model,
as presented in Fig. 3. The instantiated model consists of ten (10) concepts:
<<Investigator>>, <<Forensic Tools>>, <<Extraction>>, <<Acquired Data>>,
<<Backup>>, <<MobileDevice>>,<<Imaging>>, <<Potential Evidence>>,
<<Volatile Evidence>>, and <<Nonvolatile Evidence>>. The <<Investigator>>
478
A. Ali et al.
Fig. 2. M1-verification model
identified the <<MobileDevice>> which has the <<Potential Evidence>>, and conduct <<Imaging>> for whole mobile device. The <<Investigator>> will uses a special kind of <<Forensic Tools>> to conduct the <<Extraction>> from the mobile
device. The purpose of this phase is to produce the <<Acquired Data>> from the
mobile device and preserve it through <<Backup>>. Therefore, the MFM has successfully used to cover whole concepts to instantiate the M1-Acquisition model. The
<<Acquired Data>> needs to move to the forensic lab for analysis purposes.
Generate M1-Examination and Analysis Model from the MFM: This model examines and analyzes the acquired data collected in the acquisition stage. To instantiate
the M1-Examination and Analysis model from the MFM, the author selected appropriate concepts from the MFM that match/cover scenario concepts. Thus, the instantiated
model consists of eight (8) concepts as shown in the Fig. 4: <<Forensic Specialist>>,
<<Analysis Data>>, <<Evidence>>, <<Forensic Tools>>, <<Acquired Data>>,
<<Examination Data>>, <<Reconstruction Events>>, and <<Examined Data>>.
The first stage of this model is to verify the authentication of the acquired data. The
investigator will check the integrity of the data via comparing collected data before
hashing and after rehashing. Then, if the data is not original and has been tampered
with, the investigator needs to go back and take another original copy of the collected
data. The second stage is to reconstruct and analyze the acquired data and produces a
list of evidence. Therefore, the MFM has been successfully used to instantiate the M1Examination and Analysis Model. The whole concepts of the derived M1-Examination
and Analysis Model match with MFM.
Validating Mobile Forensic Metamodel Using Tracing Method
479
Fig. 3. M1-acquisition model
4 Discussion and Analysis
From the results, the MFM can instantiate different solution models to solve the problems at hand. Three user models (M1-user models) have been instantiated from the
MFM to verify, acquire, preserve, examine and analyze mobile crime. Thus, the consistency/conformance between the MFM concepts and the real scenario concepts confirm that the MFM can cover different MF scenarios’ concepts. For example, the
<<Mobile>> concept in the MFM can instantiate/derive <<Blackberry Device>>
in the real scenario, and the <<Potential Evidence>> in the MFM matching with
<<UnwantedBehavior>>. Therefore, results in this study showed the MFM could
derive different solution models from solving different problems.
480
A. Ali et al.
Fig. 4. M1-examination and analysis model
5 Conclusion
MF is a significant domain that is used to identify, acquire, preserve, reconstruct, analyze, and document MF crimes. Several models and frameworks have been proposed
in the literature for the MF domain. These models are redundant and specific, which
makes the MF domain complex and heterogenous among domain forensic practitioners.
The MFM was developed to solve the heterogeneity and ambiguity of the MF domain.
Therefore, this paper aimed to validate MFM from the forensic perspective to demonstrate the MFM’s effectiveness in instantiating solution models for different specific
problems. A scenario was selected for this purpose, and results showed the MFM could
instantiate different solution models to solve the problem. The future work will include
implementing the MFM in several real scenarios to ensure the applicability of the MFM
on real mobile crimes.
References
1. Arts, I., Fischer, A., Duckett, D., van der Wal, R.: Information technology and the optimisation
of experience–The role of mobile devices and social media in human-nature interactions.
Geoforum 122, 55–62 (2021)
Validating Mobile Forensic Metamodel Using Tracing Method
481
2. Ali, A., Abd Razak, S., Othman, S.H., Mohammed, A., Saeed, F.: A metamodel for mobile
forensics investigation domain. PloS one 12(4), e0176223 (2017)
3. Al-Dhaqm, A., et al.: Digital forensics subdomains: the state of the art and future directions.
IEEE Access 99, 1 (2021)
4. Turnbull, B., Taylor, R., Blundell, B.: The anatomy of electronic evidence–Quantitative analysis of police e-crime data. In: 2009 International Conference on Availability, Reliability and
Security. IEEE (2009)
5. Malware, S.: Security Threat Report 2014
6. Casey, E.: Digital Evidence and Computer Crime: Forensic Science, Computers, and the
Internet. Academic press, New York (2011)
7. Al-Dhaqm, A., et al.: Categorization and organization of database forensic investigation
processes. IEEE Access 8, 112846–112858 (2020)
8. Al-Dhaqm, A., Ikuesan, R.A., Kebande, V.R., Razak, S., Ghabban, F.M.: Research challenges
and opportunities in drone forensics models. Electronics 10(13), 1519 (2021)
9. Saleh, M.A., Othman, S.H., Al-Dhaqm, A., Al-Khasawneh, M.A.: Common investigation
process model for internet of things forensics. In: 2021 2nd International Conference on
Smart Computing and Electronic Enterprise (ICSCEE). IEEE (2021)
10. Casey, E., Bann, M., Doyle, J.: Introduction to Windows Mobile Forensics. Elsevier, New
York (2010)
11. Ahmed, R., Dharaskar, R.V.: Mobile forensics: an introduction from Indian law enforcement
perspective. In: Prasad, S.K., Routray, S., Khurana, R., Sahni, Sartaj (eds.) ICISTM 2009.
CCIS, vol. 31, pp. 173–184. Springer, Heidelberg (2009). https://doi.org/10.1007/978-3-64200405-6_21
12. Lessard, J., Kessler, G.: Android forensics: simplifying cell phone examinations. Small Scale
Digital Device Forensics J. 4(1), 1 (2010)
13. Jansen, W., Ayers, R.: Guidelines on cell phone forensics. NIST Special Publication, pp. 800101 (2007)
14. Al-Dhaqm, A., Razak, S., Othman, S.H., Ngadi, A., Ahmed, M.N., Ali Mohammed, A.:
Development and validation of a Database Forensic Metamodel (DBFM). PloS one 12(2),
e0170793 (2017)
15. Ali, A., Razak, S.A., Othman, S.H., Mohammed, A.: Extraction of common concepts for the
mobile forensics domain. In: Saeed, F., Gazem, N., Patnaik, S., Balaid, A.S.S., Mohammed, F.
(eds.) Recent Trends in Information and Communication Technology, pp. 141–154. Springer
International Publishing, Cham (2017). https://doi.org/10.1007/978-3-319-59427-9_16
16. Ali, A., Razak, S., Othman, S.H., Mohammed, A.: Towards adapting metamodeling approach
for the mobile forensics investigation domain. In: International Conference on Innovation in
Science and Technology (lICIST) (2015)
17. Al-Dhaqm, A., Razak, S., Othman, S.H.: Model derivation system to manage database forensic
investigation domain knowledge. In: 2018 IEEE Conference on Application, Information and
Network Security (AINS). IEEE (2018)
18. Khelalfa, H.M.: Forensics challenges for mobile phone security. In: Information Assurance
and Security Technologies for Risk Assessment and Threat Management: Advances, pp. 72–
133. IGI Global (2012)
19. Chang, W., Chung, P.: Knowledge management in cybercrime investigation – a case study
of identifying cybercrime investigation knowledge in Taiwan. In: Chau, M., Hsinchun Chen,
G., Wang, A., Wang, J.-H. (eds.) Intelligence and Security Informatics, pp. 8–17. Springer
International Publishing, Cham (2014). https://doi.org/10.1007/978-3-319-06677-6_2
20. Ghabban, F.M., Alfadli, I.M., Ameerbakhsh, O., AbuAli, A.N., Al-Dhaqm, A., AlKhasawneh, M.A.: Comparative analysis of network forensic tools and network forensics processes. In: 2021 2nd International Conference on Smart Computing and Electronic Enterprise
(ICSCEE). IEEE (2021)
482
A. Ali et al.
21. Al-Dhaqm, A., Razak, S., Ikuesan, R.A., Kebande, V.R., Hajar Othman, S.: Face validation
of database forensic investigation metamodel. Infrastructures 6(2), 13 (2021)
22. Ameerbakhsh, O., Ghabban, F.M., Alfadli, I.M., AbuAli, A.N., Al-Dhaqm, A., AlKhasawneh, M.A.: Digital forensics domain and metamodeling development approaches. In:
2021 2nd International Conference on Smart Computing and Electronic Enterprise (ICSCEE).
IEEE (2021)
23. Sargent, R.G.: Verification and validation of simulation models. J. Simul. 7(1), 12–24 (2013)
24. Kleijnen, J.P., Deflandre, D.: Validation of regression metamodels in simulation: bootstrap
approach. Eur. J. Oper. Res. 170(1), 120–131 (2006)
25. Biles, W.E., Kleijnen, J.P., Van Beers, W.C., Van Nieuwenhuyse, I.: Kriging metamodeling
in constrained simulation optimization: an explorative study. In: 2007 Winter Simulation
Conference. IEEE (2007)
26. Sargent, R.G.: Verification and validation of simulation models. In: Proceedings of the 2010
winter simulation conference. IEEE (2010)
27. Kassab, M., Ormandjieva, O., Daneva, M.: A metamodel for tracing non-functional requirements. In: 2009 WRI World Congress on Computer Science and Information Engineering.
IEEE (2009)
28. Do, Q., Martini, B., Choo, K.-K.R.: A forensically sound adversary model for mobile devices.
PloS one 10(9), e0138449 (2015)
29. Kuzniarz, L., Staron, M., Wohlin, C.: An empirical study on using stereotypes to improve
understanding of UML models. In: Proceedings of 12th IEEE International Workshop on
Program Comprehension, 2004. IEEE (2004)
Catching a Phish: Frontiers of Deep
Learning-Based Anticipating Detection Engines
Hamzah Salah1 and Hiba Zuhair2(B)
1 Department of Networks Engineering, College of Information Engineering,
Al-Nahrain University, Baghdad, Iraq
ha.salim94@gmail.com
2 Department of Systems Engineering, College of Information Engineering,
Al-Nahrain University, Baghdad, Iraq
hiba.zuhair.pcs2013@nahrainuniv.edu.iq
Abstract. In recent years, cyber-security gains high attention in the light of ethical hacking and social engineering attacks like phishing that riskily overshadow
the development of social networking, e commerce, and information technology.
Thus, mitigation of such risks via AI techniques represents the prime research
direction in academia and industry. Amongst, are the detection engines integrating diverse deep learning algorithms to anticipate changeable phishing features
over time into the classification models. However, extracting the mutual features
and predicting the future changes in phishing attacks still need more concrete
characterization and accurate classification with fewer faults in the online engine.
Upon these needs, this paper aims to present future-oriented standpoints for longterm, hybrid, cognitive, and effective phishing detection about the existing deep
learning-based classification models by appraising the prior research and compiling their outstanding problems. This aim is achieved through a comparative and
critical review of the prior research and then discuss the possible solutions for
future phishing detection approaches.
Keywords: Social engineering · Phishing attacks · Phishing detection · Deep
learning-based models
1 Introduction
Recently and particularly in the COVID-19 pandemic, people’s lives have become more
reliant on cyberspace and web apps. By Global Digital Population Report, active web
users have reached 4.66 billion (which accounts for 59.5% of the global population)
via learning and education, healthcare, work meeting, business and social communicating that have switched from offline to online mode during the COVID-19 pandemic
[1]. As such, lots of sensitive data have been exchanged and stored via cloud computing that has provided good chances to hackers for illegal impersonating and intruding
on users’ information systems by utilizing social engineering deceptions [1]. For more
gains, hackers have never ended up bypassing the artificial intelligence secure mechanisms of the communicated information systems among organizations. Phishing has
© The Author(s), under exclusive license to Springer Nature Switzerland AG 2022
F. Saeed et al. (Eds.): IRICT 2021, LNDECT 127, pp. 483–497, 2022.
https://doi.org/10.1007/978-3-030-98741-1_40
484
H. Salah and H. Zuhair
been utilized as the most perspective social engineering deception to closely resemble
an organization’s legitimate website, send mass notifications to users, redirect victimized users to a fake website, steal users’ profiles, hack their exchanged data online, and
intrude on the communicated information systems [1]. Furthermore, phishing attacks
have evolved to successfully espionage many e-governments and e-commerce services
for illegal monetary gains [2, 3].
To tackle these challenges, phishing detection has been acknowledged at a high
level across diverse techniques such as list-based, heuristic-based, and visual similaritybased [2, 3]. However, the list-based detection techniques have needed updates regularly,
the heuristic-based techniques have lacked the characterization of mutually relevant
phishing features, and the visual similarity-based techniques have falsely resembled
animated components and embedded objects in a phishing website [2, 3]. That, in turn,
has fallen short at mitigating the dramatic evolution of phishing patterns and their overtime changeable features [2, 3]. Lately, AI has spotted the light to elaborate more effective
techniques using machine and deep learning algorithms that are specially designed for
phishing detection where the accuracy is extremely important [2, 3].
Machine learning-based detection, in their single and/or ensemble framework; has
been constructed as features-based classifiers to identify phishing patterns from a batch
of phishing and legitimate patterns [2, 3]. Yet, they have diverged in their classification
accuracy on an escalating web stream (i.e. flow of phish/suspicious/legitimate website
patterns) due to their diverse specifics, decision boundaries, and the set of features that
they have deployed [2, 3]. Also, hackers have used to evolve zero-hour and different
patterns carrying out phishing in advanced ways which have implied out-of-time and
overlooked classification by the machine learning-based detection engines [2, 3].
As time progresses, evolved phishing patterns become an emerging problem that
threatens information systems on mobiles and IoT domains by exploiting technical vulnerabilities and users’ unawareness [2, 3]. That poses real growing threats not only to
cyber-security but also to the global IT industries [2, 3]. Thus, researchers in academia
and industry motive to develop pro-active phishing detection engines by leveraging deep
learning algorithms [2, 3]. Unlike former detection engines, deep learning-based detection engines characterize mutually relevant features of phishing patterns without human
tuning by self-learning and multi-classifying the unlabeled web stream in unsupervised,
supervised, and hybrid models [2, 3]. However, some difficulties are encountered in
applying deep learning due to phishing unpredictable activities over seconds not only
hours which requires finding the line-level annotations of insider phishing activities and
a stable model of truly legitimate patterns by training web stream continuously in an
online fashion.
In this light, this paper addresses three main tracks: revisiting the existing deep
learning-based phishing detection engines with the detail of their various phishing
datasets for a better understanding of their frontiers and looking out the evolutionary solution scope for future phishing detection. To do so, the rest of this paper is organized into
five sections as follows: zero-hour phishing detection; conceptual background of deep
learning; phishing detection and the related works; critical issues and future solutions;
then drawing our conclusions.
Catching a Phish
485
2 Zero-Hour Phishing Detection
Hackers have insisted on unlawfully accessing data and system files and then stealing the users’ profiles for illegal monetary gains. Hence, they have targeted financial
organizations, e-government services, IT industries, critical infrastructures, small-scale
and large-scale enterprises. To do so, they have used sophisticatedly skilled and welldetermined mechanisms to evolve their variable phishing patterns every hour (i.e., zerohour patterns) and deliver them to the connected information systems via technical
vulnerabilities in software or hardware of mobile and IoT devices. Also, they have leveraged various features to make their zero-hour phishing patterns persistent and to evade
the existing detection engines for months and even years. Most features of zero-hour
phishing patterns comprise misleading links, spoofed contents, and socially engineering
deceptions that mimic victims to catch the bait and submit their confidential data via
Table 1. Evolutionary phishing detection engines [1, 4–6].
Detection engine
Mechanism
White and/or Black List
Whitelists sort a collection of authorized URLs that browsers can
visit, and blacklists include phishing URLs to prevent browsers
from downloading their web pages. When the browser downloads
the related websites that are and/or are not banned, a significant
number of true positives resulted. Otherwise, High false outputs
resulted if the regular basis of these lists is not updated
Heuristics
Extract phishing common features (static traits) from sample
phishing webpages and use them to qualify each visited webpage to
detect any phishing activity. However, they produce a lower
detection rate and false positives if they are not assisted by black or
whitelist
Visual layout
similarity
Usually, phishing patterns seem to look like legitimate websites for
users’ suspecting. Thus, successful detection can be achieved by
comparing layouts of phishing replicas to legitimate websites and
calculating the ratio of similarity. However, this requires a long
execution time to process images, texts, and other visual contents.
Dynamic contents like animations might be overlooked due to
minimal resembling and then resulting in high false-negative rates
Machine learning
Machine learning classifiers are feature-based classifiers that predict
the status of a visiting website (phishing or legitimate) by learning a
set of extracted features on training and testing a set of samples.
However, classifying new patterns of phishing websites might
produce divergent accuracies due to the needs of actively learning
of the features-based classifier on new samples
Deep learning
Beyond machine learning classifiers, the deep learning classifiers
identify new phishing patterns proactively by automated extraction
and analysis of unknown and relevant features and learning them
actively
486
H. Salah and H. Zuhair
online transactions and web browsing. For that reason, most phishing detection engines
strategies have developed features-based classification mechanisms. Such mechanisms
are dependent on either checking up block lists of phishing URLs features, or phishing
intrusion footprints (i.e., heuristics), or phishing replicas of the truly visual layouts of
legitimate websites or characterizing phishing patterns actively and proactively throughout a trained set of features and machine learning deep learning classifiers, as presented
in Table 1.
3 Conceptual Background of Deep Learning
As presented in Table 2 and shown in Fig. 1, deep learning is a machine learning approach
that uses numerous layers of neural networks to show complicated ideas and relationships
[7]. Deep learning is a branch of machine learning that uses artificial neural networks
(ANN) to obtain results. A deep neural network is built up of layers that make up
deep learning (DNN). Image classification, text mining, video recommendation, spam
detection, and multimedia idea retrieval are just a few of the applications that use it.
Deep learning approaches that have been recently created have demonstrated exceptional
performance in a variety of applications, including natural language processing (NLP),
a)
Auto-encoder Structure [11]
c)
e)
CNN Structure [12]
RNN Structure of [11]
b) RBM Structure [11]
d) LSTM Structure [13]
f)
MLP Structure [8]
Fig. 1. General structures of baseline deep learning algorithms
Catching a Phish
487
Table 2. Baseline deep learning algorithms [8]
Method
Input data
Deep
Various
Auto-encoders (AE)
Learning type
Characteristics
Unsupervised
(generative)
• AE can operate with
data instances that are
unlabeled
• The Output is a
reconstructed version
of the input data, and it
is helpful for extracting
features and reducing
dimensionality
Convolutional
Neural Network
(CNN)
2-D (video, image, etc.) Supervised
(discriminative)
• Internal memory is
used to process
sequential data
• Visual tasks need a
large amount of
training data (images
and videos)
Multi-Layer
Perceptron
Neural Network
(MLP)
Various
Supervised
(discriminative)
• Learning that is
adaptable,
Non-linearity and MLP
has a high fault
tolerance
Recurrent
Neural Network
(RNN)
Sequence data,
time-series
Supervised
(discriminative)
• NTMA (Network
Traffic Monitoring and
Analysis) application
scenarios with
time-sensitive data are
suitable
• Use internal memory
for processing
sequential data
Restricted
Boltzmann
Machines (RBM)
Feature vectors
Unsupervised
(generative)
• RBM can be trained
single layer at a time
• RBM does not have an
intra-layer
Long Short-Term
Memory (LSTM)
Sequence data, long
time dependent data,
time-series
Supervised
(discriminative)
• Better performance
than its predecessors in
applications with
lengthy time lag input
data. And it can
operate with labeled
and unlabeled datasets
488
H. Salah and H. Zuhair
visual data analysis, and machine learning. DL is a subfield of machine learning in which
Deep Neural Networks (DNN) used to identify data representation at each layer [8].
The term “deep” in the definition of “DL” relates to the concept of consecutive
layers of representations. Furthermore, the depth of the model refers to the number of
layers used to model the data [8]. There are three types of deep learning architectures:
generative (unsupervised), discriminative (supervised), and hybrid architectures [9]:
• Generative Architecture (Unsupervised): It can learn from unlabeled raw data to
achieve its goals. For data that does not provide the expected result, we might use
the term “unsupervised.“
• Discriminative Architectures (supervised): Typically used to find patterns in labeled
data for prediction jobs [10]. In this learning type, a subset of training datasets is
required, which includes both the input and intended outcomes. The training set has
an impact on the classification of new data.
• Hybrid Architectures: This architecture combines both supervised and unsupervised
models. This employs generative features at first and discriminative features later to
recognize data.
Most deep learning-based detection engines have used different collections of data
pieces that the computer may consider as a single entity for phishing prediction, but the
acquired data must be understood and dealt with by the machines. Table 3 describes
the utilized datasets along with their data sources and size. To testify and qualify the
deep learning-based detection engines against zero-hour phishing patterns on scalable
datasets, various evaluation criteria are used, and they are characterized as presented in
Table 4.
Table 3. Summary of the utilized datasets in phishing detection
Dataset name
Size of dataset
Merits
Alexa database[14]
1M URLs
Top 1M site, Legitimate URLs
Common-Crawl [15]
940M URLs
2800M phishing URLs,
Legitimate URLs
Mendeley [16]
88,647 instances, 111 features
for full variant
Frequently published dataset
Phish-Tank [17]
6.8M URL’s
Daily updated, Phishing URLs
Open-Fish [18]
4,253 URLs
Daily updated, Phishing URLs
UCI Machine learning
repository [19]
11,055 URLs
30 features
Gathered from 2456 unique
websites
Ebbu2017 [20]
73,575 URLs
Both phishing and legitimate
URLs
Kaggle [21]
11,000 URL’S
Consists of many datasets
Best Websites [22]
5000 URLs
There is information about the
website available
Catching a Phish
489
Table 4. Summary of evaluation criteria
Criterion
Description
Formula
Accuracy
It is the proportion of correctly identified Accuracy =
samples to the total number of samples is (TP + TN )/(TP + TN + FN + FP)
that known as the right classification rate.
When the dataset is well-balanced, it is a
good metric
Precision
It defined as the percentage of
legitimately positive samples to the
anticipated legitimately positive samples
P = TP/(TP + FP)
Recall
It defined as the percentage of genuine
positive samples among all positive
samples
R = TP/(TP + FN )
F-measure
It is the harmonic average of accuracy
and recall
F = (2 ∗ P ∗ R)/(P + R)
4 Frontiers of Deep Learning-Based Phishing Detection
Upon the revision of related works in phishing detection, this section demonstrates the
main contribution of this paper by highlighting the frontiers of various deep learningbased phishing detection engines in terms of datasets sources, datasets size, extracted
features, specifications, and their performance outcomes, as presented in Appendix Table
A1. Then, justifying “why the revisited deep learning-based detection engines are still
sub-optimum to classify zero-hour phishing patterns?”.
To compile this questionable issue, their lacks and performance outcomes were
synthesized and categorized as follows:
• Features. Each baseline deep learning algorithm emulated a feature-based classifier
that projected the extracted features onto feature vectors. Then, it mapped these vectors back into the original extracted feature space to compare them versus the unexpected patterns. Unexpected patterns might be valid legitimate websites, valid phishing websites, and suspicious websites (neither phishing nor legitimate). Hence, not
all features (as their types and their values) were part of classification boundaries and
they were outliers in their mutual information, relevance, and redundancy across the
feature space. That yielded a proportional feature-based classifier to the error of its
reconstruction.
• Dataset. The web stream (collection of phishing and/or legitimate samples) might be
anonymized eventually before being publicly simulated in the data repositories. Such
anonymization obscured the potentially relevant features in these samples. Precisely,
either the categorical features were absent in the open release datasets, or their values
were missing.
• Tuning parameters. Developing and hybridizing multiple baselines deep learning algorithms in the detection engine needed to tune their functions/layers/layer dimension
490
H. Salah and H. Zuhair
on the same batch of data and batch size throughout a hyper-parameter search. Otherwise, the cost of missed detections would be substantially larger than the cost of
mistaken detections.
To produce a superior performance on a vast web stream involving more sophisticated
patterns and overtime changeable patterns of phishing, the aforementioned issues can be
leveraged to improve deep learning in the phishing detection domain by the following
disregarded facets:
• Eliminating the feature engineering mechanism that extracts a space of static phishing features by dramatically narrowing it into a vector of dynamic features which
constitutes the insider activity of phishing patterns.
• Qualifying the best and richest cluster of phishing anticipating features amongst the
literarily adopted deep learning algorithms for addressing their all-inclusive characterization and efficacious classification of zero-hour phishing patterns. That, in turn,
could provide progressive configuration to deep learning algorithms and then would
boost up the performance of detection engines towards maximal phishing detection
rates in the near future as well as minimal processing and storage footprints on online
mode.
• Applying deep learning-based detection engines on bigger web streams which may
include more static and dynamic anomalies of phishing. Chronological aggregation
of web streams will reveal less biased learning and the detection will be cost-sensitive
against implicit and explicit class balance problems.
• Dual categorization of phishing patterns onto their granularities as well as their release
time. Time of evolution will be a potential feature to characterize phishing patterns besides the prior examined features for minimal missing detections of different
phishing patterns might be launch within a single hour.
5 Conclusions
The revision of existing deep learning-based phishing detection engines in this paper
affirmed that they were computationally efficient but partially effective against zero-hour
phishing patterns. This was due to their limitations in leveraging feature engineer-ing,
dynamic features, big web stream, and functional parameters tuning. As stated in this
paper, building proactive deep learning-based detection depends on dynamic fea-tures,
datasets, and tuning parameters. Therefore, the paper restated the causality be-tween the
observed limitations and the boost-up outlooks in phishing detection to pro-mote the
detection of zero-hour phishing patterns on the evolving web stream. Such enhancement
would maximize the detection accuracy and minimize the missing detections as well as
reduce the computational cost. Overall, comparative, and critical review along with the
underlined perspectives will serve as a navigating taxonomy to the re-searchers for their
future work and extend the research facets.
Catching a Phish
491
Appendix
Table A1. Comparative performance outcomes of the revisited related works
Related
Work
Deep
Learning
Algorithm
Description
Dataset (s)
Performance Outcomes
Pavan
Kumar
et al. [23]
CNN
It is improved
with Swarm
Intelligence
Binary Bat
Algorithm to
learn URL
features
KAGGLE
Accuracy: 94.8%
0.2% False detections
Xiao et al.
[27, 28]
CNN
It is a
Five thousand legitimate Websites,
multi-headed
Phish Tank
and
self-attentional
algorithm
assisted by the
Generative
Adversarial
Network (GAN)
and URL
features
Accuracy: 97.20%
Detection Time: 174 as
Recall = 95.60%
Precision = 98.76%
F1 = 97.15%
Jiang et al.
[25]
CNN
Classifies URL Google, DMOZ Phish Tank, Virus
at
Total
character-level
by the features
of URL length,
URL separators,
number of dots,
and other
categorical and
lexical features
Miss Rates: 4/1000 URLs
Ozcan et al. DNN +
LSTM,
[26]
DNN +
Bi-LSTM
It is important
for NLP
features and
character
embedding
features
classification
Ebbu2017
Phish Tank
Accuracy
F1
DNN +
LSTM
98.62%
98.64%
DNN +
BILSTM
98.79%
98.8%
DNN +
LSTM
98.98%
99.1%
DNN +
BILSTM
99.21%
99.41%
(continued)
492
H. Salah and H. Zuhair
Table A1. (continued)
Related
Work
Deep
Learning
Algorithm
Description
Dataset (s)
Performance Outcomes
Somesha
et al. [1]
DNN +
CNN +
LSTM
It uses
information
gain (IG) for
features ranking
and optimizing
a set of URL
obfuscation
features,
hyperlink-based
features, and
third
party-based
features
Phish Tank, Alexa
Accuracy varied from: 99.57%,
to 99.43%
Liang et al.
[27]
DBN
Borderline
Smote-based
classification
across a set of
URL features,
Page contents,
and Images
Phish Tank
Recall: 90.7%
Precision: 96.5%
Huang
et al. [28]
CNN + RNN
It segments
specific Viterbi
and
URL features
for phishing
classification
Phish Tank,
Alexa,
Open-Fish
Accuracy: 97.905%
FPR = 0.020%
Precision: 98.958%
Yang et al.
[29]
CNN +
LSTM
Integrating
soft-max and
dropout
mechanisms for
overfitting
solution with
Logistic
Regression and
XGBoost to
classify URL
features, and
static contents
of webpage
code
Phish Tank, Dmoz
Recall = 98.57%
Precision = 99.41%
F1 = 99.9%
Yerima and
Alzaylaee
[30]
CNN 1D
Classifying
URL features
syntax
UCI Machine learning repository
Accuracy = 97.3%
Recall = 98.2%
Precision = 97%
F1 = 97.6%
Su [31]
LSTM
Classifying
URL features
syntax
Phish Tank
Accuracy: 99.14%
Recall: 98.91%
Precision: 98.74%
FNR: 02.12%
Yazhmozhi
et al. [32]
LSTM +
CNN
Classifying
URL features
syntax
Phish Tank
Precision: 97%
Accuracy: 96%
(continued)
Catching a Phish
493
Table A1. (continued)
Related
Work
Deep
Learning
Algorithm
Description
Dataset (s)
Performance Outcomes
Singh et al.
[33]
CNN
Classifies
embedding
objects and
URL features
throughout two
layers
https://github.com/ebbubekirbbr/pdd/
tree/master/input
Accuracy: 98.0%
Rasymas
and
Dovydaitis
[34]
CNN
Classifies URL
features at
multiple layers
Phish Tank
Accuracy: 94.4%
Wei et al.,
[35]
CNN
Classifies URL
features at
multiple layers
Phish Tank, Alexa, Common-Crawl
Accuracy: 99.98%
Zhang et al. AE and CNN
[36]
Classifies 30
features of
URLs, webpage
source code in a
multi-modal
classification
Phish Tank, UCI Machine learning
repository
Accuracy: 97.68%
Lakshmi
et al. [37]
DNN
Uses batch
UCI Machine learning repository
normalization of
30 hyperlinking
features of
phishing
websites
Not presented
Al-Ahmadi
& Alharbi
[38]
CNN
Recognizes
URL and visual
content as
screenshots in a
two-layered
classification
model
Accuracy: 99.67%
Precision: 99.43%
F1 score: 99.28%
Recall: 99.47%
Ali &
Ahmed
[39]
DNN
Utilizes a
UCI Machine learning repository
graphical
feature and
features ranking
mechanisms to
classify long
URL, Server
Form Handler
(SFH), Having
the IP Address,
Request URL,
URL of Anchor,
Age of Domain,
Website Traffic,
Pop-Up
window,
HTTPS, and
SSL,
2000 webpage screenshots and URLs
Not presented
(continued)
494
H. Salah and H. Zuhair
Table A1. (continued)
Related
Work
Deep
Learning
Algorithm
Description
Dataset (s)
Performance Outcomes
Yao et al.
[40]
R-CNN
It improved for FlickrLogos-32
Feature Pyramid
Network (FPN)
and Logo
FlickrLogos-32plus
Recognition
Precision: 98.9%
F1 score: 94.6%
Recall: 90.6%
Precision: 98.6%
F1 score: 94.2%
Recall: 90.1%
Xiao et al.
[24]
CNN +
LSTM
It classifies
URL and
website content
features like
images and
frame elements
Common-Crawl, Phish Tank, 10,000
webpage screenshots
Precision: 93.3%
F-measure: 94.2%
Recall: 93.27%
Accuracy: 93.28%
Chen et al.
[41]
LSTM
It classifies
features of
domain names,
subdomain
length, URL
length, prefixes
and suffixes
Length ratio,
punctuation
counts, TLDs,
IP address, Port
Number, and
URL Entropy
Yahoo Directory, Phish Tank
Precision: 98.74%
Recall: 98.91%
Accuracy: 93.28%
Opara et al.
[42]
CNN
It characterizes Common-Crawl, Phish Tank, Alexa
syntax and word
embedding
content of
HTML code
including tables,
text, images,
hyperlinks, and
lists
Accuracy: 93%
Hema et al.
[42]
DNN
DNN classifies
UCI Machine learning repository
30 URL features
Accuracy: 94.3%
Feng et al.
[43]
Stacked
Auto-encoder
(SAE)
Soft-maxing
source codes of
HTML, URL,
and the
third-party
services
Not clearly presented
Phish Tank, Alexa
Catching a Phish
495
References
1. Somesha, M., Pais, A.R., Rao, R.S., Rathour, V.S.: Efficient deep learning techniques for the
detection of phishing websites. Sādhanā 45(1), 1–18 (2020). https://doi.org/10.1007/s12046020-01392-4
2. Zuhair, H., Selamat, A.: Phish webpage classification using hybrid algorithm of machine
learning and statistical induction ratios. Int. J. Data Min. Model. Manag. 12(3), 255–276
(2020)
3. Zuhair, H., Selamat, A.: Phishing classification models: issues and perspectives. Int. J. Digit.
Enterpr. Technol. 1(3), 219–240 (2019). https://doi.org/10.1504/ijdet.2019.10019065
4. Tang, L., Mahmoud, Q.H.: A Survey of machine learning-based solutions for phishing website
detection. Mach. Learn. Knowl. Extr. 3, 672–694 (2021). https://doi.org/10.3390/make30
30034
5. Routhu Srinivasa Rao, A.R.P.: Detection of phishing websites using an efficient feature-based
machine learning framework. Neural Comput. Appl. 31(8), 3851–3873 (2018)
6. Bai, W.: Phishing website detection based on machine learning algorithm. In: Proceedings
- 2020 International Conference Computing Data Science CDS 2020, pp. 293–298 (2020).
https://doi.org/10.1109/CDS49703.2020.00064
7. Josh Patterson, A.G.: Deep Learning. O’Reilly Media, Inc. (2017)
8. Abbasi, M., Shahraki, A., Taherkordi, A.: Deep learning for network traffic monitoring and
analysis (NTMA): a survey. Comput. Commun. 170, 19–41 (2021). https://doi.org/10.1016/
j.comcom.2021.01.021
9. Mosca, P., Zhang, Y., Xiao, Z., Y.W.: Cloud security: services, risks, and a case study on
amazon cloud services. Int’l J. Commun. Netw. Syst. Sci. 7(12), 529 (2014)
10. Aldweesh, A., Derhab, A., Emam, A.Z.: Deep learning approaches for anomaly-based intrusion detection systems: a survey, taxonomy, and open issues. Knowledge-Based Syst. 189,
105124 (2020). https://doi.org/10.1016/j.knosys.2019.105124.
11. Berman, D.S., Buczak, A.L., Chavis, J.S., Corbett, C.L.: A survey of deep learning methods
for cyber security. Inf. 10(4), 122 (2019). https://doi.org/10.3390/info10040122
12. O’Shea, K., Nash, R.: An Introduction to Convolutional Neural Networks. (2015)
13. Yuan, X., Li, L., Wang, Y.: Nonlinear dynamic soft sensor modeling with supervised long
short-term memory network. IEEE Trans. Ind. Inform. 16, 3168–3176 (2020). https://doi.org/
10.1109/TII.2019.2902129
14. ALEXA Homepage. https://www.alexa.com/topsites. Accessed 21 Oct 2021
15. Commoncrawl Homepage. http://index.commoncrawl.org/. Accessed 21 Oct 2021
16. Vrbančič, G.: Phishing Websites Dataset. https://doi.org/10.17632/72ptz43s9v.1. Accessed
13 Nov 2021
17. Phish Tank Homepage. https://www.phishtank.com/. Accessed 21 Oct 2021
18. Openphish Homepage. https://openphish.com/. Accessed 21 Oct 2021
19. UCI Machine learning repository. https://archive.ics.uci.edu/ml/datasets/phishing+websites.
Accessed 21 Oct 2021
20. Github Homepage. https://github.com/ebubekirbbr/pdd/tree/master/input. Accessed 21 Oct
2021
21. Kaggle Homepage. https://www.kaggle.com/datasets. Accessed 21 Oct 2021
22. 5000best Homepage. http://5000best.com/websites/. Accessed 21 Oct 2021
23. Pavan Kumar, P., Jaya, T., Rajendran, V.: SI-BBA – a novel phishing website detection based
on Swarm intelligence with deep learning. Mater. Today Proc. (2021). https://doi.org/10.1016/
j.matpr.2021.07.178
24. Xiao, X., et al.: Phishing websites detection via CNN and multi-head self-attention on imbalanced datasets. Comput. Secur. 108, 102372 (2021). https://doi.org/10.1016/j.cose.2021.
102372.
496
H. Salah and H. Zuhair
25. Jiang, J., et al.: A deep learning based online malicious URL and DNS detection scheme. In:
Lin, X., Ghorbani, A., Ren, K., Zhu, S., Zhang, A. (eds.) SecureComm 2017. LNICSSITE, vol.
238, pp. 438–448. Springer, Cham (2018). https://doi.org/10.1007/978-3-319-78813-5_22
26. Ozcan, A., Catal, C., Donmez, E., Senturk, B.: A hybrid DNN–LSTM model for detecting
phishing URLs. Neural Comput. Appl. 0123456789 (2021). https://doi.org/10.1007/s00521021-06401-z.
27. Wang, G., Atiquzzaman, M., Yan, Z., Choo, K.-K. (eds.): SpaCCS 2017. LNCS, vol. 10658.
Springer, Cham (2017). https://doi.org/10.1007/978-3-319-72395-2
28. Huang, Y., Yang, Q., Qin, J., Wen, W.: Phishing URL detection via CNN and attentionbased hierarchical RNN. In: Proceedings - 2019 18th IEEE International Conference Trust
Security Private Computing Communication IEEE International Confrence Big Data Science Engineering Trust 2019. 112–119 (2019). https://doi.org/10.1109/TrustCom/BigDat
aSE.2019.00024
29. Yang, P., Zhao, G., Zeng, P.: Phishing website detection based on multidimensional features
driven by deep learning. IEEE Access. 7, 15196–15209 (2019). https://doi.org/10.1109/ACC
ESS.2019.2892066
30. Yerima, S.Y., Alzaylaee, M.K.: High accuracy phishing detection based on convolutional
neural networks. In: ICCAIS 2020 - 3rd International Conference Computing Application Information Security, pp. 19–21 (2020). https://doi.org/10.1109/ICCAIS48893.2020.909
6869
31. Su, Y.: Research on website phishing detection based on LSTM RNN. In: Proceedings 2020
IEEE 4th Information Technology Networking, Electronic Automation Control Conference
ITNEC 2020, pp. 284–288 (2020). https://doi.org/10.1109/ITNEC48623.2020.9084799
32. Yazhmozhi, V.M., Janet, B., Reddy, S.: Anti-phishing system using LSTM and CNN. In: 2020
IEEE International Conference for Innovation in Technology INOCON 2020, pp. 1–5 (2020).
https://doi.org/10.1109/INOCON50539.2020.9298298
33. Singh, S., Singh, M.P., Pandey, R.: Phishing detection from URLs using deep learning approach. In: Proceedings of 2020 International Conference on Computing, Communication
and Security ICCCS 2020, pp. 16–19 (2020). https://doi.org/10.1109/ICCCS49678.2020.927
7459
34. Rasymas, T., Dovydaitis, L.: Detection of phishing URLs by using deep learning approach
and multiple features combinations. Balt. J. Mod. Comput. 8, 471–483 (2020). https://doi.
org/10.22364/BJMC.2020.8.3.06
35. Wei, W., Ke, Q., Nowak, J., Korytkowski, M., Scherer, R., Woźniak, M.: Accurate and fast
URL phishing detector: a convolutional neural network approach. Comput. Netw. 178 (2020).
https://doi.org/10.1016/j.comnet.2020.107275
36. Zhang, X., Shi, D., Zhang, H., Liu, W., Li, R.: Efficient detection of phishing attacks with
hybrid neural networks. In: International Conference on Communication Technology Proceedings, ICCT. 2019-October, pp. 844–848 (2019). https://doi.org/10.1109/ICCT.2018.860
0018
37. Lakshmi, L., Reddy, M.P., Santhaiah, C., Reddy, U.J.: Smart phishing detection in web pages
using supervised deep learning classification and optimization technique ADAM. Wirel. Pers.
Commun. 118(4), 3549–3564 (2021). https://doi.org/10.1007/s11277-021-08196-7
38. Al-Ahmadi, S., Alharbi, Y.: A deep learning technique for web phishing detection combined
Url features and visual similarity. Int. J. Comput. Networks Commun. 12, 41–54 (2020).
https://doi.org/10.5121/ijcnc.2020.12503
39. Ali, W., Ahmed, A.A.: Hybrid intelligent phishing website prediction using deep neural
networks with genetic algorithm-based feature selection and weighting. IET Inf. Secur. 13,
659–669 (2019). https://doi.org/10.1049/iet-ifs.2019.0006
Catching a Phish
497
40. Yao, W., Ding, Y., Li, X.: Deep learning for phishing detection. In: Proceedings - 16th IEEE
International Symposium Parallel Distribution Processing with Application 17th IEEE International Conference Ubiquitous Computing Communication 8th IEEE International Conference Big Data Cloud Computing, vol. 11t, pp. 645–650 (2019). https://doi.org/10.1109/BDC
loud.2018.00099
41. Chen, W., Zhang, W., Su, Y.: Phishing detection research based on LSTM recurrent neural
network. In: Zhou, Q., Gan, Y., Jing, W., Song, X., Wang, Y., Lu, Z. (eds.) ICPCSEE 2018.
CCIS, vol. 901, pp. 638–645. Springer, Singapore (2018). https://doi.org/10.1007/978-98113-2203-7_52
42. Opara, C., Wei, B., Chen, Y.: HTMLPhish: enabling phishing web page detection by applying
deep learning techniques on HTML analysis. In: Proceedings of International Joint Conference Neural Networks, pp. 1–8 (2020). https://doi.org/10.1109/IJCNN48605.2020.920
7707
43. Hema, R., Ramya, V., Sahithya, K., Sekharan, R.: Detecting of phishing websites using deep
learning. J. Crit. Rev. 7, 3606–3613 (2020)
44. Feng, J., Zou, L., Nan, T.: A phishing webpage detection method based on stacked autoencoder
and correlation coefficients. J. Comput. Inf. Technol. 27, 41–54 (2019). https://doi.org/10.
20532/cit.2019.1004702
Applying an Enhanced Elliptic Curve Integrated
Encryption Scheme ECIES to Enhance Smart
Energy IoT Platform Security Based
on Constrained Protocol
Ayoub Ech-Chkaf1(B) , Salma Ait Oussous1 , Abdelhadi El Allali1 , Siham Beloualid1 ,
Taoufiq El Harrouti2 , Sanaa El Aidi1 , Abderrahim Bajit1 , Habiba Chaoui1 ,
and Ahmed Tamtoui3
1 Laboratory of Advanced Systems Engineering (ISA), National School of Applied Sciences,
Ibn Tofail University, Kenitra, Morocco
{ayoub.ech-chkaf,salma.aitoussous,siham.beloualid,sanaa.elaidi,
habiba.chaoui}@uit.ac.ma, aelallali@gmail.com,
abderrahim.bajit@gmail.com
2 Department of Computer Science, Logistics and Mathematics (ILM) Engineering Science
Laboratory National School of Applied Sciences, Ibn Tofail University, Kenitra, Morocco
taoufiq.elharrouti@uit.ac.ma
3 Laboratory of Advanced Systems National Institute of Posts and Telecommunications, SC
Department, Mohammed V University, Rabat, Morocco
tamtaoui@inpt.ac.ma
Abstract. The smart city is a new urban development idea whose purpose is to
improve people’s quality of life while also protecting the environment by utilizing new technologies that rely on an ecosystem of objects and services to make
cities more adaptable and efficient. And the Internet of Things (IoT) is at the heart
of practically all smart city gadgets and solutions. Data cannot be collected and
presented in the different ways required by the city without it. It allows smart city
sensors to regulate lighting, water and waste management, sound and air quality sensors, parking management, etc. Real-time data from buildings, streets, and
infrastructure can now be actionable and valuable to all parties involved due to
the IoT. In our work, we developed an intelligent and secure IoT Smart energy
platform to monitor and control energy use in various parts of a smart city, utilizing the CoAP communication protocol to transport data from smart meters to
a web server. We also used different topologies such as STAR, TREE, MESH,
and CLUSTER to optimize the performance of our platform in terms of execution
time and memory consumption, and we evaluated the impact of the ECIES security protocol compared to other security protocols such as AES-SHA256, RSA,
and EEECC.
Keywords: IoT Smart energy platform · CoAP IoT protocol · STAR · TREE ·
MESH · CLUSTER topologies · AES-SHA256 · RSA-SHA256 · EEECC ·
ECIES security protocols
© The Author(s), under exclusive license to Springer Nature Switzerland AG 2022
F. Saeed et al. (Eds.): IRICT 2021, LNDECT 127, pp. 498–511, 2022.
https://doi.org/10.1007/978-3-030-98741-1_41
Applying an Enhanced Elliptic Curve Integrated Encryption Scheme
499
1 Introduction
Smart city initiatives around the world are being enabled by new IoT applications. It
enables remote monitoring, management, and control of devices, as well as the extraction of fresh insights and actionable data from huge quantities of real-time data. A high
degree of information technology integration and a broad application of information
resources are two of the most important characteristics of a smart city. Moreover, smart
technology, smart industry, smart services, smart management, and smart grid are all
vital components of urban growth for a smart city [1]. IoT has an important role which
is presented in sensor’s installation, then connect them to the internet via a protocol for
transmitting data and enabling the communication, to generate a huge amount of data to
be collected, transferred and examined to distribute results, and to obtain for example
intelligent recognition, monitoring, and managing the energy production and consumption in a changing area. With the help of IoT, Smart cities must have three characteristics:
they must be instrumented, networked, and smart. Then, at this advanced degree of IoT
development, Smart City can be constructed by combining all of these intelligent components. The rapid expansion of it and IoT applications has created science and engineering
issues that necessitate creative research from academia and business, particularly for the
development of efficient, flexible, and dependable Smart Cities based on IoT [2]. A
smart grid component is a modern electrical grid that employs analog or digital data and
communication technology to make the most efficient use of widely available energy
resources [3]. Renewable energy is an important topic in the study because of its wide
availability, usability, and environmental responsibility, and the use of the smart grid
in renewable energy expands its potential. This combination helps in the proper use of
renewable sources, which is a big issue [4].
The present work attempts to develop an IoT smart energy platform to monitor
and control the energy consumption of any area in a city while using the sustainability
factor as a goal to ensure a green living lifestyle using the CoAP protocol, which is
a customized web transfer protocol designed for IoT devices with limited resources,
and it’s made for M2M applications like smart energy [5, 6]. Then, we studied the
impact of the ECIES security algorithm in our platform, by applying a set of topologies
STAR, TREE, MESH, and CLUSTER to choose the appropriate topology for each zone
in terms of memory consumption and execution time. Star topology is composed of a
single network coordinator and one or more terminal devices that only interact with the
coordinator, and it establishes centralized management for network operations and makes
it simple to add a new node [7]. A Tree is based on a child-parent relationship, where
the coordinator is connected to routers that can also be connected to others or leaf nodes
[8]. Mesh is different, it has no hierarchical relationship, the communication is more
flexible, and it is characterized by its increased reliability as more alternate pathways
become accessible [9]. The Cluster is the most complex since it is a combination of the
other topologies, then it can handle a large volume of traffic. In addition, it also has a
hierarchy of child parents like a tree [10].
500
A. Ech-Chkaf et al.
2 Smart Grid IoT Platform and Aims
The objective of our work is to develop an intelligent and secure smart grid IoT platform
for a smart city in real-time, which is used to collect, analyze and control the energy
consumption in each area in the smart city such as tourist area, industrial area, commercial
area, etc.
As shown in Fig. 1, we used IoT smart meter nodes for each zone to measure the
amount of energy consumed over a specified period, and then, we send data to the CoAP
server via routers. The CoAP server sends the data to the webserver for modeling and
analysis. This analysis provides an overview of our city’s energy consumption and allows
us to discover which areas are consuming more energy and the reason, to improve the
consumption in the different areas of the city, as well as to choose the topology that suits
it.
To accomplish this task, we employed four distinct topologies, in which the IoT smart
meter nodes are connected directly to the coordinator, or each End device is connected to
the coordinator via routers that operate as an intermediary. And to guarantee the security
of the data that circulates, we have added the ECIES security layer.
Fig. 1. IoT smart grid platform architecture based on CoAP protocol.
Applying an Enhanced Elliptic Curve Integrated Encryption Scheme
501
3 Methodology
To model and improve effective energy management by adopting environmental
resources to control and power modern life devices in smart cities and contribute to
better air quality and lower environmental nuisance, we used an IoT platform model
interested in handling resource analysis and optimization needs by collecting stable and
accurate information. And to avoid any kind of data loss, this data must be secured.
Data security has become an important topic. The majority of the data we use is
insecure. As a result, we must search for solutions to secure them. And cryptography is
one of several methods for securing information [11].
Elliptic Curve Cryptography (ECC) is a type of cryptography that can be used to
encrypt data, create digital signatures, and manage key exchanges. ECC cryptography
is considered the most suitable current successor to the Cryptosystem since it employs
shorter keys and signatures for the same degree of security as RSA and allows for
extremely quick key generation, key agreement, and signatures [12].
Moreover, it offers a range of approaches that rely on the mathematics of elliptic
curves over finite fields, including ECC encryption algorithms and hybrid encryption
schemes such as the ECIES Elliptic Curve Integrated Encryption Scheme, integrated
and EEECC Energy-efficient Elliptic Curve cryptography, to ensure that authentication
and key distribution issues are solved [13].
The present algorithms are known as hybrid cryptosystems since they combine symmetric and asymmetric techniques. The ECIES is the most well of the hybrid cryptosystems based on ECC, it may be found in various cryptographic standards as a result [14].
It is a public key encryption system that is based on the ElGamal encryption algorithm
and is developed for Elliptic curve groups. It is ANSI X9.63 and ISO/IEC 15946-3
standardized, as well as IEEE P1363a. In addition, adaptively selected plaintext and
chosen-ciphertext attacks are protected by this method. It combines encryption, key
exchange, and digital signature capabilities. Because it is a hybrid scheme that uses a
public key system to transmit a session key for use by a symmetric cryptosystem, it is
dubbed Integrated Encryption Scheme [15].
The ECIES standard mixes ECC-based asymmetric cryptography with symmetric
ciphers to offer data encryption and decryption using an EC private key and an EC public
key. It employs ECC cryptography (public key cryptosystem) in conjunction with a keyderivation function, symmetric encryption, and the MAC algorithm. For decryption, the
ECIES produces the original plaintext message by combining the output of the encryption
with the recipient’s private key [16].
Finally, our work is based on this security algorithm to ensure authentication,
confidentiality, and availability of data in good condition.
4 Related Works
The authors provide secure and lightweight authentication algorithms for IoT devices
based on this notion [16]. The devices in the perception layer are mutually authenticated
with the system’s gateway, in a centralized network paradigm. A mutual authentication
approach that employs symmetric key negotiation with Elliptic Curve Diffie-Hellman
502
A. Ech-Chkaf et al.
(ECDH) in the registration part of the protocol to preserve device credentials while minimizing device calculation costs. After the authentication, the sensor devices and the
gateway form a key agreement based on symmetric-key cryptography. Furthermore, in
the registration step of the preceding protocol, the Elliptic Curve Integrated Encryption
Scheme (ECIES) approach is employed to avoid the risk of a man-in-the-middle attack
(MITM). The protocols are subjected to an informal security verification, which shows
that they are resistant to perception layer assaults. After the protocol has been simulated
in the Cooja simulator under the Contiki OS environment, the performance of the protocol has been evaluated using metrics such as execution time, communication cost, and
calculation cost. Furthermore, as compared to existing protocols, the suggested system
is lightweight since it has a cheap calculation cost and a faster execution time.
Second, the authors give a survey of ECC in the context of lightweight cryptography
in their article [17]. The goal of this work is to establish the parameters that make an ECCbased system lightweight and useful in limited situations. The key factors examined in
ECC designs for lightweight realizations are systematically reviewed in representative
works. As a result, this work establishes the concept and specifications for elliptic curve
lightweight cryptography for the first time.
Based on those works, and from the previous work [18], which we created a smart
grid platform for a smart city that aims to monitor and analyze energy consumption,
using smart meter IoT nodes for each area. First, from the comparison performed on
the data sent by the IoT nodes in terms of execution time and memory occupancy using
the CoAP and MQTT protocols, we concluded that the CoAP protocol is better than the
other one because it uses a small packet size, it consumes less memory and it takes less
time to execute.
Then, we studied the impact of the topologies in terms of execution time and memory
consumption, with and without security. The test is done on the following security
protocols RSA-SHA256 and ECC, and we focused our study on the impact of the ECC
to compare it with RSA. From this study, we found that ECC is better than RSA since
it offers high data security, as well as it is fast, efficient, and consumes little memory
thanks to its small size keys. The present work is a continuity of the previous work,
we aim to achieve the same objectives as the previous, but this time we will focus our
study on the impact of another security algorithm that ECC uses which is ECIES that
must be compared with AES-SHA256 and EEECC to choose the best one using multi
topologies.
5 The Proposed Approach
Our approach is focused on developing an IoT smart grid platform for a smart city, which
collects, analyzes, and manages energy usage in each zone. To fix that, we employed
IoT smart meters to quantify the quantity of energy spent in each zone; using the CoAP
protocol. Moreover, it is based on different parts, where each zone uses one or more
topologies. The use of these topologies is based on several criteria like surface, smart
meter’s number, and the distance between smart meters, routers, and coordinators. For
securing our data circulates between them, we added the ECIES algorithm.
We choose to work with the CoAP protocol because it is asynchronous takes little
time to execute and consumes less memory compared to MQTT according to these
Applying an Enhanced Elliptic Curve Integrated Encryption Scheme
503
works [19, 20]. However, ECC is considered the most modern and secure protocol, it is
a combination of the EEECC algorithm and the ECIES algorithm. And since it generates
keys and computes message signatures faster than the RSA algorithm, additionally, it is
capable to provide the same level of security as RSA.
We decided to study the impact of the ECIES algorithm to approve that it is the
best in terms of memory consumption and execution time, by doing tests. Then we
compared it with AES-SHA256 which is a security protocol faster in processing with
high performance, low resource and memory requirements, as well as the possibility
of encrypting and decrypting a large amount of data quickly compared to RSA [21],
because it uses symmetric encryption with a smaller key size in which the sender and
receiver of a communication share a single common key to encrypt and transmit the
information.
6 Discussion and Results
To achieve the goal of our work, we made many tests for studying the performance of our
platform in terms of execution time and memory consumption using different topologies
Start, Tree, Mesh, and Cluster, with and without security layers.
In this section, we will discuss the results obtained to choose the best security layer.
So, we focused to work with four versions of security: secured with RSA-SHA256,
AES-SHA256, EEECC, and ECIES, using the CoAP protocol.
Firstly, Fig. 2 shows the results of all versions of the security layer mentioned before
in terms of execution time by each type of topology. According to these results, we
observed that the ECIES algorithm takes little time to execute which is the opposite of
EEECC and RSA-SHA256. For AES-SHA256, we can say that it is almost the same as
ECIES.
Secondly, Fig. 3 shows the results of all versions of the security layer in terms of
memory consumption by topologies. From these results, we found that RSA- SHA256
consumes a lot of memory compared to ECIES. Moreover, ECIES consumes also more
memory compared to EEECC and AES-SHA256.
Thirdly, Fig. 4 shows the average execution time and the average memory consumption for each topology by different versions of security. From these tests, we found that
EEECC takes a lot of time to execute compared to the others, and ECIES is the least
time-consuming. However, for the average memory consumption by topology and security layer, we found that RSA consumes more, then ECIES, AES-SHA256, and EEECC
is the less consuming.
Additionally, Table 1 shows the average execution time according to the type of
topology and security version, where we found that ECIES takes less time, On the other
hand, RSA-SHA256 and EEECC take more time to execute.
However, Table 2 represents the average memory consumption by topology and security, we found that RSA-SHA256 consumes a lot of memory than the others. Fourthly,
Table 3 represents the gain of execution time by topology and security layer, and Table
4 shows the memory consumption gain by topology and security layer, we found that
ECIES saves time compared to RSA-SHA256, AES-SHA256, and EEECC, on the other
504
A. Ech-Chkaf et al.
hand at the level of memory consumption, we found that ECIES saves memory compared
to RSA-SHA256 but it causes a loss of memory compared to AES-SHA256.
From all these results, we can deduce that ECIES is the suitable security algorithm for
our platform. Since RSA-SHA256 takes time to execute and consumes a lot of memory,
it causes us a great loss. Moreover, ECIES takes more time compared to RSA-SHA256,
which also causes a loss, even if it consumes less memory. As for AES-SHA256, since
it is symmetric, it can cause problems in managing several keys when we have a lot of
Fig. 2. Execution time with and without security by topologies.
Applying an Enhanced Elliptic Curve Integrated Encryption Scheme
Fig. 2. continued
505
506
A. Ech-Chkaf et al.
keys, as well as being vulnerable to attacks. From this, we can conclude that ECIES is
the best security algorithm because it is more efficient and has a higher security level.
Fig. 3. Memory consumption with and without security by topologies.
Applying an Enhanced Elliptic Curve Integrated Encryption Scheme
Fig. 3. continued
507
508
A. Ech-Chkaf et al.
Fig. 4. Average Execution time and memory consumption with and without security by topology.
Table 1. Average time execution for the IoT smart grid platform.
Star
Time (MS)
Tree
Mesh
Cluster
RSA
554.21
665.47
740.56
611.85
AES
528.15
601.41
726.13
596.1
EEECC
774.86
1095.34
1441.93
704.45
ECIES
527.77
655.83
704.45
597.28
Unsecured
520.58
600.35
685.68
588.04
Applying an Enhanced Elliptic Curve Integrated Encryption Scheme
509
Table 2. Average memory consumption for the IoT smart grid platform.
Memory
RSA
Star
Tree
Mesh
Cluster
266.65
395.98
440.31
426.03
AES
241.28
354.33
410.58
388.43
EEECC
216.98
344.5
397.28
375.91
ECIES
256.28
378.93
418.85
404.81
Unsecured
209.28
320.26
377.08
355.81
Table 3. The gain of the execution time of ECIES compared to AES, RSA, and EEECC by
topology.
Time
ECIES % RSA
Time
ECIES % AES
Star
4.77%
0.07%
Tree
1.44%
–9.04%
Mesh
4.87%
2.98%
Cluster
2.38%
–0.19%
Table 4. The gain of memory consumption of ECIES compared to AES, RSA and EEECC by
topology.
Memory
ECIES % RSA
Memory
ECIES % AES
Star
3.88%
– 6,24%
Tree
4.30%
– 6.94%
Mesh
4.87%
– 2.01%
Cluster
4.98%
– 4.21%
7 Conclusion and Perspectives
In this work, we created a smart grid platform for a smart city that aims to monitor and
analyze energy consumption, using smart meter nodes for each zone. This work is done
with the CoAP protocol to study the impact of topologies and different types of security
on the functioning of our platform because the goal was to apply an enhanced Elliptic
Curve Integrated Encryption Scheme ECIES to enhance Smart Energy in IoT Platform.
So, the results show that ECIES is the most suitable.
In the next work, we will improve this platform by working on the optimization of
the costs of transmission of electrical energy, in order to propose a model that reduces
510
A. Ech-Chkaf et al.
costs and greenhouse gas emissions. And we will apply the Zigbee protocol to compare
it with CoAP, as well as we will integrate the Blockchain.
References
1. Serban, A.C., Lytras, M.D.: Artificial intelligence for smart renewable energy sector in Europe
smart energy infrastructures for next generation smart cities. IEEE Access 8, 77364–77377
(2020). https://doi.org/10.1109/AC-CESS.2020.2990123
2. Mohammed, T.-H.: Smart city and IoT. Futur. Gener. Comput. Syst. 76, 159–162 (2017).
https://doi.org/10.1016/j.future.2017.03.034
3. Vineetha, C.P., Babu, C.A.: Smart grid challenges, issues and solutions. In: 2014 International
Conference on Intelligent Green Building and Smart Grid (IGBSG), pp. 1–4 (2014). https://
doi.org/10.1109/IGBSG.2014.6835208
4. Sharma, H., Kaur, G.: Optimization and simulation of smart grid distributed generation: a
case study of university campus. In: 2016 IEEE Smart Energy Grid Engineering (SEGE),
pp. 153–157 (2016). https://doi.org/10.1109/SEGE.2016.7589517
5. Bellavista, P., Zanni, A.: Towards better scalability for IoT-cloud interactions via combined
exploitation of MQTT and CoAP. In: 2016 IEEE 2nd International Forum on Research and
Technologies for Society and Industry Leveraging a better tomorrow (RTSI), pp. 1–6 (2016).
https://doi.org/10.1109/RTSI.2016.7740614
6. Kayal, P., Perros, H.: A comparison of IoT application layer protocols through a smart parking
implementation. In: 2017 20th Conference on Innovations in Clouds, Internet and Networks
(ICIN), Paris, pp. 331–336 (2017). https://doi.org/10.1109/ICIN.2017.7899436
7. Pramono, S., Putri, A.O., Warsito, E., Basuki, S.B.: Comparative analysis of star topology and
multihop topology outdoor propagation based on Quality of Service (QoS) of wireless sensor
network (WSN). In: 2017 IEEE International Conference on Communication, Networks, and
Satellite (Comnetsat), pp. 152–157 (2017). https://doi.org/10.1109/COMNETSAT.2017.826
3591
8. Celtek, S.A., Durdu, A., Kurnaz, E.: Design and simulation of the hierarchical tree topology
based wireless drone networks. In: 2018 International Conference on Artificial Intelligence
and Data Processing (IDAP), pp. 1–5 (2018). https://doi.org/10.1109/IDAP.2018.8620755
9. Yu, L., Kin-Fai, T., Xiangdong, Q., Ying, L., Xuyang, D.: Wireless Mesh Networks in IoT
networks. In: 2017 International Workshop on Electromagnetics: Applications and Student
Innovation Competition, pp. 183–185 (2017). https://doi.org/10.1109/iWEM.2017.7968828
10. Ouadou, M., Zytoune, O., Aboutajdine, D., ElHillali, Y., Menhaj-Rivenq, A.: Improved
Cluster-tree topology adapted for indoor environment in Zigbee Sensor Network. Procedia
Comput. Sci. 94, 272–279 (2016). https://doi.org/10.1016/j.procs.2016.08.041
11. Di Matteo, S., Baldanzi, L., Crocetti, L., Nannipieri, P., Fanucci, L., Saponara, S.: Secure
elliptic curve crypto-processor for real-time IoT applications. Energies 14(15), 4676 (2021).
https://doi.org/10.3390/en14154676
12. Sadkhan, S.B.: Elliptic curve cryptography- status, challenges, and future trends. In: 2021
7th International Engineering Conference “Research & Innovation amid Global Pandemic”
(IEC), pp. 167–171 (2021). https://doi.org/10.1109/IEC52205.2021.9476090
13. Salim, A., Abbas, A., Abdul, B.M.: Data security for cloud computing based on elliptic curve
integrated encryption scheme (ECIES) and modified identity-based cryptography (MIBC). In:
International Journal of Applied Information Systems (IJAIS) – ISSN: 2249-0868 Foundation
of Computer Science FCS, New York, USA, vol. 10, no.6 (Mar 2016). www.ijais.org
14. Vinchoo, M.M., Kadam, S.S., Shaikh, I.A., Vora, D., Nayak, D.: Grey Immune: Security in
hybrid cloud. In: 2017 International Conference on Intelligent Sustainable Systems (ICISS),
pp. 492–495 (2017). https://doi.org/10.1109/ISS1.2017.8389460
Applying an Enhanced Elliptic Curve Integrated Encryption Scheme
511
15. Milen, S., Marina, S.: Practical book cryptography for developers. https://cryptobook.nakov.
com/
16. Oh, J., Yu, S., Lee, J., Son, S., Kim, M., Park, Y.: A secure and lightweight authentication
protocol for IoT-based smart homes. Sensors 21, 1488 (2021). https://doi.org/10.3390/s21
041488
17. Lara-Nino, C.A., Diaz-Perez, A., Morales-Sandoval, M.: Elliptic curve lightweight cryptography: a survey. IEEE Access 6, 72514–72550 (2018). https://doi.org/10.1109/ACCESS.2018.
2881444
18. Rao, V., Prema, K.V.: Lightweight authentication and data encryption scheme for IoT applications. In: 2020 IEEE International Conference on Distributed Computing, VLSI, Electrical
Circuits and Robotics (DISCOVER), pp. 12–17 (2020). https://doi.org/10.1109/DISCOVER5
0404.2020.9278048
19. Yachou, M., et al.: Applying lightweight elliptic curve cryptography ECC to smart energy
IOT platforms based on the CoAP protocol. In: The International Conference on Information,
Communication & Cybersecurity (ICI2C 21). https://doi.org/10.1007/978-3-030-91738-8_20
20. ElAidi, S., Bajit, A., Barodi, A., Chaoui, H., Tamtaoui, A.: An optimized security vehicular Internet of Things-IoT-application layer protocols MQTT and COAP based on cryptographic elliptic-curve. In: 2020 IEEE 2nd International Conference on Electronics, Control,
Optimization and Computer Science, ICECOCS 2020, pp. 9314579 (2020)
21. El Aidi, S., Bajit, A., Barodi, A., Chaoui, H., Tamtaoui, A.: An advanced encryption cryptographically-based securing applicative protocols MQTT and CoAP to optimize
medical-IOT supervising platforms. Lect. Notes Data Eng. Commun. Technol. 72, 111–121
(2021)
Applying Lightweight Elliptic Curve
Cryptography ECC and Advanced IoT Network
Topologies to Optimize COVID-19 Sanitary
Passport Platforms Based on Constrained
Application Protocol
Fatima Zahra Hamza1(B) , Sanaa El Aidi1 , Abdelhadi El Allali1 , Siham Beloualid1 ,
Abderrahim Bajit1 , and Ahmed Tamtaoui2
1 Laboratory of Advanced Systems Engineering (ISA), National School of Applied Sciences,
Ibn Tofail University, Kenitra, Morocco
{fatimazahra.hamza,sanaa.elaidi,siham.beloualid,
abderrahim.bajit}@uit.ac.ma, aelallali@gmail.com
2 National Institute of Posts and Telecommunications (INPT-Rabat), SC Department, Mohamed
V University, Rabat, Morocco
tamtaoui@inpt.ac.ma
Abstract. Being in a period of covid-19 urges us to develop platforms that help
in minimizing the spread of the virus. Thus, this paper proposes a Medical IoT
platform that is created to control citizens’ access to public areas. Our platform
focuses on three scenarios on which a citizen is admitted to: being vaccinated
which means that the person holds a vaccine pass that contains a unique QR
code, possessing a PCR test which means that the person holds a unique barcode,
and having an RFID tag which contains a unique identifier. All scenarios start
with the same test which allows us to detect the presence of a citizen using a
PIR IoT Client node, and end with one last test which is the face recognition
to verify the present citizen is indeed who he/she claims to be. Only if one of
the scenarios is valid can the citizen be allowed to access the public space. To
ensure communication between the IoT nodes we developed our platform based
on the Constrained Application Protocol CoAP. As for the security of the payloads,
we have implemented RSA, AES, and ECC encryption algorithms to protect the
integrity of the data and prevent any attacks. We also based our platform on
4 types of network topologies namely star, tree, mesh, and cluster. The use of
different topologies and different encryption methods will allow us to eventually
choose which one best matches the platform’s requirements, and that is in terms
of execution time and memory occupation.
Keywords: CoAP Protocol · Star · Tree · Cluster · Mesh · AES · RSA · ECC ·
Vaccine pass · PCR · QR · Barcode · RFID · IoT · COVID-19
© The Author(s), under exclusive license to Springer Nature Switzerland AG 2022
F. Saeed et al. (Eds.): IRICT 2021, LNDECT 127, pp. 512–523, 2022.
https://doi.org/10.1007/978-3-030-98741-1_42
Applying Lightweight Elliptic Curve Cryptography ECC
513
1 Introduction
The Internet of things is the most emerging technology that is growing exponentially,
providing new opportunities in the technology arena. It can be defined as devices or
‘things’ interconnecting to achieve a network through which data is created, transmitted,
received, and can yield analytical insight [1].
IoT has enabled the healthcare system to improve its supervision quality with realtime information in addition to strengthening the healthcare services provided to the
patient, this makes IoT receive huge attention in the healthcare domain, where IoT’s use
is necessary and plays an important role to predict, prevent and control emerging infectious diseases such as COVD-19 [2, 4]. The worldwide is now aware of this innovative
technology and its significant applications since it provides practical and cost-effective
solutions to face the problems that came with this pandemic [2, 3].
Most of the countries in the world have imposed travel restrictions, containment
measures, and social distancing, so it is obligatory to respect the sanitary rules to reopen
the public spaces. In this scope, this paper proposes an IoT platform that supervises and
controls the citizens’ access to public areas, by either granting them access or denying
them access. The decision is made through the results of several tests that are divided
into three scenarios, and thanks to the use of four types of IoT devices which are: PIR
node, RFID tag, temperature sensor, and a camera node.
To elaborate, the first scenario of our platform concerns the people who are vaccinated
so they hold a vaccine pass with a unique QR code, the second scenario is for the citizens
who hold a PCR test which also contains a unique barcode, and the last scenario is for
the citizens who are not vaccinated and don’t have a PCR test but they possess a unique
RFID tag. So, to grant access to a person, he/she must have a vaccine pass, a PCR test, or
an RFID tag, in addition to passing some tests such as face recognition, else their access
is unauthorized. These scenarios are discussed and elaborated more in the next section.
In this platform, we have used face recognition as a final test in each scenario. Face
recognition is an important element in our platform since it provides another layer of
access security and allows us to identify the detected citizen through analyzing the facial
structure and comparing it to the information in the database [5].
The platform relies on the Constrained Application protocol CoAP as a communication protocol that connects the nodes and is developed based on different types
of topologies namely star, tree, mesh, and cluster. AES, RSA, and ECC cryptography
algorithms were also used to encrypt the payloads shared through the network by the
IoT nodes. This will eventually allow us to deduct results about each network topology
and encryption method to finally adopt which ones will suit best the requirements of
the platform, in terms of efficiency, time consumption, memory occupation, and power
consumption. Figure 1. Shows the Medical IoT Architecture.
2 Related Works
Various researchers have addressed smart solutions for combatting covid-19 pandemic.
Researchers in [21] have proposed a medical supervising platform that serves to detect a
citizen with PIR Node, measure the body temperature through a temperature sensor, and
then verify the identity through the combination of an RFID and facial recognition test
514
F. Z. Hamza et al.
Fig. 1. Medical IoT architecture
to allow the citizen to access the public area. However, nowadays vaccines have been
developed, a huge number of PCR tests is made on a daily basis, which will guide us to
the questionable issue of if those tests are sufficient to allow access to a public space.
As for cybersecurity, researchers in [13] say that to elevate the security level of RSA,
the necessary key size must be increased exponentially. And since IoT devices only have
access to limited resource, it is not convenient to use RSA as a cryptography algorithm
for these resource-constrained environments. And so, the researchers propose that ECC,
even with a small key size, can provide the same level of security as RSA.
In this paper, we develop an optimized IoT platform that controls citizens’ access to
public areas, in addition to evaluating the performance of each cryptosystem, communication protocol, and wireless network topology implemented, when combined with each
other.
3 Functional Medical IoT Scenarios
This paper proposes a Medical IoT platform that is developed to supervise and control
citizens’ access to public areas, and it focuses on three scenarios: being vaccinated,
possessing a PCR test, and having an RFID tag (Fig. 2). All scenarios start with the same
test which allows us to detect the presence of a citizen using a PIR IoT Client node, then
it moves to the other tests of each scenario. For the first scenario, the vaccination of the
person is checked thanks to his/her vaccine pass, from which we scan the QR code that
contains a unique identifier to see its validity. If the citizen does not have a vaccine pass,
we move to the second scenario and scan the barcode in the presented PCR test which
also contains a unique identifier as well as an indication of its date, since we need it to
verify that the PCR test did not exceed 48 h. The third scenario is where the citizen does
not possess a vaccine pass nor a PCR test, so we check his body temperature as well as
his RFID’s unique identifier to see if they’re valid. All of these three scenarios end with
one last test which is the face recognition to verify that the present citizen is indeed who
he/she claims to be. Only if one of the scenarios is valid can the citizen be allowed to
access the public space.
4 The Proposed Approach
The development of this IoT intelligent medical platform is to control citizens’ access
to public space. As we mentioned before, we have implemented three scenarios in the
Applying Lightweight Elliptic Curve Cryptography ECC
515
platform: the first one for those who are vaccinated, the second one for those who have
a PCR test, and the last one for those with an RFID tag. As explained before, if all of
the scenarios do not apply to the person, or if one of the tests is not correct, the access
will not be granted to the person.
This work consists of implementing different approaches in the platform’s functioning, by encrypting the communication protocol’s payloads with various encryption algorithms which are RSA, AES, and ECC, in addition to developing the platform according
to different network topologies. In the end, this will allow us to carry out comparative
results of each approach, and adopt the one that is most suitable and effective for our
platform.
The application layer protocol plays a significant part in the IoT framework as it
enables the communication between things, devices, or objects with the application
interfaces [6]. The constrained Application Protocol CoAP is a simple and lightweight
protocol that is used in networks with limited resource. It is a specialized web transfer
protocol for constrained devices and constrained networks [7], even though its characteristics and operations are similar to those of a Hypertext Transfer Protocol (HTTP).
Also, CoAP supports the usage of DTLS which adds more security guarantees [8].
Cryptography is the process of secret writing, which allows converting plain text into
a non-readable format. It consists of two types: symmetric-key/private-key cryptography
and asymmetric-key/public-key cryptography [12]. In asymmetric key cryptography, a
key pair is generated; a public and a private key, which is why it is also called Public
Key cryptography. The public key is used for encryption, while only the corresponding
private key is used for decryption [9]. RSA is a well-known public-key cryptography
algorithm that is the most widely used. It is incredibly onerous to crack since the algorithm is based on the fact that it is of great difficulty to factorize large integers into prime
factors. However, the RSA algorithm has been considered too resource-consuming for
constrained devices, where storage, memory, and speed are limited [10, 11]. Another
known Public Key cryptography algorithm is the Elliptic Curve Cryptography (ECC),
which’s security is based on the elliptic curve discrete logarithm problem [12]. Being
able to provide the same level of security as RSA with reduced key size makes ECC the
best alternative choice. In other words, the use of smaller key sizes by the Elliptic Curve
means it has a compact key size which is the main advantage of ECC [13, 14].
Concerning the other cryptography type, symmetric-key cryptography uses only one
key to encrypt and decrypt, hence, the name of private-key cryptography. So, the sender
encrypts the plain text with the private key and the receiver applies the same key to
decrypt the message. Two types of cipher are used in Symmetric Key Cryptography,
and they are stream cipher and block cipher. Advanced Encryption Standard (AES) is
one of the most common symmetric block cipher algorithms. It encrypts the information
by breaking it down into fixed-sized blocks and encrypting data in each block with a
powerful and complex structure [15].
When it comes to network topologies, it is mandatory to understand the method
within which the nodes communicate with each other, and how they are arranged. A star
network consists of one central hub to which all other nodes in the network are linked.
This means that each end node has only one path to transmit the data, which is through
the central node, and that’s what allows it to act as a coordinator for the network [16,
516
F. Z. Hamza et al.
Fig. 2. Functional algorithm
Applying Lightweight Elliptic Curve Cryptography ECC
517
17]. The elements of the star, as well as bus topology, are incorporated in a tree topology.
A tree topology is structured just like a tree: all nodes are connected in a way that looks
like branches of a tree, so we have parent nodes and child nodes. This makes it flexible
since we can add one or more nodes without affecting other nodes [18]. As for mesh
topology, it is characterized by its higher fault tolerance and robustness to the fall of one
or more nodes, and this is because each node is allowed to communicate with several
other nodes, thanks to the paths created within the network, unlike star. This allows the
message to multi-hop until it reaches the assigned gateway [19, 20]. The advantages of
this topology, as well as star topology, are combined in another topology called cluster,
where the nodes of a star are clustered around routers that communicate with each other
and the gateway in a mesh [19, 20], or where the nodes of a cluster are connected in a
way that forms another type of topology. This makes cluster very useful when wanting
to apply different topologies in different parts of the network.
5 Discussion and Results
This paper aims to minimize the spread of covid-19 by developing an IoT platform
that controls citizens’ access to public areas. We have applied the AES, RSA, and ECC
encryption methods on our platform, as well as developed it according to different
topologies in order to analyze the impact of each one on the platform, in addition to
implementing the right communication protocol, keeping in mind that it is a high constraint resource environment, thus it is important to preserve the power of the IoT nodes,
and to shrink their memory occupation and execution time. This is why we have made a
comparative study between the topologies, the encryption methods, and communication
protocols to finally see what matches best our platform.
CoAP protocol has a small fixed-length binary header compared to MQTT which’s
packet is loaded, and, MQTT has slower transmission cycles which make CoAP more
practical for use in constrained resource environments, which was also concluded in the
results published in the ICI2C conference (Fig. 3). We can see that MQTT consumes
more time and occupies more memory, resulting in using more energy to work properly.
As for security, CoAP is built over UDP and not on TCP like MQTT.
Securing the payloads with different encryption methods enables us to compare
them in terms of efficiency, robustness, and resource consumption to eventually adopt
the right encryption algorithm for our platform. Figure 4 shows the time consumption
and memory occupation of each encryption method applied to a CoAP’s payload. Using
two large keys to encrypt and decrypt makes the RSA algorithm hard to crack and
allows it to offer great security of the data. However, it makes it very expensive when it
comes to resource constrained environments, and having limited resource consumption
of IoT devices eliminates the use of RSA in our platform. As for AES, it is a symmetric
algorithm that consumes much less resource than RSA, thanks to its use of only one
shared key, does not require a lot of energy, and is fast in processing. This is clearer in
Table 1 which shows the big consumption difference between RSA and AES (as well as
ECC), in terms of average memory occupation and average time consumption, wherein
each scenario, and in each topology applied, RSA always has higher memory and time
consumption than AES (and ECC). What we need now is a cryptography algorithm that
518
F. Z. Hamza et al.
matches the security level of RSA, but has low resource consumption to -if not the same
as- AES. This is what we notice when implementing the ECC algorithm to our platform.
Using a key pair to encrypt and decrypt allows it to offer better security than AES, a very
high-security level as RSA, but less resource consumption than AES if not the same.
Table 2 shows the percentage of time and memory we gain by implementing it in our
platform with the different topologies and scenarios, and from which we can say that
ECC adopts the advantages of RSA by using a key pair which makes it strong against
attacks, and the advantages of AES by having light resource requirements, in addition
to having its own benefits such as allowing faster keys generation thanks to the reduced
key size [13, 14], which also leads to less processing power and faster response time, as
seen in the results.
We must take into consideration some attributes to choose a wireless network, for
example, latency, fault resiliency, scalability. From the results of Fig. 5, we can notice
that star has the lower memory and time consumption, followed by cluster, tree, and
then mesh being last since it has the higher numbers. This makes the performance of star
predictable and fast, also the data travels only through one hop to reach its destination.
Star is also reliable thanks to the ease of detecting faults in devices since each one
uses its own link. However, more energy must be spent to deliver messages when the
communication link between the coordinator and the end node is long. Adding to that,
star’s range is limited to the transmission range of a single device, and, if the coordinator
failed, all the nodes attached are interrupted. A tree topology incorporates the elements
of both bus topology and star topology. Between any two connected nodes, there is an
existence of only one connection. This topology is known for its flexibility and easy
expansion without any issue since it follows a hierarchy pattern. Also, the removal of an
end node will not affect the performance of the network. Nonetheless, the uses of tree
topology are limited due to its difficult installation process and cost, also its maintenance
and configuration because of its large size. If the backbone connection, on which the
entire network depends, fails, the point where the failure occurs will decide the level
of loss. In other words, the nodes related to the branch damaged will face problems
functioning, while others that are not associated with it will continue to work. Mesh
topology is a growing network topology commonly found in IoT deployments, since
it can withstand high traffic, there is always an alternative path if a node failed so the
transfer of the data will not be affected. However, there is a high latency in mesh networks
due to multiple hops to transmit data from an end node to the gateway, and that is clear in
the results (Fig. 5) since mesh has the higher consumption amongst the other topologies.
Cluster tree network combines the advantages of star and mesh networks: the low latency
and low power consumption of star, plus extended range and fault tolerance of mesh. We
can see that it comes right after star for the low resource consumption. This topology
is perfect for a platform where we want to apply different topologies in different parts
of the network in the form of clusters. In addition, that even when applying ECC with
cluster, the resource consumption is still low. So, to sum up our discussion, we will opt
for CoAP as a communication protocol, ECC as a cryptography method, and cluster as
a wireless sensor network.
Applying Lightweight Elliptic Curve Cryptography ECC
519
Fig. 3. Time consumption and memory occupation of CoAP/MQTT classic payload combined
with AES/SHA256.
520
F. Z. Hamza et al.
Fig. 4. Time consumption and memory occupation of a CoAP camera payload and Classic
Payload secured with RSA, AES, and ECC.
Fig. 5. The three scenarios’ average time consumption and memory occupation.
Applying Lightweight Elliptic Curve Cryptography ECC
521
Table 1. Average time consumption (s) and memory occupation (Mb) of the three scenarios.
Star
Scenario 1
Time (s)
Scenario 2
Time (s)
Scenario 3
Time (s)
Scenario 1
RAM (Mb)
Scenario 2
RAM (Mb)
Scenario 3
RAM (Mb)
Tree
Mesh
Cluster
RSA
10.13
17.46
20.12
12.47
AES
6.71
7.72
9.56
7.70
ECC
6.69
6.96
8.19
7.78
RSA
13.38
17.46
21.38
14.91
AES
6.42
7.92
9.76
7.71
ECC
6.48
6.60
7.95
6.91
RSA
11.93
15.72
18.95
11.89
AES
7.07
7.52
8.51
7.61
ECC
6.54
7.05
7.22
6.80
RSA
244.6
249.4
268.0
251.0
AES
222.3
225.6
237.4
230.2
ECC
219.2
224.7
235.8
226.9
RSA
189.3
179.5
207.5
199.5
AES
162.9
167.3
175.1
171.1
ECC
160.0
168.2
179.2
171.1
RSA
200.7
204.8
219.0
208.7
AES
173.9
179.4
190.0
181.9
ECC
172.8
177.8
189.2
185.1
Table 2. Scenarios’ gain percentage of ECC compared to RSA and AES in terms of time
consumption and memory occupation.
Star
Tree
Mesh
Cluster
33.9%
60.1%
59.2%
37.6%
Scenario 1
(time)
ECC%RSA
ECC%AES
0.3%
9.8%
14.3%
–1.0%
Scenario 2
(time)
ECC%RSA
51.5%
62.1%
62.8%
53.6%
ECC%AES
–0.9%
16.6%
18.5%
10.3%
Scenario 3
(time)
ECC%RSA
45.1%
55.1%
61.8%
42.8%
ECC%AES
7.5%
6.2%
15.1%
10.6%
Scenario 1
(ram)
ECC%RSA
10.3%
9.9%
12.0%
9.6%
ECC%AES
1.4%
0.4%
0.6%
1.4%
Scenario 2
(ram)
ECC%RSA
15.4%
6.2%
13.6%
14.2%
ECC%AES
1.7%
–0.5%
–2.3%
0.0%
Scenario 3
(ram)
ECC%RSA
13.9%
13.1%
13.6%
11.3%
ECC%AES
0.6%
0.9%
0.4%
–1.7%
522
F. Z. Hamza et al.
6 Conclusion and Perspectives
This work enabled us to create a sanitary passport platform that serves to control the
access of vaccinated as well as non-vaccinated citizens to minimize the spread of the
Covid-19 virus. The platform was built and based on different approaches from which
we were able to carry out and deduct comparative results, that helped us, in the end, to
extract the approach that fits best the requirements of the platform, when it comes to the
communication protocol, cryptography algorithm, and network topology.
Eventually, and after studying the results, CoAP was chosen combined with ECC
cryptography algorithm to ensure light and secure communication, in addition to
adopting Cluster topology to ensure the reliability and efficiency of the platform.
For future works, we will propose a blockchain architecture that will give data more
security, we will also implement other communication protocols such as Zigbee and
6LowPan, and deploy other security methods like ECIES.
References
1. Nord, J.H., Koohang, A., Paliszkiewicz, J.: The Internet of Things: review and theoretical
framework. Expert Syst. Appl. 133, 97–108 (2019)
2. Singh, R.P., Javaid, M., Haleem, A., Suman, R.: Internet of things (IoT) applications to fight
against COVID-19 pandemic. Diab. Metab. Syndr. Clin. Res. Rev. 14(4), 521–524 (2020)
3. Rahman, M.S., Peeri, N.C., Shrestha, N., Zaki, R., Haque, U., Hamid, S.H.A.: Defending
against the Novel Coronavirus (COVID-19) outbreak: How can the Internet of Things (IoT)
help to save the world? Health Policy Technol. 9(2), 136–138 (2020). https://doi.org/10.1016/
j.hlpt.2020.04.005
4. Nasajpour, M., Pouriyeh, S., Parizi, R.M., Dorodchi, M., Valero, M., Arabnia, H.R.: Internet
of Things for current COVID-19 and future pandemics: an exploratory study. J. Healthcare
Inf. Res. 4(4), 325–364 (2020). https://doi.org/10.1007/s41666-020-00080-6
5. Masud, M.: Deep learning-based intelligent face recognition in IoT-cloud environment.
Comput. Commun. 152, 215–222 (2020)
6. Gupta, P., Indhra Om Prabha M.: A survey of application layer protocols for Internet of
Things. In: 2021 International Conference on Communication information and Computing
Technology (ICCICT), pp. 1–6 (2021). https://doi.org/10.1109/ICCICT50803.2021.9510140
7. Suwannapong, C., Khunboa, C.: Congestion control in CoAP observe group communication.
Sensors 19, 3433 (2019). https://doi.org/10.3390/s19153433
8. Nebbione, G., Calzarossa, M.C.: Security of IoT application layer protocols: challenges and
findings. Future Internet 12, 55 (2020). https://doi.org/10.3390/fi12030055
9. Dhakar, R.S., Gupta, A.K., Sharma, P.: Modified RSA Encryption Algorithm (MREA).
In: 2012 Second International Conference on Advanced Computing & Communication
Technologies, pp. 426–4292012https://doi.org/10.1109/ACCT.2012.74
10. Lihua, G., Kaide, Q., Chengzhi, D., Nanrun, Z.: An optical image compression and encryption
scheme based on compressive sensing and RSA algorithm. Opt. Lasers Eng. 121, 169–180
(2019)
11. Kothmayr, T., Schmitt, C., Hu, W., Brünig, M., Carle, G.: DTLS based security and two-way
authentication for the Internet of Things. Ad Hoc Netw. 11(8), 2710–2723 (2013)
12. Mahto, D., Yadav, D.K.: RSA and ECC: a comparative analysis. Int. J. Appl. Eng. Res. 12(19),
9053–9061 (2017)
Applying Lightweight Elliptic Curve Cryptography ECC
523
13. Shaikh, J.R., Nenova, M., Iliev, G., Valkova-Jarvis, Z.: Analysis of standard elliptic curves
for the implementation of elliptic curve cryptography in resource-constrained E-commerce
applications. In: 2017 IEEE International Conference on Microwaves, Antennas, Communications and Electronic Systems (COMCAS), pp. 1–4 (2017). https://doi.org/10.1109/COM
CAS.2017.8244805
14. Albalas, F., Alsoud, M., Almomani, A., Almomani, O.: Security-aware CoAP application
layer protocol for the Internet of Things using elliptic-curve cryptography. Int. Arab J. Inf.
Technol. 5(3A), Special Issue (2018)
15. Abdullah, A.: Advanced encryption standard (AES) algorithm to encrypt and decrypt data.
In: Cryptography and Network Security (2017)
16. Network topology guide for the internet of things. https://www.rcrwireless.com/20161017/
big-data-analytics/network-topology-guide-tag31-tag99. Accessed 04 Oct 2021
17. Topologies driving IoT networking standards. http://radar.oreilly.com/2014/04/3-topologiesdriving-iot-networking-standards.html. Accessed 04 Oct 2021
18. Tree Topology Advantages and Disadvantages. https://www.aplustopper.com/tree-topologyadvantages-and-disadvantages/. Accessed 04 Oct 2021
19. Wireless Topologies. https://www.emerson.com/documents/automation/training-wirelesstopologies-en-41144.pdf. Accessed 04 Oct 2021
20. Bilbao, J., Bravo, E., Varela, C., et al.: Developing the IoT through wireless communication
networks: analysis of topologies. Int. J. Biosen. Bioelectron. 3(4), 327–331 (2017)
21. El Aidi, S., Bajit, A., Barodi, A., Chaoui, H., Tamtaoui, A.: An advanced encryption cryptographically-based securing applicative protocols MQTT and CoAP to optimize
medical-IOT supervising platforms. In: Saeed, F., Mohammed, F., Al-Nahari, A. (eds.) IRICT
2020. LNDECT, vol. 72, pp. 111–121. Springer, Cham (2021). https://doi.org/10.1007/9783-030-70713-2_12
Challenges on Digital Cyber-Security
and Network Forensics: A Survey
Omar Ismael Al-Sanjary1(B) , Ahmed Abdullah Ahmed2 , M. N. Mohammed3 ,
and Kevin Loo Teow Aik1
1 Faculty of Information Sciences and Engineering, Management and Science University, 40100
Shah Alam, Malaysia
omar_ismael@msu.edu.my
2 Faculty of Engineering and Computer Science, Qaiwan International University (QIU),
Slemani Heights, Sulaymaniyah, Iraq
3 Mechanical Engineering Department, College of Engineering, Gulf University, Sanad,
Kingdom of Bahrain
Abstract. There are minimal studies have attempted to shed light on the reality
of the challenges and as such, the present paper brings forth studies identifying,
quantifying, and prioritizing the challenges to motivate future authors to focus
on the issues affecting the domain. Accordingly, a survey was conducted among
researchers and practitioners (at the level of law enforcement and organizations)
in order to investigate actual challenges and differentiate them from perceived
challenges for the purpose of providing insight into the effects upon digital forensic
domain in the near future. The study provided and collated a compact survey of
the top significant challenges highlighted in the design/development of modern
digital forensics tools. The study contributes to the identification of the important,
mid- and long-term opportunities and issues that need to be taken into account by
the security experts and network forensics in the field investigations fields.
Keywords: Cybersecurity · Cyberattack · DDOS · Network threats · Cybercrime
1 Introduction
Internet has a key role in the network information technology realm, with security of
information being the top challenge presently considering the amount of activities done
using digital information [1]. In relation to this, cybersecurity combines processes and
the protection of secrecy, integrity, practices, technologies design and computer network availability from attacks, damages or access from unauthorized individuals [2, 3].
According to Cybersecurity Ventures, global cybercrime costs is looking at 15% growth
every year for the next five years, which will reach to U.S.$10.5 trillion by 2025, a $4
trillion increase from 2020 [4]. Aligned with this is the increased cyberattacks – which
on the basis of the Symantec survey involving 20,000 individuals throughout 24 nations,
69% had experienced cyber-attacks in their lifetimes. The survey also found that every
second, 14 adults experience cyber-attacks, equating to over one million attacks daily
© The Author(s), under exclusive license to Springer Nature Switzerland AG 2022
F. Saeed et al. (Eds.): IRICT 2021, LNDECT 127, pp. 524–537, 2022.
https://doi.org/10.1007/978-3-030-98741-1_43
Challenges on Digital Cyber-Security and Network Forensics
525
[5]. The costs incurred for tackling cybercrime covers data damage and destruction,
stolen money, lows productivity, intellectual property theft, personal and financial data
theft, embezzlement, fraud, fraud, post-attack disruption to the normal business activities, forensic investigation, hacked data/system restoration and deletion, and harm to the
reputation. (See Fig. 1.) depicts the costs predicted throughout the period.
On the other hand, cyber criminals need only to incur a few costs relating to obtaining
a computer and Internet connection, and are unhindered by geography and distance, difficult to identify and prosecute because of the Internet’s anonymous nature. Considering
the easy and feasibility that involves in attacking information technology systems, it is
predicted that cyber-attacks will continue to grow in number and sophistication. Therefore, this paper conducts an assessment of the cyber security field through a thorough
review of literature dedicated to current and less traditional aspects in the field. The
study primarily aims to determine significant focus areas in the current academic cyber
security research. Given the level of human ability, this part of the study is not intended
to develop a detailed information and ontology of cyber security, however inferences are
drawn from the findings to determine and highlight current trends, and for the reviewed
papers are grouped into general fields [6].
Fig. 1. Global cybersecurity attack cost
The paper furnishes speculative observations as to the directions that future authors
can follow, which include; privacy concerns to protect increasing personal information
volumes that are entered into the Internet, requirement to have a current secure Internet
from scratch while considering the subjected growth and patterns of use, which differs
from the scenario of today’s internet, and a trustworthy system with a distinct fundamental architecture from its inception in order to address the constantly changing malware.
Along with the above are the need to identify and keep track of the attacks source through
the development of global scale identity management system and trace-back methods,
and also a clear stress on usable security to provide security controls to individuals for
their comprehension and control [7, 83]. The survey’s objective is to establish and prioritize the major future challenges that digital forensics face with a clear perspective of
the various forensic practitioners and forensic researchers’ points of view. It is assumed
that various researchers’ motivations, which focus on longer-term may be distinct from
practitioners, who focus on near-term as this may affect the major challenge.
2 Digital Cyber-Security and Network Forensics Methods
In this background, digital forensics also referred to as computer forensics is about using
scientific methods to preserve, gather, validate, identify, analyze, interpret, document and
526
O. I. Al-Sanjary et al.
present digital evidence obtained from digital sources in order to bring about the development of criminal events. Throughout its history, since its inception, computers have
become the target of viruses/worms attacks, and this has urged businesses to consider
this security risk. Nevertheless, the present methods used for deploying attacks and penetrating networks are quite covert in a sense that they remain undetected until the attack
happens [5, 8].
In addition, literature contains studies that touch upon areas of broad fields that have
not been explicitly outlined – for instance, some authors craft ontologies concerning
cyber security using manual and automated methods [10–12], Efforts along this line often
use fewer inputs, initiating with fundamental phrase of cyber security and conducting
automated searches for papers containing the same, and hence, such studies may fall
short of covering the complete cyber security scope [9, 84].
It is surprisingly clear that the information security terminology is often aligned with
that of national security discourses – in that both are concerned with threats, vulnerabilities, agents, and the like but each of the terms have distinct meanings that should be
used with caution. In relation to this, threats can be categorized into various failures,
accidents and attacks, with failures being potentially damaging occurrences stemming
from the system deficiencies/external element that the system is dependent on. Failures
may also originate from the errors in software design, degrading hardware, human errors
or corrupted data. On the other hand, accidents cover a range of occurring and damaging
events that happen randomly including natural disasters, and most of them are generated
external of the system, rather than internal to it, as in failures. Both passive and active
attacks could damage the system as is the objective behind a human rival. Attacks form
the primary focus of the cyber-security discourse [13, 14] and they are categorized as
follows:
i. Passive attack – this type of attack takes the form of listening to system passwords,
releasing message content, analysing traffic and capturing data.
ii. Active attack – in active attack, various activities are adopted including attempts to
log into accounts, wire taps, service denial, masquerading, and modifying messages.
Notably, it may be useful for future research to identify with the above for further
opportunities, however it is not suggested that any terms in this level be employed as
paper keywords. On the whole, the optimal range contains candidate standard terms,
while the minimum range contains candidate terms. In the latter range, searching using
terms are not covered in the former range and as such, this should be carried out through
the combination of many terms in order to obtain accurate results. In the present study, the
rejection and suggestion of standard terms involved the consideration of optimal range
of cybersecurity terms and cyberattack terms total hits, and this is used when assessing
the meeting of required term guidelines (refer to Table 1). The use of suboptimal terms
and phrases may be an invaluable research progression aspect in order to make sure that
the publications are acceptable.
In the present work, digital cybersecurity and cyberattacks are referred to as using scientifically obtained and proven methods and techniques to identify, preserve, reconstruct,
and present digital evidence of the attack/incident obtained from the digital devices. This
Challenges on Digital Cyber-Security and Network Forensics
527
definition covers digital evidence recovered from the computer as well as digital evidence recovered from the device that are not computers, and from digital activity that
falls under an attack or incident [87].
3 Digital Cyber-Security Model
In a security model, significant security aspects and their connections to system behavior are described, with the primary objective of providing the required understanding
level of implementation success of major security requirements [73, 82]. In this regard,
the security policy has a key role in the determination of the security model contents
and as such, good security model development calls for a clear, well-rounded security
policy. As for a formal model, development should place reliance on suitable mathematical equations of description and form analysis. Evaluation and usage success should
be followed by the model’s explanation of security-relevant aspects of the functionality
of the system and later on, in the maintenance stage, it should lay down the guidance
of undergoing security-relevant changes when needed. Moreover, individual security
control and security vulnerability requires one or more key concepts. The fundamental
Cyber-Security Model components are; Information Security Properties and Information
States and Security Measures [74, 75] (refer to Fig. 2). Every organization and management should consider information security properties as a top priority in a business
plan. Such properties entail the protection of organizational data and optimal information systems. Information security assists in the prevention of breaches in confidential
assets, data losses, erroneous deletion of data, and inaccurate production of data [73, 76].
The Central Intelligence Agency (CIA) represents the four basic supports of information
security as confidentiality, integrity, availability and non-repudiation. In sum, confidentiality involves limitation of data access, integrity ensures accurate data, and availability
ensures access to data of those who are authorized and in need This triad is used as the
basis for robust information security policies development.
Table 1. Keywords extracted from related methods and additional cybersecurity terms and
cyberattack terms
Cybersecurity
Cybersecurity
Cyberattacks
Cyberattacks
CISO [15]
Honey pots [45]
Hacker attack [33]
Zeus Gameover attack
[72]
Cloud computing [16]
wireless security
[42]
Cracker attack [33]
Carberp attack [85]
Computer abuse [17]
Blockchain
technology [46]
Spamming attack [33] Torpig attack [15]
Critical infrastructure
[18]
Digital
Watermarking [47]
Ransomware attack
[33]
Secure Sockets Layer
SSL [28]
(continued)
528
O. I. Al-Sanjary et al.
Table 1. (continued)
Cybersecurity
Cybersecurity
Cyberattacks
Cyberattacks
Cryptanalysis [19]
IoT security [48]
Spoofing attack [33]
Router attack [33]
Cryptography [19]
Social protection
application [38]
Active attack [14]
Cryptowall attack [71]
Cryptology [19]
Digital Forensics
[40]
Denial-of-service
(DoS) attack [63]
Emotet attack [19]
Crypto-assets [20]
Privacy settings [49] Distributed
Denial-of-service
(DDoS) attack [63]
Cryptojacking attack
[28]
Cryptocurrencies [17]
cyber-physical
security [22]
Virtual private
network [11]
Cybercrime [20]
Cybersquatting [50] IP attack [37]
Shellshock attack [22]
Cyberlaw [20]
CyberSlam [23]
Drive-by attack [18]
Browser attack [13]
Cyberoperation [21]
Computer
Intrusions [31]
Password attack [37]
Brute force attack [14]
Cyberphysical [22]
Cyber sextortion
[51]
SQL injection attack
[68]
Internal attack [15]
Cyberthreat [23]
Cyber Criminology
[52]
Cross-site scripting
(XSS) [68]
External attack [16]
Cyberwar [24]
Cyber Deterrence
[53]
Eavesdropping attack
[37]
Man-in-the-middle
attack [17]
Antivirus programs [25] Cybernetics [54]
Malware attack [64]
Social engineering
attacks [10]
Antispyware software
[25]
Cyber Extortion
[55]
Trojan Horses [37]
Adversarial attacks
[11]
Monitored internet
access [26]
Cyber Vandalism
[79]
Birthday attack [27]
Panic attacks [12]
Cloud security [27]
Cyberterrorism [56] Botnets attack [31]
Server attack [14]
Cryptojacking [28]
Cybertherapy [57]
Access control attack
[26]
DNS attack [33]
Cyberbullying [29]
Cyberharassment
[58]
Asset attack [17]
Address Resolution
Protocol (ARP)
attacks [37]
Cyberspace [29]
Cybergeddon [56]
Data Structure attack
[17]
Smurf attack [37]
Digital Signature [30]
Hacktivism [56]
Unstructured attack
[66]
Hijacking [33]
Demilitarized Zone
(DMZ) [31]
Cyber physical
systems [18]
Passive attack [14]
BlackHole attack [46]
Phishing attack [64]
(continued)
Challenges on Digital Cyber-Security and Network Forensics
529
Table 1. (continued)
Cybersecurity
Cybersecurity
Cyberattacks
Cyberattacks
Steganography [32]
Cybercriminal [20]
Risk Management
[39]
Wormhole attacks [67]
Firewall [31]
Rogue security
software [37]
URL attack [37]
Sybil attack [69]
Internet service
provider (ISP) [31]
Cryptovirology [59] Water Hole Attack
[33]
Sinkhole attack [70]
Intrusion detection
system (IDS) [31]
Cloud computing
security [16]
Zero-Day Exploits
[67]
jamming attack [71]
Intrusion prevention
system (IPS) [31]
Mobile cloud
security [38]
Viruses/Worms attack Wrapping Attack [17]
[37]
Incident Response (IR)
[33]
Automotive security Vulnerability [42]
[91]
Online Auction Fraud
[37]
Security information
and event management
(SIEM) [34]
Cyber information
warfare [25]
Spyware [37]
Non-Delivery
Merchandise fraud
[37]
Cyberconflict [35]
CyberStrike [60]
Backdoor attack [19]
Fake Escrow Services
[9]
Cyberdomain [36]
CyberGames [61]
Email attacks [19]
Slowloris attacks [72]
Countermeasures [37]
Cyberethics [62]
Teardrop attacks [12]
Session Downgrade
Attacks [21]
Cyber Stalking [37]
Cyber forensics [40] SYN Flood attack
[13]
Data scraping attack
[22]
Network Security [37]
Cybergeography
[19]
Buffer Overflow
attack [54]
Byzantine Attacks
[23]
Application Security
[38]
Cybergogy [59]
Credit/Debit Card
Fraud [28]
Fabrication Attacks
[24]
Mobile Security [38]
Cyberweapon [24]
Identity Theft [42]
Honeypot attack [45]
Security Assessments
[39]
Investment Fraud [17] User Emulation attack
[26]
Anti-forensics [40]
Freight Forwarding/
Reshipping scheme
[17]
Shellcode attack [28]
Computer Forensics
[40]
Ponzi and Pyramid
Schemes [66]
Fork bombs [23]
Darknet [41]
File Inclusion attacks
[15]
Fraudulent dialers
[24]
Hybrids Security [42]
Malicious attack [16]
Logic bombs [25]
CryptoLocker [43]
Adware attack [17]
Evil Maid attack [29]
Dedicated Internet
Access (DIA) [31]
Crimeware attack [24] Image tampering [65]
(continued)
530
O. I. Al-Sanjary et al.
Table 1. (continued)
Cybersecurity
Cybersecurity
Cyberattacks
Cyberattacks
CAPTCHA Security
[44]
Mobile Malware
attack [64]
Video tampering [65]
Threat Detection [42]
Rootkit attack [20]
Data tampering
attacks [65]
System Security [42]
Bot attack [21]
Code injection [28]
Prevention System [31]
SpyEye attack [12]
Fig. 2. Components of cyber-security model
4 Cybercrime Investigation Process
Extensive and expansive processes of cybercrime investigations are a must for the standardization of terminology, requirements definition and enabling new techniques development and investigation tools [65, 77]. Cybercrime scene investigation involves an
activity within which judicial entity observes and inspects the crime scene based on law
to comprehend the case circumstances and to gather required evidence. In addition, an
effective cybercrime investigation process is crucial in providing an abstract reference
framework, which is not dependent on specific technological/organizational context,
based on which techniques and technologies for supporting the investigators work can
be discussed. It can also function as a basis for common terminology for expertise sharing. The investigation process is useful in developing and applying methodologies to
new emerging technologies as they become the topic behind the investigations. In the
same way, a relevant model can be useful in identifying opportunities for development
and use of technology so that work of investigators are enabled and the requirements
Challenges on Digital Cyber-Security and Network Forensics
531
for investigative tools are captured and analyzed - this is particularly true for advanced
automated analytical tools. Presently, processes that are directed specifically to cybercrime investigations are still lacking, with the proposed models focusing only towards
a part of the investigative process (gathering, analyzing and presenting evidence), while
overlooking other important aspects.
Literature evidences several investigation processes, which are briefly described in
this section. The models are limited to the investigations of the crime scene and the
evidence is not as extensive in their encapsulation compared to the proposed models.
To begin with, [78, 79] brought forward a process consisting of four stages, namely
recognition, preservation, classification and reconstruction. This process mimics with
that presented by [104, 108] in the initial and final stage, and it focuses on a systematic
and methodical investigation technique of any digital crime case. However, the process
is limited to digital forensic process and does not cover data acquisition (preparation and
presentation). Added to the above, digital forensic research workshop (DFRWS) [65, 81]
developed and proposed a model with the steps involving, identification, preservation,
collection, examination, analysis, presentation and decision [78, 107]. The model can
be considered as a comprehensive one as it has a tendency to include stages that were
not included by prior models (e.g., presentation stage).
The previous section elaborated on the processes utilized and now the question
arises as to how to develop and update digital forensic investigation process. The present
process failed to focus on the entire cybercrime investigation aspects, but rather emphasized on the digital evidence processing [78, 80]. The design of the existing models
failed to indicate the information process flow and address issues like chain of custody or chain of identity. In fact, in most of the presented investigation processes, the
latest gap exists in tackling fragile evidence and data acquisition process [78]. Lack of
stages addressing such aspect could mean an unstable cybercrime investigation. The new
steps of cybercrime investigation proposed are displayed in the following Fig. 3. In the
figure, the cybercrime investigation process begins with the identification phase which
assumes the recognition and determination of the incident type – this step is crucial as
all the remaining steps hinges on it. This is followed by the preparation step, where
tools, techniques, search warrants, monitoring authorization and management support
are prepared. The approach strategy is then introduced in a step that maximizes the
evidence collection while at the same time mitigating the impact on the victim through
approaches/procedures formulation [85, 86]. The next phase involves preserving the
acquired data by isolating and securing them to maintain their authenticity. The entire
digital evidence is also duplicated and the physical scene recorded on the basis of standardized procedures under the collection step. The examination step involves in-depth
systematic analysis of evidence that links to the case and this is followed by the analysis phase which determines the probative value of the examined evidence. Presentation
phase summarizes the develop process, while returning evidence step culminates the
investigation process by returning physical and digital evidence to their owner.
532
O. I. Al-Sanjary et al.
Fig. 3. Steps of cybercrime investigation process
5 Conclusion
Throughout the past decade and a half, attack of digital cybersecurity and network forensics has been rampant. Because the Internet has become the chosen medium of communication for billions of web users through which they can share their interests, photos,
videos and engage with their friends without geographic and economic barriers. Using
such services however could leave users vulnerable to serious cyber security risks and
this paper provided a state-of-the-art study of various privacy/security issues in digital
cyber-security. The paper provided a summary of the recent attack statistics and security reports documented by security organizations and cyber security and cyber-attacks
blogs. The paper also addressed the security state of cyber-security by presenting three
malicious code attacks categories, namely vulnerabilities, threat and risk management.
Based on the presentation, a new analysis of cybercrime investigation process is proposed
to assist relevant research respond to developments in technology and investigations.
References
1. Jang-Jaccard, J., Nepal, S.: A survey of emerging threats in cybersecurity. J. Comput. Syst.
Sci. 80(5), 973–993 (2014)
2. Li, L., He, W., Xu, L., Ash, I., Anwar, M., Yuan, X.: Investigating the impact of cybersecurity
policy awareness on employees’ cybersecurity behavior. Int. J. Inf. Manage. 45, 13–24 (2019)
Challenges on Digital Cyber-Security and Network Forensics
533
3. Kshetri, N.: Blockchain’s roles in strengthening cybersecurity and protecting privacy.
Telecommun. Policy 41(10), 1027–1038 (2017)
4. Internet Security Threats Report. Cybercrime Magazine. https://cybersecurityventures.com/
cybercrime-damage-costs-10-trillion-by-2025/. Accessed 13 Nov 2020
5. https://pcmag.com/article2/0.2817.2392570.00.asp. Accessed June 2013
6. Ishak, Z., Rajendran, N., Al-Sanjary, O.I., Razali, N.A.M.: Secure biometric lock system
for files and applications: a review. In: 2020 16th IEEE International Colloquium on Signal
Processing & Its Applications (CSPA), pp. 23–28. IEEE , February 2020
7. Mohammed, T.L., Ahmed, A.A., Al-Sanjary, O.I.: KRDOH: kurdish offline handwritten text
database. In: 2019 IEEE 7th Conference on Systems, Process and Control (ICSPC), pp. 86–89.
IEEE (2019)
8. Al-Sanjary, O.I., Ibrahim, O.A., Sathasivem, K.: A new approach to optimum steganographic
algorithm for secure image. In: 2020 IEEE International Conference on Automatic Control
and Intelligent Systems (I2CACIS), pp. 97–102. IEEE, June 2020
9. Al-Sanjary, O.I., Ahmed, A.A., Zangana, H.M., Ali, M., Aldulaimi, S., Alkawaz, M.: An
investigation of the characteristics and performance of hybrid routing protocol in (MANET).
Int. J. Eng. Technol. 7(4.22), 49–54 (2018)
10. Iannacone, M., et al.: Developing an ontology for cyber security knowledge graphs. In: Proceedings of the 10th Annual Cyber and Information Security Research Conference, pp. 1–4,
April 2015
11. Takahashi, T., Kadobayashi, Y.: Reference ontology for cybersecurity operational information. Comput. J. 58(10), 2297–2312 (2015)
12. Khairkar, A.D., Kshirsagar, D.D., Kumar, S.: Ontology for detection of web attacks. In: 2013
International Conference on Communication Systems and Network Technologies, pp. 612–
615. IEEE, April 2013
13. Ahmed, A.A., Hasan, H.R., Hameed, F.A., Al-Sanjary, O.I.: Writer identification on multiscript handwritten using optimum features. Kurdistan J. Appl. Res. 2(3), 178–185 (2017)
14. Nasr, M., Shokri, R., Houmansadr, A.: Comprehensive privacy analysis of deep learning:
passive and active white-box inference attacks against centralized and federated learning. In:
2019 IEEE symposium on security and privacy (SP), pp. 739–753. IEEE, May 2019
15. Tari Schreider, S.S.C.P., CISM, C., CISO, I.: Building Effective Cybersecurity Programs: A
Security Manager’s Handbook. Rothstein Publishing (2017)
16. Zissis, D., Lekkas, D.: Addressing cloud computing security issues. Futur. Gener. Comput.
Syst. 28(3), 583–592 (2012)
17. Corbet, S., Meegan, A., Larkin, C., Lucey, B., Yarovaya, L.: Exploring the dynamic relationships between cryptocurrencies and other financial assets. Econ. Lett. 165, 28–33
(2018)
18. Yusta, J.M., Correa, G.J., Lacal-Arántegui, R.: Methodologies and applications for critical
infrastructure protection: state-of-the-art. Energy Policy 39(10), 6100–6119 (2011)
19. Stinson, D.R., Paterson, M.: Cryptography: Theory and Practice. CRC Press (2018)
20. Butkovic, A., Mrdovic, S., Uludag, S., Tanovic, A.: Geographic profiling for serial cybercrime
investigation. Digit. Investig. 28, 176–182 (2019)
21. Kim, Y.G.: Deception tree model for cyber operation. In: 2019 International Conference on
Platform Technology and Service (PlatCon), pp. 1–4. IEEE , January 2019
22. Alguliyev, R., Imamverdiyev, Y., Sukhostat, L.: Cyber-physical systems and their security
issues. Comput. Ind. 100, 212–223 (2018)
23. Mavroeidis, V., Bromander, S.: Cyber threat intelligence model: an evaluation of taxonomies, sharing standards, and ontologies within cyber threat intelligence. In: 2017 European
Intelligence and Security Informatics Conference (EISIC), pp. 91–98. IEEE (2017)
24. Kaiser, R.: The birth of cyberwar. Polit. Geogr. 46, 11–20 (2015)
534
O. I. Al-Sanjary et al.
25. Shukla, J.B., Singh, G., Shukla, P., Tripathi, A.: Modeling and analysis of the effects of
antivirus software on an infected computer network. Appl. Math. Comput. 227, 11–18 (2014)
26. Tynes, B., Reynolds, L., Greenfield, P.M.:Adolescence, race, and ethnicity on the Internet:
a comparison of discourse in monitored vs. unmonitored chat rooms. J. Appl. Dev. Psychol.
25(6), 667–684 (2004)
27. Kandukuri, B.R., Rakshit, A.: Cloud security issues. In: 2009 IEEE International Conference
on Services Computing, pp. 517–520 (2009)
28. Eskandari, S., Leoutsarakos, A., Mursch, T., Clark, J.: A first look at browser-based
cryptojacking. In: 2018 IEEE European Symposium on Security and Privacy Workshops
(EuroS&PW), pp. 58–66 (2018)
29. Slonje, R., Smith, P.K., Frisén, A.: The nature of cyberbullying, and strategies for prevention.
Comput. Hum. Behav. 29(1), 26–32 (2013)
30. Harn, L.: Group-oriented (t, n) threshold digital signature scheme and digital multisignature.
IEEE Proc. Comput. Digit. Tech. 141(5), 307–313 (1994)
31. Chowdhary, A., Dixit, V.H., Tiwari, N., Kyung, S., Huang, D., Ahn, G.J.: Science DMZ: SDN
based secured cloud testbed. In: 2017 IEEE Conference on Network Function Virtualization
and Software Defined Networks (NFV-SDN), pp. 1–2. IEEE, November 2017
32. Cheddad, A., Condell, J., Curran, K., Mc Kevitt, P.: Digital image steganography: survey and
analysis of current methods. Signal Process. 90(3), 727–752 (2010)
33. Schneier, B.: The future of incident response. IEEE Secur. Priv. 12(5), 96 (2014)
34. Miller, D.R., Harris, S., Harper, A., VanDyke, S., Blask, C.: Security Information and Event
Management (SIEM) Implementation. McGraw Hill Professional (2010)
35. Karatzogianni, A.: The Politics of Cyberconflict. Routledge (2006)
36. Hoffman, R.R., Lee, J.D., Woods, D.D., Shadbolt, N., Miller, J., Bradshaw, J.M.: The
dynamics of trust in cyberdomains. IEEE Intell. Syst. 24(6), 5–11 (2009)
37. Hazelwood, S.D., Koon-Magnin, S.: Cyber stalking and cyber harassment legislation in the
United States: a qualitative analysis. Int. J. Cyber Criminol. 7(2), 155–168 (2013)
38. Li, Q., Clark, G.: Mobile security: a look ahead. IEEE Secur. Priv. 11(1), 78–81 (2013)
39. Kirschen, D.S., Jayaweera, D.: Comparison of risk-based and deterministic security assessments. IET Gener. Transm. Distrib. 1(4), 527–533 (2007)
40. Stamm, M.C., Liu, K.R.: Anti-forensics of digital image compression. IEEE Trans. Inf.
Forensics Secur. 6(3), 1050–1065 (2011)
41. Biddle, P., England, P., Peinado, M., Willman, B.: The darknet and the future of content
protection. In: Feigenbaum, J. (eds) Digital Rights Management. DRM 2002. Lecture Notes
in Computer Science, vol. 2696, pp. 155–176 Springer, Berlin, Heidelberg (2002). https://
doi.org/10.1007/978-3-540-44993-5_10
42. Stamm, M.C., Lin, W.S., Liu, K.R.: Forensics vs. anti-forensics: a decision and game theoretic framework. In: 2012 IEEE International Conference on Acoustics, Speech and Signal
Processing (ICASSP), pp. 1749–1752. IEEE, March 2012
43. Liao, K., Zh, Z., Do, A., Ahn, G.J.: Behind closed doors: measurement and analysis of
CryptoLocker ransoms in Bitcoin. In: 2016 APWG Symposium on Electronic Crime Research
(eCrime) p. 113 (2016)
44. von Ahn, L., Blum, M., Hopper, N.J., Langford, J.: CAPTCHA: using hard AI problems
for security. In: Biham, E. (eds) Advances in Cryptology — EUROCRYPT 2003. EUROCRYPT 2003. Lecture Notes in Computer Science, vol. 2656, pp. 294–311. Springer, Berlin,
Heidelberg. https://doi.org/10.1007/3-540-39200-9_18
45. Dagon, D. et al.: HoneyStat: local worm detection using honeypots. In: Jonsson, E., Valdes,
A., Almgren, M. (eds.) Recent Advances in Intrusion Detection. RAID 2004. Lecture Notes
in Computer Science, vol. 3224. Springer, Berlin, Heidelberg, pp. 39–58 (2004). https://doi.
org/10.1007/978-3-540-30143-1_3
Challenges on Digital Cyber-Security and Network Forensics
535
46. Mohanta, B.K., Jena, D., Panda, S.S., Sobhanayak, S.: Blockchain technology: a survey on
applications and security privacy challenges. Internet Things 8, 100107 (2019)
47. Cox, I.J., Miller, M.L., Bloom, J.A., Honsinger, C.: Digital Watermarking, vol. 53. Morgan
Kaufmann, San Francisco (2002)
48. Xiao, L., Wan, X., Lu, X., Zhang, Y., Wu, D.: IoT security techniques based on machine
learning: How do IoT devices use AI to enhance security? IEEE Sign. Process. Mag. 35(5),
41–49 (2018)
49. Ghazinour, K., Matwin, S., Sokolova, M.: YOURPRIVACYPROTECTOR, A recommender
system for privacy settings in social networks (2016). arXiv preprint arXiv:1602.01937
50. Mercer, J.D.: Cybersquatting: Blackmail on the information superhighway. BUJ Sci. Tech.
L. 6, 290 (2000)
51. Clark, J.F.: Growing threat: Sextortion. US Att’ys Bull 64, 41 (2016)
52. Jaishankar, K.: Cyber criminology as an academic discipline: history, contribution and impact.
Int. J. Cyber Criminol. 12(1), 1–8 (2018)
53. Crosston, M.D.: World gone cyber MAD: how mutually assured debilitation is the best hope
for cyber deterrence. Strat. Stud. Q. 5(1), 100–116 (2011)
54. Krippendorff, K.: The cybernetics of design and the design of cybernetics. In: Fischer, T., Herr,
C. (eds.) Design Cybernetics. Design Research Foundations. Springer, Cham. pp. 119–136
(2019). https://doi.org/10.1007/978-3-030-18557-2_6
55. Ibarra, J., Jahankhani, H., Kendzierskyj, S.: Cyber-physical attacks and the value of healthcare
data: facing an era of cyber extortion and organised crime. In: Jahankhani, H., Kendzierskyj,
S., Jamal, A., Epiphaniou, G., Al-Khateeb, H. (eds.) Blockchain and Clinical Trial. Advanced
Sciences and Technologies for Security Applications, pp. 115–137. Springer, Cham. https://
doi.org/10.1007/978-3-030-11289-9_5
56. Denning, D.E.: Activism, hacktivism, and cyberterrorism: the Internet as a tool for influencing
foreign policy. Netw. Netwars Future Terror Crime Milit. 239, 288 (2001)
57. Spagnolli, A., Bracken, C.C., Orso, V.: The role played by the concept of presence in validating
the efficacy of a cybertherapy treatment: a literature review. Virt. Real. 18(1), 13–36 (2014)
58. Van Laer, T.: The means to justify the end: combating cyber harassment in social media. J.
Bus. Ethics 123(1), 85–98 (2014)
59. Young, A.L., Yung, M.: Cryptovirology: the birth, neglect, and explosion of ransomware.
Commun. ACM 60(7), 24–26 (2017)
60. Vandaele, K., van der Velden, S., Dribbusch, H., Lyddon, D., Vandaele, K.: From the Seventies
Strike Wave to the First Cyber-Strike in the Twenty-First Century, pp. 196–205. Aksant,
Amsterdam (2007)
61. Wimmer, J.: Digital game culture(s) as prototype(s) of mediatization and commercialization
of society: the world cyber games 2008 in cologne as an example. In: Fromme, J., Unger, A.
(eds.) Computer Games and New Media Cultures. Springer, Dordrecht, pp. 525–540 (2012)
. https://doi.org/10.1007/978-94-007-2777-9_33
62. Pusey, P., Sadera, W.A.: Cyberethics, cybersafety, and cybersecurity: preservice teacher
knowledge, preparedness, and the need for teacher education to make a difference. J. Digit.
Learn. Teach. Educ. 28(2), 82–85 (2011)
63. Kandula, S., Katabi, D., Jacob, M., Berger, A.: Botz-4-sale: Surviving organized DDoS attacks
that mimic flash crowds. In: Proceedings of the 2nd conference on Symposium on Networked
Systems Design & Implementation-Volume 2, pp. 287–300 (2005)
64. Leukfeldt, E.R., Kleemans, E.R., Stol, W.P.: Cybercriminal networks, social ties and online
forums: social ties versus digital ties within phishing and malware networks. Br. J. Criminol.
57(3), 704–722 (2017)
65. Al-Sanjary, O.I., Ahmed, A.A., Sulong, G.: Development of a video tampering dataset for
forensic investigation. Forensic Sci. Int. 266, 565–572 (2016)
536
O. I. Al-Sanjary et al.
66. Suo, H., Liu, Z., Wan, J., Zhou, K.: Security and privacy in mobile cloud computing. In: 2013
9th International Wireless Communications and Mobile Computing Conference (IWCMC),
pp. 655–659. IEEE (2013)
67. Sun, X., Dai, J., Liu, P., Singhal, A., Yen, J.: Using Bayesian networks for probabilistic
identification of zero-day attack paths. IEEE Trans. Inf. Forensics Secur. 13(10), 2506–2521
(2018)
68. Lee, I., Jeong, S., Yeo, S., Moon, J.: A novel method for SQL injection attack detection based
on removing SQL query attribute values. Math. Comput. Model. 55(1–2), 58–68 (2012)
69. Abbas, S., Merabti, M., Llewellyn-Jones, D., Kifayat, K.: Lightweight sybil attack detection
in manets. IEEE Syst. J. 7(2), 236–248 (2012)
70. Salehi, S.A., Razzaque, M.A., Naraei, P., Farrokhtala, A.: Detection of sinkhole attack in
wireless sensor networks. In: 2013 IEEE international conference on space science and
communication (IconSpace) , pp. 361–365. IEEE, July 2013
71. Shi, Y., Sagduyu, Y.E., Erpek, T., Davaslioglu, K., Lu, Z., Li, J.H.: Adversarial deep learning for cognitive radio security: jamming attack and defense strategies. In: 2018 IEEE
international conference on communications workshops (ICC Workshops), pp. 1–6. IEEE
(2018)
72. Shorey, T., Subbaiah, D., Goyal, A., Sakxena, A., Mishra, A.K.: Performance comparison and
analysis of slowloris, goldeneye and xerxes ddos attack tools. In: 2018 International Conference on Advances in Computing, Communications and Informatics (ICACCI), pp. 318–322.
IEEE (2018)
73. Peltier, T.R.: Implementing an information security awareness program. Inf. Secur. J. A Glob.
Perspect. 14(2), 37–49 (2005)
74. Kao, D.-Y.: Cybercrime investigation countermeasure using created-accessed-modified model
in cloud computing environments. J. Supercomput. 72(1), 141–160 (2015). https://doi.org/
10.1007/s11227-015-1516-7
75. Al-Sanjary, O.I., Ghazali, N., Ahmed, A.A., Sulong, G.: Semi-automatic methods in video
forgery detection based on multi-view dimension. In: Saeed, F., Gazem, N., Patnaik, S., Saed
Balaid, A.S., Mohammed, F. (eds.) IRICT 2017. LNDECT, vol. 5, pp. 378–388. Springer,
Cham (2018). https://doi.org/10.1007/978-3-319-59427-9_41
76. Ahmed, A.A., Al-Sanjary, O.I., Kaeswaren, S.: Reserve parking and authentication of guest
using QR Code. In: 2020 IEEE International Conference on Automatic Control and Intelligent
Systems (I2CACIS), pp. 103–106. IEEE (2020)
77. Casey, E.: Handbook of Digital Forensics and Investigation. Academic Press (2009)
78. Ciardhuáin, S.Ó.: An extended model of cybercrime investigations. Int. J. Digit. Evid. 3(1),
1–22 (2004)
79. Abushahma, R.I.H., Ali, M.A., Al-Sanjary, O.I., Tahir, N.M.: Region-based convolutional
neural network as object detection in images. In: 2019 IEEE 7th Conference on Systems,
Process and Control (ICSPC), pp. 264–268. IEEE (2019)
80. Reust, J., Friedburg, S.: DFRWS 2005 Workshop Report. http://www.dfrws.org/2005/dow
nload/2005final.Pdf (2006)
81. Al-Sanjary, O.I., et al.: Deleting object in video copy-move forgery detection based on optical
flow concept. In: 2018 IEEE Conference on Systems, Process and Control (ICSPC), pp. 33–38.
IEEE (2018)
82. Al-Sanjary, O.I., Sulong, G.: Detection of video forgery: a review of literature. J. Theor. Appl.
Inf. Technol. 74(2) (2015)
83. Al-Sanjary, O.I., Ahmed, A.A., Jaharadak, A.A.B., Ali, M.A., Zangana, H.M.: Detection
clone an object movement using an optical flow approach. In: 2018 IEEE Symposium on
Computer Applications & Industrial Electronics (ISCAIE), pp. 388–394. IEEE (2018)
Challenges on Digital Cyber-Security and Network Forensics
537
84. Alkawaz, M.H., Steven, S.J., Hajamydeen, A.I.: Detecting phishing website using machine
learning. In: 2020 16th IEEE International Colloquium on Signal Processing & Its Applications (CSPA), pp. 111–114 (2020)
85. Che Hamid, H.E., et al.: Disaster management support model for Malaysia. In: Badioze
Zaman, H., et al. (eds) Advances in Visual Informatics. IVIC 2019. LNCS, vol. 11870,
pp. 570–581. Springer, Cham (2019). https://doi.org/10.1007/978-3-030-34032-2_50
86. Hajamydeen, A.I., Udzir, N.I.: A detailed description on unsupervised heterogeneous anomaly
based intrusion detection framework. Scalable Comput. Pract. Exper. 20(1), 113–160 (2019)
87. Aidee, N.A.N., Johar, M.G.M., Alkawaz, M.H., Hajamydeen, A.I., Al-Tamimi, M.S.H.: Vulnerability assessment on ethereum based smart contract applications. In: 2021 IEEE International Conference on Automatic Control & Intelligent Systems (I2CACIS), pp. 13–18
(2021)
Information Systems
A Model of Trusted Factors of Video Word
of Mouth (vWOM) in Social Commerce
Humaira Hairudin and Halina Mohamed Dahlan(B)
Information System Department, Azman Hashim International Business School (AHIBS),
Universiti Teknologi Malaysia (UTM) Skudai Johor, Skudai Johor, Malaysia
humairahairudin@graduate.utm.my, halina@utm.my
Abstract. In this digital era, many people often searching information before
make purchase decision. The vWOM might be considered as resources for customer to searching beneficial information that can increase customer trust to purchase online. However, there is still less study conducted about what is significant
attributes of vWOM that make them effective in influence purchase intention. This
study identified trusted factors of vWOM that can influence purchase intention and
also identified a suitable theory for develop a model of trusted factors of vWOM.
Therefore, this study identify Rhetoric theory is suitable theory and developed a
conceptual model of trusted factors of vWOM in social commerce which consists
of seven factors which is informative, credible, perceived transparency, perceived
benefit, perceived emotion, expertise and attractiveness. All the factors identified
are categorized under definition of each Rhetoric theory’s elements.
Keywords: Video word of mouth · Purchase intention · vWOM
1 Introduction
With the emergence of internet, product review using video format is considered as a
new and developing trend. Video word of mouth or shortly called as vWOM is defined
as a product review using video format that provide individual faces and vivid demonstrations [1]. The vWOM is created by the reviewer to convey their real experience and
provides helpful information which can help customers to find trusted product information through online platform [2]. The vWOM also defined as audiovisual content that
display characteristics of product to introduce the product to customer, which can convey
the product information to help customer purchase decision making [3]. Therefore, the
vWOM is determined have powerful persuasive effects that can increase customers trust
and influence their purchase intention [1].
During online shopping, customers often exposed to being inconveniently to physical
touch of the products and feeling unsatisfactory to make high quality decision by plainly
depending with product information provided by seller [4]. Hence, by using trusted
vWOM, customer has ability to see the product in action, where customer cannot test
the product as in physical store [5]. Moreover, it can help customers to understand the
product affordances such as functionalities of different parts of the product. Customer
© The Author(s), under exclusive license to Springer Nature Switzerland AG 2022
F. Saeed et al. (Eds.): IRICT 2021, LNDECT 127, pp. 541–550, 2022.
https://doi.org/10.1007/978-3-030-98741-1_44
542
H. Hairudin and H. M. Dahlan
also can watch the interaction between the reviewer and the product featured in the
video that enhance customer understanding about the product affordances [7]. In social
commerce, there many customers are rely on vWOM before make purchase decision.
However, there is still less study conducted about what is significant attributes of vWOM
that make them effective and help generate favorable perceptions among customers [6].
Apparently, vWOM has a much more powerful persuasive effective due to the multimedia presentation because it can show how the products work or not. However, how
such vWOM can be trusted is still unknown [1]. Numerous studies have found that
vWOM posted using online video sharing platform to share information with online
customers [18, 9, 10, 13, 8], but to date lack of studies looking on the how communication is carried out through the video that can be trusted and can influence purchase
intention. Besides, a number of authors have reported the characteristics of reviewer in
the video [11, 12], however, far too little attention has been paid to video content that the
reviewer can conveyed to the audiences to increase customer trust [13]. Therefore, this
study will develop a conceptual model of trusted factors of vWOM in social commerce
that can influence purchase intention and help customer to avoid wasteful purchase.
This paper is organized into five sections. The first section is about the introduction
of vWOM and the research problem. The literature review is explained in Sect. 2, while
Sect. 3 is about the research methodology applied in this study. Then, Sect. 4 explains
about the findings and last but not least, Sect. 5 is about the conclusion of this study.
2 Literature Review
2.1 Video Word of Mouth (vWOM)
vWOM is video based on eWOM that refer to online product review video that created by
individual and posted through social commerce platform. The vWOM is online product
review using video based format, which is show the individual faces and provide product
demonstrations to share information to the customers and lead to purchase intention [1].
vWOM is defined as the reviewer can convey a great deal of information to the customers
using videos through language verbally and non-verbally [11]. The reviewer can convey
the information by explain briefly about the characteristics of product to introduce them
to the customer through vWOM that can ease customer purchase decision making [3].
By using YouTube as online video sharing platform for upload vWOM, it can enhance
consumer’s perception towards the value of products and it is easy to searching the
information that matching with the customer’s needs. This can strengthen customer’s
awareness about the products by include relevant information into the video created
[25]. Besides, the reviewer also can upload vWOM through TikTok platform where it is
more convenient to create and share vWOM packed with music and special effects that
typically lasting between 15 s to a few minutes [26].
2.2 Research Related Video Word of Mouth (vWOM)
Many people use social media for entertainment platform but it is should be viewed
as communicating platform as well. Previous scholar identified that video theme is
A Model of Trusted Factors of Video Word of Mouth
543
important for creator to choose the suitable topics or specific information that can give
benefits to the viewer [8]. Besides, the credible information is important in order to
delivering factual description about products, attributes, and people that can increase
customer trust [9]. The informative video content could provide specific information to
customers which help in their purchase decision making [10]. Previous study explains
that informativeness can be measured by which explanations or completeness of the
information from reviewers that conveys to the customers can help them to searching
credible product information through online platform [11].
Nowadays, communication is important to convey the information in the vWOM.
Previous scholar also pointed out that in the vWOM normally have individual character
being shown most in the video and playing the leading role. The good image and have
professional background would encourage people more believe with the individual who
communicate in the video [8]. The credible speaker should have high knowledge background to provide valid information and evidence to the audience [12, 13]. In addition,
the speaker also tends to focus on what they can convey the information, so communication appears more reliable and professional [11]. Moreover, the reviewer that has
attractiveness, skilled, abilities and expertise in certain field to be qualified to convey
effective and valid information to the customers can influence purchase intention [14].
Another previous scholar discuss about emotion focused has either positive or negative emotion. Positive emotion is give good impressions of the product such as love,
joy, and excitement. While negative emotion and expressing negative feelings are such
as sadness, shame and anger [1, 9]. In addition, emotion that could be found in the
vWOM is enjoyable, fun, and pleasing may attract them to watch the vWOM without
feel boring [10, 11]. Perceived enjoyment is an active feeling which activity conducted
is considered pleasurable that can contribute to customer behaviour [11]. The reviewer
provides right expression to stir with the audience’s emotion, which the expression look
like a representation of customer feeling toward the product. A few cheerful and smiles
expression also needed to applied in some humor messages to entertain the customer
[12].
2.3 Rhetoric Theory
The rhetoric theory is based on Aristotle’s persuasive communication method that consists of three effective elements of rhetoric which include Logos, Ethos, and Pathos,
where it is expected to provide enrichment in communication theory. Logos refers to the
validity of arguments, Ethos refers to speaker’s credibility or characteristics, and Pathos
refers to the ability of emotions [15]. Based on previous study, three effective elements
of rhetoric which is consist of logos, pathos and ethos applied in order to examine how
the vWOM help strengthen the connection between customers and the reviewer [16].
The logos is verbal messages that contain information such as evidence and arguments [12]. Moreover, Logos refer to the arguments in favor of strengthening of the
connection or information presented by the speaker due to the exposure of social media
marketing activities [16]. Logos used in this study refer to provide valid and accurate
information in the video that might helpful and useful for customer. Meanwhile, the
pathos appears in serious nonverbal messages to influence the emotions of the audience
[12]. In other words, Pathos refer to the feelings evoked to the customers which expressed
544
H. Hairudin and H. M. Dahlan
through the communication [16]. Phatos used in this study refers to how to deliver the
communication with emotion in the vWOM. Besides, another element which is Ethos
refers to the credibility of the sources or speaker [16]. Therefore, Ethos is use credible
speaker that have high knowledge background to convey information to the audience
[12]. Ethos used in this study refers to character of the reviewer in the vWOM.
3 Research Methodology
The methodology used in this paper consists of two phases which are:
Phase 1: Identification of trusted factors of vWOM that can influence purchase intention
based on literature review. In finding the trusted factors, this study using database platform such as Google Scholar, Scopus, ScienceDirect, IEEE Xplore, and other institution
available database access. The searching strategy for identify the factors is based on the
keywords used which related to the domain of this study. The information will be taken
from each article to derive the factors of vWOM. There are 371 selected studies from
online database platform that relevant and related to this domain study. According to
the selected studies, there are 30 factors of vWOM are identified. Next, all the identified
vWOM factors will be analyzed based on weight of criteria and definition of trust. The
weight of criteria of the vWOM factors are calculated which results only seven factors of vWOM achieved weight of criteria more than 0.5. Seven factors identified from
previous literature review which is perceived emotion, informative, credible, perceived
transparency, perceived benefit, expertise, and attractiveness.
Phase 2: The development model of trusted video word of mouth (vWOM) which consists
of seven factors identified from previous literature review which is perceived emotion,
informative, credible, perceived transparency, perceived benefit, expertise, and attractiveness. In addition, this study also identifies the relevant theory for adapt in the model
development which is Rhetoric theory. Hence, this steps results the development model
of trusted factors of vWOM that adapted Rhetoric theory. The Rhetoric theory identified
is suitable to provide enrichment in communication theory. Moreover, Rhetoric refers
to competency of individual to identify existing means to convince another individual
[15].
4 Findings
4.1 Trusted Factors of Video Word of Mouth (vWOM)
Based on the literature review, the selected factors are analyzed based on definition
of trust which is considered as trusted factors of vWOM that can influence purchase
intention. The definition of trust explains that vWOM provided is able to act in the
customer’s interest which involves honest, competent, benevolent, and predictable [27].
Therefore, trust is important in the social media platform where the vWOM created
and delivered must effectively provide trusted information, advice and service [28]. The
trusted factors of vWOM identified are informative, credible, perceived transparency,
perceived benefit, expertise, attractiveness, and perceived emotion.
A Model of Trusted Factors of Video Word of Mouth
545
Informative refer to the amount of information could provide to customers in the
video which is beneficial in customer purchase decision making. The information provided must be a good source of product information to explain the useful of product
reviewed in the video, which can lead to purchase intention. The informative factor
considered as utmost priority in the vWOM when customers seeking for online product
information [10]. In general, informative consists of product features, the use of product, price, and news for upcoming events that can give knowledge to the customer and
can influence purchase intention. Moreover, the informative vWOM may maintain the
interest of potential customer that seeking for information through vWOM before make
purchase decision [17].
The video credibility is defined as the believability and trustworthiness based on customer perception towards the video. The video is perceived credible as provide credible
information that may help to enhance customer trust toward the product effectiveness
and this will leading to purchase intention about the product [10]. The video that provide
credibility to the audiences is to enhance trust of customer toward the video content.
Customer will put a trust on the video if the video is trustworthiness and useful in aided
customer to make purchase decision [18].
The video review is considered as perceived benefit if it can confirm the customer the
positive and negative things about the product before to purchase. The perceived benefit
video can help customer to make a good purchase and can avoid the purchase risk [19]. If
the reviewer provides information that has benefit through vWOM, it will help customer
to think carefully to determine whether the purchase made will be worthy. The benefit
of information is perceived by customer that may influence them toward perceptions of
product value. Therefore, information that perceived benefit is depends on the reviewer
experience for consuming the product either feel satisfied or unsatisfied [20].
Perceived transparency is described as an effort to provide clear and relevant information regarding products and business to the customers. For example, transparent communication about the product related cost and price is perceived higher level of information sensitivity. Hence, the practice of disclosing cost and product information can help
build perception of customer towards the perceived product transparency and authenticity [21]. Besides, the vWOM should provide specific information such as features
and functions of product in order to facilitate customer’s understanding of a product. By
provide product feature information, it can help customer to have better understanding
and can determine whether the product features can satisfy their needs [22].
In the vWOM, emotions are one of the most influential factors during process of
decision making. By showing positive emotions in the video, it has positive effect on
customer satisfaction and may be influenced with the reviewer to purchase the product
exposed in the vWOM. There are nine positive emotions can be identified in the vWOM
such as joy, love, pride, hope, amusement, compassion, contentment and gratitude [20].
The emotion provided may convince customer to purchase the product if the emotion
shown is satisfy the customer. It is because positive emotion expression in the vWOM
can create the feeling among the audience to feel the same way as the reviewer. Moreover,
it also can make the audience feel good and have positive mood to purchase [9].
Expertise can be described by how much a reviewer is capable of providing valid
and credible information in the video. The individual who share informative sources
546
H. Hairudin and H. M. Dahlan
and helpful information to the customers is believed as credible and reliable reviewer. It
can be seen through the reviewer’s words that show his/her competence, reliability, and
good will [16]. Hence, the reviewer tend to be more professional in convey the relevant
information, which make the customers respond more favorably towards the reviewer.
The expertise of the reviewer perceived by the customers after watching vWOM will
influence their attitude towards the product exposed in the vWOM [23].
Physical attractiveness is defined as an attractiveness and beautiful face which determine the first impression in a moment. Besides, the attractiveness of reviewer perceived
by customers after watching vWOM will lead the customers to have positive attitude
toward information sharing and product exposed through the vWOM [23]. Customers
are more easily influenced by the physical attractiveness of the reviewer during review
the product. It is because the attractiveness of the reviewer is considered as a strong
factor in determining an ability of the reviewer to persuade customers to make purchase
decision [24].
4.2 Trusted Video Word of Mouth (vWOM) Model
In order to understanding the trusted factors of vWOM in influencing purchase intention,
this study needs to identify the suitable theory used for develop a model. This study
identify the Rhetoric theory is suitable for model of trusted factors of vWOM. Rhetoric
theory consist of Therefore, the figure below shows a model of trusted factors of vWOM
(see Fig. 1).
Fig. 1. Trusted vWOM model.
Based on the Fig. 1 above, the four factors identified which is informative, credible,
perceived benefit and perceived transparency are categorized under logos. Logos used in
this study refer to provide valid and accurate information in the video that might helpful
and useful for customer [12]. Next, Phatos used in this study refers to how to deliver the
communication about the vWOM [16]. Hence, Perceived emotion is categorized under
A Model of Trusted Factors of Video Word of Mouth
547
Phatos because the reviewer can show their emotion expression in the vWOM. Lastly,
two factors identified which is expertise and attractiveness is categorized under ethos.
Ethos used in this study refers to character of the reviewer in the video [15]. It is because
expertise and attractiveness are related to character of the user who talking in the video.
The operational definition of rhetoric elements and its factors is as in Table 1 below.
Table 1. Trusted factors and rhetoric elements
Trusted
factors
Definition of trusted Rhetoric elements
factors
Definition of rhetoric
elements
Informative
Completeness and
sufficient of
information or
explanation from
reviewer can be
conveyed to the
customers [10]
Logos
The arguments on the
subject presented by
the speaker [16]
Credible
The truthfulness and
believability of the
vWOM [12]
Perceived benefit
Beneficial
information which
helpful for purchase
decision [29]
Perceived transparency
The information
provided in the
video need to be
truthful and balance
[11]
Perceived emotion
The emotion
expression
presented in the
video [8]
Pathos
Expressed emotions
between the speaker
and audiences [30]
Expertise
The reviewer that
has background
knowledge and
expert in certain
field to be qualified
[31]
Ethos
The credibility of the
speaker [16]
Attractiveness
The degree of
attraction of the
reviewer to the
customers [31]
548
H. Hairudin and H. M. Dahlan
5 Conclusion
In conclusion, this study identifies the trusted factors of vWOM based on literature review
that can increase customer trust and influence purchase intention. Due to pandemic, customers often exposed to being inconveniently to physical touch of the products because
customer cannot test the product as in physical store. Therefore, this study develops a
model of trusted factors of vWOM that can help customer who seeking credible information about the product through online platform. Literature review is adapted in this
study in order to identify the trusted factors of vWOM and suitable theory. The selected
trusted factors of vWOM are calculated which is achieved weight of criteria and analyzed
based on trust definition. Besides, Rhetoric theory is identified in this study as suitable
theory for a model of trusted factors of vWOM because it is related with communication theory. The findings from this paper is development conceptual model of trusted
factors of vWOM in social commerce which consists of informative, credible, perceived
transparency, perceived benefit, perceived emotion, expertise, and attractiveness. In the
future, this study can be extended in order to develop hypothesis and evaluate the model.
References
1. Bi, N.C., Zhang, R., Ha, L.: Does valence of product review matter?: the mediating role
of self-effect and third-person effect in sharing youtube word-of-mouth (vWOM). J. Res.
Interact. Mark. 13(1), 79–95 (2019)
2. Diwanji, V.S., Cortese, J.: Contrasting user generated videos versus brand generated vide-os
in ecommerce. J. Retail. Consum. Serv. 54, 102024 (2020)
3. Orús, C., Gurrea, R., Flavián, C.: Facilitating imaginations through online product presentation videos: effects on imagery fluency, product attitude and purchase intention. Electron.
Commer. Res. 17(4), 661–700 (2016). https://doi.org/10.1007/s10660-016-9250-7
4. Lah, N.S.B.C., Hussin, A.R.B.C., Dahlan, H.B.M.: Information relevance factors of argument
quality for e-commerce consumer review. Adv. Intell. Syst. Comput. 843, 871–881 (2019)
5. Yu, Y.W., Natalia, Y.: The effect of user generated video reviews on consumer purchase
intention. In: Proceedings - 7th International Conference on Innovative Mobile and Internet
Services in Ubiquitous Computing, IMIS 2013, pp. 796–800 (2013)
6. Ghosh, T.: How to make effective product review videos: the influence of depth, frame, and
disposition on consumers. J. Electron. Commer. Organ. 18(4), 73–92 (2020). https://doi.org/
10.4018/JECO.2020100104
7. Fang, K., et al.: Demo2Vec: reasoning object affordances from online videos. In: Proceedings
of the IEEE Computer Society Conference on Computer Vision and Pattern Recognition,
pp. 2139–2147. https://doi.org/10.1109/CVPR.2018.00228 (2018)
8. Zhu, C., Xu, X., Zhang, W., Chen, J., Evans, R.: How health communication via tik tok
makes a difference: a content analysis of tik tok accounts run by Chinese provincial health
committees. Int. J. Environ. Res. Public Health 17(1), 1–13 (2020)
9. Tellis, G.J., MacInnis, D.J., Tirunillai, S., Zhang, Y.: What drives virality (sharing) of online
digital content? the critical role of information, emotion, and brand prominence. J. Mark.
83(4) pp. 1–20 (2019).
10. Bezbaruah, S., Trivedi, J.: Branded content: a bridge building gen Z’s consumer-brand
relationship. Vision 24(3), 300–309 (2020)
11. Fitriani, W.R., Mulyono, A.B., Hidayanto, A.N., Munajat, Q.: Reviewer’s communication
style in YouTube product-review videos: does it affect channel loyalty?, Heliyon, 6(9), e04880
(2020)
A Model of Trusted Factors of Video Word of Mouth
549
12. Sofian, F.A.: YouTubers creativity in creating public awareness of COVID-19 in Indonesia:
a youtube content analysis. In: International Conference on Information Management and
Technology (ICIMTech), (August), pp. 881–886 (2020)
13. Sokolova, K., Kefi, H.: Instagram and YouTube bloggers promote it, why should I buy? How
credibility and parasocial interaction influence purchase intentions. J. Retail. Consum. Serv.
53, 101742 (2020)
14. Chen, J.-L., Dermawan, A.: The Influence of youtube beauty vloggers on Indonesian Consumers’ purchase intention of local cosmetic products’. Int. J. Bus. Manag. 15(5), 100
(2020)
15. Aristotle: On Rhetoric: A Theory of Civic Discourse. Edited by G. A. Kennedy and G. A.
Kennedy. Oxford University Press (1991)
16. Panigyrakis, G., Panopoulos, A., Koronaki, E.: All we have is words: applying rhetoric to
examine how social media marketing activities strengthen the connection between the brand
and the self. Int. J. Advert. 39(5), 699–718 (2020)
17. Kefi, H. and Maar, D.: The power of lurking: assessing the online experience of luxury brand
fan page followers. J. Bus. Res. (2017), pp. 0–1 (2018) .https://doi.org/10.1016/j.jbusres.
2018.08.012
18. Yang, K.C., Huang, C.H., Yang, C., Yang, S.Y.: Consumer attitudes toward online video
advertisement: YouTube as a platform. Kybernetes 46(5), 840–853 (2017)
19. Mumuni, A.G., Lancendorfer, K.M., O’Reilly, K.A., MacMillan, A.: Antecedents of
consumers’ reliance on online product reviews. J. Res. Interact. Mark. 13(1), 26–46 (2019)
20. Bueno, S., Gallego, M.D.: eWOM in C2C platforms: combining IAM and customer satisfaction to examine the impact on purchase intention. J. Theor. Appl. Electron. Commer. Res.
16(5), 1612–1630 (2021). https://doi.org/10.3390/jtaer16050091
21. Yang, J., Battocchio, A.F.: Effects of transparent brand communication on perceived brand
authenticity and consumer responses. J. Prod. Brand Manag. (September) (2020). https://doi.
org/10.1108/JPBM-03-2020-2803
22. Zhou, L., et al.: Perceived information transparency In B2C e-commerce: an empirical
investigation. Inf. Manag. 55(7), 912–927 (2018). https://doi.org/10.1016/j.im.2018.04.005
23. Choi, W., Lee, Y.: Effects of fashion vlogger attributes on product attitude and content sharing.
Fashion Text. 6(1), 1–18 (2019). https://doi.org/10.1186/s40691-018-0161-1
24. Benito, S.M., Illera, A.E., Fernández, E.O.: Youtube celebrity endorsement: audience evaluation of source attributes and response to sponsored content a case study of influencer verdeliss.
Commun. Soc. 33(3), 149–166 (2020). https://doi.org/10.15581/003.33.3.149-166
25. Yadav, M.S. et al.: Social commerce: a contingency framework for assessing marketing
potential. J. Inter. Mark. 27(4), 311–323 (2013). https://doi.org/10.1016/j.intmar.2013.09.001
26. Shao, T., Wang, R., Hao, J.X.: Visual destination images in user-generated short videos: an
exploratory study on Douyin. In: 2019 16th International Conference on Service Systems and
Service Management, ICSSSM 2019, (2), pp. 1–5 (2019). https://doi.org/10.1109/ICSSSM.
2019.8887688
27. McKnight, D.H., Chervany, N.L.: What trust means in e-commerce customer relationships: an
interdisciplinary conceptual typology. Int. J. Electron. Commer. 6(2), 35–59 (2001). https://
doi.org/10.1080/10864415.2001.11044235
28. Abdulgani, M.A., Suhaimi, M.A.: Exploring factors that influence Muslim intention to purchase online. In: 2014 the 5th International Conference on Information and Communication
Technology for the Muslim World, ICT4M 2014, pp. 1–6 (2014). https://doi.org/10.1109/
ICT4M.2014.7020637
29. Xu, P., Chen, L., Santhanam, R.: Will video be the next generation of e-commerce product
reviews? Presentation format and the role of product type’,. Decis. Supp. Syst. 73, 85–96
(2015). https://doi.org/10.1016/j.dss.2015.03.001
550
H. Hairudin and H. M. Dahlan
30. Huber, A., Pable, J.: Aristotelian appeals and the role of candidate-generated videos in talent
assessment. Int. J. Art Des. Educ. 38(1), 90–109 (2019). https://doi.org/10.1111/jade.12176
31. Ananda, A. F. and Wandebori, H.: The impact of drugstore makeup product reviews by beauty
vlogger on youtube towards purchase. In: International Conference on Ethics of Business,
Economics, and Social Science, vol. 3, no. 1, pp. 264–273 (2016)
Information Quality Requirements
for a Nutrition App Based on Experts Interviews
Siti Asma Mohammed(B) , Mohamed Aden Ighe, and Azlin Nordin
Kulliyyah of Information and Communication Technology, IIUM, Selangor, Malaysia
siti_asma@iium.edu.my
Abstract. Many people nowadays are using nutrition and dietary apps to manage
their health by monitoring their food and calorie intake. Online health information
enables people to search for specific health-related information that may concern
them in the comfort and privacy of their home. Thus, the quality of such information is crucial to ensure people are getting the right and reliable information. The
objective of this paper is to present the information quality requirements for nutrition app by analysis of experts’ interviews. The interview was conducted using
semi structured interview with five nutritionists. The finding from the interviews
show that a nutrition app should include a complete, reliable, accurate and updated
information.
Keywords: Information quality · Nutrition app
1 Introduction
There is an increasing number of nutrition health applications which are reaching more
and more people with a new kind of nutrition information [1, 2]. Many internet users
are seeking for information on diet, nutrition, vitamins or nutritional supplements [3].
Consequently, credibility and reliability of the massive information produced in nutrition
app has become the major concern to the healthcare providers [1]. Due to outdated
references or sources from the food composition database, several applications have
failed to offer exact, dependable and consistent information about specific foods to
their users [4, 5] and lack of quality-control procedures [6]. Nutritionists and system
developers should collaborate early on in the development process to implement the
information quality criteria [6, 7] in order to avoid rework and poor information in
nutrition apps. Most research on nutrition apps information are focusing on the user’s
behavior change and influence of the use of nutrition information to healthy eating [1,
5]. However, research on the kind of quality information that are required in order to
have a quality by design nutrition app is still limited. As a result, this paper goal is to
suggest the dimensions of information quality for nutrition apps. The significance of this
research is that users with inadequate internet skills and lower computer literacy might
unknowingly access inaccurate information that is potentially dangerous to their health.
Searching online nutrition or dietary information are becoming a trend as many people
are trying to manage their own nutrition intakes nowadays and willing to change their
lifestyle [1].
© The Author(s), under exclusive license to Springer Nature Switzerland AG 2022
F. Saeed et al. (Eds.): IRICT 2021, LNDECT 127, pp. 551–558, 2022.
https://doi.org/10.1007/978-3-030-98741-1_45
552
S. A. Mohammed et al.
2 Information Quality for Online Health Information
Information quality is known as fitness for use, which means that the information must
corresponds with user tasks according to the context usage [8, 9]. The information
should also have clear purpose and created under certain policies and procedures [10].
In terms of online health information, Health on the Net (HON) is a quality instrument
that certifies medical and health websites, which provides high quality and transparent
health information [11, 12]. Table 1 explains the HON principles [13].
Table 1. The HON principles and their definition. (Source [13])
Principle
Definition
Authoritative
Medical and health information provided are only given by
medically trained and qualified professionals
Complementarity
The information is meant for supplementary rather than replace the
user-physician interactions
Privacy
Information of the users are kept confidential
Attribution
The information is supported by clear references to source data and
the most recent date of updated information is clearly mentioned
Justifiability
Any claims about the efficacy of a treatment, a product or a service
must be backed up by scientific proof
Authorship transparency Contact information should be available for users who require
additional information or assistance from the site or app
Financial disclosure
Identities of the funder for the site or app should be acknowledged
Advertising policy
Advertising policy should be displayed
Nevertheless, poor information quality can still be found in some nutrition apps. Several existing studies that evaluated nutrition apps highlighted the common issues found
often related to accuracy, completeness, timeliness and reliability of the information, in
which this research has chosen to investigate further. For example, [14] and [15] found
that the information on food composition in some free nutrition apps are inaccurate.
Poor information was found in five apps, where the information from food database are
not relevant and are not based on reliable sources [5, 14]. As for [16], they found that
some food database information are not updated regularly.
3 Methodology
This research uses qualitative method to get in-depth understanding of nutrition information and the quality requirements from nutrition experts by applying Goal-QuestionsMetric (GQM) approach to design a semi structured interview questions. GQM is a
suitable approach to design an interview protocol for a specific measurement setting
[17].
Information Quality Requirements for a Nutrition App
553
3.1 The Objective of the Interview
The main objective of the interview is to investigate the perception of the experts on
the important information requirements for a nutrition application based on the chosen
information quality dimensions. Table 2 presents the interview protocol based on GQM
approach, including the aim of the interview, the questions to investigate and the metrics
to support the purpose of each inquiry.
Table 2. The interview protocol based on GQM approach.
Goal: To investigate the information quality requirements for nutrition apps
Question
Metric
Q1: Tell me what kind of information should
be included in the nutrition app?
M1: Personal opinion on including the actual
use of information the nutrition app
Q2: Who are responsible for providing the
information?
M2: Personal opinion on the information
ownership or authorship - relating to
reliability dimension
Q3: How do you make sure the information in M3: Personal opinion on the information
a nutrition app always available to the users?
completeness in the nutrition app - relating to
completeness and accuracy dimension
Q4: What are the information that needs to be
updated from time to time?
M4: Personal opinion on updated information
that should be in the app - relating to
timeliness dimension
3.2 Selection of Experts
The experts from this interview were 5 nutritionists. The selection criteria includes within
5 years of experience in the nutrition field, has practicing or non-practicing background
with formal education background in nutrition. Purposive sampling was used because
it is the most effective method when one needs to study a certain domain with knowledgeable experts [18]. Table 3 explains the background of nutritionists based on years
of experience and relevance.
3.3 Data Collection and Analysis
All conversations during the interview were audio recorded. The duration for each interview lasted between 45 min to 1 h. Every recorded interview was transcribed carefully
into text document for analysis. Thematic analysis was used to analyze the collected
data for interpretation.
4 Results
The result from thematic analysis are divided into three. First, the stakeholders and their
roles, which indicate to reliability or authorship of the information. Second is types
554
S. A. Mohammed et al.
Table 3. Background of nutritionists.
Nutritionist
Relevance
Years of experience
N1
Nutritional science officer
5+
N2
Nutritional science officer
5+
N3
Lecturer and researcher for nutrition and diets
5+
N4
Lecturer and researcher for nutrition and diets
15+
N5
Researcher and developer for nutrition apps
9+
of information required for a nutrition app to ensure the accuracy, completeness and
timeliness of the information, and third is the overall information quality requirements
for a nutrition app.
4.1 Stakeholders and Roles
According to the nutritionist experts, there are three types of stakeholders for a nutrition
app. First stakeholder is the nutritionist. The nutritionist is the person who provides the
app with food, nutrition and weight management information. Nutritionist is responsible
of ensuring that the information offered in the nutrition app is of high quality. The information provided should come from valid sources such as the World Health Organization
(WHO) and Malaysia Food Composition Database (MyFCD). MyFCD includes all the
food composition targeting for Malaysia local population. The second stakeholder is the
app developer. According to all the experts, the app developer is responsible to ensure
that all the provided information coming from the nutritionists should be translated into
the app accurately and completely, while the app end-user is the third stakeholder that
will provide information relating to his or her nutrition intake, weights, calories, physical
activities and diets including feedback in the app. Nutritionist 1 and 2 explained that
end-users are also responsible for the accurate and complete information of their own
personal data and the information on their food intake, which they provide through the
app in order to manage their weight. Other than that, users also can provide comments
and feedback in the app if they find any inaccurate and incomplete information from the
app. This will help the nutritionist to always improve the quality of the app information.
4.2 Types of Information
The major functions that should be included in a nutrition app, according to all the
nutritionist experts, are the Body Mass Index (BMI) calculator, food calorie dictionary,
meal diary, weight record and the user’s calorie intake. All experts believe that the
information should include a variety of local and popular food lists,as well as a BMI
classification and calculation based on Asian or International standards. Expert 1 said
the current MyFCD that is being used currently in Malaysia is dated back in 1997. He
agrees that the food database needs to be updated as there are many food recipes are
being invented in the market and restaurant, especially on hipster food as the people
nowadays call.
Information Quality Requirements for a Nutrition App
555
4.3 Information Quality Requirements
All the experts agree that accuracy, completeness, timeliness and reliability are among
the important dimensions that indicate the quality of information in nutrition app. Table
4 depicts the definition of each dimension with regard to the information that should
be in a nutrition app. These four dimensions are also among the existing issues that
contribute to the poor information quality as found in the literature.
Table 4. Information quality requirements for nutrition app.
Dimension
Description
Reliability
• Reliability of nutrition and dietary guidelines for the local population. For
example, MyFCD
• Reliability of the food database, food diary, its servings and nutrition facts
• Reliability of the references and sources originality
• Reliability of authority to the nutrition app. For example, Ministry of Health
Accuracy
• Accuracy of the nutrition information
• Accuracy of the provided information coming from valid references or
sources
• Accuracy of the BMI, ideal weight range index and calorie intake
calculations
• Accuracy of the user feedback in the app
Completeness • Complete records of food composition data and nutrition facts provided in
the app
• Complete records of food servings, calorie intakes, weight by the app user
for BMI calculation
• Complete information on frequently asked questions (FAQs) in the app for
the users
Timeliness
•
•
•
•
Update frequency of the nutrition information
Timeliness of the information provided
Timeliness for the food composition database and its nutrition facts
Timeliness of users provided information and feedbacks
In terms of authorship and reputation, all experts agree that the information in nutrition app must be trustworthy and reliable. As Nutritionist 4 mentioned “..user will trust
the information as long as the nutritionist able to give the correct information and can
validate that the information comes from reliable reference..”. Nutritionist 3 also agreed
that reliability is an important criterion for a nutrition app as according to him, “..the
issues that we have found with many app, less than 50% of the apps, the data and
information they have are not really reliable..”
As for accuracy, the information is considered true and free from errors with respect
to valid and reliable sources. Nutritionist 3 mentioned “Accuracy of the content must go
into proper procedure…we have to go into validation with nutritionist expert as well as
the users…”.
The completeness of the input records by the nutritionists and the app users in the
nutrition app are perceived importance as Nutritionist 4 mentioned “..the information
556
S. A. Mohammed et al.
from the app should cater on user needs including food portions and calorie intake
that can manage the eating habit of the user”. On the other hand, Nutritionist 3 said
completeness of information also include the frequent question and answer feature so
that expert can always add new information in order to make it complete and available
to the users. “..there should be something like Q&A in which user can ask whatever
information that are not there (in the app)..” as mentioned by Nutritionist 3.
In term of timeliness, the nutrition app’s information must constantly be up to date
for the users and must be based on the most recent evidence. Nutritionist 3 mentioned
that even the data used by Malaysia nutritionists is from MyFCD, which is last updated
in 1997, the information are still valid. It is the responsibility of the nutritionist to make
sure the information is always recent and to answer the user feedback and queries with
the latest information.
5 Discussion
This research is conducted to investigate the information quality requirements for a
nutrition app. Identifying the quality requirement at the early stages of development is
crucial to ensure high quality information in the app. This research found that inaccurate
and untrustworthy content such as unavailable references and authorship can make the
user misunderstand [19] as well as complicating their decision making options to manage
their health [20]. Other than that, the findings shows that information quality can be
achieved when all the stakeholders - nutritionist, app developer and app end-user are
aware of their responsibility in providing the correct and complete input into the app.
Information quality is important and need to be defined in the early phase of system/app
development to avoid rework. The app has to be designed in such a way it fits the usage
of various stakeholders, otherwise becomes useless or lack of use.
6 Conclusion
This research presents the information quality requirements by analysis of experts’ opinions on the meaning of reliability, accuracy, completeness and timeliness for developing
a nutrition app. Lack of study has been focusing on identifying the quality requirements
at the beginning of system or app development, which becomes the motivation for conducting this research. The overall results show that in order to determine the quality
requirements, stakeholders and their roles will also determine the quality of the information. All the experts agree that reliability, accuracy, timeliness and completeness are
important in order to have quality information in nutrition app. Our future research is to
develop a nutrition app that is based on the information quality requirements from this
study.
Acknowledgments. We would like to express gratitude to the Ministry of Higher Education
Malaysia to fund this project under Fundamental Research Grant Scheme (FRGS19–075-0683)
and to our university, International Islamic University Malaysia (IIUM) for the invaluable support.
Information Quality Requirements for a Nutrition App
557
References
1. Zarnowiecki, D., et al.: A systematic evaluation of digital nutrition promotion websites and
apps for supporting parents to influence children’s nutrition. Int. J. Behav. Nutr. Phys. Activ.
17(1), 1-19 (2020)
2. Adamski, M., Truby, H., M Klassen, K., Cowan, S., Gibson, S.: Using the internet: Nutrition
information-seeking behaviours of lay people enrolled in a massive online nutrition course.
Nutrients. 12(3), 750 (2020)
3. Ahmad, N., Rahman, A.B., Jasman, N., Zaman Salleh, K., Harun, S.,N.F., Krishnan, M.:
Usage of internet for health information seeking among elderly in Malaysia. EPRA Int. J.
Multidiscipl. Res. (IJMR) 6(5), 187–193 (2020)
4. Tosi, M., et al.: Accuracy of applications to monitor food intake: Evaluation by comparison
with 3-d food diary. Nutrition. 84, 111018 (2021)
5. Ferrara, G., Kim, J., Lin, S., Hua, J., Seto, E.: A focused review of smartphone diet-tracking
apps: usability, functionality, coherence with behavior change theory, and comparative validity
of nutrient intake and energy estimates. JMIR mHealth uHealth. 7(5), e9232 (2019)
6. Holzmann, S.L., Proll, K., Hauner, H., Holzapfel, C.: Nutrition apps: Quality and limitations.
an explorative investigation on the basis of selected apps. Ernaehrungs Umsch. 64, 80–9
(2017)
7. Gabrielli, S., et al.: Design of a mobile app for nutrition education (TreC-LifeStyle) and
formative evaluation with families of overweight children. JMIR mHealth uHealth 5(4), e7080
(2017)
8. Wang, R.Y., Strong, D.M.: Beyond accuracy: What data quality means to data consumers. J.
Manag. Inf. Syst. 12(4), 5–33 (1996)
9. English, L.P.: Information Quality Applied: Best Practices for Improving Business Information, Processes and Systems. Wiley Publishing (2009)
10. Liaw, S.T., et al.: Quality assessment of real-world data repositories across the data life cycle:
a literature review. J. Am. Med. Inform. Assoc. 28(7), 1591–1599 (2021)
11. Boyer, C., et al.: Health on the net’s 20 years of transparent and reliable health information.
In: Exploring Complexity in Health: An Interdisciplinary Systems Approach, pp. 700–704.
IOS Press (2016)
12. Daraz, L., et al.: Can patients trust online health information? a meta-narrative systematic
review addressing the quality of health information on the internet. J. Gen. Intern. Med.
34(9), 1884–1891 (2019)
13. Health on the Net foundation, HONcode, Health on the Net Foundation. http://www.hon.ch/
HONcode. Accessed 28 Sept 2021
14. Braz, V.N., de Moraes Lopes, M.H.: Evaluation of mobile applications related to nutrition.
Public Health Nutr. 22(7), 1209–1214 (2019)
15. DiFilippo, K.N., Huang, W.H., Chapman-Novakofski, K.M.: Mobile apps for the dietary
approaches to stop hypertension (DASH): app quality evaluation. J. Nutr. Educ. Behav. 50(6),
620–625 (2018)
16. Schumer, H., Amadi, C., Joshi, A.: Evaluating the dietary and nutritional apps in the google
play store. Healthc. Inform. Res. 24(1), 38–45 (2018)
17. Ya’u, B.I., Nordin, A., Salleh, N.: Analysis of expert’s opinion on requirements patterns for
software product families framework using GQM method. In: Alfred, R., Lim, Y., Haviluddin,
H., On, C.K. (eds.) Computational Science and Technology. LNEE, vol. 603, pp. 135–144.
Springer, Singapore (2020). https://doi.org/10.1007/978-981-15-0058-9_14
18. Patton, M.Q.: Qualitative Research & Evaluation Methods: Integrating Theory and Practice.
Sage Publications (2014)
558
S. A. Mohammed et al.
19. Wong, D.K., Cheung, M.K.: Online health information seeking and ehealth literacy among
patients attending a primary care clinic in Hong Kong: a cross-sectional survey. J. Med.
Internet Res. 21(3), e10831 (2019)
20. Xiao, Y., et al.: Challenges in data quality: the influence of data quality assessments on
data availability and completeness in a voluntary medical male circumcision programme in
Zimbabwe. BMJ open. 7(1), e013562 (2017)
Design of Test Data Generation Method
for Dynamic- Functional Testing in Automatic
Programming Assessment Using Flower
Pollination Algorithm
Nurhidayah Mokhtar1(B) , Rohaida Romli1 , Rusnida Romli2 , Alawiyah Abd Wahab1 ,
and Nooraini Yusoff3
1 School of Computing, Universiti Utara Malaysia, Kedah, Malaysia
kroerysher2@gmail.com, {aida,alawiyah}@uum.edu.my
2 Faculty of Electronic Engineering Technology, Universiti Malaysia
Perlis (UniMAP), Perlis, Malaysia
rusnida@unimap.edu.my
3 Institute For Artificial Intelligence and Big Data (AIBIG), Universiti Malaysia Kelantan
(UMK), Kota Bharu, Kelantan, Malaysia
nooraini.y@umk.edu.my
Abstract. Automatic Programming Assessment (APA) is one of the vital methods
that has been applied around Computer Science education in realizing automated
marking and grading on students’ programming exercises or assignments. APA is
fundamentally relying upon a test data generation process to perform a dynamic
testing. Recently in Software Testing (ST) research, it has been proven that the
adoption of any Meta-Heuristic Search Techniques (MHSTs) is able to improve
the efficiency of generating adequate and optimal test data. Unfortunately, current
studies on APA have not yet usefully incorporated the techniques to include a better
quality program testing coverage by considering the optimal size of generated test
data. Thus, our study propose a method of generating and locating an adequate test
data with optimal in size by adapting a MHST to satisfy the dynamic-functional
testing in APA (or is called DyFunFPA-TDG method). In this paper, we merely
focus on revealing the design of the method with a sample of the generated test
cases to be used in APA. This method able to assist educators of elementary programming courses to provide the means of deriving and generating adequate test
data with optimal in size regardless of having the expertise in specific knowledge
of test cases design.
Keywords: Automatic programming assessment · Test data generation ·
Dynamic testing · Flower pollination algorithm
1 Introduction
Practically, learning programming has become a common challenge among students of
Computing related disciplines particularly when they are at the basic level of programming efficiency. As acquiring certain extend of programming skills towards the end of
© The Author(s), under exclusive license to Springer Nature Switzerland AG 2022
F. Saeed et al. (Eds.): IRICT 2021, LNDECT 127, pp. 559–570, 2022.
https://doi.org/10.1007/978-3-030-98741-1_46
560
N. Mokhtar et al.
learning process is vital, hence the students need to be provided with lots of programming exercises and assignments to allow them getting familiar and consistently practice
the programming concepts and principles accordingly. Programming skills are usually
evaluated by practical programming tasks which are typically either based on homework assignments or laboratory hands-on [1]. Unfortunately, this circumstance causes
burdensome to the educators when dealing with programming exercises’ assessment
and evaluation manually. Also, manual way of assessing these exercises through hardcopies and softcopies has been deemed as costly, inflexible and time-consuming [2].
Thus, Automatic Programming Assessment (or APA) has been identified as a method
to overcome this challenge so as to improve the accuracy, consistency, and efficiency of
assessing the programming assignments [3]. There have been several APA tools were
developed such as Assyst [4], BOSS [5], TRAKLA2 [6], CourseMaster [7], SAC [8]
and Bottlenose [9] to realize APA and particularly in assisting educators.
The fundamental concept of programming assessments is related to Software Testing
(ST) [4, 10]. Static analysis and dynamic testing have been acknowledged as the main
testing techniques or strategies that are typically implemented in ST. The dynamic testing
needs a tested program to be executed against a set of inputs or test data. Test data
generation is one of the processes of identifying a set of test data which satisfies a given
testing criterion [11]. Process of preparing high quality test data manually is commonly
known as a hard, time consuming, and impractical task in practice [12]. Thus, as resolving
these difficulties, Automated Test Data Generation (ATDG) has become desirable and
vital among researchers for decades [13].
Nowadays, Meta-Heuristic Search Techniques (or MHSTs) have been demonstrated
to be the significant techniques to resolve ATDG issues [14]. The techniques able to
explore the search area efficiently and find the best solution for any particular problem
[14]. One of the new optimization algorithms for solving global problem optimization
is the Flower Pollination Algorithm (FPA) [16]. Due to the reduced parameter required
to solve the tuning parameter problem, FPA is easy to implement compared to other
algorithms [15]. Thus far, studies as proposed by [16] have proven FPA can be successfully applied in supporting efficient ATDG in ST field. There is a significant gap in the
use of ATDG and MHST in APA, especially for functional testing. Thus far, merely a
study conducted by [17] attempted to integrate ATDG and MHST in APA (see Sect. 2).
Therefore, our study proposes a method for generating test data to produce and locate a
suitable collection of test data with an optimum size that satisfies the dynamic-functional
testing in APA that is called DyFunFPA-TDG method. In this paper, the focus is on the
design of test cases for the method with a relevant sample of programming exercises.
The content of the remaining sections is organized as follows: Sect. 2 provides a brief
discussion on some related works. Section 3 details out the design of DyFunFPA-TDG
method. Section 4 briefly depicts the realization of the DyFunFPA-TDG method as a test
cases design based on a sample of programming exercise, and finally, Sect. 5 concludes
the paper.
2 Related Work
In a software development cycle (in terms of time and cost), Software Testing (ST)
is vital and considered as an expensive phase. Practically, in this phase, the process of
Design of Test Data Generation Method for Dynamic- Functional Testing
561
generation of test data is commonly known as one of the main issues. Test data generation
is one of the processes of identifying a set of test data which satisfies a given testing
criterion [11]. Also, it is one of the difficult tasks in ST and can be very burdensome and
effortful process [18]. Thus, as an alternative, Automated Test Data Generation (ATDG)
has become crucial and attentive among researchers for decades [13].
To date, in current literatures, a lot of studies proposed approaches for automating
the process of test data generation [13] to furnish the better means of generating adequate test data. Also, in ST field, Meta-Heuristic Search Techniques (MHST) have been
empirically proven as the technique that able to derive and generate adequate and optimal test data. Among the most common MHSTs used in test data generations include
Simulated Annealing (SA), Gradient Descent, Taboo Search (TS), Ant Colony Optimization (ACO) and Evolutionary Algorithms such as Genetic Algorithm (GA) [19].
The techniques were broadly applied to resolve the test data generation problems due
to the fact that the techniques can be formulated as an optimization [20]. Latest study
by Nasser et al. [21] found out that Flower pollination algorithm (FPA) has promising
result to be implemented in ATDG.
The integration of MHST into APA only began in 2014 [17] and the focused merely
on structural testing. In this study, a Particle Swarm Optimization (PSO) algorithm
was utilized to automatically generate test cases and then being applied for Online
Programming Assessment or Judge (UOJ) system. The focus is not concerned with
ATDG but more on test cases generation only. Based on this finding, it can be deduced
that utilizing MHST to support testing in APA is still at its early stages, and to the
very best of our knowledge, none of the studies attempted to utilize the technique as
to support more efficient ATDG in APA. Realizing the benefits of FPA and supported
by a signification impact of utilizing MHST in ATDG, hence, there is massive room of
research to show up to look upon resolving the existing gaps of ATDG in APA.
3 Methodology
This study was carried out by following the research procedures as shown in Table 1.
562
N. Mokhtar et al.
Table 1. Research procedures
Phase
Activity
Method
Theoretical study
• Study related terminology
• Literature survey
and concepts involved in the
research
• Searching for related issues
• Investigation of earlier works
related to APA, ATDG, an
integration of APA and
ATDG, MHSTs utilization
on ATDG and ATDG in APA
• Explore possible solution by
utilizing Flower Pollination
Algorithm (FPA) in
supporting ATDG in APA
Construction of the
DyFunFPA-TDG method
• Construct criteria of test data • Positive and negative testing
and test set schema
criteria for functional testing
• Mapping and integrating
+ FPA
FPA and the identified test
• Algorithm of
data and test set schema
DyFunFPA-TDG method
• Design DyFunFPA-TDG
method
Test data generator
Implementation and Testing
• Develop a test data generator • Prototyping
(a prototype) to realize
• Unit testing (Black-box
DyFunFPA-TDG method
testing)
• Testing the prototype
Evaluation and conclusion
• Evaluating the prototype
• Analysis of results and
discussion
• Controlled experiment [one
group pre-test and post-test
design] – completeness of
test data adequacy
4 Design of DyFunFPA-TDG Method
This study is an extension of the study proposed by Romli [13]. FPA has been utilized
to select the optimal number of test cases and test data that are adequate for executing functional testing in APA. The following sub-sections details out the design of
DyFunFPA-TDG method.
4.1 Criteria of Deriving Test Set
A test set (that is test cases with test data) are derived by integrating the specificationderived test and boundary value analysis techniques, as proposed by Romli [13]. Based
on the study, test case design depends on integration of test specification and boundary
value analysis techniques with the combination of positive and negative test criteria.
Table 2 shows the means of deriving test data as proposed by Romli [13]. Meanwhile,
Design of Test Data Generation Method for Dynamic- Functional Testing
563
Fig. 1 shows the criteria of input conditions (or input space) that has been embedded in
DyFunFPA-TDG method.
As shown in Table 3, each input condition is given certain weightage so that it will be
used as an additional criterion in choosing pollens with best fitness in FPA. The higher
the weight value indicating that the more critical is the test case and test data to be
selected as among the most optimal test set by FPA.
Table 2. The division of input conditions with their respective category of data type value and
type of data [13].
4.2 Flower Pollination Algorithm
Yang [22] proposed the Flower Pollination Algorithm (FPA) as a new heuristic algorithm
in 2012. The FPA can solve multi-objective optimization, high-dimensional function
564
N. Mokhtar et al.
Fig. 1. Criteria of input conditions [13]
Table 3. The division of input conditions with their respective weight values.
Input Condition
Weight value
Valid input conditions - V (Vb , Vulb , Vulb-left , Vulb-right , Vb-Range1 , Vb-Range2 ) 5
Invalid input conditions - IV (IVb , IVulb , IVulb-Range1 , IVulb-Range2 , IVulb-left , 4
IVulb-right )
Illegal input conditions - L
1
optimization, and engineering optimization thanks to its good searching capability, fewer
parameters, and simple structure [23]. Even though the pollination algorithm was only
proposed for a brief period, it quickly became a common research subject. Figure 2
shows the original version of FPA. In this study, the existing FPA has been modified by
adding additional process of selecting best fitness. Best fitness has been chosen based
on the weightage criteria as depicted in Table 2. Thus, the optimal number of adequate
test set can be chosen from the test set that are initially derived based on the test set and
weighted scoring criteria as shown in Fig. 1 and Table 3.
4.3 Flower Pollination Algorithm (FPA) in DyFunFPA-TDG
Figure 2 depicts the flow of the original FPA procedure. Meanwhile, Fig. 3 depicts the
modified FPA used in the DyFunFPA-TDG technique. The original FPA has been modified in certain ways. The first change is made during the initialization of a population,
where a weightage scoring criterion is assigned to each pollen. The second change occurs
in the second step, when the best pair of pollens is added to a collection of test cases
(TC). The third modification occurs during the computation of the objective function of
a new solution, which occurs after local or global pollination is completed. Weightage
is added to the evaluation throughout this procedure, which acts as a new criterion for
picking the pollen with the best fitness. The last modification is the inspection of each
pollen to determine the score of each input condition. The greater the weight value, the
more important it is for the test case and test data to be selected as part of FPA’s most
optimal test set.
Design of Test Data Generation Method for Dynamic- Functional Testing
Fig. 2. Flow processes of original FPA [23]
565
566
N. Mokhtar et al.
Fig. 3. Modified FPA used in DyFunFPA-TDG method
Design of Test Data Generation Method for Dynamic- Functional Testing
567
5 DyFunFPA-TDG Method by Example
In this paper, we include one example of programming exercise to illustrate and provide a clearer understanding of how DyFunFPA-TDG method is mapped to APA. The
programming exercise is categorized as Numeric Global (refer Table 1) with three input
variables and having a selection control structure. Figure 4 depicts the example of programming exercise with its specifications. The generated test set with test data for the
given sample programming exercise is tabulated in Table 4.
Fig. 4. Sample programming exercise and its specifications for numeric global-three input
variables–selection
Initially, as the programming exercise consists of three input variables (num1, num2,
and num3), then the total number of test cases produced is sixty-four (64). This result is
based on as proposed by Romli [13]. For the Numeric Global category with three input
variables, in involves four input conditions which are Vb, Vulb-left, Vulb-right and IL
(see Table 1). The DyFunFPA-TDG method reduces the amount of test cases initially
created by Romli [13]. Table 4 shows the generated schema of test set as produced
by DyFunFPA-TDG method. The produced test set is reduced by around 56.25% as
compared to test set generated by the previous method. The DyFunFPA-TDG method
trains all the test cases and picks the best optimal test data, resulting 28 test cases. As
mentioned in Table 3, each input condition is assigned with certain weightage value as
an extra criterion in choosing the pollen with best fitness in FPA. The higher the weight
value indicates the more critical is the test data. Most critical test data will be having
higher tendency to be selected as the most optimal test set by DyFunFPA-TDG. Thus,
unfit test data will be omitted from the test set selection.
568
N. Mokhtar et al.
Table 4. Generated schema of test set by DyFunFPA-TDG for the sample programming exercise
in Fig. 4.
Design of Test Data Generation Method for Dynamic- Functional Testing
569
6 Conclusion
This paper has highlighted the design of our proposed work namely DyFunFPA-TDG
method. The proposed method has improved the current work as proposed by Romli [13]
on the part of selecting the optimal number of test set such that there is a certain extend
of test set reduction from the initial generated test set. The proposed DyFunFPA-TDG
method is able assist lecturers or educators of programming course to derive and generate
adequate set of test data with optimal in its size and without the need to master on certain
specific test cases design. Having this method as a part of APA tool will significantly
reduce lecturers time and effort related to assessing students’ programming exercises or
assignments as well as providing students with timely feedbacks on their programming
assignments.
Acknowledgement. This research was supported by Ministry of Higher Education (MoHE) of
Malaysia through Fundamental Research Grant Scheme (FRGS/1/2017/ICT01/UUM/03/1).
References
1. Ala-Mutka, K.M.: A survey of automated assessment approaches for programming assignments. Comput. Sci. Educ. 15(2), 83–102 (2005). https://doi.org/10.1080/089934005001
50747
2. Yusof, N., Zin, N.A.M., Adnan, N.S.: Java programming assessment tool for assignment
module in moodle e-learning system. Procedia - Soc. Behav. Sci. 56, 767–773 (2012). https://
doi.org/10.1016/j.sbspro.2012.09.714
3. Blumenstein, M., Green, S., Nguyen, A., Muthukkumarasamy, V.: GAME: a generic automated marking environment for programming assessment. Int. Conf. Inf. Technol. Coding
Comput. ITCC 1(May), 212–216 (2004). https://doi.org/10.1109/ITCC.2004.1286454
4. Jackson, D., Usher, M.: Grading student programs using ASSYST. ACM SIGCSE Bull. 29(1),
335–339 (1997). https://doi.org/10.1145/268085.268210
5. Luck, M., Joy, M.: A secure on-line submission system. Softw. - Pract. Exp. 29(8), 721–740
(1999)
6. Arivazhagan, S., Nidhyanandhan, S.S., Shebiah, R.N.: Texture categorization using statistical
and spectral features. In: Proceedings of 2008 International Conference Computing Communication Networking, ICCCN 2008, vol. 3, no. 2, pp. 267–288 (2008). https://doi.org/10.1109/
ICCCNET.2008.4787722
7. Motivation et al., Automated Assessment and Experiences of Teaching Programming COLIN
A. HIGGINS, GEOFFREY GRAY, PAVLOS SYMEONIDIS, ATHANASIOS TSINTSIFAS
The University of Nottingham, Nottingham, UK Thi, vol. 5, no. 3, pp. 1–21, (2005). https://
doi.org/10.1145/1163405.1163410
8. Auffarth, B., Lopez-Sanchez, M., Campos i Miralles, J., Puig, A.: System for Automated
Assistance in Correction of Programming Exercises (SAC), Congr. Univ. Teach. Innov.,
pp. 104–113 (2008)
9. Sherman, M., Bassil, S., Lipman, D., Tuck, N., Martin, F.: Impact of auto-grading on an
introductory computing course. J. Comput. Sci. Coll. 28(6), 69–75 (2013)
10. Rajamanickam, L., Saat, N.A.B.M., Daud, S.N.B.: Software testing: the generation tools.
Int. J. Adv. Trends Comput. Sci. Eng. 8(2), 231–234 (2019). https://doi.org/10.30534/ijatcse/
2019/20822019
570
N. Mokhtar et al.
11. Korel, B.: Automated software test data generation. IEEE Trans. Softw. Eng. 16(8), 870–879
(1990). https://doi.org/10.1109/32.57624
12. Monpratarnchai, S., Fujiwara, S., Katayama, A., Uehara, T.: Automated testing for java programs using JPF-based test case generation. ACM SIGSOFT Softw. Eng. Notes 39(1), 1–5,
(2014). https://doi.org/10.1145/2557833.2560575
13. Romli, R.: Test data generation framework for Automatic Programming Assessment, PHD
Thesis (2014)
14. Bin, L.: Automatic test data generation tool based on genetic simulated annealing algorithm.
In: 2007 International Conference on Computational Intelligence and Security Workshops
(CISW 2007), pp. 183–186 (2007)
15. Mejia, J., Muñoz, M., Feliu, T.S.: Test cases minimization strategy based on flower pollination
algorithm. RISTI - Rev. Iber. Sist. e Tecnol. Inf. 26, ix–xiii (2018). https://doi.org/10.4304/
risti.35.0
16. Nasser, A.B., Zamli, K.Z., Alsewari, A.A., Ahmed, B.S.: Hybrid flower pollination algorithm
strategies for t-way test suite generation, pp. 1–24 (2018)
17. Foong, O., Tran, Q., Yong, S., Rais, H.: Swarm inspired test case generation for online C ++
programming assessment, pp. 2–6
18. Tahbildar, H., Kalita, B.: Automated software test data generation: direction of research.pdf.
Int. J. Comput. Sci. Eng. Surv. 2(1), 99–120 (2011)
19. Romli, R., Sulaiman, S., Zamli, K.Z.: Test data generation framework for automatic programming assessment. In: 2014 8th Malaysian Software Engineering Conference MySEC 2014,
vol. 110, no. 1, pp. 84–89 (2014). https://doi.org/10.1109/MySec.2014.6985993
20. Mcminn, P., Street, P., Holcombe, M.: Evolutionary testing using an extended chaining
approach. Evol. Comput. 14(1), 41–64 (2006)
21. Nasser, A.B., Sariera, Y.A., Alsewari, A.A., Zamli, K.Z.:Assessing optimization based strategies for t-way test suite generation : the case for flower-based strategy. In: 2015 IEEE international conference on control system, computing and engineering (ICCSCE), pp. 27–29,
(2015)
22. Yang, X.S.: Metaheuristic algorithms for self-organizing systems: a tutorial. In: International
Conference on Self-Adaptive and Self-Organizing Systems SASO, vol. 40, no. 3, pp. 249–250
(2012). https://doi.org/10.1109/SASO.2012.40
23. Yang, X.: Nature-Inspired Algorithms, pp. 297–323 (2018)
A Comparative Evaluation on Methods
of Teaching Computer Programming
Asmalinda Adnan and Rohaida Romli(B)
School of Computing, Universiti Utara Malaysia, Sintok, Kedah, Malaysia
aida@uum.edu.my
Abstract. Learning programming is typically regarded as a challenging task by
both educators and learners. The face-to-face learning method alone is likely insufficient to promote effective teaching and learning solutions. Thus, having a suitable teaching method can be useful in various situations and encourages learners
to actively and effectively participate in programming classes. Likewise, having
appropriate formation of different programming learning methods and environments to influence learners’ computational thinking is something significant. As
such, this paper presents an analysis and comparison of the related works on any
promising methods that are able promote a better and efficient way of learning
programming. In the meantime, it suggests any possible direction for future work
by conducting a comparative evaluation. As far as this study is concerned, several
methods of teaching programming such as visualization, game-based, robotics,
problem-solving, code tracing, simulation and pair programming have been analyzed and compared. Results of this study indicated that visualization and gamebased method are the most effective formation methods. Using visualization and
games-based methods in teaching programming can help to enhance learners’
programming concepts in terms of enhancing the learners’ cognitive ability to
develop a mental model, increase their engagement and stimulate their abstract
thinking in cognitive development.
Keywords: Teaching and learning programming · Visualization · Code tracing ·
Game-based · Robotic · Problem-based · Simulation and pair programming
1 Background
Programming concepts, syntax, and logic-building processes are commonly tough and
difficult tasks for most novice learners to grasp. The key issue is to encourage learners to build meaningful programs in a short number of times by emphasizing computational thinking and problem-solving skills [1]. As compared to traditional lecture approaches, most learners prefer to be involved and to discover material through
discovery, involvement, and fun [2].
Teaching programming is commonly known as a demanding task that has its own
set of challenges [3]. In that sense, educators must master the subject of teaching, which
is the process of converting knowledge into understandable knowledge for learners by
© The Author(s), under exclusive license to Springer Nature Switzerland AG 2022
F. Saeed et al. (Eds.): IRICT 2021, LNDECT 127, pp. 571–582, 2022.
https://doi.org/10.1007/978-3-030-98741-1_47
572
A. Adnan and R. Romli
using correct teaching methods. Meanwhile, teaching method is a systematic overall
plan to deliver instruction that is influenced by the nature of the learners’ language [4].
In the context of the programming subject teaching method, a study by Costelloe [5]
has shown that the problem-solving teaching method is used as a teaching method for
programming subjects. To ensure more effective teaching and programming learning to
improve students’ achievement and computational thinking levels, the problem-solving
method should be accompanied by a suitable teaching method. These methods are visualization, game-based, robotic tool application, simulation, code-tracing, problem-solving
and pair programming. Accordingly, the comparative evaluation in this paper aims to
promote appropriate formation teaching methods with a successful implementation that
can be applied in teaching and learning computer programming.
This paper focuses on a comparative evaluation that has been done to analyse and
compare the existing teaching methods of computer programming course to address the
mentioned issues and by then suggesting any possible effective teaching methods that are
able to promote better programming teaching methods understanding. The content of this
article is structured as follows: Sect. 2 briefly addresses some fundamental concepts of
teaching programming methods with regard to visualization, game-based, code tracing,
robotic, problem-based, simulation and pair programming; Sect. 3 provides a detailed
discussion of the methodology used in this study; Sect. 4 reveals the analysis and results
of the conducted comparative evaluation and Sect. 5 concludes this paper and provides
suggestion for future research direction.
2 Methods of Teaching Programming and Its Fundamental
Concepts
Previous researchers [6] have conducted studies to review programming teaching methods. However, in terms of comparative methods, there is a study by Kanika [7] covers
five methods which are visual programming, game-based learning, pair and collaborative programming, robot programming, and assessment system, while the focus is only
on the advantages and challenge parameters. Meanwhile, this paper extends the comparison in terms of the teaching programming methods based on the current literature
review as well as the parameter of the evaluation. There are three additional methods
presented in this paper which are simulation, code tracing, and problem-solving. The
other three added parameters such as the teaching approach, the method applied as a
digital application, and effectiveness have been reviewed to comprehend the existing
study.
Recently, the theme of programming teaching has becomes an emphasis to
researchers and educators because it is among the difficult subjects to teach in any
computing discipline program [8]. In addition, the teaching method chosen to teach programming should be able to maintain learners’ motivation and engagement [9]. These
teaching methods will be discussed further in the subsequent sections.
2.1 Visualization
Yehezkel [10] asserted that visuals have the potential to enhance the cognitive ability to
develop a mental model if exploited effectively in a conducive learning environment. The
A Comparative Evaluation on Methods of Teaching Computer
573
use of visual software aims to facilitate the process of demonstration of basic concepts
to facilitate learners to generate ideas and make hypotheses in teaching that are not
feasible by traditional methods [11]. This method helps these learners to strengthen
computational thinking [12], and problem-solving skills [13], make things easy to correct
errors [14], stimulate learners engagement with illustrations [15], reduce the involvement
of technical skills [16], is user-friendly and accessible at all times using mobile devices
[17], bridge the learner’s grade gap [18], support distance learning [19], be able to
demonstrate real situations [20] and they are mostly syntactic-error free [21]. A study
[22] stated that the main platforms of visual tools are web and mobile devices.
2.2 Game-Based Learning
Game-Based Learning (GBL) in education is known as one of the branches of Serious
Game (SG) [23]. SG is a video (visual) game in which the main purpose is not for
entertainment but is used to convey teaching objectives in line with the curriculum
guidelines [24]. In addition, the basic principles of gamification design include: the
principle of learners engagement; the principle of freedom of choice; the principle of
freedom to fail, and the need to provide quick feedback [25]. SG is generally able
to increase learners’ engagement [26], stimulate their abstract thinking in cognitive
development, turn and develop their high-level thinking skills [27]. Although this method
has shown a positive effect on educational institutions, SG is still not widely used in the
classroom [28]. This is due to the lack of involvement of educators and field experts to
prove the benefits of its use and necessity in the development of SG applications [29].
2.3 Robotics
In terms of a robotic method, it allows learners to write programs to control robots in
performing simple tasks in real-time and be able to promote active learning as well as
opening some space for constructive learning [30]. In particular, this method empowers
collaborative work, increase motivation and promote cognitive development by supporting the learners’ knowledge construction. However, its application in the classroom is
not an easy task and must be accompanied by appropriate methods for effective learning
[31]. Among the concepts of programming applied using this robot are the sequential
execution of statements, conditional statements, iterative statements [32], and algorithms
[33].
2.4 Problem-Solving
Boud and Feletti [34] defined problem-solving-based teaching as; “A way of constructing
and teaching courses using problems as the stimulus and focus for learners activity”. The
statement is also supported by Hsu, Chang, and Hung [35] who stressed that problemsolving learning supports learners in building new knowledge through problem-solving
concepts. In this method, learners gain experience with mind creation, speaking, writing, and learning independently, expressing their ideas by creating simulation models
[36] and learning collaboratively [37]. Problem-solving learning is not only used to
solve problems but also to enhance learners’ understanding of new knowledge through
appropriate questions [38].
574
A. Adnan and R. Romli
2.5 Simulation
Simulation is the use of visual technology that can facilitate learners to learn the learning
content that is abstract and very difficult to understand [39]. It is also suitable for use
in experimental learning and discovery methods [40]. There are various educational
benefits of using simulation in engineering and computing [41], interactively [42]. This
learning has successfully demonstrated a strong relationship between the dimensions
of behavior, emotional cognitive, learners engagement, and help in shaping learning
experiences that span various areas of teaching [43]. Yet, researchers have suggested
the prospect of a simpler intuitive control design for ease of operating mobile devices
without the need for high technical knowledge. However, aspects that focus on individual
relationships (user-study) such as the implications of the role of instructors and the role
of learners’ peers are still poorly studied.
2.6 Code Tracing
Code tracing and code writing are two processes to trace values in memory alignment for
all variables to understand the programme manually and to compare the actual results of
the programme [44]. Nelson [18] stated that mastering programming code detection is to
understand the set of all mappings among syntax, semantics and code compilation. Once
students develop a semantic reading understanding, they can trace the code, determine
situations and ascertain the output in the middle and at the end. This is in line with the
teaching theory to build on programming skills highlighted by [45]. The theory outlines
code tracing as an important skill in programming that needs to be mastered in addition
to writing the right syntax and applying it to solve problems. Pinter [46] said students
would not be able to write code if they did not learn to trace code first. This is because
students who are skilled in code tracing skills will have more potential to write code
correctly.
2.7 Pair Programming
The programming teaching and learning in pair programming/peer programming/peer
sharing or “pairgogy” encompasses a variety of learning modes supported by digital
resources. The statement was supported by [47] who stated that pair-based techniques
include face-to-face mode in computer labs and online. Pair programming is also defined
as a programming activity in which two individuals sit side-by-side, sharing one keyboard and a monitor [48]. There are two roles in pair programming, namely driver and
browser. The driver focuses on encoding while the browser actively observes the work
and proposes an appropriate code to the driver [49]. However, this role may change while
programming is carried out [50].
3 Methodology
In this paper, a comparative evaluation has been adopted as a method to guide the process of analysis and comparison to be done. The comparison is made for the purpose to
A Comparative Evaluation on Methods of Teaching Computer
575
comprehend the different teaching programming methods when implemented in teaching programming sessions. This comparative evaluation can be considered as a wellanalyzed picture to illustrate distinct programming teaching methods. The method used
in this study was introduced by Vartiainen [51] to explain the comparative evaluation
study. The following illustrates detailed explanations of each phase of the method.
3.1 A Theoretical Study
A theoretical study consists of the concepts of visualization, game-based, robotics,
problem-solving, code tracing, simulation and pair programming together with their
definition and existing theories that are used for a particular study [52]. Through the
theoretical study of the existing work, it helps to identify various teaching programming
methods that are used to teach programming as well as the advantages, disadvantages, and
effectiveness of review methods. The outcome of this theoretical study is the proposed
teaching programming methods to support teaching programming.
3.2 Comparative Evaluation
The comparative evaluation phase comprises of four main activities as follows:
i.
Selection of the object evaluation - The object evaluation identified is the teaching
methods used to teach programming. In this practice, the comparative evaluation
process has been focusing on the implementation of the teaching method on teaching
computer programming.
ii. Determine the level of comparison - The level of comparison involved the parameters for comparison inclusive of teaching approach that has been supported, applied
as a digital application, effectiveness of the method as well as the advantages and disadvantages of the considered methods. The evaluation is based on these parameter
points.
iii. Conceptual Comprehension - In this phase, the concepts used in analysis and comparison are determined by the fundamental concepts of each method of teaching
programming. The definition of the concept that applied in this study are utilized
during evaluation and when comparing the result of the analysis.
iv. Analysis of the findings of an evaluation - In this phase, the analysis and findings are
discussed in identifying any effective method (s) and then providing suggestions on
the possible direction of future work. On the other hand, the findings make it possible
to interpret the operative teaching methods throughout the concepts, definitions, and
theories.
3.3 Conclusion and Suggestion
This phase is in concern with reporting the findings obtained from the conducted comparative evaluation in consequence to suggest any applicable teaching programming methods that have promising insights to support teaching computer programming. Hence, by
completing this phase, the aim of this study has been achieved.
576
A. Adnan and R. Romli
4 Analysis and Result of Comparative Evaluation
This section discusses the analysis and result of comparative evaluation based on
reviewed teaching programming methods. There are seven (7) types of programming
teaching methods that have been identified. Table 1 below illustrates a list of comparative
analysis of the teaching programming methods.
Table 1. Comparative analysis of programming teaching methods.
Teaching
programming
methods
Parameters
Visualization
Collaborative, Yes
active
90% of
learners were
satisfied with
animation,
and 83% did
better
programming
than expected
using
animation
[53]
Strengthens
Provides poor
computational
debugging
thinking and
skills
problem-solving
skills; stimulates
engagement;
reduces
technical skill;
mostly free of
syntax error;
supports
distance
learning
Game-based
Collaborative, Yes
active
learning
Impact of pass
rate between
59.27% to
80.64% and
86% learners
preferred
games over
traditional
classes [53]
Supports the
cognitive
engagement and
active learners’
involvement
Not widely
[55]
used in the
classroom due
to the lack of
involvement of
educators and
field experts
Robotics
Collaborative, Yes
active
learning
Physical
robots and
robot
simulators
contribute to
learners
interest and
participation
in lessons [56]
Empowers
collaborative
work, increases
motivation;
promotes
cognitive
development
Specialized
[57]
learning
environment
settings requires
special
technical skills
and expensive
equipment and
continuous
power supply
Teaching
approach
Applied as Effectiveness
a digital
application
Advantages
Disadvantages
Source
[2]
(continued)
A Comparative Evaluation on Methods of Teaching Computer
577
Table 1. (continued)
Teaching
programming
methods
Parameters
Teaching
approach
Applied as Effectiveness
a digital
application
Advantages
Disadvantages
Source
Problem-solving Collaborative, Yes
active
learning,
scaffold
Increases
learners’
self-efficacy
in group
learning [58]
Supports
learners to build
new knowledge;
enhances critical
thinking,
analysis,
synthesis and
creative thinking
High-level
[17]
cognitive skills
give the impact
of heavy
cognitive load
Simulation
Collaborative, Yes
active
learning,
78.6%
effectiveness
of course
content and
76.84% of
course
outcomes
effectively
[59]
Suitable for
experimental
learning and
discovery
methods;
Hard to
[60],
construct a
suitable design
Pair
Programming
Collaborative, Yes
active
learning,
Students are
more likely to
complete
courses and
have higher
passing rates
[61]
Capable of
influencing
students’ ability
to learn a
programming
language
Limitation of
[62]
physical
encounters for
sharing the use
of tools and for
collaboration
Code tracing
Active
learning
69% of
students were
able to speed
up their
understanding
of tracking
algorithms
[63]
Skilled students
of code tracing
skills will have
more potential
to write code
correctly
Students need [21]
to practise over
and over again
Yes
Based on previous studies, the discussion of the strengths and weaknesses that are
illustrated in Table 1 is to determine among the most effective method(s) that can be
applied by educators of programming courses in improving their teaching method. Visualization, game-based, robotics, problem solving, code tracing and simulation are the
teaching methods that can be applied to produce digital-based applications like webbased systems or mobile apps. The digital learning environment allows full support to
contribute to the effectiveness of learning and teaching thus increasing student motivation. The digital application (online tool and mobile application) helps the students
understand, learn, revise, and practise coding, at their pace and convenience. However,
game-based and robotics techniques require learning environment settings that are not
578
A. Adnan and R. Romli
often designed for curriculum alignment. Likewise, robotics needs specialized learning environment settings to implement robotics technology in the classroom. Thus, it
requires special technical skills, expensive equipment, and a continuous power supply.
Nevertheless, visualization helps in establishing the user interface but the design needs
to focus on the concept of syntax and semantic.
In programming subject, [64] mentioned about the ability to solve a problem as the
main factor of programming success which involves cognitive function but it is built
based on behaviour. Furthermore, activities in pair programming also use cooperative
techniques such as brainstorming in problem-solving. Nevertheless, the disadvantage of
pair programming is the limitation of physical encounters for sharing the use of tools
and for collaboration [65]. Although this technique shapes active learning, increases
confidence and builds interest in solving problems, there is still less research on asynchronous online learning pair programming [66]. In addition, code tracing focuses on
performance and optimizes the process of coding.
Visualization, game-based, code tracing and simulation are programming teaching
methods that support collaborative and active learning approaches and have also commonly applied as digital applications. In comparison to other methods, the visualization method is able to increase learners’ computational thinking, stimulate engagement,
higher rate of learner’s satisfaction (90%), and also enhances active and collaborative
learning in their learning session. Meanwhile, game-based learning promotes cognitive
engagement and participation among learners and has become the most learners’ preferred method with 86% score. Contrarily, the simulation showed the difference between
the effectiveness of course content (78.6%) and course outcomes (76.84%). Therefore,
this method is recommended for educators to use in their learning sessions because of
its effectiveness as well as its ability to develop students’ computational thinking.
5 Conclusion
In this paper, a comparative evaluation was conducted to identify among the effective
teaching programming methods that can be applied by existing educators or instructors. An improvement to the comparative evaluation from the aspect of parameter is
shown in Table 1. In the comparative evaluation, there are five comparison parameters
recognized that include teaching approach; has been applied as a digital application or
not, effectiveness, advantages, and disadvantages of the teaching programming methods.
Isiaq and Jamil [43] stated that values of teaching and learning activities are reliant on
a meaningful learning environment and learners’ engagement.
Based on the conducted comparative evaluation, it can be concluded that visualization and game-based teaching methods are among the promising solutions to support
teaching and learning programming courses. The reason is that, game-based teaching
has a significant impact to encourage critical thinking [67]; helps in problem-solving;
increases student engagement and motivation [68] and offers a comfortable environment
to learn and collaborate with others. However, this method requires a specific focus on
the design requirements that underlie the curriculum requirements.
On the contrary, visualization provides a simplified learning process by visualizing
complex topics in a simpler form, helps to store longer information, and assists students
A Comparative Evaluation on Methods of Teaching Computer
579
to understand a program flow better. In this regard, it would be essential in future work
to explore any teaching programming approaches and techniques that have been applied
as digital applications as this will be able to resolve any issues related to remote and
online learning particularly during the Covid-19 pandemic.
References
1. Wing, J.M. Computational thinking. Commun. ACM 49(3), 33–35 (2006)
2. Rahman, M.M., Paudel, R.: Visual programming and interactive learning based dynamic
instructional approaches to teach an introductory programming course. In: IEEE Frontiers in
Education Conference (FIE), pp. 1–6 (2019)
3. Koulouri, T., Lauria, S., Macredie, R.D.: Teaching introductory programming: a quantitative
evaluation of different approaches. ACM Trans. Comput. Educ. 14(4), 1–28 (2014)
4. Anthony, E.M.: Approach, Methods and Technique (1965)
5. Costelloe, E.: Teaching Programming the State of the Art, Institute of Technology Tallaght
(2004)
6. Vihavainen, A., Airaksinen, J., Watson, C.: A systematic review of approaches for teaching introductory programming and their influence on success. In: 10th Annual International
Conference on International Computing Education Research, pp. 19–26 (2014)
7. Kanika, Chakraverty, S., Chakraborty, P.: Tools and techniques for teaching computer
programming: a review. J. Educ. Technol. Syst. 49(2), 170–198 (2020)
8. Apiola, M., Tedre, M.: New perspectives on the pedagogy of programming in a developing
country context. Comput. Sci. Educ. 22(3), 285–313 (2012)
9. Attard, L., Busuttil, L.: Teacher perspectives on introducing programming constructs through
coding mobile-based games to secondary school students. Inform. Educ. 19(4), 543–568
(2020)
10. Yehezkel, C.: A taxonomy of computer architecture visualizations. In: Proceedings Annual
SIGCSE Conference Innovation Technology Computer Science Education, pp. 101–105
(2002)
11. Hrabovskyi, Y., Brynza, N., Vilkhivska, O.: Development of information visualization
methods for use in multimedia applications. Phys. Eng. 1, 3–17 (2020)
12. Kyfonidis, C., Moumoutzis, N., Christodoulakis, S.: Block-C: a block-based programming
teaching tool to facilitate introductory C programming courses. In: IEEE Global Engineering
Education Conference, EDUCON (2017)
13. Hooshyar, D., Ahmad, R.B., Yousefi, M., Fathi, M., Horng, S.J., Lim, H.: SITS: A solutionbased intelligent tutoring system for students’ acquisition of problem-solving skills in
computer programming. Innov. Educ. Teach. Int. 55(3), 325–335 (2018)
14. Jawad, H.M.: Gamifying the code genie programming tool. In: IEEE International Conference
on Electro Information Technology, pp. 555–559 (2019)
15. Kölling, M.: The greenfoot programming environment. ACM Trans. Comput. Educ. 10(4),
1–21 (2010)
16. Lin, S., Kafura, D., Tech, V.: PDL : scaffolding problem solving in programming courses. In:
26th ACM Conference on Innovation and Technology in Computer Science Education V. 1
(ITiCSE 2021), June 26-July 1, 2021, Virtual Event, Germany (vol. 1, Issue 1). Association
for Computing Machinery (2021)
17. Mathew, R., Malik, S.I., Tawafak, R.M.: Teaching problem solving skills using an educational
game in a computer programming course. Inform. Educ. 18(2), 359—373 (2019)
18. Nelson, G.L., Xie, B., Ko, A.J.: Comprehension first: evaluating a novel pedagogy and tutoring
system for program tracing in CS1 (2017)
580
A. Adnan and R. Romli
19. Selwyn-smith, B., Anslow, C., Homer, M., Wallace, J.R.: Co-located Collaborative BlockBased Programming, pp. 107–116 (2019)
20. Suh, S., Lee, M., Xia, G., Law, E.: Coding Strip: a pedagogical tool for teaching and learning programming concepts through comics. In: Proceedings of IEEE Symposium on Visual
Languages and Human-Centric Computing, VL/HCC, 2020-Augus(c) (2020)
21. Vasilopoulos, I.V., van Schaik, P.: Design, development, and evaluation of an educational
visual tool for Greek novice programmers. J. Educ. Comput. Res. 57(5), 1227–1259 (2019)
22. Kuhail, M.A., Farooq, S., Hammad, R., Bahja, M.: Characterizing visual programming
approaches for end-user developers: a systematic review. IEEE Access 9, 14181–14202 (2021)
23. Anastasiadis, T., Lampropoulos, G., Siakas, K.: Digital game-based learning and serious
games in education. Int. J. Adv. Sci. Res. Eng. 4(12), 139–144 (2018). https://doi.org/10.
31695/ijasre.2018.33016
24. Perrotta, C., Featherstone, G., Aston, H., Houghton, E.: Game-based learning: Latest evidence
and future directions (2013)
25. Dicheva, D., Dichev, C., Agre, G., Angelova, G.: Gamification in education: a systematic
mapping study. Educ. Technol. Soc. 18(3), 75–88 (2015)
26. De Freitas, S.: Are games effective learning tools? a review of educational games. J. Educ.
Technol. Soc. 21(2), 74–84 (2018)
27. Abbasi, S., Kazi, H., Khowaja, K.: A systematic review of learning object oriented programming through serious games and programming approaches. In: 4th IEEE International
Conference on Engineering Technologies and Applied Sciences (2018). https://doi.org/10.
1109/ICETAS.2017.8277894
28. Almeida, F., Simoes, J.: The role of serious games, gamification and industry 4.0 tools in the
education 4.0 paradigm. Contemp. Educ. Technol. 10(2), 120–136 (2019)
29. Manuel, P.C.V., José, P.C.I., Manuel, F.M., Iván, M.O., Baltasar, F.M.: Simplifying the creation
of adventure serious games with educational-oriented features. Educ. Technol. Soc. 22(3),
32–46 (2019)
30. Linder, S.P., Nestrick, B.E., Mulders, S., Lavelle, C.L.: Facilitating active learning with
inexpensive mobile robots. J. Comput. Sci. Coll. 16(4), 21–33 (2001)
31. Aparicio, J.T., Pereira, S., Aparicio, M., Costa, C.J.: Learning programming using educational robotics. In: IEEE 14th Iberian Conference on Information Systems and Technologies
(CISTI), pp. 1–6 (2019)
32. Feijóo García, P.G., De la Rosa, F.: RoBlock - web app for programming learning. Int. J.
Emerg. Technol. Learn. 11(12), 45–53 (2016)
33. Fagin, B., Merkle, L.: Measuring the effectiveness of robots in teaching computer science.
SIGCSE Bull. 35(1), 307–311 (2003)
34. Boud, D., Feletti, G.: The Challenge of Problem-Based Learning, 2nd edn. Biddle Ltd,
Guilfford and King’s Lynn, London (1991)
35. Hsu, T.C., Chang, S.C., Hung, Y.T.: How to learn and how to teach computational thinking:
Suggestions based on a review of the literature. Comput. Educ. 126, 296–310 (2018)
36. Janpla, S., Piriyasurawong, P.: The development of problem-based learning and concept mapping using a block-based programming model to enhance the programming competency of
undergraduate students in computer science. TEM J. 7(4), 708–716 (2018)
37. Chang, C.-S., Chung, C.-H., Chang, J.A.: Influence of problem-based learning games on
effective computer programming learning in higher education. Educ. Tech. Res. Dev. 68(5),
2615–2634 (2020). https://doi.org/10.1007/s11423-020-09784-3
38. Wood, F.D.: ABC of Learning and Teaching in Medicine. Occup. Med. (Chic. Ill) 61(6), 446
(2003)
A Comparative Evaluation on Methods of Teaching Computer
581
39. Mohd Syahrizad, E., Ahmad Zamzuri, M.: a. Penggunaan simulasi packet tracer dalam
meningkatkan pemahaman pelajar terhadap konsep abstrak dalam matapelajaran rangkaian komputer: Suatu tinjauan awal. In: Proceedings of International Conference Integration
Knowledge (ICIK 2012), pp. 69–77 (2012)
40. De Jong, T., Van Joolingen, W.R.: Scientific discovery learning with computer simulations
of conceptual domains, Rev. Educ. Res. 68(2), 179–201 (1998)
41. Xie, C., Schimpf, C., Chao, J., Nourian, S., Massicotte, J.: Learning and teaching engineering
design through modeling and simulation on a CAD platform. Comput. Appl. Eng. Educ.
26(4), 824–840 (2018)
42. Connolly, T.M., Stansfield, M.: From e-learning to games-based e-learning: using interactive
technologies in teaching an IS course. Int. J. Inf. Technol. Manag. 6(2–4), 188–208 (2007)
43. Isiaq, S.O., Jamil, M.G.: Enhancing student engagement through simulation in programming
sessions. Int. J. Inf. Learn. Technol. (2018)
44. Schoeman, M., Gelderblom, H., Smith, E.: A tutorial to teach tracing to first-year programming
students. Progressio 34(3), 59–80 (2012)
45. Xie, B., et al.: A theory of instruction for introductory programming skills, Comput. Sci.
Educ. 29(2–3), 205–253 (2019)
46. Pinter, R., Čisar, S.M., Kovari, A., Major, L., Čisar, P., Katona, J.: Case study: students’ codetracing skills and calibration of questions for computer adaptive tests. Appl. Sci. 10(20), 1–21
(2020)
47. Sulaiman, S. Pairing-based approach to support understanding of object-oriented concepts
and programming, Int. J. Adv. Sci. Eng. Inf. Technol. 10(4) (2020)
48. Choi, K.S., Deek, F.P., Im, I.: Exploring the underlying aspects of pair programming: the
impact of personality. Inf. Softw. Technol. 50(11), 1114–1126 (2008)
49. Arisholm, E., Gallis, H., Dybå, T., Sjøberg, D.I.K.: Evaluating pair programming with respect
to system complexity and programmer expertise. IEEE Trans. Softw. Eng. 33(2), 65–86 (2007)
50. Nawahdah, M., Taji, D.: Work in progress: investigating the effects of pair-programming
on students’ behavior in an advanced computer programming course. In: Proceedings 2015
IEEE International Conference Teaching, Assessment Learning Engineering TALE 2015,
December, pp. 157–160 (2016)
51. Vartiainen, P.: On the principles of comparative evaluation. Evaluation 8(3), 359–371 (2002)
52. Sekaran, U.: Research and Markets: Research Methods for Business - A Skill Building
Approach (2003)
53. Yulianto, B., Prabowo, H., Meyliana. Effective digital contents for computer programming
learning: a systematic literature review. Adv. Sci. Lett. 23(5), 4733–4737 (2017)
54. Faja, S.: Pair programming as a team based learning activity: a review of research. Issues Inf.
Syst. XII(2), 207–216 (2011)
55. Fornós, S.: Game making as a learning strategy for chemical engineering. In: CHI PLAY
2020 –Extended Abstracts of the 2020 Annual Symposium on Computer-Human Interaction
in Play, pp. 234–236 (2020). https://doi.org/10.1145/3383668.3419888
56. Kurniawan, O., Lee, N.T.S., Datta, S., Sockalingam, N., Leong, P.K.: Effectiveness of physical
robot versus robot simulator in teaching introductory programming. In: Proceedings of 2018
IEEE International Conference Teaching, Assessment, Learning Engineering TALE 2018,
pp. 486–493 (2019)
57. Rodríguez, C., Guzman, J.L., Berenguel, M., Dormido, S.: Teaching real-time programming
using mobile robots. IFAC-PapersOnLine 49(6), 10–15 (2016)
58. Wang, X.-M., Hwang, G.-J.: A problem posing-based practicing strategy for facilitating students’ computer programming skills in the team-based learning mode. Educ. Tech. Res. Dev.
65(6), 1655–1671 (2017). https://doi.org/10.1007/s11423-017-9551-0
582
A. Adnan and R. Romli
59. Chandrasekaran, J., Anitha, D., Thiruchadai Pandeeswari, S.: Enhancing student learning
and engagement in the course on computer networks, J. Eng. Educ. Transform. 34, 454–463
(2021)
60. Mecca, G., Santoro, D., Sileno, N., Veltri, E.: Diogene-CT: tools and methodologies for
teaching and learning coding. Int. J. Educ. Technol. High. Educ. 18(1), 1–26 (2021). https://
doi.org/10.1186/s41239-021-00246-1
61. Chigona W., Pollock, M.: Pair programming for information systems students new to programming: students’ experiences and teachers’ challenges. In: PICMET’08-2008 Portland
International Conference on Management of Engineering \& Technology, pp. 1587–1594
(2008)
62. Asnawi, A.L., et al.: The needs of collaborative tool for practicing pair programming in
educational setting. Int. J. Interact. Mob. Technol. (2019)
63. Bahig, H.M., Khedr, A.Y.: MonitTDPA: a tool for monitoring the tracing of dynamic
programming algorithms. Comput. Appl. Eng. Educ. 25(2), 179–187 (2017)
64. Mayer, R.E., Dyck, J.L., Vilberg, W.: Learning to program and learning to think: what’s the
connection?. Commun. ACM 29(7), 605–610 (1986)
65. Hanks, B.: Empirical evaluation of distributed pair programming. Int. J. Hum. Comput. Stud.
66(7), 530–544 (2008)
66. Zin, A.M., Idris, S., Subramaniam, N.K.: Improving learning of programming through Elearning by using asynchronous virtual pair programming. Turkish Online J. Dist. Educ. 7(3),
162–173 (2006)
67. Cicchino, M.I.: Using game-based learning to foster critical thinking in student discourse,
Interdiscip. J. Probl. Learn (2015)
68. Hussein, M.H., Ow, S.H., Cheong, L.S., Thong, M.K., Ale Ebrahim, N.: Effects of digital
game-based learning on elementary science learning: a systematic review. IEEE Access 7,
62465-62478 (2019)
Attitude Towards Intention to Use Mobile-Based
Teaching Assessment Based on TAM
and a Novel Extended TAM Model
Abdullahi Ahmed Abdirahman1(B) , Marzanah A. Jabar2 , Abdirahman Osman Hashi1 ,
Mohamed Abdirahman Elmi1 , and Octavio Ernesto Romo Rodriguez3
1 Faculty of Computing, SIMAD University, Mogadishu, Somalia
{aaayare,m.abdirahman}@simad.edu.so
2 Department of Information System and Software Engineering, Faculty of Computer Science
and Information Technology„ Universiti Putra Malaysia, Seri Kembangan, Malaysia
marzanah@upm.edu.my
3 Department of Computer Science, Faculty of Informatics, Istanbul Teknik Üniversitesi, 34469
Maslak, İstanbul, Turkey
Abstract. In recent years the combination of a rapid development in mobile
technology and the pandemic scenario in which currently the world is still in,
have caused an increasing demand for online systems that can replace the traditional methods in a variety of areas. For instance, the rising usage of e-learning
and e-health are evidence of this reality. Consequently, Mobile Based Teaching
Assessment (MBTA) has become the ideal candidate to replace traditional classroom evaluation. The intention of end users to use MBTA as an alternative to
traditional evaluation is the main indicator of its adoption in a regular basis. This
study has two main goals, the first one is to use the Technology Acceptance Model
(TAM) to evaluate how people’s feelings towards the usage of MBTA, the second
goal is to propose an extended TAM that incorporates intrinsic motivation to the
traditionally extrinsic regular TAM. Partially least squares (PLS) were used in this
study, and data was gathered from 75 students and academic support personnel
using a simple sampling technique, as well as structural model to evaluate the
proposed model. Based on the findings of this research, the attitude of individuals
directly influences their desire to use MBTA. Along with that, individual’s attitude
is influenced by a variety of factors, this is more evident in the extended TAM
proposed. Despite the indications achieved with TAM regarding the implementation of mobile-based teaching assessment in an academic context, the claimed
user attitude explains 75% of the variance in user intention towards MBTA. The
importance of the suggested paradigm, as well as the accuracy of the extended
TAM proposed, is shown in the results of this work.
Keywords: Partial least squares · Technology acceptance model · Mobile
assessment in mobile devices
© The Author(s), under exclusive license to Springer Nature Switzerland AG 2022
F. Saeed et al. (Eds.): IRICT 2021, LNDECT 127, pp. 583–593, 2022.
https://doi.org/10.1007/978-3-030-98741-1_48
584
A. A. Abdirahman et al.
1 Introduction
With global acceptance of technologies for the improvement of learning activities, various portable personal computing, and communication devices (like Smartphone and
tablets) made adoption of such technologies a reality. Also, the rapid growth of IT
has led to new applications such as e-learning, e- health to replace traditional methods
[1]. As a result, mobile-based teaching assessment (MBTA) has developed as a useful
supplement to traditional classroom evaluation methods.
Among academics, mobile learning has become a frequent occurrence. Furthermore,
it is becoming more widely accepted owing to its accessibility and the fact that it provides
users with a variety of capabilities, such as 3G and 4G networks [2]. In accordance with
this, O’ Malley et al. [3] described m-learning as a kind of learning that allows students
to study at any time and from any location while also allowing them to communicate
through mobile devices. Mobile technologies support a variety of activities in the educational setting, including dynamic, location-aware, context-aware, collaborative, peer,
and self-assessment practices [4]. However, contemporary educational evaluations are
not intended to be completed on mobile terminals, but rather on a desktop computer.
It demonstrates that students’ ease in using the system at any time and from any location receives less attention. As a result, mobile devices should be used in classroom
assessment to improve academic services [5].
More specifically, the wide array of a proliferation of technology applications in education environment necessitates a mobile-based teaching assessment. However, learners’
recognition of mobile-based teaching assessment has been overlooked, and the effectiveness of the adoption of MBTA raises a question among academics, practitioners, and
developers. To that end, special attention is given to the adoption of MBTA. Since the
previous literature highlighted the suitability of assessing the computers [6–8]. While
other literature stated that mobile learning is encouraged to be adopted in an academic
environment [9, 10]. Therefore, from the viewpoint of the Technology-AcceptanceModel, this provides sufficient scope to examine the attitude toward the intention to
utilize Mobile-Based Teaching Assessment. In fact, this research will be one of the first
to predict the acceptability of Mobile-Based Teaching Assessment.
The paper is structured as follows: the background of Assessments by the mobile
technology is presented in section two. Followed by and Technology Acceptance Model
(TAM) in section three. Research model and formulation of hypotheses are reported in
section four. A methodology is presented in section five. The data analysis is shown in
section six. Section seven presents discussions and conclusion.
2 Background and Related Work
2.1 Assessments on the Basis of Mobile Technology
Technology innovation brought portable devices like tablets, notebooks, and Smartphones allowing academicians gain access to digital content in learning which leads to a
new learning mode called mobile learning. In addition, technology innovation offered not
only mobile learning but also enabled users to make communication, entertainment, and
multiple purpose information processing tools. Therefore, the usage of mobile devices
Attitude Towards Intention to Use Mobile-Based Teaching Assessment
585
in higher education improved due to conjunctions with near universal 3G/4G wireless
connectivity. In addition to that, mobile learning has features that include ubiquity, portability, low cost, mobility and flexibility engaging users to use the Mobile-learning [11].
On the other hand, mobile devices have a potential effect on improving the outcomes
and motivations of the students besides the enhancement of their attitudes since mobile
technology has already integrated into learning activities [12]. Consequently, the ubiquitous and mobility features at mobile devices plus the growth of technology enable
to perform possible evaluations and create a new technique for the assessments, called
Mobile-Based Testing (MBT).
Context-aware adaptation provides support to the educational activities in a mobile
learning platform. Economides [13] demonstrates the essential features that affect the
quality of using mobile learning devices. Adaptive mobile learning and mobile learner are
two ideas in mobile technology, with adaptive mobile learning serving as an engine that
personalizes educational activities in a given environment, and the mobile learner doing
educational activities. Moreover, mobile devices make a possible extension of services
due to their mobility. For instance, mobile learning plays a vital role in various educationrelated activities, namely performing formative assessment or self-assessment [14]. For
that reason, mobile technology can be alternatively adoptable in teaching assessment.
Therefore, the mobile devices become inevitable in the adoption of the implications in
a real world, and that renders mainly teaching evaluation to benefit them.
2.2 Technology Acceptance Model
Due to technology applications proliferation in the academics, a new approach for mobile
assessment was innovated to replace the existing traditional methods of evaluation such
as paper-and-pencil based or web-based. The mobile devices can access the contents anytime and anywhere. Thus, it is imperative to explore student’s acceptance of mobile-based
teaching assessment adoption in academic institutions. Various studies were conducted
about users’ the acceptance to adopt the information system for their lives [15, 16]. For
example, a study by Hussein [17] revealed that intention to use the e-learning depends
on users’ attitude which has a significant part for making the system well performed.
This paper puts forward the technology-acceptance-model (TAM) to explain the
relationship between the variables of interest. Perceived ease of use (EoU), perceived
usefulness (PU), and attitudes (ATT) are three variables in this theory that characterize
and predict system adoption. They have different meanings, since perceived usefulness
captures how much a user believes utilizing a specific technology would improve his
or her work performance (PU). This factor determines the usefulness and efficacy of
mobile teaching assessment in academics. The ease of understandability of such mobile
teaching assessment is defined by its ease of use (EoU), which relates to the ease-of-use
(EoU) of TAM, since ease-of-use refers to the extent/degree to which a person has strong
views that he or she can utilize the system with ease [18]. Finally, the third component
of the theory provides light on the users’ attitudes that motivate them to utilize mobilebased instructional assessment. In an e-learning system, the attitude relates to the degree
to which the user is interested in the MBTA. Furthermore, the voluntary adoption of
MBTA in academics is motivated by a behavioral purpose that is affected by attitude.
The user’s desire to utilize the mobile to manage teaching-related evaluations is predicted
586
A. A. Abdirahman et al.
by the general dimensions described above. As a result, the purpose of this study is to
look at user acceptability of the MBTA’s usage of TAM. It is critical to examine the
underlying variables that drive MBTA, which are influenced by the user’s behavioral
goals and attitude toward technology adoption, either directly or indirectly. Given that
TAM is the theory that may be used to verify the interrelationships between the variables
in this research. To put it another way, acceptance of mobile learning has previously
been used in TAM assessment with a variety of changes and extensions to incorporate a
variety of external factors [10, 20]. However, the research on the acceptability of mobilebased instructional evaluation is still lacking. Moreover, the empirical existing literature
about mobile based assessment by users shows contradictory results. Mobile users have
positive attitude towards MBA according to Chen [21], while other show negative attitude
towards MBA [22, 23]. Therefore, this study is first step forward by examining the users’
(students and academic support) attitudes which lead to the behavioral intention which
results in driving mobile-based teaching assessment.
2.3 Research Model and Hypothesis
The reliability of TAM has proven by an extensive number of research. Nonetheless,
TAM has an emphasis on the notion of instrumentality, focusing mainly on functional
and extrinsic motivations. Such a perception could be limited when dealing with situations out of an organizational environment, where the motivations behind the choices of
individuals are not so obvious.
According to research in the field of Psychology and Psychoanalysis, motivations can
be classified in two categories, extrinsic and intrinsic motivators. Extrinsic motivation is
when an individual is motivated to do an activity to obtain a reward, the focus is on the
outcome of the activity. Intrinsic motivation is naturally the opposite, when an individual
chooses to do an activity because it is internally rewarding, the activity is satisfactory
by itself, therefore the focus is on the activity and not the outcome of it.
Given that psychological principle, it has been proven that intrinsic motivation plays
a key role in decision making of individuals, particularly among young people. Taking
that into consideration, it becomes clear that TAM, as reliable as it might be in some
cases, does not cover the whole spectrum of the motivations behind the decisions of
people in this case, mainly because the environment is more varied and the individuals
targeted are younger, thus with a higher tendency to base their decisions on intrinsic
motivation.
That is the main reason why it was decided to extend the previously presented model,
using a regular TAM model, and introduce an extended TAM model including intrinsic
motivation. This motivation has been included in the form of two factors: System Quality
Perception (SQP) and Enjoyment (E). The relation between these two new factors and
the previous model is based on research in the fields of psychology, pedagogy and
information systems, as well as data gathered in this research to prove the reliability of
the proposed model.
Established on the factors mentioned, the extended model proposed is the following:
The first introduced factor is System Quality Perception (SQP). This involves aspects
such as system quality, information quality and content quality, as well as the availability
of the system as a whole. Instinctively, the quality of a system influences the Ease of Use
Attitude Towards Intention to Use Mobile-Based Teaching Assessment
587
Fig. 1. Describes the proposed extended model to be adopted in this research
(EuO), since a good quality system consists of well documented and planned features
that will allow users to navigate in the system and use its resources efficiently. With that
said, quality can be interpreted in a variety of ways, objective and subjectively.
Given that the focus of this research is the intention of people to use mobile-based
teaching assessment, and that the targeted demographic consists of mostly young people
who tend to base their decisions on intrinsic motivation, the interpretation given to quality
in this model has an additional aspect, which is the perception. Hence, System Quality
Perception conveys the objective and subjective features of quality in a system, such as
the actual usability and availability of the system, as well as the statics of the system,
that influence enormously the perception of the end user regarding to the quality of the
system.
The second new factor is Enjoyment (E). This is entirely an intrinsic motivation and
as the name suggests it refers to the enjoyment while using the system. It is directly
influenced by the Ease of Use of the system, naturally a user-friendly system increases
the enjoyment of the end users, that is the reason why social media developers put so
much effort in making their systems as intuitive as possible. If the user enjoys using their
system, he will come back to use it again.
Continuing with those principles, Enjoyment is indirectly influenced by the System
Quality Perception. Given that this factor consists subjective aspects like the appreciation
of statics, it is clear that these also influence the overall enjoyment of the user while using
the system. Regardless of that, these aspects are not directly influencing the Enjoyment
factor due to the fact that subjective aspects like the statics of a system cannot make the
end user enjoy using the system if the system is not functional itself. It is the combination
of functional and static aspects that influences the enjoyment of the end user. Such a
relationship is portrayed in the proposed model.
3 Proposed Methodology
3.1 Participants
Random sampling technique was conducted to select participants for the survey. A Total
of 75 participants were collected from undergraduates, graduates studies, and academic
588
A. A. Abdirahman et al.
support of Universiti Putra Malaysia (UPM). In which 50 out of 75 making (66.67%)
were students and 25 (33.33%) academic support, while males constituted of 46 (61.33%)
and 29 females (38.67%).
3.2 Procedure and Instrument
A quantitative approach was conducted in this paper by using a survey. A questionnaire
was formulated based on the TAM constructs from previously validated instruments.
The English language was designed to build the survey questionnaire. All items were
graded on a 5-point Likert scale ranging from 1 (strongly disagree) to 5 (strongly agree)
(strongly agree). Construct three items for Perceived Usefulness (PU) and three items
for Perceived Ease of Use from [26]. We utilized six questions from [27] to evaluate
Attitudes toward (ATT) and Intention to Use (IU) of Mobile-Based Teaching Assessment,
and we upgraded the items slightly to reflect the current research environment (mobilebased teaching assessment). The item “In the future, I plan to utilize e-learning” was
changed with “In the future, I want to use mobile devices for teaching evaluation. “In
addition to that, to describe and explain the features of the Mobile-Based Teaching
Assessment, we have given to the participants 10 min presentation before answering the
questionnaire, and 15 min to complete the questionnaires. To validate and analyzing data
for the variables that effect the implementation of teaching assessment through mobile
technologies. Smart PLS Version 3.0 software was used to test the measurement and
structural model of this analysis.
4 Data Analysis
We utilized Smart PLS Version 3.0 to offer the study model’s convergent and discriminant
validity in order to evaluate and verify its quality. As a result, to verify that the concept
indicators are genuine, the convergent validity must be assessed. The model’s validity
must meet the following measurement requirements: (1) constructs with factor loadings
higher than 0.700 are acceptable; (2) each variable’s composite reliability must exceed
0.700; and (3) each construct’s Average Variance Extracted (AVE) must likewise exceed
0.700.
The results in Table 1, indicates that all the measures for convergent validity passed
and verified. In the factor loadings, the results of all variables are in between 0.755–
0.942 that means they exceed 0.700. Also, the Average Variance Extracted (AVE) values
indicate that they are in the range of 0.665 to 0.760 (AVE > 0.5). In addition, the
values of root squared of AVE as shown in Table 2 are greater than correlation of
corresponding constructs. As a result, all AVE square root values are higher than the
construct inter-correlation values. As a result, the suggested research model’s convergent
and discriminant validity are both confirmed.
We used PLS-Graph to complete the SEM by calculating the R-squared values and
Path coefficients. We also tested whether hypotheses formulated are in line with the
study expectations or not. Therefore, the results reveal that all hypotheses tested are
in accordance with expected signs. These imply that relationships among variables are
statistically significant and positive.
Attitude Towards Intention to Use Mobile-Based Teaching Assessment
589
Table 1. Convergent validity of the model
Items
Factor loading
(>0.7)
EoU
EoU 1
0.799
EoU 2
0.878
EoU 3
0.764
U
U1
0.755
U2
0.878
U3
0.863
IU
BIU 1
0.816
BIU 2
0.923
BIU 3
0.873
ATT
ATT 1
0.873
ATT 2
0.942
ATT 3
0.801
Cronbach’s (>0.7)
Composite Reliability
(>0.7)
Average Variance
Extracted (>0.5)
0.746
0.856
0.665
0.780
0.872
0.695
0.841
0.904
0.760
0.795
0.880
0.712
EoU: Ease of Use, PU: Perceived Usefulness, IU: Intention to Use, ATT: Attitude.
Table 2. Discriminant Validity of the Model
Item
ATT
ATT
0.844
IU
EoU
IU
0.764
0.872
EoU
0.641
0.603
0.815
PU
0.832
0.867
0.622
PU
0.834
Bold values: the square root of the average variance extracted (AVE) of each construct.
Table 3. Hypothesis testing results
H
Path
Path Coefficient
H1
EoU -> PU
0.622***
8.124
Supported
H2
EoU -> ATT
0.201***
2.071
Supported
H3
PU - > IU
0.554***
4.724
Supported
H4
PU -> ATT
0.707***
7.008
Supported
H5
ATT -> BIU
0.754***
5.781
Supported
* p < 0.1, ** p < 0.05,*** p < 0.01
t statistics
Support
590
A. A. Abdirahman et al.
Fig. 2. The structural model results
Structural equation modeling was used to examine the newly added variables and
their connections (Table 4). The calculation of the values produced findings that showed
a good match of the structural model to the data for the specified research model [31].
It can be noticed that the values in the table are given within a range. The decision
and direction of the result also confirms the validity of the proposed model.
Table 4. A summary of the results achieved is shown in the following table:
Relationship
Path
t-value
p-value
Direction
Support
SQP → PU
– 0.006
0.114
0.914
Neg
No
SQP → EoU
0.103
2.498
0.011
Pos
Yes
E → EoU
– 0.203
2.673
0.009
Neg
Yes
E → IU
0.133
2.112
0.035
Pos
Yes
EoU → PU
0.295
5.160
0.000
Pos
Yes
EoU → ATT
0.150
3.123
0.002
Pos
Yes
PU → ATT
0.522
9.697
0.000
Pos
Yes
EoU → IU
0.086
1.867
0.040
Pos
Yes
PU → IU
0.195
2.832
0.005
Pos
Yes
ATT → IU
0.341
5.132
0.000
Pos
Yes
IU → Actual Usage
0.192
3.486
0.001
Pos
Yes
Structural model results (significant at p** < = 0.01, p* < 0.05).
It is important to notice the accuracy of the proposed model in accordance to the
results achieved in Table 4. For instance, in the proposed model System Quality Perception directly influences Ease of Use, in the previous table this hypothesis is confirmed
since it shows a positive relationship between these two factors.
In a similar manner, in the proposed model a relationship between Ease of Use
and Enjoyment was introduced, this relationship is also confirmed in the third row of
Attitude Towards Intention to Use Mobile-Based Teaching Assessment
591
the table, showing a negative relationship between Enjoyment and Ease of Use. The
direction is also consistent with the proposed model since it was proposed that Ease of
Use influences Enjoyment and not the other way around, which is proven right in the
structural model results.
Additionally, the last introduced relationship in the proposed model is also present
in the results achieved. The fourth row of the table shows a positive relationship between
Enjoyment and Intention to Use, which is precisely what the proposed model describes.
5 Discussion
Using the Technology Acceptability Model, this research investigates the acceptability
of mobile-based teaching assessment (TAM). This is the first study to use the Technology
Acceptance Model to assess mobile-based teaching (TAM). It adds to the theoretical body
of knowledge in the area of mobile apps. The mindset of the user, according to the idea,
is the most important element that affects their desire to use the MBTA. User attitude
has a favorable and substantial effect on their intention to use the MBTA, according to
the findings, accounting for 75% of the variance in user intention to use the MBTA. The
result is that the user’s intention has an impact on whether or not mobile-based teaching
assessment (MBTA) is utilized, since a positive attitude leads to a greater willingness to
use mobile-based teaching assessment (MBTA).
Furthermore, these results corroborate both hypotheses, and previous research has
shown that the user’s attitude influences their intention to utilize an e-learning system
[28, 29]. TAM has a strong predictive value in describing how academic arena could
be adopted mobile-based-teaching-assessment (MBTA) in the, according to the data.
The purpose of users of mobile-based teaching assessment (MBTA) changes with their
attitudes, according to TAM. As a result, users’ attitudes and other associated variables
that may enhance or reduce user acceptance of online educational tools must be given
top priority in the success of such a model in the educational environment. Since TAM
included attitude as the most important main explanatory variable, the study recommends
that variables that increase attitude be studied in the future.
Through the mediation of attitude, the ease of use has a substantial beneficial impact
on the intention to use. Students and academic support staff develop a strong proclivity
to utilize MBTA with ease as they get a better understanding of mobile apps in teaching
assessments. The MBTA’s perceived utility (PU) has a direct positive impact on the
desire to use it. Students and support groups have a greater conviction in the use of
mobile applications in teaching assessment as an alternate or complementary method to
paper-based and computer-based assessment delivery modalities that may be used both
within and outside of the school.
6 Conclusions
The implications of this study include motivation of both students and academic support groups to perform the teaching assessment for their convenience and encourage
developer should design mobile applications that appeal needs of students and academic
support groups on one side and education administration on the other. Implementation
592
A. A. Abdirahman et al.
of teaching assessment based on mobile applications depends on the positive attitude of
the administration.
Although the current research represents an early effort at developing MBTA acceptability, it does not imply that it is without limits. The present proposed model calls to
be tested to other theories than TAM. It further needs to account for individual differences among users of mobile applications in teaching assessment. For future research,
proposed model calls for applying in other settings as well as adding additional variables.
Acknowledgment. It is imperative to acknowledge the support given by SIMAD Research Center
in order to make this research a success.In addition to that, the authors of this paper are honored to
thank SIMAD University for making this research possible by granting the Research University
Grant.
References
1. oAlsabawy, F., Younis, A., Aileen, C.S., Soar, J.: Determinants of perceived usef e- learning
systems. Comput. Hum. Behav. 64, 843- 858 (2016)
2. Cerratto-Pargman, T., Järvelä, S.M., Milrad, M.: Designing Nordic technology-enhanced
learning. Internet High. Educ. 15(4), 227–323 (2012)
3. O’Malley, C., et al.: Guidelines for learning/teaching/tutoring in a mobile environment (2005)
4. Berge, Z.L, Muilenburg, L.: Handbook of Mobile Learning, Routledge (2013)
5. Tulloch, M., et al.: Case studies to enhance online student evaluation: Charles Sturt University–
Evaluation, analytics and systems integration (2015)
6. Terzis, V., Economides, A.A.: The acceptance and use of computer based assessment. Comput.
Educ. 56(4), 1032–1044 (2011)
7. Terzis, V., Moridis, C.N., Economides, A.A.: Continuance acceptance of computer based
assessment through the integration of user’s expectations and perceptions. Comput. Educ.
62(50–6), 1 (2013)
8. Terzis, V., Moridis, C.N., Economides, A.A., Mendez, G.R.: Computer based assessment
acceptance: A cross-cultural study in Greece and Mexico. J. Educ. Technol. Soc. 16(3), 411
(2013)
9. Abu-Al-Aish, A., Love, S.: Factors influencing students’ acceptance of m-learning: an
investigation in higher education. Int. Rev. Res. Open Distrib. Learn. 14(5), 82-107 (2013)
10. Park, S.Y., Nam, M.-W., Cha, S.-B.: University students’ behavioral intention to use mobile
learning: evaluating the technology acceptance model. Br. J. Edu. Technol. 43(4), 592–605
(2012)
11. Cheung, W.S., Hew, K.F.: A review of research methodologies used in studies on mobile
handheld devices in K-12 and higher education settings. Australas. J. Educ. Technol. 25(2)
(2009)
12. Hwang, G.-J., Chang, H.-F.: A formative assessment-based mobile learning approach to
improving the learning attitudes and achievements of students. Comput. Educ. 56(4),
1023–1031 (2011)
13. Economides, A.A.: Requirements of mobile learning applications. Int. J. Innov. Learn. 5(5),
457–479 (2008)
14. Huang, Y.-M., Lin, Y.-T., Cheng, S.-C.: An adaptive testing system for supporting versatile
educational assessment. Comput. Educ. 52(1), 53–67 (2009)
15. Hsu, H.-H., Chang, Y.-Y.: Extended TAM model: impacts of convenience on acceptance and
use of moodle. Online Submiss. 3(4), 211–218 (2013)
Attitude Towards Intention to Use Mobile-Based Teaching Assessment
593
16. King, W.R., He, J.: A meta-analysis of the technology acceptance model. Inf. Manag. 43(6),
740–755 (2006)
17. Hussein, Z.: Leading to intention: the role of attitude in relation to technology acceptance
model in e- learning. Procedia Comput. Sci. 105, 159–164 (2017)
18. Davis, F.D., Bagozzi, R.P., Warshaw, P.R.: User acceptance of computer technology: a
comparison of two theoretical models. Manage. Sci. 35(8), 982–1003 (1989)
19. Saadé, R.G., Galloway, I.: Understanding intention to use multimedia information systems
for learning. Inf. Sci. Int. J. Emerg. Transdiscipl. 2, 287–296 (2005)
20. Liu, Y., Han, S., Li, H.: Understanding the factors driving m-learning adoption: a literature
review. Campus-Wide Inf. Syst. 27(4), 210–226 (2010)
21. Chen, C.-H.: The implementation and evaluation of a mobile self-and peer-assessment system.
Comput. Educ. 55(1), 229–236 (2010)
22. Huff, K.C.: The comparison of mobile devices to computers for web-based assessments.
Comput. Hum. Behav. 49, 208–212 (2015)
23. Wang, Y.-S., Wu, M.-C., Wang, H.-Y.: Investigating the determinants and age and gender
differences in the acceptance of mobile learning. Br. J. Edu. Technol. 40(1), 92–118 (2009)
24. Ju, T.L., Sriprapaipong, W., Minh, D.N.: On the success factors of mobile learning. In: Paper
presented at 5th International Conference on ICT and Higher Education (2007)
25. Bangkok
26. Terzis, V., Moridis, C.N., Economides, A.A.: The effect of emotional feedback on behavioral
intention to use computer based assessment. Comput. Educ. 59(2), 710–721 (2012)
27. Venkatesh, V., Morris, M.G., Davis, G.B., Davis, F.D.: User acceptance of information
technology: toward a unified view. MIS Q. 27(3), 425e478 (2003)
28. Chang, H.H.: Task-technology fit and user acceptance of online auction. Int. J. Hum.-Comput.
Stud. 68(1e2), 69e89 (2010). http://dx.doi.org/https://doi.org/10.1016/j.ijhcs.2009. 09.010
29. Altawallbeh, M., Soon, F., Thiam, W., Alshourah, S.: Mediating role of attitude, subjective norm and perceived behavioural control in the relationships between their respective
salient beliefs and behavioural intention to adopt elearning among instructors in jordanian
universities. J. Educ. Pract. 6(11), 152–159 (2015)
30. Sujeet, K.S., Jyoti, K.C.: (2013) ‘Technology acceptance model for the use of learning through
websites among students in Oman. Int. Arab J. E- Technol. 3(1), 44–49 (2013)
31. Salloum, S.A.S.: Investigating students’ acceptance of E-learning system in Higher Educational Environments in the UAE: Applying the Extended Technology Acceptance Model
(TAM) (Doctoral dissertation, The British University in Dubai)sss (2018)
The Roles of Information Presentation on User
Performance in Mobile Augmented Reality
Application
Nur Intan Adhani Muhamad Nazri and Dayang Rohaya Awang Rambli(B)
Universiti Teknologi PETRONAS, Perak, Malaysia
{nur_9113,dayangrohaya.ar}@utp.edu.my
Abstract. Mobile Augmented Reality (AR) has an interesting and interactive
method of presenting information because it is the combination of real and virtual
environments. Thus, a large amount of information is required and some of the
necessary information is not fit to the screen due to the small screen display. Hence,
lead to user dissatisfaction and not getting the right and accurate information. This
study herein aims to examine the roles and optimal combination of information
presentation to improve user performance in mobile AR applications. A possible
combination of information modalities is created and a study was conducted by
comparing two different conditions:1) without sound and haptic feedback; 2) with
sound and haptic feedback. Results showed the optimal combination of information modalities is with sound feedback and haptic feedback based on statistical
analysis and user preferences. Moreover, the roles of information presentation
indeed able to support visual information modality in the mobile AR application.
Keywords: Mobile augmented reality · Multimodal information presentation ·
User performance
1 Introduction
Augmented Reality (AR) technology has become an ideal platform due to the advancement of technology such as a high-quality camera, powerful microprocessor, tracking
technology and others. Thus, provide an interactive technique to interact with the physical and virtual environment. Consequently, AR uncovers unique ways to present data
and information. Though AR has been introduced more than a decade, these still a very
important area of future research [1]. By embedding AR within applications, it can offer
an interactive experience by providing creative details such as data and information
through the use of augmentation added to it. Some features that make AR practical to
use is, it makes users aware of their surrounds while interacting with virtual content in
the mobile AR application [2]. This is different compared to users who may be texting or
scrolling content on their mobile devices, which may narrow their eyes vision resulting
in accidents while walking.
In spite of its ubiquity, it is found that when creating mobile AR application, designers, developers and researchers barely see from the user’s point of view. This in the
© The Author(s), under exclusive license to Springer Nature Switzerland AG 2022
F. Saeed et al. (Eds.): IRICT 2021, LNDECT 127, pp. 594–603, 2022.
https://doi.org/10.1007/978-3-030-98741-1_49
The Roles of Information Presentation on User Performance
595
long run driven to the low commercialization of versatile AR applications within the
market. This is because presenting meaningful information in effective ways is still an
ongoing challenge due to the nature of AR technology, which involves a large amount of
data and information required to be presented [3–5]. Therefore, due to the small screen
display of a mobile device, some required and meaningful data, content and information are not fitted into it. Eventually, it will make user feel frustrated and disappointed.
Moreover, it will lead to an error in getting the right and accurate information [6] due
to the impact of ineffective information presentation. Hence, there is a need to mapping
types of information to tasks in and understand the roles of information presentation,
which will allow exploration of possible uses and benefits of various modalities that can
eventually improve the user performance [7].
This paper addresses a question on what is the roles of information presentation and
the optimal combination of output modalities in mobile AR application. Thus, the objectives of this study are to examine and identify the optimal combination and investigate
the roles of information presentation in mobile AR application.
In the next section, related works of this study are highlighted. Followed by methods
to conduct this study. Then, results and discussion are described in detail.
2 Related Work
2.1 Mobile Augmented Reality
Today, smartphones have become a popular mobile AR platform due to its sufficient
processing powers which improve the AR functions [8–10] and widely used. This is
because of it features that offers mobility, lightweight and small. To experience mobile
AR, users do not have to carry a bulky hardware. With the widespread adoption of AR
using smartphone, it encouraged users to look at the screen and interact with the AR
content inside it.
In order to make mobile AR experience possible, as a start, it only takes processing
power, camera, internet connection, a basic understanding of geometry and 3D graphics
to deliver augmented reality experiences for users. The development of AR applications
is very accessible and basic application are easy to get. This allows developers to reach
the most users because people already own AR capable smartphones.
2.2 Information Presentation Theory
Information presentation is generally referring to a manner in which a system or interfaces present information to user [7]. In order to expand the knowledge of the users, the
role of information presentation is to create a creative visual representation of data to be
meaningful and can be easily understood.
The main role of information presentation is to offer a simple, yet concise and
compact presentation content to support users in working and exploring the content of
an application [12]. At the same time, the information needs to be accurate, meaningful
and are able to be perceived by user. Furthermore, with respect to its projection on the
eye level, there is a need to ensure the displayed information is well organized [11, 13]
and provide interactive and intuitive user interface.
596
N. I. A. M. Nazri and D. R. A. Rambli
Below is some of the terms that were used interchangeably in many existing
literatures related to information presentation: – Information presentation: common ways of presenting data. Example type of medias
are icon, text, image, audio and video. It is generally used as a type of information
presentation. The purpose and objective of information presentation are to increase
users’ knowledge, awareness and engagement by providing interactive media. [14–
16].
– Information representation: The same information can have few alternative representations. For example, icon ‘Printer’ represents to print a document.
2.3 Information Presentation in Mobile AR
Compared to the traditional method, information presentation in mobile AR is far more
challenging as it combines information from the real environment and information that
needs to be augmented. Furthermore, to fit onto the screen of mobile devices, the relevant
data and information need to be squeezed and become compact information [17].
Moreover, identifying the type and style of information of each presentation mode
will eventually speak its purpose within the user interface (UI). According to Lombard &
Ditton [18], there is always a relation between the form in which information is displayed
with the content of the information and features exclusive to the user.
Therefore, information presentation in mobile AR has become a unique way to
provide a form of interactive communication, engagement and provide a better mutual
understanding between users as it is effective and memorable.
2.4 Multimodal Information Presentation
The application or system that use more than 2 modalities (i.e., Vision, Auditory, Gesture, Tactile, etc.) to present information is always refer to multimodal information
presentation and also known as multimodal fission.
It can be classified on the basis of 3 criteria [19]: – Medium: refer to device used to deliver information. For example; Paper, computer
display, speaker, mobile screen
– Presentation Mode (Information modality): refer to format of the message. For
example; text, image
– Modality: refer to process information using human senses. For example; visual,
auditory
Few researchers stated the guidelines for multimodal information presentation which
are the grouping of information modalities ought to be minimized and only necessary to
use it when there is a need to convey important information [20]. Furthermore, to improve
the method of communication and transmission of information multiple information
modalities can be combined in one presentation form [21].
Nevertheless, under a certain condition, combining multiple information modalities
could provide significance support. However, it does not always give any benefit to the
The Roles of Information Presentation on User Performance
597
user and the system and sometimes create more burden to the user. Information modalities
contain a really great expressive control as they can actually be way better than another
at passing on certain information for certain condition. As an example, to display and
giving out instruction or information when driving, sound command or speech is a
better method. Whereas, the text is appropriate to display distance, temperature, level of
measurements such as centimeter, meter and others.
3 Method
An experimental design needs to be done in order to conduct a study. The next subsection
describes the experimental setup, followed by the method used to collect and analyzes the
data. There are 3 main processes in conducting the experiment which are experimental
procedures, data collection and data analysis. Details of these processes will be explained
in details in the next section.
3.1 Experimental Procedures
Purpose. This purpose of this study is to investigate how information presentation is able
to assist users in navigating and exploring the mobile AR content and to understand the
roles of information presentation on user performance. Therefore, optimal combination
of output modalities and its role will be proposed and identified.
Procedure. For the purpose of this study, five types of information modalities were
selected which are text, image/icon, speech, sound and vibration. Two separate conditions
are tested. The first condition is combination without haptic and sound feedback. The
second condition is combination with haptic and sound feedback. Below are the 5 steps
to ensure the experiment is properly conducted: • Before experiments begin: Participants were given an explanation about the study by
the project leader.
• In the beginning of experiments: To familiarize with the mobile AR application,
participants were given at least 5 min and they were asked if there are any question.
• During the experiment: Participants will then try the mobile AR application. Observation of the participant’s reaction and interaction with the mobile AR application is
recorded.
• At the end of experiment: Each participant was asked to answer a questionnaire and
give any feedback that they have experienced.
• To test for second condition, step 3 and step 4 is repeated.
Participants. A total of 40 participants, with 20 males and 20 females volunteered in
this study. The majority participants are between 20 to 28 years old. All the participants
are familiar in using smartphone. By following the sample size rule, “sample size larger
than 30 and less than 500 are appropriate for most research” [22]. Therefore, 40 sample
is enough for this study.
598
N. I. A. M. Nazri and D. R. A. Rambli
3.2 Data Collection
Observation. Throughout the experimentation, a paper recording of the users’ actions
is taken. Hence, every action of participants that occurred during the study will be written
and recorded to analyze the participant’s feedback for reference.
Open-Ended Question. The open-ended questions are a non-structured way aimed to
collect users’ feedback on the application [23].
QUIS Questionnaire 5.5. A measurement apparatus designed to evaluate a user’s subjective Satisfaction with the human-computer interface [24]. It contains a demographic
questionnaire, a measure of overall system satisfaction, and a measure of specific interface factors such as screen visibility, terminology and system information, learning
factors, and system capabilities.
3.3 Data Analysis
Comparison analysis was done between the first condition and second condition by
testing on the response time and the score (user performance).
3.4 Mobile AR Apps
The mobile AR game interface is designed with a combination of 2D and 3D components.
The 3D object consists of the brick wall, the bubbles, and the avatar. While for 2D object
consists of the instructions, countdown timer, score panel and application control buttons
which situated on planes floating above the 3D scene. The application was developed
using Unity3D.
4 Results
A set of information modalities and the type of information to be conveyed need to
be defined and categorized. In corresponding with cognitive theories, the modality set
needed to include visual, auditory, verbal and non-verbal, haptic properties. Hence, in
order to allow all combinations of these properties, five types of information modalities
were selected which are text (visual, verbal), image/icon (visual, nonverbal), speech
(auditory, verbal), sound (auditory, nonverbal) and vibration (haptic, nonverbal). The
reason visual and auditory modalities were chosen is because it has been investigated
the most in nearly all application domains.
A total of 40 participants were volunteered in this study. All the participants own
a smartphone. Almost all of the participants make used audio interaction using their
smartphone. All of the participants have tried at least one type of AR application and it
shows that participants are familiar with AR technology.
Survey results were divided into 3 sections which are: - (i) Results from QUIS for
First Condition; (ii) Results from QUIS for Second Condition; and (iii) Comparison
between QUIS for first condition and second condition.
The Roles of Information Presentation on User Performance
599
4.1 Results from QUIS for First Condition
In this result section, the first condition was on combinations of visual output modalities
and auditory output modalities due to its natural uses in the mobile device. For visual
output modalities, it consists of text, graphics and images. For auditory output modalities,
only sound (background music) was available.
Results from the Overall Reactions to the Application. For Q1_A (Is it difficult or
easy?), the majority (28 participants) find it difficult to use the interface of the application
While for Q2_A (Is it frustrating or satisfying?), the majority (36 participants) respond it
was frustrating. Q3_A (Is it dull or stimulating?) shows the majority (32 the participants)
respond it was a dull application. However, the majority (28 participants) respond that
the application is flexible on Q4_A.
4.2 Results from QUIS for Second Condition
In this result section, the second condition was on combinations of visual output modalities, auditory output modalities and haptic output modalities. For visual output modalities, it consists of text, graphics and images. For auditory output modalities, sound
(background music and score sound) and speech were included together. For haptic
output modalities, the vibration effect was added in the mobile AR application.
Results from the Overall Reactions to the Application. For Q1_B (Is it difficult or
easy?), majority (30 participants) find it easy to use the interface of the application. While
for Q2_B (Is it frustrating or satisfying?), the majority (31 participants) respond it was satisfying. Q3_A (Is it dull or stimulating?) shows majority (32 the participants) respond it
was stimulating when using the application. Next, the majority (26 participants) respond
that the application is flexible on Q4_B.
4.3 Comparison Analysis Between First Condition and Second Condition
Figure 1 shows the user performance based on response time. The result suggested that
there was a significant difference in mean response time between the combination of
with and without output modalities (sound and haptic feedback), with Z = –6.742; p <
.001. Hence, it was concluded that combination with output modalities performs faster
in terms of response time. Therefore, it was statistically confirmed that a combination
with output modalities (Ct_HS) is able to improve user performance in mobile AR
applications.
Figure 2 shows the user performance on the score. The combinations with output
modalities have a greater effect on scores achieved by participants in this task-based
performance due to its significance and higher median and mean scores compared to
combinations without output modalities.
600
N. I. A. M. Nazri and D. R. A. Rambli
Fig. 1. User performance based on response time
Fig. 2. User performance based on the score
The Roles of Information Presentation on User Performance
601
5 Discussion
For the first condition, most of the participants gave a negative comment due to no
additional information modalities being present in the first condition. In this mobile
AR application, there are 3 interfaces, namely Main interface, Instruction interface and
Game interface. In the main interface in the first condition, most of the participants found
it was dull. In the Instruction interface, almost all participants’ voice out that they found
it was annoying when the speech modality (giving instruction) was present in the second
condition. This was shown in negative reaction of Usability & UI part in survey result.
Participants stated that it was not necessary to include the speech modality to give the
instruction as they were able to read from the text given. Furthermore, it has created a
privacy issue. In the Game interface for the first condition, the score and time (2D graphic)
were positioned on the top left and right. While for ‘HOME’ and ‘EXIT’ button is on
the bottom left and right of the mobile device screen. This has created a distraction
and dissatisfaction as participants were not able to view other objects properly in the
virtual scene. Moreover, as there were no sound modality and haptic modality available,
participants mentioned that something felt missing. Furthermore, participants mentioned
they were confused to interact with AR application when the environment around them
was too bright or too dark. They also mentioned that the color of the avatar and other
3D object was small and almost the same as the image of AR marker.
For the second condition, most of the participants gave a positive comment, especially
when sound modality and haptic modality was included together. Participants were aware
of their surrounding in the virtual scene, when these two information modalities being
present where participants getting a point, bonus point or clicking a button. In the Main
interface, participants found it was exciting when there is a sound and vibration produced
when they click ‘PLAY’ button. This has made them be ready for next interface. In the
Instruction interface, participants stated they were able to read the instruction easily from
the text given as they make used of zoom in and zoom out from the mobile device without
any additional speech aid (adjusting and positioning the camera view). Participants also
stated that the image of ‘HOME’ and ‘EXIT’ button was easy to be understood and both
buttons were in the center of their view. Furthermore, the sound of clicking and vibration
has made the participant to get ready to play the game as soon as the interface changed.
In the Game interface, participants mentioned that they were aware with the surrounding in the virtual environment due to the support from sound and haptic modality
being present. Moreover, in the second condition, the score and time board were inside
the virtual environment which did not block the view of the Game interface.
5.1 Implementation Concerns for Information Presentation in Mobile AR
There are 2 factors that become a concern when implementing information presentation
in mobile AR which are the environment factor and user factor. These factors did affect
the roles of information presentation in AR applications.
Environment Factor. Environmental factors that need to be considered are making
sure the gesture recognition is possible through better lighting and brightness of screen
display. Furthermore, able to adapt noisy condition and able to identify the user’s hand
602
N. I. A. M. Nazri and D. R. A. Rambli
motion. It also should be able to give the user the distribution of force, and pressure
based on certain conditions.
User Factor. One of the user factors is user preferences which can be interchangeable
to suit with the user choices. User preferences consist of familiarity with the application,
interest in other interaction mechanisms and error avoidance. Another user factor that
needs to be considered is user satisfaction which consists of comfortableness, being in
control and easy to use.
6 Conclusion
This research has reached the aim of examine the roles and optimal combination of
information presentation to support user performance in mobile AR application. It was
found that to support visual modality of information presentation in mobile AR, the use
of sound and haptic feedback is needed by providing feedback in response to interaction
between user and virtual object. However, certain condition needs to be considered such
as the condition of real environment (brightness, noises and etc.)
In conclusion based on results above, (i) it was not necessary to include the speech
modality to give the instruction as they were able to read from the text given as it created
a privacy issue, (ii) Too many icons create disturbance for the user and create confusions;
(iii) With additional output feedback, it will instill awareness in virtual scene, (iv) Sound
feedback and haptic feedback is the optimal combination of information modalities based
on user preferences.
However, it is worth mentioning, that the use of information modalities is sometimes
influenced by the user preferences and user perceptions to environment or surrounding.
This can be classified as environment and user factor that will affect the user performance
and user satisfaction towards the mobile AR application. Therefore, there is a need
to conduct a further study that will combine information modalities with interaction
modalities to find more empirical evidence and optimal combination to support the
effectiveness of user performance.
References
1. Jaziar, R., Tim, A.M., Jennifer, F., Isabell, W.: A systematic review of immersive virtual reality
applications for higher education: design elements, lessons learned, and research agenda.
Comput. Educ. 147, 103778 (2020)
2. Miller, M.R, Jun, H., Herrera, F., Yu, V.J., Welch, G., Bailenson, J.N.: Social interaction in
augmented reality. PLoS ONE 14(5), e0216290 (2019)
3. Doukianou, S., Daylamani-Zad, D., O’Loingsigh, K.: Implementing an augmented reality
and animated infographics application for presentations: effect on audience engagement and
efficacy of communication. Multimed. Tools Appl. 80, 30969–30991 (2021)
4. Lee, G.A., et al.: Freeze-set-go interaction method for handheld mobile augmented reality
environments. In: Paper Presented at the Proceedings of the 16th ACM Symposium on Virtual
Reality Software and Technology, pp. 143–146 (2009)
The Roles of Information Presentation on User Performance
603
5. Sun, M., Ren, X., Cao, X.: Effects of multimodal error feedback on human performance in
steering tasks. Inf. Media Technol. 6(1), 193–201 (2011)
6. Koelsch, M., Bane, R., Hoellerer, T., Turk, M.: Multimodal interaction with a wearable
augmented reality system. IEEE Comput. Graph. Appl. 3, 62–71 (2006)
7. Sarter, N.B.: Multimodal information presentation: design guidance and research challenges.
Int. J. Ind. Ergon. 36(5), 439–445 (2006)
8. MobiDev Homepage. https://mobidev.biz/blog/augmented-reality-development-guide.
Accessed 21 Nov 2021
9. Mohring, M., Lessig, C., Bimber, O.: Video see-through ar on consumer cell-phones. In: Paper
presented at the Proceedings of the 3rd IEEE/ACM International Symposium on Mixed and
Augmented Reality, pp. 252–253 (2004)
10. Schall, G., et al.: Global pose estimation using multi-sensor fusion for outdoor augmented
reality. In: 8th IEEE International Symposium on Paper presented at the Mixed and Augmented
Reality, 2009. ISMAR 2009, pp. 153–162 (2009)
11. Interaction Design Foundation. https://www.interaction-design.org/literature/book/the-enc
yclopedia-of-human-computer-interaction-2nd-ed/3d-user-interfaces. Accessed 21 Nov 2021
12. Hornbæk, K., Hertzum, M.: The notion of overview in information visualization. Int. J. Hum
Comput Stud. 69(7), 509–525 (2011)
13. Bell, B., Feiner, S., Höllerer, T.: View management for virtual and augmented reality. In:
Paper presented at the Proceedings of the 14th annual ACM symposium on User interface
software and technology, pp. 101-110 (2001)
14. Bordegoni, M., et al.: A standard reference model for intelligent multimedia presentation
systems. Comput. Stand. Interfaces 18(6), 477–496 (1997)
15. Card, S.K., Mackinlay, J.D., Shneiderman, B.: Readings in Information Visualization: Using
Vision to Think. Morgan Kaufmann, (1999)
16. Tegegne, T.H., Mincheol, K.: Mobile Augmented reality in electronic commerce: investigating
user perception and purchase intent amongst educated young adults. Sustainability 12, 9185
(2020)
17. Tobias, M.: Challenges in representing information with augmented reality to support manual
procedural tasks. AIMS Electron. Electr. Eng. 3(1), 71–97 (2019)
18. Lombard, M., Ditton, T.: At the heart of it all: the concept of presence. J. Comput. Media.
Commun. 3(2), JCMC321 (1997)
19. Reeves, L.M., et al.: Guidelines for multimodal user interface design. Commun. ACM 47(1),
57–59 (2004)
20. Held, R.M., Durlach, N.I.: Telepresence. Presence: Teleoperators and Virtual Environments
1992 vol. 1, pp. 109–112 (1992)
21. Sarter, N.B.: Multimodal information presentation in support of human-automation communication and coordination. Adv. Hum. Perform. Cogn. Eng. Res. 2, 13–36 (2002)
22. Sekaran U.: Research Method for Business: A Skill Building Approach. John Wiley & Sons
(2003)
23. Nielsen, J.: Usability Engineering: Elsevier, Amsterdam (1994)
24. Chin, J.P., Diehl, V.A., Norman, K.L.: Development of an instrument measuring user satisfaction of the human-computer interface. In: Paper presented at the Proceedings of the SIGCHI
conference on Human factors in computing systems, pp. 213–218 (1988)
Relevance Judgment of Argument Quality
and Online Review Adoption During
Information Search in e-Commerce Review
Platform
Nur Syadhila Che Lah1(B) , Ab Razak Che Hussin2 , Norazira A. Jalil1 ,
and Nor Fatiha Subri1
1 Universiti Tunku Abdul Rahman, Kampar Perak, Malaysia
{syadhila,noraziraj,fatihas}@utar.edu.my
2 Universiti Teknologi Malaysia, Skudai Johor, Malaysia
abrazak@utm.my
Abstract. The landscape of e-Commerce review platforms can be assumed to be
in a state of constant growth due to the viral nature of web content. Furthermore,
the leading features of these platform has been acclaimed to be among the influential factors in shaping the behavior of online consumer. Even so, in this regard,
if the platform presents too many reviews in non-relevant manner, this may be
time-consuming and cumbersome to be understand. Hence, awareness on identifying valuable content of online reviews during information searching process has
become important part for online businesses. This study purposely aims to develop
a model to understand consumer adoption of online reviews based on dynamics
relevance judgment of argument quality in e-Commerce review platform. Elaboration Likelihood Model (ELM) is used in developing the research model to find
the potential effects of consumer relevance judgment from information retrieval
perspective, which include perceived informative and affective relevance. A quantitative research method has been applied to test and validate the proposed research
model. Total of 238 valid respondents has been analyzed using the Partial Least
Square Structural Modelling (PLS-SEM) technique. From the research findings,
the study found that, content novelty, content topicality, content similarity, content tangibility and content sentimentality could positively influence perception
of argument quality which led to information adoption behavior. To be concluded,
the importance of information relevancy was also highlighted in this study, which
reveals some appropriate features that can be utilized by e-Commerce practitioners
to better refine their information search criteria in online review platforms.
Keywords: Online behavior · Information retrieval · Informative relevance ·
Affective relevance · ELM · PLS-SEM technique
1 Introduction
Online reviews can be described as any judgment posted by previous buyers to describe
about the product, the services or the brand published on the websites. The accessibility
© The Author(s), under exclusive license to Springer Nature Switzerland AG 2022
F. Saeed et al. (Eds.): IRICT 2021, LNDECT 127, pp. 604–615, 2022.
https://doi.org/10.1007/978-3-030-98741-1_50
Relevance Judgment of Argument Quality and Online Review Adoption
605
of online reviews permits a consumer to make an alternative comparison adjusting to
their need during information seeking process. The influence of this information roles
is assumed to reach beyond any other marketing strategy and advertising campaign
[1]. Many studies have been done to investigate the contribution factors of information
quality. However, the results have shown inconsistent conclusions as to how this quality assessment could affect the adoption of online reviews [15]. Additionally, previous
studies tend to focus the investigations on the single outcome of argument quality [3].
On the other side, information relevance is proved as one of the most salient subjective
quality [4], but still few scholars applied this dimension to represent argument quality
perceptions. Hence, the nature of information relevance is worth to be explored as valuable clues in online review platform [2]. Limited studies in testing the multidimensional
constructs of argument quality and lack of knowledge on subjective influence towards
information adoption behavior are the main identified problems that this study seeks
to address. The adoption of IS theories can be made in this research model to test on
the relationships of the proposed constructs. Based on this concern, the main research
question to be answer is “How can a model be developed to improve argument quality
perceptions in the adoption of online reviews across e-Commerce review platforms?”.
2 Theoretical Background and Model Development
Dual-process theory of Elaboration Likelihood Model (ELM) designed by Petty and
Cacioppo (1980), has been selected most as the research framework to study about
argument quality perceptions. ELM posits that, the individual ‘s attitude change will be
caused through the central and peripheral routes [16]. In the context of online review
platform, when consumer take a central route, they are assumed to take the maximum
effort in evaluating the quality of the received information [11]. Since the focus of this
study is to enhance relevance filter of text recommendations, it is assumed that online
consumer is more willing and highly motivated to process the pertinent content of review
message. Hence, this study proposes that, online consumer will be more likely to use
the central route, which involves the relevance judgment of quality dimension of review
arguments. In general, the central route encompasses the higher level of information
processing within an online communication context. At this stage, online consumer is
assumed to critically analyze the message’s contents rather than read in casually. Moreover, a consumer is likely to invest in inspecting the credible features of information
content, hence the focus is attributed to the strength of message arguments. From literature review done by this study, the nature of information relevance is always perceptual
in delivering the most valuable clues of information in a review platform which can be
proved from the study by [2] that shows, perceived review relevancy was found to be the
strongest predictors towards information diagnosticity, in both of their research sample
in 2011 and 2016.
2.1 Factors Derivations
Based on ELM and the representation of argument quality as the central route, a theoretical model is proposed for this study. Since this study is concerned on how to assess
606
N. S. C. Lah et al.
the value of information content from informational and persuasive viewpoint, thus perceived informative relevance (informational value) and perceived affective relevance
(motivational value) was selected in predicting consumer judgment of argument quality
in online review platform. Both relevance dimensions are adopted from the previous
research framework proposed by [6]. In the research framework, some relevance criteria
have been confirmed that suit with informative and affective dimensions. The element of
scope has been rejected from the research framework due the insignificant impact towards
information relevance judgment. Thus, the study will adopt the element of novelty, topicality, reliability and understandability (readability) in the process of developing the
research model for this study. In addition, a modification on previous framework from
[7] are made with the extension on some relevance criteria concerning on argument
quality dimensions. In performing this process, the next review analysis from previous
studies is conducted related to information relevance judgment and their effect towards
online behavior intention. From here, the study proposed the factors of informative relevance based on content novelty, topicality, reliability and similarity, while factors of
affective relevance based on content tangibility, readability and sentimentality.
2.2 Research Hypothesis
According to [17], content novelty is defined as the degree, to which the information
within the existing background knowledge of a consumer is perceived to be new. A
unique experience with particular product knowledge may represent unforeseen product
attributes that could activate the level of surprise amongst consumers. The level of
surprise could be based on the variation of new and previous product consumptions. The
novelties seeking behavior is assumed to lead the user judgment on informational value
of online review credibility.
H1: Content novelty has a positive effect on the perceived informative relevance of
online reviews.
Perceived content topicality refers to topical relatedness or ‘about-ness’ of received
information towards a user’s queries, which is viewed as a return towards informational
value searching behavior [7]. The fundamental design of a system relevance from topicality conception is such a search engine, which should return a document that is assumed
to be within the frame of the user’s interests [18]. The topicalities seeking behavior is
assumed to lead a user’s judgment on informational and persuasive values of online
review credibility.
H2: Content topicality has a positive effect on the perceived informative relevance
(2a) and perceived affective relevance (2b) of online reviews.
Content reliability refers to the perceptions of information truthfulness in accordance with informational value seeking behavior. Concerning on this situation, this
study assumed that, if the review system could be designed to filter informational cues
based on information familiarities from one’s background, and is assumed to well-fit
with someone’s knowledge, the readers may pay more attention towards the argument in
the online reviews. The reliability seeking behavior is assumed to lead a user’s judgment
on the informational value of the online review credibility.
H3: Content reliability has a positive effect on the perceived informative relevance
of online reviews.
Relevance Judgment of Argument Quality and Online Review Adoption
607
Similarity cues may assist individuals to transfer their positive feelings over to the
other person, social group or product and services [3]. In the context of online communication, [5] suggested that similarity cues could be obtained from personal and usage
characteristics in an online review. Following these logics, this study assumed that, if
the review platform could be designed to filter these similarity cues shared between the
focal consumer, the informational and persuasive value of information could be created.
These similarities seeking behavior thus could be used to predict the adoption of text
recommendation in the online review platform.
H4: Content similarity has a positive effect on the perceived informative relevance
(4a) and perceived affective relevance (4b) of online reviews.
Content readability is defined as the extent to which a user perceives a received
document’s information as easy to be read and understood [7]. [18] showed that, the
reviews that are written with lesser content abstractness and highly comprehensive, tend
to return much higher perceptions of review helpfulness. On the other hand, with certain
levels of information relevance, documents that are difficult to read may causes fatigue
and make a user less happy. Text readership is assumed to lead a user’s judgment on the
persuasive value of text recommendations.
H5: Content readability has a positive effect on the perceived affective relevance of
online reviews.
Content tangibility can be defined as the extent to which information provided is
assumed to be real, definite, proven and consists of tangible issues [20]. In addition, the
essence of mental intangibility is defined as to whether the consumers could interpret
the evaluation cues to ensure a clear representation of the object, and mentally make a
visualization of the intangibilities [21]. The tangibility seeking behavior is assumed to
lead a user’s judgment on persuasive and the informational value of an online review’s
credibility.
H6: Content tangibility has a positive effect on the perceived informative relevance
(6a) and perceived affective relevance (6b) of online reviews.
Perceived content sentimentality refers to the degree of affective response towards
the given information [22]. In the context of online review platforms, the reviews with
high levels of positive sentiments are the review’s title, which would encourage more
readership, while opinions with neutral polarity in the text recommendations are perceived to be more helpful [23]. This sentiment seeking behavior is assumed to lead a
user’s judgment on the persuasive value of a review’s credibility.
H7: Content sentimentality has a positive effect on the perceived affective relevance
of online reviews.
Perceived informative relevance or cognitive relevance judgment refers to the pragmatic values obtained from information content for the purpose of user problem solving
[24]. This type of relevant judgment can be referred to as the degree of information
enlightenment information content, which brings a user and can be judged as perceived
knowledge enrichment by the user [7]. This process shows that, information recipients might undergo significant intellectual effort during an argument’s evaluation when
they have sufficient ability and cognitive resources. Based on these concerns, this study
therefore expects that, the perceived informative relevance of content reviews might be
608
N. S. C. Lah et al.
achieved by identifying informational cues from text recommendations in the online
review platform.
H8: Perceived informative relevance has a positive effect on the argument quality.
Affective relevance is defined as one’s affective reaction, such as enjoyment or sadness, as the results from the activity consumption of a document [7]. In the context
of online review platforms, past research works have shown that, the perceived high
argument quality might be imposed through relevant judgment related to the strength of
persuasive arguments embedded in the review content, which further predicts consumer
behavior intentions [3]. Thus, this study assumed that the perceived affective relevance
of review content can be activated by recognizing these emotional values and intrinsic
motivation cues from text recommendations.
H9: Perceived affective relevance has a positive effect on the argument quality.
Argument quality is defined as the perceptions of strong and convincing messages,
rather than weak and unreal ones [25]. In the context of online decision-making, information quality is defined as helpfulness of available information regarding product
attributes, which could assist consumers in evaluating the quality of the product [26].
H10: Argument quality has a positive effect on the review helpfulness.
Perceived review helpfulness can be defined as an individual’s perception related to
the performance enhancement upon consumption of a new technology. The proposed
concept of argument quality, which is defined based on the consumer’s judgment of
review relevancy, will be used to predict the consumer’s perceptions towards information
helpfulness.
H11: Review helpfulness has a positive effect on the review adoption.
3 Research Method
A survey method as a common research methodology for quantitative research approach
was selected for this study. Through the survey method, the data collection phase can
be conducted by gathering the valuable responses, which can be further used in testing the proposed research model and identifying the relationship amongst key factors.
For that reason, a questionnaire was designed based on the developed research model
and was distributed amongst respondents across two phases. The first phase involved a
pilot testing of the questionnaire (confirming its reliability and validity) and the second
phase (main study) was about the decision evaluation on the acceptance or rejection
of the research hypothesis. Finally, the last phase involving the steps in validating the
relationships in the proposed research model.
3.1 Data Collection
The questionnaire consisted of five sections. Section A was about the screening question
on consumer’s validity for participating in the survey. A respondent needs to answer
about their experiences in reading the online product reviews. The subsequent sections
B, C and D of the questionnaires, reflected the core element of this research. In total,
45 questions were put forth. Section B was about accessing the level of the consumer’s
agreement concerning the content characteristics of argument in the online reviews, and
Relevance Judgment of Argument Quality and Online Review Adoption
609
section C was related to the consumer’s responses on the relevant judgment of argument
quality embedded in the online reviews. Section D was developed to find the relationship
between the consumer’s relevant judgment of argument quality and information adoption
behavior. In the last section, E, information on the respondent’s demographic profile was
gathered. In total, the questionnaire consisted of 59 questions. The respondents were
asked to respond to each of the questions, by choosing one of five alternatives given,
ranging from “strongly agree” to “strongly disagree”, (5-point Likert scale) as proposed
by (Likert, 1932). The final step in designing the appropriate survey instrument include
the process of checking the validity and reliability of the survey content. The survey
questions were then evaluated by five experts in the field of Information System (IS),
Universiti Teknologi Malaysia, to check the item’s relevancy with reference to each
contrasting definition. From the results, some items did not perfectly pass the required
threshold, which can be referred to its convergent validity, AVE. Design constructs of
novelty, topicality, reliability and readability are those having AVE scores below 0.5.
Thus, four items based on the outer loading achievement were removed to increase the
AVE score, which were, NOV4, TOP1, REL2 and READ4. Consequently, a refined
measurement items was generated, which can be used in the subsequent analysis.
4 Research Result
4.1 Assessment of Measurement Model
The internal consistency, convergent and discriminant validity analysis will be used to
access those the reflective constructs. This was done by accessing the criteria from factor
of outer loading, average variance extracted (AVE), Cross-factor loading and FornellLacker test. On the other hand, the minimum value recorded for composite reliability
test is 0.79 and all the values for the constructs are below than 0.95. The results show
that, all the constructs have achieved the acceptable internal consistency reliability hence
proved that all the constructs’ indicators are reliable. The test from convergent validity,
the results of outer loading (Table 1) for all the indicators have exceeded the suggested
threshold, except for three indicators (REL2, TAN2, and TOP3), which the item’s loading
were less than the recommended value. Next, the three indicators that were identified for
scale removal need to be deleted one by one to check if the AVE value could be changed
after that.
610
N. S. C. Lah et al.
Table 1. The results of convergent validity analysis
Construct
Convergent validity
Construct Name
Construct Code
AVE (>0.5)
Outer Loading
(>0.7)
Argument Quality
ARQ
0.632
ARQ1
0.748
ARQ2
0.870
ARQ3
0.749
ARQ4
0.808
PINR1
0.879
PINR2
0.890
PINR3
0.869
PINR4
0.858
PAFR1
0.797
PAFR2
0.806
PAFR3
0.806
Informative
Relevance
Affective
Relevance
Novelty
Readability
Reliability
Review Adoption
Review Helpfulness
PINR
PAFR
NOV
READ
REL
RADP
RHEP
0.764
0.647
0.584
0.554
0.532
After Item Deletion (0.595)
0.655
0.699
PAFR4
0.810
NOV1
0.798
NOV2
0.701
NOV3
0.789
READ1
0.751
READ2
0.754
READ3
0.727
REL1
0.761
REL2
0.675
REL3
0.749
REL4
0.728
RADP1
0.812
RADP2
0.850
RADP3
0.825
RADP4
0.748
RHEP1
0.786
(continued)
Relevance Judgment of Argument Quality and Online Review Adoption
611
Table 1. (continued)
Construct
Construct Name
Sentimentality
Similarity
Tangibility
Topicality
Convergent validity
Construct Code
SENT
SIM
TAN
TOP
AVE (>0.5)
0.676
0.645
0.506
After Item Deletion (0.596)
0.515
After Item Deletion (0.584)
Outer Loading
(>0.7)
RHEP2
0.853
RHEP3
0.880
RHEP4
0.822
SENT1
0.817
SENT2
0.834
SENT3
0.779
SENT4
0.856
SIM1
0.766
SIM2
0.878
SIM3
0.781
SIM4
0.784
TAN1
0.710
TAN2
0.642
TAN3
0.744
TAN4
0.744
TOP1
0.705
TOP2
0.775
TOP3
0.680
TOP4
0.708
4.2 Assessment of Structural Model
This stage involves the step in examining the predictive capabilities of the model, together
with their construct’s relationships. The first step in this stage is to conduct the collinearity
assessment, which can be done by obtaining the value of VIF test. From Table 2, the
results for t value and p value for all hypotheses are acceptable, except for H3 and
H7, which exceed the threshold value, thus, these two hypotheses, need to be rejected
from the research model. Next, the assessment of coefficient of determination of R2
value need to be conducted. This was performed to measure the predictive power of the
model. Therefore, the path coefficient representing the amount of variance for dependent
constructs explained by all the independent constructs associating to it. The result shows
that, all the five constructs have the moderate level of predictive power. From all data
analysis results, the final research model for this study is visualized in Fig. 1.
612
N. S. C. Lah et al.
Table 2. Evaluation of research hypothesis
Path
t values
p values
Significant level
Argument Quality - > Review Helpfulness
18.986
0.000
***
Informative Relevance - > Argument Quality
2.916
0.002
***
Affective Relevance - > Argument Quality
8.809
0.000
***
Novelty - > Informative Relevance
1.295
0.098
*
Readability - > Affective Relevance
0.991
0.161
NS
Reliability - > Informative Relevance
1.191
0.117
NS
Review Helpfulness - > Review Adoption
9.105
0.000
***
Sentimentality - > Affective Relevance
4.378
0.000
***
Similarity - > Informative Relevance
5.224
0.000
***
Similarity - > Affective Relevance
1.628
0.052
*
Tangibility - > Informative Relevance
2.660
0.004
***
Tangibility - > Affective Relevance
2.779
0.003
***
Topicality - > Informative Relevance
1.369
0.086
*
Topicality - > Affective Relevance
1.847
0.032
**
Fig. 1. A model of review adoption in e-Commerce review platform
Relevance Judgment of Argument Quality and Online Review Adoption
613
5 Discussion and Conclusions
In this study, dimension of argument quality is classified into two relevant judgments of
online information which are perceived informativeness and perceived persuasiveness.
The model was drawn based on the studies of theory of information adoption, argument
quality dimensions, theory of elaboration likelihood model and information retrieval
perspective. The model tested by using a field survey data from the sample of users
who are deemed to have the good experiences in online purchasing especially in reading online reviews from e-Commerce platforms such as Lazada.com, shopee.com.my
and Carousell.com. The results show that, nine out of eleven proposed hypotheses were
relatively significant which illustrated that, the proposed factors of content novelty, topicality, similarity, tangibility, and sentimentality have the positive influence on argument
quality perception, which then contributes towards the adoption of online reviews in
e-Commerce websites. The other two factors of argument quality, content reliability and
readability, appeared to be the non-significant factors towards the perception of review
helpfulness, which then effect the adoption of online reviews. Additionally, the predictors explained 44.8% of the variance of argument quality, which reflected a significant
and appropriate result for the prediction of online review’s adoption in e-Commerce
websites.
5.1 Practical Contribution
The research model provides a contextualization on how to offer a preferred information
search in e-Commerce review platform. The results shown that, by providing high quality review, the sales team will have the best strategy in terms of convincing the potential
online consumers. The results from the first dimension of the research model suggested
that modern e-Commerce should focus on designing a review filter, which could attract
emotional attention from the information receivers. For example, the enhancement could
be done by placing the online reviews in the prominent filters with such a visible or tangible content. This includes the attachment of useful and interesting external links, the
attractive image or graphics, the organized form of a review’s summary, and providing
the advanced technology, which assumed to increase the probability of motivational values received by the online consumers. The results also revealed that, the review platform
must be designed to provide the information filter based on the appropriate sentiment
classifications. A tractable information cue based on emotional expressions from past
experiences of the users could encourage the active engagement of a user’s intentions
and contribute to the consumer’s decision quality. Therefore, the awareness of such matters on e-Commerce websites deserves continuous attention for practical considerations.
The second dimensions of the research model provide the remarkable role of informational values specific to content novelty, content topicality and content similarity which
assumed to strongly eliminate the information gaps amongst the knowledge seekers.
For example, the review platforms can be supported with such a noticeable filter on the
topicality search field.
614
N. S. C. Lah et al.
5.2 Theoretical Contribution
Against the previous studies background, based on subjective measures of argument
quality and taking the view of relevant judgment from information retrieval perspective,
this study explores an additional path alongside the cognitive path of perceived credibility
of online reviews. Since perceived content relevancy is amongst the heart of argument
strength prediction as confirmed by [3], neglecting the effect and associated factors seems
to be excluded in the case of an online review adoption. Hence, this study is amongst
the first few to have investigated the subjective measure of argument quality to predict a
better adoption of online revies. Consistent with the previous research results by [4], the
findings from the study suggest that argument quality was the most influential stimulus
provoking perceived helpfulness of online reviews. The first contribution can be seen
from the delivery of the research model through the lens of Elaboration Likelihood Model
(ELM), information adoption model and information retrieval perspectives. The study
offers empirically validated factors pertaining to the information adoption behavior in
e-Commerce review platform. Following the extensive research review and analysis, the
study has demonstrated the promised factors according to two important dimensions of
argument quality, which include perceived informative relevance (i.e., content novelty,
content topicality, and content similarity) and perceived affective relevance (i.e., content
tangibility and content sentimentality). These factors have shown the significant impacts
on argument quality perceptions and subsequently effects the process of review adoption.
Therefore, the future research for improving the conceptualization of argument quality
perceptions should put extra considerations with regards to these factors, which are
assumed to further offer better predictions for the consumer behavior in the e-Commerce
websites.
References
1. 2018 ReviewTrackers Online Reviews Survey. (n.d.). https://www.reviewtrackers.com/onl
ine-reviews-survey. Accessed 5 March 2019
2. Filieri, R., Hofacker, C.F., Alguezaui, S.: What makes information in online consumer reviews
diagnostic over time? the role of review relevancy, factuality, currency, source credibility and
ranking score. Comput. Hum. Behav. 80, 122–131 (2018)
3. Zhang, K.Z., Zhao, S.J., Cheung, C.M., Lee, M.K.: Examining the influence of online reviews
on consumers’ decision-making: a heuristic–systematic model. Decis. Support Syst. 67, 78–89
(2014)
4. Watts, S., Shankaranarayanan, G., Even, A.: Data quality assessment in context: a cognitive
perspective. Decis. Support Syst. 48(1), 202–211 (2009)
5. O’Reilly, K., MacMillan, A., Mumuni, A.G., Lancendorfer, K.M.: Extending our understanding of eWOM impact: the role of source credibility and message relevance. J. Internet
Commerce 15(2), 77–96 (2016)
6. Xu, Y.: Relevance judgment in epistemic and hedonic information searches. J. Am. Soc.
Inform. Sci. Technol. 58(2), 179–189 (2007)
7. Xu, Y., Chen, Z.: Relevance judgment: what do information users consider beyond topicality?
J. Am. Soc. Inform. Sci. Technol. 57(7), 961–973 (2006)
8. Saracevic, T.: Relevance reconsidered. In: Proceedings of the Second Conference on Conceptions of Library and Information Science (CoLIS 2), pp. 201–218. ACM, New York, October
1996
Relevance Judgment of Argument Quality and Online Review Adoption
615
9. Bhattacherjee, A., Sanford, C.: Influence processes for information technology acceptance:
an elaboration likelihood model. MIS Q. 805–825 (2006)
10. Ahn, T., Ryu, S., Han, I.: The impact of Web quality and playfulness on user acceptance of
online retailing. Inf. Manage. 44(3), 263–275 (2007)
11. Meng, B., Choi, K.: Tourists’ intention to use location-based services (LBS): converging
the theory of planned behavior (TPB) and the elaboration likelihood model (ELM). Int. J.
Contemporary Hospitality Manage. (2019)
12. Hair, F.J., Jr., Sarstedt, M., Hopkins, L., Kuppelwieser, G., V.: Partial least squares structural
equation modeling (PLS-SEM) an emerging tool in business research. Eur. Bus. Rev. 26(2),
106–121 (2014)
13. Huang, Y.F., Kuo, F.Y.: An eye-tracking investigation of internet consumers’ decision
deliberateness. Internet Res. 21(5), 541–561 (2011)
14. Park, D.H., Lee, J., Han, I.: The effect of on-line consumer reviews on consumer purchasing
intention: the moderating role of involvement. Int. J. Electron. Commer. 11(4), 125–148
(2007)
15. Hong, H., Xu, D., Wang, G.A., Fan, W.: Understanding the determinants of online review
helpfulness: a meta-analytic investigation. Decis. Support Syst. 102, 1–11 (2017)
16. Le, T.D., Dobele, A.R., Robinson, L. J.: WOM source characteristics and message quality:
the receiver perspective. Market. Intell. Plan. (2018)
17. Chen, Y.C., Shang, R.A., Li, M.J.: The effects of perceived relevance of travel blogs’ content
on the behavioral intention to visit a tourist destination. Comput. Hum. Behav. 30, 787–799
(2014)
18. Foster, A., Rafferty, P. (Eds.): Innovations in information retrieval: perspectives for theory
and practice. Facet Publishing (2011)
19. Li, M., Huang, L., Tan, C.H., Wei, K.K.: Helpfulness of online product reviews as seen by
consumers: source and content features. Int. J. Electron. Commer. 17(4), 101–136 (2013)
20. Balatsoukas, P., Ruthven, I.: An eye-tracking approach to the analysis of relevance judgments
on the Web: the case of Google search engine. J. Am. Soc. Inform. Sci. Technol. 63(9),
1728–1746 (2012)
21. Mazaheri, E., Richard, M.O., Laroche, M., Ueltschy, L.C.: The influence of culture, emotions,
intangibility, and atmospheric cues on online behavior. J. Bus. Res. 67(3), 253–259 (2014)
22. Bruza, P., Chang, V.: Perceptions of document relevance. Front. Psychol. 5, 612 (2014)
23. Salehan, M., Kim, D.J.: Predicting the performance of online consumer reviews: a sentiment
mining approach to big data analytics. Decis. Support Syst. 81, 30–40 (2016)
24. Wang, X., Hong, Z., Xu, Y., Zhang, C., Ling, H.: Relevance judgments of mobile commercial
information. J. Am. Soc. Inf. Sci. 65(7), 1335–1348 (2014)
25. Petty, R.E., Briñol, P.: Emotion and persuasion: cognitive and meta-cognitive processes impact
attitudes. Cogn. Emot. 29(1), 1–26 (2015)
An Exploratory Study on the Use of Social
Companion Robot for Adults with Motor
Disabilities
Sofianiza Abd Malik1 , Linah Aburahmah1 , and Muna Azuddin2(B)
1 Prince Sultan University, Riyadh, Saudi Arabia
sabdmalik@psu.edu.sa
2 International Islamic University Malaysia, Kuala Lumpur, Malaysia
munaazuddin@iium.edu.my
Abstract. Assistive technology has been a significant topic in both the research
and manufacturing industry for the past decades focusing on improving social
interaction, supporting health care, business, education, and daily activities. There
are different types of assistive technologies such as wearable devices, mobile applications, automated home appliances, and robots. There is lack of study conducted
to investigate the use of robots among disabled users, such as adult users with
motor disabilities. The aim of this study is to explore the use of a companion robot
called Zenbo in assisting motor disability users in Saudi community. This paper
presented a preliminary work on Zenbo’s design evaluation in terms of functionality, acceptability, and effectiveness. The study used a mixed method such as
observation (hands-on), interview, and survey questions to evaluate the purpose
of the study. The findings showed positive acceptance of Zenbo as a companion
robot due to the physical design. However, the interaction of Zenbo to notify the
users through user interface and wheel light, and processing voice command were
found ineffective and require more improvement.
Keywords: Adults with motor disabilities · Assistive technology · Companion
robot · Zenbo robot
1 Introduction
Robots are machines programed by a computer to simulate humans, interact with them,
and perform complex actions. The use of robots in the industry has been ages. However,
started in year 2005, most of the previous studies regarding robots were discussed in the
domain assisted technology (robotics) for health care and educational [1]. The context
of these studies was, the use of robotics for elderly people and learning disability users
(autism) [1], which the robots able to support them in their daily life and reducing the
load on the caregivers. To date, there is a lack of studies discussed the use of robots
among adults with motor disabilities to support them in their daily activities.
The aim of this study is to explore the feasibility of using social companion robot
(Zenbo) in obstacle detection among adults with motor disabilities. The robot was used
© The Author(s), under exclusive license to Springer Nature Switzerland AG 2022
F. Saeed et al. (Eds.): IRICT 2021, LNDECT 127, pp. 616–629, 2022.
https://doi.org/10.1007/978-3-030-98741-1_51
An Exploratory Study on the Use of Social Companion Robot
617
to assist their movement and to help them be more independent. The paper presented
a preliminary study that discussed issues and challenges of using companion robot by
adults with motor disabilities. The use of Zenbo as the companion robot in the research
is due to the robot’s various capabilities which is discussed in the related work. The
findings may add knowledge to developers and researchers to improve the design of
assisted technology such as robots which the utilization of the robots can be gained
more effectively by the users. In addition, the findings also can assist the designers
and researchers to specifically understand Zenbo’s detection capabilities; issues and
challenges, which may be important for later designing.
2 Related Work
2.1 Disabled People and Assistive Technologies
Around 1.1 billion people have some disability as reported by the World Health Organization and the World Bank [2]. About 110 million to 190 million of the disabled people
are adults, which showed that they are the majority group of the disabled people. A total
of 30.6 million out of them suffer from physical disabilities such as difficulty in walking
[3]. People with physical disabilities need assistance from other people in their daily
lives, such as to perform simple task – turn on lights, they need help from people in
their surroundings. Therefore, ignoring disabled people creates a significant impact on
society.
In Saudi Arabia, 3.73% of the population are people with functional disabilities such
as physical, visual, and mental [4]. A total of 74.2% from this category group of people
(3.73%) needed high attention from the caregivers [4].
Physical disabilities are defined as “the result of a condition affecting mobility, upper
limb disorders or motor coordination in terms of fine and gross motor skills, diagnosed
by a consultant which has an impact on lifestyle, work, movement, and independence.”
[5]. Different types of physical disabilities are either caused by a disease or an accident
to result in temporary or permanent physical disability.
This study focused on adults with movement difficulties. Movement disorders are
defined as severely compromising the person’s ability to perform motor skills as ordinary
people. These skills are such as walking, writing, turning around, or transferring in and
out of bed [6]. People with Parkinson Disease suffered from different disorders such
as Bradykinesia, Akinesia, and Episodes of freezing. Each disorder has its effect on
the person’s movement. Bradykinesia reduced the speed and the amplitude of motion.
Akinesia caused difficulty in initiating movements. Episodes of freezing block the user
movement suddenly while executing a movement sequence [6].
Functional disabled people need caregivers to support them on their daily tasks.
There are different types of disabilities such as physical, mental, hearing, etc. The most
frequent causes of physical impairments are a result of deficiencies to the muscles or the
neurons [7].
The main major challenges that have been highlighted in many research papers are
related to the movement they faced, such as having difficulties to move inside and outside
their homes. They also have a lot of health issues as they are moving less, or not moving
at all. Therefore, their health condition is worse than the ordinary adults of the same age
618
S. A. Malik et al.
[21]. To minimize the efforts that caregivers provide to the disabled people, there are
lots of assistive technologies have been developed in recent years [8–11] (Table 1).
Table 1. Assistive technologies for disabled people.
Technologies
Descriptions
Brain Computer Interface (BCI) It is one of the technologies that enable the physically
disabled adults to control a mobile robot through brain
signals [5, 12]
Virtual Reality (VR)
It has been utilized in the educational aspects where they
have a simulation on the real environment in 3D view [24]
Internet of Things (IoT)
It has many technologies that support disabled people.
Automated home appliances are a common example of the
internet of things that are controlled by disabled people
through voice commands. Also, some devices have sensors
and actuators that can detect incidents at home. This feature
is very helpful in emergency cases [9, 13, 14]
Wearable Devices
Necklace and bracelet are examples of wearable devices that
can detect the fallen behavior of a disabled person and notify
caregivers, family members, or the responsible healthcare
institutes [15, 16]
Robots
It is one of the technologies that are used heavily in the
recent research studies. There are two main types of robots
that are used to serve physically disabled people which are
physically assistive robots and socially assistive robots.
Some robots can be both socially and physically supportive.
The physically assistive robots are usually used in therapy
[17], feeding [18], or in moving the person from one place to
another by acting as a wheelchair [18]
Social assistive robots are also called companion robots. This type of robot can mimic
human behavior [19]. The companion robots have been used in social interactions which
the disabled people use it to communicate with other people, as a daily reminder, as a
fitness coach, respond to inquiries (through voice commands), and as entertainer (play
games) [20–22].
Currently there are lack of research that investigate the use of assisted technology
such as robots to assist the physically disabled people, in the context of adult with motor
disabilities. To date, there are none of research studies in this domain, conducted in Saudi
population. Thus, this study uses Zenbo robot which is designed to fit the use of adult
with motor disability, which to support their movement and emotion.
2.2 Zenbo Robot as the Assistive Technology for Disabled People
Zenbo robot is a ready-made platform that can be customized to fit the different needs of
the users. ASUS developed it with an Android operating system and launched it in 2017.
An Exploratory Study on the Use of Social Companion Robot
619
Zenbo is considered a family robot that is full of energy. The robot is lovely, polite, and
respectful; and always takes the initiative to assist people. Zenbo expresses his emotions
through his agile body and his facial expressions. There are 24 emotions that Zenbo can
possess such as happy, proud, shocked, and tired. There are guidelines related to the use
of Zenbo’s emotion such as maintaining a ratio of 80% and 20% of positive and negative
emotions respectively. Other than the emotions, the robot has high capabilities that allow
developers, business teams, and system integrators to deploy different solutions and to
engage the users compellingly.
Zenbo robot has a lot of built-in movements and functions to perform numerous
tasks such as; i) Zenbo can follow any person by recognizing his face using a built-in
camera, ii) Zenbo can be configured to understand the layout of the user’s house so it can
provide more assistance, iii) Zenbo can be used as a reminder and an alarm, iv) Zenbo
can control home appliances by interacting with connected devices, and v) Zenbo can
recognize the voices and therefore respond to the requests or the spoken questions.
Moreover, Zenbo could be linked with a mobile app and can allow the user to perform
basic configurations. The most important feature that made Zenbo more convenient
for people with movement disabilities is the voice command. Zenbo can receive voice
command in long distance compared to average smartphones or tablets, and this may
ease the disabled people to perform tasks.
For health purposes, Zenbo can help to remind users about their medications. It can
also be used as a recording tool to track the health status of users. For example, the
user can record the blood pressure and sugar concentration daily. In case any of the
measurements are high, Zenbo will notify the responsible doctor or inform the family
members through messages sent to their home. Moreover, Zenbo allows the doctor to
follow up with patients remotely by using the video call feature. Zenbo can provide
instructions to users to perform workouts or rehabilitation exercises.
In a study, Lee et al. [15] presented seven out of eleven emotions of Zenbo. The
emotions were captured from students’ emotion during different scenarios, and the study
was conducted in Taiwan and Japan. The aim of the study was to assess the students’
performance and obtain their feedback about learning systems. Zenbo was used in the
developed module to present the emotions of students using the students’ brainwaves
and transformed it into physiological indices.
Lee and Shin [22] reviewed different companion robots in terms of their ability to
support elderly. Zenbo was included in the review due to the Zenbo features such as
moving around the home, controlling home appliances and doors, shopping online and
searching for recipes through voice commands. Another powerful features that Zenbo
has is the ability to detect human fall and notify family members. For this state of
condition, older people need to wear a wearable device (bracelet) that sent signals to
Zenbo.
Another study conducted by Chien et al. [23] focused on understanding older people’s
attitude towards robots as the robots have been increasingly used as assistants to the older
people. The participants were given a self-rated questionnaire to evaluate their attitudes
before and after their interaction with robot. The researchers prepared a set of tasks
that participants need to perform while using the robot through utilizing the built-in
commands. Some of the commands used were “Hey! Zenbo!”, “what can you do?”,
620
S. A. Malik et al.
“date is tomorrow?”, “Follow me”, “Tell me a story”. Participants whose age ranged
between 59–86 years old showed positive reaction of using the robot.
Meanwhile in the research context of disabilities, Kean [23] used Zenbo to interact
with visually impaired people. The study was conducted among Taiwanese participants
who had different levels of visual impairment ranging from mild to severe and different
demographic backgrounds (12–19 years old). The participants used two robots, Alpha 2
and Zenbo. The results showed that both robots are humanoid and there was no difference
highlighted during the interaction; other than the Chit Chat feature that was developed
and deployed on Zenbo. The feature resulted in Zenbo being more empathetic while
chatting.
All research papers that were discussed earlier involved Zenbo, by utilizing Zenbo’s
capabilities in recording videos, notifying, and calling family members, expressing different emotions, to support older people, students, or visually impaired people. To date,
there were none previous studies has been reported to use Zenbo as the companion robot
among adult with motor disabilities, in Saudi population. The use of Zenbo in the study
will add another contribution for different range of users - to assist adult with motor
disability to detect obstacle.
3 The Preliminary Study
The preliminary study consists of two phases: 1) the user requirements phase, and 2)
the design phase. The first phase focuses heavily on the users (adult with motor disabilities) and their needs. The second phase, the requirements gathered from the first phase
were transformed to low-fidelity prototype, which will be tested before implementing
the solutions in Zenbo. The paper will focus only on Zenbo’s evaluation among the
participants.
It was found (phase 1) that an obstacle detection is needed to check for objects on
the floor to provide users some safety measurement while moving from one location
to another. This is vital to the users because they cannot inspect the path due to their
condition. The following section discussed the embedded obstacle detection solution
in Zenbo and findings of the evaluation. To develop the solution, the voice recognition
feature of Zenbo was utilized to allow participants to communicate with it through a
voice command to check for objects and obstacles on the floor.
4 Methodology
4.1 Participants
Five participants (2 males and 3 females); adults who have motor disabilities were
recruited through the mobile phone and WhatsApp. The participants’ age range was
between 18–50 years old. Four of the participants have a bachelor’s degree while one of
them has a master’s degree. All the participants were Saudis and their disability was since
birth except one whose disability was due to a car accident. The five participants with
motor impairments had different types of disabilities (one was diagnosed with Osteogenesis Imperfecta, two were diagnosed with Cerebral Palsy and two were diagnosed
An Exploratory Study on the Use of Social Companion Robot
621
with Spinal Cord Injury). The participants had experiences with technology as they use
smart phones and computer tablets daily to check on social media and communicate
with others.
4.2 Setting
The study was conducted at five different coffee shops according to participants’ time
availability. The area of the movement was limited because the study was conducted in
a coffee shop, Zenbo moved 600 cm from point A to point B. The obstacle was placed
300 cm away from the starting point. The obstacle used was a box that is 140 cm length,
125 cm width, and 50 cm height. The box was placed horizontally on the floor.
4.3 Materials
Zenbo Application. Zenbo is an android apps and has four types of sensors which
are Sonar Sensor, Drop IR Sensor, Touch Sensor Area, and Auto Recharge Sensor.
In this study, only the Sonar Sensor was activated. Zenbo has three sensors located
at the front of its body that were used in measuring the distance between Zenbo and
its surroundings. The built-in emotions (Confident and Shocked) were selected because
they were the most understandable facial expressions among the 24 emotions that Zenbo
have. Moreover, the wheel lights (red and green) were utilized for notification purposes
after processing the command “Clear the way”. Below is a description of how Zenbo
reacts to the above-mentioned command:
• If the path is clear, Zenbo will move forward with confidence and the wheels lighten
in green
• If an obstacle is found on the way, Zenbo activates the shocked face and the wheels
lightens in red
Questionnaires. Table 2 explains the questionnaires and hands-on methods use in
the study.
Table 2. Methods used in the study.
Methods
Descriptions
Demographic and background questionnaires Demographic and background questionnaires
were used to know about the participants
demographics, daily activities and challenges,
the recommended technologies that can
overcome their challenges, and their
experience with assistive technologies
(continued)
622
S. A. Malik et al.
Table 2. (continued)
Methods
Descriptions
Tasks and Usability Measures
Participants performed two tasks:
• Task 1: Activate Zenbo by saying “Hello
Zenbo”
• Task 2: Use Zenbo to guide you to check the
path by saying “Hey Zenbo, clear the way”
To evaluate Zenbo’s obstacle detection ability,
multiple measures were collected:
• Time taken to complete task 1 and task 2.
Time taken to complete task 1 was the time
of giving the command by the participant,
plus the time of processing the command by
Zenbo, plus the time of giving a voice
response by Zenbo. For task 2, the task time
was the time of giving the command by the
user, plus the time of processing the
command by Zenbo, plus the time of Zenbo
to move in the specified path to detect the
obstacle and show the emotional and wheel
light response
• The task success rate of task 1 and task 2 was
observed and collected. The task
performance was classified using three
categories: 1) performed with ease, 2)
performed with difficulty, 3) failure to
perform the task
• The number of times the participants
repeated the voice command until Zenbo
reacts
• The time in seconds the participant waited to
say the command again when Zenbo did not
detect it at the first time
Think-aloud Protocol and Observations
Participants were asked to think aloud while
they were performing the above-mentioned
tasks. Observations have been gathered as
notes when the participants verbalize their
cognitive thinking of doing the tasks and
express. the users’ facial expression when
interacting with Zenbo
Post-test questionnaire
The post-test questionnaire is a 5-point Likert
scale to evaluate the reliability, usefulness, and
satisfaction of Zenbo. The scale is to measure
Zenbo’s capabilities and design, and
acceptability of Zenbo’s as companion
(continued)
An Exploratory Study on the Use of Social Companion Robot
623
Table 2. (continued)
Methods
Descriptions
Post-Test Interview
To understand participants’ experiences
interacting with Zenbo, usefulness, suggestions
that help to make Zenbo more effective for
navigational needs, and preferences to have
Zenbo as their companion
Procedures. Table 3 explains the data collection procedures.
Table 3. Procedures phase.
No Phase
Description
1
Before the evaluation Before the testing began, the purpose and instructions of the
session were explained to the participants
2
During the evaluation The participants were explained on how to interact with Zenbo, so
they can use it alone to perform the given tasks. Then, participants
were asked to perform task 1 and task 2
3
After the evaluation
Post-Test Questionnaire and the post-test interview were
conducted
5 Results and Discussions
5.1 Time Taken to Complete the Task
Table 4 shows the average time taken by the participants to complete Task 1 and Task 2.
Zenbo spent more time completing task 2 than task 1. This is expected as task 2 requires
Zenbo to move between two points to check if there are obstacles in the way. On the
other hand, task 1 is to activate Zenbo by saying “Hello Zenbo”, which requires less
time.
Table 4. Mean of time on task.
Task #
Mean
Standard deviation
Task 1
22 s
16 s
Task 2
76 s
27 s
5.2 Task Success Rate
Figure 1 shows the success rate of the participants as “Completed with ease”, “Completed
with difficulty”, or “Failed to complete”. Zenbo completed 20% of task 1 commands with
624
S. A. Malik et al.
ease. Eighty percent of the task 1 and task 2 commands were completed with difficulty.
Zenbo failed to perform 20% of task 2 commands. Sometimes Zenbo detected task 2
commands incorrectly. For example, Zenbo processed the command as “Close the way”
instead of the right command “Clear the way”. Participants had to repeat the command
to Zenbo multiple times as demonstrated in Table 5.
Fig. 1. Success distribution for task 1 and task 2.
Table 5. Frequency of repeating task 1 and task 2 commands by users
Users/Tasks
User 1
User 2
User 3
User 4
User 5
Task 1
3 times
5 times
2 times
7 times
3 times
Task 2
3 times
10 times
5 times
4 times
3 times
Participants waited between 8–12 s for Zenbo to perform the tasks before they
repeated their command. Participants seemed worried when Zenbo was not performing
their commands.
Based on the observation, there are some factors have affected the ability of Zenbo’s
to detect the voice commands: 1) the noise during the experimental (coffee shops were
noisy), 2) not pronouncing the command loud enough for Zenbo to detect it, 3) the
commands are in Arabic accent.
5.3 Zenbo’s Design and Capabilities
Figure 2 shows the participant’s evaluation of Zenbo’s physical and aesthetic design as
well as its functional capabilities. Moreover, the observation and interview data were
analyzed to explain the participants’ rating.
The results showed that participants were happy with Zenbo’s physical appeal. When
they saw Zenbo, they showed enthusiasm to interact with it. Participants rated the emotions expressions of Zenbo at 4.5. They loved the humanized face of Zenbo because
it visualizes different emotions. This was mostly observed when they met Zenbo for
the first time during the training session before the experiment. The height of Zenbo
An Exploratory Study on the Use of Social Companion Robot
625
Fig. 2. Zenbo’s design and capabilities
was convenient for the participants whose disability is not very severe because they can
move their head to see what is close to them. One the other hand, the participants who
have severe disabilities preferred Zenbo to be taller because they cannot move their body
easily, therefore they have difficulty to see Zenbo clearly when it is near them.
5.4 Acceptability of Zenbo as Companion
All participants showed high acceptance for Zenbo as a companion (Fig. 3). Based on the
interview, they would love to use Zenbo to perform other tasks such as controlling home
appliances, which they do not have accessibility to. Furthermore, participants suggested
improving Zenbo’s intelligence to be able to carry conversations as a human being with
users. This shows the willingness of the participants to have Zenbo as a companion.
Fig. 3. Acceptability of Zenbo.
5.5 Solution Effectiveness
The worst rating for the solution effectiveness was 1.7 which is for the accuracy of
voice detection (Fig. 4). Participants were frustrated as Zenbo failed to accurately detect
626
S. A. Malik et al.
different words or did not hear the pronounced words. Therefore, the rating for the
reliability of Zenbo was reduced to be 2.5.
As an observational note, when Zenbo changed his facial expression because there
was an obstacle on the way, none of the participants noticed it because Zenbo was
walking in front of them, and they only could just see its back.
The accuracy of voice detection reduces in noisy places. The study was conducted at
coffee shops which had a lot of noise and therefore impacted the performance of Zenbo.
Furthermore, the command needs to be pronounced with loud voice for Zenbo to detect
it.
Some participants had to raise their voices more than their normal tone for Zenbo to
detect the commands. This was exhausting for the participants with motor disabilities
as their muscles are weak or they cannot move them at all.
Fig. 4. Solution effectiveness
6 Conclusion
In general, participants showed positive emotions - likability to Zenbo and how Zenbo
expressed itself through facial expression. They also showed high acceptance to have
Zenbo as a companion and friend. However, the design instruction of Zenbo was not
effective enough to meet the participants’ needs. First, Zenbo was not reacting accurately
to the participants’ voice commands. Second, the emotional expression of Zenbo that
notified the participants about the obstacles cannot be seen by the participants. This was
because Zenbo position (user interface) was not facing the participants. The drawback
of this interaction is because the participants were not able to see the notification of
obstacle on the user interface (Zenbo’s screen). The other notification of Zenbo - the
flashing wheels may be effective for some users; however, it was not effective for others
with severe motor disabilities. Users with severe motor impairments were not able to
move their head down to notice the notifications. Moreover, they were not able to increase
their voice tone for Zenbo to detect the voice command.
There have been many limitations and challenges encountered during some stages in
this study. First, difficulties were experienced in recruiting people with motor disabilities
An Exploratory Study on the Use of Social Companion Robot
627
for the study due to their non-availability and willingness to participate. Second is finding
an accessible and quiet place to conduct the study was challenging. Third, Zenbo can
understand English and Chinese languages only, so finding adults with motor disabilities
who can speak English was great challenge.
In terms of Zenbo robot limitations, to program the movement of Zenbo in scanning
the ground, Zenbo master app needed to be downloaded on the mobile phone. The app
was in Chinese language and an effort was made to find the English version. Then to bind
the robot with the app, an admin account of Zenbo needs to be used. In order to register the
admin account, two verification methods were used, voice encoding and facial detection.
The voice encoding was happening by saying the sentence that Zenbo showed three times.
The main struggle was the sentence was in Chinese. This took a few days until a solution
was found. A live translator app was used to say the sentence in Chinese. Moreover,
Since the robot is relatively new in the market, there were not many documentations
available in forums that can help in the development and troubleshooting. Furthermore,
the ability of Zenbo to detect the voices was not efficient.
There are few suggestion for future work: 1) replicate the study with different cultures
and wider population, 2) improve Zenbo’s language setting – include Arabic language
to be more accessible for Saudi community, and 3) improve Zenbo functions to notify
family members through a phone call and to remove the obstacles and scan the paths
between rooms in a site.
Acknowledgement. This research is funded by the Human Computer Interaction Research
Group; Prince Sultan University, Riyadh, Saudi Arabia [RG-CCIS-2017–06-01].
References
1. Al-Razgan, M., AlFallaj, L.F., AlSarhani, L.S., Alomair, H.W.: Systematic Review of Robotics
Use Since 2005. International Journal of Mechanical Engineering and Robotics Research 5(2),
129–132 (2016)
2. Faroom, S., Ali, M.N., Yousaf, S., Deen, S.U.: Literature review on home automation system
for physically disabled peoples. In: International Conference on Computing, Mathematics
and Engineering Technologies (Icomet), Sukkur, pp. 1–5 (2018)
3. Dolbow, D., Figoni, S.: Accommodation of Wheelchair-Reliant Individuals by Community
Fitness Facilities. Spinal Cord 53(7), 515–519 (2015)
4. Kbar, G., Aly, S.: Smart workplace for persons with disabilities (Smartdisable). In: International Conference on Multimedia Computing and Systems (Icmcs), Marrakech, pp. 996–1001
(2014)
5. Schalock, R.I., Kiernan, W.E.: Habilitation planning for adults with disabilities. Springer
Science & Business Media, 8 & 46 (2012)
628
S. A. Malik et al.
6. Morris, M.: Movement Disorders in People with Parkinson Disease: A Model for Physical
Therapy. Phys. Ther. 80(6), 578–597 (2000)
7. Kassah, A.: Community-Based Rehabilitation and Stigma Management by Physically
Disabled People in Ghana. Disabil. Rehabil. 20(2), 66–73 (1998)
8. Gopinath, E.: Controlling A Human Computer Interface (Hci) Using Electro-Oculography
(Eog) Signal. International Journal of Computing Communication and Information System
(Ijccis) 6, 55–59 (2014)
9. Freitas, D.J., Marcondes, T.B., Nakamura, L.H.V., Ueyama, J., Gomes P.H., Meneguette,
R.I.: Combining cell phones and Wsns for preventing accidents in smart-homes with disabled
people. In: 7th International Conference on New Technologies, Mobility and Security (Ntms),
Paris, pp. 1–5 (2015)
10. Solórzano, S., Rojas-Ortiz, M., López-Molia, R., Clairand, J., Pozo-Espín, D.: Home Teleassistance system for elderly or disabled people in rural areas. In: International Conference
on Edemocracy & Egovernment (Icedeg), Ambato, pp. 380–385 (2018)
11. Molteni, F., Gasperini, G., Cannaviello, G., Guanziroli, E., Exoskeleton et al.: End-effector
robots for upper and lower limbs rehabilitation. Narrative Rev. 10(2), 174–188 (2018)
12. Pasqualotto, E.: Usability and Workload of Access Technology for People with Severe Motor
Impairment: A Comparison of Brain-Computer Interfacing and Eye Tracking. Neurorehabil
Neural Repair 29(10), 950–957 (2015)
13. Padhmaavathi, A., Nandhini, G., Keerthika, S.: Handsfree home automation for disabled
people. J. Global Res. Comput. Sci. Technol. (2015)
14. Saunders, J., Syrdal, D.S., Koay, K.L., Burke, N., Dautenhahn, K.: Teach Me–Show Me—
End-User Personalization of a Smart Home and Companion Robot. IEEE Transactions on
Human-Machine Systems 46(1), 27–40 (2016)
15. Qushem, U.B., Ahmad Dahlan, A.R., Ghani, A.S.B.M.: My emergency assistant device: a
conceptual solution in enhancing the quality of life for the disabled and elderly. In: 6th
International Conference on Information and Communication Technology for the Muslim
World (Ict4m), Jakarta, pp. 82–87 (2016)
16. Lee, C.: Intelligent agent for real-world applications on robotic edutainment and humanized
co-learning. J. Am. Intell. Humanized Comput. 11, 1–19 (2019)
17. Chavarriaga, R.: Multidisciplinary design of suitable assistive technologies for motor disabilities in Colombia. In: IEEE Global Humanitarian Technology Conference (Ghtc 2014), San
Jose California, pp. 386–391 (2014)
18. Lee, Y., Chiu, C., Jhang, L., Santiago, C.: A Self-reliance assistive tool for disable people. In:
3rd International Conference on Control and Robotics Engineering (Iccre), Nagoya, pp. 26–30
(2018)
19. Weinrich, C.: Estimation of human upper body orientation for mobile robotics using an Svm
decision tree on monocular images. In: Intelligent Robots and Systems Conference (Iros),
Portugal, pp. 2147–2152 (2012)
20. Torturella, V.C.: Analysis of the use of a robot to improve social skills in children with Autism
spectrum disorder. Res. Biomed. Eng. 32(2), 161–175 (2016)
21. Mavadati, S.M., Feng, H., Salvador, M., Silver, S., Gutierrez, A., Mahoor, M.H.: Robotbased therapeutic protocol for training children with Autism. In: 25th IEEE International
Symposium on Robot and Human Interactive Communication (Ro-Man), New York, pp. 855–
860 (2016)
An Exploratory Study on the Use of Social Companion Robot
629
22. Saturnino, M.: Fallen People Detection Capabilities Using Assistive Robot. Electronics 8,
915 (2018)
23. Tan, E.: Impact of visual impairment and demographic factors in social participation with
service robots. Ph.D. thesis, Asia (2018)
24. Sobota, B., Korečko, S., Jacho, L., Pastornický, P., Hudák, M., Sivý, M.: Virtual-reality technologies and smart environments in the process of disabled people education. In: 15th International Conference on Emerging Elearning Technologies and Applications (Iceta), Stary
Smokovec, pp. 1–6 (2017)
A Comparison of Block-Based Programming
Platforms for Learning Programming
and Creating Simple Application
Umar AbdulSamad(B) and Rohaida Romli
School of Computing, Universiti Utara Malaysia, 06010 Sintok, Kedah, Malaysia
s.abdullah097@yahoo.com, aida@uum.edu.my
Abstract. Among the several programming paradigms, block-based visual programming has become widespread in recent years. Visual programming language
is any programming language which enables developers to design programs graphically, manipulating rather than by textually defining program elements. Since the
first attempts in the 1970s, visual programming has come a long way, but it still
has an aura of promises that had not been accomplished. Block-based programming avoid the occurrence of syntactic errors. In the current literatures, there
have not much empirical evidence showing and revealing the usage and utilization of the available block-based programming platforms and how these platforms
would offer programming environment that able to engage, motivate and provide
satisfaction to novice learners. Thus, it is significant to analyze the block-based
programming approach to determine the most effective block-based solutions.
Thus, a suggestion on the most effective block-based programming platform(s)
that enables novice learners to develop applications easily can be made. This
paper provides a comparison among different block-based programming platforms
that are currently available, in identifying those that support effective learning in
programming as well as providing ability to speed up the process of writing codes.
Keywords: Block-based programming · Visual programming language ·
Learning programming · Novice programmers
1 Introduction
Inside today’s computing landscape, there are several programming paradigms which
can be used for programming. Some common programming paradigms include imperative models which can be object-oriented, procedural and many others; declarative
models which includes functional, logical programming; and block-based programming
or visual programming [1, 2].
Learning programming via traditional methods and text-based are regarded as quite
difficult [3]. According to the Higher Education Statistics Agency HESA [4], degrees
in Computer Science (CS) have the largest number of students who drop out. The most
recent figures available from HESA, covering the year 2016/17, indicate that before
finishing their degree, 9.8% of CS undergraduates dropped out. The most common
© The Author(s), under exclusive license to Springer Nature Switzerland AG 2022
F. Saeed et al. (Eds.): IRICT 2021, LNDECT 127, pp. 630–640, 2022.
https://doi.org/10.1007/978-3-030-98741-1_52
A Comparison of Block-Based Programming Platforms
631
explanation when it comes to why people quit degree courses across disciplines was
because almost half (49%) said that they did not like it, and 33% said it was too complicated [4]. With this significant drop in the learners’ or programmers’ motivations to
innovate, it is very important for programmers to have a high motivation and satisfaction
[5]. Hence, an increase in satisfaction of programming approach may boost the morale
of programmers or developers. As compared to other programming paradigms, visual
programming makes the learning process simpler and more comprehendible for both
children and programming novices [6].
There are different platforms that adapt block-based programming (that is based
on Visual Programming Language - VPL), such platforms include Scratch, Blockly,
App Inventor, Alice, Snap!, Code.org, Tynker many others [7]. Nowadays, block-based
programming has been utilized by many potential learners or programmers ranging from
young to adults as a steppingstone to learn programming as well as developing small
scale-size applications. This block-based programming paradigm has been shown to
make programming easier and more comprehendible [6]. Thus, it is crucial to ensure
that this block-based programming paradigm provides a platform which can be used to
develop and learn simple application as well as easy to use. For learners to stay motivated,
it is very important to know any available block-based programming platforms that are
satisfactory and fun to use [8].
As there have been not much published empirical evidence showing and revealing
the usage and utilization of the available block-based programming platforms and how
these platforms would offer programming environment that able to engage, motivate
and provide satisfaction to novice learners or programmers to write codes, hence, it is
significant enough to venture in this context of research. In our study, a suggestion on the
most effective block-based programming platform (s) that novice learners or programmers can use to learn and develop small scale-based applications can be drawn. Also,
this would be beneficial to them as block-based programming paradigm able to provide
a better environment to speed up programming effort as well as easily absorb problem
solving skills. However, in this paper, we are merely focusing on a conceptual analysis
and comparison among the identified block-based programming platforms. After conceptually compared these platforms, three of them were selected to be analyzed further
in providing a suggestion on the most effective block-based programming platform (s)
that able to support in developing some simple application among the novice learners.
This article is arranged as follows: In Sect. 2, some fundamental concepts of among
the available block-based programming are addressed. Section 3 provides the analysis
and comparison result of all the block-based programming platforms explained in Sect. 2.
Finally, Sect. 4 concludes of this paper.
2 Block-Based Programming Platforms
Nowadays, there are a lot of different kind of programming platforms which utilize the
block-based programming that based on VPL. Some of these platforms include Scratch,
Snap!, Blockly, Tynker, Code.org, Alice and many others, and they’re designed to teach
kids how to create games and programs, and rather than writing the code, users visually
drag and snaps together blocks of code [9]. Like text-based programming, platforms that
632
U. AbdulSamad and R. Romli
implements block-based programming paradigms can support imperative programming
models or declarative models or both, for example, an extension to Scratch that was
initially called BYOB which stands for Build your Own Blocks was developed by Harvey
and Monig, this extension could implement the Object-Oriented Programming (OOP)
paradigm of imperative models [10].
The sub-sequence paragraphs provide conceptual explanations related the identified
block-based programming platforms. Figures 1, 2, 3, 4, 5, 6 and 7 visualize all the
platforms.
Scratch: As discussed by [11], Scratch is a visual and multimedia programming that
is a Squeak-based. It aims to construct animated sequences in an easy and effective
manner for learning computer programming. Scratch has an interface that is intuitive,
quick and comprehensible, so that novices can learn without much difficulty. users can
work with pictures, photographs, music, create sketches, alter appearance, make objects
communicate with each other and with the user, and make programming fully visual.
Scratch’s programming language and environment work together to create a framework
that is extremely easy to understand. By having an interface which has a single-window,
multipaned architecture, which keeps vital subcomponents accessible at all times, which
thrives to make navigation as easy as possible, a liveness and tinker ability feature which
means there is no need distinction between compilation and edit/run phase and allows
users to play with commands and code fragments in the same way as mechanical or
electronic components are tinkered with. Scratch also gives you visual cues on how well
your program is working. And user cannot encounter error message using this platform.
Scratch transforms variables into tangible objects in which users can see and operate, as
well as allowing them to be better understood through experimenting and perusing. As
Blocks snapped together in Scratch represents programming expressions, statements, or
control structures which forms Scratch scripts, and there have been four basic types of
blocks to pick from. which includes, function, command, control structure, and trigger
blocks. Scratch also has three first-class data types which includes Number, String and
Boolean. However, Scratch is an object-based, not an Object-Oriented Programming
(OOP) language, since it lacks classes and inheritance. Thus, they do not have procedures or concurrency (multi-threading). There have been no straightforward methods
for concurrency control, such as locks, monitors, and semaphores in scratch that are
common in other programming languages. Instead, it adds concurrency control into its
threading model in such a manner that almost all racing conditions are avoided. The
description of scratch above was based on the study conducted by [12].
Blockly: Blockly was created especially for kids and novices. It was designed to allow
this audience without a teacher to use the setting, as its educational mechanics were
designed to be self-taught. With Blockly, the user receives instructions from a set of
educational constructs and after completion users are supposed to be able to use the
traditional text-based languages [11]. Blockly is still in its early stages of production,
so it’s only good for writing short scripts for the time being [13]. Blockly is written in
JavaScript and is meant to be used in a web page [13]. It can also create code that can
be executed independently. It can be modified to enable end users to program web apps
since it can be embedded in a web page and is written in JavaScript [13].
A Comparison of Block-Based Programming Platforms
633
App Inventor: App Inventor is described as a visual and intuitive programming environment that is designed to create completely functional applications for smartphones
and tablets for all types of users including kids and novices [14]. The environment offers
an intuitive metaphor for programming and consists of two parts: a designer that allows
the users to pick application components and a block editor to specify the application’s
behaviours [11].
Alice: This is a block-based platform which allows making of animations, interactive
storylines, and simple 3D games simple for novice [9]. It was created in 1994 at the University of Virginia. The environment is appealing to novice learners because it contains
many 3D model elements such as objects, animals, and vehicles that can be animated by
the user [11]. Alice comes with a number of built-in action commands. Alice’s functions
(procedures) are provided by the Python programming language. Functions are primarily
used in Alice to implement recursion and looping, as well as to implement interactions
through events [15]. Alice error messages, like many other languages, can be cryptic at
times, which means it is possible to make errors in Alice [15].
Snap!: This is a free, block-based educational VPL and online community that enables
users to learn about mathematical and computational concepts while experimenting with,
or developing, games, interactive animations, stories, and more. One of the core ideas
behind Snap! is that it allows programmers to expand the framework by creating blocks
that look and function just like the ones that come pre-installed [16]. Snap! and Scratch
are similar in terms of user interface, events and live parallel blocks. But despite being
inspired from Scratch, Snap! has a lot of advanced functionality [16]. For-example, Snap!
borrows the concept of first class heterogenous lists as the only essential complex data
structure from the Scheme programming language, which we can use to create any other
kind of data structure we might think of. As a result, enables the assignment of these
type of lists to variables, to be used as parameters/dimension in blocks, return them from
procedures, transmitted and received as message [16]. Some unique features of Snap!
is its closures and first class procedures. Programming constructs which enable users to
treat code like data are called closures. It records the context in which they were formed,
as well as variable values in their scope [16].
Code.org: This is a website which hosts graphical programming courses [17]. its environment has been very successful since its release and is available in a variety of languages, making it accessible to people all over the world [17]. Novices can learn algorithms and logic, ‘if’ conditions, variables, loops, and functions by programming with
building blocks (drag-and-drop blocks), which is provided by code.org [18]. According
to [18], tutoring computer programming to fourth grade students on the code.org platform did not enhance their problem-solving abilities; however, the students formed a
positive attitude toward programming.
Tynker: Tynker is a type of block-based programming platform like Scratch. The
graphic design and concepts, like Hopscotch and Snap!, are based on the free Scratch
programming language. Tynker is built on JavaScript and HTML5 and it can be used in
634
U. AbdulSamad and R. Romli
the browser, and from smartphones and tablets too, without the need for plugins [19].
Tynker is an open source software that is more advanced than Scratch and ScratchJr. It is
better used when user have been exposed to more simple apps or have had other programming experiences. Although Hutchison noted that it is not meant for novices, Tynker
makes understanding coding easier because it does so by using games like Minecraft
and Hour of Code to educate them [20].
Fig. 1. Scratch user interface
Fig. 2. Blockly user interface
A Comparison of Block-Based Programming Platforms
Fig. 3. Design section of app inventor interface
Fig. 4. Alice 3.5 interface
Fig. 5. Snap interface
635
636
U. AbdulSamad and R. Romli
Fig. 6. Code.org interface
Fig. 7. Tynker interface
3 Analysis and Comparison Result
There are tremendous advantages of block-based programming. One of these common
benefits is that any of block-based programming platform has served as an environment
to welcome learners into the programming world. Since, the launch of Scratch, there have
been 40 million shared projects. Scratch aims to provide a development platform with
adequate scaffolding for inexperienced programmers to begin programming with almost
no formal instruction, while also supporting complex programs [21]. Furthermore, it
was crucial that it provides support for a variety number of programs and programmers
as well as offering programmers with a platform to engage and express their art in
a larger programming culture. Block-based programming platforms have motivational
potentials features which have tremendous impact to programmers and can also lead
to better productivity [10]. Also, block-based programming has been used widely in
different domains over the years. Among of the domains are examples of where some
types of these block-based programming have been used are sensor-controlled music,
image processing, animations etc. Most types of block-based programming languages are
highly portable, with desktop implementations already in place (Macintosh, Windows,
BeOS, Acorn, Linux/Unix) as described by [22].
A Comparison of Block-Based Programming Platforms
637
Table 1 shows the result of analysis and comparison among all the block-based programming platforms as explained in prior section in terms of their differences and similarities related to features offered by each platform. In terms of pedagogical characteristics,
all of these platforms specialized on problem-driven learning and computational thinking
[10]. In current practice, the three most prominent block-based programming platforms
include Scratch, Blockly and App Inventor. Further discussion on these three platforms
are also available in the sub-sequence paragraphs. Table 1. shows the similarities and
differences in feature between the block-based programming platforms.
Scratch has a more attractive user interface among the three platforms, and it is
mostly used as a benchmark for other block-based platforms. Scratch is a pioneer blockbased platform, it has been so successful that there has been other application that
has been developed based on scratch. Although some applications are an extension of
Scratch, they lack Scratch’s glamour. When using Scratch to develop applications or
learn programming, it is a useful tool for novice programmers, and one of its most
interesting features is the availability of its user community for codes sharing and it is
an open-source (free) software which can be downloadable on PC. Most of the available
block-based programming platforms are based on Scratch. Scratch was chosen because
of its features, popularity and acceptance worldwide. Based on Table 1, it can be noticed
that Snap!, Alice, Tynker and Code.org is similar to Scratch in terms of features. In fact,
the platforms were designed based on Scratch [19].
Blockly is also a good tool for novice programmer to develop applications. Blockly
is unique because it allows users to create custom blocks and blockly applications can be
translated into other text-based languages like PHP, JavaScript, Python, Dart and many
other languages. Blockly is also great for complex and abstract programs development
and can put a coding environment on your webpage. Blockly app has a simple interface
which is divided into 3 sections. The first section is where the blocks can be selected and
the blocks in Blockly are divided into 8 categories which include Logic, Loops, Math,
Texts, Lists, Color, Variables and Functions. The second section is the canvas where the
programs can be formed. Blocks that has been dragged can be snapped together on the
canvas. A section which is a unique feature that has been included only in Blockly, where
it translates the program on the canvas into a selected text-based language of the user’s
Table 1. Similarities and differences in features between block-based programming platforms
Features
Scratch
App inventor
Blockly
Alice
Snap!
Tynker
Code.org
Allow users to
create custom
blocks
No
Yes
Yes
No
Yes
No
Yes
Make syntax
errors
impossible
Yes
Yes
Yes
No
Yes
Yes
No
User community Yes
for code sharing
No
No
Yes
Yes
Yes
Yes
(continued)
638
U. AbdulSamad and R. Romli
Table 1. (continued)
Features
Scratch
App inventor
Blockly
Alice
Snap!
Tynker
Code.org
Downloadable
on pc
No
Yes
No
Yes
No
No
No
Usable on
browsers
Yes
Yes
Yes
No
Yes
Yes
Yes
Sharing sprites
Yes
No
Yes
No
Yes
Yes
Yes
Procedures
No
Yes
Yes
Yes
Yes
No
Yes
Recursion
No
Yes
Yes
Yes
Yes
No
Yes
Lists
No
Yes
Yes
Yes
Yes
No
Yes
Databases
No
Yes
No
No
No
No
Yes
Multi-threading
Yes
Yes
No
Yes
Yes
Yes
No
Inheritance
No
No
No
Yes
Yes
No
No
choice. Blockly has more programming functions like lists, recursion, custom blocks,
procedures/functions etc., so it will be logical to select Blockly over Alice, Tynker or
Snap!.
App Inventor is the most unique feature about App Inventor is that only App Inventor
can be used to develop a mobile application. According to Park and Shin [23], App
Inventor has the most numbers of blocks. For example, it has 204 event type blocks
while Scratch only has 7 types of event type blocks [23]. Although custom blocks can be
defined in Scratch but in App Inventor only custom procedures can be defined. The app
Inventor has a palette tab which consists of items that can be used to design an application.
For example, the textbox, listpicker, and password textbox are all included in the palette
and next is the viewer where users can see a live feedback of how the application interface
looks like. And then the Components tab which comprises of the list of all the contents of
all the item that has been used in the application being developed. App inventor also has
properties features where the properties of the application components can be modified.
For example, the background color of a text button can be modified in the properties tab.
In the blocks screen, App Inventor has a tab where blocks can be selected and dragged
on to the canvas. The blocks are divided into 9 categories which include Control, Logic,
Math, Text, Lists, Dictionaries, Colors, Variables, and Procedures. App Inventor was
selected over Code.org because it would be diverse to have to choose a platform that is
not based on only Scratch.
As mentioned earlier, in our study, an experimental evaluation was conducted to
compare and analyze these three platforms by getting involved some novice learners
in programming to experience using all the platforms. Based on the analysis of the
collected responses from these learners, then a suggestion was made on deciding the
most preferrable block-based programming platform that able to support in developing
some simple application among the novice learners.
A Comparison of Block-Based Programming Platforms
639
4 Conclusion
In summary, based on the analysis and comparison done among the block-based programming platforms, all three shortlisted are very good and recommended for novices.
Scratch is ranked higher in terms of satisfaction, engagement and motivation and it is
also preferred by the novices because they believed it is easier to use. Blockly is a great
application with assortment of features. App Inventor is unique because of its ability to
enables novices develop mobile app conveniently and easily. There are certain limitations encountered in this study as the usability and other factors of this platforms could
not be measured. Also, further works can be done to reveal the usage and utilization of
the available block-based programming platforms and how these platforms would offer
programming environment that are able to engage, motivate and provide satisfaction to
novice learners or programmers to write codes, hence, it is significant enough to venture in this context of research. And evaluate to what extend the identified block-based
programming platforms achieved users’ engagement, motivation and satisfaction.
References
1. Krishnamurthi, S., Fisler, K.: Programming paradigms and beyond. Cambridge Handb.
Comput. Educ. Res. 37 (2019)
2. Pichler, P., Weber, B., Zugal, S., Pinggera, J., Mendling, J., Reijers, H.A.: Imperative versus
declarative process modeling languages: an empirical investigation. In: Daniel, F., Barkaoui,
K., Dustdar, S. (eds.) BPM 2011. LNBIP, vol. 99, pp. 383–394. Springer, Heidelberg (2012).
https://doi.org/10.1007/978-3-642-28108-2_37
3. Kalelioğlu, F., Gülbahar, Y.: The effects of teaching programming via scratch on problem
solving skills. 13(1), 33–50 (2014)
4. Flinders, K.: Computer science undergraduates most likely to drop out. ComputeWeekly.Com. https://www.computerweekly.com/news/252467745/Computerscience-underg
raduates-most-likely-to-drop-out. Accessed 1 Aug 2019
5. LeDuc, A.L.: Motivation of programmers. ACM SIGMIS Database 11(4), 4–12 (1980).
https://doi.org/10.1145/1113469.1113470
6. Williams, C., Alafghani, E., Daley Jr., A., Gregory, K., Rydzewski, M.: Teaching programming
concepts to elementary students. In: 2015 Frontiers in Education Conference Proceedings (FIE
2015), pp. 706–714 (2015)
7. Resnick, M., et al.: Scratch: programming for all. Commun. ACM 52(11), 60–67 (2009).
https://doi.org/10.1145/1592761.1592779
8. João, P., Nuno, D., Fábio, S.F., Ana, P.: A cross-analysis of block-based and visual programming apps with computer science student-teachers. Educ. Sci. 9(3) (2019). https://doi.org/10.
3390/educsci9030181
9. Jenkins, T.: The motivation of students of programming. In: Proceedings of the Conference on
Integrating Technology into Computer Science Education, ITiCSE, pp. 53–56 (2001). https://
doi.org/10.1145/507758.377472
10. Papadakis, S., Kalogiannakis, M., Zaranis, N., Orfanakis, V.: Using scratch and app inventor
for teaching introductory programming in secondary education. A case study. Int. J. Technol.
Enhanced Learn. 8(3–4), 217–233 (2016). https://doi.org/10.1504/IJTEL.2016.082317
11. Carlos Begosso, L., Ricardo Begosso, L., Aragao Christ, N.: An analysis of block-based
programming environments for CS1. In: Proceedings - Frontiers in Education Conference,
FIE, 2020-Octob (2020). https://doi.org/10.1109/FIE44824.2020.9273982
640
U. AbdulSamad and R. Romli
12. Maloney, J., Resnick, M., Rusk, N., Silverman, B., Eastmond, E.: The scratch programming
language and environment. ACM Trans. Comput. Educ. 10(4), 1–15 (2010). https://doi.org/
10.1145/1868358.1868363
13. Lucy Black, Google Blockly - A Graphical Language with a Difference. https://www.ipr
ogrammer.info/news/98-languages/4357-google-blockly-a-graphical-language-with-adiffe
rence.html. 12 June 2012
14. García Peñalvo, F.J., et al.: Evaluation of existing resources (study/analysis) (2016)
15. Pausch, R., Dann, W.: ALICE: a 3-D tool for introductory programming concepts. J. Comput.
Sci. Coll. 15(5), 107–116 (2017)
16. Romagosa, B.: The snap! Programming system. In: Tatnall, A. (ed.) Encyclopedia of Education and Information Technologies. Springer, Cham (2019). https://doi.org/10.1007/978-3319-60013-0_28-2
17. Lambić, D., Ðorić, B., Ivakić, S.: Investigating the effect of the use of code.org on younger elementary school students’ attitudes towards programming. Behav. Inf. Technol. 1–12 (2020).
https://doi.org/10.1080/0144929X.2020.1781931
18. Kalelioğlu, F.: A new way of teaching programming skills to K-12 students: Code.org.
Comput. Hum. Behav. 52, 200–210 (2015)
19. Rees, A.M., García-Peñalvo, F.J., Toivonen, T., Hughes, J., Jormanainen, I., Vermeersh, J.: A
survey of resources for introducing coding into schools (2016)
20. Hutchison, A., Nadolny, L., Estapa, A.: Using coding apps to support literacy instruction and
develop coding literacy. Read. Teach. 69(5), 493–503 (2016)
21. Weintrop, D.: Block-based programming in computer science education. Commun. ACM
62(8), 22–25 (2019). https://doi.org/10.1145/3341221
22. Burd, L., Kafai, Y., Rusk, N., Silverman, B., Resnick, M.: Scratch: a sneak preview [education]. In: Proceedings of Second International Conference on Creating, Connecting and
Collaborating Through Computing, pp. 104–109 (2004). http://ieeexplore.ieee.org/xpls/abs_
all.jsp?arnumber=1314376%5Cnpapers2://publication/uuid/556FB3A7-C6C7-47F5-BE7D353071E9CCE1
23. Park, Y., Shin, Y.: Comparing the effectiveness of scratch and app inventor with regard to
learning computational thinking concepts. Electron. (Switzerland) 8(11) (2019). https://doi.
org/10.3390/electronics8111269
Information Security Policy Compliance:
An Exploration of User Behaviour
and Organizational Factors
Angraini1,3(B) , Rose Alinda Alias2 , and Okfalisa3
1 School of Computing, Faculty Engineering, University Technology Malaysia, 81310 Johor,
Malaysia
angraini@uin-suska.ac.id
2 Department of Information System, Azman Hashim International Business School,
University Technology Malaysia, 81310 Johor, Malaysia
3 Department of Informatic Engineering, Faculty Science and Technology,
Universitas Islam Negeri Sultan Syarif Kasim, Pekanbaru, Riau, Indonesia
Abstract. Organizations are adopting security policies to protect critical information, despite the fact that IT users frequently violate these standards. Numerous
factors affecting user compliance have been identified in previous research, but few
research findings have addressed human and organizational factors. The purpose
of this study is to ascertain the human and organizational factors that influence
user adherence to policies. The variables examined included leadership, organizational commitment, rewards, awareness, behavioral intentions, and habits, all of
which were gender-related. This is a quantitative study that includes offline and
online surveys of university users in Indonesia. The findings indicated that the
awareness variable had the greatest effect, while the reward variable had no effect.
This research is expected to contribute to an understanding of how to comply with
information security policies.
Keywords: Information security · Compliance · User behaviour · Moderating
variabel · Gender
1 Introduction
Cybercrime continues to grow in number as the use of information technology grows. For
example, between January and September 2020, Indonesia experienced the highest level
of online fraud in ASEAN and is the country hardest hit by ransomware attacks, with
1.3 million victims [1]. To minimize information security incidents, the organization has
developed an information security policy and enforces compliance by employees [2–4].
The information security policy (ISP) is intended to ensure the safety of information
and information technology assets in support of organizational goals and objectives [5].
There are still many users who do not comply with information security policies so
that finding of internal violations [6, 7] and if this continues, individuals will disrupt
organizational activities [8, 9].
© The Author(s), under exclusive license to Springer Nature Switzerland AG 2022
F. Saeed et al. (Eds.): IRICT 2021, LNDECT 127, pp. 641–650, 2022.
https://doi.org/10.1007/978-3-030-98741-1_53
642
Angraini et al.
Numerous studies have been conducted on the ISP compliance model, utilizing a
variety of theories, including the theory of planned behavior, the theory of protective
motivation, and those that examine the variables affecting ISP compliance [2, 3, 10–15].
However, there have been few empirical investigations into combining factors from user
behaviour and organization factors. Furthermore, it is necessary to develop a model that
focuses on the variables required by the organization rather than on a particular theory
to ensure that it only uses variables relevant to the organization. This study will conduct
a survey of active information technology users in Indonesian universities to determine
their compliance behavior with information security policies. This study aims to develop
a compliance model by incorporating variables such as leadership, organizational commitment, reward, awareness, behavior intention, and habit with gender as moderating
variables. This model is expected to be used by organizations to evaluate user compliance
with information security policies.
This paper is structured as follows: an introduction, a theory explaining the study’s
variables, and a research model. Furthermore, the research approach and data processing
was explained. The paper is followed by a presentation of the findings and a discussion
of them. Finally, this paper concludes.
2 Literature Review
Leadership is a collaborative influence process when a group of people chooses someone
as their leader to accomplish a common goal [16]. In the context of information security policy, leadership is a critical factor that influences employee compliance with ISP
standards and, as a result, the protection of corporate resources [10, 17]. According to
Humaidi and Balakrishnan (2015), Leaders play a critical role in ensuring that employees are aware of and adhere to the organization’s information security policy [18]. Avey
(2010) assert that leaders must serve as role models in developing governance frameworks that ensure proper information security. By fostering a trusting relationship, ethical
leadership may boost employees’ compliance intentions [19]. Organizational commitment is a term that relates to the degree to which employees identify with and participate
in the organization for which they work [20]. Due to its prominence in understanding the
relationship between employees and their organizational behavior, significant research
efforts have focussed on organizational commitment as a significant antecedent of diverse
workplace behaviors [21]. According to Herath and Rao (2009), organizational commitment is a strong determinant of employee compliance with ISPs [22]. Rewarding users
for perceived compliance benefits has a considerable effect on their perceptions of the
importance of adhering to security measures [10].
Although their findings varied, Moody (2018) discovered that rewards had no meaningful effect on intentions to follow information security policies [2]. This view is backed
up by Siponen (2014), who assert that the incentive for adhering to information security
policies is negligible [23]. This research will study the direct effect of reward on user
compliance to information security policy. The term “habit” can be interpreted as “the
degree to which humans perform behaviors automatically while interacting with information systems as a result of their experience [24]. Practice habits are essential because
they suggest and support an individual’s repeated engagement with IS.
Information Security Policy Compliance
643
Individual variables can affect behavioral intentions to adhere to security policies and
their overall security behavior (directly or indirectly) [25]. Numerous models have been
created based on General Detterance Theory (GDT) [26–29] in order to research, analyze,
and predict the effect of perceived punishment components on behavioral compliance
intents. In addition, compliance with the Information Security Policy (ISP) is influenced
by various other elements within the company [30]. Therefore, this research incorporates various variables into its analysis of behavioral intention. Security awareness can
be defined as “workers’ total knowledge and comprehension of potential information
security risks and their repercussions” [10]. Awareness, defined as the security professional’s overall knowledge and awareness of practices, methods, systems, and their
repercussions, is oriented toward planning, monitoring, strategizing, and executing incident management duties [31]. Employees’ levels of awareness are the most predictive
of their intention to follow the organization’s information security policy [32].
This research will incorporate the gender variable as a moderator to enhance the
information security policy compliance model. Variables from earlier research are used
to construct a compliance model for information security policies, as illustrated in Fig. 1.
Fig. 1. Purpose model of information security policy compliance
The hypothesis for this research is as follows:
H-1: leadership have a significant effect on information security policy compliance
(ISPC)
H-1b: Gender will positively moderate the influence of leadership to comply with
information security policy (ISPC)
H-2: Organization commitment has a significant effect on ISPC.
644
Angraini et al.
H-2b: Gender will positively moderate the influence of Organization commitment to
comply with information security policy (ISPC)
H-3: reward has a significant effect on ISPC
H-3b: Gender will positively moderate the influence of reward to comply with
information security policy (ISPC)
H-4: awareness has a significant effect on ISPC
H-4b: Gender will positively moderate the influence of awareness to comply with
information security policy (ISPC)
H-5: Behavior Intention has a significant effect on ISPC
H-5b: Gender will positively moderate the influence of Behavior Intention to comply
with information security policy (ISPC)
H-6: Habit has a significant effect on ISPC
H-6b: Gender will positively moderate the influence of habit to comply with information
security policy (ISPC)
3 Method
This research applies a case study approach to examine public universities in Indonesia.
The participants are information technology users from a variety of Indonesian public
universities. The questionnaire was adapted from earlier research with modifications
to account for the unique circumstances of the case study. We circulated the online
questionnaire via email invitations and group messages. There were a total of 1153
requests, however only 246 were responded to. The low response rate online is a result
of the high sample size. Additionally, respondents were contacted directly via surveys.
Three hundred questionnaires were issued; 196 were returned, indicating a response rate
of 65 percent for the direct questionnaire. The data was then evaluated with Smart-PLS
to validate the model.
4 Result
This research examines the data using the Partial Least Squares (PLS) method and the
smartPLS software. PLS-SEM is frequently used in information systems research for
model complexity and formative metrics. Additionally, PLS can be employed with small
sample sizes and irregular data [33]. The standards for reporting the results of the PLS
analysis utilized in this study are based on Hair’s (2019) guidelines for evaluating formative measurement and structural models. The convergent validity, indicator collinearity, statistical significance, and relevant indicator weight of the formative measurement
model are all analyzed [34]. The reliability of the variable items research instrument was
determined using the loading factor value. Based on the value of the loading factor, the
item can be used in research. When the loading factor is between 0.60 and 0.70, the item
is considered “suitable” for exploratory study. Between 0.70 and 0.90 indicates that the
item is “acceptable to good” [35]. On this research all variabel has value more than 0.60
so it can be use continue.
Discriminant validity is used to verify that each thought associated with a latent variable differs from other variables. If the loading value of each latent variable indicator is
Information Security Policy Compliance
645
Table 1. The discriminant validity test
AW
Behavior Intention
HA
ISPC
Leadership
Organization
Commitment
Reward
gender
AW
0.92
Behavior
Intention
HA
ISPC
Leadership
Organization
Commitment Reward
0.611
0.598
0.637
-0.056
0.975
0.419 0.957
0.544 0.512
0.123 0.106
0.831
0.154
0.942
0.716
0.055
0.56 0.549
0.064 0.1
0.662
0.077
0.169
0.041
0.893
0.045
-0.042
0.002 -0.054 -0.031
0.106
-0.006
gender
0.794
0.07 1.000
more significant than the loading values of other latent variables, the model has excellent
discriminant validity. The discriminant validity test results are shown in Table 1.
As illustrated in Table 2, multiple loading factor values for each indicator of each
latent variable do not equal the loading value when coupled with other latent variables.
Thus, this score indicates that each latent variable has a high discriminant validity, despite
some hidden variables lacking a highly correlated gauge with other constructs.
Additionally, the reliability value of a construct and the Average Variance Extracted
(AVE) value of each construct provides insight into the validity and reliability requirements. For example, the build is reliable if the value is more significant than 0.70 and the
AVE is greater than 0.50. The Composite Reliability and Average Value of All Variables
data will be provided in Table 2.
Table 2. The composite reliability and average value
Cronbach’s alpha
Composite reliability
Average Variance
Extracted (AVE)
AW
0.963
0.971
0.846
Behaviour
intention
0.983
0.987
0.951
HA
0.982
0.985
0.916
ISPC
0.848
0.899
0.69
Leadership
0.976
0.979
0.887
Organization
commitment
0.936
0.952
0.797
Reward
0.861
0.895
0.63
646
Angraini et al.
According to the average Average Variance Extracted (AVE) results, each variable
had a value greater than 0.50, and the composite reliabilities of the individual measurements ranged between 0.76 and 0.95, exceeding the prescribed value of 0.70. After a
satisfactory evaluation of the measurement model, the SEM-PLS model is structurally
evaluated.
Changes in the value of R-Squares can be used to explain the effect of certain exogenous latent factors on endogenous latent variables, regardless of whether the exogenous
latent variables have a substantial effect. For instance, R-Squares values of 0.75 indicate
a substantial value, 0.50 indicates a moderate, and 0.25 indicates a weak [36].
The R squared value 0.534 indicates the variance in each endogenous construct and
the model’s explanatory power [37]. R square values greater than 0.10 indicate that this
research model can proceed to the hypothesis testing step.
The following step is to test each hypothesized association using simulation statistically. the SMART-PLS approach is applied to the sample using the bootstrap method. The
purpose of bootstrap testing is to mitigate the issue of aberrant research data. Additionally, the predicted significant factors shed light on the link between the studied variables.
Two of the thirteen beta coefficient paths had negative values, notably moderating gender with ISPC and moderating behavior intention with ISPC. Table 3 contains detailed
information about the beta coefficient path and p-value.
Table 3. The result of hyphotesis
The table above summarizes the findings of hypothesis testing by determining
the p-value for each path coefficient, which can be one- or two-way depending on the
previous researcher’s knowledge of directions and coefficients that connected (Kock,
Information Security Policy Compliance
647
2015b). A two-sided type test with a p-value of 0.05 and a confidence interval of 97.5
percent was used in this study. Half of the twelve hypotheses offered in this study were
not significant, with a p-value > 0.05. detail for each hypothesis descript below:
H-1: t-value of 2.325 > t-table 1.967 and the association between the leadership variable
and ISPC, it is established that leadership has a significant influence on ISPC.
H-2: The relationship between Organization commitment and ISPC has a t-value of
5.851 > 1.967 and a p-value of 0.000 0.05. It may be inferred that organizational
commitment has a significant effect on ISPC.
H-3: The reward variable’s connection with ISPC has a t-value of 0.651 t-table 1.967
and a p-value of 0.515 > 0.05. Thus, it may be argued that incentive has a negligible
effect on ISPC.
H-4: The relationship between awareness and ISPC has a t-value of 3.796 > t table 1.967
and a p-value of 0.000 0.05. It can be stated that awareness and ISPC have a significant
influence.
H-5: The association between the variables Behavior Intention and ISPC has a t-value
of 3.568 > t table 1.967 and a p-value of 0.000 0.05, indicating that Behavior Intention
and ISPC have a significant influence.
H-6: The association between Habit and ISPC has a t-value of 2.647 > t table 1.967 and
a p-value of 0.008 0.05, indicating that habit substantially affects behavior intention.
Additionally, the beta path coefficient with statistical significance for moderating
factors (interacting) is non-significant for almost all hypotheses, with only one positive
hypothesis being identified.
H-1b: When gender is controlled, leadership has no influence on improving ISPC
H-2b: gender had no effect on the interaction between organizational commitment factors
and ISPC
H-3b: reward has no effect on improving ISPC when gender is controlled
H-4b: gender has no effect on the interaction between awareness and ISPC
H-5b: regardless of gender, behavior intention had no effect on ISPC
H-6b: Habit plays a beneficial function in improving ISPC, with gender having a
moderating effect.
5 Discussion
Information security should be a primary strategic objective because this study discovered that leadership affected user compliance regardless of gender. This conclusion is
consistent with Koohang’s (2020) finding that leadership predicts employee compliance with information security policies [32]. Furthermore, commitment from leaders
enables successful enforcement of ISP compliance within organizations [38], emphasizing the critical nature of transformational leadership because it directly impacts employee
behavior levels [39].
648
Angraini et al.
The organizational commitment variable has a substantial effect on compliance with
information security policies; Sharma (2018) supports this finding by stating that organizational commitment will be felt more strongly by employees when it comes to complying with ISPs [40]. Nevertheless, contrary to what Liu (2020) discovered, organizational
commitment will erode self-efficacy regarding user compliance [41].
The hypothesis that reward can promote compliance was not established in this
study. This study did not uncover an effect of reward that was either direct or mediated by gender. Moody (2018) discovered the same thing [2]. This data corroborates
Bulgurcu’s (2010) conclusion that reward do not significantly contribute to compliance
with security policies [10]. Despite benefits for fulfilling security policy compliance
objectives [42]. The outcomes of this study explicitly imply that user awareness matters,
as earlier research has established that staff opinions also influence information security
compliance attitudes [10]. Additionally, those who understand computers and are knowledgeable about computer security have a decreased interest in exploiting information
technology.
The findings of this research contrast with Sommestad (2017) discovered that habits
had no significant effect on behavioral intentions to adhere to information security standards [11]. However, it is consistent with Moody’s (2018), which claims that habits, in
addition to role ideals and anxiety, influence behavioral intentions [2]. However, earlier
research relied on behavior intention as a moderator, demonstrating that habit directly
affected compliance with information security standards.
6 Conclusion
The purpose of this research is to conduct a broad examination of the factors that influence
user compliance with information security regulations, with a focus on gender. There are
three organizational variables to consider: leadership, organizational commitment, and
reward, as well as three behavioral variables to consider: awareness, behavior intention,
and habit. Gender was chosen as a moderator due to its perceived ability to influence
user compliance. The findings established categorically that gender had no effect on user
compliance. Similarly, additional hypothesis revealed the same thing. Only one of the
six presented hypotheses moderated by gender had an effect on adherence. As a result,
additional research into the use of moderator factors is warranted. Additionally, the use
of mediating variables to ascertain the relationship between more complicated variables
should be included. This study’s distribution of questionnaires and responders is limited.
However, due to this survey’s wide range of respondents, the response rate is relatively
near to the ground. Additionally, this research should be developed from the variable
selection process with complex theory.
References
1. Interpol (2021): Asean cyberthreat assessment 2021
2. Moody, G.D., Siponen, M., Pahnila, S.: Toward a unified model of information security policy
compliance. MIS Q. 42, 285–311 (2018)
Information Security Policy Compliance
649
3. Pahnila, S., Siponen, M., Mahmood, A.: Employees’ behavior towards IS security policy compliance. In: Proceedings of the Annual Hawaii International Conference on System Sciences,
pp. 1–10 (2007)
4. Manjula, R., Bagchi, K., Ramesh, S., Baskaran, A.: Policy compliance in information security.
Int. J. Pharm. Technol. 8, 22330–22340 (2016)
5. Doherty, N.F., Fulford, H.: Aligning the information security policy with the strategic
information systems plan. Comput. Secur. 25, 55–63 (2006)
6. Höne, K., Eloff, J.H.P.: What makes an effective information security policy? Netw. Secur.
2002, 14–16 (2002)
7. Wiant, T.L.: Information security policy’s impact on reporting security incidents. Comput.
Secur. 24, 448–459 (2005)
8. Sohrabi Safa, N., Von Solms, R., Furnell, S.: Information security policy compliance model
in organizations. Comput. Secur. 56, 1–13 (2016)
9. Furnell, S.: Malicious or misinformed? Exploring a contributor to the insider threat Comput.
Fraud Secur. 2006, 8–12 (2006)
10. Bulgurcu, B., Cavusoglu, H., Benbasat, I.: Information security policy compliance: an empirical study of rationality-based beliefs and information security awareness. MIS Q. 34, 523–548
(2010)
11. Sommestad, T., Karlzén, H., Hallberg, J.: The theory of planned behavior and information
security policy compliance. J. Comput. Inf. Syst. 1–10 (2017)
12. D’Arcy, J., Lowry, P.B.: Cognitive-affective drivers of employees’ daily compliance with
information security policies: a multilevel, longitudinal study. Inf. Syst. J. 1–27 (2017)
13. Alotaibi, M., Furnell, S., Clarke, N.: Information security policies : a review of challenges and
influencing factors. In: 11th International Conference for Internet Technology and Secured
Transactions, pp. 352–358 (2016)
14. Ifinedo, P.: Information systems security policy compliance: an empirical study of the effects
of socialisation, influence, and cognition. Inf. Manag. 51, 69–79 (2014)
15. Safa, N.S., Von, S.R., Furnell, S.: Information security policy compliance model in
organizations. Comput. Secur. (2015). https://doi.org/10.1016/j.cose.2015.10.006
16. Silva, A.C.: What is Leadership? (2016)
17. Siponen, M., Willison, R.: Information security management standards: problems and
solutions. Inf. Manag. 46, 267–270 (2009)
18. Humaidi, N., Balakrishnan, V.: Leadership styles and information security compliance behavior: the mediator effect of information security awareness. Int. J. Inf. Educ. Technol. 5,
311–318 (2015)
19. Avey, J.B., Palanski, M.E., Walumbwa, F.O.: When leadership goes unnoticed: the moderating role of follower self-esteem on the relationship between ethical leadership and follower
behavior. J. Bus. Ethics 98, 573–582 (2011)
20. Mowday, R.T.: Reflections on the study and relevance of organizational commitment. Hum.
Resour. Manag. Rev. 8, 387–401 (1998)
21. Lowry, P.B., Posey, C., Bennett, R.B.J., Roberts, T.L.: Leveraging fairness and reactance theories to deter reactive computer abuse following enhanced organisational information security
policies: an empirical study of the influence of counterfactual reasoning and organisational
trust. Inf. Syst. J. 25, 193–273 (2015)
22. Herath, T., Rao, H.R.: Encouraging information security behaviors in organizations: role of
penalties, pressures and perceived effectiveness. Decis. Support Syst. 47, 154–165 (2009)
23. Siponen, M., Adam Mahmood, M., Pahnila, S.: Employees’ adherence to information security
policies: an exploratory field study. Inf. Manag. 51, 217–224 (2014)
24. Limayem, M., Hirt, S.G., Cheung, C.M.K.: Research article how habit limits the predictive
power of intention: the case of information. MIS Q. 31, 705–737 (2007)
650
Angraini et al.
25. Consolvo, S., Langheinrich, M.: Identifying factors that influence employees’ security behavior for enhancing ISP compliance. In: Fischer-Hübner, S., Lambrinoudakis, C., López, J. (eds.)
Trust, Privacy and Security in Digital Business. TrustBus 2015. LNCS, vol. 9264., pp. 8–23
Springer, Cham (2015). https://doi.org/10.1007/978-3-319-22906-5_13
26. Lebek, B., Uffen, J., Neumann, M., Hohler, B., Breitner, M.H.: Information security awareness
and behavior: a theory-based literature review. Manag. Res. Rev. 37, 1049–1092 (2014)
27. Puhakainen, S.: Improving employees’ compliance through information systems security
training: an action research study. MIS Q. 34, 757 (2010)
28. Abed, J., Dhillon, G., Ozkan, S.: Investigating continuous security compliance behavior : insights from information systems continuance model. In: Twenty-second Americas
Conference on Information Systems San Diego, pp. 1–10 (2016)
29. Herath, T., Rao, H.R.: Protection motivation and deterrence: a framework for security policy
compliance in organisations. Eur. J. Inf. Syst. 18, 106–125 (2009)
30. Sharma, S., Warkentin, M.: Do i really belong?: Impact of employment status on information
security policy compliance. Comput. Secur. 87, 101397 (2019)
31. Thangavelu, M., Krishnaswamy, V., Sharma, M.: Impact of comprehensive information security awareness and cognitive characteristics on security incident management–an empirical
study. Comput. Secur. 109, 102401 (2021)
32. Koohang, A., Nowak, A., Paliszkiewicz, J., Nord, J.H.: Information security policy compliance: leadership, trust, role values, and awareness. J. Comput. Inf. Syst. 60, 1–8
(2020)
33. Hair, J.F., Hult, G.T.M., Ringle, C.M., Sarstedt, M.: A Primer on Partial Least Squares
Structural Equation Modeling (PLS-SEM), p. 165. Sage, Thousand Oaks (2013)
34. Hair, J.F., Risher, J.J., Sarstedt, M., Ringle, C.M.: When to use and how to report the results
of PLS-SEM. Eur. Bus. Rev. 31, 2–24 (2019)
35. Hair Jr, J.F., Sarstedt, M., Hopkins, L., Kuppelwieser, V.G.: Partial least squares structural
equation modeling (PLS-SEM). Eur. Bus. Rev. 26, 106–121 (2014)
36. Hair Jr, J.F., Black, W.C., Babin, B.J., Anderson, R.E.: Multivariate data Analysis (2018).
https://doi.org/10.1002/9781119409137.ch4
37. Henseler, J., Sarstedt, M.: Goodness-of-fit indices for partial least squares path modeling,
pp. 565–580 (2013)
38. Safa, N.S., Von Solms, R.: An information security knowledge sharing model in organizations.
Comput. Hum. Behav. 57, 442–451 (2016)
39. Guhr, N., Lebek, B., Breitner, M.H.: The impact of leadership on employees’ intended information security behaviour: an examination of the full-range leadership theory. Inf. Syst. J.
29, 340–362 (2019)
40. Sharma, S., Warkentin, M.: Do i really belong?: Impact of employment status on information security policy compliance. Comput. Secur. (2018). https://doi.org/10.1016/j.cose.2018.
09.005
41. Liu, C., Wang, N., Liang, H.: Motivating information security policy compliance: the critical
role of supervisor-subordinate guanxi and organizational commitment. Int. J. Inf. Manag. 54,
02152 (2020)
42. Gerber, N., McDermott, R., Volkamer, M., Vogt, J.: Understanding information security compliance - why goal setting and rewards might be a bad idea. In: International Symposium on
Human Aspects of Information Security & Assurance (HAISA 2016), vol. 10, pp. 145–155
(2016)
Understanding Wearable Device Adoption:
Review on Adoption Factors and Directions
for Further Research in Smart Healthcare
Md Ismail Hossain1
, Ahmad Fadhil Yusof1(B)
, and Mohana Shanmugam2
1 School of Computing, Faculty of Engineering, Universiti Teknologi Malaysia,
Skudai, Johor, Malaysia
ahmadfadhil@utm.my
2 Department of Informatics, College of Computing and Informatics,
Universiti Tenaga Nasional, Selangor, Malaysia
mohana@uniten.edu.my
Abstract. This paper analyses prior literature that identify adoption model for
smart wearable healthcare devices. This assessment aims to contribute and identify
factors that enable users to adopt wearable devices in the Internet of Things (IoT)
based healthcare to monitor blood glucose measuring. This study has set off in
quest of research in IoT smart healthcare focusing on blood glucose monitoring
based on previous studies on wearable devices for smart healthcare. The key aim
of this paper is to provide a summary of published articles and to find the current
factors leading to the adoption of wearable devices for smart healthcare. The
authors guided a systematic review of wearable devices in smart healthcare to
explore the factors of adopting smart healthcare devices. 55 studies were analyzed
where 21 studies directly address wearable devices, adoption models, and also IoT
systems. Most of the studies covered a few factors; namely Interpersonal Influence,
Self-efficiency, Individual Innovativeness, Attitude toward wearable devices, Selfinterest, Perceived Expensiveness, and Perceived Usefulness in a wearable fitness
tracker or monitoring. Findings show that the effect of trustworthiness has a very
extensive potential to be explored to improve the model prediction to measure the
adoption of IoT wearable devices in smart healthcare as well as blood glucose
monitoring.
Keywords: Smart healthcare adoption · Wearable healthcare device · Adoption
factors · Trustworthiness
1 Introduction
In this modern time, people wish to have a relaxed life with the creation of smart technologies. IoT is a buzzword that changes our daily lives and it also works by sensor
to sensor (S2S) with a cloud-based application. IoT is an association of internet-linked
objects which can gather and swap data. According to Fotiadis [1], a wearable healthcare
device can be autonomous, non-invasive, and can carry out health functions namely to
monitor and maintain health status over some time.
© The Author(s), under exclusive license to Springer Nature Switzerland AG 2022
F. Saeed et al. (Eds.): IRICT 2021, LNDECT 127, pp. 651–662, 2022.
https://doi.org/10.1007/978-3-030-98741-1_54
652
M. I. Hossain et al.
Here, the authors identified some recent papers which discussed the adoption of
wearable devices but were limited to smart healthcare-related devices especially on IoT
devices (Table 2). In this paper, trustworthiness is also identified as an important factor to
adopt a smart healthcare device for blood glucose monitoring whereas the other papers
addressed trust and privacy concerns on other technology devices only. To complete
this paper, the authors identified the influencing factors for smart healthcare devices
especially on CGMs devices which is a new dimension in the domain of IoT healthcare
devices.
Wearable technology is one of the gifted terms of IoT. As time goes by, many
inventions came out in the area of wearable healthcare devices from the 13th to 20th
century. The majority of people intend to have smart devices that can be used easily
through sensor-based communication. IoT has made all the desires possible, giving the
same opportunity and advantages to aged people and serious patients.
Wearable devices in healthcare start from different famous fitness trackers (Fitbit,
Apple Watch, Samsung Gear) to more refined wearable healthcare devices [2, 3]. IoT
healthcare offers a lot of opportunities and benefits however the level of adoption of
wearable devices for blood glucose monitoring is still low compared to other wearable
devices like fitness trackers. To accomplish the key objective of this study, we intend to
address two key questions which will give an obvious idea to the readers by answering
these questions:
RQ1. What are the factors influencing the adoption of wearable devices in smart
healthcare?
RQ2. What are the limitations and gaps in the current research of wearable devices in
smart healthcare?
RQ3. How trustworthiness can influence the adoption of smart healthcare devices?
The contribution of this study can be divided into two segments. Firstly, through the
analysis of previous papers, comprehension of the existing models for wearable devices
like fitness trackers will be easily gained. Secondly, readers can understand the most
common and effective factors for wearable devices adoption through blood glucose
measuring in smart healthcare. The residue of this study is as follows: Sect. 2 gives
ideas for the surroundings of wearable devices and adoption model; Sect. 3 explains
the adoption model for the adoption of wearable devices in smart healthcare to monitor
blood glucose measuring; Sect. 4 discloses the literature review results; Sect. 5 informs
the outcome of all the research quest, and lastly Sects. 8 and 9 sets up the discussion and
conclusion.
2 Background
This division provides an outline of wearable devices, summarizes the core definition
of wearable devices and, the adoption model of wearable devices in terms of smart
healthcare.
Understanding Wearable Device Adoption
653
2.1 Wearable Devices: An Overview
IoT is one of the fast-growing and dynamic areas in this technological era. Wearable
devices are the main term regarding IoT as all the wearable devices work through sensorbased data transfer like S2S [4]. In IoT, there are different areas such as smart city, smart
healthcare, smart agriculture. Currently, smart healthcare is a significant sector because
people now wish to have more relaxation infused into their usual lifestyle [5]. That is why
they wish to adopt wearable healthcare devices to save time. One of the smart healthcare
applications named open APS Glucose monitoring device is used by Pharma as its
connected system to help diabetes patients. Devices that are used during cancer treatment,
ingestible sensors, connected contact lenses, arthritis, connected inhalers, wearable smart
asthma monitoring, smart drill, wearable fitness tracker, wearable smartwatch, and so
on are considered wearable devices. [3, 6]. Various definitions were provided by various
researchers representing their understanding and contexts as shown in Table 1.
Table 1. Some wearable device definitions from previous studies
No Definition
References
1
The new technologies which are based on sensor and internet connectivity
are called smart wearable devices
[2]
2
Devices that are attached to our body externally as a fashion accessory or set [7]
in clothes are considered as smear wearable devices
3
Mobile technologies have headed to the rise of wearable devices which are
smart and much popular
4
Smart devices are embedded with portable computers and electronics that are [3]
wearable on the body. These also allow for interactions between users and a
smart environment anytime, anywhere
[8]
Definition 2 fits to our text as IoT devices work with sensor as well as continuous
internet connectivity through wearable smart devices. Definition 4 also matches with the
smart healthcare system where connectivity between users and systems is continuous,
anytime and anywhere. This shows a combination of sensor connectivity, continuous
use the of Internet and interactions with wearable devices.
2.2 Research in Wearable Device Adoption
According to the previous studies, several research has been conducted on IoT-based
smart healthcare focusing on different wearable devices. Based on the existing literature,
there is a lack of theoretical model on smart healthcare. In addition, the factors that
explain the uses of wearable blood glucose monitoring devices, endure a significant
strength for the developers of blood glucose monitoring devices [2, 9, 10]. Moreover,
the adoption model delivers some significant factors that can identify users’ intention to
adopt smart healthcare devices [11–13].
654
M. I. Hossain et al.
Authors from past research have identified multiple factors indicating wearable smart
healthcare device adoption intentions [14–17]. In another study, the researchers proposed
a model to examine the factors affecting the intention to use wearable devices. The
model was tested on smartwatches, one of the most prevalent wearable devices [18]. For
Wearable Fitness Technology, TAM and SEM are implemented for the successful result
of adopting a device [19]. Most of the previous research involved had empirical analysis
to measure the intention to adopt wearable devices. This study shows the context of
healthcare wearable device adoption especially on CGMs devices, that is yet needed
to be explored. In line with Table 2, several studies were conducted by researchers on
wearable device adoption. This study further identifies the model and constructs used in
the adoption of wearable devices.
Table 2. Previous studies on wearable device adoption
No
Constructs
Sources
1
Perceived motivation, privacy, reliability
[20]
2
Self-efficacy, interpersonal influence, health interest, perceived
expensiveness
[21]
3
Task scope, expert support, data sharing
[22]
4
Personal innovativeness, self-efficacy, satisfaction
[23]
5
Perceived value, perceived risk
[7]
6
Trust, satisfaction, resemblance
[8]
7
System quality, usability
[24]
8
The continuous intention, health ology
[25]
9
Adoption intention, ease of use, attitude toward using
[26]
10
Perceived ease of use, subjective norm, attitude toward using
[19]
11
Health concern, privacy concern, extended use
[27]
12
Functional, patient benefit
[28]
13
Privacy concern, trust, risk
[18]
14
Perceived usefulness, health belief
[29]
15
Intention to purchase, value, performance
[5]
16
Perceived usefulness, perceived risk, attitude toward using
[30]
17
Self-care, social support, security, privacy
[31]
18
Consumer satisfaction, trust towards doctor
[32]
19
Social influence, personality
[33]
20
Perceived usefulness, social influence
[34]
21
Interpersonal influence, personal innovativeness, health interest, attitude,
trustworthiness
[10]
Understanding Wearable Device Adoption
655
3 Research Methodology
For the completion of this paper, numerous steps were undertaken. The Authors downloaded journal articles, conference proceedings from various database: IEEE, Scopus,
Science Direct, Springer Link and Atlantis press. Most articles cited here range from
the year 2006 to 2021 because these all articles are similar to this paper context. During
the searching and selecting process, authors used different keywords such as: “Wearable
device”, “Internet of Things”, “Smart Healthcare”, “Adoption model”, Trustworthiness
factor”, “Blood Glucose Monitoring”. After the research papers were downloaded, they
were classified into different sections: 1) adoption model for wearable devices, 2) factors
of adopting a wearable device and 3) smart healthcare system. Subsequently, when the
classifying process was completed, the authors proceeded with the reviewing process.
In addition to reviewing journal papers, various adoption models for wearable devices
that were mostly on smart healthcare devices through IoT were focused on. As this study
focuses on the adoption model factors, the utmost priority was finding out which factor
has a bigger influence on users’ decision to use wearable devices for blood glucose monitoring. To respond to the above research questions, this study uses an organized review
approach. Organized review is the combination of some processes like; identifying, evaluating, and interpreting all available researches that are relevant to the research questions,
area of study, or rising phenomenon of interest [35]. For completion of this procedure,
Mendeley desktop had been used as a tool in order to all of these research papers based
on the keywords. Figure 1 illustrates the whole process of Research Methodology used
to write this paper.
Fig. 1. Research methodology workflow
In the stage of Data Extraction & Synthesis, we recorded all the information in
Microsoft Excel carefully by reading all the papers from Mendeley. However, in this
paper few things were considered: research theme, source, publication time. These items
were selected in alignment with the research questions for writing this paper.
656
M. I. Hossain et al.
4 Trustworthiness in IoT Adoption
The future phase of internet is IoT where machines talk with other machines [36].
Mobile technologies and computer are critical in our lives nowadays [37–39]. Wearable
technologies have come forward following the growing fame of mobile technologies
[40]. As wearable healthcare devices are the current trends, the systems need to be
protected and assured to monitor users’ healthcare daily [8, 41–43]. Health consciousness
people would adopt a healthcare device if they find the devices trustworthy as it concerns
their state of health [44]. Trust is a positive and important predictor for users’ intention
to adopt new healthcare devices [45]. Based on the findings, it is clearly shown that
trustworthiness is one of the most important factors to be considered in measuring users’
intention to adopt wearable healthcare devices.
5 Previous Study on Trustworthiness
Trustworthiness would have been mentioned several times considering that the majority
of the publications talked about the factors for the adoption of wearable fitness trackers.
One publication highlighted that trust is one of the most vital influencers of users’ acceptance of new automated technologies [2]. The barrier to users’ acceptance of healthcare
devices is consumers’ lack of trust in technologies [2]. Recently, consumers’ concern
regarding health has been increasing due to data accuracy and security [20, 27]. Accordingly, if users can get the authentic sources to consume wearable healthcare devices for
monitoring their health status then they would positively consider it. In contrast, if they
sense hesitation about the accuracy and reliability of health data obtained from healthcare wearable devices, they would evaluate it as a threat to their health and well-being
[27].
According to previous studies [18], trust can be seen as an important factor that
influences behavioral intention to use technology and has a strong effect on privacy
concerns. At this point in the paper reviewing process, trustworthiness is only seen as
a factor to adopt wearable devices in a fitness tracker. However, this proposed outset, it
requires advanced research. In Table 3, some research has mentioned trust for wearable
device adoption where blood glucose monitoring devices were not mentioned.
Table 3. Previous studies on trust-based adoption
No
Area
Year
Identified context
References
1
Purchase intention for online
product
2018
Organic private label food
[46]
2
Adoption of cloud-based SCM
2013
Supply chain management
[47]
3
Perceptions of wearable fitness
device impact
2018
Wearable fitness device
[48]
(continued)
Understanding Wearable Device Adoption
657
Table 3. (continued)
No
Area
Year
Identified context
References
4
Role of initial trust for
automated vehicles acceptance
2018
Vehicle automation
[45]
5
Consumer’s online merchant’s
selection process: role of trust
expectation
2015
E-commerce
[49]
6
Doctor’s communication of trust 2004
care: breast cancer
Healthcare
[50]
7
Subjective norms on user’s
truest intention to adopt cloud
technology
2017
Cloud technology
[51]
8
Factors influencing health data
sharing
2017
Healthcare
[14]
9
A Trustworthy system for
patient sensitive information
2018
Healthcare
[8]
10
The effect of doctor-consumer
interaction
2018
Social media, health
[52]
11
A model for wearable IoT device 2018
using intention in workplace
IoT
[18]
12
Trustworthiness of medical
devices
2014
Medical devices
[53]
13
Data trustworthiness in the
internet of things
2018
IoT
[41]
14
Factors influencing adoption of
CGMs device
2021
IoT healthcare device
[10]
The above table shows information regarding trust as a construct. In these 14 articles,
we found trust as a strong construct for users’ intention to use a device. Unfortunately,
none of the papers discussed wearable healthcare device adoption specifically on blood
glucose monitoring systems for smart healthcare. Along with this, it is essential to explore
users’ intention to adopt wearable blood glucose devices in smart healthcare.
6 Trustworthiness in Blood Glucose Monitoring
As stated in the previous studies, many publications addressed the various types of
wearable devices in smart healthcare; but none can be found on the trustworthiness
factor in blood glucose monitoring. Based on the reviewed papers, it is noticeable that
trustworthiness is an important factor to influence users’ intention to adopt healthcarerelated devices. In a smart IoT healthcare system, it is crucial to have or maintain reliable
and accurate data since all the systems work through sensors so that users can trust the
wearable devices better. By the previous studies on different sectors like intention to
658
M. I. Hossain et al.
have wearable device for fitness tracker authors also mentioned about the security and
privacy issue which indicate trustworthiness to have a wearable device in blood glucose
monitoring [10].
Most of the previous papers discussed smart fitness trackers and some factors for
the adoption of wearable technologies. Trustworthiness can also be a major factor for
sensing the glucose level devices as well as the adoption of the smart devices. Testing own
blood glucose manually with devices is now an old trend like it had been for more than
50 years. Most recently continuous glucose monitoring is a new term that is now quite
popular for diabetic patients [54]. To an extent that, the importance of trustworthiness
is visibly highlighted in the related perspective. Thus it is relevant to see the impact
of trustworthiness in measuring the user’s intention to adopt IoT wearable healthcare
devices.
7 Research Questions Outcomes
RQ1. What are the factors influencing the adoption of wearable devices in smart
healthcare?
In Sect. 2.2 and Table 2, it is shown that several factors influence the user’s intention
to adopt wearable devices. In there, seven studies directly addressed some factors in
the context of the smart healthcare sector where personal innovativeness, self-efficacy,
interpersonal influence, health concern, privacy concern, attitude toward using wearable
devices show significant influence on user’s adoption intention to use wearable smart
healthcare devices.
RQ2. What are the limitations and gaps in the current research of wearable devices in
smart healthcare?
To continue this paper, we had gone through many articles where only 7 articles
mentioned smart healthcare adoption intention, barriers of adoption. Most of the studies
discussed only fitness trackers and automated devices that are wearable. As CGMs device
is wearable and a smart solution for blood glucose monitoring, some researches can be
done to give a proper recommendation to the user to adopt smart healthcare-related
devices.
RQ3. How trustworthiness can influence the adoption of smart healthcare devices?
As mentioned in Table 3, trust is a significant construct to measure users’ intention
to adopt smart healthcare devices. In there, 14 studies mentioned trust-based model for
adoption where only one study directly talked about the significance of trust to adopt
smart healthcare devices. If the data from the wearable device is reliable and confirmed
with experts, then users feel safe to use healthcare devices. Trustworthiness is a very
sensitive term as the device is used for disease management and is also related to patient’s
health safety.
Understanding Wearable Device Adoption
659
8 Discussion
This study delivers an overview of wearable healthcare devices. To answer the research
questions, here authors have identified several factors for the adoption of wearable
devices where trust was less highlighted compared to the other constructs. To adopt
smart healthcare wearable devices, users should focus on some factors that have been
discussed and decide the most decisive factors among all of them. As in IoT smart
healthcare devices, all system works through the sensor to sensor communication, so it
needs to assure the end-user about the trustworthiness of the data and devices accurately
to the end-user who will use the system. It is generally accepted in consumer behavior
research that source trustworthiness in health information is an important factor, and
associated with belief [2].
Trust in caregivers and technology vendors may be the critical factors that disturb the
users’ adoption of healthcare information technology [34]. As blood glucose monitoring
is a sensitive issue, it is very important to make sure of the data accuracy on a real-time
basis to create user’s satisfaction on trustworthiness. To adopt wearable devices for blood
glucose monitoring, some factors may influence the users. Among all the aforementioned
factors, trustworthiness plays a vital role in users’ intention to adopt wearable devices
for smart healthcare and blood glucose monitoring. A study on testing the relationship
of trustworthiness through IoT device adoption should be conducted [55].
To identify the research gap, this study presents an overview of wearable device definition (Table 1). Furthermore, this study addresses also the existing factors of wearable
device adoption including wearable fitness trackers, cloud technology. In a few papers,
the authors mentioned the overview and benefits of using wearable CGMs devices where
those studies did not describe anything clearly about the adoption factors for blood glucose monitoring devices. Here, the authors raise the issue of those points and also gave
a preview of the existing articles providing directions for further researches on wearable
CGMs devices that can be useful for the service providers of those devices and also the
users as well.
9 Conclusion
In conclusion, by reviewing the previous studies on wearable devices, smart healthcare,
blood glucose monitoring, and adoption model, we consider this effort could be valuable
for the end-user of the smart healthcare wearable devices especially for the diabetic
patients while service giver can find out the complete model for blood glucose monitoring
device adoption. Trustworthiness can also be a smart solution to make the user’s intention
to adopt a wearable device easily.
As wearable device adoption in IoT healthcare is a new term so the finding shows that
the factors for adoption of the devices will help the users as well as the service providers
to help patients in many ways. By referring to this study, service providers of the smart
healthcare systems can also get a proper initial idea on which of the factors could attract
more users to adopt a wearable device for blood glucose monitoring. After examining
the previous studies, it will be easier to find out the way to have a smart healthcare
device for measuring blood glucose because wearable devices for fitness tracking apply
the same concept as blood glucose monitoring devices.
660
M. I. Hossain et al.
References
1. Fotiadis, D.I., Glaros, C., Likas, A.: Wearable medical devices. Wiley Encycl. Biomed. Eng.
(2006)
2. Kim, S., Kim, S.: User preference for an IoT healthcare application for lifestyle disease
management. Telecomm. Policy 42(4), 304–314 (2018)
3. Casselman, J., Onopa, N., Khansa, L.: Wearable healthcare: lessons from the past and a peek
into the future. Telemat. Inform. 34(7), 1011–1023 (2017)
4. Mahdavinejad, M.S., Rezvan, M., Barekatain, M., Adibi, P., Barnaghi, P., Sheth, A.P.: Machine
learning for internet of things data analysis: a survey. Digit. Commun. Netw. 4(3), 161–175
(2018)
5. Hsiao, K.L., Chen, C.C.: What drives smartwatch purchase intention? Perspectives from
hardware, software, design, and value. Telemat. Inform. 35(1), 103–113 (2018)
6. Aslani, P., et al.: Consumer opinions on adverse events associated with medical devices. Res.
Soc. Adm. Pharm. 15(5), 568–574 (2019)
7. Yang, H., Yu, J., Zo, H., Choi, M.: User acceptance of wearable devices: an extended
perspective of perceived value. Telemat. Inform. 33(2), 256–269 (2016)
8. Yachana, N.K., Sood, S.K.: A trustworthy system for secure access to patient centric sensitive
information. Telemat. Inform. 35(4), 790–800 (2018)
9. Buenaflor, C., Kim, H.C.: Six human factors to acceptability of wearable computers. Int. J.
Multimed. Ubiquitous Eng. 8(3), 103–114 (2013)
10. Hossain, M.I., Yusof, A.F., Hussin, A.R.C., lahad, N.A., Sadiq, A.S.: Factors influencing
adoption model of continuous glucose monitoring devices for internet of things healthcare.
Internet Things 15, 100353 (2021)
11. Lin, D., Lee, C.K.M., Tai, W.C.: Application of interpretive structural modelling for analyzing
the factors of IoT adoption on supply chains in the Chinese agricultural industry. In: IEEE
International Conference on Industrial Engineering and Engineering Management, vol. 2017Decem, pp. 1347–1351 (2018)
12. Gajanayake, R., Iannella, R., Sahama, T.: An insight into the adoption of Accountable-eHealth
systems – an empirical research model based on the Australian context. IRBM 37(4), 219–231
(2016)
13. Lee, S.Y.: Examining the factors that influence early adopters’ smartphone adoption: the case
of college students. Telemat. Inform. 31(2), 308–318 (2014)
14. Moon, L.A.: Factors influencing health data sharing preferences of consumers: a critical
review. Heal. Policy Technol. 6(2), 169–187 (2017)
15. Haque, M.M., Ahlan, A.R., Mohamed Razi, M.J.: Factors affecting knowledge sharing on
innovation in the higher education institutions (HEis). ARPN J. Eng. Appl. Sci. 10(23),
18200–18210 (2015)
16. Gücin, N.Ö., Berk, Ö.S.: Technology acceptance in health care: an integrative review of
predictive factors and intervention programs. Procedia Soc. Behav. Sci. 195, 1698–1704
(2015)
17. Canhoto, A.I., Arp, S.: Exploring the factors that support adoption and sustained use of health
and fitness wearables. J. Mark. Manag. 33(1–2), 32–60 (2017)
18. Yildirim, H., Ali-Eldin, A.M.T.: A model for predicting user intention to use wearable IoT
devices at the workplace. J. King Saud Univ. Comput. Inf. Sci. 1–9 (2018)
19. Lunney, A., Cunningham, N.R., Eastin, M.S.: Wearable fitness technology: a structural investigation into acceptance and perceived fitness outcomes. Comput. Human Behav. 65, 114–120
(2016)
20. Rupp, M.A., Michaelis, J.R., McConnell, D.S., Smither, J.A.: The role of individual differences on perceptions of wearable fitness device trust, usability, and motivational impact. Appl.
Ergon. 70(April 2017), 77–87 (2018)
Understanding Wearable Device Adoption
661
21. Lee, S.Y., Lee, K.: Factors that influence an individual’s intention to adopt a wearable
healthcare device: the case of a wearable fitness tracker. Technol. Forecast. Soc. Change
129(December 2017), 154–163 (2018)
22. Dehghani, M., Kim, K.J., Dangelico, R.M.: Will smartwatches last? Factors contributing to
intention to keep using smart wearable technology. Telemat. Inform. 35(2), 480–490 (2018)
23. Martínez-Caro, E., Cegarra-Navarro, J.G., García-Pérez, A., Fait, M.: Healthcare service
evolution towards the internet of things: an end-user perspective. Technol. Forecast. Soc.
Change 136(March), 268–276 (2018)
24. Keikhosrokiani, P., Mustaffa, N., Zakaria, N.: Success factors in developing iHeart as a patientcentric healthcare system: a multi-group analysis. Telemat. Inform. 35(4), 753–775 (2018)
25. Dehghani, M., Joon, K., Maria, R.: Telematics and informatics will smartwatches last? Factors
contributing to intention to keep using smart wearable technology. Telemat. Inform. 35(2),
480–490 (2020)
26. Chuah, S.H.W., Rauschnabel, P.A., Krey, N., Nguyen, B., Ramayah, T., Lade, S.: Wearable
technologies: the role of usefulness and visibility in smartwatch adoption. Comput. Human
Behav. 65, 276–284 (2016)
27. Marakhimov, A., Joo, J.: Consumer adaptation and infusion of wearable devices for healthcare.
Comput. Human Behav. 76, 135–148 (2017)
28. Hatz, M.H.M., Sonnenschein, T., Blankart, C.R.: The PMA scale: a measure of physicians’
motivation to adopt medical devices. Value Heal. 20(4), 533–541 (2017)
29. Li, J., Zhang, C., Li, X., Zhang, C.: Patients’ emotional bonding with MHealth apps: an
attachment perspective on patients’ use of MHealth applications. Int. J. Inf. Manag. (March),
102054 (2019)
30. Nasir, S., Yurder, Y.: Consumers’ and physicians’ perceptions about high tech wearable health
products. Procedia Soc. Behav. Sci. 195, 1261–1267 (2015)
31. Anwar, M., Joshi, J., Tan, J.: Anytime, anywhere access to secure, privacy-aware healthcare
services: Issues, approaches and challenges. Heal. Policy Technol. 4(4), 299–311 (2015)
32. Wu, T., Deng, Z., Zhang, D., Buchanan, P.R., Zha, D., Wang, R.: International journal of
medical informatics seeking and using intention of health information from doctors in social
media : the effect of doctor-consumer interaction. Int. J. Med. Inform. 115(April), 106–113
(2018)
33. Yee-Loong Chong, A., Liu, M.J., Luo, J., Keng-Boon, O.: Predicting RFID adoption in
healthcare supply chain from the perspectives of users. Int. J. Prod. Econ. 159, 66–75 (2015)
34. Holden, R.J., Karsh, B.-T.: The technology acceptance model: its past and its future in health
care. J. Biomed. Inform. 43(1), 159–172 (2010)
35. Asrar-ul-Haq, M., Anwar, S.: A systematic review of knowledge management and knowledge
sharing: trends, issues, and challenges. Cogent Bus. Manag. 3(1), 1–17 (2016)
36. Gubbi, J., Buyya, R., Marusic, S., Palaniswami, M.: Internet of things (IoT): a vision,
architectural elements, and future directions. Futur. Gener. Comput. Syst. 29(7), 1645–1660
(2013)
37. Jebaseeli, T.J., Durai, C.A.D., Peter, J.D.: IOT based sustainable diabetic retinopathy diagnosis
system. Sustain. Comput. Inform. Syst. (2018). Elsevier Inc.
38. Byrne, J.R., O’Sullivan, K., Sullivan, K.: An IoT and wearable technology Hackathon for
promoting careers in computer science. IEEE Trans. Educ. 60(1), 50–58 (2017)
39. Ahmad, N.A., Drus, S.M., Kasim, H., Othman, M.M.: Assessing content validity of enterprise architecture adoption questionnaire (EAAQ) among content experts. In: 2019 IEEE 9th
Symposium on Computer Applications and Industrial Electronics, pp. 160–165 (2019)
40. Balapour, A., Reychav, I., Sabherwal, R., Azuri, J.: Mobile technology identity and selfefficacy: implications for the adoption of clinically supported mobile health apps. Int. J. Inf.
Manag. 49(October 2018), 58–68 (2019)
662
M. I. Hossain et al.
41. Haron, N., Jaafar, J., Aziz, I.A., Hassan, M.H., Shapiai, M.I.: Data trustworthiness in internet
of things: a taxonomy and future directions. In: 2017 IEEE Conference on Big Data Analysis,
ICBDA 2017, vol. 2018-Janua, pp. 25–30 (2018)
42. Hennemann, S., Beutel, M.E., Zwerenz, R.: Ready for eHealth? Health professionals’ acceptance and adoption of eHealth interventions in inpatient routine care. J. Health Commun.
22(3), 274–284 (2017)
43. Lassar, W.M., Manolis, C., Lassar, S.S.: The relationship between consumer innovativeness,
personal characteristics, and online banking adoption, 23(2) (2005)
44. Ayeh, J.K., Au, N., Law, R.: Predicting the intention to use consumer-generated media for
travel planning. Tour. Manag. 35, 132–143 (2013)
45. Zhang, T., Tao, D., Qu, X., Zhang, X., Lin, R., Zhang, W.: The roles of initial trust and
perceived risk in public’s acceptance of automated vehicles. Transp. Res. Part C Emerg.
Technol. 98(June 2018), 207–220 (2019)
46. Konuk, F.A.: The role of store image, perceived quality, trust and perceived value in predicting
consumers’ purchase intentions towards organic private label food. J. Retail. Consum. Serv.
43(March), 304–310 (2018)
47. Liu, X., Li, Q., Lai, I.K.W.: A trust model for the adoption of cloud-based supply chain management systems: a conceptual framework. In: ICEMSI 2013 - 2013 International Conference
on Engineering, Management Science and Innovation, pp. 1–4 (2013)
48. Rupp, M.A., Michaelis, J.R., McConnell, D.S., Smither, J.A.: The role of individual differences on perceptions of wearable fitness device trust, usability, and motivational impact. Appl.
Ergon. 70, 77–87 (2018)
49. Hong, I.B.: Understanding the consumer’s online merchant selection process: the roles of
product involvement, perceived risk, and trust expectation. Int. J. Inf. Manag. 35(3), 322–336
(2015)
50. Wright, E.B., Holcombe, C., Salmon, P.: Doctors’ communication of trust, care, and respect
in breast cancer: qualitative study. Br. Med. J. 328(7444), 864–867 (2004)
51. Ho, S.M., Ocasio-Velázquez, M., Booth, C.: Trust or consequences? Causal effects of perceived risk and subjective norms on cloud technology adoption. Comput. Secur. 70, 581–595
(2017)
52. Wu, T., Deng, Z., Zhang, D., Buchanan, P.R., Zha, D., Wang, R.: Seeking and using intention
of health information from doctors in social media: the effect of doctor-consumer interaction.
Int. J. Med. Inform. 115(April), 106–113 (2018)
53. Zhang, B.M., Raghunathan, A., Jha, N.K.: Trustworthiness of medical devices and body area
networks, 102(8) (2014)
54. Olczuk, D., Priefer, R.: A history of continuous glucose monitors (CGMs) in self-monitoring
of diabetes mellitus. Diabetes Metab. Syndr. Clin. Res. Rev. 12(2), 181–187 (2018)
55. Hossain, M.I., Yusof, A.F., Hussin, A.R.C., Billah, M., Shanmugam, M.: The content and
construct development of CGMs device adoption model. In: Siconian 2019, vol. 172 (2020)
Factors Contributing to an Effective
E- Government Adoption in Palestine
Tareq Obaid1(B) , Bilal Eneizan2 , Samy S. Abu Naser1 , Ghaith Alsheikh3 ,
Ahmed Ali Atieh Ali4 , Hussein Mohammed Esmail Abualrejal4 ,
and Nadhmi A. Gazem5
1 Faculty of Engineering and IT, Alazhar University, Gaza, Palestine
tareq.obaid@alazhar.edu.ps
2 Business School, Jadara University, Irbid, Jordan
3 Human Resources Department, Faculty of Business, Amman Arab University, Amman, Jordan
4 School of Technology Management and Logistic, College of Business,
Universiti Utara Malaysia, 06010 Sintok, Kedah, Malaysia
abualrejal@uum.edu.my
5 Management Information Systems Department, College of Business Administration-Yanbu,
Taibah University, Medina, Saudi Arabia
Abstract. Despite the fact that the success of e-government adoption is dependent on individuals’ willingness to utilize it, little attention has been paid to citizens’ perspectives on e-government adoption. However, it appears that worldwide e-Government adoption has fallen short of predictions, but some countries
are performing better than others. As a result, it is critical to improve residents’
understanding of the reasons for and techniques of using government websites,
as well as their attitudes about e-Government. This article addresses the issue by
proposing a conceptual model for e-Government adoption that emphasizes the
role of users in the implementation of e-Government. By adapting and tailoring
the measurement scale from prior studies, the questionnaire approach was used to
collect data. On 250 prospective respondents, a systematic convenience sampling
approach was used. The finding of this study technical, personal, and dependability factors influence the intention to use e-Government, they have a significant
impact on the actual adoption of e-Government services in Palestine. The government should develop a comprehensive e-government planning model based on
demographic factors.
Keywords: Intention to use · Perceived-E readiness · e-Government ·
Adoption · Palestine
1 Introduction
The electronic government or e-Government employs information and communication
technology (ICT) to successfully deliver government services and information to residents, other government organisations, and businesses (Rose et al. 2015). It is clear
© The Author(s), under exclusive license to Springer Nature Switzerland AG 2022
F. Saeed et al. (Eds.): IRICT 2021, LNDECT 127, pp. 663–676, 2022.
https://doi.org/10.1007/978-3-030-98741-1_55
664
T. Obaid et al.
that the traditional public service provided through the new ICT systems or the addition of new online service delivery channel is not the main focus of e-Government,
but it emphasizes on strengthening the transparency, governance, and accountability of
the public sector services for the improvement in government effectiveness and development of new public value for businesses and residents (Wang 2014). Higher public
involvement in e-Government facilities is important to fulfil these goals.
Although the efforts made in this domain are present, the low rate of adoption via
the residents is a significant concern to the governments worldwide (Rana and Dwivedi
2015). Therefore, research attention is essential on this matter as effective employment
of e-Government is greatly affected by the residents as well as the employment of
such services (Panagiotopoulos et al. 2012). This situation illustrates that grasping the
multi-faceted elements impacting the citizens’ adoption of e-Government services is
important. Despite the fact that an extensive research of technology adoption from the
user’s perspective has been conducted, in the e-commerce and Internet contexts (AlDebei and Al-Lozi 2014), The number of studies on residents’ adoption of e-Government
services is limited. (Beldad et al. 2011).
In comparison to the critical adoption and implementation of a wide range of information technology in private businesses, the residents’ adoption of e-Government services
frequently takes place in unstable socio-political environments, including the changing
budget reduction and political leadership. In this scenario, the adoption of e-government
facilities should not be studied solely from a technological point of view, but a thorough
and integrative method, which incorporates the cultural, political, and social views is
required to obtain further knowledge in this subject (Carter et al. 2011). Notably, the
lack of concrete comprehension of the elements of the residents’ adoption of its services would disrupt the government from making informed strategic decisions for the
improvement in e-Government adoption (Carter et al. 2011).
The previous investigation on the adoption of e-government primarily emphasised
on the developed nations. As a result, there was a minor focus on the investigation on
the adoption of e-government in developing nations, specifically the Arab nations. This
is a large research problem due to the notable difference between these nations and the
Western nations in the aspects of the social and cultural features (Olasina and Mutula
2015). Therefore, it could be predicted that the essential elements impacting people’s
acquirement of technologies in Arab nations might be different from the elements associated with the industrialised Western nations, including the nations from North America
and Western Europe (Al-Gahtani 2004).
Palestine is among the nations in the Middle East, which has been dedicated to
ICT-related actions and quality governance. It was illustrated in the recent literature that
Palestine has exhibited a positive degree of electronic transformation in the aspect of
political determination although the application of e-government in this nation is still in
its infancy. However, some challenges are present in the e-Government implementation,
which mainly include geopolitical phenomenon, inadequate legislation, decision-making
processes, low consciousness and preparedness of residents to accept the recent digital
evolution towards the true digital government, and policies (Shat et al. 2013).
Factors Contributing to an Effective E-Government Adoption
665
A low degree of cooperation for e-Government actions is present among the ministries due to anxiety and trust issues regarding data control with other national organisations and ministries (Abu-Jaber 2011). As a result, the government ministries are
confronted by the obstacles to the distribution of electronic information and insufficient safety of service for the users. This phenomenon distorts the users’ reliance on the
government’s capability of employing e-government and ultimate results in ineffective
e-Government actions (Ayyash et al. 2013).
The application of e-Government in Palestine possibly develops solutions to the
issues about communication with government institutions and access to government
services. Taking the notable distribution of the Palestine residents and Israel domination
over the area into account, the development and implementation of an authentic electronic Government possibly results in the capability of the government to fulfil its role
and perform the electronic distribution of public services to the Palestine residents and
other stakeholders. Besides, the residents will be capable of performing two-way communication with the government. Notably, effective e-Government services in Palestine
would enhance the efficacy of the Palestinian authority’s potential in providing support for public institutions and catering to individuals and corporations. Accordingly,
improving the comprehension of the elements impacting the residents’ adoption is highly
crucial. It would facilitate the policymakers in designing the service and assist the public
institutions in delivering it to strengthen the service adoption among the residents.
2 Literature Review
The application of electronic Government involves the users’ attempt for interaction and
engagement with e-Government systems (Rana et al. 2015). It could also be identified
as the users’ preparedness to employ e-Government facilities and systems (Carter et al.
2016). During the previous years, the adoption of e-Government among the residents
brought increasing attention among scholars. It was highlighted by (Kumar et al. 2007)
that attempt and preparedness to use these systems indicate a dimension of the measurement of e-Government adoption, which does not only involve the use of electronic
services and systems, but it also considers the frequency of the users’ attempt of using
and accepting the systems, what impacts their point of view, experiences and predictions, the elements influencing the adoption, and how this adoption and preparedness of
using the systems could be adjusted (Athmay et al. 2016; Enas et al. 2019). Furthermore,
users’ predictions and needs are emphasised in this adoption to make a contribution to
their attempt of using electronic government services. Moreover, a speech by the prime
minister of the United Kingdom addressed the transformational government and emphasised that technology is essential to make a better decision regarding the public sector
services for citizens (King and Cotterill 2007). It was also stressed that these services
should be based on what is needed by the users instead of the suppliers (Linders et al.
2018).
Low adoption rate may result in an ineffective e-Government system. It was highlighted by (Anthopoulos et al. 2016; Nofal et al. 2021) that that ineffective adoption of
the e-Government projects remains and may go from an incomplete to a total failure. It
was also claimed that this failure would occur when the actual business needs, users’
666
T. Obaid et al.
expectations, and preparedness for adoption and implementation are not fulfilled. Moreover, (Janssen and Estevez 2013) emphasised that various high transformation projects,
such as e-Government, do not lead to the targeted project results when they are not
adopted by the stakeholders. The ineffective e-Government project was classified into
two types by (Anthopoulos et al. 2016), namely pre- or post-execution, and failed execution. Specifically, the first failure involved either the neglect of the project upon the
implementation stage, which lead to total failure.
In a study by (Huang et al. 2013), the UTAUT was combined with dependence
on citizens’ conduct in the adoption and distribution of e-Government in Greece. It
was found that effort and performance prediction, reliance on the government and the
internet, and social impact are the elements influencing the user’s attempt. As for the
e-Government use, it was indicated from the analysis that ‘facilitating conditions’ was a
notable indicator of the e-Government use (Rokhman 2011). The Diffusion of Innovation
and perceived characteristics of innovating theories were used to examine e-Government
adoption among Indonesian residents. In this research, four features were investigated,
namely image, relative advantage, image, efficient use, and compatibility on the attempt
of using e-Government services. It was noted from the results that the comparative advantages and compatibility had a notable impact on the attempt to employ e-Government
facilities. It was also revealed that efficient use and image were not the ideal determinants of the attempts to employ the e-government facilities, and this result was consistent
with the findings of a number of earlier investigations. (Belanger et al. 2005). Furthermore, Al Hujran et al. (2013) combined the Technology Acceptance Model constructs
with new constructs, including reliability, service quality, and residents’ satisfaction to
develop a model of elements impacting the residents’ employment of e-Government
facilities in Jordan. It was found that residents’ satisfaction, PEOU, PU, and reliability
were the notable determinants of usage intention, which constituted 54.6% of the variation of the residents’ attempt to using e-Government facilities. It was also demonstrated
that the residents’ attempt to use e-Government services was primarily impacted by the
users’ satisfaction. In a study by Azam et al. (2013), a combination of the model was
created using UTAUT and initial reliance, while the elements proving the adoption of
e-Government facilities in Pakistan were outlined. The analysis illustrated that performance prediction, social impact, and initial reliance positively affected the behavioural
attempt of using e-Government services. A current study by Alomari (2014) examined
the effect of word of mouth (WOM), avoidance to development, and favoritism on eGovernment adoption in Jordan. This study emphasised that taking the cooperation of
the Jordanian population into account was crucial when the elements influencing the
e-Government adoption were examined.
Despite the existence of important literature on the factors influencing citizens’ adoption in various developing and developed countries, few works of research highlighted
the adoption of e-Government facilities in Palestine.
3 Conceptual Model
In analysing the e-Government adoption, a model was formulated. It was also among
the main contributions of this study, which would be applied for the investigation and
Factors Contributing to an Effective E-Government Adoption
667
analysis of the elements with a considerable influence on various adoption and degrees
of e-Government adoption among the users. Furthermore, the formulation of the model
was according to a substantial analysis of the literature regarding the acceptance of
technology and the understanding achieved from examining some theories or models.
These aspects were normally employed to analyse the use and acceptance to technologies,
namely the (UTAUT), the (DOI), the (TAM), and the (TRA) (Dwivedi et al. 2019; Enas
et al. 2019; Nofal et al. Nofal et al. 2021). This research aimed to determine, examine,
and perform an analysis of the effect of fundamental elements influencing the adoption
rate of e-Government from the residents’ belief. As a result, improved comprehension
would be developed regarding various elements contributing to the strong effectiveness
of the systems.
The theory of reasoned action (TRA) is a model, which was properly investigated
and shown to effectively elaborate on the intention and actions in diverse domains. It
was highlighted by Lean et al. (2009) that TRA was among the theories investigating
the individuals’ actions towards the acquirement of computers. Davis also highlighted
that TRA was suitable in the investigation of the indicators of computer use conduct,
and it was employed as the root for the development of the TAM model, which was
also commonly applied to gain comprehension on the users’ acceptance of technology
(Davis 1986; Enas et al. 2019). Furthermore, the TRA was used in some research with
a purpose to develop insights about the adoption and acceptance of systems led by
the information and communication technologies (ICT), including the acquirement of
online systems (Enas et al. 2019; Rehman et al. 2016). Nevertheless, the TRA comprised
inadequate constructs, which should be addressed to examine and analyse the adoption
of complex and major systems, including the e-Government. The constructs, which are
not highlighted, refer to the quality of the system, the impact of consciousness, the
simplicity of the information system, and the impact of reliance. Despite the important
involvement of two constructs in TRA, namely the subjective norms and attitude towards
behaviour, they were not adequate for a thorough comprehension of the adoption of the
e-Government systems. It was highlighted by Davis (1986) that the least comprehension
revolves around the subjective norm. Furthermore, it is possible for the subjective norm
(SN) construct to indirectly affect behavioural intention (BI) through the perception
towards behaviour (A) construct. This impact would lead to challenges in distinguishing
the direct impact of SN on BI and the indirect impact of SN on BI through A. For this
reason, increased comprehension of the model is important for the adoption of the use
and e-Government analysis.
The TAM is a model applied in some research in the literature on the employment
and acceptance of the technology. This model was used in several studies to examine the
employment of e-Government systems (Al Hujran et al. 2013; Nofal et al. Nofal et al.
2021). In a study by Benbasat and Barki (2007), although the adoption and acceptance
towards TAM were found to be the most significant in the literature in various areas,
such as information systems, business, and management, several factors with a high
association with technology adoption and acceptance were omitted. To give an example,
this study did not consider the impact of social norms as outlined in the Theory of
Reasoned Action (TRA), such as the impact of previous technology adoption, quality
standard, and awareness of the attempt to use technology. The relationship between
668
T. Obaid et al.
perceived ease of use (PEU), perceived usefulness (PU), and the attempt to employ
technology is not entirely explained by one’s attitude toward it (Ramayah and Ignatius
2005). TAM, on the other hand, did not conduct a detailed examination into the external
factors that were identified as having an impact on PEU and PU (Nofal et al. Nofal et al.
2021; Sang et al. 2009). Additionally, Al-Shafi and Weerakkody (2010) emphasised that
TAM omitted several crucial variance resources and other essential elements, which
could avoid the users from employing the information systems, including time and
financial restrictions.
One of the most recent frameworks in the literature on technology acceptance and
use is the Unified Theory of Acceptance and Use of Technology (UTAUT). This framework is also more commonly applied in this area compared to other models and theories.
For example, it is involved in the analysis of the use of social media in public-relations
practitioners’ engagement with the public. Furthermore, Curtis et al. (2010) aimed to
investigate the elements influencing the attempt of using the advanced mobile services,
while Carlsson et al. (2006) attempted to perform an analysis and gain an understanding
of the application of online banking (Martins et al. 2014). The UTAUT was used in
various studies for the analysis of the adoption of e-Government services and systems
(Weerakkody et al. 2013). Although UTAUT was widely applied in many researches
of various disciplines, the limitations of it were present in the analysis of technology
adoption, especially in the e-Government area. However, the UTAUT highlights several
highly crucial elements and constructs, including identified service standard and consciousness despite the high possibility of these elements to have a strong impact on the
attempt of employing and implementing technology. Furthermore, it did not emphasise
on the constructs associated with the elements of reliability, including management,
reliance, privacy, and security. The UTAUT also did not emphasise on the influence of
culture on the employment of technologies. Although UTAUT took the impact of specific
personal demographic elements into accounts, including age and gender, the essential
demographic elements were not highlighted, such as the user’s academic degree and
salary, which would possibly affect the adoption rate. It was stated by Huang et al.
(2013) that the categorisation of elements in the UTAUT became a concern due to the
integration of various disparate elements to form a single construct.
Personal
Factors
Intention to Use
E-Government
Technical
Factors
Reliability
Factors
Actual
Adoption
Perceived-E
Readiness
Fig. 1. Conceptual model of the research
Factors Contributing to an Effective E-Government Adoption
669
Figure 1 illustrates the e-Government adoption model. The independent elements
positioned on the left part of the model are personal factors (PF), technical factors (TF)
and reliability factors (RF), which indicate the factor groupings.
Personnel factors (PF) is a crucial element in the model. It was indicated from the
research that users’ gender, academic level, age, salary, income, and computer literacy
degree are the elements to be examined when the e-Government adoption is analysed.
However, these elements were not considered by the majority of the previous adoption
models, including TAM and DOI models, while several models, such as UTAUT, identified these elements as moderators instead of the primary factors. However, it was added
by several works of research in the e-Government adoption literature that users’ characteristics might be the significant elements influencing the employment of e-Government.
To illustrate, it was proposed by Sciadas (2002) that older users often had a positive
correlation with e-Government as more access was available to technology. However,
this phenomenon did not remain in the current years nor represent the phenomenon in
Palestine, which was the setting of this research. Overall, this situation indicated the
importance of including personal factors when the technology implementation was performed in e-Government. The Personal Factors (PF) in the model of this study consisted
of four primary elements, namely users’ gender, age, location, and academic level.
Technical Factors (TF) is another crucial element in the model. Technical elements
are present in any interactive information system, which should be highlighted to gain
the results from the application of the systems. E-Government is among the information
systems, in which more emphasis should be placed on the technical aspect due to the
high number of users. There is a high possibility for the implementation degree of these
users to be influenced by the technical problems of the systems.
4 Research Method
The data for this study was collected using a self-administered questionnaire, which
took a quantitative approach. A thorough literature research was conducted in order to
identify items that would be used to assess the actual adoption and intent to use the
e-government construct. The research methodology involved e-government users. The
items were adapted and modified to suit this study. Several items have been modified
in order to suit the needs of the research. The 5 Likert-scale ranging from 1 (strongly
disagree) to 5 (strongly agree) with the statement were used to measures the responses.
A convenience sample of 250 e-government users from the West Bank and Gaza Strip
was chosen for data collection and given the self-administered questionnaire.
5 Data Analysis
We used partial least squares (PLS) modeling using the SmartPLS 3.3.2 version. The
study employed a two stages approached in testing the hypothesis of the study. The first
stage consist of measurement model, which consist of the convergent and discriminant
validity. Once the validities has been confirm, the study will proceed to the hypothesis
testing, or the structural model.
The first is convergent validity, which determines if a given item measures the latent
variable it claims to measure (Hair et al. 2017) (Fig. 2).
670
T. Obaid et al.
Fig. 2. Convergent validity
Fig. 3. Measurement model
According to (Fornell and Larcker 1981), the square root of AVE for each construct
should be bigger than the correlation coefficient of the constructs included in the model,
as shown in Fig. 3. This requirement has been met, as indicated in Fig. 3.
5.1 Structural Model
To produce t-values bootstrapping was also performed, Fig. 4 illustrates the outcomes
of the hypotheses examining of direct relationships. The results of the study indicated
that personal factors, Reliability Factors and Technical Factors effect positively and significantly on Intention to Use E-Government and Perceived-E Readiness. Perceived-E
Factors Contributing to an Effective E-Government Adoption
671
Discriminant Validity
20
10
0
OS
SE
T value
P Values
Intenon to Use E-Government -> Actual Adopon
Perceived-E Readiness -> Intenon to Use E-Government
Personal Factors -> Intenon to Use E-Government
Reliability Factors -> Intenon to Use E-Government
Reliability Factors -> Perceived-E Readiness
Technical Factors -> Intenon to Use E-Government
Fig. 4. Discriminant validity
Readiness effect positively and significantly on Intention to Use E-Government. Intention to Use E-Government effect positively and significantly on Actual Adoption (Figs. 5
and 6).
18
16
14
12
10
8
6
4
2
0
OS
SE
T value
P Values
Fig. 5. Direct relationships
672
T. Obaid et al.
Fig. 6. Structural model
6 Discussion
In this study personal factors has been identified to have positive influence on intention
to use e-Government in Palestine. The hypothesized association was determined to be
statistically significant at 95% confidence interval (β = 0.215, t-value = 5.957, p-values
= 0.000) significance at p < 0.01, indicating support for H1. This result is consistent
with previous studies the examined intention to use e-Government (Mensah et al. 2017).
Personal Factors must believe that the government has the management and technical
resources needed to put these mechanisms in place and secure them. Citizens must
have the intention to “engage in e-government,” which includes the intentions to receive
and supply information through on-line channels, in order to use e-government services.
Also; The H2 has hypothesized that the reliability factors may have a positive effect on the
intention to use e-Government in Palestine. It was found that the p-value was 0.013 which
is less than the assumed value of 0.05 level. Thus, it can be concluded that the difference
between reliability factors and intention to use e-Government is significant. This implies
that the reliability factors does really matter much in determining the intention to use
e-Government in Palestine according to (Ayyash et al. 2013; Obaid et al. 2020), For a
few participants, the quality of e-government service had no bearing on people’ trust
since they would not utilize e-government service even if the quality was great because
they did not trust internet systems in general to conduct any financial transactions. In
this research, examined the reliability factors on the perceived e-readiness. According
to the result, the direct effect β is 0.218, whereas the (p-values = 0.000) significance at
p < 0.01. Hence, the H3 is supported. Therefore, the result of this study is consistent
with several recent studies (Ali and Alrayes 2014).
7 Conclusion
The crucial elements impacting the users’ attempt of using the system in Palestine were
determined in this study, and a model was formed as a remarkable instrument, which
facilitated the employment of e-Government in developing nations. The novelty of this
Factors Contributing to an Effective E-Government Adoption
673
study would lead to knowledge representation, while the research suggestions would
be important for researchers and decision/policymakers who have the willingness for
changes.
It was also believed that this study could be the basis of future research on the residents’ employment of e-Government services in Palestine. Therefore, e-Government
institutions would be presented with the information associated with the elements affecting the users’ employment of e-Government facilities in Palestine. Subsequently, the
government would be capable of focusing on every element and make developments.
The primary role of researchers is to determine the main aspects, which would assist
the policymakers from the e-Government authority in identifying the benefits of eGovernment in future actions by the government. This study would also assist future
studies in enhancing the implementation of e-Government.
8 Limitations and Future Studies
This research has formulated an integrated model to create a systematic method of
understanding the implementation of e-Government services among users.
Future studies are recommended for the actual application of e-Government services
rather than the dependent elements to evaluate e-Government employment (Shih and
Venkatesh 2004). The effectiveness of the findings could be enhanced with the use of
an observed variable rather than a construct for an online system measurement.
This study was performed according to some elements formulated from previous
literature for the measurement of e-Government facilities in Palestine. However, an
analysis of similar topics could be performed in future studies through the expansion of
the research model and the incorporation of more elements. To illustrate, the identified
risk is among the elements, which could be incorporated in future studies due to its
notable impact on online purchase attempt (Featherman and Pavlou 2003). The factor of
compatibility could also be taken into account as the extent to which a transformation
is regarded to be in line with the current values, previous experience, and the possible adopters’ needs. Additionally, the increasing use of the target technology by the
users enhanced the suitability of the technology with the change, which impacted the
compound responses via PU and EOU.
It was believed that these research findings would assist Palestine and other nations
with the same features across the primary elements in the e-Government implementation.
Accordingly, comparative research could be performed to make a comparison between
the results of this research and those from other developing nations, particularly the
nations with a similar vision as the Palestinian government. Through similar research in
other nations, particularly the nations with similar features with Palestine, a comparison
might take place between this study and other studies in terms of results, followed by
their affirmation or extension.
References
Abu-Jaber, N.O.Y.: Strategic analysis and development of electronic government strategies for the
palestinian municipalities (2011)
674
T. Obaid et al.
Al-Debei, M.M., Al-Lozi, E.: Explaining and predicting the adoption intention of mobile data
services: a value-based approach. Comput. Hum. Behav. 35, 326–338 (2014)
Al-Gahtani, S.S.: Computer technology acceptance success factors in Saudi Arabia: an exploratory
study. J. Glob. Inf. Technol. Manag. 7(1), 5–29 (2004)
Al-Shafi, S., Weerakkody, V.: Factors affecting e-government adoption in the state of Qatar (2010)
Al Hujran, O., Aloudat, A., Altarawneh, I.: Factors influencing citizen adoption of e-government
in developing countries: the case of Jordan. Int. J. Technol. Hum. Interact. (IJTHI) 9(2), 1–19
(2013)
Ali, H., Alrayes, A.: An empirical investigation of the effect of e-readiness factors on adoption of
e-procurement in kingdom of Bahrain. Int. J. Bus. Manag. 9(12), 220 (2014)
Alomari, M.K.: Discovering citizens reaction toward e-government: factors in e-government
adoption. JISTEM-J. Inf. Syst. Technol. Manag. 11(1), 5–20 (2014)
Anthopoulos, L., Reddick, C.G., Giannakidou, I., Mavridis, N.: Why e-government projects fail?
An analysis of the Healthcare .gov website. Gov. Inf. Q. 33(1), 161–173 (2016)
Athmay, A.A.A.A., Fantazy, K., Kumar, V.: E-government adoption and user’s satisfaction: an
empirical investigation. EuroMed J. Bus. (2016)
Ayyash, M.M., Ahmad, K., Singh, D.: Investigating the effect of information systems factors on
trust in e-government initiative adoption in Palestinian public sector. Res. J. Appl. Sci. Eng.
Technol. 5(15), 3865–3875 (2013)
Azam, A., Qiang, F., Abdullah, M.I.: Determinants of e-government services adoption in Pakistan:
an integrated model. Electron. Gov. Int. J. 10(2), 105–124 (2013)
Belanger, F., Carter, L.D., Schaupp, L.C.: U-government: a framework for the evolution of egovernment. Electron. Gov. Int. J. 2(4), 426–445 (2005)
Beldad, A., De Jong, M., Steehouder, M.: I trust not therefore it must be risky: determinants of
the perceived risks of disclosing personal data for e-government transactions. Comput. Hum.
Behav. 27(6), 2233–2242 (2011)
Benbasat, I., Barki, H.: Quo vadis TAM? J. Assoc. Inf. Syst. 8, 7 (2007)
Carlsson, C., Carlsson, J., Hyvonen, K., Puhakainen, J., Walden, P.: Adoption of mobile
devices/services-searching for answers with the UTAUT. Paper presented at the Proceedings of
the 39th Annual Hawaii International Conference on System Sciences (HICSS 2006) (2006)
Carter, L., Shaupp, L.C., Hobbs, J., Campbell, R.: The role of security and trust in the adoption
of online tax filing. Transform. Gov. People Process Policy (2011)
Carter, L., Weerakkody, V., Phillips, B., Dwivedi, Y.K.: Citizen adoption of e-government services:
exploring citizen perceptions of online services in the United States and United Kingdom. Inf.
Syst. Manag. 33(2), 124–140 (2016)
Curtis, L., et al.: Adoption of social media for public relations by nonprofit organizations. Publ.
Relat. Rev. 36(1), 90–92 (2010)
Davis, F.D.: A technology acceptance model for empirically testing new end-user information
systems, Cambridge, MA (1986)
Dwivedi, Y.K., Rana, N.P., Jeyaraj, A., Clement, M., Williams, M.D.: Re-examining the unified
theory of acceptance and use of technology (UTAUT): towards a revised theoretical model. Inf.
Syst. Front. 21(3), 719–734 (2019)
Enas, A., Ghaith, A., Abdulllah, A.A., Tambi, A.M.b.A.: Review of the impact of service quality
and subjective norms in TAM among telecommunication customers in Jordan. Int. J. Ethics
Syst. (2019)
Featherman, M.S., Pavlou, P.A.: Predicting e-services adoption: a perceived risk facets perspective.
Int. J. Hum. Comput. Stud. 59(4), 451–474 (2003)
Fornell, C., Larcker, D.F.: Evaluating structural equation models with unobservable variables and
measurement error. J. Mark. Res. 18(1), 39–50 (1981)
Factors Contributing to an Effective E-Government Adoption
675
Hair, J.F., Hult, G.T.M., Ringle, C.M., Sarstedt, M., Thiele, K.O.: Mirror, mirror on the wall:
a comparative evaluation of composite-based structural equation modeling methods. J. Acad.
Mark. Sci. 45(5), 616–632 (2017)
Huang, W.-H.D., Hood, D.W., Yoo, S.J.: Gender divide and acceptance of collaborative Web 2.0
applications for learning in higher education. Internet High. Educ. 16, 57–65 (2013)
Janssen, M., Estevez, E.: Lean government and platform-based governance—doing more with
less. Gov. Inf. Q. 30, S1–S8 (2013)
King, S., Cotterill, S.: Transformational government? The role of information technology in
delivering citizen-centric local public services. Local Gov. Stud. 33(3), 333–354 (2007)
Kumar, V., Mukerji, B., Butt, I., Persaud, A.: Factors for successful e-government adoption: a
conceptual framework. Electron. J. E-Gov. 5(1) (2007)
Lean, O.K., Zailani, S., Ramayah, T., Fernando, Y.: Factors influencing intention to use
e-government services among citizens in Malaysia. Int. J. Inf. Manag. 29(6), 458–475 (2009)
Linders, D., Liao, C.Z.-P., Wang, C.-M.: Proactive e-governance: flipping the service delivery
model from pull to push in Taiwan. Gov. Inf. Q. 35(4), S68–S76 (2018)
Martins, C., Oliveira, T., Popovič, A.: Understanding the Internet banking adoption: a unified
theory of acceptance and use of technology and perceived risk application. Int. J. Inf. Manag.
34(1), 1–13 (2014)
Mensah, I.K., Jianing, M., Durrani, D.K.: Factors influencing citizens’ intention to use egovernment services: a case study of South Korean students in China. Int. J. Electron. Gov.
Res. (IJEGR) 13(1), 14–32 (2017)
Nofal, M.I., Al-Adwan, A.S., Yaseen, H., Alsheikh, G.A.A.: Factors for extending e-government
adoption in Jordan. Periodicals Eng. Nat. Sci. (PEN) 9(2), 471–490 (2021)
Obaid, T., Abu Mdallalah, S., Jouda, H., Abu Jarad, A.: Factors for successful e-government adoption in palestine: a conceptual framework. Haitham and Abu Jarad, Ali, factors for successful
e-government adoption in Palestine: a conceptual framework, 25 July 2020 (2020)
Olasina, G., Mutula, S.: The influence of national culture on the performance expectancy of
e-parliament adoption. Behav. Inf. Technol. 34(5), 492–505 (2015)
Panagiotopoulos, P., Al-Debei, M.M., Fitzgerald, G., Elliman, T.: A business model perspective
for ICTs in public engagement. Gov. Inf. Q. 29(2), 192–202 (2012)
Ramayah, T., Ignatius, J.: Impact of perceived usefulness, perceived ease of use and perceived
enjoyment on intention to shop online. ICFAI J. Syst. Manag. (IJSM) 3(3), 36–51 (2005)
Rana, N.P., Dwivedi, Y.K.: Citizen’s adoption of an e-government system: validating extended
social cognitive theory (SCT). Gov. Inf. Q. 32(2), 172–181 (2015)
Rana, N.P., Dwivedi, Y.K., Williams, M.D.: A meta-analysis of existing research on citizen adoption of e-government. Inf. Syst. Front. 17(3), 547–563 (2015). https://doi.org/10.1007/s10796013-9431-z
Rehman, M., Kamal, M.M., Esichaikul, V.: Adoption of e-government services in Pakistan: a
comparative study between online and offline users. Inf. Syst. Manag. 33(3), 248–267 (2016)
Rokhman, A.: e-Government adoption in developing countries; the case of Indonesia. J. Emerg.
Trends Comput. Inf. Sci. 2(5), 228–236 (2011)
Rose, J., Persson, J.S., Heeager, L.T., Irani, Z.: Managing e-government: value positions and
relationships. Inf. Syst. J. 25(5), 531–571 (2015)
Sang, S., Lee, J.D., Lee, J.: E-government adoption in ASEAN: the case of Cambodia. Internet
Res. (2009)
Sciadas, G.: Unveiling the digital divide (2002)
Shat, F.J., Mousavi, A., Pimenidis, E.: Electronic government enactment in a small developing
country–the Palestinian authority’s policy and practice. Paper presented at the International
Conference on e-Democracy (2013)
Shih, C.-F., Venkatesh, A.: Beyond adoption: development and application of a use-diffusion
model. J. Mark. 68(1), 59–72 (2004)
676
T. Obaid et al.
Wang, C.: Antecedents and consequences of perceived value in mobile government continuance
use: an empirical research in China. Comput. Hum. Behav. 34, 140–147 (2014)
Weerakkody, V., El-Haddadeh, R., Al-Sobhi, F., Shareef, M.A., Dwivedi, Y.K.: Examining the
influence of intermediaries in facilitating e-government adoption: an empirical investigation.
Int. J. Inf. Manag. 33(5), 716–725 (2013)
Preliminary Investigation on Malaysian Office
Workers’ Sedentary Behaviour, Health
Consequences, and Intervention Preferences:
Towards Designing Anti Sedentary Behaviour
Change Support Systems
Nur Fadziana Faisal Mohamed1,2(B) and Noorminshah A. Iahad1
1 Universiti Teknologi Malaysia, Johor Bahru, Malaysia
fadziana@uum.edu.my, minshah@utm.my
2 Universiti Utara Malaysia, UUM, Sintok, Malaysia
Abstract. Sedentary behaviour is a phrase that describes low-energy activities
that are commonly coupled with long periods of sitting. Sedentary behaviour has
been linked to a variety of negative health effects. Nonetheless, health experts
say that the best approach to avoid this condition is to take regular breaks from
prolonged sitting. The goals of this study were to find out about 1) sedentary
time and patterns among office workers who mostly use computers, 2) health
effects of extended sitting, and 3) awareness about sedentary behaviour health
repercussions and intervention preferences. From March to May 2019, a poll was
conducted in several Malaysian government agencies. The findings suggest that
Malaysian office workers work long hours and spend a lot of time sitting. As
a result, reducing occupational sitting time is an effective preventative measure.
Environmental restructuring was identified as the most popular intervention by
respondents, followed by the use of technology to convince people to take a break
from sitting.
Keywords: Sedentary behaviour · Office workers · Health consequences ·
Intervention preferences · Behaviour change support systems
1 Introduction
1.1 Workplace Sedentary Behaviour
The large percentage of today’s workforce working in office-based settings and long
hours sitting at work has made sedentary behaviour a major public health concern (Radas
et al. 2013; Suhaimi et al. 2021). Office workers spend an average of more than 8 h
per day at work during the week. Office workers, who primarily utilise computers as
their primary working tool, are the greatest occupational category at danger. A growing
body of research demonstrates that long periods of sitting are linked to negative health
consequences (Jamil et al. 2016). To avoid overuse damage, workers should organise
© The Author(s), under exclusive license to Springer Nature Switzerland AG 2022
F. Saeed et al. (Eds.): IRICT 2021, LNDECT 127, pp. 677–687, 2022.
https://doi.org/10.1007/978-3-030-98741-1_56
678
N. F. Faisal Mohamed and N. A. Iahad
their breaks and stretching exercises in between tasks (Mahmud et al. 2014). Many
studies have indicated that encouraging regular breaks from prolonged sitting can help
to reduce the above-mentioned issues (Brändström and Dueso 2013; Conn et al. 2009;
Stach 2012).
To date, there anti-sedentary intervention studies that focusing on environment
restructuring (Lakerveld et al. 2013; Mahmud et al. 2014; Mahmud et al. 2011; Zafir
Mohamed Makhbul et al. 2007). However, there are few studies on self-regulatory sedentary behaviour change interventions. Surveys that have been conducted are still insufficient in determining office workers’ preferences for taking breaks from prolonged sitting.
Hence, to further understands this matter, a survey was conducted to learn more about
office workers’ sedentary behaviour, health implications, and solution preferences. This
paper shows the findings of a survey conducted among office workers who primarily
utilise computers as their primary working tool. The information was gathered from
319 respondents in Malaysia’s public sector offices. This research is necessary in order
to comprehend the issue that affects the target group. Thus, the goals of this research
are to find out about 1) sedentary time and patterns among office workers who mostly
use computers, 2) health effects of extended sitting, and 3) knowledge about sedentary
behaviour health consequences and intervention preferences.
2 Methodology
2.1 Respondents
A survey was conducted in various public-sector offices in Malaysia comprising workers
who were working with computers to perform daily tasks. An email invitation was sent to
these organisations to forward to their personnel, and the survey was accessed online via
an external internet web-link. Some organizations were approached by providing a paper
version of the questionnaire. Individuals who wanted to join had to be employed, work
in a desk-based environment with a computer as their primary working tool, and not be
impaired. Prior to beginning the survey, all participants had given their approval, and all
survey replies were anonymous. Between March and May of 2019, 319 questionnaires
were received. This sample size is adequate for this research. Sudman (1976) suggested
that a minimum of 100 elements is needed for each major group. The surveys were
handed to respondents for a week to complete. Participation was entirely voluntary.
2.2 Questionnaire
The questionnaire consisted of items covering demographic profiles of respondents,
occupational sitting time, and physical activities, as well as intervention preferences to
break sedentary behavior.
Demographic Profiles of Respondents. Items in the demographic profile section consisted of age, gender, and current job.
Occupational Sitting Patterns. Questions regarding occupational sitting patterns were
adopted from Workplace Sitting Breaks Questionnaire (SitBRQ). Items for occupational
Preliminary Investigation on Malaysian Office Workers
679
sitting patterns are mainly concerned with respondents’ daily activities while working
with the computer during working days. Respondents were asked about the number of
working days per week, the number of hours using the computer at work per day, and
the frequency of taking breaks. Sedentary hours were self-reported.
Knowledge on Sedentary Behaviour. Respondents were given an infographic showing the illustrations of the health effects of sedentary behavior. They were then asked to
study infographics and answer a polar question of yes or no to whether they were aware
of the effects of sedentary behavior on their body.
Intervention Preferences. Items for intervention preferences were based on previously
researched interventions to break sedentary behaviour. Items covered were:
• environmental changes (e.g., active workstations)
• policies targeting reduced sedentary time (e.g., allowing employees regular desk
breaks),
• changing norms surrounding prolonged sitting (e.g., standing meetings),
• using technology to remind or encourage them to move (e.g., apps or computer-based
prompting to stand or move).
Each item was clearly defined and accompanied by examples. Respondents were
instructed to rank based on the suitability of their nature of work and working environment. The ranking order of 1 to 4 was labelled with 1 being most preferred and 4
being less preferred.
3 Results and Analysis
The survey findings and an analysis of the main results are presented in this section.
The purpose of the discussion is to bring to light the key issues raised by the responses.
The responses, which were based on descriptive approach, were assessed using a basic
statistical method.
3.1 Demographic Profile
The participants’ ages ranged from 18 to 62. Females made up 70.5% of the participants,
while men made up 29.5%. The majority of the participants were between the ages of
20 and 40. The majority of participants (24.1%) work in management, followed by
IT/technical/programmer (19.1%), clerical workers (18.8%), teacher/lecturer (16.9%),
and researchers (13.5%). Operators (5.3%) and others (2.2%) made up the balance of
the participants. The demographic profile of the respondents is shown in Table 1.
680
N. F. Faisal Mohamed and N. A. Iahad
Table 1. Demographic profiles of the respondents
Gender
Ages
Male
Female
<20 years
3
3
6
20–30 years
12
99
111
31–40 years
62
98
160
41–50 years
14
25
39
> 60 years
3
0
3
94
(29.5%)
225
(70.5%)
319
(100%)
Clerical
6
54
60
Managerial
16
61
77
Teacher/Lecturer
10
44
54
Researcher
11
32
43
IT/Technical/Programmer
40
21
61
Operators
6
11
17
Others
5
2
7
94
(29.5%)
225
(70.5%)
319
(100%)
Total
Job
Total
Total
Days
1-2 days
3-4 days
5-6 days
7 days
Total
Frequency
5
22
250
42
319
Percentage
1.6%
6.9%
78.4%
13.2%
100%
Fig. 1. Number of working days spent per week.
3.2 Occupational Sitting Patterns
The number of working days spent per week was inquired of the responders. The vast
majority of respondents (78.4%) worked 5–6 days a week (See Fig. 1). The range is still
allowed by the Malaysian Employment Act (1955). Around 13.2% worked seven days
each week, which was already more than the maximum of six days per week allowed.
Only a small minority of those surveyed worked fewer than four days each week.
The respondents were then asked to estimate how much time they spent sitting during
the course of a day at work. Figure 2 reveals that 87.2% of people sit for more than 4 h
per day. This finding is in line with research showing that white-collar workers spend the
Preliminary Investigation on Malaysian Office Workers
681
majority of their working hours sitting, and that they do so in lengthy, uninterrupted periods (James Hopkin and Sarkar 2018). The majority of working persons in industrialised
countries spend a significant amount of their waking hours at work (Chu et al. 2016).
The current findings add to the growing body of research pointing to the workplace as
a key location for high levels of sedentary behaviour.
Time
1-2 hours
3-4 hours
4-5 hours
5-6 hours
>6 hours
Total
Frequency
5
36
42
66
170
319
Percentage
1.6%
11.3%
13.2%
20.7%
53.3%
100%
Fig. 2. Estimated amount of time spent sitting down as part of their work in a day.
Taking movement breaks every 30 min, according to experts, could lower mortality
rates. Figure 3 shows only 6.3% of people took a break from prolonged sitting every
30 min. Every one hour, 15.7% takes a break, and every two hours, 23.5% takes a break.
Half of the respondents sat for more than 3 h at a stretch. This conclusion indicates that
the majority of respondents were at risk of a variety of negative health effects. Individuals
who sit for more than 2 h at a time are more likely to develop diabetes, hypertension,
and other metabolic risk factors. The result also shows, respondents were also at risk for
lower back discomfort and other musculoskeletal issues.
Fig. 3. Frequency of getting up or breaking from prolong sitting
In total, 90.6% of those surveyed felt that long periods of sitting were harmful to
their health. Back pain (71.2%) and eye strain (51.4%) were the two most common
health effects associated with prolonged sitting, especially when using a computer (See
Fig. 4). Long periods of sitting have been linked by orthopaedic research to lumbar disc
abnormalities. At the end of four hours of continuous sitting, lumbar 4–5 was dramatically decreased. Meanwhile, optometric research has found that extended computer use
682
N. F. Faisal Mohamed and N. A. Iahad
causes eye strain or tiredness, blurred vision, dry and irritated eyes, excessive tear secretion, double vision, headache, light or glare sensitivity, slowness in adjusting focus, and
changes in colour perception.
Fig. 4. Health consequences of prolong sitting.
3.3 Knowledge on Sedentary Behaviour
Only a small percentage of office workers were aware that sitting for long periods of
time was a risk factor for hypertension (36.63%), type 2 diabetes (35%), cancer (21%),
and premature mortality (12%), cardiovascular disease (30%) and obesity (25%) (See
Fig. 5). Respondents, on the other hand, were well aware that sitting for lengthy periods
of time was a risk factor for slipped discs (70%). Despite their extensive understanding
of sedentary behaviour as a risk factor for slipped discs, the sedentary nature of their
jobs prevents them from breaking free from long periods of sitting. In all, 67.2% of
respondents said they were unaware that long periods of sitting are associated to the
health problems indicated above. This information indicates that office workers were
not adequately informed about the dangers of prolonged sitting.
Fig. 5. Knowledge over the risk factors of prolonged sitting
Preliminary Investigation on Malaysian Office Workers
683
3.4 Intervention Preferences
The ranking order from 1 to 4 was used to conduct the analysis of intervention preferences. The results of the intervention preferences indicate the environmental restructuring came in first, followed by the use of technology to persuade a sitting break, according
to the results of the intervention preferences. This finding is in line with (Gardner et al.
2015), which suggests that intervention based on environmental restructuring and persuasion is one of the most promising behaviour modification approaches. Policies aimed
at reducing sedentary time and altering long-term seating standards were not as popular.
The lowest ranking indicated that certain office workers may have difficulties and ambiguity in implementing this intervention. All four intervention preferences are ranked in
Table 2.
Table 2. Intervention preferences by the respondents
Intervention preferences
Rank
Environmental restructuring
1
Technology to persuade sitting break
2
Policies targeting reduced sedentary time
3
Changing norms surrounding prolonged sitting
4
4 Discussion
Malaysian office workers work long hours and spend a lot of time sitting. As a result,
reducing office sitting time is an important preventative measure. The respondents work
five to six days a week. This is still within the bounds of the Malaysian Employment Act’s
(1955) permissible range. However, 90% of respondents said they sat for more than 4 h
every day during work hours. This conclusion indicates that the majority of respondents
were at risk of a variety of negative health effects. Individuals who sit for more than 4 h
have a higher risk of diabetes, hypertension, and other metabolic risk factors, according
to medical data. Respondents were also at risk for lower back discomfort and other
musculoskeletal issues, according to this result.
Back pain and eye strain were the most common health problems reported as a result
of prolonged sitting, particularly when using a computer (Gupta et al. 2015; Harman
et al. 2014). Respondents were also at risk for lower back pain and other musculoskeletal
issues, according to the findings. Continuous sitting should be limited to no more than
2 h over an 8-h workday, according to an ergonomic recommendation for static work
postures. When it comes to the sitting interval, doctors advocate standing or moving
every 30 min of sitting.
According to data on sedentary behaviour knowledge, office workers were not well
exposed to the dangers of prolonged sitting. Poor health promotion programmes in public
offices on sedentary behaviour can be attributed for a high percentage of people having
684
N. F. Faisal Mohamed and N. A. Iahad
a poor understanding of the risk factors for sedentary behaviour and its health consequences. Improved workplace health promotion, on the other hand, may lead to better
lifestyle choices. Despite having a strong understanding of the dangers of prolonged
sitting in terms of slipped discs and back discomfort, the nature of job and a lack of
self-determination appear to be a barrier for the respondents, particularly when it comes
to extended sitting at work.
The results on intervention preferences are consistent with (Stach 2012), with environmental restructuring and persuasion evaluated as particularly promising behaviour
modification strategies. External surroundings and self-regulation, according to the intervention’s creators, are two elements that can impact sedentary behaviour modification
(Stach 2012). In the near term, reorganising the surroundings, such as giving sit-stand
desks, has been shown to be effective in reducing inactive time. However, there is no
certainty that it will have a long-term effect on behaviour. The usage of a sit-stand desk
should be coupled by a reminder mechanism to stand at regular intervals, according to
researchers (Carr et al. 2013). The disadvantage of reconstructing the exterior environment is that it necessitates the creation of new office settings and the replacement of
furniture. All of this necessitates careful planning and training, as well as a significant
financial investment. It’s also limited to individual workstations and difficult to use in
meeting rooms.
Persuasion intervention, on the other hand, does not have to be limited to rearranging workplace furniture and settings. Sedentary behaviour could be reduced across
several environmental domains by focusing on strengthening persons’ psychological
capabilities (Mohamed et al. 2017). Changes in motivation and self-regulation, according to Social Cognitive Theory (SCT) (Bandura 1986), are at the basis of behaviour
change. The core notion of SCT is self-efficacy, which is defined as “a person’s belief
in their ability to carry out a course of action successfully.” Many health habits, particularly anti-sedentary behaviour and physical activity are influenced by self-efficacy. The
motivational push and self-regulatory skills are required for self-management of health
promotion (Gardner et al. 2015). This is in line with Bandura’s claim that SCT incorporates both cognitive and motivational aspects of self-regulated behaviour. Self-regulatory
mechanisms such as self-monitoring, social support, and goal planning influence health
behaviour in both direct and indirect ways. In healthcare, the use of persuasion technology like as cellphones is fast rising. Various research have documented its capability
and popularity. The majority of prior mobile phone research have used text messaging as part of a behaviour modification intervention, with motivating and informational
text messages being received as one of the intervention components. Mobile apps as a
behaviour change intervention have been shown to be convincing, low-cost, and result
in significant reductions across multiple environmental domains (Rosenberger 2012).
5 Conclusion
The long hours of working and high sitting time exist in Malaysian office workers.
Reducing workplace sitting time is therefore an important prevention strategy. The most
preferred intervention strategies by office workers is environmental restructuring that is
by providing sit stand desk to enable them to break prolonged sedentary sitting while
Preliminary Investigation on Malaysian Office Workers
685
working. The basic sit stand desk requires user to manually change the height of the table.
The more sophisticated ones require mechanical controller to change the height. This
intervention would be ideal to be implemented. However, the major drawback of sit stand
desk lies in the high implementation cost (Chau et al. 2014). Having an adjustable desk
height is meaningless if not equipped with a reminder system. Furthermore, it is limited
to individual workstations and difficult to apply in meeting spaces. Researchers indicated
that for a sit stand desk to be successful, it should be coupled by a reminder mechanism
to stand at regular intervals (Radas et al. 2013). As an alternative, persuasive technology
can be employed without requiring any changes to office furniture or environments.
Mobile apps have been reported in various behaviour change studies. Smartphones
offer built-in tools for monitoring, reminding, providing feedback, instructing, informing, and recording data. Previous mobile phone research has used text messaging as
part of a behaviour modification intervention, with motivating and informational text
messages being one of the intervention components. Mobile apps as a behaviour modification intervention have been shown to be convincing, low-cost, and result in significant
reductions across many environmental domains (Rosenberger 2012). Smartphones have
the potential to support successful sedentary behaviour change techniques (Mohamed
et al. 2017). Because of the popularity and mobility of smartphones, it is appropriate to
provide person level support in addition to the technological capabilities they display.
Smartphone apps are readily available for download at a minimal cost. Because of the
prevalence of mobile technologies, a huge and growing number of people now hold
smartphones, allowing interventions to reach a big number of people. Smartphones are
an effective tool for encouraging people to improve their inactive habits on a personal
level (Suhaimi et al. 2021). It is advised that intervention researchers look at persuasion
technology to help people change their inactive habits.
6 Ethical Approval
Before the instrument was given out, each responder gave their informed consent. Everyone who took part in the survey was told that it was completely voluntary. The research
data was kept private, and if necessary, a summary of the outcomes and findings was
sent to the participants. There are no risks associated with the study just as there are
no rewards or compensations for participating. This study has been carried out as a
preliminary investigation for the Anti-Sedentary Behaviour Change Support Systems
project.
References
Bandura, A.: Social Foundations of Thought and ACTION: A Social Cognitive Theory. PrenticeHall Inc., New Jersey (1986)
Brändström, M., Dueso, A.: How to Encourage Stretching and Breaks at Work. Umea Universitet,
Sweden (2013)
Carr, L.J., Karvinen, K., Peavler, M., Smith, R., Cangelosi, K.: Multicomponent intervention to
reduce daily sedentary time: a randomised controlled trial. BMJ Open 3(10), e003261 (2013).
https://doi.org/10.1136/bmjopen-2013-003261
686
N. F. Faisal Mohamed and N. A. Iahad
Chau, J.Y., et al.: The effectiveness of sit-stand workstations for changing office workers’ sitting
time: results from the Stand@Work randomized controlled trial pilot. Int. J. Behav. Nutr. Phys.
Act. 11, 127 (2014). https://doi.org/10.1186/s12966-014-0127-7
Chu, A.H.Y., Ng, S.H.X., Tan, C.S., Win, A.M., Koh, D., Müller-Riemenschneider, F.: A systematic
review and meta-analysis of workplace intervention strategies to reduce sedentary time in
white-collar workers. Obes. Rev. 17(5), 467–481 (2016). https://doi.org/10.1111/obr.12388
Conn, V.S., Hafdahl, A.R., Cooper, P.S., Brown, L.M., Lusk, S.L.: Meta-analysis of workplace
physical activity interventions. Am. J. Prev. Med. 37(4), 330–339 (2009). https://doi.org/10.
1016/j.amepre.2009.06.008
Gardner, B., Smith, L., Lorencatto, F., Hamer, M., Biddle, S.J.: How to reduce sitting time?
A review of behaviour change strategies used in sedentary behaviour reduction interventions
among adults. Health Psychol. Rev. 7199(October), 1–24 (2015). https://doi.org/10.1080/174
37199.2015.1082146
Gupta, N., Christiansen, C.S., Hallman, D.M., Korshøj, M., Carneiro, I.G., Holtermann, A.: Is
objectively measured sitting time associated with low back pain? A cross-sectional investigation
in the NOMAD study. PLoS ONE 10(3), e0121159 (2015). https://doi.org/10.1371/journal.
pone.0121159
Harman, K., Macrae, M., Vallis, M., Bassett, R.: Working with people to make changes: a
behavioural change approach used in chronic low back pain rehabilitation. Physiotherapie
Canada 66(1), 82–90 (2014). https://doi.org/10.3138/ptc.2012-56BC
Jamil, A.T., Rosli, N.M., Ismail, A., Idris, I.B., Omar, A.: Prevalence and risk factors for sedentary
behavior among Malaysian adults. Malaysian J. Publ. Health Med. 16(3), 147–155 (2016).
https://www.mjphm.org.my/mjphm/journals/2016
James Hopkin, T., Sarkar, S.: Cronicon Sedentary Behavior of White Collar Office WorkersReview (2018). https://www.ecronicon.com/ecnu/pdf/ECNU-03-0000102.pdf
Koepp, G.A., et al.: Treadmill desks: a 1-year prospective trial. Obesity 21(4), 705–711 (2013).
https://doi.org/10.1002/oby.20121
Lakerveld, J., Bot, S.D.M., Van der Ploeg, H.P., Nijpels, G.: The effects of a lifestyle intervention
on leisure-time sedentary behaviors in adults at risk: the Hoorn Prevention Study, a randomized controlled trial. Prev. Med. 57(4), 351–356 (2013). https://doi.org/10.1016/j.ypmed.2013.
06.011
Lee, S., Wong, J., Shanita, S., Ismail, M., Deurenberg, P., Poh, B.: Daily physical activity and
screen time, but not other sedentary activities, are associated with measures of obesity during
childhood. Int. J. Environ. Res. Publ. Health 12(1), 146–161 (2014). https://doi.org/10.3390/
ijerph120100146
Mahmud, N., Bahari, S.F., Zainudin, N.F.: Psychosocial and ergonomics risk factors related to
neck, shoulder and back complaints among Malaysia office workers. Int. J. Soc. Sci. Humanity
4(4), 260–263 (2014). https://doi.org/10.7763/IJSSH.2014.V4.359
Mahmud, N., Kenny, D.T., Heard, R.: Office ergonomics awareness and prevalence of musculoskeletal disorders among office workers in the Universiti Teknologi Malaysia : a cross
sectional study. Malaysian J. Med. Health Sci. (2011)
Matthews, C.E., et al.: Amount of time spent in sedentary behaviors in the United States, 2003–
2004. Am. J. Epidemiol. 167(7), 875–881 (2008). https://doi.org/10.1093/aje/kwm390
Mohamed, N.F.F., Rahman, A.A., Iahad, N.A.: Managing sedentary behavior with smartphone
managing sedentary behavior with PACIS 2017 Proceedings (2017)
Radas, A., et al.: Evaluation of ergonomic and education interventions to reduce occupational
sitting in office-based university workers: study protocol for a randomized controlled trial.
Trials 14, 330 (2013). https://doi.org/10.1186/1745-6215-14-330
Rosenberger, M.: Sedentary behavior: target for change, challenge to assess. Int. J. Obes. Suppl.
2(Suppl 1), S26–S29 (2012). https://doi.org/10.1038/ijosup.2012.7
Preliminary Investigation on Malaysian Office Workers
687
Stach, T.B.: Heart rate balancing for multiplayer exergames (2012). http://hdl.handle.net/1974/
7525
Sudman, S.: Applied Sampling. Academic Press, New York (1976)
Suhaimi, S.A., Müller, A.M., Hafiz, E., Khoo, S.: Occupational sitting time, its determinants and
intervention strategies in Malaysian office workers: a mixed-methods study. Health Promot.
Int. (2021). https://doi.org/10.1093/heapro/daab149
Swartz, A.M., Squires, L., Strath, S.J.: Energy expenditure of interruptions to sedentary behavior.
Int. J. Behav. Nutr. Phys. Act. 8, 69 (2011). https://doi.org/10.1186/1479-5868-8-69
Tremblay, M.S., et al.: Sedentary behavior research network (SBRN) – terminology consensus
project process and outcome. Int. J. Behav. Nutr. Phys. Act. 14(1), 75 (2017). https://doi.org/
10.1186/s12966-017-0525-8
Warburton, D.E.R., Nicol, C.W., Bredin, S.S.D.: Health benefits of physical activity: the evidence.
CMAJ: Can. Med. Assoc. J. 174(6), 801–809 (2006). https://doi.org/10.1503/cmaj.051351
Makhbul, Z.M., Idrus, D., Rani, M.R.A.: Ergonomics design on the work stress outcomes. Jurnal
Kemanusiaan 9, 50–61 (2007). http://myais.fsktm.um.edu.my/8343/
The National Industry 4.0 Policy Performance
Review Based on Industry4WRD Readiness
Assessment and Intervention Program
Zulhasni Abdul Rahim(B) , Nor Azian Abdul Rahman, and Muhamad Saqib Iqbal
Malaysia-Japan International Institute of Technology, Universiti Teknologi Malaysia,
Kuala Lumpur, Malaysia
zulhasni@utm.my
Abstract. Industry growth has been accelerated by the discovery of emerging
technology, from the early implementation of mechanical systems to support manufacturing processes to today’s highly automated assembly lines, in order to be
flexible and adaptable to today’s changing consumer requirements and demands.
As a result of the evolution of the industrial revolution, a variety of enabling technologies to have emerged. The manufacturing sector is vital to the development
of smart and sustainable industries. As a result, Industry 4.0 aids in the shaping of smart future manufacturing through a variety of methods, one of which
is the implementation of the Industry4WRD RA Program, which is influenced
by the National Policy on Industry 4.0. The study depicts the performance of
the National Industry 4.0 policy based on the SMEs Industry4WRD Readiness
Assessment (RA) and intervention program. Analysis and discussion on the collective achievement of assessed Manufacturing and Manufacturing Related Services (MRS) companies for the year 2019 sorted primarily according to their
respective Readiness Profiles will be presented in the following first application
analysis before Readiness Profile achievement analysis, with suggestions to further
improve the RA Program based on post assessment survey, and general observation
and suggestions to assessed Manufacturing and MRS company.
Keywords: National Industry 4.0 policy · Industry4WRD · Readiness
assessment · Intervention
1 Introduction of National Industry 4.0 Policy: Industry4WRD
Program
1.1 The Initiation of Industry4WRD Program
Launched on the 31st October 2018, the Industry4WRD Policy underlines the concerted multi- ministerial strategy in realizing a 10-year vision to accelerate Malaysia’s
transformation into a smart and modern manufacturing system, with a threefold AttractCreate-Transform (ACT) objective of: increasing Malaysia’s attractiveness as a preferred
destination for high-tech manufacturing; creating the right ecosystem for Industry 4.0
© The Author(s), under exclusive license to Springer Nature Switzerland AG 2022
F. Saeed et al. (Eds.): IRICT 2021, LNDECT 127, pp. 688–696, 2022.
https://doi.org/10.1007/978-3-030-98741-1_57
The National Industry 4.0 Policy Performance Review
689
to be adopted; and, transform Malaysia’s industry capabilities in both a holistic and an
accelerated manner. Thus, at its core, the policy aims to facilitate Malaysian companies
(especially SMEs) to embrace Industry 4.0 business model in a systematic and comprehensive manner, thus becoming smart, agile, and data-driven organizations powered
by three Shift Factors: next-generation competent workers and leaders (people); nextgeneration product development and production methods (process); and next-generation
Operation Technologies and IT Technologies (technology), showed in Fig. 1.
Fig. 1. Industry4WRD policy framework
Although the Industry4WRD Policy sets a 10-year vision for the Malaysian manufacturing and manufacturing related services sectors, it has also set up four National Goals
(to be achieved by 2025) including: 30% productivity improvement; increased manufacturing sector Gross Domestic Product (GDP) contribution from RM254.7 billion to
RM392 billion; improved innovation potential by achieving top 30 in the Global Innovation Index (GII)6; and improved sectoral skilled workers7 participation (from 18% to
35%). To achieve the National Goals, five Strategic Enablers (Funding, Infrastructure,
Regulations, Skills and Talents, and Technology, or F.I.R.S.T) has been identified and
this is further supported by thirteen Strategies, and thirty eight (38) Action Plans, showed
in Fig. 1.
Among the many components to this Industry4WRD Policy Framework is Strategy
R2, which supports the Regulations Strategic Enabler. This strategy highlights the need
to create a platform and mechanism to help manufacturing firms, especially SMEs, assess
690
Z. A. Rahim et al.
and develop their Industry 4.0-ready (smart) capabilities, with the corresponding Action
Plan stating the need to establish a National Readiness Program as a tool for conducting
assessment, sharing global and local best practices, supporting the development of local
firms, and identifying national Industry 4.0 priorities. This leads to the roll out of the
Industry4WRD Readiness Assessment (RA) Program.
1.2 The Industry4WRD Readiness Assessment and Profile
There are nine RA Dimensions for each Manufacturing and MRS Technology Shift
Factors, with a difference in terms of classification. Nevertheless, the Technology Shift
Factor observes similar methodology with both People and Process Shift Factors, where
each RA Dimension is further broken down into five Levels of Readiness with corresponding points of between 0 to 4 representing worst readiness level to the best readiness
level respectively. Therefore, maximum point for the Technology Shift Factor is 45 points
with an overall percentage of 50%. Hence, the Technology Shift Factor contributes the
most to the overall Industry4WRD RA Percentage.
To classify the readiness level of each assessed Manufacturing and MRS company,
its “Readiness Profile” is calculated based on the summation of the weighted percentage of the People, Process, and Technology Shift Factors. Table 1 shows each of the
five Readiness Profile according to the range of percentage scored and corresponding
general description. In general, it is expected that Manufacturing and MRS companies
wanting to transform to Industry 4.0-ready (smart) operations to be within the ranges
of “Newcomer” and “Learner” since they are expected to not have yet taken the steps
to prepare for the transformation, while Manufacturing and MRS companies who has
started to transform is expected to be in the ranges of “Experienced” and “Leader”. In
contrast, Manufacturing and MRS companies that fall into the “Conventional” Readiness Profile even though has low Overall RA Percentage scores, could still be interested
in transforming to Industry 4.0-ready (smart) operations but presently lacking operation
Table 1. Readiness profile for assessed manufacturing and MRS companies
The National Industry 4.0 Policy Performance Review
691
strategy, organization, and technology mostly due to not having a management system
in place. Thus, “Conventional” companies must be continuously guided in these areas
until they are ready to transform into Industry 4.0-ready (smart) operations.
2 The Participation of Industry4WRD
2.1 The Industry4WRD Demographic of Participation by State
Out of the 452 Manufacturing and MRS companies receiving Government funding,
highest concentration of committed participation is from Selangor (181 companies or
40.0%), Johor (68 companies or 15.0%), and Pulau Pinang (62 companies or 13.7%).
This is to be expected since Selangor, Johor, and Pulau Pinang contributes highest to
the (national) manufacturing sector GDP contribution in 201920 with RM95,942m (or
30.47% from total manufacturing sector GDP contribution), 21 also worth noting that
in 2019, only Pulau Pinang is significantly dependent on manufacturing activity as the
sector contributes to 43.2% to the state economy, as opposed to Selangor 22 RM40,125m
(12.74%), and RM40,510m (12.86%) respectively, showed in Fig. 2.
However, it is (27.8%) and Johor (29.9%). In contrast, there are FIVE (5) States with
less than 10 committed participations: Sabah (7), Terengganu (7), Pahang (5), Kelantan (3), and Perlis (0). This is to be expected from Kelantan and Perlis as in 2019,
manufacturing activity contribution to state’s total economic activity only accounted
to RM1,300m (5.1% from state total) and RM470m (7.6%) 23 from state total) and
RM12,767m (21.8%) respectively 25 respectively. However, when looking at Terengganu and Pahang (third and fourth lowest participation), manufacturing activity in these
Fig. 2. Industry4WRD participation by states
692
Z. A. Rahim et al.
states accounted to RM13,093m (37.5% 24. This is comparable to Perak (RM13,683m
or 18.0% from state total) and Kedah (RM13,430m or 28.7%). But, unlike Perak and
Kedah who has the fourth and fifth best committed participation to the RA Program,
Terengganu and Pahang sits at the opposite end with committed participation contribution of only 1.6% and 1.1% (from total of 452) respectively. The final state with less than
10 committed participants is Sabah, but since the manufacturing activity only contributes
to 7.6% (RM6,472m) to the total state economic activity, the low quantity of committed
participants is expected.
2.2 The Industry4WRD Demographic of Participation by Manufacturing Sectors
In 2019, the manufacturing sector contributed to 22.3% to the Malaysian GDP. According
to the 2008 Malaysia Standard Industrial Classification (MSIC 2008) Manufacturing
organizations can be further classified into 24 Divisions. These Divisions are then further
classified into 51 corresponding Classes and 241 Sub-Classes. For the RA Program in
2019, the 444 Manufacturing companies receiving Government funding was made up
of committed Manufacturing companies performing activity across 23 out of the 24
Divisions. Out of the 23 Divisions with committed participation in the RA Program,
Divisions 10 (Food products), 22 (Rubber and plastic products), and 25 (Fabricated
metal products, except machinery and equipment) has committed participation with
more than 60 Manufacturing companies each, showed in Fig. 3.
According to the Industry4WRD standard for MRS, there are sixteen MRS types
with: eight types of services which supports activities in the Pre-Manufacturing stage;
five types of services which supports activities in the Manufacturing stage38; and three
types 39 of services which supports activities in the Post Manufacturing stage. For 2019,
out of 20 MRS companies’ participation, only 8 were committed participants: three
in Logistic services; two in Manufacturing support services; one in Inspection, testing
and quality control; one in Maintenance, repair, and overhaul of machinery equipment;
and one in Environmental management services. Additionally, stage concentration of
committed participation is spread evenly between Pre-Manufacturing and Manufacturing
stages, with no committed participation from MRS companies operating in the Post
Manufacturing stage. This is represented visually in Fig. 4.
The National Industry 4.0 Policy Performance Review
693
Fig. 3. Breakdown of RA Program participation for 2019 (Govt Funded, Manufacturing)
according to MSIC Code 2008 Division
694
Z. A. Rahim et al.
Fig. 4. Breakdown of RA Program participation for 2019 (Govt Funded, MRS) according to MRS
Type
3 The Industry4WRD Performance
3.1 The Industry4WRD RA Profile
As previously described, there are five RA “Readiness Profiles” which are categorized
based on the Overall RA Percentage score. For the year 2019, out of the 470 Manufacturing and MRS companies (Government funded and self-funded) that were assessed:
31 companies achieved an Overall RA Percentage score of between 0 to 20 and are categorized as “Conventional”; 398 categorized as “Newcomer” (21 to 40 overall score); 35
categorized as “Learner” (41 to 60 overall score); and 6 categorized as “Experienced”
(61 to 90 overall score). No assessed company in 2019 managed to achieve Overall RA
The National Industry 4.0 Policy Performance Review
695
Percentage score of between 91 and 100. This is shown in Fig. 5. Although the overall result skews to the left, this result is expected 43 and is in line with findings from
Khazanah Research Institute.
Industry4WRD RA Profile
Newcomer
Conventional
Learner
7%
6%
87%
Fig. 5. Breakdown of Industry4WRD RA profiling
4 The Conclusion and Recommendations
The National Policy on Industry 4.0 is a critical policy that aims to change or transform the Manufacturing and MRS sectors through 13 strategies and 38 action plans. The
policy outlines five national strategies with the aim of attracting stakeholders to Industry 4.0 technologies and processes while also increasing Malaysia’s attractiveness as a
preferred manufacturing location. To further strengthen this, the improvement should
focus on developing a consolidated information platform on Industry4WRD awareness and solutions, innovation, recommended vendor list, forms, templates, application,
reports, and status under a central platform should be explored. It is envisioned that
the platform can help institutions and firms to update their knowledge base, allowing
companies to identify the value of external information, assimilate it, and apply it to
commercial purposes. Furthermore, developing an effectiveness assessment program
to begin implementing the reorientation of various engineering and technical systems
towards the digital economy, a long-term effectiveness assessment program on the RA
Program considerations on the assessed Manufacturing and MRS companies should be
considered.
696
Z. A. Rahim et al.
Acknowledgement. This paper is sponsored by Ministry of Higher Education, under FUNDAMENTAL RESEARCH GRANT SCHEME (FRGS/1/2021/SS02/UTM/02/16).
References
1. Lin, W.D., Low, M.Y., Chong, Y.T., Teo, C.L.: Application of SIRI for industry 4.0 maturity
assessment and analysis. In: 2019 IEEE International Conference on Industrial Engineering
and Engineering Management (IEEM), pp. 1450–1454. IEEE (Dec 2019)
2. Man, J.C., Strandhagen, J.O.: An Industry 4.0 research agenda for sustainable business models.
Procedia Cirp 63, 721–726 (2017)
3. Karacay, G.: Talent development for Industry 4.0. In: Industry 4.0: Managing the Digital
Transformation, pp. 123–136. Springer, Cham (2018)
4. Department of Statistics, Malaysia, Malaysia Standard Industrial Classification 2008
(MSIC 2008). Source: https://www.dosm.gov.my/v1/uploads/files/4_Portal%20Content/3_M
ethods%20%26%20Classifications/2_List%20of%20References/MSIC_2008.pdf
5. Zulhasni, A.R., Roslan, M.M., Syukri, W.W.M.: The Application of TRIZ in the development
of readiness assessment model for the Malaysian Industry4WRD program. IOP Conf. Ser.
Mater. Sci. Eng. 1051(1), 012036 (2021)
6. Zulhasni, A.R., Kamaliah, J., Roslan, Y.M., Syukri, W.W.M.: A review of talent adaptive
concept and conceptual framework of accelerated Industry4WRD talent adaptation in Malaysia.
J. Adv. Res. Bus. Manage. Stud. 21(1), 10–18 (2020)
Construction 4.0 Readiness and Challenges
for Construction Skills Training Institutions
in Malaysia
Muhammad Fariq Abdul Hamid1(B) and Zulhasni Abdul Rahim2
1 Malaysia-Japan International Institute of Technology, Kuala Lumpur, Malaysia
fariqhamid79@gmail.com
2 University of Technology Malaysia, Kuala Lumpur, Malaysia
Abstract. Rapid changes in technology application due to increment of market
requirements have been a pushing factor to radical industry adoption and adaptation upon new technologies. The integration of emerging technologies associated
with Industry 4.0 with construction delivery processes had founded the Construction 4.0 term which been emerging in the recent research corpus. The adoption
of Construction 4.0, major changes in the construction process delivery stages,
project structures and organization and ultimately integrate the known highly fragmented construction industry atmosphere including its work force. These changes
will require another level of skill set for the construction personnel who involve
in the construction project life cycle and its value chain. The current level of
awareness on Construction 4.0, key challenges faced and technologies adoption
readiness amongst construction skill training institutes in Malaysia upon changes
associated with Construction 4.0 technologies need to be assessed and well understood. This will be the basis for construction lead body in Malaysia to mitigate
the way forward for the construction skills training institutions of the nation. As
there are still limited research and study conducted in understanding Construction
4.0 adoption clarity by the construction skills training institutions in Malaysia,
this research will contribute to the enrichment of academic studies documentation related to the Construction 4.0 in specific and the Industry 4.0 generally for
Malaysia context.
Keywords: Construction 4.0 · Construction · Skill training
1 Research Background
1.1 Introduction
The robust changes in technology applications in fulfilling the needs and demands of
continuous increment of market requirements have been a pushing factor to radical industry adoption and adaptation upon new technologies. The Fourth Industrial Revolution
(Industry 4.0) that was first mentioned by the executive chairman and the founder of the
World Economic Forum (WEF), Klaus Schwab, in Davos-Klosters, Switzerland back in
© The Author(s), under exclusive license to Springer Nature Switzerland AG 2022
F. Saeed et al. (Eds.): IRICT 2021, LNDECT 127, pp. 697–706, 2022.
https://doi.org/10.1007/978-3-030-98741-1_58
698
M. F. A. Hamid and Z. A. Rahim
2016 had highlighted that, the integration of business and manufacturing processes as
well as all players in the industry value chain is the profound concept of Industry 4.0
approach [1].
Industry 4.0 mainly focusing on range of advanced technologies adoption across
all industries value chain. Automation, robotics, artificial intelligence, nanotechnology,
quantum computing, biotechnology, industrial internet of things, decentralized consensus, fifth-generation (5G) wireless technologies, 3D printing, and fully autonomous
vehicles are considered as the main emerging technologies that driving Industry 4.0 forward while at the same time creating both threats and opportunities to the conventional
industries environment. Continuous increment of digital technology applications in the
current conventional methods of delivering things especially in manufacturing industry
which emphasizes in advanced communication and connectivity had driven the emergence of cyber-physical production systems (CPPS). In short, it is a result of coordination
and integration between hardware, software and biological elements in enhancing traditional monitoring of physical processes, decisions making and troubleshooting towards
cost reduction, increase productivity and control the risks during production stages.
In response to the needs and challenges arise in Industry 4.0 era, construction industry, as other industries, has been reacting in positive direction. Researchers in the construction industry had begun exploring the potential integration of Industry 4.0 technologies into construction thus the term ‘Construction 4.0’ recently emerged in the 21st
century research corpus (Rastogi D. S., 2017, as cited in [2]). The Construction 4.0
term, according to the European Industry Construction Federation (FIEC), is coined to
Architecture, Engineering & Construction (AEC) industry as part of Industry 4.0 and its
mainly refers to the digitalization of the industry ([3], as cited in [2]).
According to Rastogi (2017), Construction 4.0 can be understood as a counterpart of
Industry 4.0 in which, aims to digitalize the whole life cycle of construction project monitoring and with the aid of multiple technologies. Through the adoption of Construction
4.0, major changes in the construction process delivery stages, project structures and
organization and ultimately integrate the known highly fragmented construction industry atmosphere. These changes will require another level of skill set for the construction
personnel who involve in the construction project life cycle and its value chain. The
required skill set may be acquired from construction skill training institutes available in
a country which mostly governed by certain body under the local government or international conferring bodies. In order to produce construction personnel with the required
skill sets related to Construction 4.0 technologies, it is crucial for the construction skill
training institutes to realize on the changes involve. A sound understanding on the Construction 4.0 and the emerging technologies that may disrupt the current methods in
developing the future skilled workforce for construction must be well acknowledged
and anticipated towards successful adoption of the changes.
1.2 Issue Statement
Workforce readiness towards technological adoption to construction processes has been
highlighted as one of domain enabler towards embracing the implementation of Construction 4.0. Involvement of construction skills institutions to equip and prepare the
future workforce capabilities are highly crucial as highlighted in the Construction 4.0.
Construction 4.0 Readiness and Challenges for Construction Skills Training
699
Malaysia had portrayed readiness in embracing new construction revolution, based
on The Global Competitiveness Report 2019, Global Innovation Index (GII) 2019 and
IMD World Competitiveness Ranking 2019 [4]. People (workforce) have been identified
as one of four enablers that leads to the success of Construction 4.0 agenda and to be
equipped and ready with new skills for the future workforce [5].
However, study has revealed that Malaysia’s TVET lecturers are not really understand how to apply Industry 4.0 thus relatively present potential threat to the adoption
of Construction 4.0 in the construction skill training programs [6]. Clarity on roles
and necessity to change amongst construction skills training institutions are crucial to
extensively understand their readiness in implementing Construction 4.0. A clear understanding on Construction 4.0 implementation and potential challenges to be faced by
the construction skills training institutions will enhance their competitiveness level in
adapting with changes.
Therefore, it is crucial to deep dive into understanding the current level of awareness
on Construction 4.0 among the construction skill training provider in Malaysia and
analyse the readiness for them to meet up with the new emerging technologies bundled
in Construction 4.0. It is also essential to understand the anticipated challenges that
may present barriers in Construction 4.0 adoption among the construction skill training
institutes in Malaysia for feasible initiative to be proposed in the recent future.
1.3 Research Purpose
The purpose of this research is to develop a sound understanding on the current level
of awareness upon Construction 4.0 and to analyze Construction 4.0 adoption readiness
among of the construction skills training institutions in Malaysia. This research will also
aim to analyze the collective anticipated challenges faced by the institutions in adopting Construction 4.0 technologies in the current training program for further strategic
decision and initiatives formulation in the future.
1.4 Research Objectives and Questions
In response to the problem identified with regards to the adoption and readiness towards
Construction 4.0 technologies changes by the construction skill institutions in Malaysia,
this research is conducted to:
i.
Assess the level of awareness on Construction 4.0 amongst the construction skills
training institutions in Malaysia.
ii. Identify the key challenges faced by the construction skills training institutions in
adopting Construction 4.0
iii. Assess the Construction 4.0 adoption readiness level by the construction skills
training institutions in Malaysia.
iv. Propose the way forward for the construction industry lead body in Malaysia to
undertake based on the construction skills training institutions current Construction
4.0 adoption readiness level
700
M. F. A. Hamid and Z. A. Rahim
In order to streamline the research towards achieving the objectives set, these research
questions are developed to understand the identified problem in depth as well as building
further argumentative questions to verify research findings:
i.
ii.
iii.
iv.
v.
What are the critical elements of Construction 4.0 need to be aware by the
construction skills training institutions in Malaysia?
To what extend the construction skills training institutions in Malaysia are clear on
their roles and scope in adopting the critical elements of Construction 4.0?
What are the challenges faced by Malaysia construction skills training institutions
in adopting the critical elements of Construction 4.0?
What are the key elements to be measured and analyzed in understanding Malaysia
construction skills training institutions current level of readiness in adopting
Construction 4.0?
What are the feasible intervention initiatives can be undertaken by the construction
industry lead body in Malaysia for the Construction 4.0 adoption readiness way
forward?
1.5 Research Framework
A clear research framework is essential to lead a research processes and stages towards
achieving its aims and objectives. According to Dickson Adom [22], a clear conceptual
framework enables to guide a research path towards building a credible foundation for
a good investigation. It is also mandatory requirement of a thesis or dissertation for a
researcher to map their study flow comprehensively. In order to organize the flow and
provide an overview on the entire contents of the research, the following conceptual
framework is structured and outlined as shown at Fig. 1 below:
Fig. 1. Conceptual research framework
1.6 Research Limitation
This research is limited to construction skills training institutes in Malaysia and the
findings shall not be treated to generalize upon all TVET institutes in Malaysia. However,
Construction 4.0 Readiness and Challenges for Construction Skills Training
701
it is believed that some issues are very much related and may present the same method
of intervention as recommended for future way forwards.
2 Literature Review
2.1 Industry 4.0
A better understanding on Industry 4.0 is through the chronological events that lead to
the birth of Industry 4.0 era. The industrial revolutions history is always related to certain
discovery in manufacturing industry in the form of new innovative inventions.
The innovative ways in steam power engines usage for industrial purposes back in
the 18th century had demarcated the beginning of the First Industrial Revolution. The
fully man-powered weaving loom in textile industry had been mechanised and powered
with steam engines, a real breakthrough that increase to eight times in volume of the
same time in manual handling. In brief, the Industrial Revolution transforms the ways
of goods and services being produced or delivered. It was also driven by large market
demand of certain manufactured product with the advancement of technology leverage
during that period of time [5].
The Second Industrial Revolution began in 1870’s, whereby mass production systems were used with the introduction of electrical energy. It was also demarcated by an
innovative method that Henry Ford had introduced in automobile production which had
significantly altered the assembly processes to faster production at much lower cost.
The third industrial revolution began in the late 1950s, whereby manufacturers had
slowly adopting the use of electronic machines and later the use of computer technology
into their factories. The digital technology and automation with the aid of software
programs for robotic tools became the shift from analogue and mechanical based tools.
In the past few decades, the fourth industrial revolution has emerged, known as Industry
4.0. The digital technology from previous decades has been elevated to a whole new
level with the help of interconnectivity through the Internet of Things (IoT), access to
real-time data, and the introduction of cyber-physical systems (CPS).
A more comprehensive, interlinked, and holistic approach for manufacturing industry. Connection between physical with digital allows for better collaboration and accessibilities across internal and external parties. Industry 4.0 offers business owners much
better control and accessibility to all aspect of their operation. It allows them to leverage
and manipulate instant data to boost productivity, improve processes and project growth.
2.2 The New Technologies
The Fourth Industrial Revolution (Industry 4.0) that was first mentioned by the executive chairman and the founder of the World Economic Forum (WEF), Klaus Schwab,
in Davos-Klosters, Switzerland back in 2016 had highlighted that, the integration of
business and manufacturing processes as well as all players in the industry value chain
is the fundamental concept of Industry 4.0 approach.
According to Klaus Schwab, (2016) the Fourth Industrial Revolution, will change not
only what we do but finally also who we are. It will affect our identity and all the issues
702
M. F. A. Hamid and Z. A. Rahim
associated with it: our sense of privacy, our notions of ownership, our consumption
patterns, the time we devote to work and leisure, and how we develop our careers,
cultivate our skills, meet people, and nurture relationships [5].
In term of technologies associated with Industry 4.0, the so called emerging technologies being discussed around the world are merely new technology. The fact that
these technologies are already in the market, however, the interaction and resulting convergence of these technologies is creating an unprecedented pace and breadth of impact
[9].
2.3 Construction 4.0
According to Osunsanmi, T.O., Aigbavboa, C.O., Emmanuel Oke, A. and Liphadzi, M.
[11], to drive focus of Industry 4.0 discussion towards construction, the term Construction
4.0 was coined from Industry 4.0 as a form of transformation that representing the
digitalization of the construction industry. It is no doubt that the construction industry has
also benefited from the progress brought by Industry 4.0 in which the term Construction
4.0 was mention by Roland Berger GMBH in Munich, Germany back in 2016.
Construction 4.0 was first mentioned as an awareness concept based on the digitization of the construction industry, promoting the construction industry players to adopt
four elements in Industry 4.0 which were digital data, automation, connectivity, and
digital access [12].
However, Construction 4.0 should be viewed and understood in a wider perspective
as it is not just traditional construction with technological upgrades but a new way of
understanding construction in light of innovation and increased productivity [13].
In a nutshell, the transition towards Construction 4.0 need to be strategically paved.
A study by [2] had introduced a four-layer implementation plan through an abstruse
review of commonly cited technologies of Construction 4.0 which are Building Information Modelling (BIM), Augmented Reality (AR), Virtual Reality (VR), robotics, 3D
printing, Artificial Intelligence (AI), and drones. As the digitalization concept promoted
in Construction 4.0 mostly is about integration, two level of integration efforts;
i. integration of a Construction 4.0 technology throughout the construction project
lifecycle, and
ii. integration and connectivity of Construction 4.0 technologies;
were assessed and evaluated in the study. A roadmap of Construction 4.0 integration
across a project life-cycle was proposed and parameters required for the implementation
were also highlighted [2].
In Malaysia context, generally, the need to embrace Industry 4.0 technologies have
been addressed in many national documents. Focusing into construction industry, a
national strategic plan known as Construction 4.0 Strategic Plan 2021–2025 was published in 2020, by the Construction Industry Development Board (CIDB) Malaysia.
According to YB Dato’ Sri Haji Fadillah bin Haji Yusof, Senior Minister of Infrastructure, Minister of Works Malaysia, Construction 4.0 Strategic Plan is a roadmap for the
Construction 4.0 Readiness and Challenges for Construction Skills Training
703
Malaysian Construction Industry to embrace the Fourth Industrial Revolution (IR 4.0)
in ways that would transform its productivity and competitiveness. The Construction 4.0
is created to be aligned to the Shared Prosperity Vision 2030 (SPV 2030) and the implementation of the National Policy on Industry 4.0 (Industry4WRD). The strategic plan
also supports and compliment the National Internet of Things (IoT) Strategic Roadmap,
the Malaysia Smart City Framework and the Digital Economy Blueprint, among others.
It covers twelve emerging technologies and its implementation plan within the short,
medium and the long term [5].
2.4 Construction 4.0 Strategic Plan (2021–2025)
The Construction 4.0 Strategic Plan has been developed in collaboration with industry
stakeholders with aim to elevate Malaysia construction industry in the era of technological revolution by embracing digital technologies across the construction supply chain.
However, the document does not provide all answers to issues and challenges but rather
a framework on how the Malaysian Construction Industry players should position their
businesses and enhance their service deliveries with the aid of technologies offered in
Industry 4.0.
With a vision to be the leading Construction 4.0 country in the South East Asian
Region, the Strategic Plan is aimed to support digital transformation of Malaysia construction industry by leveraging the country’s experience and the current digitalised
ecosystem. While the Strategic Plan’s mission is to transform the Malaysian construction
industry by empowering smart construction concept for future society, whereby digital
technologies and industrialised manufacturing techniques are utilised in full from the
building design phase, construction phase until the building operation and maintenance
phase. Through the smart construction concept, productivity can be enhanced, whole
life-cycle cost of a building can be minimised while the sustainability of a building can
be improved and users’ benefits are maximised [15].
In brief, there are 12 “disruptive technologies” which are being focused in order
to change the current Malaysia construction landscape towards the future; Building
Information Modelling (BIM), pre-fabrication and modular construction, autonomous
construction, augmented reality and virtualization, cloud and real time collaboration,
3D scanning and photogrammetry, big data and predictive analysis, internet of things,
3D printing and additive manufacturing, advanced building materials, block chain and
artificial intelligence. There are four key enablers of the Strategic Plan are being highlighted in ensuring transition and adoption towards the industry’s digital transformation
are able to be achieved within 5 years of its implementation [8]. In relation to Enabler
1 identified in the Strategic Plan, under the Strategic Thrust 1 Building Capacity, has
stated that “Preparing future workforce for Construction 4.0” is the Strategic Objectives
No.1 as shown in Fig. 2 below:
704
M. F. A. Hamid and Z. A. Rahim
Fig. 2. The four strategic thrusts of construction 4.0 strategic plan 2021–2025 [8].
2.5 Construction Skills Training Institutions in Malaysia
Technical and vocational education and training (TVET) emphasized on the acquisition
of knowledge and skills in the world of work. Broad definition on the term of TVET has
been discussed in many years. The prominent term is within the context of UNESCO
and according to the 2001 UNESCO Revised Recommendation concerning TVET which
concluded that TVET refers all aspects of the educational process involving, in addition
to general education, the study of technologies and related sciences, and the acquisition
of practical skills, attitudes, understanding and knowledge relating to occupations in
various sectors of economic and social life (Hollander A., Mar N.Y., 2009).
In the context of construction skills training in Malaysia, the Industry Lead Body
(ILB) appointed by the Department of Skills Development (DSD), Ministry of Human
Resources Malaysia (MOHR) is the Construction Industry Development Board Malaysia
(CIDB) (MOHR Malaysia, 2020). Governed under the Lembaga Pembangunan Industri
Pembinaan Malaysia Act 1994 (Act 520), CIDB has the power to accredit and certify
skilled construction worker as stated in Sect. 33A (1) to those specified in the Third
Schedule (Amendment 2017) and establish, promote and accredit training institutions
as stated in Sect. 33B (a) under the same Act.
Basically, there are two main types of institution in relation to construction skills
training centre accredited by CIDB;
i. Certified Competency Training Centre (CCTC)
ii. Certified Competency Assessment Centre (CCAC)
A CCTC is a certified training institution which has been accredited to conduct
construction skills trainings for the skills trade listed in the Third Schedule of CIDB
Act. There are three types of CCTC being accredited, governed and monitored by CIDB
which are;
Construction 4.0 Readiness and Challenges for Construction Skills Training
705
i.
CCTC on Management, which offers training for construction executive, officer
and manager level (level 5–6)
ii. CCTC on Supervisory, which offers training for construction site supervisor (level
4)
iii. CCTC on Skills, which offers training for skills trade for level 1–3 construction
personnel (operator) (level 1–3)
While CCAC is referred to a certified assessment centre accredited by CIDB to
conduct assessment for the skills trade assessment (level 1–3) construction personnel.
There are two types of CCAC which are;
i. Local CCAC for skills trade assessment
ii. Overseas CAC for skills trade assessment
2.6 Research Significance
Through the study, it is hoped that the level of awareness on Construction 4.0 among
the construction skill training institutions in Malaysia can be understood and concluded.
This will lead to further understanding on the level of readiness of construction skills
training institutions in Malaysia in adopting Construction 4.0 technologies in delivering
their training programs. Areas of concern in the Construction 4.0 adoption process can
be highlighted, challenges can be anticipated and further interventions in mitigating
problems can be strategized.
As there are still limited research and study conducted in understanding Construction
4.0 adoption clarity by the construction skills training institutions in Malaysia, it is belief
this research will contribute to the enrichment of academic studies documentation related
to the Construction 4.0 in specific and the Industry 4.0 generally for Malaysia context.
References
1. Muñoz-La Rivera, F., Mora-Serrano, J., Valero, I., Oñate, E.: Methodological-technological
framework for construction 4.0. Arch. Comput. Methods Eng. 28(2), 689–711 (2020). https://
doi.org/10.1007/s11831-020-09455-9
2. El Jazzar, M., Urban H., Schranz, C., Nassereddine, H.: Construction 4.0: A Roadmap to
Shaping the Future of Construction (2020)
3. García de Soto, B., Agustí-Juan, I., Joss, S., Hunhevicz, J.: Implications of Construction 4.0
to the workforce and organizational structures. Int. J. Constr. Manage., 1–13 (2019)
4. Malaysia’s Performance in The Global Competitiveness Index 2019. World Economic Forum
(WEF). https://www.mpc.gov.my/wp-content/uploads/2019/10/Malaysias-Performance-inThe-Global-Ccompetitiveness-Report-2019-Topline.pdf. Accessed 06 Sep 2021
5. CIDB Malaysia,: Construction 4.0 Strategic Plan 2021–2025, p. 47, https://www.cream.my/
my/publication/construction-4-0-strategic-plan-2021-2025/construction-4-0-strategic-plan2021-2025. Accessed 06 Dec 2021
6. Zulnaidi, H., et al.: J. Tech. Educ. Training 12(3), 89–96 (2020). https://penerbit.uthm.edu.
my/ojs/index.php/jtet. Accessed 06 Dec 2021
706
M. F. A. Hamid and Z. A. Rahim
7. Wesam Salah Alaloul, M.S. Liew, Noor Amila Wan Abdullah Zawawi, Icke Baldwin Kennedy:
Industrial Revolution 4.0 in the construction industry: Challenges and opportunities for
stakeholders. Ain Shams Eng. J. 11(1), 225–23 (2020)
8. CIDB Malaysia: Construction 4.0 Strategic Plan (2021–2025), Strategic Plan for Construction
Industry: Gearing Up for the Fourth Industrial Revolution, p. 8 (2020)
9. MITI Malaysia: Industry 4WRD: National Policy On Industry 4.0, p. 16 (2018)
10. Maskuriy, R., Selamat, A., Ali, K., Maresova, P., Krejcar, O.: Industry 4.0 for the Construction
Industry—How Ready Is the Industry? (2020). https://www.researchgate.net/publication/334
488532_Industry_40_for_the_Construction. Accessed 17 June 2021
11. Osunsanmi, T.O., Aigbavboa, C.O., Emmanuel Oke, A., Liphadzi, M.: Appraisal of stakeholders’ willingness to adopt construction 4.0 technologies for construction projects. Built Environ. Project Asset Manage. 10(4), 547–565 (2020). https://www.emerald.com/insight/con
tent/doi/https://doi.org/10.1108/BEPAM-12-2018-0159/full/html. Accessed 21 June 2021
12. Forcael, E., Ferrari, I., Opazo-Vega, A., Pulido-Arcas, J.A.: Construction 4.0: a literature
review. Sustainability 12(22), 9755. MDPI AG. (2020). Accessed 21 June 2021
13. Bock, T.: The future of construction automation: technological disruption and the upcoming
ubiquity of robotics. Autom. Constr. 59, 113–121 (2015)
14. CIDB Malaysia: Construction 4.0 strategic plan 2021–2025, p. 47, https://www.cream.my/
my/publication/construction-4-0-strategic-plan-2021-2025/construction-4-0-strategic-plan2021-2025. Accessed 12 June 2021
15. Construction Leadership Council 2018, Smart Construction - A Guide for Housing Clients,
p. 3. https://www.constructionleadershipcouncil.co.uk/wp-content/uploads/2018/10/181010CLC-Smart-Construction-Guide.pdf. Accessed 22 June 2021
16. Construction Skills Training and Competency Program, CIDB Malaysia. https://www.
cidb.gov.my/en/construction-info/skills-training/construction-skills-training-competencyprogram. Accessed 22 June 2021
17. Construction Skills Training and Competency Program, CIDB Malaysia. https://www.
cidb.gov.my/en/construction-info/skills-training/construction-skills-training-competencyprogram. Accessed 22 June 2021
18. Ying Yi, L.: The Edge Markets ‘CIDB allocates RM70m for programmes to enhance construction industry’ (2020). https://www.theedgemarkets.com/article/cidb-allocates-rm70m-progra
mmes-enhance-construction-industry. Accessed 22 June 2021
19. Aspers, P., Corte, U.: What is qualitative in qualitative research. Qual. Sociol. 42(2), 139–160
(2019). https://doi.org/10.1007/s11133-019-9413-7
20. William, P., Trochim, M.K.: (2021) https://conjointly.com/kb/qualitative-approaches/.
Accessed 23 June 2021
21. Dickson, A., Emad, H., Joe, A-A.: Theoretical and conceptual framework: mandatory
ingredients of a quality research. Int. J. Sci. Res. 7, 438–441 (2018). https://www.researchg
ate.net/publication/322204158_Theoretical_And_Conceptual_Framework_Mandatory_Ing
redients_Of_A_Quality_Research
22. Baškarada, S.: Qualitative case studies guidelines. The Qualitative Report 19(40), 1–25
(2014). https://papers.ssrn.com/sol3/papers.cfm?abstract_id=2559424
23. Rashid, Y., Rashid, A., Warraich, M.A., Sabir, S.S., Waseem, A.: Case study method: a stepby-step guide for business researchers. Int. J. Qual Methods (2019). https://doi.org/10.1177/
1609406919862424
24. DeJonckheere, M., Vaughn, L.M.: Semistructured interviewing in primary care research: a
balance of relationship and rigour. Family Med. Commun. Health 2019 7, e000057 (2019).
https://fmch.bmj.com/content/7/2/e000057
25. Guest, G., Namey, E., Mitchell, M.: Sampling in qualitative research. In: Collecting qualitative
data, pp. 41–74. SAGE Publications, Ltd. (2013). https://doi.org/10.4135/9781506374680
A Conceptual Framework for Democratization
of Big Data Analytics (BDA)
Nor Haslinda Ismail(B) and Rose Alinda Alias
Azman Hashim International Business School, Universiti Teknologi Malaysia, Johor, Malaysia
nor78@graduate.utm.my
Abstract. Organizations implement Big Data Analytics (BDA) to help the organization to improve the efficiency and effectiveness of the business. However, the
successful of the BDA implementation is not achieved because of lack communication and collaboration between the BDA stakeholders. As we know stakeholders
for example a data scientist played an important role in BDA implementation.
Therefore, democratization is introduced to address these issues. This paper introduces the concept of democratization in big data analytics (BDA) by applying the
Technology Organization Environment Model (TOE) in a conceptual framework
that is used in the process of BDA implementation.
Keywords: Big data analytics · Democratization · Technology Organizational
Environment (TOE) model
1 Introduction
Big Data is now widely available for organization in different fields. Since the Big data
had gained a significant impact for organization in achieving organizational vision and
mission. Therefore, by adopting an advanced analytics technology, organizations can
use big data for developing innovative insights, products, and services. Big data analytics (BDA) has recently been employed by organizations to speed up decision making,
facilitate communication and respond quickly [1]. Therefore, a good communication
and collaboration between the stakeholders who have a same understanding and know a
clear mission and vision of the organization will make the implementation of Big Data
Analytics is successful.
Organizations implement Big Data Analytics (BDA) to help them improve the
efficiency and effectiveness of the business and for getting assistant in the decisionmaking process. However, the effectiveness of the BDA implementation is not achieved
because of lack communication and collaboration between the BDA stakeholders. In
order to make big data analytics implement successful this study introduce the concept
of democratization in BDA.
This paper is aimed at further understanding the concept of democratization for Big
Data Analytics in organizations. And this paper also provides an overview of democratization in big data analytics. The successful implementation of big data analytics
influences by the factors that is related to the successful of BDA such as technology
© The Author(s), under exclusive license to Springer Nature Switzerland AG 2022
F. Saeed et al. (Eds.): IRICT 2021, LNDECT 127, pp. 707–712, 2022.
https://doi.org/10.1007/978-3-030-98741-1_59
708
N. H. Ismail and R. A. Alias
such as the technology readiness, unclear of project goals, lack of experience with technology. Secondly organization factors also will influence the democratization of BDA
success for instance factors of demand for big data, senior leadership, trust in project
team and management policies and procedures. Finally, the environmental factors such
as government regulations also will give an impact in democratization of BDA success.
This paper is organized as follows: Sect. 2 discusses issues in democratization of
BDA, Section 3 discusses the theoretical discussion on Technological Organization and
Environmental (TOE) and stakeholder theories. Section 4 describes the proposed model
in detail. Finally, Sect. 5 concludes this paper, along with the recommendation for future
work.
2 Problem Statement
Big data analytic implementation is one of the challenges processes which is required a
good communication and collaboration between the stakeholders involve in the implementation process. Furthermore, as a data scientist who play an important role in BDA
implementation, he or she must full adopt their capabilities in making a decision [11].
The research starts with an approach of concept of democratization in big data analytics.
The paper illustrates the use of democratization for BDA success in organization and
shows the current gaps between the literature and the research aims to understand the
concept of democratization in order to make BDA implementation successful.
3 Literature Review
3.1 Big Data and Big Data Analytics
Big Data is defined as “information assets characterized by such a high volume, velocity,
and variety to require specific technology and analytical methods for its transformation
into value” [2]. Big data is an abstract concept. There is no single description for it,
and research researchers, scientific and technology firms, data analysts, and technical
practitioners all have diverse perspectives on what it is [3] (Fig. 1).
Fig. 1. The 5Vs of big data (www.quora.com)
A Conceptual Framework for Democratization of Big Data Analytics (BDA)
709
The big data analytic topic has become a hot research topic in recent ten years. Thus,
many organizations, both commercial and public, are concerned about implementing
BDA because they expect insights from BDA to help them improve productivity, satisfy
consumer requests, cut operational costs, and expand their businesses [4].
3.2 Democratization Definition from Previous Work
Data democratization has lately been discussed in many industry, with the suggestion
that data should be democratized to make data analytics more accessible [5]. Additionally, with democratization stakeholders could readily draw on information across an
organization which enables them to interact and communicate effectively among them.
Below are the studies of the concept of democratization apply generally in a Big Data
field:
• First the term of democratization of technology was introduced by [6] stated that technology that was once considered high-tech is now available to practically everyone.
The technologies used by ordinary peoples are growing in the opposite way; they are
developing later in industry than in everyday use[ 7].
• The democratization of data, which is defined as intra-organizational open data, allows
employees to transition from data users to citizen data scientists who may give useful
insight [8].
• Democratization is defined as an organizational culture that encourages information
sharing and acceptance of diversity based on fresh knowledge [1].
3.3 The Importance of Technology Democratization
From what we have study from the past literature, democratization will help organization
to articulate of strategies based on availability, accessibility, and usability of the information flow. Furthermore, democratization will allow data to transit from the non-technical
to technical people within the organization.
4 Theoretical Framework
4.1 Technological Organizational Environmental (TOE) and Stakeholder
Theories
The TOE framework was created by [9] which the technological, organizational, and
environmental elements all have a role in how a technology innovation is embraced
and deployed. All three aspects were utilized in this study since they have been found
to be essential in the literature when evaluating BDA implementation democratization.
In terms of technology, consider whether the organization’s current technology and
experience with it are compatible with the BDA deployment. The organizational aspect
examines BDA demand, as well as a few other factors such as project team trust, organizational norms and procedures, and senior leadership. For the environmental aspect
looks into the government regulations that will influence the democratization of BDA
implementation success.
710
N. H. Ismail and R. A. Alias
4.2 B. Definition of the Stakeholders?
A stakeholders can be anybody who can affect or affected by an organization, strategy,
or project implementation. In other definitions suggest that stakeholders must be those
who have the power to impact an organization or project. For example people or small
groups with the power to respond to, negotiate with and change the strategic future of
the organization [10].
However [11] defines a stakeholder as any group or individual who can affect or is
affected by the achievement of the organization’s objectives. For example, data scientist
may not have a choice in the process of implementation of a Big Data Analytics but
he or she will be the key factor in the long-term adoption of the project. If they do
not fully adopt and use with full capabilities, then it will impact to the successful of
BDA implementation. As a result, stakeholders must be identified, even if they look
powerless at first. It is also being used in other domains where conflicting interests and
management are important, such as operational research, political economy, and, of
course, information systems research [12].
4.3 The Proposed Conceptual Framework
This paper provides a conceptual framework as indicated in Fig. 2 based on the theoretical
discussion above and insights from the literature. It shows the relationship between the
four dimensions of the study. Each dimension and its relationship with other construct
as depicted in the model are discussed further in the remainder of the paper. From the
proposed conceptual framework, four propositions are suggested as follows:
Proposition 1 (P1): From the technological perspective, adequate technology, with
a clear project goal and have an experience using the technology will impact the
democratization of BDA success in the organization.
Proposition 2 (P2): From the organizational perspective, the combination of strong
senior leadership, trust in project team, adequate management policy and procedure and
good demand for big data will impact the democratization of BDA implementation in
the organization.
Proposition 3 (P3): From the environmental perspective, government regulation will
impact the democratization of BDA implementation in the organization.
Proposition 4(P4): Stakeholders with good communication and collaboration during the
process of implementation of BDA will strongly influence the successful of BDA in the
organization.
We will evaluate the propositions qualitatively using data from the in-depth
interviews with the stakeholders in the future study.
A Conceptual Framework for Democratization of Big Data Analytics (BDA)
711
Fig. 2. Propose conceptual framework
5 Conclusion
This main aim of the study was to highlights the concept of democratization of BDA
implementation success in the organization. From the literature reviewed, organizational, technological, environmental (TOE) factors and stakeholders will influence the
democratization of BDA implementation success. This research was underpinned by
TOE framework and eight BDA factors. Thus, future researchers will be able to extend
the current of democratization of BDA using the proposed framework.
The authors express their gratitude to Universiti Teknologi Malaysia (UTM) for
providing support to this work and, special thanks to all reviewers of an earlier version
of this paper for their helpful.
References
1. Hyun, Y., Hosoya, R., Kamioka, T.: The moderating role of democratization culture: Improving agility through the use of big data analytics. In: Proceedings of the 23rd Pacific Asia
Conference on Information System Security ICT Platform 4th Industry Revolution, PACIS
2019 (2019)
2. De Mauro, A., Greco, M., Grimaldi, M., Ritala, P.: In (Big) data we trust: value creation
in knowledge organizations - introduction to the special issue. Inf. Process. Manag. 54(5),
755–757 (2018)
3. Chen, M., Mao, S., Liu, Y.: Big data: a survey. Mob. Netw. Appl. 19(2), 171–209 (2014).
https://doi.org/10.1007/s11036-013-0489-0
712
N. H. Ismail and R. A. Alias
4. Ijab, M.T., Salleh, ohdMa.M., Wahab, S.M.A., Bakar, A.A.: Investigating big data analytics readiness. In: 6th International Conference on Research and Innovation in Information
Systems (ICRIIS) (2019)
5. Díaz, T., Rowshankish, A., Saleh, K.: Why data culture matters. Mckensey Q., pp. 1–17
(2018)
6. Friedman, T.L.: The Lexus and the Olive Tree: Understanding Globalization. Farrar, Straus
and Giroux, New York (1999)
7. Karlovitz, T.J.: The democratization of technology – and its limitation. In: Managing Customer
Experiences in an Omnichannel World: Melody of Online and Offline Environments in the
Customer Journey, pp. 13–25. Emerald Publishing Limited (2020)
8. Awasthi, P., George, J.J., George, J.: A case for data democratization. In: Association
Information System, AMCIS 2020 Proceedings, pp. 0–10 (2020)
9. Tornatzky, M., Fleischer, L.G.: The Process of Technological Innovation. Massachusets
Lexington Books (1990)
10. Eden, C., Ackermann, F.: Making Strategy: The Journey of Strategic Management. London
Sage Publications (1998)
11. Freeman, R.E.: Strategic Management: A Stakeholder Approach. Cambridge University
Press, Cambridge (1984)
12. Pouloudi, A.: Aspects of the stakeholder concept and their implications for information systems development. In: Proceedings of the Hawaii International Conference on System Science,
vol. 00, no. c, p. 254 (1999)
Construction 4.0 Intervention in Quality
Assessment System in Construction’s
Implementation
Syed Muhammad Nazir Bin Syed Othman1(B) and Zulhasni Abdul Rahim2
1 Malaysia-Japan International Institute of Technology, Kuala Lumpur, Malaysia
syedmuhammadnazir@graduate.utm.my
2 University of Technology Malaysia, Kuala Lumpur, Malaysia
Abstract. The quality of construction projects (buildings and infrastructure) is
an important parameter in determining the maturity level of construction industry. The issues related to quality in construction projects is not relatively new
and has been around for decades. To address this issue, Construction Industry
Development Board (CIDB) Malaysia has introduced Quality Assessment System in Construction (QLASSIC) or also known as Construction Industry Standard
7 (CIS7) back in 2007 as a benchmark yardstick to rate the quality level of building
projects specifically in the workmanship area. The association of Industry 4.0 concept with construction delivery process has resulted the Construction 4.0 concept.
Through the adoption of Construction 4.0, the construction industry is expected
to experience major changes in the entire project delivery process. These changes
require further update on the existing CIS7 to suit the measurement methodology
with the upcoming emerging technologies and new construction methods. The
clarity of gaps between existing measurement parameters stated in CIS7 and the
requirement of emerging technologies must be made clear and well-understood.
This will be the foundation for CIDB Malaysia as sole construction leader in
Malaysia to improvise CIS7 to a higher standard and ready for Industry 4.0 era.
As there are limited study and research conducted in understanding the integration
of Construction 4.0 in QLASSIC and limitation of CIS7, this study will contribute
to the enrichment of academic studies documentation related to Construction 4.0
generally and QLASSIC in specific.
Keywords: Industry 4.0 · Construction 4.0 · QLASSIC · CIS7 · Quality-rated
building · CIMP · CITP
1 Research Background
1.1 Introduction
The Fourth Industrial Revolution (Industry 4.0) that was first mentioned by the executive chairman and the founder of the World Economic Forum (WEF), Klaus Schwab, in
Switzerland back in 2016. During his presentation, Klaus mentioned that the integration
of business and manufacturing processes as well as all players in the industry value chain
© The Author(s), under exclusive license to Springer Nature Switzerland AG 2022
F. Saeed et al. (Eds.): IRICT 2021, LNDECT 127, pp. 713–722, 2022.
https://doi.org/10.1007/978-3-030-98741-1_60
714
S. M. N. B. S. Othman and Z. A. Rahim
is the profound concept of Industry 4.0 approach [1]. The original concept of Industry
4.0 is mainly focusing on range of advanced technologies adoption across all industries value chain. Automation, robotics, artificial intelligence, nanotechnology, quantum
computing, biotechnology, industrial internet of things, decentralized consensus, fifth
generation (5G) wireless technologies, 3D printing, and fully autonomous vehicles are
considered as the main emerging technologies that driving Industry 4.0 forward while
at the same time creating both threats and opportunities to the conventional industries
environment.
Following the Industry 4.0, industry experts and researchers has explored the integration of emerging technologies with construction process thus creating the new concept
of Construction 4.0. Construction 4.0 can be understood as a counterpart of Industry 4.0
in which, aims to digitalize the whole life cycle of construction project monitoring and
with the aid of multiple technologies [2]. Through the adoption of Construction 4.0, it
is expected the major changes to take place in the construction process delivery stages,
project structures and organization and ultimately integrate the highly known fragmented
construction industry atmosphere. These changes will further require the major change
on the entire component of construction industry such as standards for practices, personnel skills competency and numerous procedures in construction activities. From
construction standards point of view, the existing standards should be updated with the
consideration of the emerging Construction 4.0 technologies application in construction
practices.
1.2 Issue Statement
Today, more and more countries have come forward to ensure they are left behind
in becoming the best in adopting Industry 4.0 technologies. Malaysia has portrayed
a serious commitment internationally to adopt and explore digital technologies into its
economic value chain thus transforming businesses. Malaysia was ranked at 22nd position
worldwide in Institute of Management Development (IMD) World Competitiveness
Ranking 2019 and 26th position in World Competitiveness Yearbook (WCY) in 2019
based on the progress of technological infrastructure and the agility of its businesses.
From construction perspective, the industry player must be made ready to drive the
technological advancement from various angle including industry standards [3].
As the national document which referred daily by construction players in project
implementation activities, it is crucial for CIS7 to be updated from time to time to suit
the changes which will take place in construction industry. CIS7 was developed in 2007
and since that, it has undergone revision process once in 2014, where it was updated
to incorporate the parameters enlisted in 8th Edition of CONQUAS. With upcoming
revolution around the corner, it is crucial for CIS7 to be updated and equipped with
measurement parameters which considered the implementation of new emerging technologies as suggested in Construction 4.0. To achieve this, it is utmost important to first
understand the limitation of CIS7 and the requirement of emerging technologies to be
implement in construction projects.
Construction 4.0 Intervention in Quality Assessment System
715
1.3 Research Purpose
The purpose of this research is to understand the limitation of CIS7 towards the adoption
of Construction 4.0 technologies in construction practices. This research also will dive
deep in understanding the implementation method of Construction 4.0 technologies in
construction projects thus assisting the formulation of future CIS7 revision process.
1.4 Research Objectives and Questions
In response to the issue identified which related to the limitation of CIS7 in adoption of
Construction 4.0 technologies change, this research is conducted to:
i.
Identify the Construction 4.0 technologies implementation method in construction
projects.
ii. Assess the feasibility of existing quality measurement methodology in CIS7 with
Construction 4.0 technologies implementation method.
iii. Identify the new parameter required to support the requirement of Construction 4.0
technologies.
iv. Propose way forward for CIDB Malaysia to undertake the revision of CIS7 based
on the Construction 4.0 technologies adoption gaps identified.
In order to streamline the research towards achieving the objectives set, the following
research questions are developed to understand the identified problem in depth as well
as building further argumentative questions to verify research findings:
i.
How are the new Construction 4.0 technologies should be implemented in
construction works?
ii. What are the critical elements in CIS7 which require urgent attention in accelerating
Construction 4.0 technologies adoption?
iii. What would be the new parameter that has to be incorporated in CIS7 as
Construction 4.0 technologies is implemented?
1.5 Research Framework
The development of theoretical and conceptual framework is important to provide an
illustration pathway of research to support theoretical constructs. The objective of both
framework is to ensure generalization, guide the research to a meaningful finding and
aligned with theoretical constructs. Research without the theoretical or conceptual framework makes it difficult for readers in ascertaining the academic position and the underlying factors to the researcher?s assertions or hypotheses. This renders the research sloppy
and not appreciable as contributing significantly to the advancement of the frontiers of
knowledge [4].
In this research, the design and flow to provide the overview of the research content is
developed by using RIBA Plan of Work 2020 and Construction Project Lifecycle [5]. The
intervention of Construction 4.0 technologies will be analyzed throughout 5 construction
phase that are conceptual stage, planning & design stage, procurement stage, construction
stage and operation & maintenance stage. The overview of conceptual framework for
this research as follows (Fig. 1):
716
S. M. N. B. S. Othman and Z. A. Rahim
Fig. 1. Research conceptual framework
1.6 Research Limitation
This research is limited to Construction Industry Standard 7 (CIS7) implementation in
Malaysia and the findings shall not be treated to generalize in other country. However,
it is believed that some issues are very much related and may present the same method
of intervention as recommended for future way forwards.
2 Literature Review
2.1 Overview of Malaysia Construction Industry
The construction industry has been a key economic engine in Malaysian economy ever
since and play a significant role in driving the physical development of nation. From
economy point of view, the construction industry possesses a strong composition with
strong volume contribution in economy. In the past ten years, the total volume of construction projects executed by both public and private sectors remains above RM100
billion annually, peaking RM241 billion in 2016.
The construction industry is a unique industry because of its ability to create twotimes multiplier economic effect and it is the only industry that have more than 120 other
industries relying on for their growth and sustainability. In general, construction activities
consume about 15% of total manufacturing output in Malaysia [6]. The construction
Construction 4.0 Intervention in Quality Assessment System
717
industry act as a vital component of Malaysia?s Gross Domestic Product (GDP) with
approximately 4% contribution in 2013 and continually improve annually and recorded
peak at 5.9% in 2017 and decline to 0.4% in 2020 [2]. The growth of 5.9% in 2017
surpass the expectation set in Construction Industry Transformation Programme (CITP)
which was 5% by 2020 to outpace Malaysia?s overall economy which is expected to
grow at a steady rate of 5% - 6% per year.
Since March 2020, Malaysia construction industry was hit by global COVID-19
pandemic as the Movement Restriction Order (MCO) was enforce by government, all
construction activities were put at hold. According to Senior Minister of Works and
Infrastructure of Malaysia, the estimated lost in construction industry is RM42 billion during MCO period of March 2020 until September 2021. As Malaysia entering
endemic stage, construction industry is expected to recover at 10.3% per year as the
industry demonstrates strong correlation with economic development, with the construction share of GDP positively correlated with GDP per capita. As developing nation,
there is a big necessity for more higher standard and quality, energy-efficient buildings,
and infrastructures to improve people?s life quality. In the past 10-years, we have seen
the demand is being delivered by government through series of mega projects such as
Mass Rapid Transit (MRT), Light Rail Transit (LRT), Highways (Pan-Borneo, DUKE
Phase 2 and Phase 3) etc. In future, more of such projects is required to match the
demands and support national population growth headings should be numbered (Fig. 2).
Fig. 2. Construction projects volume by cost from 2010 to 2020 (Source: Convince CIDB
Malaysia)
2.2 Quality Assessment System in Construction (QLASSIC)
Conventionally, the quality of the management, operation and products of the organization is measured by using the standard management system derived from International
718
S. M. N. B. S. Othman and Z. A. Rahim
Organization of Standardization (ISO) 9000. Because of the nature of construction is
different from other industries such as manufacturing, the implementation of ISO9000
in construction industry was founded very difficult. Due to this, the QLASSIC is introduced by CIDB for the use and benefits of the entire construction industry. QLASSIC is
a simplified terminology for Quality Assessment System in Construction, developed by
CIDB Malaysia in late 2005 with the main objectives to benchmark the level of quality
of the construction industry in Malaysia and have a standard quality assessment system
for quality of workmanship of building projects. QLASSIC is a system or method used to
measure and assess the quality of construction work based on the Construction Industry
Standard (CIS 7:2014), similar to guidelines used for construction projects in achieving
quality outcomes [11].
Initially, QLASSIC was developed as CIS7:2006 through the adoption of 6th Edition
of Construction Quality Assessment System (CONQUAS), a management system developed by Singapore?s Building & Construction Authority (BCA) [12]. QLASSIC was
then updated in 2014 in accordance with CIS7:2014 and 8th Edition of CONQUAS [11].
The quality and reliability of CIS7:2006 was monitored and examined by a Technical
Committee formed by CIDB which composed the representatives from various professional bodies and associations. To further enhance its adoption, QLASSIC initiatives was
elevated to national agenda when it was incorporated in Construction Industry Master
Plan 2006?2015 (CIMP) followed by Construction Industry Transformation Programme
2016 ? 2020 (CITP). Despite of various efforts done, QLASSIC adoption in on-ground
projects is still low and not widely practiced by construction stakeholders. Due to this,
it is significant for a study to be conducted to explore the critical issues and challenges
faced by construction stakeholders in adopting QLASSIC in construction projects.
Currently, the assessment using QLASSIC are only applicable to building projects
regardless the size of the project and are not applicable to benchmark the quality level of
infrastructure projects such as roads, highways, seaport etc. Commonly, the assessment is
being conducted on building projects including landed residential, stratified residential,
building for public use such as offices and schools, in addition to distinctive buildings
such as hospitals and airports, etc. [13]. In CIS 7:2014, the assessment methodology is
created as four separated principal components that are i. Structural Works, ii. Architectural Works, iii. Mechanical & Electrical Works (M&E) and iv. External Works. The
assessment of the workmanship is carried out based on the components as established
under the standard where points are awarded if the workmanship complies to the standard. These points are then summarized, giving a total quality (TQ) score called the
QLASSIC Score for the building [11].
The level of adoption and performance of QLASSIC give an indication of how deep
the quality element is emphasize in construction project generally. The information
of both adoption and performance can assessed through the reports published by CIDB
Malaysia. To understand the implementation status in construction sector the information
of data and statistics on the volume of project assessed using QLASSIC and total number
of building projects and data on average QLASSIC score achieved was analyzed.
According to statistical data published in [14], from early year 2015 till 2020, there
were 1,969 buildings projects completed the quality assessment by using QLASSIC. As
comparison, the total buildings projects recorded for the same timeline is 22,495 projects.
Construction 4.0 Intervention in Quality Assessment System
719
This data shows there are only 8.7% of building projects in Malaysia were quality-rated
using QLASSIC for the past 5 years. Based on this statistic, the QLASSIC adoption for
the past 5 year is ranging between 6% to 15%. The adoption increased from 2015 to 2017
and peak at 15%. The adoption declined till 2019 at 6.4% before slightly increased in
2020 at 7.6%. In terms of QLASSIC performance, the statistic shows a nearly stagnant
scoring from 2015 to 2020. All projects assessed with QLASSIC achieved an average
QLASSIC score between 69% to 74% (Figs. 3, 4 and 5).
Total Building Projects
270
311
341
314
409
324
2165
2280
2928
4255
4500
6367
Building Assessed with QLASSIC
2015
2016
2017
2018
2019
2020
Fig. 3. Data on building assessed with QLASSIC and total number of building projects in
Malaysia (from 2015 until 2020)
2.3 Construction 4.0 in Malaysia Landscape
The terminology Construction 4.0 was derived from the concept of Industry 4.0 where the
bigger concept of Industry 4.0 was streamlined and focused on the needs and its intervention in construction industry. The main focus of Industry 4.0 is to encourage technology
adoption across manufacturing industry in such modernizing industry, improving productivity and people?s life. Automation, robotics, artificial intelligence, nanotechnology,
quantum computing, biotechnology, industrial internet of things, decentralized consensus, fifth generation (5G) wireless technologies, 3D printing, and fully autonomous
vehicles are considered as the main emerging technologies that driving Industry 4.0 forward while at the same time creating both threats and opportunities to the conventional
industries environment. Even though the idea of Industry 4.0 was originally focused on
manufacturing industry, the idea of revolutionizing the industry was followed by other
industries.
720
S. M. N. B. S. Othman and Z. A. Rahim
100%
90%
80%
70%
60%
50%
40%
30%
20%
10%
6.00%
10.60%
15.00%
14.50%
6.40%
7.60%
2019
2020
0%
2015
2016
2017
2018
Fig. 4. Statistic on QLASSIC adoption in Malaysia (From 2015 until 2020)
100%
90%
80%
73.00%
73.00%
72.00%
74.00%
2015
2016
2017
2018
69.00%
71.00%
2019
2020
70%
60%
50%
40%
30%
20%
10%
0%
Fig. 5. Mean of QLASSIC score resulted from the assessment (From 2015 until 2020)
Just like other industries, construction industry has been moving towards the same
direction. Industry experts and researchers has been actively participated in exploring
the integration between the emerging technologies in Industry 4.0 into construction
Construction 4.0 Intervention in Quality Assessment System
721
thus creating the term ?Construction 4.0? into research corpus [2]. Construction 4.0 can
be understood as a counterpart of Industry 4.0 in which, aims to digitalize the whole
life cycle of construction project monitoring and with the aid of multiple technologies.
Via the adoption of Construction 4.0, the existing fragmented construction practices is
expected to meet major changes as well as construction process delivery stages, project
structures and organization. These changes will require the further elevation on the existing standards of practices to suit with the requirement of Construction 4.0 technologies
implementation. In Malaysia context, the standards which refer to construction quality
(CIS7) is govern by CIDB Malaysia. In order to ensure smooth technology adoption, it is
vital for CIS7 to be updated at par with the requirement of Construction 4.0 technology.
In 2020, Malaysia government through Ministry of Works has launched Construction
4.0 Strategic Plan 2021?2025 (CR4.0). The document has been developed in collaboration with industry stakeholders with aim to elevate Malaysia construction industry in
the era of technological revolution by embracing digital technologies across the construction supply chain. According to CR4.0, 12 disruptive technologies were identified
to be focused on in order to change the current Malaysia construction landscape towards
the future that are Building Information Modelling (BIM), pre-fabrication and modular construction, autonomous construction, augmented reality and virtualization, cloud
and real time collaboration, 3D scanning and photogrammetry, big data and predictive
analysis, internet of things, 3D printing and additive manufacturing, advanced building
materials, block chain and artificial intelligence. The Construction 4.0 is created with
aligned to the Shared Prosperity Vision 2030 (SPV 2030) and the implementation of
the National Policy on Industry 4.0 (Indus-try4WRD). The strategic plan also supports
and compliment the National Internet of Things (IoT) Strategic Roadmap, the Malaysia
Smart City Framework, and the Digital Economy Blueprint, among others [5].
3 Conclusion
It is belief that through this study, the implementation method of Construction 4.0 technologies on real ground can be identified. A clear understanding on it will further assist
the identification of the gap between existing CIS7 and the requirement of emerging technologies implementation in construction sector. The clarity within this area will then be
an assist for future revision process of CIS7 in supporting the adoption of Construction
4.0 technologies by industry players.
As there are limited study and research conducted in understanding the integration
of Construction 4.0 in QLASSIC and limitation of CIS7, it is hoped this study will contribute to the enrichment of academic studies documentation related to Construction 4.0
generally and QLASSIC in specific.
References
1. Muñoz-La Rivera, F., Mora-Serrano, J., Valero, I., Oñate, E.: Methodological-technological
framework for construction 4.0. Arch. Comput. Methods Eng. 28(2), 689?711 (2020). https://
doi.org/10.1007/s11831-020-09455-9
722
S. M. N. B. S. Othman and Z. A. Rahim
2. El Jazzar M., Urban H., Schranz C., Nassereddine H.: Construction 4.0: a roadmap to shaping
the future of construction. In: 2020 Proceedings of the 37th ISARC, Kitakyushu, Japan,
pp. 1314-1321 (2020)
3. Malaysia?s Performance in The Global Competitiveness Index 2019. World Economic Forum (WEF). https://www.mpc.gov.my/wp-content/uploads/2019/10/Malaysias-Per
formance-in-The-Global-Ccompetitiveness-Report-2019-Topline.pdf
4. Abdul Rahman, H., Berawi, M.A., Berawi, A.R., Mohamed, O., Othman, M., Yahya, I.A.:
Delay mitigation in the Malaysian construction industry. J. Constr. Eng. Manage. 132(2),
125?133 (2006)
5. CIDB Malaysia: Construction 4.0 Strategic Plan 2021?2025, p. 47. https://www.cream.my/
my/publication/construction-4-0-strategic-plan-2021-2025/costruction-4-0-strategic-plan2021-2025
6. CIDB Malaysia, Construction Industry Transformation Programme 2016?2020 Public
Document Pages 20, 44, 63?65 (2015)
7. Department of Statistics Malaysia (DOSM), Malaysia Economic Performance 2020. https://
www.dosm.gov.my/v1/index.php?r=column/cthemeByCat&cat=100&bul_id=dUl6ZW5Za
TMycTV4bW51d0NlWWYzUT09&menu_id=TE5CRUZCblh4ZTZMODZIbmk2aWR
RQT09. Accessed 25 Oct 2021
8. Abdul-Rahman, H., Wang, C., Wood, L., Khoo, Y.: Defects in affordable housing projects in
Klang Valley, Malaysia. J. Perform. Constructed Facilities, in press (2012). https://doi.org/
10.1061/(ASCE)CF.1943-5509.0000413
9. Sufian, A., Abdul-Rahman, R.: Quality housing: regulation and administrative framework in
Malaysia. Int. J. Econ. Manage. 2(1), 141?156 (2008)
10. Ali, A.S., Wen, K.H.: Building defects: possible solution for poor construction workmanship.
J. Build. Perf. [S.l.], 2(1), (2012). ISSN 2180-2106. http://spaj.ukm.my/jsb/index.php/jbp/art
icle/view/20. Accessed 25 Oct 2021
11. CIDB Malaysia. Construction Industry Standard, CIS7:2014, Quality Assessment System
For Building Construction Works. CIDB Malaysia (2014)
12. Ali, M., Ismail, R., Kam, K.J., Dzulkalnine, N.: Preliminary findings on potential areas of
improvement in QLASSIC. Elixir Proj. Qual. 76, 28341?28349 (2014)
13. CIDB Malaysia. CIDB Technical Report Publication No: 206: Analysis Defect CIS 7 &
QLASSIC Acceptable Score (2015?2018). CIDB Malaysia. Kuala Lumpur, Malaysia. ISBN:
978-967-0997-84-1 (2020)
14. CIDB Malaysia. Buletin QLASSIC (2020). https://www.cidb.gov.my/sites/default/files/202
103/Buletin%20QLASSIC%202020%20-%20Final%20%28A4%29.pdf
15. Hairuddin, M., Hassan, P.F., Siti Khalijah, Y.: Construction Handbook Series Project Management, Construction Management & Site Management. Penerbitan UTHM, Johor, Malaysia
(2018)
Gamification Elements in E-Library Services
in Higher Education: A Systematic Review
Folashade Oyinlola Adedokun1,2(B)
, Norasnita Ahmad2
, and Suraya Miskon2
1 The Federal Polytechnic, Ado-Ekiti, Nigeria
oyinlola@graduate.utm.my
2 Universiti Teknologi Malaysia, 81300 Skudai, Johor Bahru, Malaysia
Abstract. E-libraries in higher education is to support teaching, learning, and
research. Various services like online library services, e-reference services, eSDI, and bibliographic services are rendered in the library to meet the users’
information, education, and research needs. E-libraries in institutions of higher
learning play vital roles, such as the provision of metadata to access e-resources
and the introduction of plagiarism software into the course management system to
promote good practice. Despite the relevance of the e-library services, the library
management experiences low patronage by the prospective users. As a result, of
not being aware of the e-library services within the academic community, the
academic performance of the potential users is affected negatively. Based on this,
there is a need to adopt gamification in e-library services in higher education to
promote library services and improve the academic performance of library users.
Gamification is an act of using game elements to engage and motivate learners
in non-game contexts. The study aims to explore various game elements used in
e-library services. Therefore, this study explores the Scopus database to identify,
extract, and analyze various game elements used in e-library services. Articles
were selected using PRISMA Statement for inclusion and exclusion criteria. Out
of the 41 articles extracted, 29 were thoroughly read and analyzed. In addition, the
study results show that rewards, points, feedback, badges, leaderboards, and prizes
are significant elements used in e-library services to bring fun, engagement, and
enthusiasm. This study will guide the library management in providing necessary
facilities that will aid in the implementation of gamification in e-library services
in higher education. Lastly, the study suggests future research.
Keywords: Gamification · Game elements · e-Library service · Higher education
1 Introduction
The advent of ICT has brought tremendous change to every facet of life. Libraries have
benefitted immensely from technological advancement that has turned the entire world
into a global village over time. Digital library is the result of the influence of technological development in the educational field and consequently has found its application in
various libraries, like national, academic, special, school, research, and private [1]. The
© The Author(s), under exclusive license to Springer Nature Switzerland AG 2022
F. Saeed et al. (Eds.): IRICT 2021, LNDECT 127, pp. 723–733, 2022.
https://doi.org/10.1007/978-3-030-98741-1_61
724
F. O. Adedokun et al.
term digital library is synonymous with e-library, virtual or library without walls. Digital Library stores information in digital form or fulfils information needs from external
information sources to users registered as specific customers and the community in general. The e-libraries found in the institutions of higher learning are to support teaching,
learning, and research. Examples are Universities, Polytechnics, and Colleges of Education. Today, digital libraries offer online library services, e-reference services, e-selective
dissemination of information (e-SDI), and bibliographic services [2, 3]. E-libraries provide vital roles in the institutions of higher learning. Such as integrating plagiarism
software into e-learning/course management systems to promote good practice and provision of metadata that serves as an access point to the e-resources [4]. Despite the roles
that e-libraries play by providing adequate e-resources and e-services for students in
higher education, the libraries still recorded low patronage due to a lack of awareness
of e-library services [5]. Studies revealed that gamification had been applied to various
services in the e-library to motivate and engage the students in creating awareness of the
services rendered [6, 7]. There is a need to explore the empirical studies covering gamification in e-library services in the context of higher education to understand various
variables that have guided these studies.
Gamification has gained popularity in all the fields of human endeavour, with the
library not an exception. The era of Information Communication Technology has made
Gamification cuts across all areas of human work. Various gamification APPs and game
elements are making it possible to adapt to all fields. Different scholars have defined
gamification based on the broader study of the term. Gamification applies game design
elements in non-game contexts to improve users’ experiences and increase their engagements [8, 9]. In gamification, game elements are the potent tools used to inspire and
motivate learners. Gamification is widely used in educational settings and other nonacademic institutions to increase student engagement and motivation by incorporating
game design elements outside a full-fledged game [9]. Points scoring, leaderboards, levels, badges, prizes, and feedback are examples of game elements. However, there could
be other game elements yet to be identified. Therefore, this study aims to explore current
literature related to gamification elements that could find their expressions in other areas
of interest in e-library services in higher education. As a result, one research question
is: what are the gamification elements that could be further explored within the e-library
services in higher education? There are four sections in this study. Section two reviews
the literature, section three describes the methodology, and section four analyzes the
results and discusses the study. Lastly, we conclude and make suggestions for future
research.
2 Literature Review
2.1 E-Libraries
The primary goal of the e-libraries in higher education is to help their parent institutions
by acquiring relevant information materials, processing, organizing, and disseminating
them to library users. It aims at improving the university community’s learning, teaching,
and research activities [1]. There are various resources in the e-library that could help
students actualize their learning and improve their academic performance. Examples of
Gamification Elements in E-Library Services in Higher Education
725
information resources available in the e-libraries are; e-books, e-journal, e-articles, etheses, e-newspapers, e-magazines, video, and audios. Some scholars identified e-library
services as information literacy services, online internet search services, digitalization of
local contents, and e-reference service. Others are CD-ROMs searching service, online
inter-library services, technical training in ICT for staff and users, data management
services, awareness and workshop services, e-mail services, data analysis services, and
audio/video conferences [4, 10].
2.2 Gamification
Gamification refers to designing systems, services, organizations, and activities to create
similar experiences and motivations to those experienced when playing games with the
added educational goal of affecting user behaviour [9]. Studies have shown that gamification applies to many academic library services like library instruction, a compulsory
course offered by all fresh students in institutions of higher learning. Gamification helps
to improve skills needed in effective searching from various databases and exploring
independently [11]. Since there are too many things contending for the attention of
academic community members leading to information overload, the implementation
of gamification in e-library services makes learning more exciting and engaging [12].
Gamification makes boring activities more interesting, thereby bringing about fun and
enjoyment, making learning more enjoyable.
Most libraries have successfully moved their orientation program to online services
using game elements. Some of these elements, sometimes described as components, are
seen in most games nowadays, including Points scoring, leaderboards, levels, badges,
prizes, and feedback [13]. Gamification is also used in orientation services to create
awareness of e-library resources and services for first-year students [14]. The study
showed that gamification was used in e- welcoming orientation activities and made
positive connections with new students [15–17]. The Inclusion of Gamification into
the academic library could prepare the users for academic work and entrepreneurship
[18]. Studies have revealed that gamification increases learners’ attention, motivation,
engagement, performance, satisfaction, and knowledge retention [19−22]. Gamification
could break procrastination habits and reinforce consistency in attaining attainable goals
[23].
2.3 Gamification in e-library Services
Januszak and Koorie [7], in their survey at Leigh University, there was low attendance
of library users based on a lack of awareness of the resources in the library. So, they
decided to gamify the library orientation for first-year students, structured their courses in
Moodle, and incentivized Moodle with lots of prizes, gifts, and digital badges. After the
gamified orientation, the statistics showed that 1311 students collected badges, and the
outcome was encouraging as the participants were enthusiastic. Since then, they accessed
the resources in the library without imposition. Also, in State University Library, New
York Buffalo, the librarians used a Photo-based Scavenger hunt called Goose Chase.
For library tours of their new students. The librarian shared iPads among the students,
which they used for the library instruction course. At the end of the library instruction
726
F. O. Adedokun et al.
course, the students have high engagement in learning and develop collaboration among
themselves [6].
3 Methodology
The study will adopt the following methodology to explore articles regarding elements
of gamification in relation to e-library services in higher education.
3.1 Research Design
The study adopted four-phase systematic review approach. Firstly, relevant articles were
methodically acknowledged, after which the researchers grouped them. Thirdly, inclusion and exclusion activities took place in the third phase. Lastly, the relevant papers were
examined using the research background - gamification elements in e-library services.
The following subsections give details of the review process.
3.2 Database Search
The researchers searched Scopus, a reputable academic database, for the related literature
from the identified research topic. The first keywords used to search in the database
were gamification AND librar*, giving the results of 487. To narrow down the search,
gamification AND digital librar* were used, which best described our research topic.
We found one hundred thirty-eight (138) articles, conference papers, and review papers,
excluding book chapters and book series. Figure 1 below illustrates our search process
following the PRISMA Model [24].
Fig. 1. The literature search process
Gamification Elements in E-Library Services in Higher Education
727
3.3 Selection Criteria
The researchers checked abstracts to analyze and purify the articles in the review process, ensuring published academic literature quality and relevance. We only selected
those articles written in the English Language while excluding the non-English Language articles. It spanned through 2013–2021. Forty-one (41) articles were assessed for
eligibility. While going through the abstract, 12 full articles were finally excluded for
not having information regarding the gaming elements that were relevant for the study.
Therefore, the researchers eventually used twenty-nine (29) papers,
3.4 Data Extraction
Data from the selected studies were extracted and transferred into the worksheet planned
for the evaluation. Articles and review papers with gamification elements in e-library
services were brought together, while conference papers in e-library services were also
grouped.
4 Results and Discussion
This section highlights the result and the discussion that the researchers generated from
the papers under review.
4.1 Results
This section discussed the results emanated from the reviewed papers. The researchers
grouped the results into statistical and literature classification. The distribution of the
reviewed articles is of the following publication types: thirteen (13) journal articles,
fifteen (15) conference papers, and one (1) reviewed paper. Under the statistical analysis,
the researchers provided two charts to show the graphical representation of the reviewed
documents, and one table was provided to illustrate various game elements used in
gamifying e-library services. Lastly, the literature classification discussed in detail the
results of the study.
Fig. 2. Number of publications against the indicated years.
728
F. O. Adedokun et al.
Figure 2 shows the years that the review covered. It also shows that 2019 has the
highest publication in gamification in academic libraries, followed by 2020. While 2016
and 2015 have average publications compared to those years.
Table 1. Game elements used in e-library services and their outcomes
S/No. Game elements
Outcomes
1
Feedback
It was used in library instruction, and students felt a sense of
accomplishment when achieving a task [25–29]
2
Badges
Students could earn badges for completing specific tasks, such as
learning how to use an online document delivery service [7, 11,
30, 31]
3
Teamwork
It was used in library orientation service and library instruction.
Teamwork has been proven effective at engaging students in the
learning process and helping students to retain information [7, 14]
4
Reward
It increased engagements among the students [25, 27, 32−36]
5
Avatar
It increased students’ awareness and collaboration [32]
6
Leaderboard
Information retrieval service was gamified. Leaderboards produce
user activity focused on the top-ranking members, with 97% of an
action directed to the top 4 positions [11, 37, 38]
7
Challenge
It increased users’ awareness of the library [32]
8
Not-specified
It increased users searching skills on various library databases [39,
40]
9
Competition
It increased students’ enthusiasm. Students were engaged and
involved in the process [38]
10
Storytelling
It helped the students to remain engaged in the game [11, 41]
11
Achievement
The Library web application service was gamified for better
engagement [30]
12
Quest,
Students were encouraged to access the library and therefore
increased students’ engagement [27]
13
Point
Students could earn points for completing specific tasks, and users
were given the opportunity of interacting with the website to
enhance knowledge [11, 20, 28, 30−33]
14
Prizes
They are used to gamify library orientation services [7, 38, 42]
15
Fun
It improved students’ searching skills [14]
16
Time out
It improved students’ searching skills [14]
17
Flow enhancement The students were immersed in the game [43]
18
Immersion
Students were enthusiastic about accomplishing a task [43]
19
Progression
They were deeply engaged in the game [43]
Gamification Elements in E-Library Services in Higher Education
729
Fig. 3. Game elements in the reviewed papers
Figure 3 shows that reward, points, feedback and badges topped the game elements
used in the reviewed works, followed by leaderboard and prizes with equivalent grades.
The above result indicated that users are enjoying playing games based on the external
reward.
4.2 Discussion
In this systematic literature review, we have investigated and reviewed the gamification
elements in e-library services. Kaneko et al. [20] designed a motivational model called
ARCS, consisting of four components that would motivate the learner throughout the
process (attention, relevance, confidence, and satisfaction). It is deduced from Kaneko
that the model itself must be motivational. That is, it must bring fun and enjoyment [11].
For better engagement, a librarian teaching the pharmacy students used competition
mode. After each question, a live leaderboard was configured to show fictitious names
to maintain user anonymity [38]. At the end, prizes like free food, coffee, library branded
promotional items were shared for the participants. At the same time, the game-winner
was awarded a grand prize. It indicated that the librarian motivated the learners with the
prizes and the other gifts. When the trivia game ended, the student found the game fun
and engaging. Many of the students cited the competitiveness of the ranking and prizes
as being incentivized [38].
Most of the scholars in the reviewed work believed in “Hands-On” [14, 20, 29, 44].
Hands-on is when the user is fully involved in the game, which makes the users have
the mastery of the subject and actively participate in the game. According to Adams
et al. [45], hands-on was used to assess students’ nurses’ skills when there was a lack
of engagement and a passive learning approach. A survey indicated that they the students were immersed in the gaming activity and full of a high level of confidence [45].
For students to get engaged with the instructional content, game-based learning can also
motivate learners with fun and excitement [46, 47]. The game elements were categorized
730
F. O. Adedokun et al.
into seven (immersion, support for different roles, flow enhancement, visual enhancement, support for different learning stages and experience levels, design for interactivity,
and progress [43].
According to Brown [48], in his survey outside library and information studies,
observed that they used measures of learning achievement, self-efficacy, and motivation.
And he also stressed that LIS professionals should borrow these variables from them.
The essence is to make a case that gamification improves learning and promotes library
services. Some scholars believe that one primary tool in Gamification is the reward.
They divided the reward into four; the reward of glory, the reward of access, the reward
of a facility, and the reward of sustenance [49, 50]. They described the reward of glory
as having no impact on the gameplay itself but providing the player with status or
achievement like leaderboards for high scores or trophies for achievements. A reward
of sustenance permits the player to maintain their status quo and keep objects acquired
until that point. Such as health packs, portions, and armour. The reward of access allows
players to access new places or resources not previously available to them, like keys,
passwords, or unique weapons. And the reward of the facility enables the player to do
things they could not do once or enhance existing abilities [49, 50].
Some scholars supported teamwork as a tool that can generate motivation. Since
playing the game alone can be tedious and cannot bring out the best in them. Gamification
is about reaching a goal in a fun way and bringing internal satisfaction.
5 Conclusion
This study explored the numerous game elements gamification elements used in the
delivery of e-library services. These are rewards, feedback, points, badges, leaderboards,
prizes, storytelling, avatar, progression, immersion, flow enhancement, fun, achievement, competition, challenges, quest teamwork and others that could not be specified.
The reviewed works showed that game elements like rewards, points, feedback, badges,
leaderboard, and prizes are significant elements used in e-library services in higher education. Therefore, from the analysis above, gamification improves learning, increases
usage of e-resources, and promotes library services. This study will guide the library
management in providing necessary facilities that will aid the successful implementation
of game elements in e-library services. It will also enhance the awareness of e-library services among library users. Therefore, future works should investigate the use of various
apps in gamifying e-library services.
References
1. Perdana, I.A., Prasojo, L.D.: Digital Library Practice in University: advantages, challenges,
and its position. In: International Conference on Educational Research and Innovation (ICERI
2019), pp. 44–48 (2020)
2. Ozohue, C.E., Yaya, J.A.: Provision of current awareness services and selective dissemination
of information by medical librarians in technological era. Am. J. Inf. Sci. Comput. Eng. 2(2),
8–14 (2016)
3. Unegbu, V., Otuza, C.E.: Use of Library and Information Resources: Library Use Education.
Emaphine Reprographic Ltd, Lagos (2015)
Gamification Elements in E-Library Services in Higher Education
731
4. Dahiru, S., Adamu, R.: Integration of e-Library Services and e-Learning Platforms: A New
Approach to University Education in Digital Era, pp. 297–311. Ahmadu Bello University
Press, Zaria (2021)
5. Bizi, M.K.: Exploring E-Library challenges in the North East of Nigeria Tertiary Institutions
Library. Int. J. Sci. Eng. Appl. Sci. 7(1), 137–145 (2021)
6. Foley, M., Bertel, K.: Hands-on instruction: the iPad self-guided library tour. Ref. Serv. Rev.
43(2), 309–318 (2015). https://doi.org/10.1108/RSR-07-2014-0021
7. Januszak, A., Koorie, C.: Designing and deploying a virtual IT services orientation for firstyear undergraduate students in Moodle. In: Proceedings of the 2018 ACM SIGUCCS Annual
Conference, pp. 87–89 (2018)
8. Deterding, S., Dixon D., Khaled, R., Nacke, L.: From game design elements to gamefulness:
defining gamification. In: Proceedings of the 15th International Academic MindTrek Conference: Envisioning Future Media Environments, MindTrek 2011, pp. 9–15 (2011). https://doi.
org/10.1145/2181037.2181040
9. Dichev, C., Dicheva, D.: Gamifying education: what is known, what is believed and what
remains uncertain: a critical review. Int. J. Educ. Technol. Higher Educ. 14(1), 1–36 (2017)
10. Omeluzor, S.U., Akibu, A.A., Dika, S.I., Ukangwa, C.C.: Methods, effect and challenges of
library instruction in academic libraries. Libr. Philos. Pract. 1465 (2017)
11. Brigham, T.J.: An introduction to gamification: adding game elements for engagement. Med.
Ref. Serv. Q. 34(4), 471–480 (2015). https://doi.org/10.1080/02763869.2015.1082385
12. Regalado, F., Costa, L.V., Veloso, A.I.: Online news and gamification habits in late adulthood:
a Survey. In: Gao, Q., Zhou, J. (eds.) HCII 2021. LNCS, vol. 12786, pp. 405–419. Springer,
Cham (2021). https://doi.org/10.1007/978-3-030-78108-8_30
13. Mohamad, S.N., Sazali, M.N.S.S., Salleh, M.A.M.: Gamification approach in education to
increase learning engagement. Int. J. Humanity Arts Soc. Sci. 4(1), 22–32 (2018)
14. Veach, C.C.: Breaking out to break through: re-imagining first-year orientations. Ref. Serv.
Rev. 47(4), 556–569 (2019). https://doi.org/10.1108/RSR-06-2019-0039
15. Wise, H., Lowe, J., Hill, A., Barnett, L., Barton, C.: Escape the welcome cliché: designing
educational escape rooms to enhance students’ learning experience. J. Inf. Lit. 12(1), 86–96
(2018)
16. Vrbancic, E.K., Byerley, S.L.: High-touch, low-tech: investigating the value of an in-person
library orientation game. Coll. Undergrad. Libr. 25(1), 39–51 (2018). https://doi.org/10.1080/
10691316.2017.1318429
17. Hottinger, P.R., Zagami-Lopez, N.M., Bryndzia, A.S.: FYI for FYE: 20-minute instruction
for library orientation. Ref. Serv. Rev. 43, 468–479 (2015)
18. Walsh, A.: The potential for using gamification in academic libraries in order to increase
student engagement and achievement. Nord. J. Inf. Lit. High. Educ. 6(1), 39–51 (2014).
https://doi.org/10.15845/noril.v6i1.214
19. Alsawaier, R.S.: The effect of gamification on motivation and engagement. Int. J. Inf. Learn.
Technol. 35(1), 56–79 (2018). https://doi.org/10.1108/IJILT-02-2017-0009
20. Kaneko, K., Saito, Y., Nohara, Y., Kudo, E., Yamada, M.A.: A game-based learning environment using the ARCS model at a university library. In: 2015 IIAI 4th International Congress
on Advanced Applied Informatics, pp. 403–408 (2015)
21. Subhash, S., Cudney, A.: Gamified learning in higher education: a systematic review of the
literature. Comput. Human Behav. 87, 192–206 (2018)
22. Woolwine, S., Romp, C.R., Jackson, B.: Game on: evaluating the impact of gamification
in nursing orientation on motivation and knowledge retention. J. Nurses Prof. Dev. 35(5),
255–260 (2019)
23. Bohyun, K.: Gamification in education and libraries. Libr. Technol. Rep. 51(2), 20–
28 (2015). http://search.ebscohost.com/login.aspx?direct=true&db=a9h&AN=101029551&
lang=fr&site=ehost-live%0Afiles/498/2015
732
F. O. Adedokun et al.
24. Page, M.J., et al.: The PRISMA 2020 statement: an updated guideline for reporting systematic
reviews. BMJ 372, 71 (2021)
25. Kaneko, K., Saito, Y., Nohara, Y., Kudo, E., Yamada, M.: A game-based learning environment
using the ARCS model at a university library. In: Proceedings - 2015 IIAI 4th International
Congress on Advanced Applied Informatics, IIAI-AAI 2015, pp. 403–408 (2016). https://doi.
org/10.1109/IIAI-AAI.2015.285
26. Prandi, C., et al.: Gamifying cultural experiences across the urban environment. Multimedia
Tools Appl. 78(3), 3341–3364 (2018). https://doi.org/10.1007/s11042-018-6513-4
27. Bălutoiu, M.A., et al.: Libquest - revitalize libraries and reading through gamification. In:
eLearning and Software for Education Conference, pp. 173–180 (2019). https://doi.org/10.
12753/2066-026X-19-023
28. Colasanti, N., Fiori, V., Frondizi, R.: Promoting knowledge circulation in public libraries: the
role of gamification. Libr. Manage. 41(8/9), 669–676 (2020). https://doi.org/10.1108/LM-042020-0064
29. Shannon, C.: Engaging students in searching the literature. Med. Ref. Serv. Q. 38(4), 326–338
(2019). https://doi.org/10.1080/02763869.2019.1657726
30. Laubersheime, J., Ryan, D., Champaign, J.: InfoSkills2Go: using badges and gamification to
teach information literacy skills and concepts to college-bound high school students”. J. Libr.
Adm. 56(8), 924–938 (2016)
31. Barr, M., Hopfgartner, F., Munro, K.: Increasing Engagement with the Library via Gamification Graduate Skills and Game-Based Learning View project News Recommendation
Evaluation View project Increasing Engagement with the Library via Gamification (2016).
http://ceur-ws.org
32. Raflesia, P.S., Surendro, K.: Designing gamified service towards user engagement and service
quality improvement. In: 1st International Conference on Wireless and Telematics, pp. 1–4
(2015)
33. Shannon, C.: Engaging students in searching the literature. Med. Ref. Serv. Q. 38(4), 326–338
(2019)
34. Bilandzic, M., Johnson, D.: Hybrid placemaking in the library: designing digital technology
to enhance users’ on-site experience. Aust. Libr. J. 62(4), 258–271 (2013). https://doi.org/10.
1080/00049670.2013.845073
35. Colasanti, N., Fiori, V., Frondizi, R.: Promoting knowledge circulation in public libraries: the
role of gamification. Libr. Manage. 41(8–9), 669–676 (2020). https://doi.org/10.1108/LM04-2020-0064
36. Honeyman, D., Walker, D.: Evolving customer engagement: Using mobile technology and
gamification to improve awareness of and access to library services. (2015). https://www.res
earchgate.net/publication/310771185
37. Biasini, M., Carmignani, V., Ferro, N., Filianos, P., Maistro, M., Nunzio, G.M.D.: FullBrain:
a Social E-learning Platform. In: IRCDL, pp. 25–41 (2021)
38. Jones, E.P., Wisniewski, C.S.: Gamification of a mobile applications lecture in a pharmacy
course. Med. Ref. Serv. Q. 38(4), 339–346 (2019). https://doi.org/10.1080/02763869.2019.
1657728
39. Bigdeli, Z., Haidari, G., Haji, A., Yakhchali, R., Jahromi, B.: Gamification in library websites
based on motivational theories. Webology 13(1), 1–12 (2016)
40. Prince, J.D.: Gamification. J. Electron. Resour. Med. Libr. 10(3), 162–169 (2013). https://doi.
org/10.1080/15424065.2013.820539
41. Clarke, S., Collins, B., Flynn, D., Arnab, S.: Gamifying the university library: using RPG
maker to re-design library induction and online services. Proc. Eur. Conf. e-Learning ECEL
2018, 721–725 (2018)
Gamification Elements in E-Library Services in Higher Education
733
42. Honeyman, D., Walker, D.: Evolving customer engagement: using mobile technology and
gamification to improve awareness of and access to library services. In: THETA 2015 At Gold
Coast Convention and Exhibition Centre, Broadbeach, Gold Coast, Queensland, Australia
(2015)
43. Schulz, R., Martinez, S., Hara, T.: Towards a game-design framework for evidence-based
clinical procedure libraries. In: 2019 IEEE 7th International Conference on Serious Games
and Applications for Health SeGAH 2019, no. November, pp. 1–8, (2019).https://doi.org/10.
1109/SeGAH.2019.8882474
44. Brigham, T.J.: An introduction to gamification: adding game elements for engagement. Med.
Ref. Serv. Q. 34(4), 471–480 (2015)
45. Adams, V., Burger, S., Crawford, K., Setter, R.: Can you escape? Creating an escape room to
facilitate active learning. J. Nurses Prof. Dev. 34(2), E1–E5 (2018)
46. Smale, M.A.: Learning through quests and contests: Games in information literacy instruction.
J. Lib. Innov. 2, 36–55 (2011)
47. Strickland, H.P., Kaylor, S.K.: Bringing you a-game: Educational gaming for student success.
Nurse Educ. Today 40, 101–103 (2016)
48. Brown, R.T.: A literature review of how videogames are assessed in library and information
science and beyond. J. Acad. Librariansh. 40(5), 447–451 (2014)
49. Hallford, N., Hallford, J.: Swords and Circuitry: A Designer’s Guide to Computer RolePlaying Games. Prima Publishing, Roseville (2001)
50. Salen, K., Zimmerman, E.: Rule of Play Game Design Fundamentals. MIT Press, Cambridge
(2004)
Health Informatics
Bayesian Model for Detecting Influence
Directionality of Heart Related Diseases
with Application in Multimorbidity
Understanding
Faouzi Marzouki(B)
and Omar Bouattane
Laboratory of SSDIA, ENSET Mohammedia, Hassan II University of Casablanca, Casablanca,
Morocco
faouzi8marzouki@gmail.com, o.bouattane@enset-media.ac.ma
Abstract. Multimorbidity is the existence of two or more than two diseases in
the same patient at the same time. It is a major problem in the modern healthcare
system and several studies have pointed out the association between the burden
of multimorbidity and poor quality of life. It is quite intuitive to represent multimobid diseases as a weighted graph. We define comorbidity pattern detection of
valvular heart diseases in a machine learning framework. We aim to investigate
the directionality influence between comorbid valvular heart diseases by algorithmically extract this structural knowledge from real medical data. We investigate
the performance of four well-known Bayesian network algorithms by comparative
analysis methodology. First, we build a comparative baseline based on association strength estimation of all pairs of studied diseases. Then the four algorithms
outcomes are compared against the baseline algorithm, and against each other.
The results suggest that score based methods outcomes are the closest to baseline
algorithm. Besides, Tabu search and Hill climbing algorithms with AIC criterion
as objective function, are the most performing in terms of log-likelihood loss.
Despite differences in algorithm directionality outcomes, it seems that the used
approaches are comparable for learning graph skeleton.
Keywords: Multimorbidity · Comorbidity · Data science · Machine learning ·
Valvulopathy
1 Introduction
Researches in epidemiology indicate the high risk and prevalence of having multiple
health conditions at the same time as age increases. Multimorbidity, i.e. the presence
of two or more diseases in the same patient at the same time [1], is a significant health
problem in modern medicine. There are several risk factors implicated in the development
of Multimorbidity: environmental, genetic predisposition, lifestyle, the process of aging,
pathophysiological process nature of the disease. These highly inter-related conditions
make a further burden on patients in terms of polypharmacy and difficulties in their
informal careers [2], which reduces considerably their quality of life.
© The Author(s), under exclusive license to Springer Nature Switzerland AG 2022
F. Saeed et al. (Eds.): IRICT 2021, LNDECT 127, pp. 737–747, 2022.
https://doi.org/10.1007/978-3-030-98741-1_62
738
F. Marzouki and O. Bouattane
Unfortunately, health systems are still designed in a single disease paradigm rather
than Multimorbidity. However, the transition from disease-centered care, to patientcentered care is ongoing [1]. In medical literature, several approaches were proposed to
explore facets of Multimorbidity: statistical techniques (descriptive statistics, regression)
and data analysis (segmentation and regressions) [3–5], probabilistic graphical models
[6–8], network analysis based models [9, 10], machine learning based methods [11, 12].
Despite the important work done in literature, the Multimorbidity remains a challenging
problem due to the multifactorial complexity aspects of this phenomenon. Recently,
initiatives to exploit Big data techniques and the increasing amount of electronic health
care data [13] to get insight about this phenomena.
Typically, data scientists find the right data, clean it up, transform it into the suitable
format, and apply models and algorithms to extract the targeted knowledge from the
original unstructured raw data. See Fig. 1. In this perspective, we contribute in exploring the use data science methods and machine learning techniques for multimorbidity
modeling. We give a formal algorithm of the process of extracting Comorbidity Disease Network from real medical data. Then, we investigate the influence directionality
between nodes/diseases in this network using Bayesian network learning algorithms.
Fig. 1. General methodology for data science followed in this work.
When applying machine learning algorithms, the suitability of particular techniques
for a particular domain of application is important to consider. Since these techniques are
based on different concepts and assumptions, it is necessary to perform a comparative
analysis in order to select the suitable model, according to that domain of interest. In this
paper, we focus our study on analyzing structure and influence directionality of some
valvular heart disease related diseases.
We organize this work in two phases. First, we implement a pairwise based approach
to construct a comorbidity model as a weighted graph of a Comorbidity Disease Network
(CDN). The edge weights are calculated using Multimorbidity Coefficient (MC) as association strength between two comorbid diseases. Then we compare the resulting CDN
structure skeleton to outcomes of some well-known Bayesian network structure learning
algorithms. Second, we execute these Bayesian network model learning algorithms to
extract the dependence directionality of edges over nodes/diseases in the obtained graph
skeleton.
Bayesian Model for Detecting Influence Directionality
739
The remainder of this paper is organized as follows: in Sect. 2 we review some related
works to the multimorbidity modeling. Section 3 is devoted to data and methods used
in this work. We present results in Sect. 4 before we conclude in Sect. 5.
2 Related Works
Recently, a growing number of studies have been conducted in the medical literature to
address the burden of multimorbidity, examine risk factors for multimorbidity, its impact
on quality of life, mortality, or the costs and utility of care medical [14]. Technically,
the models and methods used differ either in data (cross-sectional or longitudinal) or
whether the objective is to explain, explore, or predict.
Combinations of traditional data analysis and machine learning were proposed as
promising multimorbidity research methods. The authors in [15] applied classification/regression trees and random forest to data of elderly patients to identify how the
specific combinations of chronic conditions, functional limitations, and geriatric syndromes affect costs and inpatient utilization. In [16], the authors applied the k-means
algorithm to a cross-sectional study using digital records of patients, aged between 45 and
64 years, to distinguish population groups from others. In [17], the author added fuzziness to k-means algorithm to create clusters of patients and their membership matrix.
This later indicates the membership degree of a patient to a given cluster.
Other approaches used network science tools to draw insights about comorbidity
disease networks. Hernández et al. [18] applied network analysis and association rules
to study comorbidity patterns of some diseases in 6101 Irish adults aged >50 years. They
perform Louvain algorithm to detect communities of diseases from the disease network.
Standardized lift and confidence scores of the association rules was put as probabilistic
measuring of how conditionally the diseases are related. In the study of [19], logistic
regression models, adjusted by age and sex and odd ratio, were used to estimate the
multimorbidity networks.
The aforementioned studies tried to construct weighted graphs based on the idea
of association strength between diseases. Other approaches in the literature focused
on the dependency idea under a probabilistic framework. For example Lappenschaar
et al. [20] proposed a probabilistic framework to model these concepts using a causal
Bayesian network. This model was extended with a time dimension in [12]. These authors
proposed in [8] a Bayesian network structure learning method for modeling the risk
factors interactions explaining co-occurrences of malignant tumors in the oncological
domain.
In this work, we define comorbid valvular heart diseases pattern extraction in
a machine learning framework. We investigate the performance of four well-known
Bayesian network algorithms by comparative analysis methodology. First, we build a
comparative baseline based on association strength estimation of all pairs of studied diseases. Then the four algorithms outcomes are compared against the baseline algorithm,
and against each other.
740
F. Marzouki and O. Bouattane
3 Data and Methods
3.1 Problem Setting
Let D = {d1 , d2 , … , d|D| } a finite set containing |D| number of diseases present in
medical dataset, such that |S| denotes the number of elements of a given set S. Let
X = {X1 , X2 , … , X|X| } the set of all observations of patients such that: Xi = (x1,i ,
x2,i , … , x|Xi|,i ) with xj,i ∈ D a tuple of observed diagnoses for the patient i. We assume
that data X are governed by the same underlying Multimorbidity Mechanism, and X are
independent and identically distributed (i.i.d) samples.
Let R consists of a binary relation over Cartesian product set D × D. Two diseases
d1 and d2 are related with the relation R if and only if they satisfy a predefined condition
of interest. This relation R is usually estimated by a metric to measure its strength. In
this work, we define the binary relation R using two concepts: association strength and
dependence/independence concepts.
Association Strength Definition. Let d1 and d2 be two binary random variables for
occurrence/absence of diseases 1 and 2 respectively. Let P(di ) stands for the occurrence
probability of the disease di ∈ D. We use Van Den Akker et al.’s definition of cluster
comorbidity [21]: if d1 has occurred, then d2 will be more likely to occur than what
would be expected just by chance.
We consider that d1 and d2 are in positive comorbidity, if P(d1 , d2 ) > P(d1 )P(d2 ). If
P(d1 )P(d2 ) ≈ P(d1 , d2 ) we consider that the two diseases are in random co-occurence.
The final case P(d1 , d2 ) < P(d1 )P(d2 ) can be interpreted as d1 and d2 are in protective
comorbidity (e.g. myopia may be protective against diabetic retinopathy [22]).
To measure how strongly disorders are linked, a Multimorbidity Coefficient (MC) is
calculated. MC is a commonly used method for measuring pairwise association in medical research on multimorbidity [23]. MC is defined as the division of the observed rate
of comorbidity (multimorbidity) by the rate which is expected under the null hypothesis
of no association between the separate disorders. See table below.
Disease 1
Disease 2
Occurrence Absence
a
b
b
d
a+c
b+d
Occurrence
Absence
Total
Total
a+b
c+d
a+b+c+d=N
Taking into account the notation of table above, the Multimorbidity Coefficient (MC)
score for Disease 1 and Disease 2 is as follows:
MC =
a
N
a+c
N
∗
a+b
N
=
aN
(a + c) ∗ (a + b)
(1)
We use this pairwise approach to learn the weighted structure of CDN (See Algorithm
1). We will consider this pairwise approach as baseline to be compared to Bayesian
network structure learning algorithms.
Bayesian Model for Detecting Influence Directionality
741
Dependence/Independence Definition. Another possible approach to model the structure of CDN is to measure how diseases are linked in term of dependences/independences
rather than the association strength idea. This is can be done using several methods
in Bayesian network literature, which we can be divided into score based methods,
constraint based methods, and hybrid methods.
Let us consider the graph G = (V, E), such that V is the set of nodes (diseases), E
is the set of edges (association between diseases). To be able to use Bayesian dependence/independence concept to learn structure and directionality of CDN, we add the
two hypotheses below:
• G = (V, E) is a directed acyclic graph, in which vertices V are described by: X =
{Xv |v ∈ V} the set of binary random variables indexed by v.
• a joint probability distribution P(X) over X.
The tuple (G, X, P) is a Bayesian network, a graphical model where nodes represent random variables of the presence of diseases (we will use these two terms interchangeably),
and arcs models probabilistic dependencies between them. The joint probability P can
be factorized into smaller local probability distributions, as a product of the probability
of each random variable, conditional on their parent variable:
(2)
P(x1 , x2 , . . . ., xn ) = i∈V p xi |xj ∀j ∈ Parent(i)
The diversity of possible techniques to learn the structure and the influence directionality
of the CDN makes the choice of the suitable technique of the particular domain of
Multimorbidity unclear. Therefore, we will conduct a comparative analysis between the
approaches and techniques discussed in this section. The comparison will be against
a set of diseases that exhibit a causal relationship. By this special methodology, we
construct a ground truth to compare these techniques with each other. In this work we
study the following algorithms: Incremental Association Markov Blanket (IAMB) and
Grow Shrink for constraint based algorithms, Tabu search and Hill Climbing for score
based approaches, Min Max Hill Climbing and (mmhc) rsmax2 for hybrid approaches.
3.2 Building Comorbidity Disease Network Algorithm
In this section we define the pairwise methodology for building Comorbidity Disease
Network. Let Ndiag denote number of diagnoses and Ndis number of diseases presented
in the dataset, N the number of diseases. Let D = {d1 , d2 , d3 , ..., dNdis } disease set.
Mk ⊂ D such that k > 1, is the subset of size k diseases from D. (e.g. M2 is the
subset of possible co-morbidities, M3 represent the subset of possible tri-morbidities an
so forth). Let f : I ⊂ N → {D1 , D2 , ..., DNdiag } ⊂ P(D) be an application that maps
<i>
<i>
every patient i to its recorded diagnoses {x<i>
1 , x2 , ..., xNdiag }.
n!
potential combinations of comorbidity and estiAlgorithm 1 searches for (n−2)!2!
mates MC for each combination using MC definition presented in Sect. 3.1. this algorithm
is easily generalizable to Multimorbidity. If the MC is higher than 1 then we consider
that these two diseases are in comorbidity, and these two diseases are linked by an edge
742
F. Marzouki and O. Bouattane
whose weight is equal to MC. If the MC is less than 1 then we say that these two diagnoses
are in protective comorbidity. The bigger this number is, the stronger the association is
considered. We are interested in this work by positive comorbidity.
3.3 Data
The analysis was applied in a case study of a real medical dataset [24]. Each patient
has a recorded diagnosis recorded by a unique distinct ICD 10 Code. The data contain
78451 patients (34639 males, and 43812 females). The maximum number of registered
diagnoses per admission is 20. We choose a valvulopathy related set of diseases on which
to apply Algorithm 1. This group consists of the following node diseases: Non-rheumatic
mitral and tricuspid and aortic (valve) insufficiency (coded respectively in ICD10 as
I34.0 and I36.1 and I35.1). Non-rheumatic aortic (valve) stenosis (I35.0). Rheumatic
tricuspid insufficiency (I07.1). Rheumatic disorders of both mitral and tricuspid valves
(I08.1). Combined rheumatic disorders of mitral, aortic and tri-cuspid valves (I08.3).
Other pulmonary hypertension (I27.2). Other ill-defined heart diseases (I51.89). Several
Bayesian Model for Detecting Influence Directionality
743
studies reveal causal relationships among these diseases [25, 26]. This is one of the
reasons we choose these diseases for the comparative analysis.
3.4 Evaluation Metrics
Metrics. The learned models quality is compared based on Akaike’s Information Criteria (AIC) and Bayesian Information Criteria (BIC). AIC and BIC are both penalizedlikelihood criteria. BIC estimates the posterior probability of a model being true, assuming a Bayesian perspective, so that a lower BIC means that a model is considered more
likely to be the true model. AIC, which is based on Kullback-Leiber information loss,
estimates a constant plus the relative distance between the unknown true likelihood function of the data and the fitted likelihood function of the model, that is, a lower AIC means
a model is closer to the truth-model.
(3)
AIC = −2log Likelihood ∗ + 2k
BIC = −2log Likelihood ∗ + log(n)k
(4)
Where * is estimated parameters for value and k corresponds to the number of
estimated model parameters, n is the number of observations. Unlike the AIC, the BIC
penalizes the model more in term of complexity, i.e. that more complex models in terms
of parameters n, will be less likely to be selected.
Bayesian Network Structures Comparison. Structural Hamming Distance (SHD) is
a metric widely used to quantify similarities and differences between Bayesian networks.
SHD counts missing, additional and reversed arcs of the learned network compared to a
reference network. To omit the directionality of arcs, either because are less important
than the association between two variables or because of feedback relation, one can use
SHD on Bayesian network without directionality: it ignores arc directions and compares
the skeletons of the two networks.
4 Results and Discussion
We applied Algorithm 1 to the valvular heart diseases defined in Sect. 3.3, the weighted
graph in Fig. 2 and Table 1 show the results of detected comorbidity disease network
for males in older adulthood (>65 years). The thickness of edges reflects visually the
differences of calculated MC weight on pairs of diseases. The absence of edges means
either the association is random or not significant (the null hypothesis was not rejected
at risk 0.01) or both, according to our data of application. Figure 2 shows for example
that Non rheumatic tricuspid insufficiency (I36.1) co-occurs with non-rheumatic mitral
insufficiency (I34.0) 20.8 times more than what would be expected just by chance. This
high score can reflect a potential causal relationship, which can be due to functional
abnormalities in heart functioning.
To detect potential influence directionality, we compared Bayesian network learning
algorithms mentioned in Sect. 3.1 to select the best performing. We performed 10-fold
744
F. Marzouki and O. Bouattane
Fig. 2. Example of co-occurrence structure of some ICD 10 codded diseases for males in older
adulthood (>65 years). The thickness of edges reflects the strength of MC score for pairs of
diseases (see Table 1). This is the skeleton of the studied graph. For example, non rheumatic
aortic stenosis (I35.0) co-occurs with non-rheumatic mitral insufficiency (I34.0) 3.17 times more
than what would be expected just by chance. In this figure the disease codes are abbreviated. See
Sect. 3.3 for more details.
Table 1. MC scores computed by Algorithm 1 (Sect. 3.2) for the structure of co-occurrence of
Fig. 1. Since the built graph is undirected, the weight matrix is symmetric. Empty cases means
that either the MC score is equal to one, or the null hypothesis is not rejected, or both.
I27.2
I34.0
I35.0
I35.1
I36.1
I51.89
I07.1
I08.1
I08.3
I27.2
I34.0
I35.0
I35.1
I36.1
I51.89
I07.1
I08.1
7.70
4.54
19.07
5.03
14.21
15.07
13.42
3.17
7.97
20.8
9.42
16.13
-
-
-
-
-
-
-
I08.3
cross-validation in which we set the negative expected log-likelihood of the test set for the
Bayesian network fitted from the training set. Lower value is better. We repeated this procedure 100 times and averaged the results. For each algorithm performance, the average
and standard deviation are calculated. Figure 3 suggests that hill climbing and tabu search
algorithms (score based approaches) such that AIC criterion included as penalizing term
of objective function, are the best performing. While constraint based approaches were
the poorer performing algorithms. The presence of outliers may reflect the initialization
and local minima problems. Hybrid algorithms had medium performance.
Further, we set manually two scenarios of the following directions in the skeleton of
Fig. 2: from I34.0 to all its neighboring nodes, and I27.2 to all its neighboring nodes (first
scenario). The second scenario is the reverse directions. These scenarios were the most
performing model according to AIC and BIC. See Table 2. That is among the reasons to
Bayesian Model for Detecting Influence Directionality
745
put it as a baseline for comparison to the studied Bayesian network learning algorithms.
While the Algorithm 1 structure with the first scenario was the most performing in
term of both AIC and BIC, it has comparable performance with other approaches in the
reversed scenario.
While we conducted the comparison analysis, we noticed that constraint based methods (Iamb and grow shrink) failed to decide directions between diseases I27.2, I08.3,
I08.1 in one hand, and between I51.89 to I35.1 in other hand. We set then, the directions
manually, from I27.2 to I08.3, and I08.1, I51.89 to I35.1 which increased the AIC and
BIC scores for the mentioned algorithms.
Fig. 3. Performance comparison between Bayesian network structure learning algorithms.
In consistence with results in Fig. 3, score based approaches had the lowest structural
distance from the network reference in terms of hamming distance. However, still differences in performance according to directionality of arcs. For the reversed scenario (the
second scenario) of directionality, score based approaches are the closest models for the
graph of reference in terms of true positives, followed by hybrid methods. Hill climbing
had the most performance on term of high precision (=0.92) and recall (=1) in reversed
Table 2. Comparison of the Algorithm 1, and some well-known algorithms.
Constraint based
Score based
iamb
Grow
shrink
Hill
climbing
Tabu
search
Mmhc
Rsmax2
4
1
1
3
3
Hamming 4
distance
Hybrid
Algorithm
1
BIC
−8220.19 −8220.19 −8169.61 −8169.61 −8184.07 −8184.07 −8866
AIC
−8124.27 −8124.27 −8066.02 −8066.02 −8107.34 −8107.34 −8221.03
746
F. Marzouki and O. Bouattane
scenario. Furthermore, false negative rate is the lowest among the other methods (=0)
for reversed scenario.
5 Conclusion and Perspectives
In this work we tried to model multimorbidity of diseases as weighted graph such that
weights represent strength between diseases (structure of Comorbidity Network Diseases
measured by Multimorbidity Coefficient) and probability of observing a disease given
another disease (directionality detection). We formulated CND detection as a machine
learning task. We implemented a pairwise based approach to learn CND structure, and
we compared the structure of the obtained graph with some well-known algorithms in
Bayesian network structure learning literature. Further, we investigated the directionality
of arcs using comparative analysis against AIC, BIC and negative expected log likelihood. The results suggest that score based methods outcomes are the closest to pairwise
approaches for CND detection. Besides, Tabu search and Hill climbing algorithms with
AIC criterion as objective function, are the most performing in terms of log-likelihood
loss. Despite differences in algorithm directionality outcomes, it seems that the used
approaches are comparable for learning graph skeleton.
We choose to use of AIC and BIC metrics, as well as Multimorbidity Coefficient
to evaluate and build Comorbidity Disease Network. Therefore, the generalizability of
these results to other empirical data and other metrics is envisaged in perspectives.
References
1. Rijken, M., et al.: How to improve care for people with multimorbidity in Europe? European
Observatory on Health Systems and Policies, Copenhagen (Denmark) (2017)
2. Doyle, J., et al.: Addressing medication management for older people with multimorbidities:
a multi-stakeholder approach. In: Proceedings of the 11th EAI International Conference on
Pervasive Computing Technologies for Healthcare, pp. 78–87. Association for Computing
Machinery, New York (2017)
3. Kirchberger, I., et al.: Patterns of multimorbidity in the aged population. Results from the
KORA-Age study. PLoS One 7, e30556 (2012). https://doi.org/10.1371/journal.pone.003
0556
4. Fortin, M., Hudon, C., Haggerty, J., van den Akker, M., Almirall, J.: Prevalence estimates of
multimorbidity: a comparative study of two sources. BMC Health Serv. Res. 10, 111 (2010).
https://doi.org/10.1186/1472-6963-10-111
5. Elhai, J.D., Calhoun, P.S., Ford, J.D.: Statistical procedures for analyzing mental health
services data. Psychiatry Res. 160, 129–136 (2008)
6. Lappenschaar, M., et al.: Multilevel temporal Bayesian networks can model longitudinal
change in multimorbidity. J. Clin. Epidemiol. 66, 1405–1416 (2013). https://doi.org/10.1016/
j.jclinepi.2013.06.018
7. Lappenschaar, M., Hommersom, A., Lucas, P.J.: Probabilistic causal models of multimorbidity concepts. In: AMIA ... Annual Symposium Proceedings. AMIA Symposium, pp. 475–484
(2012)
8. Lappenschaar, M., Hommersom, A., Lagro, J., Lucas, P.J.F.: Understanding the co-occurrence
of diseases using structure learning. In: Peek, N., Marín Morales, R., Peleg, M. (eds.) AIME
2013. LNCS (LNAI), vol. 7885, pp. 135–144. Springer, Heidelberg (2013). https://doi.org/
10.1007/978-3-642-38326-7_21
Bayesian Model for Detecting Influence Directionality
747
9. Lai, Y.-H., Wang, T.-Y., Yang, H.-H.: Network-based analysis of comorbidities: case study of
diabetes mellitus. In: Wang, L., Uesugi, S., Ting, I.-H., Okuhara, K., Wang, K. (eds.) MISNC
2015. CCIS, vol. 540, pp. 210–222. Springer, Heidelberg (2015). https://doi.org/10.1007/9783-662-48319-0_17
10. Cramer, A.O.J., Waldorp, L.J., van der Maas, H.L.J., Borsboom, D.: Comorbidity: a network
perspective. Behav Brain Sci. 33, 137–150 (2010). https://doi.org/10.1017/S0140525X099
91567
11. Faruqui, S.H.A., Alaeddini, A., Jaramillo, C.A., Potter, J.S., Pugh, M.J.: Mining patterns of
comorbidity evolution in patients with multiple chronic conditions using unsupervised multilevel temporal Bayesian network. PLoS ONE 13, e0199768 (2018). https://doi.org/10.1371/
journal.pone.0199768
12. Guo, M., et al.: Analysis of disease comorbidity patterns in a large-scale China population.
BMC Med. Genomics 12(Suppl 12), 177 (2019)
13. Pastorino, R., et al.: Benefits and challenges of Big Data in healthcare: an overview of the
European initiatives. Eur. J. Pub. Health 29, 23–27 (2019)
14. Vetrano, D.L., et al.: Joint action ADVANTAGE WP4 group: frailty and multimorbidity: a
systematic review and meta-analysis. J. Gerontol. A Biol. Sci. Med. Sci. 74, 659–666 (2019).
https://doi.org/10.1093/gerona/gly110
15. Schiltz, N.K., et al.: Identifying specific combinations of multimorbidity that contribute to
health care resource utilization: an analytic approach. Med. Care 55, 276–284 (2017)
16. Violán, C., et al.: Multimorbidity patterns with K-means nonhierarchical cluster analysis.
BMC Fam. Pract. 19, 108 (2018)
17. Marengoni, A., et al.: Patterns of multimorbidity in a population-based cohort of older people:
sociodemographic, lifestyle, clinical, and functional differences. J. Gerontol. Ser. A 75, 798–
805 (2020). https://doi.org/10.1093/gerona/glz137
18. Hernández, B., Reilly, R.B., Kenny, R.A.: Investigation of multimorbidity and prevalent disease combinations in older Irish adults using network analysis and association rules. Sci Rep.
9, 14567 (2019). https://doi.org/10.1038/s41598-019-51135-7
19. Aguado, A., Moratalla-Navarro, F., López-Simarro, F., Moreno, V.: MorbiNet: multimorbidity
networks in adult general population. Analysis of type 2 diabetes mellitus comorbidity. Sci.
Rep. 10, 2416 (2020). https://doi.org/10.1038/s41598-020-59336-1
20. J.p.: Preface. In: Pearl, J. (ed.) Probabilistic Reasoning in Intelligent Systems, pp. vii–ix.
Morgan Kaufmann, San Francisco (1988)
21. van den Akker, M., Buntinx, F., Metsemakers, J.F., Roos, S., Knottnerus, J.A.: Multimorbidity
in general practice: prevalence, incidence, and determinants of co-occurring chronic and
recurrent diseases. J. Clin. Epidemiol. 51, 367–375 (1998). https://doi.org/10.1016/s08954356(97)00306-5
22. Lim, L.S., Lamoureux, E., Saw, S.M., Tay, W.T., Mitchell, P., Wong, T.Y.: Are myopic eyes
less likely to have diabetic retinopathy? Ophthalmology 117, 524–530 (2010). https://doi.org/
10.1016/j.ophtha.2009.07.044
23. Barabási, A.-L., Gulbahce, N., Loscalzo, J.: Network medicine: a network-based approach to
human disease. Nat. Rev. Genet. 12, 56–68 (2011)
24. Bonis, J.: drbonis/CMBD_MAD_2016 (2019). Accessed 01 July 2021. https://github.com/
drbonis/CMBD_MAD_2016
25. Tichelbäcker, T., et al.: Pulmonary hypertension and valvular heart disease. Herz 44(6), 491–
501 (2019). https://doi.org/10.1007/s00059-019-4823-6
26. Maeder, M.T., Weber, L., Rickli, H.: Pulmonary hypertension in aortic valve stenosis. Trends
Cardiovasc. Med. S1050–1738(20), 30158–30164 (2020)
Data Science for Multimorbidity Modeling: Can
Age and Sex Predict Multimorbidity Burden?
Faouzi Marzouki(B)
and Omar Bouattane
Laboratory of SSDIA, ENSET Mohammedia, Hassan II University of Casablanca, Casablanca,
Morocco
faouzi8marzouki@gmail.com, o.bouattane@enset-media.ac.ma
Abstract. Age and sex are important biological factors that should be taken into
account in each medical phenomenon. With the increasing amount of recorded
data, data science methods became necessary tools for extracting useful knowledge. We propose in this work to investigate the role of age and sex in prediction
of developing multimorbidity. In machine learning perspective, we formulate the
problem of predicting multimorbidity count given a patient profile, and we compare some of regression based models on real data to estimate the significance of
sex and age as predictors of multimorbidity count. Results show, in accordance
with previous medical studies, that age is critical factor in developing multimorbidity, while sex has negligible contribution as predictor for multimorbidity according
to our data of interest. Besides, third polynomial regressor was the best performing
model for predicting averaged multimorbidity for male patients between one and
95 years old.
Keywords: Machine learning · Multimorbidity · Comorbidity · Data science
1 Introduction
Comorbidity is defined as “any distinct additional clinical entity that has existed or that
may occur during the clinical course of a patient who has the index disease under study”
[1]. It is a significant health problem in modern medicine, and the more conditions
are (i.e. Multimorbidity), the more burdens is put on patient and healthcare systems.
Unfortunately, health systems are still designed in a single disease paradigm rather
than Multimorbidity. However, the transition from a disease-centered care, to a patientcentered care is ongoing [2].
In medical literature, several models were proposed to explore Multimorbidity: statistical techniques (descriptive statistics, regression) and data analysis (segmentation and
regressions) [3–5], probabilistic graphical models [6–8], network analysis based models
[9, 10], machine learning based methods [11, 12]. The multiplicity of models reflects
the multi-facets by which we can approach and model multimorbidity. Therefore, studies results in discrepancies in prevalence rates and patterns of multimorbidity, which is
also highly influenced by methodology (population and measures [13], heterogeneity
in multimorbidity definitions and how chronic conditions are classified [14]). Most of
© The Author(s), under exclusive license to Springer Nature Switzerland AG 2022
F. Saeed et al. (Eds.): IRICT 2021, LNDECT 127, pp. 748–758, 2022.
https://doi.org/10.1007/978-3-030-98741-1_63
Data Science for Multimorbidity Modeling
749
the research on multimorbidity starts with modeling disease counts using count data
model techniques and other generalized linear model [15, 16]. For instance, in recent
study [16], researchers used generalized linear model regressions with a log link function and negative binomial distribution to estimate the association of age, gender, and
language with the number of chronic diseases, as well as to predict length of stay per
admission among inpatients in different departments. Several medical studies pointed
out the importance of considering age and sex factors in multimorbidity burden understanding [17–19], which make these variables necessary to be considered in modeling
multimorbidity.
Recently, initiatives to exploit Big data techniques and the increasing amount of
electronic health care data [20] are taken to get an insight into this phenomenon. In
this perspective, we contribute in filling the gap between data science researches and
multimorbidity studies in medical area. We define multimorbidity count prediction using
machine learning terminology; we explain how to make use of this terminology to draw
conclusions about multimorbidity from real data.
Data science methodology consists of four steps in general: Collecting and transforming data of interest in a pertinent format; applying, visualizing and evaluating models.
We focus in this work to model a predictive system that predicts average of diseases
(disease counts) given a patient profile. A patient profile can be any statistical characteristics of a patient: age, gender, socio-demographic specificities and so on. We set a
formal definition of this predictive task and we propose and assess a Meta-algorithm
that searches models that fit data given the patient profile, with a focus in age and sex as
predictor variables (patient profile), and generalized linear models as hypothesis space
explored by the meta algorithm.
The rest of the paper is as follow: in the next section we present the methodology
followed in this work. In Sect. 3 we present obtained results. We finish in Sect. 4 by
main conclusions of our work.
2 Data and Methods
2.1 Problem Setting
In order to understand the potential relationship hidden in our data of interest, between
gender, aging process and multimorbidity, we computed averages of distinct diagnosis
in the data per age for both gender across our studied time period (2016). We put the
research question in a machine learning framework, i.e. we algorithmically build from
data, a functional relation of k-morbidity number (we denote it in the following by
Y<morb> ) as function of sex and age.
Let D = {d1 , d2 , …, d|D| } a finite set of diseases present in medical dataset. X
= {X1 , X2 , …, X|X| } the set of all observations of patients such that Xi = (x(1,i) ,
x(2,i) , … , x(|Xi|,i) ) with xj,i ∈D a tuple of observed health conditions for the patient
i. Let Xv be the subset of patients with profile v (the profile can be any set of medical
or socio-demographic characteristics). Xv = {Xv 1 , Xv 2 , … , X v |X v | } is a finite subset of
X indexed by v. We suppose that X are independent and identically distributed (i.i.d),
i.e. that all samples from the datasets are generated from the same generative law, and
that the generative process is assumed to have no memory of past generated samples. In
750
F. Marzouki and O. Bouattane
other words, in this work we build our analysis on the important assumption that every
patient sample consists of separate cases, and these cases are caused by a same underlying Multimorbidity Mechanism. Finally, we define the dependent variable Y<morb>
distribution as follows:
Y<morb> = average X v
v
X
i
=
for all non negative integer i.
(1)
i<|X v | |X v |
Let f be a statistical model such that Y<morb> = f(X; 8) with parameters, that explains
the observations X. We consider the hypothesis space H = {f | f: X → Y<morb }. Technically, statistical models f are grouped as family of equations and H is framed based
on assumptions underlying the problem of interest. We are interested in algorithmically
building this statistical model. To do so we propose the following meta-algorithm:
Meta-Algorithm1
Input: observations Xv, Y<morb> and hypothesis space H.
Output: a learned statistical model F: Xv Y<morb>.
Begin
1- Observe the random vectors Xv and Y<morb>.
2- For each statistical model candidate h
H,evaluate
its predictive quality with a given quality metric.
3- Select the optimal h*=f.
4- Initialize the set of all predictors vi V (explaining variables) in the model f.
5- Iteratively eliminate non contributive predictors
in explaining the model f outcomes.
6- If the model f has a hyper-parameters k,then finetune k of fk against a given Loss function L(.),
such that fk are the set of selected model f indexed by their hyper-parameters k.
Return F with parameter k=argmax L(fk).
In this work we implemented this meta-algorithm with the following setting. First,
we selected the raw data and we prepared it to be inputted to the algorithm. We precise
the hypothesis space in the next section. The algorithm assesses the predictive quality of
h ∈ H using AIC, and BIC metrics. See Evaluation metrics section. The set of predictors
are initialized by two predictors/profile characteristics v = (a, b) such that gender a ∈
{female, male} and age b ∈ [1, 150] years. The algorithm eliminates non- contributive
predictors by calculating R2 and BIC metrics of all combinations of predictors (age only,
sex only, age and sex in the same time) and selects the optimal combination. Finally,
fine-tuning the hyper parameters will be based on BIC and adjust R2 . Adding more
settings to this meta-algorithm will result in more informative outcomes.
Data Science for Multimorbidity Modeling
751
2.2 Hypothesis Space H
We framed the hypothesis space H in a subset of generalized linear models (GLMs).
GLMs describe the dependence of a scalar variable yi (i = 1, … , n) on a vector of
regressors xi [21]. The conditional distribution of yi |xi is a linear exponential family
with probability density function:
p(y; λ, ϕ) = exp(
y · λ − b(λ)
+ c(y, ϕ))
ϕ
(2)
Where λ is the canonical parameter that depends on the regressors via a linear predictor
and ϕ is a dispersion parameter that is often known. The functions b(·) and c(·) are known
and determine which member of the family is used, e.g., the normal, binomial or Poisson
distribution. Conditional mean and variance of yi are given by E[yi | xi ] = μi = b (λi )
and VAR[yi | xi ] = ϕ · b (λi ), b (.) and b (.) are numerical functions. Thus, up to a scale
or dispersion parameter ϕ, the distribution of yi is determined by its mean. Its variance
is proportional to V(μ) = b (λ(μ)), also called variance function. The dependence of
the conditional mean E[yi | xi ] = μi on the regressors xi is specified as:
g(μi ) = xTi β
(3)
where g(·) is a known link function and β is the vector of regression coefficients which
are typically estimated by Maximum Likelihood (ML) using the iterative weighted least
squares algorithm.
In this paper we restrict our analysis in polynomial and count data models. In count
data models, Y<morb> is considered as discrete data with non-negative integer values
which represent disease number. We propose to study Poisson, negative binomial and
geometric distributions. They are defined respectively:
Poisson: p(y; μ) =
Negative binomial: p(y; μ, θ) =
e−μ .μy
y!
(y + θ) θθ .μy
(θ) · y! (μ + θ)y+θ
(4)
(5)
With mean μ and shape parameter θ; (·) is the gamma function. Geometric distribution
is a special case of negative binomial such that θ = 1.
2.3 Evaluation Metrics
Besides statistical measures like R2 and Mean squared error, the learned models quality
are compared based on Akaike’s Information Criteria (AIC) and Bayesian Information
Criteria (BIC) [22]. AIC and BIC are both penalized-likelihood criteria. BIC estimates
the posterior probability of a model being true, assuming a Bayesian perspective, so
that a lower BIC means that a model is considered more likely to be the true model.
AIC estimates a constant plus the relative distance between the unknown true likelihood
752
F. Marzouki and O. Bouattane
function of the data and the fitted likelihood function of the model, that is, a lower AIC
means the model is closer to the truth-model.
AIC = −2log Likelihood ∗ + 2k
(6)
BIC = −2log Likelihood ∗ + log(n)k
(7)
Where 8* is estimated parameters for 8 value and k corresponds to the number of
estimated model parameters, n is the number of observations.
2.4 Data
Our work was applied in a case study of real medical dataset [23]. Each patient has a
recorded diagnosis which is recorded by a unique distinct ICD 10 Code in a hospital
inpatients’ diagnosis dataset, taken originally from admissions in NHS hospitals (The
National Health Service hospitals) of Madrid, Spain during 2016. The data contain 78451
patients (34639 males, and 43812 females). The diseases are encoded in 12763 unique
ICD10 code (almost 1611 categories). The maximum number of registered diagnosis
per admission is 20.
In the remainder of the paper, we analyze and discuss the outputs of the metaalgorithm proposed in the Sect. 2, alongside; we perform some exploratory analysis of
our variable of interest.
3 Results and Discussion
3.1 Gender and k-morbidity Variables
Figure 1 shows prevalence of different morbidities by gender. In general, we observe that
prevalence of patients tend to decrease as distinct recorded conditions per patient increase
continually. It seems that there are differences according to gender. We conducted a Twosample Kolmogorov-Smirnov test data to compare male and female distributions. We
found D = 0.2, p-value = 0.832, therefore, we did not rejected the null hypothesis which
suggests that there is not a significant distribution differences based on gender, for all
patients in dataset. However, significant gender differences could be detected in some
age ranges, for example, in elderly patients (>70 years), females have more potential to
develop multimorbidity than man. We set the following hypothesis Hk0 : “females have
less or equal proportions of k-distinct recorded diseases than males”,
and we applied
Pearson’s chi-squared test statistic and found that maxk pk − value 0.01 for k ∈
{3, .., 9}. Thus, we rejected the null hypothesis in favor of the alternative Hk1 : “females
have more proportions of k distinct recorded diseases than males” for k ∈ {3, .., 9}.
Data Science for Multimorbidity Modeling
753
Fig. 1. Prevalence of k-morbidity by gender. Two-sample Kolmogorov-Smirnov test data was
performed for male and female, we found D = 0.2 and p-value = 0.832.
3.2 Modeling Relationship of Age and Gender to Multimorbidity
In order to model the relationship between aging process and gender and multimorbidity,
we computed averages of distinct diagnosis in the data per age for both gender. In this
context we suppose that the number of distinct diagnosis recorded for the patient i is
the number of multimorbid diseases (k-morbidity) for the patient i, for our studied time
period (2016). The algorithm fitted Poisson, geometric, negative binomial, and a multilinear model to data of interest. These models were evaluated by Akaike’s Information
Criteria (AIC) and Bayesian Information Criteria (BIC).
For all models, gender was not of significance in predicting number of conditions (all
p-values of gender variable for the studied models are greater than 0.273), in contrary
to age variable (all p-values were less than 0.001 with a standard error less than 0.002).
This is in line with observation of researchers in [16]. Furthermore, geometric model and
Poisson models were respectively the worst and the best count data model, and linear
model was the best fitting data according to both AIC and BIC, with low standard errors
(SE < 0.002).
To verify further the non-contribution of gender variable as predictor of average kmorbidity, the algorithm backward-eliminated the two variables (age and gender) based
on AIC and adjusted R Squared (R2 ). Figure 2 shows the results.
Figure 2 shows that Linear model with Gender only as selected predictor results in
poor explained error variability R2 = 0.0039 and poorer AIC score. Meanwhile, models
with both age and gender selected (compared to age only selected) are quasi-equals (R2
≈ 86.07). As a result, adding gender variable does not improve explained variability any
754
F. Marzouki and O. Bouattane
further. Furthermore, linear model with both gender and age as predictors for k-morbidity
is the highest AIC score, meaning that this model is too complicated unnecessarily.
In this step, gender is excluded from analysis and the form of age relationship to
multimorbidity is further investigated with a polynomial regression.
Fig. 2. AIC and adjusted R2 for different variable combinations. Notice the difference in scale of
x-axis: R squared is plotted in inverse direction for ease of visualization and comparison.
3.3 Age Relation to Multimorbidity Modeling
Fig. 3. Average k-morbidity by age for both genders.
Figure 3 describes distribution of average of total disease count per age for males
and females. A linear regression was fitted to data point and reaches R2 = 0.92 for
Data Science for Multimorbidity Modeling
755
females and R2 = 0.95 for males, i.e. almost 90% of data could be explained by a
linear relationship. We noticed that for female the interval between 18 and 45 years had
significantly greater k-morbidity mean compared to males (p-value ≺≺ 0.01). Further,
significant differences between genders was also detected (p − value ≺ 0.05) in older
adulthood, in which the proportion of women who was recorded with more than 11
diagnoses was significantly higher than males, and was less or equal proportions for
patient recorded with less than 10 diagnoses.
These observations suggest one more time, in consistence with other studies [24–
28], that multimorbidity increases significantly with age, potentiality to multimorbidity
diseases depend on gender in young adulthood and older adulthood phase, with higher
rank for females.
Although the linear regression explains 92% of variability of data showing a positively correlated tendency between age and multimorbidity, a residual analysis for males
reveals a systematic pattern in residual points (curvature form, see Fig. 4), which suggest that a linear regression could be a simplifying assumptions for age-multimorbidity
relationships. To investigate more the form of this relationship we increased complexity to the initial model by fitting polynomial regression, i.e. we fitted the model f h =
Y = β0 + β1 X + β2 X2 + . . . + βh X h + such that h = {1, 2, 3, 4, 5, 6, 7} and are
respectively the degree of the polynomial and model error. A 10-fold cross validation
was performed against AIC and adjusted R2 . Figure 5 shows that metrics start to stabilize by the third degree and the standard deviation of these metrics tend to very small
quantities as degree increases.
Fig. 4. Residuals in respect to fitted values. Residuals are forming a shape with curvature which
suggests that simple linear regression is a simplistic assumption.
For data concerning males between one and 95 years the best describing model is
Y<morb> = β0 + β1 .age + β2 .age2 + β3 .age3
= 5.64065 + 36.42487.age + 9.83039.age2 + 1.27109..age3
756
F. Marzouki and O. Bouattane
With variability explained adjusted R2 = 0.9565 and overall p-value << 0.01 for the
model. Further, all coefficients of the model βk have significantly effects on the model
output, with max(k<4) {p-value of βk } << 0.01.
Fig. 5. AIC, R2 and Means squared Error metrics computed for 10 fold cross validation. Averages
and standard deviation are plotted for each hyper-parameter k of the model.
4 Conclusion
In this work we investigated relationship between three health related variables: age,
gender and Multimorbidity. In a machine learning framework, we formulated the problem of modeling Multimorbidity as learning an optimal statistical function explaining
average conditions based on age and gender. We found, consistently with epidemiological literature, that aging process influences significantly on developing Multimorbidity
burden. Gender was not influencing as predictor according to our data of interest, but
significant differences between genders was detected in some age intervals. The analysis was conducted by investigating two types of models: count data and polynomial
regressors. Polynomial regression to model age and averaged k-morbidity was done after
obtaining optimal results for linear model in comparison with count data models and
Data Science for Multimorbidity Modeling
757
the non-contribution of gender predictor. Most performing model was the third degree
polynomial for males between one and 95 years old.
Further works are needed to investigate the generalizability of our conclusions in
other real datasets. Second, our study started by investigating two predictors; further
predictors will shed more lights on multimorbidity phenomena. Third, used models are
based on assumptions which need to be more investigated.
References
1. Feinstein, A.R.: The pre-therapeutic classification of co-morbidity in chronic disease. J.
Chronic Dis. 23, 455–468 (1970). https://doi.org/10.1016/0021-9681(70)90054-8
2. Rijken, M., et al.: How to improve care for people with multimorbidity in Europe? European
Observatory on Health Systems and Policies, Copenhagen (Denmark) (2017)
3. Kirchberger, I., et al.: Patterns of multimorbidity in the aged population. Results from the
KORA-Age study. PLoS One 7, e30556 (2012)
4. Fortin, M., Hudon, C., Haggerty, J., van den Akker, M., Almirall, J.: Prevalence estimates of
multimorbidity: a comparative study of two sources. BMC Health Serv. Res. 10, 111 (2010).
https://doi.org/10.1186/1472-6963-10-111
5. Elhai, J.D., Calhoun, P.S., Ford, J.D.: Statistical procedures for analyzing mental health services data. Psychiatry Res. 160, 129–136 (2008). https://doi.org/10.1016/j.psychres.2007.
07.003
6. Lappenschaar, M., et al.: Multilevel temporal Bayesian networks can model longitudinal
change in multimorbidity. J. Clin. Epidemiol. 66, 1405–1416 (2013)
7. Lappenschaar, M., Hommersom, A., Lucas, P.J.: Probabilistic causal models of multimorbidity concepts. In: AMIA ... Annual Symposium proceedings. AMIA Symposium, pp. 475–484
(2012)
8. Lappenschaar, M., Hommersom, A., Lagro, J., Lucas, P.J.F.: Understanding the co-occurrence
of diseases using structure learning. In: Peek, N., Marín Morales, R., Peleg, M. (eds.) AIME
2013. LNCS (LNAI), vol. 7885, pp. 135–144. Springer, Heidelberg (2013). https://doi.org/
10.1007/978-3-642-38326-7_21
9. Lai, Y.-H., Wang, T.-Y., Yang, H.-H.: Network-based analysis of comorbidities: case study of
diabetes mellitus. In: Wang, L., Uesugi, S., Ting, I.-H., Okuhara, K., Wang, K. (eds.) MISNC
2015. CCIS, vol. 540, pp. 210–222. Springer, Heidelberg (2015). https://doi.org/10.1007/9783-662-48319-0_17
10. Cramer, A.O.J., Waldorp, L.J., van der Maas, H.L.J., Borsboom, D.: Comorbidity: a network
perspective. Behav. Brain Sci. 33, 137–150 (2010)
11. Faruqui, S.H.A., Alaeddini, A., Jaramillo, C.A., Potter, J.S., Pugh, M.J.: Mining patterns of
comorbidity evolution in patients with multiple chronic conditions using unsupervised multilevel temporal Bayesian network. PLoS ONE 13, e0199768 (2018). https://doi.org/10.1371/
journal.pone.0199768
12. Guo, M., et al.: Analysis of disease comorbidity patterns in a large-scale China population.
BMC Med. Genomics 12(Suppl 12), 177 (2019). https://doi.org/10.1186/s12920-019-0629x.PMID:31829182;PMCID:PMC6907122
13. Xu, X., Mishra, G.D., Jones, M.: Evidence on multimorbidity from definition to intervention:
an overview of systematic reviews. Ageing Res. Rev. 37, 53–68 (2017)
14. Diederichs, C., Berger, K., Bartels, D.B.: The measurement of multiple chronic diseases-a
systematic review on existing multimorbidity indices. J. Gerontol. A Biol. Sci. Med. Sci. 66,
301–311 (2011)
758
F. Marzouki and O. Bouattane
15. Uijen, A.A., van de Lisdonk, E.H.: Multimorbidity in primary care: prevalence and trend over
the last 20 years. Eur. J. General Pract. 14, 28–32 (2008). https://doi.org/10.1080/138147808
02436093
16. Guerin, E., Bouattane, E.M., Joanisse, J., Prud’homme, D.: Bouattane Mostafa Clusters of
multimorbidity across hospital services and by language groups. JHA 10, 6 (2021)
17. Abad-Díez, J.M., et al.: Age and gender differences in the prevalence and patterns of
multimorbidity in the older population. BMC Geriatr. 14, 75 (2014)
18. Jin, L., et al.: Multimorbidity analysis according to sex and age towards cardiovascular diseases of adults in northeast China. Sci. Rep. 8, 8607 (2018). https://doi.org/10.1038/s41598018-25561-y
19. Broeiro-Gonçalves, P., Nogueira, P., Aguiar, P.: Multimorbidity and disease severity by age
groups, in inpatients: cross-sectional study. PJP 37, 1–9 (2019)
20. Pastorino, R., et al.: Benefits and challenges of Big Data in healthcare: an overview of the
European initiatives. Eur. J. Pub. Health 29, 23–27 (2019)
21. McCullagh, P., Nelder, J.A.: Generalized Linear Models (1989)
22. Burnham, K.P., Anderson, D.R.: Multimodel Inference: understanding AIC and BIC in model
selection. Sociol. Methods Res. 33, 261–304 (2004)
23. Bonis, J.: drbonis/CMBD_MAD_2016 (2019). https://github.com/drbonis/CMBD_MAD_
2016. Accessed 01 July 2021
24. Ryan, B.L., et al.: Beyond the grey tsunami: a cross-sectional population-based study of
multimorbidity in Ontario. Can. J. Public Health 109(5–6), 845–854 (2018). https://doi.org/
10.17269/s41997-018-0103-0
25. Makovski, T.T., Schmitz, S., Zeegers, M.P., Stranges, S., van den Akker, M.: Multimorbidity
and quality of life: systematic literature review and meta-analysis. Age. Res. Rev. 53, 100903
(2019)
26. Nunes, B.P., Flores, T.R., Mielke, G.I., Thumé, E., Facchini, L.A.: Multimorbidity and mortality in older adults: a systematic review and meta-analysis. Arch. Gerontol. Geriatr. 67,
130–138 (2016)
27. Violán, C., et al.: Patrones de multimorbilidad en adultos jóvenes en Cataluña: un análisis de
clústeres. Atención Primaria 48, 479–492 (2016)
28. Koné Pefoyo, A.J., et al.: The increasing burden and complexity of multimorbidity. BMC
Public Health 15, 415 (2015)
Advanced Analytics for Medical Supply Chain
Resilience in Healthcare Systems: An Infection
Disease Case
Brenno Menezes1(B) , Robert Franzoi1 , Mohammed Yaqot1 , Mohammed Sawaly1,2 ,
and Antonio Sanfilippo3
1 Division of Engineering Management and Decision Sciences, College of Science and
Engineering, Hamad Bin Khalifa University, Qatar Foundation, Doha, Qatar
bmenezes@hbku.edu.qa
2 Department of Supply Chain, Hamad Medical Corporation, Doha, Qatar
3 Qatar Environment and Energy Research Institute, Hamad Bin
Khalifa University, Qatar Foundation, Doha, Qatar
Abstract. The COVID-19 impacts go beyond healthcare systems as they also
challenge global markets and society. A comprehensive knowledge involving the
elements to contain the virus is fundamental for properly planning and implementing a quick response to the problems faced worldwide. Learning to coexist with the
COVID-19 pandemic has become part of our daily life. Hence, the scientific community’s capabilities to continuously provide solutions for pandemics are crucial
to mitigate the spread of the pandemic. The main contribution of this work is to
propose applications of advanced analytics (AA) in healthcare treatment networks
that predict epidemiology curves and the distribution of patients’ severity towards.
These tools assist the optimization of such networks with innovative solutions aiming to increase the capacity, responsiveness, and preparedness of the infrastructure
and management in healthcare systems. Such a decision-making environment can
forecast the spread of the disease by utilizing given inputs such as social distance,
out-of-stock of personal protective equipment (PPE) items, lockdown policies,
environmental factors, etc. These forecasts are especially important to allow a)
medical corporations to design and operate healthcare treatment systems and b)
governments to develop policies aiming to maintain the balance between social
progress and a sustainable economy.
Keywords: Advanced analytics · Medical supply chain resilience · COVID-19 ·
Optimization
1 Introduction
The COVID-19 cases have been imposing many challenges on the capacity, operation,
and control of healthcare treatment systems, exhausting a lot of their resources in material, equipment, and personnel. COVID-19 is an infectious disease that spreads exponentially quicker than severe acute respiratory syndrome (SARS) or the Middle East
© The Author(s), under exclusive license to Springer Nature Switzerland AG 2022
F. Saeed et al. (Eds.): IRICT 2021, LNDECT 127, pp. 759–768, 2022.
https://doi.org/10.1007/978-3-030-98741-1_64
760
B. Menezes et al.
respiratory syndrome (MERS). So far, such an unprecedented pandemic has proven
to be extremely hard to contain and revealed that healthcare systems worldwide are
unprepared to respond to the required changes effectively. Governments and healthcare
systems must pursue enhanced capabilities to be better prepared for dealing with the
multiple waves of COVID-19 and any future outbreaks.
The COVID-19 impacts surpassed healthcare systems by affecting educational processes, local and international markets, and global supply chains. Therefore, a resilient
supply chain response should be as quick as the spread of the virus for properly containing it, whilst providing adequate care [1]. A detailed and robust understanding of
the causes and consequences in markets, communities, and healthcare systems is necessary to be resilient by resisting (avoiding and containing) and recovering (stabilizing
and returning) when planning and executing timely responses [2]. Despite the vaccination efforts made so far to provide immunization as quickly as possible, the vaccine
distribution chain is challenging and is likely to delay the demise of COVID-19. Hence,
the scientific community is fundamental to continuously study and investigate the pandemic’s dynamic evolution aiming to enhance institutional preparedness with resistance
and recovery capabilities.
This research focuses on the development of advanced analytics in healthcare treatment networks for predicting epidemiology curves and distribution of patients’ severity. Healthcare networks can be properly optimized with innovative solutions towards
increased capacity, responsiveness, and preparedness of healthcare systems infrastructure and management. In the proposed framework, a data-driven machine learning (ML)
technique (predictive analytics) is firstly applied to identify epidemiology curves of
future outcomes in terms of numbers of positive cases and their distribution among
asymptomatic/mild, moderate, and severe stages. Second, the healthcare treatment networks’ design, operation, and control (prescriptive analytics) are determined using the
predictions on the epidemiology curves by integrating both predictive and prescriptive analytics. Then, sensitivity analysis is conducted by inserting disruptive inputs in
the model to infer a sustainable economy with social progress in equilibrium with the
healthcare treatment systems under evaluation.
The proposed research provides a platform embedded with ML and optimization
algorithms configured by predictive and prescriptive analytics for the operation and
coordination of the healthcare networks for disease treatment. This platform can predict
disease outbreaks based on specified inputs such as social distance, out-of-stock personal
protective equipment (PPE) supplies, lockdown policies, environmental parameters such
as temperature and humidity, etc. Such projections enable a) medical corporations to
build and execute healthcare treatment systems; and b) governments to establish regulations and policies based on the solution’s feasibility assessment, with the goal of
maintaining the balance between social progress and sustainable long-term economic
viability.
2 Impacts of Infectious Diseases in the Medical Supply Chain
Pandemics and natural disasters create unanticipated operational shocks to healthcare and
emergency response systems and organizations. The backbone to absorb and mitigate
Advanced Analytics for Medical Supply Chain Resilience in Healthcare Systems
761
pandemic shock waves are hospitals, which are the most vulnerable and rarely ever
prepared for large-scale crises. Hospitals all over the world were severely overwhelmed
by the COVID-19 pandemic. These negative impacts could have been mitigated or even
avoided had there been effective ways to optimize resources and operations. For instance,
Italy experienced high infection rates amongst healthcare workers because of inadequate
supply and access to PPE. One of the primary reactions was a frantic effort by individuals
and medical staff to secure PPE, which was at odds with the concerns of supply chain
personnel to limit waste and prioritize response.
Optimization of the distribution center stocks is vital to successfully respond to
pandemic events. In many countries, there were far more COVID-19 positive and symptomatic people outside than inside hospitals due to lack of space, lack of utilization of
bed capacity in hospitals, and operational inefficiencies. Such design obstacles indicate
that many patients are not treated in time (or at all), which significantly increases the
death rate. In times of crisis, the challenges are multi-layered, so that there is an urgent
need to have enough qualified staff, expand treatment capacity, treat more patients and
discharge them faster, allocate resources to those most required. All these challenges
are faced simultaneously while facing a pandemic with multiple difficulties and uncertainties. During such a crisis, employees are in constant fear of being infected, working
extremely long hours, confused, and tense. Fear, along with illness, are the two biggest
factors that lead to workers absenteeism [3, 4]. Hence, scheduling of staff is vital to
maintain workflow in hospitals where there are ever-changing demands. These dynamics and concomitant factors eventually strained the whole local supply chain of medical
items locally and worldwide.
Several institutes worldwide have addressed models for the growing spread of the
pandemic. For example, in March 2020, Qatar’s Energy Environmental Research Institute (QEERI) proposed a data-driven estimation and forecasting approach of COVID-19
transmissions based on machine learning (ML) modeling of epidemiological, socioeconomic, environmental, and global health indicator data. QEERI’s model currently targets
only the prediction 7 days ahead of the expected COVID-19 cases per day. The forecasting horizon of the model can be increased to several weeks, in addition to providing
forecasts for the statistical distribution of the symptomatic conditions of the infected
population. For the confirmed COVID-19 cases per day, Fig. 1 gives a snapshot of the
good correlation of the global aggregate value and the prediction of QEERI’s model
(R2 of 0.964). The plot at the top shows the prediction accuracy of the model when
tested over an unseen portion of the dataset. The bottom figure depicts the overall model
performance when considering the whole dataset (training and testing sets).
Some studies have tried to predict COVID-19 spread from 1–3 up to 6 days ahead
using ML-based techniques. Ribeiro et al. [5] forecast cumulative cases of COVID-19
in Brazil using forecasting techniques of different time series such as support vector
regression, autoregressive integrated moving average, ridge regression, random forest,
cubist regression, and stacking-ensemble learning. Chimmula and Zhang [6] use a deep
learning approach (long short-term memory networks) to forecast future COVID-19
cases in Canada, Italy, and the USA. A model for COVID-19 cases in a real-time prediction for France, Canada, India, South Korea, and the United Kingdom is developed
by Chakraborty and Ghosh [7] based on a combination of the ARIMA algorithm and
762
B. Menezes et al.
Fig. 1. Comparison between the confirmed and predicted COVID-19 daily cases at the global
level.
wavelet-based forecasting techniques. Stübinger and Schneider [8] propose the forecast
of the COVID-19 spread by utilizing the identified lead-lag effects among diverse countries with the help of the well-known dynamic time warping (DTW) used extensively in
batch process monitoring and analysis.
In reference to bed capacity management, Alban et al. [9] developed a computer
simulation model that uses a stochastic queuing model for ICU patients flow to determine
the amount of positive and negative COVID-19 patients to be assisted in a limited ICU
capacity. Their model considers beds that are reserved for COVID-19 patients, as well
as beds for unplanned urgent cases. The conclusion is that the inclusion of both COVID
and non-COVID patients in an ICU facility adds an operational constraint to ICU bed
management. To optimize large-scale emergency preparedness, Lee et al. [10] developed
a decision-making software called RealOpt, which optimizes a public healthcare system
for a complete set of emergency responses. This framework can be used in areas of
infectious disease outbreaks, radiological or biological terrorism, and national disaster
resource planning. In addition, RealOpt can be configured for different inputs to get
desired fast results through many what-if scenarios.
To manage resources during pandemic events, Garbey et al. [11] use data from the
French Government during COVID-19 within a computational model that anticipates
the patient moves to different care units and the amount of PPE required by these units,
as well as other key measurements of the performance of the French healthcare system
during the COVID-19 crisis. This model is meant to reproduce the hospital workflow
during an epidemic, which in this case, admits a maximum of 50 patients per day. They
use a Markov process to augment the workflow of patients and employ a statistical model
to determine the lengths of stay of patients at each stage of their admission. The model
Advanced Analytics for Medical Supply Chain Resilience in Healthcare Systems
763
helped senior medical directors to determine the number of beds needed and whether
transferring of patients among facilities was required.
To the best of our knowledge, no work has been reported so far covering healthcare
treatment systems’ infrastructure (design), operation, and control for their planning,
scheduling, and coordination over multiple stages of the disease. This is especially
important for developing a performance model that minimizes the deviation from targets
of healthcare, efficiency, service, etc., for an assessment of the balance between social
progress and a sustainable economy. Thus, this work aims to propose a decision-making
framework to address such an important topic and provide future research guidelines.
3 Proposed Framework
The proposed framework integrates a) machine learning predictive analytics for the epidemiology curves of COVID-19 positive cases (and their distribution in terms of severity)
and b) optimization (or prescriptive analytics) to prescribe future design, operation, and
control of healthcare treatment systems. Such methodology can be greatly useful to
enhance the economy towards its sustainability and help governments and society cope
with the unforeseen impacts in healthcare.
The spread of the new daily cases (referred to as epidemiology curve) can be predicted
by a ML method based on data analytics (Step 1). Then, these predictions can be used
for determining healthcare treatment systems’ optimal design, operation, and control
(Step 2) to assess a COVID-19 facility with specific reference to ICU units (for severe
patients), In-Patient Clinics/tents (for mild-moderate patients), and Emergency ward
(for symptomatic patients), and lastly other quarantine sites for asymptomatic positive
patients. The combination of Steps 1 and 2 allows sensitivity analysis to assess the
integration of social progress and sustainable economy using what-if cases or predicted
epidemiology curves with respect to the spread of the disease. A summary of the steps
is illustrated in Fig. 2.
Fig. 2. Phases of the medical supply chain resilience study.
764
B. Menezes et al.
3.1 Epidemiology Curve Prediction
From the challenges faced by the medical corporations worldwide in the COVID-19
pandemic, it is fundamental to efficiently determine the disease spread to be better
prepared for peaks in the number of patients within the healthcare treatment networks.
When simulating or measuring the specific inputs (e.g., social distance, out-of-stock
PPE supplies, climate, lockdown policies, etc.), epidemiology curve predictions have
the ability to forecast the statistical distribution of the symptomatic conditions of the
predicted infected population.
As an example, this can be based on Gradient Boosted Regression Tree (GBRT)
models. GBRT is an additive stochastic model that combines multiple sequentially connected weak learners (regression trees). The new learners fit the residuals from the previous stage for optimizing the overall predictive performance. The models built using
such methodology include nonlinear interactions and are sufficiently flexible, highly
accurate, and robust to outliers or missing data. The dataset used for the forecasting
approach can include lagged values of epidemiological, socioeconomic, environmental,
and global health indicator factors [12]. The model is trained using a random part of the
dataset, in which the remaining data points test the prediction accuracy to avoid any sort
of biased behavior from the data. The hyperparameters in the model can be optimized
based on a combination of grid-search and 5-fold cross-validation approaches to avoid
overfitting and to reduce the variance erroring the error predictions.
3.2 Optimal Design, Operation and Control of the Medical Supply Chain
With the prediction of the epidemiology curve with respect to the defined inputs, and
with the parameter of the rate of the PPE items for emergency, in-patient, and ICU
COVID-19 treatments, decisions can properly determine the optimal design, operation,
and control of a resilient medical supply chain. The decision variables for the medical
resource supply chain resilience are categorized and described as follows:
Design. Capacity of the facilities in terms of patients as continuous variables, and type
and number of different treatments (ICU, In-Patient, Operating Theatres, etc.) as discrete
and integer variables.
Operation. Stocks and flows of resources (material, equipment, personnel) in each
healthcare treatment site considering the different stages of the COVID-19 treatment.
Control: Level of supply chain services and PPE distribution/reposition in near realtime among the multiple sites to minimize deviation for standards or targets of healthcare,
efficiency, service, etc.
In the optimization and control of healthcare treatment systems, the network in
Fig. 3 shows a flowsheet of facilities and connections in the unit-operation-port-state
superstructure (UOPSS) constructs from Kelly [13] that is built-in in the Industrial
Modeling and Programming Language (IMPL) software [14]. The objects or shapes are:
a) sources and sinks (♦), batch-processes (), continuous-processes (), and tanks or
inventories () represented by unit-operations m and b) the connectivity of arrows (→),
Advanced Analytics for Medical Supply Chain Resilience in Healthcare Systems
765
Fig. 3. Healthcare treatment system constructed within the UOPSS flowsheet.
inlet-ports i (◯) and outlet-ports j (⊗). Both binary y and continuous x variables are
defined for unit-operations and arrows and the ports represent process yields.
For the modeling of units, materials, tasks, etc., two approaches are usually used to
represent production systems in the chemical engineering literature. They are known as
state-task network (STN) [15, 16] and resource-task network (RTN) [17]. These models
are originated from sequential batch-type production in which a sequence of tasks is
performed on renewable (units) and/or non-renewable resources (states). However, as a
superset of the STN and RTN superstructures, the UOPSS network gives an anywhereto-anywhere connectivity usually referred to as a flowsheet, routing, mapping, topology,
or block-diagram for its various objects, shapes, or structures that are needed to configure
and construct the problem networks. Brunaud et al. [18] demonstrate that the UOPSS
is computationally superior to STN and RTN in complex-scope scheduling problems
using batch processes in the chemical production industry, solving large-scale problems
within minutes to seconds instead of hours.
From such definition of design, operation, and control for the medical resource
supply chain resilience to COVID-19 pandemic, a generalized performance model could
potentially and efficiently minimize deviation from targets, standards, and policies. Such
methodology needs to address uncertain information such the forthcoming number of
positive case patients. Methodologies to determine the contagious curve can be estimated
766
B. Menezes et al.
and employed within a performance model according to a) targets or standards (treated
as soft bounds), b) capacity limitation for the treatment facilities, c) correlated processes
considering hard bounds of lower and upper limits in decision variables, and d) penalty
values for variables or constraints aiming to avoid infeasibilities (e.g., out of stock of
PPE).
3.3 Sensitivity Analysis for Social Progress and Sustainable Economy
From such a novel solution, an integrated framework can be developed to include a)
machine learning predictive analytics for the epidemiology curves of COVID-19 positive cases (and their distribution in terms of severity) and b) optimization (or prescriptive
analytics) to prescribe future healthcare treatment systems’ design, operation, and control. This can be utilized for a sustainable economy and social progress assessments to
help governments and society cope with the unforeseen impacts in healthcare, economy,
supply chains, etc.
Considering social distance restrictions that are still ongoing in some countries
around workplaces and educational centers, and the sectors highly affected by COVID19 damages in supply chains, tourism, etc., the companies and overall society need to
handle the pandemic events considering a limited amount of people and resources. Therefore, learning to mitigate the COVID-19 impacts and achieving enhanced knowledge
and experience under pandemic events is fundamental to continue with the resistance by
a) avoiding the spread of the disease, when determining the targets of social distance, as
an example, and b) its containment by better preparedness of the healthcare treatment
networks to mitigate the consequences for those symptomatic patients both in moderate
and severe stages.
In-deep studies to understand how to recover and re-establish previous stages of the
economy and social livelihoods may be determined with such advanced analytics framework, whereby predictions of the near future epidemiology curves and prescription of
the optimized healthcare treatment for the future responses, both detective and cognitive
analytics [19], can be used to determine stabilization stages and moments of returning
to past or new states of social and economic progress.
4 Conclusion
As we have witnessed, COVID-19 did not disappear after a few months, but has in fact
developed and become a problem to persist over the years. With the aid of advancements
in predictive and prescriptive, we can be able to predict epidemiology curves of the virus
spreading to be well prepared to act accordingly. It is shown in this study that healthcare
systems can be better designed and operated in anticipation of worst-case scenarios,
through timely and efficient response mechanisms. Such modeling capabilities can be
used in future crisis situations, whether they are other virus outbreaks or natural disasters.
Hence, the scientific community is fundamental to continuously study and investigate
the dynamic evolution of the pandemic aiming to enhance institutional preparedness
with resistance and recovery capabilities.
Advanced Analytics for Medical Supply Chain Resilience in Healthcare Systems
767
It is evident from the COVID-19 events that the interconnection among countries
is linked in a way that no one can escape the outreach of most matters, particularly
virus outbreaks. Everyone’s lives have been impacted, and many lives have been lost.
Protecting the people lives entails that we need sufficient resources, allocated properly
and efficiently. Further to this work, additional methodologies and strategies, such as
procurement planning, can be developed and implemented to ensure that no stock-outs
of PPE or medical equipment occur. Staff scheduling models can be employed to ensure
proper treatment for everyone so that no sick person is left unattended. The design of
whole healthcare networks can be enhanced to make sure that every bed space in a
community is fully utilized. Quarantine and hotel facilities can be planned to be better
utilized. The development of better epidemiology curves, showing the potentials of newer
strains of viruses with newer causations can also be studied. Overall, many advanced
analytic techniques can be developed, improved, and implemented to provide more
efficient capabilities for handling emergency situations in the current and eventually
future pandemic events.
References
1. Murthy, S., Gomersall, C.D., Fowler, R.A.: Care for critically ill patients with COVID-19. J.
Am. Med. Assoc. 323(15), 1499–1500 (2020)
2. Melnyk, S., Closs, D., Griffis, S., Zobel, C., Macdonald, J.: Understanding supply chain
resilience. Supply Chain Manage. Rev. 18(1), 34–41 (2014)
3. Itzwerth, R.L., MacIntyre, C.R., Shah, S., Plant, A.J.: Pandemic influenza and critical
infrastructure dependencies. Med. J. Aust. 185(10), 70 (2006)
4. Balicer, R.D., et al.: Characterizing hospital workers’ willingness to report to duty in an
influenza pandemic through threat- and efficacy-based assessment. BMC Public Health
436(10), (2010)
5. Ribeiro, M.H.D.M., da Silva, R.G., Mariani, V.C., Coelho, L.C.: Short-term forecasting
COVID-19 cumulative confirmed cases: Perspectives for Brazil. Chaos, Solitons & Fractals,
pp. 109853 (2020)
6. Chimmula, V.K.R., Zhang, L.: Time series forecasting of COVID-19 transmission in Canada
using LSTM networks. Chaos, Solitons & Fractals, p. 109864 (2020)
7. Chakraborty, T., Ghosh, I.: Real-time forecasts and risk assessment of novel coronavirus
(COVID-19) cases: a data-driven analysis. Chaos, Solitons & Fractals, p. 109850 (2020)
8. Stubinger, J., Schneider, L.: Epidemiology of coronavirus COVID-19: forecasting the future
incidence in different countries. Healthcare 8(2), 99 (2020)
9. Alban, A., et al.: ICU capacity management during the COVID-19 pandemic using a stochastic
process simulation. Intensive Care Med. 7, 1–3 (2020)
10. Lee, E.K., Chen, C.H., Pietz, F., Benecke, B.: Modeling and optimizing the public-health
infrastructure for emergency response. Interfaces 39(5), 476–490 (2009)
11. Garbey, M., Joerger, G., Furr, S., Fikfak, V.: A model of workflow in the hospital during a
pandemic to assist management. PLOS ONE 15(11), e0242183 (2020)
12. Friedman, J.H.: Greedy function approximation: a gradient boosting machine. Annals of
statistics, pp.1189–1232 (2001)
13. Kelly, J.D.: The unit-operation-stock superstructure (UOSS) and the quantity-logic-quality
paradigm (QLQP) for production scheduling in the process industries. In: Multidisciplinary
International Scheduling Conference Proceedings: New York, United States, pp. 327–333
(2005)
768
B. Menezes et al.
14. Kelly, J.D., Menezes, B.C.: Industrial Modeling and Programming Language (IMPL) for offand on-line optimization and estimation applications. In: Fathi, M., Khakifirooz, M., Pardalos,
P. (eds.) Optimization in Large Scale Problems. SOIA, vol. 152, pp. 75–96. Springer, Cham
(2019). Doi: https://doi.org/10.1007/978-3-030-28565-4_13
15. Kondili, E., Pantelides, C.C., Sargent, R.W.H.: A general algorithm for short-term scheduling
of batch operations – I MILP formulation. Comput. Chem. Eng. 17, 211–227 (1993)
16. Shah, N., Pantelides, C.C., Sargent, R.W.H.: Optimal periodic scheduling of multipurpose
batch plants. Ann. Oper. Res. 42, 193 (1993)
17. Pantelides, C.C.: Unified frameworks for optimal process planning and scheduling. In:
Foundations of Computer-Aided Process Operations. CACHE Publications, New York (1994)
18. Brunaud, B., Perez, H.D., Amaran, S., Bury, S., Grossman, I.E.: Batch scheduling with qualitybased changeovers. Comput. Chem. Eng. 132, 106617 (2020)
19. Menezes, B.C., Kelly, J.D., Leal, A.G., Le Roux, G.C.: Predictive, prescriptive and detective
analytics for smart manufacturing in the information age. IFAC-PapersOnline 52(1), 568–573
(2019)
Application of Temporal Network on Potential
Disease Transmission: Hospital Case Study
Yaseen Alwesabi(B) , Dong Dinh, and Xilin Zhang
Department of Systems Science and Industrial Engineering, SUNY Binghamton University,
Binghamton, NY 13902, USA
yalwesa1@binghamton.edu
Abstract. Early diagnosis of potential epidemic transmission of diseases such as
influenza or coronavirus in hospitals where one-to-one contact occurs is central
not only to save patients’ life, but also to prevent disease propagation to staff,
nurses, medical doctors, and other workers. This paper aims to predict the risk
threshold of influenza disease transmission in a temporal network; the hospital’s
data in Lyon, France is taken as a case study. The network involves 46 health care
workers and 29 patients. The Susceptible Infectious Recovered (SIR) model is
used for the analysis. The SIR model is more fit for the influenza disease because
a patient is not suspected to spread the disease after recovery. The results show
that the disease propagation rate is lower in the temporal network compared with
the corresponding aggregated network. It is found out that that the threshold of
an epidemic occurs when the transmission percentage is 10%. Most importantly,
it is found that the nurses and administrators are more likely to be infected than
physicians or patients in this case study. The proposed model is applicable in
hospitals, schools, or any work organization for epidemiologic control.
Keywords: Epidemic transmission of disease · Temporal network · Susceptible
infectious recovered · Susceptible infectious susceptible
1 Introduction
Based on the recent statistics from World Health Organization in August 2020, more than
three million influenza cases and up to half a million deaths worldwide [1]. Infection
control is a vital approach to prevent some potential bacterial and viral transmissions
[2–4]. Nurses or healthcare workers in hospitals have direct interaction with patients
and colleagues. These interactions lead to a high risk of potential epidemic transmission
of infectious diseases such as influenza and COVID-19. To monitor this phenomenon,
wearable sensors were used to detect interactions between individuals [4]. The recorded
data has 46 staff members (27 nurses, 11 physicians, and 8 administrative staff) as well
as 29 patients. The data has been collected and analyzed by [4]. Three methods have
been used to study disease transmission from a temporal network, time-slice networks,
ongoing networks, and exponential-threshold networks [4]. The results indicated that
exponential-threshold was able to capture the most relevant information while static or
© The Author(s), under exclusive license to Springer Nature Switzerland AG 2022
F. Saeed et al. (Eds.): IRICT 2021, LNDECT 127, pp. 769–774, 2022.
https://doi.org/10.1007/978-3-030-98741-1_65
770
Y. Alwesabi et al.
aggregated network performs poorly. However, the likelihood of an infectious disease
outbreak using the SIR model for this case study has not been investigated in the literature
according to the authors’ best knowledge. Therefore, this study aims to extend the work
of [4] by detecting the transmission rate using the SIR model, as well as providing a
comparison between temporal and static networks.
Epidemic models on dynamic temporal-driven networks have been investigated by
several researchers [5, 6]. Derived evidence from [6] shows that temporal networks can
reduce the epidemic prevalence due to the time factor that is not active all the time. In
this study, the behavior of disease propagation will be analyzed using the SIR model.
The SIR model is established to measure disease transmission when the patient does not
transfer the disease after recovery. The remains of the paper are organized as follows.
Section 2 illustrates the literature review while the proposed approach or methodology
is demonstrated in Sect. 3. Results, discussion, and conclusions are shown in Sects. 4,
5, and 6, respectively.
2 Related Work
A reliable estimation of the epidemic threshold of infectious disease is of utmost importance for the probability of disease contagion prediction, identifying the containment
of the infectious disease epidemic and perhaps preventing disease propagation [7]. The
typical models used to quantify the epidemic threshold are SIR and SIS models [8, 9].
The difference between the SIS model and the SIR model is that the infected individuals
are susceptible again after recovery in the SIS model, while the infected individuals can
recover with lifelong immunity or die in the SIR model.
In the literature, three commonly used theoretical methods are reported to predict
epidemic thresholds, namely the mean-field-like (MFL) method, the dynamical message
passing (DMP) method, and the quenched mean-field (QMF) method. Wei Wang et al.
[9] applied the three methods in conjunction with the SIR model in 56 real-world networks. They found that the MFL method has the best performance among the three in
real-world networks. The threshold predicted by the MFL method is closer to the real
epidemic threshold. Shu et al. [10] used the MFL in finite-size networks and confirmed
that analyzing the peak of the epidemic variability accurately determines the simulated
epidemic thresholds of the SIS and SIR models.
The duration (time) of nodes or links plays an important role in the propagation
process, see [11, 12]. The epidemic threshold of temporal networks is given by the
interplay between the timescales of contagion [13]. In static networks, the link between
two individuals indicates that the two individuals have at least one-time interaction
during the sample period. The epidemic threshold of static networks is determined by
the principal eigenvalue of the adjacent matrix [13].
3 Methodology
The data format in our case study is expressed as follows: (t, i, j, mi , mj ) represents
(time, identity i, identity j, status i, and status j), respectively; status: NUR = Nurses, Pat
= Patients, MED = Medical doctors, and ADM = administrative staff. The mean-field
Application of Temporal Network on Potential Disease Transmission
771
approximation for the SIR model is used for simulation. The parameters are defined as
follows. p is the probability of a node is infected at a specific time, pe is the connectivity probability between nodes in the network, pr is the recovery probability, pi is the
probability that an infected node transfers the disease to another node if they are connected, and n = 75 is the total number nodes. The comparison of the infection process
between the temporal network and the static network corresponding to the SIR model is
presented.
In both networks, static and temporal, the probability of recovery pr is set at 0.8 and
the probability of infection is varied from 0 to 0.3 with step 0.01. Since the experiments
are stochastic, each experiment will be replicated 100 times and the average values will
be calculated and used for interpretation. The result will determine at which probability
of infection the disease will survive in the network. Further analysis will be performed to
understand the difference between these two networks in terms of disease transmission.
4 Results
This section illustrates the main findings of the simulation using the Python language and
NetworkX package. Section 4.1 shows the topological analysis of static and temporal
networks. The SIR results are demonstrated in Sect. 4.2. More analysis of infection
transmission in the proposed data is presented in Sect. 4.3.
4.1 The Topological Analysis
Topological analysis of the network represents the main features of the network,
including the number of nodes, edges, graph type, and network degree, see Table 1.
Table 1. Topological parameters of the static network
Item
Value
Item
Value
Number of nodes
75
Number of
components
1
Number of edges
1139
Clustering
average
0.64
Graph type
Undirected
Betweenness
centrality
‘1769’
Density
0.41
Connectivity
True
Degree (min,
average, max)
(6, 30.37, 61)
This network is small due to its few numbers of nodes, 75, compared with largescale networks in the literature. The density is high due to many contacts compared to the
number of people or nodes. We have found out that node ‘1525’ has the lowest number of
contacts while ‘1098’ has the highest number of contacts. Moreover, the patient number
772
Y. Alwesabi et al.
‘1769’ has the minimum length path in the network, so patient number ‘1769’ serves
as a bridge from one part of the network to another. In the temporal network, each day
always contains the main component and isolated nodes. When interactions between
nodes are active through a specific period, the number of isolated nodes is few as shown
in day1, while isolated nodes increase when interactions are reduced such as (d) or day5
in Fig. 1.
Fig. 1. (a) is the static network, and (b), (c), and (d) are the temporal network nodes interactions
in day1, day3, and day5, respectively
4.2 Dynamic Simulation of the SIR Model
The patient in the SIR can recover and get immunity or die after becoming infected.
Figure 2 shows the simulation of the SIR model tested on the static and temporal
networks.
Fig. 2. SIR model for static and temporal networks
The disease propagation starts quite late for the temporal network on the SIR model
(pi = 0.09) and the average maximum number of infected nodes is maintained around
25/75, almost half the size of the static network.
Application of Temporal Network on Potential Disease Transmission
773
4.3 Disease Transmission Analysis
This section concentrates on individuals to track the most infected people in this temporal
network using the SIR scheme simulation. The simulation parameters are pi = 0.2 and
pr = 0.8. The number of iterations is 100, each time we replicate the experiment 5
times, such that in each replication, the highest 5 infected nodes, maximum number
of switches “either from normal to infected or the opposite way”, the lowest infected
nodes and eventually the nodes that never changed through the entire experiment were
computed. Then, the most frequent results in all five experiments are reported.
The obtained results show that the highest infected nodes in all replications are the
nurses, then the administrators. Besides, patients and physicians are less likely to become
infected. It is found that the nurse ID “1295” has a dominant probability. Interestingly,
most of these nurses’ connections are with people who themselves have a higher probability of infections in the system. These nurses have a higher probability to transfer
diseases to others, which on the other hand reflects the reality due to nurses’ frequent
interaction with patients and workers alike. Secondly, the nurses’ number is higher than
physicians or other staff as a majority that plays an important role in disease propagation.
5 Results
The obtained results show that the static network seems to be more vulnerable to the
increment of infection probability. The temporal network required a much larger value
of infection probability to be threatened by the epidemic. In a static network, every
connection throughout the whole time will be aggregated together to form the network.
In the temporal network, every connection for each node will only be considered during
a specific time frame, which is dynamic and represents reality. The connection between
some sets of nodes will appear on time t but might disappear in time t + 1 or t + 2. This
behavior reduces the network density and makes the network more resistant to epidemic
deployment.
The average maximum value of infected nodes in the static network is significantly
higher than the temporal network. The explanation of this behavior may reside in the
community structure of the temporal network. During a different time, the temporal network creates different community components and clusters. Those clusters contribute
to isolating the spread of disease in some specific experiments and decreasing the total
number of infected nodes. This result supports [6] claim, “the diffusion dynamics are
affected by the network community structure and by the temporal properties of waiting
times between events” [14]. Consequently, disease prevalence is lower in temporal networks than in static networks. In addition, the presented SIR model was able to capture
most of the relevant information of the given data. The SIR simulation showed that the
epidemic structure has an exponential form, which matches with the literature review
and particularly, with the results reported in [4]. To prevent disease transmission, the
transmission rate should be less than 10%.
6 Conclusion
This study elucidates the way of controlling and monitoring disease propagation in
hospitals and alerts policymakers about the risk rate of the epidemic. The SIR model
774
Y. Alwesabi et al.
is used and tested on the proposed temporal network dataset and its aggregated (static)
network. The temporal network represents reality due to its advantage of involving
time as a main part of the data structure. The patient’s interaction with staff occurs in
an intermittent form, which was reflected in the topological analysis of the temporal
network. It is found out that nurses and administrators have a higher probability of
becoming infected compared with medical doctors or patients.
There are many limitations to our study, including the use of homogeneous assumptions. Even though this is a common method to make the results achievable; however, in
real life, the medical staffs have a better awareness of the disease and well-knowledge
of the prevention of infection, so that they don’t have the same infection probability as
patients. Future research can consider more detailed based on these different characters.
References
1. WHO: What is the global incidence of influenza? (August 2020). https://www.medscape.
com/answers/219557-3459/what-is-the-global-incidence-of-influenza
2. Albrich, W.C., Harbarth, S.: Health-care workers: source, vector, or victim of MRSA? Lancet
Infect. Dis. 8(5), 289–301 (2008)
3. Barrat, A., Cattuto, C., Tozzi, A.E., Vanhems, P., Voirin, N.: Measuring contact patterns with
wearable sensors: methods, data characteristics and applications to data-driven simulations
of infectious diseases. Clin. Microbiol. Infect. 20(1), 10–16 (2014)
4. Holme, P.: Epidemiologically optimal static networks from temporal network data. PLoS
Comput. Biol. 9(7), e1003142 (2013)
5. Holme, P.: Temporal network structures controlling disease spreading. Phys. Rev. E 94(2),
022305 (2016)
6. Moinet, A., Pastor-Satorras, R., Barrat, A.: Effect of risk perception on epidemic spreading
in temporal networks. Phys. Rev. E 97(1), 012313 (2018)
7. Nadini, M., Sun, K., Ubaldi, E., Starnini, M., Rizzo, A., Perra, N.: Epidemic spreading in
modular time-varying networks. Sci. Rep. 8(1), 2352 (2018)
8. Shu, P., Wang, W., Tang, M., Do, Y.: Simulated identification of epidemic threshold on finitesize networks. arXiv preprint arXiv:1410.0459 (2014)
9. Valdano, E., Ferreri, L., Poletto, C., Colizza, V.: Analytical computation of the epidemic
threshold on temporal networks. Phys. Rev. X 5(2), 021005 (2015)
10. Vanhems, P., et al.: Estimating potential infection transmission routes in hospital wards using
wearable proximity sensors. PloS one 8(9), e73970 (2013)
11. Vanhems, P., et al.: Risk of influenza-like illness in an acute health care setting during community influenza epidemics in 2004–2005, 2005–2006, and 2006–2007: a prospective study.
Arch. Intern. Med. 171(2), 151–157 (2011)
12. Wang, W., Liu, Q.-H., Zhong, L.-F., Tang, M., Gao, H., Stanley, H.E.: Predicting the epidemic
threshold of the susceptible-infected-recovered model. Sci. Rep. 6, 24676 (2016)
13. Zhang, J., Lu, D., Yang, S.: Comparison of mean-field based theoretical analysis methods for
SIS model. arXiv preprint arXiv:1704.01025 (2017)
14. Delvenne, J.C., Lambiotte, R., Rocha, L.E.: Diffusion on networked systems is a question of
time or structure. Nat. Commun. 6(1), 1–10 (2015)
Hospital Supply Chain Management
and Quality of Services Within Hospitals:
A Preliminary Review
Amer Alqudah1(B) , Hussein Mohammed Abualrejal1,2
, and Ezanee Elias1,2
1 School of Technology Management and Logistics, College of Business,
University Utara Malaysia, Sintok, Kedah, Malaysia
alqudahamer99@yahoo.com, abualrejal@uum.edu.my
2 Knowledge Science Research Lab, School of Technology Management and Logistics, College
of Business, University Utara Malaysia, Sintok, Kedah, Malaysia
Abstract. The most significant changes that face organizations nowadays are the
growth of the globalization phenomenon and the new conditions and its development. In terms of the direction, the rapid growth work patterns and interactions
between these factors prompted organizations to come up with new ways, also
to deal with the suitable qualified and sudden changes affected by the changes
that the economic environment has witnessed. Quality management (QM) and the
supply chain (SC) are some of the significant changes facing organizations today
and have been highlighted in many articles. They are management philosophies,
not just simple tools or techniques. As a result, the purpose of such a study is to
examine prior studies founded on this philosophy of overloading and to provide
a fundamental notion in that framework for future research studies. This research
will look into how improving medical care and treatment services has become
urgent at the local and global levels as governments and the health care sector
have begun to adopt total quality management. The study’s goal is to provide
a completer and more achievable model of controlling the relationship between
supply chain and hospital service quality that has a significant impact on health.
The study is useful for patients and health professionals to have a fundamental
awareness of the relationship between supply chain and hospital service quality
in Jordanian government hospitals, that aims to develop a healthier and better
Jordanian generation.
Keywords: Hospital supply chain · Quality services · Government hospital
Jordan
1 Introduction
The emergence of a new Coronavirus disease has impacted public health care organizations around the world. In Jordan, Coronavirus negatively affected healthcare for patients
and has also forced a downturn in the production of medicines and respiratory equipment
throughout the industries, and has further damaged supply chains that generally maintain
© The Author(s), under exclusive license to Springer Nature Switzerland AG 2022
F. Saeed et al. (Eds.): IRICT 2021, LNDECT 127, pp. 775–784, 2022.
https://doi.org/10.1007/978-3-030-98741-1_66
776
A. Alqudah et al.
health organizations’ supplies [1]. Many organizations have adopted quality management as a key concept, and management ideology and lifestyle enable them to do so in
the face of successful and rapid environmental conditions, as well as to raise customer
awareness of the quality of the goods or services they supply [2]. Customer satisfaction is
an important part of quality assurance, and comparable customer interactions have also
been vital for improving service quality [3] To provide it, the importance of the supply
chain in this field must be recognized as a major and essential area, both in the public
and private sectors, and a significant contribution and focus on its effectiveness must be
made through the use of the supply chain management information system, which is a
part of the information system that measures, processes, and reports useful management
information in making smooth decisions [4]. Consumers are encouraged to play a more
active role in their own health management in today’s healthcare environment. The quality of medical provided, on the other hand, is extremely variable and changing. Little is
known about people’s ideas and views concerning the quality of health utilized in medical car [5]. In the face of the foreign market’s international competitive and totalitarian
environment, enterprises must implement a “quality enhancement” strategy that caters
to systems and services, allowing them to develop efficiently in international markets
[6].
In general, the implementation of the concept of TQM translates into an improvement
in service quality, which in turn leads to increased patient (customer) satisfaction, which
is also taken into account to be among the basic tools for measuring the quality of service
provided in health systems [3]. Kisuma et al. (2013) was also shown that the more
successful the service quality assessment, the more significant the appealing precedents
of customers enhance their relationship with them. Because health care providers give
reliable information (feedback) that reflects the performance of health institutions, health
care quality assessment of health care providers is a vital aspect in determining the
effectiveness of these critical sectors [7].
The healthcare industry exists to serve the public by providing patients with highquality care and safety at a low cost. As a result, having a responsive supply chain can
help achieve this goal [8]. Chowdhury and others (2017) emphasized that the fundamental goal of the supply chain in service industries is to lower the costs associated with
providing high-quality services [4]. Accordingly, the purpose of this study is to examine
the difficulties surrounding the supply chain and quality of service’ as they influence the
health of government hospitals in Jordan as a first step toward proposing an academic
improved model to improve health care service quality. In Jordan, there aren’t enough
models addressing or assessing the efficacy of the supply chain, and more models are
needed to understand its utilization and its impact on health-care quality.
2 Business Model
The study aims to clarify the impact of the dimensions of supply chain management (relationship with suppliers, specifications and standards, delivery, and after-sales service)
as the Independent variables on the dimensions of health service quality (suitability,
responsiveness, trust, and safety) in Jordanian government hospitals (the Dependent
Variables) (Fig. 1).
Hospital Supply Chain Management and Quality of Services
Dependent
Variable
Independent
Variable
Supply Chain
• Dealing with
suppliers
• Standers and
specifications
• After Sale service
777
Quality management
•
•
•
•
Tangibility
Reliability
Assurance
Empathy
Fig. 1. Research business model (Prepared by Researcher)
3 Literature Review
The researcher reviews some previous research regarding healthcare services quality
management and the supply chain of the hospital correlation of healthcare services in
Jordanian government hospitals. Therefore, the researcher introduces several SC concepts, quality management, and healthcare service quality. During the discussion of the
study theoretical literature previous studies, An overview of the development of supply
chain management and related ideas present.
3.1 HealthCare Quality Service
Quality management is considered one of the modern management concepts that continuously improves and develops understanding by responding to client requirements
continually [9]. Quality management is defined as a cooperative approach of company
performance based on the shared skills of managers and employee, with the goal of
continual quality and productivity development through work teams [10]. Quality of
health care is described by the World Health Organization as conforming to standards
and accurate performance in a safe, community-acceptable manner at a reasonable cost,
resulting in a change and influence on the percentage of illness cases, deaths, disability,
and malnutrition [11]. Many researches on assessing the quality of hospital services
and patient satisfaction have shown numerous challenges, emphasizing the importance
of continuing to pay attention to quality issues and informing hospital managers about
potential problems so that they can be addressed [12].
Quality healthcare, in the classical sense, entails meeting professional standards,
specifications, and norms. Medical personnel as nursing practiced and taught by leaders
of the medical profession during a given period of social, cultural, and professional
growth in a particular country are referred to be good medical care [13].
778
A. Alqudah et al.
3.2 Supply Chain
The theoretical frameworks addressed a wide range of definitions, expressing the ideas,
ideologies, and theoretical concepts of each researcher and thinker on the supply chain
from various conceptual angles. SC is described by the Supply Chain Management
Council as an activity chain in which raw materials are transported from a primary supplier to a final customer. Also sharing materials, information, and materials in logistical
operations ranging from collecting raw materials to delivering end-user products, as well
as all vendors and customer service providers [14]. SC defined a logical sequence of
creative value-adding activities that commence with the procurement of raw materials
and conclude with the delivery of the finished product to the end user [15]. Burns et al.
(2021) defined SC as a series of facilities, activities, functions, and organizations of
those organizations encompassed in manufacturing as well as service or product delivery, starting with raw material suppliers and extending in all directions to the ultimate
client. [16].
The Relationship Between Supply Chain and Health Services Quality Ben Daya
et al. (2020) highlighted the supply chain (SC) as one of the areas of application with
considerable potential to reap the benefits of the Internet of Things in their evaluation
of Internet of Things (IoT) applications in supply chain management. They proposed
possible study subjects that benefit from rapid technological improvements in SC, based
on the results of this literature review. [17]. In a field of knowledge on the impact
of supplier investment, quality management, and supply chain information on SME
performance, Zhou and Li (2020) investigated the importance of quality management
and value chain practices. The research added to the literature in a number of ways
[18]. Initially, it investigates the connections between supplier investment, supply chain
information sharing, quality management, along with the effects on development and
market share performance.
Furthermore, geographic settings such as coastal areas and interior provinces could
have a considerable influence on the practices and performance of SMEs in the supply
chain. Additionally, competition intensity could affect small and medium-sized enterprises’ decisions regarding investing in provider investment projects. Fourth, the different stages of development (i.e., presentation, growth, and maturity) in which SME
choices concerning supplier investment, quality management, and supply chain information sharing are unaffected. Al-Saa’da et al. (2013) from the standpoint of quality,
the dimensions of supply chain management, namely, specifications and standards, supplier connection, after-sale service, compatibility, and delivery on health care quality
and their impact on health care quality dimensions (security, response, and confidence)
in Jordan’s private hospitals were studied [19] according to the procurement staff. The
research further seeks to explain the variation between the quality of health care and supply chain as a result of certain demographic factors. According to the research, supply
chain management parameters, which include specifications and standards, after-sales
support, supplier connection, and delivery, have a moral impact on health service quality.
The outcomes, on the other hand, demonstrate that there are no sex, level of education,
age, or knowledge disparities in health-care quality, along with supply chain management. Jordan’s health-care system’s quality has been evaluated (Abu-kharmeh 2012).
The quality has been assessed in five dimensions, namely concrete, reliable, responsive,
Hospital Supply Chain Management and Quality of Services
779
assured, and sympathetic. According to the findings, Jordanian hospitals provide moderate health services. With the exception of assurance factors and the high response,
the service quality dimensions appeared likewise modest [20]. De Vries and Huijsman
(2011) centered on the topic of whether there are any parallels seen between healthcare services, along with industrial centers concerning developments in supply chain
management [21].
4 Methodology
A literature review method was used in this study depending on supply chain and healthcare service quality as well as hopes for future empirical investigations to go into the
specifics of the links between supply chain and healthcare service quality. This study
will consider the ‘supply chain and healthcare service quality among Government hospitals in Jordan with the goal of developing a new academic-enhanced approach that
would serve as a complete and achievable approach for controlling service quality that
might have a considerable effect on patients. The study’s exploratory approach attempts
to determine the impacts of the supply chain on the quality of service. The conclusions
may not be deduced from electronic sources, necessitating additional study (Table 1).
5 Discussion
Warehouses, factories, operations centers, and distribution centers are all part of supply
chains. Among the responsibilities and activities addressed are forecasting, buying, stock
management, data management, quality control, manufacturing, distribution, delivery,
and, finally, customer service. [25]. From an administrative standpoint, El-Shoghari and
Abdallah (2016) noted that supply chain management will have an impact on service
quality, as it will allow institutions to monitor service quality in order to better utilize
existing resources and attract new ones to satisfy demand. [26]. Ali et al. (2012) investigated the extent to which Jordanian hospitals use comprehensive quality management
to improve their performance. A total of two health-related industries were investigated:
Both public and private hospitals (Irbid-King Abdullah University Hospital) are available (Amman-Jordan Hospital and Medical Center) [27]. The results revealed that eight
principles of comprehensive quality management were strongly linked to the hospital’s
performance, and that overall quality management had a very good association with the
hospital’s performance in Jordan. Starting with a review of existing literature, various
approaches to supply chain integration might be examined. Additionally, knowledge
gained from the studies presented in this special issue must be reviewed and contextualized in the context of any additional investigation that could be necessary. By outlining
several important study areas that are connected to healthcare management as well as
supply chain management, this book contributes to the literature in both fields. The
researcher aids researchers and administrators in grasping the complexity of health-care
supply chain management.
780
A. Alqudah et al.
Table 1. Provides research carried out on supply chain and quality of health service.
Author
Gentle and Arrive, 2020
Independent variable
SCM
Mediating &
Dependent
moderating
variable
variable
Health care
service quality
Methodology
Findings
Qualitative analysis and
questionnaire
The findings are based on
a sample of students from
a single Italian state
institution
A cross-sectional
approach is provided in
this study [23]
Jan, De Vries, 2011
SCM
Health services
Exploratory, qualitative
approach
Starting with a
classification of current
studies, five major study
topics affecting supply
chain management in
healthcare and care
settings have been
identified. Furthermore,
in addition to studies with
a monodisciplinary
emphasis, a
multidisciplinary
attention on Supply chain
issue in health services
appears to be necessary
Xianghui Peng, 2017
SCM
A quality
The findings indicate the
efficacy of the suggested
framework. According to
the findings, SCM is an
important organizational
construct that has a
considerable beneficial
direct influence on
organizational
performance. According
to studies, SCM is also a
facilitator for
management,
measurement,
investigation, and
knowledge creation, all of
which impact
organizational success
(continued)
Hospital Supply Chain Management and Quality of Services
781
Table 1. (continued)
Author
Independent variable
Mediating &
moderating
Dependent
variable
Methodology
Findings
Qualitative analysis
The results show that
GSCPs integrate with
TQM and JIT to enhance
variable
Agyabeng-Mensah et al.,
2020
Green supply chain
TQM
OP as well as BP
significantly. However,
green TQM and supply
chain management
combination add greater
value to BP and OP as
opposed to the synergy
between GSCPs and JIT
[24]
Gutama Getele, 2020
SCM
Healthcare
Questionnaire used in
All the variables are
service quality
this study
associated; all of the
variables have a strong
and substantial
association. Current study
results show that the
quality of healthcare in
Ethiopia is linked to a
combination of timely
delivery of health care
products, specifications,
the standard of healthcare
product providers, and
after-sale services in
private health sectors
Mahmoud BakkarAbdel
Tawab, 2019
Total quality
management
SCM
Descriptive-analytical
method
The results of the positive
research of TQM in all its
dimensions (support to
senior management),
Customer focus,
continuous improvement,
employee training
working in the public
domain
The supply chain
dimensions (the company,
customer recovery,
customer relations,
information flow)
Across the supply chain,
internal supply chain
operations (public sector
industries firms
(continued)
782
A. Alqudah et al.
Table 1. (continued)
Author
Independent variable
Mediating &
moderating
Dependent
variable
Methodology
Findings
variable
Raghavendraand
Njaguna, 2015
SCM
Service quality
Clearly indicates that
there is significant
relationship between the
supply chain
Practices and the service
quality of the restaurant.
Our findings are also
discussed in terms of their
significance for practicing
managers. Our findings
imply that in their
strategic planning efforts,
supply chain managers
should consider the
practices highlighted in
this study when
determining the optimal
amount of supply chain
integration in the five
service quality
dimensions
Alsaida, 2013
Management of the
supply chain
Quality service health
In Ethiopia, the quality of
healthcare is connected to
a combination of timely
provision of health care
goods, specifications,
After-Sale services in the
private health sector, and
the standard of healthcare
product suppliers
6 Conclusion
Total Quality Management (TQM) is a method utilized by organizations that provide
high-quality service. Total Quality Management (TQM) is a management method that
gives organizations a competitive edge. TQM was defined as a change in the organization’s structure that also entails focusing the organization’s efforts on the continuous
improvement of all operations and systems, as well as, most importantly, the various
stages of work, because performance is nothing more than knowing the client’s requirements and converting them into requirements that meet the client’s requirements. In
addition, healthcare SCM is a dynamic model that takes into account production and
provider resources, as well as the availability of services and goods for patients and
providers, which is considered as an intrinsically difficult operation, which necessitates
a continuous commodities’ flow, information, orders, as well as financial transactions
among phases. Despite the fact that SCM considers a phased operation, the COVID-19
pandemic damaged the majority of the chain for several grounds, leading to a shortage
of several personal protective devices and medical services on the medical frontlines
Hospital Supply Chain Management and Quality of Services
783
because of insufficient data quality. The impact on daily life of a disturbance in the
flow of services and medical goods from the patients’ factory as well as doctors, with
far-reaching implication.
References
1. J. World Health Org. (2020)
2. Al-Maamari, Q.A., Hashemi, A., Aljamrh, B.A., Al-Harasi, A.H.: The relationship between
total quality management practices and individual readiness for change at petroleum
exploration and production authority in Yemen. Int. J. Bus. Industr. Mark. 6(2), 48–55 (2017)
3. Nguyen, T.L.H., Nagase, K.: The influence of total quality management on customer
satisfaction. Int. J. Healthc. Manag. 12(4), 277–285 (2019)
4. Chowdhury, A.H.M., Alam, M.Z., Habib, M.M.: Supply chain management practices in services industry: an empirical investigation on some selected services sector of Bangladesh.
Int. J. Supply Chain Manag. 6(3), 152–162 (2017)
5. Tao, D., Lerouge, C., Smith, K.J., De Leo, G.: Defining information quality into health websites: a conceptual framework of health website information quality for educated young adults.
JMIR Hum. Fact. 4(4), E6455 (2017)
6. Debattista, J., Auer, S., Lange, C.: Luzzu—a methodology and framework for linked data
quality assessment. J. Data Inf. Q. JDIQ 8(1), 4 (2016)
7. Cho, W.H., Lee, H., Kim, C., Lee, S., Choi, K.S.: The impact of visit frequency on the
relationship between service quality and outpatient satisfaction: a South Korean study. Health
Serv. Res. 39(1), 13–34 (2004)
8. Srivastava, S., Garg, D., Agarwal, A.: A step towards responsive healthcare supply chain
management: an overview. Adv. Manuf. Industr. Eng. 431–443 (2021)
9. Wagner, C., Groene, O., Thompson, C., et al.: Development and validation of an index to
assess hospital quality management systems. Int. J. Qual. Health Care 26, 16–26 (2014)
10. Abbas, J.: Impact of total quality management on corporate sustainability through the
mediating effect of knowledge management. J. Clean. Prod. 244, 1–11 (2020)
11. Hamed, O.: Quality of health services provided to patients in government hospitals, applying
to locality and Medani Al-Kubra, Gezira State - Sudan (2020). World J. Econ. Bus. 9(2),
318–332 (2020)
12. Parand, A., Dopson, S., Renz, A., Vincent, C.: The role of hospital managers in quality and
patient safety: a systematic review. BMJ Open 4(9), 1–15 (2014)
13. Mcglynn, E.A.: Measuring and improving quality in the US: where are we today? J. Am.
Board Family Med. 33(Supplement), S28–S35 (2020)
14. Mathur, B., Gupta, S., Meena, M. L., Dangayach, G.S.: Healthcare supply chain management:
literature review and some issues. J. Adv. Manag. Res. (2018)
15. Abdel-Basset, M., Manogaran, G., Mohamed, M.: Internet of things (IoT) and its impact on
supply chain: a framework for building intelligent, secure, and efficient systems. Futur. Gener.
Comput. Syst. 86, 614–628 (2018)
16. Burns, N., Minnick, K., Smith, A.H.: The role of directors with related supply chain industry
experience in corporate acquisition decisions. J. Corp. Finance, 101911 (2021)
17. Ben-Daya, M., Hassini, E., Bahroun, Z., Banimfreg, B.H.: The role of internet of things in
food supply chain quality management: a review. Qual. Manag. J. 1–24 (2020)
18. Zhou, H., Shou, Y., Zhai, X., Li, L., Wood, C., Wu, X.: Supply chain practice and information
quality: a supply chain strategy study. Int. J. Prod. Econ. 147, 624–633 (2014)
19. Al-Saa’da, R.J., Taleb, Y.K.A., Al Abdallat, M.E., Al-Mahasneh, R.A.A., Nimer, N.A., AlWeshah, G.A.: Supply chain management and its effect on health care service quality:
quantitative evidence from Jordanian private hospitals. J. Manag. Strategy 4(2), 42 (2013)
784
A. Alqudah et al.
20. Abu-Kharmeh, S.: Evaluating the quality of healthcare services in the hashemite of the
Kingdom of Jordan. Int. J. Bus. Manag. 7(4), 195–205 (2012)
21. De Vries, J., Huijsman, R.: Supply chain management in health services: an overview. Supply
Chain Manag. Int. J. (2011)
22. Iyengar, K., Mabrouk, A., Jain, V.K., Venkatesan, A., Vaishya, R.: Learning opportunities
from COVID-19 and future effects on health care system. Diabetes Metab. Syndr. 14(5),
943–946 (2020)
23. Getele, G.K., Li, T., Arrive, J.T.: The role of supply chain management in healthcare service
quality. IEEE Eng. Manag. Rev. 48, 145–155 (2020)
24. Agyabeng-Mensah, Y., Ahenkorah, E., Afum, E., Agyemang, A.N., Agnikpe, C., Rogers,
F.: Examining the influence of internal green supply chain practices, green human resource
management and supply chain environmental cooperation on firm performance. Supply Chain
Manag. Int. J. (2020)
25. el Shoghari, R., Abdallah, K.: The impact of supply chain management on customer service
(a case study of Lebanon). Management 6(2), 46–54 (2016)
26. Agyabeng-Mensah, Y., Afum, E., Agnikpe, C., Cai, J., Ahenkorah, E., Dacosta, E.: Exploring
the mediating influences of total quality management and just in time between green supply
chain practices and performance. J. Manuf. Technol. Manag. (2020)
27. Ali, J., Kumar, S.: Information and communication technologies (ICT) and farmers’ decisionmaking across the agricultural supply chain. Int. J. Inf. Manag. 31(2), 149–159 (2011)
Author Index
A
A. Iahad, Noorminshah, 677
Abang Jawawi, Dayang Norhayati, 129
Abbas, Haider Hadi, 423
Abd Halim, Shahliza, 50
Abd Wahab, Alawiyah, 559
Abdirahman, Abdullahi Ahmed, 16, 583
Abdullah, Azizol, 258, 397
Abdullahi, Marzuk, 333
AbdulSamad, Umar, 630
Abdulshaheed, Haider Rasheed, 423
Abualrejal, Hussein Mohammed, 775
Abualrejal, Hussein Mohammed Esmail, 663
Aburahmah, Linah, 616
Adedokun, Folashade Oyinlola, 723
Adnan, Asmalinda, 571
Ado, Abubakar, 105
Ahmad, Maryam, 309
Ahmad, Norasnita, 723
Ahmed, Ahmed Abdullah, 524
Ahmed, Ehsan Qahtan, 423
Aik, Kevin Loo Teow, 524
Ait Oussous, Salma, 359
Ajibade, Samuel-Soma M., 95
Aladesote, Olomi Isaiah, 397
Al-Barazanchi, Israa, 423
Al-Dhaqm, Arafat, 473
Al-Hadhrami, Tawfik, 461
Al-Harbi, Hanan, 3
Al-Harbi, Heba Abdullah, 295
Alharbi, Nouf, 295
Ali, Abdulalem, 473
Ali, Ahmed Ali Atieh, 663
Ali, Ali H., 73
Alias, Rose Alinda, 641, 707
Alkhammash, Eman H., 319
Alkhammash, Reem, 333
Al-Kumaim, Nabil Hasan, 160, 173
Almazroi, Abdulaleem Ali, 173
Almazroi, Abdulwahab Ali, 160, 173
Al-Mohammadi, Ohoud Moqbel, 295
Almomani, Iman, 3
Almuhaya, Mukarram A. M., 345
Almuntashiri, Abdullah H., 283
Almusawi, Athraa, 73
Al-Nahari, Abdulaziz, 371
Al-Nuzaili, Qais, 193
Aloufi, Omar F., 283
Alqahtani, Fayez Hussain, 446
Alqudah, Amer, 775
Al-Rehaili, Raghad Abdullah, 295
Al-Rehaili, Shatha Abdulhadi, 295
Alromema, Waseem, 62, 117
Alsalka, Mhd Ammar, 283
Al-Sanjary, Omar Ismael, 524
Al-Sarem, Mohammed, 283
Alsheikh, Ghaith, 663
Al-Suhaimi, Rahaf, 3
Alwesabi, Yaseen, 769
Angraini, 641
Arshad, Noreen Izza Bt, 309
Asl, Moussa Pourya, 219, 231, 243
Asri, Muhamad Aiman Zikri Bin Muhamad, 219
Awal, Aisha, 117
Awuson-David, Kenny, 461
Ayadi, Amira, 209
Ayanlade, S. O., 385
Azuddin, Muna, 616
© The Editor(s) (if applicable) and The Author(s), under exclusive license
to Springer Nature Switzerland AG 2022
F. Saeed et al. (Eds.): IRICT 2021, LNDECT 127, pp. 785–787, 2022.
https://doi.org/10.1007/978-3-030-98741-1
786
B
Bajit, Abderrahim, 359, 498, 512
Beloualid, Siham, 359, 498, 512
Bouattane, Omar, 737, 748
Boulehmi, Mongi, 209
Budiarto, Eka, 270
C
Chaoui, Habiba, 498
Chweya, Ruth, 95
D
Dahlan, Halina Mohamed, 541
Deris, Mustafa Mat, 105
Dinh, Dong, 769
Driss, Maha, 3
E
Ech-Chkaf, Ayoub, 498
El Aidi, Sanaa, 359, 498, 512
El Allali, Abdelhadi, 359, 498, 512
El Harrouti, Taoufiq, 359, 498
Elias, Ezanee, 775
Elmi, Mohamed Abdirahman, 16, 583
Emara, Abdel-Hamid, 283
Emara, Abdel-Hamid M., 26
Eneizan, Bilal, 663
Ezekiel, S. O., 385
F
Fadipe, Samuel, 95
Faisal Mohamed, Nur Fadziana, 677
Fasha, Ezqil Fasha Bin Kamal, 231
Fazea, Yousef, 371
Franzoi, Robert, 759
G
Gabr, Dalia Goda, 26
Garba, Salisu, 333
Gazem, Nadhmi A., 663
Ghaleb, Fuad A., 193
H
Hair Zaki, Ummu Hani’, 50
Hairudin, Humaira, 541
Hamdi, Ali, 193
Hamid, Muhammad Fariq Abdul, 697
Hamza, Fatima Zahra, 512
Hashi, Abdirahman Osman, 16, 583
Hashim, Ibrahim Abaker Targio, 160
Hitam, Nor Azizah, 319
Hossain, Md Ismail, 651
Hossain, Sheikh Md. Hanif, 141
Hussein, Ibrahim Hassan, 16
Author Index
Hussin, Ab Razak Che, 604
Hussin, Masnida, 258
I
Ibrahim, Nehad M. Abdulrahman, 26
Ibrahim, Roliana, 50
Ighe, Mohamed Aden, 551
Iqbal, Muhamad Saqib, 688
Ismail, Amelia Ritahani, 319
Ismail, Nor Haslinda, 707
J
Jabar, Marzanah A., 583
Jabbar, Waheb A., 345
Jalil, Norazira A., 604
Joseph, Elijah, 117
K
Kamsani, Izyan Izzati, 50
Kasim, Anisah, 435
Keikhosrokiani, Pantea, 219, 231, 243
L
Lah, Nur Syadhila Che, 604
M
Mahmood, Raja Azlina Raja, 258
Malik, Sofianiza Abd, 616
Marie, Rashiq Rafiq, 151, 473
Marzouki, Faouzi, 737, 748
Menezes, Brenno, 413, 759
Mishra, Amit, 117
Miskon, Suraya, 723
Mohamad, Mohd Murtadha, 435
Mohammed, Fathey, 160, 173, 371
Mohammed, M. N., 524
Mohammed, Siti Asma, 551
Mokhtar, Nurhidayah, 559
N
Narawi, Azlina, 129
Naser, Samy S. Abu, 663
Nasser, Maged, 117, 333, 473
Nazri, Nur Intan Adhani Muhamad, 594
Nordin, Azlin, 551
O
Obaid, Tareq, 663
Ogunbolu, Mary O., 95
Ogunwole, E. I., 385
Okfalisa, 84, 641
Othman, Siti Hajar, 473
Othman, Syed Muhammad Nazir Bin Syed, 713
Oussous, Salma Ait, 498
P
Paremeswaran, Punetham a/p, 243
Author Index
Q
Qureshi, Muhammad Ahsan, 160
R
Rabiu, Idris, 117
Rahim, Zulhasni Abdul, 688, 697, 713
Rahman, Nor Azian Abdul, 688
Rambli, Dayang Rohaya Awang, 594
Razak, Shukor Abd, 473
Rodriguez, Octavio Ernesto Romo, 16, 583
Romli, Rohaida, 559, 571, 630
Romli, Rusnida, 559
Rusnedy, Hidayati, 84
S
Saeed, Faisal, 117
Saktioto, 84
Salah, Hamzah, 483
Salim, Naomie, 117
Salimon, S. A., 385
Samsudin, Noor Azah, 105
Samsudin, Ruhaidah, 62, 129, 319
Sanfilippo, Antonio, 759
Sarlan, Aliza Bt, 309
Sawaly, Mohammed, 759
Shaban, Khaled, 193
Shabri, Ani, 38, 62, 151
Shah, Asad Ali, 160, 173
Shanmugam, Mohana, 651
Sharifai, Abdurra’uf Garba, 105
Siburian, Rizal, 84
787
Siregar, Junita Juwita, 270
Subri, Nor Fatiha, 604
Sulaiman, A. H. A., 345
Sulaiman, Assif Shamim Mustaffa, 151
Sulaiman, Noorazliza, 345
Sulaiman, Suriani, 141
T
Tamtaoui, Ahmed, 512
Tamtoui, Ahmed, 359, 498
Thompson, James, 461
Tuner, Kiran, 461
U
Udzir, Nur Izura, 258
Ujan, Cindy, 435
V
Vitriani, Yelfi, 84
Y
Yachou, Mohammed, 359
Yaqot, Mohammed, 413, 759
Yola, Melfa, 84
Yusof, Ahmad Fadhil, 651
Yusoff, Nooraini, 559
Z
Zakari, Abubakar, 160
Zhang, Xilin, 769
Zuhair, Hiba, 483