/


Text
MM
RAY 1MIN6
PETER SHIRLEY
1
V
r
^
r
' i
Realistic Ray Tracing
PETER SHIRLEY
H
A K Peters
Natick, Massachusetts
Editorial, Sales, and Customer Service Office
A K Peters, Ltd.
63 South Avenue
Natick, MA 01760
Copyright © 2000 by A K Peters. Ltd.
All rigffts reserved. No part of the materia3 protected by this copyright notice may
be reproduced or utilized in any form, electronic or mechanical, including
photocopying, recording, or by any information storage and retrieval system, without
written permission from the copyright owner.
Library of Congress Cataloging-in-Publication Data
Shirley. P. (Peter), 1963-
Realistic ray tracing / Peter Shirley.
p. cm.
Includes bibliographical references and index.
ISBN 1-56881-110-1 (alk. paper)
1. Computer graphics. I. Title.
T385 .S438 2000
006.6'2—dc2I 00-039987
Printed in Canada
04 03 02 01 00 10 9 8 7 6 5 4 3 2 1
Contents
Preface ix
Introduction xi
I The Basic Ray Tracing Program 1
1 Getting Started 3
1.1 RGB Colors 3
1.2 Images 4
1.3 Vectors 4
1.4 Rays 7
1.5 Intervals 7
1.6 Orthonormal Bases and Frames 7
1.7 Transformation Matrices 9
2 Ray-Object Intersections 17
2.1 Parametric Lines 17
2.2 General Ray-Object Intersections 18
2.3 Ray-Sphere Intersection 21
2.4 Ray-Box Intersection 22
2.5 Ray-Triangle Intersection 24
2.6 More Than One Object 28
2.7 A Simple Ray Tracer 29
3 Lighting and Shadows 31
3.1 Implementing Lighting 31
3.2 Adding Shadows 32
3.3 Outward Normal Vectors 34
V
vi Contents
4 Viewing 37
4.1 Axis-aligned viewing 37
4.2 Setting View Parameters 39
5 Basic Materials 43
5.1 Smooth Metal 43
5.2 Smooth Dielectrics 44
5.3 Polished Surfaces 47
II Bells and Whistles 51
6 Solid Texture Mapping 53
6.1 Stripe Textures 53
6.2 Solid Noise 54
6.3 Turbulence 56
6.4 Bump Textures 56
7 Image Texture Mapping 59
8 Triangle Meshes 63
9 Instancing 67
9.1 Intersecting Rays with Transformed Objects 68
9.2 Lattices 69
10 Grids for Acceleration of Intersection 71
10.1 Grid Traversal 71
10.2 Grid Creation 76
III Advanced Ray Tracing 79
11 Monte Carlo Integration 81
11.1 Monte Carlo Overview 81
11.2 A Little Probability 83
11.3 Estimating Definite Integrals 87
11.4 Quasi-Monte Carlo Integration 88
11.5 Multidimensional Monte Carlo Integration 89
11.6 Weighted Averages 91
11.7 Multidimensional Quasi-Monte Carlo Integration 92
12 Choosing Sample Points 95
12.1 Overview 95
12.2 Generating ID Random Numbers With Nonuniform Densities . . 96
12.3 Generating 2D Random Numbers With Nonuniform Densities . . 97
Contents
98
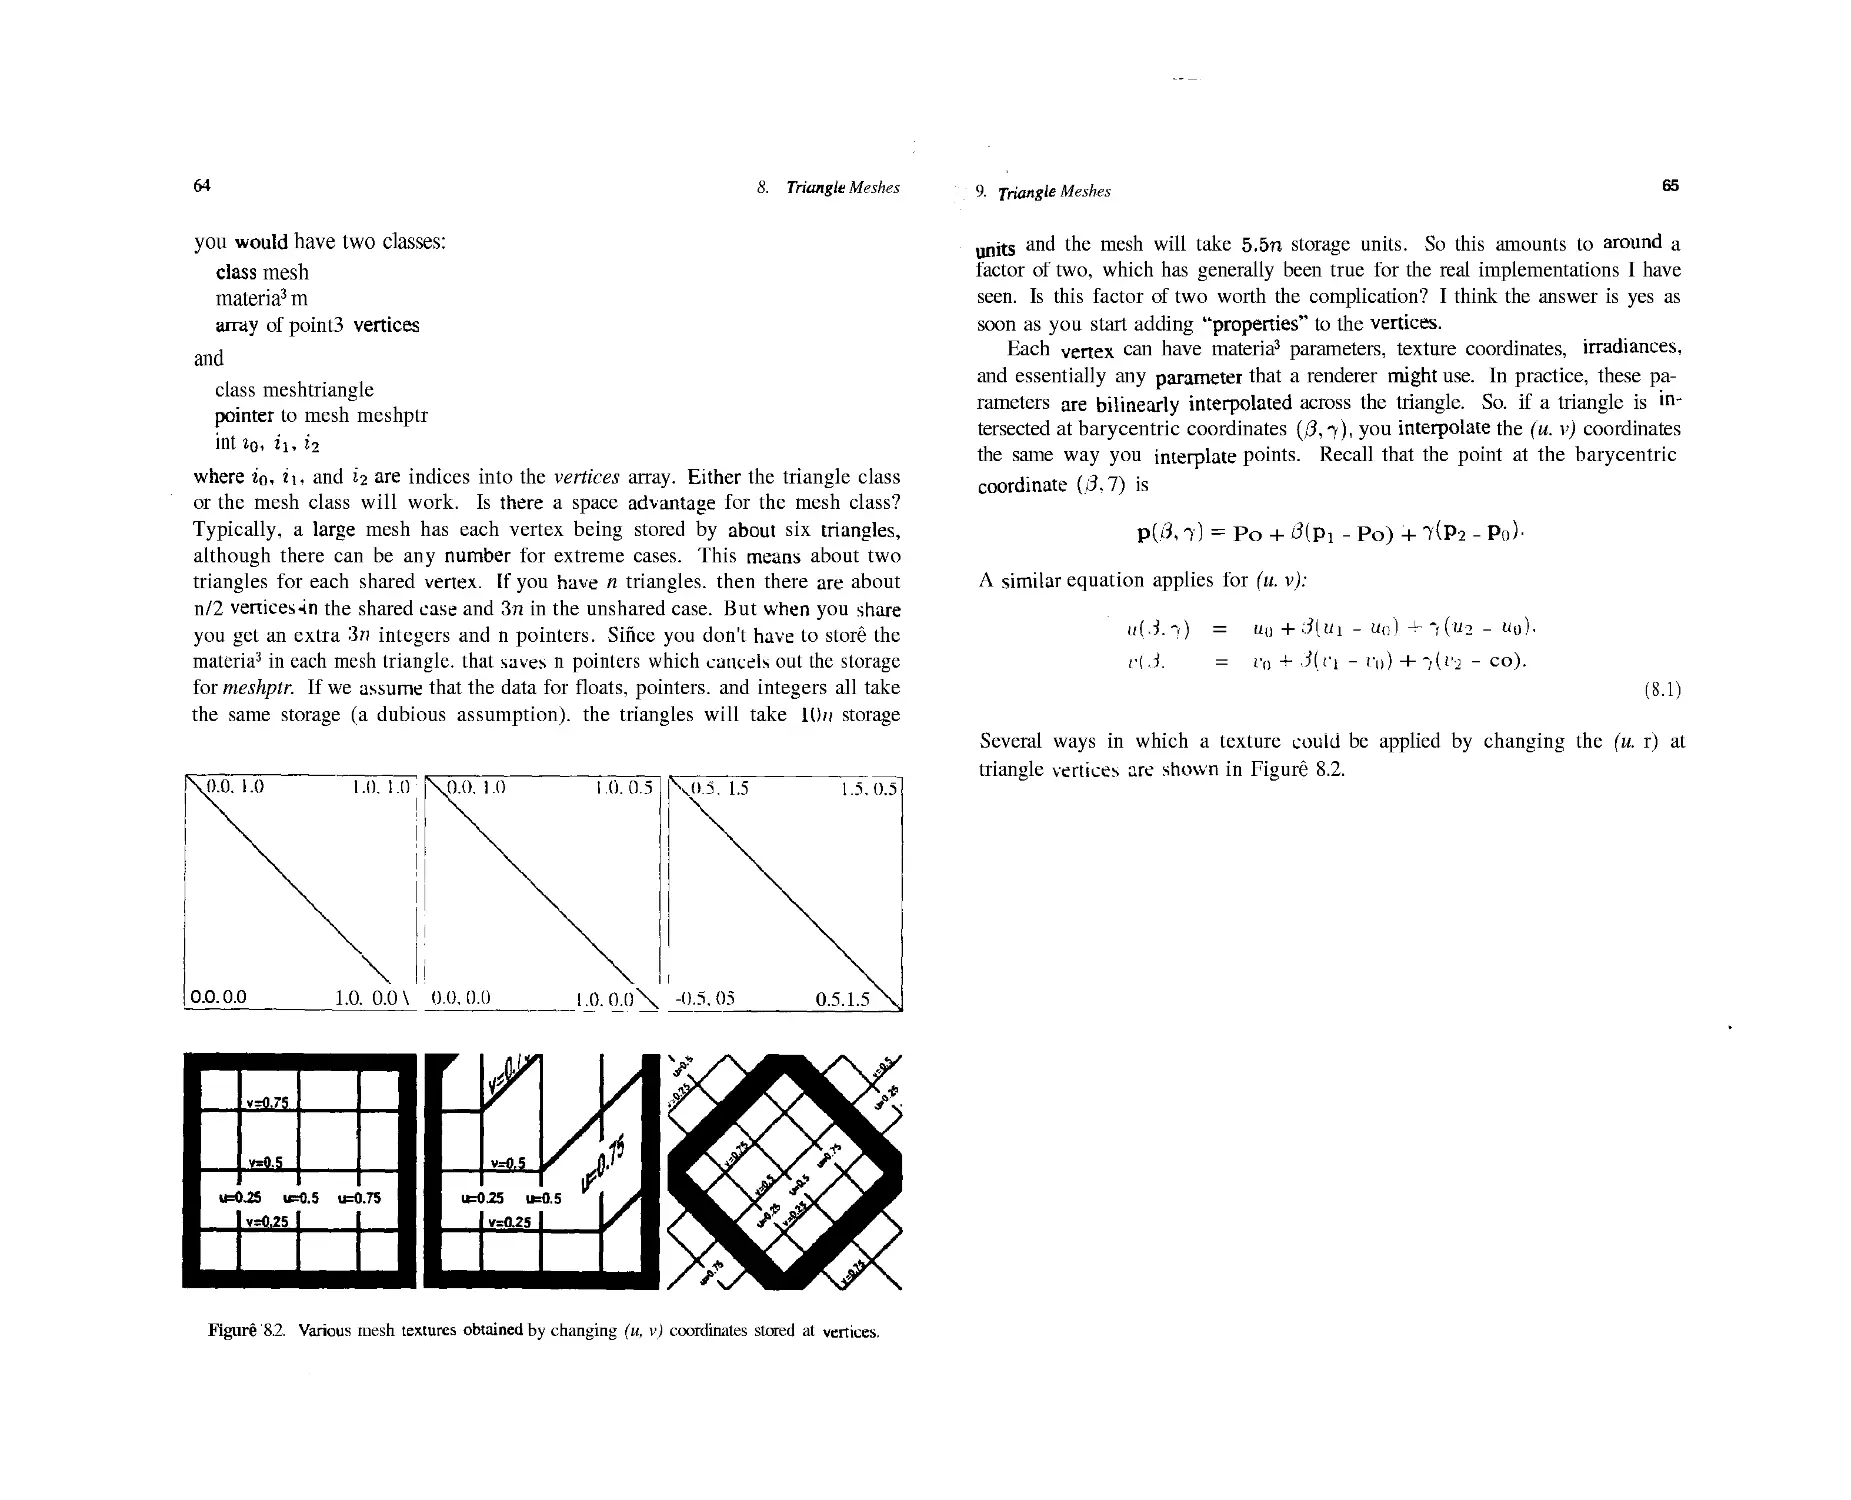
12.4 Sampling Triangles
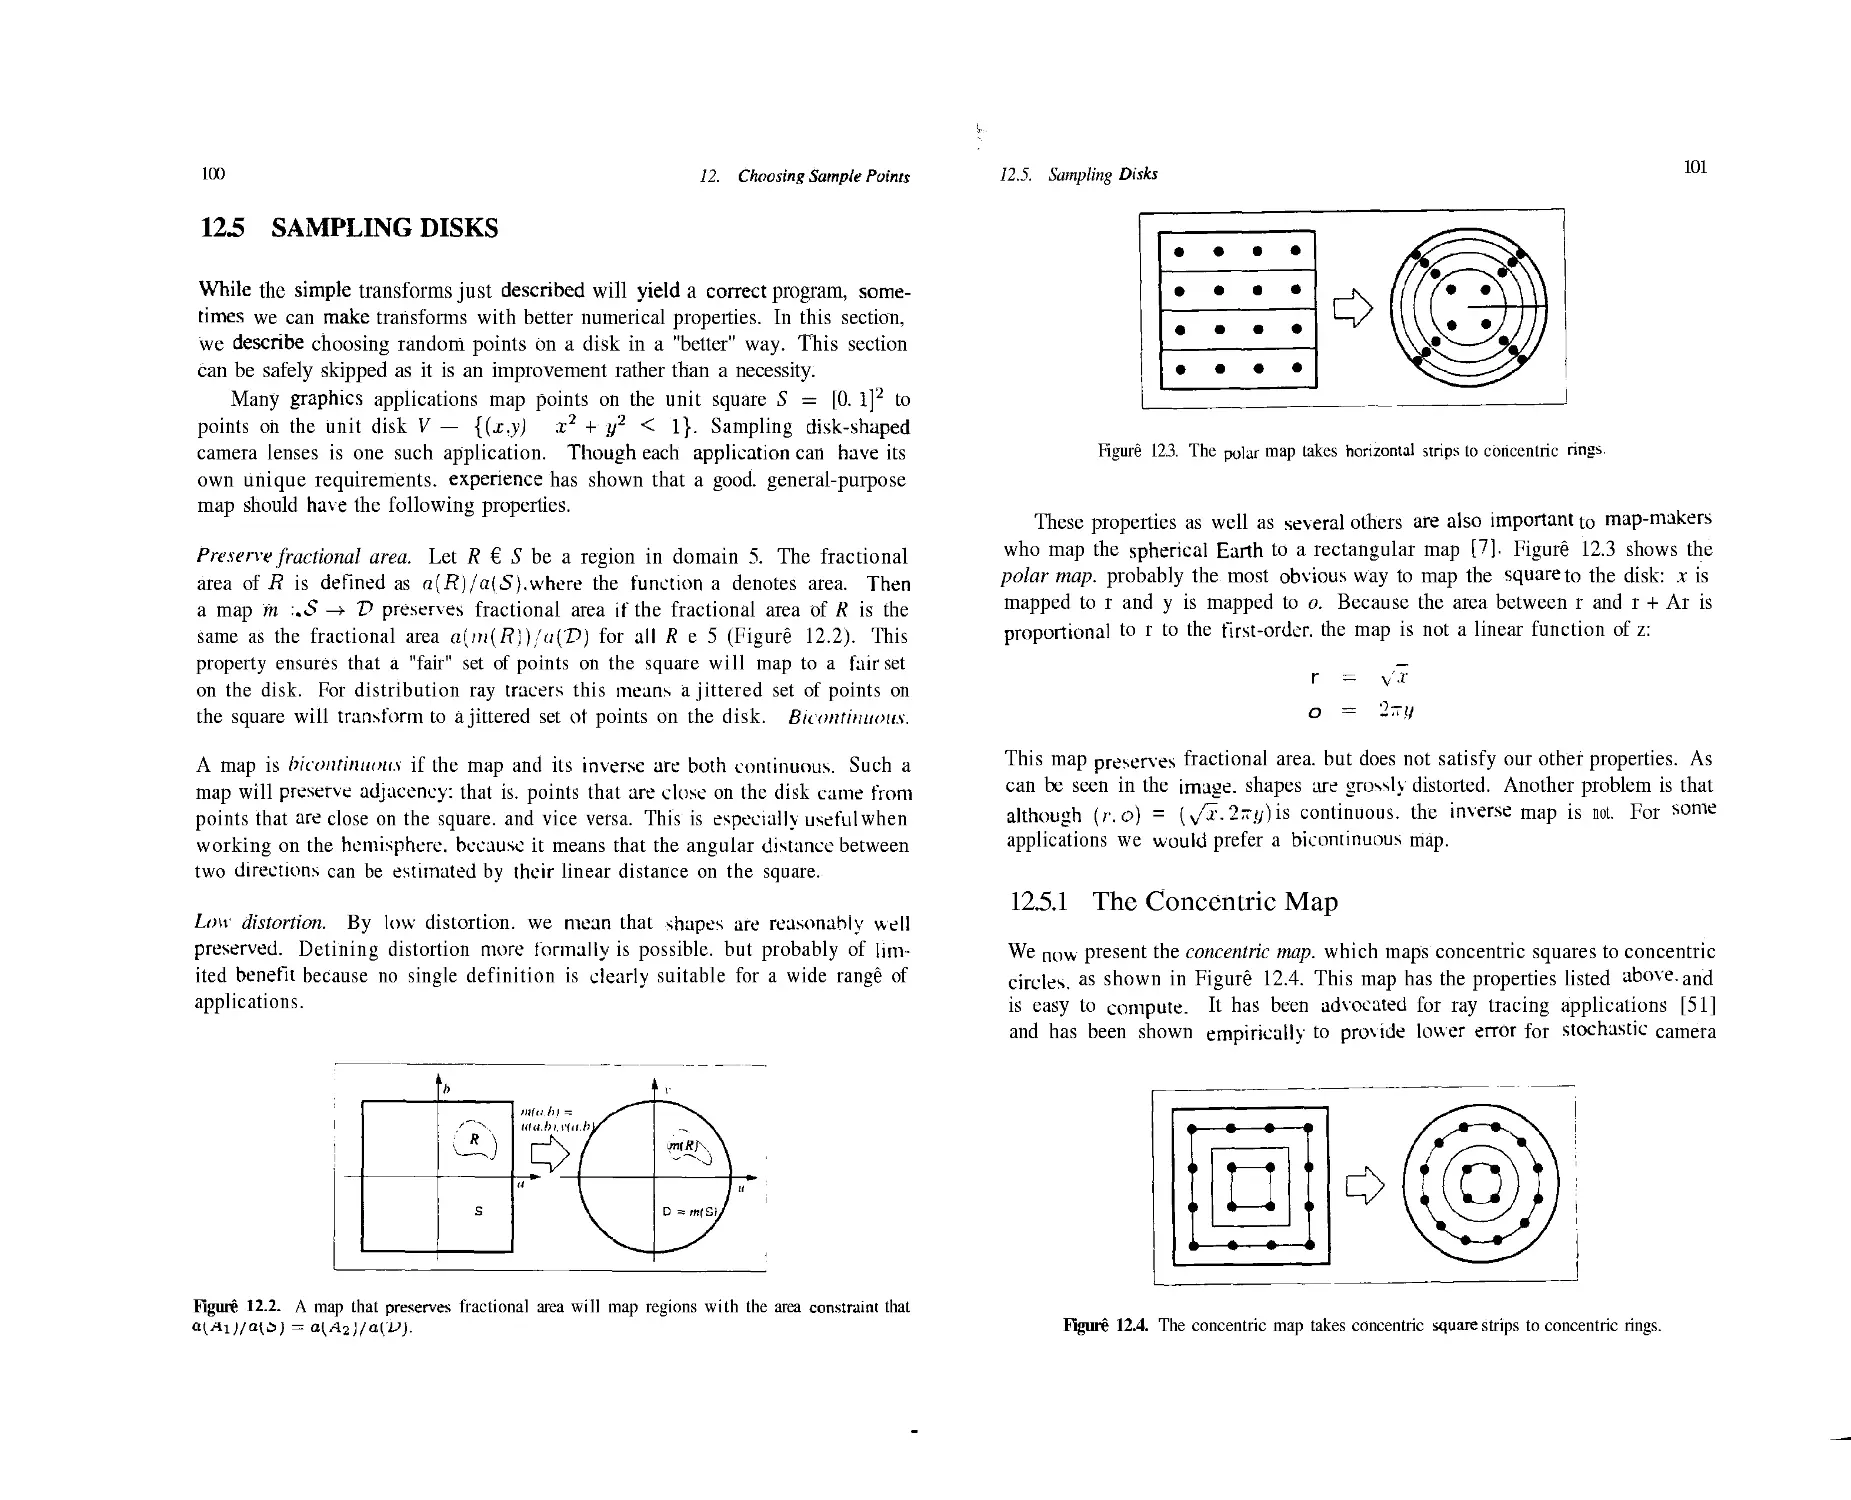
12.5 Sampling Disks . iUU
13 Antialiasing ^
13.1 Rasters 105
13.2 Display Devices 106
13.3 Filtering 107
13.4 Sampling U0
14 Cameras 113
14.1 Thin-lens cameras 113
14.2 Reai Cameras 113
14.3 Multidimensional sampling 116
15 Soft Shadows 119
15.1 Mathematical Framework 119
15.2 Sampling a Spherical Luminaire 122
15.3 Nondiffuse Luminaires 124
15.4 Direct Lighting from Many Luminaires 124
16 Path Tracing 129
16.1 Simple Path Tracing 129
16.2 Adding Shadow Rays 133
16.3 Adding Specularity 135
17 General Light Reflection 137
17.1 Scattering functions 137
17-2 An Advanced Model 139
17.3 Implementing the Model 142
17-4 Including Indirect Light 145
18 Spectral Color and Tone Reproduction 147
18.1 Spectral Operations 147
18.2 Luminance 148
18.3 CIE Tristimulous Values 148
18-4 Tone Mapping 151
19 Going Further 153
Bibliography 155
Index
163
Preface
The main code I use to generate images is a ray tracer. The basie ray tracing
concepts were developed and popularized primarily by Turner Whitted in the late
1970s and early 1980s. These were expanded into some probabilistic ray tracing
by Rob Cook and Jim Kajiya in the mid 1980s. Most of the book's content is
due to these pioneers. Of course, many other people dealt with tracking the
movement of rays around an environment, such as Appel and Kay, and with
luck a full history of computer graphics will get written up someday.
I have taught people about ray tracers in several classes and seminars at
Indiana University. Cornell University, and the University of Utah. The notes
from these classes have grown into this book. This book is intended to fill in
missing details that I am always wishing were in the books I read. Itwas never
meant to be a survey, and I hope that it doesn't read like one. Its subtitle could
be "how Pete Shirley implements a ray tracer," and it should be read in that
light. There are many things I don't cover due to my priorities and sometimes
ignorance, but if you find you are missing something important, or have a better
way to do something, especially if it is simpler. I'd love to hearabout it.
If you want to learn everything about ray tracing, there is a variety of books
that you should read, but the most complete collection is the online Ray Tracing
News, edited by Eric Haines. This is a remarkably complete discussion of ray
tracing issues by hard-core ray tracing geeks. Eric also runs the annual ray
tracing meeting at the SIGGRAPH annual conference. I hope you will make
it there! Eric deserves special praise for his many selfless contnbutions to this
field.
ABOUT THE COVER
The cover image was modeled by Bill Martin at the University of Utah. It uses
the "Utah Teapot" developed by Martin Newell in the 1970s. In the reflections
x Preface
are one of the first ray traced images by Turner Whitted, and one of the first
bump-mapped images by Jim Blinn. The ray tracer that generated the image was
written by Steve Parker at The University of Utah with a little help fromPeter-
Pike Sloan, Bill Martin, and myself. It can run interactively on medium-sized
images on a parallel computer. The serial portion of that code is essentially what
is presented in the first two parts of this book.
ACKNOWLEDGEMENTS
This book would not have been possible without the many students who have
helped me determine which presentation methods work best. In addition, much
of the materia3 in the book has been taught to me by my teachers, students,
and co-workers. In particular. Teresa Hughey taught me many fundamentals
of ray tracing; Don Hearn taught me how to make transform matrices simple:
Greg Rogers and Kelvin Sung helped me understand how to use object-oriented
programming without becoming a zealot: Don Mitchell provided many e-mail
answers to sampling questions I never would have worked out on my own: Jim
Arvo helped me understand much of the mathematics behind rendering
algorithms: Steve Marschner helped me with many subtle coding and algorithmic
issues'. Brian Smits and Steve Parker have given me many details of
implementation and optimization that have made my code simpler and faster.
Michael Herf. Steve Marschner, Peter-Pike Sloan, and Mike Stark were
extremely helpful in improving drafts of the book. Michael Ashikhmin develpedthe
reflection model presented in Chapter 17 and graciously allowed me to include it
before its publication. My parents. Bob Shirley and Molly Lind, provided some
crucial baby-sitting that allowed the book to get done. My wife Jean did allthe
work in our household for a year, or the book never would have happened.
Alice and Klaus Peters deserve special credit for encouraging me to write
this book, and I am very grateful to the publisher of this book. A K Peters, for
their great dedication to quality publications.
Peter Shirley
Salt Lake City. USA
April, 2000
Introduction
This book will show you how to implement a rax tracer. A ray tracer uses simple
local algorithms to make pictures that are realistic. Ray tracing is becoming more
and more popular because of increases in computing power and because of lts
ability to cleanly deal with effects such as shadows and transparency. It has even
been used in feature animations, and it is just a matter of time before it is used
in video oames. Most importantly. I think writing ray tracing code is fun. and it
is a great way to learn many graphics concepts.
An overview of a ray tracing program is shown in Figure 1- Here. fae eye js
at point e and it is looking through a 3D "window" at two shaded spheres. For
each point on the window we send a 3D "ray" to that point and extend it into
the scene as shown by the arrow and dotted line. Whatever this ray hits first is
what is seen in that pixel. Each pixel can be computed independently by simple
computations to form the image shown in the lower-lettof the figure. The two
majn tasks of the program are determining what point on what object js hit, and
what coior that point is. The first task will require intersecting 3D 'ines with
surfaces sucn as spheres, which will require some mathematics. Determining
the color will require some simple physics and the generation of rays from the
intersection point to see how the world "looks" to that point. All of this will turn
out to be quite elegant, which is why people usually enjoy writing ray tracing
programs.
The book is divided into three parts:
• part I The Basic Ray Tracing Program shows how to write a program
to make simple images.
• Part II Bells and Whistles gives several independent extensions which
can be added to your program. These chapters can be read in any order.
• Part m Advanced Ray Tracing shows you how to add special effects
such as soft shadows, depth-of-field, motion-blur, and indirect lighting.
Introduction
IMgure 1. An 'overview of the ray tracing .concept.
My (general3[philosophy iisithat'dleani mathematics* maps' directly to> clean'code.
The text 'wSlllibe-veryidetail-orientedi Nothing 'will Ibe Heft as ;an exercise to the
ireader. )I also assume some comfort with high-school mathematics in genera8. If
you are math-phobic, mow iis (the itiime ito iGure yourself; 'take lit: slowly, and keep
itJhe (a%dbr<a ifirmly mapped to the geometry: Read every .-'cction carefeffly. and
jgo on to itlhe imexit section only when you are iready. Just don't give up! A firm
grasp of the fundamentals iis lhard if© (get. but wiffll Uas't ■& Hifetime.
Throughout ittie Ibook, )I .assume (thatiilight obeys ithe i niles'of ,'geometrie op-
itics andithatjpolarization'does mo't'exist. This iis'Of course not true—Konnen's
took l[2S] Contains teamy 'examples 'where polarization is very important, and
diffraction is visible 'on isany animals' 'exteriors—butffor at lleast the next couple
'of decades,.a lack of polarization .or physicalioptics effects willi not be the biggest
llifiitationf 6ft rendering'cotes. iFfaorescence is another issue I do not deal with.
This is am iimnpoiitamtt 'effect, especially in man-made environments where almost
revery bright rcolor iis ipartially'duetto J fluorescence. fQlassner |[1:S] developed a
Metkod (to iindltrde (fluorescence in ra Tenderer which interested readers should
"Consult.
il'do fflot 'talk.'about/radiosity, which'already ifias ! three/good books 'devoted
ito ift l[5., % 36]. 'There .'are also riiahy topics related to. Monte' Carlo sampling,
variants 'of jpath 'tracing, and hybrid algorithms which will be skipped entirely.
iFor a teoaier (treatment of image synthesis algorithms, the reader should con--
rsrilt(theUWo^v6tonieslhyrfflassner([r6],randfthelbook by Watt and Watt |[7'0].
JFor an excellent treatment of interactive rendering, see the book by Moller arid
iHainesf35].
Introduction
I build up the ray tracer one step at a time, and your progg™™ wlU expand
wira each chapter. There will ibe images in each chapter you j should duplicate.
I emphasize a clean program and .leave -efficiency as a second^ pnonty. C ean
programs .are usually :fast programs, so this won't cause as ms^any problems as
you .might expect. At the end, you willhave a really powerful ] program wou
a jot ,of code. This program can be improved in the many ways s discussed ^ gjg
:last chapter, but it will be very useful as is. Let's begin!
Parti
The Basic Ray Tracing Program
1
Getting Started
Underlying any graphics program is utility code that allows us to think and
program at a higher level. In ray tracing programs, there are certain pieces of
utility code that pop up repeatedly and are worth coding up front. This chapter
descnbes what code you can write before getting started. It uses the vocabulary
of an object-oriented language such as C++ or Java, but the principles apply to
any language.
1.1 RGB COLORS
Your output image will be in a "red-green-blue" color space, referred to for the
rest of the book as RGB. You should have three real numbers to represent the
three components.
You will want to make all the "normal" arithmetic operations work with
RGBs. Given RGBs a, b. and scalar k, the following operators should be
implemented:
-l-a = (a,-. a3. Oj,).
-a = (-a,..-ag.-a6).
k * a = {kar,kag. kcib) .
a*k = (kar.kag. kai,) ,
a/k = (ar/k,ag/k,abfk).
a + b = {ar+br,ag + bg,at, +bb),
a-b = (aT—br,ag—bg,ai,—bb),
a*b = (aTbT,agbg,abbb),
a/b = (aT/br,ag/by,ab/bt,)
3
4
1.2 IMAGES
You will want to use simple 2D arrays of RGB colors both for storing your
computed image and for texture-mapping.
You will want to write a few utility functions to output images, either as
they are computed or as they are finished. If you output to a file, use whatever
format is easiest to implement. You can always convert the files you want to
save to a compact or portable format offline.
For now, assume the convention that colors whose components are all zero
are black, and colors whose components are all one are white. That is, if
RGB = (1, 1, 1) that represents the color white. You must usually convert each
of these numbers / € [0.1) into a one byte quantity i € {0,1,..., 255}, where
[0,1) indicates the interval of numbers between zero to one including zero but
not one. This is accomplished with i = mi(256* /). If you are not sure that /
is in that range, an "if" should be added to force i within the range. On most
systSms, the intensity on the screen is nonlinear; ;' = 128 is significantly less
than half as bright as i = 255. The standard way to handle this is to assume the
screen or printer has a "power curve" described by a parameter gamma -..
/ ' V
briahtness x 1 -— ] .
V255/
Thus the "gamma-corrected" image that you output should be
i = mr(256*/%
The values of gamma for most systems range from 1.7 to 2.3. Most PCs are 2.2
and most Macs are 1.8. The emerging standard "sRGB"' uses gamma 2.2. See
www.srgb.com for details. A more complete discussion of this topie is given in
Glassner's two volume text [16] and in Chapter 13.
1.3 VECTORS
A vector describes an n-dimensional offset or location. For our purposes, we
need 2D and 3D vectors. Rather than trying to write an n-dimensional class,
you should write two classes vector2 and vector3.
For the actual storage of the (x, y, z] cordinates you should use an array.
For example, you should have dotal3J rather than x, y, z. This allows a
member function element(i) which returns the ith data element without using any ;/
statements. For example, v.element(l) should return the y coordinate of v. This
is most efficient if an array is used.
1,3, Vectors
5
You may want to make a separate point class to store locations, but my
current belief is that although this improves type checking and aids implicit
documentation, it makes coding more awkward in practice. So I advocatejust
using vectors to store points; the value of the vector is the displacement from
the point to the origin.
The length of a vector a = (ax,ay, az) is given by
llal'l = ya* -t-aj+a*.
You should have member functions that return Mall and ||a||2. If the length of
v is one, it is called a unit vector. You may want a special class for that, and
you may not. It strengthens type checking, but can interfere with efficiencyanQ
increases the number of possibly nonobvious type conversions.
You will want to make all the "normal" arithmetic operations for vectors.
Given vectors a b. and scalar k, the following operators should be implemented:
-i-a
-a
k * a
a,* k
a/fr
a4- b
a-b
=
=
=
=
=
=
=
(ax.ay.az).
(-ar.-ay.-a:),
[kaT.kay. kaz).
{ktij.kay. ka-).
[ar/k.ay/k.a:/k),
(«.,.+ bj-- fiy + by. az + b:).
(<!• _ fcj-.ay - bu.a: - b:) .
There are two important operators for 3D vectors; the dot product (•) and
the cross product (•<). To compute these use the following formulae:
a-b = aTbx + ayby + a:bz.
a x b = ( a:/b: - azby. a-ftr - axb:, axby - aybz ) ■
Note that the dot product returns a scalar and the cross product returns a 3D
vector. The dot product has a property that is used in an amazing number of
ways in various graphics programs:
a b = ||a]| ||b|| cos0,
where d is the angle between a and b. The most common use of the dot product
is to compute the cosine of the angle between two vectors If a and b are unit
vectors, this is accomplished with three multiplications and two additions.
The cross product a x b has a different, but equally interesting, geometrie
property. First, the length of the resulting vector is related to sin 8:
||axb|| = l|a||||b||sin0.
6 /. Getting Started
,,
f)
t£
aXb
J
-"""h
a
Figure 1.1. To establish whether a x b points "up" or "down." place your right hand in a way that
your wrist is at the bases of a and b and your palm will push [he arrow of a toward the arrow of
b. You thumb will point in the direction of the resulting cross product. Since x. y. and z obey this,
they are referred to as a "right-handed" coordinate system.
In addition, a x b is perpendicular to both a and b. Note that there are only two
possible directions for such a vector. For example, if the vectors in the direction
of the.r-. y- and c-axes are given by
x = (1.0.0),
y = '(0.1,0),
z = (0.0.1).
then x x y must be in the plus or minus z direction. You can compute this to
determine that in fact, x x y = z. But how do we visualize what the geometrie
configuration of these vectors is? To settle this, a convention is used: the right-
hand rule. This rule in illustrated in Figure 1.1. Note that this implies the useful
properties:
x x y = +z,
y x x = -z,
y X z = +X,
z '-x y = —x,
z x x = -t-y,
x x z = —y.
1.4. Rays 1
1.4 RAYS
A 3D ray is really a 3D parametric line. It is usually called a ray by graphics
programmers for reasons discussed in the next chapter. A ray is defined by an
origin location o and a direction vector d. A ray class is very simple; it has
these data members and one function: point-at-parameter(t) which returns the
point o + td for scalar /. There should be no restriction that d be a unit vector,
as will be discussed in Chapter 9.
1.5 INTERVALS
An interval is a set of points bounded by an ordered pair [a, b\ where b > a.
Intervals are useful in a variety of contexts. You will want to implement a
boolean function that tells whether a scalar t is within the interval, a boolean
function that tells whether two intervals overlap, and a function that computes
the (possibly empty) interval of overlap between two intervals. For example, the
overlap between [1.3jand [2. 7j is [2. 3j.
1.6 ORTHONORMAL BASES AND FRAMES
Graphics programs usually manage many coordinate systems. For example, in a
flight simulator the airplane is stored in the coordinate system aligned with the
fuselage, wings, and tail. The orientation part of such a coordinate system is
stored as three orrhonormal vectors u. v, and w. which are unit length, mutually
perpendicular, and right-handed (u x v = w). These three vectors are called the
basis vectors of the coordinate system. As a set they are an orthonormal basis
(ONB).
The x, y, and z vectors form a special ONB called the canonicalbasis. This
•s the natural basis of our program, and all other bases are stored in terms of it.
For example, any vector can be stored in xyz coordinates:
a = («j-, ov, fij.) = axx + ayy + a.z.
We are so : familiar with this that we sometimes forget what these coordinates
mean. The coordinates (ar,ay.az)are computed by dot product as
ax = a • x,
ay = ay,
a, = a • z.
g
1. Getting Started
The same would apply for any ONB. For example,
a = (a • u)u + (a • v)v + (a • w)w.
In programs we would often store these coordinates as [0^,^,0^. You might
have two different vectors declared a and a-uvw that have different numbers in
them, but represent the same directions. Note that I do not say the first vector
is a-xyz—the default coordinate system is the canonical one. These vectors
are the same geometrically even though they have different components. You
would multiply them by different basis vectors before you would compare their
coordinates. As you will see, we will use a noncanonical coordinate system when
it is convenient, and that will make a-xyz have elements like (7,0,0) or some
other simple set of numbers because we are in a "natural" coordinate system.
This may all sound like a pain, but stick with it because your program will be
simpler and more efficient.
You should add some constructors or utility functions for ONBs. For
example, you should make one constrttct-from-uvthat takes two vectors a and b and
produces an ONB where u is parallel to a. v is in the piane of a and b, and w
is parallel to a x b. To accomplish this proceed with the following assignments:
a
Ni'
a x b
w = .
||axb||
V = W X U
Note that neither a nor b need be unit length, but neither can be zero length, and
they cannot be parallel. Also note that the order of these operations must be as
above. You should make five other constructors. The first is constnct-fmm-vit
which makes v parallel to the first vector. The other four are for vw. iiv. ««•,
and wit.
Sometimes you want a coordinate system where one of the vectors has a
particular direction, and the other two basis vectors can be arbitrary as long as
they make a valid ONB. So implement a function constritct-from-vw/hich makes
w parallel to a. Unfortunately, this requires an if:
w = -—
, i|a|1 .
if \wx\ < \wy\and \wx\ < wz\ then
_ (o.^.-*'J
\\(a,wz.-wy)\\
else if \wy\ < \wz\ then
_ (mt.'D.-uij)
IKii,,, 0.-^)11
else
(u.,,-11^,0)
V 11(1^.-^,0)11
u = v x w
jj. TransformationMatrices
9
This is all so complicated because some components of a couldbe zero. You may
want to clean this up using utility functions of vectors such as perpendicular-
vector, unit-vector, and index-of-min-abs-component.
Once you have an ONB defined by u, v, and w, it is very easy to1 convert
from a = (ax,ay,az)back and forth to autIW = (a
au = a ♦ u,
av = a v,
aw = a • w.
a = auu + avv + o„w.
Note that the asymmetry of these equations arises because a has components
stored in the canonical coordinate system while aul,U! does not.
To define a whole coordinate system, you will also need an origin point. This
origin combined with an orthonormal basis can be called a frame of reference
or frame. Define a class frame which is just an ONB and a point. It needs no
member functions other than for access and construction.
1.7 TRANSFORMATION MATRICES
You should implement a class tnmsform-matrixvihich stores a 4 x 4 matrix of
scalars. So a matrix has values
mm m0i ni{)2 rnm
M_ "tin "Hi m 12 "'13
r"2n m-2\ hi 22 ni2:i
_ 0 0 0 1 _
This matrix is used to transform vectors to other vectors. For convenience. I
advocate storing the inverse matrix N = M" along with M. Also, you can of
course not bother to store the bottom row of the matrix. Note that the matrix
should transform points and displacements and normal vectors differently. I will
not go over the details why these matrices work the way they do here; for more
information see any introductory computer graphics book.
Suppose we are given a transform matrix M and a point (location) p, then
the transform rule is
m-ooPz + maiPy + mo2Pz + mo3
mioPx + mnPy + muPz + TU3
m20px 4- mupy + rn^xpz + m-23
jn-ioPx + m3ipy + m32pz + m33
Mp =
moo m-oi fn02 m0s
m10 ma mi2 mi3
m20 m21 m22 m23
m30 m.31 m.32 m33
Px
Py
P;
1
10
/. Getting Started
Figure 1.2. When the normal vector in local coordinates is transformed as a conventional vector,
you get a nonnormal vector (dotted). A different transformation rule is needed for normalst0 ?et
the solid (not dotted) vector.
In practice, all the matrices we deal with will have a bottom row of (0.0.0.1)
so the transformed point will have a one for its last coordinate.
Because vectors indicate a direction they do not change when translated (e.g„
"North" is the same everywhere). But we do want to have scales and rotate count.
Fortunately, we can use the row that points set to one to manage this for the
transform of a vector v:
Mv =
"'00 »»01 "1t>2 77(03
ml0 mn m12 m13
rraao ni2i n?22 m23
m-M m:il m-si mX\
I's
0
mo<>t\r + moivy+ m02r,
m-wfr + mm'y-L- ml2t':
f7!2()('r + m-nl'n + ni22l':
niMvT + rn3ii'j,+ m-s,v.
So when we transform a ray p(t) = o + tv, we need to make sure we transform
o and v according to location and displacement mies respectively. In your code
this implies you should have separate functions such as "transformAsLocation."
"transformAsOffset." and "transformAsNormal."
Surface normal vectors transform a different way still (Figure 1.2) A nice
discussion of this is available in the OpenGL Programming Guide [72] which
nas a wonderful discussion of transformation matrices in genera3. Instead of
Mn, as it would be for a conventional vector, it is (M~"l)r, where T indicates
transpose. Ifyou follow my recommendation and store N = M_1.this gives
(M_1)Tn = NTn
"00 n 10 "20 "30
ram rin ri2i «3i
7102 TJl2 "22 7732
7103 7113 123 «33_
noofz + nmvu + niovs
"Olfn + 7lllWj,+ n2lv*
7l02"x + rii2Vy + ri2lVz
no3Vx ■+- nisVy + 1231;.
I J. Transformation Matrices
11
The first operator the matrix should have is transform-location which takes
the location o to anothor location o':
ITloOOi + TTloiOj, + 771020s. + 77103
mioOi + mnOt, + 77ii20z + mu
m20Ox + 771210„ + m22°z + 7123
1
This matrix is used to transfer vectors to other vectors. Since vectors do not
get changed when translated, we "turn off the last column of the matrix for a
vector v:
O'z
o\
1
Oz
1
77100
77110
77120
0
77101
mu
77121
0
77102
77112
77122
0
77103
77113
77123
1
Ox
Oy
Oz
1
moo "lot m02 m03
mio mu m.12 mn
771-20 T»21 m22 m23
0 0 0 1
Vz
0
moot'i + ^rioivy+ mm'vz
m\ovx +TnnVy + mi2Vz
m,'>QVx+ 77121 Vy + Wl22 l>2
0
normal vector n' to a surface transformed by M is
n'=(M-1)rn =
"00 "11 n20 0
"01 "11 "21 O
Tl02 "12 "22 0
"03
1
••13 "23 1.
n
where n^ are the elements of N = M
Your class should contain both M and N. and should have functions to
transform points, vectors, and surface normal vectors. This is a total of six
functions: three for each of two matrices.
You will also need functions or constructors for common matrix types. First
is an identity that leaves points unchanged:
f'l 0 0 Ol
Identity
" " n
0 10 0
JO-"
To translate (move) by a vector t = [tx.tu.t:):
r
1 Q 0 **
0 1 0 ty
0 0 1 t,
0 0 0 1
translate(t)
To scale by coefficients {sx,sy, s:
scaic(sx,sv,s~) =
0 Oj
o o 1
0 0 Sz
|_0 0 0 lj
12
/. Getting Started
To rotate counterclockwise around the x, y, or z axis by angle 0:
rotate-x(0) =
rotate- y(9) =
1 0
0 cosO
O sine
0 0
cosO 0
0 1
-sin6 0
0 0
0
— sin 9
cos 9
0
sinO
0
cos 9
0
0
0
Q
1_
0'
0
0
1
rotate-z(S)
cos d — sin 0 0 0
sin6» cosO 0 0
O 0 10
O 0 0 1
For more arbitrary rotations, we employ ONBs. This may be the most |m.
portant measure to avoid ugly programs, so make sure you absorb this pan of
the materia3 if you aren't familiar with it.
Suppose we want to find the unique rotation matrix which takes the ONB
defined by u. v. w to the canonical ONB definedby x. y. z (Figure 1.3). A nice
way to work out what matrix is required to represent that transform. Whatever
this matrix is, its inverse will take the canonical basis in the other direction, i.e.,
it will take x to u. y to v, and z to w. So if we assume Mx = u. we can
see what the first column of the matrix is. The following matrix accomplishes
exactly that:
0
0
0 0 1
11111
0
0
L°
=
uT
Uy
u.
0
You can verify that there are no other possibilities for these numbers in the first
column, and that the numbers in the blank fields don't matter. We can observe
similar behavior by transforming the y and z axes to determine
rotate-xyz-to-uvw
ux
uy
"z
0
vx
vy
vz
0
wx
•V,
w2
0
0
0
0
1
/ 7. Transformation Matrices
Figure 13. Some rotation matrix takes an ONB defined by u, v, w to the canonical ONB defined
by x, y, z.
Because the algebraic inverse of a transform matrix is always the matrix
that performs the opposite geometrie transform, and the algebraic inverse of a
rotation matrix-is its transpose, we know
rotate-uvw-to-xyz =
Note that this transpose property assumes the matrix is orthonormal, which all
rotation matrices are. If we apply this matrix to u we get
Ujr
Vx
Wx
0
Uy
Vy
U>i,
0
u-
Vz
V-':
o
0
0
0
1
"T
t\l
U\r
0
uu
l'y
Wy
0
u.
V;
U';
0
uT
Uy
_0_
=
u • u
V • U
w • u
L o,
=
HI It
0
0
0
1
The dot products v • u and w • u are zero because u, v, and w are mutually
orthogonal. Similiar behavior is true for transforming v and w.
1.7.1 Using Transformation Matrices
Transform matrices are usually applied in series. So, for example, to rotate a
sphere centered at c about its own center by an angle O, where the "north pole"
is an axis in d'rection a, we
1. move the sphere to the origin (Mi),
2. rotate a to align with z (M2),
3. rotate by 6 about z (M3),
14
1. Getting Started
4. rotate z back to a (M~2 *),
5. move the sphere back to c (M^1).
Algebraically, this composite transform M is given by
M = M^Mj-'MaMaM!.
Because the vector is multiplied on the right of the matrix, the transforms tnat
are applied first are 0n the right. The only nonobvious rnatrix is M2 which
aligns a with z. This is surprisingly easy: Just construct an ONB where w is
aligned to a as described earlier, and then create a rotate-u\w-to-x\z matrix as
described earlier.
1.7.2 Coordinate Changes
Coordinate transforms are a pain because it's easy to get things backwards.
Suppose we nave a canonical coordinate system, which is the implicit one that
forms tne defauit frame of reference in our program. This is defined bv an
origin location o and basis vectors x. y, and z Note mat 0 x y and z' are
not really written down anywhere; they are our universal reference and we thus
not expressible numerically. They do, however, allow us to set up geometrie
Information that relates locations to other locations. For example we know
that point (3.4.2) is one Unit away from (3. 4. 3). We sometimes forsjet nlj
the coordinate machinery that tells us this is true, -phe point (3 4 0) is "reallv
shorthand for 0 + 3x + 4y + 2z. Some grinding tells us the difference vector
between the two points is lx so they are one unit apart.
Suppose I don't like the origin at o For convenience I wish it were ar
o = (2.0.0). If 1 were to write down the coordinates of a point p = (x. u. :)
in this new coordinate system it would be (x- 2. y , ;). Recall that this is really
shorthand for (2. 0,j)) + (x - 2)x + yy + zz. If we want t0 generaliZe this, and
the new origin is o' = (o'xo'.,o'z), the canonical representation of the point is
(x, y, z), and the representation in the new coordinate system is [x' 1/ z') then
we know \x <y • z) = (x - o'x,y - o'. z - ol). In matrix form this is expressed
as
"l 0 0
0 1 0
0 0 1
0 0 0
And of course to go from an (*', y', 2')n our newoordinate systerto
canonical coordinates is achieved by
"x'~
y'
-r'
x
"~
<
4
-o\
1 "
X
y
z
1
//. TransformationMatrices
15
"1
0
0
0
0
1
0
0
0
0
1
0
o'x
°'y
o'z
1
1
y'
z'
1
1
Note that in all of the above, nothing moved; we are only changing how the
same location is described in two different coordinate systems.
The same reasoning applies if we want to express the location (x, y. z) in a
coordinate system with origin o and an ONB u, v, w. We know that if (u, v, w)
represents the point in the new coordinate system then
o + xx + yy + zz = o — uu + w + u'w.
Since the canonical basis vectors are linearly independent, we can expand an
equation in each dimension:
UU r + W .
U'U'j.
In matrix form this becomes
0
1
L~J
L
0 0
Wy
If;
0
D V
0' ' tf
11 11
And to go from a point in eanonicaioordinates to tne new coordinates we
can take advantage of the matrix above being orthonormal (invfflfis'piose):
n ux Uy U; 0
v _ i'x vy <■': o
W WT ICy ii'; 0
■A' L» ° ° ^ '^
Note that these are just the same matnces we used to actually rotate the coordinate
systems to each other!
Now suppose we want a coordinate system with a new origin o and basis
vectors u, v, and w- We can move from one coordinate system to another by
setting up a third coordinate system with canonical basis vectors and origin o .
This implies
x
y
1
0
0
0
0
1
0
0
0
0
1
0
<
°y
0'.
1"
, Ur
Uy
U;
0
vx
Vy-
Vz
0
irx
Wy
IV z
0
0,
0
1
0
1
1
, u
V
1
w
1
1
L.
16
/. Getting Started
And of course the reverse.
ux
vx
Wx
0
H7jy
Vy
Wy
0
Uz
vz
wz
0
o
O
O
1
1
0
0
0
0
1
0
0
0
0
1
0
-o[
-°;
-o'.
1
4'
y
X
y
z
[l\
Now let's apply this to a problem:
Change FROM a point written in terms of a coordinate system with origin at
(a, b, c) and basis vectors u = (ux,uy,uz),v = (vx, vy, vz),w = (wx.wy,wz)
(e.g., the point (u, v, w) is location ox+ by + cz + uu+ w + «rw) TO a point
written in terms of coordinate system with origin at (d,e, f) and basis vectors
r = (rx,ry, rz),s = (sx.sy,sz),t = (tx.ty,t:).
This is just switching from one frame to the canonical frame and from the
canonical frame to a third frame:
"1 0 0 -J
0 1 0 -e
t„ r- 0 O O 1 -/
0 0 lj [o 0 0 1
All of that may seem confusing, but it will get easier as you use it more.
And if you are serious about graphics, read it and reread it. playing around with
2D examples, until you are comfortable with it. Almost all graphics programs,
ray tracers, and otherwise use these concepts. The matrix stacks and transform
nodes of graphics APIs are built assuming the programmer is familiar with these
concepts.
1
0
0
0
0
1
0
0
0
0
1
0
o"
6
c
1
0'
0
o
1
u
u
w
J.
Ray-Object Intersections
This chapter describes how to compute intersections between rays and objects,
and how to produce a simple ray traced image.
The genera3 problem we are trying so solve is at what point, if any, a 3D line
intersects a 3D surface. The line is always given in parametric form because that
is the most convenient for ray tracing. The surface is sometimes given in implicit
form and sometimes in parametric form. Solving for intersection is usually a
mechanical algebraic exercise.
2.1 PARAMETRIC LINES
A line in 2D can be given in implicit form, usually y — rnx-b = 0. or parametric
form. Parametric form uses some real parameter to mark position on the line.
For example, a parametric line in 2D might be written as
x(t) = 2 + 7t, y(3) = 1 + 7t.
This would be equivalent to the explicit form v = x - 1.
In a parametric 3D line might be
x{t) =2+7*, y(t) = 1 + 2t. Z(t) = 3 - 5t.
This is a cumbersome thing to write, and does not translate well to code variables,
so we will write it in vector formi:
p(i) = o + td,
where, for this example, o and d are given by
o=(2,l,3), d = (7,2,-5).
18
2. Ray-Object Intersections
Figure 2.1. A parametric line. Note that the point o can be expressed as p(0) = o + Od, and the
point labeled t = 2.5 at the right can be expressed as p(2.5) = o + 2.5d. Every point along the
line has a corresponding t value, and every value of t has a corresponding point.
The way to visualize this is to imagine that the line passes though o and is
parallel to d. Given any value of t, you get some point p(() on the line. For
example. at t - 2, p(t) = (2.1,3) + 2(7.2. -5) = (16.5. -71. This genera3
concept is illustrated in Figure 2.1.
A line segment can be described by a 3D parametric line and an interval
t e [ta,tk]. The line segment between two points a and b is given by p(f) .=
a + t(b-a) with* [0.1]. Here p(0) = a. p(l) = b. and p(0.5) = (a + b),,2.
the midpoint between a and b.
A ray, or half-line,is a 3D parametric line with a half-open interval, usually
[0. -x.). From now on we will refer to all lines, line segments, and rays as -'rays."
This is sloppy, but corresponds to common usage, and makes the discussion
simpler.
2.2 GENERAL RAY-OBJECT INTERSECTIONS
Surfaces are described in one of two ways; either as implicit equations,
OTparametric equations. This section describes standard ways to intersect rays with
each type of object.
2.2.1 Implicit Surfaces
Implicit equations implicitly define a set of po'nts that are on the surface
f(x,y,z)=0.
2.2. General Ray-Object Intersections
19
Any point (x, y, z) that is on the surface returns zero when given as an argument
to /. Any point not on the surface returns some number other than zero. This
is called implicit rather than explicit because you can check whether a point is
on the surface by evaluating /, but you cannot always explicitly construct a set
of points on the surface. As a convenient shorthand, I will write such functions
of p = (x, y, z) as
/(p) = 0.
Given a ray p(£) = o + id and an implicit surface /(p) = 0. we'd like to
know where they intersect. The intersection points occur when points on the ray
satisfy the implicit equation
/(p(0) = o.
This is just
/(o + fd) = 0.
As an example, consider the infinite piane though point a with surface normal
n. The implicit equation to describe this piane is given by
(p-a)n = 0.
Note that a and n are known quantities. The point p is any unknown point that
satisfies the equation. In geometrie terms this equation says "the vector from
a to p is perpendicular to the piane normal." If p were not in the plane, then
(p -a) would not make a right angle with n. Plugging in the ray p(f) = o + td
we get
(o + rd - a) • n = 0.
Note that the only unknown here is /. The rest of the variables are known
properties of the ray or piane. If you expand this in terms of the components
(x. y. z) of p you will get the familiar form of the piane equation Ax + By +
Cz + D = 0. If we find a t that satisfies the equation, the corresponding point
p(f) will be a point where the line intersects the piane. Solving for /, we get
(a — o) • n
f~ d n '
If we are interested only in intersections on some interval on the line, then this
t must be tested to see if it is in that range. Note that there is at most one
solution to the above equation, which is good because a line should hit the piane
at most once. The case where the denominator on the right is zero corresponds
20
2. Ray-Object Intersections
to when the ray is parallel to the piane, and thus perpendicular to n, and there
is no defined intersection. When both numerator and denominator are zero, the
ray is in the piane. Note that finding the intersection with implicit surfaces is
often not this easy algebraically.
A surface normal, which is needed for lighting computations, is a vector
perpendular to the surface. Each point on the surface may have a different
normal vector. The surface normal at the intersection point p is given by the
gradient of the implicit function
A/(P) 9/(p) df(P\
dx ' ay " dz )'
The gradient vector may point "into" the surface or may point "out" from the
surface.
2.2.2 Parametric Surfaces
Another way to specify 3D surfaces is with 2D ' puranierenThesc surfaces have
the form
x = f(u. r).
y - gU'-v)-
2 = h(u.i).
For example, a point on the surface of the earth is given by the two parameters
longitude and latitude. For example, if we put a polar coordinate system on
a unit sphere with center at the origin (see Figure 2.2), we get the parametric
equations
x = cos <5 sin O,
y = sin 0 sin 6*.
2 = cos 9.
Ideally, we'd like to write this in vector form like the piane equation, but it isn't
possible for this particular parametric form. We will return to this equation when
we texture map a sphere.
To intersect a ray with a parametric surface, we set up a system of equations
where the Cartesian coordinates all match:
ox + tdx = f(u, v),
oy + tdy = g(u,v),
oz + tdz = h(u,v).
n = V/(p) =
2.5. Ray-Sphere Intersection 21
Figure 2.2. Polar coordinator on the sphere. These eoordinates will be u>ed in se\em! p!uces later
in the book.
Here we have three equations and three unknowns (/. u. and <■). so we can
numerically solve for the unknowns. If we are lucky, we can solve for them
analytically.
The normal vector for a parametric surface is given by
, , fdf dy 0h\ (Of 0() 0h\
\Ou On du \c)r dr dv I
2.3 RAY-SPHERE INTERSECTION
A sphere with center c = (cT, c,,.c-) and radius R can be represented by the
implicit equation
(x - cTf + (y -r,,)- + (; - cz)2 - Ft2 = O.
We can write this same equation in vector form:
(p-c)-(P-c)-fl2 = 0.
Again, any point p that satisfies this equation is on the sphere. If we plug points
on the ray p(t) = o + td into this equation we can solve for the values of t on
the ray that yield points on the sphere:
(o + id - c) • (o + td - c) - B ? = O.
22
2. Ray-Object Intersections
Moving terms around yields
(d • d)t2 + 2d • (o - c)t+ (o-c)*(o-c)-R2 = 0.
Here, everything is known but the parameter t, so this is a classic quadratic
equation in t, meaning it nas the form
At2 +Bt+C-0.
The solution to this equation is
t _. -B ± %/B2- 4AC
2A
Here, the term under the square root sign, B2 — 4AC, is called the discriminant
and te"s us how many real solutions there are. If the discriminant is negative.
Its square root is imaginary and there are no intersections between the sphere
and the line.Jf the discriminant is positive, there are two solutions;one solution
where the ray enters the sphere, and one where it leaves. If the discriminant is
zero, the ray grazes the sphere touching it at exactly one point. Plugging in the
actual terms for the sphere and eliminating the common factors of two. we get:
-d ■ (o - c) ± y'(d • (o - c))' - fd • di |(o - c) • (o - c) _ #J)
(d~d) '
'n an actual implementation, you should first check the value of the discriminant
before computing other terms. If the sphere is used just as a bound ins objeaet
for more complex objects, then we need only determine whether we hit it and
checking the discriminant suffices.
The normal vector at point p is given by the gradient n = 2(p — c). The
unit normal is (p — c) 'Ft.
2.4 RAY-BOX INTERSECTION
When y0U nave an axis-aligned box with corners pn = (.r0. ;/n. ;„) and p _
[xi.yi. zi), one could do an intersection with all six rectangular sides, but there
is a standard trick that is faster. Instead, think of three infinite slabs °f space:
x 6 t^Oj^iJ. y € illo, 2/i].and ~ € [20.21.]. We can compute the intersection of
ray p( ) = o + td and slab x e [i0lI,]:
^o = ox + tx0 dx,
xi = ox + t.xldx.
2.4. Ray-Box Intersection
Figure 2.3. A 2D ray intersecting a 2D box. Left: The intersections with the x slab are elven
between the solid circles, while the intersections with the y slab are given between the open circles.
Right: the intersection of the two intervals in ray parameter (4) space is represented by the bold line.
Points within this ray parameter interval are in the box.
The unknowns here are fr() and txl. so the line segment on ray ray is given by
t e !(.r0 - ox)/dr. (xi - or)/dx}.
Note that it would be nice computationally if a line segment t [a. 6; were
a valid increasing interval, that is b > a. but we don't know this for the slab
because the ray is going "backwards" in x if d,r < 0. So. we can convert the
interval t 6 [f.r(l.r.ri] to t € tx ,„,„,f rm„,r))y setting it to [fro-fritf (^> 0
and [^ri-frol otherwise. Similarly, we can get the intersections with the y and
z slabs t e [t,im,„. tuiniir] and t e [tz ,„,„. t: „mr\.
Each of these intervals can be merged into overlapping intervals. For
example, if the .c slab interval is f e [2.4] and the y interval is / 6 3.5.5 . then the
overlap of these two intervals is i 6 [3.4]. The intersection of all three •''• y,
and z intervals is where the ray is inside the box. This principle is illustrated
in Figure 2.3. If the intersection of the three intervals is empty, the ray misses
thebox.
There is a nice way to code described by Smits and discussed further in his
article on efficient ray tracing [57]. It avoids tests for degenerate cases by taking
advantage of the IEEE floating point properties: Comparing anything against
NaN returns.false, everything is less than infinity.sad everything is greater than
minus infinity.
if dx > O then
txmin <— (-£() - Ox)/dx
txmax *~ ixl - Ox)l'dx
else
txmin •*- Ol - ox)/dx
txmax <— {XQ ~ Ox)/dx
4 Z Ray-Object Intersections
if dy > O then
ty min <~ (j/0-— Ovi/dj,
Xy m-iu: <—'(jl - Oy)/dy
else
futnin <— .(yr- oyydy
tymax*- (yo - oy)/dy
if dt > 0 then
^min <~ "2{)"- 0:)/az
t z max +- (21 - O- )/ds
else
fe min 4-(21 — 0.j/dz
tz max ■<— (-0 - Oz)/d2
{Findthe biggest of txmul. tymln,tznun}
if f.r mm > tj, „„■„ thdl
f(] <"j.r .-,-,„„
else
t(> '"'Otllll!
if /; ,„, „ > to then
t<) *~~tz „i ,„
{Findthe smallest offx.,„„.r. tumnj.,tz ,„„.,.}
'■* *.r Fiidi < fy/ri«(f then
tl '<-'^m«.r
else
' 1 ^ < u m; av r
if t: ma < 3\ then
ti '*- t.nuir
.{Intersection with box at /(1 and ti if t0 < fj
hit -<— .f -< 11;
2.5 RAY TRIANGLE INTERSECTION
There ;>ire -a variety'of ray-polygon and ray-triangle intersection routines. These
are discussed extensively by Eric Haines in various ray tracing news articles that
you should read' once you get your basie ray;, tracer working. 1 will present only
one simple routine for triangles.
'A 'triangle is defined by three points a, b and c. If not co-linear, these
points define a piang. A common way to describe this piane is with barycentric
coordinates:
p(ay0,7} = aa+ ,3b + 7c
(2.1)
2.5. Ray-Triangle Intersection 25
Figure 2A Barycentric coordinates can be found by computing the areas of subtriangks.
with the constraint
Q + J-- = 1.
Barycentric coordinates seem like an abstract and unintuitive construct at first,
but they turn out to be powerful and convenient. Barycentric coordinates are
defined for all points on the piane. The point p is inside the triangle if and only
if
O < Q < 1.
0<j < 1.
O < -. < 1.
If one of the coordinates is zero, you are on an edge. If two are zero, you are at
a vertex.
One way to compute barycentric coordinates is to compute the areas A„. Ab.
and Ac, of subtriangles as shown in Figure 2.4. Barycentric coordinates obey
the rule
••: Q = a, i a.
0 = AbIA.
1 = AJA,
where A is the area of the triangle. This rule still holds for points outside the
triangle if the areas are allowed to be signed.
We can eliminate one of the variables by plugging in a = 1 — /3 — 7 into
Equation 2.1:
p(a, /?,7) = a + 0{b - a) + 7(c - a).
26
2. Ray-Object Intersections 2.5. Ray-Triangle Intersection
figure 2.5. An intersection of a ray and the plane aintainina the triangle.
Figure 2.6. Bup-centrie coordinates on a piane intersected by a ray.
Now points are in the triangle if and only if
.?-rv< i.
0 <J.
0 < -v.
Together 3 and 7 parameterize nonorthogonal coordinate system on the piane as
shown in Figure 2.5.
The ray t = o + rd hits the piane when
o + td= a + ;i(b - a) + -{c - a).
(2.2)
This hitpoint is in the triangle if and only if J > 0. 7 > 0, and j + 7 < 1. A
configuration where the ray hits at (3. 7) — (1.2. 0.8) is shown in Figure 2.6,
which is not inside the triangle as predicted by the sum of 3 and 7 being two.
To solve for t, 3, and 7 in Equation 2.2, we expand it from its vector form
into the three equations for the three coordinates:
This can be rewritten as a standard linear equation:
"x
a,j
a.
-bx
^y
-b.
a.r - cx
°y ~ cy
a. — c-
dx
rfv
rf-
"J"
■)
J
-
=
aT - Ox
ay - oy
az — o-
The fastest classic method to solve this 3 x 3 linear system is Cramet
This gives us the solutions:
ax
ay
a-
- Or
~ <>»
— o-
(>.t - Cr
au - ?a
a._— c,
d.
dy
d;
Or-
av
az -
-bx
- by
-b-
Qj- -
a,j -
d~-
-ox
°y
- o~
dx
d«
d.
ox + tdx =
0(bx
-f y(cx - ax
o„ _i_ td.
+
y + ""y
o. j. td.
o-y+P(by~ay)+1(cy-ay)>
= a, + 0(bz-az)+j(cz
ax
ay-
a~-
- bx
-by
-b:
ax —
*Iy -
az —
Cx
cy
c,
ax - ox
*r - o,
az — oz
2. Ray-Object Intersections
where the matrix A is
b,
by
b2
a,j
a
a
A =
and |A| denotes the determinant of A. The 3x3 determinants have common
subterms that can be exploited. Looking at the linear systems with dummy
variables
a d
b e
F f
~3
7
t
f
k
J
Cramer's rule gives us
3 =
j(ei - hf)
where
t =
M
k(gf - di) + l(dh- eg)
M
i((ih-jb)+ h(je al) 4- g(bl- kc)
M
/(((A- - jh) + f(jc- al) + d(bl - kc)
M
a(ei - hf) + b(gf- di) + c(dh - eg).
These equations can be put into code mechanically by creating variables suchas
a and ei-miiuis-hfanA assuming that the compiler will (at least eventually) do
its job.
There are faster ways to compute triangle intersection (e.g. [36]). but this way
is straightforward and requires no global storage besides the triangle vertices.
2.6 MORE THAN ONE OBJECT
Once you have multiple objects, you will need a routine to return the firstobject
hit by a ray. Usually you will be only interested in hits for / € [fo.fi] for a
ray p(f) = o + fd. For example, if you are interested only in hit points "in
front" of o, that corresponds to t e [0. do]. If you are using an object-oriented
language, you should make ah abstract class or interface or superclass whatever
your language calls a class you inherit from. This class is for anything you can
hit which I will call surface. This class needs a routine hit that returns true or
false for whether a ray hits it, and fills in some data (like the / value) if it returns
true. Since a list of objects can be hit, the list is also a surface and has a hit
function:
27. A Simple Ray Tracer
29
function surfacelist.hit(ray o + td, t0, ti.prim) {primis a pointer to the object
hit} [t and prim are filled in if hit returns true}
bool hitone <- false
for all surf in list do
if surf->hit(o + id, to, t, prim) then
hitone ■*— true
return hitone
Note a trick in this code: The interval passed to the object is [to-t] where
t is the smallest t of an object hit so far. This uses the interval to sort
for you. With this interface the code for a sphere intersection is as follows:
function sphere.hit(ray o + td. to. ti, prim) {sphere has center c and radius
R}
float A <- dot(d.d)
float B <r- 2*dot(d.o-c)
float C <— dot(o-c.o-c)
discriminant <- B*B-4*A*C
if B > epsilon then
prim <— this
sqrtd 4— sqrt(discriminant)
t <- (-B - sqrtd) / (2*A)
if f > to and t < fi then
return true
t 4- (-B + sqrtd) / (2*A)
if t > to and t < t\ then
return true
return hitone
The epsilon in the code above is to avoid degenerate code when the ray is
tangent to the sphere. You may want to also return the hitpoint p = o + td and
the surface normal at the hitpoint. I usually have a class that contains all the
"returned" variables I compute that I pass in as an argument, and I think you
will find you will like it if you do the same.
2.7 A SIMPLE RAY TRACER
We can now generate a simple image using spheres and triangles with an
orthographies camera. Let's assume we have 101 by 101 pixels {i,j) numbered
2. Ray-Object Intersections
Figure 2.7. Sample image with sphere and triarmlc
(0. 0) through (100. 100). For each pixel generate a ray r = o + td. such that
o = (i.j.O).
d = (0.0,-1).
where me negative c direction is chosen for d to avoid reinventina the left-handed
coordinate system.
Let's create a sphere with center (0. 0. —150) and radius 100.1, and trianale
with vertices (0,0.-100). (100.1.0,-100). and (50.100.1.-100). Now put
these [W0 objects into a list and for each ray find the closest hitpoint. if you
hit the sphere, color pixel (i.j) light grey. If you hit the triangle, color it dark
grey. If you hit neither, color it black. You should get an itnage that looks like
Figure 2.7.
Lighting and Shadows
To make your images more realistic, the shading on objects should depend on
both surface orientation and lighting direction. For marre (nonshiny) materials.a
good approximation to how surfaces react to lighting is given by Lambert's Law:
L = ER cos Q
where E is the color of the light source (RGB). R is the reflectance of thesurface
(RGB), and d is the angle between the surface normal at the illuminated point,
and the direction from which the viewing ray comes.
3.1 IMPLEMENTING LIGHTING
Recall that the viewing ray is coming into the illuminated point. Let's define a
unit-length vector e pointing in the direction d comes from (it points away from
the surface):
_ d
e"_iidi:
Figure 3.1. Geometry for lighting computation.
31
32
3. Lighting and Shadows
Figure 3.2. Two images illustrating lighting. These images have the same viewing rays used at the
end ofthe last chapter, and two spheres with centers (50.0. -80.0. -1000) and (50.0. 50.0. -IIXX)). and
radi* 100 and 30. The lighting vector 1 is (0.1.0). Left: Using absolute value when L is negative.
Right: Clamping negative L to zero.
You should define 1 to be a unit vector toward the direction from which the light
comes (it also points away from the surface). In this context. Lambert's Law
becomes
L = EH(n-l).
The thing to note is that there is no e in this equation! This means the surface
does not change brightness as you move your eye. You should observe that many
"matte" surfaces in the real world don't change brightness much as you move
your viewpoint, so this is not a bad property. A problem with this formu3a is that
L can be negative. There are two potential solutions to this: Take the absolute
value, or clamp answers below zero. These alternatives are shown in Figure 3.2.
3.2 ADDING SHADOWS
Shadows should occur whenever a point "sees" another object in direction 1.
This can be accomplished as follows:
1. When the viewing ray hits an object at point q, create a shadow ray
p(t) = 1 + tl.
2. If the shadow ray hits no objects, then apply the lighting equation.
Otherwise, set L to zero.
3.2. Adding Shadows
33
1 1
incoming light
1 1 i 1 f T
k
viewing ray
/shadow ray >i
/ J5
1
incoming
* 1 i
viewing ray
u
>1
2 j f
jr: ^>
y
7fq
]
1
light
3 ♦ T
}
Figure 3.3. Shadow ravs originate at q and propagate in the direction from which the light comes.
Intersections at or behind q (f < 0) are not of interest.
An important thing to realize is that "hits no objects" above does nnot include
any hits with 3 < 0. This can be seen in Figure 3.3 where the shado'»w ray hits
the lower object at both / = O (where p(0) = q + 01) and some tmegative /.
Instead, we are only interested in positive values of t.
A problem to keep in mind is that because of finite-precision arithmetic, the
shadow ray may intersect the surface q at some t value other than zesro. Tf this
number is positive, we will detect a false shadow as shown in Figure: 3.4 (left).
<<$$^\>
Figure 3.4. Left: Using an interval t £ (0. oo) causes some rays to hit the surface : at q causing
black pixels. Right: Using t € (e, oo) avoids these artifacts.
34
3. Lighting and Shadows
^
unclosed model
arbitrary normals
outward normals
Figure 3.5. The three classes of models.
Sometimes these dark pixels are more irregular and resemble a Moire' pattern.
Instead, we pick some smali e that t must be bigger than. This is an inelegant
hack, but doe^ usually solve the problem. For a more principled discussion of
such problems, see the paper by Amanatides and Mitchell [11.
3.3 OUTWARD NORMAL VECTORS
When you implement the simple lighting in this chapter, an important issue will
arise: The normal vector n for a polygon may point into the surface. This
matters because it changes how your code computes cosines. It rays can come
from either side, this has to happen for one side of the polygon or the other. You
must now decide on a convention for your ray tracer: Does it assume outward-
facing surface normals? This problem is shown in Figure 3.5 where three classes
of models are shown. In the first, surfaces can be hanging in space, so normal
vectors are arbitrary. In the second, surfaces must be closed, meaning they huve
a well-defined inside and outside, but the normals can tace in or out. The third
has outward-facing normals.
Outward-facing normals certainly make the job of writing your program
easier, so I would suggest you assume your models will have outward facing
normals. This is in the long tradition of leaving any hard work to the modeling
program. A convention that is usually followed is that polygonal models will
obey the right-hand rule, meaning that a polygon that contains three vertices p0,
Pj, and p2 will generate a normal
:(Pi -Po) x (P2-P0) ■
If you do assume outward-facing normals, you can eliminate the epsilon-hack
from shadow ray testing. When testing for shadow ray intersections, disregard
3.3. Outward Nurmul Vectors
35
any intersections where n • 1 > O at the intersection points. This counts only
intersections where the ray is entering the object, rather than leaving it as is true
at q. Alternatively, you can flip normals when they point "into" the surface, i.e.,
if (d • n) > 0.
Viewing
The simplest image aquisition device we can makers ^pinhole camera: We ju'st
take a box painted black cm the inside^ poke" a' hole in one side;, and tape film;
to the inside of the opposite side-(Figure 4.1). In this chapter; we'sittiuliate ' such
a device. As shown in the figure, we can compute light passing through some
rectangle in front of the camera.- In effect, this is computing the: light coming
through a "window" in front of the ""viewer." The only reason fo do'this is; that
it may be more intuitive: it is for most people.
r^^^m
\ i f ■*—_ : Mr '"
",' - ':.? '■"'
pCohofc *V---J
Figure14.1. A real pinhole- camera. Light enters the pinhole froma' specific direction a'tfd' exposes;
a particular part of the film. The film will capture a scene in sharp focus, but it fequifes significant
exposure lime. The color of Tight at point s in the difectioh shown will stay the sanie as it passes-
through the pinhole, and as it hits the film at f.
41 AXIS-ALIGNED VIEWING
We can implement a synthetic version of a pinhole camera; A" nice'thing isul&t
we can create a virtual film piane in front of the camera" and forget-that-the filhi1
is behind the pinhole. To do this, we need to set up a projection of .the film-out
37
4. Viewing
Figure 4.2. An image passing through a rectangle at distance s wili he mapped unto the tilm.
in space. This is shown in Figure 4.2. Note that the selection ofthe distance
s is arbitrary: if we make it bigger the rectangle and the image grow, and the
same image will be saved.
To implement the camera, we pick a specific rectangle aligned to our viewing
system as shown in Figure 4.3. The viewing system has center o which is defined
to be the origin in uvw coordinates and is aligned to the uvw basis. Points a
and b are the corner points of this rectangle. The rectangle need not be centered
on the gaze direction. The rectangle is in the negative w direction because we
want to both maintain a right-handed coordinate system, and have u go to the
right on the rectangle. The points we sample on the image are mapped onto that
rectangle as shown in Figure 4.4. The equations for mapping a pixel (i.j) on
an nx by ny pixel image to the correct (u, v) are
i
u = a„+(6„-a„) .
Tlj - 1
v = av + (6t - o„)—1—.-.
ny - 1
This means the ray in uvw coordinates is
' i i
p(t) = (0, 0, 0) + t ( an + (6U - au) - -,a„ + {bv - av)— s
\ rij. - 1 ny - / •
4,2. Setting View Parameters
39
Figure 4.3. The viewing rectangle is a distance s from o along the negative w axis, and is parallel
to the uv piane.
(0.0,0)
-.
b = (blrb,.-s)
a = (au.a,,-s)
Figure 4.4. Pixel coordinates are mapped to the 3D window in uvw coordinates.
4.2 SETTING VffiW PARAMETERS
If we choose to have an axis-aligned view from the origin then we can use just
the ray above as xyz coordinates. However, we would usually like to be able
to set view location and orientation. There are many ways to do this, but I will
describe only my favorite, shown in Figure 4.5.
40
4. Viewing
Figure 4.5. Viewing trom an arbiirury poiition.
The variables that are specified are:
• e. the xyz eyepoint (pinhole);
g, the xyz direction of gaze (This is also the normal to the viewing
rectangle. so it is sometimes called the v/Vvv '-plane nortnal '"•
• v,,p. tne view-up vector. This is any vector in the piane of the £aze
direction g and the vector pointing out of the top of the heatl;
• s. the distance from e to the viewing rectangle:
a„,a,,.6„.6„, the uv coordinates of the rectangle corners.
From this information we can establish an aligned uvw frame where e is the
origin and the basis vectors are
w = -A.
llvupX W||
V = W X U.
Note that y°u could also just make a call to make-ONB-from-WV(g,vupfc
have such a function implemented
So we have the ray in Uvw coordinates, and we have the xyz coordinates
of the uvw basis vectors and origin. We could construct a coordinate transform
A 2 Setting View Parameters
41
matrix aS described111 Chapter 2, or we can just proceed from the definition^
coordinates:
plf) = e + t((a» + (bu- o.u)^^) u + (a, + (fc, - a»)^Ti) v + ~sw)
Note that this 1S a Prettv genera3 viewing system so some care mustbe taken
in setting parameters. If you want the viewing 'rectangle centered around the
gaze airectl011> make sure au = -bu and av- -&„. if you want t0 have square
pixels, make sure that
bu — Ou _ Ttj
bv - av ny
Fln!jly' note tnat although s is arbitrary as long as it is positive, the bigger it
is the bigger (a a„.bu.bt,)have to be to get the same imaee. The ratio of
bu~au t0 s 1S the tanSent of half of the -'vertical field-of-view." Tf vn]] are more
comfortable with that concept, set s to one and input the vertical field-of-view.
One nice thing about not requiring the viewing rectangle to be centered
around the direction is that you can run different "tiles' of a si le ■
in concurrently running programs and then join them together for a lazy
programmer's Parallel code- You can also generate stereo images with proper eye
separation; neither eye is centered on the screen if the nose is.
example
is shown in Figure 4.6 with parameters e = (0-0.2). vup =
^■l-°)J = (0-0-2)- (*u,av) = (-2.-2). (bB.M = (2.2) s = 2
- 101, and a sphere with center (0.0.0). radius >/2. and the u8"f vector
Figure 4.6. A sample use of viewing parameters.
42
4. Viewing
(0,1,0). An ambient factor of 0.1 is added, and the sphere reflectance is 0-9,
so colors range from 0.1 to 1.0.
Nol:e that you could change g to anything with a positive y component and
a zero x component and the image won't change. Change vup to point in the
x direction and the image should rotate 90 degrees. Decrease ,s and the sphere
should '°°k smaller. Change e to be any vector in the xz piane where x*+z2 = 2
and the image should not change.
Basic Materials
Materials such as glass and metal which show mirror-like reflection and
refraction are collectively known as specular surfaces. The physics of these surfaces
is well-understood and is straightforward to approximate in an implementation.
Surfaces that show some diffuse and some specular behavior, such as smooth
plastic, are more complex, but the approximation I like to use works reasonably
well and is not too difficult to implement.
5.1 SMOOTH METAL
Smooth metals are the simplest materials to describe, and they are easy to
implement in a ray tracer. Smooth metals obey two principles:
• The law of reflection, which States that the angle of incident light relative
to the surface normal is the same as the angle of reflected light, and that
the incident direction, surface normal, and reflected direction are coplanar;
• The Fresnel eauations. which describe how much of the light is reflected,
and by complement how much is absorbed.
Let's assume we have functions to compute the lighting on a diffuse surface,
the reflected vector, and the reflectance. The function for computing a ray color
that "sees" a diffuse or metal surface is
function color(ray o + t d)
if r hits object at point p with normal n then
if p is diffuse then
return R{p) * direct-light(p.n)
else
r <— reflect(d. n)
return R(pj * color(p + tr)
else
return background
43
44
5. Basic Materials
- - ^ i
Figure 5.1. The reflection from a smooth surface.
To implement the law of reflection, observe Figure 5.1. where the incident
direction is d. the surface normal vector is n, and the reflected vector is r. As can
be seen in the Figure, r = d + 2a. The vector a is parallel to n but has length
of d scaled by the cosine of the angle between d and n. This yields
r = d 4- 2a
d» n
d — £ n
Note that if n is a unit vector, dividing by the square of its length is not needed.
To compute the reflectance, the simplest approximation is to set it to some
constant RGB value. This works well enough for most images. However, the
reflectance of real metals increases as the angle between d and n increases. Schlick
developed ah accurate approximation to the rather uglv Fresnel equations [48]
to simulate the change in reflectance:
R(8) a R0 + (1 - Ro)(l -cos£)5
(5.1)
where Rq is the reflectance when d is parallel to n. Try setting Rn to 0.8 for
all three channels RGB. This will make an object that behaves similarly to any
modem "stainless" alloy. Although there is a smali error implicit in Schlick's
approximation, it is no bigger than the error we imposed when we decided not
to use polarization, so you shouldn't worry about that.
5.2 SMOOTH DIELECTRICS
A dielectric is a transparent materia3 that refracts light. Diamonds, glass, water,
and air are dielectrics. Dielectrics also filter light; some glass filters out more
5.2. Smooth Dielectrics
45
red and blue than green light, so the glass takes on a green tint. When a ray
travels from a medium with refractive index n into one with a refractive index
ntt some of the light is transmitted, and it bends. This is shown for nt > n in
Figure 5.2. Snell's Law tells us that
n sin 8 = nt sin O .
From this and the equation shr d+ cos20 = 1, we can derive a relationship
for cosines:
"2 (l-COS^)
cos-6' = 1
nt
From the figure, we can see that n and b form a basis for the piane of refraction.
Important: The following discussion assumes d and n are unit vectors, so when
you implement this be sure to make unit length variables in this routine. By
definition, we can describe t in this basis:
t = sini9'b - cos#'n.
Since we can describe d in the same basis, and d is known, we can solvefor b:
d
b
sin #b - cos On.
d — n cos 0
sin 0
Figure 5.2. The refraction of light at a smooth surface.
46
5. Basic Materials
This means We can solve for t with known variables:
n (d + ncos#))
t = — --ncos^'
nt
n (d - n(d • n)) f n2 (1 - (d - n)20)
— — ni /1 = .
nt \j nf
Note that this equation works regardless of which of n and nt is bigger.
For homogeneous impurities as is found in typical glass, a light-carrying
ray's intensity will be attenuated according to Beer's Lena. As the ray travels
through the medium, it loses intensity according to dl = —CIdxwhere dx
is distance. This means dl/dx = —CI. This is solved by the exponential
/ = fcexp(-Cx) + k'. The strength of attenuation is described by the RGB
attenuation constant a, which is the attenuation after one unit of distance. Putting
in boundary conditions, we know that 7(0) = /()• and ^(1) = al(0). The
first implies I(x) = Iq exp(-Cr). The second implies /,,« = 70exp(-C) so
-C = ln(a). .So the fina3 formu3a is
I{*) - l(0)e-inil"s
where Us) is the intensity of the beam at distance * from the interface, hi
practice, we reverse-engineer a by eye because such data is rarelv easy to find.
To add transparent materials in our code, we need a way to determine when
a ray is going "into" an object. The simplest way to do this is to assume that
all objects are embedded in air with refractive index verv close to 1.0, and
that surface normals point "out" (toward the air). This concept is illustrated in
Figure 5.3.
The code segment for rays and dielectrics with these assumptions is:
if p is dielectric then
r = reflect! d. n)
if d • n < O then
t <- refractfd, n,n)
c < d n
Kj- ^- K„ i— fjflj i— /
else
t <-- refract(d. -n. 1/n)
c <- t n
kT «■- exp(-ori)
kg*-exp{-ast)
kb f- exp(-a(,r.)
i?o<-(n-l)2/(n+l)2
R <- R0 + (1-Ro)* (1 -c)5
return k(R * color(p + tr) + (1 - R) * color(p + tt))
5.3. Polished Surfaces
Figure 5.3. If a direction and the surface normal have a negative dot product, the direction points
into the object. This is useful for deciding whether the ray bends in or out.
The code above assumes that the natural log has been folded into the constants
(ar. as. ai,). An image that uses both Fresnel equations and Beer's law is shown
in Figure 5.4.
5.3 POLISHED SURFACES
Many surfaces are dielectrics, but have smali reflecting particles embedded which
diffusely scatter light (e.g., plastic), or coat an underlying diffuse surface (e-g-
finished wood). Such surfaces act as combinations of specular and diffuse
surfaces. An interesting aspect of this behavior is that when the incoming light is
"grazing" (9 is near 90 degrees), the specular component dominates, and when
the incoming light is near-normal (0 is small), the diffuse interaction dominates.
This is actually not surprising; the specular reflectance approximated by
Equation 5.1 approaches one for the grazing case, so little light goes into the dielectric
to interact with the subsurface materia3 that creates the diffuse behavior. In the
normal case, the typical normal reflectance is around five percent, so most of
the light is transmitted to interact diffusely with the subsurface materia3.
A simple model for these polished surfaces tries just to maintain physical
constraints of reflection and the diffuse/specular behavior [53]. The specular
component acts just like the reflected part of a dielectric. The diffuse component
5. Basic Materials
48
j 3 Polished Surfaces 49
is given by
L = R(p)E (1 - (1 - n ■ e)5) (1 - (1 - n "J)5) •
"turns off the diffuse component if either the light or the eye is near D. °
and does so in a way that prevents a violation of energy conserva l
Figure 5.4. Dielectrics rendered with Fresnel equations and ^eer s law.
Part II
Bells and Whistles
Solid Texture Mapping
In previous chapters, we used the reflectance at a point x as a function R{x).
For a solid-colored object this might return just the reflectance of the object that
contains x. But for objects with texture, we should expect R(x) to vary as x
moves across a surface. One way to do this is to create a solid texture that
defines an RGB at every point in 3D space. When a ray hits a surface at x. this
function can be evaluated and the return value can be used for R{x). Such a
strategy is clearly suitable for surfaces that are "carved" from a solid medium,
such as a marble sculpture. In this chapter, we describe how to add interesting
solid textures to your system. More traditional surface textures are covered in
the next chapter. A more extensive treatment of procedural te,\tures can be found
in the book by Ebert et ai. [12].
6.1 STRIPE TEXTURES
There are surprisingly many ways to make a striped texture. Let's assume we
have two colors en and c\ that we want to make the stripe color. We need
some oscillating function to switch between the two colors. An easy one is a
cosine:
RGB stripe( point x )
if sin<x.z()) > 0 then
return sO
else
return si
We can also make the stripe's width w controllable:
RGB stripe( point x, double w )
3f sin(7r * x.z() / w) > 0 then
return sO
else
return si
53
6. Solid Texture Mapping
Figure 6.1. Various stripe textures.
It we want to interpolate smoothly between the stripe colors we can use a
parameter t:
RGB stripeCpoint x. double w )
double t <- (1 + sin(- * x.z()iw))/2
return f * sO + (1 - t) * si
These three possibilities are shown in Figure 6.1.
6.2 SOLID NOISE
We would like to be able to make "mottled" textures such as we see on birds'
eggs. Perlin introduced a way to do this which can be seen in a huge number of
graphics images [40. 41 ]. Just calling a random number for everv point wouldn't
be appropriate because it wouldjust be like "white noise" in TV static. We would
like to make it smoother without losing the random quality. One possibility would
be to blur white noise, but there is no practical implementation of this. Another
possibility would be to make a big lattice with a random number at every lattice
point and interpolate these random points for points between lattice nodes. This
would make the lattice too obvious. Perlin used a variety of tricks to improve
this basie lattice technique so the lattice was not so obvious [41). Here is his
basie method:
kl + i LsJ+i L-J + i
n(x. y. z) = Y, E E fiO'*(* " *'« ~ 3- = ~ k)
where (x, y. z) are the Cartesian coordinates of x, and
fijjfc("iv, w) = ^{u)u}(v)ui(w){rijk* (u, v, u;)),
:,-: 6.2. Solid Noise
Figure 6.2. Absolute value of solid noise and noise for scaled* and y values.
and uj{t) is the cubic weighting function:
„.m = /21tl3-3|t|2 + 1 ififl<L
10 otherwise.
V
The fina3 piece is that r,^- is a random unit vector for the lattice point (x. y, z) =
(j j, k). Since we want any potential ijk. we use a pseudorandom table:
T,j, = G(Q(i+0(j+o(k))))
where G is a precomputed array of n random unit vectors, and o(i) = P[i
mod n] where P is an array of length n containing a permutation of the integers
O throush n — 1. In practice. Perlin reports n = 256 works well. To choose a
random unit vector (rx. r,;, v.) uniformly first set
vx = 2 * random(O.l) - 1.
vy = 2 * random(O.l) — 1.
c. = 2 * random(0.1) - 1.
Then, if (v- + t>2 + L>2) < 1 make the vector a unit vector. Otherwise, keep
setting it randomly until its length is below one and then make it a unit vector.
This is an example of a rejectionmethod. which will be discussed in more depth
later. Essentially, the less than test gets a random point in the unit sphere. ancj
the vector for the origin to that point is uniformly random. That would not be
true of random points in the cube so we "get rid" of the corners with the test.
Because solid noise can be positive or negative, it must be transformed before
being converted to a color. The absolute value of noise over a 10 x 10 square is
shown in Figure 6.2 along with stretched versions. These versions are stretched
by scaling the points input to the noise function.
The dark curves are where the original noise function went from positive to
negative. Since noise varies from — 1 to 1, a smoother image can be gotten by
56 6. Solid Texture Mapping
Figure 63. Using 0.5 * noise + 0.5 (left) and 0.8 * noise + 0.5 (right) tor color.
using (noise + l)/2 for color. However, since noise values close to 1 or —1 are
rare, this will be a fairly smooth image. Larger scaling can increase the contrast
(Figure 6.3).
6.3 TURBULENCE
Many natural textures contain a variety of feature sizes in the same texture.
Perlin uses a pseudofractal "turbulence" function:
i
The turbulence function is shown for various values of n in Figure 6.4. This
can be used to distort the stripe function:
RGB turbstripe( point x, double w )
double t — (1 + sin(/l-i.r.r0 + turbuience(k.2x)))/w)/2
return t * sO + (1 - t) * si
Various values for fcL and fc2 were used to generate Figure 6.5.
6.4 BUMP TEXTURES
Although so far I have only discussed changing materia3 properties using solid
texture, you can also change the surface normal to give an illusion of fine-scale
6.4- Bump Textures
Figure 6.4. Turbulence function with one through eight terms in the summation.
Figure 65- Various turbulent stripe textures with different ki. k2. Top row has only the first term
of the turbulence series
geometry on tne surface- We could do this by applying a bump map which
perturbs the surface normal. One way to do this is as follows:
vector3 n = surfaceNormal(x)
n+ = ki * vectcrrTu.rbulence(k2* x)))/w)/2
return t * sO + (1 - t) * si
This is shown in Figure 6.6.
58
6. Solid Texture Mapping
Figure 6.6. Using vector turbulence on sphere of radius 1.6. Lighting directly from above Left,
fei = 0. Middle: fci = 0.08, fc2 = 8. Right: la. = 0.24, fc2 = 8.
To implement vectorTurbulence, we first need vectorNoise which produces
a simple spatially-varying 3D vector:
L-rJ + l iyj + l [:j+l
nL.(x.y.z)= /__, j_^ ^ rijkOmega{x)* ointyn(y)* omega(z)
! = l-'-J j='.y}i'=[-s
With th's- vectorTurbulence is a direct analog of turbulence: Sum a series of
scaled versions of vectorNoise.
7
Image Texture Mapping
We often want to take a pixel-based image and "map" it onto a surface. This is
not difficult to implement once you understand the coordinate systems involved.
In the last chapter, we used the point on a surface to look up a texture. Here
we use a 2D coordinate, often called MV, which is used to create a reflectance
R(u,v).
The key is to take an image and associate a (u.v) coordinate system on it
so that it can be associated with points on a 3D surface. For example, if the
latitudes and longitudes on the world map are associated with polar coordinate
systems on the sphere, we get a globe (Figure 7.1).
As should be clear from Figure 7.1. it is crucial that the coordinates on
the image and the object match in "just the right way." As a convention, the
coordinate system on the image is set to be the unit square (u. v) e [0.1] x [0. I1.
For (u. r) outside of this square, only the fractional parts of the coordinates are
used resulting in a tiling of the piane (Figure 7.2). Note that the image has a
different number of pixels horizontally and vertically so the image pixels have a
nonuniform aspect ratio in (u. r) space.
Figure 7.1. A Mercator projection world map and its placement on the sphere. The distortions in
the texture map (i.e.. Greenland being so large) exactly correspond to the shrinking that occurs when
the map is applied to the sphere.
59
60 7.
Image Texture Mapping
) 'A i, A y.
'^■■reeJKr:
Figure 7.2. The tiling of an image onto the (u. u) piane. Note that the input image is rectangular
and that this rectangle is mapped to a unit square on the (u, v) piane.
To map this (u.r) € [0.1] x [0.1] image onto a sphere, we first compute
the polar coordinates. (Recall the coordinate system shown in Figure 2.2). For
a sphere of radius R and with center {cx. cs. r-),fhe parametric equation of the
sphere is
X
y
z
=
—
=
xc + R cos <t> sin 9
yc + Rs"m0 sinfi.
zc + R cos 6.
The {8, <b) can be found using
z
arccos -
0 = arctan2(j/ - yc, x - xc
where arctan2(a, 6) is the atari! of most math libraries which returns the
arctangent of a/b. Because (6,0) £ [0,t] x [—tt, ?r], we convert to (u, v) as follows,
61
v=0.7S
v=0.5
u=0.25 u=0.5 u=0.75
lv=0.25
Figure 7.3. Left: a calibration texture map. Right: the sphere viewed along the y-i
after first adding 2- to o if it is negative:
o
U = 2V
7T-0
V = .
7T
(7.1)
This mapping is shown in Figure 7.3. There is a similar, although likely more
complicated way. to generate coordinates for most 3D shapes.
Once the (n. v) coordinate of an object is known, all that remains is to find
the corresponding color in the image. First, we remove the integer portion of
(M, v) so that it is in the unit square. We then use one of three interpolation
strategies to compute the image color for that coordinate. The simplest strategy
is to treat each image pixel as a constant-colored rectangular tile. This is shown
on the left of Figure 7.4. To compute this, apply c(u.v) = c,j. where c(u.v) is
the texture color at (u. r) and aj is the pixel color for pixel indices:
[vny
(7.2)
where (nI,n!/)is the size of the image being textured, and the indices start at
(U) = (0,0).
7. Image Texture Mapping
1
0
1
0
1
0
1
0
1
Figure 7.4. Right to left: values in texture file, point texture, bilinear texture, and bicubic texture.
For a smoother texture, a bilinear interpolation can be used as shown in the
middle of Figure 1.4. Here we use the formu3a:
c(u.i-) = (l - u')(l - v')CiJ +
u'(l- l/ku-M); +
(7.3)
where K v') = (nu~ [nu\.m-— [nv\). The discontinuities in the derivative
in intensity can cause visible mach bands, so hermite smoothing can be used:
c(u.r) = (1 -u")(l- r")cu +
(i - " )'' <\<j~n +
u"(.'"c(j4.nUJ.i)
(7.4)
where (u".y") = (3(u')2-2(u')3.3(c')2-2(r'f) which results in the rightmost
image of Figure 7.4.
I have described how textures can be used to modulate diffuse reflectance.
They can also be used to modulate any parameter that controls lighting and even
for transparency (a "alpha-map"). Readers interested in more information on
such techniques should consult either of the excellent Renderman books [3. 64].
8
Triangle Meshes
Most real-world models are composed of complexes of triangles with shared
vertices. In many fields these are known as triangular meshes or triangular
irregular networks (TINs). In this chapter. I describe how to manage these types
of models without too much storage, and with texture maps.
A simple triangular mesh is shown in Figure 8.1. You could store these
three triangles as independent entities and thus store point px three times, and
the other vertices twice each for a total of nine stored points (three vertices for
each of two triangles), or you could try to somehow share the common vertices
and store only tour.
So instead of
class triangle
materia3 m
point3 p„. Pep.
meshtrum\>lt
parent —
vertices
0
meshtritiniiie
parent
vertices
run]
meshtrianylt-
vertices 1 ^ 1 "> 1 | I
4
mesh
material
vertice-i
| Po| P
P:
H
Figure 8.1. A three triangle mesh with tour vertices.
63
54
8. Triangle Meshes
you would have two classes:
class mesh
materia3 m
array of point3 vertices
and
class meshtriangle
pointer to mesh meshptr
int iq, i\, i2
where «o, i\, and 12 are indices into the vertices array. Either the triangle class
or the mesh class will work. Is there a space advantage for the mesh class?
Typically, a large mesh has each vertex being stored by about six triangles,
although there can be any number for extreme cases. This means about two
triangles for each shared vertex. If you have n triangles, then there are about
n/2 vertices-in the shared case and 3rc in the unshared case. But when you share
you get an extra 3ri integers and n pointers. Since you don't have to store the
materia3 in each mesh triangle, that saves n pointers which cancels out the storage
for meshptr. If we assume that the data for floats, pointers, and integers all take
the same storage (a dubious assumption), the triangles will take 10/i storage
Figure 82. Various mesh textures obtained by changing (u, v) coordinates stored at vertices.
9. Triangle Meshes
65
rmixs and the mesh will take 5.5n storage units. So this amounts to around a
factor of two, which has generally been true for the real implementations I have
seen. Is this factor of two worth the complication? I think the answer is yes as
soon as you start adding "properties" to the vertices.
Each vertex can have materia3 parameters, texture coordinates, irradiances,
and essentially any parameter that a Tenderer might use. In practice, these
parameters are bilinearly interpolated across the triangle. So. if a triangle is in_
tersected at barycentric coordinates (,3,7), you interpolate the (u. v) coordinates
the same way you interplate points. Recall that the point at the barycentric
coordinate {'3,1) is
p{3, -)') = Po + t?(Pi - Po) + 7(P2 - Po)'
A similar equation applies for (u. v):
u{3.-<) = uu +3[ui - un) -+--, (u2 - u0).
c[3. = !•() + 3(l'l - I',)) +~,{V-2 - CO).
(8.1)
Several ways in which a texture could be applied by changing the (u. r) at
triangle vertices are shown in Figure 8.2.
Instancing
This chapter discusses instancing, where an object is stored in its own local
coordinates along with a separate transform matrix. In a conventional z-buffer
graphics system, each vertex of the object is transformed by the matrix before
being drawn. So if a scale in z by 0.5 is applied, the object will become squat
in that dimension. In ray tracing, instancing is easy to manage, but the way the
transforms are done is a little trickier to understand than with a z-buffer. as you
will see. The basie idea of instancing for ray tracing is shown in Figure 9.1. A
neat thing about instancing is that you can have the same object be associated
with two different "instances" which have different values for the transform.
A wonderful thing about instances is that although they require only a few
lines of code, you can create more primitives. For example, if you implement a
sphere, you can get ellipsoids by having scaled instances.
global coordinates
local coordinates
Figure 9.1. If rays and objects are all transformed together, the image remains the same. This can
change the problem of ray tracing ellipsoids into the easier problem of intersecting with a sphere.
67
68
9. Instancing
o+rd
M-'o + r M-'d
alobal coordinates
local coordinates
Figure 9.2. A ray traced against an ellipsoid can be trumfonned mi that the ellipsoid becomes
sphere centered at the origin.
9.1 INTERSECTING RAYS WITH TRANSFORMED
OBJECTS
The basie idea of how to do intersections with transformed objects is shown
in Figure 9.2. Rather than transforming the points on the object, which might
global coordinates
local coordinates
Figure 9.3. When the normal vector in local coordinates is transformed as a conventional vector,
you get a non-normal vector (dotted). A different transformation rule is needed for normals to get
the solid vector.
9,2. Lattices
69
be complicated, we transform the ray. I use the convention that the "local"
points on the object are transformed by M. This means the opposite transform
should bring the ray into local coordinates. This transformed ray, M~1o +
iM_ld, is 3ntersected with the object in its native local coordinate system and
the intersection point is x.
The intersection point in world coordinates is Mx. If the local normal
vector is n, then the transformed normal that we use for lighting computations
is(M_1)Tx.
An interesting issue is whether we implement solid textures with local or
glocal coordinates. Usually, using local coordinates is the right answer, so that
the texture will move with the object as the object is changed.
One implication of instancing is that the length of the vector in rays cannot
be restricted to one. We need arbitrary vector lengths so that they can be scaled
into the local coordinate system; if d had length one. a scaled version of d in
local coordinates could have any length.
The pseudocode for the intersection with a surface 5Mrftransformed by a
matrix M is given below:
function hit-instance( ray o + fd)
o' ^-Mo
d' <— Md {if hit-surf returns true, assume hit point p' and normal n' are
somehow returned)
if hit-surt'(o'+ fd') then
p <- A/~ V
nf- (M~lfn'
return true
else
return false
9.2 LATTICES
Instances can be used to create procedural complexity without code specific to a
specific type of geometrie object. This is accomplished by making many copies
of the same object with different transform matrices. This essentially makes
copies of objects. A procedural way to make this is with a "lattice" that creates
a 3D array of object copies. If we have a way to create a transformed instance
create-instance(surf,M)the pseudocode for a lattice is as follows:
for all i 6 {0,.. .nx}, j € {0,.. .ny}, k {0—nv} do
M «- translate(ax + i*dx, ay + j*dy. az+ fc*dz) {(ax.ay.az)is the startpoint
and (dx,dy.dz) is the base offset}
create-instance(obj ect,M)
10
Grids for Acceleration of
Intersection
This chapter describes how to use a regular grid subdivision structure to avoid
computing intersections with every object in the scene. This is similar to how
hashing is used to speed searches in ordered data. However, it is somewhat more
complicated because ordering objects in 3D is somewhat ill-detlned. There are
many alternative acceleration strategies to the one presented here. Interested
readers can find more information in the aniele by Arvo and Kirk [4].
10.1 GRID TRAVERSAL
The grid is a 3D axis-aligned box that is subdivided into a lattice of smaller
boxes. Each box contains a list ot" which primitives have any points within the
box. A simple grid and the corresponding array data structure are shown in a
empty
grid data structure
grid geometry
Figure 10.L A 2D grid (left) with the corresponding array data structure (right).
71
72 10. Gridsfor Acceleration of Intersection
Figure 10.2. A ray first enters cell a and is tested against surface 2. Since it misses, it is advanced
to celt b and then to cell c where it is tested against surface I. Since it hits surface 1. the seurchis
terminated. Note that object 0 is never tested.
2D example in Figure 10.1. The array should contain pointers which are either
null or point to a list (or another grid) depending on whether the cell is empty.
Since a ray can hit a grid, the grid, like the list, should be of the same type or
class as the basie spheres and triangles.
The key advantage of a grid is that it can be used to skip testing hits with
some of the objects. This is illustrated in Figure 10.2 where only two of the three
objects are tested. In larger data sets, a higher fraction of objects is skipped.
A special case that should be accounted for is shown in Figure 10.3. Because
ot this type of situation, we must test whether an intersection occurs in the cell
in question. Note also that in the next cell we test the triangle again. In practice,
we can test the same primitive many times. Although we could put in a special
case check to avoid multiple tests, that would add if tests that slowdown the case
where we test an object once. I believe that if there is any speed advantage to this
type of test, it is not worth making your code more complex, so just test every
object in each cell that the ray visits and don't worry about the multiple tests.
The basie code for a grid traversal is given below:
if ray misses whole grid then
return false
find first cell (i.j, k) ray visits
findtjn, tout for that cell
while true do
if ray hits an object in cell (i,j, k) with t € [fnn,£0„t]then
return true
change i, j, or k by +1 or —1.
10.1. Grid Traversal
73
if (i,j, k) out of range (hen
return false
Lin — ^out
compute new tout
To convert this into more explicit operations, we need to do some clever steps
developed by Amanatides and Woo [2]. The key concept to making the traversal
efficient is shown in Figure 10.4. The inner loop of the 2D traversal for rays
traveling in the positive x and y directions will thus look something like this:
loop
II txnext^ Cy7iexfU'cII ^
t in — lout
'out — r.i- nert
if hit in cell (i.j, k) with t e [f,n.f„„(]then
return true
i <- I + 1
t.r nt.rt ^~ tx in .rt + «?•'"
else
t,„ <- t„»t
taut * Mi i}' .rt
if hit in cell (i.j. kj with f 6 [f,„. f,Jllf|then
return true
j +-J+1
IU ,i, .rt +~ i,i ii' rt + litII
Figure 10.3. A special case that must be accounted for: Although the triangle is tested for and hit
in cell a, the hitpoint is not inside that cell so it should not be accepted.
10. Gridsfor Acceleration of Intersection
To turn this into more complete code, we need to get the loop started and we
need to terminate it when the ray leaves the grid. First, some definitions: The
grid has extreme corners pa = (x0,yo,z0) and p, = (zi,j/i,Zi). The grid has
nx by ny by nz cells, each of the same size. The basie code is as follows:
if vx > 0 then
*xmin * ^0
tx max ^ \X\
else
*x triin ^ («£l -
^1 max ^ (^-0 -
if i'tf > O then
ty min v 1,3/0
f y max ^ \U\ ~
else
*-y min ^ [Ml
If/max *~ {TjO -
if r. > O then
t; nun <~ (-0 ~
' : max i V - 1
else
tzmin ^~ (~1 -
- ox)/vx
- ox)/vx
- ox)/vx
- ox)/vx
-Oy)IVy
o:)/r:
":)/(';
'->.-)/'*;
t;n,ax <~ ( ~0 ~0-)/v:
{Find the biggest of tr ,„,„. t^
if tr mm > ty ,„,
<() *" *x nun
else
'o <- fv„,„,
„ then
m in - ' ; /
•all hils • y hits ' \ hits
Figure 10.4. The intersection points with cell walls are irregular, but closer inspection shows that
the intersection points with the vertical sides are evenly spaced, as are the intersection points with
the horizontal sides.
' 10.1. Grid Traversal
if tz min > tobig then
tr) ^ — tz min
{Find the smallest of tx max Jy max, tzmax}
if txmax < tymax then
tl 4 I'Xmax
else
l-l ■* £y max
if tzmax ^tIsmail then
A i *~ max.
{Intersection with box at to and t\ if to <'*i}
if (t0 > ti) then
return false
(Add intersection of tmin, tmax}
dtx <- (rrl - txQ)/nx
dty <- (iyl - ty0)/ny
dtz <- (r:l -tz0)/n:
p <— o + fd
i-x <- (fix - ■Vo)nxi[x\ - J"u)
iy *r- U>y - i/o)».y/(.i/i - i/n!
'i'2 <~ (Pr. - =<j)"-/Ul - -o)
clamper. O, nx - 1)
clamp(7M. 0. ny - 1)
clamp(/;. 0. nz - 1)
if vr > O then
fr ,.,-.rf <- '•'•" + ('i- + '>***
ixStep <— +1
ixStop <— n.r
else
txnrst <- f-'-0 + (»•*•- 'j)rf^'
ixStep <- —1
ixStop <— -1
if v„ > O then
iyStep <— +1
iyStop •(— ny
else
tsnexf <~ %0+ (ny - iy)dty
iyStep <- -1
iyStop <— -1
if vz > O then
izStep <- +1
76
10. Grids /(^Acceleration of Intersection
izStop <— nz
else
tznext <— tzO + (nz - lz)dtz
izStep <— -1
izStop <— —1
while true do
if (txnext < tynextandtxnext< tznext) then
if (grid(ix,iy,iz) and grid(ix,iy,iz)-^hit(r,time,t,txnext.VHR,rnp)) then
return true
t «— txnext:
txnext += dtx:
ix += ixStep:
if (ix = ixStop) then
return false;
else if tynext < tznext then
if (grid(ix.iy.iz) and grid(ix.iy.iz)-t;hit(r.time.t.tynext.VHR.mp)) then
return true
t <— tynext:
tynext += dty;
iy += iyStep:
if (iy = iyStop) then
return false:
else
if (grid(ix.iy.iz) and grid(ix,iy.iz)-t-,hit(r.timt\t.tznext.VHR.mp)) then
return true
t <— tznext;
tznext += dtz:
iz += izStep;
if (iz == izStop) then
return false:
102 GRID CREATION
There are two tasks to be done when creating a grid. The first is, given the
axis-aligned bounding box of the objects to be placed in the grid, to choose the
number of subdivisions nx, ny,nz. The second is to actually add object lists to
the grid cells.
Various authors have argued that it is best that the grid cells be roughly
cubes and that the number of gridcells be on the same order of magnitude as the
number of objects. This can be accomplished in the following manner:
102. Grid Creation T?
'WXWyWZ\3
n I
round1!
4\
= round (^),
round
(T)
where u:x. wy. and tu- are the lengths of the bounding box sides and nr- ny.
and n, are the number of subdivisions used to create a nx x ny x n- grid.
To add objects to the grid, you should employ a sort of 3D scan conversion.
The easiest way is to add a surface to a cell if that surface's bounding box
overlaps the cell. This can be accomplished easily by finding the grid cell indices
occupied by the two extreme corners of the surface bounding box and adding the
object to every cell in the range of indices between these two extremes. This may
add the surface to cells it doesn't actually overlap, but such false negatives will
only impact performance and not correctness. More efficiency can be gained by
more sophisticated overlap tests, but I rarely employ them.
Partm
Advanced Ray Tracing
11
Monte Carlo Integration
To go further in making our pictures look realistic, we need to use Monte Carlo
methods, which use random numbers to solve numerical problems. "Monte
Carlo" refers to any method that uses averages of random computations to get
an approximate answer to a problem. We cover only Monte Carlo integration
here. Readers interested in a broader treatment of Monte Carlo techniques should
consult one of the classic texts [20, 55. 19. 74].
11.1 MONTE CARLO OVERVIEW
To get an idea of how a Monte Carlo simulation progresses, observe the dart
impact positions shown in Figure 11.1. As more and more darts are thrown, we
can see that there is a definte pattern, or density to how the darts are hitting.
Two important questions: 1) How do we describe this pattern mathematically?
2) How do we simulate the generation of dart positions to fit that pattern? The
answer to the first question is a probability density function which we will
discuss now. The second question is dealt with in the next chapter.
If we take a smali area ,4 on the dartboard and count hits within that area, the
number will increase as the number of darts thrown increases. We can normalize
this by measuring the fraction of darts within the area. This fraction will vary
as the number of darts increases, eventually settling on the true probability of
hitting the area. Note the simplicity of that concept: The probability of hitting
the square is j ust the fraction of an infinite number of darts that hit the area.
We can generalize this concept further by making the area very smali.
However, then the probability will also get very smali. To normalize again, we can
divide the fraction that hits the smali region by the area of the smali region. As
we make the region smaller and smaller, eventually it is infinitesimal,and every
point will have a probability divided by a smali area. The probability and the
area both go to zero, but their fraction does not. For every point x, this fraction
81
82
11. Monte Carlo Integration
Figure 11.1. A dun board with dart impaot positions shown. As more darts are thrown, the
underlying distribution ot" dart positions becomes more obwous.
has a potentially different value p(.v). This is a probability detnitx function.
Note that the probability of selection, given points .n or x-i. is zero, but the rado
/•>(•'■ t), p(.('j)is the relative likelihood of choosing a point near xi as opposed to
a point near ,r>.
How does all this relate to ray tracing? As we will see, we need to solve
integrals to generate realistic images. Rays will be generated probabilistically to
help us estimate solutions to these integrals. Random numbers and points can
be great ways to solve integrals. For example, in our dart board problem, each
dart location x has a score s(x). The average score for a player is
f
average score = / p(x).s(x)dA.r.
Jxedartboard
We could compute this by hand or we could write a program that just averages
N dart scores:
average score =s — > s xt).
it ^—'
This assumes we can generate random xt with the right density. Obviously, this
indicates we can approximate integrals for some problems via simulation. In
fact, we can approximate any integral with any density function.
Consider the one dimensional integral:
r"
1 = I f(x) dx.
Ja
11.2. A Linie Probability
83
This can be viewed as taking an area under / in the interval [a, 6]. Another way
to consider this integral is
/ = (b - a)average(/(i))
where the average is taken over the interval [a. b]. This 3s really just saying
that the area is the base times the average height. We can estimate averages by
picking random x, € [a. b\:
This is analogous to what a telephone survey does to estimate otheraverages.
Less obvious is that we do not need the x, to be uniform. For example, suppose
H has an underlying density p(x) which has a preference for numbers near b.
This means b is more likely to be chosen than a. If we use just the simple
averaging formula, then we would get the wrong answer; our results would be
biased. Butp(</) tells us exactly how skewed our sample is. If p(a) is large, we
are likely to get samples near a and we need to weight them less. To do this,
our scaling factor should be proportional to the inverse of pix):
What is not obvious is that the scaling constant on this formu3a is right. However,
consider the case where p(.r) is a constant. This constant is l/( b - a). So this
case can be used to normalize the above expression and see that it is right.
Now that we have established some intuition for why integrals and
randomness go together, we will go through a more formal treatment. Take it slow and
keep your intuition by trying examples.
112 A LITTLE PROBABILITY
Before getting to the specifics of Monte Carlo techniques, we need several
definitions, the most important of which are continuous random variable.probability
density function, expectedvalue. and variance. This section is meant as a review
and those unfamiliar with these terms should consult an elementary probability
theory book (particularly the sections on continuous, rather than discrete, random
variables).
Loosely speaking, a continuous random variable z is a scalar or vector
quantity that "randomly' takes on some value from a continuous space S, and
84
//. Monte Carlo Integration
the behavior of x is entirely described by the distribution of values it takes. This
distribution of values can be quantitatively described by the probability density
function, p, associated with x (the relationship is denoted x - p). If x ranges
over a space S, then the probability that x will take on a value in some region
Si C S is given by the integral
Prob(x € 5.) = / p{x)dp. (p:S-> R1). (11.1)
J Hi
Here Prob{event) is the probability that event is true, so the integral is the
probability that x takes on a value in the region St. The notation p :S —» R1
should be read "p is a function that takes a point in set 5 and returns a value
in set R1." This is similar to the familiar function prototypes such as int
func(realx) which could as easily be written "f unc: real—>int." The
measure p is the measure on our probability space. In graphics. S is often
an area (dp = dA = d.rdy) OT a set of directions (points on a unit sphere:
rf/j = <L; = *m6dftdo). Loosely speaking, the probability density function
describes the relative likelihood of a random variable taking a certain value: if
p(.z'i) = 6.0 and p(.r->) = 3.0. then a random variable with density p is twice as
likely to have a value "near" .i) than it is to have a value near rj. The density
p has two characteristics:
p(.r) > O (Probability is nonnegutive). (I 1.2)
p[x)dp = 1 (Probi.r e S) = 1). ( 11.31
As an example, the canonical random variable $ takes on values between zero
(inclusive) and one (non-inclusive) with uniform probability (here, uniform
simply means each value for is equally likely). This implies that
){ [ 1 ifO < < 1
[ O otherwise.
The space over which is defined is simply the interval [0.1). The probability
that takes on a value in a certain interval [a. 6] 6 [0. 1) is
Prob(a < £ < b) = f 1 dx = b — a.
J a
As an example, a two-dimensional random variable a is a uniformly distributed
random variable on a disk of radius R. Here, uniformly means uniform with
respect to area, e.g., the way a bad dart player's hits would be distributed on
I
11.2. A Linie Probability
85
a dart board. Since it is uniform, we know that p(a) is some constant. From
Equation 11.3, and the fact that area is the appropriate measure, we can deduce
thatp(a) = l/(7ri?2). This means that the probability that a is in a certain
subset Si of the disk is j ust
Prob(a S,) = / ^dA.
J Si *"•«
This is all very abstract. To actually use this information, we need the integral in
a form we can evaluate. Suppose Sz is the portion of the disk closer to the center
than the perimeter. If we convert to polar coordinates, then Q is represented as a
(r, 6} pair, and Si is where r < R/l. Note that just because a is uniform does
not imply that 9 or r are necessarily uniform (in fact, 0 is uniform and r is not
uniform). The differential area dA becomes r dr dt). This leads to
o r'lir r— i
Prob(r <--)=/ / • -—^rdrdO = 0.25.
Ju J» "K-
The average value that a real function / of a one-dimensional random variable
will take on is called its expected value. E(fl.r)):
I
£(/U'))= / fU-)p(x)dn.
The expected value of a one-dimensional random variable can be calculated by
letting /(.;•) = x. The expected value has a surprising and useful property: The
expected value of the sum of two random variables is the sum of the expected
values of those variables:
£(.!•+ ,,) = F(.r)+ E(u)
for random variables x and y. Since functions of random variables are themselves
random variables, this linearity of expectation applies to them as well:
£■(/(-'•) + <)(!))) = £(/(•<•)) + E(!)(n)l
An obvious question is whether this property holds if the random \ariables being
summed are correlated. (Variables that are not correlated are called independent.)
This linearity property in fact does hold whether or not the variables are
independent! Since the sum of two random variables is itself a random variable, this
principle generalizes. As an example of expectation, consider random points on
the disk of radius R. What is the expected distance r from the center of the disk
of radius R'l
^nu*
op
rdrd6 = —.
3
86 //. Monte Carlo Integration
The variance, var(x), of a one-dimensional random variable is the expected
value of the square of the difference between x and E(x):
var(x) = E([x - E(x)]2).
Some algebraic manipulation can give the nonobvious expression:
var(x) = E(x2) - [E(x)]2.
The expression E([x- E(x)\") is more useful for thinking intuitively about
variance, while the algebraically equivalent expression E[x2) — [E(x)$ usually
convenient for calculations. The variance of a sum of random variables is the
sum ot the variances if the variables are independent. This summation property
of variance is one of the reasons it is frequently used in analysis of probabilistic
models. The square root of the variance is called the standard deviation, a,
which gives some indication of expected absolute deviation from the expected
value.
The variance tells us what the expected square of the deviation from the mean
is. Sometimes we would like to know the absolute deviation from the mean,
such as "the darts average ten centimeters from the bulls-eye." Computing such
an absolute deviation is difficult. Often, it is sufficient to know the standard
deviation a(.r) = y tw(j'). The standard deviation, at an intuitive level, will
usually serve as an approximation to expected absolute deviation.
Many problems involve sums of independent random variables .r,. where the
variables share a common density /. Such variables are said to be independent
identicalh-distrihutedmndom variables. When the sum is divided by the number
of variables, we get an estimate of £"(>):
^^xri:*'-
N
f=i
As N increases, the variance of this estimate decreases. We want n to be large
enough that we have confidence that the estimate is "close enough." However,
there are no sure things in Monte Carlo: we just gain statistical confidence
that our estimate is good. To be sure, we would have to have n = x. This
confidence is expressed by Law of Large Numbers:
Prob
1 '
E{x) = lim — y^ xt
JV-+CC N J-J
JV-+CC N
t=l
So, with a probability of 1, our estimate will eventually converge to the right
answer.
11.3. Estimating Definite Integrals
87
113 ESTIMATING DEFINITE INTEGRALS
For a function / and a random variable x ~ p, we can approximate the expected
value of f(x) by a sum:
(f(x)) = I f(x)p(x)dp* -^2f{xi). (11.4)
Jxes '■ i=1
Because the expected value can be expressed as an integral, the integral is also
approximated by the sum. The form of Equation 11.4 is a bit awkward: we
would usually like to approximate an integral of a single function g rather than
a product f p. We can get around this by substituting g = f p as the integrand:
/
*<•>«« =4 ££t ^
r€5 -' ,= 1
P(J<
For this formu3a to be valid, p must be positive where g is nonzero.
So to get a good estimate, we want as many samples as possible, and we
want the g.'p to have a low variance (y and p should have a similar shape).
Choosing p intelligently is called importance sampling, because if p is large
where g is large, there will be more samples in important regions. Equation 11.4
also shows the fundamental problem with Monte Carlo integration: diminishing
return. Because the variance of the estimate is proportional to l/N, the standard
deviation is proportional to 1 v^V. Since the error in the estimate behaves
similarly to the standard deviation, we will need to quadruple A" to halve the
error.
Another wav to reduce variance is to partition 5, the domain of the integral,
into several smaller domains 5,. and evaluate the integral as a sum of integrals
over the 5,. This is called stratified sampling. Normally, only one sample is
taken in each S, (with density p,), and in this case the variance of the estimate
is
p,(-i;) frT \Pt(x
It can be shown that the variance of stratified sampling is never higher than
unstratified if all strata have equal measure:
I p(xW= "TV , p{x)d(i-
Js, N Js
The most common example of stratified sampling in graphics is jittering for pixel
sampling [ll].
92
11. Monte Carlo Integration
The sin 9 term arises because the measure is solid angle (area on the unit sphere:
dui = dA = sm9d9d<j>). To solve this, we just need to choose a random direction
u> to sample with a distribution according to the density function cos 9/n. This
gives the estimator
L(x) = pd(x.)L(x,u>).
This makes it easy to figure out the color of the ground in the mid western United
States: It's the weighted average of the color of the sky times the reflectance of
the ground!
11.7 MULTIDIMENSIONAL QUASI-MONTE CARLO
INTEGRATION
Suppose we want to numerically estimate the value of an integral / on [0. lj-:
/= / / /{■'■■ )/)d.rdf,.
For pure Monte Carlo, we might use a set of uniform random points (.r, ,.i/,) €
[0. I]2 and estimate / to be the average of f(x, .,</,). For stratified sampling,
we might partition [0. lj- into several equal-area rectangles and take one sample
(.r,. ,y,) in each rectangle and again average /(.(',.//,). Interestingly, we might
also use "Poisson-disk" sampling to generate the points, or evenjust use points
Figure 11-3. Random. Jittered, Poisson disk. Regular.
11-7. Multidimensional Quasi-Monte Carlo Integration
93
on a regular grid. No matter which of these point distributions (shown in
Figure 11.3) we use, the estimate of/ is the average of f(xi, t/;). Interestingly, only
when we use one of the first two patterns are we doing Monte Carlo integration.
With Poission-disk (dart-throwing), the samples are correlated, and in regular
sampling they are deterministic.
As in the one-dimensional case, we can replace the random sample points
with any set of samples that are in some sense uniform, and this is just quasi-
Monte carlo integration. There is rich literature on this topie, but Mitchell has
indicated that the graphics community will not be able to findmany useful
answers there, because the patterns that are used in that literature are deterministic,
which causes aliasing in images [33]. He suggests that perceptual issues should
determine which type of sampling is best.
12
Choosing Sample Points
The last chapter discussed how to estimate integrals using a set of random points
with underlying density p. This chapter discusses how to get such points for
various p with various domains. The section on disks is largely derived froma
paper intended to sample camera lenses [52],
12.1 OVERVIEW
We often want to generate sets of random or pseudorandom points on the unit
square for applications such as distribution ray tracing. There are several methods
for doing this such as jittering and Poisson disk sampling. These methods give
us a set of N reasonably equidistributed points on the unit square: (ui.i'i)
through (;/.v. r.v).
Sometimes, our sampling space may not be square (e.g.. a circular lens),
or may not be uniform (e.g.. a filter function centered on a pixel). It would
be nice if we could write a mathematical transformation that would take our
equidistributed points (u,. r,) as input, and output a set of points in our desired
sampling space with our desired density. For example, to sample a camera lens,
the transformation would take (iij, v,) and output (r-t. 0,} such that the new points
were approximately equidistributed on the disk of the lens.
In one dimension, we assume we can generate a set of canonical random
numbers ( i. 3 &v) and transform them to the desired nonuniform
numbers. For example. (£j. J %) are not uniform, but they are still random.
The question is what transform T(E) gives us exactly the right behavior for
probability density function p? The answer turns out to be a not immediately
intuitive inverse of an integral of p. To get some insight into the behavior of
the transform, see Figure 12.1. Here we take some canonical £: (in fact they are
jittered), and attempt to create samples distributed to a triangle-shaped density.
The dashed lines are bins of probability 1/10. Not surprisingly, the samples stay
95
96
12. Choosing Sample Points
utx) ,
1 x
Figure 12.1. We can take a set of canonical random samples and transform them to nonunitbrm
samples.
within their bins. Taking this idea to infinitely many bins gives a mechanism to
compute T as discussed in the next section.
12.2 GENERATING ID RANDOM NUMBERS WITH
NONUNIFORM DENSITIES
If the density we wish to sample is a one-dimensional pi.r) defined over the
interval ,r £ [/„,„,;„„,, . then we can generate random numbers n, that have
density/? from a set of uniform random numbers ,. where , t [0. ll. To do
this, we need the cumulative probability distribution function P(.r):
Prob{a < x) = P(x) = j p(x ')dfi
(12.1)
To get a, we simply transform t:
a,=P'l(^) (12.2)
where P"] is the inverse of P. If P is not analytically invertiblethen numerical
methods will sufficebecause an inverse exists for all valid probability distribution
functions.
For example, choose random points Xi ~ p, where
, /2|i if i 6 [-1,1],
O otherwise.
12.3. Generating 2D Random Numbers With NonuniformDensities
97
We can see that the associated probability distribution function is
[0 if x < -1,
PW= U-i¥^ if i e [-1,1],
y if x > i.
To find an inverse of this function, we compute xi in terms of x:
* J-i 2 2 ' 2"
Now we solve for x in terms of . completing the inversion of P:
x= \/2?-l.
So we can "warp" a set of canonical random numbers (£i.•• • ■ vv) to the
properly distributed numbers (.ri.---.sx) = (v'2si — l.--- . ty'I'.x - 1). This
same warping function can be used to transform "uniform" Poisson disk samples
into nicely distributed samples with the desired density. So. a set of jittered
samples with this density would be as given below:
for / — O to n - 1 do
.r, = {!2(,+i,)!n - 1
123 GENERATING 2D RANDOM NUMBERS WITH
NONUNIFORM DENSITIES
If we have a random variable o = (a,, n,,) with two-dimensional density i.'-.y)
defined on [.!■„,,-„..r,„„.,- x [;/„,,„.</„,„.,■' then we need the two-dimensional
distribution function
Pvob\ar < x and au < ;;) = F(x.ij) = / / /(.)•'. i/')(//((.r'. ()').
We first choose an .;•, using the marginal distribution F(.r. (/,„„.,■). and then
choose y, according to F(x,. y)/F(x,. t/„m.i)-If f(x->j) is separable
(expressible as q(x)h[y)),then the one-dimensional techniques can be used on each
dimension.
For example, suppose we are sampling uniformly from the disk of radius R.
so p(r,0) = l/(7ri?2). The two-dimensional distribution function is
f6a [T° rdrd.9 6{)rl
Prob(r <r0and8 <00) = F(r0,9o)= Jq ~^f = ^W'
98
12. Choosing Sample Points
This means that a canonical pair ( i, 2) can be transformedto a uniform random
point on the disk: (r, 0) = {R\/ti, 2n 2).
To choose reflected ray directions for zonal calculations or distributed ray
tracing, we can think of the problem as choosing points on the unit sphere or
hemisphere (since each ray direction ^ can be expressed as a point on the sphere).
For example, suppose that we want to choose rays according to the density:
p(e, <j>) = ^-ti cosn 9 (12.3)
In
where n is a Phong-like exponent. 6 is the angle from the surface normal and
B [0, k/"2] (is on the upper hemisphere), and 0 is the azimuthal angle (0 6
[0. 2t]). The distribution function is
fa pf>
P(0.o) = \ I pW'.o'^mO'dO'do'. (12.4)
Ja Jo
The cos ff term arises because on the sphere (/_• = cos QiWdo. When the
marginal densities are found.p (as expected) is separable and we find that a (si-sV)
pair of canonical random numbers can be transformed to a direction by
(0.O)= (arccosfd - n J^O). 2-r_>)
One nice thing about this method is that a set of jittered points on the unit square
can be easily transformed to a set of jittered points on the hemisphere with a
distribution of Equation 12.3. If n is set to 1 then we have a diffuse distribution
needed for a Monte Carlo zonal method.
12.4 SAMPLING TRIANGLES
To generate uniform random points on a triangle, we use the natural barycentric
coordinates of the triangle and note that the determinant of the Jacobian matrix
that takes a triangle defined with barycentric coordinates to a triangle with an
unnormalized coordinate system is a constant. This means that if we pick random
barycentric coordinates for one triangle, we can use them for any other triangle
and the random point will still be uniform. We now go into some detail on the
mechanics of choosing a uniform p, because when the uniform density function
is written in terms of the two coordinates on the triangle, it is not separable.
Using barycentric coordinates, everypoint on the plane containing a triangle with
vertices p0, pj, and p2 can be described by p = p0 + B{p^ - p0) + 7(p2 - Po)
and the p is in the triangle if and only if (0 > 0) and (7 > 0) and {3 + 1 < 1).
12.4. Sampling Triangles
99
Integrating the constant 1 across the triangle gives
/ r
1-7 !
dj3 dr) =
This means that the value of our density function is 2 in barycentric coordinates
(and 1/Ain Cartesian space, where A is the area of the triangle, implying the
determinant of the Jacobian that transforms from barycentric to Cartesian space
has the value 2.4).
To perform an inversion, we must first find densities which correspond to
0 and 7 separately. If 3 and 7 were independent, we could simply use the
marginal density for each. In this case, 0 is dependent on 7. Therefore, we will
use the marginal density for 7, fed), and the conditional density of ,3 given 7,
/B|G(J]-y). By definition
/«:.■(-)= f ' f(l3.-i)d3 = 2{\
Jo
and
/(Jo)
fod-i';-))
foil) !-->
Now we can pertbrm the inversion by letting i= F&'d'land >= ■FBiG'Wb')
and soKing for 3' and V. Here Fa and Fo c are the cumulative densities
corresponding to the random variables -.' and J'\~-' respectively. Again by definition
Zl=FC(-)')= f A;h)^=20-,'2.
Jo
Solving for V we get ~' = 1 - \A -Ti- For 3':
ii = FB,G(3'W) = / /BIG(d'h') d3 = -^—,,
Jo t — ~i
thus ' = >(1 - 7') = £2v/T^Ti. Therefore.
= Po + fe v/l-& (Pt " Po) + (1 - \/l-£ij (P2 - Po) • (l2-5)
P
This is the same method presented by Pattanaik [38] in his dissertation. Turk [62]
presents a faster method for uniformly sampling triangles that makes stratification
deteriorate slightly.
too
12. Choosing Sample Points
125 SAMPLING DISKS
While the simple transforms just described will yield a correct program,
sometimes we can make transforms with better numerical properties. In this section,
we describe choosing random points on a disk in a "better" way. This section
can be safely skipped as it is an improvement rather than a necessity.
Many graphics applications map points on the unit square S = [0. I]2 to
points oh the unit disk V — {(x.y) x2 + y2 < 1}. Sampling disk-shaped
camera lenses is one such application. Though each application can have its
own unique requirements, experience has shown that a good, general-purpose
map should have the following properties.
Preserve fractional area. Let R € S be a region in domain 5. The fractional
area of if is defined as a{R)/a(S).where the function a denotes area. Then
a map in :.S —> V preserves fractional area if the fractional area of R is the
same as the fractional area a{m(R))(u{V) for all R e 5 (Figure 12.2). This
property ensures that a "fair" set of points on the square will map to a fair set
on the disk. For distribution ray tracers this means a jittered set of points on
the square will transform to ajittered set of points on the disk. Bicontimious.
A map is bicontimious if the map and its inverse are both continuous. Such a
map will preserve adjacency: that is. points that are close on the disk came from
points that are close on the square, and vice versa. This is especially usefulwhen
working on the hemisphere, because it means that the angular distance between
two directions can be estimated by their linear distance on the square.
Low distortion. By low distortion, we mean that shapes are reasonably well
preserved. Detining distortion more formally is possible, but probably of
limited benefit because no single definition is clearly suitable for a wide range of
applications.
2)
s
Figure 12.2. A map that preserves fractional area will map regions with the area constraint that
12.5. Sampling Disks
101
Figure 12.3. The polar map takes horizontal strips to concentric rings.
These properties as well as several others are also important to map-makers
who map the spherical Earth to a rectangular map [7]. Figure 12.3 shows the
polar map. probably the most obvious way to map the square to the disk: x is
mapped to r and y is mapped to o. Because the area between r and r + Ar is
proportional to r to the first-order, the map is not a linear function of z:
r = v'J
o = 2-y
This map preserves fractional area, but does not satisfy our other properties. As
can be seen in the image, shapes are grossly distorted. Another problem is that
althousih (r.o) = (s//x.2~i/)is continuous, the inverse map is not. For some
applications we would prefer a bicontinuous map.
12.5.1 The Concentric Map
We now present the concentric map. which maps concentric squares to concentric
circles, as shown in Figure 12.4. This map has the properties listed above. and
is easy to compute. It has been advocated for ray tracing applications [51]
and has been shown empirically to provide lower error for stochastic camera
Figure 12.4. The concentric map takes concentric square strips to concentric rings.
102
12. Choosing Sample Points
Figure 12.5. Quantities for mapping region 1.
lens sampling [24], but the details of its computation have not been previously
published.
The algebra behind the map is illustrated in Figure 12.5. The square is
mapped to (o. h) -1. I]2. and is divided into four regions by the lines a = b
and a = -b. For the first region, the map is
X — U
Ttb
o — —-
4 a
This produces an angle o e [—n/i. tt/4]. The other four regions have analogous
transforms. How the polar map and concentric map transform the connected
points in a uniform grid is shown in Figure 12.6. We show in the Appendix that
this map preserves fractional area.
This concentric square to concentric circle map can be implemented in a
smali piece of robust code which has been written to minimize branching:
■Afy. ■■
Figure 126. Left: unit square with gridlines and letter "F". Middle: polar mapping of gridlines
and "F\ Right: concentric mapping of gridlines and "F\
12.5- Sampling Disks
103
Vector2 ToUnitDisk( Vector2 o)
real <t>, r, u, v '
real a = 2ox - 1 {(a,b) is now on [-1, l]2-}
real 6 = 2oM - 1
if (a > -b) {region 1 or 2} then
if (a > b) {region 1, also \a > \b\} then
0 = (7r/4)(6/a)
else
r = 6
© = (7r/4)(2-a/6)
else
if (a < b) {region 3. also lol > 161, a i= 0} then
r = -a
0 = (tt/4)(4 + b/a)
else
r = -b
if (MO then
o = (-/4)(6 - a/b)
else
phi - O
u — r cos o
v = r sin O
return Vector2( u. c )
The inverse map is straightforward provided the function atan2 () is available.
The code below assumes atan2 () returns a number in the range [-"■ ""j- as it
does in ANSI C. ANSI C++, ANSI FORTRAN.and Java.
Vector2 FromUnitDisk(Vector2 p )
real r = ^Jpj. + p2
real o — atan2(prpJ.)
real a. b. x. y
if 0 < -n/4 { (p e {-pi/4.7pi/i}} then
0 = o + It;
if phi < ?r/4 {region 1} then
a = r
6 = 0a/[ir/4)
else if 0 < 3tt/4 {region 2} then
b = r
a = _(0_,r/2)*6/(ir/4)
else if 4> < 57r/4 {region 3} then
a = — r
1<M
12. Choosing Sample Points
b = (0 - 7r)a/(7r/4)
else
b= -r
a = -{<t>- 37r/2)6/(7r/4)
x = (a + l)/2
y = (6+l)/2
return Vector2(x, y)
A random point on the disk of radius R can be generated by passing a random
point on [O, 1] through the map and multiplying both coordinates by R.
A set of n jittered points can be generated similarly using uniform
random numbers between O and 1 such as generated by a call to a canonical
random number generator that produces number and ' on two adjacent calls:
int s = O
for i = O to n - 1 do
for j = O "to n - 1 do
Vector! o = {{> + £)/n. (j | .')/n)
onDisk[s++] = Tol!nitDisk{ o )
Note that the random numbers are generated by new calls on each iteration of
the loop.
12.5.2 Jacobians
When the concentric map is expanded out so that we map from (a. 6) € [-1. l:'-
to (u. r) on the unit disk, the map is
fitb\
u = a cos ' — ' .
v = a sin r —J1.
The ratio of differential areas in the range and domain for the map is given
by the determinant of the Jacobian matrix. If this determinant is the constant
ratio of the area of the entire domain to the entire range, then the map preserves
fractional area as is desired. This is in factthe case for the concentric map:
du
Jfe
da
du
&
96
IT
This is the constant 7r/4 because that is the ratio of the area of the unit disk to
the area 'of [-1J l]2. By symmetry, the determinant of the Jacobian matrix is the
same for the other three regions.
13 Antialiasing
This is the first of several chapters which use random sampling to compute better
images. Until now, your images suffer from "jaggies," a result of aliasing. It's
been shown empirically that you can usually get better images if you think of
a pixel as the average color of the sampled continuous image near the pixel
center. Quite a bit is understood about why this is true, but there are still open
questions about-how this averaging should really be done. This chapter describes
the simplest way to do it. which will give you much better images withjust a
little extra code (and a lot of extra execution time).
13.1 RASTERS
In the real world, we can think of the light seen through a window as a rectangular
2D image. This is bogus for a moving viewer, but it is reasonable for a smali
instant of time. We can also think of the 2D rectangular image cast onto the
backplane of a camera. For a black and white camera, all we care about is the
total amount of light falling on each point on the film. Let's say we put an sy
coordinate system on the film. The light falling on the film could be denoted
f(x. y) where / is some, as yet unspecified, intensity. Of course, the amount of
light at any point is zero, but the light per unit area is finite.
When we look at the window or film piane we see an image as a picture.
Where / is big, we see white. Where it is small, we see black. In between, we
see greys. Now suppose we want to duplicate that picture on a digital medium
such as an LCD screen. Such media typically have some layout of light emitting
(or reflecting) atomie regions known as pixels, short for "picture elements."
Each pixel might be a square region that gets a constant intensity (e.g., for an
LCD screen) or it might be a set of smaller colored "blobs" (e.g., for a traditional
CRT). In any case, for the rest of this discussion, we assume that there are nxby
ny pixels, and that they are in a rectangular array. Further, we assume coordinate
105
106
13. Antialiasing
9.5.7.5)
j-ai
(-0.5.-0.5
V
,.
.51
i
'i +
-j +
■) +
- 4-
- +
-1 +
* +
+ ! +
+
+
+
+
+
+
-r
+
-L-
+
+
+
-f
+
+
+
+
4-
+
+
4-
9
+
-
+
4-
£"
(\
5.7.5)
+
T
+
|
Figure 13.1. Sampling an image of the letter "a" on a 10 x 8 pixel screen. The c<x>rdinate systems
assumed tor the function / being sampled and the screen image /^. Note that the integer coordinates
occur at pi\el centers, that / is definedoutside the screen boundaries, and that the coordinate systems
have a direct correspondence. The image on the right uses the average colorWithin each square pixel.
systems for/ and what is displayed on the screen is shown in Figure 13.1. This
makes a very simple mapping between the coordinate system of/ and /... Note
that pixel centers have coordinates (0.0) through {n,. — 1. n,, - 1).
13.2 DISPLAY DEVICES
Digital display devices typically have a finite set of p intensity values they can
achieve: [0. I\ ^-i- For convenience, we pretend it is really a continuous
set of values parameterized by a multiplier a in the range [0. 1). Further, we
also pretend that /<) is zero, although this is never true. So a = O is the same as
saying intensity / — /(). and a = 0.999 is the same as saying a = Ip-\. Why
0.999 and not 1? This allows each discrete intensity level to own the same size
interval on a and to get the following conversion:
r _ L«pJ r
p-i
If we allowed a to be 1, we could get intensities greater than Imax, the maximum
intensity of the device. If we had p = 10, then we would have a lot of banding
in images. This could be alleviated if we used this formu3a for conversion:
p-i
13.3. Filtering
107
where is a canonical random number, which is a uniform random number 0n
me interval [0,1) such as approximated by drand4 8 (). That is a crude form
°f dithering, which we will not discuss further — for a survey see the book by
Ulichney [63].
What does p need to be to display smooth images? If we let the spacing
between It and Ii+l be the same for all i. then we will notice that we stop seeing
banding near white for a smali p. say around 40. But we need to drive p far
above 256 before the banding disappears for smali values of I (i.e.,dark colors).
This is because we are sensitive to the relative difference between intensities,
so the absolute difference between two dark intensities looks bigger than the
same absolute difference between two light intensities. The obvious solution is
to push more of the color levels toward dark values. This is what is done on
almost all display devices, and the parameter that controls how much nonuniform
bunching is done is usually called qamnui (the greek letter 7). Suppose we have
an intensity that is a fraction a of the maximum intensity we wish to display.
The level i e {0. 1 p - 1} we pick is
, i
/ = a ' p .
Here. / is the number (between O and 255 for an 8-bit file format) that you write
out to disk when outputting the image. Note that this means the screen intensity
for a given a is
p- i
Note that this is all a game to allow us to use only eight bits of storage for the
intensities in tranie buffers and image f iles. If we used sixteen bits, we wouldn't
need to worry about gamma in this context. What is the best gamma? It depends
on display conditions. So there is no right answer, although there will hopefully
one day be a standard. For Macs, it is 1.8. for SGIs. it is 1.4. and for other
devices gamma is usually 2.2. For a more complete discussion of gamma, see
the book by Poynton [44).
133 FILTERING
Suppose we have a continuous greyscale image we want to display on a monitor
with a rectangular array of pixels (e.g.. Figure 13.1). We cannot do it because the
continuous image has a potentially infinite amount of information in it and the
monitor is controlled by a smali number of probably 8-bit integers. Let's pretend
we can display any continuous intensity using the linear a parameter above. We
™> 13. Antialiasing
-still have ihe pfobfem 'of finite pixels. What shall we do? An obvious thing
to 36 is to divide ih& screen" up into squares around each' pixel. If we want to
fee fancy, \ve can'call this a voronoi partition because each square is the set of
points closer to each pixel Oeiitef than any other pixel 'center. Let's just set the
ipix'el intensity equal to the-average of the'-continuous image'intensities within
'the ;sqtfare. iFor ;f he i pixel'eehfered 'at (i,j) this is
[t+i rJ+i
M*-J)= / / f(x,y)dydx, (ill)
We Iheh rconvert<"6achof the//a(/, j)fo 'a variable 'a{ij)= ;kf„{i.j).where t
is'chosen :su©h that'irfdstrdf 'all'a(/. j)afe in [0.1), and the a's are written to an
linage 'file 'of computer screen.
This tyipe 'of aveTagiifg shown in liquation 13.1 "is called "box filterina."
There are "rnaay other types of averaging of weighted averaging that can be used
instead: arid some of them yield better empirical results than simple box filterina.
The g;ehefaliz£fi<$fi of Equation 13.1 is
/.,{>-■]) = / u-,j(.i:i/)fl.r.y)dijdx < 13.2)
Where it'o is the "filter" dr "weighting" function for pixel (i.j,). To turn
Equation ] 13.2Tritb 'TJtjUati(Jh 113.1. we:tis'e the filter function:
TO otherwise.
To make our lite simpler, we oaii assume that the filter is the same shape
everywhere, but is translated:
fA'J) = j J w(i + i\j + y)f(s.y)<ixdy. (13.3)
Here, ((he empty integration Hmits 'are shorthand for integrating over all ;t and
all !j: For the> box" fitter of width" W" (a generalization of the simple width one
box filter),- the Weighting function is
[ 'O ©thenvis'e.
The literature implies 'that rsoffie nonuniform w that is maximum 'at the pixel
tenter is" best- Oiie su6h filter i's 'the 'Separable triangle filter with support width
twa. "The term "support" refers to the region where w in nonzero. The term
13.3. Filtering 109
FigilfS 132. A unit width support box filter (left) "and "a width two support separable triangle filter
(right). The ellipses on the xy plane are pixel centers.
"separable" means the filter is in the form of a product of two ID functions:
w(x. j/) — a(x)(b). The separable triangle filter is given by:
I 0 otherwise.
and is shown in Figure 13.2. The separable triangle filter has a property that is
Usually desirable: in a filter function [34]: The total contribution of any given
(x. y) to the fina3 image is one. This ensures that the average of /, is the same
as the average "of./.
The difference" between" box and tent filters is not obvious for most still
frames. For an infinite checkerboard, the differences are barelv obvious as seen
Figure 133. An infinite checkerboard sampled with box (left) and tent (right) filters. Images
ibuftesy of Mike Stark.
110 13. Antialiasing
Figure 13.4. An extreme function to emphasize aliasing sampled with box (left! and lent (right)
filters. Note that, ideally, the far right of the image should be very smooth. All features there are
alaising. Images eourtes* of Mike Stark.
in Figure 13.3. The differences are more obvious if we use an extreme 2D
function usually used to illustrute human contrast sensitvily:
L{.r.y) = ~(l^f*m(2-u/"'))-
where a = x/nT. / = (1 — (i/ «,,))'. and .;' and y are coordinates in the system
where the lower left corner of the image is (0. 0) and the upper right is (tir. nu).
This image is shown in Figure 13.4. For moving images, all of the artifact.s
are much more obvious. For this reason, higher-order filters than the tent are
sometimes used. For more details see the books by Glassner [17].
13.4 SAMPLING
Given /. a screen resolution (nA.. ny), and a filter w, we could try to analytically
evaluate Equation 13.3 for every pixel (i.j) € {0.* • • . nx — l}x {0.* • • . nu — l}.
Unfortunately, these integrals may not be analytic, and we may have only an
implicit representation for /. By "implicit." I mean that we can evaluate / for a
given (x,y), but we have no explicit equation for it; we have only a procedure
for evaluating it. In such cases where we need to integrate some way other
than algebraically, we invariably use numencal integration (sometimes called
"quadrature"). A large class of numencal integration methods take a very simple
13.4. Sampling
ill
strategy of trying to estimate the average value of the integrand overthe domain
of integration, and multiplying it by the measure of the domain:
Jn Jn
where < /(x) >n means the average of/ on domain Q. This is a straightforward
manipulation of the definition of "average," and in 2D it just says the volume
is equal to the base times the average height. We can estimate the average
numerically by taking a set of N sample points X; fi and averaging the value
of/(x,):
1 'V_1
</(x)>^</(x,)>=-£/(xt). (13.5)
i=0
For Equation 13.5 to be valid, the sample points x, must in some sense be
uniformly distributed. There are several possible definitions of uniformly
distributed, and a reasonable one is that any given vex CI is just as likely to be
a sample point as any other rex € U. This is. in fact, overkill, but is a good
defmition in the limit.
Let's apply Monte Carlo integration to a unit width W box filter. For pixel
(i.j). we first generate a set of uniformly random points in [^— ir/2,i-t-U /2] x
fj-ir/2.j + H72]:
where and ' are canonical random numbers. We then displace these to pixel
center (i.j) and evaluate Equation 13.2 using Equation 13.5:
.j_j.ii; .,■-,. is: l »-i
fsdJ) = 77^ / ', / „. /U. y)drdU * - £ /(A- yk).
Images with various numbers of samples are shown in Figure 13.5.
For a nonuniform filter, we can instead use sample points whose distribution
is nonuniform in exactly the right way to give the result of the filter. For the
separable triangle filter, such points that are random (but nonuniform) can be
generated by the transform
' -1 + v^lit if *<0.5,
Xk — <
1 - y/2 - 2& otherwise.
112
13. Antialiasing
Figure 13.5. A checkerboard sampled with 1. 16. and 256 samples. Images courtesy of Mike Stark.
An analogous formu3a transforms 'k into to yk. The formu3a for the pixel
intensity is then
ii-i
JAiJ) - ^ J^ f(i + -Vk-j -r Uk).
i--o
Note that this formu3a only applies to nonunifoniipoints that have been "warped"
according to the appropriate function. Also, note that the input points need not
be random for this to work: they need only be uniform. The process for sampling
a pixel with warped regular sampiing is shown in Figure 13.6
T l+
#•'''•' -1
1.4-1)
*■
,.
• ■ ••
<i
.+ 1)
.V
(1.1 )
(0.5.0.5)
5)
--
14.
\.v5)
.V
Figure 13.6. The stages in applying a separable triangle to pixel (2. 1). Lett: A set of regular
samples are generated on [O, 1]". Middle: These samples are warped to have the density of the filter.
Right: The warped samples are moved over the center of the pixel. Note that the same procedure is
used if the initial samples are random, jittered, etc.
14
Cameras
In most graphics programs, a "pinhole" camera model is used where everything
is in perfect focus. For images with "depth-of-field." where some objects are not
in focus, we use a "thin-lens" camera model. Such a model is easy to implement
in a path tracer.
14.1 THIN-LENS CAMERAS
A thin-lens camera replaces the pinhole with a disk-shaped "thin-lens" which
nas certain idealized behavior (Figure 14.1). If the camera is focused on a point
at distance s f rom the lens, all light from that point will be focused at a point
distance i behind the lens. These two points will both lie along a line through
the lens center. The distances / and .s obey the thin-lens hiw.
1 _ I _ J.
14.2 REAL CAMERAS
Specify film size (W.H) and focal length /. The film size is the actual physical
size of the film that gets exposed—so H is approximately the distance between
the sprockets on 35 mm film. Then we can specify where we are focusing on
s > f. To specify the aperture of the lens we could just specify R. but the
tradition is to use the perhaps less cbwousf-number, N = f/(2R). Given these
variables, we have
ui _ v\ _ s
W/2= ~H]2~~i'
113
114
14. Cameras
Figure 14.1. For four samples, stratified samples on the lens are randomly paired with stratihed
samples on the pixel.
rxr
m T _:
25 ml.25 m
Figure 14.2. Cameras with f-numbers 22, 11,5.6, and 3.3 focused at 0.5 meters. Images courtesy
of Mike Stark.
14.2. Real Cameras
115
.5 m
25 m
Figure 143. Camera with f-number 5.6 varying the focus. Images courtesy of Mike Stark.
We know that
and
s-r
/T,I/ /„ A IT (* — t\\
(ui,n) = (-uo,-i>o)= ^y—j—. y J y
For a typical 35 mm camera and lens, / = 50 mm, W = 36 mm, and
H = 24 mm. Images for a camera with f-number 5.6 are shown in Figure 14.2.
Changing the focus is shown in Figure 14.3.
14. Cameras
Figure 14.4. For four samples, stratified samples on the lens are randomly paired with stratitied
samples on the pixel.
14.3 MULTIDIMENSIONAL SAMPLING
One way to implement the camera is to take a random point ( . '. ". '") in
[0. I)4 and use the first two coordinates to seed the lens sampling, and the
last two for the pixel sampling. But this wouldn't stratify, which is very bad.
An alternative is to stratify in 4D, but that is difficult and will produce poor
stratification on the pixel and the lens relative to 2D stratification. One could
Figure 14.5. Motion blur by generating rays with different times. Balls have center positions that
vary with time. Image courtesy of Greg Coombe.
14.3. Multidimensional sampling
117
lens
(«»v0)
<";.V/)
(llj.V,)
(u3,v3)
y\
pixel
(ao,b0)
(a,,b,)
(.a2,b2)
U'j.bj)
V
time
'o
'I
fi
h
Figure 14.6. The dark-shaded path represents a set of sample seeds that
that each column is a set of 2D or 1 D stratified samples.
generates one ray. Note
also create two sets of stratified 2D samples and match the first lens sample with
the first pixel samples, but this would lead to correlation and artifacts: in every
pixel, the same part of the lens would be matched with the same parts of the
pixel. But this matching will work if the pairing is random (Figure 14.4).
If we add time to the mix. each ray is at a specific random time within the
shutter-open time. For a moving object, a ray at time 3 is intersected at the
point where the object is at time t. This automatically gives motum-hlureffects
(Figure 14.5). The samples for a four sample pixel with time effects are shown
in Figure 14.6.
15
Soft Shadows
In this chapter, we will create soft shadows that arise from area light sources.
One way to do this is tojust sprinkle point light sources across an area and use
techniques from Chapter 3. Instead, we will use Monte Carlo methods to choose
random points on the area of a light source. As the number of samples in the
pixel becomes large, the number of samples on the light will become large as
well. Thus, the shadows will become smooth.
15.1 MATHEMATICAL FRAMEWORK
To calculate the direct light from one luminaire (light emitting object) onto a
diffuse surface, we solve the following equations:
L(x) = L,.(x)+ ~1 f , (x.^)cos6\L: (15.1)
" Vail j
where L(x) is radiance (color) of x. I,(x) is the light emitted at x. i?(x) is
the reflectance of the point. *; is the direction from which the light is incident,
and 6 is the angle between the incident light and the surface normal. Suppose
we wanted to restrict this integral to a domain of one luminaire. Instead of "all
uj." we would need to integrate overjust the directions toward the luminaire. In
practice, this can be difficult (the projection of a polygon onto the hemisphere
is a spherical polygon, and the projection of a cylinder is stranger still). So,
we can change variables to integrate overjust area (Figure 15.1). Note that the
differential relationship exists:
dA cos B'
&» = T-, M9- (15-2)
119
120
15. Soft Shadows
Figure 15.1. Integrating over the luminaire. Note that there is a direct correspondence between dx.
the differential area on the luminaire. and d^. the area of the projection o\ dx onto the unit sphere
eentered at x.
Just plugging those relationships into Equation 15.1 gives
, i?(x) f T , ^<IA cos f?'
L(X) = Z,„(X + -1 / LA-O COS 0-— rp;.
* Jmk ||x'-x!|-
There is an important flaw in the equation above. It is possible that the points
x and x' cannot "see'" each other (there is a shadowing object between them).
This can be encoded in a "shadow function." ,s(x. x'). wnich is either 1 or O
depending on whether or not there is a clear line of sight between x and x'.
This gives us the equation
L(x) = L,.(x) +
R[x)
£1 f
£,.(x )cosfl- „ / — . (1:>.3)
X' I|X' - X„-
If we are to sample Equation 15.3. we need to pick a random point x' On
the surface of the luminaire with density function p (so x' ~ p). Just plugging
into the Monte Carlo equation with one sample gives
L(x)» LJ-x.) +
R(x)
Up \A. ) V.UO L
n s(x,x')cos#'
= '"p(x')||x'-x||2''
(15.4)
If we pick a uniform random point on the luminaire, then p — 1/A where A is
the area of the luminaire. This gives
L(x) w Le{x) H Le(x ) cos9—^—■' . (15.5)
15.1. Mathematical Framework
121
We can use Equation 15.5 to sample planar (e.g., rectangular) luminaires in a
straightforward fashion. We simply pick a random point on each luminaire. The
code for one luminaire would be as follows:
spectrum directLightfa n J
pick random point x' with normal vector n' on light
d = (x' - x)
;/ ray x + td hits at x' then
return ALe(x')(n« d)(-n' - d)/||d||4
else
return O
The above code needs some extra tests such as clamping the cosines to zero if
they are negative. Note that the term ||dj|4 comes from th-c distance squared
term and the two cosines, e.g.. n • d = lldjl cos 9 because d is not necessarily a
unit vector.
Several examples of soft shadows are shown in Figure 15.2.
Figure 15.2 Various soft shadows on a backlit sphere with a square and a spherical light source.
Top: one sample. Bottom: 100 samples. Note that the shape of the light source is less important
than its size in determining shadow appearance.
122 15. Soft Shadows
Figure 15.3. Geometry for spherical lunuruiire.
15.2 SAMPLING A SPHERICAL LUMINAIRE
Although a sphere with center c and radius r can be sampled using Equation 15.5.
this will yield a very noisy image because many samples will be on the back
of the sphere, and the cos 0' term varies so much. Instead, we can use a more
complex p(x') to reduce noise. The first nonuniform density we might try is
p(x') y. cos#'. This turns out to be just as complicated as samplingwith p(x') x
cos 0' :\\x' — x]!2. so we instead discuss that here. We observe that sampling on
the luminaire this way is the same as using a density constant function q{^) =
const defined in the space of directions subtended by the luminaire as seen from
x. We now use a coordinate system defmed with x at the origin, and a right-
handed orthonormal basis with w = (c-x)/||c-x||. and v = (wxn)/ll(wxn)ll
(see Figure 15.3). We also define [a.o) to be the azimuthai and polar angles
with respect to the uvw coordinate system.
The maximum Q that includes the spherical luminaire is given by
• / r \ ( r V
Qmax = arcsm I r. rr = arCCOS U 1 — J, 17
Vl|x-c||/ V Vl|x-c||y
Thus, a uniform density (with respect to solid angle) within the cone of directions
subtended by the sphere is just the reciprocal of the solid angle 2rr(l — cos ana,)
15.2. Sampling a Spherical Luminaire
123
subtended by the sphere:
And we get,
COSQ
0
fcrll-vMlP^)'
This gives us the direction to x'. To find the actual point, we need to find
the first point on the sphere in that direction. The ray in that direction is just
(x + ia), where a is given by
cos o sm a
sin o sin a
cos a
We must also calculate p(x'). the probability density function with respect
to the area measure (recall that the density function q is defined in solid angle
space). Since we know that q is a valid probability density function using the a
measure, and we know that do(^)- dA{x!) cosO1 /\\x-x'\\2. we can relate any
probability density function <7(a.')with its associated probability density function
p(x'):
<?("<•) =
p(x') costf'
■ x.
(15.6)
Figure 15.4 A sphere with Lc = 1 touching a sphere of reflectance 1. Where they touch the
reflective sphere should have L(x) = 1. Left: one sample. Middle: 100 samples. Right: 100
samples, close-up.
124
15. Soft Shadows
So we can solve for p(x'):
, ,, cos 9'
P(x ) = / , v •
2T||x-xT^l-V/l-(p^)j
A good debugging case for this is shown in Figure 15.4. For further details on
sampling the sphere with p see the article by Wang [66].
153 NONDIFFUSE LUMINAIRES
There is no reason the brightness of the luminaire cannot vary with both direction
and position. It can vary with position x' if the luminaire is a television. Itcan
vary with direction for car headlights and other directional sources. Nothing need
change from the previous sections, except that Lr(x') must change to £p(x'.u-').
The simplest way to vary the intensity with direction is to use a phong-like
pattern with respect to the normal vector n'. To keep the total light output
independent of the exponent, you can use the form:
L,:(x .a.') — — cos' n—l)0
where E(x')is the radiant exitance (power per unit area) at point x'. and n is
the phong-exponent. You get a diffuse light for n = 1.
15.4 DIRECT LIGHTING FROM MANY LUMINAIRES
Traditionally, when Nl luminaires are in a scene, the direct lighting integral is
broken into A*l separate integrals [11]. This implies at least NL samples must
be taken to approximate the direct lighting, or some bias must be introduced (as
done by Ward where smali value samples are not calculated [67]). This is what
you should probably do when you first implement your program. However, you
can later leave the direct lighting integral intact and design a probability density
function over all NL luminaires.
As an example, suppose we have two luminaires, li and l2, and we devise
two probability functions pi(x') and P2(x')- where pj(x')= O for x' not on lt
and Pi(x') is found by a method such as one of those described previously for
generating x on k. These functions can be combined into a single density over
both lights by applying a weighted average:
p(x') = api(x') + (1 - a)p2(x')
15.4. Direct Lighting from Many Luminaires
123
where a e (0,1). We can see that p is a probability density function because
its integral over the two luminaires is one, and it is strictlypositive at all points
on the luminaires. Densities that are "mixed" from other densities are often
called mixture densities' and the coefficients a and (1 — Q) are called the mixing
weights [59].
To estimate L = [L\ + £2). where L is the direct lighting and Li is the
lighting from luminaire li, we first choose a random canonical pair (fi. C2). and
use it to decide which luminaire will be sampled. If O < £1 < a, we estimate
L\ with ei using the methods described previously to choose x' and to evaluate
pi(x'), and we estimate L with ei/a. If £1 > a, then we estimate L with
e2/(l — q). In either case, once we decide which source to sample, we cannot use
(^1^2) directly because we have used some knowledge of £i- So, if we choose
l\ (so d < Q), then we choose a point on l\ using the random pair (£i/a- &>)• If
we sample U (so £j > a), then we use the pair ((£1 — q)/(1 -a),£i)- This way.
a collection of stratified samples will remain stratified in some sense. Note that
it is to our advantage to have ^j stratified in one dimension, as well as having
the pair (£i.sa) stratified in two dimensions, so that the /, we choose will be
stratified over many (fi.£>) pairs, so some multijittered sampling method may
be helpful (e.g., [8]).
This basie idea used to estimate L = (Li -t- L2) can be extended to Nl
luminaires by mixing Nr. densities:
p(x') = QiPi(x') + a2p_>(x') H 4- q'.Vlp.vl(x') 05.7)
where the a,'s sum to 1. and where each Q, is positive if /, contributes to the
direct lighting. The value of a, is the probability of selecting a point on the I,.
and p, is then used to determine which point on /, is chosen. If I, is chosen,
then we estimate L with ejai. Given a pair (si-s.')- we choose I, by enforcing
the conditions
i-i (
Y,qj <^< Y,aJ-
And to sample the light we can use the pair (£,[. Ca) where
«,
This basie process is shown in Figure 15.5. It cannot be overstressed that it is
important to "reuse" the random samples in this way to keep the variance low. in
the same way we used stratified sampling (jittering) instead of random sampling
in the space of the pixel. To choose the point on the luminaire U given (£i-52)>
we can use the same types of pi for luminaires as used in the last section. The
question remaining is what to use for on.
126
IS. Soft Shadows
•\2±u
a3.
tt4 I I
J L
$1=0
$,=0.45
Actual § | chosen means we E -055
pick luminaire 3.
Si=0
Si=0-33
I I
^1=0.75
I
41=1
5i=i.o
Figure 15.5. Diagram of mapping i to choose /, and me reMiUing remapping to new canonical
sample [.
15.4.1 Constant Weights
The simplest way to choose values for n, was proposed by Lange [29] (and this
method is also implied in the figure on page 148 ot" [23]). where all weights are
made equal: a, = l/.Y^for all /'. This would definitely make a valid estimator
because the n, sum to 1 and none ot" them is zero. Unfortunately, in many scenes
this estimate would produce a high variance (when the Li are very different as
occurs in most niaht "walkthroughs").
15.4.2 Linear Weights
Suppose we had perfect p; defined for all the luminaires. A zero variance
solution would then result if we could set t*,; rx Lt. where Lt is the contribution
from the ith luminaire. If we can make at approximately proportional to L,,
then we should have a fairly good estimator. We call this the linear method of
setting Qi because the time used to choose one sample is linearly proportional
to JV L, the number of luminaires.
To obtain such on we get an estimated contribution &£at x by approximating
the rendering equation for li with the geometry term set to one. These eis (from
15.4. Direct Lightingfrom Many Luminaires
127
all luminaires) can be directly converted to a, by scaling them so their sum is 1:
Qi _ ± . (15.8)
i +e2H + eN,.
This method of choosing on will be valid because all potentially visible
luminaires will end up with positive Qi. We should expect the highest variance in
areas where shadowing occurs, because this is where setting the geometry term
to 1 causes qj to be a poor estimate of Qi.
Implementing the linear a, method has several subtleties. If the entire
luminaire is below the tangent piane at x. then the estimate for e* should be zero. An
easy mistake to make is to set ex to zero if the center of the luminaire is below
the horizon. This will make a; take the one value that is not allowed: an
incorrect zero- Such a bug will become obvious in pictures of spheres illuminated
by luminaires that subtend large solid angles, but for many scenes such errors
are not noticeable (the figures in [51] had this bug. but it was not noticeable).
To overcome this problem, we make sure that for a polygonal luminaire. all of
its vertices are below the horizon before it is given a zero probability of being
sampled. For spherical luminaires. we checkthatthe center of the luminaire is a
distance greater than the sphere radius under the horizon piane before it is given
a zero probability of being sampled.
16 Path Tracing
This chapter describes path tracing where indirect lighting is computed using
Monte Carlo methods. The roots of path tracing are in Whitted's odgina3
paper [71] and were expanded on by Cook [11] and were finally fully generalized
by Kajiya [23[. Path tracing is elegant and general, but is not for the faint-of-
heart when it comes to CPU intensity!
16.1 SIMPLE PATH TRACING
To make our lite simple, let's assume for now that all surfaces are Lambertian,
which is an idealization of a matte/dull surface. Let's also assume that all
luniinaires (light-emitting objects) are diffuse emitters—they look the same color
from all directions (as opposed to a car headlight which is much brighter head-
on). The radiance of a reflective surface in this situation is given by the equation
pin r
L(p) = £,(p) + ^^ L[p. x) cos ft dx (16.1)
where £f(p)is the emitted radiance (zero unless the surface is a luminaire).
Rip) is the reflectance at point p.
When we start ray tracing, our rays will either hit background or a surface.
If a surface, we evaluate Equation 16.1 for p as the intersection point. When
evaluating this equation, L,..(p. A) and R(p. A) are materia3 properties which are
known inputs to our program. This leaves us with the integral. Provided we can
pick random directions x ~ p for some density p. we get the equation
L(p) asLe(p)+— -— .
IT P(.w)
This assumes only one sample. For good results we should average over many
cdi. Note that 9 is entirely determined by u. So, if we took uniform directions <j.
129
130 16. Path Tracing
Figure 16.1. A single ray in a path tracer just bounces around the environment. It does not branch.
It terminates when it misses all objects, or exceeds some maximum depth.
that would make/? = l/(2~-). But we can get better results if we use importance
sampling to cancel out the cosine term/? x cos ft When we normalize the density
function p so that its volume is 1. we see that p = (costf) 'it, and the integral
becomes
I(p) = L, (p) -t-/?lp)L(p.^)- (16.2)
Note that Equation 16.2 applies if and only //the density of the ^ is proportional
to the cosine of 0. This suggests the following function radiance to compute
L:
color radiance! ray r )
if r hits at p then
generate random ray r„
return Le(p}— /?(p)radiance(r„)
else
return background
This is a very easy function to write, but it may not terminate without some
maximum allowed depth. Note that a ray just keeps bouncing without branching
(Figure 16.1). This is why it is called part tracing: a whole path is generated
for each sample point on the screen.
The only missing detail is how one generates the random ray r„ with the
right density. Given an orthonormal basis uvw for the surface where w points
in the direction of the outward surface normal, we can think of the problem as
choosing points on the unit sphere or hemisphere (since each ray direction u>
can be expressed as a point on the sphere). If we assume the coordinate system
where 9 is the angle to the w axis, and 4> is the angle around the w axis (the u
axis is at <i> = 0), then, the canonical random numbers ( , ') can be mapped to
16.1. Simple Path Tracing
131
an appropriate point:
(0, cj>) = (arccosVl-C,2<').
ux
Uy
u*
Vx
VV
Vz
Wj
Wy
Wz
The scattered ray is with respect to some unit normal vector N (as opposed
to the z axis). We can first convert the angles to a unit vector a:
a = (cos 0 sin O, sin cj> sin 6, cos 0}
We can then transform a to be an a' with respect to ur by multiplying a by a
rotation matrix R (a' = Ra.). This rotation matrix is simple to write down:
R =
where u = {uT.uy,uz).v = (tv i'y, v~)>w = {wx,wy,wx)ionn a basis (an
orthonormal set of unit vectors where u=vxw, v=wxu, and w = u x v)
with the constraint that w is aligned with N:
N
|N|
To get u and v. we need to find a vector t that is not co!linear with w. To do
this, simply set t equal to w and change the smallest magnitude component 0f
t to one. The u and v follow easily:
t x w
t x w]
v = w x u.
As an efficiency improvement, you can avoid taking trigonometric functions 0t
inverse trigonometric functions (e.g., cos (arc cos (.r)) rather than the equivalent
but cheaper x). For example, the vector a for our rays is
a=(cos(27rOv/l7. sin(27r^)V?, \/l-^)
A good way to initially debug this program is to use an enclosure of any shape
with constant emitted radiance E and constant reflectance R. Your program
should compute L — E + RE + R2E + ■ ■ ■. The converged solution is
Try this with R = E = 0.5. Your program should have all pixels with value
1.0.
^ more complicated example is the touching spheres as in shown in
Figure 16.2. A "Cornell box" is shown in Figure 16.3.
132
16. Path Tracing
Figure 162. A simple path traced image with |(i) rays. per p]\ei.
Figure 163. A simple path traced image with 100 rays per pixel (left) and 1600 ravs per
(right).
16.2. Adding Shadow Rays
133
162 ADDING SHADOW RAYS
One problem with simple path tracing is that a ray has to get "lucky" and hit a
luminaire before it can add any light to an image. For scenes with smali lumi-
naires, this implies many rays. Instead, we can compute "direct lighting" using
shadow rays and use path tracing only for the indirect lighting (Figure 16.4).
The algorithm for this is as follows:
color retlectedRadiance( ray r )
if r hits at p then
Ld = direct light at p
generate random ray r„
return Z,di?(p)reflectedRadiance(r„)
else
return background
Here "direct light" uses the techniques of the last chapter. Note that this just
computes the reflected radiance, so it would not suy a luminaire is bright. For
the first viewing rays you would have to add in L, (x).
The difference between using shadow rays and not using them for a 100
sample image is shown in Figure 16.5. A more complex scene is shown in
Figure 16.6.
Figure 16A A single ray in a path tracer with shadow rays.
134
16. Path Tracing
Figure 16.5. A 100 sample rendering with simple path tracing (left) and shadow rays (right).
Figure 16A An image computed using a path tracer with shadow rays. The gloss on the tables
uses nondiffuse reflectance which is discussed in the next chapter.
16.3. Adding Specularity
135
16.3 ADDING SPECULARITY
It is not practical to compute direct lighting for specular surfaces, so instead we
call radiance (simple path tracing) for initial viewing and specularly reflected
rays, and reflectedRadiancefor diffusely scattered rays.
For other forms of reflectance, as discussed in the next chaptEr, you need to
evaluate more complex integrals.
17
General Light Reflection
If you want more realistic looking images, idea3 diffuse and specular materials
are usually not enough. This chapter discusses basics of genera3 light reflection
and presents one advanced model.
17.1 SCATTERING FUNCTIONS
Reflection from a surface can be described by how light incident on the
surface is scattered into a continuum of directions. This scattering function
can be described mathematically, and there are several strategies for deriving a
mathematical model for reflection.
To do any simulation using spread reflection, we need to develop a
mathematical convention to describe its properties. We could look at a concept similar
to diffuse reflectance. The simplest way to do this is to describe the ratio of
incident light power at a given angle to outgoing light power integrated over all
outgoing angles:
power incident from (O.o)
R\B.6) = - : .
total outgoing power
This quantity is often called directional hemispherical reflectance. But to
describe the directional behavior of spread reflectance, we need some function over
the outgoing directions {9'.0'). One way to do this is to imagine a hypothetical
photon-like light particle that is incident to the surface from direction {6,<t>).
This particle will be absorbed by the surface with probability 1 — R(9,<p). If
it is not absorbed, it will be scattered in some outgoing direction {9', (b')with
probability density function p(6. 4>.9'. <f>'). We callp(#, (p. 9'. 0') the scattering
probability density function, or SPDF for short. Note that there is no standard
term for the SPDF. Also note that the SPDF refers to a potentially different
137
138
17. General Light Reflection
probability density function for each (9,4>). Readers who prefer to think deter-
ministically can think of the product of R and p as an energy density function
without losing any information.
Given the directional hemispherical reflectance and the SPDF for a particular
type of material, we have completely specified its reflectance behavior. We
could change the definition in several ways without changing the completeness.
The most common way to do this is to multiply the directional hemispherical
reflectance, the SPDF, and reciprocal of cos 9' into a single product:
P{0,<t>,e'.o') = ^)p{6>0e'^
cos 01
There is no gain or loss of information in this transformation, but the form ofp is
convenient for many image synthesis and measurement applications as it relates
incoming irradiance to outgoing radiance, quantities that are often computed and
measured. The standard name for p is the bidirectional reflectance distribution
function, or BRDF for short. One fundamental property of a BRDF is that
lAO.o.B'.o') = plti'.o'.e.o).
This property is known as reciprocity: incident and outgoing directions can be
interchanged. Although almost all of the reflection literature is written in terms
of BRDF. it is often convenient to think in terms of the SPDF (or the outgoing
energy density function) when intuition can play a role.
The directional hemispherical reflectance can be written in terms of the
BRDF:
R(0.o) = I ['p(8. 0.8'.0')cos 6'sin O'dO'do'.
Jo Jo
This equation is equivalent to saying the SPDF must have unit volume, which
is required for any probability density function. For a physically valid materia3
model, it is necessary that R(d.cti) < 1; it must be energyconsenins>.
Many rendering algorithms rely on these properties, so it is important when
using these Tenderers that BRDF models both conserve energy and be
reciprocal. Lewis calls BRDF models that are faithful to these constraints physically
plausible [31], As an example we see that the Lambertian BRDF,
Pl(M,0 ??•) = —,
7T
is both reciprocal and energy conserving provided the reflectance Rd is less than
1- The division by n is necessary because the BRDF is integrated over the
cosine-weighted hemisphere.
17.2. An Advanced Model
139
Figure 17.1. Geometry of reflection. Note that ki, k2. and h share a plane, which usually does
not include n.
17.2 AN ADVANCED MODEL
A BRDF model that will produce scratched metals and polished surfaces is
presented here. For a derivation, see the paper by Ashikmin and Shirley [6].
We decompose the BRDF into a specular component and a diffuse
component. Accordingly, we write our BRDF as the classical sum of two parts:
plki.ki) =/9,(k1.k2)+pd(k1.k2) (17.1)
where the first term accounts for the specular reflection and is presented first.
17.2.1 Anisotropic Specular BRDF
Several shapes for the specular lobe have been proposed with Phong power-of-
cosine lobe being the most popular. This is primarily due to its simplicity. The
original form of the Phong shader [43] has several problems which triggered the
development of more physically plausible Phong-style BRDFs [27, 31. 37]. We
can also use an anisotropic Phong-style specular lobe and incorporate Fresnel
behavior while attempting to preserve the simplicity of the initial model and
physical plausibility achieved earlier for the Phong BRDF by other researchers.
This BRDF is
-^(cosa) (17.2)
/j(kl.k,) = v' " '" ' '— ——
8~ cos Q ma.x(cos ii\, cos d-2)
where nu and nv are control parameters. Again, we use Schlick's approximation
to Fresnel fraction [49]:
F(cosq) = Ra + (1 -Rs)(l- cos a)5 (17.3)
where R3 is the material's reflectance for the normal incidence.
140 17. General Light Reflection
Figure 17.2. Metallic spheres for various exponents
The specular BRDF described in this section is useful for representing
metallic surfaces where the diffuse component of reflection is verysmali. Figure 17.2
shows a set of spheres on a texture-mapped Lambertian piane. As the values of
parameters nu and n,, change, the appearance of the spheres shifts from rough
metal to almost perfect mirror, and from highly anisotropic to the more familiar
phong-like behavior.
17.2.2 Diffuse Term
It is possible to use a Lambertian BRDF together with the specular term.
However, a simple angle-dependent form of the diffuse component can account for
the fact that the amount of energy available for diffuse scattering varies due to
the dependence of the specular term's total reflectance on the incident angle. In
17.2. An Advanced Model
141
particular, diffuse color of a surface disappears near the grazing angle because
the total specular reflectance is close to 1 in this case. This well-known effect
cannot be reproduced with a Lambertian diffuse term and is therefore missed by
most reflection models. Another, perhaps more important, limitation of the
Lambertian diffuse term is that it must be set to zero to ensure energy conservation
in the presence of a Fresnel-weighted term.
The diffuse term that behaves this way is
Note that this diffuse BRDF does not depend on n,L and nv.
A set of polished spheres with different phong exponents nu, n„ is shown
= 10 11.= 100 n„= 1000 n„= 10000
Figure 17J. Diffuse spheres for various exponents.
142
17. General Light Reflection
Figure 17.4. Three views for n, = nv = 400 and a diffuse substrate.
in Figure 17.3. For all spheres. R, is set to 0.05 across the visible spectrum
which is a typical value for plastics. In addition to anisotropic highlights and
blurred reflections, we can observe strengthening of the specular reflection near
the silhouette of the sphere along with simultaneous decrease in the intensity of
the diffuse intensity. This effect is mere prominent in Figure 17.4 where three
different views of the same scene are shown.
17.3 IMPLEMENTING THE MODEL
Recall the BRDF is a combination of diffuse and specular components:
/9(ki.k2) =ps(k1.k,) + p,,(k,.k,). (17.4)
It is not necessary to call trigonometric functions to compute the exponent, so
the specular BRDF is
p(kL.k2)= V'K + D(^1) (n-h) »-^~
air (h« k)max((n- kL), (n k2))
(17.5)
In a Monte Carlo setting we are interested in the following problem: Given
kj, generate samples of ki with a distribution with a shape similar to the
cosine-weighted BRDF. The key observation is inspired by discussion by
Zimmerman [76] and by Lafortune and Willems [27] who point out that greatly
17.3. Implementing the Model
143
Figure 17.5. A close-up of the model implemented in a path tracer with 9. 26. and 100 samples.
undersampling a large value of the integrand is a serious error while greatly
oversampling a smali value is acceptable in practice. The reader can verify that
the densities suggested below have this property.
We can just use the probability density function.
Pi, (h) =
- 1)
1)
, co?" o-^-n, sm" o i
(17.6)
to generate a random h. However, to evaluate the rendering equation, we need
both a reflected vector k^ and a probability density function p^i). It is important
to note that if you generate h according to />/, (h) and then transform to the
resulting ki.
k. = -ki +2(kih)h.
(17.7)
the density of the resulting k-j is not pi,(k_>). This is because of the difference
in measures in h and k_> space:
= 4(k1h)</u,'/l.
So the actual density p(k2) is
P(k2)
P/,(h)
4(k!h)-
Note that it is possible to generate an h vector whose corresponding vector
k2 will point inside the surface, i.e.. (kin) < 0. The weight of such a sample
should be set to zero. This situation corresponds to the specular lobe going
below the horizon and is the main source of energy loss in the model. Clearly,
this problem becomes progressively less severe as nu, nv become larger.
The only thing left now is to describe how to generate h vectors with
probability density function of pj,.(h). We will start by generating h with its spherical
144
17. General Light Reflection
angles in the range (9, 0) e [0, f ]x [0, §]. Note that thisis onlythe firstquadrant
of the hemisphere. Given two random numbers ( 1, 2) uniformly distributed in
[0,1], we can choose
and then use this value of (j> to obtain 9 according to
COS 9 = (1 - 2) »««»:<♦+..„.i»<*-(-l. (17.9)
To sample the entire hemisphere, the standard manipulation where 1 is mapped
to one of four possible functions depending on whether it is in
[0.0.25), [0.25,0.5),
[0.5,0.75), or [0.75,1.0). For example, for & 6 [0.25,0.5), find 0(1 _ 4(0.5 -
1)) Vla Equation 17.8, and then "flip" it about the 4>= 7r/2axis. This ensures
full coverage and stratification. Three images sampled using this method are
shown in Figure 17.5. For the diffuse term, it would be possible to do an
importance sample with a density close to cosine-weighted BRDF in a way similar to
that described by Shirley et al. [53], but it works well to use a simpler approach
Figure 17.6. An image with a Lambertian sphere (left) and a sphere with "» -
17A- Including Indirect Light
145
an<^ venerate samples according to cosine distribution. This is sufficientlycjQse
to the complete diffuse BRDF to substantially reduce variance 0f ^ jyjon(e
An example of the model in a full scene inspired by Lafortune pg] js shown
in Figure 17.6. Note tne specular effects on the horizon 0f the ri8ht sphere which
implements the model of this paper, and the absence of these effects on the left
sphere which is Lambertian.
17.4 INCLUDING INDIRECT LIGHT
To generalize path tracins t0 include genera3 BRDF we need to solve the
rendering equation:
L(k1) = Le(ki)-/ p(k1.k2)L(k2)cos.32<Mk-2)- (17-10)
H» we have l^ out tne Polnt x we are fading for simpler notation. we
choose a random k, with density p(k>). we get
p(ki.k.»)L(k>)cos,J2
KkO^Uki)- ^j
T, , . , |ast chapter can be simply extended to account for
equation.
18
Spectral Color and Tone
Reproduction
To create more "physically accurate" images, you will need to implement
"spectral" color. Although it has all the same base operations as RGB colors, a
spectral color has values for every wavelength in the visible spectrum. An
additional complication is that a spectral color needs to eventually be displayed
or written to file, usually as an RGB color. This chapter deals with issues of
converting radiometric quantities to control vectors for real display devices such
as CRTs or printers.
18.1 SPECTRAL OPERATIONS
The key issue in designing a spectral class is deciding what representation to
use. A real spectrum, for visible light computation, is a mapping from the
visible spectrum j380nm. 800am] to nonnegative real values. This is an infinite
amount of data so we need to approximate such a mapping. Typically, we would
approximate a spectrum s(\) with a weighted sum of N basis functions b,(\):
N
S(x) = y>i&,-(A).
This allows us to store a spectrum using a vector of N weights n^. Being a
believer in the KISS principle, I suggest using nonoverlapping piecewise
constant basis functions that evenly partition the vis3ble spectrum into N "boxes."
Glassner has an excellent discussion of the mathematics behind such a system
in his two volume set [17],
147
148
18. Spectral Color and Tone Reproduction
18.2 LUMINANCE
The signal that reaches the eye varies with wavelength and can be described
by spectral radiance L(A) which represents the intensity of light coming froma
particular direction at a particular wavelength. The SI units of spectral radiance
are Wm~2sr_1 run-1.
All light is not created equal; humans are more sensitive to some wavelengths
than others, and are not sensitive at all to light outside the range [380nm, SOOnm].
Based on many experiments, psychologists came up with an empirical formu3a
to determine how much "useful" light for protraying light/dark was available in
a given spectral radiance signal. The formu3a for luminance is
/■800
Y = k / y(X)L{\)d\.
J380
where k = 683cd/W. an odd constant whose value ensures backward
compatibility with historical units that were based on the number of candles requiredto
produce equivalent light. The data for y(A)are given in Table 18,1.
18.3 CIE TRISTIMULOUS VALUES
Luminance only provides light/dark information. For color, we need two other
signals. The standard one is XZ which together with Y give us the CIE tris-
tiinulous values:
^ 800
X = k / x(\)L{\)d\.
J380
,800
Z = k / z{\)L(\)dX
J :iso
where k is the same constant as in the equation for Y.
For low levels of illumination, such as moonlight, your eyes go into a
different perceptual mode, and the spectral sensitvity changes. The values of XYZ
become irrelevant, and the scotopic luminance determines lights and darks:
/•800
V = k' I v'{\)L(\)d\,
J3S0
where k' = 1700#.
18.3. CIETristimulous Values
A (rm)
380
390
400
410
420
430
440
450
460
470
480
490
500
510
520
530
540
550
560
570
580
590
600
610
620
630
640
650
660
670
680
690
700
710
720
730
740
750
760
770
X
0.0014
0.0042
0.0143
0.0435
0.1344
0.2839
0.3483
0.3362
0.2908
0.1954
0.0956
0.0320
0.0049
0.0093
0.0633
0.1655
0.2904
0.4334
0.5945
0.7621
0.9163
1.0263
1.0622
1 .0026
0.8544
0.6424
0.4479
0.2835
0.1649
0.0874
0.0468
0.0227
0.0114
0.0058
0.0029
0.0014
0.0007
0.0003
0.0002
0.0001
y
0.0000
0.0001
0.0004
0.0012
0.0040
0.0116
0.0230
0.0380
0.0600
0.0910
0.1390
0.2080
0.3230
0.5030
0.7100
0.8620
0.9540
0.9950
0.9950
0.9520
0.8700
0.7570
0.6310
0.5030
0.3810
0.2650
0.1750
0.1070
0.0610
0.0320
0.0170
0.0082
0.0041
0.0021
0.0010
0.0005
0.0002
0.0001
0.0001
0.0000
z
0.0065
0.0201
0.0679
0.2074
0.6456
1.3856
1.7471
1.7721
1.6692
1.2876
0.8310
0.4652
0.2720
0.1582
0.0782
0.0422
0.0203
0.0087
0.0039
0.0021
0.0017
0.0011
0.0008
0.0003
0.0002
0.0000
0.0000
0.0000
0.0000
0.0000
0.0000
0.0000
0.0000
0.0000
0.0000
0.0000
0.0000
0.0000
0.0000
0.0000
v'
0.0006
0.0022
0.0093
0.0348
0.0966
0.1998
0.3281
0.4550
0.5670
0.6760
0.7930
0.9040
0.9820
0.9970
0.8350
0.8110
0.6500
0.4810
0.3288
0.2076
0.1212
0.0655
0.0332
0.0159
0.0074
0.0033
0.0015
0.0007
0.0003
0.0001
0.0001
0.0000
0.0000
0.0000
0.0000
0.0000
0.0000
0.0000
0.0000
0.0000
Table [g.j. Values for the trisimulous and scotopic sensitivity curves.
150
18. Spectral Color and Tone Reproduction
Often, we want to factor out luminance and concentrate on color. The
standard for this is to use chromaticity values:
y ,yi \X + Y + Z' X + Y + Zj'
There is a similar formu3a for z but it is rarely used because x + y + z = 1.
Instead of XYZ, people often pass around only xyY. This way we can talk
about "color" and "intensity" seperately. We can also compute XYZ from xyY:
(x.r.z) = fg,y,(i-'-»)n. (18,)
V y y J
We sometimes know the tristimulous values for the RGB channels of our
CRT. Let's say these are (Ar.Y'r, Zr) for the red channel, (A"9.Y'<,. Zg)for the
red channel, and {Xb.Yt. Zb) for the blue channel. If we assume a perfect black
point for the monitor (unlikely), then given a gamma-corrected RGB signal of
(?•,<?. 6). we can compute the screen tristimulous values (X.,. V'3.ZS):
rX,.+ gXg + bX,~ X A',; .\V| [r~
rY,.+gYg + bYh ' = ' Yr Y,, Yb g
rZy + gZg + bZ>, ' Z, Za Zh\ [b
You can invert the equation above to figure out how to set (r,g. b) givena desired
(A*. Y.Z). Note that you may get values much larger than 1.0. or smaller than
0.0, so you will need to do some manipulation to deal with that. However, there is
a bigger problem. Monitor manufacturers almost never tell you (A*,.. V,.. Zr) etc.
Instead they give the chromiticities of the phosphors (x,.,y,.). {x,r yt/). (.;-(,. (/;,).
and the chromiticity of the white point (.r„..;/„.). In addition, you can usually
measure the luminance Y„. of the brightest white screen with a consumer
photometer. If you can't measure that, assume it is approximately Y"„. = lOOcd/nr.
The reason manufacturers don't tell you Y^.is that your brightness now changes
it. The reason the white point varies is that "white" is usually the averagecolor
in the room. Thus, what looks white in a fluorescenl-litroom will have dominant
short wavelengths, and what looks white in an incandescent-lit room will have
dominant long wavelengths. So, if you move a monitor with a white-looking
image from a fluorescent-lighted room to a incandescent-lit room that same
display will look blue. This same issue causes photographers to buy "daylight" or
"tungsten" film.
To convert the information the manufacturers give us (tristimulous values),
we need to do some algebra. First, let's write a straightforward equality:
'*r *a Xi.~
Yr Ys Y„
111
Z^ £ Z^
[. r, y, Yb _,
A,
y.
z.
=
"Yr
1
=
Xw
Yw
18.4. Tone Mapping
151
Now we do some subsitutions so we have only (Yr,Yg,Yb)as unknowns:
1
V9
1
l-J»-»g
Vb
2l
Vb
1
1—ib—Vh
Vb
x,.,Y„,
yw
Y
We can use numerical methods, or algebraically Cramer's rule, to solve for
(Yr, Yg, Yi,): Once we have that, we can get (XrXg.Xi,), {Yr. Yg. Yb), [Zr,Zg. Z\,)
using Equation 18.1.
For a typical trinitron monitor we have:
(xr,yr) = (0.625,0.340)
{xg,yg) = (0.280.0.595)
(xb.yb) = (0.155.0.070)
(xu..yw) = (0.283.0.298)
lOOcd/nr
Using the earlier equations, this yields
1
1000
' 348.3
-107.2
6.35
152.1
196.6
20.00
55.9"
3.67
8.11
X"
y;
z.
where (A".,. Y',. Z.s) are the tristimulous values for the computed spectrum. An
emersina standard for RGB monitors and gammas is "sRGB". This standard is
worth investigating for long-term use. For details see www.srgb.com.
18.4 TONE MAPPING
A physically-based Tenderer can produce arbitrarily large RGB values to be
displayed on a monitor or printed page. People use tone mapping to scale
these quantities to a "reasonable" level that can be seen on the display. This is
analogous to what photographers do to make sure their pictures are viewable.
For example, a photo of a night scene is really much brighter than the night
scene is.
Tone mapping is a complex issue with hundreds of papers related to it, and
research continues today. The psychophysical approach of making displayed
synthetic images have certain correct objective characteristics was introduced
by Upstill [65]. The mapping of intensity has been dealt with by brightness
matching [60], contrast detection threshold mapping [13, 30, 65, 68], and a
combination of the two [39].
152
18. Spectral Color and Tone Reproduction
This section will provide just one simple way to tone map rendered images.
It implements the work of Ward [68].
s
W
X
y
X
y
Y
=
=
=
=
=
=
=
<
0
3/iogl0y+2\2' o/iogl0y+2^
\ 2.6 / I 2.6 J
l
X + Y+Z
X/W
Y/W
(1 - s)xw+ s(x +xw — 0.33)
(l-s)yw+s(y +yu, - 0.33)
0
.4468(1 - s)V + sY
if log10 Y < -2,
if -2 < log10 Y < 0.6
otherwise.
Here. V" is the scotopic luminance. After this process, the scotopic pixels will be
desaturated. the mesopic pixels will be partially desaturated. Also, the )' channel
will store scaled scotopic luminance for scotopic pixels, photopic luminance for
photopic channels, and a combination for mesopic pixels. The scaling factor
0.4468 is the ratio of Y to V for a uniform white field.
To scale the resulting luminance Y we now apply
Y =
Y_ i 1.219 + (V.,/2)0"1
v„. ^ i.2i9 + r0-1
where Y, is the log-average of luminances in the computed image. Finally, the
A"Z for the fina3 display is
X = *.
When the fina3 XYZ are converted to RGB, the RGB may be negative or above
one. They should be clamped to [0.1] if that is true.
19 Going Further
This book has described how to implement a basie ray tracer and the classic
probabilistic extensions. There are many places you can take it from^gj-g j
give the basie references below:
• More shapes. In addition to triangles and spheres, you can implement any
primitive with which you can intersect a 3D line. Examples include:
genera3 polygons |18|. superquadrics [261. constructive-solid geometry
Inland quadric surfaces [14|.
• Other rendering algorithms. These include radiosity [9. 56]. density
estimation [54]. photon maps [21. 22). and irradiance caching [69|.
• Displacement maps. These displace positions based on a procedural func-
ti0n. There is a variety of ways to treat displacement mapping, the most
practical being caching [42]. and all are somewhat awkward. However,
displacement maps make amazing images!
• Participating media. For tog and smoke to "partcipate" in light scattering,
there is a varietv of algorithms. 1 think the best one is also the easiest to
implement: photon maps |22].
• Natural illumination. Your images will look more realistic if you use
reasonable values for sunlight and skylight. These can be found jn a
variety of sources referenced in Preetham et al. [45].
• Better tone mapping. For images that have a high dymanie range, the
simple tone mapping presented earlier is insufficient. For such scenes,
a spatially-varying operator should be used [39. 61]. For scenes with a
dominant hue. chromatic adaptation should be accounted for [391. For
scenes with very bright objects, glare should be simulated [58].
Have fun, and if you render any neat images, please send me a pointer as I
always love seeing new rendered images!
153
Bibliography
[ 1 ] John Amanatides and Don P. Mitchell. Some regularization problems in ray
tracing. In Proceedings of Graphics Interface '90, pages 221-228. June
1990.
[2] John Amanatides and Andrew Woo. A fast voxel traversal algorithm for
ray tracing. In Eurographics '87, 1987.
[31 Anthony A. Apodaca and Larry Gritz. AdvancedRenderman Creating CCI
for Motion Pictures. Morgan Kaufmann. 2000.
[4] James Arvo and David Kirk. A survey of ray tracing acceleration
techniques. In Andrew S. Glassner. editor. An Introduction to Ray Tracing.
Academic Press. San Diego. CA. 1989.
[5] Ian Ashdown. Radiosm: A Programmer's Perspective. John Wiley &
Sons. New York. 1994. includes C++ source code for fully functional
radiosity Tenderer.
[6] Michael A.shikmin and Peter Shirley. An anisotropic phong reflection
model. To appear.
[7] Frank Canters and Hugo Decleir. The World in Perspective. Bath Press,
Avon. Great Britain. 1989.
[8] Kenneth Chiu. Peter Shirley, and Changyaw Wang. Multi-jittered sampling.
In Paul Heckbert. editor, Graphics Gems TV, pages 370-374. Academic
Press, Boston, 1994.
[9] Michael F. Cohen and John R. Wallace. Radiosity and Realistic [mage
Synthesis. Academic Press, Boston, MA, 1993.
[10] Robert L. Cook. Stochastic sampling in computer graphics. ACM
Transactions on Graphics, 5(l):51-72, January 1986.
155
156
Bibliography
[11] Robert L. Cook, Thomas Porter, and Loren Carpenter. Distributed ray
tracing. Computer Graphics, 18(4): 165-174, July 1984. ACM Siggraph
'84 Conference Proceedings.
[12] David Ebert, Kent Musgrave, Darwin Peachy, Ken Perlin, and Steve Wor-
ley. Texturing and Modeling: A Procedural Approach. Academic Press,
Burlington, MA, 1994.
[13] James A. Ferwerda, Sumant N. Pattanaik, Peter Shirley, and Donald P.
Greenberg. An adaptation model for realistic image sysnthesis. In
Computer Graphics, Computer Graphics Proceedings, Annual Conference
Series, August 1996. ACM Siggraph '96 Conference Proceedings.
[14] Andrew S. Glassner, editor. An Introduction to Ray Tracing. Academic
Press. San Diego. CA, 1989.
[15] Andrew S. Glas'sner. A model for fluorescence and phospherescence. in
Proceedings of the Fifth Eurographics Workshop on Rendering, pages 57-
68. June 1994.
[16] Andrew S. Glassner. Principles of Digital Image Synthesis. Morgan-
Kaufman. San Francisco. 1995.
[17] Andrew S. Glassner. Principles of Digital Image Synthesis. Morgan-
Kaufman, San Francisco. 1995.
[18] Eric Haines. Point in polygon strategies. Graphics Gems IV, pages 24-46.
1994.
[ 19] John H. Halton. A retrospective and prospective of the Monte Carlo method.
SIAMReview. 12(1): 1-63. January 1970.
[20] J. M. Hammersley and D. C. Handscomb. Monte Carlo Methods. Wiley.
New York, N.Y..'l964.
[21] Henrik Wann Jensen and Niels Jorgen Christensen. Bidirectional Monte
Carlo ray tracing of complex objects using photon maps. Computers &
Graphics, 19(2), 1995.
[22] Henrik Wann Jensen and Per H. Christensen. Efficient simulation of 'ignt
transport in scenes with participating media using photon maps.
Proceedings of SIGGRAPH 98, pages 311-320, July 1998.
[23] James T. Kajiya. The rendering equation. Computer Graphics, 20(4): 143-
150, August 1986. ACM Siggraph '86 Conference Proceedings.
Bibliography
157
[24]
Craig Ko^> Pat Hanrahan, and Don Mitchell. A realistic camera model for
computer graphics. In Rob Cook, editor, Proceedings of SIGGRAPH
(Anaheim California, August 6-11, 1995), Computer Graphics
Proceedings, Annual Conference Series, pages 317-324, August 1995.
[25] G. P. jQjnnen. Polarized light in nature. Cambridge University Press,
Cambridge, 1985.
[26] Roman Kuchkuda. An introduction to ray tracing. In R. A. Earnsnaw-
editor, Theoretical Foundations of Computer Graphics and CAD, pages
1039-1060. Springer-Verlag, 1988.
[27] Eric P. LafbrtUne and Yves D- willems- UsinS the modified Phong BRDF
for pr,ysicaiiy based rendering. Technical Report CW197, Computer
Science Department, K.U.Leuven, November 1994
[28] Eric P. F. Lafortune, Sing-Choong Foo. Kenneth R Torrance. and Don_
aid P. Greenberg. Non-linear approximation of reflectance functions. In
SIGGRAPH 97 Conference Proceedings, pages 117-126. August 1997.
[29] Brigitta Lange. The simulation of radiant light transfer with stochastic
r-iv-tracin" ^n Proceedings of the Second Eurographics Workshop on
Rendering (Barcelona. May 1991). 1991.
[30] Gregory Ward Larson. Holly Rushmeier. and Christine Pi'tko. A visibility
matching tone reproduction operator for high dynamie range scenes. IEEE
Transactions on Visualization and Computer Graphics, 3(4):291-306.
tober - December 1997. ISSN 1077-2626.
■ •,■] Robert Lewis. Making shaders more physically plausible. In Micnae R
Cohen. Claude pUech. and Francois Sillion. editors. Fourth Eurographics
Workshop on Rendering, pages 47-62. Eurographics. June 1993. in
Paris. France, 14-16 June 1993.
[32] Don P. Mitchell. Spectrally optimal sampling for distributed ray tracing. In
Thomas W. Sederberg, editor. Computer Graphics (SIGGRAPH
Proceedings), volume 25, pages 157-164, July '991.
[33] Don P. Mitchell. Ray tracing and irregularities of distribution. In Pr"~
reedines °ft^le Third Eurographics Workshop on Rendering, pages ~ '
1992.
[34] Don P. Mitchell and Arun N. Netravali. Reconstruction Filters in com_
puter graphics. Computer Graphics, 22(4):221-228, August 1988. ACM
Siggraph '88 Conference Proceedings.
158
Bibliography
[35] Tomas Moller and Eric Haines. Real-Time Rendering A K Peters, Natick,
MA, 1999.
[36] Tomas Moller and Ben Tmmbore. Fast, minimum storage ray-triangle
intersection. Journal of Graphics Tools, 2(l):21-28, 1997.
[37]
Laszlo Neumann, Attila Neumann, and Laszld Szirmay-Kalos. Compact
metallic
reflectance models. Computer Graphics Forum, 18(13X 1999.
[38] S. N. Pattanaik. Computational Methodsfor Global Illumination an(^
Visualisation 0f Complex 3D Environments. PhD thesis, Birla Institute of
Technology & Science, Computer Science Department, Pilani, India,
February 1993.
[39] Sumanra N. Pattanaik, James A. Ferwerda, Mark D. Fairchild. and Don"
^ P. Greenberg. A multiscale model of adaptation and spatial vision for
realistic inla?e display. Proceedings of S1GGRAPH 98. pages 287-298.
[40] Ken Perlin. An image synthesizer. Computer Graphics, 19(3)-">87-">96
July 1985. ACM Siggraph "85 Conference Proceedings.
[41] Ken Per''n and Eric M. Hoffert. Hypertexture. Computer Graphics,
23(3):253-262. July 1989. ACM Siggraph "89 Conference Proceedings.
[42] Matt Pllarr and Pat Hanrahan. Geometry caching for ray-tracing
displacement maps. Eurographics Rendering Workshop 1996, pages -^ i_j.o June
1996. ' " •
[43] Bui-Tuong Phong. Illumination for computer generated ima„es Commit
nications of' the ACM, 18(6):311-317, June 1975. c"
[44] Charles A. Poynton. A Technical Introduction to Digital Video. wj,„v
New York. 1996. ey'
[45] A. J. Preetham, peter Shirley, and Brian E. Smits. A practjcai analytic
model for daylight. Proceedings of SIGGRAPH 99, pages 91-100, August
1999.
[46] Werner Purgathofer. a statistical method for adaptive stochastic sampling.
Computers and Graphics, 11(2): 157-162, feb 1987.
[47] S. D. Roth. Ray casting for modeling solids. Computer Graphics and
Image Processing, 18(2): 109-144, February 1982.
Bibliography
159
[48] Christophe Schlick. A customizable reflectance model for everyday
rendering. In Proceedings of the Fourth Eurographics Workshop on Rendering,
pages 73-84, June 1993.
[49] Christophe Schlick. An inexpensive BRDF model for physically-based
rendering. Computer Graphics Forum, 13(3):233—246, 1994.
[50] P. Shirley. Discrepancy as a quality measure for sample distributions.
In Werner Purgathofer, editor, Eurographics '91, pages 183-194. North-
Holland, September 1991.
[51 ] Peter Shirley. A ray tracing method for illumination calculation in diffuse-
specular scenes. In Proceedings of Graphics Interface '90. pages 205-212,
May 1990.
[52] Peter Shirley and Kenneth Chiu. . a low distortion map between disk and
square. Journal of Graphics Tools. 2(3):45-52. 1997.
[53] Peter Shirley. Helen Hu. Brian Smits. and Eric Lafortune. A practitioners'
assessment of light reflection models. In Pacific Graphics, pages 40-49.
October 1997.
[54] Peter Shirley. Bretton Wade. David Zareski. Philip Hubbard. Bruce Walter,
and Donald P. Greenberg. Global illumination via density estimation. In
Proceedings of iheSixth Eurographics Workshop on Rendering, pages 187—
199. June 1995.
[55] Y. A. Shreider. The Monte Carlo Method. Pergamon Press. New York.
N.Y. 1966.
[56] Francois X. Sillion and Claude Puech. Radiosity & Global Illumination.
Morgan-Kaufmann. San Francisco. 1994.
[57] Brian Smits. Efficiency issues for ray tracing. Journal of Graphics Tools.
3(2):1-14. 1998.
[58] Greg Spencer, Peter Shirley, Kurt Zimmerman, and Donald P. Greenberg.
Stratified sampling of spherical triangles. In Computer Graphics. Computer
Graphics Proceedings, Annual Conference Series, pages 325-334, August
1995. ACM Siggraph "95 Conference Proceedings.
[59] D. M. Titterington, A. F. M. Smith, and U. E. Makov. The Statistical
Analysis of Finite Mixture Distributions. John Wiley & Sons, New York,
NY, 1985.
160 Bibliography
[60] Jack Tumblin and Holly E. Rushmeier. Tone reproduction for realistic
images. IEEE Computer Graphics and Applications, 13(6):42-48, November
1993. also appeared as Tech. Report GIT-GVU-91-13, Graphics,
Visualization & Usability Center, Coll. of Computing, Georgia Institute of Tech.
[61] Jack Tumblin and Greg Turk. Lcis: A boundary hierarchy for detail-
preserving contrast reduction. Proceedings ofSIGCRAPW9, pages 83-90,
August 1999.
[62] Greg Turk. Generating random points in triangles. In Andrew Glassner,
editor, Graphics Gems. Academic Press, New York, NY, 1990.
[63] Robert Ulichney. Digital Halftoning. MIT Press, Boston. 1988.
[64] Steve Upstill. The Renderman Companion. Addison-Wesley, Reading. MA,
1990.
[65] Steven Upstill. The Realistic Presentation of Synthetic Images: Image
Processing in Computer Graphics. PhD thesis. Berkeley. 1985.
[66] Changyaw Wang. Physically correct direct lighting for distribution ray
tracing. In David Kirk, editor, Graphics Gems 3. Academic Press. New
York, NY, 1992.
[67] Greg Ward. Adaptive shadow testing for ray tracing. In Proceedings of
the Second Eurographics Workshop on Rendering (Barcelona. May 1991).
1991.
[68] Greg Ward. A contrast-based scalcfactor for luminance display. In Paul
Heckbert, editor, Graphics Gems IV, pages 415—421. Academic Press,
Boston. 1994.
[69] Gregory J. Ward. Francis M. Rubinstein, and Robert D. Clear. A ray tracing
solution for diffuse interreflection. In John Dill, editor, Computer Graphics
(SIGGRAPH '88 Proceedings), volume 22, pages 85-92, August 1988.
[70] Alan Watt and Mark Watt. Advanced Animation and Rendering Techniques:
Theory and Practice. Addison-Wesley Publishing Company, 1992.
[71] T. Whitted. An improved illumination model for shaded display. CACM,
23(6):343-349, June 1980.
[72] Mason Woo, editor. OpenGL Programming Guide. Addison-Wesley,
Reading, MA, 3rd edition, 1999.
Bibliography
[73] H. Wozniakowski. Average case complexity of multivariate integration.
Bulletin (New Series) of the American Mathematical Society, 24(1): 185-
193, January 1991.
[74] Sidney J. Yakowitz. Computational Probability and Simulation. Addison-
Wesley, New York, N.Y., 1977.
[75] S. K. Zaremba. The mathematical basis of Monte Carlo and quasi-Monte
Carlo methods. SIAMReview, 10(3):303-314, July 1968.
[76] Kurt Zimmerman. Density Prediction forlmportance Sampling in Realistic
Image Synthesis. PhD thesis, Indiana University, June 1998.
Index
aliasing, 105
anisotropic reflection, 139
aperture. 113, 115
attenuation constant. 46
barycentric coordinates. 24-26.65,
98
Beer's Law. 46. 47
bidirectional reflectance distribution
function (BRDF). 138
box filter. 108
bump map. 57
camera.
35mm. 115
orthographic. 29
pinhole. 37, 113
thin-lens. 113
canonical basis, 7
canonical random number, 84, 95,
107
chromaticity, 150
CIEphotopic sensitivity function, 148
color operations, 3
color,
RGB, 3, 147, 150-152
spectral, 147
coordinate systems, 14—16
coordinates.
local. 69
world, 69
Cramer's rule. 27
cross product. 5
cumulative probability distribution
function. 96
depth-of-field. 113
dielectrics. 44. 46, 47
diminishing return, 87
direct lighting. 133
directional hemispherical reflectance,
137
discrepancy, 88
displacement mapping. 153
dot product. 5
energy conservation. 138
expected value. 83, 85
f-number. 113. 115
filtering, 91, 108
focal length, 113
form factor, 90
frame of reference, 9
Fresnel reflectance, 44, 47, 139, 141
163
164
Index
gamma, 107, 150
gamma correction, 4
gaze direction, 40
grid spatial subdivision structure, 71
grid traversal, 72, 74, 76
grid, initialization, 76
importance sampling, 87, 88, 112, 143
indirect light, 133, 145
instancing. 67
interpolation,
bilinear, 62
hermite, 62
ray-box, 23. 24
ray-ellipsoid. 67
ray-grid. 71
ray-implicit, 19
ray-list, 28
ray-object. 18
ray-parametric, 20
ray-plane. 19
ray-sphere, 21
ray-triangle. 24. 26
interval. 7
Jucobiun matrix. 104
jaggies. 105
jittering. 87. 95
Law of Large Numbers, 86
line.
implicit, 17
parametric, 7. 17
vector form, 17
luminaires. 119, 129
luminance. 148, 152
scotopic, 148, 152
matrix,
composite, 13
inverse, 13
rotation, 12
scale, 11
transformation, 9
translation, 11
mesh, 63
monitor,
gamma, 4, 107
phosphors, 150
trinitron, 151
tristimulous values, 150
white point, 150
Monte Carlo integration, 81-83.87, 88
motion-blur, 117
normal vector, transformation. 10
orthonormal bases. 7-9. 12
construction. 8
participating media. 153
path tracing. 129. 130. 145
piane.
implicit, 19
parametric. 24
points. 5
transformation. 9. 11
Poisson disk sampling. 93. 95
probability, 83
probability density function. 83
quadratic equation. 22
quasi-Monte Carlo integration. 88. 92
radiosity. 153
random points,
cosine density, 131
disk, 90, 97, 100
Phong density, 98
tnangle, 98
random sampling, 93
random variable, 83
Index
165
ray, vii, 7, 18
shadow, 32, 133
viewing, 31, 40
ray tracing, vii
reciprocity for BRDFs, 138
reflection,
shadow, 32, 133
genera3, 137
Lambertian, 31. 32, 91, 119,
129, 138, 141
metal, 43
Phong, 139
physically plausible, 138
poiished. 47, 141
specular, 43. 44. 135. 140
refraction. 44
refractive index. 45
regular sampling. 93
rendering equation. 145
right-hand rule. 6
sampling. 110
scattering probability density
function (SPDF). 137
Schlick's approximation. 44. 139
shadows. 32
soft. 119
Snell's Law. 45
solid noise. 54
spatial subdivision. 71
grid. 71
sphere.
implicit form. 21
normal vector. 22
parametric. 60
vector form, 21
standard deviation, 86
stratified sampling, 87, 88
surface,
implicit, 18
parametric, 20
texture coordinates, 59, 61, 65
texture mapping, 4, 59-62
texture,
marble, 56
procedural, 53
solid, 53
tiled, 59
thin-lens law, 113
tone mapping, 151. 153
transparency. 44, 46, 62
triangular irregular networks (TINs),
63
triangular meshes. 63
tristimulous values. 148
turbulence function. 56
variance. 83. 86-88
vector noise. 58
vector operations. 5
vector turbulence, 58
vectors. 4. 7
length. 5
normal. 20. 21. 34, 69
reflection. 44
refraction. 45
transformation. 10. II
unit. 5
view-plane normal, 40
view-up vector, 40
viewing. 37, 39, 41, 42
weighted average, 91