/


Text
UC-2 and UC-11
Reporting Date: June 1976
Issued: October 1976
CIC-14 REPORT COLLECTION
REPRODUCTION
COPY
UNITED STATES HIGH-ALTITUDE
TEST EXPERIENCES
A Review Emphasizing the Impact
on the Environment
A LASL MONOGRAPH
Z -CD
§^=O>
S==SCN
j CM
g о
i=°
д CO
j—= CO
g CD
. Herman Hoerlin
* of the University of California
IOS ALAMOS, NEW MEXICO 87545
by
CIC-14 REPORT COLLECTION
REPRODUCTION
COPY
An Affirmative Actian/Equal Opportunity Employer
UNITED STATES
ENERGY RESEARCH AND DEVELOPMENT ADMINISTRATION
CONTRACT W-740S-ENG. 36
Work performed under Contract No. At(26-l)-648 with the US Energy
Research and Development Administration, Nevada Operations Office,
Las Vegas, Nevada, 89114.
Printed in the United States of America. Available from
National Technical Information Service
U.S. Department of Commerce
5285 Port Royal Road
Springfield, VA 22161
Price: Printed Copy $4.50 Microfiche $2.25
This report was prepared as an account of work aponsorcd
by the United Slates Government. Neither the United State*
nor the United State* Energy Research and Development Ad-
ministration, nor ant of their employers, nor any of their con-
tractors. subcontractors. or their employee*, make* any
warranty. express or implied, or assumes any legal liability or
responsibility for the aceuract. completeness, or usefulness of
any Information, apparatus, product, or process disclosed, or
represents that its use would not Infringe prlvatelv owned
right».
UC-2 and UC-11
Reporting Date: June 1976
Issued: October 1976
LA-6405
UNITED STATES HIGH-ALTITUDE
TEST EXPERIENCES
A Review Emphasizing the Impact
on the Environment
A LASL MONOGRAPH
by
Herman Hoerlin
scientific laboratory
of the University of California
LOS ALAMOS, NEW MEXICO 87545
An Affirmative Action/Equal Opportunity Employer
UNITED STATES
ENERGY RESEARCH ANO DEVELOPMENT ADMINISTRATION
CONTRACT W-7405-ENG. 36
CONTENTS
Abstract............................................................................ 1
I. Listing of Events. General Description of Phenomenology.........................3
П. Prompt Thermal Radiation........................................................9
Ш. Flash Blindness and Eyeburn. Eyeburn Case Histories.
Eyeburn Hazard and Operational Problems.........................................11
IV. Effects on Radio Communications................................................17
V. The Formation of Artificial Radiation Belts. Effects on Satellites.............23
VI. Synchrotron Radiation and Hydromagnetic Waves..................................29
VII. Electromagnetic Radiation Effects on Electrical and Electronic
Systems (Contribution by John Malik).................................................31
VIII. Auroral Phenomena. Detection of Nuclear Explosions in Space.
Hypothetical Effects on Weather Patterns of Energy Deposition
in the Upper Atmosphere..............................................................33
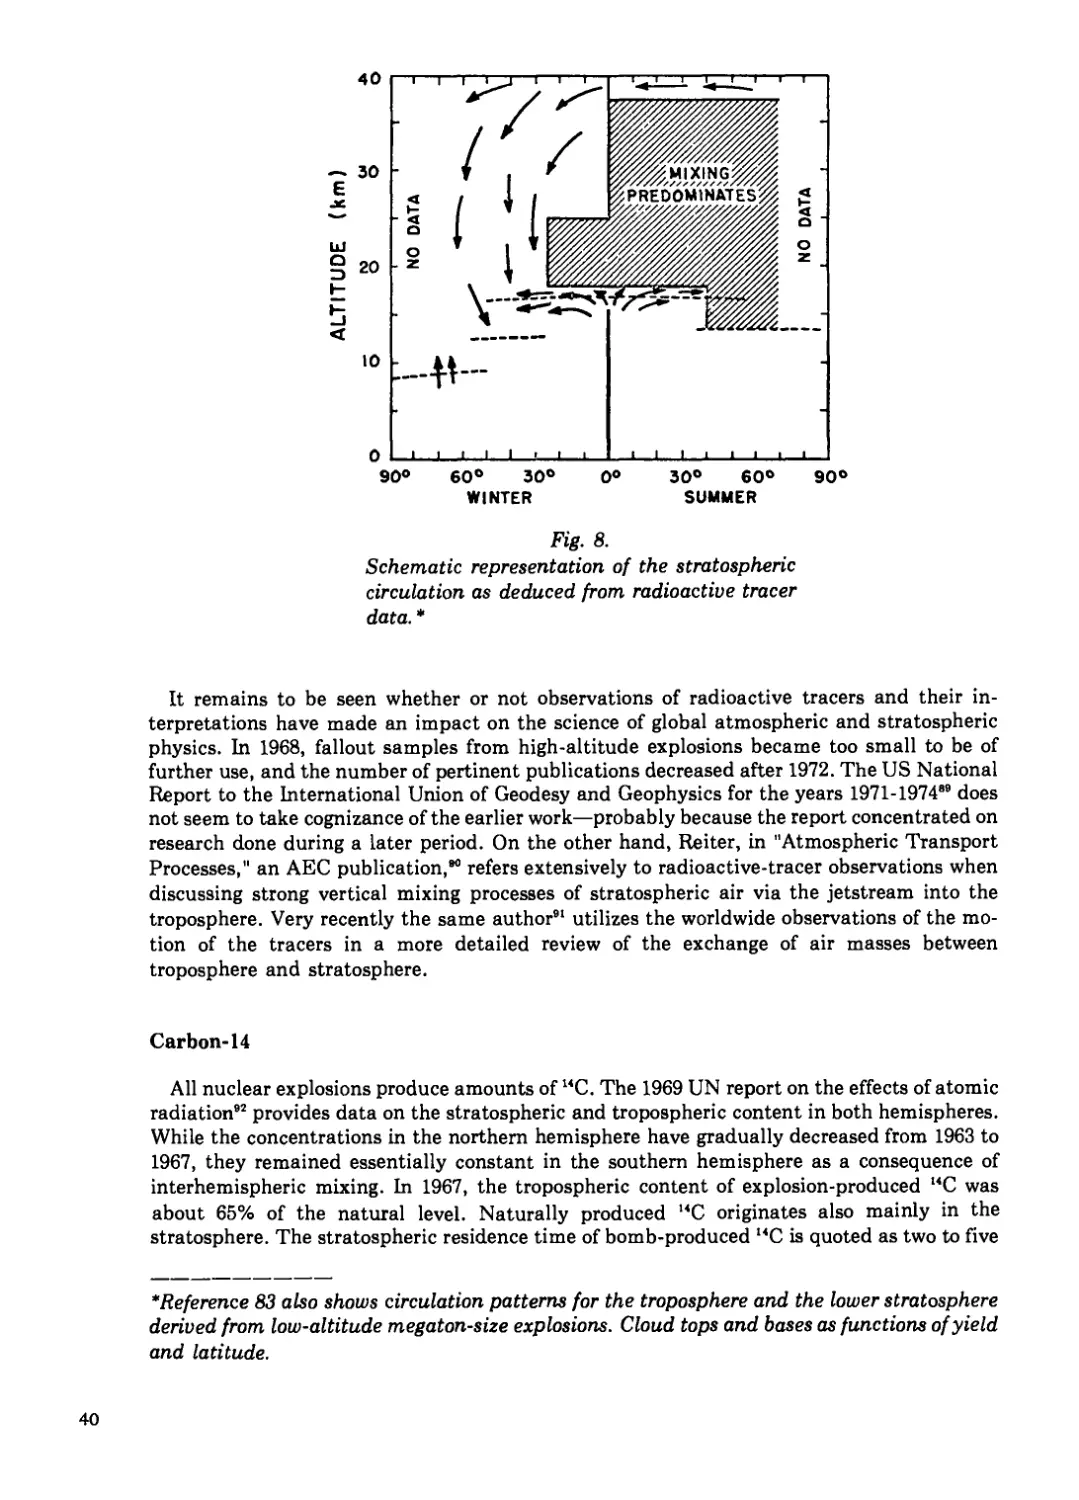
IX. Residence Time of Radioactive Tracers in the Stratosphere.
Upper Atmospheric Air Circulation Patterns...........................................37
X. Hole in the Ozone Layer After Teak and Orange? ................................43
XI. Concern About Environmental Effects of Starfish-type
Explosions: British and US-NASA Reactions in 1962.
Scientific Values in Retrospect ...............................................45
Acknowledgments ....................................................................48
References .........................................................................49
V
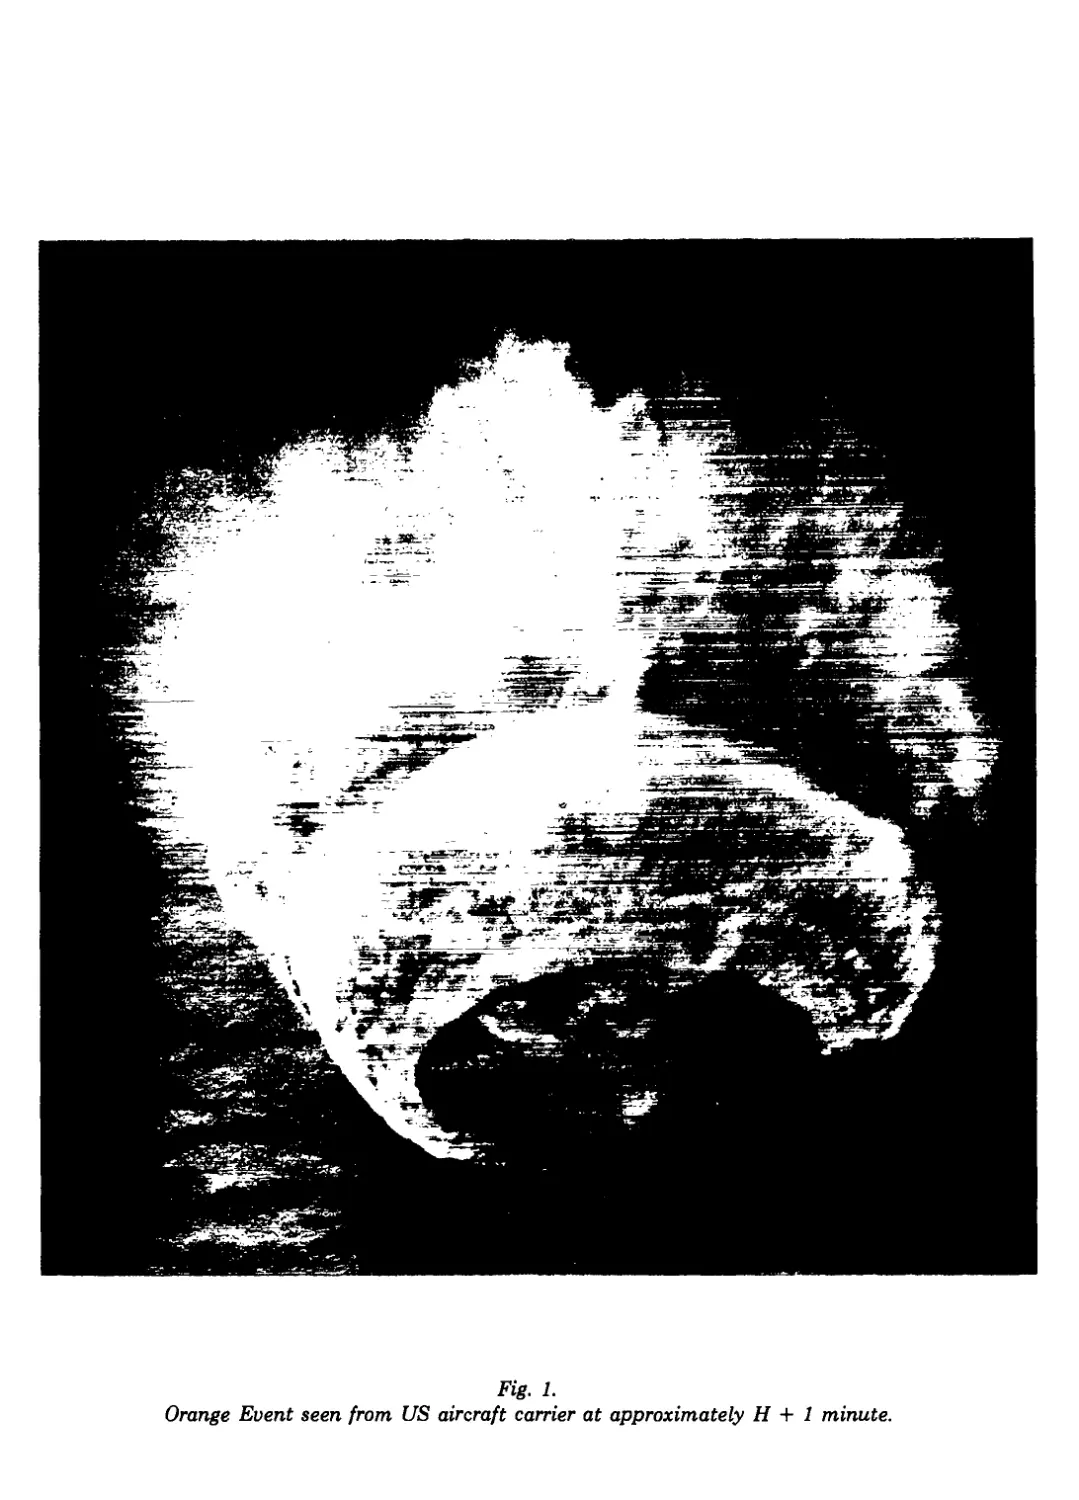
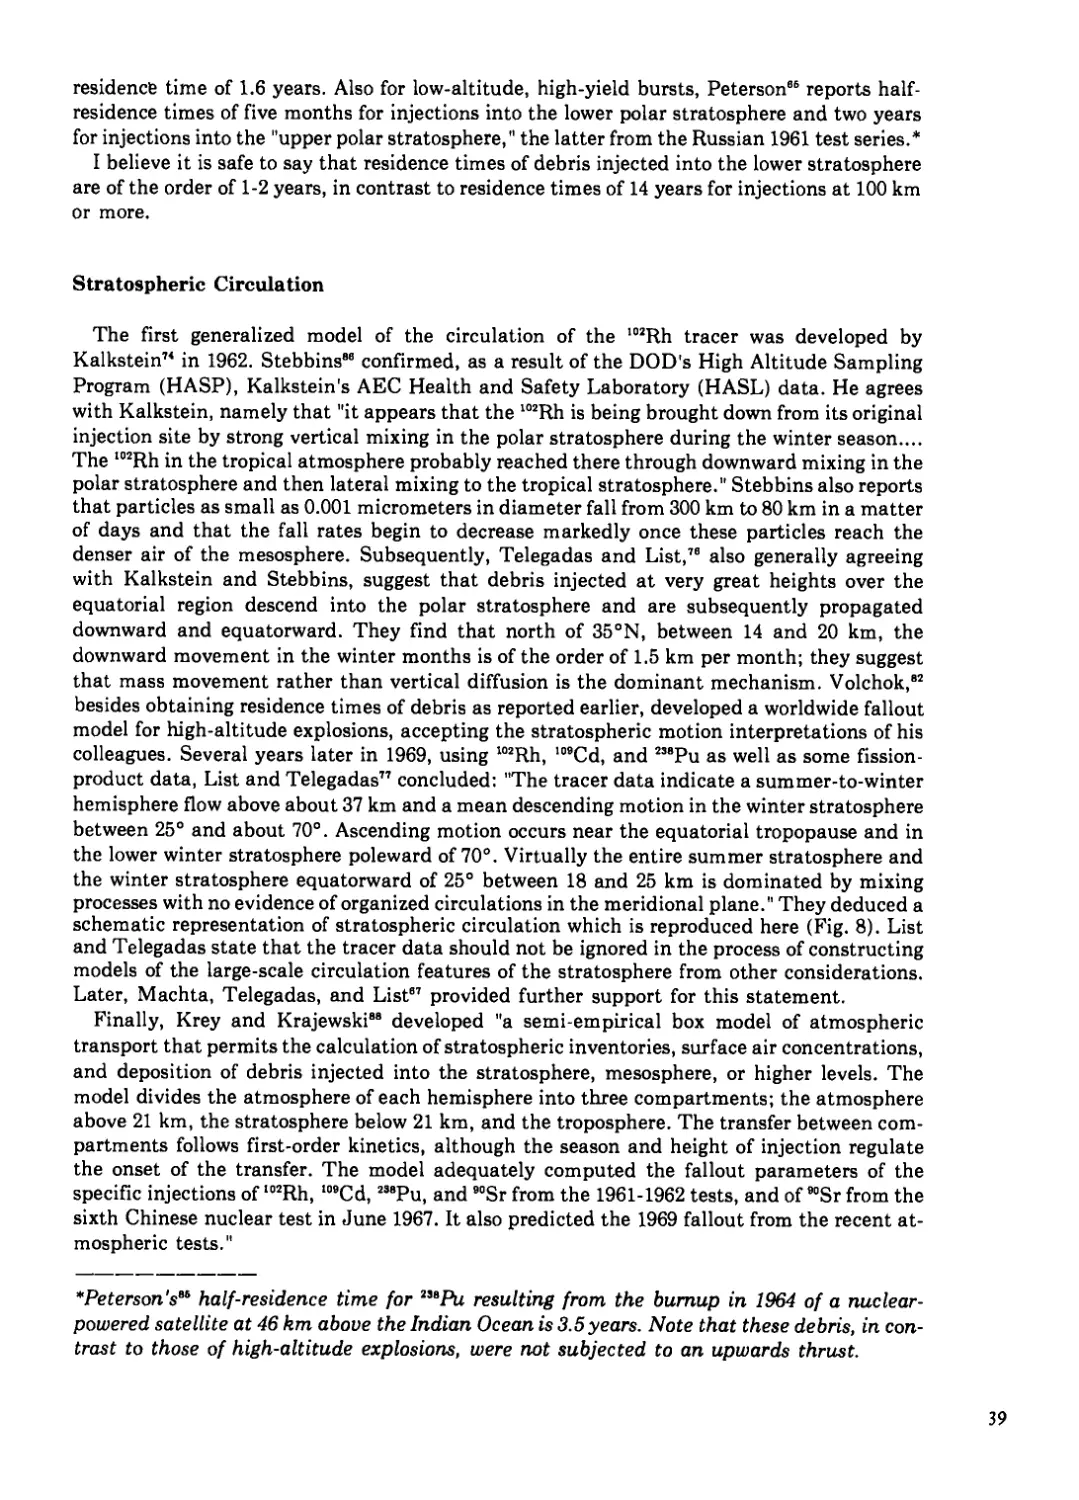
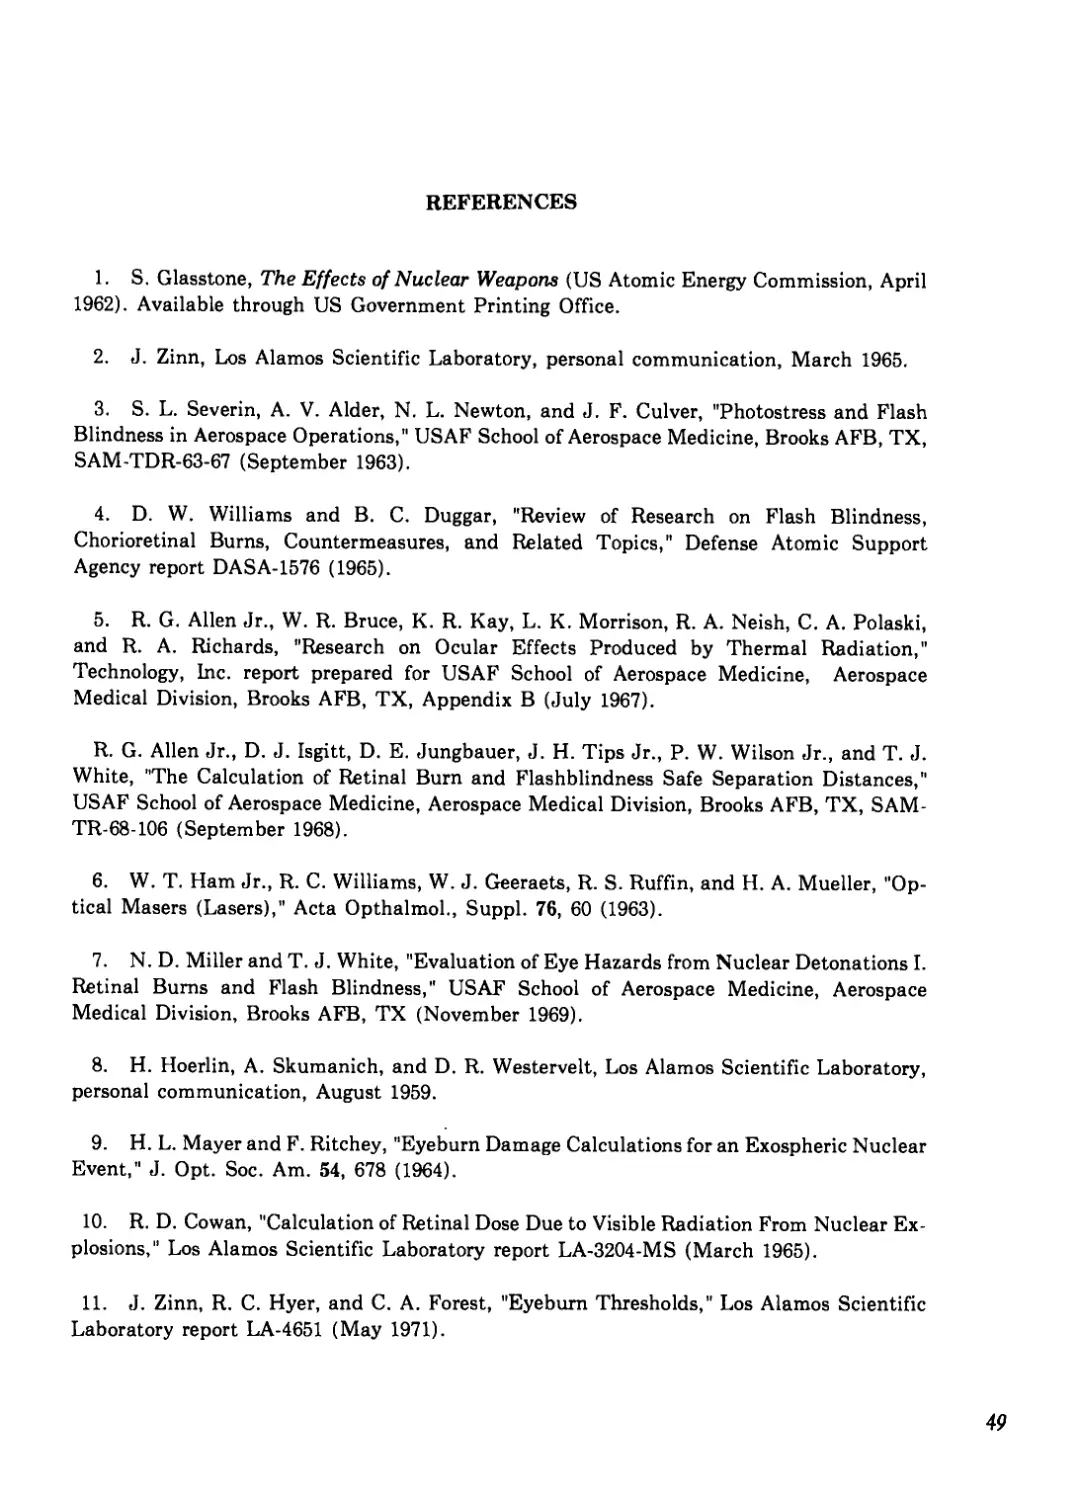
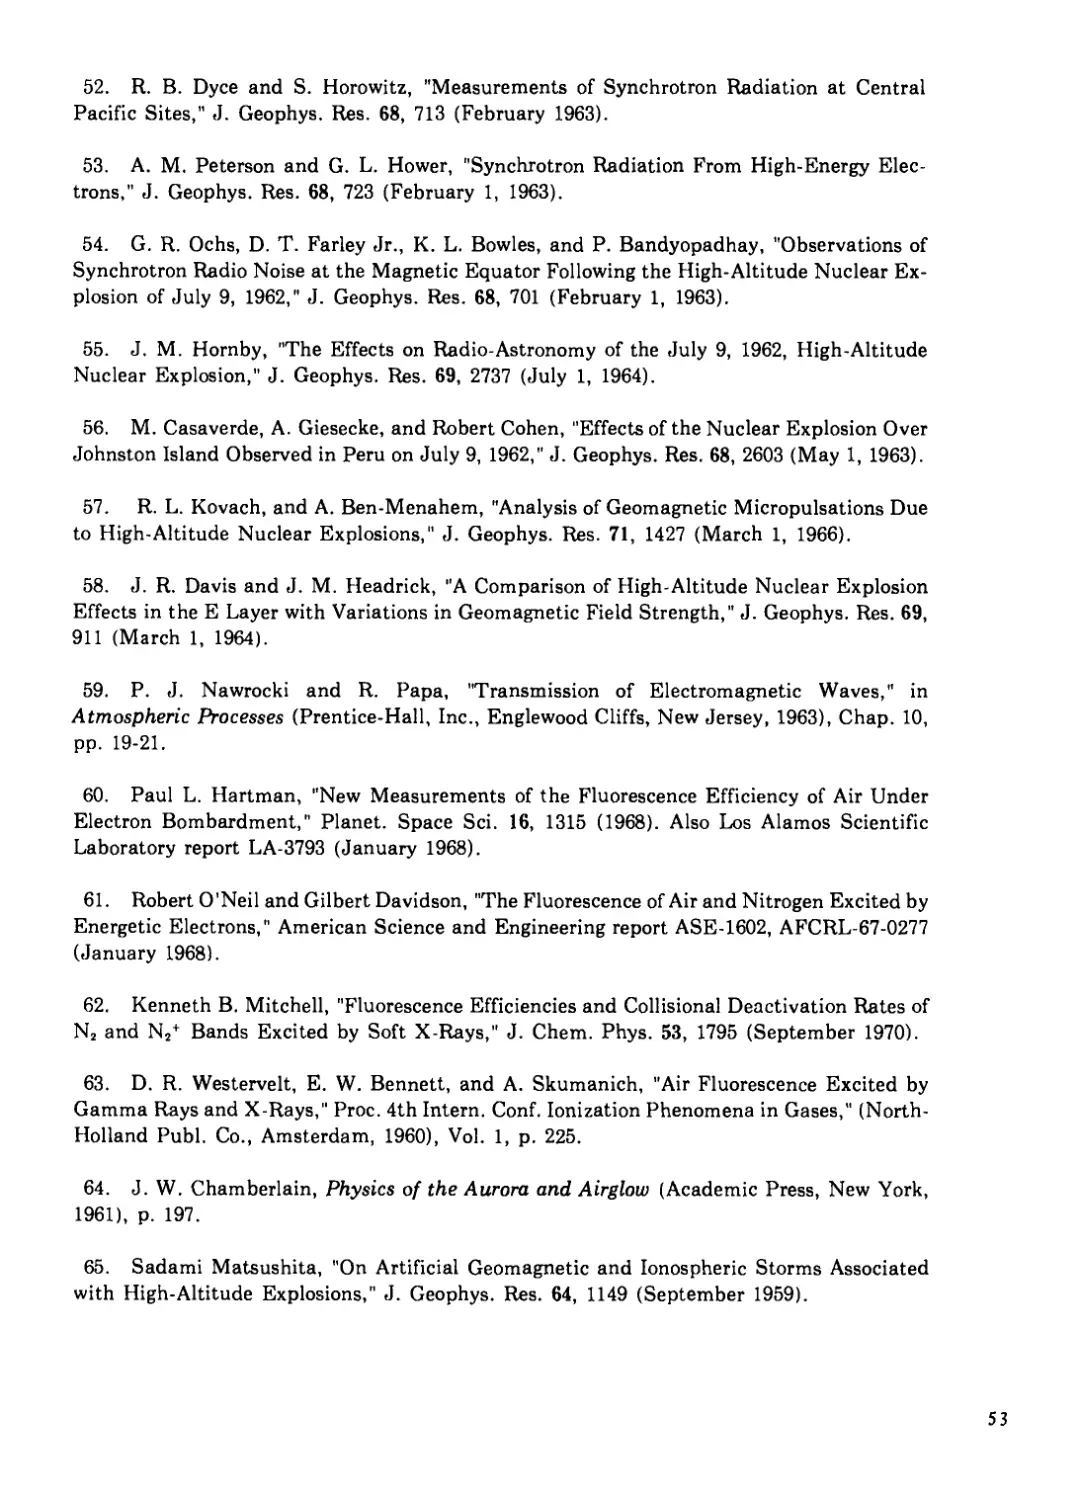
Fig. 1.
Orange Event seen from US aircraft carrier at approximately H + 1 minute.
UNITED STATES HIGH-ALTITUDE
TEST EXPERIENCES
A Review Emphasizing the Impact on the Environment
A LASL Monograph
by
Herman Hoerlin
ABSTRACT
The US high-altitude nuclear explosions of the 1955-1962 period are listed
chronologically; dates, locations, and yields are given. The major physical
phases of the interactions of the weapon outputs with the atmosphere are
described, such as the formation of fireballs at the low high-altitudes and the
partition of energies and their distribution over very large spaces at the
higher high-altitudes. The effects of these explosions on the normal ac-
tivities of populations and the protective measures taken are documented.
Many scientific observations, together with their significance and values,
are reviewed.
The prompt thermal effects on the ground were negligible, with the excep-
tion of those from the Orange event. That event could have caused minor
damage in the Johnston Island (JI) area in the absence of cloud cover.
The eyeburn problem at ground zero and up to large slant distances was
severe for all events except Starfish, Checkmate, and Argus. Adequate
precautions, such as the selection of JI instead of Bikini as the base in the
Pacific, were taken. Two military personnel suffered severe burns, however,
due to inadvertent exposure. Their case histories are recorded.
The degrading effects of increased ionospheric ionization on commercial
and aircraft communications—mainly in the LF, MF, and HF frequency
ranges—extended over the whole Pacific Ocean area. They lasted for many
days after the three megaton-range explosions. They were less severe—in
some cases even beneficial—for VHF and VLF frequencies, thus providing
guidance for emergency situations.
The formation of an artificial radiation belt of such high electron fluxes
and long lifetimes as occurred after the Starfish event was unexpected; so
were the damages sustained by three satellites in orbit. However, the vast
amount of knowledge gained by the observations of the artificial belts
generated by Starfish, Argus, and the Russian high-altitude explosions far
outweighed the information which would have been gained otherwise. A few
extrapolations are made to effects on manned space flight under
hypothetical circumstances.
Electromagnetic radiation in the radio-frequency portion of the spectrum
(EMP) caused brief outages of a street lighting system in Oahu and of
several input stages of electronic equipment, though during the Starfish
event only.
1
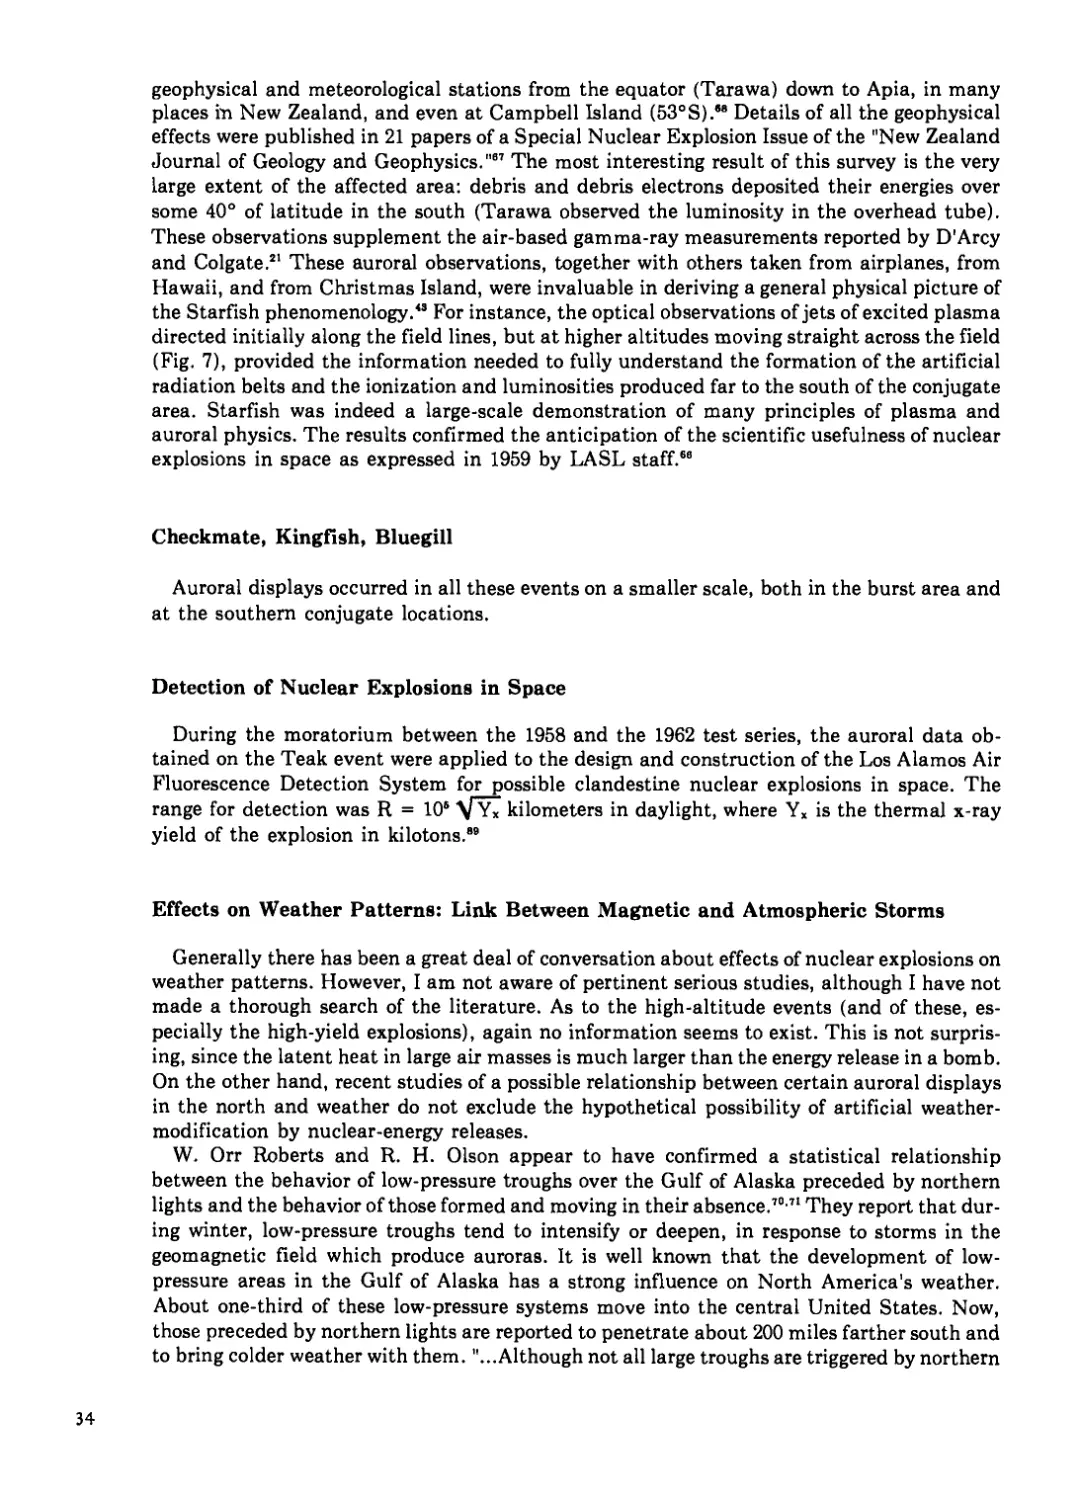
The worldwide auroral phenomena produced by the high-yield explosions
were spectacular but of no consequence to ordinary human activities. They
increased substantially our basic knowledge of auroral-type light-producing
processes. Questions were raised but not answered as to the effects of perti-
nent energy depositions on large-scale weather patterns.
The prompt fallout from high-altitude explosions was zero. The residence
time in the stratosphere of special tracers—102Rh and 109Cd—incorporated
into the Orange and Starfish devices was 14 years. The fallout of fission
products was similarly delayed and was distributed over the whole globe;
thus, the biological effects on humans were reduced per unit energy release
in comparison with low-altitude atmospheric explosions. The worldwide
observation of the tracers led to the development of matching models of
global stratospheric air-mass motions and to a better understanding of mix-
ing processes near the tropopause. In fact, the downward motion of the
tracers was most pronounced in the polar areas during local winter. No ef-
fect on the natural ozone layer could be ascertained.
In summary, the effects of the US high-altitude explosions on the normal
activities of the populations were either insignificant or under protective
control involving little harassment or irritation. As to the effects on the
research activities of the international scientific community, I believe, in
retrospect, that the early apprehension both in the US and Great Britain
has given way now to a more positive assessment of the scientific returns ob-
tained. However, it is also evident that the consequences of massive military
operations in the upper atmosphere would be grave.
2
CHAPTERI
LISTING OF EVENTS.
GENERAL DESCRIPTION OF PHENOMENOLOGY.
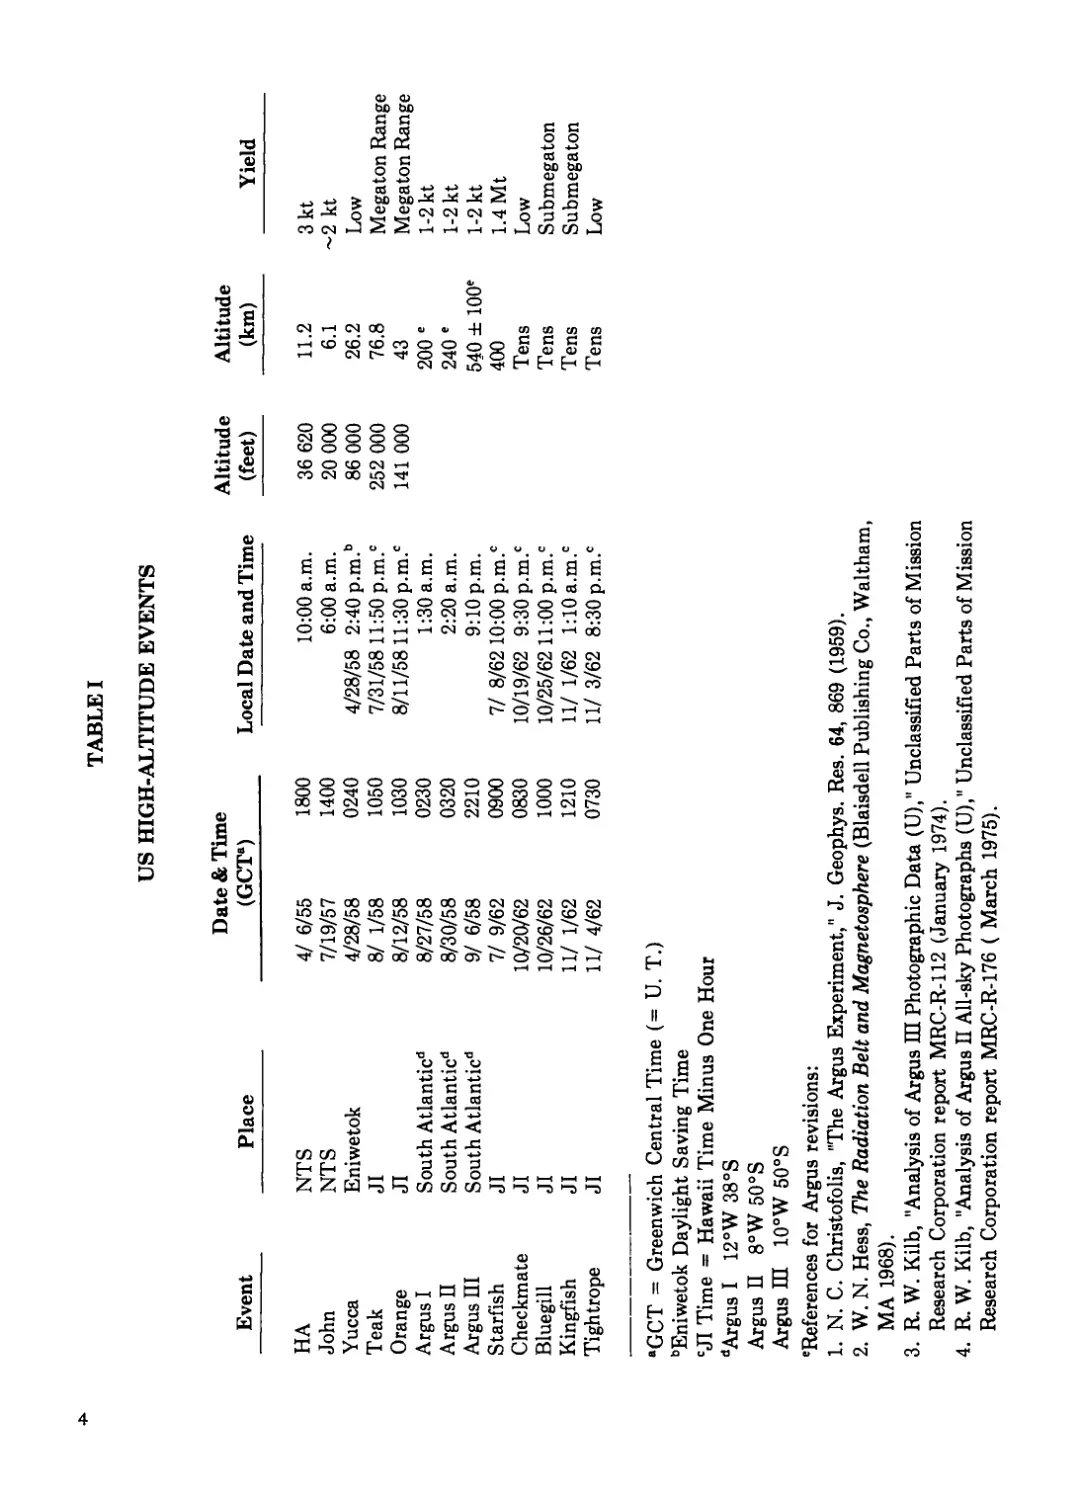
All US high-altitude events are listed in Table I in temporal sequence. Much, but not all, of
the information is taken from Glasstone.1 The explosion times are rounded to the nearest
minute, which is adequate for the purposes of this paper. The numbers were checked and sup-
plemented by data from other sources. There is some uncertainty as to the Argus burst loca-
tions. They are different from the Glasstone data. The references used are shown at the bot-
tom of Table I.
For the purpose of introduction, a general description of the main aspects of the
phenomenology of the events is provided first. Later in the document, those phases of the
phenomenology which are pertinent to a specific environmental effect are described in greater
detail. The treatment will not always be entirely satisfactory to the pure scientist: it suffers
from the non-utilization of precise weapons-output information, which is classified. However,
these omissions are not expected to interfere with the main purpose of this monograph.
The explosion phenomena of the three "low" high-altitude, low-yield events (HA, John, and
Yucca) did not differ drastically from that of sea-level or near-sea-level explosions. Compared
with the latter, the power-time histories of the fireballs were somewhat shorter, the peak
radiances were slightly higher, the time of the minimum (bhangmeter time) was shorter, and
the thermal pulse was more intense. While the total prompt-thermal-yield fraction was close
to the thermal fraction of similar events near sea level (i.e., 25-30%), the somewhat shorter
duration of the pulse is more effective in producing thermal damage. Therefore, the thermal-
radiation effects of explosions in the "low" high-altitude domain would be more severe than of
sea-level events. In the Yucca event, the early power-time history was optically better
resolved than in sea-level events; one could differentiate between the radiative expansion of
the fireball, the formation of the hydrodynamic shock, and the debris shock catch-up with the
hydrodynamic shock. The fraction of the thermal yield emitted by these three pulses is higher
than in the corresponding pulse at sea level, but the relative environmental effects in this
yield domain are small. The Tightrope event was also in the low-yield domain. The same
comments apply. The thermal pulse was definitely shorter and more intense.
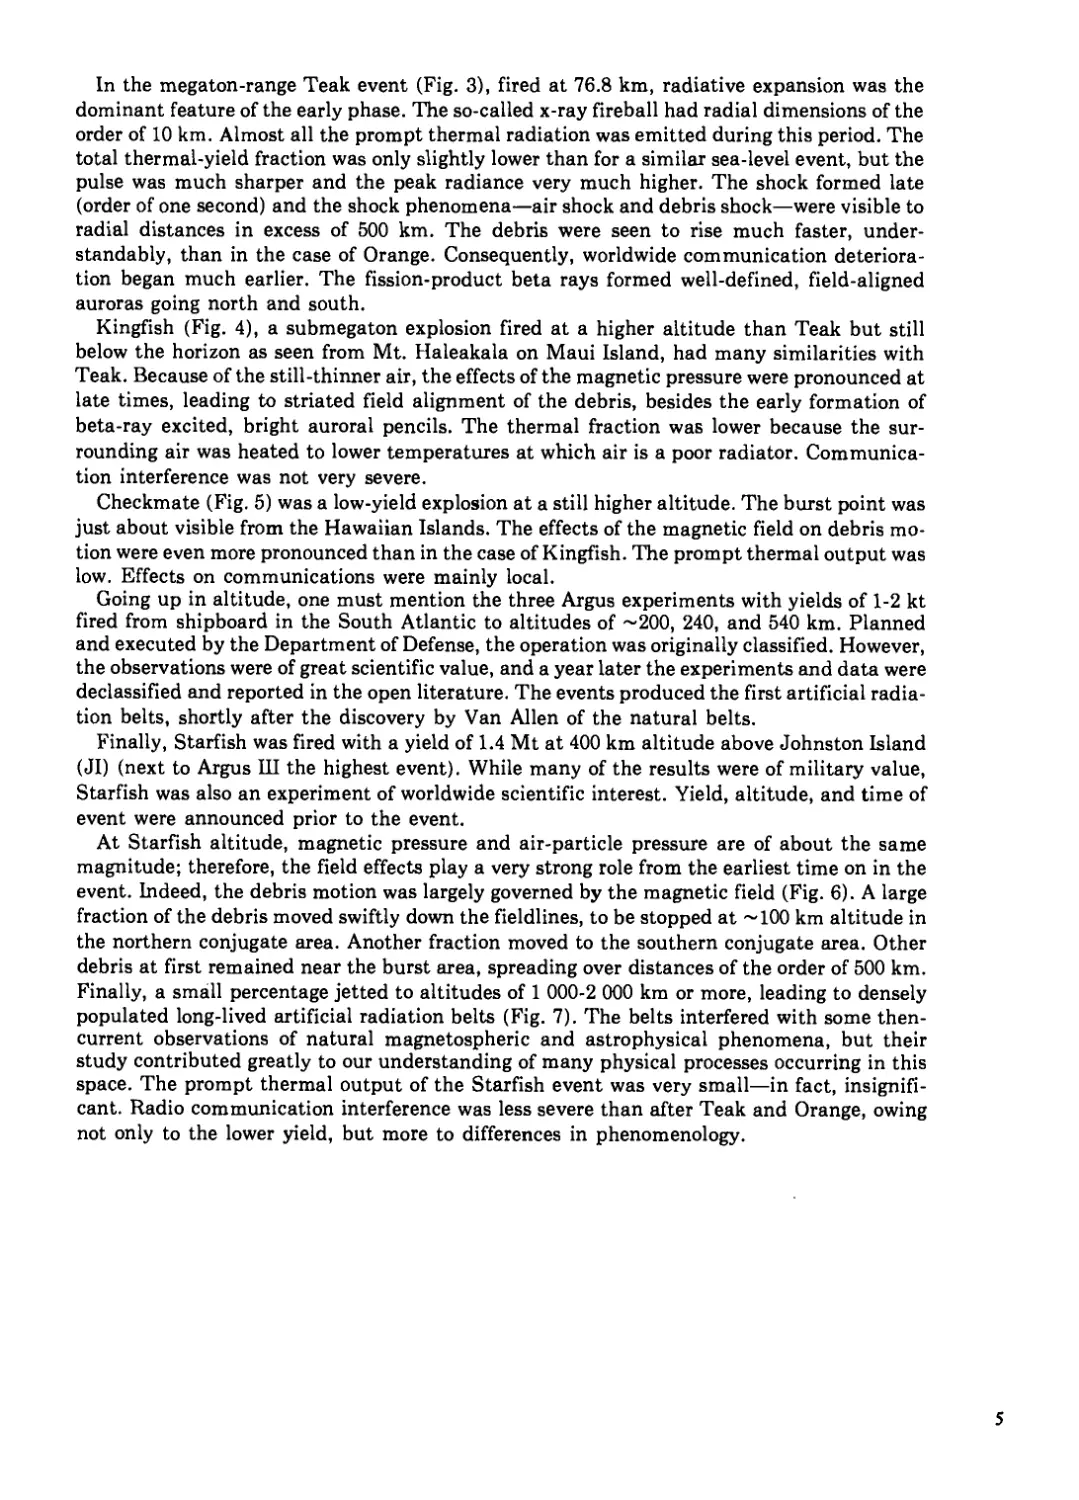
In the next altitude domain, the megaton-range Orange event (Fig. 1) was fired at 43 km.
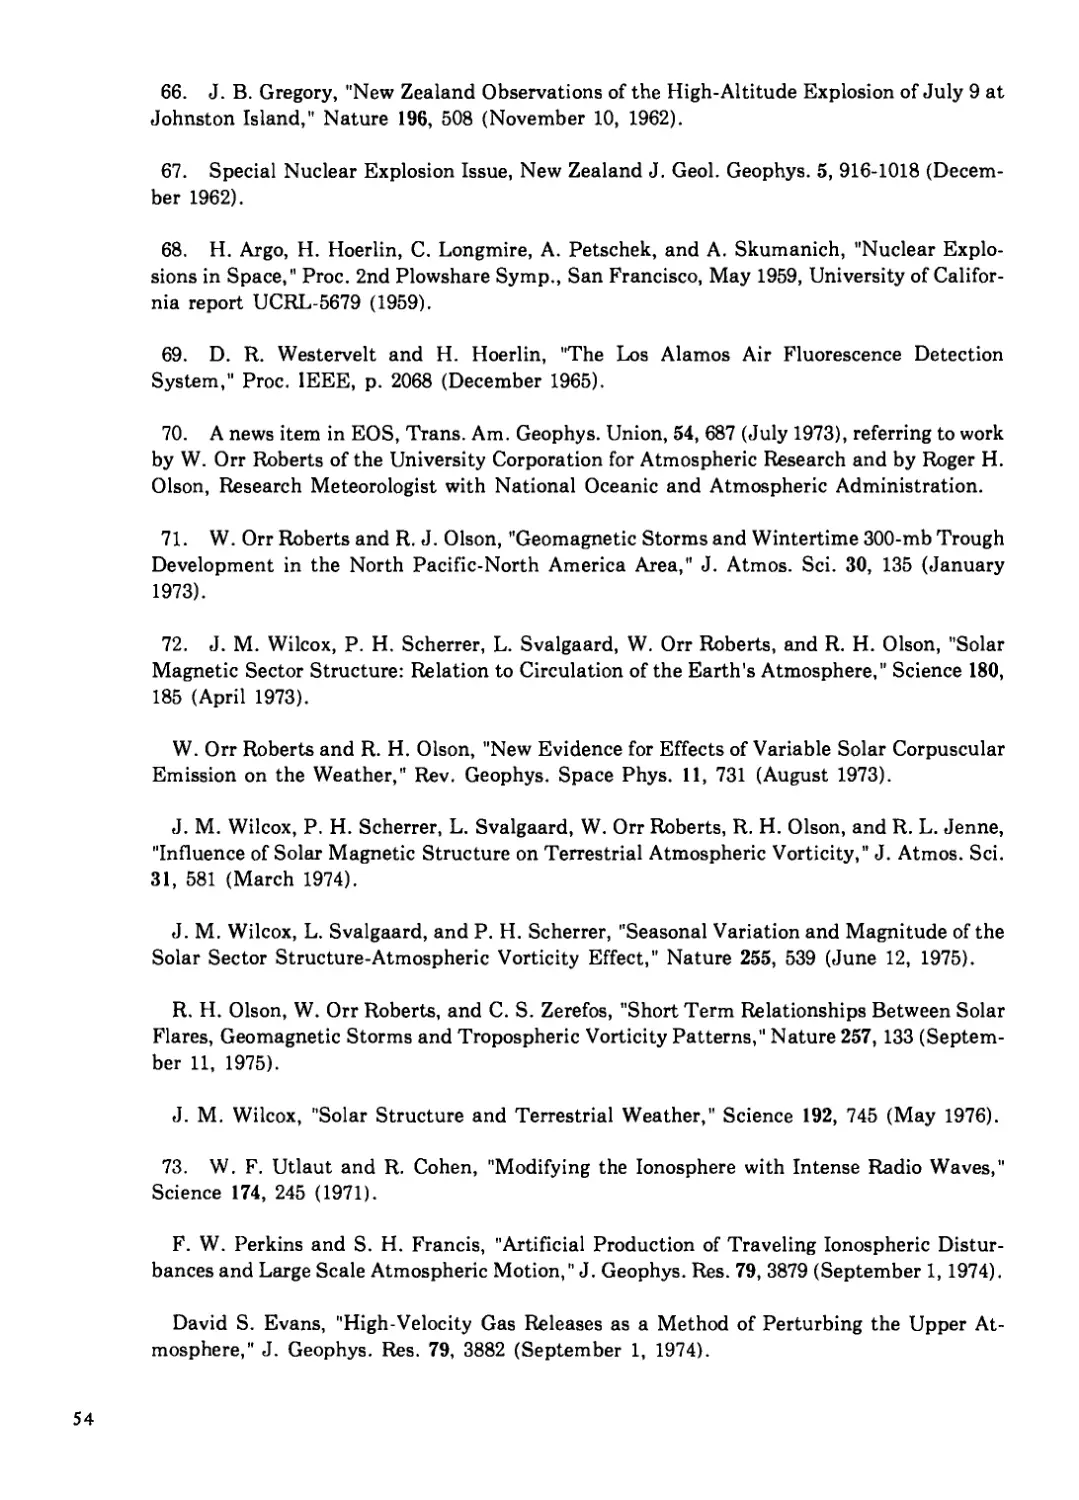
Bluegill (Fig. 2) belongs in the same category, but the yield was lower (i.e., submegaton). In
both cases, the phenomenology differed substantially from the lower altitude events. Because
of the much lower air density, the x-rays from the source had a larger mean free path (mfp)
and the radiative expansion of the fireball was more pronounced. The strong shock still
formed early, though it was delayed compared with the strong shock formation in the
previously discussed events. The thermal pulse was much shorter, the peak radiances were
considerably higher than at sea level, and the apparent bhangmeter minimum appeared as a
weak inflection. The time of occurrence does not agree with any popular scaling law. The
total prompt thermal-yield fraction was still almost normal. Of great significance, particular-
ly in the case of Orange, was the rise of the debris to altitudes of several hundred kilometers
and their subsequent spread and worldwide motion. The effects of this phase of the
phenomenology on worldwide communications are reviewed later, as is the motion in the up-
per stratosphere of lW!Rh, a neutron-activated tracer produced in the Orange device.
3
TABLEI
US HIGH-ALTITUDE EVENTS * 1 2 3 4 *
Event Place Date & Time (GCTa) Local Date and Time Altitude (feet) Altitude (km) Yield
HA NTS 4/ 6/55 1800 10:00 a.m. 36 620 11.2 3kt
John NTS 7/19/57 1400 6:00 a.m. 20 000 6.1 ~2 kt
Yucca Eniwetok 4/28/58 0240 4/28/58 2:40 p.m? 86 000 26.2 Low
Teak JI 8/ 1/58 1050 7/31/58 11:50 p.m? 252 000 76.8 Megaton Range
Orange JI 8/12/58 1030 8/11/5811:30 p.m.' 141 000 43 Megaton Range
Argus I South Atlantic6 8/27/58 0230 1:30 a.m. 200 ' 1-2 kt
Argus П South Atlantic6 8/30/58 0320 2:20 a.m. 240 ' 1-2 kt
Argus П1 South Atlantic6 9/ 6/58 2210 9:10 p.m. 540 ± 100' 1-2 kt
Starfish JI 7/ 9/62 0900 7/ 8/62 10:00 p.m.' 400 1.4 Mt
Checkmate JI 10/20/62 0830 10/19/62 9:30 p.m.' Tens Low
Bluegill JI 10/26/62 1000 10/25/62 11:00 p.m.' Tens Submegaton
Kingfish JI 11/ 1/62 1210 11/ 1/62 1:10 a.m.' Tens Submegaton
Tightrope JI 11/ 4/62 0730 11/ 3/62 8:30 p.m.' Tens Low
aGCT = Greenwich Central Time (= U. T.)
bEniwetok Daylight Saving Time
CJI Time = Hawaii Time Minus One Hour
“Argus I 12°W 38°S
Argus П 8°W 50°S
Argus Ш 10°W 50°S
'References for Argus revisions:
1. N. C. Christofolis, "The Argus Experiment," J. Geophys. Res. 64, 869 (1959).
2. W. N. Hess, The Radiation Belt and Magnetosphere (Blaisdell Publishing Co., Waltham,
MA 1968).
3. R. W. Kilb, "Analysis of Argus JU Photographic Data (U)," Unclassified Parts of Mission
Research Corporation report MRC-R-112 (January 1974).
4. R. W. Kilb, "Analysis of Argus П All-sky Photographs (U)," Unclassified Parts of Mission
Research Corporation report MRC-R-176 ( March 1975).
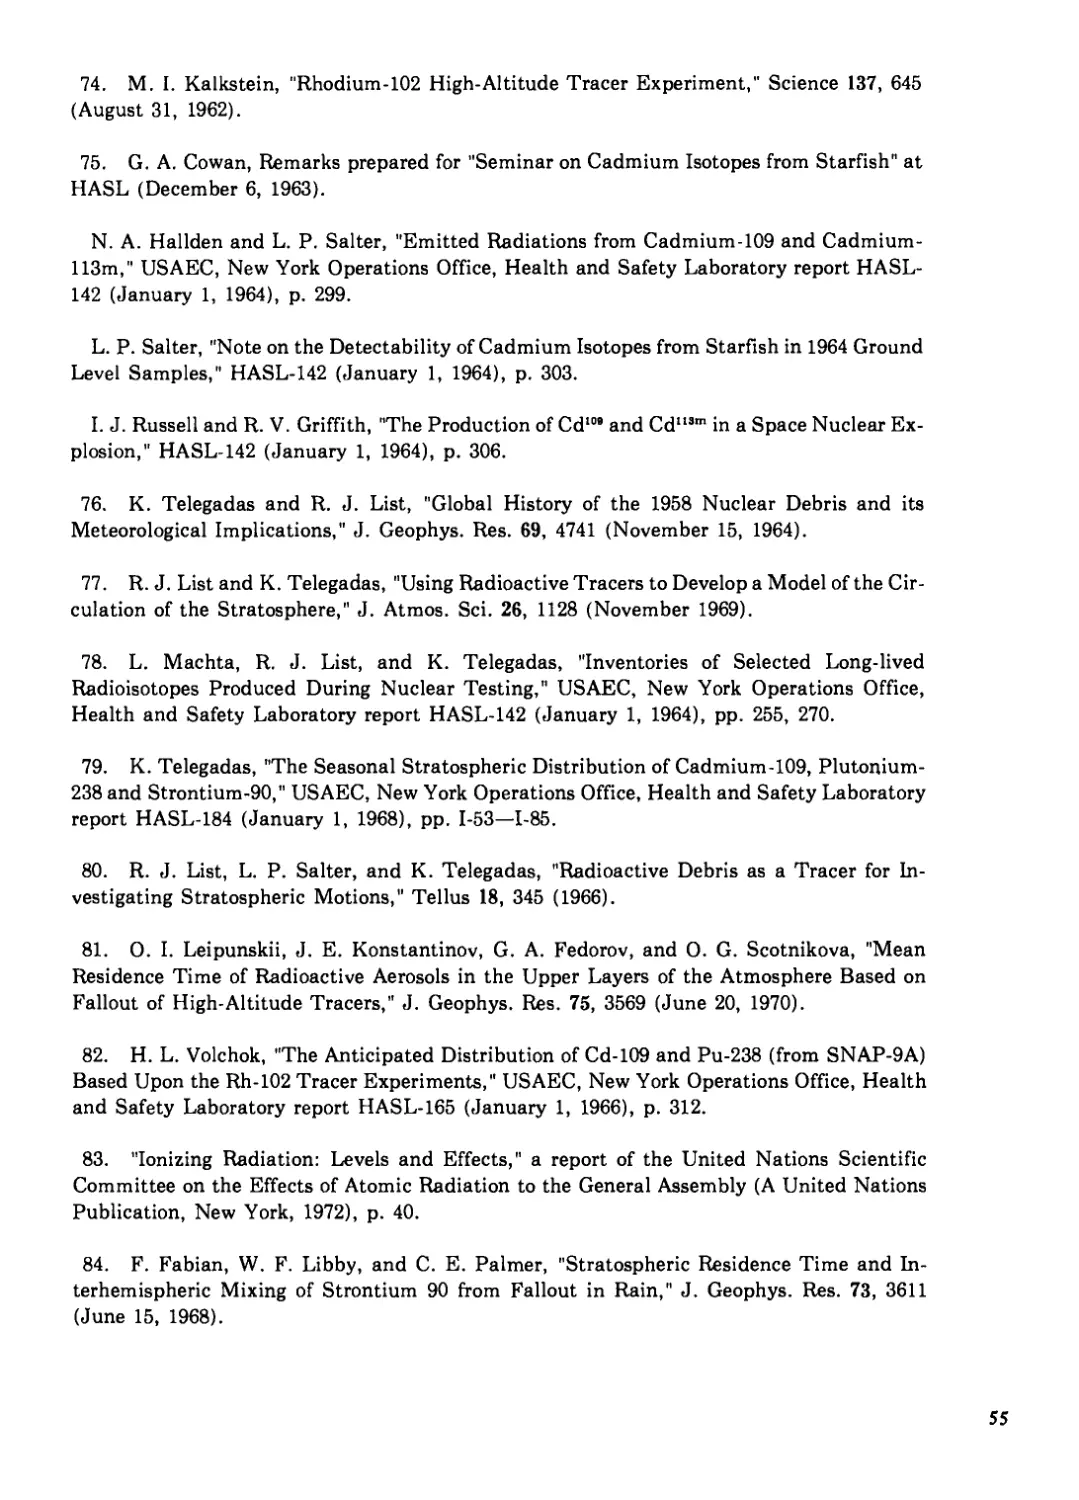
In the megaton-range Teak event (Fig. 3), fired at 76.8 km, radiative expansion was the
dominant feature of the early phase. The so-called x-ray fireball had radial dimensions of the
order of 10 km. Almost all the prompt thermal radiation was emitted during this period. The
total thermal-yield fraction was only slightly lower than for a similar sea-level event, but the
pulse was much sharper and the peak radiance very much higher. The shock formed late
(order of one second) and the shock phenomena—air shock and debris shock—were visible to
radial distances in excess of 500 km. The debris were seen to rise much faster, under-
standably, than in the case of Orange. Consequently, worldwide communication deteriora-
tion began much earlier. The fission-product beta rays formed well-defined, field-aligned
auroras going north and south.
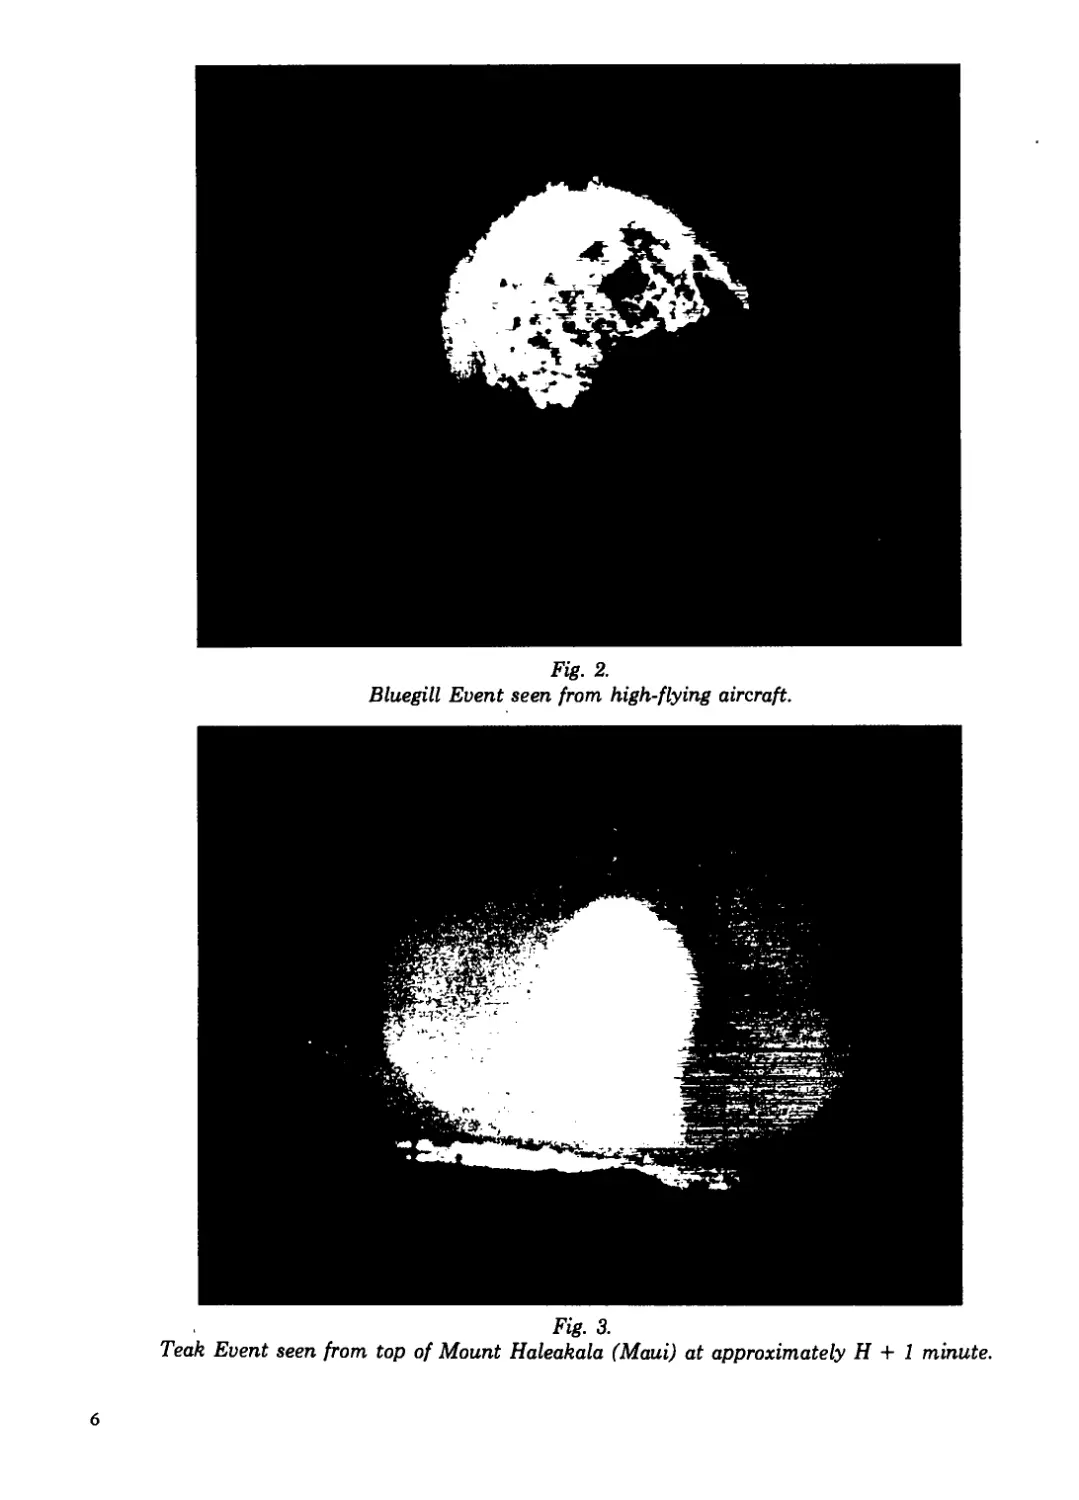
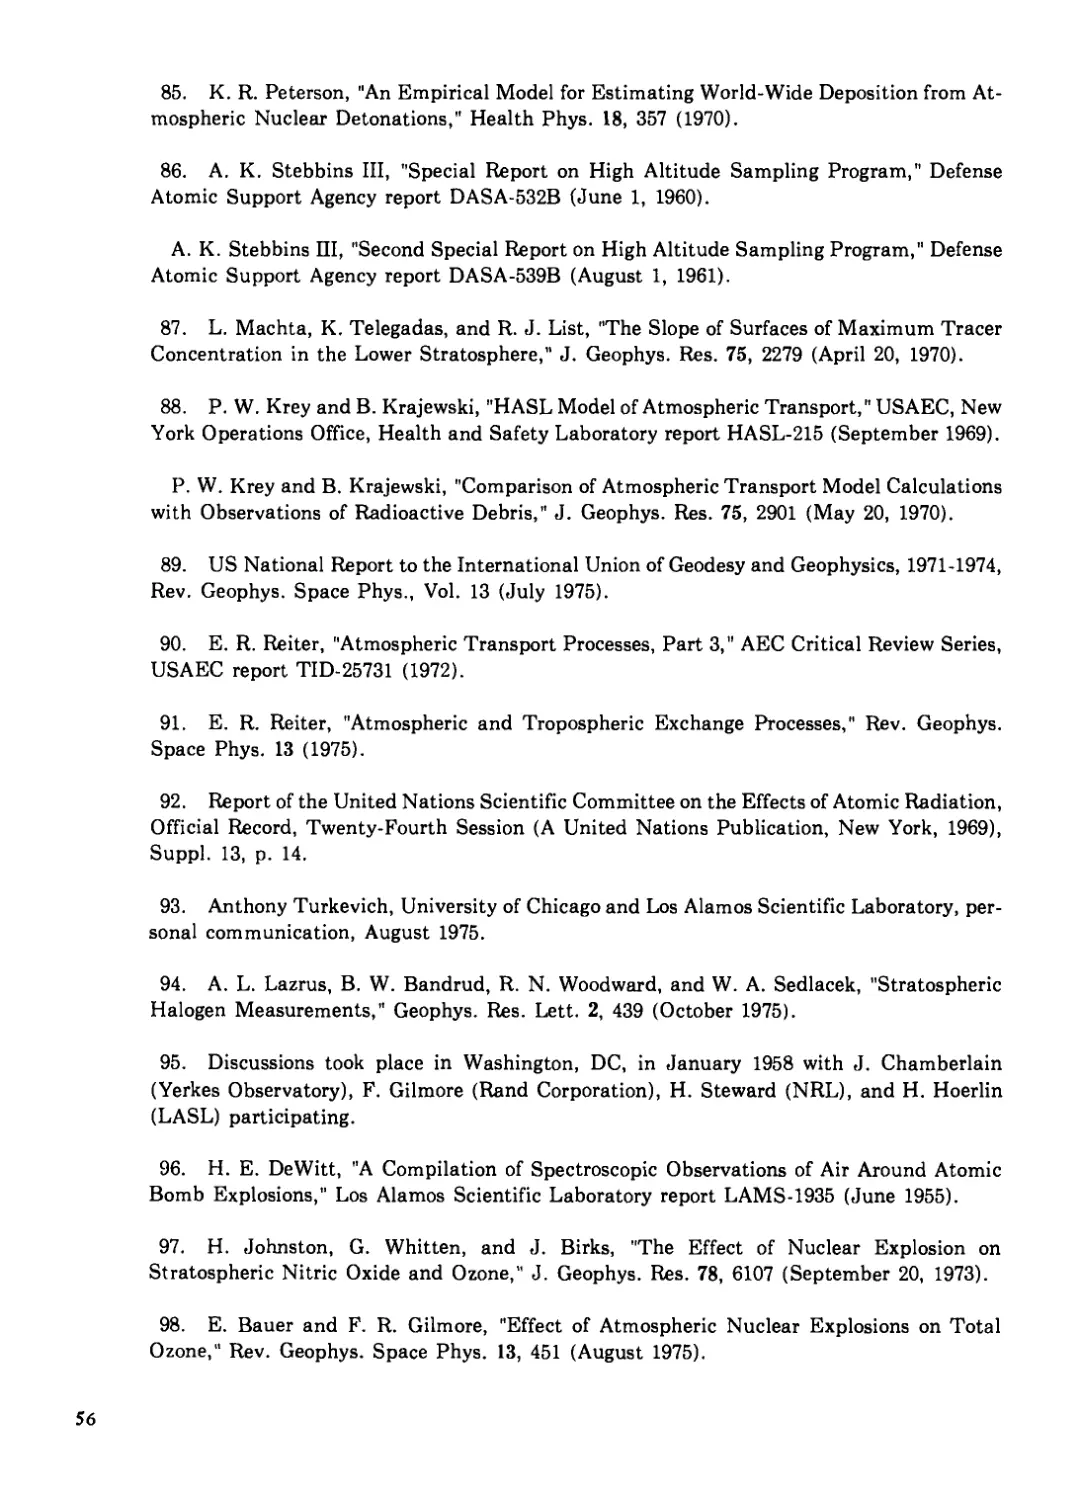
Kingfish (Fig. 4), a submegaton explosion fired at a higher altitude than Teak but still
below the horizon as seen from Mt. Haleakala on Maui Island, had many similarities with
Teak. Because of the still-thinner air, the effects of the magnetic pressure were pronounced at
late times, leading to striated field alignment of the debris, besides the early formation of
beta-ray excited, bright auroral pencils. The thermal fraction was lower because the sur-
rounding air was heated to lower temperatures at which air is a poor radiator. Communica-
tion interference was not very severe.
Checkmate (Fig. 5) was a low-yield explosion at a still higher altitude. The burst point was
just about visible from the Hawaiian Islands. The effects of the magnetic field on debris mo-
tion were even more pronounced than in the case of Kingfish. The prompt thermal output was
low. Effects on communications were mainly local.
Going up in altitude, one must mention the three Argus experiments with yields of 1-2 kt
fired from shipboard in the South Atlantic to altitudes of ~200, 240, and 540 km. Planned
and executed by the Department of Defense, the operation was originally classified. However,
the observations were of great scientific value, and a year later the experiments and data were
declassified and reported in the open literature. The events produced the first artificial radia-
tion belts, shortly after the discovery by Van Allen of the natural belts.
Finally, Starfish was fired with a yield of 1.4 Mt at 400 km altitude above Johnston Island
(JI) (next to Argus III the highest event). While many of the results were of military value,
Starfish was also an experiment of worldwide scientific interest. Yield, altitude, and time of
event were announced prior to the event.
At Starfish altitude, magnetic pressure and air-particle pressure are of about the same
magnitude; therefore, the field effects play a very strong role from the earliest time on in the
event. Indeed, the debris motion was largely governed by the magnetic field (Fig. 6). A large
fraction of the debris moved swiftly down the fieldlines, to be stopped at ~100 km altitude in
the northern conjugate area. Another fraction moved to the southern conjugate area. Other
debris at first remained near the burst area, spreading over distances of the order of 500 km.
Finally, a small percentage jetted to altitudes of 1 000-2 000 km or more, leading to densely
populated long-lived artificial radiation belts (Fig. 7). The belts interfered with some then-
current observations of natural magnetospheric and astrophysical phenomena, but their
study contributed greatly to our understanding of many physical processes occurring in this
space. The prompt thermal output of the Starfish event was very small—in fact, insignifi-
cant. Radio communication interference was less severe than after Teak and Orange, owing
not only to the lower yield, but more to differences in phenomenology.
5
Fig. 2.
Bluegill Event seen from high-flying aircraft.
Fig. 3.
Teak Event seen from top of Mount Haleakala (Maui) at approximately H + 1 minute.
6
Fig. 4.
Kingfish Event seen from high-flying aircraft.
Fig. 5.
Checkmate Event seen from Johnston Island.
7
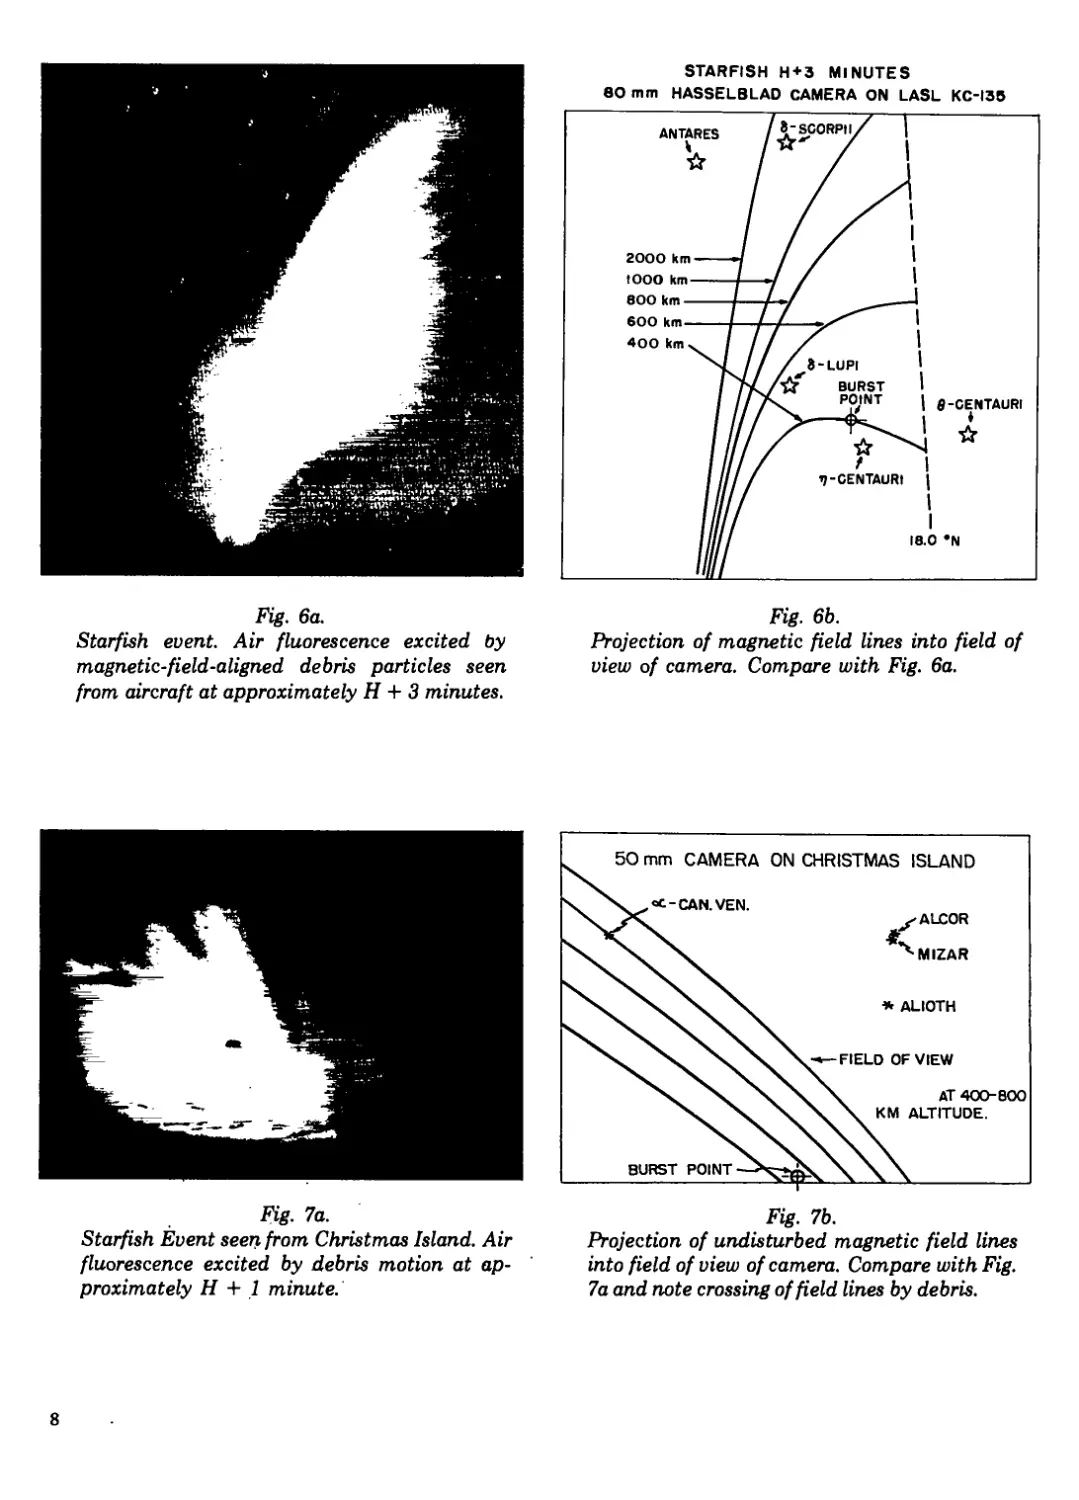
Fig. 6a.
Starfish event. Air fluorescence excited by
magnetic-field-aligned debris particles seen
from aircraft at approximately H + 3 minutes.
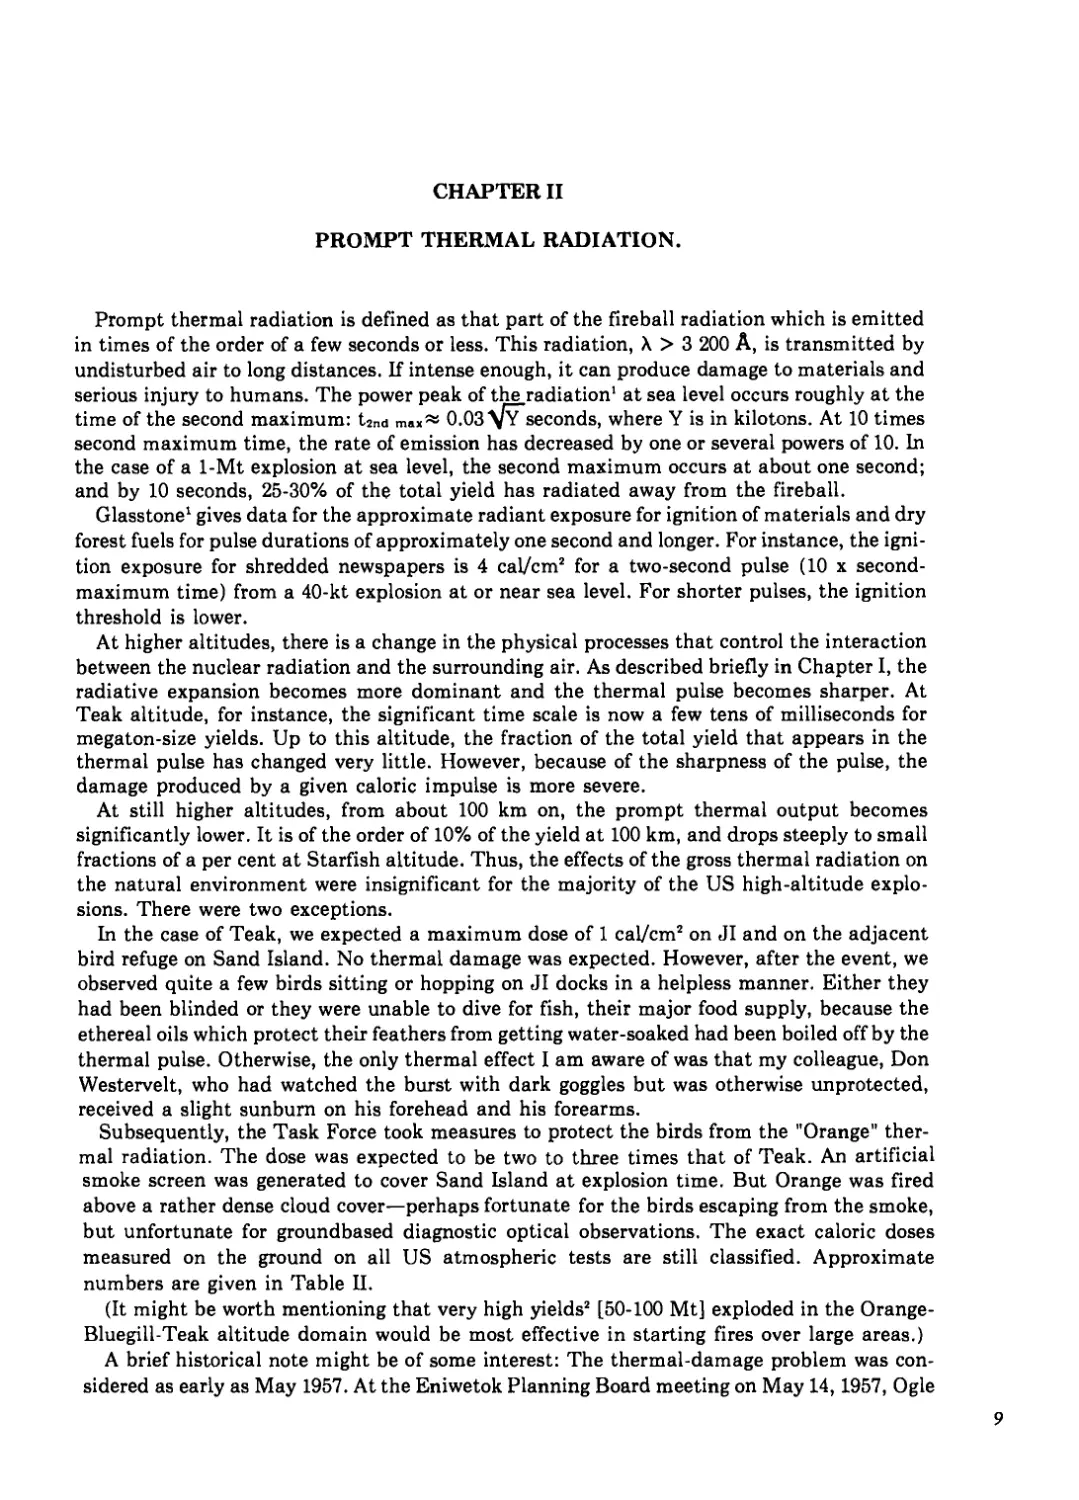
STARFISH H + 3 MINUTES
80 mm HASSELBLAD CAMERA ON LASL KC-I3B
Fig. 6b.
Projection of magnetic field lines into field of
view of camera. Compare with Fig. 6a.
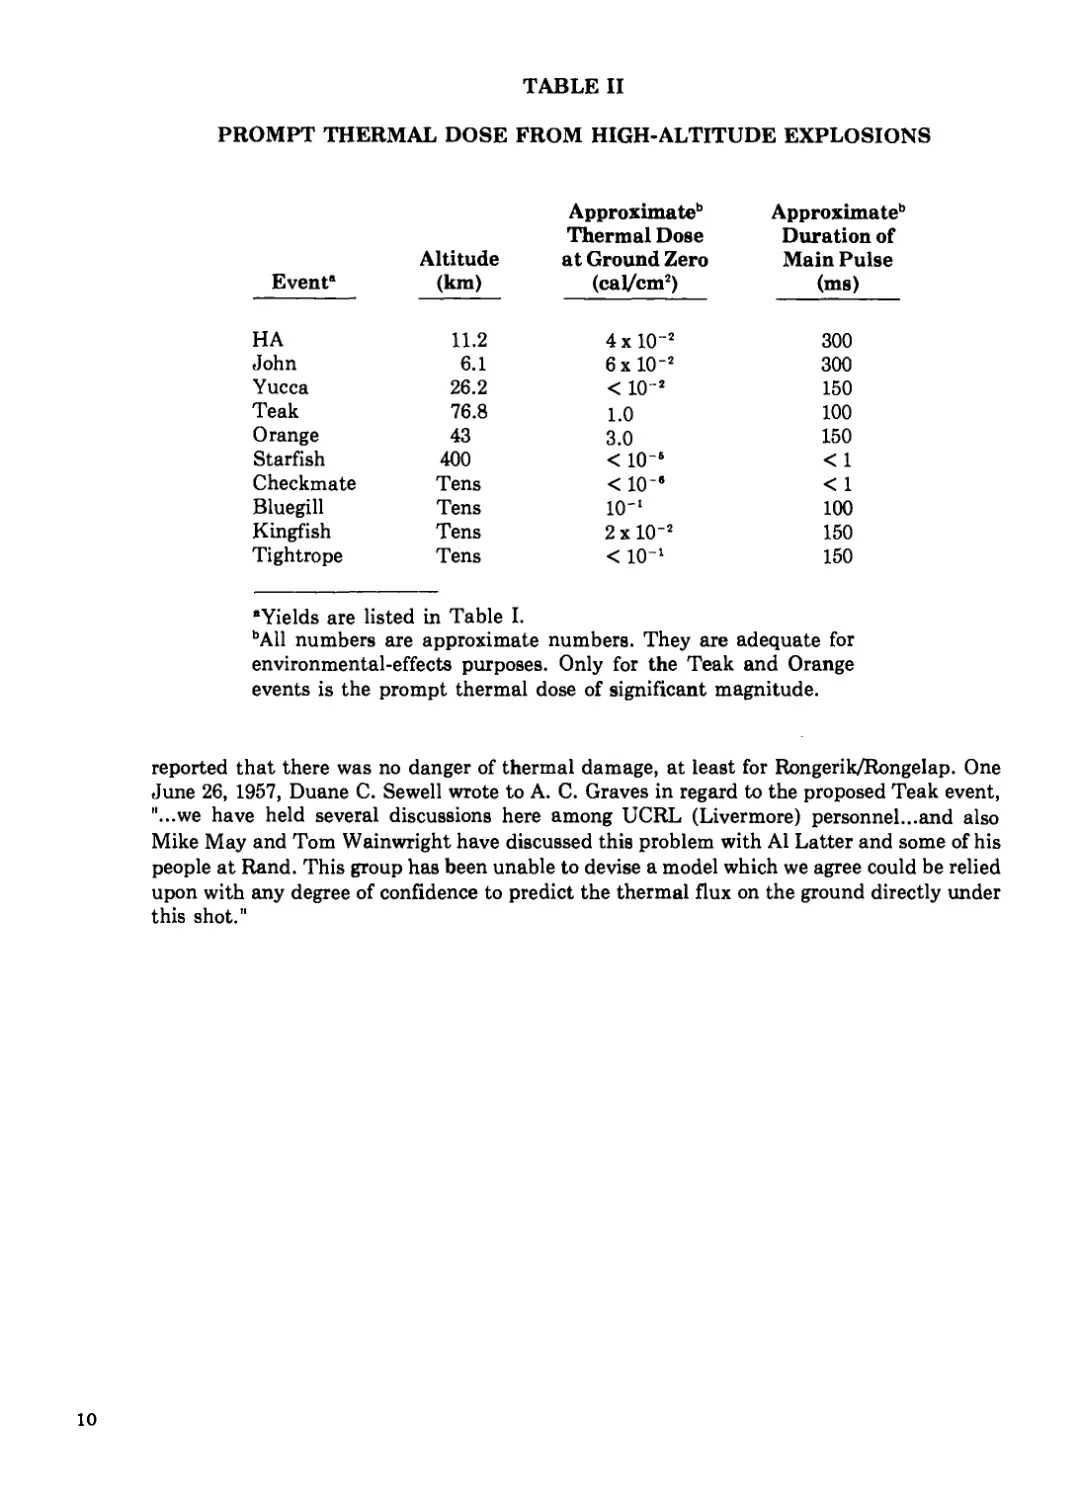
Fig- 7a.
Starfish Event seen from Christmas Island. Air
fluorescence excited by debris motion at ap-
proximately H + 1 minute.
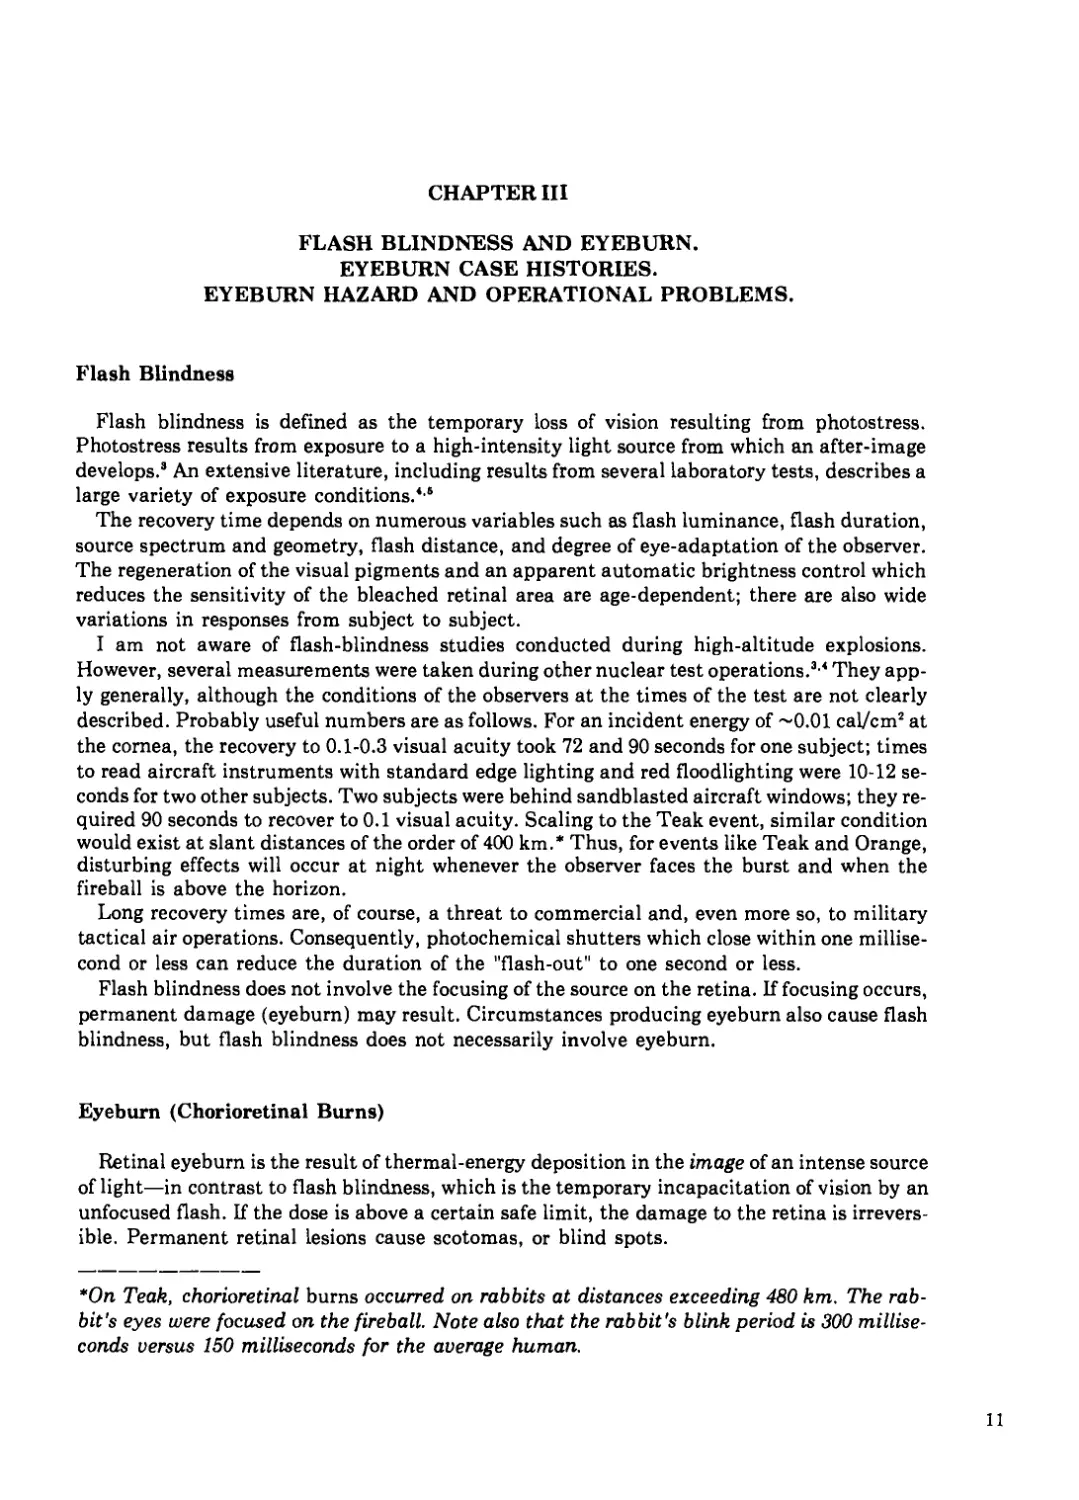
Projection of undisturbed magnetic field lines
into field of view of camera. Compare with Fig.
7a and note crossing of field lines by debris.
8
CHAPTER II
PROMPT THERMAL RADIATION.
Prompt thermal radiation is defined as that part of the fireball radiation which is emitted
in times of the order of a few seconds or less. This radiation, X > 3 200 A, is transmitted by
undisturbed air to long distances. If intense enough, it can produce damage to materials and
serious injury to humans. The power peak of the radiation1 at sea level occurs roughly at the
time of the second maximum: t2n<i 0.03^Fseconds, where Y is in kilotons. At 10 times
second maximum time, the rate of emission has decreased by one or several powers of 10. In
the case of a 1-Mt explosion at sea level, the second maximum occurs at about one second;
and by 10 seconds, 25-30% of the total yield has radiated away from the fireball.
Glasstone1 gives data for the approximate radiant exposure for ignition of materials and dry
forest fuels for pulse durations of approximately one second and longer. For instance, the igni-
tion exposure for shredded newspapers is 4 cal/cm2 for a two-second pulse (10 x second-
maximum time) from a 40-kt explosion at or near sea level. For shorter pulses, the ignition
threshold is lower.
At higher altitudes, there is a change in the physical processes that control the interaction
between the nuclear radiation and the surrounding air. As described briefly in Chapter I, the
radiative expansion becomes more dominant and the thermal pulse becomes sharper. At
Teak altitude, for instance, the significant time scale is now a few tens of milliseconds for
megaton-size yields. Up to this altitude, the fraction of the total yield that appears in the
thermal pulse has changed very little. However, because of the sharpness of the pulse, the
damage produced by a given caloric impulse is more severe.
At still higher altitudes, from about 100 km on, the prompt thermal output becomes
significantly lower. It is of the order of 10% of the yield at 100 km, and drops steeply to small
fractions of a per cent at Starfish altitude. Thus, the effects of the gross thermal radiation on
the natural environment were insignificant for the majority of the US high-altitude explo-
sions. There were two exceptions.
In the case of Teak, we expected a maximum dose of 1 cal/cm2 on JI and on the adjacent
bird refuge on Sand Island. No thermal damage was expected. However, after the event, we
observed quite a few birds sitting or hopping on JI docks in a helpless manner. Either they
had been blinded or they were unable to dive for fish, their major food supply, because the
ethereal oils which protect their feathers from getting water-soaked had been boiled off by the
thermal pulse. Otherwise, the only thermal effect I am aware of was that my colleague, Don
Westervelt, who had watched the burst with dark goggles but was otherwise unprotected,
received a slight sunburn on his forehead and his forearms.
Subsequently, the Task Force took measures to protect the birds from the "Orange" ther-
mal radiation. The dose was expected to be two to three times that of Teak. An artificial
smoke screen was generated to cover Sand Island at explosion time. But Orange was fired
above a rather dense cloud cover—perhaps fortunate for the birds escaping from the smoke,
but unfortunate for groundbased diagnostic optical observations. The exact caloric doses
measured on the ground on all US atmospheric tests are still classified. Approximate
numbers are given in Table П.
(It might be worth mentioning that very high yields2 [50-100 Mt] exploded in the Orange-
Bluegill-Teak altitude domain would be most effective in starting fires over large areas.)
A brief historical note might be of some interest: The thermal-damage problem was con-
sidered as early as May 1957. At the Eniwetok Planning Board meeting on May 14,1957, Ogle
9
TABLE II
PROMPT THERMAL DOSE FROM HIGH-ALTITUDE EXPLOSIONS
Event11 Altitude (km) Approximate13 Thermal Dose at Ground Zero (cal/cm2) Approximate1 Duration of Main Pulse (ms)
HA 11.2 4xl0"2 300
John 6.1 6xl0-2 300
Yucca 26.2 < 10~2 150
Teak 76.8 1.0 100
Orange 43 3.0 150
Starfish 400 < IO’5 < 1
Checkmate Tens < io-e < 1
Bluegill Tens 10'1 100
Kingfish Tens 2xl0“2 150
Tightrope Tens < io-1 150
•Yields are listed in Table I.
bAll numbers are approximate numbers. They are adequate for
environmental-effects purposes. Only for the Teak and Orange
events is the prompt thermal dose of significant magnitude.
reported that there was no danger of thermal damage, at least for Rongerik/Rongelap. One
June 26, 1957, Duane C. Sewell wrote to A. C. Graves in regard to the proposed Teak event,
"...we have held several discussions here among UCRL (Livermore) personnel...and also
Mike May and Tom Wainwright have discussed this problem with Al Latter and some of his
people at Rand. This group has been unable to devise a model which we agree could be relied
upon with any degree of confidence to predict the thermal flux on the ground directly under
this shot."
10
CHAPTER III
FLASH BLINDNESS AND EYEBURN.
EYEBURN CASE HISTORIES.
EYEBURN HAZARD AND OPERATIONAL PROBLEMS.
Flash Blindness
Flash blindness is defined as the temporary loss of vision resulting from photostress.
Photostress results from exposure to a high-intensity light source from which an after-image
develops.3 An extensive literature, including results from several laboratory tests, describes a
large variety of exposure conditions.4,5
The recovery time depends on numerous variables such as flash luminance, flash duration,
source spectrum and geometry, flash distance, and degree of eye-adaptation of the observer.
The regeneration of the visual pigments and an apparent automatic brightness control which
reduces the sensitivity of the bleached retinal area are age-dependent; there are also wide
variations in responses from subject to subject.
I am not aware of flash-blindness studies conducted during high-altitude explosions.
However, several measurements were taken during other nuclear test operations.3,4 They app-
ly generally, although the conditions of the observers at the times of the test are not clearly
described. Probably useful numbers are as follows. For an incident energy of ~0.01 cal/cm2 at
the cornea, the recovery to 0.1-0.3 visual acuity took 72 and 90 seconds for one subject; times
to read aircraft instruments with standard edge lighting and red floodlighting were 10-12 se-
conds for two other subjects. Two subjects were behind sandblasted aircraft windows; they re-
quired 90 seconds to recover to 0.1 visual acuity. Scaling to the Teak event, similar condition
would exist at slant distances of the order of 400 km.* Thus, for events like Teak and Orange,
disturbing effects will occur at night whenever the observer faces the burst and when the
fireball is above the horizon.
Long recovery times are, of course, a threat to commercial and, even more so, to military
tactical air operations. Consequently, photochemical shutters which close within one millise-
cond or less can reduce the duration of the "flash-out" to one second or less.
Flash blindness does not involve the focusing of the source on the retina. If focusing occurs,
permanent damage (eyeburn) may result. Circumstances producing eyeburn also cause flash
blindness, but flash blindness does not necessarily involve eyeburn.
Eyeburn (Chorioretinal Burns)
Retinal eyeburn is the result of thermal-energy deposition in the image of an intense source
of light—in contrast to flash blindness, which is the temporary incapacitation of vision by an
unfocused flash. If the dose is above a certain safe limit, the damage to the retina is irrevers-
ible. Permanent retinal lesions cause scotomas, or blind spots.
*On Teak, chorioretinal burns occurred on rabbits at distances exceeding 480 km. The rab-
bit's eyes were focused on the fireball. Note also that the rabbit's blink period is 300 millise-
conds versus 150 milliseconds for the average human.
11
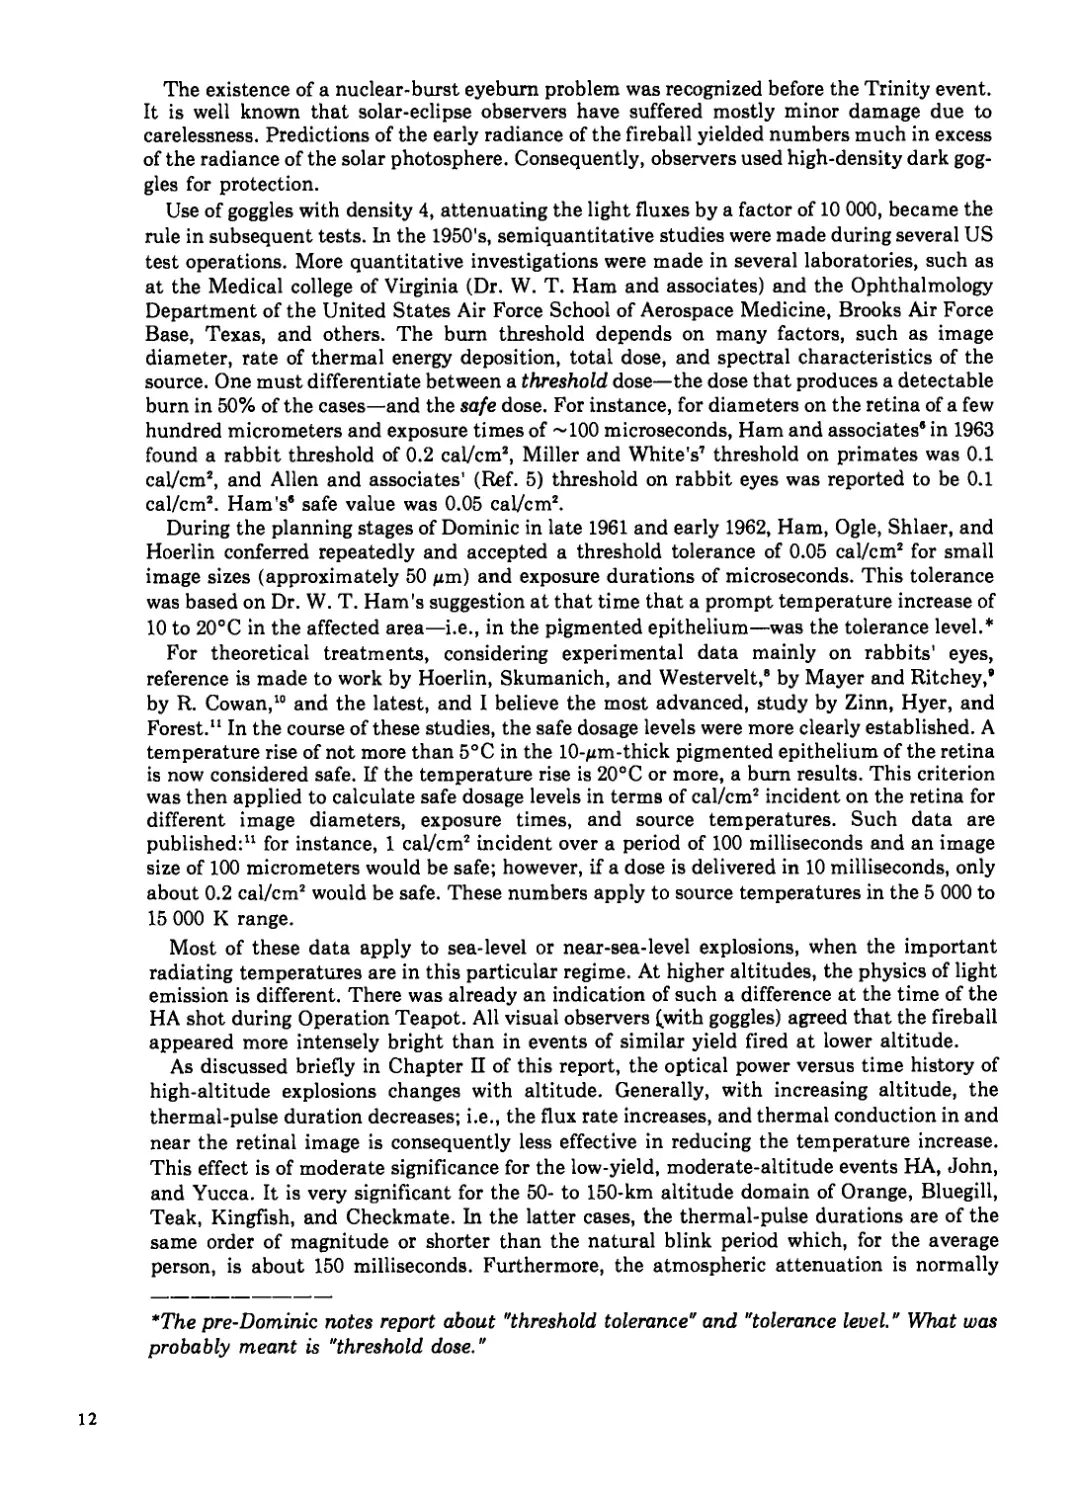
The existence of a nuclear-burst eyebum problem was recognized before the Trinity event.
It is well known that solar-eclipse observers have suffered mostly minor damage due to
carelessness. Predictions of the early radiance of the fireball yielded numbers much in excess
of the radiance of the solar photosphere. Consequently, observers used high-density dark gog-
gles for protection.
Use of goggles with density 4, attenuating the light fluxes by a factor of 10 000, became the
rule in subsequent tests. In the 1950's, semiquantitative studies were made during several US
test operations. More quantitative investigations were made in several laboratories, such as
at the Medical college of Virginia (Dr. W. T. Ham and associates) and the Ophthalmology
Department of the United States Air Force School of Aerospace Medicine, Brooks Air Force
Base, Texas, and others. The bum threshold depends on many factors, such as image
diameter, rate of thermal energy deposition, total dose, and spectral characteristics of the
source. One must differentiate between a threshold dose—the dose that produces a detectable
burn in 50% of the cases—and the safe dose. For instance, for diameters on the retina of a few
hundred micrometers and exposure times of ~100 microseconds, Ham and associates’ in 1963
found a rabbit threshold of 0.2 cal/cm2, Miller and White's7 threshold on primates was 0.1
cal/cm2, and Allen and associates' (Ref. 5) threshold on rabbit eyes was reported to be 0.1
cal/cm2. Ham's’ safe value was 0.05 cal/cm2.
During the planning stages of Dominic in late 1961 and early 1962, Ham, Ogle, Shlaer, and
Hoerlin conferred repeatedly and accepted a threshold tolerance of 0.05 cal/cm2 for small
image sizes (approximately 50 gm) and exposure durations of microseconds. This tolerance
was based on Dr. W. T. Ham's suggestion at that time that a prompt temperature increase of
10 to 20°C in the affected area—i.e., in the pigmented epithelium—was the tolerance level.*
For theoretical treatments, considering experimental data mainly on rabbits' eyes,
reference is made to work by Hoerlin, Skumanich, and Westervelt,® by Mayer and Ritchey,’
by R. Cowan,10 and the latest, and I believe the most advanced, study by Zinn, Hyer, and
Forest." In the course of these studies, the safe dosage levels were more clearly established. A
temperature rise of not more than 5°C in the 10-gm-thick pigmented epithelium of the retina
is now considered safe. If the temperature rise is 20°C or more, a bum results. This criterion
was then applied to calculate safe dosage levels in terms of cal/cm2 incident on the retina for
different image diameters, exposure times, and source temperatures. Such data are
published:" for instance, 1 cal/cm2 incident over a period of 100 milliseconds and an image
size of 100 micrometers would be safe; however, if a dose is delivered in 10 milliseconds, only
about 0.2 cal/cm2 would be safe. These numbers apply to source temperatures in the 5 000 to
15 000 К range.
Most of these data apply to sea-level or near-sea-level explosions, when the important
radiating temperatures are in this particular regime. At higher altitudes, the physics of light
emission is different. There was already an indication of such a difference at the time of the
HA shot during Operation Teapot. All visual observers (with goggles) agreed that the fireball
appeared more intensely bright than in events of similar yield fired at lower altitude.
As discussed briefly in Chapter П of this report, the optical power versus time history of
high-altitude explosions changes with altitude. Generally, with increasing altitude, the
thermal-pulse duration decreases; i.e., the flux rate increases, and thermal conduction in and
near the retinal image is consequently less effective in reducing the temperature increase.
This effect is of moderate significance for the low-yield, moderate-altitude events HA, John,
and Yucca. It is very significant for the 50- to 150-km altitude domain of Orange, Bluegill,
Teak, Kingfish, and Checkmate. In the latter cases, the thermal-pulse durations are of the
same order of magnitude or shorter than the natural blink period which, for the average
person, is about 150 milliseconds. Furthermore, the atmospheric attenuation is normally
*The pre-Dominic notes report about "threshold tolerance" and "tolerance level." What was
probably meant is “threshold dose."
12
much less for a given distance than in the case of sea-level or near-sea-level explosions.
Consequently, the eye-damage hazard is more severe. Fortunately, the seriousness of this
problem was recognized during the early planning stages of the Teak and Orange events. It
seems worthwhile to document that phase of the eyeburn hazard and its operational conse-
quences separately in one of the following sections.
At still higher altitudes, as with the Starfish event (400 km above JI), the fireball
phenomenology is changed again: the main thermal x-ray energy radiated by the source has a
very long mfp and is absorbed over a very large volume of air at about 100 km altitude, thus
producing mainly air fluorescence, little heating of the air, and relatively low radiance—i.e.,
low optical power per unit area, with no hazard from this source. The fraction of the total
energy release that resides in the internal energy of the expanding bomb debris, part of which
is emitted in a sharp pulse, is not insignificant. However, the source is small, and at distances
of 400 km and more ij: is not resolved by the eye. Thus, the burn hazard is lower at the greater
altitudes. The prediction of the thermal output from this source as a function of time and
diameter was done by Longmire. The pre-event concern about possible effects on observers in
the Hawaiian Islands* was resolved after careful review of the problem. There could be no
above-threshold exposure in the Islands, and indeed no eye damage nor other physiological
inconveniences were reported. The burst was observed from several beaches and mountain
tops at slant distances in excess of 1 000 km.
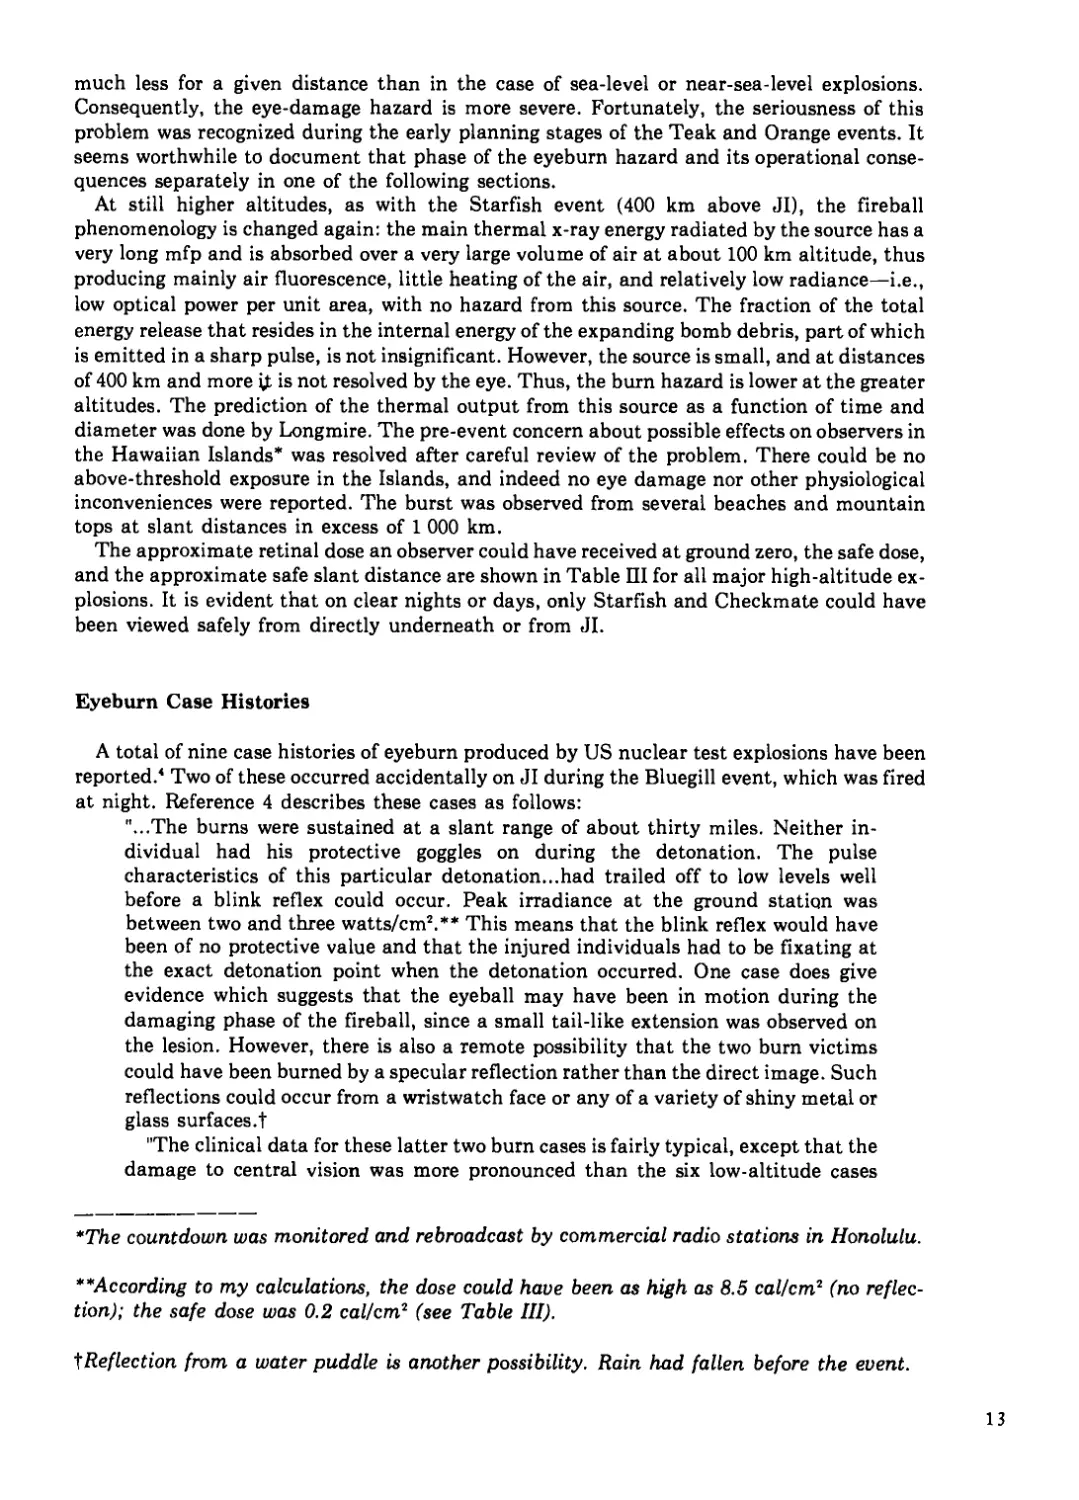
The approximate retinal dose an observer could have received at ground zero, the safe dose,
and the approximate safe slant distance are shown in Table П1 for all major high-altitude ex-
plosions. It is evident that on clear nights or days, only Starfish and Checkmate could have
been viewed safely from directly underneath or from JI.
Eyeburn Case Histories
A total of nine case histories of eyeburn produced by US nuclear test explosions have been
reported.4 Two of these occurred accidentally on JI during the Bluegill event, which was fired
at night. Reference 4 describes these cases as follows:
"...The burns were sustained at a slant range of about thirty miles. Neither in-
dividual had his protective goggles on during the detonation. The pulse
characteristics of this particular detonation...had trailed off to low levels well
before a blink reflex could occur. Peak irradiance at the ground station was
between two and three watts/cm2.** This means that the blink reflex would have
been of no protective value and that the injured individuals had to be fixating at
the exact detonation point when the detonation occurred. One case does give
evidence which suggests that the eyeball may have been in motion during the
damaging phase of the fireball, since a small tail-like extension was observed on
the lesion. However, there is also a remote possibility that the two burn victims
could have been burned by a specular reflection rather than the direct image. Such
reflections could occur from a wristwatch face or any of a variety of shiny metal or
glass surfaces.!
"The clinical data for these latter two burn cases is fairly typical, except that the
damage to central vision was more pronounced than the six low-altitude cases
*The countdown was monitored and rebroadcast by commercial radio stations in Honolulu.
**According to my calculations, the dose could have been as high as 8.5 cal/cm2 (no reflec-
tion); the safe dose was 0.2 cal/cm2 (see Table III).
^Reflection from a water puddle is another possibility. Rain had fallen before the event.
13
TABLE III
RETINAL DOSE AT GROUND ZERO, SAFE DOSE, AND
APPROXIMATE SAFE SLANT DISTANCE
Event* Ground Zero Approximate Safe Slant Distance (km) Eye Adaptation
Estimated Doseb (cal/cm2) Safe Dose (cal/cm2)
HA 3.2 0.5 30 Daylight
John 4 0.9 25 Daylight
Yucca 1.7 0.6 100 Daylight
Teak 23 0.2 720 Night
Orange 50 0.4 2° Elevation6 Night
Starfish Safe any distance larger than 400 Night
Checkmate Safe any distance larger than 200 Night
Bluegill 8.5е 0.2 2° Elevation" Night
Kingfish 0.1 0.04 200 Night
Tightrope 20 0.3 250 Night
“For burst altitude and approximate pulse duration, see Tables I and П.
bFor observer at ground zero.
cOn Johnston Island, slant range ~60 km.
"From sea level.
cited previously. In the first case, acuity for central vision was 20/400 initially, but
returned to 20/25 by six months. The second victim was less fortunate, as central
vision did not improve beyond 20/60. The lesion diameters were 0.35 and 0.50 mm*
respectively. Both individuals noted immediate visual disturbances, but neither
was incapacitated. In a recent review12 of these two cases, the fact that
chorioretinal bums on or near the fovea do not necessarily cause complete
blindness was emphasized. Both size and location of the lesion determine visual
impairment."
The recent review12 referred to above describes in considerable detail the observation of the
two patients by ophthalmologists during more than 6 months, first at Tripier General
Hospital and later at the USAF School of Aerospace Medicine. After 6 months, the Air Force
sergeant (Case No. 1) performed unusually well in his job and had minimal subjective com-
plaints. "His reading ability was good; when he held his eyes stationary, he was aware of a
very small central negative scotoma which blanked out individual letters." "The U.S. Navy
petty officer (Case No. 2) was not as effective in his assigned duties, and his visual findings
were somewhat more severe than those of the Air Force sergeant." In this case
"...the fovea was destroyed, and there is no doubt that more energy was absorbed."
"... He has been discharged by the Navy with a disability ratable at 30%; however, there are
many gainful occupations that he can perform very capably."
*According to my calculation, the diameter of the "hot" image on the retina was 0.35 mm for a
focal length of 15 mm.
14
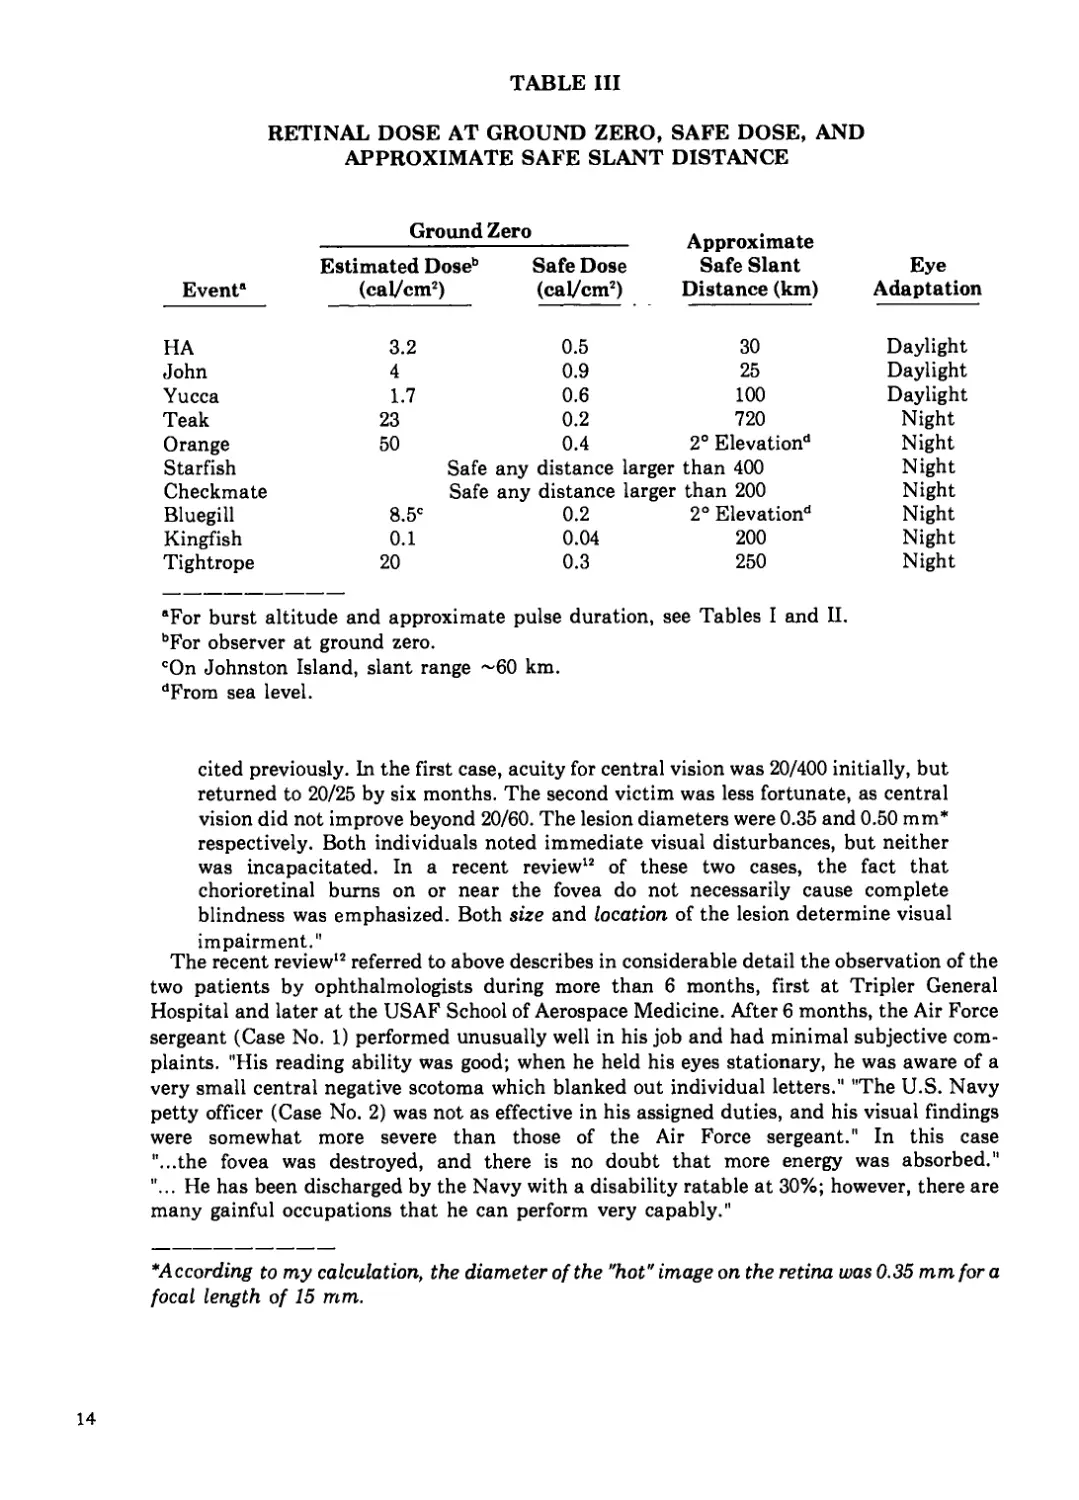
Teak Eyeburn Hazard and Operational Problems (A Historical Review)
According to available records, the Teak eyeburn problem was first discussed on May 11,
1957, during a meeting at the Control Point, Mercury, Nevada Test Site (NTS), with W.
Ogle, H. Stewart, and H. Hoerlin participating (entry in Hoerlin's notebook dated May 11,
1957). The eyeburn hazard was considered to be serious. The consensus was that further
study was needed. It was felt that dark goggles were certainly needed at Rongerik, an in-
habited atoll 250 km from Bikini. The seriousness of the problem was subsequently relayed to
the Eniwetok Planning Board meeting at NTS on May 14, 1957, by Ogle. On June 29, 1957,
H. E. Parsons (a Department of Defense [DOD] representative at the Eniwetok Planning
Board) wrote to A. Graves of the Los Alamos Scientific Laboratory (LASL): "An evaluation of
the flash blindness hazard has not been attempted for lack of understanding of the
phenomena affecting brightness...."
In July and August, H. A. Bethe delivered a series of some 10 lectures at LASL to J-
Division staff members on the-physics of megaton-range high-altitude events.13 On the basis
of these discussions, theoretical calculations of the Teak phenomenology were started in
Group J-10, mainly by A. Skumanich and F. Jahoda. First data were obtained November
1957. Preliminary calculations of anticipated fluxes on the retina of the dark-adapted eye
directly under Teak predicted a dose of 27 cal/cm2 during the blink period of 150 millise-
conds, with a possibility of a hotter spot in the center. The damage threshold was then
believed to be 3 cal/cm2 (entry in Hoerlin's notebook dated January 17, 1958). More advanced
theoretical numbers were reported by Skumanich on March 3, 1958.14 On March 13, 1958, W.
Ogle sent a telegraphic message to General A. Luedecke, the Task Force Commander,
pointing out the seriousness of actual eyebum danger: the possible danger radius at sea level
was quoted to be 540 miles on exceptionally clear days. This message was supplemented
shortly afterward by two Hardtack eyeburn documents written by W. Ogle.16 The main con-
cern of the Task Force was protection of the Marshall Island natives. Approximately 11 000
Polynesians lived within 400 nautical miles of Bikini Atoll, where the event was planned to
take place. Their main livelihood is fishing, frequently at night. The probability of their
observing the rocket launch, following the track, and then being focused at or near the burst
point was considered high. It was also felt that it would be impossible to keep all the natives,
dispersed over 20 inhabited islands, under control and/or equip them with goggles. Conse-
quently, on April 9, 1958, the decision was reached to move the Teak and Orange events to the
practically unpopulated JI area. (It is not clear to me at this time who was involved in the
decision. The high-altitude events were proposed by the Department of Defense [DOD], more
specifically by the Air Force. The Nuclear Panel of the Scientific Advisory Board of the Air
Force was probably the driving force. The Joint Chiefs of Staff had to approve the general
schedule. The Air Force Special Weapons Project [AFSWP], located at Kirtland Air Force
Base, was the DOD's executing agency. The Atomic Energy Commission [AEC] was in-
volved, but so far as I know mainly as a needed participant. In any case, the move to JI was
requested by W. Ogle, the Scientific Deputy of the Task Force; and the decision to execute
the move was made by the Commander of the Joint Task Force.)
As to more technical details, in arriving at a danger radius of 540 miles, we considered a
variety of assumptions, such as daylight versus nighttime firing, and "high" and "probable"
atmospheric transmission. Some burn thresholds (cal/cm2) for rabbit eyes were known, from
Dr. W. T. Ham's work,8 as functions of image diameters and exposure times. Several source
diameters, thermal yields, and durations of the thermal pulse were assumed. In the end, the
conservative approach was taken—namely, a source diameter of 4 km and a pulse duration of
30 milliseconds; 3 cal/cm2 were taken as the "maximum allowable dose" for the retinal image
size at 540 miles horizontal distance from ground zero for nighttime conditions and an excep-
tionally clear atmosphere.
15
As discussed in a preceding section, in the years following Hardtack the problem was
treated in greater depth. This work, much of which was done on primates (rhesus monkeys),
led to a reduction of the threshold and safe dose exposure. We believe now that irreversible
damage occurs for a temperature increase of 20°C, while a 5°C temperature rise is safe. Ap-
plying these criteria to the Teak case, the threshold (20°C) dose at ground zero would reduce
from 3 cal/cm2 to 1 cal/cm2 on the retina and the safe dose to 0.2 cal/cm2. Then, taking the
postevent source data and assuming an exceptionally clear day, the safe slant distance would
have been 450 statute miles.
16
CHAPTERIV
EFFECTS ON RADIO COMMUNICATIONS.
General
Ionization produced by the high-altitude events caused degradation of radio communica-
tions over large areas of the Pacific. The most severe effects occurred after the Teak and
Orange events; they were less severe after Starfish and relatively moderate as a consequence
of Checkmate, Kingfish, Bluegill, and Tightrope.
The ionization was caused mainly, but not exclusively, by fission-product gamma rays,
and, in more local areas, by beta radiation. The extent and intensity of ionization was
governed by the location of the debris and by the fission yield. When the debris rise from the
burst location to higher altitudes, they spread in space, and the gamma rays, because of their
long mfp, cover increasingly larger geographic areas. The debris cloud as such is also highly
ionized because of the short range of the beta particles, although many betas escape and
produce ionization in conjugate areas.
The Teak and Orange events had the highest yields. The Teak debris rose relatively fast,
reaching altitudes of 500 km in about 20 minutes. Little direct quantitative information
about the subsequent motion exists, but both the actual debris cloud and the associated
gamma-ray effects were sources of serious communication blackouts in the South Pacific,
New Zealand, and Australia, mainly in the MF* and HF* ranges. Some details are described
in later sections.
The Orange debris rose more slowly from its lower burst altitude. Therefore, it took longer
to affect the D-layer horizon. The onset of severe degradation was delayed, but after it occur-
red it was as strong as and generally of longer duration than after Teak. The main body of
these debris rose to 150-250 km altitude; however, there are indications that fractions rose
higher, perhaps to 500 km.
The communication interference patterns after Starfish were different from those en-
countered after Teak and Orange. There was little delay in the onset of the initial absorption.
This difference is caused by the differences in burst altitude. While the x-rays emitted by the
Orange and Teak devices deposited their energies in the air close-in, the Starfish x-rays
traveled long distances. The effects of their prompt energy deposition in the upper D-layer
and of gammas at 25-30 km were not very long-lasting. We assume that about 30% of the
debris were then spread over diameters of 1 000 km or more near the burst altitude, acting as
fission-product gamma-ray sources. Another 30% each of the debris moved along the
magnetic field lines to the northern and southern conjugate areas where large debris patches
★Nomenclature used by communication engineers:
VLF - Very Low Frequency <30 kHz
LF - Low Frequency ~30 kHz to 300 kHz
MF - Medium Frequency ~300 kHz to 3 MHz
HF - High Frequency ~3 MHz to 30 MHz
VHF - Very High Frequency ~30 MHz to 300 MHz
17
(~500 х 1 000 km initially) were formed, producing near this space large volumes of ioniza-
tion by fission beta particles; the gamma rays produced lower but still significant ion den-
sities over still larger volumes. Later, the debris patches were observed to rise from the con-
jugate areas, and to spread over still larger areas of the Pacific. Thus, the Starfish debris
space-time history differed significantly from the Teak and Orange histories.
While D-layer absorption of radio frequencies was the main cause of the communication
blackout, it is interesting to note that long-distance VHF transmissions improved after all
three events in several areas, particularly at night, because of the increased electron densities
in the E- and F-regions.
The following sections provide details of the interferences. The literature for the Teak,
Orange, and Starfish events is so extensive that only a selection of the most severe and in-
teresting occurrences is made here. Very little has been published in the open literature on
communication problems after the other events. The effects were of a more local nature, and
the fact that precise yields and altitudes remain classified did not facilitate the interpretation
of whatever was observed. A brief description of what has transpired will, however, be given.
Teak and Orange Effects
Johnston Island. After the Teak burst, the island communications were cut off for many
hours; unfortunately, I have been unable so far to find detailed records. However, I was pre-
sent on the island and remember not so much the difficulties encountered by the JI com-
munication people in making contact with the outside world but rather the desperate at-
tempts of other transmitting stations to obtain a response from JI. One of the first transmis-
sions actually received at JI in the morning hours after the event was "Are you still there?"
Honolulu had serious difficulties in maintaining air travel services. Indeed, they had to be
suspended for many hours because of the failure of long-wave communications. H. P. Wil-
liams18 provided the following summary:
Hawaii.
LF and MF Propagation. A serious interruption of LF and MF transmission occurred.
Below 1 MHz, the nighttime absorption continued for three days. Above this frequency, the
absorption had decreased by the next night. This applies to Teak. In the case of Orange, the
persistence was reduced to one day.
HF Propagation. A complete blackout started at about 20 minutes after the explosion in
the case of Teak and at plus five hours after Orange.
VHF Propagation. There seems to be no mention in the unclassified literature of the ef-
fects of Teak and Orange on VHF ionoscatter propagation. The possible effects are discussed
by Williams18 in the light of known solar-flare events. He concludes that after shots of the
Teak and Orange type, absorption of VHF frequencies in the D-region increases. While scat-
tering at altitudes of ~90 km increases, cosmic noise decreases; thus, the signal-to-noise ratio
improves. It is concluded, therefore, that VHF links using ionoscatter or meteor-scatter
propagation would have escaped the severe blackouts experienced with MF and HF trans-
mission.
Ionosonde Data. The National Bureau of Standards (NBS)17 operated an ionosonde at
Maui, Hawaii; vertical-incidence ionograms were obtained routinely every 15 minutes in the
frequency ranges from 1 to 25 MHz. After Teak, "complete blackout"—ie., no reflected signals
above 1 MHz—occurred from H + 25 minutes to H + 3 hours and again at H + 4 hours for 15
18
minutes. After Orange, "total blackout" occurred at H + 5 hours and 15 minutes, lasting for 2
hours; and partial to complete blackout lasted for another 2 hours and 45 minutes.
South Pacific Data. G. C. Andrew18 reports as follows:
Teak.
MF - HF: At Rarotonga* nighttime reception of MF broadcast stations was impossible
for some five days after Teak. There was a complete blackout of all communication frequen-
cies in use for commercial aircraft and broadcasting services.
VHF: However, "phenomenally good high frequency communication" became possible
because of the abnormally high ionization density in the F-layer. Signals on 30 MHz and
above were heard over long distances even at night.
LF: Low-frequency radio signals were also heard during daylight hours over long dis-
tances.
Orange.
MF - HF: After Orange, absorption of MF broadcast-station signals was even greater
than that following Teak. A complete blackout of these stations lasted for a week. The fade-
out of HF radio signals in the Pacific lasted, however, for a shorter period. In Australia,
periods of severe attenuation of MF sky-wave signals occurred, lasting one or two days and
extending from the 2nd to the 10th day after each explosion.
VHF: On the other hand, the first two-way contacts ever established on 50 MHz between
Rarotonga and Hawaii, a distance of about 5 000 km, were made over a path of complete
darkness, "presumably because the atomic explosion produced clouds of high ionization that
extended or drifted over an area sufficiently large to permit multiple-hop propagation."”
Near Wellington, New Zealand, the BBC transmissions from England and the relay sta-
tions in Singapore at frequencies between ~21 and 26 MHz were enhanced at various periods
after the Teak and Orange events.
Communication Links Across the Pacific. Obayashi, Coroniti, and Pierce” published
changes in signal strength over the HF links from Japan to Honolulu and to San Francisco.
Williams18 summarizes the main features as follows:
Japan-Honolulu
(10 MHz)
Teak
Orange
40 db drop
for 6 hours
20 db drop
after 5 hours
Japan-San Francisco
(14 MHz)
40 db drop
±20 db
±10 db
variation
*Rarotonga is at the southern end of the Cook Island group, at ~20°S, almost straight south
of the Hawaiian chain.
19
There exists additional specific information in the literature. The important fact is that not
only channels passing in the vicinity of JI but also channels at very large distances from the
burst area were affected, indicating strong disturbances from the D-layer up to the F-layer.
For instance, the San Francisco-Japan transmission link passes 3 600 km away from JI.
Starfish Effects
Johnston Island, Northern Hemisphere. In the HF range, total blackout occurred on JI
only for a short time; moderate interference lasted for several hours. Absorption increased at
sunrise.
The debris patch in the northern conjugate area should have affected communications in
the French Frigate Shoal, Midway, and Wake areas; also on board ship—the "DAMP" ship,
for instance. The information reposes in the classified literature.
The signal strength of Radio Australia in Melbourne on 11.7 MHz was measured at Lex-
ington, Massachusetts.20 The short path crosses within 2 300 km of JI, but passes through the
southern conjugate area. First, there was a sharp drop in signal strength by 10 db, lasting two
minutes; then came a 20-db drop (total) for five additional minutes. Recovery after plus
seven minutes was almost complete.
Australia, New Zealand, Cook Island Areas. Apparently, the strongest communication
degradation occurred in this area caused by the motion of a large debris fraction into the
conjugate area21 and its subsequent expansion and drift. The following information has been
extracted from the literature.18
Wellington, New Zealand, monitored countdown from JI at 12.020 MHz. After explosion
time, the JI station was blacked out for the rest of the night.
In the Australia and New Zealand area (Sidney, Aukland, Melbourne), many MF and HF
transmissions were strongly attenuated; signal strengths were down an average of 30 db dur-
ing the first hour, but improved after H + 60 minutes. There was also strong attenuation of
radio signals from Honolulu. For instance, Voice of America directed from Honolulu to New
Zealand and Australia on 9.65 MHz was down 30 db at H + 5 minutes, and down 20 db at H
+ 60 minutes. "Enhanced D-region ionization continued to be apparent for the remainder of
the night, as no distant MF station or HF station below 20 MHz returned to its normal night-
time signal strength."
At Rarotonga, similar effects were observed at MF and in the lower HF range. During the
following nights, New Zealand and Australian MF stations faded out completely, but not the
US Stations.
BBC transmissions to Wellington, New Zealand, were again enhanced in the 15- to 21-MHz
range.
Worldwide Effects. Observations of mostly transient effects of VLF transmissions were
reported from the State of Washington; Boulder, Colorado; Panama; Chile; Wellington, New
Zealand; and many other places. It does not appear that the transient effects posed a serious
communication problem, although it would seem worth while to make a more comprehensive
study of the exact physical sources for these perturbations. Speculations have been advanced
that some of these effects were produced by neutron-decay protons and electrons.22
An increase in the absorption of 30-MHz cosmic radio noise was observed at four stations in
Alaska within two seconds after the explosion, by Basler, Dyce, and Leinbach.23 The authors
believe that the ionization in the lower ionosphere originated at the endpoints of the radiation
belt tubes formed at L = 1.5 to L = 2.0.
20
Other Events
Checkmate. HF interference was serious in the JI area for approximately half an hour.
There was strong-to-moderate HF interference in the Pacific area to distances of ~1 000 km
from JI for one or two hours.
Kingfish. The communication disruptions were widespread and moderately severe. Actual
HF communications to and from JI were out for about three hours. Ionosonde measurements
implied complete blackout of HF frequencies for at least one hour due to heavy absorption in
the D-layer.
There is little information in the unclassified literature, presumably because yield and
altitude are still classified. Interpretation of observations is therefore ambiguous.
Bluegill. Degradation of communications was relatively moderate (compared with Teak,
Orange, and Starfish). It was predominantly local. HF on JI was out for about two hours. Ef-
fects at larger distances were generally small or minimal. Many details are in the classified
literature.
Geomagnetic worldwide effects were, by many orders of magnitude, smaller than for Star-
fish—understandably so, because at low altitude, the particle pressure is the dominant factor
in fireball phenomenology.
Tightrope. Very moderate southern conjugate ionospheric effects occurred. HF Midway-
Palmyra links were not affected (they pass in JI vicinity). There are some details on com-
munication interference during the first hour after the event in the classified literature.
Generally, they were small.
Supplementary Information
It is worthwhile to have a sharper look at the reasons why the communications interference
in the Hawaii area was delayed after the Teak event and more so after Orange.
Let us take Teak, for example. The prompt gamma-ray output was high, nominally 0.2% of
the yield. The arc from the burst point to the D-layer at ~50 km above Honolulu is about
1 200 km long; the shortest approach of the chord to the surface of the earth occurs at an
altitude of 20-25 km. Consequently, the gamma rays had to penetrate about 7 air masses and
were attenuated by a factor of 1 000. Still, the gamma flux is strong enough to generate an
electron density of the order of 10е electrons/cm3, but only for microseconds. The electrons are
removed very quickly by attachment to 02 and more complex compounds. This very transient
increase in ionization was probably unobservable by commercial equipment.
If we look now at the much more steady flux of fission-product beta-rays,24 say at plus one
second after Teak burst time, then the electron density above Honolulu increases only
slightly—namely, by 5 electrons/cm3 at 50 km and by 15 electrons/cm3 at 70 km. Thus, the
density increase in the D-layer is of the order of only 10%.
However, as time goes on, the debris cloud rises. At plus 5 minutes it reaches 400 km,26 and
at about plus 20 minutes, it is 500 km above JI with a horizontal dimension of the same
magnitude. While the gamma activity has decreased substantially, the transmission to the
air above Honolulu has increased by almost an order of magnitude. Furthermore, the
penetration into the D-layer increases, and so does the column electron density because of the
21
steeper look-angle of ~20°. This leads to electron-density increases of one to two orders of
magnitude* above ambient at this time, consistent with the radio-frequency observations.
Concluding Remarks
The communication interference picture as presented in this report is not complete. In a
few instances, attempts have been made to associate specific interferences or blackouts with
the source characteristics, i.e., burst location, debris motion, prompt and delayed radiations,
their attenuation, etc. It would be desirable to present a still better, fully coherent story of the
whole pertinent phenomenology. While today's knowledge of the late phenomenology could
conceivably be improved by putting more bits and pieces together—a tedious task—the full
picture would probably not evolve, simply because of limitations in observational data.
Furthermore, the theoretical treatment of these late phases of the phenomenology and of the
atmospheric interactions is difficult to do with confidence. Nevertheless, the information
gained so far is of great qualitative and semiquantitative value.
*Critical electron densities, electrons/cm3:
30 kHz 300 kHz 3 MHz 30 MHz 300 MHz 10l 103 103 101 103
22
CHAPTERV
THE FORMATION OF ARTIFICIAL RADIATION BELTS.
EFFECTS ON SATELLITES.
Argus
Before the discovery of the natural Van Allen belts in 1958, N. C. Christofilos26'26 had sug-
gested in October 1957 that'many observable geophysical effects could be produced by a
nuclear explosion at high altitude in the upper atmosphere. This suggestion was reduced to
practice with the sponsorship of the Advanced Research Project Agency (ARPA) of the
Department of Defense and under the overall direction of Herbert York, who was then Chief
Scientist of ARPA. "It required only four months from the time it was decided to proceed
with the tests until the first bomb was exploded." The code name of the project was "Argus."
Three events took place in the South Atlantic. Data, yields, and locations are shown in Table
I. Following these events, artificial belts of trapped radiation were observed.
A general description of trapped radiation is as follows. Charged particles move in spirals
around magnetic-field lines. The pitch angle (the angle between the direction of the motion of
the particle and direction of the field line) has a low value at the equator and increases while
the particle moves down a field line in the direction where the magnetic field strength in-
creases. When the pitch angle becomes 90°, the particle must move in the other direction, up
the field lines, until the process repeats itself at the other end. The particle is continuously
reflected at the two "mirror" points—it is trapped in the field. Because of asymmetries in the
field, the particles also drift around the earth, electrons towards the east. Thus, they form a
shell around the earth similar in shape to the surface formed by a field line rotated around the
magnetic dipole axis. The shells are called L-shells; the L-value is the ratio of the distance of
the equatorial crossing point of the field line from the center of the dipole to the earth's
radius. (In reality, the dipole field is somewhat distorted.) The approximate L-values of the
1958 detonations were 1.7, 2.1, and 2.0 for Argus I, П, and III respectively.
The rockets carrying the nuclear devices were launched from shipboard. Measurements
were made by Explorer IV.2’ Additional Argus II data were obtained by sounding rockets.29
The artificial belts formed between L = 1.7 and L = 2.2. This is between the inner and out-
er zones of the natural Van Allen belts. The center of the inner natural zone is between L =
1.15 and L = 1.3; a broad slot of low intensity is located at about L = 2.8, and the center of the
outer zone is near L = 4.5. Because of the presence of energetic protons, relatively little was
known before 1962 about the omnidirectional electron populations in the inner zone. Hess30
gives the following numbers for the 1957 fluxes: E > 40 keV: 3 x 10⁷ electrons/cm2-s; E > 580
keV: 2 x 10е electrons/cm2-s. Numbers are uncertain at least by a factor of three. The fluxes in
the slot region are three to four orders of magnitude lower than those in the inner zone. The
original Argus data were published in terms of count rates; they imply that the fluxes were
about one order of magnitude larger than the natural flux densities in the respective natural
shells. Later, Van Allen31 gave maximum omnidirectional fluxes of 106/cm2-s for Argus I and
II, and 10e/cm2-s for Argus III. These artificial belts were stable for several weeks; belts I and
II were 90 km thick, and belt III was 150 km thick. The electron lifetimes—i.e., the time for
the electron fluxes to decrease by factor e—were 6-10 days for electron energies > 3 MeV.32 In-
jection efficiencies were difficult to derive from Explorer IV data. Estimates vary from 12 to
23
27% for low energies and from 2 to 11% for E > 5 MeV;32 the authors advise caution in the use
of these numbers. For further details, see the review by Cladis, Davidson, and Newkirk in the
"Trapped Radiation Handbook."’2
Unfortunately, the optical photographic coverage of the events was inadequate. Only
recently, some rather scarce photographic records obtained on Argus П and Ш were analyzed,
and the phenomenology was found to be similar to that observed on the Starfish event.33,34 On
Argus III, an electron patch formed at about 65 km and a debris patch near 100 km altitude in
the conjugate area; later on, field-aligned striated ionization was seen at higher altitudes.
The Argus experiments were originally kept classified, but their occurrence and results
were later made public85 because of limited military significance. The purely scientific results
were of greater value. The artificial belts had low electron fluxes, and they did not interfere
with the study of natural phenomena. At least I am not aware of any critical complaints
about undesirable environmental effects.
Teak and Orange
The study of Explorer IV records by Johnson and Dyce38 after the Teak and Orange events
provided evidence for trapped radiation in both instances. The Teak belts were more
pronounced; they lasted for several days and centered at L = 1.2. Radar backscatter data38 in-
dicate that five hours after Teak, the debris cloud of fission products was centered some 600
km west-northwest of JI and that it had dimensions of several hundred kilometers at
altitudes between 100 and 200 km. L = 1.1 to L = 1.2 would intersect this debris cloud at ap-
proximately 200 km. Van Allen31 gives 103/cm2-s as the maximum omnidirectional fluxes for
Teak and Orange. The total number of all electrons trapped in the Teak shell at plus one hour
is estimated to have been ~1020, indicating a very low injection efficiency of about 10"7. For
more details, refer to the "Trapped Radiation Handbook."32
Starfish
This event produced by far the most intense, long-lasting radiation belt. At burst time,
several satellites were in rather low orbits; their apogees were near 1 000 km. At D -I- 1 day,
Telstar was launched into a more favorable elliptical orbit which covered the space up to an
apogee of 5 600 km. Subsequently, several other satellites were launched which provided ad-
ditional data. For a listing, see the "Trapped Radiation Handbook,"32 Sections 6-33.
Because of differences in orbits, spectral coverage, and launch times, the data obtained by
the various satellites did not always agree. However, the maximum electron fluxes were en-
countered between L = 1.2 and L = 1.4; at D + 1-2 days they amounted to ~10v
electrons/cm2-s. In these L-shells, the spectrum was similar to the fission spectrum. At higher
altitudes and L-shells, significant discrepancies between the observations of the satellites in
orbit before explosion time37'38 and of the post-burst Telstar40 became the subject of many
scientific arguments. The Telstar instrumentation had better spectral resolution, and the
measurements extended to high L-values where the fluxes observed were much higher and
softer than were those indirectly derived from the other satellites, which entered high L-space
only at high latitudes. The validity of the interpretation of these Telstar data as owing to
Starfish electrons was questioned, because no pre-event data existed for this part of the
space. The high population could have been due to natural causes, or quite possibly these
low-energy electrons may have been injected from shock-heated air in the exosphere as
postulated by S. Colgate.41 Even today the problem has not been fully resolved. As time went
by, the differences in terms of the total electron inventory narrowed, however. By 1966, the
following picture evolved: Van Allen31 assumed that the nominal yield of fission-decay
24
electrons was 5 x 10²³. This is reasonably close to my number of 7.5 x 10²e derived from Grif-
fin.42 The reported inventories at ~D + 10 hours were
O’Brien et al., Injun I, 1962” 1024
Van Allen, 3 satellites, 1965” 1.3 x 1025
Hess et al„ Telstar, 196240 2 x 10²e
Hess, Brown, and Gabbe40 7 x 1026
(Walt and Newkirk, 197132 7.5 x 1026)
A probable mean number is 4 x 1025, corresponding to an injection efficiency of ~5%. It is
most likely that the injection occurred by way of the strong debris-jets moving across the
magnetic field lines as observed from Christmas Island43 and by a high flying aircraft.44
Debris were observed photographically at altitudes up to 2 000 km and at times between one
and three minutes after the burst (Figs. 6,7).
The decay of the electron population has been treated in considerable detail. Van Allen31
reports that 15% of the total injected survived 5-1/2 months and 10% survived 12 months.
The lifetimes are dependent on electron energies, the shell, and the В-field. Low-energy
electrons have shorter lifetimes. Thus, a fission spectrum becomes harder as time goes by.
Decay at low altitudes is caused by scattering interactions with air; this decay is fast,
roughly about 50 days at 400 km. Decay in the main belt was found to be of the order of about
three months to several years. The decay is caused by coulomb scattering with atmospheric
atoms. The decay at higher altitudes (L > 1.7) cannot be caused by collisions with at-
mospheric constituents. It is believed to be caused by magnetic disturbances, i.e., by interac-
tions with solar-wind-induced electromagnetic waves. While the lifetime at L = 1.7 is many
months, the decay time at L = 2.2 is of the order of one week.
Neutron Decay Electrons. Hess30 reviewed the contribution of Starfish neutrons to the
radiation belt. Neutron half-life is about 1 000 seconds, with decay into protons and
electrons. Calculations lead to numbers of the order of 10° to 107 trapped electrons/cm2-s in
the main Starfish belt. This number is not negligible, but is much lower than the originally
trapped fission-electron fluxes. Some effect on VLF propagation is indicated.
Checkmate, Kingfish, Bluegill
Although some air fluorescence was observed in the southern conjugate area after all three
events, and synchrotron radiation was measured along the magnetic meridian through JI
after Checkmate for a short time, there seems to be no evidence for the formation of artificial
radiation belts of significant lifetime.
Satellite Damage from Starfish Electrons
Ariel. US-UK satellite Ariel was launched from Cape Canaveral on April 26, 1962. Orbit
inclination was 54°, apogee 1 209 km, and perigee 393 km. At Starfish explosion time, Ariel
was at a distance of 7 400 km from JI. After July 13, 1962, four days after the explosion, Ariel
operated only intermittently as a result of the deterioration of the solar cells owing to the ef-
fects of the artificial radiation belts.45
25
Traac. Traac, the research satellite of the Applied Physics Laboratories, Johns Hopkins
University, had operated for 190 days at the time of the Starfish event. The solar-cell power
system had already suffered some degradation in the natural space environment. Traac's
apogee was 1 100 km, perigee 951 km, inclination 32°. Data were received on a reduced
schedule between days 190 through 224, because of accelerated degradation of solar cells.
After day 224, i.e., 34 days after the explosion, the satellite failed to transmit data.46,48
Transit 4B. W. N. Hess40 reports that "...on August 2, Transit 4B stopped transmitting...."
In Table I of the same publication, Traac and Transit 4B are shown to have the same orbit,
i.e., 960 km perigee and 1 106 km apogee and an inclination of 32°. The solar-cell damage
curves in his Fig. 8 are shown to be the same for Transit,40 Traac, and Ariel I. However, Ariel
started to have trouble at plus 3-1/2 days (different orbit, though encountering lower fluxes
than the other two), Transit at plus 25 days, and Traac at plus 38 days. Hess30 has a listing
supposedly of all satellites launched before July 1, 1966, but Transit 4B is not listed.
Cosmos V. Cosmos V was launched in Russia on May 28, 1962. Orbit inclination was 49°;
apogee on July 9 was 1 512 km, perigee 204 km. The article describing results contains only
indirect information on the lifetime of power sources of the satellite.47 Radiation belt data
were taken over a period of four months. The design of the satellite is described in an article
by V. I. Krassovsky et al.48
Injun I, Telstar. Injun I's active life ended in December 1962—apogee 1 020 km, perigee
860 km, inclination 67°. Telstar transmitted through February 1963—apogee 5 600 km,
perigee 955 km, inclination 45°. I have been told that Telstar developed some component
trouble which, however, could be overcome by command to a back-up circuitry, after 80Co ir-
radiation of a mock-up assembly.
The vulnerability of solar cells and electronic circuit components to nuclear radiations has
been treated extensively in the literature. References 32 and 40 are pertinent.
Effects on Manned Spacecraft
This is a complicated subject; the dose received by an astronaut depends on many
variables such as type of orbit (apogee, perigee, inclination), degree of shielding, and duration
of flights. It will be very different for Gemini or Skylab-type flights, which would be seriously
affected by artificial belts, and, on the other hand, for Apollo flights, which are subject only to
transient radiation-belt effects, to solar-wind, solar-flare, and cosmic radiation.
Adams and Mar48 provided daily dose rates from electrons, protons, and bremsstrahlung
for various orbits and for shielding by 0.4 and 2.0 g/cm2 of aluminum. They also refer to ex-
perimental dose measurements made in unmanned satellites as follows:
Peak readings four months after the Starfish explosion occurred at В = 0.16 and L = 1.25
(1 600 km above the equator). They were as follows:
•30 rads/h in a chamber shielded by 4.7 g/cm2 brass,
• 23 000 rads/h in a chamber shielded by 0.4 g/cm2 brass.
Thus, for a satellite in a polar circular earth orbit, the daily dose would have been at the
very least 60 rads in a heavily shielded vehicle at Starfish time plus four months. A cor-
responding maximum dose rate of 0.15 rads/h was measured before the Starfish event by the
heavily shielded chamber in almost the same location (B = 0.2, L = 1.25).
One can also calculate the dose an astronaut in a Skylab-type orbit (roughly circular at 435
km, 50° inclination, 90 minutes per orbit) would receive, say at one week after Starfish. The
maximum dose would amount to ~50 rads per orbit behind 1 g/cm2 and ~5 rads behind 2
g/cm2 of aluminum. This is about 1 000 times the natural dose. The average yearly dose limit
26
recommended by NASA32* for eyes is 27 rads (the eyes are the most sensitive part of the
body). Lifetime total body exposures of 400 rads of penetrating radiation for early space ex-
plorers and up to 200 rads for future space passengers have been suggested as compatible with
a reasonable risk.501 have no numbers for Skylab shielding. The Gemini spacecraft shielding
varied from 1.6 g/cm2 to 7 g/cm2 of aluminum, depending on the solid angle subtended by the
exposed body areas.
For more details, reference is made to the "Trapped Radiation Handbook,"32 to "Status
Report on the Space Radiation Effects on the Apollo Mission,"325 and to "Radiation Trapped
in the Earth's Magnetic Field."51 In addition, W. H. Langham310 was leading an extensive
study of radiobiological factors in manned space flight for the National Academy of Sciences.
Russian Events
The Russians conducted three high-altitude tests in October and November 1962 at high L-
values. Van Allen31 provided the following data:
Date of Burst Nominal Yield Maximum Omnidirectional Intensity at t=0 L-Value of Burst Approximate Mean Lifetime
22 Oct. 1962 Submegaton 107 e/cm2-s 1.9 1 month
28 Oct. 1962 Submegaton 107 e/cm2-s 2.0 1 month
1 Nov. 1962 Megaton 107 e/cm2-s 1.8 1 month
The maximum fluxes of the Soviet belts are two orders of magnitude lower than those en-
countered in the Starfish belt, and are one to two orders of magnitude higher than in the
Argus belt. The short mean lifetime is probably owing to pitch-angle scattering and to loss at
the mirror points.
Response of the Scientific Community
The response was mixed. This subject matter is reviewed separately in Chapter XI.
27
CHAPTER VI
SYNCHROTRON RADIATION AND HYDROMAGNETIC WAVES.
Electrons moving in a circular orbit perpendicular to a magnetic field will be accelerated
and, consequently, emit radiation. Low-energy electrons radiate at the frequency of the cir-
cular motion; this frequency is often called the cyclotron frequency. High-energy relativistic
electrons emit radiation in the direction of the motion of the particle at frequencies higher
than the cyclotron frequency. This is called synchrotron radiation or, sometimes, magnetic
bremsstrahlung.
Synchrotron radiation was observed after Starfish at Central Pacific sites with existing
riometer networks operating in the 30- to 120-MHz range.52 The best data were obtained in
Huancayo, Peru, where a strong burst of radiation was observed promptly after the Starfish
explosion. "Beginning ten minutes later, the original intense tube of emitting electrons ap-
peared again over the Central Pacific, having completed one trip around the globe...."
Synchrotron radiation was also observed at Canton and Palmyra Islands south of JI, but the
onset was delayed; in fact, the natural cosmic noise was first reduced in these areas by D-
region attenuation caused by prompt x-rays. Wake Island, about 2 500 km west of JI,
observed synchrotron radiation at plus 10 minutes after the burst. The radiation was
strongest at the magnetic equator: the intensity fell to half maximum at 12° and to one-tenth
maximum at 20° from the equator. The effect was difficult to detect at radio astronomy sta-
tions at higher latitudes. The intensity decayed slowly with a decay constant of about 100
days, in general agreement with satellite data quoted earlier. The initial electron spectrum
corresponded to a fission spectrum.
It was concluded58 that the radiation is generated primarily at heights above the equator
between L = 1.2 and L = 1.6. Attempts were also made to derive the total number of
electrons with energies >1 MeV that were trapped after the explosion.54
Little is known experimentally about the synchrotron noise produced at lower frequency,
although a British radio astronomer55 conjectures that the artificial radiation "...may be a
hazard to accurate work on the galactic spectrum below 25 MHz."
Magnetic Disturbances and Hydromagnetic Wave Observations
After the Starfish detonation, changes in magnetic field strength and geomagnetic
micropulsations were observed at many stations in North and South America, South Africa,
Australia, and Japan. The changes were of a transient nature; their onset varied from about
plus two to five seconds. The interpretation of the physical processes which caused the distur-
bances is still ambiguous.
One school of thought associates the onset of the perturbations with the arrival of an MHD
wave at the particular location. Magnetic containment of bomb debris results in the
stretching of the magnetic field lines; the stretching of the lines is propagated as a transverse
MHD wave along the В-lines. Therefore, a zero MHD effect would indicate no containment in
the early phases of the detonation. It is well known43 that the initial expansion of the Starfish
debris was contained by the magnetic field. A manifestation of this containment was
observed at three geophysical stations in Peru at distances of 9 000 km from the burst.58 The
magnetic activity at these stations was interpreted as being caused by the arrival of an MHD
wave traveling at a velocity of 5 x 10е cm/s at a height of ~1 000 km. Furthermore, the
magnetic field lines above Huancayo in Peru were sufficiently distorted for a few minutes to
permit an increase in the cosmic-ray flux at the station.
Somewhat similar interpretations were advanced by Stanford University and California In-
stitute of Technology57 researchers. It is stated that "the Alfven velocity-altitude profile in-
dicates that MHD waves can be trapped in a waveguide in the altitude range from 300 to
3 000 km, thus producing resonant oscillations."
The coincidence of geomagnetic field fluctuations and variations in E-layer ionization den-
sity is advanced by another group58 as evidence that the perturbations were caused by in-
teractions of nuclear radiations with the magnetic field and ionosphere. Actually, the E-layer
could be "seen" at most of the reporting stations by the debris jets and by the higher L-shells.
Another interpretation was advanced by Nawrocki,59 who calculated the size of similar
Argus signals and the propagation time in terms of the diamagnetic effect of the thermal
electrons which spiral along the В-lines and give rise to a decrease in the ambient field.
However, there is no reason to believe that the Argus debris expansion was not magnetically
contained initially.
In any case, while observed worldwide, the magnetic disturbances did not seem to interfere
with the normal activities of the geophysical stations; they may have contributed to a better
understanding of somewhat similar natural phenomena, such as the "sudden commence-
ments."
30
CHAPTER VII
ELECTROMAGNETIC-RADIATION EFFECTS ON
ELECTRICAL AND ELECTRONIC SYSTEMS.
(Contribution by John Malik)
The electromagnetic radiation in the radio-frequency portion of the spectrum (EMP) can
cause problems in electronic systems. The pulse from detonations above about 30 km is
caused by the deflection of Compton electrons produced by gamma-ray interaction with the
earth's magnetic field in the deposition region (20-40 km). The resulting transverse current in
the large area of gamma-ray deposition produces a large coherent radiating element. With ap-
propriate yield, detonation altitude, and magnetic azimuth, the electric fields over large
areas at the earth’s surface can exceed 104 V/m. Such fields can cause detrimental effects on
some types of electrical systems. The pulse width is less than a microsecond.
Starfish produced the largest fields of the high-altitude detonations; they caused outages of
the series-connected street-lighting systems of Oahu (Hawaii), probable failure of a
microwave repeating station on Kauai, failure of the input stages of ionospheric sounders and
damage to rectifiers in communication receivers. Other than the failure of the microwave
link, no problem was noted in the telephone system. No failure was noted in the telemetry
systems used for data transmission on board the many instrumentation rockets.
There was no apparent increase in radio or television repairs subsequent to any of the JI
detonations. The failures observed were generally in the unprotected input stages of receivers
or in rectifiers of electronic equipment; transients on the power line probably caused the rec-
tifier failures. There was one failure in the unprotected part of an electronic system of the
LASL Optical Station on top of Mount Haleakala on Maui Island. With the increase of solid-
state circuitry over the vacuum-tube technology of 1962, the susceptibility of electronic
equipment will be higher, and the probability of more problems for future detonations will be
greater. However, if detonations are below line-of-sight, the fields and therefore system
problems will be much smaller.
31
CHAPTER VIII
AURORAL PHENOMENA.
DETECTION OF NUCLEAR EXPLOSIONS IN SPACE.
HYPOTHETICAL EFFECTS ON WEATHER PATTERNS OF ENERGY
DEPOSITION IN THE UPPER ATMOSPHERE.
General
The interaction of nuclear radiations—gamma rays, neutrons, beta particles, x-rays—and
of debris with the surrounding air molecules produces quantities of visible light and
ultraviolet and infrared radiation. Gamma-ray-excited air fluorescence was already observed
at Trinity. Most of the radiation is emitted from excited nitrogen, more specifically by the se-
cond and first positive systems of N2 and the first negative and the Meinel systems of N2+.
The efficiencies for conversion of nuclear emissions into light is low at sea level because of col-
lisional deactivation of the excited states; it is much higher at lower air densities.80 82 Conse-
quently, at higher altitudes, all fluorescence emissions are more brilliant88 and quite spec-
tacular indeed. They have many similarities with natural auroral phenomena, where the
same emissions, excited mainly by auroral electrons, are present.84 To my knowledge, studies
of manmade aurorae did not interfere with normal auroral research activities.
Teak
The Teak event provided the most impressive display; as seen from JI, it was breathtaking.
Excellent documentation was obtained from Mt. Haleakala on Maui by J. Champeny of
EG&G, as reported in Ref. 25 (see Fig. 3). An auroral streamer originating from the debris
mass was clearly visible, moving upwards along the field lines towards the equator. The
northern branch of the aurora was observed from JI and from two aircraft.26 The Maui pic-
tures show the rise of the luminous debris to about 500 km and their late field-aligned struc-
ture; also seen are the luminous-air shock, the debris-air shock, and the debris. The slowing
down of the upward-moving shock between altitudes of 300 to 500 km was interpreted as be-
ing caused by work against the magnetic field, with energy being carried away by MHD
waves. The auroral streamer moving south deposited its energy at the conjugate point were
bright auroral arcs were seen from Apia as reported by Matsushita,” who published a review
of many geophysical effects generated by the Teak and Orange events. The auroral-type dis-
plays after Orange were less spectacular because of the lower burst altitude.
Starfish
The Starfish aurorae were somewhat less brilliant than those following Teak; they were
seen, however, over a larger area. The x-ray-produced fluorescence at the stopping altitude of
~100 km was of very short duration. The surface brightness was not very high, but the total
emitting area directly underneath was in excess of 100 000 square kilometers. Longer lasting
luminous patches of air excited by debris and fission-product beta rays occurred in the
northern and southern conjugate areas. The displays in the south were observed at some 20
33
geophysical and meteorological stations from the equator (Tarawa) down to Apia, in many
places in New Zealand, and even at Campbell Island (53°S).“ Details of all the geophysical
effects were published in 21 papers of a Special Nuclear Explosion Issue of the "New Zealand
Journal of Geology and Geophysics."67 The most interesting result of this survey is the very
large extent of the affected area: debris and debris electrons deposited their energies over
some 40° of latitude in the south (Tarawa observed the luminosity in the overhead tube).
These observations supplement the air-based gamma-ray measurements reported by D'Arcy
and Colgate.21 These auroral observations, together with others taken from airplanes, from
Hawaii, and from Christmas Island, were invaluable in deriving a general physical picture of
the Starfish phenomenology.43 For instance, the optical observations of jets of excited plasma
directed initially along the field lines, but at higher altitudes moving straight across the field
(Fig. 7), provided the information needed to fully understand the formation of the artificial
radiation belts and the ionization and luminosities produced far to the south of the conjugate
area. Starfish was indeed a large-scale demonstration of many principles of plasma and
auroral physics. The results confirmed the anticipation of the scientific usefulness of nuclear
explosions in space as expressed in 1959 by LASL staff.66
Checkmate, Kingfish, Bluegill
Auroral displays occurred in all these events on a smaller scale, both in the burst area and
at the southern conjugate locations.
Detection of Nuclear Explosions in Space
During the moratorium between the 1958 and the 1962 test series, the auroral data ob-
tained on the Teak event were applied to the design and construction of the Los Alamos Air
Fluorescence Detection System for possible clandestine nuclear explosions in space. The
range for detection was R = 105 V Yx kilometers in daylight, where Yx is the thermal x-ray
yield of the explosion in kilotons.8’
Effects on Weather Patterns: Link Between Magnetic and Atmospheric Storms
Generally there has been a great deal of conversation about effects of nuclear explosions on
weather patterns. However, I am not aware of pertinent serious studies, although I have not
made a thorough search of the literature. As to the high-altitude events (and of these, es-
pecially the high-yield explosions), again no information seems to exist. This is not surpris-
ing, since the latent heat in large air masses is much larger than the energy release in a bomb.
On the other hand, recent studies of a possible relationship between certain auroral displays
in the north and weather do not exclude the hypothetical possibility of artificial weather-
modification by nuclear-energy releases.
W. Orr Roberts and R. H. Olson appear to have confirmed a statistical relationship
between the behavior of low-pressure troughs over the Gulf of Alaska preceded by northern
lights and the behavior of those formed and moving in their absence.70,71 They report that dur-
ing winter, low-pressure troughs tend to intensify or deepen, in response to storms in the
geomagnetic field which produce auroras. It is well known that the development of low-
pressure areas in the Gulf of Alaska has a strong influence on North America's weather.
About one-third of these low-pressure systems move into the central United States. Now,
those preceded by northern lights are reported to penetrate about 200 miles farther south and
to bring colder weather with them. "...Although not all large troughs are triggered by northern
34
lights and not all auroras are followed by trough development, the probability of the trough's
intensifying seems to be approximately doubled by the occurrence of a magnetic storm."
More recently the studies by Roberts, Olson, Wilcox, and others72 were extended to the whole
Northern Hemisphere. They relate the vorticity area index, essentially a measure in square
kilometers of the size and prominence of all low-pressure troughs in the Northern Hemisphere
north of 20°N, to weather patterns. The vorticity area index is affected both by the rather
regular sweep past the Earth of the interplanetary magnetic-field sector boundaries of solar
origin and by the more irregular occurrences and magnitudes of solar flares. The maximum of
the local vorticity area index for a sector 60° wide in longitude (i.e., more than the width of
the Gulf of Alaska) is 2 x 10е km2.
While the data collected so far cannot be neglected, the physical explanation of the
statistical relationships is the subject of much speculation.
In this context it is interesting to compare the energy depositions from the precipitation of
natural electrons in an area approximately 500 km in latitude and 2 000 km in longitude with
the energy deposited by a bomb. Typical auroral fluxes range from 1 to 100 erg/cm2-s. Assum-
ing a three-hour display and the highest flux, the total energy deposition in this area would be
1022 erg = 1/4 Mt. Chamberlin reports bombardment energies of as much as ~400 ergs/cm2-s
in a bright aurora (Ref. 64, p. 28); this is equivalent to 1 Mt incident over 10е km2.
The Starfish x-ray energy deposition over a radius of 300 km was about 1/4 Mt, although
the pulse duration was much smaller. Conceivably, a few events like Starfish over the Gulf of
Alaska could add to the statistical studies referred to above. International political problems
and environmental-impact considerations would, however, pose almost insurmountable ob-
stacles to such an exercise, although the use of relatively clean sources, the long residence
time of the debris in the stratosphere, and advance knowledge of communication problems
would soften the impact. The effects on satellites, both by prompt radiation and by short-
lived though weak radiation belts, would be most difficult to prevent or overcome.
The study of the coupling processes between the thermosphere where auroral particles and
x-rays are stopped and the mesosphere, stratosphere, and the upper troposphere—i.e., the
meteorologically important 300-millibar, ~9-km-altitude range, remains a most interesting
unsolved problem of upper-atmospheric physics. Direct injection of condensation nuclei
and/or water vapor into the latter altitude domain would also need to be considered. In this
context, reference is made to recent experimental feasibility studies and speculations about
the initiation of large-scale atmospheric motion by other physical means, such as intense
radio waves, TNT explosions, the kinetic energy obtained by the fall of tons of material into
the upper atmosphere, etc.7’
In any case, the relevance of nuclear-explosion effects to weather modification problems re-
quires much more critical discussion than is attempted in this paper.
35
CHAPTER IX
RESIDENCE TIME OF RADIOACTIVE
TRACERS IN THE STRATOSPHERE. UPPER
ATMOSPHERIC AIR-CIRCULATION PATTERNS.
Injection of I02Rh and I0’Cd
The Orange and Starfish warheads contained special tracer elements created by neutron
activation from the devices. About 3 megacuries (MCi)* of I02Rh were produced in the Orange
weapon;74 this isomer of principal concern has a half-life of 210 days. The main debris mass
rose to an estimated altitude of 150 km, although relatively crude observations from Mt.
Haleakala on Maui Island indicated some debris as high as 500 km.
In the Starfish tracer experiment, 0.25 ± 0.15 MCi of 10BCd were produced.76 Cadmium-109
has a half-life of 470 days. The Starfish explosion occurred 400 km above JI. As discussed
elsewhere in this report, approximately 30% of the debris were initially deposited in the
general burst area; about 30% each were guided by the magnetic field to the northern and
southern conjugate areas, where debris patches were formed at altitudes of 100-120 km. The
heating of the air led to a subsequent rise of the patches. The balance of the debris were
ejected to altitudes of 2 000 km or more. Thus, the major debris masses were initially dis-
tributed evenly in both hemispheres at altitudes between 100 and 200 km.
Observations
Information on the distribution of the debris in the lower stratosphere was obtained from
balloon data up to 28 km, from aircraft observations up to 19.4 km, and from surface
measurements. Kalkstein,74 List and Telegadas,78,77 and others have studied the time and
space history of tracer motion in considerable detail.
Rhodium-102 was first observed in the south in small quantities. Larger, significant con-
centrations were measured in May 1959 near 19.4 km altitude between 45° and 60° south.
The onset of similar concentrations at northern latitudes, same altitudes, occurred four
months later in September 1959, indicating an initial movement of the debris towards the
winter hemisphere; maximum concentrations were measured in the north beginning in
February 1960, remaining constant throughout 1961. In the south, about the same maxima
were reached later, in May 1960, and also remained constant throughout 1961. During this
period, the low-latitude inventories were approximately two to three times lower than those
at high latitudes.
The vertical motion of the 102Rh tracers was faster at high latitudes than at low latitudes.
The first measurable, though small, quantities in the north were obtained at 28 km, in March
1959; by June 1960, the tracer particles had moved to the lower stratosphere at 70° north and
approximately 12.5 km altitude, whereas at 25° north they had descended more slowly to a
height of 20 km.
*0ne curie (Ci) corresponds to 3.7 x 10i0 disintegrations/s.
37
The global inventory of I02Rh as of May 1961 (i.e., 33 months after the injection) was
reported78 to be as follows, in MCi corrected for decay to August 12, 1958:
Deposition
Troposphere
Stratosphere to 21 km
Stratosphere 21-31 km
Unaccounted
-0.02
-0.05
-0.48
-0.50
-2.00
Cadmium-109 was first observed by the AEC's balloon-sampling program in December
1962 at 35 km altitude in the south and several months later in the north.76 On the whole, the
observations confirmed the results suggested by the 102Rh tracer motion; but in this case, the
concentrations measured at high latitudes both in the north and the south were up to 10 times
higher than in the equatorial areas. Latitudinal cross sections of mean seasonal t09Cd
stratospheric concentrations as a function of altitude for the period December 1962 through
August 1966 were published by Telegedas et al.77,79,80 Among others, a group of Russian
workers81 measured I09Cd fallout on the ground with large collectors at four places in the
Soviet Union (Moscow, Tbilisi, Vladivostok, and Arkhangelsk) during 1964-1967.
Residence Time
It is perhaps well to begin by defining "residence time." Most authors are rather lax in their
use of this term. Mean stratospheric residence time is normally defined as "the average time
spent by radioactive debris in the stratosphere" before it is transferred to the troposphere. I
presume that this is the time for concentration to drop by factor e. Half-residence time is also
sometimes used. The mean residence time in the troposphere is generally taken as 30 days;
removal is mainly by rain-out.
Kalkstein74 derived a high-altitude l02Rh tracer "residence" time of "roughly ten years."
Volchok82 assumed a model atmosphere above the tropopause consisting of two atmospheric
layers. On the basis of I02Rh, the region above 21 km has a half-time for removal of 10 years;
the removal half-time from the lower stratosphere is taken as 2 years. On the basis of the I09Cd
data, Volchok obtained a similar model for the period of 2-3 years after the explosion, again
10 years for the half-time in the upper stratosphere but only 1 year for the lower stratosphere.
The Russian workers Leipunskii et al.81 generally agreed with the US interpretation and con-
cluded that "finely divided aerosols injected above 100 km are removed from the upper at-
mosphere with a half-time of about ten years and a mean residence time of fourteen years."
It is important to make a clear distinction between injection at altitudes of >100 km by
high-altitude explosions and injection into the lower stratosphere by cloudrise from megaton
explosions at or near the surface. In the latter case, the residence times of fission products in
the lower stratosphere are much shorter than for those transported to altitudes of >100 km.
The debris clouds of megaton-size explosions rise to altitudes of the order of 20 km and
penetrate the tropopause into the lower stratosphere. The UN document of 1972“ quotes the
following residence times:
• Lower Polar Stratosphere, 6 months
•90Sr, Lower Stratosphere, 1-1.2 years.
The fallout characteristics of 9°Sr, half-life 27.7 years, have been extensively studied
because of its biological significance. The numbers differ somewhat from author to author; for
instance, for low-altitude bursts, Fabian, Libby, and Palmer84 obtained a stratospheric
38
residence time of 1.6 years. Also for low-altitude, high-yield bursts, Peterson66 reports half-
residence times of five months for injections into the lower polar stratosphere and two years
for injections into the "upper polar stratosphere," the latter from the Russian 1961 test series.*
I believe it is safe to say that residence times of debris injected into the lower stratosphere
are of the order of 1-2 years, in contrast to residence times of 14 years for injections at 100 km
or more.
Stratospheric Circulation
The first generalized model of the circulation of the 102Rh tracer was developed by
Kalkstein74 in 1962. Stebbins86 confirmed, as a result of the DOD's High Altitude Sampling
Program (HASP), Kalkstein's AEC Health and Safety Laboratory (HASL) data. He agrees
with Kalkstein, namely that "it appears that the 102Rh is being brought down from its original
injection site by strong vertical mixing in the polar stratosphere during the winter season....
The I02Rh in the tropical atmosphere probably reached there through downward mixing in the
polar stratosphere and then lateral mixing to the tropical stratosphere." Stebbins also reports
that particles as small as 0.001 micrometers in diameter fall from 300 km to 80 km in a matter
of days and that the fall rates begin to decrease markedly once these particles reach the
denser air of the mesosphere. Subsequently, Telegadas and List,76 also generally agreeing
with Kalkstein and Stebbins, suggest that debris injected at very great heights over the
equatorial region descend into the polar stratosphere and are subsequently propagated
downward and equatorward. They find that north of 35°N, between 14 and 20 km, the
downward movement in the winter months is of the order of 1.5 km per month; they suggest
that mass movement rather than vertical diffusion is the dominant mechanism. Volchok,82
besides obtaining residence times of debris as reported earlier, developed a worldwide fallout
model for high-altitude explosions, accepting the stratospheric motion interpretations of his
colleagues. Several years later in 1969, using l02Rh, 108Cd, and 2S8Pu as well as some fission-
product data, List and Telegadas77 concluded: "The tracer data indicate a summer-to-winter
hemisphere flow above about 37 km and a mean descending motion in the winter stratosphere
between 25° and about 70°. Ascending motion occurs near the equatorial tropopause and in
the lower winter stratosphere poleward of 70°. Virtually the entire summer stratosphere and
the winter stratosphere equatorward of 25° between 18 and 25 km is dominated by mixing
processes with no evidence of organized circulations in the meridional plane." They deduced a
schematic representation of stratospheric circulation which is reproduced here (Fig. 8). List
and Telegadas state that the tracer data should not be ignored in the process of constructing
models of the large-scale circulation features of the stratosphere from other considerations.
Later, Machta, Telegadas, and List67 provided further support for this statement.
Finally, Krey and Krajewski88 developed "a semi-empirical box model of atmospheric
transport that permits the calculation of stratospheric inventories, surface air concentrations,
and deposition of debris injected into the stratosphere, mesosphere, or higher levels. The
model divides the atmosphere of each hemisphere into three compartments; the atmosphere
above 21 km, the stratosphere below 21 km, and the troposphere. The transfer between com-
partments follows first-order kinetics, although the season and height of injection regulate
the onset of the transfer. The model adequately computed the fallout parameters of the
specific injections of I02Rh, I08Cd, 238Pu, and 80Sr from the 1961-1962 tests, and of 80Sr from the
sixth Chinese nuclear test in June 1967. It also predicted the 1969 fallout from the recent at-
mospheric tests."
*Peterson'sBB half-residence time for 13BPu resulting from the burnup in 1964 of a nuclear-
powered satellite at 46 km above the Indian Ocean is 3.5years. Note that these debris, in con-
trast to those of high-altitude explosions, were not subjected to an upwards thrust.
39
Fig. 8.
Schematic representation of the stratospheric
circulation as deduced from radioactive tracer
data. *
It remains to be seen whether or not observations of radioactive tracers and their in-
terpretations have made an impact on the science of global atmospheric and stratospheric
physics. In 1968, fallout samples from high-altitude explosions became too small to be of
further use, and the number of pertinent publications decreased after 1972. The US National
Report to the International Union of Geodesy and Geophysics for the years 1971- 1974е’ does
not seem to take cognizance of the earlier work—probably because the report concentrated on
research done during a later period. On the other hand, Reiter, in "Atmospheric Transport
Processes," an AEC publication,” refers extensively to radioactive-tracer observations when
discussing strong vertical mixing processes of stratospheric air via the jetstream into the
troposphere. Very recently the same author’1 utilizes the worldwide observations of the mo-
tion of the tracers in a more detailed review of the exchange of air masses between
troposphere and stratosphere.
Carbon-14
All nuclear explosions produce amounts of l4C. The 1969 UN report on the effects of atomic
radiation’2 provides data on the stratospheric and tropospheric content in both hemispheres.
While the concentrations in the northern hemisphere have gradually decreased from 1963 to
1967, they remained essentially constant in the southern hemisphere as a consequence of
interhemispheric mixing. In 1967, the tropospheric content of explosion-produced I4C was
about 65% of the natural level. Naturally produced 14C originates also mainly in the
stratosphere. The stratospheric residence time of bomb-produced I4C is quoted as two to five
*Reference 83 also shows circulation patterns for the troposphere and the lower stratosphere
derived from low-altitude megaton-size explosions. Cloud tops and bases as functions of yield
and latitude.
40
years.” A fraction of this was produced by high-altitude explosions. (In the same context, the
residence time of ®°Sr is reported to be one to two years!)
I understand that researchers doing I4C dating need to make certain corrections in their
analyses for bomb-produced l4C (Ref. 93).
Bromine
In view of the current controversy on the effects of halogen gases on natural ozone and
because of highly confused recent press reports which claim that injection of a few kilograms
of bromine gas into the stratosphere would seriously affect the ozone concentration, John
Zinn and I looked into the matter of bromine production by fission. The fission product chain
yield for stable elBr is of the order of 3 x 10"’ (courtesy W. Sedlacek and K. Wolfsberg); thus
1 Mt of fission produces about 65 g of bromine, and 200 Mt (the estimated fission yield of all
the 1961-1962 atmospheric tests) yields about 13 kg 8lBr. According to A. L. Lazrus et al.94
and personal communication by W. Sedlacek, the mass mixing ratio of bromine/air in 1974
was about 8 x 10"12 g Br per gram air at altitudes of the order of 25 km, or a total worldwide
content of 10® kg Br in a 5-km-thick stratospheric volume near the peak of the ozone layer.
Thus, stratospheric injection of nuclear-explosion-produced bromine or of any other type of
kilogram-size bromine injection has no additional effect whatsoever. Fission-produced iodine
is roughly 10 times as abundant as bromine, but its injection is also insignificant compared
with the current worldwide inventory of bromine and chlorine; furthermore, while the iodine
reaction rates with O3 and its catalytic effects do not seem to be known well at this time, they
are probably of the same order of magnitude as those of other halogens.
Local Fallout
No significant local fallout or induced activity was observed on any of the high-altitude
events.
41
CHAPTERX
HOLE IN THE OZONE LAYER AFTER TEAK AND ORANGE?
In late 1957 and early 1958, the question was raised as to whether or not the ultraviolet
emissions from the Teak and Orange events would "bum a hole" into the natural ozone layer.
The pre-event discussions’5 were inconclusive. It was recognized that the ultraviolet radiation
in the photon energy range from 4 to 6.5 eV (~3 000 A to 2 000 A) would be absorbed by Os,
leading to dissociation; however, absorption of still shorter uv radiation in the range from 6.5
to 11 eV (~2 000 A to 1 000 A) in the Schumann-Runge continuum would lead to dissociation
of O2 and subsequent formation of ozone. The general feeling was that destruction and forma-
tion would balance each other. This feeling was strengthened by the fact55 that significant
amounts of ozone are produced in sea-level explosions. Furthermore, it was argued that even
in case of complete destruction of the ozone layer over an area with radius 50 km, the ozone
loss would amount to only 2 x IO-5 of the global inventory. The "hole" would be closed
promptly by bomb-produced turbulence and ambient motions in the atmosphere.
After the events, little attention was paid to this particular problem, evidently because no
spectacular or unusual observations were made (because of lack of evidence one way or the
other). A recent re-inspection of spectra taken by NRL with quartz optics showed, for both
Teak and Orange, the usual cutoff near 3 000 A.
After the event, the Teak fireball uv outputs were calculated at LASL by Skumanich, using
the best air opacities available at that time. The calculations show that, during the main
radiative phase, about equal amounts of thermal energy would be captured by ozone and by
the Schumann-Runge continuum of O2. However, the ozone-destroying process and the ozone
formation by dissociated molecular oxygen have different altitude dependence. A precise
treatment of this problem would be a desirable and certainly possible task. It would require
application of fireball phenomenology, energy deposition, and air chemistry codes. In the
absence of such calculations, it still appears that destruction and formation balance each
other. The NOX formed inside the fireball was carried to altitudes in excess of 100 km and was
probably not very effective in attacking the natural ozone layer. No pertinent calculations
were done for Orange. The medium-yield Bluegill event, also fired above the ozone layer, was
thoroughly analyzed. No emission was observed below 3 000 A. Calculations of the uv-
integrated power at wavelengths below 3 000 A did not permit definite conclusions. In any
case, it appears that the US high-altitude tests with a total yield of the order of 10 Mt had
very little (if any) effect on the natural ozone layer.
This is understandable in view of the results of numerous recent theoretical studies relating
variations of the natural ozone in the years 1961-1964 to the massive nuclear tests of this
period. Much of the NOX produced by a total energy release of about 340 Mt, mainly from the
Russian test series in Novaya Zemlya, was carried close to and into the ozone layer. The
precise effects are still under dispute; they are partially obscured by natural fluctuations. A
temporary depletion of about 6% is the highest number which has appeared in the
literature;’7 however, other investigators’8 feel that the fluctuations observed during the
critical period lie within the probable error of available ozone measurements.
43
CHAPTER XI
CONCERN ABOUT ENVIRONMENTAL EFFECTS OF STARFISH-TYPE
EXPLOSIONS: BRITISH AND US-NASA REACTIONS IN 1962.
SCIENTIFIC VALUES IN RETROSPECT.
In May 1962, Sir Bernard Lovell, Director of the Radio Astronomy Laboratories, Jodrell
Bank, delivered an address before the British Institute of Strategic Studies on the "Challenge
of Space Research."” After viewing the scientific dividends of space research in the brief
period since 1958, he deplored the inability of British participation in major space-based ac-
tivities and suggested "a new outlook and a new budget on the biggest possible scale." He
praised the realization of the new situation by the USA, "because it is evident, that the battle
between East and West is seen by the USSR as a conflict in the field of science and
technology. This issue has been joined by the Americans...." However, he goes on to say:
"May I conclude by saying that in spite of this enthusiasm which I display and
this optimism for the future of scientific research I must confess that my belief in
the inevitability of prograss has been very considerably undermined during this
past year by the realization that some of the American and probably some of the
Russian space activities are not being guided by the purest of scientific motives. I
refer of course to the military programme by the U.S. Air Force for the orbiting of
"Project Needles (West Ford)" around the Earth and more recently the proposed
explosion of a megaton nuclear weapon in the region of the Van Allen belts....
These subjects are unusually controversial, and the only point I would make now
is to emphasize the extreme importance of carrying out such projects only by
agreement of the International Scientific Unions. If I might end on this rather sad
note I do beg the Americans to use their influence to the utmost to make quite sure
that such projects are carried out only by international agreement and particularly
within the framework of the resolution of the International Astronomical Union
which was phrased only a few months ago in California. If this is not done then the
United States may bear the awful responsibility of having started a chain of events
leading to the militarization of space and the destruction of astronomy on Earth.
"Note added in proof by the author. This address was delivered to the Institute
of Strategic Studies nearly four months ago. In this time there have been further
space activities which underline the anxiety expressed in the last paragraph of my
address....The United States exploded the megaton bomb outside the atmosphere
and have thereby enormously confused the study of the natural radiation belts by
setting up a new long-duration zone of trapped particles. A few more explosions of
this type for military purposes by other of the Powers will obviously add so much
artificially trapped material to the radiation zones that the investigation of the
natural effects will have to be abandoned before we know their true nature or
origin....Finally, a highly successful communication satellite, Telstar, has been
placed in orbit and thereby encouraged the commercial as well as the military
communication interests in space. The anxiety expressed about 'Project Needles'
must be paralleled by the anticipation that many Telstar or Echo balloon satellites
will have a similar detrimental effect on earthbound astronomy and
45
radioastronomy. The need for international agreement about the use of space and
the control of launchings, either of rockets or space-vehicles into it, has become a
matter of the utmost urgency."
Similar views have been expressed by several editorials of "Nature."100,101
In the United States, the reaction to the Starfish event was mixed. Many members of the
NASA staff expressed great concern about possible interference of the artificial radiation
belts with the space program. Their anxiety was enhanced by the fact that two or three satel-
lites were put out of commission by the artificial electron fluxes, thus terminating their mis-
sions, and by the premature claims (September 1962) of the Bell space scientists that essen-
tially all fission beta rays were injected into the belts; (as it turned out, it was ~5%, not "more
than 50%," of the pertinent activity). In any case, Dr. Webb, the NASA administrator at that
time, prevailed upon Dr. Jerome Wiesner, the Chief Scientific Advisor to the President, and
reportedly also directly upon President Kennedy to have future nuclear space experiments
restricted to lower altitudes. This, in my personal opinion, highly emotional response led un-
fortunately to the cancellation of the low-yield Uracca event, which was to be exploded at an
altitude of 1 300 km as proposed by LASL. The event, as planned, would have added less
than 1% to the inventory of the artificial belts but would have increased our knowledge of
near-space physics significantly.
Another critical response, though of a different type, might be worth recording. Nawrocki50
in discussing the physics of magnetic disturbances (see Chapter VI) writes:
"The ambiguity concerning interpretation of the magnetic disturbance is just
one indication of how poorly conceived and instrumented were the Argus experi-
ments. Perhaps all that was achieved was the substantiation of the existence of the
terrestrial В-field. Contrary to Christofilos27 and others, the high-altitude explo-
sion is not a good tool for investigating the atmosphere. Rather one must know the
atmosphere extremely well to interpret the highly complex interaction of the bomb
and the perturbed environment."
This statement was made in 1961. Nawrocki was right at least in one respect, namely that
Argus was poorly instrumented.
As time went by, the emotions were replaced by genuine scientific curiosity and a thorough,
high-class analysis of the many unusual phenomena observed as a consequence of the high-
altitude events. Literally many hundreds of publications in scientific magazines (such as the
"Journal of Geophysical Research" and the "New Zealand Journal of Geology and
Geophysics;" in the "Proceedings of the National Academy of Sciences;" in "Cospar Publica-
tions" and in "Nature" (sic), etc.; and in unclassified documents of the AEC, of AEC
Laboratories, and of DOD agencies and their contractors) bear witness to the stimulating
questions which these events raised and frequently answered. Studies were initiated which
otherwise would not have been conducted. True, some of the studies suffered from the clas-
sification of the source outputs. Still, now in retrospect, I believe that the advances in our
knowledge in many fields of physics did outweigh the disadvantages. After all, the results of
many large-scale experiments are derived from the modification or the simulation of natural
processes.
It is worthwhile to quote here a few published postevent positive reactions to several phases
of the observations and to list several—of many—rather basic scientific rewards which were a
direct consequence of the high-altitude experiences.
In a United Nations document published in 1972 we read: "Observations of radioactive
tracers have contributed greatly to the understanding of air movement within the
stratosphere....1'102
In a textbook on Particles in the Atmosphere and Space103 we read that radioactive "parti-
cles behave almost as though they are molecules, and they enter the troposphere only as the
stratospheric air enters the troposphere. Because of this behavior and because radioactive
particles are readily identified as such, delayed fallout serves as an excellent tracer for air
masses."
46
In another publication58 it is stated: "Geomagnetic and other perturbations produced by
such explosions can lead to an understanding of certain geophysical processes. For example,
explosions like this [Starfish] provide an opportunity to measure the time delay of the
hydromagnetic waves they generate, and thus they furnish evidences about the propagation
mechanism of the waves."
In an otherwise classified document, H. A. Bethe104 wrote in 1957, before the Teak event, as
follows:
"The many deviations from equilibrium which are characteristic of high-altitude
shots make it very difficult to make definite predictions on either hydrodynamic or
optical phenomena....All I can hope to do is indicate the scale of the phenomena,
not the details. This makes it more interesting to make observations on this test. In
fact, the test will constitute a beautiful laboratory for the study of the properties
of air in large quantity and at very low density. It is regrettable that the test can
not be planned with greater leisure and instrumented more fully to make use of
this important opportunity to study the properties of the high atmosphere."
This remark by Bethe and the analysis of data established the need for better, more precise
reaction rates for atmospheric constituents. In the subsequent years, an extensive research
program conducted mainly at academic institutions under the Defense Atomic Support
Agency (DASA) and later the Defense Nuclear Agency (DNA) sponsorship resulted in the
publication of a "Reaction Rate Handbook"105 which is frequently being updated. It is an es-
sential source of information for atmospheric researchers.
The application of the experiences gained in 1962 during the AEC's rocket-bome diagnostic
experiments to the Vela Satellite program provided another dividend.108 This program com-
bined the objective of detecting possible clandestine nuclear explosions in space with fruitful
basic magnetospheric research.107108
Finally, the study of the physics of the interaction of debris with low-density air (the so-
called coupling processes) provided the impetus for the intensification of several phases of
modern plasma physics as demonstrated by Longmire.108
47
ACKNOWLEDGMENTS
This work was done under the auspices of the Nevada Operations Office of the US Energy
Research and Development Administration, with Ross L. Kinnaman as the Manager of the
NNTRP Environmental Assessment Program. Thanks are due to members of the reference
section of the LASL Library for their valuable assistance. Eugene J. Baumann of the Radio
Physics Laboratory of the Stanford Research Institute provided many references for the sec-
tion on communication degradation. Photographs are by Elbert Bennett, William Regan, and
Roy Stone, all of LASL, and by members of the EG&G teams. Among many of my LASL
colleagues who have read the draft manuscript, I am particularly indebted to Robert
Brownlee, Marvin Hoffman, John Malik, Carson Mark, and John Zinn for their helpful
comments.
48
REFERENCES
1. S. Glasstone, The Effects of Nuclear Weapons (US Atomic Energy Commission, April
1962). Available through US Government Printing Office.
2. J. Zinn, Los Alamos Scientific Laboratory, personal communication, March 1965.
3. S. L. Severin, A. V. Alder, N. L. Newton, and J. F. Culver, "Photostress and Flash
Blindness in Aerospace Operations," USAF School of Aerospace Medicine, Brooks AFB, TX,
SAM-TDR-63-67 (September 1963).
4. D. W. Williams and В. C. Duggar, "Review of Research on Flash Blindness,
Chorioretinal Burns, Countermeasures, and Related Topics," Defense Atomic Support
Agency report DASA-1576 (1965).
5. R. G. Allen Jr., W. R. Bruce, K. R. Kay, L. K. Morrison, R. A. Neish, C. A. Polaski,
and R. A. Richards, "Research on Ocular Effects Produced by Thermal Radiation,"
Technology, Inc. report prepared for USAF School of Aerospace Medicine, Aerospace
Medical Division, Brooks AFB, TX, Appendix В (July 1967).
R. G. Allen Jr., D. J. Isgitt, D. E. Jungbauer, J. H. Tips Jr., P. W. Wilson Jr., and T. J.
White, "The Calculation of Retinal Burn and Flashblindness Safe Separation Distances,"
USAF School of Aerospace Medicine, Aerospace Medical Division, Brooks AFB, TX, SAM-
TR-68-106 (September 1968).
6. W. T. Ham Jr., R. C. Williams, W. J. Geeraets, R. S. Ruffin, and H. A. Mueller, "Op-
tical Masers (Lasers)," Acta Opthalmol., Suppl. 76, 60 (1963).
7. N. D. Miller and T. J. White, "Evaluation of Eye Hazards from Nuclear Detonations I.
Retinal Bums and Flash Blindness," USAF School of Aerospace Medicine, Aerospace
Medical Division, Brooks AFB, TX (November 1969).
8. H. Hoerlin, A. Skumanich, and D. R. Westervelt, Los Alamos Scientific Laboratory,
personal communication, August 1959.
9. H. L. Mayer and F. Ritchey, "Eyeburn Damage Calculations for an Exospheric Nuclear
Event," J. Opt. Soc. Am. 54, 678 (1964).
10. R. D. Cowan, "Calculation of Retinal Dose Due to Visible Radiation From Nuclear Ex-
plosions," Los Alamos Scientific Laboratory report LA-3204-MS (March 1965).
11. J. Zinn, R. C. Hyer, and C. A. Forest, "Eyebum Thresholds," Los Alamos Scientific
Laboratory report LA-4651 (May 1971).
49
12. W. F. Culver, N. L. Newton, R. Penner, and R. W. Neidlinger, "Human Chorioretinal
Burns Following High Altitude Nuclear Detonations," Aerosp. Med. 35, 1217 (December
1964).
13. H. A. Bethe, Los Alamos Scientific Laboratory consultant, personal communication,
August 1958.
14. A. Skumanich, Los Alamos Scientific Laboratory, personal communication, January
1958.
15. W. Ogle, Los Alamos Scientific Laboratory, personal communication, March 1968.
16. H. Paul Williams, "The Effect of High-Altitude Nuclear Explosions on Radio Com-
munications," ERE Trans. Mil. Electron. (Inst. Radio Eng., New York), 326 (October 1962).
17. W. F. Utlaut, "Ionospheric Effects Due to Nuclear Explosions," Boulder Laboratories,
National Bureau of Standards report 6050 (April 30, 1959).
18. G. C. Andrew, "Some Observations of MF and HF Radio Signals After Mid-Pacific
High-Altitude Nuclear Explosions," New Zealand J. Geol. Geophys. 5, 988 (December 1962).
19. T. Obayashi, S. C. Coroniti, and E. T. Pierce, "Geophysical Effects of High-Altitude
Nuclear Explosions," Nature 183, 1476 (May 23, 1959).
20. D. Davidson, "Nuclear Burst Effects on Long-Distance High-Frequency Circuits," J.
Geophys. Res. 68, 331 (January 1, 1963).
21. R. G. D'Arcy and Stirling A. Colgate, "Measurements at the Southern Conjugate
Region of the Fission Debris from the Starfish Nuclear Detonation," J. Geophys. Res. 70, 3147
(July 1, 1965).
22. A. J. Zmuda, B. W. Shaw, and C. R. Haave, "Very Low Frequency Disturbances and
the High-Altitude Nuclear Explosion of July 9, 1962," J. Geophys. Res. 68, 745 (February 1,
1963).
23. R. P. Basler, R. B. Dyce, and H. Leinbach, "High-Latitude Ionization Associated with
the July 9 Explosion," J. Geophys. Res. 68, 741 (February 1, 1963).
24. James J. Griffin, "Re-Evaluation of Optimal Parameters for Post-Fission Beta Decay,"
Los Alamos Scientific Laboratory report LA-2811, Addendum П (June 1964).
25. Herman Hoerlin, "Artificial Aurora and Upper Atmospheric Shock Produced by Teak,"
Los Alamos Scientific Laboratory report LAMS-2536 (June 1961).
26. N. C. Christofilos, "The Argus Experiment," J. Geophys. Res. 64, 869 (August 1959).
27. N. C. Christofilos, "Sources of Artificial Radiation Belts," in Radiation Trapped in the
Earth's Magnetic Field, В. M. McCormack, Ed. (D. Reidel Publ. Co., Dordrecht-Holland,
1966), pp. 565-574.
50
28. James A. Van Allen, Carl E. McIlwain, and George H. Ludwig, "Satellite Observations
of Electrons Artificially Injected into the Geomagnetic Field," J. Geophys. Res. 64, 877
(August 1959).
29. Lew Allen Jr., James L. Beavers П, William A. Whitaker, Jasper A. Welch Jr., and
Roddy B. Walton, "Project Jason Measurement of Trapped Electrons From a Nuclear Device
by Sounding Rockets," J. Geophys. Res. 64, 893 (August 1959).
30. W. N. Hess, The Radiation Belt and Magnetosphere (Blaisdell Publishing Co.,
Waltham, MA, 1968).
31. J. A. Van Allen, "Spatial Distribution and Time Decay of the Nuclear Intensities of
Geomagnetically Trapped Electrons From the High Altitude Nuclear Burst of July 1962," in
Radiation Trapped in the Earth's Magnetic Field, В. M. McCormack, Ed. (D. Reidel Publ.
Co., Dordrecht-Holland, 1966), pp. 575-592.
32. J. B. Cladis, G. T. Davidson, and L. N. Newkirk, 'The Trapped Radiation Handbook,"
Defense Nuclear Agency report DNA-2524H (December 1971).
a. J. Billingham, "Status Report on the Space Radiation Effects on the Apollo Mission," in
Second Symposium on Protection Against Radiations in Space, NASA SP-71, A. Reetz Jr.,
Ed., Scientific and Technical Information Division, National Aeronautics and Space Ad-
ministration, Washington, DC, 1965.
b. W. H. Langham, Ed., Radiobiological Factors in Manned Space Flight, National
Academy of Sciences and National Research Council Publication 1487 (Washington, DC,
1967), pp. 14-20.
33. R. W. Kilb, "Analysis of Argus П1 Photographic Data (U)," Unclassified parts of Mis-
sion Research Corporation report MRC-R-112 (January 1974).
34. R. W. Kilb, "Analysis of Argus II All-Sky Photographs (U)," Unclassified parts of Mis-
sion Research Corporation report MRC-R-176 (March 1975).
35. Symposium on Scientific Effects of Artificially Introduced Radiations at High
Altitudes held April 29, 1959, at the National Academy of Sciences, Washington, DC. Papers
published in J. Geophys. Res. 64, 865 (August 1959) and in Proc. Nat. Acad. Sci. USA, 45,
1141 (August 15, 1959).
36. G. L. Johnson and R. B. Dyce, "A Study of Explorer IV Records in the Pacific Area,"
Stanford Research Institute report FO-O-111 (July 1960).
37. B. J. O'Brien, C. D. Laughlin, and J. A. Van Allen, "Geomagnetically Trapped Radia-
tion Produced by a High-Altitude Nuclear Explosion on July 9, 1962," Nature 195, 939 (Sep-
tember 8, 1962).
38. W. L. Brown, W. N. Hess, and J. A. Van Allen, "Collected Papers on the Artificial
Radiation Belt from the July 9, 1962, Nuclear Detonation," J. Geophys. Res. 68, 605
(February 1, 1963).
51
39. J. A. Van Allen, L. A. Frank, and B. J. O'Brien, "Satellite Observations of the Artificial
Radiation Belt of July 1962," J. Geophys. Res. 68, 619 (February 1, 1963).
40. W. N. Hess, "The Artificial Radiation Belt Made on July 9, 1962," J. Geophys. Res. 68,
667 (February 1, 1963). Actually, Hess refers to Brown and Gabbe, J. Geophys. Res. 68, 607
(February 1, 1963). Brown and Gabbe's numbers of the total inventory are a factor of three
lower than Hess', i.e., more like 7 x 1025 electrons.
41. S. A. Colgate, "Energetic Electrons From Shock Heating in the Exosphere," in
Radiation Trapped in the Earth's Magnetic Field, В. M. McCormack, Ed. (D. Reidel Publ.
Co., Dordrecht-Holland, 1966), p. 693.
42. J. J. Griffin, "Beta Decays and Delayed Gammas From Fission Fragments," Los
Alamos Scientific Laboratory report LA-2811 (February 1963).
43. J. Zinn, H. Hoerlin, and A. G. Petschek, "The Motion of Bomb Debris Following the
Starfish Test," in Radiation Trapped in the Earth's Magnetic Field, В. M. McCormack, Ed.
(D. Reidel Publ. Co., Dordrecht-Holland, 1966), pp. 671-692.
44. H. Hoerlin, "Air Fluorescence Excited by High-Altitude Nuclear Explosions," Los
Alamos Scientific Laboratory report LA-3417-MS (January 1966).
45. A. C. Durney, H. Elliott, R. J. Hynds, and J. J. Quenby, "Satellite Observations of the
Energetic Particle Flux Produced by the High-Altitude Nuclear Explosion of July 9, 1962,"
Nature 195, 1245 (September 29, 1962).
46. G. F. Pieper and D. J. Williams, "Traac Observations of the Artificial Radiation Belt
from the July 9, 1962 Nuclear Detonation," J. Geophys. Res. 68, 635 (February 1, 1963).
47. Yu. I. Galperin and A. D. Bolyunova, "Study of the Drastic Changes of the Radiation in
the Upper Atmosphere in July, 1962," in Space Research V (North-Holland Publ. Co.,
Amsterdam, 1965), p. 446.
48. V. I. Krassovsky, Yu. I. Galperin, V. V. Temnyy, T. M. Mulyarchik, N. V. Dzhordzhio,
M. Ya. Marov, A. D. Bolyunova, 0. L. Vaysberg, В. P. Potapov, and M. L. Bragin, "Some
Characteristics of Geoactive Particles," Geomagn. Aeron. 3, 401 (1963).
49. D. A. Adams and B. W. Mar, "Predictions and Observations for Space Flight," in
Radiation Trapped in the Earth's Magnetic Field, В. M. McCormack, Ed. (D. Reidel Publ.
Co., Dordrecht-Holland, 1966), p. 817.
50. J. Hazel, "Radiation Hazards and Manned Space Flight," Aerosp. Med. 35, 436 (May
1964). 51
51. В. M. McCormack, Ed., Session VI, "Artificial Injected Radiation," and Session IX,
"Radiation Doses Received by Manned Flight in the Trapped Radiation Belts," in Radiation
Trapped in the Earth's Magnetic Field (D. Reidel Publ. Co., Dordrecht-Holland, 1966), pp.
565-702 and 817-886.
52
52. R. В. Dyce and S. Horowitz, "Measurements of Synchrotron Radiation at Central
Pacific Sites," J. Geophys. Res. 68, 713 (February 1963).
53. A. M. Peterson and G. L. Hower, "Synchrotron Radiation From High-Energy Elec-
trons,” J. Geophys. Res. 68, 723 (February 1, 1963).
54. G. R. Ochs, D. T. Farley Jr., K. L. Bowles, and P. Bandyopadhay, "Observations of
Synchrotron Radio Noise at the Magnetic Equator Following the High-Altitude Nuclear Ex-
plosion of July 9, 1962," J. Geophys. Res. 68, 701 (February 1, 1963).
55. J. M. Hornby, "The Effects on Radio-Astronomy of the July 9, 1962, High-Altitude
Nuclear Explosion," J. Geophys. Res. 69, 2737 (July 1, 1964).
56. M. Casaverde, A. Giesecke, and Robert Cohen, "Effects of the Nuclear Explosion Over
Johnston Island Observed in Peru on July 9, 1962," J. Geophys. Res. 68, 2603 (May 1, 1963).
57. R. L. Kovach, and A. Ben-Menahem, "Analysis of Geomagnetic Micropulsations Due
to High-Altitude Nuclear Explosions," J. Geophys. Res. 71, 1427 (March 1, 1966).
58. J. R. Davis and J. M. Headrick, "A Comparison of High-Altitude Nuclear Explosion
Effects in the E Layer with Variations in Geomagnetic Field Strength," J. Geophys. Res. 69,
911 (March 1, 1964).
59. P. J. Nawrocki and R. Papa, "Transmission of Electromagnetic Waves," in
Atmospheric Processes (Prentice-Hall, Inc., Englewood Cliffs, New Jersey, 1963), Chap. 10,
pp. 19-21.
60. Paul L. Hartman, "New Measurements of the Fluorescence Efficiency of Air Under
Electron Bombardment," Planet. Space Sci. 16, 1315 (1968). Also Los Alamos Scientific
Laboratory report LA-3793 (January 1968).
61. Robert O'Neil and Gilbert Davidson, "The Fluorescence of Air and Nitrogen Excited by
Energetic Electrons," American Science and Engineering report ASE-1602, AFCRL-67-0277
(January 1968).
62. Kenneth B. Mitchell, "Fluorescence Efficiencies and Collisional Deactivation Rates of
N2 and N2+ Bands Excited by Soft X-Rays," J. Chem. Phys. 53, 1795 (September 1970).
63. D. R. Westervelt, E. W. Bennett, and A. Skumanich, "Air Fluorescence Excited by
Gamma Rays and X-Rays," Proc. 4th Intern. Conf. Ionization Phenomena in Gases," (North-
Holland Publ. Co., Amsterdam, 1960), Vol. 1, p. 225.
64. J. W. Chamberlain, Physics of the Aurora and Airglow (Academic Press, New York,
1961), p. 197.
65. Sadami Matsushita, "On Artificial Geomagnetic and Ionospheric Storms Associated
with High-Altitude Explosions," J. Geophys. Res. 64, 1149 (September 1959).
53
66. J. В. Gregory, "New Zealand Observations of the High-Altitude Explosion of July 9 at
Johnston Island," Nature 196, 508 (November 10, 1962).
67. Special Nuclear Explosion Issue, New Zealand J. Geol. Geophys. 5, 916-1018 (Decem-
ber 1962).
68. H. Argo, H. Hoerlin, C. Longmire, A. Petschek, and A. Skumanich, "Nuclear Explo-
sions in Space," Proc. 2nd Plowshare Symp., San Francisco, May 1959, University of Califor-
nia report UCRL-5679 (1959).
69. D. R. Westervelt and H. Hoerlin, "The Los Alamos Air Fluorescence Detection
System," Proc. IEEE, p. 2068 (December 1965).
70. A news item in EOS, Trans. Am. Geophys. Union, 54, 687 (July 1973), referring to work
by W. Orr Roberts of the University Corporation for Atmospheric Research and by Roger H.
Olson, Research Meteorologist with National Oceanic and Atmospheric Administration.
71. W. Orr Roberts and R. J. Olson, "Geomagnetic Storms and Wintertime 300-mb Trough
Development in the North Pacific-North America Area," J. Atmos. Sci. 30, 135 (January
1973).
72. J. M. Wilcox, P. H. Scherrer, L. Svalgaard, W. Orr Roberts, and R. H. Olson, "Solar
Magnetic Sector Structure: Relation to Circulation of the Earth's Atmosphere," Science 180,
185 (April 1973).
W. Orr Roberts and R. H. Olson, "New Evidence for Effects of Variable Solar Corpuscular
Emission on the Weather," Rev. Geophys. Space Phys. 11, 731 (August 1973).
J. M. Wilcox, P. H. Scherrer, L. Svalgaard, W. Orr Roberts, R. H. Olson, and R. L. Jenne,
"Influence of Solar Magnetic Structure on Terrestrial Atmospheric Vorticity," J. Atmos. Sci.
31, 581 (March 1974).
J. M. Wilcox, L. Svalgaard, and P. H. Scherrer, "Seasonal Variation and Magnitude of the
Solar Sector Structure-Atmospheric Vorticity Effect," Nature 255, 539 (June 12, 1975).
R. H. Olson, W. Orr Roberts, and C. S. Zerefos, "Short Term Relationships Between Solar
Flares, Geomagnetic Storms and Tropospheric Vorticity Patterns," Nature 257, 133 (Septem-
ber 11, 1975).
J. M. Wilcox, "Solar Structure and Terrestrial Weather," Science 192, 745 (May 1976).
73. W. F. Utlaut and R. Cohen, "Modifying the Ionosphere with Intense Radio Waves,"
Science 174, 245 (1971).
F. W. Perkins and S. H. Francis, "Artificial Production of Traveling Ionospheric Distur-
bances and Large Scale Atmospheric Motion," J. Geophys. Res. 79, 3879 (September 1, 1974).
David S. Evans, "High-Velocity Gas Releases as a Method of Perturbing the Upper At-
mosphere," J. Geophys. Res. 79, 3882 (September 1, 1974).
54
74. M. I. Kalkstein, "Rhodium-102 High-Altitude Tracer Experiment," Science 137, 645
(August 31, 1962).
75. G. A. Cowan, Remarks prepared for "Seminar on Cadmium Isotopes from Starfish" at
HASL (December 6, 1963).
N. A. Hallden and L. P. Salter, "Emitted Radiations from Cadmium-109 and Cadmium-
113m," USAEC, New York Operations Office, Health and Safety Laboratory report HASL-
142 (January 1, 1964), p. 299.
L. P. Salter, "Note on the Detectability of Cadmium Isotopes from Starfish in 1964 Ground
Level Samples," HASL-142 (January 1, 1964), p. 303.
I. J. Russell and R. V. Griffith, "The Production of Cd10’ and CdII3,n in a Space Nuclear Ex-
plosion," HASL-142 (January 1, 1964), p. 306.
76. K. Telegadas and R. J. List, "Global History of the 1958 Nuclear Debris and its
Meteorological Implications," J. Geophys. Res. 69, 4741 (November 15, 1964).
77. R. J. List and K. Telegadas, "Using Radioactive Tracers to Develop a Model of the Cir-
culation of the Stratosphere," J. Atmos. Sci. 26, 1128 (November 1969).
78. L. Machta, R. J. List, and K. Telegadas, "Inventories of Selected Long-lived
Radioisotopes Produced During Nuclear Testing," USAEC, New York Operations Office,
Health and Safety Laboratory report HASL-142 (January 1, 1964), pp. 255, 270.
79. K. Telegadas, "The Seasonal Stratospheric Distribution of Cadmium-109, Plutonium-
238 and Strontium-90," USAEC, New York Operations Office, Health and Safety Laboratory
report HASL-184 (January 1, 1968), pp. 1-53—1-85.
80. R. J. List, L. P. Salter, and K. Telegadas, "Radioactive Debris as a Tracer for In-
vestigating Stratospheric Motions," Tellus 18, 345 (1966).
81. О. I. Leipunskii, J. E. Konstantinov, G. A. Fedorov, and O. G. Scotnikova, "Mean
Residence Time of Radioactive Aerosols in the Upper Layers of the Atmosphere Based on
Fallout of High-Altitude Tracers," J. Geophys. Res. 75, 3569 (June 20, 1970).
82. H. L. Volchok, "The Anticipated Distribution of Cd-109 and Pu-238 (from SNAP-9A)
Based Upon the Rh-102 Tracer Experiments," USAEC, New York Operations Office, Health
and Safety Laboratory report HASL-165 (January 1, 1966), p. 312.
83. "Ionizing Radiation: Levels and Effects," a report of the United Nations Scientific
Committee on the Effects of Atomic Radiation to the General Assembly (A United Nations
Publication, New York, 1972), p. 40.
84. F. Fabian, W. F. Libby, and С. E. Palmer, "Stratospheric Residence Time and In-
terhemispheric Mixing of Strontium 90 from Fallout in Rain," J. Geophys. Res. 73, 3611
(June 15, 1968).
55
85. К. R. Peterson, "An Empirical Model for Estimating World-Wide Deposition from At-
mospheric Nuclear Detonations," Health Phys. 18, 357 (1970).
86. A. K. Stebbins III, "Special Report on High Altitude Sampling Program," Defense
Atomic Support Agency report DASA-532B (June 1, 1960).
A. K. Stebbins Ш, "Second Special Report on High Altitude Sampling Program," Defense
Atomic Support Agency report DASA-539B (August 1, 1961).
87. L. Machta, K. Telegadas, and R. J. List, "The Slope of Surfaces of Maximum Tracer
Concentration in the Lower Stratosphere," J. Geophys. Res. 75, 2279 (April 20, 1970).
88. P. W. Krey and B. Krajewski, "HASL Model of Atmospheric Transport," USAEC, New
York Operations Office, Health and Safety Laboratory report HASL-215 (September 1969).
P. W. Krey and B. Krajewski, "Comparison of Atmospheric Transport Model Calculations
with Observations of Radioactive Debris," J. Geophys. Res. 75, 2901 (May 20, 1970).
89. US National Report to the International Union of Geodesy and Geophysics, 1971-1974,
Rev. Geophys. Space Phys., Vol. 13 (July 1975).
90. E. R. Reiter, "Atmospheric Transport Processes, Part 3," AEC Critical Review Series,
USAEC report TID-25731 (1972).
91. E. R. Reiter, "Atmospheric and Tropospheric Exchange Processes," Rev. Geophys.
Space Phys. 13 (1975).
92. Report of the United Nations Scientific Committee on the Effects of Atomic Radiation,
Official Record, Twenty-Fourth Session (A United Nations Publication, New York, 1969),
Suppl. 13, p. 14.
93. Anthony Turkevich, University of Chicago and Los Alamos Scientific Laboratory, per-
sonal communication, August 1975.
94. A. L. Lazrus, B. W. Bandrud, R. N. Woodward, and W. A. Sedlacek, "Stratospheric
Halogen Measurements," Geophys. Res. Lett. 2, 439 (October 1975).
95. Discussions took place in Washington, DC, in January 1958 with J. Chamberlain
(Yerkes Observatory), F. Gilmore (Rand Corporation), H. Steward (NRL), and H. Hoerlin
(LASL) participating.
96. H. E. DeWitt, "A Compilation of Spectroscopic Observations of Air Around Atomic
Bomb Explosions," Los Alamos Scientific Laboratory report LAMS-1935 (June 1955).
97. H. Johnston, G. Whitten, and J. Birks, "The Effect of Nuclear Explosion on
Stratospheric Nitric Oxide and Ozone,” J. Geophys. Res. 78, 6107 (September 20, 1973).
98. E. Bauer and F. R. Gilmore, "Effect of Atmospheric Nuclear Explosions on Total
Ozone," Rev. Geophys. Space Phys. 13, 451 (August 1975).
56
99. Sir Bernard Lovell, "The Challenge of Space Research," Nature 195, 935 (September 8,
1962).
100. Editorial, 'The Space Game," Nature 195, 739 (August 25, 1962).
101. Editorial, "News and Views, the High-Altitude Nuclear Explosion of July 9, 1962,"
Nature 195, 945 (September 8, 1962).
102. "Ionizing Radiation: Levels and Effects,” Pt. 2, "Man-Made Environmental Radia-
tion," a report of the United Nations Scientific Committee on the Effects of Atomic Radiation
to the General Assembly (A United Nations Publication, New York, 1972), Vol. I, Levels, pp.
39-41.
103. Richard D. Cadle, Particles in the Atmosphere and Space (Reinhold Publ. Corp., New
York, 1966), p. 122.
104 H. A. Bethe, Los Alamos Scientific Laboratory consultant, personal communication,
1957.
105. Defense Nuclear Agency Reaction Rate Handbook, 2nd Edn., DNA, 1948H, March
1972 (distribution unlimited).
106. S. Singer, "The Vela Satellite Program for Detection of High-Altitude Nuclear Detona-
tions," Proc. IEEE 53, 1935 (December 1965).
107. S. J. Bame, "Time-of-Flight Measurements Made with Neutrons from Nuclear Explo-
sions in Space," Bull. Am. Phys. Soc. 9, 76 (1964).
108. H. V. Argo, "Introduction to the Scientific Results from the Vela Satellite Program,"
Trans. Am. Geophys. Union 45, 623 (1964).
109. C. L. Longmire, "Notes on Debris-Air-Magnetic Interaction," Rand Corporation
Memorandum RM-3386-PR (January 1963).
AUS. GOVERNMENT PRINTING Off ICE 1976-777-034/777-297
57