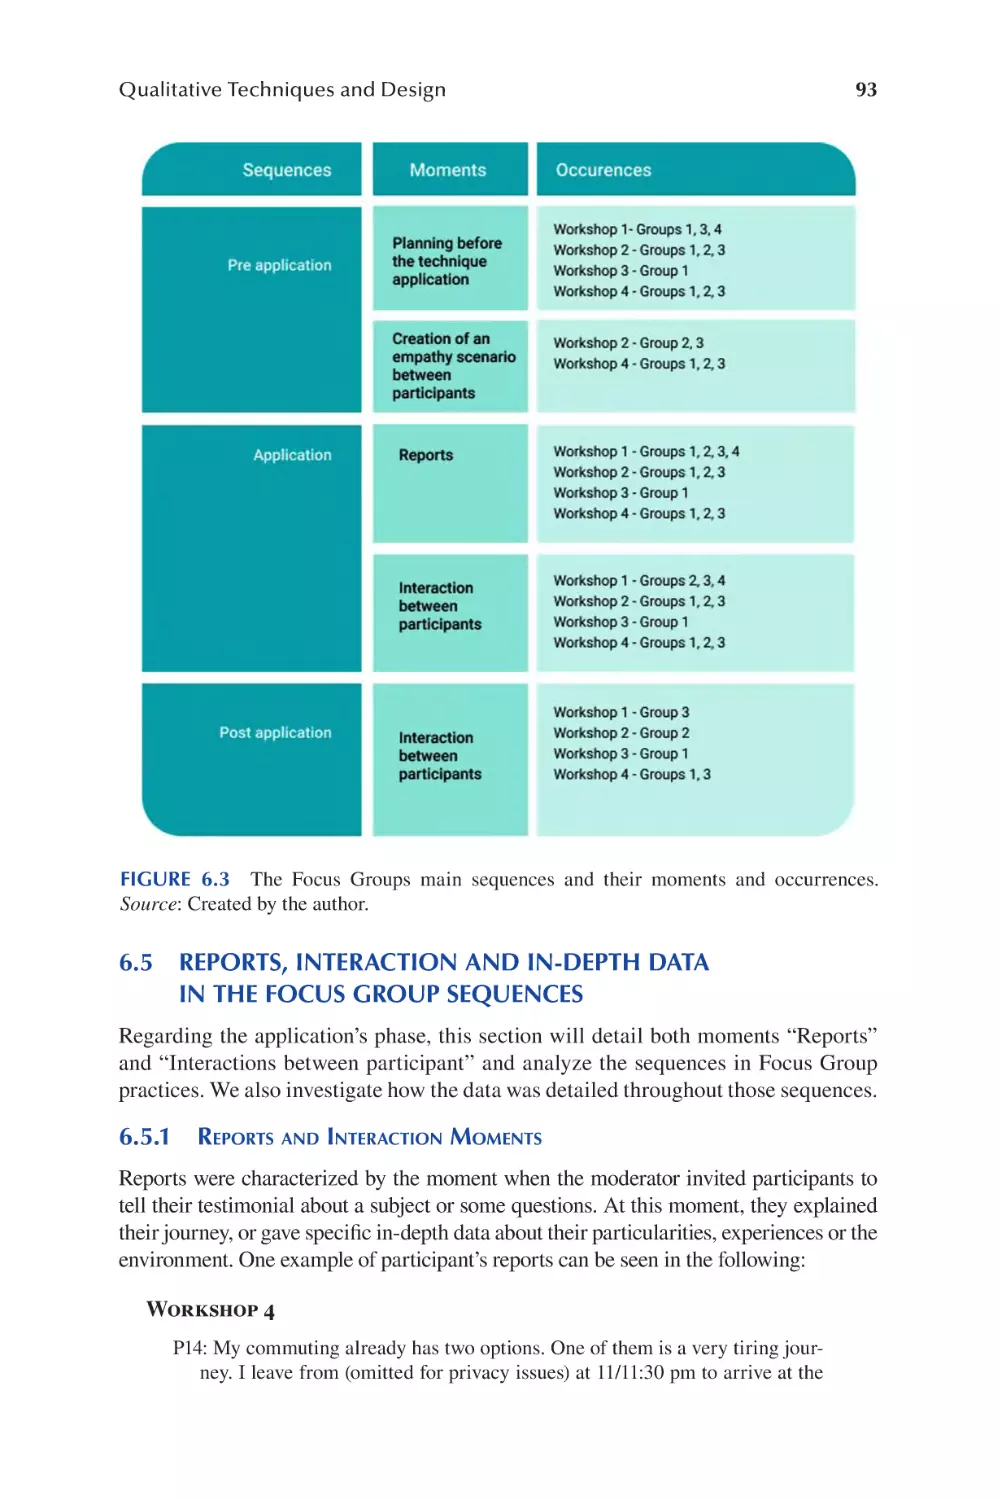
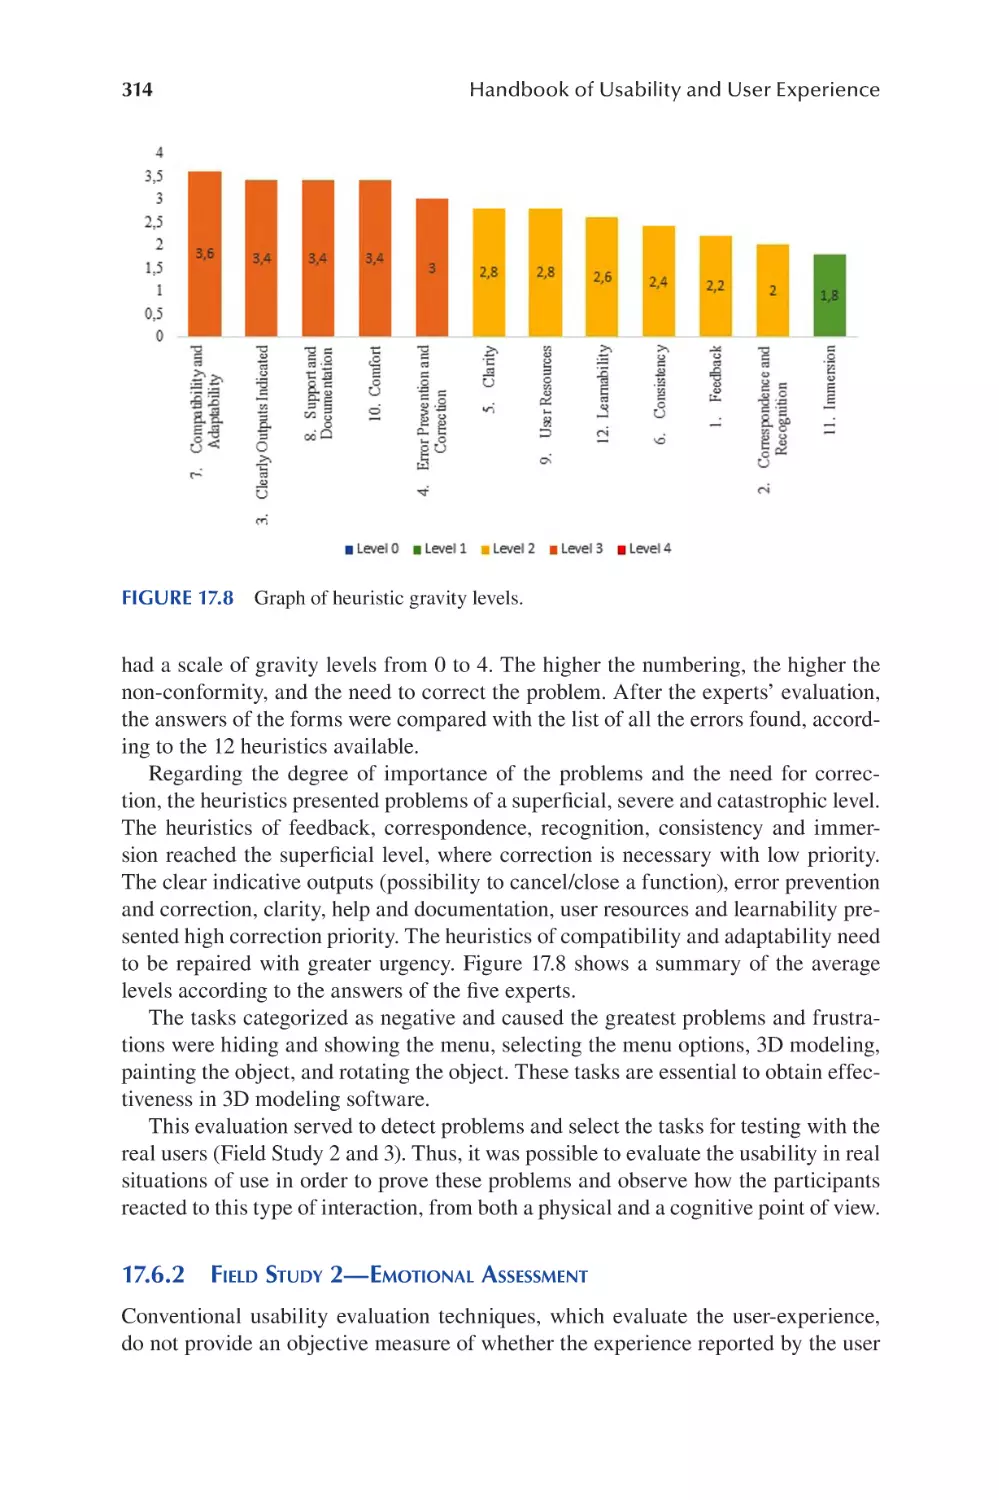
/


Author: Soares M.M. Rebelo F. Ahram T.Z.
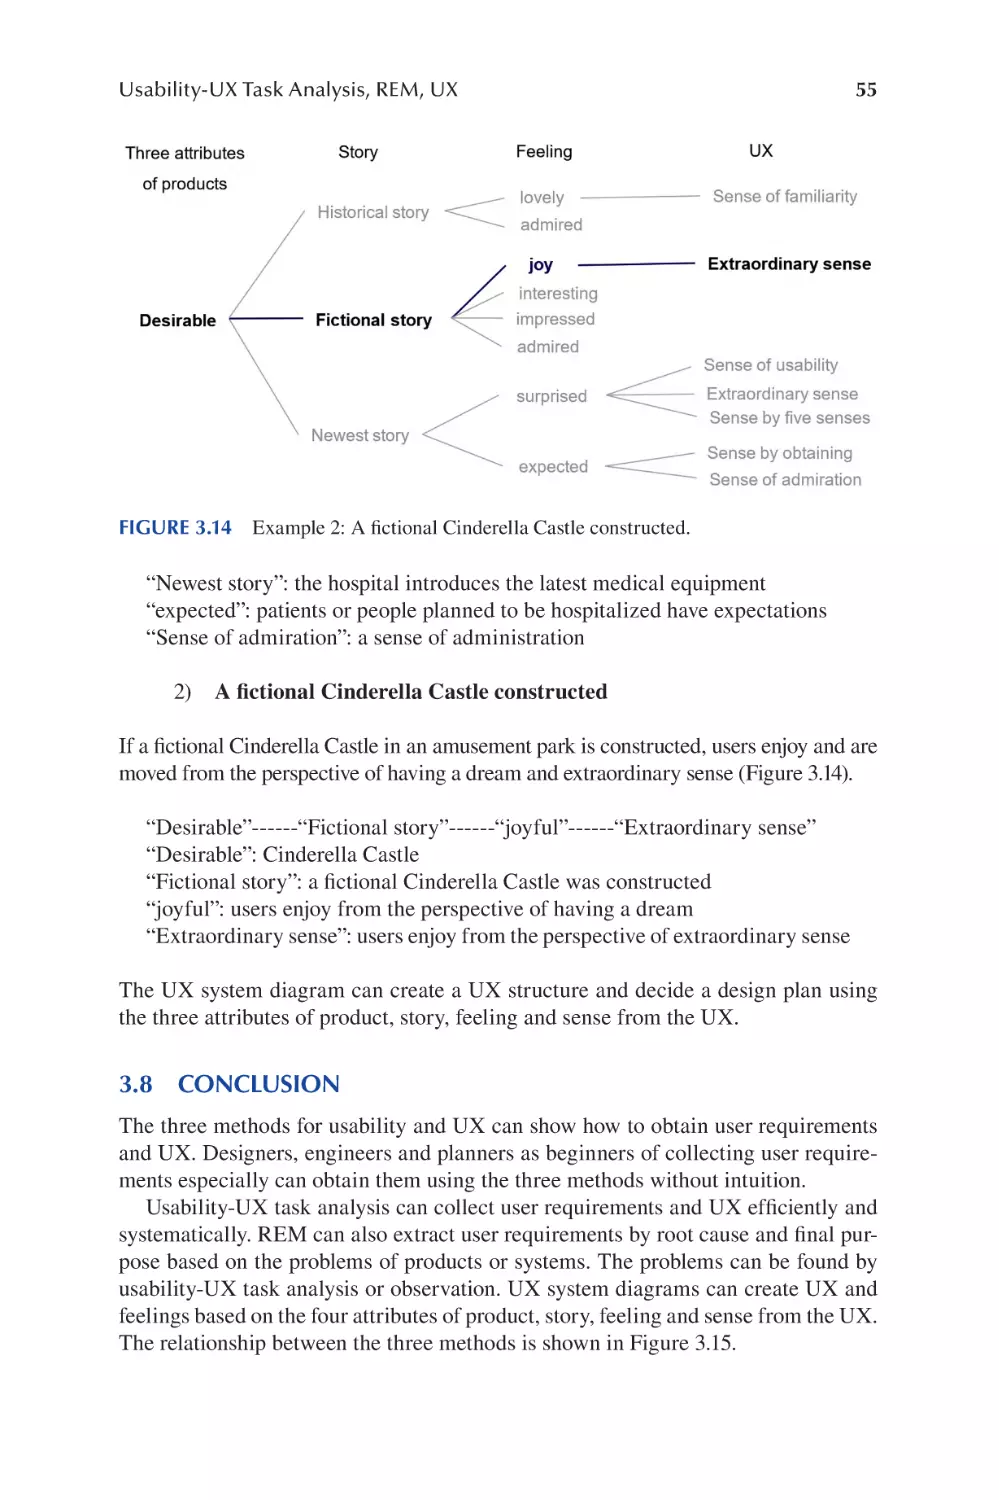
Tags: operation manual handbook user guide ux operational systems crc press publisher
ISBN: 9780367357702
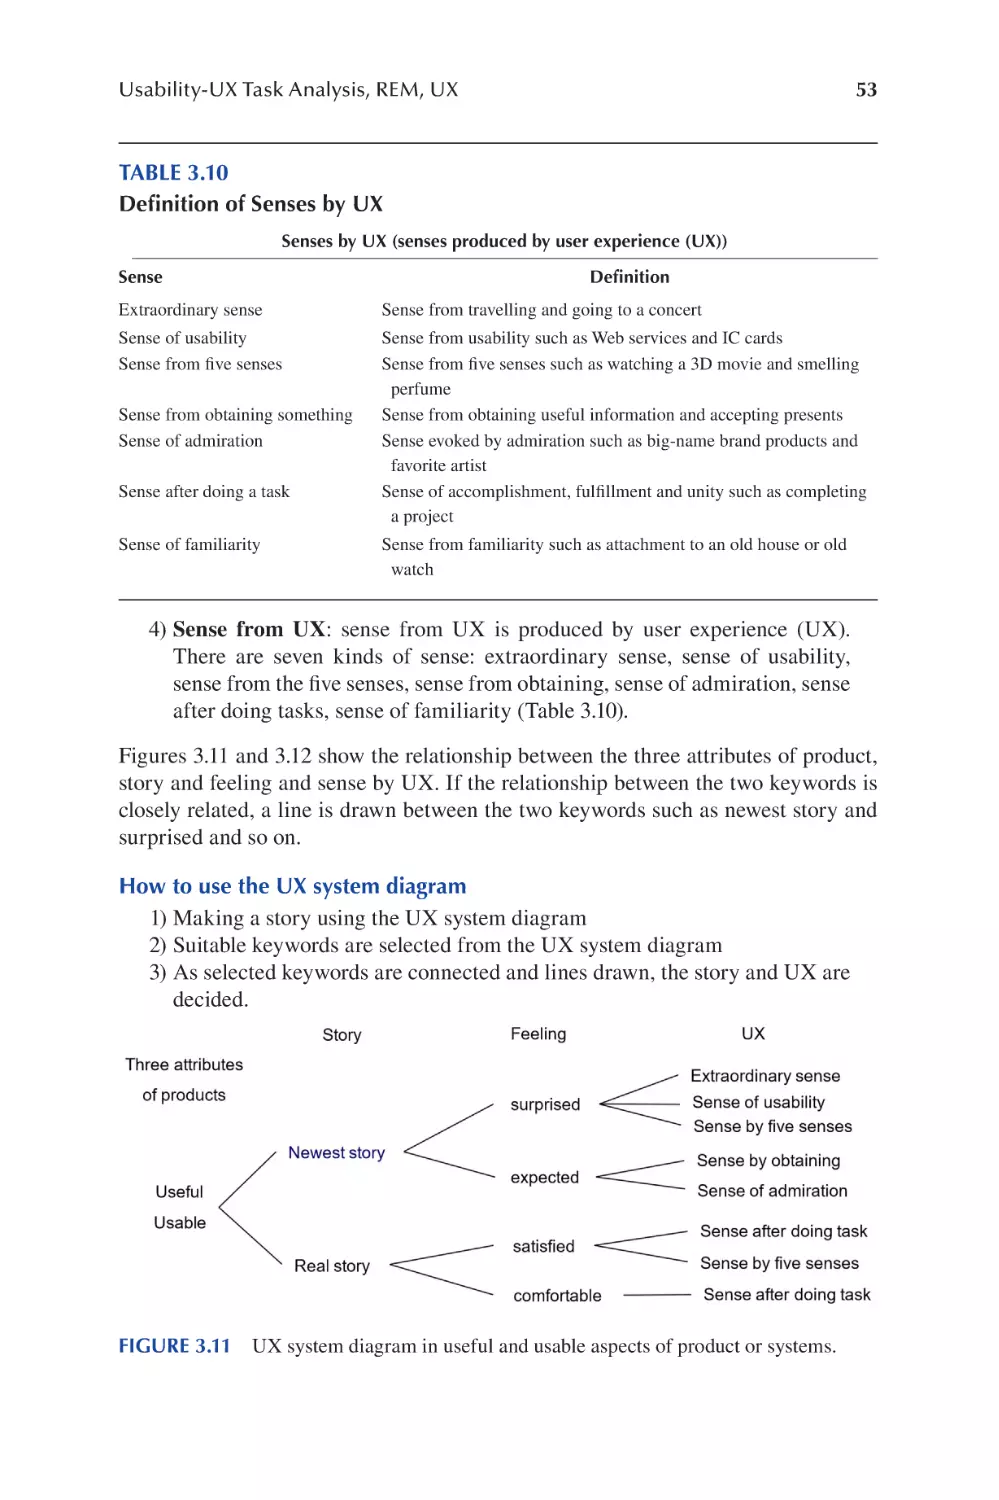
Year: 2022


Text
Handbook of Usability and
User Experience
Handbook of Usability and
User Experience
Methods and Techniques
Edited by
Marcelo M. Soares, Francisco Rebelo and
Tareq Z. Ahram
First edition published 2022
by CRC Press
6000 Broken Sound Parkway NW, Suite 300, Boca Raton, FL 33487-2742
and by CRC Press
2 Park Square, Milton Park, Abingdon, Oxon, OX14 4RN
© 2022 Taylor & Francis Group, LLC
CRC Press is an imprint of Taylor & Francis Group, LLC
Reasonable efforts have been made to publish reliable data and information, but the author and publisher cannot
assume responsibility for the validity of all materials or the consequences of their use. The authors and publishers have attempted to trace the copyright holders of all material reproduced in this publication and apologize to
copyright holders if permission to publish in this form has not been obtained. If any copyright material has not
been acknowledged please write and let us know so we may rectify in any future reprint.
Except as permitted under U.S. Copyright Law, no part of this book may be reprinted, reproduced, transmitted, or utilized in any form by any electronic, mechanical, or other means, now known or hereafter invented,
including photocopying, microflming, and recording, or in any information storage or retrieval system, without
written permission from the publishers.
For permission to photocopy or use material electronically from this work, access www.copyright.com or contact the Copyright Clearance Center, Inc. (CCC), 222 Rosewood Drive, Danvers, MA 01923, 978-750-8400. For
works that are not available on CCC please contact mpkbookspermissions@tandf.co.uk
Trademark notice: Product or corporate names may be trademarks or registered trademarks and are used only
for identifcation and explanation without intent to infringe.
Library of Congress Cataloging–in–Publication Data
Names: Soares, Marcelo Marcio, editor. | Rebelo, Francisco, 1962- editor. |
Ahram, Tareq Z., editor.
Title: Handbook of usability and user experience / edited by Marcelo M.
Soares, Francisco Rebelo, and Tareq Z. Ahram.
Description: Boca Raton : CRC Press, 2022. | Includes bibliographical
references and index. | Contents: v. 1. Methods and techniques -- v. 2.
Research and case studies.
Identifers: LCCN 2021024350 | ISBN 9780367357702 (v. 1 ; hardback) | ISBN
9781032070292 (v. 1 ; paperback) | ISBN 9780429343490 (v. 1 ; ebook) |
ISBN 9780367357719 (v. 2 ; hardback) | ISBN 9781032070315 (v. 2 ;
paperback) | ISBN 9780429343513 (v. 2 ; ebook)
Subjects: LCSH: Human-machine systems. | User-centered system design.
Classifcation: LCC TA167 .H365 2022 | DDC 620.8/2--dc23
LC record available at https://lccn.loc.gov/2021024350
ISBN: 9780367357702 (hbk)
ISBN: 9781032070315 (pbk)
ISBN: 9780429343490 (ebk)
DOI: 10.1201/9780429343490
Typeset in Times
by Deanta Global Publishing Services, Chennai, India
Contents
Preface.......................................................................................................................ix
Editors.......................................................................................................................xi
Contributors ........................................................................................................... xiii
SECTION 1 Methods and Models for Usability
and UX
Chapter 1
Usability and User Experience: Methods and Models .........................3
Marcelo M. Soares, Tareq Ahram and Christianne Falcão
Chapter 2
Implications and Methodological Issues for the Study of
Individual Differences in Usability and User Experience ................. 23
E. Brunsen, W. B. Hicks and A. C. McLaughlin
Chapter 3
Three Methods of Usability-UX Task Analysis, REM, UX
System Diagrams................................................................................ 37
Toshiki Yamaoka
Chapter 4
Remote Usability Testing ................................................................... 57
J. M. Christian Bastien and Kevin Falzone
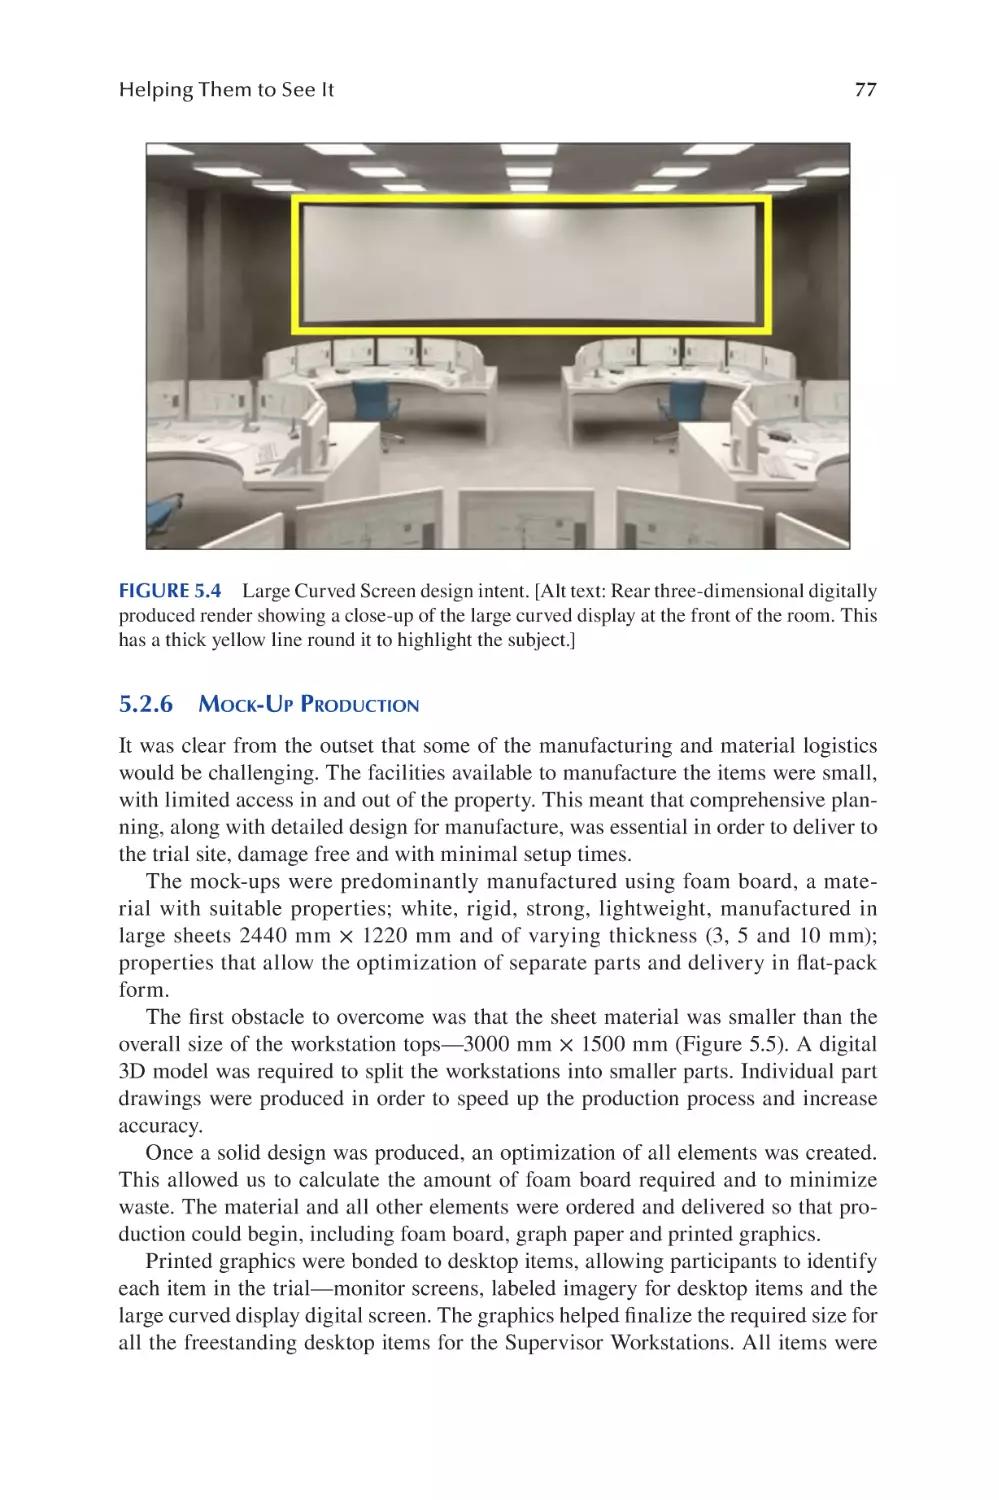
Chapter 5
Helping Them to See It: Using Full Size Mock-Ups to Achieve
Usability ............................................................................................. 73
David Hitchcock, Miskeen Rahman and Benjamin Holmes
Chapter 6
Qualitative Techniques and Design: Using Sequential and
Thematic Analysis to Investigate Focus Group in the Problem’s
Exploration Phase............................................................................... 83
Camille N. Santiago Caminha, Fábio da Costa Campos and
Walter Franklin Correia
v
vi
Chapter 7
Contents
User-Centred Change: New Perspectives on Technology
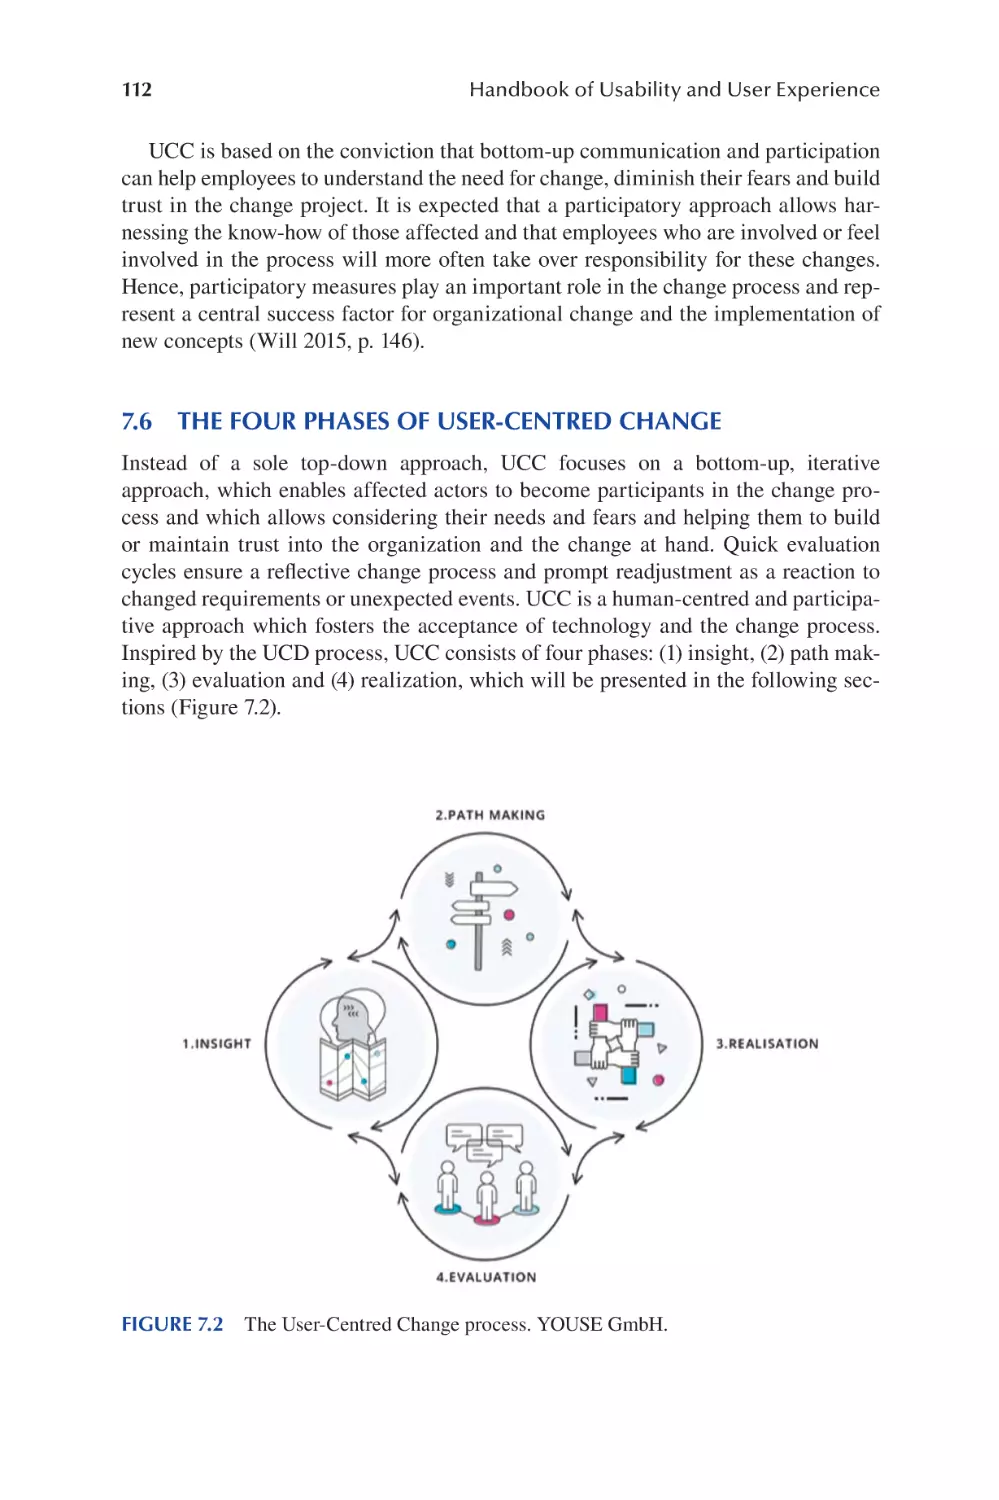
Development and Implementation.................................................... 107
Annabel Zettl, Angelika Trübswetter, Antonia Meißner,
Mathias Jenny and Sebastian Glende
SECTION 2 Usability and UX in the Health Sector
Chapter 8
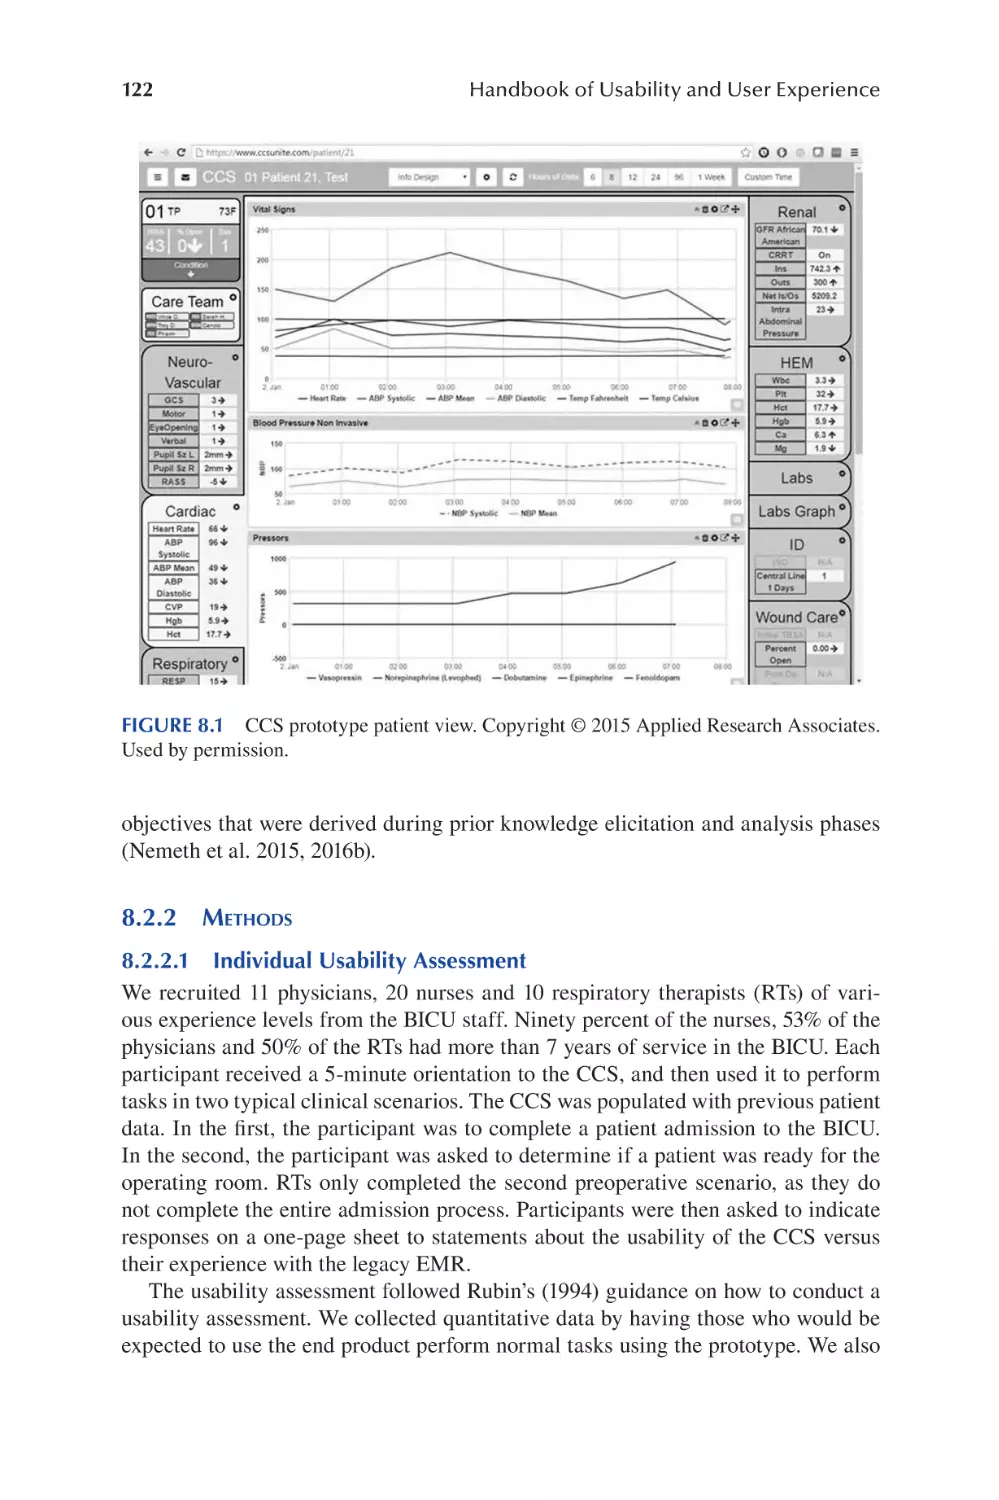
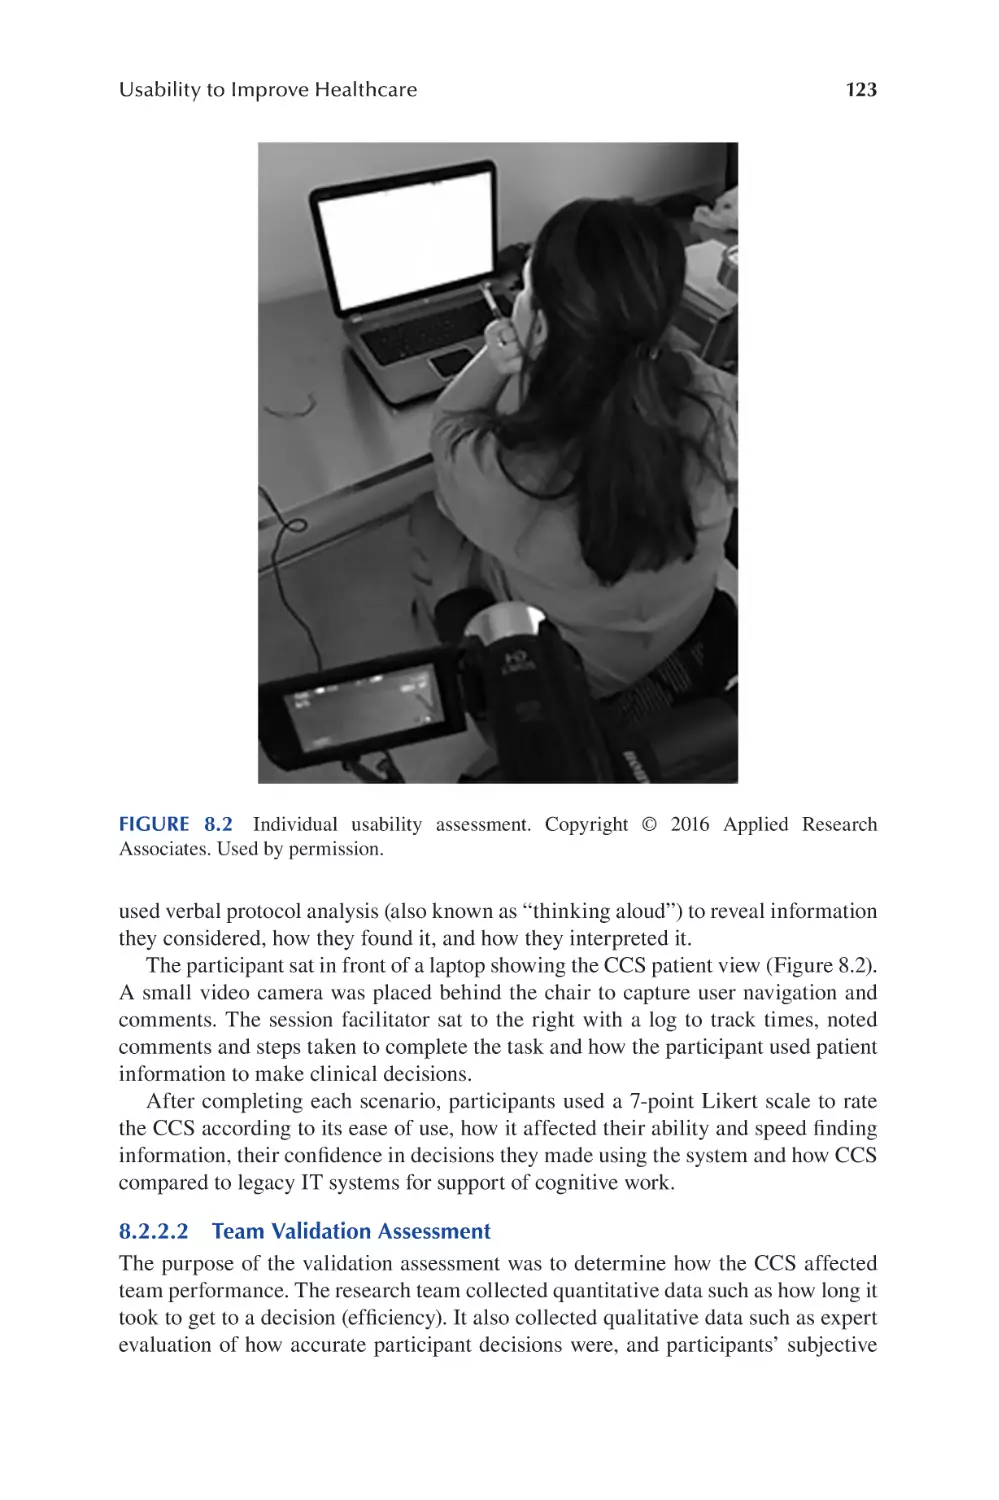
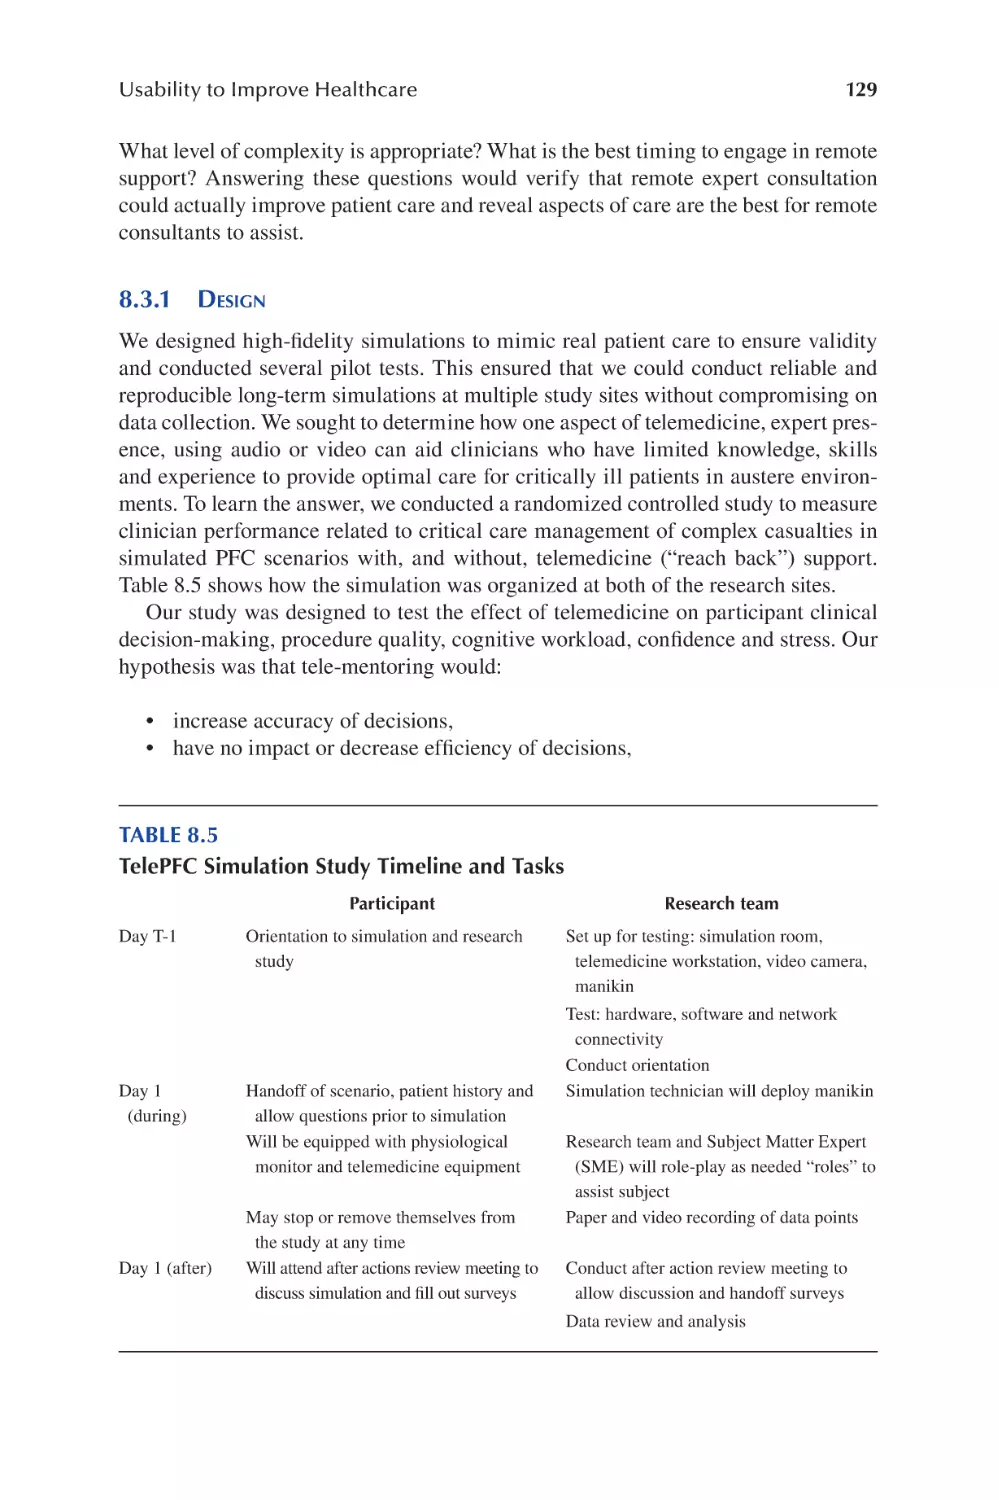
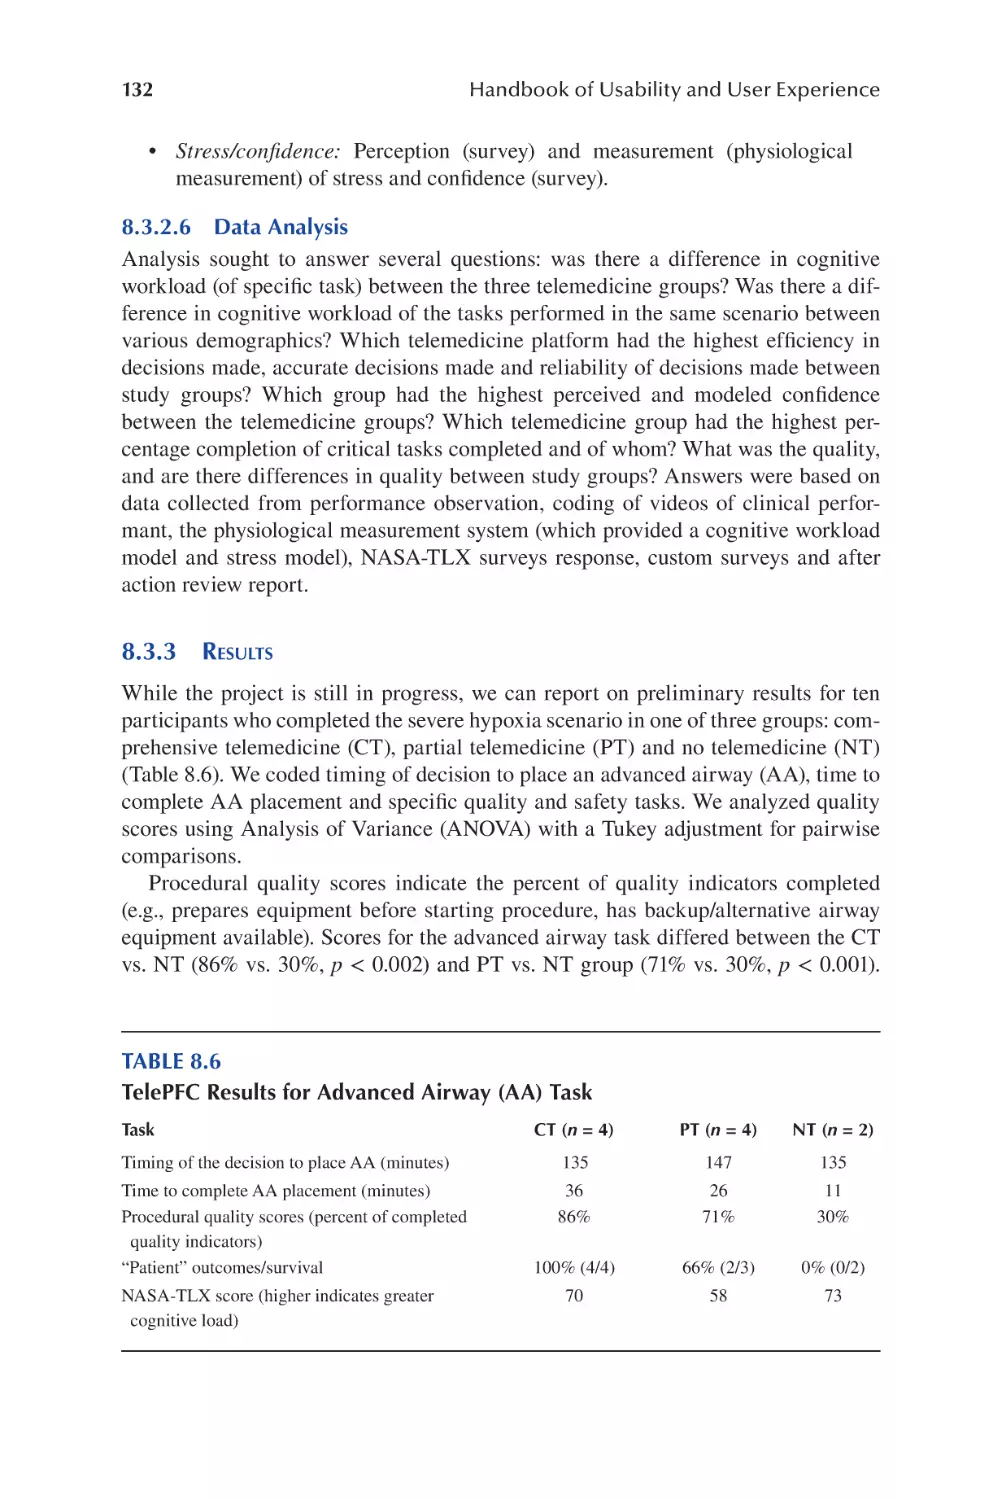
Usability to Improve Healthcare ...................................................... 119
Christopher P. Nemeth, COL Jeremy C. Pamplin, Sena Veazey
and LTC Christopher Colombo
Chapter 9
Considering Users’ Experience in the Design of Animated
Instructions for Medicines Usage: Listening to Patients and
Health Professionals ......................................................................... 137
Carla Galvão Spinillo
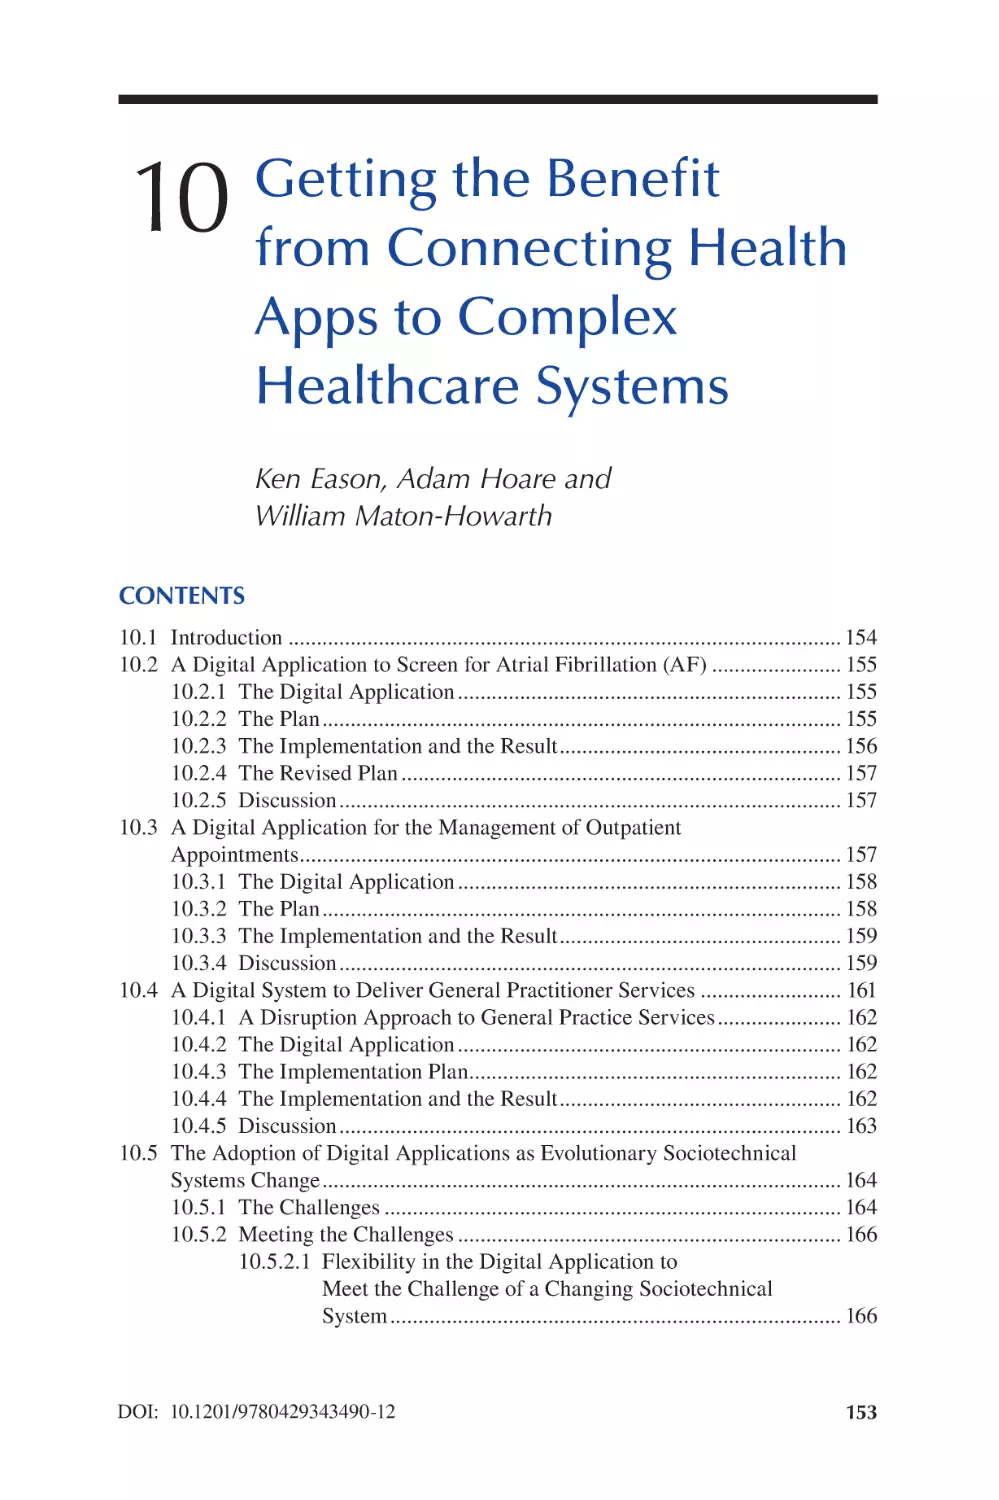
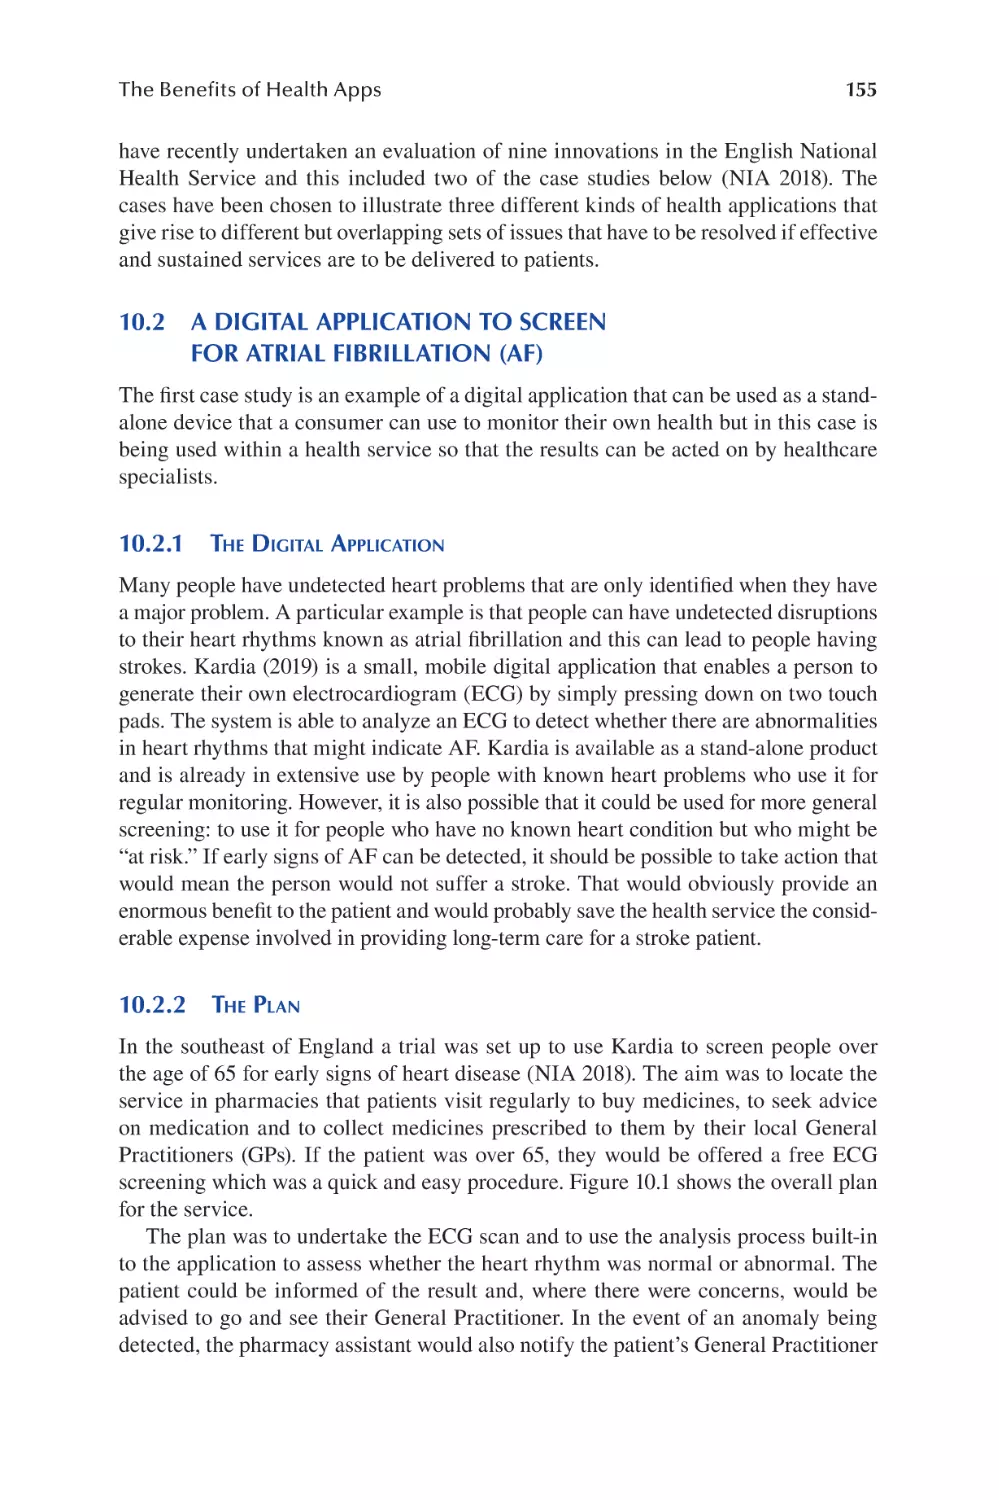
Chapter 10 Getting the Beneft from Connecting Health Apps to Complex
Healthcare Systems .......................................................................... 153
Ken Eason, Adam Hoare and William Maton-Howarth
SECTION 3 Usability and UX in the Built Environment
Chapter 11 Usability and User Experience of the Built Environment:
Concepts, Methods and Techniques................................................. 175
Ermínia Attaianese and Thaisa Sampaio Sarmento
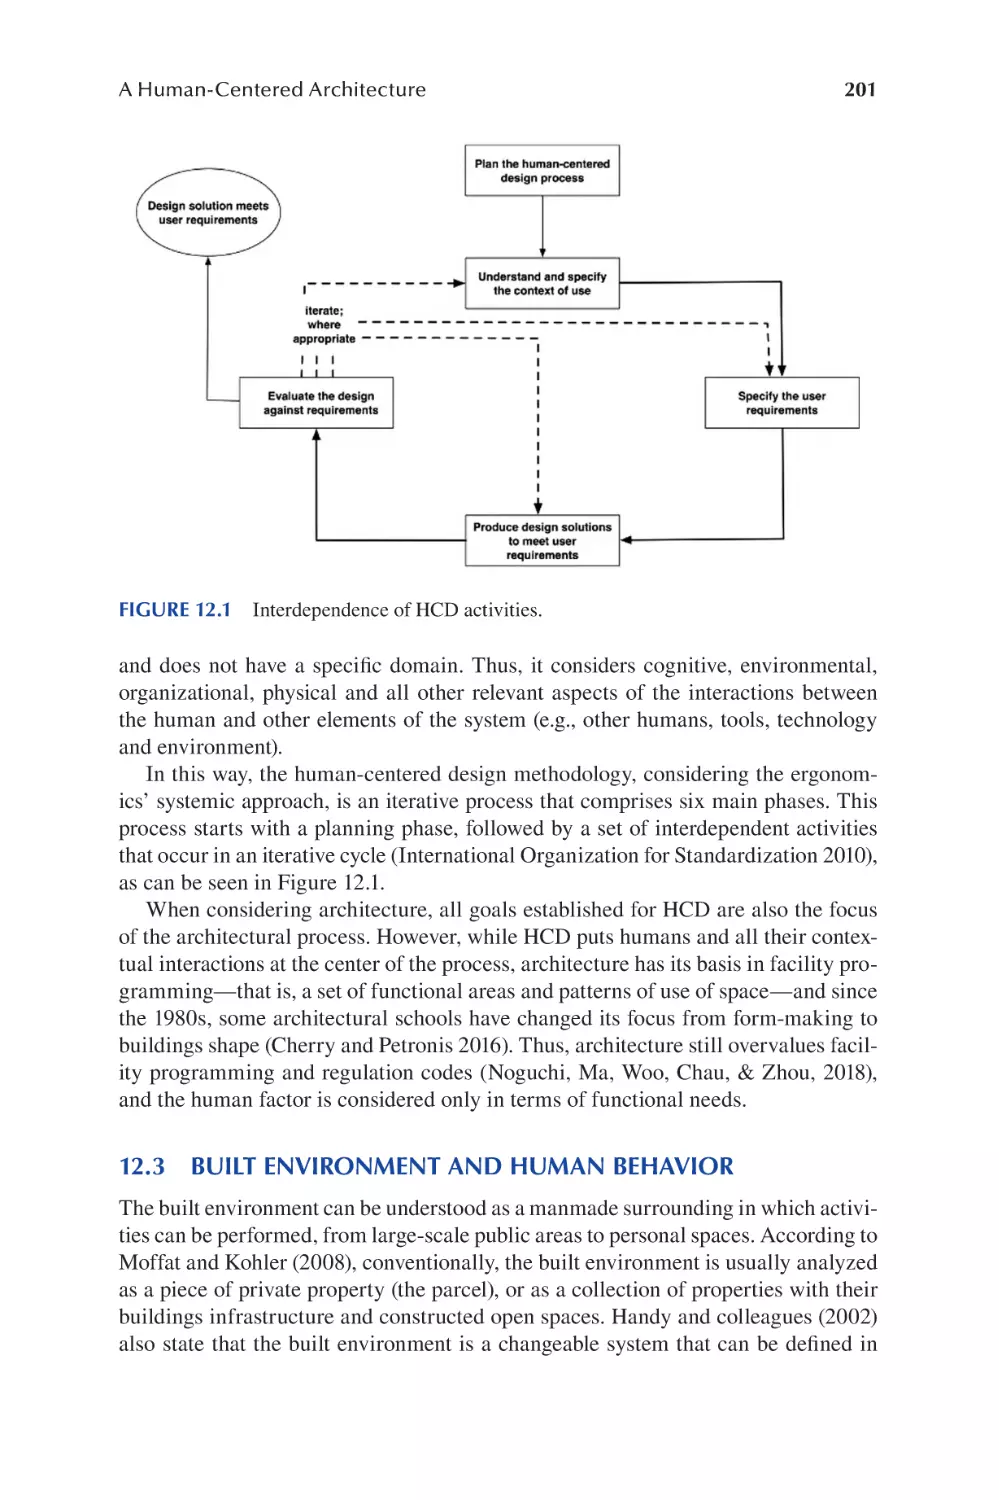
Chapter 12 A Human-Centered Architecture: Considering Usability and
User Experience in Architectural Design ........................................ 197
Elisângela Vilar, Francisco Rebelo, Paulo Noriega and
Ernesto Filgueiras
SECTION 4 Usability and UX in the Digital World
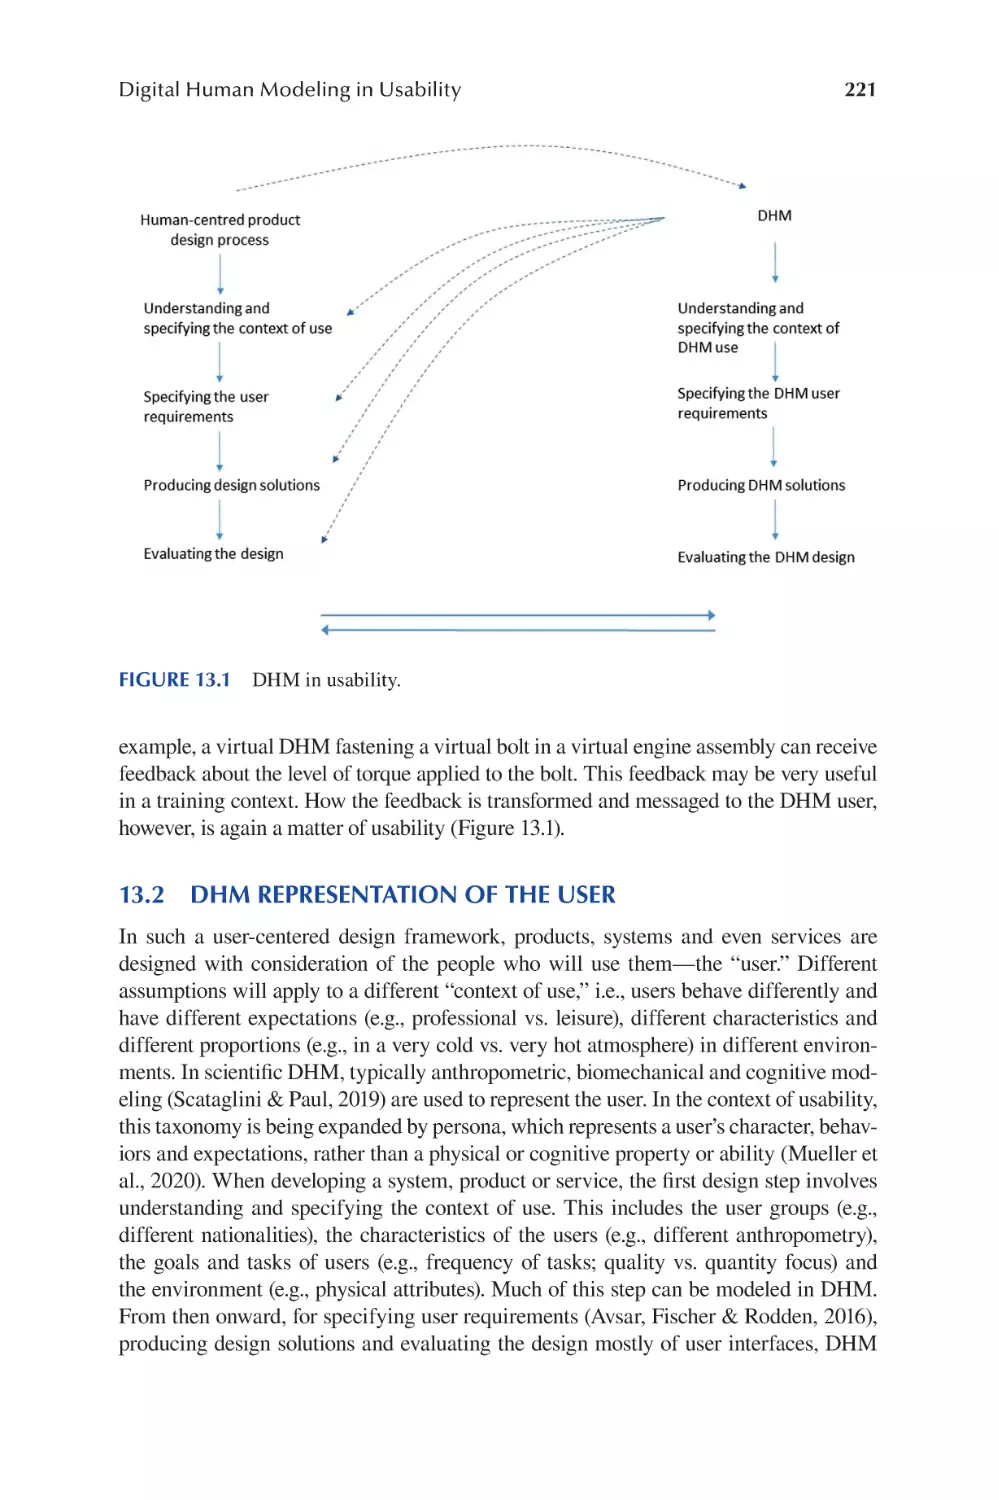
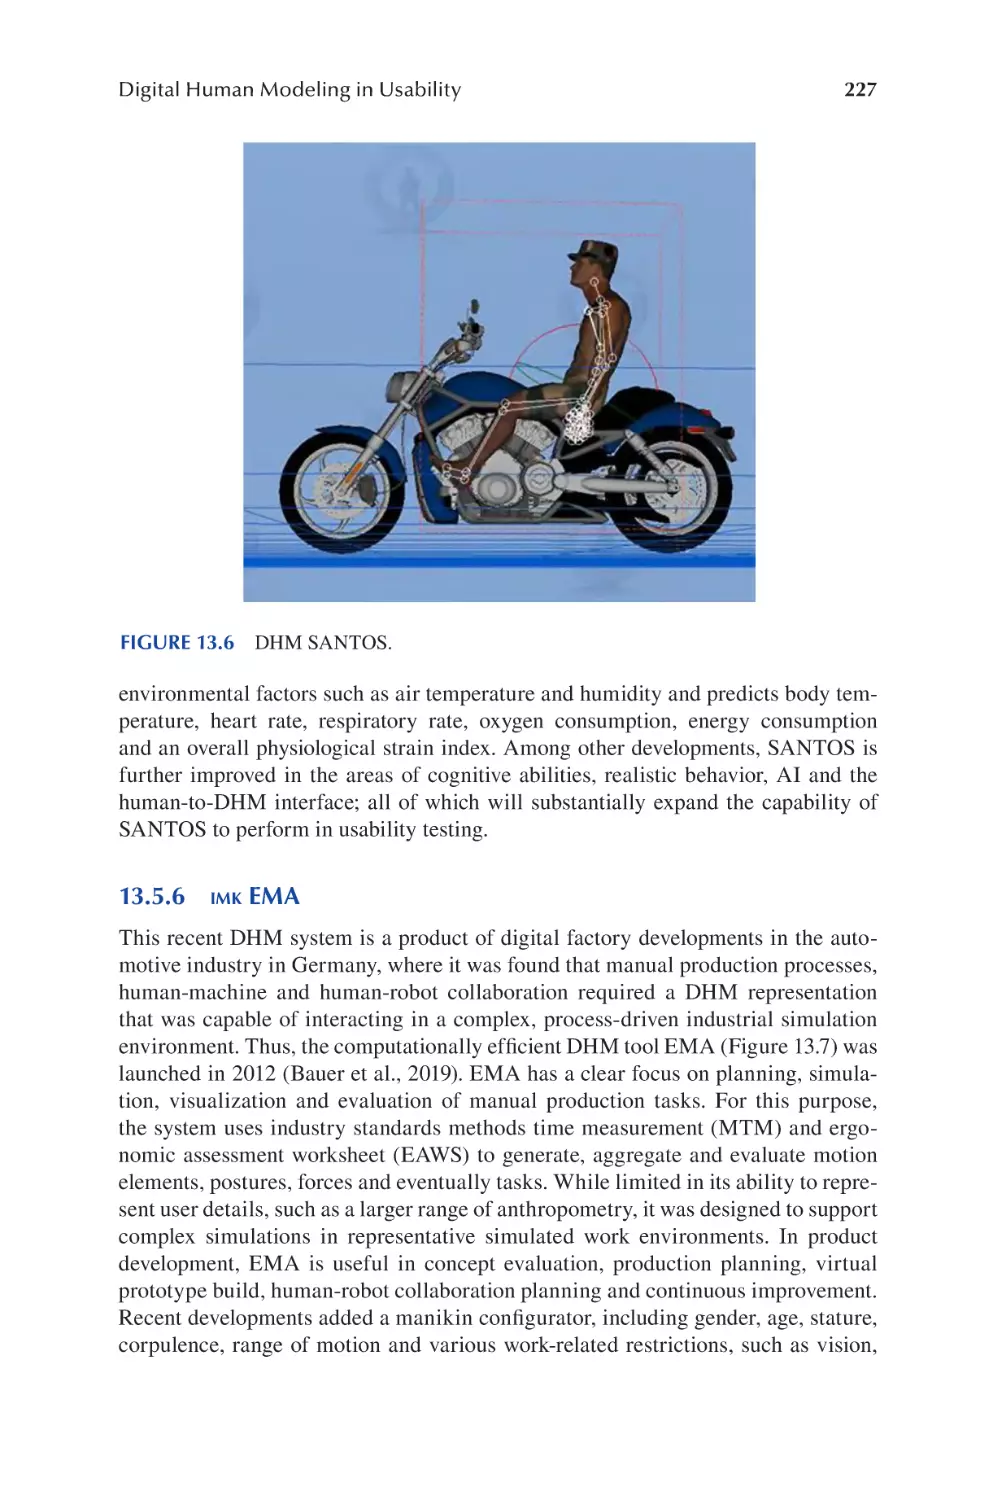
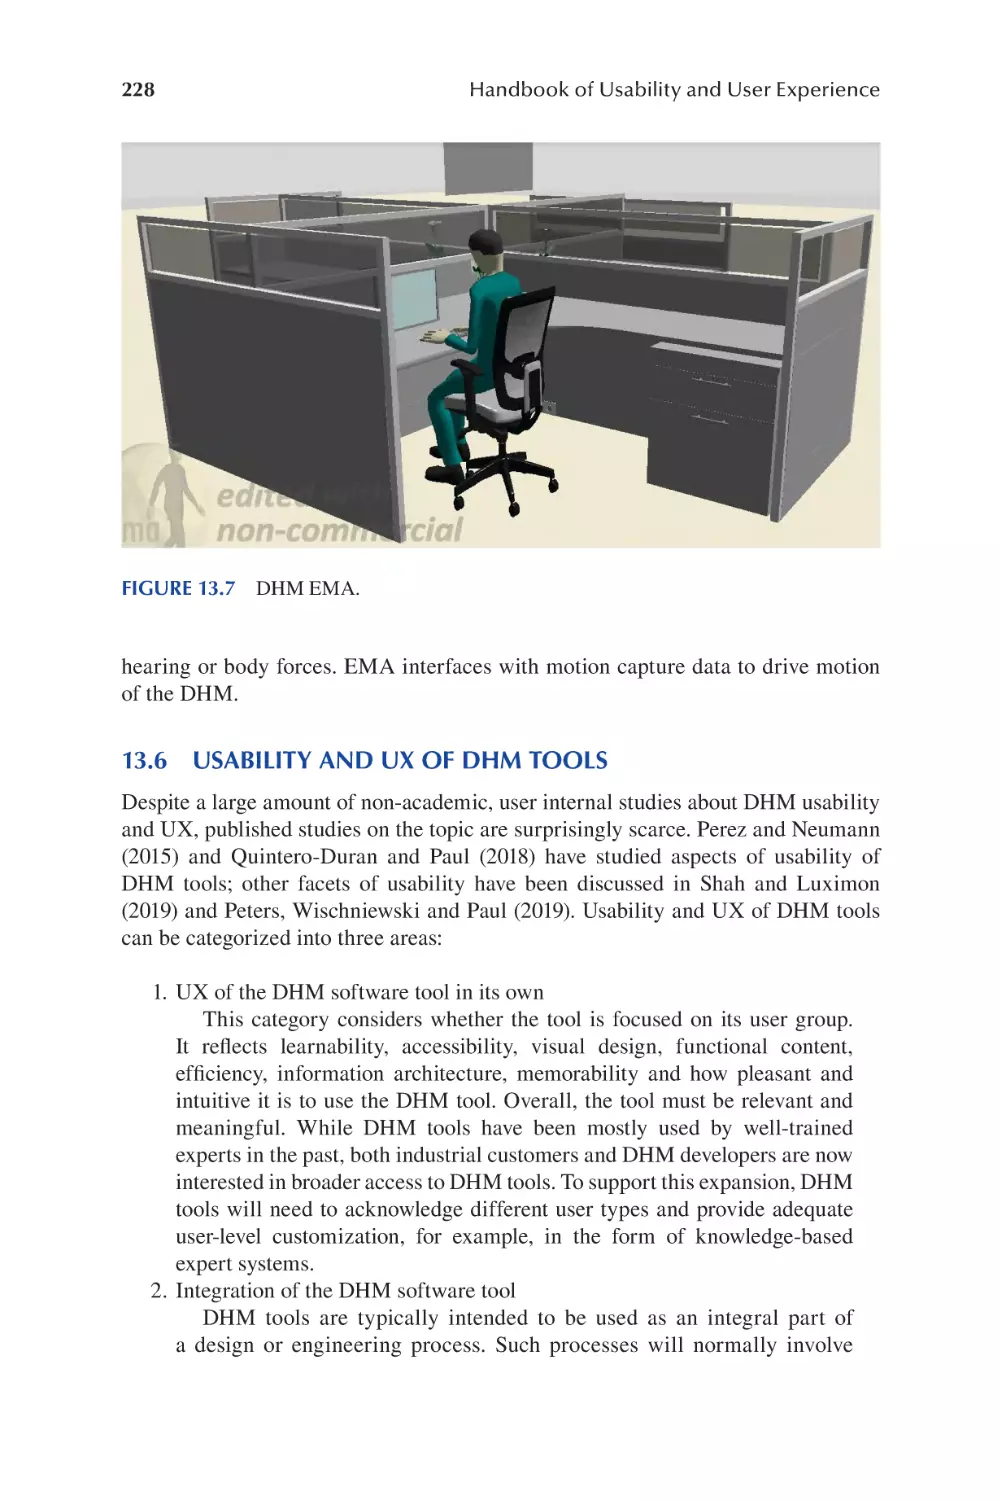
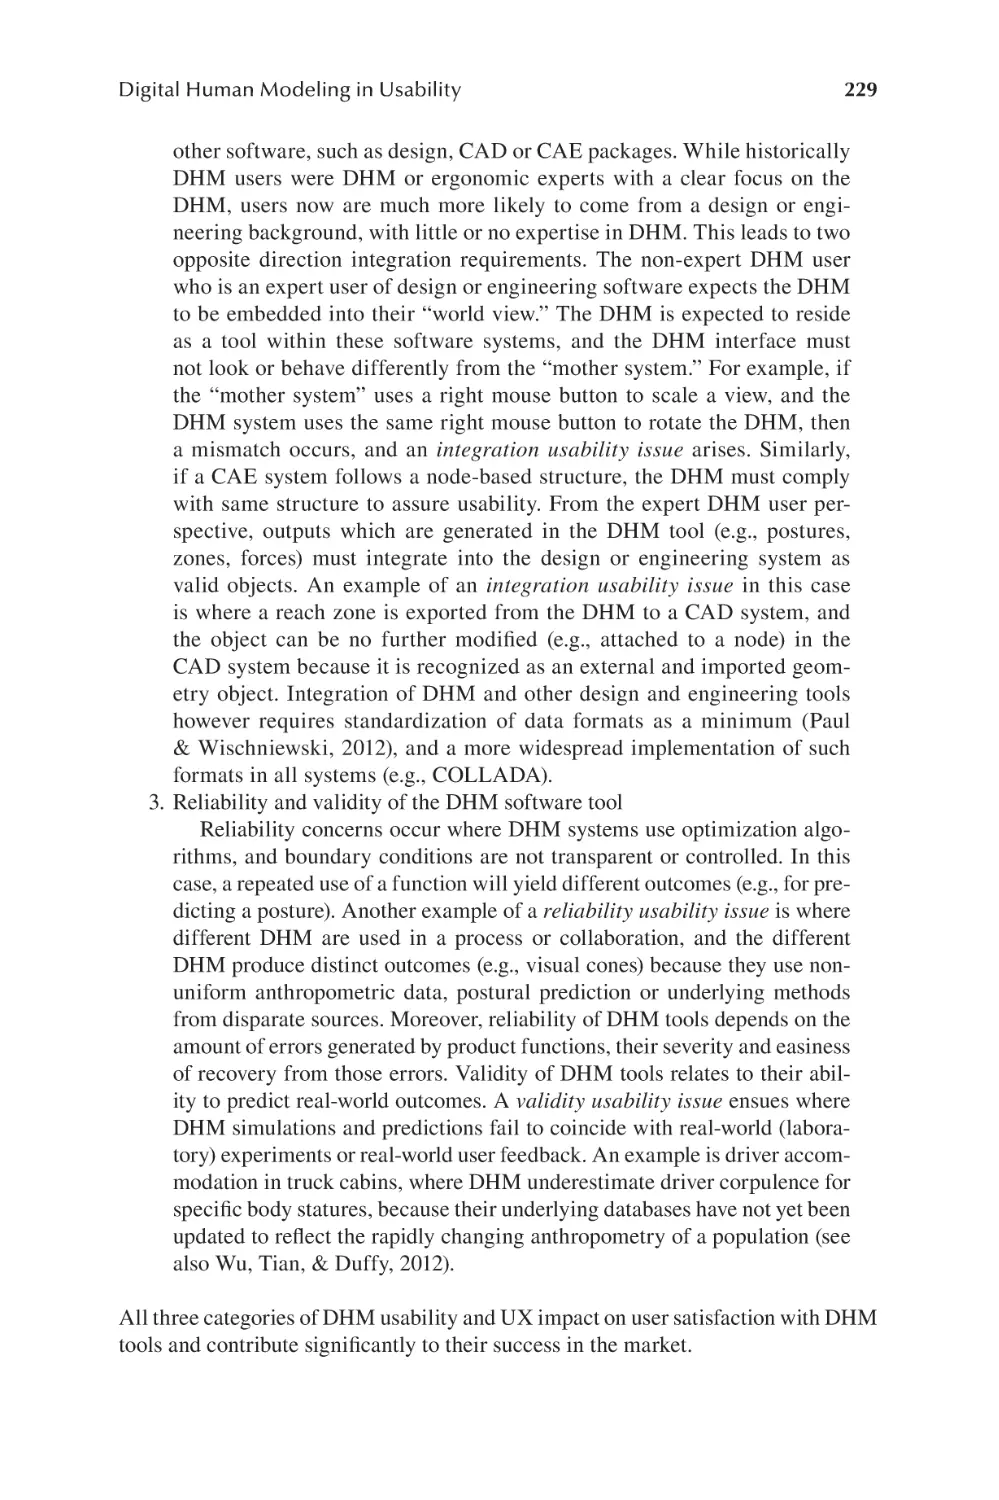
Chapter 13 Digital Human Modeling in Usability ............................................. 219
Gunther Paul
vii
Contents
Chapter 14 User Experience and Information Architecture: Interaction with
Recommendation System on a Music Streaming Platform.............. 247
Luiz Agner, Barbara Jane Necyk and Adriano Renzi
Chapter 15 Personifed Virtual Assistants: Evaluating Users’ Perception of
Usability and UX.............................................................................. 269
Claudia Mont’Alvão and Marcela Maués
SECTION 5 Usability and UX in the Currency
Context and Emerging Technologies
Chapter 16 User Experience in Remote Context: Emerging Needs ................... 291
Maria Lucia Leite Ribeiro Okimoto
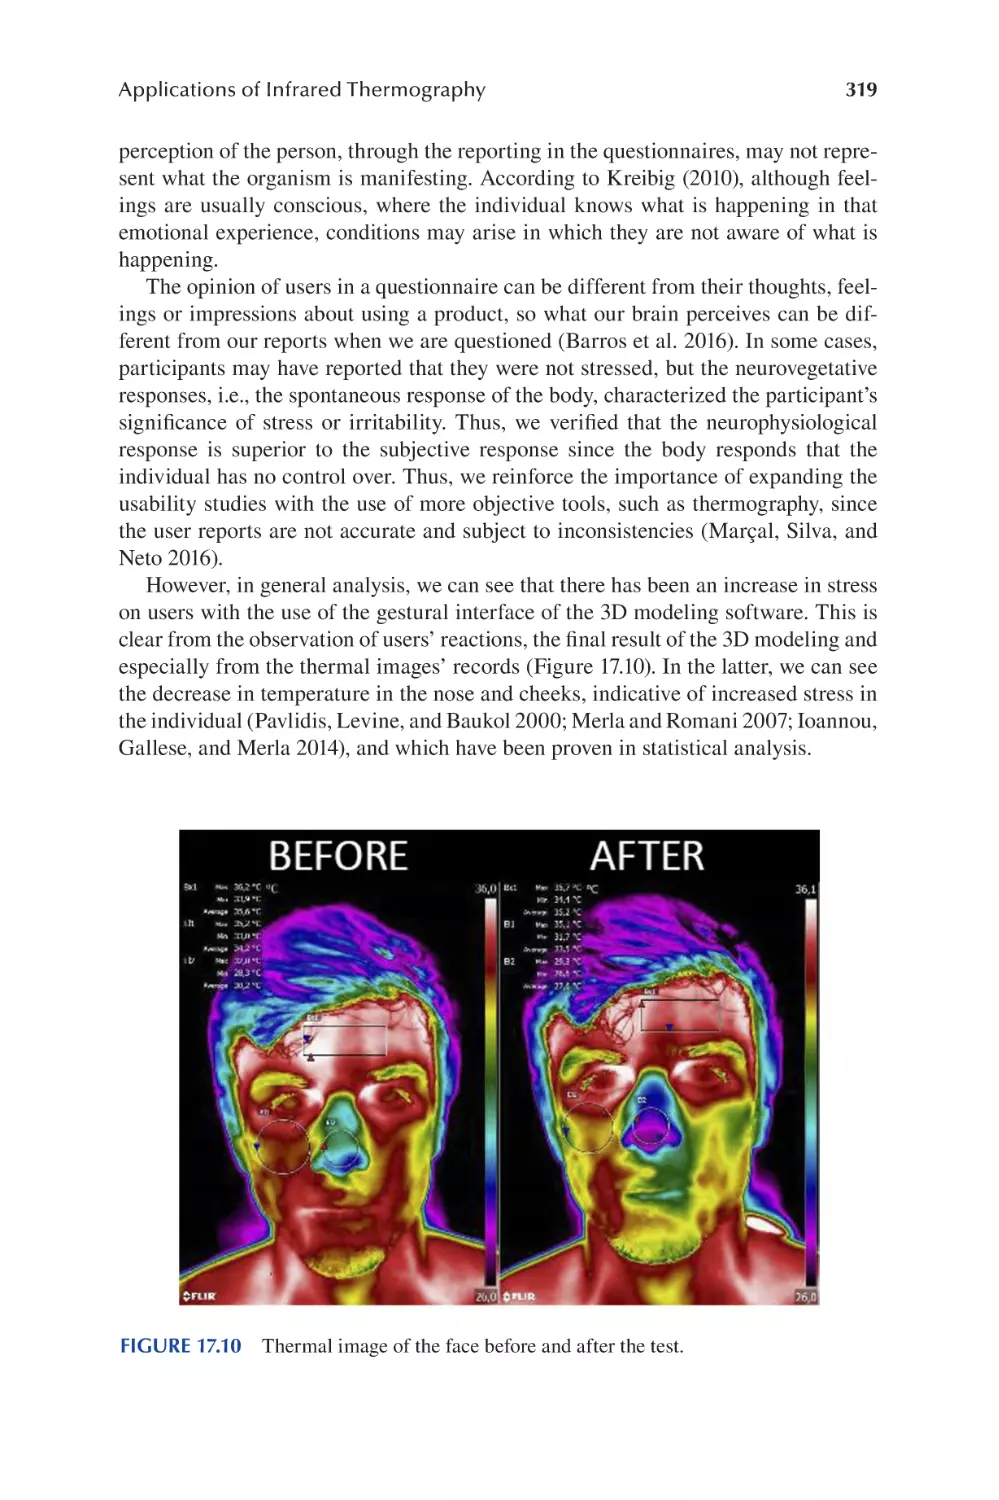
Chapter 17 Applications of Infrared Thermography to Evaluate the
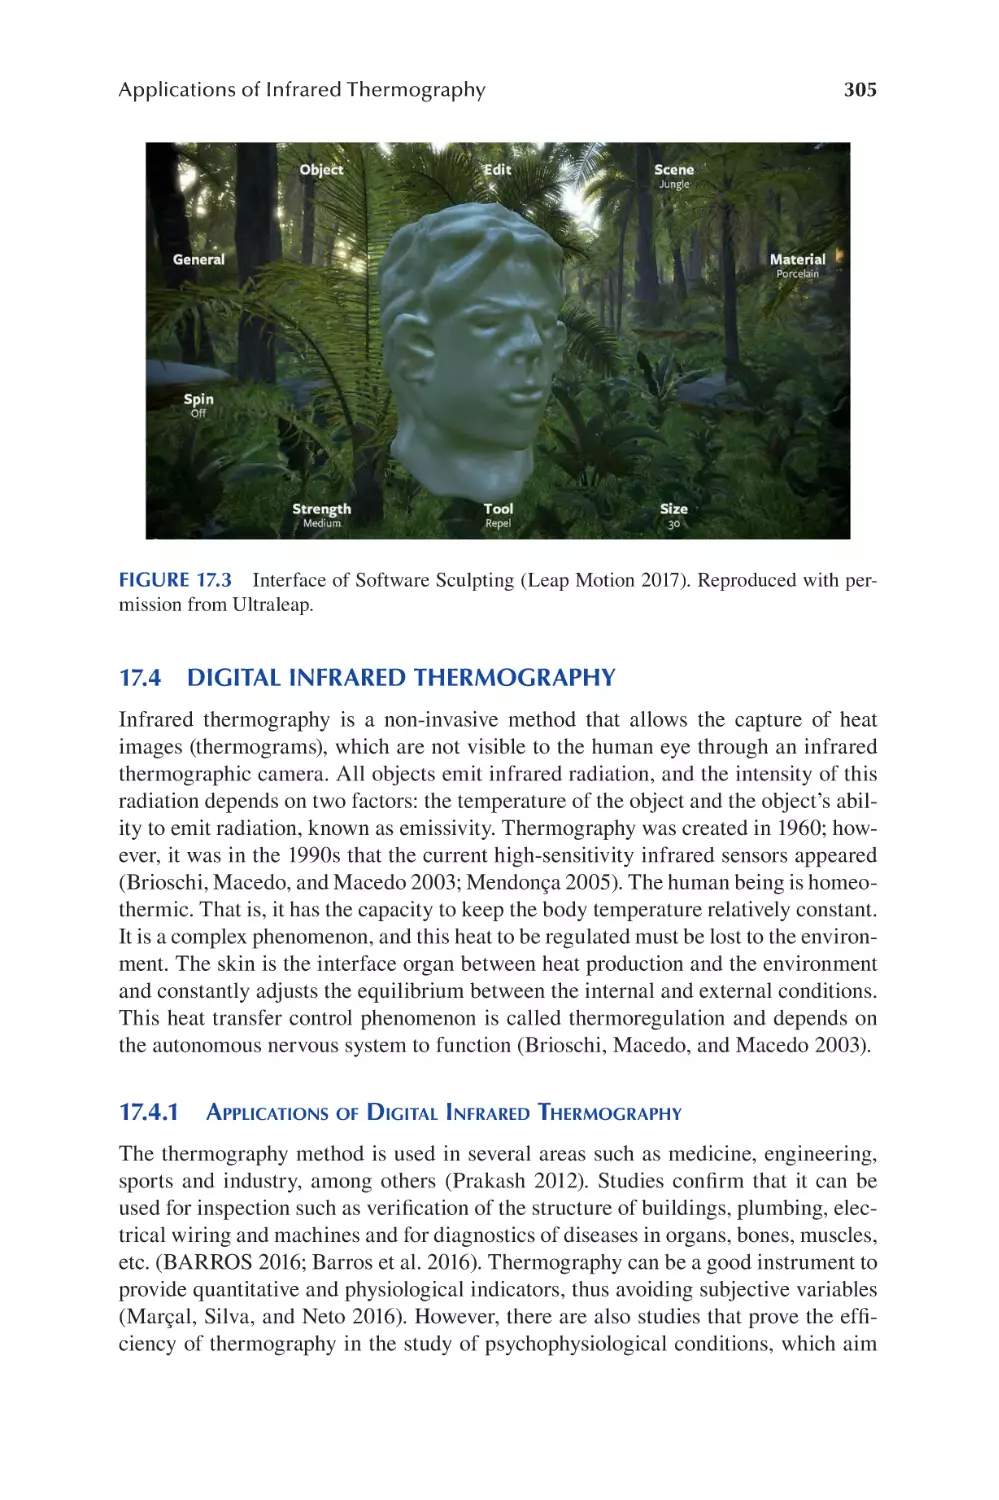
Ergonomics and Usability of Products with a Gestural Interface.... 301
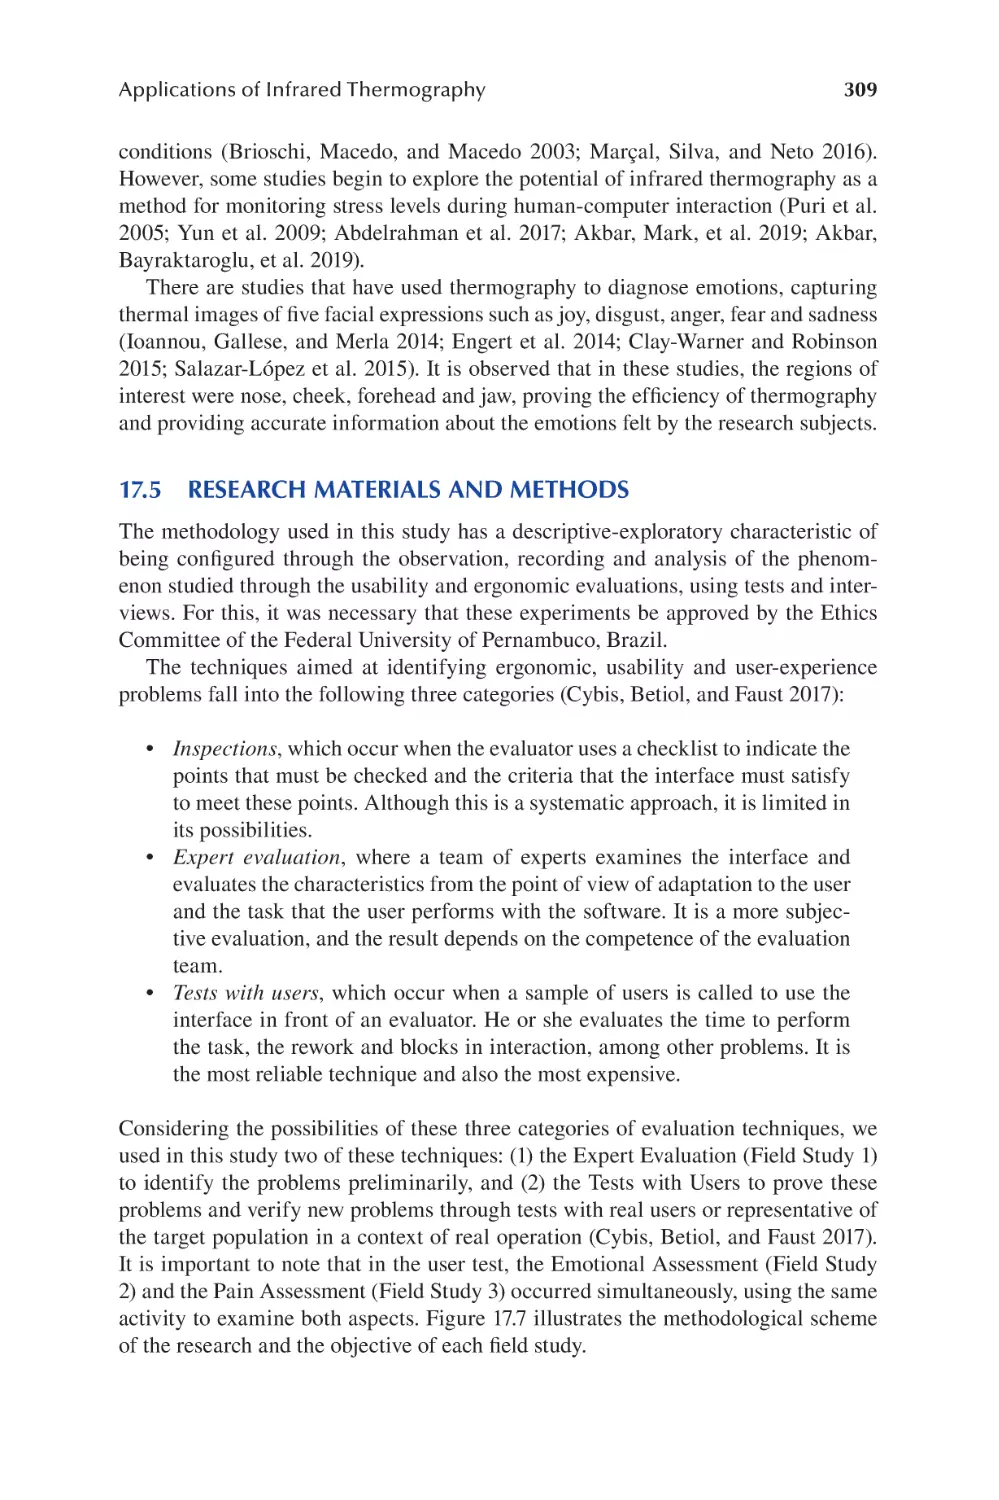
Danilo F. Vitorino, Marcelo M. Soares and Marcio A. Marçal
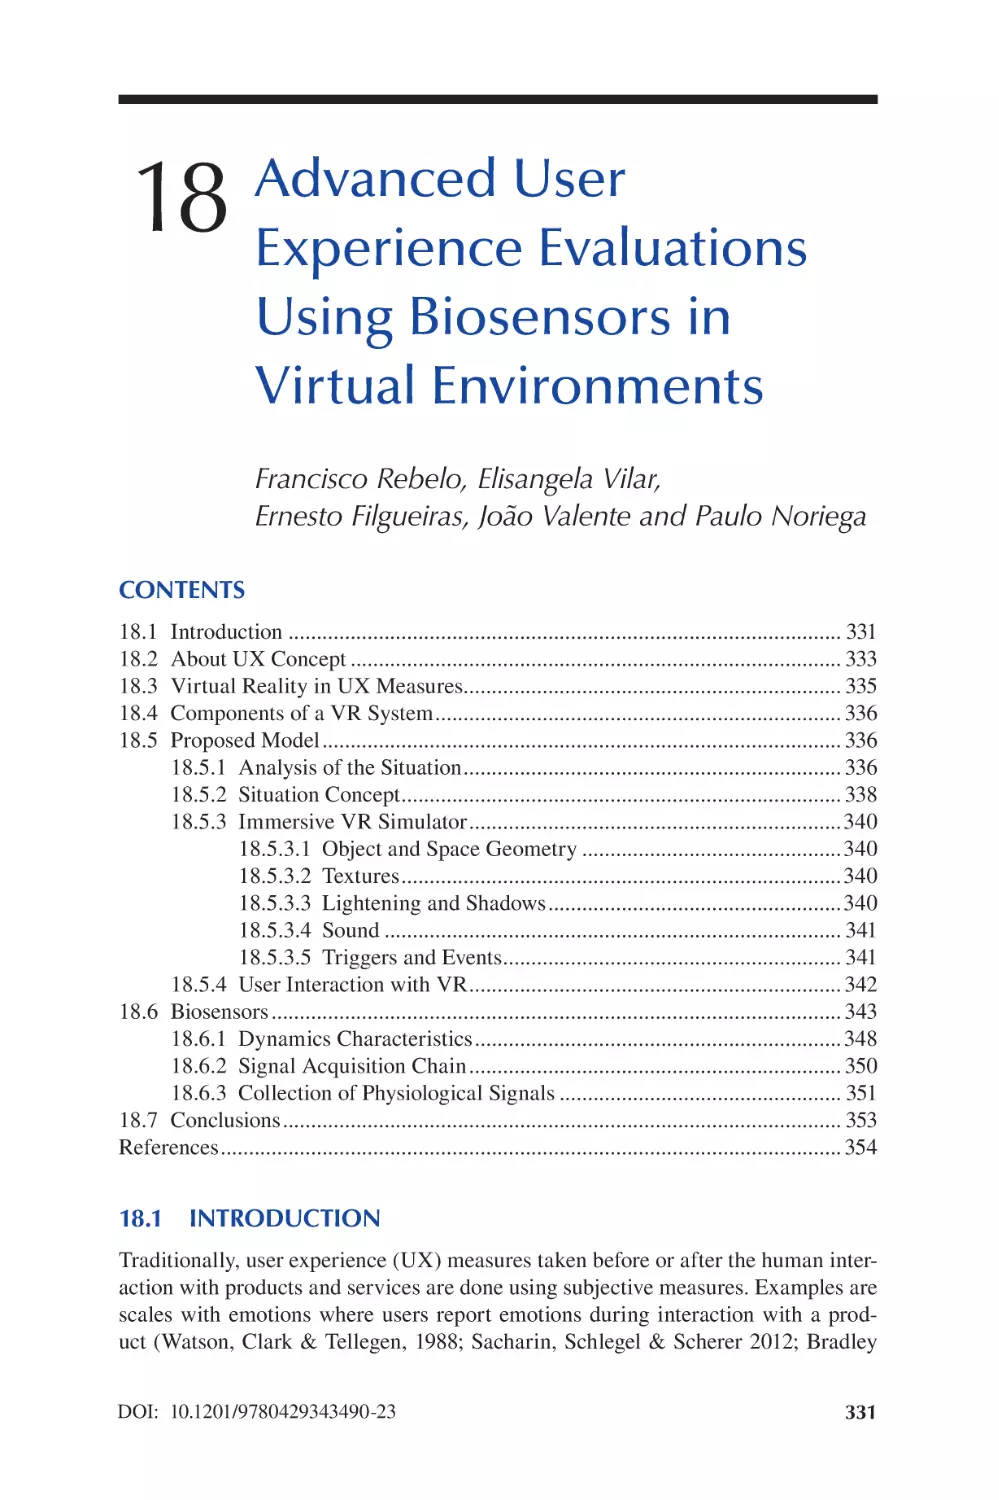
Chapter 18 Advanced User Experience Evaluations Using Biosensors in
Virtual Environments....................................................................... 331
Francisco Rebelo, Elisangela Vilar, Ernesto Filgueiras, João
Valente and Paulo Noriega
Index...................................................................................................................... 355
Preface
Each day we interact with dozens of products and systems. From the simplest to the
most complex, each with its particular forms and interaction requirements, those
forms and requirements must meet user needs. To meet the user needs, products, systems and environments must have specifc usability characteristics for this purpose.
The result of a good interaction is the by-product of a good design which provokes a
positive user experience.
Global challenges altered social and working relationships, and ways of interaction with products and systems. In order to attend to these new requirements, new
methods of interactions must be rethought to promote a better user experience.
This volume of the Handbook of Usability and User Experience will present
methods and techniques to be used to design products, systems and environments
with good usability and accessibility and user satisfaction.
This frst volume, Handbook of Usability and User Experience: Methods and
Techniques, contains 18 chapters. It is divided into fve parts. Part I includes seven
chapters, discussing methods and models for usability and UX. These chapters introduce the concepts of usability and its association with user experience, the methods
and models for usability and user experience; relevant cognitive, cultural, social and
experiential individual differences, which are important for understanding, measuring and utilizing individual differences in the study of usability and interaction
design; a human-centered, participatory framework for the development and implementation of technology in a work environment is also introduced. Additionally,
new methods and approaches for collecting usability and UX, using full-size mockup,and understanding the mechanics of focus groups to be applied by designers are
presented and discussed.
Part II, which contains three chapters, is related to usability and UX in the health
sector. The use of usability assessment to improve healthcare is presented. Three
case studies are reported in which digital applications connected patients to healthcare services are described. A study focusing on the effectiveness of and satisfaction
with animations representing four types of medicines usage conducted with userpatients and health professionals is introduced. Finally, case studies are reported in
which digital applications connected patients for healthcare services.
Part III presents two chapters on the relationship between usability and user experience in the built environment. The frst one introduces concepts, methods and techniques of usability and user experience related to the built environment. The second
chapter discusses people’s interactions with built environments, and how the new
technologies are changing this interaction and architecture.
Part IV summarizes the state-of-the-art review of usability and UX in the digital
world. Digital human modeling in usability is discussed and the application of DHM
in three different setups is shown. The remaining chapters introduce sensitive aspects
of the users’ interaction with machine learning (ML) algorithms, and how users perceive the relationship with voice interfaces and personifed virtual assistants.
ix
x
Preface
Part V presents the usability and UX in the current context and emerging technologies. In the frst chapter, the authors discuss the changes, transformation of life
and adaptation in face of the new scenario presented by the global pandemic crisis
in the year 2020 and the consequences regarding the adoption of new behaviors
and user experience. In the next chapters, a new technology based on infrared computerized thermography is presented for the evaluation of product usability, and an
integrated model to evaluate the user experience (UX), based on the user emotional
reactions and behavioral decisions, using virtual reality and biosensors technologies
is discussed and analyzed.
We hope that this frst of two volumes will be useful to a large number of professionals, students and practitioners who strive to incorporate usability and user
experience principles and knowledge in a variety of applications. We trust that the
knowledge presented in this volume will ultimately lead to an increased appreciation
of the benefts of usability and incorporate the principles of usability and user experience to improve the quality, effectiveness and effciency of consumer products,
systems and environments in which we live.
Prof. Marcelo M. Soares
Shenzhen, China
Prof. Francisco Rebelo
Lisbon, Portugal
Dr. Tareq Ahram
Orlando, USA
Editors
Marcelo Soares is currently a Full Professor at the Southern
University of Science and Technology—SUSTech, and previously at School of Design, Hunan University, China, selected
for this post under the 1000 Talents Plan of the Chinese
Government. He is also a licensed Full Professor of the
Department of Design at the Federal University of Pernambuco,
Brazil. He holds an MS (1990) in Industrial Engineering from
the Federal University of Rio de Janeiro, Brazil, and a PhD
from Loughborough University, England. He was a postdoctoral fellow at the Industrial Engineering and Management
System Department, University of Central Florida. He served as an invited lecturer
at the University of Guadalajara, Mexico, University of Central Florida, USA, and the
Technical University of Lisbon, Portugal. Dr. Soares is Professional Certifed Ergonomist
from the Brazilian Ergonomics Association, of which he was president for seven years.
He has provided leadership in ergonomics in Latin American and in the world as a
member of the Executive Committee of the International Ergonomics Association
(IEA). Dr. Soares served as Chairman of IEA 2012 (the Triennial Congresses of the
International Ergonomics Association), held in Brazil. Professor Soares is currently a
member of the editorial boards of Theoretical Issues in Ergonomics Science, Human
Factors and Ergonomics in Manufacturing and several journal publications in Brazil.
He has 52 papers published in journals, over 190 conference proceedings papers and 90
books and book chapters. He has undertaken research and consultancy work for several
companies in Brazil. Prof. Soares is co-editor of the Handbook of Human Factors and
Ergonomics in Consumer Product Design: Uses and Applications and the Handbook
of Usability and User-Interfaces (UX) published by CRC Press. His research, teaching and consulting activities focus on manufacturing ergonomics, usability engineering,
consumer product design, information ergonomics and applications of virtual reality
and neuroscience in products and systems. He also studies user emotions when using
products and techniques in real and virtual environments based on biofeedback (electroencephalography and infrared thermography).
Francisco Rebelo is Associate Professor at School of
Architecture—University of Lisbon (FA/ULisboa),
Director of the ergoUX—Ergonomics and User Experience
Laboratory, responsible for Ergonomics in the Centre of
Architecture, Urban Planning and Design FA/ULisboa,
and collaborator of the Interactive Technologies Institute—
Laboratory of Robotics and Engineering Systems IST/
ULisboa. He has been principal researcher in projects
fnanced by the Portuguese Foundation of Science and
xi
xii
Editors
Technology and multinational companies (i.e., Nokia, Siemens, Thales, Nespresso).
His activity of teacher and research is focused on human-centered design, usability
and user experience. He has published more than 170 articles and is editor of 12
books.
Tareq Ahram is a research professor and lead scientist at
the University of Central Florida. He received the Master of
Science degree in human engineering from the University
of Central Florida (UCF), Orlando, FL, and PhD degree in
industrial engineering with a focus on large-scale information retrieval systems from UCF, in 2004 and 2008, respectively, with specialization in human systems integration
(search algorithms). Dr. Ahram served in multiple research
roles in the United States, Brazil and Europe.
Contributors
Adam Hoare
Red Embedded Consulting
UK
Arminda Guerra Lopes
Polytechnic Institute of Castelo Branco
Portugal
Adriano Renzi
Microsoft Interaction Design
Research Group
USA
Barbara Jane Necyk
Escola Superior de Desenho Industrial
State University of Rio de Janeiro and
Pontifcal Catholic University of Rio
de Janeiro
Brazil
Alan Bittencourt
Feevale University
Brazil
Aleksandar Zunjic
Faculty of Mechanical
Engineering
University of Belgrade
Serbia
Alexandra Cabral
CIAUD—Research Center for
Architecture, Urbanism and
Design, Lisbon School of
Architecture
Lisbon University
Portugal
Angelika Trübswetter
YOUSE GmbH
Germany
Annabel Zettl
YOUSE GmbH
Germany
A. C. McLaughlin
North Carolina State University
USA
Antonia Meißner
YOUSE GmbH
Germany
Benjamin Holmes
David Hitchcock Limited
UK
Bernardo Bastos da Fonseca
Faculty of Technology
State University of Rio de Janeiro
Brazil
Camille N. Santiago Caminha
Department of Design
Federal University of Pernambuco
Brazil
Carla Galvão Spinillo
Federal University of Paraná
Brazil
Carlos Diaz-de-Leon
Lupa—Laboratorio Centrado en el
Usuario
Guadalajara University
Mexico
Carolina Bozzi
CIAUD—Research Center for
Architecture, Urbanism and Design,
Lisbon School of Architecture
Lisbon University
Portugal
xiii
xiv
Christianne Falcão
Catholic University of Pernambuco
Brazil
Christopher B. Mayhorn
Psychology Department
North Carolina State University
USA
Christopher Colombo
Madigan Army Medical Center and the
Uniformed Services University
USA
Christopher P. Nemeth
Applied Research Associates, Inc.
USA
Claudia Mont’Alvão
Laboratory of Ergodesign and Usability
of Interfaces
Pontifcal Catholic University of Rio de
Janeiro
Brazil
Danilo F. Vitorino
Department of Design
Federal University of Pernambuco
Brazil
David Hitchcock
David Hitchcock Limited
UK
Elisangela Vilar
Faculty of Architecture, CIAUD
Lisbon University
Portugal
Contributors
Ernesto Filgueiras
Faculdade de Artes e Letras, CIAUD
University of Beira Interior
Portugal
Fábio da Costa Campos
Department of Design
Federal University of Pernambuco
Brazil
Francisco Rebelo
CIAUD and ITI/LARSysy
Lisbon School of Architecture
University of Lisbon
Gunther Paul
Australian Institute of Tropical Health
and Medicine
James Cook University
Australia
Isabela Motta
Laboratory of Ergodesign and Usability
of Interfaces
Pontifcal Catholic University of Rio de
Janeiro
Brazil
J. M. Christian Bastien
Université de Lorraine
Laboratoire PErSEUs (UR 7312)
Metz, France
E. Brunsen
North Carolina State University
USA
Jeremy C. Pamplin
U.S. Army Telemedicine and
Advanced Technology Research
Center, and the Uniformed Services
University
USA
Erminia Attaianese
Department of Architecture
University of Naples Federico II
Italy
João Valente
Polythecnic Institute of Castelo
Branco
Portugal
xv
Contributors
Juliana Avila-Vargas
Lupa—Laboratorio Centrado en el
Usuario
Guadalajara University
Mexico
Ken Eason
The Bayswater Institute
UK
Marcelo M. Soares
School of Design
Southern University of Science and
Technology—SUSTech
China
and
Department of Design
Federal University of Pernambuco
Brazil
Kevin Falzone
Université de Lorraine
Laboratoire PErSEUs (UR 7312)
Metz, France
Marcio A. Marçal
Federal University of Vales do
Jequitinhonha and Mucuri
Brazil
Linda Lemegne
Graubner Industrie-Beratung GmbH
Germany
Luiz Agner
Brazilian Institute of Geography and
Statistic (IBGE)
Brazil
Manuela Quaresma
Laboratory of Ergodesign and Usability
of Interfaces
Pontifcal Catholic University of Rio de
Janeiro
Brazil
Marcela Pedroso Maués
Pontifcal Catholic University of Rio de
Janeiro
Brazil
Marcello Silva e Santos
Centro Universitário Geraldo
DeBiase and Faculty of
Technology
State University of Rio de Janeiro
Brazil
Marco Neves
CIAUD—Research Center for
Architecture, Urbanism and Design,
Lisbon School of Architecture
Lisbon University
Portugal
Maria Lúcia Leite Ribeiro Okimoto
Federal University of Paraná
Brazil
Maria Victoria C. Aguilera
Faculty of Technology
State University of Rio de Janeiro
Brazil
Martin Maguire
Loughborough University
UK
Matheus Correia
Pontifcal Catholic University of Rio de
Janeiro
Brazil
Mathias Jenny
YOUSE GmbH
Germany
xvi
Miskeen Rahman
David Hitchcock Limited
UK
Nelson Tavares Matias
Faculty of Technology
State University of Rio de Janeiro
Brazil
Nilo Antonio S. Sampaio
Faculty of Technology
State University of Rio de Janeiro
Brazil
Nina Ferreri
Psychology Department
North Carolina State University
USA
Paulo Noriega
CIAUD and ITI/LARSysy
Lisbon School of Architecture
University of Lisbon
Rafael Gonçalves
Laboratory of Ergodesign and Usability
of Interfaces
Pontifcal Catholic University of Rio de
Janeiro
Brazil
Ragan Wilson
Psychology Department
North Carolina State University
USA
Regina de Oliveira Heidrich
Feevale University
Brazil
Roger Ball
School of Industrial Design
Georgia Institute of Technology
USA
Contributors
Sarah Ventura-Basto
Lupa—Laboratorio Centrado en el
Usuario
Guadalajara University
Mexico
Sebastian Glende
YOUSE GmbH
Germany
Sebastian Graubner
Graubner Industrie-Beratung GmbH
Germany
Sena Veazey
U.S. Army Institute of Surgical Research
USA
Sheisa Bittencourt
Feevale University
Brazil
Somnath Gangopadhyay
Occupational Ergonomics Laboratory,
Department of Physiology, University
College of Science and Technology
University of Calcutta
India
Sónia Rafael
Faculdade de Belas-Artes,
Lisbon University, ITI—Interactive
Technologies Institute / LARSyS
Portugal
Tareq Ahram
University of Central Florida
USA
Thaisa Sampaio Sarmento
Faculty of Architecture and Urbanism
Federal University of Alagoas
Brazil
xvii
Contributors
Toshiki Yamaoka
Kyoto Women’s University
Japan
William Maton-Howarth
The Bayswater Institute
UK
Victor M Almeida
Lisbon University
Portugal
Yuanqing Tian
School of Industrial Design
Georgia Institute of Technology
USA
Vladimir Lesnikov
SAT Media Group
Belgrade, Serbia
Walter Franklin Correia
Department of Design
Federal University of Pernambuco
Brazil
W. B. Hicks
North Carolina State University
USA
Zuli Galindo-Estupiñan
Lupa—Laboratorio Centrado en el
Usuario
Guadalajara University
Mexico
Section 1
Methods and Models
for Usability and UX
1
Usability and User
Experience
Methods and Models
Marcelo M. Soares, Tareq Ahram
and Christianne Falcão
CONTENTS
1.1 Introduction ...................................................................................................... 3
1.2 What Is Usability ..............................................................................................4
1.3 Focusing on the User ........................................................................................ 5
1.4 Understanding Consumer Products ..................................................................8
1.5 Context of Use for Consumer Products ............................................................ 9
1.6 Usability Measurement................................................................................... 10
1.7 Usability Models............................................................................................. 12
1.8 Conclusion ...................................................................................................... 18
References................................................................................................................ 19
1.1
INTRODUCTION
In the home, offce and leisure environments, we deal with a wide variety of consumer products on a daily basis. To gain a cutting edge in an increasingly competitive market space, manufacturers are constantly looking for ways to improve the
quality of their products. On the other hand, users are increasingly demanding of
better quality products and have less tolerance for diffculties in the use of products,
giving greater emphasis to designs and products that are easy to use and allow for
ease of learning and better aesthetics (Han et al., 2001). If a product or system is
diffcult to use, it wastes user time and causes frustration and discomfort, thereby
discouraging its use.
The market for consumer products is characterized by constant change. It is
expected to add new features and functionality to products, making them increasingly complex over the years. Manufacturing companies are expected to keep up
with this rapid technological evolution, designing and manufacturing products not
only with better performance but also lower costs at an accelerated pace. According
to Acosta et al. (2011), companies identify usability as a strategic factor in product
competitiveness, effciency, differentiation and best practice, which can be integrated
into the different phases of the product development lifecycle. Product development,
DOI: 10.1201/9780429343490-2
3
4
Handbook of Usability and User Experience
according to Krishnan and Ulrich (2001), is the transformation of the market opportunity into a product available for sale to consumers and users.
Based on the belief that the design of the product must meet the user’s needs,
usability focuses on creating an excellent user experience, which is in the process
that underlies the real goal of usability. The user experience and usability evaluation
process starts by looking at who uses the product, understanding their goals and
needs and selecting the right techniques to answer the question: does this product
meet the user’s needs and requirements?
Usability evaluation focuses on understanding how people use the product, with
regard to the interaction between the user, the task and the product. Some authors
(Jordan, 1998; Norman, 2006; Preece et al., 2002; Göbel, 2011) report that in the
past, many products were designed with little emphasis on the user, and this caused
frustration and wasted time as they did not offer adequate usability. With the saturation of the market and consistent technological advancements, aspects such as aesthetics and features that can be associated with usability have become ever more
important for determining product value and brand success. In parallel, this issue
was emphasized by the growing complexity of products, requiring greater attention
to user needs, and in order to allow technical benefts to be explored. During this
phase of identifying user needs and requirements, which started in the 1990s, usability parameters received greater attention, initially with a focus on market studies,
engaging the user more and more in the design process.
Although usability is well known as a key element in product design, the concepts
used are derived from the feld of human–computer interaction (HCI), highlighting
the need to formalize the concept when it comes to consumer products. This chapter
introduces various usability concepts, presenting the evolution of their application in
consumer products over the past three decades.
1.2
WHAT IS USABILITY
The concept of usability was frst discussed by Shackel (1984), who defnes
usability of a system or equipment as its ability to be used easily and effectively,
in human functional terms, by a specifc range of users, when receiving adequate
training and support for fulflling a specifc task, within a certain expected time
interval and environmental factors. That is, usability corresponds to the capacity of product, system or service to be used easily and effectively by humans
(Shackel, 1991, p. 24).
Usability is better known and better defned in terms of the approach to HCI.
These concepts are used to improve the user–software interface side of the product (Nielsen, 1993). The importance of this dimension in the design of consumer
products was frst considered in the early 1990s by companies such as Thomson
Consumer Electronics, Apple Computers and Northern Telecom (March, 1994).
Later, Jordan (1998, 2000) noted a theme of growth with the increase of publications
in the feld, more usability professionals being employed, more research conferences
on the subject and greater public awareness of the feld of usability and user experience. Since the last decade, usability has been applied on a large scale to design
Usability and User Experience
5
products that are easy to use, easy to learn, accessible and comfortable, making our
daily life less stressful and more productive.
Nielsen (1993) considers usability as an aspect, among others, that infuences the
acceptance of a product, whose objective is to develop transparent interfaces capable
of offering easy, pleasant, effective and effcient interaction, allowing the user full
control of the environment without becoming an obstacle during the interaction.
Nielsen also suggests that usability and ease of use can together form a usable
system. The usefulness of the product can be defned as its ability to perform its
intended functions and necessary operations, and that usability corresponds to how
well the product works so the user can use its functionality. This view is supported
by Eason (1984), stating that usability can limit the degree to which a user can perform a potential objective of a computer system.
Steve Krug, in his famous book Don’t Make Me Think! (Krug, 2000), features
usability from a simple perspective, with the certainty that something works well
when a person with skill and average experience (or even minimal experience) can
use a product for which it is intended and designed, without getting confused or frustrated. According to Bevan (1995), usability is often defned as the ease of use and
acceptability of features in a system for a particular class of users who perform specifc tasks in a determined environment. This will facilitate user performance and
overall product satisfaction, while acceptability infuences the system when used.
However, the expression “easy to use” offers little guidance on the product interface.
The International Organization for Standardization issued the ISO 9241-11 (ISO,
2018) which brings the most classical and recognized usability concept together in a
unifed standard: “extent to which a system, product or service can be used by specifed users to achieve specifed goals with effectiveness, effciency, and satisfaction in
a specifed context of use.”
Effectiveness refers to “the extent to which an objective or task is achieved.
Effectiveness measures the relationship between the results obtained and the intended
objectives; that is, to be effective is to achieve a given objective.” Effciency refers to “the
amount of effort required to achieve an objective.” The less the effort, the greater the effciency. Satisfaction refers to the level of comfort the user feels when using a product and
how acceptable the product is to the user in relation to the desire to achieve their goals.
Comparing the defnition of ISO as proposed by Shackel (1991), it is evident that
importance is given by the researcher to the fact that usability is dependent on the
context of use. Jordan (2006) corroborates by highlighting that the defnition given
by ISO makes it clear that usability is not simply a product property in isolation,
but that it also depends on who is using the product, the objective that it intends to
achieve and in what environment the product is being used.
Thus, the usability of the product must be assessed from three aspects: the user,
the product and the context of use.
1.3
FOCUSING ON THE USER
Nielsen (1993) highlights that the two most important considerations for usability
are the user’s task and users’ individual characteristics and differences. For Norman
6
Handbook of Usability and User Experience
(1999), product development is focused on the human being and the process must be
initiated with users and their needs in mind instead of technology. The technology’s
purpose is to serve the user through its suitability to the task. If there is any complexity, it must be inherent in the task and not the tool.
The user, according to Ward (2011), refers mainly to the category of population
inserted between the owner of the technology and the end-user of a particular type of
consumer product. Some designers use the term “target market” to describe a population of users for which a product is being developed. It is also important to consider
that, in certain types of products, people involved in installation and maintenance
can also be considered users if their needs are identifed as having an impact on the
design process and on the fnal results.
Dejean and Wagstaff (2012) propose the following question to identify all users
and divide them between the direct and indirect users: does the “user” choose the
product with which it is interacting or not? Therefore, if the answer is yes, then it’s a
direct user; if the answer is no, then it is an indirect user.
On many occasions people may contact involuntarily products being classifed
as indirect users. Considering the behavior of users and the consequence of use, it
is important to identify the indirect users to preview the role in the evaluation of
usability. On the other hand, direct users correspond to people who have a voluntary
choice to use the product (Dejean; Wagstaff, 2012). An example is a wheelchair user
(the direct user) and their carer (the indirect user).
Therefore, the defning of the user must include all those whose work is affected
by the product in some way. Before starting design, it is important to consider the
characteristics of those who will use the fnal product (both the direct and the indirect user), for whom the product is intended. According to Jordan (1998), this can be,
for example, the general public, a private session of a consumer population, a small
group of specialists or even an individual user. The important aspect here is to understand the characteristics of people who will use the product and information about
the various features of the product, and what are the implications caused by their use;
for example, some products are safety-critical systems, while others are for entertainment; therefore, for example, reliability and redundancy factors can affect various features to prevent or reduce the chance of human error and mistakes. Consider,
for example, power plants or control security systems. From there (where accuracy
and error-free are essential), requirements are generated so that users’ needs are
addressed in the project.
The population of users with special needs is of particular importance to usability evaluation and product design. Some products must meet specifc requirements
and be used by various user types, whether senior citizens, the elderly or those with
visual, auditory, cognitive-mental or movement impairments. Kumin et al. (2012)
carried out a study to assess how users with Down syndrome could use touch screens
in their tasks. The research sought solutions so that usability tests could be conducted using what is termed in the feld of usability evaluation as a “participant
profle,” as well as to identify potential challenges encountered in the use of tablets.
Jordan (1998) draws attention to the need to know the user’s physical and cognitive characteristics while designing consumer products. The user’s physical
Usability and User Experience
7
characteristics refer to people’s individual measurements for the purpose of understanding human physical variation, for example, height, reach or strength. Cognitive
characteristics include specifc knowledge that users may have, such as attention,
knowledge, information processing, attitudes expected by users or any expectations
that users may have about a product. Such factors are susceptible to variation according to the target audience for which the product is intended.
Jordan (1998) states that to determine the target audience, some user characteristics must be considered:
• Experience: Previous experience with the product, or similar products, is
one of the factors that affects the user’s ease of use or diffculty in performing a certain task.
• Domain of knowledge: This refers to the user’s knowledge of the task and/
or if it is necessarily linked to the product used to perform it.
• Cultural background: The culture of users is also a factor that infuences
their interaction with products. Information tools must be in accordance
with local culture-population stereotypes.
• Limitations: It must be taken into account that not all users are in full
physical functionality. Many have physical and/or mental limitations that
must be considered.
• Age and gender: Seniors, adults, youth, teens and children, male or
female, should be treated specifcally. The strength, the intellectual
capacity and the performance of the tasks can be extremely affected
by these factors, thus degrading or even damaging perception of the
product’s usability.
When observing the frst three characteristics described by Jordan, these represent
a focus on the importance of observing the user’s previous experience; that is, the
knowledge acquired from interaction with the use of the product, and personal characteristics and experiences, also called “repertoire of knowledge.” In this direction,
Chamorro-Koc et al. (2009) emphasize the importance for the designer to consider
the user’s cultural knowledge and previous experience instead of following their
own personal interpretations to describe the user’s needs and the prediction of their
behavior.
There are many different types and characteristics of users. Because of this,
understanding its nature implies great diffculties, requiring efforts that go beyond
market research. Given the diffculty of classifying users, Meister and Enderwick
(2002) suggested addressing them from the following perspective:
• The user as a subject in usability and prototyping tests, where the focus
is on knowing how and how good or bad their performance is in relation to
a particular equipment or to a characteristic of this equipment.
• The user as someone who has preferences, particularly for consumer
products.
• The user as a specialist in specifc subjects, as an information provider.
8
Handbook of Usability and User Experience
1.4 UNDERSTANDING CONSUMER PRODUCTS
The human race has survived for hundreds of thousands of years, if not 2 million
years, in diverse contexts, often hostile. Human beings have always been trying to
build utensils that strengthen or complement their natural characteristics and aptitudes, for example inventing the wheel to help move heavy weights, or sewing animal cloths to survive harsh winters and ice ages. This has made it possible for human
beings to survive in challenging times, thus allowing human dominance in the environment in which they live. In this way, some human needs are met by the use of
objects, which means products being used. Such products refect the environmental,
social and cultural conditions of a society, and can be produced in an artisanal or
industrial way. In the industrial form, products are produced by means of industrial
processes for mass consumption, and the product becomes a particular offer that a
company provides to customers (Kahn, 2001).
Products, to give a broad defnition, are physical and tangible elements, whereas
services are intangible. Among these, it is important to characterize consumer products. According to several authors (Cushman; Rosenberg, 1991; Schulze, 2011), there
is a difference between consumer products and commercial or industrial products.
The latter refers to machinery and equipment for use in industry in general, and
more specifcally in production, to produce goods and provide services. Consumer
products are those for personal, family or domestic use in a residential or social
environment and not in a work environment, such as appliances, furniture and toys.
The ISO 20282-1 standard (ISO, 2006) describes consumer products as intended to
be purchased and used by an individual for personal use instead of professional use,
such as electric kettles, smartphones and electric drills.
The major differences between product consumption and product trades are the
number of characteristics, the capacity of production and operation speed. Consumer
products are distributed through a long channel with many steps between the factory
and the fnal consumer and are usually purchased in small quantities by a single individual (user) from the retail trade. In contrast, commercial products are usually purchased by a wholesale buyer of a company or by the manager (Cushman; Rosenberg,
1991; Schulze, 2011).
As for users of consumer products, they are usually not trained, not specialized
and not supervised by agents experienced in purchasing. They are also subject to
irregular, less systematic use and even to uses not foreseen by the manufacturer. The
user of a commercial product is usually trained, highly specialized and supervised.
Besides, these users have at their back several people who support the operation
of the product, such as toolmakers, job analysts and maintenance technicians. These
products are rarely used differently from what was programmed by the company
and envisaged by the manufacturer (Cushman; Rosenberg, 1991; Schulze, 2011).
However, users can be of any age, gender or physical condition, as well as of great
educational, cultural or economic variation (Hunter, 1992).
Both consumer products and commercial products depend on intense marketing
and need to be continually improved in order to become competitive (Cushman;
Rosenberg, 1991). To this end, the focus has a dual function, one being the quality of
Usability and User Experience
9
the interaction with the product and the other being the power of attractiveness of the
product for purchase by appeal (Bauersfeld; Bennet; Lynch, 1992).
Nowadays, new design principles are being introduced to meet a new product concept called “smart or intelligent product.” Based on theories developed in Germany
for intelligent environments, this concept has been affecting economic and industrial
growth in many nations. According to Ahram et al. (2011) and Das and Cook (2006),
an intelligent environment is able to acquire and apply knowledge about an environment and adapt it to its inhabitants, promoting a better experience.
The Ambient Intelligence (AMI) group identifes two motivating objectives for
the design of intelligent products (Sabou et al., 2009):
1. The growing need to simplify the use of daily products when their functionalities have become increasingly complex. Simplicity is timely throughout
the product’s life cycle from support to manufacture, repair and use.
2. Increase in the number, sophistication and diversity of product components,
as well as the tendency for suppliers and manufacturers to become increasingly independent of each other, which requires a considerable degree of
openness in the characteristics of the product.
The key issue that characterizes smart products is the knowledge aspect, representing products that facilitate daily tasks and expand everyday objects (Ahram,
Karwowski, Soares, 2011). The Smart Products Consortium (SPC) defnes a smart
product as an autonomous object designed to self-incorporate into different environments throughout its life cycle and which allows natural human–product interaction.
These products are able to proactively approach the user using sensors, input and
output data, and have the ability to adjust to the environment, being sensitive to the
situation and the context of use. The related knowledge and functionality can be
shared and distributed among several smart products, evolving over time (Sabou et
al., 2009; Ahram; Karwowski; Amaba, 2011; Ahram; Karwowski; Soares, 2011).
Intelligent products are already part of our daily life and have instigated great transformations. In many airports, for example, a system has been adapted: self-check-in
is an automated process, replacing long waiting lines for airlines’ kiosk representatives, creating a self-service environment for travelers globally. Nowadays, those
check-ins are done from the ease of your smartphone while riding to the airport in a
soon-to-be autonomous self-driving car.
1.5
CONTEXT OF USE FOR CONSUMER PRODUCTS
When a product (or system) is developed, it will be used within a particular context
and by a population of users with certain characteristics (Maguire, 2001). In this
sense, the usability of the product is not an independent activity and is related to the
context. Changing any aspect relevant to the context of use may change the ability to
use the product (Bevan; Macleod, 1994).
Therefore, the characteristics of the context to determine usability must be as
important as the characteristics of the product itself (Trivedi; Khanum, 2012).
10
Handbook of Usability and User Experience
Context of use, according to ISO 9241-11 (ISO, 2018), comprises users, tasks, equipment (hardware, software and materials) and the physical and social environment in
which a product is used.
The physical context comprises the location where the user is performing the
task. The natural environment is the real place of the product, and when tests
are carried out in this environment, they are called feld studies. An artifcial
environment is a simulation of the natural environment, sometimes called a controlled environment, and the studies performed in this environment are called
laboratory studies or tests.
Field tests take place in a more natural environment. According to Markopoulos
et al. (2008), in an artifcial scenario, there is greater control of the data. Still, it lacks
realism, while a natural scenario has realism but diffculties in control are encountered. These laboratory tests are performed in a controlled environment, providing greater control for the treatment and manipulation of variables. It is possible to
employ facilities to collect data with high-quality streams, such as video recording.
Laboratory tests have received both recognition and criticism. Razak et al. (2010)
describe some advantages: the control of conditions for the accomplishment of the
research, the possibility of all participants to experience the same confguration and
to concentrate on the specifc phenomena of interest of the research, facilitating data
collection. Park and Lim (1999) point out that the simulation of usage settings is diffcult, time-consuming and expensive and does not have contextual factors. Bruno
and Muzzupappa (2010) point out that evaluation carried out in laboratories does not
provide the discovery of usability problems that occur in the real world since laboratory tests are only simulations of product use.
The social context corresponds to the people involved and plays an important
role in usability. The people involved can be the evaluators and monitors of the tests,
as well as the users. There is also a substantial effect from other people who may
not be directly involved with the assessment, such as family members and curious
users. Stoica et al. (2005) found that, while laboratory evaluations provide excellent
data, the social context as well as the presence of other people around them also
play an important role. Although the social context is considered to be important,
little research has been carried out to identify its infuence on usability assessments
(Triverdi; Khanum, 2012).
1.6
USABILITY MEASUREMENT
Usability measurements allow the term usability to become more concrete and easier
to evaluate (Hornbaek, 2006). These measures are summarized in two aspects, effciency and effectiveness, and are subsequently decomposed into various dimensions
by several researchers. The basic idea is that usability can be measured and the aim
is to know in practice how much the task with the product can be accomplished and
successfully completed.
According to Tullis and Albert (2008), measuring user experience offers much
more than just a simple observation. Metrics add structure to the design and
solid evaluation process, give explanations to results and provide information for
11
Usability and User Experience
decision-makers. Without the information provided by usability metrics, important
business decisions can be made with inadequate or even incorrect assumptions.
Tullis and Albert (2008) also added that usability metrics could help reveal patterns
that are diffcult or impossible to notice. When evaluating a product with a small sample,
without collecting any metrics, the most obvious usability problems are usually revealed.
However, there are other, more subtle problems that require the help of metrics.
Nielsen (1993) points out that usability is not a single property of an interface but
has multiple components. In this sense, it considers fve dimensions to defne such a
concept in a clear and objective way: ease of learning, effciency, easy to memorize,
few errors and satisfaction.
Nielsen’s (1993) approach, among others outlined in Table 1.1, unifes three different aspects of usability (Nielsen, 1993; Han et al., 2001; Raita; Oulasvirta, 2011):
• Operational measures: The operational measures correspond to the quantitative variables corresponding to the performance, the task time and the
number or error rate of the user.
• Objective measures of usability related to the user’s knowledge levels:
These measures correspond to the performance of the experienced user, the
learning ability or learnability of the novice user and the ability to relearn
by a casual user of a given product.
• Subjective measures: Subjective measures refect opinions and experiences based on the user’s perception.
TABLE 1.1
Usability Dimensions from Different Authors and ISO Standard
Shackel
(1991)
Nielsen
(1993)
Abran et al.
(2003)
Quesenbery
(2003)
Effciency
Effciency
Ease of
learning
Effective
Effcient
Easy to learn
ISO 9241-11
(2018)
Rubin and
Chisnell (2008)
Objective dimensions
Effciency
Ease of
learning
Effciency
Ease of
learning
Easy to
memorize
Effciency
Effciency
Effective
Effcient
Usable
Flexibility
Few errors
Fault
tolerance
Accessibility
Safety
Subjective dimensions
Satisfaction
Attitude
Satisfaction
Engaged
Satisfaction
Satisfaction
12
Handbook of Usability and User Experience
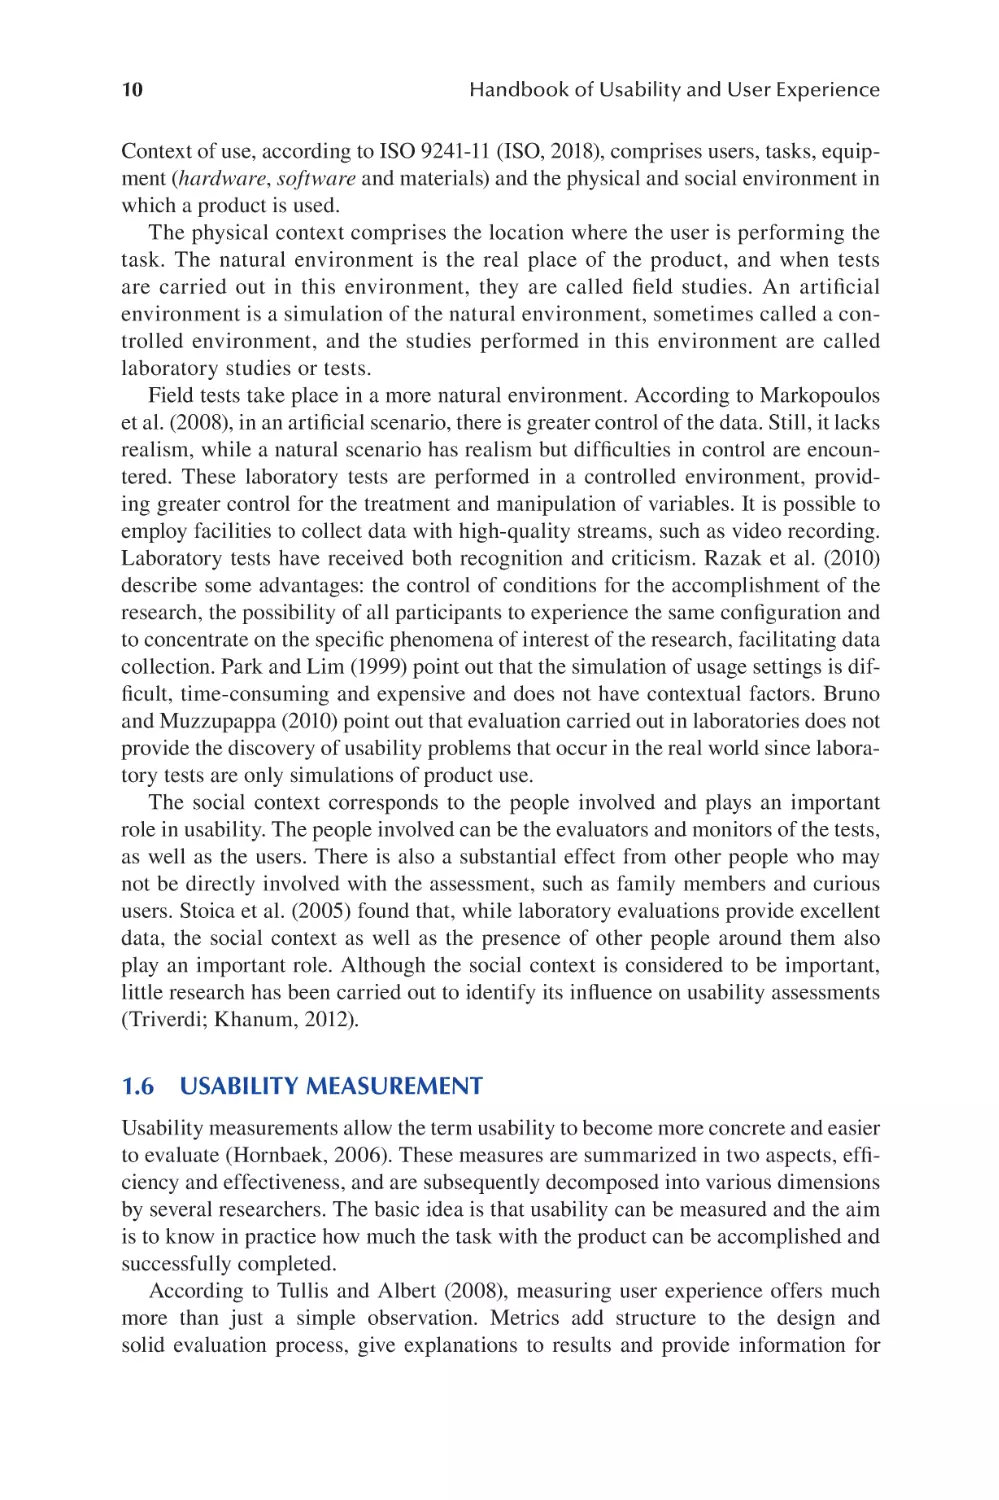
FIGURE 1.1 Product usability approach. Source: Adapted from Han et al. (2001).
Based on Han et al. (2001), Figure 1.1 shows the product’s usability approach considering the objective and subjective dimensions.
The usability dimensions presented by various researchers and the ISO standard
are summarized in Table 1.1. Each line in the table has a dimension, grouped according to the defnitions given by the authors and divided into objective and subjective.
When looking at the table, it is noticed that many authors have dimensions with the
same meaning but with different nomenclatures. The proposed dimensions combine
usability with other attributes and concepts of systems or products, offering measurable usability criteria, which are necessary for their understanding.
However, the dimensions presented were developed to evaluate the software
user interface and may leave gaps in the evaluation of consumer products. To meet
this need, Kim and Han (2008), based on an in-depth literature review, propose 18
dimensions of usability for electronic consumer products, as shown in Table 1.2. It
should be noted that not all the dimensions listed are relevant to all types of evaluation, and additional dimensions may be required for testing with products that have
a particular type of system or specifc performance.
1.7 USABILITY MODELS
The defnitions of usability characterized by the dimensions presented previously
need to be adapted in order to effectively facilitate the evaluation and testing of
usability. To this end, some authors propose “usability models.” According to
Leventhal and Barnes (2008), a model not only sets out the characteristics of a usable
interface but also indicates how the characteristics will ft, what they mean and how
they contribute to usability. Without a model and its implications for the causal effect
of different user interfaces and situational characteristics, the usability engineer/
designer might have to guess the factors that potentially infuence the usability of a
product or system.
Different approaches for assessing usability are proposed in different contexts,
such as software (Leventhal; Barnes, 2008) and electronic consumer products
13
Usability and User Experience
TABLE 1.2
Usability Dimensions for Electronic Consumer Products
Usability dimensions
Description
Simplicity
A product’s interfaces and methods of interaction must be simple, clear and
intuitively recognized.
Consistency
Interfaces and methods of interaction must be consistent within the product
and between products in the same family.
Each interface and method of interaction must have only one meaning and
one behavior.
The user must be given authority to control all functions and the appearance
of the user interface.
All operations must be designed to give the user the feeling of direct
manipulation.
The status of the product and the consequences of any user operation must
be provided clearly and immediately.
Any useful information must be provided to the user whenever necessary.
When an error is recognized, the user must be offered the possibility to take
corrective actions.
Interaction interfaces and methods must be designed to prevent errors.
Interface changes should allow adaptation to different users and conditions in
accordance with the experience, knowledge and preferences.
Any functions and interfaces must be easily accessible.
The effort required to learn interfaces and methods of interaction should be
small.
Interfaces and methods of interaction should be easy to remember.
Familiar interfaces and interaction methods must be adopted so the user can
apply their previous experience.
The interaction method and the meanings of the interfaces must be in
accordance with the user’s expectations.
The interfaces presented to the user must be clear and easy to understand.
All usage functions must be implemented in a product.
Modeling
Control locus
Direction
Feedback
Helpfulness
Pardon
Error prevention
Adaptability
Accessibility
Learning ability
Memorization
Familiarity
Predictability
Informational
Effciency
Effciency
A product must be designed to allow a user to perform functions quickly,
easily and economically.
Source: Adapted from Kim and Han (2008, p. 336).
(Kwahk; Han, 2002; Kim; Han, 2008). Table 1.3 presents a summary of the usability
models used, as well as their defnitions.
The three models developed by Eason (1984), Shackel (1991) and Nielsen (1993),
and presented in Table 1.3, suggest that certain properties of the interface have
a causal infuence on usability. In the Shackel and Nielsen models, a number of
dimensions that contribute to usability are identifed, whereas in the Eason model
we fnd a different approach. According to Eason, the characteristics of the three
14
Handbook of Usability and User Experience
TABLE 1.3
Taxonomy of Usability Models
Model
Eason
model
(1984)
Dimensions
Frequency
Number of times a task is performed by the user.
User
Opening
Knowledge
Extent to which a task is modifable.
The knowledge that the user applies to the task. This must
be appropriate or not.
What determine the user the fulfllment of his task?
The user’s ability not to choose to use any part of the
system.
The effort required to understand and operate an
unfamiliar system.
The effort required to operate a system once it is
understood and mastered by the user.
The extent to which each information and function that a
system provides corresponds to the user’s needs for a
given task.
It is described by the task interval that must be better than
the required performance level, as well as a specifc
percentage of a target user range within a specifc range
of the usage environment.
Corresponds to the time between training the users and
supporting the installation of the system, including the
time of relearning.
Corresponds to the permission of some percentage
variation specifed in the task and/or in the environment
in addition to what was specifed frst.
Corresponds to acceptable levels of the human cost in
terms of tiredness, discomfort, frustration and personal
effort.
The system must be easy to learn so that the user, even
without having experience, can quickly begin to obtain
satisfactory results from the work performed.
It is directly related to the productivity of the system so
that once the user has learned the system, high
productivity is possible.
The system must be easy to remember so that the
occasional user does not have to learn everything about
the system again after some time without using it.
The system must have a low error rate so that users make
fewer mistakes when using the system, and as soon as
errors are made, they can be corrected simply and
quickly. In addition, catastrophic errors should not occur.
Motivation
Criterion
System
Easy to learn
Easy to use
Task match
Shackel
model
(1991)
Effciency
Ease of learning
Flexibility
Attitude
Nielsen
model
(1993)
Defnition
Assignment
Ease of learning
Effciency
Easy to memorize
Few errors
Satisfaction
The system should allow pleasant interaction so that users
are subjectively satisfed when using it.
Usability and User Experience
15
dimensions—user, system and task—are independent variables, and the way these
dimensions interact with each other will infuence usability results.
An important contribution of the model proposed by Eason is that you cannot measure usability without considering the user and the target task. These two
approaches provide essential contextual information and can infuence usability as
much as the characteristics of the user interface itself.
The models proposed above were developed mainly to analyze software and websites from the context of human–computer interaction. However, they can be adapted
to study the usability of consumer products.
In search of a specifc model for products, Kahmann and Henze (1999; 2002)
describe a model based on three elements: object, intervention and result (Figure 1.2).
The PESC USESCAN® model has been widely applied in several product usability
tests through the P5 company formed by the authors.
The object is the subject of the usability study. Depending on the production
phase of the development process, the quality of the object can vary considerably.
This variation corresponds from the conceptual to the material; that is, elements of
the idea, the concept, the model, the prototype and the product.
The intervention corresponds to the object of usability testing. The type of an
object determines the target of the intervention. This target, for example, can be visible product requirements based on a manager’s ideas, or it can be testing concepts to
determine specifc requirements.
Results correspond to the data obtained in the intervention in the form of information. According to the authors, the resulting concept is not intentionally used
because it can only be realized when the results are incorporated and accepted in a
product development process.
As shown in Figure 1.2, a line is drawn representing the model proposed by the
authors. The process starts by demonstrating the movement of the object from the
FIGURE 1.2 P5 USESCAN model. Source: Adapted from Kahmann and Henze (2002,
p. 300).
16
Handbook of Usability and User Experience
FIGURE 1.3 Ping-Pong model. Source: Adapted from Kahmann and Henze (2002. p. 299).
designer (or team) to the usability professional who will develop the tests, from a
briefng, represented by the line on the left. The process ends with the presentation
of the data collected to the designer (or team) through a workshop, according to the
line on the right. By doing this, the process can be repeated several times.
To better illustrate the product development phases in which usability tests are
part, Kahmann and Henze (2002) propose an additional approach that consists of
four phases: inspiration, exploration, evaluation and verifcation. Figure 1.3 represents this process as a whole. On the left are shown the different stages of materialization of the product, whereas on the right side are positioned the four phases of the
study and usability.
Inspiration corresponds to the initial idea, insight. Exploration seeks what type
of interaction can or should occur when using the product and which aspects are
relevant, forming the concept of the product. The next phase corresponds to the
evaluation of this concept. This corresponds to the testing of prototypes, the way in
which different interactions work in a qualitative way. In the third and fnal phase,
the verifcation will take place in a quantitative survey to verify that the expected
interactions work in the right way. The completion of the process corresponds to the
fnal product.
The information collected during the intervention must be divided into objective and subjective. The objective information, called professional knowledge, consists of the information of a physical and cognitive nature, corresponding to the data
on dimensions, permissible forces, font sizes and color combinations. On the other
hand, user input information is obtained from usability tests. In these tests, qualitative methods are generally used, and the results obtained are not absolute and can be
considered as subjective data.
The model proposes several evaluations throughout the product development process. It demonstrates how usability analysis should be conducted, placing all elements in context. Although the approach is focused on the interaction between user
and product based on the terms defned in ISO 9241-11, the confguration of this
model allows adapting the dimensions of usability, or even one of the models previously presented, according to the objectives or scope evaluation.
Usability and User Experience
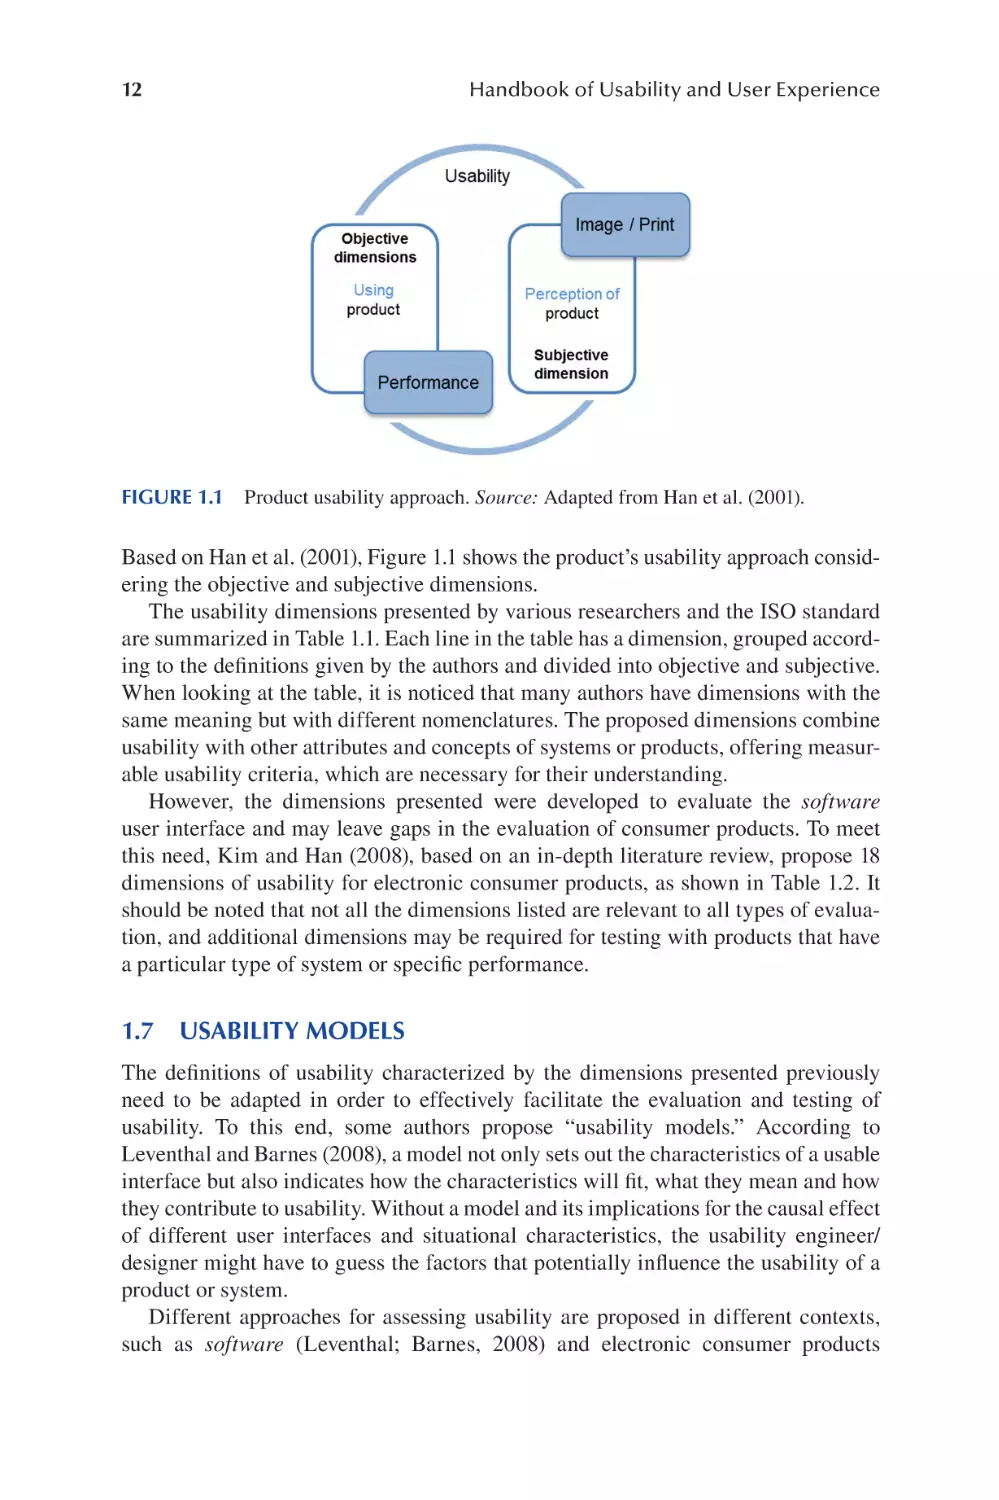
FIGURE 1.4
17
Usability evaluation model. Source: Kwahk and Han (2002).
In the context of consumer electronic products, Kwahk and Han (2002) developed
a usability evaluation model, as shown in Figure 1.4.
The usability assessment procedure begins with a preparatory phase. In phase 1,
the evaluators will require the taxonomy of the context variables to defne the status
of the tests. From a list of context variables that are considered important, such as
characteristics of users or the environment, evaluators need to confgure each one as
a constant, controlled or random variable.
Detailed information about the characteristics of the product interface to be evaluated is provided in phase 2. The elements of the human interface are frst analyzed
to subsequently measure each product in relation to these properties. In phase 3, the
dimensions of usability, measures and evaluation techniques are determined. This
step can be performed in parallel with step 2, if it is necessary.
Kim and Han (2008) propose a model that provides a level of usability by measures that can be used in step 3. The model consists of two phases: single integrated
model and full model. The individual model is used to calculate the level of usability
of each dimension proposed in Table 1.1, while the integrated model calculates the
overall level of all these dimensions.
18
Handbook of Usability and User Experience
Step 4 is the place where the assessors build the scenario for the assessment and
prepare all materials, devices, etc. so that the assessment is carried out in step 5. Step
6 corresponds to a very important step where the results of the evaluation are stored
in a database for effcient management for further analysis, product optimization,
analytics and design changes.
1.8
CONCLUSION
This chapter introduces the readers to the concept of usability and its association
with the user experience. It also covers various aspects of usability evaluation and
models. Although the concept of usability comes from the HCI area, its application
in consumer products has evolved over the years, based on the various studies and
a summary of several researchers presented in this chapter. Different dimensions
have been proposed as indicators for a clear view of usability and its aspects, as
well as models for their application, which form the basis for evaluating the usability of the product.
It is understood that the fundamental focus of usability remains the ease of use
when interacting with a product. To defne this concept it is necessary to develop
measures for the user experience and to establish a level of success for the product. These measures can be directed toward an understanding of the user’s needs
and requirements of the physical, cognitive and emotional dimensions, which are
understood as complementary and interdependent. Therefore, the characteristics
of the interaction between a user, product and context of use determine the usability of the product.
Based on these relationships, conceptual models were built to assess the usability,
but many of these models relate to the assessment of software usability, addressing
factors that represent hypothetical constructs about usability in measurable criteria from specifc metrics. However, these criteria and metrics are not consistently
defned in the different models when related to consumer products. These offer
little information on how to select certain metrics in the face of broader usability
goals in a given context of use, making practical application diffcult. In order to
overcome these diffculties, models have been developed specifcally for categories
of products: gathering information on how to collect data according to the general
objectives of the product’s usability, according to the model of Kwahk and Han
(2002), taking into consideration the phases development, according to the model
of Kahmann and Henze (2002).
According to the model of Kahmann and Henze (1999; 2002), as well as the
emphasis given throughout this chapter on the importance of user participation,
it becomes evident that there is ever-increasing need for designers and software
engineers to overcome their personal interpretations of a given situation and start
to consider users’ cultural differences, expectations and previous experiences.
Design errors can arise from the differences between the concept that designers
have in mind about users and the concept that users actually have about everyday
product use. In this sense, user expectations are a central issue in the usability
of the product.
Usability and User Experience
19
REFERENCES
Abran, A.; Khelif, A.; Suryn, W.; Seffah, A. 2003. Consolidating the ISO usability models.
In Proceedings of 11th International Software Quality Management Conference and
the 8th Annual INSPIRE Conference, April 23 – 25, 2003, Glasgow.
Acosta, G.; Morales, K.; Lagos, D.; Ortiz, M. 2011. Addressing human factors and ergonomics in design process, product life cycle, and innovation: trends in consumer
product design. In: Karwowski, W.; Soares, M.; Stanton, N. (eds) Human Factors and
Ergonomics in Consumer Product Design: Methods and Techniques. Boca Raton, FL:
CRC Press, 133–154.
Ahram, T.; Karwowski, W.; Amaba, B. 2011. Collaborative system engineering and socialnetworking approach to design and modelling of smarter products. Behaviour &
Information Technology 30(1): 13–26.
Ahram, T.; Karwowski, W.; Soares, M. 2011. Smart products user-centered systems engineering. In: Karwowski, W.; Soares, M. M.; Stanton, N. (eds) Handbook of Human Factors
and Ergonomics in Consumer Product Design: Methods and Techniques. Boca Raton,
FL: CRC Press.
Bauersfeld, P.; Bennet, J.; Lynch, G. 1992. Striking a balance. In Proceedings of the
Conference of Human Computer of Interaction (CHI'92), June 3–7, 1992, Monterey,
California.
Bevan, N. 1995. Measuring usability as quality of use. Journal of Software Quality 4:
115–140.
Bevan, N.; Macleod, M. 1994. Usability measurement in context. Behaviour and Information
Technology 13(1–2): 132–145.
Bruno, F.; Muzzupappa, M. 2010. Product interface design: a participatory approach based on
virtual reality. International Journal of Human-Computer Studies 68: 254–269.
Chamorro-Koc, M.; Popovic, V.; Emmison, M. 2009. Human experience and product usability: principles to assist the design of user-product interactions. Applied Ergonomics 40:
648–656.
Cushman, W. H.; Rosenberg, D. J. 1991. Human Factors in Product Design. Rosenberg:
Elsevier, Amsterdam.
Das, S.; Cook, D. 2006. Designing smart environments: a paradigm based on learning and
prediction. In: R. Shorey; A. Ananda; M. C. Chan; W. T. Ooi (eds) Mobile, Wireless,
and Sensor Networks: Technology, Applications, and Future Directions. Chichester:
Wiley, 337–358.
Dejean, P.; Wagstaff, P. 2012. Users/consumers differences regarding ergonomics and design
theory and practice. Work 41 Supplement 1: 3641–3645.
Eason, K. D. 1984. Towards the experimental study of usability. Behavior and Information
Technology 3(2): 133–143.
Göbel, M. 2011. Empathy meets engineering: implanting the user’s perspective into a systematic design process. In: W. Karwowski; M. Soares; N. Stanton (eds) Human Factors
and Ergonomics in Consumer Product Design: Methods and Techniques. Boca Raton,
FL: CRC Press., 161–175.
Han, S. H.; Yun, M. H.; Kwahk, J.; Hong, S. W. 2001. Usability of consumer electronic products. International Journal of Industrial Ergonomics 28: 143–151.
Hornbaek, K. 2006. Current practice in measuring usability: challenges to usability studies
and research. International Journal of Human-Computer Studies 64(2): 79–102.
Hunter, T. A. 1992. Design of consumer products. In: R. W. Houserman (ed.) Engineering
Design for Safety. New York: McGraw-Hill, 104–105.
ISO 20282-1. 2006. Ease of Operation of Everyday Products -- Part 1: Design Requirements
for Context of Use and User Characteristics. International Organization for
Standardization.
20
Handbook of Usability and User Experience
ISO 9241-11: 2018 (en). Ergonomics of Human-System Interaction - Part 11: Usability:
Defnitions and Concepts. International Organization for Standardization.
Jordan, P. 2000. Designing Pleasurable Products: An Introduction to the New Human
Factors. London: Taylor & Francis.
Jordan, P. W. 1998. An Introduction to Usability. London: Taylor & Francis.
Jordan, P. W. 2006. Usability and product design. In: Karwowski, W (ed.) International
Encyclopedia of Ergonomics and Human Factors. 2nd Edition. Boca Raton, FL: Taylor
& Francis Group.
Kahman, R.; Henze, L. 1999. Usability testing under time-pressure in design practice. In:
Green, W. S.; Jordan, P. W. (eds) Human Factors in Product Design: Current Practice
and Future Trends. London: Taylor & Francis, 113–123.
Kahman, R.; Henze, L. 2002. Mapping the user- product relationship (in product design). In:
Green, W. S.; Jordan, P. W. (eds) Pleasure with Products: Beyond Usability. London:
Taylor and Francis.
Kahn, K. B. 2001. Product Planning Essentials. Thousand Oaks, CA: Sage Publications, Inc.
Kim, J.; Han, H. 2008. A methodology for developing a usability index of consumer electronic products. International Journal of Industrial Ergonomics 38: 333–345.
Krishnan, V.; Ulrich, K. T. 2001. Product development decisions: a review of the literature.
Management Science 47(1): 1–21.
Krug, S. 2000. Don’t Make Me Think! A Common-Sense Approach to Web Usability.
Indianapolis, IN: New Riders Press.
Kumin, L.; Lazar, J.; Feng, J.; Wentz, B.; Ekedebe, N. 2012. A usability evaluation of workplace-related task on a multi-touch tablet computer by adults with down syndrome.
Journal of Usability Studies 7(4): 118–142.
Kwahk, J.; Han, S. H. 2002. A methodology for evaluating the usability of audiovisual consumer electronic products. Applied Ergonomics 33: 419–431.
Leventhal, L.; Barnes, J. 2008. Usability Engineering: Process, Products and Examples.
Hoboken, NJ: Pearson Education, Inc.
Maguire, M. 2001. Context of use within usability activities. International Journal of
Human-Computer Studies 55(4): 453–483.
March, A. 1994. Usability - the new dimension of product design. Harvard Business Review
72(5): 144–149.
Markopoulos, P.; Read, J.; MacFarlane, S.; Höysniemi, J. 2008. Evaluating Children’s
Interactive Products: Principles and Practices for Interaction Designers. Burlington,
MA: Morgan Kaufmann.
Meister, D.; Enderwick, T. P. 2002. Human Factors in System Design, Development and
Testing. Mahwah, NJ: Lawrence Eribaum Associates.
Nielsen, J. 1993. Usability Engineering. Boston, MA: Academic Press.
Norman, D. A. 1999. The Invisible Computer: Why Good Products can Fail, the Personal
Computer is so Complex, and Information Appliances Are the Solution. Cambridge,
MA: MIT.
Norman, D. A. 2006. O Design Do Dia-a-Dia. Rio de Janeiro: Rocco.
Park, K. S.; Lim, C. H. 1999. A structured methodology for comparative evaluation of user
interface designs using usability criteria and measures. International Journal of
Industrial Ergonomics 23: 379 –389.
Preece, J.; Rogers, Y.; Sharp, H. 2002. Interaction Design: Beyond Human-Computer
Interaction. John Wiley & Sons Inc. ISBN 0-471-49278-7.
Quesenbery, W. 2003. The fve dimensions of usability. In: M. Albers; B. Mazur (eds) Content
and Complexity: Information Design in Technical Communication. Erlbaum. Available
at: http://www.wqusability.com/articles/getting-started.html.
Usability and User Experience
21
Raita, E.; Oulasvirta, A. 2011. Too good to be bad: favorable product expectations boost subjective usability ratings. Interacting with Computers 23: 363–371.
Razak, F.; Haft, H.; Sedi, N.; Zubaidi, N.; Haron, H. 2010. Usability testing with children: laboratory vs feld studies. In International Conference on User Science and
Engineering (i-USEr), 104–109.
Rubin, J.; Chisnell, D. 2008. Handbook of Usability Testing: How to Plan, Design and
Conduct Effective Tests. Indianapolis, IN: Wiley Publishing Inc.
Sabou, M.; Kantorovitch, J.; Nikolov, A.; Tokmakoff, A.; Zhou, X.; Motta, E. 2009. Position
paper on realizing smart products: challenges for semantic web technologies. Report by
Knowledge Media Institute. Available at: http://people.kmi.open.ac.uk/marta/papers/
ssn2009.pdf. Acesso Junho/2013.
Schulze, L. J. H. 2011. Design, usability and maintainability of consumer products. In: W.
Karwowski; M. Soares; N. Stanton (eds) Human Factors and Ergonomics in Consumer
Product Design: Methods and Techniques. Boca Raton: CRC Press, 177–222.
Shackel, B. 1984. The concept of usability. In: Bennett, J.; Case, D.; Sandelin, J.; Smith,
M. (eds) Visual Display Terminals: Usability Issues and Health Concerns.Englewood
Cliffs, NJ: Prentice-Hall, Inc., 45–87.
Shackel, B. 1991. Usability – context, framework, defnition, design and evaluation. In:
Shackel, B.; Richardson, S. (eds) Human Factors for Informatics Usability. New York,
NY; United States: Cambridge University Press, 21–38.
Stoica, A.; Fiotakis, G.; Simarro, J.; Muñoz, H.; Avouris, N.; Dimitriadis, Y. 2005. Usability
evaluation of handheld devices: a case study for a museum application. In Proceedings
PCI 2005, Volas, Greece, November 11–13.
Trivedi, M.; Khanum, M. 2012. Role of context in usability evaluations: a review. Advanced
Computing: An International Journal 3(2): 69–78.
Tullis, T.; Albert, B. 2008. Measuring the User Experience: Collecting, Analyzing and
Presenting Usability Metrics. San Francisco, CA: Elsevier Inc.
Ward, S. J. 2011. User research by designers. In: Karwowski, W.; Soares, M.; Stanton, N. (eds)
Human Factors and Ergonomics in Consumer Product Design: Uses and Applications.
Boca Raton: CRC Press, 127–141.
2
Implications and
Methodological
Issues for the Study of
Individual Differences
in Usability and
User Experience
E. Brunsen, W. B. Hicks and A. C. McLaughlin
CONTENTS
2.1
The Importance of Individual Differences in User Experience ..................... 23
2.1.1 Examples of Individual Differences ...................................................24
2.1.1.1 Cognitive Abilities Important to Usability ..........................24
2.1.1.2 User Attributes to Consider for Usability Studies ...............26
2.2 An Approach to Incorporating Individual Differences in Usability .............. 30
2.2.1 General Steps...................................................................................... 30
2.3 Conclusion ...................................................................................................... 32
References................................................................................................................34
2.1 THE IMPORTANCE OF INDIVIDUAL
DIFFERENCES IN USER EXPERIENCE
Human factors research and its subfelds of usability, user experience and humancomputer interaction have always been concerned with matching design to the capabilities and limitations of the human. Writ large, this has meant considering fairly
universal capabilities and limitations, such as the limit of how many items can be
maintained in short-term memory (Miller, 1956), the shortest reaction times (e.g.,
Olson & Sivak, 1986), the excellence of the human processor in noticing patterns
(e.g., Mattson, 2014) and our biases in decision-making (e.g., Kahneman, 2011).
There has also been a focus on designing for group differences, for example, designing in general for aging due to age-related differences in grip strength, vision or
working memory capacity (Hofer & Alwin, 2008). Though such tailoring of design
to these group differences has greatly improved usability (see Czaja, Boot, Charness,
DOI: 10.1201/9780429343490-3
23
24
Handbook of Usability and User Experience
& Rogers, 2019), the issue is that there is no “average user,” even within a group.
Designing for a group is more benefcial than not, but with the advent of sensor
technology, AI and “glass” interfaces that can be easily changed, we have the opportunity to consider individual differences in user-centered design, in user testing and
in data analysis.
Using individual differences in design is not a new idea. Cronbach and Snow
(1977) initiated the idea of aptitude-treatment interactions in education. They were
most concerned with changing education and training according to evidence-based
person-instruction interactions, but the concept of considering an individual within
a situation, environment or technology generalizes to questions of design and usability. In 2009, Szalma called for inclusion of individual differences in human factors
research by demonstrating how the study of individual differences was important to
both application and theory development in human factors psychology. This echoed
Underwood’s 1975 address to the American Psychological Association, where he
discussed using our knowledge of individual differences in building and testing the
limits of psychological theory. For the remainder of this chapter, we will focus on
applying our knowledge of individual differences in usability studies. We start by
identifying categories of individual differences important to usable designs and then
provide a step-by-step process for usability researchers.
2.1.1
EXAMPLES OF INDIVIDUAL DIFFERENCES
2.1.1.1 Cognitive Abilities Important to Usability
We begin with a consideration of two individual differences in cognitive ability/
cognitive resource that can have important user interface implications: spatial ability
and working memory capacity. These cognitive resources, sometimes referred to as
fuid abilities, are limited. This means that (1) humans do not have an infnite capacity and all show limitations under certain circumstances and (2) within the limits of
human capability, these resources are assumed to have a normal distribution. For
each, we provide a description of the ability, the methods by which it has been measured and an example of its application to usability and design.
2.1.1.1.1 Spatial Ability
Spatial ability has many facets, from navigation to mental rotation to visualization
(Hegarty & Waller, 2005). Those with high spatial abilities tend to be able to navigate environments and interfaces better than those with poor ability. For example,
in a study of using a telephone menu system, older persons with lower spatial ability
had trouble with the auditory menu system. However, when provided with a visual
menu that accompanied the audio, they performed similarly to higher ability users
(Sharit, Czaja, Nair, & Lee, 2003).
If a designer believes spatial ability will be important for the task the user wants to
accomplish (for example, a map or traffc application), the choice of measure should
be based on a task analysis. In the task analysis, consider what kind of spatial ability is most needed for the task. The most common measure of spatial ability is the
measurement of the ability to rotate objects mentally. The most common test used
Study of Individual Differences
25
FIGURE 2.1 Examples of spatial ability measures. The mental rotation task (Shepard &
Metzler, 1971) tests a person’s ability and mental representations of objects (two-dimensional
and three-dimensional) as it is related to the visual representation of such rotation within the
mind. It must be determined whether the object on the left is the same as the object on the
right, only rotated.
is the updated Mental Rotation Test (Peters et al., 1995; based on the original test by
Shepard and Metzler, 1971), which presents shapes that the participant must assess
for similarity to other rotated versions of the shape (Figure 2.1). This measures the
ability to mentally rotate, but not other spatial abilities, such as the ability to navigate. Navigation ability is typically measured using virtual environments. For example, a virtual world called Virtual Silcton has participants navigate a campus or city,
with performance scores indicating their navigational ability (Blacker, Weisberg,
Newcombe, & Courtney, 2017; Galati, Weisberg, Newcombe, & Avraamides, 2017;
Nazareth, Weisberg, Margulis & Newcombe, 2018; Weisberg & Newcombe, 2016;
Weisberg, Schinazi, Newcombe, Shipley, & Epstein, 2014).
Spatial ability differences can be crucial in the usability of a design. For example,
if all usability participants are under age 30, they are likely at the peak of their
spatial abilities (the same is true for the other cognitive abilities we describe). This
means they are likely to be able to overcome undue spatial demands made by the
interface, for example, a map display that reorients during use. Testing with such
participants may give a false indication of usability, as they may be able to perform
regardless of the spatial demands. However, those low in spatial ability may fnd the
same interface impossible to use. Even those with high spatial abilities could have
issues when multitasking or distracted, which might only be uncovered in a usability
test that included a mandatory distraction.
2.1.1.1.2 Working Memory Capacity
Working memory capacity is a measure of the ability to hold raw information in
immediate awareness so that it can be manipulated and transformed (Schneider &
McGrew, 2012). Smartphones provide a typical example of how a poorly designed
interface can consume working memory beyond an individual’s capacity. For example, security measures on phones often require a verifcation code (sent to the device)
26
Handbook of Usability and User Experience
to be immediately entered into an application on the phone or a computer. The users’
working memory must hold their current goal (e.g., access their email), an understanding of what step they are in toward that goal, the method of moving back and
forth between the application requesting the code and the text message providing
the code and usually the short-term memory demands of holding fve to six digits in
memory until they can be entered, as the user must move back from the received text
to the entry screen for the code. Smartphones improved this process by automating
the access to and copying of the code, so that the application does not need to be
exited to view the code nor does the code need to be held in human memory to enter
on another screen. This design change should particularly aid persons with permanent or task-induced lower working memory capacities. It is notable that around ten
years passed between the advent of the smartphone and this simple design change
for greater usability.
Measures of working memory capacity that are simple to administer individually
include the Automated Operation Span test (Unsworth, Heitz, Schrock, & Engle,
2005) and Reading Span (Friedman & Miyake, 2005). Alphabet Span (Waters, &
Caplan, 2003) is a test easily administered to groups of users at one time. Because
working memory capacity tends to decline with age, recruiting users over age 65 is
another method to attain a diverse sample. For controlled experiments and research,
we recommend administering several measures of working memory capacity to best
estimate the construct of working memory, as any single measure may be a poor
indicator (Rabbitt, 1997).
Like spatial ability, differences in working memory can translate to large differences in the usability of a product or system. For example, when designing auditory
menus, such as for phone menu systems, using a broad rather than deep menu system
is especially important for users with lower working memory capacity (Commarford,
Lewis, Smither, & Gentzler, 2008). In a comparison of scrolling through a website
or clicking through discrete pages, those with high working memory capacities were
able to remember the text they read using either method. However, those with lower
working memory capacity remembered more when the pages were discrete, and
scrolling was not required (Sanchez & Wiley, 2009). These are just two examples
from a large and extensive literature on the connection between interface design
decisions and working memory capacity.
2.1.1.2 User Attributes to Consider for Usability Studies
2.1.1.2.1 Expertise Level
Expertise level refers to the amount of prior knowledge regarding the specifc
interface being used. Novices are assumed to have little or no prior experience or
knowledge, while experts typically understand the interface and associated task
on a qualitatively different level. This is due to the development of proceduralized,
automatized actions (Anderson, 1996), chunking of those actions so that a series of
steps become one cognitive step for the user (Gobet, 2005) and development of a
mental model for how the interface works, generally allowing better troubleshooting of errors (Payne, 2003). Novices become experts by moving through stages of
skill acquisition: the cognitive stage, where all actions are highly accessible, slow,
Study of Individual Differences
27
conscious and error prone, to the associative stage, where procedural knowledge is
being developed, and fnally to the expert stage (also called the autonomous stage
due to the automaticity of responses to inputs from the interface and task) (Fitts &
Posner, 1967). This qualitative difference between novices and experts makes it a
crucial individual difference to consider when designing for usability.
Expertise can be measured in many ways, from tests of knowledge to measurements of performance. It is likely the expertise level of the user is known or can be
easily assessed with a questionnaire. For example, in the design of a medical device
for persons with diabetes, the Diabetes Knowledge Questionnaire has been used
to determine whether the potential user understands the disease and the steps that
should be taken to maintain their health (Eigenmann, Skinner, & Colagiuri, 2011).
This measure can be used in two ways: frst, during recruitment of usability participants, to ensure a variety of knowledge levels interact with the designs, and second,
if important design decisions differ for various knowledge levels, it can be used to
direct new users to tailored interfaces.
It can be more diffcult to assess expertise in a novel system. In these cases, it
may be best to either assume a novice level for all users or to use analogous systems
to assess expertise (e.g., questionnaires about experience with 3D video games may
inform the interaction techniques developed for a novel augmented reality interface).
It may also be possible to measure more general differences in expertise that apply
beyond a specifc system, as with the Technology Experience Questionnaire (Ham,
Bunn, Meyer, Khan, & Hickson, 2014). However, the ultimate research and usability questions must be kept in mind: for a novel system, will differences in analogous expertise matter for the design? If so, what is the best tool to measure those
differences?
A classic example of providing tailored interfaces depending on expertise can
be found in the home computer. Expert users tend to prefer command line interfaces, for their fexibility and power. However, such interfaces demand extensive
prior knowledge—they are diffcult or impossible to use by novices as they depend
on “knowledge in the head” (Norman, 2013) (Figure 2.2). Graphical user interfaces
(GUIs), such as most websites or Windows-related operating systems, place menus,
buttons and other methods of interaction on the display. Here, the user can “recognize” rather than recall, and a well-designed interface will be usable by novices.
However, clicking on menus and choosing options repeatedly slows down the command line expert, which is why most Operations Support Systems (OSS) offer the
fexibility of either approach. Allowing different interfaces for use by different experience levels matches Nielsen’s (1994) heuristic of “Flexibility and effciency of use:
Accelerators, unseen by the novice user, may often speed up the interaction for the
expert user such that the system can cater to both inexperienced and experienced
users. Allow users to tailor frequent actions.”
2.1.1.2.2 Locus of Control and Self-Effcacy
Locus of control (LoC) is the degree to which people believe that they have control
over the outcome of events in their lives, as opposed to external forces beyond their
control. Those with a strong locus of control believe that events and situations in
28
Handbook of Usability and User Experience
FIGURE 2.2 Command line interface (top) for expert use compared to graphical user interface (bottom) for novice to moderately skilled users. Both contain similar functionality.
their own lives derive, for the most part, from their own actions. An example of
this would be scoring high on an exam. Those with a high internal locus of control
believe it was their doing for their score, while those with a high external locus
would give credit to external factors such as a guide or a study sheet.
A scale used for locus of control that has been applied in the area of health
research is the Multidimensional Health Locus of Control Scale (MHLC) (Wallston,
Wallston, & DeVellis, 1978). The scale includes three potential loci for health belief:
internal (e.g., healthy diet and exercise), powerful others (e.g., a doctor controls or
contributes to the individual’s health) or chance. Factors that affect LoC include
age, family origins, cultural beliefs, stress and self-effcacy (Wallston, 2005). One
of Shneiderman’s rules for usable design includes supporting internal locus of control (Shneiderman, Plaisant, Cohen, Jacobs, & Elmqvist, 2017). We suggest another
Study of Individual Differences
29
alteration to this rule might be to consider that users will have differences in locus of
control, and the design should support this variety.
Dupuy, Consel and Sauzéon (2016) studied the match of LoC and self-determination in older adults with an adaptive interface using a self-determination theory
(SDT) scale and found that both play a large role in technology acceptance. They
promoted acceptance of new technologies by older adults in assisted living homes
by offering them interfaces designed to support self-determination. For example,
users could choose the assistive technologies they wanted via a catalog, and it was
easy to install or uninstall any technology. This supported feelings of behavioral
autonomy. All technologies were able to be paused, such as when guests came over,
which supported psychological empowerment. Individual differences in initial selfdetermination were analyzed, fnding that the higher the self-determination score,
the more likely that person was to accept the new technologies. Further, they found
that their designs raised the self-determination scores of the users after their interactions during the study. By fguring out these levels of LoC and SDT, they were able to
design a better platform for the older users and improve the design process for other
technologies specifcally used with older adults. A study by Lee, Lee and Hwang
(2015) found similar results for younger adults.
An application of the locus of control measurement might be to compare users
in how they research a large purchase online (including others’ reviews, how many
websites they looked at, how many product details they care about, how many product comparisons and so on). Srinivasan and Tikoo (1992) conducted such a study,
measuring locus of control and then information search when purchasing a car.
Those with more internal locus of control searched more for information relating to
the purchase as they believed additional information would result in enough beneft
to warrant the effort of searching. We did not fnd design or usability studies that
included locus of control measures, but it follows from Srinivasan and Tikoo that
designs could be used to either encourage desired behavior (convincing those with
external locus of control to gather more information) or to offer interface options that
matched the locus of control level of the user (e.g., a search engine that either returns
many options or takes the user directly to the frst and most likely website). Some
options for measuring locus of control include the MHLC, Rotter’s Forced Choice
Scale (1966), James’ Locus of Control Scale (1957), Bailer’s (1961) scale for children
and the Duttweiler Internal Control Index (1984).
Self-effcacy is used to describe one’s belief in their ability to achieve a defned
goal (Bandura, 1986). Self-effcacy has been shown to impact motivation, mindset
and task performance, as it is a measure concerned with perceived capability (Urdan
& Pajares, 2006; Rhew, Piro, Goolkasian, & Cosentino, 2018). Bandura’s (1986)
Social Cognitive Theory highlights how personal or cognitive factors (e.g., personal
knowledge, attitudes or expectations), the environment (e.g., knowledge accessibility and social norms) and human behavior (e.g., self-effcacy and personal ability)
interact with one another to affect a person’s outlook and self-belief in relation to
goal-oriented objectives. Individuals are prone to act based on their self-effcacy
judgments or how well they believe they can perform (Stajkovic & Luthans, 1998).
As behaviors are often guided by attitudes, behavior change or improvement may
30
Handbook of Usability and User Experience
be achieved by manipulating and crafting the environment to promote self-effcacy
(Regan & Fazio, 1977). This can improve not only task performance, but persistence
and resilience to diffculty as well (Bandura, 1997).
In reference to performance, self-effcacy has shown to have three separate dimensions: magnitude, strength and generality (Bandura, 1986; Stajkovic & Luthans,
1998). Magnitude refers to the threshold of task diffculty an individual believes of
which they are capable. An internal judgment of whether the aforementioned magnitude is strong or weak refers to strength. Self-effcacy beliefs can also vary widely
in generality. Some beliefs are task- or domain-specifc, while others may promote
a more generalized belief of self. For example, a user might have high self-effcacy
concerning their expected performance with new interfaces but low self-effcacy
concerning making healthy nutritional food choices. Thus, it must be considered
whether it is important to measure self-effcacy specifc to the task or domain in
which the new product or interface will be used or to measure self-effcacy more
generally, such as technological self-effcacy.
Measures like the Computer User Self-Effcacy Scale (CUSE) have commonly
been used to assess an individual’s perceived confdence and competence in computer use (Cassidy & Eachus, 2002). For example, the CUSE was used in a study
on the acceptability of telemedicine. Older persons with higher scores on the CUSE
had higher intentions to engage with telemedicine technologies and were willing
to expend more effort to engage with those new technologies (van Houwelingen,
Ettema, Antonietti & Kort, 2018). In testing the telemedicine system, it might be
easy to select usability participants high in computer self-effcacy (e.g., coworkers,
parents or friends of the highly educated usability testers), so an effort should be
made to measure (if not screen) computer self-effcacy.
2.2
AN APPROACH TO INCORPORATING
INDIVIDUAL DIFFERENCES IN USABILITY
In the remainder of the chapter, we present the steps of applying an individual differences lens to a design problem. We suggest an adaptation and extension of the steps
suggested by Szalma (2009) (Figure 2.3).
2.2.1
GENERAL STEPS
As with all usability improvements, we start with the two commandments of human
factors psychology: know the task and know the user. The tools for understanding
the task are well known, such as hierarchical task analysis and cognitive task analysis. We recommend Gillan (2012) and Crandall et al. (2006) for overviews. Knowing
the users may not be as straightforward as the designer should have in mind what
qualities of those users may impact their performance, enjoyment or other use of the
system. For example, gender could be collected to describe users of a library search
interface, but there is no reason to expect that gender would impact how the system
is used. Thus, the frst pass at a user analysis can be general and at the group level:
are there certain age groups expected to or not expected to use the system? Are there
Study of Individual Differences
31
FIGURE 2.3 Adaptation and extension of the research considerations of individual differences. Figure shows general steps of interface or system development with indications of
stages where individual differences are crucial.
expected gender differences in goals, intent or use? Will the system be used by novices, experts or both? Will the system be frequently or rarely used? Answers to these
questions are a start to the next step: identify relevant person characteristics.
Identifying relevant person characteristics is the crucial step in including individual differences in design. It is the step that requires the most background knowledge
of psychology and anthropometry. In this step, consider the task demands, outlined
in the task analysis, and whether those demands are high enough to expect individual
differences to impact use of the system. For example, a system that displays a map
might demand “spatial ability,” but inspection of the system shows the maps in this
32
Handbook of Usability and User Experience
system are so simple as to have inconsequential spatial demands. Further, the system
operates serially, so there is no chance of multitasking while under spatial demand. It
could be concluded that the individual difference of spatial ability would not matter
and thus should not be included in any tests or analysis. However, on the other side,
task analysis might reveal that the map system demands moderate amounts of spatial
ability, likely while driving (another spatial task). Here, the demand may exceed
what some users are able to provide, and testing users low in spatial ability would
reveal the impact of the design choice.
The third step is to connect the information from Step 1 with Step 2. It is important
to have a working knowledge of likely individual differences or consult with experts
in the domain (e.g., human factors professionals). Designers should ask themselves,
at least for the most crucial steps in the task analysis, what cognitive abilities or other
attributes are needed or overloaded by the interface? For example, if an app requires
a long security code, but that code only appears for a few seconds, this would be
hard to remember and enter for people with lower working memory capacity. Once
the environment is considered, such as navigating a noisy and crowded sidewalk to
locate a ride share location, memory and entry of such a code may be impossible
even for those with high working memory capacities.
In the fourth step, utilize the method suggested by Szalma (2009) to decide (1)
whether subgroups of users likely exist, and whether their needs may confict with
each other, and (2) what are the overall needs for users of the interface, ignoring their
potential individual differences. Following these steps will ensure that the system
can fulfll the needs of users, but will also reveal whether a fexible design is needed
to accommodate subgroups. For example, the preferences of many expert software
developers for command line interfaces might confict with casual computer users
who need a graphical user interface to accomplish their goals.
In the ffth step, design or redesign the system or interface. This may mean large,
conceptual changes or constrained element changes. During the design, revisit the
task analysis and update as needed. Simply having gone through the earlier steps may
have inspired different ways of thinking about the design, making it more usable for
the range of individual differences important to the task.
The last steps are to perform a standard usability evaluation, where performance
or experience metrics are predefned and measured as users experience the system
or interface, and iterate the design based on the outcome. The added piece here is
to include the important individual differences as predictors or manipulations: for
example, if attentional control is important to performance, one could recruit older
persons (likely to score lower on tests of spatial ability, working memory, attentional
control) or one could screen to include potential users high or low on attentional
control using psychometric tests.
2.3
CONCLUSION
We have discussed the importance of considering individual differences when conducting basic and applied research, when conducting usability and UX studies and in
applying human-centered design methods. We have also discussed the literature on
Study of Individual Differences
33
individual differences linked to usability and design, including the paucity of such
research and the need for more. It makes sense that, when technologies were mostly
physical, created in factories and fully formed upon release to the public, it would be
diffcult to include tailoring to individual differences. However, as technologies move
toward the virtual, with software-controlled interfaces and multiple input methods,
it is time to start considering how these designs could and should be tailored to different groups and individuals. These systems, interfaces and displays can be easily
presented or updated to ft an individual—the remaining step is to understand how
to do so. Because there is little explicit guidance as of yet, it falls on the researchers
and designers to explore the individual differences likely to affect use of the product.
We end with the following guidelines for researchers and practitioners.
For researchers:
1. Include measurement of individual differences in future studies. Many
of the studies we reviewed posited that results could have been due to
individual differences (such as in locus of control), but did not have the
measures.
2. Include these measurements in planned and post hoc analyses.
3. Use individual differences to test general theories—if a theory suggests
multitasking performance decrements are due to lack of attentional
resources, compare those with low and high amounts of that resource
to test the theory.
For designers and practitioners:
1. Use the literature when possible to drive the choice of individual differences to include in usability studies, designs and personas.
2. Develop a general understanding of the individual differences that are
likely important to the design. Include these in recruitment of participants to avoid a sample biased against real-world differences in cognition or other attributes.
3. Include these explicit questions when designing any product:
a. What are potential differences in cognition that might make the
planned design harder to use?
b. Will people use this product when distracted or with diminished
cognitive ability due to the environment?
4. Consider individual differences explicitly at multiple points in the
design process: when assessing user needs and when testing designs.
5. Include usability participants who are representative of the individual
differences of interest.
Following these guidelines does not guarantee success. Usability, especially usability for individual differences, is not a recipe or an algorithm. It is an art that depends
on the application of knowledge, including knowledge of the user, knowledge of
34
Handbook of Usability and User Experience
individual differences and knowledge of the task. This art is blended with the science
of measurement and analysis—no system should be assumed to match individual
differences purely based on theory. It must also be tested. We hope that the information and suggestions in this chapter will result in individual differences being
considered more often, from the initial design through the fnal testing of any new
interface.
REFERENCES
Anderson, J. R. (1996). ACT: A simple theory of complex cognition. American Psychologist,
51(4), 355–365.
Bailer, I. (1961). Conceptualization of success and failure in mentally retarded and normal
children. Journal of Personality, 29(3), 303–320.
Bandura, A. (1986). The explanatory and predictive scope of self-effcacy theory. Journal of
Social and Clinical Psychology, 4(3), 359–373.
Bandura, A. (1997). Self-effcacy and health behaviour. In Baum, A., Newman, S., Weinman,
J., West, R., & McManus, C. (Eds.), Cambridge handbook of psychology, health and
medicine, 160–162.
Blacker, K. J., Weisberg, S. M., Newcombe, N. S., & Courtney, S. M. (2017). Keeping track
of where we are: Spatial working memory in navigation. Visual Cognition, 25(7–8),
691–702.
Cassidy, S., & Eachus, P. (2002). Developing the computer user self-effcacy (CUSE) scale:
Investigating the relationship between computer self-effcacy, gender and experience
with computers. Journal of Educational Computing Research, 26(2), 133–153.
Commarford, P. M., Lewis, J. R., Smither, J. A. A., & Gentzler, M. D. (2008). A comparison
of broad versus deep auditory menu structures. Human Factors, 50(1), 77–89.
Crandall, B., Klein, G., Hoffman, R. R. (2006). Working minds: A practitioner’s guide to
cognitive task analysis. Cambridge, Massachusetts: MIT Press.
Cronbach, L. J., & Snow, R. E. (1977). Aptitudes and instructional methods: A handbook for
research on interactions, New York: Irvington Publishers Inc.
Czaja, S. J., Boot, W. R., Charness, N., & Rogers, W. A. (2019). Designing for older adults:
Principles and creative human factors approaches. Boca Raton, FL: CRC Press, Taylor
& Francis Group.
Dupuy, L., Consel, C., & Sauzéon, H. (2016). Self determination-based design to achieve
acceptance of assisted living technologies for older adults. Computers in Human
Behavior, 65, 508–521.
Duttweiler, P. C. (1984). The internal control index: A newly developed measure of locus of
control. Educational and Psychological Measurement, 44(2), 209–221.
Eigenmann, C. A., Skinner, T., & Colagiuri, R. (2011). Development and validation of a diabetes knowledge questionnaire. Practical Diabetes International, 28(4), 166–170.
Fitts, P. M., & Posner, M. I. (1967). Human performance. Belmont, CA: Brooks/Cole Pub. Co.
Friedman, N. P., & Miyake, A. (2005). Comparison of four scoring methods for the reading
span test. Behavior Research Methods, 37(4), 581–590.
Galati, A., Weisberg, S. M., Newcombe, N. S., & Avraamides, M. N. (2017). When gestures
show us the way: Co-thought gestures selectively facilitate navigation and spatial memory. Spatial Cognition & Computation, 18(1), 1–30.
Gillan, D. J. (2013). Five questions concerning task analysis. In The Handbook of Work
Analysis (pp. 234–246). Oxfordshire, UK: Routledge.
Gobet, F. (2005). Chunking models of expertise: Implications for education. Applied
Cognitive Psychology, 19(2), 183–204.
Study of Individual Differences
35
Ham, H., Bunn, P., Meyer, C., Khan, A., & Hickson, L. (2014). Exploring the relationship
between technology use, hearing help-seeking, and hearing aid outcomes in older
adults. International Journal of Audiology, 53(1), 38–42.
Hegarty, M., & Waller, D. (2005). Individual differences in spatial abilities. In P. Shah &
M. Miyake (Eds.), The Cambridge handbook of visuospatial thinking (pp. 121–169).
Cambridge University Press.
Hofer, S. M., & Alwin, D. F. (2008). Handbook of cognitive aging: Interdisciplinary perspectives. Thousand Oaks, CA: SAGE Publications, Inc.
James, W. H. (1957). Internal versus external control of reinforcement as a basic variable in
learning theory. Unpublished doctoral dissertation, Ohio State University.
Kahneman, D. (2011). Thinking, fast and slow. London: Penguin Books.
Lee, Y., Lee, J., & Hwang, Y. (2015). Relating motivation to information and communication
technology acceptance: Self-determination theory perspective. Computers in Human
Behavior, 51, 418–428.
Mattson, M. P. (2014). Superior pattern processing is the essence of the evolved human brain.
Frontiers in Neuroscience, 8, 265.
Miller, G. (1956). The magical number seven, plus or minus two: Some limits on our capacity
for processing information. The Psychological Review, 63, 81–97.
Nazareth, A., Weisberg, S. M., Margulis, K., & Newcombe, N. S. (2018). Charting the development of cognitive mapping. Journal of Experimental Child Psychology, 170, 86–106.
Nielsen, J. (1994). Heuristic evaluation. In Nielsen, J., & Mack, R. L. (Eds.), Usability inspection methods (pp. 25–64). New York: John Wiley & Sons.
Norman, D. (2013). The design of everyday things: Revised and expanded edition. New York,
NY: Basic Books.
Olson, P. L., & Sivak, M. (1986). Perception-response time to unexpected roadway hazards.
Human Factors, 28(1), 91–96.
Payne, S. (2003). Users’ mental models: The very ideas. In HCI models, theories, and frameworks (pp. 135–156). Burlington, MA: Morgan Kaufmann Publishers.
Peters, M., Laeng, B., Latham, K., Jackson, M., Zaiyouna, R., & Richardson, C. (1995). A
redrawn Vandenberg and Kuse mental rotations test-different versions and factors that
affect performance. Brain and Cognition, 28(1), 39–58.
Rabbitt, P. (1997). Introduction: Methodologies and models in the study of executive function.
In P. Rabbitt (Ed.), Methodology of frontal and executive function (pp. 1–38). Hove,
UK: Psychology Press.
Regan, D. T., & Fazio, R. (1977). On the consistency between attitudes and behavior: Look
to the method of attitude formation. Journal of Experimental and Social Psychology,
13(1), 28–45.
Rhew, E., Piro, J., Goolkasian, P., & Cosentino, P. (2018). The effects of a growth mindset on
self-effcacy and motivation. Cogent Education, 5(1), 1–16.
Rotter, J. B. (1966). Generalized expectancies for internal versus external control of reinforcement. Psychological Monographs: General and Applied, 80(1), 1–28.
Sanchez, C. A., & Wiley, J. (2009). To scroll or not to scroll: Scrolling, working memory
capacity, and comprehending complex texts. Human Factors, 51(5), 730–738.
Schneider, W. J., & McGrew, K. S. (2012). The Cattell-Horn-Carroll model of intelligence.
In D. P. Flanagan & P. L. Harrison (Eds.), Contemporary intellectual assessment:
Theories, tests, and issues (pp. 99–144). The Guilford Press.
Sharit, J., Czaja, S. J., Nair, S., & Lee, C. C. (2003). Effects of age, speech rate, and environmental support in using telephone voice menu systems. Human Factors, 45(2),
234–251.
Shepard, R. N., & Metzler, J. (1971). Mental rotation of three dimensional objects. Science,
171, 701–703.
36
Handbook of Usability and User Experience
Shneiderman, B., Plaisant, C., Cohen, M., Jacobs, S., & Elmqvist, N. (2017). Designing the
user interface: Strategies for effective human-computer interaction: Sixth edition.
Education Ltd., Essex, UK: Pearson.
Srinivasan, N., & Tikoo, S. (1992). Effect of locus of control on information search behavior. In Association for Consumer Research (pp. 498–504). Provo, UT: Association for
Consumer Research
Stajkovic, A. D., & Luthans, F. (1998). Social cognitive theory and self-effcacy: Going
beyond traditional motivational and behavioral approaches. Organizational Dynamics,
26(4), 62–75.
Szalma, J. L. (2009). Individual differences in human-technology interaction: Incorporating
variation in human characteristics into human factors and ergonomics research and
design. Theoretical Issues in Ergonomics Science, 10(5), 381–397.
Underwood, B. J. (1975). Individual differences as a crucible in theory construction. American
Psychologist, 30(2), 128–134.
Unsworth, N., Heitz, R. P., Schrock, J. C., & Engle, R. W. (2005). An automated version of the
operation span task. Behavior Research Methods, 37(3), 498–505.
Urdan, T., & Pajares, F. (Eds.). (2006). Self effcacy beliefs of adolescents. Greenwich, CT:
IAP.
van Houwelingen, C. T., Ettema, R. G., Antonietti, M. G., & Kort, H. S. (2018). Understanding
older people’s readiness for receiving telehealth: Mixed-method study. Journal of
Medical Internet Research, 20(4), e123.
Wallston, K. A. (2005). The validity of the multidimensional health locus of control scales.
Journal of Health Psychology, 10(5), 623–631.
Wallston, K. A., Wallston, B. S., & DeVellis, R. (1978). Development of the multidimensional
health locus of control (MHLC) scales. Health Education Monographs, 6(2), 160–170.
Waters, G. S., & Caplan, D. (2003). The reliability and stability of verbal working memory
measures. Behavior Research Methods, Instruments, & Computers, 35(4), 550–564.
Weisberg, S. M., & Newcombe, N. S. (2016). How do (some) people make a cognitive map?
Routes, places, and working memory. Journal of Experimental Psychology, 42(5),
768–785.
Weisberg, S. M., Schinazi, V. R., Newcombe, N. S., Shipley, T. F., & Epstein, R. A. (2014).
Variations in cognitive maps: Understanding individual differences in navigation.
Journal of Experimental Psychology: Learning, Memory, and Cognition, 40(3),
669–682.
3
Three Methods of
Usability-UX Task
Analysis, REM, UX
System Diagrams
Toshiki Yamaoka
CONTENTS
3.1
3.2
Introduction .................................................................................................... 37
Usability-UX Task Analysis (Yamaoka 2012)................................................ 38
3.2.1 Background and Purpose.................................................................... 38
3.2.2 Proposed Method................................................................................ 38
3.3 Example of the Application of Usability-UX Task Analysis..........................40
3.3.1 Structuring of the Data ....................................................................... 43
3.3.2 Analysis of the Data............................................................................44
3.4 REM (Hierarchical Requirements Extraction Method) (Yamaoka 2013)...... 47
3.4.1 Background and Purpose.................................................................... 47
3.4.2 Proposed Method................................................................................ 48
3.4.3 Observation......................................................................................... 49
3.5 Example of REM Application ........................................................................ 50
3.6 UX System Diagram....................................................................................... 51
3.6.1 Background......................................................................................... 51
3.6.2 Proposed Method................................................................................ 52
3.7 Example of UX System Diagram Application ............................................... 54
3.8 Conclusion ...................................................................................................... 55
References................................................................................................................ 56
3.1 INTRODUCTION
The usability-UX (User Experience) task analysis, REM (hierarchical
Requirements Extraction Method) and UX system diagram are proposed as new
methods for collecting usability and UX. Usability-UX task analysis is a variation of task analysis allowing user requirements to be obtained systematically
and quantitatively. REM is a method for extracting user requirements by root
cause and fnal purpose based on problems of products or systems. UX system
DOI: 10.1201/9780429343490-4
37
38
Handbook of Usability and User Experience
diagrams can create UX and feelings based on the four attributes of product,
story, feeling and sense by UX. As new products or systems related to service
design become more complex in the 21st century, new logical methods for usability and UX to extract user requirements are required. This is because most existing methods depend on intuition and personal ability, and so they seem to not be
useful or effective for complex systems such as service design, social design and
so on, which are needed in the 21st century.
3.2 USABILITY-UX TASK ANALYSIS (YAMAOKA 2012)
3.2.1 BACKGROUND AND PURPOSE
Usability and UX have become very important elements in the creation of attractive
products, GUIs and services. However, designers and engineers cannot get information on usability and UX effciently and systematically. Usability-UX task analysis is
used for collecting user requirements and UX etc. in an effcient and systematic manner. This method is constructed based on task analysis which can obtain problems
regarding tasks for products and is a popular technique in ergonomics. The usability
and UX data extracted by this method can be analyzed using qualitative and quantitative methods such as multiple regression analysis, FCA (formal concept analysis)
and so on.
3.2.2
PROPOSED METHOD
Usability-UX task analysis was developed based on task analysis to get user requirements systematically and quantitatively from the viewpoint of the good and bad
points of a task (Figure 3.1). Task analysis is a very important method to extract user
requirements or problems for each task.
The procedure of collecting user requirements is as follows.
1) The test participants evaluate each task of products, GUIs and services.
Each task is evaluated from the viewpoint of the good and bad points of usability,
and the UX of the task. Test participants are asked to fll out appropriate evaluation
words in the blanks in a Sentence Completion Test (SCT) after operating the products, GUIs and services. SCT is aimed at collecting the causal relationship of the
usability of the task (Figure 3.2).
The tasks of products are evaluated from the viewpoint of UX according to a
three-grade evaluation: good, ordinary and bad. And they also are evaluated from the
viewpoint of usability (good and bad points) according to the Likert scale: strongly
agree (5), agree (4), neutral (3), disagree (2) and strongly disagree (1).
2) After each task is done, synthetic evaluation is fnally conducted as mentioned above.
3) The good and bad points are analyzed.
Usability-UX Task Analysis, REM, UX
39
FIGURE 3.1 Usability-UX task analysis.
The good points become user requirements, while the bad points are changed into
good user requirements. For example, a bad point of “heavy” is changed into user
requirement “light,” which is an antonym of “heavy.” The idea of including the two
words with positive and negative comments is a very important user requirement.
4) Qualitative analysis
40
Handbook of Usability and User Experience
FIGURE 3.2
SCT (Sentence Completion Test).
User requirements including UX are collected and structured.
As user requirements are collected and structured by grouping, very important
user requirements are selected.
5) Quantitative analysis
User requirements are also analyzed using statistical methods. Multiple regression
analysis of usability can be done using the fve-grade evaluation data of the Likert
scale. UX can also be analyzed using the three-grade evaluation data by multiple
regression analysis.
3.3
EXAMPLE OF THE APPLICATION OF
USABILITY-UX TASK ANALYSIS
A web screen of six hotels and three mechanical pencils (Figure 3.3) was evaluated
and analyzed using usability-UX task analysis. Six university students (female, 20–26
FIGURE 3.3
Three mechanical pencils.
Usability-UX Task Analysis, REM, UX
41
FIGURE 3.4 An example of usability-UX task analysis of a web screen (shown as a part of
a web screen of six hotels and three tasks).
years old) answered questions on tasks for a web screen of six hotels (Figure 3.4), and
eight university students (female, 20–26 years old) answered questions on tasks for
three mechanical pencils (Figure 3.5).
The test participants checked all of the tasks of the products and screens as the
synthetic evaluation and grade (Table 3.1).
42
Handbook of Usability and User Experience
FIGURE 3.5 Usability-UX task analysis of a mechanical pencil (shown as a part of three
mechanical pencils and three tasks).
1) Four screens such as the home page, guest rooms, accommodation plans
and ideal plans were selected as tasks. Table 3.2 shows some of the results
for the usability-UX task analysis of six hotels.
2) Four tasks for the mechanical pencils such as picking up the pencil, holding
it, clicking it and writing were selected. Table 3.3 shows some of the results
for the usability-UX task analysis of the three mechanical pencils.
43
Usability-UX Task Analysis, REM, UX
TABLE 3.1
User Requirements Collected from Synthetic Evaluation
The requirements collected in synthetic evaluation
Requirements organized as
good points
Requirements organized as bad
points
Important requirements
Light and easy to write
Writing easily important
Diffcult to write
Light and easy to hold
Friendly
Fit in hand
Holding easily is important
Heavy and tired to hold
Fitting in hand is important
Doesn’t ft in hand
High-grade image
High-grade image is important
Cheap-looking
TABLE 3.2
UX Items Collected in the Writing Task
UX organized as good
points
UX organized as bad
points
Important requirements
Light and easy to write
Writing is an important requirement
Diffcult to write
Smooth and easy to write
Smooth is an important requirement
Not smooth
Easy to hold
Holding easily is an important requirement
Thin and diffcult to hold
TABLE 3.3
Average (AV) and Standard Deviation (SD) of User Requirements of
Mechanical Pencils A, B and C
Average and standard deviation of user requirements
Task 1
Task 2
Task 3
Picking up
mechanical
pencil
Holding
mechanical
pencil
Clicking
mechanical
pencil
Task 4
writing
Synthetic evaluation
of user
requirements
AV
SD
AV
SD
AV
SD
AV
SD
AV
SD
A
3.14
0.70
3.42
0.98
2.71
1.38
2.57
1.13
3.00
1.00
B
3.00
C
3.00
1.15
2.57
0.79
2.43
1.27
2.57
1.51
2.71
0.76
1.00
2.43
0.53
3.57
0.98
4.29
0.76
3.57
1.13
The collected usability and UX were structured and analyzed.
Collected data was structured and analyzed by average, standard deviation and
multiple regression analysis.
3.3.1
STRUCTURING OF THE DATA
The requirements or UX collected regarding the good points and bad points from
synthetic evaluation were grouped (Tables 3.1 and 3.2). When the requirements or
44
Handbook of Usability and User Experience
TABLE 3.4
Average (AV) and Standard Deviation (SD) of UX of Mechanical Pencils A, B
and C
The average and standard deviation of UX
A
Task 1
Task 2
Task 3
Task 4
Picking up
mechanical
pencil
Holding
mechanical
pencil
Clicking
mechanical
pencil
Writing
Synthetic
evaluation of
user
requirements
AV
SD
AV
SD
AV
SD
AV
SD
AV
SD
2.29
0.49
2.57
0.53
2.00
0.82
2.29
0.76
2.14
0.38
B
2.43
0.79
2.43
0.53
1.57
0.79
1.86
0.90
2.00
0.82
C
2.29
0.76
1.86
0.90
2.57
0.79
2.71
0.49
2.43
0.98
UX based on good points were opposite to the requirements based on bad points,
the requirements or UX became very important. When “being easy to write” as a
good point and “being diffcult to write” as a bad point were selected for an example,
they were opposite to each other and then “writing easily” became the important
requirement.
3.3.2 ANALYSIS OF THE DATA
1) Average, Standard Deviation
The average and standard deviation of user requirements and UX of mechanical pencils A, B and C were calculated (Tables 3.3 and 3.4). When the numerical value of
the average is high, the average of user requirements and UX means a good evaluation. If the numerical value of the standard deviation is high, the standard deviation
of user requirements and UX shows that the opinions of participants were divided.
Mechanical pencil C had generally high scores in the average and UX, but the standard deviation was also high and the opinions were divided. As mechanical pencil C
is designed for drawing, it is heavy and substantial compared with the other mechanical pencils.
2) Multiple Regression Analysis
Multiple regression analysis was done to extract important user requirements and UX
(Tables 3.5 and 3.6). As mechanical pencil A is light, relatively ordinary and high
scoring, the important task to infuence synthetic evaluation was clicking regarding use requirements and holding regarding UX. Mechanical pencil B has a special
clicking button located in the middle of the body in order to push while writing.
This special function made it lower in evaluation. Mechanical pencil C is heavy and
substantial compared with the other mechanical pencils, and so it had a high score.
45
Usability-UX Task Analysis, REM, UX
TABLE 3.5
Important Tasks to Infuence Synthetic Evaluation Regarding User
Requirements
Explanatory variable
Task 1
Picking up
mechanical
pencil
Response variable
Task 2
Task 3
Task 4
Holding
mechanical
pencil
Clicking
mechanical
pencil
Writing
Mechanical
pencil A
—
—
✓
—
Mechanical
pencil B
—
—
—
✓
Mechanical
pencil C
—
—
—
—
Synthetic evaluation of
user requirements
Important tasks do not
infuence synthetic evaluation
3) Formal Concept Analysis
FCA is very useful in the case of a lot of parameters such as attributes or evaluation
items in a matrix, because it makes them clarify the relationships between them.
Although the relationship of the parameters of mechanical pencils is not complicated, FCA is useful and easy for designers, engineers and planners, and so FCA is
introduced using this example in this section.
a. The questionnaire data was changed into binary data
TABLE 3.6
Important Tasks to Infuence Synthetic Evaluation Regarding UX
Response
variable
Explanatory variable
Task 1
Picking up
mechanical
pencil
Task 2
Task 3
Task 4
Holding
mechanical
pencil
Clicking
mechanical
pencil
Writing
Mechanical
pencil A
—
✓
—
—
Mechanical
pencil B
—
—
✓
✓
Mechanical
pencil C
✓
—
—
—
Synthetic
evaluation
of UX
46
Handbook of Usability and User Experience
TABLE 3.7
Binary Data for Usability
Task 1
Task 2
Task 3
Picking up
mechanical
pencil
Holding
mechanical
pencil
Clicking
mechanical
pencil
Task 4
Writing
Synthetic evaluation
of user requirements
A
1
1
0
0
1
B
1
0
0
0
0
C
1
0
1
1
1
TABLE 3.8
Binary Data of UX
The average of UX
Task 1
Task 2
Task 3
Picking up
mechanical
pencil
Holding
mechanical
pencil
Clicking
mechanical
pencil
AV
AV
AV
Task 4
Writing
AV
Synthetic
evaluation of user
requirements
AV
A
1
1
0
1
0
B
1
1
0
0
0
C
1
0
1
1
1
The average of user requirements and UX of mechanical pencils A, B and C were
changed into binary data. If the usability or UX average is higher than the usability
average (2.99) and UX average (2.23) for each total average, the average is 1 (Tables
3.7 and 3.8). If lower, the average is 0.
b. Making Hasse diagrams
FCA shows a Hasse diagram using the binary data of usability and UX (Figures 3.6
and 3.7).
c. Interpreting the Hasse diagram
Each mechanical pen is connected with its evaluation item through lines from the
top point in the Hasse diagram. An arrow is added to understand the relationship
between the mechanical pencils and the evaluation items. Users can understand the
relationship according to the arrows from the top point to the mechanical pencil. The
Usability-UX Task Analysis, REM, UX
FIGURE 3.6
The usability output of FCA.
FIGURE 3.7
The UX output of FCA.
47
evaluation items located in the upper position in the Hasse diagram are important
and shared with many mechanical pencils.
3.4
3.4.1
REM (HIERARCHICAL REQUIREMENTS
EXTRACTION METHOD) (YAMAOKA 2013)
BACKGROUND AND PURPOSE
After a usability specialist has observed products or systems, they only extract problems of usability and improve them. However, they don’t usually grasp the root cause
and fnal purpose. Grasping the root cause and fnal purpose of products and systems
can give an ideal and essential understanding of them for the usability specialist.
48
Handbook of Usability and User Experience
REM is a method to extract user requirements by root cause and fnal purpose
based on problems of products or systems. The relationship between results and
cause may require the root cause of products and systems, while the relationship
between purpose and means may require the fnal purpose.
3.4.2 PROPOSED METHOD
The procedure of REM is as follows (Figure 3.8).
FIGURE 3.8 The structure of REM.
Usability-UX Task Analysis, REM, UX
49
How to obtain the fnal purpose
1) Problems are extracted based on observation, protocol analysis, check list,
questionnaire and so on.
2) A problem is selected and solutions are produced based on the problem.
In the case of a heavy camera as the problem, a light camera is the solution.
3) A purpose is needed from the perspective of the relationship between purpose and means. In short, the purpose is realized using the means.
For the example above, no fatigue to use the camera is the purpose required based
on the means of a light camera.
4) Each purpose is required to repeatedly raise the saturation state from the
perspective of the relationship between purpose and means.
5) The fnal purpose is produced when the purpose cannot be abstracted.
New user requirements and UX are created based on the redefned fnal purpose. For
the above-mentioned example, the fnal purpose is to realize comfortable operation.
As one example, a new camera with all voice instruction is produced based on the
idea of comfortable operation.
How to obtain root cause
1) As the problem is the result, a cause is needed from the perspective of the
relationship between the result and cause.
For the above example, the problem is the heavy camera and so the cause seems to
be to have a lot of functions not used in the camera.
2) Each cause is required repeatedly up to the saturation state from the perspective of the relationship between the result and cause.
3) The root cause is produced when the cause cannot be abstracted.
For the example above, the root cause seems to be technicism.
The second hierarchy level of the fnal purpose is concrete user requirements, and
the second hierarchy level of the root cause is the concrete cause of the problem. The
opposite concepts of the concrete causes of the problem show the user requirements.
As REM can extract the fnal purpose and root cause of products, systems and so
on, the user requirements and UX can be produced.
3.4.3 OBSERVATION
Before doing REM, observation is required to obtain the problems. Although the
problems are also obtained by usability-UX task analysis, easy observation is
50
Handbook of Usability and User Experience
TABLE 3.9
Five Aspects of HMI and 15 Items
Five aspects of HMI
(human machine interface)
Search problems using the following items
1.
Physical aspect
a. Check user’s posture
b. Check operational direction and strength of the controls
c. Check ft between the controls and the user’s body
2.
Information aspect
3.
Temporal aspect
4.
Environmental aspect
a.
b.
c.
a.
b.
c.
a.
b.
c.
5.
Organizational aspect
Check user’s mental model
Check easiness to understand
Check easiness to see
Check working time
Check recess
Check machine response time
Check air conditioning
Check lighting
Check noise and vibration
a. Check organization’s policy
b. Check information sharing among members
c. Check motivation of members
introduced. The problems are extracted easily from the viewpoint of the fve aspects
of HMI (human–machine interface). The total 15 check items of the fve aspects of
HMI can easily search for problems (Table 3.9).
3.5 EXAMPLE OF REM APPLICATION
An example of a desk lamp in a hotel and a cafe shop using REM is shown.
1) A desk lamp in a hotel room (Figure 3.9)
As a desk lamp inside causes glare, it’s very hard for customers to read books or PC
screens. Although the hotel is a business hotel next to a railway station, desk lamps
used in luxury hotels are usually placed on a desk. After using REM, the fnal purpose
is defned as “Providing a comfortable environment in the room.” A new idea “Barrierfree design for everybody” is created based on the fnal purpose and root cause.
2) Cafe shop (Figure 3.10)
A new idea “Providing a familiar user experience and healing in a cafe” is proposed
as the fnal purpose to solve “Not having customers in a café.” Finally, “Easy access
to the cafe, and forming a familiar interior of healing with aroma, sound, etc.” is
created.
Usability-UX Task Analysis, REM, UX
51
FIGURE 3.9 A desk lamp as an example of REM.
3.6 UX SYSTEM DIAGRAM
3.6.1
BACKGROUND
UX system diagrams can create UX and feelings based on the four attributes of product, story, feeling and sense by UX. UX becomes an important factor to construct
various designs. It is diffcult to create UX based on human intuition because of its
ambiguity. If designers and engineers depend on intuition to design, they require
a lot of knowledge, intelligence and experience. However, they can construct UX
using the UX system diagram as a frame of thinking even if they don’t have a lot of
knowledge, intelligence and experience.
52
Handbook of Usability and User Experience
FIGURE 3.10 A cafe as an example of REM.
3.6.2
PROPOSED METHOD
This method creates a new UX using a combination of the following four factors.
1) Three attributes of the product: useful, usable, desirable (Null and Cherry
1998)
2) Story: newest story, real story, historical story, fctional story
3) Feeling: lovely, admired, joyful, interesting, impressed, surprised, expected,
comfortable, satisfed
53
Usability-UX Task Analysis, REM, UX
TABLE 3.10
Defnition of Senses by UX
Senses by UX (senses produced by user experience (UX))
Sense
Defnition
Extraordinary sense
Sense from travelling and going to a concert
Sense of usability
Sense from fve senses
Sense from usability such as Web services and IC cards
Sense from fve senses such as watching a 3D movie and smelling
perfume
Sense from obtaining useful information and accepting presents
Sense evoked by admiration such as big-name brand products and
favorite artist
Sense of accomplishment, fulfllment and unity such as completing
a project
Sense from obtaining something
Sense of admiration
Sense after doing a task
Sense of familiarity
Sense from familiarity such as attachment to an old house or old
watch
4) Sense from UX: sense from UX is produced by user experience (UX).
There are seven kinds of sense: extraordinary sense, sense of usability,
sense from the fve senses, sense from obtaining, sense of admiration, sense
after doing tasks, sense of familiarity (Table 3.10).
Figures 3.11 and 3.12 show the relationship between the three attributes of product,
story and feeling and sense by UX. If the relationship between the two keywords is
closely related, a line is drawn between the two keywords such as newest story and
surprised and so on.
How to use the UX system diagram
1) Making a story using the UX system diagram
2) Suitable keywords are selected from the UX system diagram
3) As selected keywords are connected and lines drawn, the story and UX are
decided.
FIGURE 3.11
UX system diagram in useful and usable aspects of product or systems.
54
Handbook of Usability and User Experience
FIGURE 3.12 UX system diagram of desirable aspects of product or systems.
3.7
EXAMPLE OF UX SYSTEM DIAGRAM APPLICATION
Two examples:
1) Latest medical equipment introduced into a hospital
When a hospital introduces latest medical equipment, the patient or people planned
to be hospitalized have expectations on their sense of its administration.
The items of “Useful, Usable,” “Newest story,” “expected” and “Sense of admiration” are connected as one story (Figure 3.13). Each item selected shows concrete
content as below:
“Useful, Usable”------ “Newest story”------ “expected”------“Sense of
admiration”
“Useful, Usable”: latest medical equipment
FIGURE 3.13 Example 1: Newest medical equipment introduced in hospital.
Usability-UX Task Analysis, REM, UX
55
FIGURE 3.14 Example 2: A fctional Cinderella Castle constructed.
“Newest story”: the hospital introduces the latest medical equipment
“expected”: patients or people planned to be hospitalized have expectations
“Sense of admiration”: a sense of administration
2)
A fctional Cinderella Castle constructed
If a fctional Cinderella Castle in an amusement park is constructed, users enjoy and are
moved from the perspective of having a dream and extraordinary sense (Figure 3.14).
“Desirable”------“Fictional story”------“joyful”------“Extraordinary sense”
“Desirable”: Cinderella Castle
“Fictional story”: a fctional Cinderella Castle was constructed
“joyful”: users enjoy from the perspective of having a dream
“Extraordinary sense”: users enjoy from the perspective of extraordinary sense
The UX system diagram can create a UX structure and decide a design plan using
the three attributes of product, story, feeling and sense from the UX.
3.8 CONCLUSION
The three methods for usability and UX can show how to obtain user requirements
and UX. Designers, engineers and planners as beginners of collecting user requirements especially can obtain them using the three methods without intuition.
Usability-UX task analysis can collect user requirements and UX effciently and
systematically. REM can also extract user requirements by root cause and fnal purpose based on the problems of products or systems. The problems can be found by
usability-UX task analysis or observation. UX system diagrams can create UX and
feelings based on the four attributes of product, story, feeling and sense from the UX.
The relationship between the three methods is shown in Figure 3.15.
56
FIGURE 3.15
Handbook of Usability and User Experience
The relationship of the three methods.
REFERENCES
Roberta. L. Null, Kenneth F. Cherry, 1998, Universal Design, 116. Belmont: Professional
Publications, Inc.
Toshi Yamaoka, 2012, A proposal of usability task analysis for user requirements and evaluation, in 4th International Conference on Applied Human Factors and Ergonomics
(AHFE) Conference Proceedings, 7116–7122.
Toshiki Yamaoka, 2013, Evaluating user interface design using hierarchical requirements
extraction method (REM), in HCI International 2013, Conference Proceedings,
137–142.
4
Remote Usability Testing
J. M. Christian Bastien and Kevin Falzone
CONTENTS
4.1
4.2
Introduction .................................................................................................... 57
Preparing and Conducting a User Test ........................................................... 58
4.2.1 The Defnition of Test Objectives ....................................................... 58
4.2.2 The Selection and Recruitment of Test Participants........................... 58
4.2.3 The Defnition of Task Scenarios ....................................................... 59
4.2.4 The Choice of Measures, Their Analyses and Their Representation ...... 59
4.2.5 The Preparation of the Test Material and the Test Environment
(Test Laboratory) ................................................................................ 63
4.2.6 The Presentation and Communication of Test Results.......................64
4.3 Remote User Testing.......................................................................................64
4.3.1 Moderated User Testing......................................................................64
4.3.2 Unmoderated User Testing ................................................................. 65
4.3.3 Comparing In Situ and Remote User Testing .....................................66
4.4 Conclusion ...................................................................................................... 67
Notes ........................................................................................................................ 68
References................................................................................................................ 68
4.1 INTRODUCTION
Usability evaluation is an essential step in the user-centered design cycle
(International Organization for Standardization, 2019). For usability evaluation, different approaches and methods are available: model-based evaluations (Kieras, 2012),
inspection-based evaluations (Cockton, Woolrych, Hornbæk, & Frøkjær, 2012) and
user testing (Dumas & Fox, 2012; Lewis, 2012). This latter method is probably the
most documented one. There are countless articles and books on it (Barnum, 2020;
Dumas & Redish, 1999; Rubin & Chisnell, 2008; Tullis & Albert, 2013).
With the Internet, remote usability testing has gained popularity, especially for
testing Web sites. In remote user tests, researchers and participants are in different
locations and participants use their own hardware and software. This is made possible by different technologies.
The aim of this chapter is to present a state of the art in remote usability testing.
The differences between the two approaches in terms of methodology and tools,
advantages and drawbacks of each will be addressed. Before presenting the state
of the art in remote usability testing and allowing the comparison between in situ
user tests and remote testing, we will describe how the user tests are prepared and
conducted in the traditional lab.
DOI: 10.1201/9780429343490-5
57
58
Handbook of Usability and User Experience
4.2 PREPARING AND CONDUCTING A USER TEST
To assess the usability of interactive systems, experts collect behavioral, physiological and self-reported data (Bergstrom & Schall, 2014; Sauro & Lewis, 2016; Tullis
& Albert, 2013). But before capturing these data, experts have to go through the following steps for preparing the test (Bastien, 2010):
•
•
•
•
•
•
•
•
•
•
The defnition of the test objectives,
The selection and recruitment of test participants,
The selection of tasks that participants will be asked to perform,
The creation and description of task scenarios,
The choice of the measures and the way the data will be recorded,
The preparation of the test material and test environment (the usability
laboratory),
The choice of the tester and the design of the test protocol per se (instructions, design protocol, etc.),
The selection of satisfaction questionnaires,
The analysis of the data,
The presentation and communication of the test results.
Some of these steps, as they take place in a usability lab, are detailed in the following sections.
4.2.1 THE DEFINITION OF TEST OBJECTIVES
The design faws may be identifed during the development cycle of an interactive
system or when the system is released. In the frst case, we talk about formative
evaluations which are conducted at the beginning of the design process and continue
until the fnal system is released. In other words, evaluations are usually performed
with each new version of the underdevelopment system in order to identify and fx
usability problems. These evaluations end when predefned criteria are met (e.g., a
planned number of iterations, a percentage of successful tasks, etc.).
In the second case, summative evaluations are intended to assess the fnal system in order to measure its performance, to validate that the system meets a set of
requirement criteria and to benchmark the system to previous versions or to competing products.
4.2.2 THE SELECTION AND RECRUITMENT OF TEST PARTICIPANTS
Tests participants should be representative of the end users in terms of characteristics, knowledge and skills. The number of users that need to be mobilized is an issue
that has been addressed by several authors. Early studies concluded that fve users
were suffcient to identify 80–85% of usability problems (Lewis, 1994; Nielsen &
Landauer, 1993; Virzi, 1990, 1992).
However, more recent studies have indicated that fve users could not be suffcient.
For example, Spool and Schroeder (2001) report that 35% of usability problems were
Remote Usability Testing
59
found with the frst fve users, but that critical usability problems were found from
the 13th and 15th test participants. Faulkner (2003) also conducted a study involving
60 users who were asked to complete a computerized timesheet. The author found
that the risk of relying on a group of fve users could cause half of the usability problems to be missed.
4.2.3
THE DEFINITION OF TASK SCENARIOS
During user testing, participants are usually asked to perform predefned tasks.
These tasks are selected according to several criteria such as the objectives of the
test or research hypotheses, the end user’s goals, the frequency with which they are
performed by the end users, the areas of the system where there may be potential
usability problems, the system’s business objectives, the results of a previous test or
inspection methods or the new functionalities which have to be tested.
Following the selection and defnition of the tasks, the experts have to write
instructions and test their comprehensibility. When writing the instructions, experts
will keep in mind that users are invited to achieve specifc objectives and not to follow a succession of actions.
4.2.4
THE CHOICE OF MEASURES, THEIR ANALYSES AND THEIR REPRESENTATION
During a user test, experts collect specifc information related to effectiveness and
effciency of the interaction and also satisfaction with the system, which are the
characteristics of usability (International Organization for Standardization, 2018).
The data can be classifed into three categories:
Behavioral data. The most commonly used behavioral data collected during a
user test are the task status (i.e., success or failure), task duration, error rate and
physical or/and cognitive efforts. In the context of Web sites, clickstreams and the
lostness metric (Smith, 1996) can also be collected and computed.
The task status is a way of reporting whether or not the user has completed the
task and to what extent. From this task status, several analyses and representations
can be produced: the ratio of successes (or failures), the average calculation of the
tasks (i.e., the number of participants who succeeded or failed in completing the
task) and the average calculation for each participant (i.e., the number of tasks that
the participant was able to complete or fail to complete).
The time on task is the time elapsed between the start of a task and its completion.
Duration of the task can be calculated and presented not only for each task (i.e., the
average time the user takes to complete the task) but also for each user (i.e., the average time the user takes to complete all tasks).
Errors are the actions that can cause the task to fail. Errors can be calculated and
presented as error rate per task per user or for each task per user. It is also possible to
assign a severity score (low, medium, high) and then calculate the frequency for each
category of errors. These errors are generally due to usability problems.
Physical efforts refer to the physical activity required to perform the task, whereas
cognitive efforts are the mental resources involved in responding to a particular task.
60
Handbook of Usability and User Experience
They can be analyzed by counting the number of actions, such as clicks, performed
to complete the task. Usually, experts calculate an average number of actions for
each task (per participant).
Clickstreams illustrate the paths taken (by users) on a Web site. It can be used to
identify the pages that participants go through in their search for information and to
calculate the percentage of participants taking each route (e.g., Figure 4.1). It allows
assessing the heading and links and their relation to their content.
The lostness metric (Smith, 1996) indicates whether or not users are lost on a Web
site. The coeffcient is calculated from three elements: (1) N: the number of unique
Web pages that were visited during the task (pages that are visited several times only
count once); (2) S: the total number of Web pages visited during the task, including
page revisits; (3) R: the (optimal) number of pages that must be visited to complete
the task. These three elements are then used in the following formula to calculate the
lostness metric noted L:
L = sqrt((N / S -1)2 + (R / N -1)2 ).
Smith (1996) found that the score L of less than 0.4 shows no sign of being lost. In
contrast, participants with a score above 0.5 appear disoriented. When the L value
was calculated for each participant, it is possible to obtain an average score for
each task.
The use of eye-tracking techniques makes it possible to know precisely where
the participant’s gaze lands throughout the test session (Bergstrom & Schall, 2014).
This technique can be used, for example, to analyze cognitive processing, stimulation and interest using the user’s pupillary response, or to determine whether the
user, while browsing, correctly saw the Web link to successfully complete the task
or whether the user took it into account but did not click on it. From the eye-tracking
data, it is possible to obtain the following: (a) The scanpath which allows the visual
representation of the participant’s eye path on the interface. This technique takes
into account two types of data: fxations and saccades. The fxations, which are a
pause in the eye’s movement over an area, are usually expressed in numbered circles,
while saccades, which are brief, rapid eye movements, are represented by lines joining two fxations. (b) The heat map which is used to represent the eye movements of
several participants on the Web page. The colors of the heat map indicate the density
of eye fxations. Usually, the warmer the color, the higher the fxation density and,
conversely, the colder the color, the lower the fxation density. The heat map is an
excellent way to know which area(s) of the page is attracting more (or less) attention
from participants. (c) The focus map which makes areas that have received the most
visual attention transparent, while it darkens areas that have received little or no
visual attention.
It is also possible to make analyses of eye-tracking data according to specifc areas
(called areas of interest [AOI]) that have been delineated by the experts. From these
areas of interest, experts can have dwell times, number of fxations within an AOI, the
sequence, time to frst fxation, revisits, hit ratio, etc. From these analyses, two types of
visualizations are possible: (1) binning charts which show the percentage of time spent
FIGURE 4.1 Schematic example of a clickstream taken from a test conducted with Evalyzer (www.evalyzer.com).
Remote Usability Testing
61
62
Handbook of Usability and User Experience
looking at each area of interest according to a time interval; (2) areas of interest grids
which show the amount of visual attention given to cut out cells of equal size.
Physiological data. The most common physiological measures used in user
tests are facial expressions, skin conductance and electroencephalography (EEG).
Software such as FaceReader1 can determine the emotional state of the participant
based on his or her facial expressions (based on the taxonomy of Ekman and Friesen
(1975)). The conductance (or electrodermal activity) of the skin is measured using
sensors to detect emotional activation or stimulation. Three types of activation exist:
an increase in mental load, an increase in emotion/emotional state and/or an increase
in physical activity. Emotional states associated with increased electrodermal activity include fear, anger and joy. Knowing the emotional states of participants during
the user testing session can be useful not only in evaluating the user experience, but
also in detecting usability problems.
Brain waves measured by electroencephalogram are associated with cognitive
and emotional states. For example, they can detect states of activation or excitement
or calm in users (Alfmtsev, Basarab, Devyatkov, & Levanov, 2015).
Self-reported data. Most of the time, self-reported data used in user testing are
collected in three different ways: with the think-aloud protocol, with questionnaires
and with standardized satisfaction questionnaires.
User verbalizations are collected by the think-aloud protocol method. The thinkaloud protocol involves asking participants to think aloud while interacting with the
system. Users are invited to express anything that comes to their mind, i.e., their
ways of doing things, their opinions, their reactions and so on. Experts can have users
perform verbalizations during the test session (which is called concurrent thinkaloud protocol) or after the test session accompanied with a video recording of their
performance (which is called retrospective think-aloud protocol).
Written and oral comments are collected with open-ended, closed-ended, single
choice, multiple-choice questions, scales and ranking questions (e.g., Likert scale
[Likert, 1932] and semantic differentiators (Osgood, Suci, & Tannenbaum, 1957)).
In addition, from the 1980s onward, authors have developed satisfaction questionnaires. These questionnaires can be categorized globally by their number of items,
the usability dimensions they evaluate, the scale format and the type of systems they
are designed for. Some examples of satisfaction questionnaires are the ASQ (After
Scenario Questionnaire) (Lewis, 1995), the AttrakDiff (Hassenzahl, Burmester,
& Koller, 2003), the CSUQ (Computer Usability Questionnaire) (Lewis, 1995),
the meCUE (Minge & Riedel, 2013), the PSSUQ (Post-Study System Usability
Questionnaire) (Lewis, 2002), the PUTQ (Purdue Usability Testing Questionnaire)
(Lin, Choong, & Salvendy, 1997), the QUIS (Questionnaire for User Interface
Satisfaction) (Chin, Diehl, & Norman, 1988), the SUMI (Software Usability
Measurement Inventory) (Kirakowski & Corbett, 1993), the SUS (System Usability
Scale) (Brooke, 1996), the UEQ (User Experience Questionnaire) (Laugwitz, Held,
& Schrepp, 2008; Laugwitz, Schrepp, & Held, 2006), the UMUX (Usability Metric
for User Experience) (Finstad, 2010), the UMUX-LITE (Usability Metric for User
Experience) (Lewis, Utesch, & Maher, 2013) and the USE (Usefulness, Satisfaction
and Ease of Use) (Lund, 2001).
Remote Usability Testing
63
Some satisfaction questionnaires are more dedicated to Web sites: e.g., DEEP
(Design-oriented Evaluation of Perceived Usability) (Yang, Linder, & Bolchini,
2012), EUCS (End User Computing Satisfaction) (Doll & Torkzadeh, 1988), the
perceived Web site usability measurement scale (Wang & Senecal, 2007), SUPR-Q
(Sauro, 2015), the user-perceived Web quality instrument (Aladwani & Palvia, 2002)
and WAMMI (Web Analysis and Measurement Inventory, www.wammi.com).
4.2.5
THE PREPARATION OF THE TEST MATERIAL AND THE
TEST ENVIRONMENT (TEST LABORATORY)
The structure of a test laboratory is usually composed of several rooms. Although the
number of rooms differs from laboratory to laboratory, there is a minimum of two rooms
(Nielsen, 1994): a testing room for the participant(s) and an observation room for usability professionals. In this frst room, you will fnd materials for conducting the test, such
as a computer, tablet or smartphone, for presenting the interface (Web site, application)
to be evaluated. The instructions, usage scenarios and questionnaires are generally provided in paper or online version or eventually verbally given by a facilitator.
The test room also contains recording devices allowing the user’s actions on the
interface to be collected through software snapshots, cameras for observing the users,
user verbalizations with the help of microphones and physiological measurements
using specifc devices (e.g., cardio-frequency meters and electrodermal sensors).
This room is usually separated by a one-way glass. The observation room contains equipment for the observation of the users and instruments to interact with the
user (i.e., microphones).
Sometimes additional rooms are used in some laboratories (Figure 4.2): an observation room where additional people can observe the test without interfering with the
users or assessors, a reception room and audiovisual control room.
FIGURE 4.2
Pergolab user test laboratory (Metz, France).
64
Handbook of Usability and User Experience
4.2.6 THE PRESENTATION AND COMMUNICATION OF TEST RESULTS
Although the presentation and communication of test results can be left to the choice
of the usability professionals, a template (the CIF2) has been proposed (American
National Standard, 2001; International Organization for Standardization, 2010). The
purpose of this template is to standardize the writing of test reports.
4.3 REMOTE USER TESTING
In the previous sections, the preparation of the test session, as well as the tools used
during the laboratory sessions, has been presented. In this and the following sections, we will address the remote user testing and the tools used. We will also ask
ourselves if this kind of test allows gathering the same kind of data that are gathered in a laboratory and if the results of these tests compare to those obtained in a
laboratory.
Over the past two decades or so, the Internet has made it possible to conduct
user tests remotely. Thus, “the evaluator, performing observation and analysis,
is separated in space and/or time from the user” (Hartson, Castillo, Kelso, &
Neale, 1996). Remote user testing addresses several issues encountered in laboratory settings. In fact, remote testing does not require testers to travel to the
testing labs, saving time and money. It also makes it possible to involve testers
who are far away, and to reduce the costs of traditional lab. Moreover, users are
in their natural environment (i.e., they use their own hardware and software).
However, the remote user test may face some new issues such as installation and
confguration of the software to perform the test as well as confdentiality issues
(De Bleecker & Okoroji, 2018).
Two ways of conducting remote user testing have been used by experts: (1) User
tests that involve the supervision of an evaluator (synchronous and moderated testing). (2) User tests that do not require the presence of a moderator (asynchronous and
unmoderated).
4.3.1 MODERATED USER TESTING
Moderated remote user testing was born in the 1990s, thanks to the development
of information sharing and collaborative tools (Hammontree, Weiler, & Nayak,
1994). Like user testing labs, evaluators conduct the tests and collect information
while users perform different actions on the system, but in this context evaluators
are just geographically separated from users. Evaluators interact directly with test
participants.
To perform user tests, three key elements are required (Dumas & Loring, 2008):
the system being evaluated, a sharing application and a recording application.
Nowadays, evaluators usually use videoconferencing tools (e.g., WebEx,3 Zoom,4
etc.) in order to collect user screen actions, user verbalizations and user facial expressions. Commercial tools such as Lookback5 and Loop116 can be used in moderated
remote user testing.
Remote Usability Testing
4.3.2
65
UNMODERATED USER TESTING
Unmoderated remote testing appeared in the late 1990s (Scholtz, Laskowski, &
Downey, 1998). In unmoderated testing, the evaluators are physically and temporally
separated from the users. In other words, evaluators are replaced by a platform which
is in charge to conduct user tests and to collect data from users (and in some circumstances analyzes them). The advantages are that many users may participate at the
same time, thus more participants can be recruited in a given period of time, reducing the duration of the test campaign. The test is also independent of time zones. In
this situation, users are not infuenced by the expert’s comments or behaviors and
the test situation is less impressive because the user is in a familiar environment at
home or at work.
But there are some drawbacks. In fact, users may not be able to get assistance if
needed. Experts cannot observe test participants while they are running the test and
cannot interact with them. But some of these drawbacks can be mitigated depending
on the technology used.
Over the last 20 years, unmoderated remote user testing tools have evolved signifcantly in terms of the architecture used to collect data, the type of data collected,
the skills and amount of effort required by usability experts.
Three approaches have been adopted to conduct remote testing: server-based,
proxy-based or client-based approach.
Server-based approaches are normally able to collect navigation data and even
interaction data by adding some JavaScript code on Web pages which require access
to the Web server. With this approach, it may be diffcult to interpret users’ actions,
paths and goals. Nevertheless, a possible solution has been proposed to address these
drawbacks. This solution combines users’ actions data and subjective data collected
through questionnaires in the same tool (Winckler, Freitas, & Valdeni de Lima, 2000).
Proxy-based approaches consist in adding an “intermediary” between the client
which sends requests to obtain Web pages and the server which provides specifc
Web pages according to the requests. By being located between the two, the proxy
can retrieve some data. Like server-based tools, this approach gathers navigation
data (Hong & Landay, 2001), interaction data (Atterer & Schmidt, 2007; Atterer,
Wnuk, & Schmidt, 2006; Baravalle & Lanfranchi, 2003) as well as subjective data
(Baravalle & Lanfranchi, 2003). This approach solves the main issue related to the
server-based approach, i.e., the access to the server.
Client-based approaches consist in using either an instrumented browser (e.g.,
Uzilla) (Edmonds, 2003) or browser plugins (e.g., Evalyzer7 and Loop118). Thanks
to this approach, not only the above-mentioned data but also the user’s actions
on the Web browser (e.g., backward and forward buttons) can be recorded. With
this approach, however, the user must have a compatible operating system or Web
browser, the required privileges and the aptitude or the inclination to install a browser
or plugins on his machine.
Recent commercial tools mainly use the plugin approach and (try to) integrate all
the steps required to conduct user tests for reducing the amount of effort needed by
usability experts (e.g., Evalyzer,9 Lookback,10 Loop1111 and UserTesting12).
66
Handbook of Usability and User Experience
To a certain extent, these tools can manage the different steps that were described
in the previous sections for preparing and conducting a user test. For instance, user
selection and description can be done by a screening questionnaire. Evalyzer and
UserTesting, for example, offer this functionality. All the platforms mentioned above
allow defning tasks. However, given that the test is conducted without supervision,
experts or evaluators cannot know when participants have succeeded a task or not.
Thus, conditions of success must be defned in order for the tool to be able to calculate success rates and failures. Some of the tools provide this functionality (Evalyzer
and Loop11). To our knowledge, only one of them allows the evaluator to randomize
the task order (Evalyzer). At the end of the test, satisfaction questionnaires are provided as well as the possibility to develop different types of questions both after each
task and at the end of the test (e.g., Evalyzer, Loop11 and UserTesting).
The measures, their analyses and their representation may vary depending on the
platform. Behavioral data, self-reported data and user software and hardware environment information can also be collected. However, no platforms allow capturing
physiological data. The use of Webcams has been attempted to record the position
of the gaze on Web pages on the desktop of the remote participant, but the data collected is not very reliable (Chynał & Szymański, 2011) and the software used may
compete with the remote testing application for the Webcam resources.
After collecting user data, some platforms provide automatic analyses and representations of the results. Individual results are provided as well as group statistics
on each task and questionnaire responses. Thus, it is possible to know for each user
the number of tasks on which he failed, the task duration, the efforts (e.g., number of
clicks, scrolls, pages consulted), the pages consulted (i.e., clickstream) and the lostness coeffcients. In addition, the results of standardized satisfaction questionnaire
(e.g., the SUS) can be computed automatically. At the level of the tasks, we get the
number of users which have failed on the task, the average duration of the task, the
average effort on the task, the clickstream on the task and the average of the lostness
metric.
These platforms allow not only exploring data and visualizing the analyses but
also exporting data in spreadsheet format, the fgures, and the video recordings of
the test session which may contain the comments made by the participants and the
participants’ faces in picture-in-picture if the participants are allowed the use of the
Webcam and the microphone. Finally, some platforms allow generating a PowerPoint
report.
4.3.3 COMPARING IN SITU AND REMOTE USER TESTING
Several studies have examined the effects of user test situations (i.e., laboratory testing, remote and supervised testing, remote and unsupervised testing) on dependent
variables such as the number of usability issues identifed and their severity, task
duration, task completion, number of errors, satisfaction, etc.
As for the number of usability problems, fve studies found that the lab situation
and the remote testing situation were comparable (Andreasen, Nielsen, Schrøder,
& Stage, 2007; Brush, Ames, & Davis, 2004; Chalil Madathil & Greenstein, 2017;
Remote Usability Testing
67
Hartson et al., 1996; Thompson, Rozanski, & Haake, 2004). In the same way, the
severity of the problems found was similar in both situations (Andreasen et al., 2007;
Brush et al., 2004; Chalil Madathil & Greenstein, 2017).
Among the four studies which have measured the task duration, three of them
showed that there were no signifcant statistical differences (Andreasen et al., 2007;
Brush et al., 2004; Chalil Madathil & Greenstein, 2017) and only one study showed
that local participants took less time (Thompson et al., 2004). One of the studies
reported that the setup and wrap-up of the test took signifcantly more time for
remote moderated testing and the discussion was slightly longer in the laboratory
condition (Brush et al., 2004).
One study reported that the task completion time was not different between the
two test contexts (Andreasen et al., 2007) and another one reported that the number
of errors was less for the local participants (Thompson et al., 2004).
Two studies measured satisfaction through questionnaires (Hartson et al., 1996;
Thompson et al., 2004). They concluded that the results were comparable.
A point to note is that “the majority of participants felt that the remote condition
was more convenient” and “half would prefer to be involved in remote studies over
local studies in the future, while none preferred local over remote condition” (Brush
et al., 2004).
Only one study compared the laboratory and the unmoderated remote testing
(Tullis, Fleischman, McNulty, Cianchette, & Bergel, 2002), and in this study both
confgurations allowed identifcation of the most critical usability issues. Task completion rates and task duration were found comparable.
However, the results of these comparisons should be considered with caution as
the technologies used are different.
4.4 CONCLUSION
The aim of this chapter was to give the reader an overview of the state of the art in
remote usability testing. To do so, we frst presented the different steps an evaluator
has to go through in order to prepare and conduct the usability test and to analyze the
data captured. These steps were described as they are usually conducted in a local
usability laboratory. They were thus used as a reference. We then gave a brief overview of the evolution of the technologies used to conduct remote usability tests and
presented some commercial platforms. Studies comparing the local laboratory test
session with the remote testing situation were then presented. We conclude that with
recent technologies, the data that can be obtained from remote testing is no longer
different from the data captured in a local usability laboratory except for physiological data and eye-tracking recordings. But remote usability platforms which allow
conducting usability tests remotely can also be used in a local laboratory so as to
complete the test campaign with other kinds of measures. What emerges from these
comparisons and comparative analyses of the platforms is that the most recent ones
use plugin technologies which allow the evaluators to capture performance data
(quantitative) as well as subjective data. The platforms differ from one another in the
way they allow, for example, managing the tasks presented to the users as well as
68
Handbook of Usability and User Experience
the way they analyze the data. It can be expected that these will continue to evolve
and will make it possible to integrate other measurement tools whether in a remote
situation or as a complement to it.
NOTES
1.
2.
3.
4.
5.
6.
7.
8.
9.
10.
11.
12.
https://www.noldus.com/facereader
Common Industry Format (for usability test reports).
https://www.webex.com/
https://zoom.us/
https://lookback.io/
https://www.loop11.com/
https://www.evalyzer.com/
https://www.loop11.com
https://www.evalyzer.com/
https://www.lookback.com/
https://www.loop11.com/
https://www.usertesting.com/
REFERENCES
Aladwani, A. M., & Palvia, P. C. (2002). Developing and validating an instrument for measuring user-perceived web quality. Information & Management, 39(6), 467–476.
doi:10.1016/S0378-7206(01)00113-6
Alfmtsev, A. N., Basarab, M. A., Devyatkov, V. V., & Levanov, A. A. (2015). A new methodology of usability testing on the base of the analysis of user’s electroencephalogram.
Journal of Computer Sciences and Applications, 3(5), 105–111. doi:10.12691/jcsa-3-5-1
American National Standards Institute. (2001). Common Industry Format for Usability
Test Reports (Formerly ANSI INCITS 354-2001). New-York, NY: American National
Standards Institute, Inc.
Andreasen, M. S., Nielsen, H. V., Schrøder, S. O., & Stage, J. (2007). What happened to
remote usability testing? An empirical study of three methods. In Proceedings of the
SIGCHI Conference on Human Factors in Computing Systems, San Jose, California,
USA. https://doi.org/10.1145/1240624.1240838.
Atterer, R., & Schmidt, A. (2007). Tracking the interaction of users with AJAX applications
for usability testing. In Proceedings of the SIGCHI Conference on Human Factors
in Computing Systems, San Jose, California, USA. https://doi.org/10.1145/1240624
.1240828.
Atterer, R., Wnuk, M., & Schmidt, A. (2006). Knowing the user’s every move: user activity
tracking for website usability evaluation and implicit interaction. In: Proceedings of the
15th International Conference on World Wide Web, Edinburgh, Scotland. https://doi
.org/10.1145/1135777.1135811.
Baravalle, A., & Lanfranchi, V. (2003). Remote web usability testing. Behavior Research
Methods, Instruments, & Computers, 35(3), 364–368. doi:10.3758/BF03195512
Barnum, C. M. (2020). Usability testing essentials: ready, set... test!. (2nd ed.). Amsterdam:
Morgan Kaufmann.
Bastien, J. M. C. (2010). Usability testing: A review of some methodological and technical
aspects of the method. International Journal of Medical Informatics, 79(4), e18–e23.
doi:10.1016/j.ijmedinf.2008.12.004
Remote Usability Testing
69
Bergstrom, J. R., & Schall, A. J. (2014). Eye tracking in user experience design (J. R.
Bergstrom & A. J. Schall, eds.). Boston, MA: Elsevier.
Brooke, J. (1996). SUS: A quick and dirty usability scale. In P. W. Jordan, B. Thomas, B. A.
Weerdmeester, & I. L. McClelland (Eds.), Usability evaluation in industry (pp. 189–
194). London: Taylor & Francis.
Brush, A. J. B., Ames, M., & Davis, J. (2004). A comparison of synchronous remote and local
usability studies for an expert interface. In: CHI '04 Extended Abstracts on Human
Factors in Computing Systems, Vienna, Austria. https://doi.org/10.1145/985921.
986018.
Chalil Madathil, K., & Greenstein, J. S. (2017). An investigation of the effcacy of collaborative virtual reality systems for moderated remote usability testing. Applied Ergonomics,
65, 501–514. doi:10.1016/j.apergo.2017.02.011
Chin, J. P., Diehl, V. A., & Norman, K. L. (1988). Development of an instrument measuring user satisfaction of the human-computer interface. In Proceedings of the SIGCHI
Conference on Human Factors in Computing Systems, Washington, D.C., USA. https://
doi.org/10.1145/57167.57203.
Chynał, P., & Szymański, J. M. (2011). Remote usability testing using eyetracking. In P.
Campos, N. Graham, J. Jorge, N. Nunes, P. Palanque, & M. Winckler (Eds.), Humancomputer interaction – INTERACT 2011 (Vol. 6946, pp. 356–361). Berlin: Springer.
Cockton, G., Woolrych, A., Hornbæk, K., & Frøkjær, E. (2012). Inspection-Based Evaluations.
In J. A. Jacko (Ed.), The human-computer interaction handbook: Fundamentals, evolving technologies and emerging applications (3rd ed.). Boca Raton, FL: CRC Press.
De Bleecker, I., & Okoroji, R. (2018). Remote Usability Testing: Actionable insights in user
behavior across geographies and time zones. Birmingham, UK: Packt Publishing..
Doll, W. J., & Torkzadeh, G. (1988). The measurement of end-user computing satisfaction.
MIS Quarterly, 12(2), 259–274. doi:10.2307/248851
Dumas, J. S., & Fox, J. E. (2012). Usability testing. In J. A. Jacko (Ed.), The human-computer
interaction handbook: Fundamentals, evolving technologies and emerging applications (3rd ed.). Boca Raton, FL: CRC Press.
Dumas, J. S., & Redish, J. (1999). A practical guide to usability testing (Rev. ed.). Portland,
OR: Intellect Books.
Dumas, J. S., & Loring, B. A. (2008). Moderating usability tests. principles & practice for
interacting. Morgan Kaufmann.
Edmonds, A. (2003). Uzilla: A new tool for web usability testing. Behavior Research Methods,
Instruments, & Computers, 35(2), 194–201. doi:10.3758/BF03202542
Ekman, P., & Friesen, W. V. (1975). Unmasking the face: A guide to recognizing emotions
from facial clues. Englewood Cliffs, NJ: Prentice-Hall.
Faulkner, L. (2003). Beyond the fve-user assumption: Benefts of increased sample sizes
in usability testing. Behavior Research Methods, Instruments, & Computers, 35(3),
379–383. doi:10.3758/BF03195514
Finstad, K. (2010). The usability metric for user experience. Interacting with Computers,
22(5), 323–327. doi:10.1016/j.intcom.2010.04.004
Hammontree, M., Weiler, P., & Nayak, N. (1994). Remote usability testing. Interactions, 1(3),
21–25. doi:10.1145/182966.182969
Hartson, H. R., Castillo, J. C., Kelso, J., & Neale, W. C. (1996). Remote evaluation: The network as an extension of the usability laboratory. In: Paper presented at the CHI96: CHI
‘96 ACM conference on human factors.
Hassenzahl, M., Burmester, M., & Koller, F. (2003). AttrakDiff: Ein Fragebogen zur Messung
wahrgenommener hedonischer und pragmatischer Qualität. In G. Szwillus & J. Ziegler
(Eds.), Mensch & computer 2003 (vol. 57, pp. 187–196). Wiesbaden: Springer.
70
Handbook of Usability and User Experience
Hong, J. I., & Landay, J. A. (2001). WebQuilt: A framework for capturing and visualizing the
web experience. In: Paper presented at the WWW ‘01: Proceedings of the 10th international Conference on World Wide Web.
International Organization for Standardization. (2010). ISO/IEC TR 25060:2010—Systems and
software engineering—Systems and software product quality requirements and evaluation
(SQuaRE)—Common industry format (CIF) for usability: General framework for usability-related information. Retrieved from https://www.iso.org/standard/35786.html
International Organization for Standardization. (2018). ISO 9241-11:2018: Ergonomics of
human-system interaction - Part 11: Usability, defnitions and concepts. Retrieved from
https://www.iso.org/standard/63500.html
International Organization for Standardization. (2019). ISO 9241-210:2019: Ergonomics of
human-system interaction - Part 210: Human-centred design for interactive systems.
Retrieved from https://www.iso.org/standard/77520.html
Kieras, D. (2012). Model-based evaluation. In J. A. Jacko (Ed.), The human-computer interaction handbook: Fundamentals, evolving technologies and emerging applications
(3rd ed.). Boca Raton, FL: CRC Press.
Kirakowski, J., & Corbett, M. (1993). SUMI: The software usability measurement inventory.
British Journal of Educational Technology,24(3), 210–212. doi:10.1111/j.1467-8535.1993.
tb00076.x
Laugwitz, B., Held, T., & Schrepp, M. (2008). Construction and evaluation of a user experience questionnaire. In A. Holzinger (Ed.), HCI and usability for education and work
(vol. 5298, pp. 63–76). Berlin, Heidelberg: Springer Berlin Heidelberg.
Laugwitz, B., Schrepp, M., & Held, T. (2006). Konstruktion eines Fragebogens zur Messung der
User Experience von Softwareprodukten. In H. M. Heinecke & H. Paul (Eds.), Mensch
und computer 2006. München: OLDENBOURG WISSENSCHAFTSVERLAG.
Lewis, J. R. (1994). Sample sizes for usability studies: Additional considerations. Human
Factors: The Journal of the Human Factors and Ergonomics Society, 36(2), 368–378.
doi:10.1177/001872089403600215
Lewis, J. R. (1995). IBM computer usability satisfaction questionnaires: Psychometric evaluation and instructions for use. International Journal of Human-Computer Interaction,
7(1), 57–78. doi:10.1080/10447319509526110
Lewis, J. R. (2002). Psychometric evaluation of the PSSUQ using data from fve years of
usability studies. International Journal of Human-Computer Interaction, 14(3–4),
463–488. doi:10.1080/10447318.2002.9669130
Lewis, J. R. (2012). Usability testing. In G. Salvendy (Ed.), Handbook of human factors and
ergonomics (4th ed., pp. 1267–1305). Hoboken, NJ: Wiley.
Lewis, J. R., Utesch, B. S., & Maher, D. E. (2013). UMUX-LITE: when there's no time for
the SUS. In: Proceedings of the SIGCHI Conference on Human Factors in Computing
Systems, Paris, France. https://doi.org/10.1145/2470654.2481287.
Likert, R. (1932). A technique for the measurement of attitudes. Archives of Psychology,
22(140), 55–55.
Lin, H. X., Choong, Y.-Y., & Salvendy, G. (1997). A proposed index of usability: A method
for comparing the relative usability of different software systems. Behaviour &
Information Technology, 16(4–5), 267–278. doi:10.1080/014492997119833
Lund, A. M. (2001). Measuring usability with the USE questionnaire. Usability Interface,
8(2), 3–6. Retrieved from https://www.researchgate.net/profle/Arnold_Lund/publication/230786746_Measuring_Usability_with_the_USE_Questionnaire/links/56e5a90
e08ae98445c21561c/Measuring-Usability-with-the-USE-Questionnaire.pdf
Minge, M., & Riedel, L. (2013). meCUE-Ein modularer fragebogen zur erfassung des nutzungserlebens. In: S. Boll, S. Maaß & R. Malaka (Hrsg.), Mensch und Computer 2013:
Inter-aktive Vielfalt (S. 89–98). München: Oldenbourg Verlag.
Remote Usability Testing
71
Nielsen, J. (1994). Usability laboratories. Behaviour & Information Technology, 13(1–2), 3–8.
doi:10.1080/01449299408914577
Nielsen, J., & Landauer, T. K. (1993). A mathematical model of the fnding of usability
problems. In: Proceedings of the INTERACT '93 and CHI '93 Conference on Human
Factors in Computing Systems, Amsterdam, The Netherlands. https://doi.org/10.1145
/169059.169166.
Osgood, C. E., Suci, G. J., & Tannenbaum, P. H. (1957). The measurement of meaning.
Champaign, IL: University of Illinois Press.
Rubin, J., & Chisnell, D. (2008). Handbook of usability testing: How to plan, design and
conduct effective tests. New York, NY: John Wiley & Sons.
Sauro, J. (2015). SUPR-Q: A comprehensive measure of the quality of the website user experience. Journal of Usability Studies 10(2), 19.
Sauro, J., & Lewis, J. R. (2016). Quantifying the user experience: Practical statistics for user
research (2nd ed.). Cambridge: Morgan Kaufmann.
Scholtz, J., Laskowski, S., & Downey, L. (1998, June 5). Developing usability tools and techniques for designing and testing Web sites. In : Paper presented at the 4th Conference
on Human Factors & the Web, Basking Ridge, NJ.
Smith, P. A. (1996). Towards a practical measure of hypertext usability. Interacting with
Computers, 8(4), 365–381. doi:10.1016/S0953-5438(97)83779-4
Spool, J., & Schroeder, W. (2001, 31 March–5 April). Testing Web sites: Five users is nowhere
near enough. In: CHI '01 Extended Abstracts on Human Factors in Computing Systems,
Seattle, Washington, New York..
Thompson, K. E., Rozanski, E. P., & Haake, A. R. (2004). Here, there, anywhere: Remote
usability testing that works. In: Proceedings of the 5th Conference on Information
Technology Education, Salt Lake City, UT, USA. https://doi.org/10.1145/1029533
.1029567.
Tullis, T., & Albert, B. (2013). Measuring the user experience: Collecting, analyzing, and
presenting usability metrics. Amsterdam: Elsevier/Morgan Kaufmann.
Tullis, T., Fleischman, S., McNulty, M., Cianchette, C., & Bergel, M. (2002). An empirical
comparison of lab and remote usability testing of Web sites. In: Paper presented at the
Usability Professionnal Association Conference, https://www.researchgate.net/publication/228540469_An_empirical_comparison_of_lab_and_remote_usability_testing
_of_Web_sites.
Virzi, R. A. (1990). Streamlining the design process: Running fewer subjects.
Proceedings of the Human Factors Society Annual Meeting, 34(4), 291–294.
doi:10.1177/154193129003400411
Virzi, R. A. (1992). Refning the test phase of usability evaluation: How many subjects is
enough? Human Factors: The Journal of the Human Factors and Ergonomics Society,
34(4), 457–468. doi:10.1177/001872089203400407
Wang, J., & Senecal, S. (2007). Measuring perceived website usability. Journal of Internet
Commerce, 6(4), 97–112. doi:10.1080/15332860802086318
Winckler, M. A. A., Freitas, C. M. D. S., & Valdeni de Lima, J. (2000). Usability remote evaluation for WWW. In: CHI '00 Extended Abstracts on Human Factors in Computing
Systems, The Hague, The Netherlands. https://doi.org/10.1145/633292.633367.
Yang, T., Linder, J., & Bolchini, D. (2012). DEEP: Design-oriented evaluation of perceived
usability. International Journal of Human-Computer Interaction, 28(5), 308–346. doi
:10.1080/10447318.2011.586320
5
Helping Them to See It:
Using Full Size MockUps to Achieve Usability
David Hitchcock, Miskeen Rahman
and Benjamin Holmes
CONTENTS
5.1
5.2
Introduction .................................................................................................... 73
A Psychophysical “Old School” Approach..................................................... 74
5.2.1 The Mock-Up Brief............................................................................. 74
5.2.2 Supervisor Workstations..................................................................... 75
5.2.3 Operator Workstations........................................................................ 76
5.2.4 Manager Workstations ........................................................................ 76
5.2.5 Large Curved Display......................................................................... 76
5.2.6 Mock-Up Production........................................................................... 77
5.2.7 Mock-Up Erection............................................................................... 79
5.2.8 During the Trials ................................................................................ 79
5.2.9 Waste Management............................................................................. 79
5.3 The Trials Approach .......................................................................................80
5.3.1 A Sample of Headline Findings..........................................................80
5.4 How Did the Approach Help Them to See It? ................................................80
References................................................................................................................ 82
5.1 INTRODUCTION
Ergonomists have for decades repeatedly used mock-ups and task simulations in
order to test design concepts. In the early stages of the complex design and buildup of
a brand new metro (railway) in Riyadh, Kingdom of Saudi Arabia, Siemens elected
to do just this to validate the design concept for the Operational Control Centre
(OCC) or Central Control Room (CCR).
As might be expected with major multi-consortia projects of this nature, there is
a mixture of agendas, experience and topics competence involved in the decisionmaking process. Anecdotal evidence suggests that in such circumstances, inappropriate designs can be accepted on the basis of impressive design drawings and
renders, sometimes compromised by eleventh-hour “HIPPO” (highest paid person’s
opinion) decisions!
DOI: 10.1201/9780429343490-6
73
74
Handbook of Usability and User Experience
In an operational and safety-critical setting such as an OCC/CCR, the design must be
validated on a more robust basis. So, to produce the necessary evidence and serve as a
demonstrator for the unfamiliar—to help them to see it—a classical method was adopted
for concept approval which sought to evaluate the design through the use of intentionally
rudimentary mock-ups of the concept workstation and the control room layout.
The metro being designed was an automatic one with Grade of Automation Four
(GoA4), which meant in normal operation the operators simply have to observe (or
supervise) the screens and monitors. In order to satisfy project requirements, the aim
of the exercise was to demonstrate to the client (The Riyadh Metro Authority) and
their consultants that the OCC/CCR design satisfed the requirements of ISO 110644: 2013—Ergonomic design of control centers.
This approach of using a full-size mock-up allowed the project team to evaluate and validate the intended design to minimize, and where possible to eliminate,
potential human errors during the operation of the metro.
The trials were witnessed by the client’s consultant and their human factors
expert to assess and comment on the human–machine interface (HMI) as well as
the visibility of the visual display panel. A video was made to explain the methodology applied to a wider audience of engineers, operational experts and architects—it
is often a challenge to convince people with different visions of a CC/OCC; the
engineers wants it to be functional, the operation experts want ease of operation
and the architect requires the internal walls, ceiling and the operator’s desks to be
aesthetically designed. The approach adopted was one by which each of these could
be somewhat immersed in the requirements and solutions of the design proposed.
5.2 A PSYCHOPHYSICAL “OLD SCHOOL” APPROACH
The use of crude—foam board—mock-ups gives participants clear indication that
the design is unfnished and, therefore, presents the opportunity for changes, even
minor ones to be considered. The use of basic seating also added to the appreciation
of the “unfnished” nature of the design, reducing assessment distraction which may
arise through unintentional assessment of the chair quality. Similarly, the provision
of personal storage and the like (albeit important) was avoided in the mock-up.
The beneft of creating a full-size representation of the OCC enables a “see and feel”
experience for the participants which cannot be simulated by on-screen visuals. As a
result, participants gain an appreciation of size and space which presents the opportunity
to evaluate both the ft (e.g., reach, clearance) and acceptability of the designs.
This typically enables those involved in the evaluation to rate and comment on
the designs in an interactive and critical manner to identify any necessary changes
and validate the concept(s).
5.2.1
THE MOCK-UP BRIEF
To obtain real albeit raw data, a brief was agreed to manufacture, deliver and assemble crude, full-scale mock-ups (made from 3–10 mm foamcore board) of the proposed room workstation designs, including their desktop items (Figure 5.1).
Helping Them to See It
75
FIGURE 5.1 Proposed room design intent.
5.2.2
SUPERVISOR WORKSTATIONS
Two Supervisor Workstations (3000 mm wide × 1500 mm deep × 740 mm high)
with accompanying equipment (see Figures 5.2 and 5.3) were required. One workstation needed to be raised off the ground to mimic the rise in foor level toward
the back of the OCC and it was to have six freestanding monitors on its desktop.
Although not part of the proposed room layout, the other workstation was to sit to
FIGURE 5.2 Proposed Supervisor Workstation brief plan.
76
Handbook of Usability and User Experience
FIGURE 5.3 Proposed Supervisor Workstation design intent.
one side in the trials room for additional data collection considering the application
of seven monitors on its desktop. In both cases, the desktop items were regular-size
keyboard (×2), regular-size mouse (×2), 10″ CCTV monitor (×2), “TETRA” monitor
(×1), radio communicator (×2) and regular-size telephone set (×2). All of the items
were freestanding so that they could be moved around during the trials. Both workstation tops were completely covered in graph paper in order to record the positions
of the desktop items as they were positioned according to the preferences of each
trial participant.
5.2.3 OPERATOR WORKSTATIONS
Five Operator Workstations (3000 mm wide × 1500 mm deep × 740 mm high)
were required. These workstations were only required to hold seven freestanding
monitors.
5.2.4
MANAGER WORKSTATIONS
Two Operator Workstations (1600 mm wide × 800 mm deep × 740 mm high) were
required. These workstations were required to hold two freestanding monitors, one
keyboard, one mouse and one inkjet printer.
5.2.5
LARGE CURVED DISPLAY
The large curved display (see Figure 5.4) was to consist of multiple panels, 2 panels
high × 8 panels wide. Each panel was 750 mm high × 1000 mm wide. The panels needed to be mounted so that the overall height of the curved screen could be
adjusted easily and quickly during the trials. The adjustment of the top of the screen
was between 2 and 4 m.
Helping Them to See It
77
FIGURE 5.4 Large Curved Screen design intent. [Alt text: Rear three-dimensional digitally
produced render showing a close-up of the large curved display at the front of the room. This
has a thick yellow line round it to highlight the subject.]
5.2.6
MOCK-UP PRODUCTION
It was clear from the outset that some of the manufacturing and material logistics
would be challenging. The facilities available to manufacture the items were small,
with limited access in and out of the property. This meant that comprehensive planning, along with detailed design for manufacture, was essential in order to deliver to
the trial site, damage free and with minimal setup times.
The mock-ups were predominantly manufactured using foam board, a material with suitable properties; white, rigid, strong, lightweight, manufactured in
large sheets 2440 mm × 1220 mm and of varying thickness (3, 5 and 10 mm);
properties that allow the optimization of separate parts and delivery in fat-pack
form.
The frst obstacle to overcome was that the sheet material was smaller than the
overall size of the workstation tops—3000 mm × 1500 mm (Figure 5.5). A digital
3D model was required to split the workstations into smaller parts. Individual part
drawings were produced in order to speed up the production process and increase
accuracy.
Once a solid design was produced, an optimization of all elements was created.
This allowed us to calculate the amount of foam board required and to minimize
waste. The material and all other elements were ordered and delivered so that production could begin, including foam board, graph paper and printed graphics.
Printed graphics were bonded to desktop items, allowing participants to identify
each item in the trial—monitor screens, labeled imagery for desktop items and the
large curved display digital screen. The graphics helped fnalize the required size for
all the freestanding desktop items for the Supervisor Workstations. All items were
78
Handbook of Usability and User Experience
FIGURE 5.5 Workstation 3D model, bill of materials and optimization of workstation piece
parts.
created in a two-dimensional state, enabling them to be moved around the desks
during the trial.
Once production of the workstations began, the signifcant overall size of the
worktops became apparent! The workstation part shown in Figure 5.6 was a full
sheet of foam board and, therefore, too large to maneuver to the production room in
order to cut in the curved recess. The decision was made that this part be split down
the middle and to use pre-cut, small, rectangular bracing pieces to bond the workstation desktop parts together from the underside.
The large curved display consisted of the foam board panels which were bonded
to metal poles that could be extended and retracted to suit the heights required.
All items were numbered and labeled to assist on-site assembly.
FIGURE 5.6 Desktop main body drawing.
Helping Them to See It
79
FIGURE 5.7 Workstation 3D model, bill of materials and optimization of workstation piece
parts.
5.2.7
MOCK-UP ERECTION
Once production was complete, all parts were transported to a site where they were
laid out, face down, in position. The bracing pieces were then used to bond these
together using a hot glue gun which allowed for quick application and drying time.
The legs were assembled using half-lap, fnger joints designed to allow quick on-site
assembly. The workstations were assembled quickly and hassle-free. The fnal, full
mock-up is shown in Figure 5.7.
5.2.8
DURING THE TRIALS
The nature of the trials required a mock-up which allowed participants to freely maneuver workstation items into places to suit their specifc needs and anthropometry. At each
workstation, participants were encouraged to behave as if it was their place of work.
Varying human behavior, along with the fimsy nature of foam board, meant that
the workstations required regular attention and adjustment during the trials. For
example, a participant may have leaned on the desktop where joints were weak, and
this required fxing with a glue gun or roll of tape or even the production of new parts.
It was apparent on day 1 of the trials that the monitor screens were not robust
enough to withstand constant moving by the participants; this led to the production
and application of supporting fanges.
5.2.9
WASTE MANAGEMENT
Once the trials were successfully completed, all materials and tools needed to be
removed from the trial site. Unfortunately, the high volume of foam board was
80
Handbook of Usability and User Experience
underestimated, along with the disposal challenge it presented! Ultimately, a local
church and children’s craft charity took the majority of the foam board, enabling
around 65% of it to be used rather than discarded.
5.3
THE TRIALS APPROACH
These trials adopted two prime methods of investigation:
• “Fitting Trials” of the Supervisor Workstation were conducted to establish commonality of layout. In practice, this type of psychophysical experiment means identifying the acceptable limits and optimum positions of
items within a piece of equipment to satisfy the needs of the target user population. In this case, having assumed a neutral sitting posture, each participant was asked to sit at a mock-up of the 6-Screen Supervisor Workstation
shown in Figure 5.2 to arrange 21 items of desktop equipment in their “closest acceptable,” “preferred” and “furthest acceptable” positions.
• “Use and Comfort” Trials were conducted to assess the ability to view the
large front panel display, the visual and communication links between the
different workstations and the comfort of operation. Two room layouts were
rated by the participants; “2-3-1” (two desks on the front row, three on the
second row and the Supervisors Workstation at the rear) and “3-2-1.”
5.3.1
A SAMPLE OF HEADLINE FINDINGS
Participants were drawn from 24 people who, in the absence of anthropometry data
for Riyadh, represented an extensive stature range for UK males (aged 18–64) of less
than 1 percentile to over 99 percentile (Open Ergonomics, 2008).
Trials which integrate the physical issues such as reach, clearance and visibility
with psychological factors such as communication, social interaction and perception
of comfort can yield a wide range of detailed feedback to be considered in subsequent iterations of a design—and these trials were no exception.
The following two key fndings are presented to illustrate the type of feedback
gathered. First, Figure 5.8 shows the fnal plots for acceptable monitor and keyboard
positions which revealed that the proposed workstation size of 3000 mm × 1500 mm
would be suffcient.
Alongside tests of viewing accuracy, using a points-based rating to help assess participant’s perception of comfort of viewing the large curved display (Visual Display
Panel [VDP]) of CCTV and other information helped identify the most appropriate
positions for those who needed most visual interaction with it. The results are summarized in Table 5.1.
5.4
HOW DID THE APPROACH HELP THEM TO SEE IT?
The one-to-one mock-up approach was used to validate the design of the Central
Control Room and allow the designer as well as the client and their consultant as the
Helping Them to See It
81
FIGURE 5.8 Plots showing acceptable monitor and keyboard positions.
approver, the thinking behind the layout and dimensions of the CCR and workstations. The layout and the dimensions of the VDP in relation to the operators’ workstations were also assessed.
This approach helped not only to identify the interfaces with the other disciplines
and the impact of human factors on the design, and the layout of the workstations
and VDP in the CCR, but also to create a comfortable environment for the staff to
operate a safe and reliable service.
It enabled the realization that the layout confguration of 3-2-1 of workstations
had restrictive viewing of the VDP from the two side workstations on the front row
and to change the workstations to a 2-3-1 confguration and angling the frst two rows
of the workstations inward to the center of the slightly curve shape VDP to achieve
better viewing.
Adjusting the mock-up also demonstrated viewing improvements in both comfort
and visibility.
In addition, moving workstations around to accommodate clearance requirements
(minimum 1200 mm) for an individual with crutches or wheelchair also served to
demonstrate the need for an overall increase in the size of the CCR. The physical
nature of the demonstration was particularly useful in validating the need because
an increase in the size of the CCR from 12 m × 12 m (144 m2) to 12 m × 15 m (180
m2) due to the rearranged workstations necessitated an unexpected change in the
building plans.
The project requirements identifed that an individual user be provided with a
working space of 15 m2 but due to the improvement of the visibility of the VDP from
the front row, this individual working space has been enhanced to more than 25 m2
within the core operational foor. This enhancement created a better individual working space for the operator but adversely affected the verbal communication between
the front row operators and supervisor slightly. Also, the increased distance between
the VDP and middle row workstations plus the supervisor’s workstation reduced the
visibility and readability of the displayed information such as the train number, track
section number and traction zones numbers on the VDP. To validate this new layout
with the increased length of the CCR, the trials were repeated.
82
Handbook of Usability and User Experience
TABLE 5.1
Summary of Comfort Ratings for Viewing the VDP
“Lower” panel height
Best
1st (19 points)
Middle row
(Workstation 5)
2nd (18
points)
= 3rd
(16 points)
Middle row
(Workstation 4)
Front row
(Workstation 2)
Back row
(Workstation 6)
Middle row
(Workstation 3)
4th (15 points)
Worst
5th (13 points)
Front row
(Workstation 1)
“Higher” panel height
1st (24 points)
= 2nd (21
points)
3rd (18 points)
4th (16 points)
Front row
(Workstation 2)
Front row
(workstation 3)
Middle row
(workstation 4)
Middle row
(workstation 5)
Front row
(workstation 1)
Back row
(workstation 6)
For the rerun of the trail, the VDP size was increased from two rows to three
rows and the font size for the displayed information on the VDP was also increased.
The redesigned VDP still had the top row for the CCTV streaming and the middle
row displayed the track schematic (Line Diagram) and train movement information
while the bottom row was utilized for traction power zones and associated switching
arrangement.
A knock-on impact of these changes was refected in the height of the bottom
of the VDP, so it became necessary to test and validate the maximum height of the
workstations with all six display screens at maximum height to maintain visibility of
the bottom row of the VDP from the middle row workstations.
The rerun of the mock-up confrmed the improvement in readability of the altered
VDP and specifed workstation height and reaffrmed the validity of the original trial
for the rest of the CCR.
These, and other examples illustrate how the mock-up approach highlighted issues
that may have been missed otherwise and prompted timely and achievable resolutions in the early design stage of the CCR. Ultimately, with confdence, a Building
Information Management (BIM) model was created for presentation to the client.
REFERENCES
ISO 11064-4:2013. Ergonomic design of control centres.
Open Ergonomics. (2008). People size professional.
6
Qualitative Techniques
and Design
Using Sequential and
Thematic Analysis
to Investigate Focus
Group in the Problem’s
Exploration Phase
Camille N. Santiago Caminha, Fábio da Costa
Campos and Walter Franklin Correia
CONTENTS
6.1
6.2
6.3
6.4
6.5
Introduction ....................................................................................................84
The Problem’s Exploration Step, Focus Group and Design ........................... 85
The Research Context and Focus Group Application .................................... 86
6.3.1 Research Scenario .............................................................................. 87
6.3.2 Participants Approach ........................................................................ 87
6.3.3 Focus Group Workshops..................................................................... 87
6.3.3.1 First Moment........................................................................ 88
6.3.3.2 The Second and the Third Moment ..................................... 88
6.3.4 Data Documentation and Analysis ..................................................... 88
6.3.4.1 Transcription ........................................................................ 88
6.3.4.2 Description Narratives ......................................................... 89
6.3.4.3 Data Codifcation ................................................................. 89
6.3.4.4 Sequential and Thematic Analysis....................................... 89
Pre-Application, Application and Post-Application ....................................... 91
6.4.1 Pre-Application................................................................................... 91
6.4.2 Application..........................................................................................92
6.4.3 Post-Application..................................................................................92
Reports, Interaction and In-Depth Data in the Focus Group Sequences ....... 93
6.5.1 Reports and Interaction Moments ...................................................... 93
6.5.2 Linear and Interspersed Sequencing ..................................................94
6.5.3 Focus Group Sequences and In-Depth Data.......................................94
DOI: 10.1201/9780429343490-7
83
84
Handbook of Usability and User Experience
6.6
Interaction and Collective Sensemaking ........................................................ 95
6.6.1 How the Interaction Began .................................................................96
6.6.2 What Participants Interacted .............................................................. 98
6.6.3 The Collective Sensemaking ..............................................................99
6.7 Discussion and Best Practices When Using Focus Groups ............................99
6.7.1 Discussing the Findings.................................................................... 100
6.7.1.1 “Pre-Application,” “Application” and
“Post-Application” ............................................................. 100
6.7.2 Best Practices When Using Focus Groups ....................................... 101
6.7.2.1 Guidelines for an Exploratory Focus Group PreApplication......................................................................... 101
6.7.2.2 Guidelines for an Exploratory Focus Group
Application......................................................................... 102
6.8 Final Remarks............................................................................................... 103
Notes ...................................................................................................................... 103
References.............................................................................................................. 104
6.1 INTRODUCTION
We live in a world where technologies are embedded into, centered on and connected
with people’s everyday lives and related to their problems, contingencies, needs and
specifc or sometimes unknown wishes. Therefore, there is a need in Design to comprehend how research methods work, which one can be applied and the quality of
data one can expect when the goal is to get a deep and detailed understanding about
these interactions and behaviors.
Some authors argue about the use of quantitative and qualitative methods in the
Design Process (Banu Hatice Gurcum 2016; Shavelson et al. 2003; Wright et al.
2009). While quantitative methods can be employed when the main goal is to generalize or validate some piece of data, qualitative methods are used to investigate, detail
or understand an experience, behavior or interaction; to discover the quality of data
that are part of the studied research scenario; to understand complex phenomena,
problems, people’s motivation; and to gather insights (Castro et al. 2010; Klotins
2017; Krohwinkel 2015; Pardo, Ellis, and Calvo 2015).
In the problem’s exploration step, a phase in the Design Process in which one
should analyze the problem, situation or research scenario, several qualitative techniques (such as Observations, Individual Interviews, Surveys, Focus Groups and
Cultural Probes) are used to dive into data, understand behaviors and gather insights
into the following Design Process steps (Michael Agar and MacDonald 1995;
Williams et al. 2006).
However, even the Design literature reveals the use of qualitative techniques,
when the Designer decides to choose one to apply, there are few publications, recommendations or guidelines from structured research that describe what could be
the best practices, the quality of data that arises and the condition in which each
technique could be employed.
Qualitative Techniques and Design
85
Thus, comprehending the importance to research how those methods and techniques are employed in practice in the Design Process, this chapter seeks to investigate the technique of “Focus Group” in the problem’s exploration step.
Aiming to provide structured research, this chapter presents the investigation
using both techniques: the “Sequential Analysis” and the “Thematic Analysis” to
understand the quality of data that arises from four workshops, in which Focus
Group was taught and employed, with Graduate and Postgraduate Design students,
from two institutions of higher education, in a city, in Brazil.
To go deep in this discussion, the next sections will present concepts about the
problem’s exploration step and Focus Group, including its practice in Design. Next
we will describe the research context, data documentation and analysis and main
results obtained such as “Pre-Application,” “Application” and “Post-Application”;
“reports, interaction and in-depth data” and “interaction and collective sensemaking.” We will fnally discuss those fndings to propose several suggestions on best
practices when using Focus Groups.
6.2 THE PROBLEM’S EXPLORATION STEP,
FOCUS GROUP AND DESIGN
This chapter research scope interest, to apply a qualitative technique, was the problem’s exploration step. This phase is characterized by the analysis of the user environment, including people, artifacts, behaviors and interactions. It is already applied
in several Design methodologies through different denominations such as problem
defnition (Alexander et al. 1977), problem analysis or data collection (Löbach 2001,
p.141). Although before the 70s, the phase (in Design) was connected with requirements related to product/project, currently the understanding of user problems, situations and/or behaviors is one of the main topics.
Other steps in the Design Process are ideation, or creativity, and prototyping. The
frst is characterized by using creativity methods (e.g., brainwriting 6351 and bodystorming2) and as an idea’s generation step. The second can be described as the use of
evaluation methods (e.g., usability testing3). These steps nowadays are increasingly
manageable and cyclical.
Back to this chapter’s research scope, the problem’s exploration step, the interest
to investigate Focus Group arose from the argument that this traditional technique is
widely used in both Design market and research. Focus Group is mentioned in existing Design literature as a qualitative technique to collect data (Agar 2014; BARNES;
et al. 1996; Castro et al. 2010; Lord, Susan M., Michelle M. Camacho, Catherine E.
Brawner, Catherine Mobley 2017; Mckenna et al. 2013), and it is shown as one of the
most used techniques in Design, according to the site “MeasuringU” (Jeff Sauro 2019).
Research also indicates this technique was applied by sociologists and psychologists for more than half a century (Merton and Kendall 1946; Merton, Fiske and
Kendall, 1956 apud Wilkinson 1998). Moreover, at the end of the 1970s decade,
Focus Group was used in marketing research (WILKINSON, 1998), and in the
1980s it became an emergent practice in Design (STAPPERS et al., 2009).
86
Handbook of Usability and User Experience
Focus Group can be described as a group interview or a collective chat, refecting
on the variation about how the group is moderated (Ryan et al. 2014). When applying
the technique, it is suggested to engage six to eight participants (Wilkinson 1998) for
1–2 hours to discuss about the topics. The practice also might have one moderator
who conducts the research using audio or video recordings (Wilkinson 1998), when
permitted by participants.
Ryan et al. (2014) reported two kinds of Focus Group: an Individualist Social
Psychology perspective, characterized by objectives and more structured questions,
and a Social Constructionist Perspective, an exploratory approach and dynamic
social process in which opinions are shared or tacit knowledge is generated through
social participation (Gergen 1985; Kamberelis and Dimitriadis 2011; Wilkinson
1998). As the purpose is to apply Focus Group in Design to understand interactions and behaviors in everyday activities, we choose to use the Social Constructivist
Perspective, which will be detailed in the next section.
6.3
THE RESEARCH CONTEXT AND FOCUS GROUP APPLICATION
This section describes a research study that investigated the technique of “Focus
Group” in the problem’s exploration step. The investigation was applied through an
exploratory qualitative methodology (Lakatos and Marconi 2003/1985), in which
pilot studies generated a protocol (Figure 6.1) used to structure the practices. This
protocol divided the practices into three moments:
• First, “questions and simulation”—when participants should expose their
questions and the researcher should simulate the technique.
• Second, “technique application”—which would be the technique application itself.
FIGURE 6.1
The protocol applied in this work. Source: Created by the author.
Qualitative Techniques and Design
87
• Third, “perception after the application”—participants should expose their
perception about the technique and understandings related to the moderator’s role.
We discuss these moments in detail in the following sections and also describe the
research scenario, participants’ approach and application. Then, both data documentation and analysis will be discussed.
6.3.1
RESEARCH SCENARIO
The workshops applied in this research took place in two different institutions of
higher education: UFPE—Universidade Federal de Pernambuco and CESAR
School. Both were located in Recife, a city in the state of Pernambuco, in Brazil.
In Recife is located “Porto Digital,” one of the main technology parks and innovation environments in Brazil, whose main areas are Information and Communication
Software and Creative Economy. Besides, Design is one of the main segments
emphasized (“Porto Digital” 2019).
Back to the institutions in which this work took place, both had a different building structure. While CESAR School provided a climatized room, with round tables,
and participants who previously worked together; in UFPE, participants didn’t work
together, so some improvizations were needed. For example, the workshop presentation was conducted on a 14″ computer screen, because the room’s structure was not
the one planned and there was no multimedia projector.
6.3.2
PARTICIPANTS APPROACH
The research was applied with Design students pursuing graduation (41 participants) and postgraduate students at both institutions UFPE (6 participants from
master’s and Ph.D. course) and CESAR School (18 participants from master’s
course).
Participants were selected in different ways for CESAR School and UFPE: in
CESAR School, workshops were applied with graduation and postgraduation classes,
and in UFPE students were recruited through a form sent by email, to which nine
participants answered and six participated in the workshops.
Both participants pursuing graduation and postgraduation participants already
had, even minimal, previous experience with interviews and observation techniques.
The majority of graduation students in the beginning of the course, however, didn’t
have previous experience with those techniques.
6.3.3 FOCUS GROUP WORKSHOPS
The workshops were conducted in 1.5 hours with graduation and postgraduation
students.
For privacy issues, at the beginning of the workshops, the researcher explained
and gave to each participant a Research Agreement Term, in the Portuguese language
88
Handbook of Usability and User Experience
called “TCLE,” in which participants could understand the research information,
risks and benefts. The researchers also emphasized that they could ask anything
about the “TCLE,” and further requested them to record audio and take pictures in
order to help with the documentation related to the data researched. It was also reinforced by the researcher that all the data would be collected exclusively for research
and publications about the technique application, and that participants could turn the
audio record off at any time they want.
6.3.3.1 First Moment
As planned in the protocol (Figure 6.1), in the frst moment of the workshop, the
researcher gave an introduction about Design and qualitative methods and techniques to further present and detail the Focus Group. In order to provide a more
structured approach, in each technique presentation workshop, the researcher used
a video to display the main concepts and explain how participants should conduct
the Focus Group. After the video, there was a moment in which participants exposed
their questions and the researcher invited some participants to simulate the technique application.
After the simulation, three themes (“journey to the university,” “breaks between
classes” and “lunchtime”) were exposed to participants, so they could choose which
one to apply in the Focus Group. Even though they chose to apply the theme journey
to the university in all workshops.
Participants also divided themselves into groups of four to seven persons. In
CESAR School, the groups were formed by affnity relationship, and in UFPE as
there were only six people, they assembled themselves in one group. As predicted
in the protocol, each group also chose one person to moderate the Focus Group
practice.
6.3.3.2 The Second and the Third Moment
In the second moment, participants applied the technique. This application lasted for
15–30 minutes, depending on the group. Then when all practices had fnished, in the
third moment, the researcher grouped all participants and discussed about the Focus
Group technique to gather their feedback.
6.3.4 DATA DOCUMENTATION AND ANALYSIS
After the workshops, the data was stored in the researcher’s computer, documented,
transcribed, using Google Docs®, and coded through the software MaxQDA®, to
further be analyzed and interpreted. All research materials collected were in the
Brazilian Portuguese language. The next sections will describe transcription,
description and analysis of the data.
6.3.4.1 Transcription
Understanding that interview transcriptions can provide a better database to further
analysis (MERIAM, 2009), three moments in the workshops were transcribed. This
Qualitative Techniques and Design
89
choice that occurred when the results emerged in the pilot studies showed: valuable
understandings about the participants’ previous experience with Focus Group; their
perception related to the practices; and the visualization of details in each technique
application, for example, the moderator’s behavior.
6.3.4.2 Description Narratives
In this research, in order to give validity and confdence, also following some requirements described by Meriam (2009) when analyzing qualitative data, description narratives were chosen to document the data collected.
Two important points that contributed to this choice were privacy issues and
research observations that need to be considered. When transcribing this research
data, we identifed moments such as situations related to participants’ identity,
everyday activities or personal perceptions, which, for privacy issues, should not
be exposed or published. Besides, we also realized that the researcher’s observation throughout the practices could be lost if only the transcriptions were taken into
account in the codifcation phase.
Thus, our description narratives included both the researcher’s observation and a
large part of the transcription by leaving out participants’ personal data.
6.3.4.3 Data Codifcation
Following up the narrative’s description, all raw data were coded. The codifcation
here was used to provide structured data and validity to the research results. Authors
defend the use of codifcation to analyze qualitative data when the goal is to structure the analysis and/or use scientifc rigor (Benson et al. 2012; Castro et al. 2010;
Karlesky and Isbister 2016; Creswell 2009, p.190). In this codifcation, we used the
MaxQDA® software to divide the practice sequences and create themes for further
analysis.
6.3.4.4 Sequential and Thematic Analysis
In order to provide a structured analysis, understanding that the technique was
applied in different contexts with constant social interaction, we used as a method the
Content Analysis, proposed by Laurence Bardin (2011/1977). As Bardin describes
that different techniques can be used according to the research approach, the ones
we decided to apply were as follows:
• Sequential Analysis, used to understand the Focus Group process
• Enunciation Analysis, applied to understand the participants’ discourse,
and how did they speak
• Thematic Analysis, employed to synthesize the main themes that emerged
in the technique practices
• Relations Analysis, chosen to relate and interpret the main themes and their
occurrences, the participants’ perception and the sequential and enunciation analysis.
90
Handbook of Usability and User Experience
In this chapter, both the Sequential Analysis and Thematic Analysis will be detailed,
once they brought relevant results for Focus Group technique. The next topics will
describe the analysis techniques concepts and how they were employed.
6.3.4.4.1 Sequential Analysis
This technique can be described as the “rhythm of the discuss” or the two steps that
reveal the dynamics of the interview (Bardin 2011/1977). This analysis visualizes some
patterns and three phases along the Focus Group: “Pre-Application,” “Application”
and “Post-Application.” Those phases will be detailed in the next section.
6.3.4.4.2 Thematic Analysis
This “analysis of the meanings” (Bardin 2011/1977) provided ways to visualize and
detail the main patterns found throughout the Sequential Analysis. These were analyzed, observing the occurrences verbally expressed (a total of 529) and synthesized
in fve themes, which raised few questions.
Below are the themes and the questions that they tried to answer:
• The theme “planning before the technique application” can be described
as a moment in which people organize themselves to the Focus Group practice. The main questions used to analyze this theme was: “how participants
planned the Focus Group practices?”; “what is the relation of the occurrences in each workshop?”
• The theme “creation of an empathy scenario between participants” aimed
to understand the relationship between moderators and participants, and
arose from the following questions: “how participants interact before, along
and after the practice?” “how this relationship made possible to create a
smooth scenario?”; “which characteristics can infuence in a non-natural
dialog between them?”; “what is the relationship between the occurrences
of those facts in each workshop?”
• The theme “kind of questions that participants employed” aimed to understand the main questions that participants used. The questions used to analyze this theme were: “what kind of questions participants used?”; “how did
they use?”; “what intention could be inferred from the questions?”; “which
question was employed in the beginning of the practice?”; how they ask
about feeling questions?”; “what kind of question inferred some bias on the
answer?”; “what is the relation of the occurrences in each workshop?”
• The theme “kind of data that arose” intended to understand the data that
emerged through participants, and was described by the following questions: “what kind of data arose from the Focus Group?”; “which characteristics they expressed?”; “how everyday experience was described?”;
“how they interact with the scenario described”; “what is the relation of the
occurrences in each workshop?”
• The theme “interaction between participants” aimed to understand the
main interactions that occurred in Focus Group, besides the relationship
between this interaction and the theme scope. The main questions used to
Qualitative Techniques and Design
91
analyze this theme were: “what participants interact?”; “how did they interact?”; “in which workshop participants missed the theme scope, and how it
occurred?”; “what is the relationship between the occurrences related to the
interactions and the moments when participants missed the theme scope in
each workshop?”
With regard to the Focus Group technique, we analyzed the following themes: “planning before the technique application”; “creation of an empathy scenario between
participants”; “the kind of data that arose”; and the “interaction between participants.” The next sections will describe the main results that emerged from the
Sequential Analysis, and its triangulation with those themes.
6.4 PRE-APPLICATION, APPLICATION AND POST-APPLICATION
Throughout this Social Constructivist Perspective, the majority of participants
interacted constantly and showed interest in the technique. They discussed about
how the journey happened, what they did in this journey, the feelings that arose,
their perceptions, thoughts, besides specifc stories, and convergent or divergent
points of view.
When we analyzed the Focus Group sequences, even each practice had its own
specifcities, some convergence was found in different aspects along the workshops such as the above-mentioned phases “Pre-Application,” “Application” and
“Post-Application” (Figure 6.2). It is worth highlighting that these phases might
not be understood as three distinct steps, once they were smooth and natural. In
the next section, we will discuss these phases and describe the related moments
or themes.
6.4.1 PRE-APPLICATION
The “Pre-Application” phase was a convergent moment in which participants organized themselves for the technique application, here described as the “planning
before the technique application” theme.
At this moment they decided who would be the Focus Group moderator (in
three of four workshops), validated the theme chosen (in two workshops) and
decided the Focus Group purpose (in one workshop). We emphasize that in the
FIGURE 6.2 The “Pre-Application,” “Application” and “Post-Application” phases. Source:
Created by the author.
92
Handbook of Usability and User Experience
frst three workshops, the researcher did not approach this Focus Group purpose
issue, but, as in those workshops participants were confused about the “focus” in
the theme they discussed, the researcher decided to change the approach in the
fourth workshop. Another point emphasized by participants was the necessity to
have a defned script before the application. Those evidence can be seen in the following transcription:
Workshop 2: Participants Discussion After Practice
Moderator FG3: I can describe myself as an example. As a moderator, I could
not direct the questions, because I didn’t know … like … What I really
wanted to know with this? Then there was a problem regarding focus. … So,
I did questions like … comprehensive. I asked, for example, I want to know
how he feels. Like the bus experience. Then I started. It is like a comprehensive thing.
Workshop 1: After Practice
Moderator FG1: So … the diffculty was because I had to create the questions
without a script. Then I got confused. …
Another pattern found in this phase was the initial presentation by the moderators,
when they introduced themselves, saluted participants and explained the practice
guidelines. This moment is described as the theme “creation of an empathy scenario
between participants” and was present in the Pre-Application phase in some workshops (Figure 6.3).
6.4.2 APPLICATION
The application’s phase is described as the moment when Focus Group started. This
moment was interesting because in four workshops, the two moments—“reports”
and “interactions”—were evident (Figure 6.3). This is further detailed in the following sections.
6.4.3 POST-APPLICATION
This phase, although not visualized in each workshop, was seen after the end of
some practices (Figure 6.3). At Post-Application participants still interacted, or
added some forgotten or omitted issue, subject and/or even talked about the Focus
Group practice, as can be seen in the following sentence:
Moderator FG1: I tried to ask the same question to everybody.
P11: And we muddled you. I did it myself twice.
Moderator FG1: No, but you can do it. It isn’t something that diverted us at all.
Otherwise the moderator can bring us back to questions.
P11: My impression was …. Even I arrived late. … The moderator here acted
like a person who mediates a round table.
It is worth highlighting that some participants turned the audio recorder off when
they thought the Focus Group had fnished, so we cannot presume that it did not happen in other workshops.
Qualitative Techniques and Design
93
FIGURE 6.3 The Focus Groups main sequences and their moments and occurrences.
Source: Created by the author.
6.5 REPORTS, INTERACTION AND IN-DEPTH DATA
IN THE FOCUS GROUP SEQUENCES
Regarding the application’s phase, this section will detail both moments “Reports”
and “Interactions between participant” and analyze the sequences in Focus Group
practices. We also investigate how the data was detailed throughout those sequences.
6.5.1
REPORTS AND INTERACTION MOMENTS
Reports were characterized by the moment when the moderator invited participants to
tell their testimonial about a subject or some questions. At this moment, they explained
their journey, or gave specifc in-depth data about their particularities, experiences or the
environment. One example of participant’s reports can be seen in the following:
Workshop 4
P14: My commuting already has two options. One of them is a very tiring journey. I leave from (omitted for privacy issues) at 11/11:30 pm to arrive at the
94
Handbook of Usability and User Experience
bus station at 7 am. Then I wait until 8:30/9 am to go to the Recife Station
or get an Uber. The other option is to get a ride with a friend, as I did today
(omitted for privacy issues). When we can combine both commuting, I get
his ride. Then he brings me here and it is easier.
The “interactions between participants,” here synthesized as “Interaction,” occurred
in the middle or end of some practices when two or more participants talked about
some subject, common experiences, participant’s story, point of view or convergent
or divergent perceptions. It can be observed in the following transcription:
Workshop 2
P10: I seat on the steps.
P13: So … normally the bus is too crowded. I cannot even pass from the Baffe gate.
P10: I cannot work in the bus. Actually, I cannot work through my smartphone.
“Like,” I need my computer to do my work. …
P16: Not if I wanted … I would have a headache, “did you get it?”
P14: It is what I would say that I have.
6.5.2
LINEAR AND INTERSPERSED SEQUENCING
When we analyzed both Reports and Interactions sequences in the Focus Groups
workshops, two different kinds of processes in the practices were visualized:
• The frst is here described as “linear sequencing,” characterized by moments
in which each participant had their own testimonies and, at the end of practices, when the moderator asked the group to talk about the theme, participants interacted naturally. This sequencing was the most visualized (in 6 of
11 group practices) and is shown in Figure 6.4.
• The second, described as “interspersed sequencing,” was observed by
“reports” interspersed with punctual “interactions,” which increased
according to the following “reports.” This kind of sequence was present in
4 of the 11 practices and is shown in Figure 6.5.
6.5.3
FOCUS GROUP SEQUENCES AND IN-DEPTH DATA
Once we knew how the Focus Group sequences occurred in a Social Constructivist
Perspective, and we triangulated this result with the “kind of data that arose” theme,
we understood how the data were generated and detailed in those practices.
In the linear sequencings of Focus Group, reports showed a specifc amount of
detailed data through each participant’s testimony. Moreover, when the interaction
occurred, there was a great amount and variety of detailed data, when participants
discussed about different subjects, and experiences, as can be visualized in Figure 6.6.
In the interspersed sequencings, the majority of the initial reports that showed
a small amount of detailed data visualized how that data was in-depth and how it
increased in amount and variety through each interaction and report. It happened
Qualitative Techniques and Design
95
FIGURE 6.4 Resume of the linear sequencings. Source: Created by the author.
FIGURE 6.5
Resume of the interspersed sequencings. Source: Created by the author.
when one participant complemented an aspect or a case before spoken by other participants, as can be seen in Figure 6.7.
With this in mind, we can hypothesize that the Focus Group has the potential to
bring in-depth data that can occur in a disordered manner, with a variety of subjects
and in-depth levels.
6.6 INTERACTION AND COLLECTIVE SENSEMAKING
As the moment “interaction between participants” emerged as one of the main patterns found in the Focus Group Sequential Analysis, we decided to analyze it in
96
Handbook of Usability and User Experience
FIGURE 6.6 Showing how the data were generated and detailed on linear sequencings.
Source: Created by the author.
detail as a theme. The next section will describe “how this interaction began” and
“what participants interacted” to further detail the “Collaborative Sensemaking”
generated through this interaction by some groups.
6.6.1
HOW THE INTERACTION BEGAN
When we analyzed how the interaction began in the Focus Groups workshops, we
realized that it started naturally both by participants and when the moderator asked
them to talk about the theme or some subject. When we analyzed how this interaction started naturally, three patterns emerged:
• First, when some participants revealed some particularities about their
everyday activities or improvizations that they found interesting; this is
illustrated by the following example:
Workshop 2
P10: I seat on the steps.
P13: So … normally the bus is too crowded. I cannot even pass from the Baffe
gate.
P10: I cannot work in the bus. Actually, I cannot work through my smartphone.
“Like,” I need my computer to do my work. …
P16: Not if I wanted … I have headache, “did you get it?”
P14: It is what I would say that I have.”
• Second, when a punctual interaction (by some participant or even the moderator) occurred, i.e., when one participant told something and other participants added their point of view. This example can be visualized in the
following transcription:
Workshop 3
P5: How long is your journey by metro? Do you prefer using metro rather than car?
P3: Dude, I use metro at rush hour.
Qualitative Techniques and Design
97
FIGURE 6.7 Showing how the data were generated and detailed on interspersed sequencings. Source: Created by the author.
P5: Really, you are a hero.
P3: The person who survives using metro in São Paulo, survives anywhere. It
is really hostile.
P4: Once I survived at 6 pm in. …
• Third, when a participant told a story and others complemented his/her
argument with questions, points of view or another story, as can be seen in
the following example.
Workshop 4
I would prefer to go by bike, but last week two friends suffered a bike accident.
P12: Really? Where? In South Zone?
98
Handbook of Usability and User Experience
P3: I don’t know where exactly. One was a guy from my (omitted for privacy
issues) and other was a girl who was (omitted for privacy issues) and suffered
an accident.
P12: I lost a friend on a bike accident. He was hit by (omitted for privacy issues).
P9: I know who was.
6.6.2
WHAT PARTICIPANTS INTERACTED
In order to detail what participants interacted, we analyzed the theme “data that
arose” and related it with the participants interaction theme. We found some evidence (97 occurrences) about the kind of information on which people interacted.
The data showed that participants expressed emotions, interpreted and/or judged
others’ reports, asked questions and shared personal experiences, as can be seen in
Graph 6.1.
It is worth highlighting that those data can be related to the context in which
workshops were applied, where the majority of participants had previous empathy
between themselves. Thus, we recommend that future research must analyze those
practices in different contexts to validate, improve or refute this hypothesis.
Another interesting result was the variety of subjects discussed throughout the
interactions. After the practices, participants emphasized both the importance of
visualizing different characteristics (e.g., when they shared their personal data) and
the variety of subjects that emerged in the interaction along the Focus Groups. This
evidence can be visualized in the following transcription:
Workshop 1
Focus Group is freer …. And the practice also generates more themes to be
discussed.
GRAPH 6.1
Participants interactions. Source: Created by the author.
Qualitative Techniques and Design
99
Workshop 3
The Focus Group provides us a bigger picture. We saw different ways to go to
college. On foot, by car, by Uber, and by metro. … Focus Group actually let
you change experiences and to listen to other people’s experiences.
6.6.3
THE COLLECTIVE SENSEMAKING
The results of the above-mentioned “kind of information that participants interacted” and the “variety of subjects” that some of them mentioned in the “What participants interact” topic arose a hypothesis related to the “Collective Sensemaking”
concept in Focus Group (Wilkinson, 1998): along the interactions in the applications, the data shared between participants (emotions, questions, personal experiences and interpretations) provide this “collaborative sensemaking.” It means
Collective Sensemaking can be generated when participants share data such as
personal experiences (stories, personal perceptions, common or non-common
feelings, information about what they do, know, think, sensorial aspects, or even
improvizations), questions, emotions and interpretations, as can be visualized in
Figure 6.8. We emphasize the need for future research to involve more exploratory
applications of Focus Group technique in different contexts and scenarios to validate, improve or even refute this hypothesis.
6.7 DISCUSSION AND BEST PRACTICES
WHEN USING FOCUS GROUPS
In this section we discuss both Sequential and Thematic Analysis fndings and
hypotheses to propose suggestions on best practices, when using Focus Groups. The
following sections will detail those fndings and propose best practices.
FIGURE 6.8 Showing hypothesis about how collective sensemaking can be generated.
Source: Created by the author.
100
6.7.1
Handbook of Usability and User Experience
DISCUSSING THE FINDINGS
As was presented in the above-mentioned topics, three smooth phases, with different
moments and themes, arose from the Sequential Analysis of Focus Group practices.
6.7.1.1 “Pre-Application,” “Application” and “Post-Application”
These sequences and their themes helped us to better understand the fndings and
hypotheses presented on above-mentioned topics and also discuss the following
ones: (i) how Focus Group practices worked, (ii) some topics that appeared in the
planning before application, (iii) how participants behaved and interacted and (iv)
how the data was in depth along those moments.
6.7.1.1.1 How Focus Group Practices Worked
When we analyzed the Focus Group sequences, we understood how an exploratory Focus Group practice might work. The data showed it occurred through
the Application phase, where its “Reports” and “Interaction” moments raised the
hypothesis that Focus Group can be combined by different sequences (linear and
interspersed sequences). Those sequences include moments where participants mention their testimonials and moments where they interact between themselves, discussing about different subjects. Thus, we can conclude Focus Groups can occur
through linear or interspersed sequences of multiple “Reports” and “Interactions.”
6.7.1.1.1.1 Topics That Appeared in the Planning Before Application In terms
of the “Pre-Application” phase, we highlight the importance of both “the planning
before application” and “the creation of an empathy scenario between participants”
in order to provide control to the moderator throughout the practice fow.
Those appeared from participants’ reports mentioning that they felt confused
about not having a “focus” in the theme they discussed in the applications; the need
to have a predefned script before the practice and the moment when moderators
introduced themselves, saluted participants and explained the practice guidelines.
The hypothesis here is that this creation of empathy and planning before application helps the moderator to feel control and create a more fuid scenario for the
practices.
6.7.1.1.2 How Participants Behaved and Interacted
Related to participants’ behaviors and interaction, the data showed how the interaction began, what participants shared throughout this interaction—such as personal experiences, questions, judgment and/or emotions—and the Collaborative
Sensemaking generated in the interaction.
This result led us to visualize how an interaction process can occur along an
exploratory Focus Group practice. The hypothesis here is: in this approach, some
interactions can start by punctual interactions, personal stories or particular behaviors, continue when they share experiences, questions, emotions, judgments and/or
interpretations and culminate in a Collaborative Sensemaking.
This information can also help moderators in the practice fow control once they
know that this process might happen.
Qualitative Techniques and Design
101
6.7.1.1.3 How the Data Was In Depth
Although there were linear and interspersed sequences, when we analyzed how
the data was in depth, we found in Focus Group exploratory practices that both
sequences provided in-depth and detailed data about people’s experiences.
Thus, the above-mentioned hypothesis (in those practices, many types of data and
subjects emerged in a disordered manner) raises the assumption that the analysis of
those data can be complex and demand time, because the researcher will have to map
and interpret these different data and subjects.
6.7.2
BEST PRACTICES WHEN USING FOCUS GROUPS
The above-mentioned sections, fndings and hypotheses expose the main results that
emerged in this research and lead us to propose suggestions on best practices, here
described as guidelines, when using an exploratory Focus Group.
In the following sections, we will detail those guidelines, dividing them into PreApplication and Application sequences.
6.7.2.1 Guidelines for an Exploratory Focus Group Pre-Application
6.7.2.1.1 Consider Planning and Organize Focus
Group Before Starting the Practice
The hypothesis that mentions planning before application helps the moderator to
feel in control of the Focus Group supports its moment benefts. With this in mind,
we suggest the following recommendations to plan and organize themselves before
starting a Focus Group exploratory practice, in order to feel in control: (i) defne
who will be the moderator, (ii) defne the practice’s script and (iii) be clear about the
Focus Group’s main goal.
6.7.2.1.1.1 Defne Who Will Be the Moderator As was visualized in this
research, before starting a practice, one of the frst defnitions recommended must
be related to who will be the moderator. We recommend that this choice should be
taken according to the researcher’s previous experience with Focus Group qualitative exploratory approaches, and previous knowledge about the practice main guidelines such as expressed on the following topics related to the practice application.
6.7.2.1.1.2 Defne a Focus Group Script The necessity emphasized by participants to have a defned script before the application brings along the recommendation to the moderator to have topics that guide both questions s/he can ask and
Focus Group path. Those topics however should not be specifc questions or that
rigid to restrict practice’s fow or generate superfcial data.
6.7.2.1.1.3 Defne and Be Clear About the Practice’s Main Goal In terms of
Focus Group purpose, as was mentioned by participants in the frst three workshops,
before starting an exploratory practice, we suggest to the moderator to defne and
be clear about the Focus Group main goal. That should help him to know which
subjects to explore in participants’ interaction and be in control of the practice fow.
102
Handbook of Usability and User Experience
6.7.2.1.2 When Start the Practice, Create Empathy with Participants
Becuase the Focus Group has the purpose of gathering data about people’s everyday
lives, we recommend, when starting the practice, the moderator introduce himself/
herself, salute participants and explain the procedures. Our hypothesis is that this
creation of empathy will help the moderator to create a fuid scenario for Focus Group
practices, because participants can feel at ease to talk about their everyday activities.
6.7.2.2 Guidelines for an Exploratory Focus Group Application
6.7.2.2.1 Comprehend How the Practice Work and How Participants Interact
As the analysis of an exploratory Focus Group application can be complex, comprehend how the practice work and how participants’ interaction can help the moderator to visualize practice fow and feel in control. With this in mind, this research
fndings lead us to the following guidelines that aim to guide the moderator in this
understanding: (i) observe Focus Group sequences, (ii) observe how the data is in
depth and (iii) observe how Collective Sensemaking can be generated in the application interactions.
6.7.2.2.1.1 Observe Focus Group Sequences Our hypothesis (Focus Group can
occur through linear or interspersed sequences of multiple Reports and Interactions)
can help the moderator to comprehend how the practice works. Thus, we recommend
that the moderators observe the practice sequences to know when an interaction is
happening; decide at which moment they can intervene and invite participants to
tell another report; or just let the interaction go on naturally.
6.7.2.2.1.2 Observe How the Data Is In Depth The hypothesis, in Focus Group
practices, that many types of data and subjects emerge in a disordered manner, and
the understanding about how the data is in depth through linear and interspersed
sequences, lead us to recommend the moderator to observe how the data can be in
depth in a Focus Group application. With this in mind, a moderator can understand
what are the main subjects that arise and guide participants through those subjects.
6.7.2.2.1.3 Observe How Collective Sensemaking Can Be Generated in
Those Interactions The hypothesis—Collective Sensemaking can be generated when participants share data such as personal experiences (stories, personal
perceptions, common or non-common feelings, information about what they do,
know, think, sensorial aspects or even improvizations), questions, emotions and
interpretations—leads us to recommend the designers and moderators, when
applying Focus Groups through a Social Constructivist Perspective, to explore
and comprehend data, and when sharing data in the interactions, participants
can generate this collective sense.
6.7.2.2.2 Understand That After Practice Participants Can Still Interact
This research data showed that participants still interacted, added some forgotten or
omitted issues and/or even talked about the practice at the end of some Focus Group
Qualitative Techniques and Design
103
applications. According to this result, we recommend the moderator and researchers to be ready in case participants keep interacting, complementing or adding data
after Focus Group application.
We also emphasize in this guideline that moderators and researchers take care
and act with ethics if some participant does not want to share the data or if the data
should not be analyzed (e.g., when the recorder was turned off and a participant
decided to speak about something that should not be considered).
6.8 FINAL REMARKS
This research’s structured investigation related to “Focus Group,” in the problem
exploration phase, leads us to detailed guidelines and hypotheses applied when the
purpose is gathering data about people’s everyday activities. As an overview, detailed
data showed, besides points of Pre-Application, Application and Post-Application
phases, how practices should be planned; how it worked; how participants behaved
and interacted and how the data was in depth.
Regarding Sequential and Thematic Analysis, both provided several points to be
taken into account when planning and applying Focus Group in the above-mentioned
conditions. Analyzing the sequences helped, besides understanding how each one
occurred, visualize patterns and details such as Reports and Interactions, and linear
and interspersed sequences. Moreover, with those patterns found, we could divide
them into themes to observe their occurrences and create questions that investigated
them in detail, using a structured approach.
Thus, we can assume Sequential and Thematic Analysis as a path when the purpose is to get evidence and structured guidelines in Design Methods investigation.
This method can help future analysis of other subjective or qualitative Design techniques, methods and tools.
Future research can also validate that hypothesis using a mixed method approach
or applying other Content Analysis techniques described by Bardin such as Relation
Analysis, Enunciation analysis, Categorial Analysis and/or Evaluation Analysis.
Another suggestion is to test those Design Methods in different phases of the Design
Process.
NOTES
1. In this tool, six participants write or draw suggestions on a piece of a paper divided
into 18 spaces (6 × 3). After 5 minutes, they must switch the paper keeping the same
clockwise direction. This tool aims to discover solutions to problems inside the project
(Pazmino 2015, p.216).
2. Bodystorming is a physical and situated dynamic, experiential method of informance
that combines active role-play with simple prototypes, and in which designers can
immerse themselves in user situations (Martin and Hanington 2012, p.20).
3. Usability testing is an evaluative method that helps designers to search for confusing
or frustrating parts of an interface by observing a given task (or a set of tasks) through
individual use of an application (Martin and Hanington 2012, p. 194).
104
Handbook of Usability and User Experience
REFERENCES
Agar, M. 2014. “An Outsider’s Ethnographic Thoughts about Design.” Arts and Humanities
in Higher Education, 13(4): 404–411. doi: 10.1177/1474022214531478.
Alexander, C, P.D.A.C. Alexander, S. Ishikawa, M. Silverstein, M. Jacobson, Center for
Environmental Structure, I. Fiksdahl-King, and A. Shlomo. 1977. A Pattern Language:
Towns, Buildings, Construction. Center for Environmental Structure. Berkeley, CA:
Center for Environmental Structure Series. OUP USA. https://books.google.com.br/
books?id=hwAHmktpk5IC.
Banu, Hatice Gurcum. 2016. “Ethnography for Textile Design as a Cultural Catalyst.” Journal
of Social Science and Humanities 2(10): 42–46.
Bardin, Laurence. 2011. Análise de Conteúdo. 70th, 2011th ed. São Paulo.
Barnes, Vivienne, Deanne Lynn Clouder, Jackie Pritchard, Christina Hughes, and Warwick
Judy Purkis. 1996. “Deconstructing Dissemination: Dissemination as Qualitative
Research.” Qualitative Research 5(2): 147–165.
Benson, Lisa, Michelle Cook, Catherine McGough, and Sarah Grigg. 2012. “Work in
Progress: Audio Refections Provide Evidence of Metacognition during Students’
Problem Solving Attempts.” Proceedings - Frontiers in Education Conference, FIE,
pp. 147–165. doi: 10.1109/FIE.2012.6462475.
Castro, Felipe González, Joshua G. Kellison, Stephen J. Boyd, and Albert Kopak. 2010. “A
Methodology for Conducting Integrative Mixed Methods Research and Data Analyses.”
Journal of Mixed Methods Research 4(4): 342–360. doi: 10.1177/1558689810382916.
Creswell, John W. 2009. “Research Design - Qualitative, Quantitative, and Mixed Approaches.”
Research Design Qualitative Quantitative and Mixed Methods Approaches. doi:
10.1016/j.math.2010.09.003.
Gergen, Kenneth J. 1985. “The Social Constructionist Movement in Modern Psychology.”
American Psychologist 40(3): 266–275. doi: 10.1037/0003-066X.40.3.266.
Jeff Sauro (PhD). n.d. “MeasuringU.” Accessed May 12, 2019. https://measuringu.com/ux
-methods-2018/.
Kamberelis, George, and Greg Dimitriadis. 2011. “Focus Groups: Contingent Articulations
of Pedagogy, Politics and Inquiry.” In The Sage Handbook of Qualitative Research,
edited by Yvonna S. Lincoln, Norman K. Denzin, 545–61. SAGE Publications. doi:
10.1111/j.1469-0691.2011.03558.x/pdf.
Karlesky, Michael, and Katherine Isbister. 2016. “Understanding Fidget Widgets: Exploring
the Design Space of Embodied Self-Regulation.” In Proceedings of the Nordichi
‘16: The 9th Nordic Conference on Human-Computer Interaction - Game Changing
Design. doi: 10.1145/2971485.2971557.
Klotins, Eriks. 2017. “Using the Case Survey Method to Explore Engineering Practices in
Software Start-Ups.” Proceedings - 2017 IEEE/ACM 1st International Workshop on
Software Engineering for Startups, SoftStart 2017, 24–26. doi: 10.1109/SoftStart.2017.4.
Krohwinkel, Anna. 2015. “A Confgurational Approach to Project Delays: Evidence From a
Sequential Mixed Methods Study.” Journal of Mixed Methods Research 9(4): 335–61.
doi: 10.1177/1558689814522709.
Lakatos, Eva Maria, and Marina de Andrade Marconi. 2003. Fundamentos de Metodologia
Científca. 5a ed. São Paulo: Editora Atlas S. A. doi: 10.1590/S1517-97022003000100005.
Löbach, Bernd. 2001. Design Industrial: Bases Para a Confguração Dos Produtos
Industriais. http://books.google.com/books?id=hm0hAAAACAAJ&pgis=1.
Lord, Susan M., Michelle M. Camacho, Catherine E. Brawner, Catherine Mobley, and
Joyce Main. 2017. “Have You Ever Wondered Why? Qualitative Research Methods
to Investigate Engineering Education.” In Global Engineering Education Conference
(EDUCON), April: 1851–53. doi: 10.1109/EDUCON.2017.7943102.
Qualitative Techniques and Design
105
Martin, Bella, and Bruce Hanington. 2012. Universal Methods of Design. Beverly, MA:
Rockport Publishers. doi: 1592537561.
Mckenna, H. Patricia, Marilyn P. Arnone, Michelle L. Kaarst-Brown, Lee W. Mcknight, and
Sarah A. Chauncey. 2013. “Ambient Intelligence & Information Interactions.” In IEEE
International Symposium on Technology and Society (ISTAS).
Merton, R. K., & Kendall, P. L. (1946). The Focussed Interview. American Journal of
Sociology, 51, 541–557. https://doi.org/10.1086/219886
Michael, Agar, and James MacDonald. 1995. “Focus Groups and Ethnography.” Human
Organization 54(1): 78–86. doi: 10.17730/humo.54.1.x102372362631282.
Pardo, Abelardo, Robert a. Ellis, and Rafael a. Calvo. 2015. “Combining Observational and
Experiential Data to Inform the Redesign of Learning Activities.” Proceedings of the
Fifth International Conference on Learning Analytics And Knowledge - LAK ’15, 305–
30. doi: 10.1145/2723576.2723625.
Pazmino, Ana Veronica. 2015. Como Se Cria: 40 Métodos Para Design de Produtos. São
Paulo: Blucher.
“Porto Digital.” 2019. https://www.portodigital.org/parque/o-que-e-o-porto-digital.
Ryan, Katherine E., Tysza Gandha, Michael J. Culbertson, and Crystal Carlson. 2014.
“Focus Group Evidence: Implications for Design and Analysis.” American Journal of
Evaluation 35(3): 328–345. doi: 10.1177/1098214013508300.
Shavelson, R. J., D. C. Phillips, L. Towne, and M. J. Feuer. 2003. “On the Science of Education
Design Studies.” Educational Researcher 32(February): 25–28.
Wilkinson, S. 1998. “Focus Group Methodology: A Review.” International Journal of Social
Research Methodology 1(3): 181–203.
Williams, L. J., L. R. Ford, N. Nguyen, and S. Rogelberg. 2006. “Research Methods in
Industrial and Organizational Psychology.” International Review of Industrial and
Organizational Psychology 21: 366.
Wright, Melanie C., Noa Segall, Jonathan B. Mark, and Jeffrey M. Taekman. 2009.
“Qualitative and Task Analytic Methods to Support Comprehensible Intelligent System
Design.” ISDA 2009 - 9th International Conference on Intelligent Systems Design and
Applications, 444–49. doi: 10.1109/ISDA.2009.173.
7 New Perspectives on
User-Centred Change
Technology Development
and Implementation
Annabel Zettl, Angelika Trübswetter,
Antonia Meißner, Mathias Jenny
and Sebastian Glende
CONTENTS
7.1
7.2
7.3
7.4
7.5
7.6
Introduction .................................................................................................. 107
Digitalization: A Change Process................................................................. 108
Change Processes and the Human Factor..................................................... 109
Acceptance as a Multifaceted Phenomenon ................................................. 110
User-Centred Change.................................................................................... 110
The Four Phases of User-Centred Change ................................................... 112
7.6.1 Insight ............................................................................................... 113
7.6.2 Path Making...................................................................................... 113
7.6.3 Realization ........................................................................................ 113
7.6.4 Evaluation ......................................................................................... 114
7.7 Conclusions................................................................................................... 114
References.............................................................................................................. 115
7.1 INTRODUCTION
Digitalization changes our lives. How we shop, how we listen to music, how we
work, how we govern. Digitalization changes our lives—on the social, economic and
political level. In 2013, the study “The Future of Employment” by Frey and Osborne
from Oxford University provoked excitement. Almost one in two Americans works
in a profession that is likely to be automated within the next 20 years. These numbers led to numerous discussions and debates worldwide. Will robots and algorithms
take away our work? Will we continue to push humans further and further out of the
center of value creation?
In 2021, this debate has become much clearer. Technical potentials are one thing,
but what is or can be implemented is another. In this context, Frey and Osborne
(2013) speak of “computerisation bottlenecks” (p. 31); perception and manipulation,
DOI: 10.1201/9780429343490-8
107
108
Handbook of Usability and User Experience
creative intelligence and social intelligence, all qualities that are (still) more attributed to people and workers. Above all, the replacement of individual routine activities by machines has always been a consequence of technical innovations. We would
like to recall the beginning of industrialization in the UK, when the weavers were
afraid of competition from the automatic loom. Today, taxi drivers and bus drivers fear the self-driving car, retailers fear the self-payers and workers in assembly
see their workplace threatened by robots. It remains to be seen how the future will
develop exactly, but what is certain is that these technological changes can only succeed in the long run, if they are accepted by the affected workforce. “User-Centred
Change” (UCC) as a participative framework for the development and implementation of technology in a work environment can help to achieve this.
7.2 DIGITALIZATION: A CHANGE PROCESS
As digitalization proceeds, working environments and demands placed on employees shift: new means of working, communicating and collaborating are possible and
necessary. Work and private lives of employees are linked much more closely in
many industries than in the previous decades. New competencies are expected of
employees as well as of managers. At the same time, digitalization affects the balance of power in organizations, as employees are not only enabled, but in many cases
also obliged to take over more responsibility than they were used to (Schwarzmüller
et al., 2018). One central challenge is the speed at which these changes take place:
while technological progress develops exponentially, human beings only adapt linearly to these changes. In environments in which people are required to use a new
technology (i.e., the workplace), the gap between technological development and
human adaptation is even larger (Friedman 2017).
All this gives us a frst idea of the enormous effect the digitalization of companies
can have on their employees. It is not without reason that in the context of digitalization of organizations, experts often speak about “digital transformation” (Hess, Matt
et al. 2016, p.126–127; Vey, Fandel-Meyer et al. 2017, p. 23–24), and therefore about
a change process (Disselkamp und Heinemann 2018, p. 95).
As all companies and organizations are “social systems” (Pettigrew 1987, p.656),
composed inter alia by employees, customers and other stakeholders (de Biasi 2018,
p. 24), it is evident that we cannot expect this change to be only of technological
nature and to only bring about technological challenges. Behavioral issues regarding
the organization have great relevance for the change process, initiated by the implementation of technology (Lorenzi and Riley 2000, p. 116). When introducing technology in such social systems or “social contexts,” not only a technological change is
provoked, but a sociotechnical transformation, which not only affects the technology
but also the context of use:
Technologies are produced and used in particular social contexts, and the processes
of technological change are intrinsically social. … [T]echnological change is always
part of a sociotechnical transformation—technology and social arrangements are coproduced in the same process.
(Russel and Williams 2002, S.45)
User-Centred Change
109
In such social systems, change processes can trigger emotional reactions. If these
reactions are not addressed properly, they can lead to the rejection of the change by
the people affected (de Biasi 2018, p. 24).
Therefore, the social and organizational components of technological transformation have to be considered to ensure its success (ibid., p. 25).
7.3 CHANGE PROCESSES AND THE HUMAN FACTOR
The importance of those “soft factors” (Maucher et al., 2002), “behavioural”
(Lorenzi and Riley 2000) or “emotional” (Disselkamp and Heinemann 2018, p.97)
aspects proves true, when looking for an overview of common causes for the failure
of change processes.
A literature review of de Biasi (2018, S.4) reveals: an average of 70–90%
of change processes in organizations fail because of the employees’ resistance,
because they are not ready for the change yet or do not feel obliged to it. De Biasi
traces the failure of organizational change back to social reasons, a major one
being the inability to gain the employees’ trust. This lack of trust often lies in the
history of the companies and their previous handling of the implementation of
change. The more change processes have failed in the past, the more resistance
to further change is to be expected. For employees to be able to engage in organizational change, they have to endure an uncertain future and possible unexpected
consequences. Employees who do not trust their company will not go along with
such uncertainty (ibid.).
Van Dijk and van Dick (2009) highlight that most people affected by change
do not resist change in general but rather fear the consequences of change, “such
as loss of status, loss of pay, or loss of comfort” (p. 5). But not only do people fear
personal loss, the apprehension that the change will not beneft or even threaten
the organization can also motivate resistance to change. This might originate
from the fact that in most cases those planning the change are not the ones
who are affected by it and that both groups have very different perspectives on
the organizational change. Alas (2015) also assumes that most people do not
reject change in general but rather resent the attempt of “being changed” (p. 155).
Therefore, resistance to change processes can be an indicator of employees feeling pushed into passivity.
According to a Capgemini study (Schaefer et al., 2017), lack of communication
and silo thinking are the biggest obstacles to digital cultural change in organizations. In his textbook Organization, Vahs (2003) names communication, in addition
to personal reservations, as one of the two main reasons for the resistance against
changes in enterprises.
Despite all these fndings, the implementation of new technological solutions in
organizations is still often technology-driven—at the expense of social aspects. This
technological focus frequently leads to problems of acceptance or in extreme cases
to resistance and the failure of the whole project (Lorenzi and Riley 2000).
Therefore, the employees’ acceptance of the change process is a fundamental
condition for its success.
110
Handbook of Usability and User Experience
7.4 ACCEPTANCE AS A MULTIFACETED PHENOMENON
Acceptance is a widely worded concept whose exact defnition is often insuffciently addressed or presented within the discussion about technology implementation. A practical example illustrates the different facets of acceptance: an app
maker wants his or her app to be accepted by the target audience, e.g., downloaded
as often as possible and also used. In the best case, the users even give a positive
rating in the app store. The specifc usage behavior, i.e., the download and use of
the app, allows conclusions to be drawn about the users’ acceptance. However, it
becomes more complex when looking into the corporate world. The CEO wants
employees to use and accept new technology in the workplace. The starting point
is different in this example, as employees are not free to decide whether to use the
technology or not. There is a certain compulsion to use the technology, provided
that employees care about their job. This situation can be classifed as a so-called
non-voluntary context of use (Huijts et al., 2012). In the context of work, it is
therefore diffcult to examine or assess acceptance only through usage behavior.
Therefore, it is necessary to look at the employees’ attitudes in order to make statements about their acceptance. The usage behavior alone is not suffcient (Brown
et al., 2002).
In many studies, acceptance, as a psychological construct, is defned as the result
of a process of perception, assessment and decision with three infuencing variables:
(1) subject (e.g., an employee) which accepts an (2) object (e.g., a digital documentation tool) within a given (3) context (e.g., a company) (e.g., Schäfer and Keppler,
2013) (Figure 7.1).
Technology acceptance is infuenced by subject-related factors, such as individual attitudes, norms and values, sociodemographic factors or experiences.
Moreover, acceptance is affected by object-related factors, such as costs and
benefts, risks, usability, task adequacy and aesthetics. Finally, context-related
factors, such as the task at hand, predominant social processes and the organizational environment as well as the macrosocial context might infuence acceptance (ibid.).
According to this concept, acceptance depends on the interplay of these three
dimensions. The object has to be “acceptable” in order to “achieve” acceptance,
but acceptability is not the only condition for user acceptance. Only through the
(positive) interplay of subject, object and context, acceptance can arise (Sauer et al.,
2005). The three components interact and infuence each other. The result of the
process depends on their relationship (Schäfer and Keppler 2013, S.23).
7.5 USER-CENTRED CHANGE
To facilitate acceptance of technological solutions at the workplace, a one-sided
focus on the design of the technology, on the object-related factors, is insuffcient.
This approach can lead to misinterpretations of the reasons for resistance, expecting
it to be caused by a misft of the system and therefore ignoring possible individual
User-Centred Change
111
FIGURE 7.1 Qualitative acceptance model. YOUSE GmbH, based on Schäfer and
Keppler (2013).
or organizational factors. The success of a certain system depends not only on technological but also on (inter)personal aspects, which are not always associated with
the system use.
The standard ISO 9241-210 “Human-centred design for interactive systems”
defnes a process for the human-centred design of usable and useful interactive systems, the so-called Human- or User-Centred Design (UCD) process.
Although this process puts the human at the center of the design process and
acknowledges the context of use as a relevant design factor, the process focuses
primarily on the system design, not on the system implementation. Furthermore,
the approach aims at “understanding” the use of context (ibid. p. 16–17) but
requirements derived from this analysis are supposed to be solved through the
design of the object, not through the design of the implementation process or the
implementation context. The User-Centred Change (UCC) approach presented
here is thought to fll this gap by expanding the design focus by subject and
context factors. Combining UCD with participative change management expertise allows the user-friendly design of new technologies while simultaneously
designing the transformation process in the best interest of all involved actors.
The decisive factor is not the acceptance of the particular technology but rather
the acceptance of the change process. Therefore, change processes must be
suited to human needs.
112
Handbook of Usability and User Experience
UCC is based on the conviction that bottom-up communication and participation
can help employees to understand the need for change, diminish their fears and build
trust in the change project. It is expected that a participatory approach allows harnessing the know-how of those affected and that employees who are involved or feel
involved in the process will more often take over responsibility for these changes.
Hence, participatory measures play an important role in the change process and represent a central success factor for organizational change and the implementation of
new concepts (Will 2015, p. 146).
7.6
THE FOUR PHASES OF USER-CENTRED CHANGE
Instead of a sole top-down approach, UCC focuses on a bottom-up, iterative
approach, which enables affected actors to become participants in the change process and which allows considering their needs and fears and helping them to build
or maintain trust into the organization and the change at hand. Quick evaluation
cycles ensure a refective change process and prompt readjustment as a reaction to
changed requirements or unexpected events. UCC is a human-centred and participative approach which fosters the acceptance of technology and the change process.
Inspired by the UCD process, UCC consists of four phases: (1) insight, (2) path making, (3) evaluation and (4) realization, which will be presented in the following sections (Figure 7.2).
FIGURE 7.2
The User-Centred Change process. YOUSE GmbH.
User-Centred Change
7.6.1
113
INSIGHT
The aim of the frst phase is a comprehensive analysis of the status quo, both on
object and on subject and contextual levels. At the object-related level, for example, it
is important to check the applicability of potential technical applications. On subject
level, respectively contextual level, it is about mapping the attitudes of those involved,
disclosing potential conficts in the company. This creates a realistic, current picture
of the organization, which is an important basis for the design of the change process, as the existing conditions, on the basis of which a technical restructuring takes
place, have a substantial impact on the success of the restructuring. Incorrect basic
hypotheses and assumptions regarding the technology to be implemented, but also
regarding the attitudes of those involved, can impede the implementation and change
process and should therefore be checked at an early stage. The focus in this phase
is on the corporate culture and the relationship between all actors involved. UCC
extends the technologically focused UCD approach to understand the way in which
individual actors will be affected by the technical change and over and above all,
how threatened they feel by it and why. The methodology here is based on traditional
methods from UCD, empirical social research as well as design.
7.6.2 PATH MAKING
The second phase aims at a shared understanding of the restructuring as well as a
common vision for its design. If employees do not understand the context and goals of
a change, the process is likely to come to a standstill. In setting the course, concrete
topics, goals and KPIs of the transformation should be identifed and defned across
teams and hierarchies. In addition to the development of the technological concept at
the object level, it is important to design a roadmap for the participation of the actors
at the subject and context levels. That means identifying the individually appropriate
path for the transformation activities. This roadmap also includes suitable concepts
and formats for qualifying employees. The roadmap design takes place in participatory
workshops with the help of co-creation and/or design-thinking methods with the inclusion of different hierarchy and status groups. This approach allows getting everyone
involved and jointly defning measures for the implementation and change process.
Through the participatory roadmap, the change process is systematically structured
and made transparent. This approach minimizes feelings of uncertainty and helplessness from the start, which often lead to resistance. Instead, the perceived control over
the process is strengthened, laying the foundation for its acceptance.
7.6.3
REALIZATION
In the third step, the restructuring is designed and carried out. The technology is
integrated into the existing work processes. For this purpose, the roadmap planned
within the path making is implemented to support the change process. The continued existence of participatory elements plays a crucial role here: they ensure that the
114
Handbook of Usability and User Experience
technology implementation is carried out closely to the requirements of the workplace and the needs of the employees. During the implementation, early practical
experience coupled with training measures is of great importance in order to build
trust in the technical system. The right communication is central here. For effective
participation, there should be sensible communication channels in both top-down
and bottom-up directions during the implementation.
7.6.4 EVALUATION
The aim of the fourth phase is to continuously evaluate the measures taken in order
to assess the change process and its impact. Appropriate evaluation measures are
necessary. At the same time, organizational processes and participatory processes
must also be checked for their effectiveness and effciency. In the technology-related
evaluation, classic methods from the UCD are used to assess the suitability of use
and the ft of the systems to the existing work processes. This includes, among other
things, usability tests and feld observations, directly involving users and thus providing information on the specifc design and optimization of the technical systems.
Such evaluation approaches are borrowed from software development, where they
have a long history and are applied widely. In contextual evaluation, the overall
organizational context is considered. Among other things, the satisfaction of those
involved with the process and potential points of attack are evaluated and necessary
adjustments are identifed.
7.7
CONCLUSIONS
Digitalization offers great changes for organizations, but also comes with risks. The
transformation processes, triggered by digitalization, have to be treated as change
processes and should be accompanied by well-grounded communication measures
and participatory approaches. The employees affected by the change and their needs
and fears have to be put at the center of all implementation strategies. Not only the
acceptance of the technology to be implemented is ought to be fostered, but also the
acceptance for the change itself.
The UCC-approach, with its four iterative phases, allows designing this change
proactively and employee-oriented. The approach helps to identify the requirements
in regard to the change process on object-, subject- and contextual levels. It suggests
the participatory design of a shared vision and implementation roadmap. This way,
the affected parties gain back a feeling of control and the know-how of all involved
can be harnessed for a successful implementation process. Enabling employees to
discover and test the technologies to be implemented can dispel fear and can promote the development of new skillsets of the employees early on in the process.
Sensitive and continuous communication can help to maintain the employees’ feeling of control during the actual technical implementation. Frequent evaluation measures allow testing the effectiveness and effciency of the change process, as well as
the satisfaction of the involved parties and also allows the identifcation of necessary
modifcations in the implementation approach.
User-Centred Change
115
The User-Centred Change approach is constantly refned and optimized. At the
moment, the authors are successfully applying the approach to the felds of industry
4.0, especially focusing on human-robot collaboration (HRC), health, elderly care
and banking. Further areas of application could be public administration and retail.
This chapter aimed to give insight into the theoretical basis of UCC and to
encourage UX and usability experts to not only focus on the User-Centred Design
of technology, but also on the User-Centred Design of its implementation, to ensure
its success.
REFERENCES
Alas, R. 2015. Resistance to institutional and organizational change: An individual perspective. In Change Management and the Human Factor - Advances, Challenges and
Contradictions in Organizational Development, eds. Dievernich, F. E. P., Tokarski, K.
O., and Gong, J., 153–166. Cham, Heidelberg, New York, Dordrecht, London: Springer.
Brown, S. A., A. P. Massey, M. M. Montoya-Weiss, and J. R. Burkman. 2002. Do I really
have to? User acceptance of mandated technology. European Journal of Information
Systems 11 no.4:283–295.
de Biasi, K. 2018. Solving the Change Paradox by Means of Trust – Leveraging the Power of
Trust to Provide Continuity in Times of Organizational Change. Wiesbaden: Springer
Gabler.
DIN EN ISO 9241-210. 2011. Ergonomics of Human-System Interaction – Part 210: HumanCentred Design for Interactive Systems. Berlin: Beuth Verlag.
Disselkamp, M., and S. Heinemann. 2018. Digital-Transformation-Management – Den digitalen Wandel erfolgreich umsetzen. Stuttgart: Schäffer-Poeschel Verlag.
Friedman, T. L. 2017. Thank You for Being Late: An Optimist’s Guide to Thriving in the Age
of Accelerations. New York: Farrar, Straus and Giroux.
Frey, C. B., and M. A. Osborne. 2013. The future of employment: How susceptible are jobs to
computerisation? Technological Forecasting and Social Change 114:254–280.
Hess, T., C. Matt, A. Benlian, and F. Wiesböck. 2016. Options for formulating a digital transformation strategy. MIS Quarterly Executive 15 no.2:123–139.
Huijts, N. M. A., E. J. E. Molin, and L. Steg. 2012. Psychological factors infuencing sustainable energy technology acceptance: A review-based comprehensive framework.
Renewable and Sustainable Energy Reviews 16:525–531.
Lorenzi, N. M., and R. T. Riley. 2000. Managing change: An overview. Journal of the
American Medical Informatics Association 7 no.2:116–124.
Maucher, I., H. Paul, and C. Rudlof. 2002. Modellierung in soziotechnischen systemen. In
Promise 2002 - Prozessorientierte Methoden und Werkzeuge für die Entwicklung von
Informationssystemen, 9–11 October 2002 in Potsdam, eds. Desel, J., and M. Weske,
128–137. Bonn: Gesellschaft für Informatik, Köllen Druck+Verlag GmbH.
Pettigrew, A. M. 1987. Context and action in the transformation of the frm. Journal of
Management Studies 24 no.6:649–670.
Russel, S., and R. Williams. 2002. Social shaping of technology: Frameworks, fndings
and implications for policy with glossary of social shaping concepts. In Shaping
Technology, Guiding Policy: Concepts, Spaces and Tools, eds. K. H. Sørensen, and R.
Williams, 37–131. Cheltenham: Edward Elgar Publishing.
Sauer, A., F. Luz, M. Suda, and U. Weiland. 2005. Steigerung der Akzeptanz von FFHGebieten. In BfN-Skripten 144, ed. Bundesamt für Naturschutz. https://www.bfn.de/
fleadmin/MDB/documents/skript144.pdf (accessed December 19, 2019).
116
Handbook of Usability and User Experience
Schaefer, D., U. Bohn, and C. Crummenerl. 2017. Culture frst! Von den Vorreitern des digitalen Wandels lernen. Change Management Studie 2017. Capgemini. https://www.capgemini.com/consulting-de/wp-content/uploads/sites/32/2017/10/change-management
-studie-2017.pdf (accessed December 20, 2019).
Schaefer, M., and D. Keppler. 2013. Modelle der technikorientierten Akzeptanzforschung:
Überblick und Refexion am Beispiel eines Forschungsprojekts zur Implementierung
innovativer technischer Energieeffzienz-Maßnahmen. Technical University Berlin.
https://depositonce.tu-berlin.de/bitstream/11303/4758/1/schaefer_keppler.pdf (accessed
December 20, 2019).
Schwarzmüller, T., P. Boris, D. Duman Denis, and I. M. Welpe. 2018. How does the digital
transformation affect organizations? Key themes of change in work design and leadership. Management Revue - Socio-Economic Studies 29 no.2:114–138.
Vahs, D. 2003. Organisation. Einführung in die Organisationstheorie und -praxis. Stuttgart:
Schäffer- Poeschel Verlag.
Van Dijk, R., and R. van Dick. 2009. Navigating organizational change: Change leaders,
employee resistance and work-based Identities. Journal of Change Management 9
no.2:143–163.
Vey, K., T. Fandel-Meyer, J. S. Zipp, and C. Schneider. 2017. Learning & development in times
of digital transformation: Facilitating a culture of change and innovation. International
Journal of Advanced Corporate Learning 10 no.1:S.22–S.32.
Will, M. G. 2015. Successful organizational change through overcoming risks. In Change
Management and the Human Factor - Advances, Challenges and Contradictions in
Organizational Development, eds. F. E. P. Dievernich, K. O. Tokarski, and J. Gong,
129–151. Cham: Springer.
Section 2
Usability and UX in
the Health Sector
8
Usability to Improve
Healthcare
Christopher P. Nemeth, COL Jeremy C. Pamplin,
Sena Veazey and LTC Christopher Colombo
CONTENTS
8.1
8.2
Introduction .................................................................................................. 119
The Cooperative Communication System (CCS) ......................................... 120
8.2.1 Design ............................................................................................... 121
8.2.2 Methods ............................................................................................ 122
8.2.2.1 Individual Usability Assessment........................................ 122
8.2.2.2 Team Validation Assessment ............................................. 123
8.2.3 Results............................................................................................... 125
8.2.3.1 Individual Usability Assessment........................................ 125
8.2.3.2 Team Validation Assessment ............................................. 127
8.3 Telemedicine Prolonged Field Care (TelePFC) ............................................ 128
8.3.1 Design ............................................................................................... 129
8.3.2 Methods ............................................................................................ 130
8.3.2.1 Recruitment........................................................................ 130
8.3.2.2 Randomization Block Design Strategy.............................. 131
8.3.2.3 Scheduling Strategy and Requirements of Subjects .......... 131
8.3.2.4 Subject, Telementor, Proctor and Role-Player Orientation......131
8.3.2.5 Simulation Tests and Analysis ........................................... 131
8.3.2.6 Data Analysis ..................................................................... 132
8.3.3 Results............................................................................................... 132
8.4 Discussion..................................................................................................... 133
8.5 Conclusions................................................................................................... 134
References.............................................................................................................. 134
8.1 INTRODUCTION
Decision support system (DSS) development and evaluation in healthcare is essential
but challenging. Prior research shows that introduction of a poorly conceived DSS
can impede care and clinician confdence to adopt it (Bright et al. 2012; Woods 1988).
The US Food and Drug Administration encourages the comprehensive evaluation of
DSS before being considered for approval to use in healthcare settings (US FDA
2002). Completing valid evaluations that refect the care setting a particular DSS
intends to support is diffcult because clinician or staff time is scarce and diffcult to
DOI: 10.1201/9780429343490-10
119
120
Handbook of Usability and User Experience
obtain due to factors such as a high patient census. Development of contextually relevant evaluation scenarios requires substantial effort to effectively refect actual care.
This chapter reports on two different projects using usability assessment to
improve healthcare. The Cooperative Communication System (CCS) project assessed
a DSS created for use in a Burn Intensive Care Unit (BICU) in two separate evaluations (Nemeth et al. 2016a). The frst evaluated usability for individual clinicians.
A sample of respiratory therapists, nurses and physicians performed tasks using the
new DSS in two scenarios: new patient admission and preparation for surgery. The
second evaluated usability at the team level. Two teams, each comprised of a nurse,
resident and attending physician, performed in two scenarios: abdominal sepsis and
acute respiratory distress syndrome (ARDS). The objective was to collect quantitative data (e.g., time to complete task, steps to complete task) and qualitative data
(e.g., confdence in decisions made, ease of use). Results from the evaluations showed
that the new DSS compared favorably to a legacy electronic medical record (EMR)
system that the clinicians had used for years. Evaluation results were used to improve
the DSS prototype and make the case for advancement into full-scale development.
Another project assessed the effect of another form of DSS, telemedicine, on
clinical decision-making and care delivery during prolonged pre-hospital care by
junior physicians and medics under simulated conditions at two research sites. The
research team assessed participant clinical decision-making, procedure quality, cognitive workload, confdence and stress while participants used either printed guidelines or “tele-mentoring” during extended (6–14 hours) simulated pre-hospital care
scenarios. Participants also reported their subjective sense of cognitive workload
under each test condition.
Healthcare evaluations require rigorous planning and execution. Use of a consistent methodology such as Cognitive Systems Engineering (CSE) (Woods and Roth
1988; Woods and Hollnagel 2006) ensures thorough and accurate DSS development.
The approach also ensures that solutions are defensible, by tracing features back
through requirements and analyses to the original data. CSE mixed methods research
designs triangulate collection of quantitative and qualitative data. Conducting studies in a setting with staff, equipment and procedures as close as possible to actual
practice ensures results have high validity.
8.2
THE COOPERATIVE COMMUNICATION SYSTEM (CCS)
We conducted both research and usability assessments at a 16-bed BICU in a 450bed tertiary care military academic medical center, that is widely considered to be
one of the best of its kind in the country. Two of the beds are reserved to serve as
a post-anesthesia care unit (PACU). One bed is dedicated to the center’s extracorporeal membrane oxygenation (ECMO) program. Nearby support facilities include
a step-down unit, a dedicated burn operating room and an outpatient clinic. The
BICU census averages around 8 patients, but rose as high as 13 during the project.
Length of stay ranges from days to months. Patients admitted to the unit have the
most severe affiction from chemical, thermal or electrical burns. Patients can also
be admitted with burn-like diseases of the skin, such as toxic epidermal necrolysis
Usability to Improve Healthcare
121
(TENS), Stevens-Johnson syndrome and the autoimmune disorder pemphigus vulgaris. The unit also treats patients who have infections or trauma that causes extensive soft tissue damage or loss, such as necrotizing fasciitis, severe degloving injuries
and some war-related trauma.
Care for fragile BICU patients requires clinicians and clinical teams to perform
complex cognitive work. This includes cognitive activity such as attention, memory and decision-making (Nemeth 2004). It also includes a range of macrocognitive activities such as problem detection, planning and replanning and developing
common ground (Cacciabue and Hollnagel 1995; Klein et al. 2003). Individuals and
teams are compelled to make time-pressured diagnostic and therapeutic decisions
based on emergent and interrelated patient information from multiple sources. Their
decisions about how to manage patient care rely on their ability to get the most
important, or salient, information about the patient when performing the activities.
Clinicians cope with many barriers to effective care, such as having to mentally integrate multiple sources of data. An effective DSS can spare clinicians from having
to overcome such barriers, which can reduce the opportunity for misadventures and
shorten patients’ length of stay by making better care possible sooner.
Care providers, cognitive artifacts and information systems in this work setting
comprise a joint cognitive system that can be studied, modeled and evaluated using
CSE methods such as cognitive task analysis (Crandall, Klein and Hoffman 2006).
CSE methods are used to design technology, training and processes that help people
to manage cognitive complexity in sociotechnical systems (Millitello et al. 2010). In
the frst year of the project, our team used a selection of CSE methods to develop an
in-depth understanding of the BICU people, tasks and work context. In the second
year, we used them to develop rough and increasingly refned prototypes, including
features from scheduling to unit view, order tracking, task checklists, messaging and
patient view (shown in Figure 8.1). All of the features in the CCS refect 39 requirements that feld research revealed. The “parent-child” tab and center feld confguration enables the user to scan key variables and choose detailed data of interest in
either graph or table form.
We performed two assessments, one at the individual level and the other at the
team level, to determine whether the CCS prototype improved clinician performance
and whether clinicians accepted it. Our usability assessment evaluated how well the
CCS supported individual clinician needs to fnd and use key patient data. CCS team
collaboration features, such as communication through an integrated messaging
application designed with healthcare team accountability in mind, were evaluated in
a validation assessment the following year.
8.2.1
DESIGN
Both usability and validation assessments followed protocols that had been approved
by the local institutional review board (IRB) and the Department of Defense Human
Research Protection Offce (HRPO). To ensure the highest fdelity to the actual
work setting and users, we conducted sessions on the BICU with clinicians who
were assigned there. Evaluation is intended to verify how well the solution fulflls
122
Handbook of Usability and User Experience
FIGURE 8.1 CCS prototype patient view. Copyright © 2015 Applied Research Associates.
Used by permission.
objectives that were derived during prior knowledge elicitation and analysis phases
(Nemeth et al. 2015, 2016b).
8.2.2 METHODS
8.2.2.1 Individual Usability Assessment
We recruited 11 physicians, 20 nurses and 10 respiratory therapists (RTs) of various experience levels from the BICU staff. Ninety percent of the nurses, 53% of the
physicians and 50% of the RTs had more than 7 years of service in the BICU. Each
participant received a 5-minute orientation to the CCS, and then used it to perform
tasks in two typical clinical scenarios. The CCS was populated with previous patient
data. In the frst, the participant was to complete a patient admission to the BICU.
In the second, the participant was asked to determine if a patient was ready for the
operating room. RTs only completed the second preoperative scenario, as they do
not complete the entire admission process. Participants were then asked to indicate
responses on a one-page sheet to statements about the usability of the CCS versus
their experience with the legacy EMR.
The usability assessment followed Rubin’s (1994) guidance on how to conduct a
usability assessment. We collected quantitative data by having those who would be
expected to use the end product perform normal tasks using the prototype. We also
Usability to Improve Healthcare
123
FIGURE 8.2 Individual usability assessment. Copyright © 2016 Applied Research
Associates. Used by permission.
used verbal protocol analysis (also known as “thinking aloud”) to reveal information
they considered, how they found it, and how they interpreted it.
The participant sat in front of a laptop showing the CCS patient view (Figure 8.2).
A small video camera was placed behind the chair to capture user navigation and
comments. The session facilitator sat to the right with a log to track times, noted
comments and steps taken to complete the task and how the participant used patient
information to make clinical decisions.
After completing each scenario, participants used a 7-point Likert scale to rate
the CCS according to its ease of use, how it affected their ability and speed fnding
information, their confdence in decisions they made using the system and how CCS
compared to legacy IT systems for support of cognitive work.
8.2.2.2 Team Validation Assessment
The purpose of the validation assessment was to determine how the CCS affected
team performance. The research team collected quantitative data such as how long it
took to get to a decision (effciency). It also collected qualitative data such as expert
evaluation of how accurate participant decisions were, and participants’ subjective
124
Handbook of Usability and User Experience
FIGURE 8.3 Team validation assessment. Copyright © 2016 Applied Research Associates.
Used by permission.
experience with the CCS. Researchers observed two three-member clinician teams
(attending burn surgeon, a bedside nurse and a resident physician) (Figure 8.3).
Table 8.1 shows that while Team 1 had more experience than Team 2, experience
in the BICU work setting was similar for both teams. Ranges represent how data
were collected to maintain anonymity of a small population of participants. Team 1
had one female member and Team 2 was all male.
Both teams cared for one simulated patient using a high-fdelity manikin
(SimMan 3G, Laerdal®, Stavanger, Norway) in each scenario, which lasted about 6
hours. Researchers performed any consulting roles that teams would need: respiratory therapist, rehabilitation specialist, nutritionist, pharmacist, family member and
subspecialty consultants.
TABLE 8.1
Validation Assessment Team Member Experience
Team
One
Two
Role
Years in practice
Years in the BICU
Attending physician
10+
10+
Resident
Nurse
Attending physician
Resident
4–6
10+
10+
<1
<1
1–3
7–9
<1
Nurse
7–9
1–3
Usability to Improve Healthcare
125
We developed two scenarios in advance that called for teams to treat a “patient”
with ARDS and a “patient” with intraabdominal sepsis. We then piloted and refned
scenarios with input from experienced burn care providers. We chose these two
conditions because therapeutic interventions in both are challenging to implement,
potentially risky and require team decision-making. Scenarios were designed to help
determine how well either the CCS or a legacy IT system in use at the BICU for years
system supported the teams’ key decisions. Scripts were designed to branch depending on clinician decisions. This required a substantial amount of advance preparation
to develop various tasks, lab values, imaging, notes, patient care needs and changes
in patient condition.
Each team was oriented to the systems and the simulation room for about an hour
the night before their frst assessment. Scenarios started at 6:45 a.m. when researchers, simulating the “night-shift,” gave standardized handoffs to the resident and
nurse subjects starting the “day shift.” This gave the members time to prepare for
multidisciplinary rounds, to conduct rounds and to perform patient care after rounds
were done.
IT systems and scenarios were counterbalanced to avoid transfer of training.
We used simulated patient data and the legacy EMR system to enter and record all
patient data so that CCS could display it real time. Team 1 frst used the CCS (entering data through the legacy EMR system) for the ARDS scenario and then used
the legacy EMR system only for the sepsis scenario. Team 2 used the legacy EMR
system for the ARDS scenario and then the CCS (entering data through the legacy
EMR system) for the sepsis scenario.
Three observers collected data on six outcome measures: activities performed,
the time it took the team to arrive at key decisions, information seeking behaviors,
communication patterns, decision-making processes and use of the CCS messaging
feature. Care that was provided at the same level of quality in a shorter timeframe
was considered more effcient.
After each scenario, we collected data using a brief survey, including statements
that invited responses using a 7-point Likert scale and open questions so that participants could rate their own team’s performance, decision-making and communication, and compare both IT systems. They also provided feedback about their
experience in a semistructured group interview.
8.2.3
RESULTS
8.2.3.1 Individual Usability Assessment
All participants were able to complete all tasks successfully. Results of the assessment included responses to questions comparing the CCS with the legacy electronic
healthcare record that has been used at the site for years (Nemeth et al. 2016c).
Table 8.2 shows data for participant responses by role.
When compared to RTs and to nurses, physicians rated the CCS as easier to use
and easier to fnd information (p < 0.05). All of the participants rated themselves
confdent in their decisions and found the effort needed to use the CCS low compared to the legacy system. Table 8.3 shows participants’ responses on a 7-point
126
Handbook of Usability and User Experience
TABLE 8.2
Participant Ratings of the CCS and Legacy System by Role (Mean [SD])
Overall
(n = 41)
Physician
(n = 11)
Nurse (n = 20)
RT
(n = 10)
I am confdent in my decision/
recommendation
5.4 (1.2)
5.7 (1.1)
5.2 (1.3)
N/A
The system was easy to use to
make this decision
The system enabled me to quickly
fnd the information I needed
It was straightforward to fnd the
information I needed
Scenario 2: new admission
I am confdent in my decision/
recommendation
The system was easy to use to
make this decision
The system enabled me to quickly
fnd the information I needed
It was straightforward to fnd the
information I needed
4.9 (1.4)
5.6 (1.1)
4.7 (1.7)
N/A
5.18 (1.6)
5.7 (1.4)
4.9 (1.8)
N/A
4.95 (1.6)
5.3 (1.4)
4.75 (1.8)
N/A
5.9 (0.75)
6.1 (0.73)
5.85 (0.67)
5.7 (0.76)
5.5 (0.95)
6.1 (0.57)a
5.6 (1.2)
4.8 (1.3)a
5.1(1.2)
5.7 (1.2)a
5.5 (1.2)
4.8 (1.3)a
5.2(1.1)
6.2 (0.92)a,b
5.5 (1.1)b
4.9 (1.4)a
Scenario 1: preparing for surgery
a. Indicates signifcant difference between identifed groups (p < 0.05) by MANOVA.
b. Indicates signifcant difference between identifed groups (p < 0.05) by MANOVA.
TABLE 8.3
Participant Ratings Comparing the CCS and Legacy Systems
Disagree
(1–3)
Neutral
4
Agree
(5–7)
24.4%
9.7%
65.9%
I can fnd the information I need more easily than I can using
(the legacy system)
Usability
14.6%
19.5%
65.9%
The CCS is easier to use than (the legacy system)
I would feel more confdent making future clinical decisions and
recommendations using the CCS than using (the legacy system)
14.5%
19.5%
19.0%
22.0%
66.0%
58.5%
The CCS supports the way I do my work better than (the legacy
system)
17.1%
19.5%
63.4%
Information search
I can fnd the information I need in (the CCS) more quickly than
I can using (the legacy system)
127
Usability to Improve Healthcare
Likert scale to fve comparison statements according to the percentage of those who
responded strongly agree or agree (5–7), neutral (4) or disagree (1–3).
A number of comments pointed out features that the earlier knowledge elicitation
phase had shown were important, such as simultaneous display of all salient data,
support for a shared mental model of patient status and sparing clinicians from having to do work that the system can handle. For example:
Respiratory therapist: “Having the information right there makes you think,
when you can see the trends. It helps to pull the information together in one
place.”
Nurse: “I like that CCS may bring us together and on the same page. All members on the team may see things the same way.”
Attending physician: “Nice to have actual and ideal or adjusted body weightto-dose drugs.”
Qualitative data also included participant recommendations for improvement. For
example, nurses preferred to have a view that included all laboratory values for a
patient. Respiratory therapists favored a view that summarized all of a patient’s ventilator settings.
8.2.3.2 Team Validation Assessment
Table 8.4 shows how teams and systems were counterbalanced to avoid training
effect.
Interestingly, in the sepsis scenario, the less experienced team using the CCS was
able to reach a decision to perform an exploratory laparotomy at essentially the same
time as the more experienced team. During the ARDS scenario, the more experienced team using the CCS decided on ECMO treatment over a half hour sooner
compared with the team using the legacy system. While the more experienced team
(Team One) consistently gave antibiotics faster, decision-making effciency was similar (Pamplin et al. in press).
Participants were able to use the CCS messaging feature to check the status of the
patient, tests, consult requests and medication orders and found that it made communication easier compared with traditional means (pager, phone, face to face). We
discovered teams used that feature in different ways. The more experienced Team 1
TABLE 8.4
Validation Scenario Time to Decide
Scenario
Team
IT system
Time to decision
Sepsis
One
Legacy
6:38
ARDS
Two
One
CCS
CCS
6:43
4:33
Two
Legacy
5:07
128
Handbook of Usability and User Experience
had 11 communication threads: 82% received replies, and team members communicated one-to-one (e.g., resident to attending) in 9 of the 11 threads. The less experienced Team 2 used messaging to broadcast information one-to-many (e.g., nurse to
resident, charge nurse, pharmacist) for 70% of their 10 threads.
Participants consistently found the scenarios were “real.” During post-scenario
interviews, members of both teams mentioned how clinically challenging the scenarios were and that, because the “patient” was “so sick,” team members relied on
the DSS/IT systems less and spent more time at the bedside.
Responses in surveys after the validation assessment showed that all but one participant rated the CCS superior to legacy systems for ease of use and information
fnding, and for improving team performance, communication and decision-making.
Team 2 rated both systems as equal for fnding information and decision confdence.
Orientation to use the CCS was minimal, and use cases did not lend themselves to
statistical analysis. Results did show participants rated the CCS easier to use than the
legacy system, and resulted in better diagnostic performance by a novice clinician
and slightly improved effciency.
8.3
TELEMEDICINE PROLONGED FIELD CARE (TELEPFC)
Future military deployment scenarios anticipate circumstances in which rapid evacuation will not be the norm. Evacuation delays will require extended care for casualties, including prolonged feld care (PFC) over hours to days (PFC 2015). PFC will
involve more severe affictions such as shock (which can cause organ failure), and a
care provider will need to make complex diagnoses and treatment decisions under
austere conditions. An inexperienced clinician’s decision-making (and by extension,
casualty care) can be improved through the use of advanced telemedicine tools with
audiovisual capabilities during prolonged Field Care (PFC) (Lilly et al. 2014).
Advanced telecommunication devices that enhance communication and situational awareness in such conditions may provide essential critical care expertise
in real time, decrease mental task load and provide comfort to clinicians faced with
unfamiliar, challenging problems (Pickering et al. 2015). We developed a simulation
platform to determine whether telemedicine improves clinical decision-making and
management of complex casualties during PFC, compared to care provided without
telemedicine support.
Physicians in academic medical centers regularly provide telemedicine for critically ill and injured patients when supervising physician trainees and consulting with
subspecialty providers or colleagues (Croteau and Vieru 2002). Enabling this type of
two-way exchange using reliable communications (i.e., e-mail and telephone) could
signifcantly improve the care of casualties and improve local provider confdence in
clinical decisions. Its benefts would be greatest in remote areas of operation where
clinical experts such as intensivists and surgeons are not physically available (see
Norris et al. 2002). While the technology is relatively simple, the human aspects
of telemedicine are more challenging and beg a number of questions. What clinical
encounters beneft from remote assistance? What are the best practices for tele-mentoring? When should clinicians employ synchronous vs. asynchronous technology?
129
Usability to Improve Healthcare
What level of complexity is appropriate? What is the best timing to engage in remote
support? Answering these questions would verify that remote expert consultation
could actually improve patient care and reveal aspects of care are the best for remote
consultants to assist.
8.3.1
DESIGN
We designed high-fdelity simulations to mimic real patient care to ensure validity
and conducted several pilot tests. This ensured that we could conduct reliable and
reproducible long-term simulations at multiple study sites without compromising on
data collection. We sought to determine how one aspect of telemedicine, expert presence, using audio or video can aid clinicians who have limited knowledge, skills
and experience to provide optimal care for critically ill patients in austere environments. To learn the answer, we conducted a randomized controlled study to measure
clinician performance related to critical care management of complex casualties in
simulated PFC scenarios with, and without, telemedicine (“reach back”) support.
Table 8.5 shows how the simulation was organized at both of the research sites.
Our study was designed to test the effect of telemedicine on participant clinical
decision-making, procedure quality, cognitive workload, confdence and stress. Our
hypothesis was that tele-mentoring would:
• increase accuracy of decisions,
• have no impact or decrease effciency of decisions,
TABLE 8.5
TelePFC Simulation Study Timeline and Tasks
Participant
Day T-1
Day 1
(during)
Day 1 (after)
Orientation to simulation and research
study
Handoff of scenario, patient history and
allow questions prior to simulation
Will be equipped with physiological
monitor and telemedicine equipment
May stop or remove themselves from
the study at any time
Will attend after actions review meeting to
discuss simulation and fll out surveys
Research team
Set up for testing: simulation room,
telemedicine workstation, video camera,
manikin
Test: hardware, software and network
connectivity
Conduct orientation
Simulation technician will deploy manikin
Research team and Subject Matter Expert
(SME) will role-play as needed “roles” to
assist subject
Paper and video recording of data points
Conduct after action review meeting to
allow discussion and handoff surveys
Data review and analysis
130
•
•
•
•
•
Handbook of Usability and User Experience
increase reliability of decisions across subjects,
increase procedural quality,
decrease cognitive workload,
increase confdence,
decrease stress.
8.3.2 METHODS
In year 1, we explored three levels of telemedicine support:
• Comprehensive telemedicine (CT) support that includes remote casualty
monitoring using synchronous telemedicine (real-time video and audio
communication) and asynchronous e-mails.
• Partial telemedicine (PT) support that includes access to a remote expert
with only asynchronous e-mails and synchronous phone calls (but no
video).
• No telemedical (NT) support. Subjects complete scenarios without help
from a remote expert and only access to hard copy clinical practice
guidelines.
We conducted simulation testing at the US Army Institute of Surgical Research (US
AISR) and at Madigan Army Medical Center Andersen Simulation Center (ASC).
The telementor role was supported with:
• Standardized scripts, with straightforward language designed to guide an
inexperienced clinician.
• Checklists to ensure complete data collection and thorough management.
• Procedure guides, complete with visual aids, to be sent to the subject.
Guides would ensure tele-mentoring reliability.
The study design consisted of six steps using the following methods.
8.3.2.1 Recruitment
In accordance with an approved IRB protocol, we recruited and enrolled participants at San Antonio Military Medical Center (US Army Institute Surgical Research
and Brooke Army Medical Center) (BAMC) and Madigan Army Medical Center
(MAMC). We recruited active duty military clinicians with no formal surgical or
anesthesia training such as family medicine, emergency medicine and internal medicine physicians, physician assistants or medics representing the types of clinicians
likely to encounter PFC during military deployments. Our goal was to recruit at least
20 subjects per site (40 in all). Assuming a 20% dropout rate, 24 subjects would comprise the sample at each site (48 in all). We also used a survey to collect demographic
information through a survey on the day before the simulation experiment. After
providing consent, each subject was assigned a unique identifer and was assigned to
a testing calendar.
Usability to Improve Healthcare
131
8.3.2.2 Randomization Block Design Strategy
We conducted block randomization to randomly sort participants into one of the
three telemedicine groups. Each block ensured that all three groups were represented
to eliminate the risk that certain groups were not conducted in case of signifcant
dropout or low subject recruitment.
8.3.2.3 Scheduling Strategy and Requirements of Subjects
We asked each participant to allow one full day to complete the simulation tests and
aligned the schedule date and time for both participants and telementors.
8.3.2.4 Subject, Telementor, Proctor and Role-Player Orientation
The day before subject testing, we gave the participant a brief orientation about the
research study without revealing which of the four simulations would be used, and
an orientation to the simulation manikin, equipment and environment. Subjects were
also encouraged to use the concurrent “think aloud” method to reveal their thoughts
throughout the simulation.
8.3.2.5 Simulation Tests and Analysis
We performed all tests using a manikin (SimMan 3G, Laerdal®, Inc., Stavanger,
Norway) in a high-fdelity simulation to mimic an austere PFC setting, and developed
scenarios that simulated patient care over 14 hours. Scenario time was compressed
into simulation events lasting from 6 to 8 hours and recorded on video. Participants
wore smart shirt sensors (Hexoskin, Carré Technologies, Montreal, CA, https://www
.hexoskin.com) during the sessions to monitor and analyze cognitive workload and
stress, based on the physiological responses. We randomized each participant to conduct one scenario which was either comprehensive (CT) or partial (PT) or no telemedical support (NT). All groups used standardized medical supplies, equipment
and had access to the Joint Trauma Systems Clinical Practice Guidelines.
The research investigators and primary proctor monitored the simulation, noted
key tasks completed and times and asked the participant to use the validated workload assessment form NASA-TLX (Hart and Staveland 1988) to report their physical
and cognitive workload after major intervention and at the end of each scenario.
Investigators collected data on the following:
• Decision-making accuracy: Did the participant perform the correct procedure/make the correct decision?
• Decision-making effciency: How fast was the participant able to perform
a procedure? How quickly could each participant determine key decision
points?
• Decision-making reliability: Measurement of consistency between various
groups
• Procedure quality: Percent of key and supportive procedural tasks
completed
• Cognitive workload: Physical and cognitive workload, measured using validated surveys and physiological measurements
132
Handbook of Usability and User Experience
• Stress/confdence: Perception (survey) and measurement (physiological
measurement) of stress and confdence (survey).
8.3.2.6 Data Analysis
Analysis sought to answer several questions: was there a difference in cognitive
workload (of specifc task) between the three telemedicine groups? Was there a difference in cognitive workload of the tasks performed in the same scenario between
various demographics? Which telemedicine platform had the highest effciency in
decisions made, accurate decisions made and reliability of decisions made between
study groups? Which group had the highest perceived and modeled confdence
between the telemedicine groups? Which telemedicine group had the highest percentage completion of critical tasks completed and of whom? What was the quality,
and are there differences in quality between study groups? Answers were based on
data collected from performance observation, coding of videos of clinical performant, the physiological measurement system (which provided a cognitive workload
model and stress model), NASA-TLX surveys response, custom surveys and after
action review report.
8.3.3 RESULTS
While the project is still in progress, we can report on preliminary results for ten
participants who completed the severe hypoxia scenario in one of three groups: comprehensive telemedicine (CT), partial telemedicine (PT) and no telemedicine (NT)
(Table 8.6). We coded timing of decision to place an advanced airway (AA), time to
complete AA placement and specifc quality and safety tasks. We analyzed quality
scores using Analysis of Variance (ANOVA) with a Tukey adjustment for pairwise
comparisons.
Procedural quality scores indicate the percent of quality indicators completed
(e.g., prepares equipment before starting procedure, has backup/alternative airway
equipment available). Scores for the advanced airway task differed between the CT
vs. NT (86% vs. 30%, p < 0.002) and PT vs. NT group (71% vs. 30%, p < 0.001).
TABLE 8.6
TelePFC Results for Advanced Airway (AA) Task
Task
CT (n = 4)
PT (n = 4)
NT (n = 2)
Timing of the decision to place AA (minutes)
135
147
135
Time to complete AA placement (minutes)
Procedural quality scores (percent of completed
quality indicators)
“Patient” outcomes/survival
36
86%
26
71%
11
30%
100% (4/4)
66% (2/3)
0% (0/2)
70
58
73
NASA-TLX score (higher indicates greater
cognitive load)
Usability to Improve Healthcare
133
These initial results suggest that clinicians who received no telemedicine guidance
had a signifcantly lower advanced airway quality score compared to both groups
that received partial (PT) or comprehensive (CT) telemedicine guidance, indicating
lower quality, and potential safety, of the procedure. Compared with the CT and PT
groups, the NT group also had slightly higher cognitive workload, but little difference in timing of decisions.
8.4 DISCUSSION
Both the examples of this chapter provide ample evidence for how usability can help
to improve healthcare.
The CCS project demonstrates inclusion of evaluation at multiple points in the
system development life cycle. The research team conducted other interim evaluations before the individual and team assessments described above. For example,
team members reviewed results with BICU clinicians to verify the accuracy of frstyear observations and interviews (Nemeth et al. 2015, 2016b). The team also conducted participatory design sessions (Clemensen et al. 2007) with BICU clinicians at
the start of interface concept development. These and the fnal assessments verifed
the development solution and clinician needs were aligned. It also enabled clinicians
to invest themselves in the solution.
While clinically accurate scenarios are a challenge to develop, they are worth the
effort. The scenario was so believable to the outside observer that the participant
roles can easily be reversed by writing scripts for the subject and evaluating telementor responses. Much like the physical setting, the clinical ecology needs to include all
of the cues and results that participants are used to experiencing in actual practice.
Participants who would use the eventual solution, rather than proxies or stand-ins,
speak from experience. Their task performance is more likely to be authentic, yielding more accurate data. The knowledge that they would beneft from the eventual
solution is an incentive to be candid. The practice refects insights developed early in
evaluation of user-computer interaction (Molich and Nielsen 1990), such as “speak
the user’s language,” “minimize the user’s memory load” and avoidance of “irrelevant or rarely needed information.”
While models that seek to improve healthcare (see Carayon et al. 2014) offer helpful insights, most rely on observation and qualitative data for evidence. Comparative
interface assessments such as by Zahabi et al. (2016) focus more on the interface
than how it affects task performance. Those who review such assessments can dismiss them as “just opinions.” Approaches to improve healthcare need to include
both quantitative and qualitative data to build a defensible case. Results from both
of the studies in this chapter include quantifable data such as time to complete task
or number of steps taken. These data provide a warrant for claims that performance
using the solution improves care quality. Minimal need for orientation also suggests
time and funds for training how to use the system could be substantially reduced.
Conducting studies in circumstances as close to actual conditions as possible
maximizes the assessment’s validity. Greater validity lessens the needs for imagination on the participant’s part and evokes more genuine behavior. For example, team
134
Handbook of Usability and User Experience
members in the CCS validation study found the scenario engaging to the point that
when the simulated patients’ condition deteriorated rapidly, team members spent
more time at bedside. While this limited the amount of time members spent using
the DSS and IT systems later in the scenario, it also provided data on how clinicians
use IT systems that other study methods like interviews and surveys might not.
Scheduling and resource constraints can make sample recruitment diffcult. For
example, the CCS validation assessment had two small teams and two clinical scenarios. A focus on process descriptions and consistent themes across the data made
the most of the exercise.
8.5
CONCLUSIONS
Those who provide and get healthcare deserve the best possible systems to support them. While other sectors might lend themselves to “quick and dirty” studies, healthcare does not. Managing tight schedules and resources makes effcient
research design necessary to make the most of the effort. Use of a methodical
approach such as CSE is essential for this, as CSE is designed to connect data from
the research setting through analyses, requirements and solutions to evaluation that
includes usability.
Both of the projects in this chapter demonstrate how use of the CSE approach
to health IT development can produce solutions that match clinical priorities and
workfows and minimize the need for training through intuitive design. Our fndings
also complement the growing body of research that shows how rigorous research
in individual and team cognitive work can produce technology that is acceptable to
clinicians, may improve their care performance and, as a result, may enhance care
quality, safety and ultimately patient outcomes.
REFERENCES
Bright, T. J., Wong, A., Dhurjati, R., Bristow, E., Bastian, L., Coeytaux, R., et al. 2012.
Effect of Clinical Decision-Support Systems: A Systematic Review. Annals of Internal
Medicine. 57: 29–43.
Cacciabue, P. C., and Hollnagel, E. 1995. Simulation of Cognition: Applications. In J. M. Hoc,
P. C. Cacciabue, and E. Hollnagel (eds.), Expertise and Technology: Cognition and
Human Computer Cooperation, 55–73. Mahwah, NJ: Erlbaum.
Carayon, P., Wetternick, T. B., Rivera-Rodriguez, A. J., Hundt, Ann Schoofs, Hoonakker,
Peter, Holden, Richard, and Gurses, Ayse P. 2014. Human Factors Systems Approach
to Healthcare Quality and Patient Safety. Applied Ergonomics. 45(1): 14–25. Published
online 2013 Jul 8. doi: 10.1016/j.apergo.2013.04.023
Clemensen, J., Larsen, S. B., and Kyng, M. 2007. Participatory Design in Health Sciences:
Using Cooperative Experimental Methods in Developing Health Services and Computer
Technology. Qualitative Health Research. 17(1): 122–130.
Crandall, B., Klein, G., and Hoffman, R. 2006. Working Minds: A Practitioner’s Guide to
Cognitive Task Analysis. Cambridge, MA: MIT Press.
Croteau, A.-M., and Vieru, D. 2002. Telemedicine Adoption by Different Groups of Physicians.
Proceedings of the 35th Hawaii International Conference on System Sciences. IEEE
Computer Society, 7–10 January.
Usability to Improve Healthcare
135
Hart, S. G., and Staveland, L. E. 1988. Development of NASA-TLX (Task Load Index):
Results of Empirical and Theoretical Research. Advances in Psychology. 52: 139–183.
Klein, G., Ross, K. G., Moon, B. M., Klein, D. E., Hoffman, R. R., and Hollnagel, E. 2003.
Macro-Cognition. IEEE Intelligent Systems. 18(3): 81–85.
Lilly, C. M., McLaughlin, J. M., Zhao, H., Baker, S. P., Cody, S., and Irwin, R. S. 2014. A
Multicenter Study of ICU Telemedicine Reengineering of Adult Critical Care. Chest.
145(3): 500–507. doi: 10.1378/chest.13-1973
Militello, L., Dominguez, C., Lintern, G., and Klein, G. 2010. The Role of Cognitive Systems
Engineering in the Systems Engineering Design Process. Systems Engineering. 13(3):
261–273.
Molich, R., and Nielsen, J. 1990. Improving a Human–Computer Dialogue. Communications
of the ACM. 33: 338–348.
Nemeth, C. 2004. Human Factors Methods for Design. Boca Raton, FL: Taylor and Francis/
CRC Press.
Nemeth, C., Anders, S., Brown, J., Grome, A., Crandall, B., and Pamplin, J. 2015. Support for
ICU Clinician Cognitive Work through CSE. In A. Bisantz, C. Burns, and T. Fairbanks
(eds.), Cognitive Engineering Applications in Health Care, 127–152. Boca Raton, FL:
Taylor and Francis/CRC Press.
Nemeth, C., Anders, S., Strouse, R., Grome, A., Crandall, B., Pamplin, J., Salinas, J., and
Mann-Salinas, E. 2016a. Developing a Cognitive and Communications Tool for Burn
Intensive Care Unit Clinicians. Military Medicine. Society of Federal Health Offcials
(AMSUS). 181(5): 205–213.
Nemeth, C., Blomberg, J., Argenta, C., Serio-Melvin, M., Salinas, J., and Pamplin, J. 2016b.
Revealing ICU Cognitive Work Using NDM Methods. Special Issue on Expanding
Naturalistic Decision Making. Journal of Cognitive Engineering and Decision
Making. Human Factors and Ergonomics Society. 10(4): 350–368. doi: 10.1177/
1555343416664845
Nemeth, C., Hamilton, A., Laufersweiler, D., Serio-Melvin, M., Blomberg, J, Murray,
S., and Pamplin, J. 2016c, October. Evidence of Usability: Evaluation of Burn ICU
Clinician Decision Support. Proceedings of the IEEE Systems, Man, and Cybernetics
International Conference, Budapest.
Norris, T. E., Hart, G. L., Larson, E. H., Tarczy-Hornoch, P., Masuda, D., Fuller, S. S., House,
P. J., and Dyck, S. M. 2002. Low-Bandwidth, Low-Cost Telemedicine Consultations
in Rural Family Practice. Journal of the American Board of Family Practice. 15(2):
123–127. http://www.jabfm.org/ (accessed 18 December 2019).
Pamplin, J., Nemeth, C., Serio-Melvin, M., et al. 2020. Improving Burn ICU Clinician
Decision and Communication through IT Support. Military Medicine. Society of
Federal Health Offcials (AMSUS). 185(1–2): e254–e261
PFCWG. 2015, March. Prolonged Field Care Teaching and Training Recommendations.
USSOCOM Prolonged Field Care Working Group (PFC WG). http://prolongedfeldcare
.org/about (accessed 14 October 2015).
Pickering, B. W., Dong, Y., Ahmed, A., Giri, J., Oguz, K., Gupta, A., Gajic, O., and
Herasevich, V. 2015. The Implementation of Clinician Designed, Human-Centered
Electronic Medical Record Viewer in the Intensive Care Unit: A Pilot Step-Wedge
Cluster Randomized Trial. International Journal of Medical Informatics. 84(5): 299–
307. doi: 10.1016/j.ijmedinf.2015.01.017
Rubin, J. 1994. The Handbook of Usability Testing. New York: John Wiley & Son.
USFDA. 2002. General Principles of Software Validation: Guidance for Industry and FDA
Staff. US Food and Drug Administration. https://www.fda.gov/regulatory-information/search-fda-guidance-documents/general-principles-software-validation (accessed
December 1, 2019).
136
Handbook of Usability and User Experience
Woods, D., and Hollnagel, E. 2006. Joint Cognitive Systems: Patterns in Cognitive Systems
Engineering. Boca Raton, FL: Taylor & Francis/CRC Press.
Woods, D., and Roth, E. 1988. Cognitive Systems Engineering. In M. Helander (ed.),
Handbook of Human-Computer Interaction, 3–43. Amsterdam: North-Holland.
Woods, D. D. 1988. Coping with Complexity: The Psychology of Human Behaviour in
Complex Systems. In L. P. Goodstein, H. B. Andersen, and S. E. Olsen (eds.), Tasks,
Errors, and Mental Models, 128–148. London: Taylor & Francis, Inc.
Zahabi, M., White, M., Morejon, O., Zhang, W., Swangnetr, M., and Kaber, D. B. 2016,
21–24 May. A Usability Evaluation of Electronic Medical Record Interface Design.
Proceedings of the 2016 Industrial and Systems Engineering Research Conference,
eds. H. Yang, Z. Kong, and M. D. Sarder.
9
Considering Users’
Experience in the Design
of Animated Instructions
for Medicines Usage
Listening to Patients and
Health Professionals
Carla Galvão Spinillo
CONTENTS
9.1
9.2
9.3
Introduction .................................................................................................. 137
Aspects of User Experience (UX) ................................................................ 139
A Study on Animations about Procedures for Medicines Usage ................. 142
9.3.1 Study with Health Professionals and Patient/Users.......................... 143
9.4 Summary of the Results of the Interviews with Health Professionals
and Users ...................................................................................................... 143
9.5 The Design of Animations About Medicine Usage...................................... 145
9.6 Users’ and Health Professionals’ Assessment of the Animations ................ 145
9.7 Summary of the Results of the Study with Users......................................... 146
9.7.1 Understanding the Animations and Performing Simulated
Tasks: Comparing the Results of the Two Studies ........................... 148
9.8 Summary of the Results of the Study with Physicians and Pharmacists ..... 149
9.9 Conclusions and Final Considerations.......................................................... 149
Acknowledgments.................................................................................................. 151
References.............................................................................................................. 151
9.1 INTRODUCTION
Instructional animation is considered a valuable resource for representing contents in many felds. It allows visualization of abstract concepts/processes and
of things that cannot be easily seen in the real world (e.g., interior of the human
body). In order to design effective instructional animations, Mayer (2019, 2020)
proposes the following three goals: reduce extraneous processing; manage
DOI: 10.1201/9780429343490-11
137
138
Handbook of Usability and User Experience
essential processing and foster generative processing. Extraneous processing
is usually caused by poor information design which uses unnecessary elements
in the animation (e.g., decorative images, background music). The instructional
goal of managing essential processing refers to the use of complex contents
that require greater cognitive effort. To facilitate cognitive processing, both the
media and the way a content is structured should be taken into account in the
design of animations. Lastly, the goal of fostering generative processing refers
to the aspects of social behavior to be considered in order to achieve greater
engagement between users and the instructional animations. To reach those
goals, Mayer (2019, 2020) recommends six instructional principles. He considers these principles essential for information design, particularly for the design
of instructional animations:
1. Principle of Coherence: present elements which convey instructional content only;
2. Indication or Signaling: highlight key information on narration and/or on
screen;
3. Segmentation: structure contents in parts relevant to learners;
4. Personalization: use language in a conversational style rather than a formal or technical style;
5. Embodiment: use gestures, movements, facial expressions and eye contact
when instructors are on screen; otherwise, use human hand for drawing and
pointing and/or frst-person perspective; and
6. Spatial contiguity: present related elements next to each other (e.g., words
as labels in parts of graphics).
It is worth mentioning that in previous studies (Mayer & Moreno, 2002) the principle of spatial contiguity is presented as part of the contiguity principle which also
includes temporal contiguity. This refers to the simultaneous presentation of words
and images in animations to enhance learning. In this sense, words should be presented as narration rather than a text on screen, which is referred to as the modality
principle (Mayer & Moreno, 2002).
The above-mentioned goals and principles for designing instructional animations have been employed in both analytical and empirical studies in the health feld.
For example, Almeida et al. (2014) employed these goals and principles to evaluate
the animations about the digestive system used in distance learning courses. Their
results indicated defciencies in the representation of contents, such as the use of
on-screen text rather than narrations, which contradicts the principle of modality.
Similarly, Lima et al. (2019) identifed problems in the animations about clinical
cases used for training health professionals. They found that these animations were
not in accordance with the principles of Coherence and Signaling as they contained
unnecessary elements and did not highlight relevant instructional contents. The
authors also state that the weaknesses in the animations analyzed might demand a
greater cognitive effort from the health professionals and this may negatively affect
their learning experience.
Animated Instructions for Medicines Usage
139
Although the goals and principles mentioned herein do not explicitly take into
account the learner/user’s experience (UX), observing them in the design process
may signifcantly enhance the learning experience.
9.2
ASPECTS OF USER EXPERIENCE (UX)
The literature on user experience (UX) is comprehensive, embracing services, products and digital artifacts, such as instructional animations. Hassenzahl (2013) considers that UX occurs at three levels: in the actions that the user can perform in the
interaction with an artifact/product (what), in the way that user interacts (how) and in
the users’ motivation to use/interact with an artifact (why). The latter relates to users’
goals when interacting with an artifact. With similar concern, Lowdermilk (2013)
states that users seek engaging and pleasurable experiences in their interaction with/
use of artifacts, which they see as the means to achieve their objectives. For instance,
in the health feld, medical students could use animations with a view to learning
how to perform a medical procedure.
Moreover, the expectations of users and how satisfed they are with the representation of contents in instructional animations may also be considered as part of
their learning experience. This experience must be positive and motivating, so as to
achieve the instructional aims. Considering aspects of UX in the design process is,
therefore, crucial. In this sense, Garrett, in his seminal work The Elements of User
Experience (2011), identifes fve planes in the design of digital artifacts which he
believes can produce positive experiences in users: the strategy, the scope, the structure, the skeleton and the surface planes. These are bottom-up orientation planes on
a continuum that goes from abstract (strategy plane) to concrete (surface plane), each
plane being grounded on the previous one.
The strategy plane is related to the needs of users and the objectives of the artifact
that must meet the demands of users. The scope plane refers to the features of the
digital artifact, the functional specifcations and requirements of the content which
are essential to meet the needs of users identifed on the previous plane. The structure plane organizes and integrates the features and functionality of the artifact,
establishing the interaction between design and information architecture. These are
then embodied in the navigation elements that are arranged on the skeleton plane,
along with elements of interface design and information design, resulting, for example, in wireframes of Web sites and apps. Finally, the surface plane, the most concrete plane of the continuum, is where the sensory experience (visual, auditory and
tactile) of users occurs through the graphic interface. Garrett’s fve planes (2011) are
also relevant to the design of instructional animations, particularly when the animations have interaction and use navigation resources.
Also concerned with the importance of UX in the design of artifacts, Morville
(2004) proposes seven qualities which he believes can promote meaningful and positive user experience: to be useful, usable, fndable, accessible, desirable, credible
and valuable. Morville employs the visual metaphor of a honeycomb to present these
qualities. The quality of being useful refers to how helpful the artifact is to users in a
functional sense, which, according to Morville, requires creative solutions from the
140
Handbook of Usability and User Experience
designer. The quality of being usable refers to the usability aspects that should be
considered, such as navigation and interaction design. The quality of being fndable
is related to how easy it is for users to locate the elements of the interface to access
contents. The quality of being accessible regards features that allow people with disabilities to effectively use the artifact. It is worth noting that ensuring accessibility
to artifacts and services is already regulated by law in many countries, thus being a
mandatory requirement. The quality of being desirable alludes to emotional/affective aspects that meet the aesthetic expectations and values of users. For Morville
(2004), this quality is associated with users’ appreciation for a brand. The trust and
beliefs that users associate with the artifact (and/or its source/brand) constitute the
quality of being credible. Finally, an artifact must be valuable. Morville (2004) considers the quality of being valuable as the central quality of UX, to which the other
qualities are to converge. Hence, for an artifact to have value for users, it must be
useful, usable, desirable, fndable, accessible and credible.
Spinillo et al. (2019), in a study on users’ experience with an authoring tool for
designing e-books, classify the qualities proposed by Morville (2004) as of two
types: extrinsic to users and intrinsic to users. The qualities extrinsic to users are
objective qualities within the scope of the artifact design (e.g., interface features),
whereas the qualities intrinsic to users are subjective, within the affective/emotional
scope, as well as related to values and expectations of users in relation to the artifact. In this way, the authors consider being usable, useful, accessible and fndable
as qualities extrinsic to users, and being desirable, credible and valuable as qualities
intrinsic to users (Figure 9.1).
Both Morville’s (2004) and Garrett’s (2011) approaches to the design of artifacts
aim at promoting meaningful user experience. In this regard, it is possible to relate
the extrinsic and intrinsic qualities of the UX Honeycomb to the fve planes of the
design of digital artifacts. The intrinsic qualities that make an artifact desirable
and credible to users, such as users’ expectations and beliefs, would be found on
the strategy plane. These qualities would defne the purpose of the artifact and the
demands it should meet. It is worth highlighting that the quality of being credible
FIGURE 9.1 Extrinsic and intrinsic qualities regarding the UX Honeycomb. Source: Based
upon Morville (2004).
Animated Instructions for Medicines Usage
141
FIGURE 9.2 Diagram relating extrinsic and intrinsic qualities of the UX Honeycomb
with the fve planes for the design of digital artifacts. Source: Based upon Garret (2011) and
Morville (2004).
is subjective as it refers to how much users trust a source/brand. In other words, the
level of credibility of the artifact varies according to the subjective perception of the
user. For example, a healthy eating Web site set up or managed by a company that
sells ultra-processed (non-heathy) foods may have its credibility questioned by users/
consumers.
On the other hand, the scope, structure and skeleton planes would accommodate the extrinsic qualities of being useful, usable, accessible and fndable. This is
because these qualities encompass the tangible aspects of interaction and navigation design, as well as information architecture, which are all considered on these
planes, together with the functional requirements of the content of digital artifact.
Finally, the surface plane embraces the quality of being valuable to users. Figure 9.2
shows the proposed relations between the fve planes and the seven qualities of the
UX Honeycomb. The color gray is used for the extrinsic qualities and blue for the
intrinsic qualities, and the thin lines link the planes to the relevant honeycomb units.
In the context of procedural animations, the UX qualities and the planes are
equally important to the creation of positive experience. For example, an interactive
animation about procedures for preventing the COVID-19 pandemic produced by
the Ministry of Health of a country would have the quality of being credible with
respect to the source of the information, as well as desirable (related to the strategy
plane). It would also be useful for the population to learn about preventive actions/
behaviors. If the animation presents an effective interaction design and interface
design, and it follows universal design principles, it would also possess the qualities
of being usable, fndable and accessible to people with disabilities. These are qualities related to the scope, structure and skeleton planes in the design process of the
animation. Finally, as a result, the animation about procedures for preventing the
COVID-19 pandemic would be valuable (related to the surface plane) as an instructional resource in health, and would possibly produce a positive UX, aiding users to
142
Handbook of Usability and User Experience
FIGURE 9.3 Screenshots from animation about breastfeeding procedures addressed to
mothers infected with coronavirus by Allisson D. Menezes and Heloisa P. Machado (2020).
perform the steps correctly. Figure 9.3 shows an example of a procedural animation
for preventing the spread of COVID-19. The animation is aimed at breastfeeding
mothers who are infected by the coronavirus and shows how they can keep their
babies protected from COVID-19 while breastfeeding. Figure 9.3 shows a sequence
of print screens from the animation. The animation content is from instructional
material issued by a local health authority in Brazil, and it was designed by students
from the Federal University of Paraná State in accordance with UX and information
design principles and guidelines.
It is worth highlighting that the dynamic character of animations allows for a more
realistic depiction of steps/actions. It facilitates the visualization and understanding
of the information presented and can support users’ task performance. Thus, procedural animations should be useful resources for the promotion of acuity in users’
action plan for carrying out steps (Höffer & Leutner, 2007; Ainsworth 2008).
9.3
A STUDY ON ANIMATIONS ABOUT
PROCEDURES FOR MEDICINES USAGE
On the assumption that animations representing instructions can promote a positive
UX, a study on the effectiveness of animations to convey information about the use
of medicines was conducted in Brazil. The study aimed to propose recommendations for the design of animations focused on user-patients and took into account
the views of health professionals and the mandatory information provided in PILs
(patient information leafets). With that in mind, the contents of the animations were
taken from the PILs of medicines provided on the portal of the Brazilian Ministry
of Health, ANVISA (www4.anvisa.gov.br/BularioEletronico/). Initially, a study on
the perception of the importance of the information provided in medicines leafets
was conducted with users, physicians and pharmacists. Then, based upon the results
of this initial study, prototypes of animations on medicines usage were produced for
Animated Instructions for Medicines Usage
143
testing. Lastly, a further study was carried out to verify how effective the animations
produced were, and how satisfed users, physicians and pharmacists were with them.
These studies are briefy described next.
9.3.1
STUDY WITH HEALTH PROFESSIONALS AND PATIENT/USERS
A study was conducted to verify how important the information provided in the PILs
was for health professionals and patients/users of medications. The study consisted
of a semistructured interview with 120 participants, with N = 80 medicine users and
40 health professionals (N = 20 physicians and N = 20 pharmacists). The participants
were asked to rank the level of importance of the following nine types of information provided in PILs: (a) dosage; (b) adverse reactions/side effects; (c) how to use the
medicine; (d) indication (what it is for); (e) medicine interaction; (f) components of
the formula; (g) contraindication; (h) overdose and (i) warnings.
9.4 SUMMARY OF THE RESULTS OF THE INTERVIEWS
WITH HEALTH PROFESSIONALS AND USERS
Overall, the results indicate little agreement between physicians, pharmacists and
users regarding the importance given to the different types of information in PILs.
The results also suggest that there is more concurrence between pharmacists and
users than between physicians and users. This may have implications for physician–
patient communication regarding information on medicines. However, this aspect is
beyond the scope of this investigation. It is worth noticing that none of the participants considered all nine types of information in their rankings. Users and physicians considered eight types of information and pharmacists, seven. “Components
of the formula” was disregarded by all three groups of participants, this probably
being due to the technical nature of such information. In addition, information on
“overdose” was not ranked by physicians and pharmacists, “drug interaction” was
only ranked by pharmacists and “warning” was only ranked by users. Participants
also differed in the number of hierarchical levels they used to rank the information.
Physicians and pharmacists used fve levels of hierarchy when ranking the information provided in PILs, while users made use of seven levels. This may indicate that
users consider having more types of information about medicine usage more valuable than physicians and pharmacists do.
Table 9.1 shows the hierarchical position assigned by each group of participants
and where there is agreement. When participants assign the same level of importance to different kinds of information, these are presented within the same cell
in the table, for example, “warnings” and “indication” were both ranked third by
physicians.
“Dosage” was the only type of information provided in PILs to be considered
as the most important by all three groups of participants. This suggests a common
concern about the quantity and frequency of medicine usage and a general consensus
that it is crucial for the effcacy of health treatment. Dosage errors may not only jeopardize the treatment, but can also be fatal. It is important to stress that information
144
Handbook of Usability and User Experience
TABLE 9.1
Order of Importance Assigned by the Participants to the Information in the
Package Leafet
Order
Physicians/Doctors (8 types)
Pharmacists (7 types)
Users (8 types)
1st
Dosage
Dosage
Dosage
2nd
How to use the medicine
Indication (what the
medicine is for)
Contraindication
3rd
Adverse reactions/side effects
Warnings
Adverse reactions/side
effects
Adverse reactions/side
effects
4th
Indication (what the medicine
is for)
Drug interaction
How to use the
medicine
How to use the
medicine
5th
Contraindication
Medicine formula
Medicine formula
Indication (what the
medicine is for)
Contraindication
Warnings
6th
Drug interaction
Medicine formula
7th
Overdose
on medication dosage should also be provided by doctors through prescriptions to
patients. Prescriptions to patients, however, do not provide information on how to use
the medicine; this type of information is provided only in the PILs. Such information
is of great relevance to users, as they need it to carry out the steps for using/taking
medicines correctly. The importance of this type of information is acknowledged
by the physicians, who ranked it second. However, pharmacists and users ranked
“how to use medicine” fourth. These results suggest that users as well as pharmacists
consider procedures for medicine usage as something intuitive and/or easy to carry
out, which seems to be a misperception about the complexity of medicine usage (e.g.,
Spinillo et al., 2011; Spinillo, 2016, 2017; Waarde, 2004, 2019).
Similarly, the results of the study also show that participants attach little importance to “warnings” about medicine usage, although this type of information plays
an important role in preventing errors in task performance (e.g., Wogalter, 2006).
Warnings were ranked third by physicians, ffth by pharmacists (last position) and
not ranked at all by users. These results seem to indicate that all three groups have
little or no concern about possible errors and/or risks of medicines use.
The data provided by the interviews greatly contributed to the understanding of
how pharmacists, physicians and users perceive the information provided in PILs.
This study made it possible to identify what information should be considered in the
animations about medicine usage. The related literature was also taken into account
and it is summarized below.
Animated Instructions for Medicines Usage
9.5
145
THE DESIGN OF ANIMATIONS ABOUT MEDICINE USAGE
The prototypes of the animations conveyed procedures for medicines usage and
differed in their pharmaceutical presentation for users: (a) nasal spray, (b) inhaler
(asthma pump), (c) injection and (d) vaginal cream. A vaginal cream presentation
was chosen because it has been shown that users have diffculties in task performance when using this format (Spinillo, 2017).
The animations followed the principles and design strategies proposed by Mayer
(2019, 2020). Thus, they presented only the elements relevant to the content: graphic
emphasis on keywords on screen, which were positioned near the animations to
which they referred; content represented in audio and animated images; narration synchronized with animation. The contents of the animations about medicine
usage were divided into introduction, steps, closing content and disposal information. Human voice and a conversational style were used for the narration in the
animations.
The design process was based on the fve planes proposed by Garrett (2011),
starting from the bottom and moving upward: strategy, scope, structure, skeleton
and surface. The strategy plane considered the information needs of the pharmacists, physicians and main users (stakeholders). The scope plane outlined the
contents of the animations in accordance with the Brazilian PILs for each type
of medicine (nasal spray, inhaler, injectable and vaginal cream). When necessary,
warnings were also included. The structure and skeleton planes were developed
together. This was because the animations would not require navigation or interaction design as they would make use of the functionalities available in the video
viewing software (e.g., QuickTime, YouTube). The structure of the animations was
as follows: (1) introduction (hygiene, inventory); (2) steps; (3) closing (indication of
completion of the task); (4) disposal. Finally, the surface plane provided the graphic
interface of the animations. Figure 9.4 shows examples of the structures of the animations and their screens.
The procedural animations about the four types of medicines were evaluated so
as to establish how easily understood and how useful they were to users. How satisfed pharmacists, physicians and users were with the design and contents of the
animations was also assessed, and this is briefy discussed next.
9.6
USERS’ AND HEALTH PROFESSIONALS’
ASSESSMENT OF THE ANIMATIONS
A study was carried out to evaluate the animations. The study examined how effective the animations were in helping users to understand how the medicine should be
used, and how to perform the simulated tasks for each of the medicines. The study
also looked into how satisfed users, physicians and pharmacists were with the representation of the procedures in the animations. The health professionals were not
required to participate in the comprehension and task performance tests, given their
knowledge about medicine usage. A total of 120 participants took part in the study
and were divided into two independent samples: N = 80 users and N = 40 health
professionals (N = 20 physicians and N = 20 pharmacists).
146
Handbook of Usability and User Experience
FIGURE 9.4 Examples of the structures of the animations and their screens.
The users were equally divided into two groups: (a) comprehension test (N = 40,
10 participants per animation) and (b) medicine usage-simulated task (N = 40, 10
participants per animation). It is worth noting that the animation about the use of
vaginal cream was assessed by female participants only, due to the nature of the task.
Participants assessed the animations individually, and then took part in a semistructured interview. Due to the limited number of participants per animation, the results
were analyzed qualitatively. However, fgures were considered to indicate possible
trends in their responses. Table 9.2 shows the distribution of participants in this study.
9.7 SUMMARY OF THE RESULTS OF THE STUDY WITH USERS
The overall results of the study with users indicate that most users fully or partially
understood the animations about medicines usage and performed the simulated tasks
satisfactorily. All 80 participants (N = 40 comprehension and N = 40 simulated tasks)
agreed that both narration and animation helped them to understand and perform the
tasks, which is in accordance with the Cognitive Theory of Multimedia Learning
(Mayer, 2019, 2020).
Regarding participants’ understanding of the animations, the results show that all
participants (N = 40) felt that they fully understood and were satisfed with the animations of how to use the medicines, suggesting a positive UX. For instance, eight
out of ten participants fully understood the step “breathing through the mouth after
spraying” in the animation of how to apply the nasal spray.
On the other hand, when participants were asked to explain the task represented in
each animation, most participants failed to mention some of the steps. This occurred
147
Animated Instructions for Medicines Usage
TABLE 9.2
Distribution of Participants in the Studies
Users
Animation
Group (a)
Understanding
Group (b)
Simulated task
Vaginal cream
10
10
20
Insulin injection
Nasal spray
Inhaler
Total
10
10
10
40
10
10
10
40
20
20
20
80
Total
Satisfaction
Animation
Doctors
Pharmacists
Users
Vaginal cream
Insulin injection
Nasal spray
Inhaler
05
05
05
05
05
05
05
05
20
20
20
20
Total
20
20
80
with the animation of how to inject insulin, where most participants did not mention
the step showing the correct manner to compress the skin (n = 7 out of 10 participants) or the step showing the correct angle of the syringe needle for injecting insulin
(n = 8 out of 10 participants). Similarly, in the animation of how to use a nasal spray,
the steps “tightening the nasal spray bottle” and “lowering the head when spraying
the medicine” were overlooked by almost all participants (n = 9 out of 10). Although
these results do not explain why participants omitted these steps in their responses,
they seem to suggest that participants either did not fully grasp the meaning of the
steps or considered the steps to be irrelevant to the task and, therefore, not worth
mentioning. In either case, this would almost certainly affect participants’ success
in carrying out the steps.
As for the simulated tasks for using the medicines with the aid of the animations, the
results show that all 40 participants completed the tasks, and that the majority carried
out most of the steps correctly. Similar to the results of the comprehension study, the
results also show that, although participants felt that they had successfully performed
the tasks, some of them were not aware of their diffculties with certain steps.
In the simulated use of the nasal spray, nine out of the ten participants made
mistakes when carrying out the following steps: shaking the bottle before using
the medicine, positioning the bottle correctly so as not to touch the nose bone
(Figure 9.5) and lowering the head before spraying the medicine. In the simulated use of the inhaler, most participants (N = 7 out of 10) skip the following
steps: shaking the inhaler bottle before using it, pressing the bottle lid to release
the medicine, exhale air from the lungs before inhaling, and hold your breath for
148
Handbook of Usability and User Experience
FIGURES 9.5 (a and b) Screenshots of the steps showing the angled positioning of the
bottle of the nasal spray and how to press the inhaler to release the medicine.
10 seconds when inhaling (Figure 9.5). Errors also occurred in the simulated use
of the insulin injection. Most participants did not measure the glucose level prior
to the task (N = 7 out of 10). In addition, fve participants did not perform the following two steps correctly: rubbing the insulin bottle in between the hands and
positioning it correctly to remove the insulin with the syringe. The overall results
of the follow-up interviews also show that participants did not seem to pay much
attention to the hygiene procedures, or to the inventory contents presented in the
animations they saw before performing the tasks, since these were not mentioned
in their responses.
9.7.1
UNDERSTANDING THE ANIMATIONS AND PERFORMING SIMULATED
TASKS: COMPARING THE RESULTS OF THE TWO STUDIES
On the whole, participants performed better in the comprehension study than in the
task performance study. This suggests that understanding an animation about medicine usage does not necessarily lead to success in task performance.
Despite these rather disappointing results in both understanding the animations
study and carrying out the tasks, all 80 participants felt that they had fully understood the animations and had successfully performed the tasks. They also thought
that the animations satisfactorily conveyed how to use the different medicine forms:
nasal spray, insulin injection, inhaler and vaginal cream. These results indicate participants’ misperception of their understanding of the animations and of their task
performance, since they did not seem to be aware of the diffculties they had. Thus,
it can be concluded that there seems to be a gap between understanding and performance regarding animations about medicines usage.
In addition, the fact that participants failed to mention the inventory contents
and the hygiene procedures suggests that this may be due to such contents not
being steps, that is, they are not procedural contents. This seems to reveal that
different types of content in animations play a different role in how participants
describe and understand task representations. This aspect, however, is outside the
scope of this study.
Animated Instructions for Medicines Usage
149
9.8 SUMMARY OF THE RESULTS OF THE STUDY
WITH PHYSICIANS AND PHARMACISTS
Overall, the results of the study with physicians and pharmacists show that there was
agreement between these two groups of health professionals regarding how satisfed
they were with the animations representing the use of a nasal spray, insulin injection,
inhaler and vaginal cream. Physicians (N = 20) and pharmacists (N = 20) both found
the animations to be simple and clear, and their content adequate to the context of
usage of each medicine type. The amount and sequence of information for the tasks,
the interaction features and the visualization of the steps in the animations were also
considered satisfactory by these health professionals.
For three of the medicine types, namely, nasal spray, insulin injection and vaginal
cream, pharmacists showed a higher level of satisfaction with the animations compared to physicians. They were more satisfed with the animation of how to use the
inhaler. Among the aspects considered, the ease of interaction in the animations had
the highest incidences in responses. On the other hand, the interest of health professionals in using animations with patients showed the lowest number of responses,
although in general these were positive. These results suggest that physicians and
pharmacists seem to be reluctant to employ animation to explain medicine usage to
their patients, despite declaring themselves favorable to and satisfed with the animations presented to them.
Regarding how these health professionals viewed and were satisfed with each
one of the animations, physicians and pharmacists differed in their opinions as no
agreement was found in their responses. It is worth noting that whereas the animation of how to use an inhaler was ranked frst by physicians, it was ranked last by
pharmacists, who ranked frst the animation about insulin injection. The reasons for
those responses were not provided by the participants.
9.9
CONCLUSIONS AND FINAL CONSIDERATIONS
Overall, the results suggest that the participants (users and health professionals) considered their experience with the animations about the application of insulin injection and vaginal cream and the use of inhaler and nasal spray positive. To a certain
extent, this aligns with Lowdermilk’s thoughts (2013) about engaging experiences in
the interaction with artifacts which meet users’ goals. It can also be inferred that the
way users and health professionals perceive and interpret their experiences—which
in this study was positive despite the diffculties—is infuenced by the way the contents in the animations are represented. This idea meets the instructional principles
and goals mentioned earlier (Mayer, 2019, 2020). This positive perception seems to
corroborate the post by Hassenzahl (2013): not only “what,” but also “how” should
be considered in the representation of contents, in this case, procedural animations
about medicines usage.
It is noteworthy that the results of the study with users suggest that the diffculties
identifed in the understanding of the animations and performance of the simulated
tasks did not negatively affect users’ level of satisfaction with the animations. This
150
Handbook of Usability and User Experience
indicates a possible correlation between satisfaction and perception of performance:
an aspect which deserves further inquiry, but which is beyond the scope of the present investigation. Despite the diffculties encountered by some of the users, the results
related to their understanding of the animations and their level of satisfaction with
them seem to be aligned with the literature on the benefcial effects of animation
on motivation and on visualization of procedures (e.g., Lowe, 2019; Spinillo, 2016).
Regarding the design of the animations about medicines usage, considerations
can be made about the use of the planes proposed by Garret (2011) and the UX
qualities proposed by Morville (2004). The planes of strategy, scope, structure,
skeleton and surface proved to be helpful in the production of the animations,
enabling the inclusion of aspects related to the stakeholders (doctors and pharmacists, and users) aligned with the design requirements for visual representation of
the animations.
As for the UX qualities proposed by Morville (2004), the results of the abovementioned study on medicines usage seem to corroborate the pertinence of these
qualities to the design of procedural animation in health, particularly the quality
of being “useful.” Overall, participants’ responses (users and health professionals)
indicated that the animations were simple, and their interaction features were easy to
locate, thus having the qualities of being fndable and usable as a multimedia informational resource. The level of satisfaction of the participants with the visual design
of the animations suggests that the animations present the quality of being desirable.
Since the contents of the animations are from medicine inserts made available by the
Ministry of Health, the animations have credibility. The combination of these qualities allied to participants’ (mis)perception of their performance lead to infer that participants valued the animations about medicines usage that they saw. Nevertheless,
the actual value of the animations with regard to aiding in the usage of medicines
can be questioned when considering the results related to content understanding and
participants’ task performance. These indicated that the animations were not as useful as expected. The reasons why participants left out some of the steps when performing the tasks, and for the errors they made when carrying out some of the steps
revealed that the animations on medicines usage were not fully understood nor did
they fully support the tasks. Therefore, the usefulness of the animations was jeopardized. Considering this, it is reasonable to conclude that the quality of being useful is
a key quality in the design of procedural animations, especially when they represent
health-related tasks.
Moreover, the results seem to indicate that how users perceive and value their
experience with procedural artifacts should be distinguished from the actual value of
their task performance. This is particularly of relevance to procedures in the health
area, due to the consequences these procedures have to patients’ medical treatments
and well-being.
To conclude, it should be highlighted that the animations about medicines usage,
even those whose design meet the principles of the Cognitive Theory of Multimedia
Learning and the fve-plane approach to UX, posed diffculties for participants,
both when understanding the animations and when carrying out some of the steps
of the task. These diffculties were only identifed in empirical studies with users
Animated Instructions for Medicines Usage
151
performing tasks mediated by the animations. Accordingly, this study contributes
to the literature on procedural animation by pinpointing evidence-based concerns
about the effects of UX on the effectiveness of animations about medicines usage.
ACKNOWLEDGMENTS
Thanks are due to CNPq—National Council of Research and Development of the
Ministry of Science and Technology of Brazil for funding the research project.
The author is also grateful to Amanda Gomes, Larissa Yumi, Tatiane de Jesus and
Elissandra Pereira for their help with the feld study and with the production of the
animations. Thanks are also due to Leandro Albuquerque for designing the illustrations, and to all the participants who volunteered for this study.
REFERENCES
Ainsworth, S. 2008. How do animations infuence learning? In Perspectives on Cognition,
Learning, and Instruction: Recent Innovations in Educational Technology that
Facilitate Student Learning, eds. D. Robinson and G. Schraw, 37–67. New York:
Information Age Publishing.
Almeida, R. R., Chaves, A. C. L., Coutinho, F. A., and Araújo Júnior, C. F. 2014. Avaliação de
objetos de aprendizagem sobre o sistema digestório com base nos princípios da Teoria
Cognitiva de Aprendizagem Multimídia. Revista Ciência & Educação, 20(4): 1003–
1017. doi: 10.1590/1516-73132014000400015
Garrett, J. J. 2011. The Elements of User Experience: User-Centered Design for the Web and
Beyond. 2nd ed. New York: AIGA New Riders.
Hassenzahl, M. 2013. User experience and experience design. http://www.interaction-design
.org/encyclopedia/user_experience_and_experience_design.html (accessed November
2020).
Höffer, T. N., and Leutner, D. 2007. Instructional animation versus static pictures: A metaanalysis. Learning and Instruction, 17: 722–738.
Lima, C. S. C., Spinillo, C. G., Assis, K. M. M., Vital, V. A., Aquino, I. F. O., and Oliveira, A.
E. F. 2019. Análise dos elementos gráfco – informacionais das animações educacionais
em Saúde na Educação a Distância (EaD). Revista InfoDesign, 16(3): 401–418.
Lowdermilk, T. 2013. User–Centered Design: A Developer's Guide to Building UserFriendly Applications. Sebastopol, CA: O'Reilly & Assoc.
Lowe, R. K. 2019. Designing animated information graphics: Challenges and opportunities.
Information Design Journal, 25/3: 300–306. Amsterdam: John Benjamins Publishing
Company. doi: 10.1075/idj.25.3.07low
Mayer, R. E. 2019. Instructional design as a form of information design. Information Design
Journal, 25(3): 258–263. Amsterdam: John Benjamins Publishing Company. doi:
10.1075/idj.25.3.03may
Mayer, R. E. 2020. Multimedia Learning (3rd ed.). Cambridge: Cambridge University Press.
doi: 10.1017/9781316941355
Mayer, R. E., and Moreno, R. 2002. Animation as an aid to multimedia learning. Educational
Psychology Review, 14: 87–99. doi: 10.1023/A:1013184611077 (accessed November
2020).
Morville, P. 2004. User experience honeycomb. [Web Log Post] Retrieved from http://semanticstudios.com/publications/semantics/000029.Php, 21: 09–12 (accessed November
2020).
152
Handbook of Usability and User Experience
Spinillo, C. G. 2016. Animation on how to take medicines: A study of electronic patient
leafets in Brazil. In DUXU Design, User Experience, and Usability: Novel User
Experiences. 1st ed., ed. A. Marcus, II: 647–654. New York: Springer International
Publishing.
Spinillo, C. G. 2017. Using animation to help communication in e-PILS in Brazil. In
Information Design: Research and Practice. 1st ed., eds. Alison Black, Paul Luna, Ole
Lund, Sue Walker, 1: 701–714. London: Routledge- Taylor and Francis.
Spinillo, C. G., Reis, E. T. S., de Oliveira, A. E. F., Rabelo Júnior, D., de C. e Lima, C. S., and
de Assis, K. M. 2019. Interaction testing on using an E-Book authoring tool: A case
study of the SaiteBooker (UNA-SUS/UFMA, Brazil). In Design, User Experience, and
Usability. Application Domains. HCII 2019. Lecture Notes in Computer Science, eds.
Marcus, A. and Wang, W., vol 11585. Cham: Springer. https://doi.org/10.1007/978-3
-030-23538-3_37
Spinillo, C. G., Souza, J. M. B., Storck, G. R., and Pottes, A. 2011. Alguns aspectos sobre
os modos de representação e o processamento da informação em instruções visuais
animadas. In Anais do XI Congresso Internacional de Ergonomia e Usabilidade
de Interfaces e Interação Humano-Computador. Manaus: Universidade Federal do
Amazonas.
Waarde, K. 2004. Visual information about medicines: Providing patients with relevant
information. In Selected Readings of the Information Design International Conference
2003, eds. Spinillo, C. G and Coutinho, S. G., 81–89. Recife: SBDI-Sociedade Brasileira
de Design da Informação.
Waarde, K. 2019. Information about medicines in Europe: Considering possible principles?
Information Design Journal, 25(3): 307–313. Amsterdam: John Benjamins Publishing
Company. doi: 10.1075/idj.25.3.08van
Wogalter, M. S. 2006. Handbook of Warnings - Human Factors/Ergonomics. Human Factors
and Ergonomics Series, ed., New York: Lawrence Erlbaum Associates.
10
Getting the Beneft
from Connecting Health
Apps to Complex
Healthcare Systems
Ken Eason, Adam Hoare and
William Maton-Howarth
CONTENTS
10.1 Introduction .................................................................................................. 154
10.2 A Digital Application to Screen for Atrial Fibrillation (AF) ....................... 155
10.2.1 The Digital Application .................................................................... 155
10.2.2 The Plan............................................................................................ 155
10.2.3 The Implementation and the Result.................................................. 156
10.2.4 The Revised Plan .............................................................................. 157
10.2.5 Discussion......................................................................................... 157
10.3 A Digital Application for the Management of Outpatient
Appointments................................................................................................ 157
10.3.1 The Digital Application .................................................................... 158
10.3.2 The Plan............................................................................................ 158
10.3.3 The Implementation and the Result.................................................. 159
10.3.4 Discussion......................................................................................... 159
10.4 A Digital System to Deliver General Practitioner Services ......................... 161
10.4.1 A Disruption Approach to General Practice Services...................... 162
10.4.2 The Digital Application .................................................................... 162
10.4.3 The Implementation Plan.................................................................. 162
10.4.4 The Implementation and the Result.................................................. 162
10.4.5 Discussion......................................................................................... 163
10.5 The Adoption of Digital Applications as Evolutionary Sociotechnical
Systems Change............................................................................................ 164
10.5.1 The Challenges ................................................................................. 164
10.5.2 Meeting the Challenges .................................................................... 166
10.5.2.1 Flexibility in the Digital Application to
Meet the Challenge of a Changing Sociotechnical
System................................................................................ 166
DOI: 10.1201/9780429343490-12
153
154
Handbook of Usability and User Experience
10.5.2.2 A Multidisciplinary Design Team ..................................... 168
10.5.2.3 An Evolutionary Approach ................................................ 168
10.5.2.4 The Tools for the Job.......................................................... 169
10.5.2.5 Passing on the Learning..................................................... 170
10.6 Conclusion .................................................................................................... 171
References.............................................................................................................. 171
10.1 INTRODUCTION
It is estimated that there are now 325,000 digital health applications available to
consumers in the UK (ORCHA 2019), supporting them in everything from exercise
regimes and healthy eating to the management of every kind of health condition
from diabetes to insomnia. Many of these applications are stand-alone: the consumer
can use them to keep a personal check on the exercise they are taking, the calories
they are consuming, etc. However, there is another class of applications that serve
people who have specifc medical conditions and are patients of the health services.
These applications depend for their effectiveness on being connected to healthcare
systems that can, for example, interpret results and provide expert guidance and care.
Applications of this kind have great potential because they can provide new links for
the consumer/patient to healthcare systems and render the expertise of health service
professionals much more accessible. However, to develop an application that gives
a good user experience of interacting with health services is a much more complex
design task than the development of a stand-alone consumer product.
This chapter explores the issues to be addressed if the consumer who is a patient is
to get an effective service from an application that is linked to a complex healthcare
system. There is now an extensive literature that tells the troubled history of getting
digital applications embedded as normal practice in health services. The history of
telehealth applications is one example. Applications that enable a patient in one location to be in visual contact with clinical staff in another location have been available
for many years and have been shown to be of great value to patients who may have
diffculty visiting clinical professionals. However, as evaluations consistently show,
it is proving very diffcult to establish this kind of consultation as a normal part of
health service delivery (May et al. 2003, Polisena et al. 2009) and authors such as
Wyatt (2011) are left asking: “Why does telehealth fail and what can we do about
it?” An extensive randomized control trial of telehealth in the UK (Steventon et al.
2012) failed to reach a defnitive view observing only that there was no conclusive
systemic evidence of benefts despite widespread anecdotal reporting of enormous
beneft to individual patients. There are factors at work that seem to make it diffcult
to translate the manifest benefts of a new digital application, often demonstrated in
early trials and pilots, into sustained and widespread benefts when the application is
disseminated more widely in health services.
In an attempt to elucidate the barriers to the successful adoption of these applications, this chapter will review three health applications that depend for their full
effectiveness on both the digital application available to the consumer/patient and on
the way the application is connected to relevant health service systems. The authors
The Benefts of Health Apps
155
have recently undertaken an evaluation of nine innovations in the English National
Health Service and this included two of the case studies below (NIA 2018). The
cases have been chosen to illustrate three different kinds of health applications that
give rise to different but overlapping sets of issues that have to be resolved if effective
and sustained services are to be delivered to patients.
10.2
A DIGITAL APPLICATION TO SCREEN
FOR ATRIAL FIBRILLATION (AF)
The frst case study is an example of a digital application that can be used as a standalone device that a consumer can use to monitor their own health but in this case is
being used within a health service so that the results can be acted on by healthcare
specialists.
10.2.1
THE DIGITAL APPLICATION
Many people have undetected heart problems that are only identifed when they have
a major problem. A particular example is that people can have undetected disruptions
to their heart rhythms known as atrial fbrillation and this can lead to people having
strokes. Kardia (2019) is a small, mobile digital application that enables a person to
generate their own electrocardiogram (ECG) by simply pressing down on two touch
pads. The system is able to analyze an ECG to detect whether there are abnormalities
in heart rhythms that might indicate AF. Kardia is available as a stand-alone product
and is already in extensive use by people with known heart problems who use it for
regular monitoring. However, it is also possible that it could be used for more general
screening: to use it for people who have no known heart condition but who might be
“at risk.” If early signs of AF can be detected, it should be possible to take action that
would mean the person would not suffer a stroke. That would obviously provide an
enormous beneft to the patient and would probably save the health service the considerable expense involved in providing long-term care for a stroke patient.
10.2.2
THE PLAN
In the southeast of England a trial was set up to use Kardia to screen people over
the age of 65 for early signs of heart disease (NIA 2018). The aim was to locate the
service in pharmacies that patients visit regularly to buy medicines, to seek advice
on medication and to collect medicines prescribed to them by their local General
Practitioners (GPs). If the patient was over 65, they would be offered a free ECG
screening which was a quick and easy procedure. Figure 10.1 shows the overall plan
for the service.
The plan was to undertake the ECG scan and to use the analysis process built-in
to the application to assess whether the heart rhythm was normal or abnormal. The
patient could be informed of the result and, where there were concerns, would be
advised to go and see their General Practitioner. In the event of an anomaly being
detected, the pharmacy assistant would also notify the patient’s General Practitioner
156
FIGURE 10.1
Handbook of Usability and User Experience
ECG screening in a pharmacy.
which was normal procedure in pharmacies if they noted anything of concern about
the patient’s health.
10.2.3 THE IMPLEMENTATION AND THE RESULT
A trial was undertaken to assess whether patients were happy to use Kardia and
whether the pharmacy assistants could capture good quality ECGs that could be
analyzed for anomalies. Many patients were indeed happy and willing to take part in
this process but many of the ECGs were diffcult to analyze and may or may not have
indicated an anomaly. Changes were made to the procedure (e.g., quieter locations
for the screening, more training for the pharmacy assistants) but there remained a
problem in interpreting some of the ECGs. A further problem was identifed when
anomalies were reported to the patient’s GP. Although fully supportive of the purposes of the screening, the GPs felt it was inappropriate to refer the matter of dealing with anomalies to them. They were already overstretched in dealing with an
increasing patient load and they were not equipped to undertake defnitive tests for
heart conditions. It was likely they would not be able to see the patient urgently and,
even then, they would have to refer them to the cardiologists in the local hospital to
assess whether there was an incipient heart condition. The pharmacy staff were concerned on two counts: frst they may be creating anxiety in the minds of the patients
and, second, the delay at the GP surgery may mean the patients would have to live
with the anxiety for a considerable time. Some estimates were that it might be up
to 12 weeks from the time of the screening to an appointment with a cardiologist.
In these circumstances, the pharmacy wondered whether they should abandon what
had seemed a very benefcial service.
The Benefts of Health Apps
10.2.4
157
THE REVISED PLAN
The project team, which included pharmacists, AF specialists and an innovation
testbed, did not want to abandon this benefcial service and they embarked on a wide
consultation to fnd a way forward. A review of the pathway by which anomalous
results would be processed was undertaken and, following consultations with the
cardiology department of the local hospital and the local Clinical Commissioning
Group (that provides the funding for local healthcare), a new system was proposed.
In the new system, the cardiology department would set up a “one-stop clinic” to
receive ECG traces from Kardia for their cardiologists to review for possible AF
or other heart problems. If they considered there might be a problem, they would
arrange an outpatient appointment for the patient at the hospital. This plan was
adopted. A new computer system was introduced that enabled the pharmacy to send
the ECG traces directly to the cardiology department and, when necessary, they
arranged appointments to see the patients. Twenty-one pharmacies took part in a
second trial in which 672 ECG traces were captured and 110 were referred to the
clinic. The clinic concluded that 74 needed no further action and that meant they
invited 36 patients to come for further tests. The process was reduced from a possible
12 weeks to 2 weeks.
10.2.5
DISCUSSION
This example shows clearly that it is not enough for a digital application in this
setting to be able to offer a major health beneft, to be acceptable to patients and
usable by the pharmacy assistants. If the goals of confrming AF and of treating
the patient in question are to be achieved, an acceptable process or “pathway” in
the local healthcare system is also to be created. This is a change in the “sociotechnical system” (Eason 2014, Hoare 2019) by which healthcare is delivered. In
this case, it required the development of a new computer system to transmit ECG
traces from Kardia to the cardiology department and changes not only to the role
of the pharmacy assistants but also to the cardiologists in the local hospital. It was
the realization by the project team that this was not just a technical innovation but
required a revision to the existing sociotechnical system that made this possible. If
a substantial review had not been undertaken and a new sociotechnical plan put in
place, this promising development could have become just another innovation that
did not become embedded in normal practice.
10.3
A DIGITAL APPLICATION FOR THE MANAGEMENT
OF OUTPATIENT APPOINTMENTS
Many people are now actively engaged with the convenience of ordering and managing services using mobile applications. Whether ordering takeaway food, a taxi
or bidding for products in online auctions, the immediacy and interactivity of apps
has been embraced by a wide cross section of the public. In the context of outpatient
appointments, including the problems of “did not attends” (sometimes called DNAs)
158
Handbook of Usability and User Experience
and the need to manage precious resources, it would seem that a digital app that optimized appointment bookings would bring convenience to many people and make
economic sense for hospitals.
It turns out that this particular application, in its requirement to integrate systemically with current ways of working, reveals some of the fundamental challenges of
interoperating technology platforms and the sociotechnical nature of such change.
That is, the successful adoption of such an approach is not just a matter of overcoming the technology challenges of getting different computer-based systems to share
data in a meaningful way. It also requires change in the way that staff interact with
the systems and with patients using them. These challenges can be better understood
through the process by which the DrDoctor platform was adopted.
10.3.1 THE DIGITAL APPLICATION
DrDoctor (2019) is an online and text-based service that allows patients to confrm, cancel and change outpatient clinic bookings digitally. For patients, it
means they have an application that enables them to engage quickly and easily with the outpatient clinics of hospitals to manage their appointments. For
hospitals, the application means they can maximize and manage patient volume to best ft their capacity. The immediacy and interactivity of being able to
offer new appointments and deal quickly with cancellations means that there is
much greater fexibility in setting up and flling additional clinics and canceling clinics that become non-viable. This fexibility is not available using postal
approaches to communication and it reduces the resource-intensive nature of
trading appointments by telephone. Such approaches are therefore benefcial for
targeting long waiting lists and more fexibly managing clinic slots. In addition,
it also provides the potential for digital assessments before and after appointments, saving time for both patients and caregivers.
10.3.2 THE PLAN
Contact between Guy’s and St. Thomas Hospital Trust (GSTT) and DrDoctor began
in 2013 when the General Manager for Women’s Services in Gynecology identifed
the high number of missed outpatient appointments (DNAs). DrDoctor was identifed
as a potential solution. However, the Trust was already underway with a procurement
process for a text-only appointment booking solution, and DrDoctor’s functionality
was broader than the procurement specifcation.
In 2014, the General Manager for Women’s Services developed a short business case that focused on the reduction of DNAs and led to GSTT piloting
DrDoctor in gynecology in 2015. A small amount of funding covered the cost of
the DrDoctor service as well as paying for some IT integration. The pilot provided suffcient evidence that DrDoctor reduced DNAs to justify a broader roll
out across GSTT. At the same time, the Chief Medical Offcer at GSTT saw the
additional potential of DrDoctor to reduce the cost of postage by replacing letters
with electronic communication.
The Benefts of Health Apps
10.3.3
159
THE IMPLEMENTATION AND THE RESULT
The Chief Medical Offcer took the Senior Responsible Offcer Role (SRO) for
the wider deployment of DrDoctor to all outpatient departments in 2016. A project board was assembled, including the SRO, an operations lead and a fnance
lead. The data from the pilot was shared with the hospital general managers
and they were brought into the project board as the rollout occurred across their
department. Each department and IT made funds available to deploy DrDoctor.
Integration with the Patient Administration System (PAS), recruitment of clinical and admin staff and training was overseen by the general managers. The
process involved:
•
•
•
•
Integration with the PAS
Recruitment of staff to oversee and action reporting
Recruitment of 142 super users to maintain content and system settings
Staff training: 224 booking clerks were trained to action patient requests
The level of functionality offered by DrDoctor was directly linked to the ability to
integrate the services with the PAS. Initially the sending out of texts capability of the
DrDoctor system was fully deployed across the hospital.
Dental services had begun to implement the second-stage capability offering
alternative appointments by text. This was due to dental services managing their
own clinics and being somewhat independent of other services in the hospital. This
introduced some workforce challenges as the manual system of calling patients had
to be integrated with the automated alternative appointment offers. This required
a two-phase approach of incorporating all automated data into the PAS before any
manual calls were made.
Much was learned in the early years about the implementation of the DrDoctor
service. For example, early use demonstrated the importance of the accuracy of
clinic codes, consultant codes and data generally. For this reason, GSST became
profcient at data cleansing and accurate management of coding. With around 750
clinic codes alone, this was a signifcant aspect of the smooth working of the system.
This subsystem was run by the Business Support Manager—Dental Directorate in
cooperation with IT.
The PAS was under review during this period and the process of replacing it
would have a direct impact upon the DrDoctor deployment. Hence, the full benefts
of the DrDoctor service would not be realized until a new PAS was in place and the
integration had taken place. This would take several more years pushing out the
realization of the full benefts of DrDoctor to 2022 or later.
10.3.4 DISCUSSION
Technology platforms, when introduced into care delivery, can be particularly challenging where they are not stand-alone but are required to interoperate with current systems, be that technological or workforce. This is complicated further where
160
Handbook of Usability and User Experience
impacted systems are old and may be replaced or where full functionality is dependent upon developing both ends of the interoperability capability. The DrDoctor
implementation is a good example of these challenges. The old PAS was only capable
of supporting the frst stage (texting out) of the DrDoctor capabilities. The requirements for DrDoctor to achieve full functionality provided guidance on the potential
PAS system that could replace the incumbent, older system. In the meantime, the
dental service was able to increase the DrDoctor functionality to include alternative clinic slots offered by text through developing the workforce to provide some
of the interoperability as a manual function tied into the regular clinic management
activity.
Two things are critical in being able to go on this journey:
1. That the management and resource commitment of the customer is longterm enough for the solution to evolve in terms of impact on current systems
and work practices.
2. That the technology supplier is prepared to develop their offer and provide
support for the staged approach which may include work on intermediate
interoperability fxes.
In Section 10.5, we develop a “lock and key” model to describe the way a new technological intervention (the “key”) has to engage with the current sociotechnical system (the “lock”). In this case, the intervention (DrDoctor) was not able, initially, to
deliver all of its capability within the current context of the customer (GSTT in this
case). DrDoctor is a “key” that is trying to ft into the “lock” of the GSTT context.
To get the full beneft of the new technology, both the “key” and the “lock” need
to change through a process of mutual adaptation. In this case, the adaptation of
the GSTT context, notably changing the PAS, could not be done quickly and so the
early use of DrDoctor was limited to “texting out” for most outpatient departments.
Dental services were able to use more of the functionality of DrDoctor because it
did not rely on the existing PAS, but in order to accommodate DrDoctor it had to
make changes to the roles of the clinic staff and to the processes of clinic management. However, over time the goal remains to have DrDoctor ft exactly the context
provided by GSTT such that the optimal functionality can be adopted. The adaptation process is not purely technological, as indicated by the changes to practice in
the dental services clinic management. This model of engagement is very different
to the idea of buying an “off-the-shelf solution” that works in all contexts and is
plug-and-play.
There are two other factors that affected the mutual adaptation between the “key”
(intervention) and the “lock” (the sociotechnical context):
1. Push factors: These are efforts by the technology supplier to make the key
better ft the “lock.”
2. Pull factors: These are efforts by the customer (GSTT) to adopt and engage
with the “key.”
The Benefts of Health Apps
161
In the context of DrDoctor and GSTT, these factors were critical to the level of success achieved:
• Push factors: DrDoctor staff took offces close to GSST in the early days
of the adoption. The location of DrDoctor staff near to GSST assisted in
ensuring that any problems encountered were addressed rapidly with staff
available on-site. DrDoctor staff then engaged with the staged approach to
interoperability with the current PAS recognizing the need to accommodate
a future PAS. They focused on the long-term outcomes sought rather than
the delivery of a specifed technological implementation.
DrDoctor also created a bespoke training regime for each of the different operational roles in GSST that would be affected by the implementation. Each person was trained in a series of practical sessions run by the
DrDoctor team, where the departments were not only shown how to use
the software but how to align their processes with the new system. During
the go-live process, “super users,” i.e., people in GSST already trained and
working in the new way, managed the transition to DrDoctor. Weekly team
meetings were held to feedback on progress and early benefts. By 2019,
discussions were underway for the DrDoctor applications to develop different reports for different operational roles in order for clinic development
management as well as resource management to be greatly improved.
• Pull factors: One of the key enablers was the cooperation between DrDoctor
and lead champions within GSST in collaborating on the embedding of the
technology. This required cooperation with the senior, clinical, operational
and IT functions. This required several people to act as advocates for the
service, primarily the Chief Medical Offcer, the Program Director (Digital
Patient Journey) and the Deputy General Manager (Dental Directorate).
Without this advocacy within the customer, the approach would have lacked
commitment and inevitably withered on the vine.
The other key pull factor is that the lead champions and other key people
in the hospital accepted the need to evolve the solution and engage with a
long-term collaboration.
10.4
A DIGITAL SYSTEM TO DELIVER GENERAL
PRACTITIONER SERVICES
One way in which the suppliers of digital applications can overcome the challenges
of interfacing with the existing sociotechnical systems of current services is to bypass
them, i.e., not just provide a technical solution but offer customers a completely new
service that is based on new technical opportunities. This is the big “disruption” strategy favored by many in Silicon Valley, for example, Amazon disrupts the high street
model of the retail trade by offering online retailing services and Uber offers a completely different taxi service. The two digital innovations described above are to some
extent disruptive of existing services but in a major disruption approach, the technology
162
Handbook of Usability and User Experience
developer creates a complete new service that constitutes radical competition to existing services. If it offers a complete service in which the digital application is an integral
part, the technology supplier has an opportunity to design all the connections between
the application, the social system and other forms of technology itself. It does not have
to deal with the inertia caused by having to change existing systems.
10.4.1 A DISRUPTION APPROACH TO GENERAL PRACTICE SERVICES
The long history of trying to establish digital consultations between GPs and their
patients was described in the introduction to this chapter. Although some progress
has been made, it has proved very diffcult to integrate telehealth conversations
between doctors and patients into the daily procedures of General Practice clinics
that are primarily based on face-to-face consultations. One way of making faster
progress is to offer a new approach to General Practice. In this case, it would be a
General Practitioner service in which digital consultations are the norm and face-toface consultations are only resorted to when necessary. The third case study to be
discussed has taken this approach.
10.4.2 THE DIGITAL APPLICATION
Babylon’s “GP at Hand” service (2019) replaces the traditional GP service in which
patients visit their local GP clinics for face-to-face consultations with a service in
which they frst book a video consultation with a doctor. A video or audio consultation then takes place within an hour or two of the booking. In most instances, this is
suffcient for the patient to be given appropriate medical advice but, if it is necessary,
arrangements can be made for the patient to have a face-to-face consultation with a
doctor at a later date. The patient can access the “GP at Hand” application via their
smartphone and it is available at all hours. It also offers other features such as a
symptom checker that in many instances may provide suffcient advice so that even
a video consultation is unnecessary.
10.4.3 THE IMPLEMENTATION PLAN
The “GP at Hand” service was launched in London in 2017. Although different in
approach to normal GP practices, it was funded by the National Health Service
through the Clinical Commissioning Group in the Borough of Hammersmith, which
is the body responsible for funding GP services in that area. The majority of the
funding for a GP service is per capita: a fxed sum of money is provided for each
patient registered for the service. To use the new service, patients had to deregister
from their existing GP practice and register with “GP at Hand.”
10.4.4 THE IMPLEMENTATION AND THE RESULT
An evaluation of the service in 2019 (Ipsos-MORI 2019) reported a very rapid takeup of the service. The service had 49,000 registered patients by April 2019 and was
The Benefts of Health Apps
163
adding new patients at a rate of 500–1000 per month. It had also contracted a large
workforce of qualifed GPs who were attracted by the fexibility of the job: they
could work part-time from home and choose the hours they worked. The evaluation
showed that the service was very popular with commuters who traveled to London
each day and who found it diffcult to attend GP clinics near their homes during the
working day. They found that, using “GP at Hand,” they could get appointments very
quickly and conveniently compared with the GP appointment procedures they had
been used to. Although most contacts with the service led to video consultations,
many patients used the symptom checker or made an audio-only appointment.
The rapid growth of the service was not, however, without problems. On many occasions the frst consultation revealed the need for a face-to-face consultation and “GP at
Hand” established fve locations across the London area where patients could be seen
by a GP. However, patients found getting an appointment was much slower than for the
initial consultation and it was often inconvenient to get to the location for the face-toface appointment. Many patients who had conditions that required face-to-face appointments concluded they were better served by the traditional GP service and 1 in 4 of the
patients who had registered since July 2017 had de-registered by April 2019.
But a much bigger problem was the disruptive impact the new service was having on the traditional GP services in the London area. Patients were being recruited
by “GP at Hand” from 29 GP services across London and these services found they
were losing patients who were mostly young, well, working-age commuters. These
were patients that GPs tended not to see very frequently and who made very limited
demands on their services. The per capita basis of payment to GPs means that they
rely on having a large number of their registered patients of this kind. They make few
demands on the service and this compensates for the high demand made by the old,
the very young and those with long-term conditions. The loss of many of the “workingage well” patients disrupted the fnancial base of the service: the workload stayed high
but the income decreased. Because of this disruption, there have been calls (Downey
2019a) for “GP at Hand” to be refused a license to offer General Practitioner services.
The company has plans to extend its operations to other major English cities such
as Birmingham and Manchester and the authorities in these cities are looking carefully at the results in London in assessing whether to approve these developments. In
Manchester, for example, there are also concerns that the new service may not be able
to offer patients effective links into other health services such as cancer screening. A
Manchester health authority spokesman (Downey 2019b) reported:
We are not convinced that Babylon’s GP at Hand model of care is suffciently integrated with other local and national services to ensure safe and effective care for local
people. Areas of concern include screening programs and safeguarding.
10.4.5
DISCUSSION
By going beyond being a technology supplier and offering new customer services
based on digital technology, “GP at Hand” has been able to avoid the immediate
problems of integrating the technology with the existing sociotechnical systems in
164
Handbook of Usability and User Experience
GP practices. It has control over the social system, e.g., the roles the GPs play, other
technical systems such as the appointment booking system and the process by which
patients are provided with healthcare. All these aspects of the service can be integrated with the video system. However, the new service still has to interface with the
larger healthcare system that it is part of and problems are emerging on many fronts
as experience of its operation grows. For patients, there are problems when they need
face-to-face consultations, for other GP practices there are threats to their business
model and for the authorities concerned with the integration of health services for
patients, there are concerns about how integration can work with a “GP at Hand”
type of service. In systems terms, it seems that delivering a service rather than just
new technology can avoid local sociotechnical system integration problems, in an
open system such as national healthcare, there will be interfaces with the larger system that will still have to be addressed. It is instructive that there is no evidence that
these issues were recognized or addressed in the initial design of the new service:
for many of the stakeholders, be they patients or existing GP practices, they only
become apparent once there is evidence of the service in operation.
10.5 THE ADOPTION OF DIGITAL APPLICATIONS AS
EVOLUTIONARY SOCIOTECHNICAL SYSTEMS CHANGE
All three of the case studies are success stories to the extent that they are on a path toward
embedding digital innovations into normal healthcare provision. However, in every case,
there have been complex challenges to address to create an effective link between the new
technology and the existing healthcare system. In this section, we review the nature of
these challenges and explore the design methods by which they may be met.
10.5.1 THE CHALLENGES
A frst target for technical design is to ensure that the direct user experience is positive and effective. However, when the new digital technology can only be effective if
integrated into the existing complex health service system, there are many challenges
that go well beyond the design of effective interaction between end users and the new
technology. The overall sociotechnical systems challenge is that it may be necessary
for the new technology to work with the existing technical systems in the health systems, for changes to be made in the social systems, e.g., changes in the work roles of
people in the health services, and adjustments to be made to the processes or pathways
by which work gets done. If these adjustments are not made, it is quite likely that, at
worse, the new technology will not be adopted or, at best, only the features that are
easy to assimilate without making changes in the existing system will be adopted.
The problems of integrating the new technology with the existing sociotechnical
system can be avoided if a complete new system is designed as illustrated by the
development of “GP at Hand.” However, it will still have to deal with the interfaces it
requires with existing systems. In a highly regulated large-scale and complex system
such as a national health service, that is likely to create many obstacles to the widespread adoption of a radically new system.
The Benefts of Health Apps
165
FIGURE 10.2 The lock and the key.
It is likely that most digital health applications will be adopted into existing
healthcare settings as in the frst two cases described above. As in these cases,
successful adoption will depend upon how the interfaces between the new technology and the existing local sociotechnical system are managed. The process
can be likened, as in Figure 10.2, to a “key” (the digital application) being ftted
into a “lock” (the existing sociotechnical system). Initially the ft is not likely to
be very good and modifcations may be needed both to the “key” and the “lock”
before the “key can be turned,” adoption can take place and the benefts for the
patient realized.
Achieving a good ft between the “key” and the “lock” involves a number of specifc challenges:
• The “key” will have to be suffciently fexible to be shaped to the needs
of each application setting. While the “lock” will also need to change to
accommodate the “key,” it is not realistic to expect all the necessary accommodation to come from an existing system which is charged with the ongoing need to deliver care to patients. It will need to remain a viable system
capable of the continuous delivery of care through any period of change
and signifcant changes in the short term may well be too disruptive to contemplate. There will have to be mutual accommodation of changes to both
the “key” and the “lock” or what sociotechnical theorists have called “joint
optimization” (Herbst 1974).
• A signifcant challenge is the creation of a design team capable of achieving
a good ft between the “key” and the “lock.” It is likely that the technology supplier will provide experts who are very familiar with the technical
capabilities of the “key” but they are unlikely to have detailed knowledge
of the specifcs of the “lock” and most certainly will not have the sense of
ownership of the “lock” that the people responsible for the daily delivery of
care in the existing system will have. Those who do understand the “lock,”
the local stakeholders, will in contrast not have detailed knowledge of the
“key.” Some form of user-centered design that is a partnership between
166
Handbook of Usability and User Experience
those who understand the technology and those who understand the existing systems will be necessary. Achieving a successful partnership is made
all the more diffcult by the fact that many of the signifcant stakeholders in
the existing system are often very busy with their “day job” and have little
time to address the challenge of implementing new technology.
• Another challenge is that it is often not initially apparent, even to the stakeholders in the existing systems, what the ramifcations for the existing systems of implementing the new technology might be. The impact on direct
users of the new technology might be obvious but, because the impact is on
a system, there are likely to be indirect impacts elsewhere. In the case of
the adoption of Kardia, for example, the impact on the jobs of the pharmacy
assistants was clear but not the impact on the workload of neighboring GP
practices who would have to deal with referrals. Identifying where there
might be direct and indirect impacts is a precursor to undertaking design
work on the “key” and the “lock.”
• A further signifcant challenge is that while the “key” may remain the same
from one application to another, the “lock” changes on each occasion. The
design challenge will be different because the local sociotechnical system
will have different characteristics in each case. Furthermore, the people
who own the “lock” (the local stakeholders) will also be different on each
occasion and will come fresh to understanding the “key” and what needs
to be done to achieve a good ft with their “lock.” There is always a strong
desire to solve the problems of implementation in early pilots and then to
“roll out” the new technology to lots of other sites, the assumption being
that they will all need the same solution. However, as Tapscott (1982) put it
in his second law of offce automation:
The ease of a pilot implementation is inversely related to the complexity of its operational extension.
In practice, each new implementation represents a new sociotechnical design
challenge.
Given these signifcant challenges, it is perhaps less surprising that many digital
health applications have struggled to become widely adopted.
10.5.2
MEETING THE CHALLENGES
Our conclusion from these case studies and many others is that in order to meet these
challenges, the process by which a digital application is implemented in a health
service setting needs a number of properties.
10.5.2.1
Flexibility in the Digital Application to Meet the
Challenge of a Changing Sociotechnical System
We have already referred to the “lock and the key” metaphor for the sociotechnical
system context and the intervention. It is important to consider the features of both
The Benefts of Health Apps
167
the “lock” and the “key” in a broader context to better understand how to meet the
challenges of technology adoption in specifc contexts and across different settings.
The “Lock” (the current sociotechnical system context) is a complex mix of:
• current technology that is being used,
• the workforce deployment into operational work roles and their skills and
capabilities,
• current work processes (e.g., “patient pathways” in health services) and
healthcare practices,
• pressures for change from other sources, e.g., new regulations, local and
national guidance, resources, tendering and procurement.
This means that the “lock” of today is an open system subject to a wide variety of
infuences and that it will be a different “lock” tomorrow because it is subject to
many other pressures to change. It can be argued that the “lock” is never a stable
component of any intervention as it is always subject to internal and external organizational factors that are constantly changing. The implication is that the search for
accommodation between the “lock” and the “key” has to meet the requirements of
the current “lock” and the solution has to be suffciently fexible to be able to adapt
to changes in the future.
The “Key” (the intervention) must therefore adapt to the current sociotechnical
systems context and provide useful outcomes that evolve by improving its ft with the
“lock.” This may include meeting interoperability challenges that exhibit much more
complexity than that of the initial requirement to enable the technological exchange
of data between systems. The quality, completeness and meaning of the data can be
signifcant factors determining whether different systems are able to utilize data to
improve outcomes. Data cleansing is often the term used to indicate the signifcant
work needed to make sure that data is current, accurate and complete. Technological
interoperability refects the ability for systems to communicate with each other. In
the GSTT case, the older PAS was able to “write out” fles of clinic data but could not
import data (without signifcant modifcation) other than by manual entry. Hence, the
ability to fully integrate with DrDoctor was compromised. This led to a sociotechnical solution that automated outgoing data but required manual entry of incoming
data. Technological interoperability can introduce many challenges if it is limited in
its ability to exchange data and also in its ability to ensure that, when connections
are unavailable, the sociotechnical system recovers elegantly and does not lose data.
Finally, we have also seen cases where the connection of the same record-keeping
system across separate geographical regions has revealed that identical events or
conditions are coded differently. Similarly, the use of free text felds can result in
variations in custom and use that makes a joined-up system challenging. These challenges are often referred to as semantic interoperability. The intervention therefore,
requires fexibility of approach over time to evolve the ft of the intervention with the
sociotechnical context.
168
Handbook of Usability and User Experience
10.5.2.2 A Multidisciplinary Design Team
To create a good ft between the “key” and the “lock” will require the expertise and
motivation of a joint team of technology suppliers and local people from the existing
service. Not only do they bring complementary knowledge and expertise, but they also
bring different but essential motivation to the design task. The technology suppliers
provide the “push,” the desire to see the application successfully implemented, and
the local stakeholders need to supply the “pull”: the energy within the existing service
to fnd an appropriate way of gaining the benefts from the application. If we assume
that the technical team is a relatively stable group that stays the same from application
to application, then the main question is: “who is involved from within the existing
service?” There is a widely held belief that what is needed is a “champion,” someone
with some authority who can convince colleagues of the value of the application and
mobilize them to get it embedded in the existing system. The evidence from the case
studies and from other cases makes clear that to deal with all the potential sociotechnical issues that can arise may need many more than one champion. Many different
stakeholder groups may be affected by the development, with some of them acting as
gatekeepers on the progress of the intervention. This has led to the idea of “gateholders” (Hoare 2019) rather than stakeholders. Gateholders are people who must be active
and positively engaged in the intervention in order for it to succeed. Identifying and
managing gateholders is a key aspect of overcoming the systemic issues of complex
interventions. In the Kardia case, for example, when it was appreciated that a new pathway was required to process people with suspected AF, the team that designed the new
pathway included technologists, pharmacists, cardiologists, GPs and commissioners.
In the case of DrDoctor, the team that managed the implementation at GSST included
over time the Chief Medical Offcer, the Program Director, IT staff, the managers of
the Dental Directorate and the managers of other outpatient departments as the implementation reached them. Complex interventions require a clear understanding of the
impact of the intervention on a range of stakeholder groups and exploration of what
they require in order to engage positively with the change.
10.5.2.3 An Evolutionary Approach
There is a long history in project management of preplanning: of creating a linear
program of activities at the outset of a project that is then executed to achieve the
desired result. Such an approach will not be effective in the search for a ft between
the “key” and the “lock.” This will be an uncertain and exploratory process for most
of the people involved: they will not know at the outset what problems, what opportunities and what barriers they might encounter and they will need a design process
that is much more evolutionary. It will need to be an iterative process that takes a step
forward, reviews progress and then determines the next step forward. It also needs to
be a learning process for both the gateholders in the existing sociotechnical system
and the technology suppliers. There are well-developed methodologies that take this
approach to systems change. Developmental evaluation (Patton 2010), for example,
is an approach used in major social systems change programs that work through
cycles of implementation, evaluation and review to move toward the implementation
of sustainable change. Action research (McNiff and Whitehead 2006) in a similar
The Benefts of Health Apps
169
way involves cycles of action followed by research to gather evidence of the result
of the action followed by review and learning followed by a further round of action
based on what has been learned. Following a process of this kind, the technology
suppliers and the gateholders could explore the space between the digital application
and the existing system to seek out the best ft between the “key” and the “lock.”
A particular problem for a team that is seeking to adapt the “key” and the “lock”
is that many of the problems identifed in the adaptation process are not obvious until
an attempt is made to change them. In the “GP at Hand” case, for example, it was only
after the service had been operating for some time that many of the issues for the wider
health service became evident. These discoveries are akin to repeatedly fnding weak
links in a chain, a process explored in the “theory of constraints” (Goldratt 1999). It is
not possible to chart a path in advance from the current status to the solution desired
unless these constraints are understood. Project management approaches that assume
a linear path to the solution cannot do this and some form of iterative process is necessary to discover these issues and take account of them in solution delivery.
Hoare (2019) describes the process of mutual adaptation of the “key” and the
“lock” as a set of activities based on a series of assumptions:
• The process is based on an action research approach that seeks to understand through iteration.
• Rather than taking a reductionist approach to breaking up the problem, the
action research process engages with complexity by mapping the context of
the intervention through gateholder groups and system levels (understanding the “lock”) and evolving the intervention as a negotiation (the “key”).
• Gateholder engagement and delivery of systemic outcomes occur through a
theory of constraints-type approach to building engagement and lowering
barriers to use.
• A developmental approach to evaluation is built into the approach which
accepts that the fnal intervention cannot be fully understood up front.
• Purposeful program theory (Funnell and Rogers 2011) based on a theory
of change and a theory of action provides guidance on “what” is being
changed and “how” that change is implemented.
It is most likely that, following this process, the impact on the existing system will
also be evolutionary. As in the example of DrDoctor, some parts of the existing system may adopt the new digital application before others. The full realization of the
capabilities of the intervention may evolve through intermediate stages that deliver
partial benefts. This evolutionary approach also has the advantage that it gives the
wider stakeholder community time to adjust to the opportunities created by the new
technology and to consider the more major sociotechnical changes that may be necessary to get the full beneft of the technological potential.
10.5.2.4 The Tools for the Job
The technology suppliers may come to the development with many tools to help them
tailor the application and get it up and running in the existing system. But what tools are
available to help them and the internal gateholders play their part in the development
170
Handbook of Usability and User Experience
of new sociotechnical systems? There are relatively few tools “ready to hand” to help
these teams engage in the search for new sociotechnical system design solutions. Many
of the approaches referred to above provide methods that can be adopted for these
purposes, e.g., action research and the theory of constraints. There are also many techniques that can be borrowed from related domains, for example, from the evaluation
literature. Realistic Evaluation (Pawson and Tilley 1997), for example, follows the
impact of a change wherever it goes in an existing system. Similarly, there are concepts in the literature on implementation science that are directly relevant, for example,
Normalization Process Theory (NPT) (May and Finch 2009) that identifes the process
by which an innovation can become embedded in the normal practice of an existing
system. What is needed is a program to convert these approaches into practical tools
for technology developers and gateholders to use as normal design practice.
There are methods that are specifcally for designing sociotechnical systems,
although most of these are for circumstances where the starting point is explicitly to
create a new sociotechnical system, for example, Mumford (2000). In most of the cases
where a new digital health application is being implemented, there is probably no initial expectation that sociotechnical change will be necessary and so techniques that
help identify the extent to which there are sociotechnical issues to be addressed may be
more helpful. One of the perennial problems is that there are unexpected consequences
when a change is made that become barriers to development and there is a need to be
able to identify these “weak links in the chain” as early as possible in the development
process. In this context, we have developed a Planning for Change Framework (PfCF)
(Eason and Maton-Howarth 2020) which helps people in gateholder roles make an
early assessment of the impact of a proposed change on the local existing sociotechnical system, i.e., the work roles of existing staff, the other technical tools they use and
the processes by which they engage with one another to get work done.
10.5.2.5 Passing on the Learning
How can the learning from one implementation of a digital health application best
be conveyed to those responsible for the implementation of that application in a different location? The assumption may be that the design solution adopted in the frst
location can be applied directly in the second and this is often where wider dissemination can go wrong because the existing system in the new location may be different
in important respects. It may be more important to pass on to the gateholders in the
second location, learning about the issues that need addressing and the design processes that are necessary to achieve successful adoption, i.e., not the solutions but the
process by which a ft between the “key” and the “lock” may be found.
In most circumstances, it is the team of the technology supplier that carry the
learning from one implementation to another: they are usually the only common
factor in the move from one location to another. However, as technology specialists,
they may not be the ideal people to convey information about sociotechnical issues.
It may be better if the new gateholders could meet the old gateholders and hear from
them directly what they have learned. One way in which this might be done is by
creating a user community forum in which the people who use an application can get
together and share their learning about how best to get the beneft from it.
The Benefts of Health Apps
171
10.6 CONCLUSION
Many promising digital healthcare applications fail when they are used within the
context of existing health services. The three cases described demonstrate why
achieving success in this context can be diffcult and what needs to be done to make
progress. When the adoption of digital health applications involves engagement with
an existing health service, the issues that need to be addressed go well beyond the
technical. The cases show that to adopt the health application in a way that achieves
its potential beneft, there may be many sociotechnical issues to address that involve
changing both the existing sociotechnical system that delivers the health service
and the new health technology application. The metaphor of a “lock” and a “key”
conveys the sense of interdependence between the two: unless the health application can be embedded in the normal practice of the service delivering system, it is
unlikely to achieve its promised benefts. The three cases described reveal the issues
involved in seeking a ft between the existing system and the new opportunity in different ways. In the case of the use of Kardia, the “lock” had to be redesigned to cope
with a new source of referrals for cardiological diagnosis. In the case of DrDoctor,
only a limited part of its functionality could be used initially because of the changes
that were necessary to existing systems to provide full interoperability. In the case
of GP at Hand, the design of a totally new service avoided any requirement to integrate new technology with existing sociotechnical systems but experience of use has
revealed many more strategic issues when the new service impacted upon the existing national health services with which it has to integrate.
In order to achieve a good ft between the new technology and the receiving
sociotechnical system, there is a need, frst, for fexibility in the technology and in
the existing sociotechnical system so that an accommodation can be found. Second,
to identify an appropriate accommodation, a design team has to be assembled that
includes technical experts and gateholders who can work on sociotechnical issues on
behalf of all of the stakeholders who are interested parties in the development. Third,
the process by which the design team work toward solutions will need to involve
exploration and learning and we need evolutionary models of change to enable these
developments. Fourth, we need tools that are specifcally designed for this purpose.
There are few readily to hand but there are approaches in the wider literature of
organizational change, evaluation and implementation that can be utilized for this
purpose and can help to realize the potential of these applications. The challenge for
future implementations of digital applications in healthcare services is to offer the
multidisciplinary teams who fnd themselves, often to their surprise, engaged in the
iterative development of new sociotechnical solutions a practical toolset to support
their work.
REFERENCES
Babylon GP-At-Hand. https://www.gpathand.nhs.uk (Accessed 03/12/19).
Downey, A. (2019a). ‘Babylon allowed to act ‘unlicensed and bullish’ in expansion, MP says’.
Digital Health, 19 October 2019. https://www.digitalhealth.net/2019/10/babylon-unlicensed-bullish-expansion/
172
Handbook of Usability and User Experience
Downey, A. (2019b). ‘Manchester CCG objects to Babylon expansion ‘due to safety concerns’’. 23 December 2019. https://www.digitalhealth.net/2019/12/manchester-ccg
-objects-to-babylon-expansion-due-to-safety-concerns/ (Accessed 14/12/19).
DrDoctor. https://www.drdoctor.co.uk (Accessed 01/12/19).
Eason, K. D. (2014). ‘Afterword: The past, present and future of sociotechnical systems theory’. Applied Ergonomics, 45(2A), 213–220. doi:10.1016/j.apergo.2013.09.017
Eason, K. D., and Maton-Howarth, W. (2020). ‘The planning for change framework (PfCF)’.
The Bayswater Institute. https://www.bayswaterinst.org
Funnell, S., and Rogers, P. (2011). Purposeful Program Theory: Effective Use of Theories of
Change and Logic Models. San Francisco, CA: Jossey-Bass/Wiley.
Goldratt, E. M. (1999). Theory of Constraints. Great Barrington, MA: North River Press.
Herbst, P. G. (1974). Socio-Technical Design Strategies in Multidisciplinary Research.
London: Tavistock.
Hoare, A. (2019). Aspects of Digital Change. Newcastle upon tyne: Cambridge Scholars.
Ipsos-MORI. (2019). Evaluation of Babylon GP-at-Hand: Final Report. London: Ipsos-Mori,
May 2019. https://www.hammersmithfulhamccg.nhs.uk/media/156123/Evaluation-of
-Babylon-GP-at-Hand-Final-Report.pdf
Kardia. https://www.kardiamobile.co.uk (Accessed 30/11/19).
May, C., &and Finch, T. (2009). ‘Implementing, embedding and integrating practices: An
outline of normalization process theory’. Sociology, 43(3), 535–554.
May, C., Harrison, R., MacFarlane, A., et al. (2003). ‘Why do telemedicine systems fail to
normalize as stable models of service delivery?’ Journal of Telemedicine and Telecare,
9(Supplement 1), 25–26. doi:10.1258/135763303322196222PMID:12952711
McNiff, J., and Whitehead, J. (2006). All You Need to Know about Action Research. London:
Sage Publications.
Mumford, E. (2000). ‘A socio-technical approach to systems design’. Requirements
Engineering, 5(2), 125–133.
NHS Innovation Accelerator. (2018). ‘Understanding how and why the NHS adopts innovations’. The AHSN Network, England. https://nhsaccelerator.com/wp-content/uploads
/2018/11/NHS-Innovation-Accelerator-Understanding-how-and-why-the-NHS-adopts
-innovation.pdf
ORCHA. https://appfnder.orcha.co.uk (Accessed 10/07/19).
Patton, M. Q. (2010). Developmental Evaluation: Applying Complexity Concepts to Enhance
Innovation and Use. New York: Guilford Press.
Pawson, R., and Tilley, N. (1997). Realist Evaluation. Thousand Oaks, CA: Sage Publications.
Polisena, J., Coyle, D., Coyle, K., and McGill, S. (2009). ‘Home telehealth for chronic
disease management: A systematic review and an analysis of economic evaluations’. International Journal of Technology Assessment in HealthCare, 25, 339–349.
doi:10.1017/S0266462309990201PMID:19619353
Steventon, A., Bardsley, M., Billings, J., et al. (2012). ‘Effect of telehealth on use of secondary
care and mortality: Findings from the whole system demonstrator cluster randomized
trial’. BMJ (Clinical Research Ed.), 344, 3874. doi:10.1136/bmj.e3874
Tapscott, D. (1982). Offce Automation: A User Driven Method. New York: Plenum.
Wyatt, J. C. (2011). ‘Why does telehealth fail, and what can we do about it?’ Paper presented
at Information Technology and Communications in Health 2011: Health Informatics:
International Perspectives, Victoria, Canada.
Section 3
Usability and UX in the
Built Environment
11
Usability and User
Experience of the
Built Environment
Concepts, Methods
and Techniques
Ermínia Attaianese and Thaisa Sampaio Sarmento
CONTENTS
11.1 Introduction .................................................................................................. 175
11.2 The Evolution of the Concept of Usability/UX Applied to the Built
Environment ................................................................................................. 177
11.2.1 Usability Concepts for the Built Environment Field ........................ 177
11.2.2 User Experience Concepts for the Built Environment Field ............ 180
11.3 Methodological Issues for Their Evaluation................................................. 181
11.3.1 Main Methodological Approaches of Usability Evaluation for
the Built Environment ...................................................................... 181
11.3.2 Main Methodological Approaches of User Experience
Evaluation for the Built Environment............................................... 183
11.4 Combining UX and Sustainable Concepts as a 21st-Century Design
Strategy......................................................................................................... 186
11.5 Future Researches......................................................................................... 190
References.............................................................................................................. 192
11.1 INTRODUCTION
Usability studies started in the 1950s, emerging from diverse backgrounds, and were
widely known in relation to applications within product design, information technology and human-computer interaction. Buildings are built for a purpose, and depending on how well they serve their purpose, they contribute to usability criteria: they
may express their usability for users. Usability is measured based on three basic
parameters: effectiveness, effciency and satisfaction (Blakstad et al., 2008; Fenker,
2008; Alexander, 2008). Usability depends on how a product can be used by specifed users to achieve specifed goals; in this way, usability is a process that can only
be understood as a social construction (Fenker, 2008). Hence, usability evaluation is
DOI: 10.1201/9780429343490-14
175
176
Handbook of Usability and User Experience
connected to user experience and their feedback about the environment design and
context of use (Chamorro-Koc, 2007). Usability theory considers that user friendliness, functionality and universal design of the system, buildings or products meet
user requirements and expectations in order to offer supportive design for all people.
Referred to the built environment, usability studies started as the facilities management (FM) feld with the concept of responsibility of the facility manager to fulfll
the demand of stakeholders by knowing the action and feedback from users experience to building in use. Consequently, FM related to improvement of surroundings,
people and spatial relationships, social, functional aspects, environment and economic (Jensen, 2010; Pheng, 1996).
An important step on usability defnition about built environment was done from
2003 to 2006, when an international team of researchers, International Council for
Building Research and Documentation (CIB TG51), investigated the application of
concepts of usability in order to provide a better understanding of the user experience of buildings. The task group comprised research-based partners from France,
Norway, Sweden, the UK and Finland. The results were published as a CIB report—
Usability of Workplaces 2005 (CIB, 2006). This report highlights basic principles
for a better understanding of not only this concept to be useful in evaluation of inuse buildings, but also what might be relevant knowledge to include usability in the
briefng process of building design.
The other two later reports—The Workshop W111: Usability of Workplaces 2
(CIB, 2008) and Usability of Workplace 3 (CIB, 2010)—developed that principles,
presenting practical examples of application.
The defnition of usability in ISO 9241-210 is as follows:
Extent to which a system, product or service can be used by specifed users to achieve
specifed goals with effectiveness, effciency and satisfaction in a specifed context of use.
Gehl (2010) calls for a refection about humanity’s actual moment. It is the frst
time in history that most of the global population live in urban spaces. All around
the world, cities are rapidly increasing and this will be continued for many years.
He emphasized that the future’s key is a focus on people’s needs and how they are
using their cities. To architects and urban planners, it is an opportunity to think
about including users’ opinion about usability of built environment they live on, and
how accessible and socially sustainable are cities and buildings to support human
activities.
Some questions are essential for our refection: how usability concepts are applied
to the contemporary built environment? Are architects and urban planners prepared
to connect usability concepts of the built environment to people’s diversity, needs
and desires, considering beyond population aging?
More recently, the need to introduce user experience in the design feld emerged
(Law et al., 2009). The defnition of user experience in ISO 9241-210 is as follows:
A person’s perceptions and responses that result from the use and/or anticipated use of
a product, system or service.
The Built Environment
177
User experience (UX) is a relatively new concept popularized by Don Norman in
1999 (Hassenzahl & Tractinsky, 2006). Naumann et al. (2009) explain that a growing and large interest in user experience has developed (Forlizzi & Battarbee,
2004) and the term UX has been increasingly used in the relevant design literature.
Although user experience is by now a common expression among HCI researchers,
it is used in various meanings and a shared defnition is still under construction. The
ISO defnition suggests measures of user experience are like measures of satisfaction in usability (Bevan, 2008). Both suggest that usability or user experience can be
measured during or after the use of a product, system or service.
A person’s “perceptions and responses” in the defnition of user experience are
like the concept of satisfaction in usability. From this perspective, Bevan (2008)
considered that measures of user experience can be compassed within the threecomponent model of usability, particularly when the experience is task related.
A shortcoming of both defnitions is that they are not explicitly concerned with
time. Just as the ISO 9241-11 defnition of usability has nothing to say about learnability (where usability changes over time), the ISO 9241-210 defnition of user
experience has also nothing to say about the way user experience evolves from
expectation, through actual interaction, to a total experience that includes refection
on the experience (Roto, 2008).
In this way, other questions need to be done: in built environment feld, how can we
make connection between usability and user experience concepts, in a way to consider
different categories of buildings, different human perceptions and their refection on
living/using that built experience along time? What are the contemporary potentialities
in architectural user-centered design for sustainable living and working places for all?
This chapter proposes a theoretical study about the evolution of both usability and
user experience (UX) concepts and methods in order to elaborate a framework focused
on user (person)-centered building design and evaluation. Moreover, this chapter aims
to demonstrate that usability concepts are not only delimited to products or artifacts
design but are also useful to architect’s technical domain that should apply them to
architectural and urban design, as a way to obtain more suitable spaces for all.
11.2 THE EVOLUTION OF THE CONCEPT OF USABILITY/
UX APPLIED TO THE BUILT ENVIRONMENT
The concepts of usability and user experience applied to the built environment come
from studies started between the end of the 19th and early 20th centuries, mainly led
by Alexander (2008). Over the last two decades, these concepts have been strengthened, as a consequence of the increase of theoretical and practical research aimed
at evaluating and understanding the built environment focused on usability main
principles of effciency, effcacy and satisfaction.
11.2.1
USABILITY CONCEPTS FOR THE BUILT ENVIRONMENT FIELD
A CIB working commission on usability of workplaces has operated as an integrated
network of researchers and practitioners since its inception in 2001. The frst CIB
178
Handbook of Usability and User Experience
report was published as CIB Report 306, and it synthesized exploratory case studies
between 2002 and 2005, sought to investigate the applicability of usability concepts
and techniques, adapt them for use in the built environment and to identify methods
and tools that would enable a more positive user experience in organizational settings.
The second CIB report was published as CIB Report 316, which included three
case studies done between 2006 and 2008, fve workshops and a fnal research seminar. The work that comprised this stage of the project focused on contextual issues
that were seen to defne the difference in applying usability to the built environment
as opposed to other consumer products.
The third CIB report was published as CIB W111, and it is the basis for a theoretical and methodological conception about usability of the built environment. It
is the third phase of a complete international research about usability of the built
environment, led by Alexander, and focused on usability of learning environments.
This report structure is divided into three parts: the frst part defnes main concepts;
the second part describes usability methods and tools; the third part describes the
usability managing.
The following are the main explanations in the studies about usability of the built
environment:
• Usability is “the extent to which a system can be used by specifed users to
achieve specifed goals with effectiveness, effciency and satisfaction in a
specifed context of use” (ISO 9241-11).
• Usability is one of the most important, but most often neglected, aspects of
building performance (Alexander, 2006).
• Usability focuses on specifed users who use a product (the building) to
achieve specifed goals and on the importance of context (the relationship
between building and users) (Vischer, 2008).
• Usability, or the use value, depends on both the physical environment and
how the environment is used (Blakstad et al., 2010). So, any evaluation
of usability will thus depend on the context, the use, the properties of the
building and fnally the user’s experiences and satisfaction.
• Usability studies are a cultural phenomenon from understanding user’s
experience (Harun et al., 2011). It is a part of human behavior activities and
reaction study or to value the end user’s satisfaction.
• It is focused on user perception and on the easiness and effcient usage of
facilities—the workplace (Ghani et al., 2016; Alexander, 2006). It can be a
tool to evaluate building which requires the total participation of user, and
their experiences are incorporated in it.
A building’s true purpose is to support and shelter its users while they are performing their activities and living their lives. Depending on how well building supports
the users’ activities, our physical surroundings contribute to effciency, effectiveness
and satisfaction in the user organizations (Blakstad et al., 2010). On the other hand,
building users’ behavior is infuenced by the space they occupy, by their feelings,
intentions, attitudes and expectations as well as by the social context in which they
The Built Environment
179
are participating (Vischer, 2008). Both points of view suggested the need of establishing building assessments as a scientifc process, precisely maintained by consolidated techniques and methods.
Built environment methods frst evolved in the last decade of the 20th century,
with researches of Davis et al. (1993) and Preiser et al. (1988). Davis et al. (1993)
developed the Serviceability Tool, one of the most widespread practical and theoretical frameworks for the appraisal of building performance (Alexander, 2006). This
evaluation distinguishes between performance (actual behavior in service) and serviceability (capability of performing as required). Preiser et al. (1988) and Preiser
(2003) defned a post-occupancy evaluation (POE) as the process of evaluating buildings in a systematic and rigorous manner after they have been built and occupied.
During the last decades, POE studies had hugely increased, focusing on physical,
technical and psychosocial evaluations. POE and serviceability tools were the frst
two competing methods to evaluate and rate buildings in relation to the intended use
(Alexander, 2006). They focused on both observing and measuring certain physical
aspects of the building or the facility and evaluate that in relation to the intended or
actual use.
In ISO 9241-11, three factors are described that determine usability: effectiveness (ability to deliver a certain desired effect), effciency (allows ease of performance with little use of resources) and satisfaction (about users feeling, attitudes
and effects). Functionality alone does not make a certain artifact usable, because it
also depends on the situation in which the artifact is used, the context the artifact is
designed and used and the values of the designers and users. Both context and values
change with time, place and cultural conditions, so these aspects are very diffcult to
be quantitatively measured.
For Bevan (2008), typical usability concerns include the following:
1. Designing and evaluating overall effectiveness and effciency
2. Designing and evaluating user comfort and satisfaction
3. Designing to make the product easy to use, and evaluating the product in
order to identify and fx usability problems
4. When relevant, the temporal aspect leads to a concern for learnability
Afacan and Erbug (2009) studied universal usability and pointed out that people’s
abilities change over time, and they want to be accommodated within the built environment as effciently, effectively and satisfactorily as possible, regardless of their
health conditions, body size, strength, experience, mobility power or age. In the
meantime, they want to expend low physical effort and have security, safety and simplicity (The Center for Universal Design, 1997). In this respect, universal usability in
architectural terms is concerned with making buildings and facilities as universally
usable as possible for everyone, rather than for the vast majority of a target population. Reviewing the literature on universal design indicates that no recommendations
exist in the architectural design context as to how universal usability can be incorporated and implemented to identify, minimize and solve usability problems that can
occur during any phase of the design process.
180
Handbook of Usability and User Experience
For Bittencourt et al. (2015), usability is inserted into different contexts, frst as
sociopolitical issues, trade and production quality standards, consumer satisfaction
and responsibility of the supplier, and second as the user interaction with desktop
environments, education, health, leisure and community and technological context
(Nicholls and Boueri Filho, 2001).
11.2.2 USER EXPERIENCE CONCEPTS FOR THE BUILT ENVIRONMENT FIELD
Although literature review considers signifcant differences between usability and
user experience, these concepts are so close that it needs to be more clearly defned.
Naumann et al. (2009) studied people’s perception about the differences between
usability and user experience. They interviewed around 166 persons, and results
showed that the most preferred techniques for both usability and user experience
evaluation methods were interviews and questionnaires, to design better products
(from 48.5% to 67.7% of respondents). People mostly associated usability concept
with these fve criteria: effciency, ease of use, effectiveness, suitability, user satisfaction. When questioned about user experience knowledge and interests, respondents
associated user experience with these fve criteria: emotion, experience, perception,
prior knowledge and ease of use.
Jensen (2010), Blakstad et al. (2010) and Villarouco (2008) agreed that a relevant
reason for involving the users in building design process is the fact that the users are
experts in relation to their work and experiences within environments. The users
have their own history, experiences and perceptions in relation to the building and
the activities that take place there. Involving users in design process may represent
an important gain in order to attend to people’s needs and desires.
Brown et al. (2010) demonstrated the complexity of user experience in buildings,
shaped in part by the characteristics and quality of the space, but also infuenced by
a host of other factors, such as occupant comfort, productivity, health and well-being
in interior environments and workplace, suggesting that when these aspects work
together in synergistic ways, the benefts should be considerable in any usability
assessment model.
Recent researches about concepts and applications of user experience in built
environment were made by Harun (2011), Ghani et al. (2016) andCozza et al. (2018).
As a product, built environment must correspond to end user expectations and emotional sensations, more than their physical needs.
Bevan (2008) pointed that typical user experience concerns include:
1. Understanding and designing the user’s experience with a product: the way
in which people interact with a product overtime: what they do and why;
2. Maximizing the achievement of the satisfaction goals of stimulation, identifcation and evocation and associated emotional responses;
3. The range of human answers that would be measured to include pleasure; and
4. The circumstances in which they would be measured to include anticipated
use and refection on use.
The Built Environment
11.3
181
METHODOLOGICAL ISSUES FOR THEIR EVALUATION
In CIB Report 306 (CIB, 2008), they had identifed three basic purposes for evaluation of usability of buildings:
• First as feedback to planners, owners, users and Facilities Managers in
order to improve usability.
• Second, as a contribution to general knowledge and research.
• Third, an understanding of user needs and usability is developed as input to
a briefng or design process.
Blakstad et al. (2010) see usability as a kind of non-defnitive formulation of solutions and suggest exploring it in multi-method strategies. In their studies, it was
important to differentiate users, actors and stakeholders such as end users, Facility
Managers, building owners, visitors and the society at large, because different stakeholders and organizational levels have different perspectives considering usability of
buildings (Fenker, 2008). They also conclude that cultural aspects and background
played an important role in the different users’ evaluation of usability. In addition,
Harun (2011) recommended qualitative methods to collect data dealing with human
needs, especially when it touched on feld experience and refection of experience.
11.3.1
MAIN METHODOLOGICAL APPROACHES OF USABILITY
EVALUATION FOR THE BUILT ENVIRONMENT
CIB Report 306 (CIB, 2008) described many recommended tools and techniques for
usability evaluation:
• Document analysis: To establish context and situation of the case. This
includes briefs and architectural descriptions and project presentations,
minutes, drawings and articles.
• Interviews: As individuals or groups, to identify the relationship between
users’ needs and what the building offered, and also to understand the use
of space.
• Walk-through: A qualitative and systematic way of assessing different
aspects of a building by using different stakeholders as informants as making a tour inside of the building.
• Surveys and questionnaires: They are useful if necessary, to obtain specifc
answers regarding the effciency and effectiveness of the building.
Based on these main tools and techniques, other researchers developed successful
methodological approaches, as described in Table 11.1, such as Davis et al. (1993),
Preiser et al. (1988), Warell (2001) and Voordt and Wegen (2005).
In the same way, that there are consistent ways to evaluate the usability of the
built environment, researchers also elaborated categories of analyses, which they
should be concerned to observe in the object of their studies. Noteworthy are the
182
Handbook of Usability and User Experience
TABLE 11.1
Main Methodological Approaches to the Usability of the Built Environment
Goal
Description
Davis et al.
(1993)
Author(s)
The serviceability
tool
Evaluate built
environment—practical
and theoretical
framework
Distinguished performance (actual
behavior in service) and
serviceability (capability of
performing as required)
Preiser et
al. (1988)
POE: postoccupancy
evaluation
–
Evaluate buildings in a
systematic and rigorous
manner after occupying
Evaluate functionality
inside buildings
NHS
Achieving
Excellence Design
Evaluation Toolkit
(AEDET)
Based on POE
Afacan and
Erbug
(2009)
Heuristic evaluation
method for
universal building
design
Inspection usability
method played by
experts
Focused on physical, technical and
psychosocial aspects. It is spread
all over the world
Evaluate technical (operational)
and interactive functionality
(ergonomic and communicative)
Use a systematic questionnaire
related to how building
performed; provides three key
areas: (1) functionality—use,
access and space, (2) impact—
character and innovation, form
and materials, staff and patient
environment, urban and social
integration, and (3) build quality
and standard performance,
engineering and construction
Based on seven universal
principles, each evaluator
inspects the building alone and
judges its compliance according
to a set of usability principles,
based on the heuristic evaluation
method by Nielsen (1994, 1992)
Cozza et
al. (2018)
Usability test
Focus on formative and
summative usability
aspects
Warell
(2001)
Method
User-centered approach, as an
interactive design process, with
the goal to gather qualitative
information about weaknesses
and operation problems of a
product, so as to accomplish task
goals
Source: Based on Davis et al. (1993), Preiser et al. (1988), Warell (2001), NHS and Cozza et al. (2018).
categories described by Warell (2001), Voordt and Wegen (2005), Voordt (2009),
Preiser et al. (1988), Afacan and Erbug (2009) and the Achieving Excellence Design
Evaluation Toolkit (AEDET) method, according to Table 11.2. Warell (2001) suggested two categories of functionality; Voordt and Wegen (2005) and Voordt (2009)
developed nine dimensions to evaluate architecture in use; AEDET provides three
183
The Built Environment
TABLE 11.2
Main Categories to Consider During Usability Evaluation Process
Warell
(2001)
Voordt
(2005, 2009)
Technical
functionality
(operational and
structural
properties)
Reachability and
parking facilities
Interactive
functionality
(ergonomic with
users) and
communicative
(form, aesthetic,
values, sensory
aspects)
–
Accessibility
Flexibility
Spatial orientation
–
Effciency
Sustainability
Safety
Privacy,
territoriality and
social contact
Health and
physical
well-being
AEDET
Preiser
et al.
(1988)
Afacan and
Erbug (2009)
Functionality—
use, access and
space
Physical
aspects
Equitable use
Technical
elements
Flexibility in
use
Impact—character
and innovation,
form and
materials, staff
and patient
environment,
urban and social
integration
Build quality and
standard
performance,
engineering and
construction
Psychosocial
aspects
–
Simple and
intuitive use
Perceptive
information
Tolerance for
error
–
–
–
Low physical
effort
–
Size and space
for approach
and use
Source: Based on Warell (2001), Voordt and Wegen (2005), Voordt (2009), Preiser et al. (1988), AEDET
and Afacan and Erbug (2009).
key areas of evaluation and Preiser et al. (1988) developed a three-area evaluation
method. Afacan and Erbug (2009) proposed seven universal design principles as a
set of heuristics for universal usability evaluation. Each of those methods features
some advantages and disadvantages.
Nevertheless, usability tests and focus groups are the only methods that consider representatives and end users and provide empirical data as requested in the
user-centered design principles (Gould et al., 1985). Therefore, usability testing and
focus groups are among the most important and widely applied methods in usability
practice.
11.3.2 MAIN METHODOLOGICAL APPROACHES OF USER EXPERIENCE
EVALUATION FOR THE BUILT ENVIRONMENT
For Bevan (2008), user experience concepts include all the users’ emotions, beliefs,
preferences, perceptions, physical and psychological responses, behaviors and
184
Handbook of Usability and User Experience
accomplishments that occur before, during and after use. If user experience includes
all behavior, it presumably includes the user’s effectiveness and effciency. This
seems consistent with the methods proposed by many people in the industry (Ketola
and Roto, 2008; Roto et al., 2009) who appear to have included usability within user
experience.
The fulfllment of human psychological needs is thought to be a main trigger
of positive experiences with interactive systems or products. This needs-driven UX
approach is a well-explored area in UX research and appears to be a powerful framework for the design of more experiential systems. Methods for optimizing user satisfaction with achieving both pragmatic and satisfaction goals can be categorized as
follows:
1. Methods to evaluate and design for the hedonic goals of stimulation, identifcation and evocation and associated emotional responses.
2. Methods to evaluate and design for the user’s perception of achievement of
pragmatic goals associated with task success.
3. Methods that support the design of the user’s experience (including setting
requirements and understanding the context of use).
The second kind of user experience method seems to be very suitable for understanding users’ behavior inside an urban space or in an interior built environment,
while experts can observe, measure and obtain important data from users’ activities, needs and desires. Therefore, main authors developed their methods based on
this paradigm, such as Hansen et al. (2010), Bluyssen et al. (2004), Rowley (1994),
Villarouco (2011), Villarouco et al. (2016) and Noguchi et al. (2018) (see Table 11.3).
User experience evaluation can be performed in different contexts and operated by different techniques involving users’ participation or simple observation,
such as contexts, tools and techniques described in Table 11.4, based on Marcus
(2009), Lallemand (2015), Villarouco (2011), Sannoff (2001), Ekambi-Scmidt (1974),
Sanders (2013) and Koskinen et al. (2011).
An effective user-centered theory needs to be clear about what is being measured
when users are asked about their experience of the built environment. Measuring the
occupants’ experience provides information about:
• Product—how spaces affect behavior in different situations, the effects of
buildings systems on comfort;
• Psychological processes—how people feel about and respond to the spaces
they occupy, as well as about the process.
The implicit evaluation of built space—of quality—that is inherent in users’ judgments links the user-centered approach to the design global process.
Vischer (2008) user-centered approach addresses the complexity of the fact that
the user-environment relation is dynamic and interactive. The user is not a passive
entity experiencing the built environment statically as input. The users’ experience of the environment is itself transformed by the activities they perform in that
185
The Built Environment
TABLE 11.3
Main Methodological Approaches to the User Experience Evaluation Method
of the Built Environment
Author(s)
Method
Goal
Description
Hansen et al.
(2010),
Bluyssen et al.
(2004),
Rowley (1994)
Walk-through
surveys
technics
Building evaluation
in a user
perspective
The methodology includes building a
customer profle, designing and
executing walk-throughs based on this,
and analyzing the results from the
walk-throughs
Villarouco
(2011)
EMBE—
ergonomic
methodology
of the built
environment
Based on human
factors analysis
and users’
perception
evaluation
Evaluate tasks and activities done by
users, environmental and dimensional
comfort criteria and subjective users’
perception about environment in use
Noguchi et al.
(2018)
Environmental
experience
design (EXD)
Based on user
experience design
Function analysis techniques that help to
categorize occupants’ requirements,
desires and expectations in the built
environment
Source: Based on Hansen et al. (2010), Bluyssen et al. (2004), Rowley (1994), Villarouco (2008) and
Noguchi et al. (2018).
TABLE 11.4
User Experience Evaluation Context and Techniques Description
Evaluation
context
Description
Lab test
Mind maps; prototyping (Sanders, 2013); space syntax analysis; user scenarios
Field
observation
Contextual Inquiry; observation/post-use interview; activity experience sampling;
ethnography observation (Koskinen et al., 2011); map of users’ behavior; wish
poem (Sannoff, 2001); constellation of attributes (Ekambi-Schmidt, 1974);
environment layout analysis; feld simple observations (audio and video)
User opinion data obtained from interviews, mind maps narratives, contextual
inquiries, focus group evaluations, surveys questionnaire, emotional cards
(Lallemand, 2015), psychological measurements tests, walk-through narratives,
workshops
Evaluation of
users’ data
Expert
evaluation
Expert analysis; POE focused on users’ satisfaction; heuristic evaluation;
accessibility evaluation techniques, ergonomics evaluation of the built environment
Source: Based on CHI (2009), SIG, Marcus (2009), Lallemand (2015), Villarouco (2008), Sannoff
(2001), Ekambi-Scmidt (1974), Sanders (2013) and Koskinen et al. (2011).
186
Handbook of Usability and User Experience
environment. So, the continuing process of self-transformation impacts directly on
the individual quality perception about the environment, equipment and/or furniture.
Lallemand (2015) developed a psychological card-set technique as a pragmatic
tool able to support needs-driven UX design and evaluation of products. It describes
seven categories of experiences: (1) pleasure stimulation, (2) relatedness—belongingness, (3) security control, (4) effectiveness, (5) autonomy, (6) infuence—popularity, (7) self-actualizing—meaning UX practitioners should seek to design or evaluate
design products or systems. In the architectural feld, it is necessarily important to
make a relation with the environmental psychology science, and environmental perception that users naturally have about living/working spaces, along a period of time
or use frequency, and how they feel themselves among other people sharing the
environment.
Vischer (2008) pointed that a way to collect consistent information about user
experience is to focus on one type of built environment, by considering who the users
are, how time is defned and what is meant by the users’ experience in that specifc
environment. In this way, for a detailed result, each user experience analysis should
be focused only on few rooms in use observation, based on wayfnding data collecting, or on task analysis fowchart. Even if the building or urban space is bigger, users
may expose less detailed perception information.
In urban spaces, Gehl (2010) explores cities’ quality criteria that seem to be
related to human factors satisfaction. It is based on three main categories: protection
(against physical and sensory infuence), comfort (for walking, seating or being on
stand) and fnally pleasure (human scale, positive climate and sensory aspects).
Cozza et al. (2018) applied a user-centered approach to evaluate building that
embodies three main principles of design:
a. Early focus on users and tasks;
b. Empirical measurement; and
c. Iterative design (Gould et al., 1985).
11.4
COMBINING UX AND SUSTAINABLE CONCEPTS
AS A 21ST-CENTURY DESIGN STRATEGY
In terms of usability of the built environment, sustainable buildings must be related
to the safeguarding and maximizing of their functionality and serviceability as well
as aesthetic quality. A useful building and/or city space must be designed to protect health, offering comfort and safety for workers (during construction process),
occupants, users, visitors and neighbors. Despite advances in researches about social
sustainability and human factors led by Attaianese (2012, 2016, 2018), Attaianese
and Acierno (2018), Peffer et al. (2013) and Berardi (2015), Fischer (2011), Hedge
(2008) and Charytonowicz (2007), social aspects around sustainable paradigm still
have few impacts on built environment, except by United Nations (UN) reports and
international political boards.
Few design decisions tend to be made favoring user experiences and this challenge
might be consequent to the discrepancies between prescribed building codes and user
The Built Environment
187
perception (Noguchi et al., 2018), although socially sustainable design for buildings is
a hard challenge that involves a range of parameters, considering cultural, economic
and political different contexts, around countries, cities and people diversity.
The connection between sustainability and human factors studies is an issue
addressed only in the 21st century, with studies from Martin et al. (2013), Zink and
Fisher (2013), Attaianese (2016, 2018) and Attaianese and Acierno (2018), as they
demonstrated the relations between these two scientifc felds. In most cases, it was
not considered that sustainable buildings and cities should be frst designed to accommodate, safe, protect, promote functionality and accessibility to human beings and
then, but not secondarily, offer best conditions to answer environmental questions
such as climate adequacy or minimizing energy consumption.
Currently, in this feld, the challenge is to establish connections between the
concepts of usability and UX and the objectives of international boards in terms
of social sustainability conditions. From a human factors perspective (Attaianese,
2018), no protocol areas of assessment are “person-centered,” while all show limited
credits about human-related factors, including into different thematic areas, such as
health, safety and well-being, accessibility and adaptability, actors’ involvement in
design process (Attaianese & Acierno, 2018).
A theoretical approach that combines usability, UX and social sustainability may
be synthesized, going back to some other theories and approaches that make an
impact on this proposition:
• Returning to Naumann et al. (2009), their studies demonstrated that experts’
interest in usability is focused mainly on designing better products, while
UX concept is often associated with the interest of making make people
more satisfed, and it is generally more linked with emotional content (e.g.
fun and joy) and hedonic qualities. Overall, results indicate that usability/
UX-research and practice are well connected.
• Considering Table 11.2, in a way to evaluate the usability of the built environment, researchers elaborated categories of analyses that involve such
physical, technical and psychosocial elements (Warell, 2001; Voordt and
Wegen, 2005; Voordt, 2009; Preiser et al., 1988) and the AEDET method.
• Regarding Afacan and Erbug (2009), universal usability in architectural
design may include four main scenarios: circulation system, entering and
exiting, wayfnding, obtaining products and services, public amenities, in
order to support seven universal design principles: equitable use, fexibility,
simple and intuitive use, perceptive information, tolerance for error, low
physical effort, size and space for approach and use.
• Regarding Lallemand (2015), UX evaluation methods may be done as a
combination of 1–3 psychological needing and competences related to 12
UX categories (see Figure 11.1). He suggests that alone or as a team, select
1–3 relevant cards and think freely about as many design ideas as possible
related to each need. Ask yourself this question: How could we design our
system/product/service in order to shape an experience of (UX need, for
instance, competence)?
188
Handbook of Usability and User Experience
FIGURE 11.1 Lallemand psychological card-set technique to evaluate UX design products.
Source: Based on Lallemand (2015).
Combining literature information, psychological needs involving environment
behavior can be synthesized into seven categories (see Table 11.5).
Voordt and Wegen (2005) and Voordt (2009) agree with Hillier and Leaman
(1976) about distinguished four main functions of a building:
a) Spatial organization of activities: A building needs to provide optimum
support for the activities desired by properly arranging the available space.
b) Climate regulation: A building must provide an optimum interior climate
for the user, his activities and his property.
c) Symbolic function: A building can be seen as the material embodiment of
the specifc ideas and expectations not just of its designer but also of the client and the users. This makes it a cultural object, an object with social and
symbolic signifcance.
d) Economic function: A building requires investment and maintenance.
These categories implicate the sense of global architectural quality design, including
four subquality groups: functional (how suitable for activities the building is), aesthetic
(the perception of beauty of the building), technical (involving structure, material and
services) and physical quality (how capable it is of achieving an attractive, safe and
healthy interior climate, measured in terms of temperature, humidity, illumination,
natural lighting and acoustics, in an environment-friendly and energy-saving way).
Physical needs involving environmental behavior (see Table 11.6) are also related
to sustainable principles and building design for all. Attaianese (2016) defned six
categories of sustainable principles that are the bases of a theoretical approach developed in this chapter: energy effciency (1), functionality and serviceability (2), operation and maintenance (3), occupants comfort (4), accessibility and inclusivity (5), and
health and safety of construction workers (6).
The Built Environment
189
TABLE 11.5
Psychological Needs Involving Environment Behavior
Pleasure
stimulation
Perception of aesthetic aspects such as colors, forms, human scale, shapes
infuence, positive landscape, comfort conditions and nature interactions that
stimulate enjoyment feeling, performing a leisure or playful activity, having fun
on experiencing new sensations and activities
Relatedness/
belongingness
To a place, neighborhood or city by putting participant of a group or community,
being aware of others’ emotions, activities or mood, expressing feelings or
emotions in a wide variety of ways, having a sense of physical intimacy and
caring about others
Of a built environment physical condition, against adverse climate or violence, and
in social interactions, having a comfortable set of routines and habits, being safe
from threats and uncertainty, being in control of events and personal movements,
understanding how things work and interacting with transparent and clear systems
and equipment
For using/managing environment elements and equipment correctly, usability
attributes to complete diffcult tasks, affordance conditions, learning how to do
things or walk self-secure, interact effectively with the environment and people
To move him/herself alone in architectural spaces, going toward desired points in
urban spaces, to use public transport and access public information, feeling that
activities are self-chosen and self-endorsed, having meaningful choices,
personalizing one’s environment and not being overly pressed or infuenced to do
something
As a person among a community, feels that your opinion is important, being
recognized as valuable person, making friends
Security—
control
Competence—
effectiveness
Autonomy—
independence
Infuence—
popularity
Self-actualizing
By attaining a deeper understanding of oneself, becoming who one really is and
developing creativity and spontaneity
Source: Adapted from Attaianese (2016), Gehl (2010) and Lallemand (2015).
The proposed theoretical model was designed to promote a qualitative comprehension about the relation between UX elements, sustainability and design for all
criteria about the building/urban space they use, live or work (see Figure 11.2). In
practical terms, the approach can be used by designers and architects along ideation
design process to develop an usability thinking environment design, as asking him/
herself this question: How could we design our environment in order to shape an
experience of UX for support psychological and physical needs? Results can be
written, sketched and/or spoken in a way to combine solutions, ideas and restrictions
to improve design process.
Figure11.2 shows the relation between sustainable principles for building design
and how these principles may be related to human basic needs about the environment, considering physical and psychological aspects. Energy effciency, operation and maintenance and functionality and serviceability categories seem to be
more related to physical human needs; so, accessibility and inclusivity, occupants’
190
Handbook of Usability and User Experience
TABLE 11.6
Physical Needs Involving Environment Behavior
Reachability and
parking
facilities
The facility to reach the place or building in a city space by car, bus, bicycle or
other way of transport
Effciency
The facility that allows an easy performance inside building with little use of
resources
The facility of access and use of environments, products and services by any
person and in different contexts, when people in normal physical condition or
with varying limitations can experience the built environment so full and
complete (Guimarães, 1999)
Facility that allow users how to recognize the identity and functions of spaces, and
the way to move and use it (Dischinger, 2001)
Easily adjustable condition to suit changing circumstances (Voordt, 2009)
The capacity to feel yourself physically safe when using and moving inside the
building
The conditions of habitability, respecting thermal conditions, ventilation,
insulation, acoustic and visual and others able to change the performance of the
building in its context, and the rational use of available resource
Accessibility
Spatial
orientation
Flexibility
Safety
Environmental
comfort
Readability
The possibility of organizing the environment within a pattern of consistent image
generation (Lynch, 1960), which directly depends on the legibility of space
Source: Based on Bittencourt et al. (2015), Voordt and Wegen (2005), Voordt (2009), Lynch (1960),
Dischinger (2001) and Guimarães (1999).
comfort, health and safety of workers categories are both related to physical and
psychological human needs.
In this way, this model needs to be detailed and tested using case studies and suitable tools applied to users and experts, a similar strategy used by Afacan and Erbug
(2009) to develop universal design heuristics for usability tests. That step will be
shown in future results.
It is important to improve studies about usability and UX approaches to the building design by developing new methods and tools that are mainly based on users’
experience, as well as by introduction of new technology resources in usability and
UX methods, and/or by using virtual reality as tool to obtain users’ and experts’
perception about built environment. Such trends are also mentioned by Emo et
al. (2016), Afacan and Erbug (2009), Becker-Asano, Ruzzoli, Hölscher and Nebel
(2014), Turner and Penn (2002) and Lehman (2011).
11.5 FUTURE RESEARCHES
Emo et al. (2016) affrm that in a contemporary architectural scene, innovation in
the design of the built environment can be supported with technical tools, analyses
and empirical models, but not alienated from users’ experiences that are essential for
The Built Environment
191
FIGURE 11.2 Theoretical model for sustainable and usability design thinking based on
users’ needs. Source: The authors.
any modeling or design approach. It is powerful to transform research fndings into
design interventions for a better city/building. In this way, developing and testing
new forms of combining theories may be a suitable strategy to obtain a more sustainable architectural design by addition usability and UX approaches to design process.
An evolution of observation researches with new mobile technologies (such as eye
tracking, recording of biometric data) allows for the accurate frst-person recording
of a user’s experience. This has the potential to revolutionize the nature of postoccupancy evaluation studies, an area where research and practice converge (Emo et
al., 2016). In this direction, an interesting study was done by Paiva (2018) to evaluate
elderly people’s perception about built environment using neuroscience technologies.
Paiva’s (2018) aim was to understand the importance of space, its functions and its
characteristics focused on ergonomics studies for human aging, considering cognitive processes and elderly physical and mental limitations.
Virtual world modeling throughout usability and UX studies make it possible to test
design interventions in a controlled setup. An area that still has scope for development
is the use of cognitively infused agents in virtual models, as a means of analyzing how
people might move around such a space in the real world. The level and nature of the
192
Handbook of Usability and User Experience
cognitive input that such agents might have are still a matter of debate (Becker-Asano,
Ruzzoli, Hölscher & Nebel, 2014; Turner & Penn, 2002; Sanders, 2013).
Sensory stimuli applied to building design should not be used only for aesthetic reasons, but also to unite function with form in such a way that occupants engage with their
buildings on cognitive, behavioral, emotional, physiological and even spiritual levels.
Sensory design is useful to architects as project advantages, so they can use stimuli to
evoke a range of human processes in their occupants (Lehman, 2011), helping on users’
environment perception and including clues to improve accessibility conditions.
These strategies can be ways to apply UX techniques to train architects and urban
planners to connect usability concepts of the built environment to people’s actual
needs and diversity, making places supportive for human activities and tasks. There
are contemporary potentialities in architectural user-centered design, as an indefnite number of felds need to be explored, in order to have housing, working places
and urban spaces more sustainable for diverse people.
REFERENCES
Afacan, Y., Erbug, C. (2009). An interdisciplinary heuristic evaluation method for universalbuilding design. Applied Ergonomics, v. 40, pp. 731–744.
Alexander, K. (ed.). (2006). Usability of Workplaces, CIB Report, Publication 306. Rotterdam,
Netherlands: International Council for Research and Innovation in Building and
Construction.
Alexander, K. (2006). The application of usabilityconcepts in the built environment. Journal
of Facilities Management, v. 4 n. 4, pp. 262–270.
Alexander, K. (2008). Usability: Philosophy and concepts. In: CIB (2008). CIB Report 316
– Usability of Workplaces, Phase 2. Rotterdam, Netherlands,International Council for
Research and Innovation in Building and Construction; pp. 6–15.
Attaianese, A., Acierno, A. (2018). La progettazioneambientale per l’inclusionesociale: ilruo
lodeiprotocollidicertifcazioneambientale. Techne, v. 14, Firenze University Press, pp.
76–87.
Attaianese, E. (2012). A broader consideration of human factor to enhance sustainable
buildingdesign. Work, 41(sup. 1), pp. 2155–2159.
Attaianese, E. (2016). Enhancing sustainability embodying human factors in building design.
In: Soraes,M.,Rebelo,F. (eds.), Ergonomics in Design: Methods and Techniques. Boca
Raton, USA: CRC Press, Taylor & Francis Group, pp. 447–464.
Attaianese, E. (2018). Green buildings: The role of HFE. In: Thatcher, A., Yeow, P. (eds.),
Ergonomics and Human Factors for a Sustainable Future. Singapore: PalgraveMacmillan, pp. 211–242.
Becker-Asano, C., Ruzzoli, F., Hölscher, C., and Nebel, B. (2014). A multi-agent system
based on unity 4 for virtualperception and wayfnding. In: Pedestrian and Evacuation
Dynamics 2014 (PED2014). Transportation ResearchProcedia, v. 2, pp. 452–455.
Berardi, U. (2015). Sustainability assessments of buildings, communities, and cities. In:
Klemes, J. J. (ed.), Assessing and Measuring Environmental Impact and Sustainability.
Oxford, UK: Elsevier, pp. 497–545.
Bevan, N. (2008). Classifying and selecting UX and usability measures. In: Proceedings of
VUUM2008, Reykjavik, Iceland, pp. 13–18.
Bittencourt, Mª. C., Pereira, V. L. D. V., Pacheco Júnior, W. (2015). The usability of architectural spaces: Objective and subjectivequalities of built environment as multidisciplinary
construction. In: Procedia Manufacturing, AHFE 2015, Elsevier, n. 3, pp. 6429–6436.
The Built Environment
193
Blakstad, S. H., Hansen, G. K., Knudsen, W. (2008). Methods and tools for evaluation of
usability in buildings. In: CIB (2008). CIB Report 316 - Usability of Workplaces,
Phase 2. Rotterdam, Netherlands, InternationalCouncil for Research and Innovation in
Building and Construction, pp. 26–37.
Blakstad, S. H., Olsson, N., Hansen, G., Knudsen, W., et al. (2010). Usability mapping
tool. In: CIB (2010). CIB W111 CIB Report 330 – Usability of Workplaces, Phase 3.
Rotterdam, Netherlands, InternationalCouncil for Research and Innovation in Building
and Construction, pp. 17–29.
Bluyssen, P. M., Fernandes, E. O., Groes, L., Clausen, G., Fanger, P. O., Valbjørn, Ø.,
Bernhard, C. A., Roulet, C. A. (2004). European indoor air quality audit project in 56
offce buildings. Indoor Air, n. 6, v.4, pp. 221–238.
Brown, Z., Cole, R. J.,Robinson, J., Dowlatabadi, H. (2010). Evaluating user experience in
green buildings in relation to workplace culture and context. Facilities, v. 28, n. 3/4,
Emerald Group, pp. 225–238.
Chamorro-Koc. (2007). Experience Contact-of-Use and the Design of the Product Usability.
Faculty of Built Environment and Engineering Queensland University of Technology.
Dissertation, Doctor Philosophy. Australia.
Charytonowicz, J. (2007). Reconsumption and recycling in the ergonomic design of architecture. In: Stephanidis, C. (eds.), Universal Access in Human-Computer Interaction.
Ambient Interaction. UAHCI 2007. Lecture Notes in Computer Science, vol 4555.
Berlin, Heidelberg: Springer, pp. 313–322.
CIB. (2006). CIB Report 306 - Usability of Workplaces, Phase 1. Rotterdam: International
Council for Research and Innovation in Building and Construction.
CIB. (2008). CIB Report 316 - Usability of Workplaces, Phase 2. Rotterdam: International
Council for Research and Innovation in Building and Construction.
CIB. (2010). CIB W111 CIB Report 330 – Usability of Workplaces, Phase 3. Rotterdam:
International Council for Research and Innovation in Building and Construction.
Cozza, S., Tuor, R., Sonderegger, A., Jusselme, T., Lalanne, D., Andersen, M. (2018). Usability
assessment of building performance simulation tools: A pilot study. In: Elsharkawy,H.,
Zahiri, S.CloughJ. (eds.), Proceedings of International Conference forSustainable
Design of the Built Environment SDBE 2018, London, pp. 25–36.
Davis, G., Thatcher, C., and Blair, L. (1993), Serviceability Tools, 1–5. Ottawa, The
International Centre for Facilities.
Dischinger, M. (2001). Designing for all senses: Accessible spaces for visually impaired citizens. In: Dischinger, M., Vera, B. (eds.), Acessibilidade e Orientabilidade no Terminal
Rodoviário Rita Maria. Florianópolis: Grupo PET/UFSC.
Ekambi-Schmidt, J. (1974). La percepcióndel hábitat. Barcelona: Editorial Gustavo Gili, S.A.
Emo, B., Kinda Al-Sayed, K., Varoudis, T. (2016). Design, cognition & behaviour: Usability
in the built environment. International Journal of Design Creativity and Innovation,
v. 4, n. 2, pp. 63–66.
Fenker, M. (2008). Towards a theoretical framework for usability of buildings. In: CIB
(2008). CIB Report 316 - Usability of Workplaces, Phase 2. Rotterdam, Netherlands:
International Council for Research and Innovation in Building and Construction, pp.
16–26.
Fischer, E. A. (2011). Issues in Green Building and the Federal Response: An Introduction.
Washington, DC: Congressional Research Service.
Forlizzi, J.,Battarbee, K. (2004). Understanding experience in interactive systems. In:
Proceedings of the 5th Conference on Designing interactive Systems: Processes,
Practices, Methods, and Techniques. DIS’04, August, 2004, Cambridge, USA, ACM,
New York, pp. 261–268.
Gehl, J. (2010). Cities for People. Island: Island Press.
194
Handbook of Usability and User Experience
Ghani, A. A. A., Hamid, M. Y., Haron, S. N., Ahmad, N. A., Bahari, M., Wahab, S. N. A.
(2016). Methods in mapping usability of Malaysia’s shopping centre. In: Proceedings of
MATEC Web of Conferences66, v. 117. EDP Science.
Gould, J. D., Lewis, C. (1985). Designing for usability: Key principles and what designers
think. In: Communications ofthe ACM, pp. 50–53.
Guimarães, M. P. (1999). Acessibilidade ambiental para todos na escala qualitativa da
cidade. Topos Revista de Arquitetura e Urbanismo, Belo Horizonte, v. 01, n. 01,
pp. 124–133.
Hansen, G. K., Blakstad, S. H., Knudsen, W., Olsson, N. (2010). Usability walkthroughs. In:
CIB (2010) CIB W111 Usability of Workplaces - Phase 3. Rotterdam: International
Council for Research and Innovation in Building and Construction, pp. 31–84.
Harun, S. N., Hamida, M. Y., Talibb, A., Rahimc, Z. A.(2011). Usability evaluation: Criteria
for quality architecture in use. Procedia Engineering, v. 20, pp. 135–146. Elsevier.
Hassenzahl, M., Tractinsky, N. (2006). User experience – A research agenda. Behaviour and
InformationTechnology, v. 25, n. 2, pp. 91–97.
Hedge, A. (2008). The sprouting of “green” ergonomics. HFES Bulletin, v. 51, pp. 1–3.
Hillier, B., Leaman, A., Stansall, P., Bedford, M. (1976). Space syntax. Environment and
Planning, B, v. 3, n. 2, pp. 147–185.
International Standards Organization. (1998). ISO 9241 – 11, Ergonomics of Human System
Interaction. Geneva, Switzerland, ISO.
Jensen, P. A. (2010). Managing for usability of the built environment. In: CIB (2010). CIB
W111 Usability of Workplaces - Phase 3. Rotterdam: International Council for Research
and Innovation in Building and Construction, pp. 69–79.
Ketola, P., Roto, V. (2008). Exploring User ExperienceMeasurement Needs. 5th COST294MAUSE OpenWorkshop on Valid Useful User Experience Measurement (VUUM).
Reykjavik, Iceland.
Koskinen, I., Zimmerman, J., Binder, T., Redström, J., Wensveen, S. (2011). Design
Research Through Practice, From the Lab, Field, and Showroom. Whaltan: MK
Elsevier, 223p.
Lallemand, C. (2015). Towards Consolidated Methods for the Design and Evaluation of User
Experience (Doctoral dissertation). University of Luxembourg.
Law, E., Roto, V., Hassenzahl, M., Vermeeren, A., Kort, J. (2009). Understanding, scoping
and defning user experience: A survey approach. In: Proceedings of Human Factors in
Computing Systems, CHI’09. April 4–9, 2009, Boston, MA.
Lehman, Mª. L. (2011). How sensory design brings value to buildings and their occupants.
Intelligent Buildings International, v. 3, n. 1, pp. 46–54.
Lynch, K. (1960). Aimagem da Cidade; The Image of The City. Massachusetts Technology
Institute, and Harvard College. Edições 70. Lisbon.
Marcus, A. (2009). User-experience development. In: M.Kurosu (ed.), Human Centered
Design, HCII 2009, First International Conference, HCD 2009, Held as Part of HCI
International 2009, San Diego, CA, USA, July 19-24, 2009 Proceedings .. Berlin:
Springer-Verlag, pp. 611–617.
Martin, K., Legg, S., Brown, C. (2013). Designing for sustainability: Ergonomics – Carpe
diem. Ergonomics, v. 56, n. 3, pp. 365–388.
Naumann, A. B., Wechsung, I., Schleicher, R. (2009). Measurements and concepts of usability
and user experience: Differences between industry and academia. In: Kurosu, M. (ed.),
Human Centered Design, HCII 2009, First International Conference, HCD 2009, Held
as Part of HCI International 2009, San Diego, CA, USA, July 19-24, 2009 Proceedings.
Berlin: Springer-Verlag pp. 618–626.
Nicholls, A. R. J., Boueri Filho, J. J.(2001). O Ambiente que Promove a Inclusão. Conceitos de
Acessibilidade e Usabilidade. Assentamentos Humanos, v. 3, n. 2, pp. 49–60.
The Built Environment
195
Nielsen, J. (1992). Finding usability problems through heuristic evaluation. In: Proceedings
of CHI ’92, California, pp. 373–380.
Nielsen, J. (1994). How to conduct a heuristic evaluation. In: Nielsen, J., Mack, R. L. (eds.),
Usability Inspection Methods. New York: John Wiley and Sons, pp. 25–36.
Noguchi, M., Ma, N., Min Woo, C. M., Chau, H., Zhou, J.(2018). The usability study of a
proposed environmental experience design framework for active ageing. Buildings, v.
8, n. 167, pp. 2–16. doi: 10.3390/buildings8120167
Paiva, M. M. B.(2018). Percepção de salas residenciais por idosos, uso das técnicas de Seleção
Visual, Realidade Virtual e Eletroencefalografa (DoctoralThesis) Universidade
Federal de Pernambuco, Recife, Brazil.
Peffer, T., Perry, D., Pritoni, M., Aragon, C., Meier, A. (2013). Facilitating energy savings
with programmable thermostats: Evaluation and guidelines for the thermostat user
interface. Ergonomics, v. 56, n. 3, pp. 463–479.
Pheng, L. S. (1996). Total quality facilities management: A framework. Journal Facilities, v.
14, n 5/6, pp. 5–13.
Preiser, W. F. E. (2003). Improving Building Performance. Washington, DC: NCARB.
Monograph Series.
Preiser, W. F. E., Rabinowitz, H. Z., White, E. T. (1988). Post-Occupancy Evaluation. New
York: Van Nostrand Reinhold.
Roto, V. (2008). User Experience Research in the Designand Development Phase. Keynote at
the User Experience & User Generated Content Workshop, Salzburg, Austria.
Roto, V., Väänänen-Vainio-Mattila, K., Law, E., Vermeeren, A. (2009). User experience
evaluation methods in product development (UXEM’09). In: Gross T. et al. (eds.),
Human-Computer Interaction – INTERACT 2009. INTERACT 2009. Lecture Notes
in Computer Science, vol. 5727. Berlin, Heidelberg: Springer, pp. 981–982. https://doi
.org/10.1007/978-3-642-03658-3_141
Rowley, J. (1994). Customer experience of libraries. Library Review, v. 43, n. 6, pp 7–17.
Sanders, E. B. N. (2013). Prototyping for the design spaces of the future. In: Valentine, L.
(ed.), Prototype: Design and Craft in the 21st Century. London: BloomsburyAcademic,
pp. 59–74.
Sanoff, H. (2001). School Building Assessment Methods. Washington, DC: National
Clearinghouse for Educational Facilities.
Turner, A., Penn, A. (2002). Encoding natural movement as an agent-based system: An investigation into human pedestrian behavior in the built environment. Environment and
Planning B: Planning and Design, 29, 473–490.
Villarouco, V. (2008). Construindo uma metodologia de avaliação ergonômica do ambiente. In: Anais do XV Congresso Brasileiro de Ergonomia – ABERGO. Porto Seguro:
ABERGO.
Villarouco, V. (2011). Tratando de ambientes ergonomicamente adequados: seriam
ergoambientes?In: Mont’alvão, C., Villarouco, V. (eds.), Um novo olhar para o projeto:
a ergonomia no ambiente construído. Rio de Janeiro: Faperj, pp. 25–46.
Villarouco, V., Leão, N. S. R., Paiva, M. M. B., Sarmento, T. F. C. S.(2016). An ergonomics
focus on built environment for the elderly. In: Soares, M., Rebelo, F. (eds.), Ergonomics
in Design. Boca Raton, FL: CRC Press, pp. 145–167.
Vischer, J. C. (2008). Towards a user-centred theory of thebuilt environment. Building
Research & Information, v. 36, n. 3, pp. 231–240.
Voordt, T. J. M. (2009). Quality of design and usability: An etruvian twin. Qualidade do
projeto e usabilidade: um gêmeo de Vetrúvio. Ambiente Construído, Porto Alegre, v.
9, n. 2, pp. 17–29.
Voordt, T. J. M., Wegen, H. B. R. (2005). Architecture in Use: An Introduction to the
Programming, Design and Evaluation of Buildings. Oxford: Architectural Press.
196
Handbook of Usability and User Experience
Warell, A. (2001). Design Syntactics: A Functional Approach to Visual Product Form,
Theory, Models and Methods. Dissertation, Chalmers University of Technology,
Gothenburg, Engineering and Industrial Design, Product and Production Development.
Zink, K., Fischer, K. (2013). Human factors and ergonomics: Contribution to sustainability
and decent work in global supply chains. In: Tatcher, A., Yeow, P. (eds.), Ergonomics and
Human Factors for a Sustainable Future, Current Research and Future Possibilities.
Singapore: Palgrave Macmillan, pp. 243–270.
12
A Human-Centered
Architecture
Considering Usability
and User Experience in
Architectural Design
Elisângela Vilar, Francisco Rebelo, Paulo
Noriega and Ernesto Filgueiras
CONTENTS
12.1 Introduction .................................................................................................. 197
12.2 UX and Usability and Human-Centered Design Concepts .......................... 199
12.3 Built Environment and Human Behavior ..................................................... 201
12.3.1 UX, Usability, HCD and Architecture .............................................203
12.3.2 The Human-Building Interaction Concept .......................................205
12.3.3 The Human-Centered Architecture..................................................208
12.4 Conclusions................................................................................................... 210
Notes ...................................................................................................................... 211
References.............................................................................................................. 211
12.1 INTRODUCTION
At the beginning of the 21st century, according to a research sponsored by the U.S.
Environmental Protection Agency and carried out by Klepeis and colleagues (2001),
about 87% of peoples’ daily time is spent indoors. This data is overwhelming and
clearly shows the importance of built space in human lives. In fact, as stated by
Winston Churchill when debating the project of Giles Gilbert Scott for the reconstruction of the British Commons Chambers, “we shape our buildings, and afterwards our buildings shape us” (Brand 1994).
Considering the effect that the built environment has on world development, it
was on the agenda of the World Economic Forum (WEF) Annual Meeting 2017
in Davos-Klosters, and the initiatives such as the “Future of Construction” were
discussed. According to the report of the WEF (World Economic Forum 2017), this
initiative, started in 2015, aims to analyze the implications of change in architecture, engineering and construction (AEC) through technology on business strategy,
DOI: 10.1201/9780429343490-15
197
198
Handbook of Usability and User Experience
skills and organizational design, fnancing and risk allocation and other fundamental
areas. Among others, the WEF established as fundamental area, fexibility, livability
and well-being, which is related to creating infrastructure and buildings that improve
the well-being of end users. Additionally, the report from WEF also presents and
discusses ten innovative initiatives in the AEC area, from buildings to start-ups, that
adopt technology-based solutions, mainly related to the use of building information
modeling (BIM), 3D printing, wireless sensing and autonomous equipment solutions. It also points that over the past 50 years, no fundamental change occurred in
the AEC industry and that new technologies have been slowly adopted.
With the new global challenges, such as climate change, resource shortage and
rapid demographic shifts in emerging and developed countries alike, thinking about
how the built environment can evolve as an affordable, sustainable and happy place,
promoting well-being, for many people is of paramount importance, and new technologies could be of great value for tackling these challenges.
Technological advances already affected the way people plan and use the built
environment, so considering technology as a motor for change is not a recent fact.
The evolution of a new thought, the intensifcation in production and massifcation
of some materials, such as iron, coal and cotton, contributed, in the 19th century,
to the massive changes in infrastructure and architecture of the cities. For example,
with new supporting technologies, such as the steel skeletal structure, new building
designs emerged (Moon 2005), together with a new way to interact with the built
environments; the small buildings were gradually replaced by increasingly tall skyscrapers, while the pedestrians and horses gave their space to the cars, also changing
the way people interact with the urban space.
In 2020, a new challenge was faced with the new coronavirus SARS-CoV-2 causing
a pandemic due to its rapid global spread, and its impact on our buildings and cities is
still unknown. With lack of knowledge about this new virus and with the necessity of
social distancing, massively adopted as the main strategy to diminish the virus spread,
telework and the reduction of mobility were encouraged. So, the changes in the daily
dynamic made people to spend more and more time in their houses, and to prefer open
to closed urban spaces, boosting the adoption of strategies that reduce the chances
of the contagion. Thus, what has been seen nowadays is a huge amount of people
who used to leave their homes during most part of the day for doing several types of
activities, from going to work to having dinner with friends, adopting a more homely
behavior supported by an increase of digital habits. For example, physically going to
the supermarket was replaced by shopping through the Internet, as well as physical
meetings were replaced by online ones. Additionally, bicycles have been even more
recognized as an effcient transportation method as they promote mobility through the
city while also increasing social distance. In this way, the house has integrated new
functions, such as supporting teleworking and distance learning, as well as the urban
space, that need to be adapted to support social distance and outdoor activities.
The use of technology was already considered by Groat and Wang (2002) when
examining research in architecture. According to the authors, the global economic trends
are infuencing many professions, including architecture, and research on the scope of
architectural practice, in the light of new technological advances, needs special urgency.
A Human-Centered Architecture
199
Besides, some authors (e.g., Noguchi, Ma, Woo, Chau, & Zhou, 2018) argue that
design decisions are misaligned with the users’ needs, expectations and experiences,
mainly due to overvaluation of the prescribed building codes. And that considering
users in the center of the architectural design process should decrease the discrepancies between users’ needs and built environment opportunities (Verma, Alavi, and
Lalanne 2017).
In this context, this chapter will discuss people’s interactions with built environments, and how the new technologies are changing this interaction and also
changing the architecture. In the light of user experience (UX) and usability concepts, and considering the experience already accumulated in the human factors
and ergonomics area and its relation with architecture, the human-building interaction (HBI) is analyzed and some examples of human-centered architecture are
given.
12.2 UX AND USABILITY AND HUMANCENTERED DESIGN CONCEPTS
Much has been said about UX and usability in the built environment. However,
usability and UX concepts were frst basically related to ergonomics and human–
computer interaction (HCI), mainly considering the relationship between users and
software or technological products.
According to Schackel (2009), with the widespread use of microcomputers from
1980 and portable computers from 1990 by all types of users and for many different
purposes, the usability problems when interacting with those devices became more
evident. Also, users become more aware and much more selective, partly due to
experiences of poor usability.
Thus, in 1998, usability was incorporated in a standard and the International
Organization for Standardization (ISO) defned it as the “extent to which a product
can be used by specifed users to achieve specifed goals with effectiveness, effciency and satisfaction in a specifed context of use” (International Organization for
Standardization 1998).
As usability was more correlated with performance aspects, with authors linking the failure in usability with monetary loss, low productivity and time wastage
(Madan and Dubey 2012), the term user experience evolved into a more emotionrelated aspect of the products.
In 2010, ISO 9241-210 (International Organization for Standardization 2010) was
revised and the UX defnition was included, considering it as “user’s perception and
responses that result from the use and/or anticipated use of a system, product or
service.” The same ISO also refers that the perceptions and responses are related to
users’ emotions, beliefs and preferences.
While usability is considered a product-related aspect, UX is an interactionrelated feature. The revision of the ISO 9241-11 (International Organization for
Standardization 2018), in 2018, incorporated the built environment in its scope, in a
way that the concepts of UX and usability should also be applied to situations where
people use the built environment.
200
Handbook of Usability and User Experience
Together with the new demand that arose from the heterogeneity of the new users—
with different levels of knowledge, expertise and expectations—and the development
and dissemination of new technological products, namely, personal computers, a new
paradigm for design based on human, called human-centered design (HCD) arose and
led to notable differences in the resulting product, system or service.
In their edited volume, Norman and Draper (1986) recommend considering the user
at the center of a design process. In this book, the authors directly put the emphasis on
people, not on technology, through a set of chapters in which the invited authors write
around this central point, setting the base for the human-centered design methodology.
This new paradigm for interactive systems’ design was later systematized in an
ISO standard (International Organization for Standardization 2019), and the HCD
defnition was set as an approach focused on users, considering their needs and
requirements, to develop usable and useful interactive systems by applying ergonomics and usability knowledge and techniques.
Despite the fact that the HCD is still directed to the computer-based interactive
systems (International Organization for Standardization 2019), it can be applied to a
broad range of systems with which humans can interact. According to ISO 9241-11
(2018), HCD is “an approach to system design and development that aims to improve
usability, accessibility and user experience and avoid harm from use, by focusing on
the use of the system.”
HCD is described as an iterative development cycle in which people and their
relations are considered in the center of the design process according to some key
principles (International Organization for Standardization 2010):
• Increasing the productivity of users and the operational effciency of
organizations;
• Being easier to understand and use;
• Increasing usability for people with a wider range of capabilities and thus
increasing accessibility;
• Improving user experience;
• Reducing discomfort and stress;
• Providing a competitive advantage;
• Contributing toward sustainability objectives.
In fact, this new paradigm was highly infuenced by the ergonomics feld of
study. According to Dul and Weedmeester (2008), the International Ergonomics
Association defnes ergonomics as
the scientifc discipline concerned with understanding of the interactions among
humans and other elements of a system, and the profession that applies theory, principles, data, and methods to design in order to optimize human well-being and overall
system performance.
It focuses on optimizing the interaction system in a way to meet health, safety and
performance criteria. Ergonomics has a multidisciplinary human-centric approach
A Human-Centered Architecture
201
FIGURE 12.1 Interdependence of HCD activities.
and does not have a specifc domain. Thus, it considers cognitive, environmental,
organizational, physical and all other relevant aspects of the interactions between
the human and other elements of the system (e.g., other humans, tools, technology
and environment).
In this way, the human-centered design methodology, considering the ergonomics’ systemic approach, is an iterative process that comprises six main phases. This
process starts with a planning phase, followed by a set of interdependent activities
that occur in an iterative cycle (International Organization for Standardization 2010),
as can be seen in Figure 12.1.
When considering architecture, all goals established for HCD are also the focus
of the architectural process. However, while HCD puts humans and all their contextual interactions at the center of the process, architecture has its basis in facility programming—that is, a set of functional areas and patterns of use of space—and since
the 1980s, some architectural schools have changed its focus from form-making to
buildings shape (Cherry and Petronis 2016). Thus, architecture still overvalues facility programming and regulation codes (Noguchi, Ma, Woo, Chau, & Zhou, 2018),
and the human factor is considered only in terms of functional needs.
12.3
BUILT ENVIRONMENT AND HUMAN BEHAVIOR
The built environment can be understood as a manmade surrounding in which activities can be performed, from large-scale public areas to personal spaces. According to
Moffat and Kohler (2008), conventionally, the built environment is usually analyzed
as a piece of private property (the parcel), or as a collection of properties with their
buildings infrastructure and constructed open spaces. Handy and colleagues (2002)
also state that the built environment is a changeable system that can be defned in
202
Handbook of Usability and User Experience
terms of their subsystems: urban design, land use and transportation system, including records of human activity within the physical environment.
The built environment comprises three interconnected aspects: physical, spatial
and social. Thus, the physical elements of a building (physical aspect such as walls)
create the space (the spatial element in which human activity occurs), and each of
them has a social value (social element) (Hillier 1996). These social values are in
the physical aspect, for example, in the shaping and decoration elements with their
functional and/or cultural signifcance; and in the spatial aspect, by providing spatial
patterns of activities and relationships (Alavi et al. 2016).
A central point in the built environment defnition is human activity, as it could
be infuenced by the built environment, but it should also shape the way the built
environment is planned and used. Thus, understanding this mutual relationship
between human activity and the built environment could be crucial to improve
mutual interaction.
For this, knowledge of the needs of the built environment users should be the
central point of the architectural process. John Zeisel, in 1975 (Zeisel 1975), had
already pointed out that, since the Industrial Revolution, knowing users’ real needs
while interacting with new large buildings daily used by a diverse type of visitors
(such as universities, offce buildings, hotels, hospitals, factories, apartment buildings) become more diffcult to the architects. It happens because, with the new buildings’ demand that arose with the new industrialized city, there was a change in the
architect’s client, with the emergence of a new relationship, turning it from an architect–user/owner relationship into an architect–owner/paying client–user client relationship. Architects have now two main clients, the one who pays for and the others
who use the product of their design. Thus, in this situation, architects are familiar
only in a general sense with the type of people who will use their buildings, relying
on a dialogue with the paying client. Zeisel also argues that it may create a large
communication gap, which the architects try to minimize by designing buildings
according to their concept of function. According to the author, it could be better
solved if social research would be more integrated with architectural design, in a
way that the human activity could be better investigated and understood in order to
be applied to the architectural project.
Some authors (e.g., Appleyard, 1980; Whyte, 1980) have already focused their
research on human behavior to understand how the built environment can infuence
users’ satisfaction, performance and even health in urban areas.
In 1980, Whyte (1980) wrote a seminal book which is a manual about why some
urban areas work and others don’t. Using direct observation techniques (very little
used at this time to study the dynamics of an urban area), he started studying parks
and playgrounds in New York City motivated by an emerging concern over urban
crowding. However, the main fndings from direct observation suggested a lack of
crowding in many of these areas, even in neighborhoods with a very high density of
people, while some streets were full of children playing, contradicting the assumption that children play on the streets because they lack playground spaces. The
authors expand their research to the plazas built in the light of an incentive bonus
given to builders by New York City since 1961. So, builders could add 10 square feet
A Human-Centered Architecture
203
of commercial foor space for each square foot of plaza they provided. Researchers
recorded human activity involving plazas in order to acquire daily patterns of use
and inquired users about the frequency they used the plaza, what they thought of it,
where they worked and where they came from. The fndings suggest that most users
were young offce workers and that most of them were not workers from the plaza’s
building. The reason for this dynamic is that workers want to keep some distance
from their work, creating an interesting movement of people. According to Whyte
(1980), this dynamic highlights a key factor: supply creates demand.
Whyte’s studies about the way human activity can shape urban space, and how
urban space can infuence human behavior were of paramount importance for architectural thinking mainly regarding putting the users at the center of the architectural
design process.
Unfortunately, according to Handy and colleagues (2002), when discussing about
urban planning, the direct assessment of the relationship between human activity
and the built environment and its infuence on the individuals is still rare. Noguchi
and colleagues (2018) also argued that, despite the high impact that the architectural
design has on users’ physical and perceived comfort levels in the built environment,
the notion of such infuence and the design of this experience is barely applied to the
practices of architecture today.
However, with the increased incorporation of technology-produced materials, and
also the concepts of UX, usability and human-centered design in the architecture
project, architectural thinking is also evolving in a more human-centered experience.
Nowadays, architecture evolved in a way that the idea of an adaptative architecture, as proposed by Cedric Prize in his Fun Palace (Mathews Hobart and Smith
Colleges 2005), could be considered plausible, thanks to the use of new technological systems and to the growing awareness by the architects that the user is now not
seen as a spectator. In this sense, some architects have already recognized that the
human factors/ergonomics feld, with its research and design methodologies, mainly
those related to the human–computer interaction, could be a helpful ally to architectural design. In the same way, the human–computer interaction feld evolved and
its research challenges have also changed, from a restricted focus on technological
systems to the recognition of its relevance to other disciplines, incorporating other
knowledge and expanding the human–computer interaction approach.
With the spread of ubiquitous computing, turning the built environment into a
large-scale technological product, as well as the increasing consciousness of users
about the quality of a product/built environment, the HCD approach has been
adapted for a broad range of applications, including architecture. Incorporating these
concepts could be an infuential support for architectural practice, providing professionals with benefcial tools and methods to achieve a better communication and
understanding of the needs and requirements of architectural product users.
12.3.1
UX, USABILITY, HCD AND ARCHITECTURE
Architecture has increasingly incorporated concepts from areas such as ergonomics,
environmental psychology and information technology, moving closer to the UX
204
Handbook of Usability and User Experience
and usability concepts and fostering the emergence of new approaches to planning
the built environment. From the developmental phase, with the introduction of a
building information model (BIM) and computer-aided design (CAD), modeling,
visualization, presentation—with virtual reality (VR), augmented reality (AR) and
3D printing—and approval of new materials and functions, such as the introduction
of sensors/actuators systems or monitoring visitors and adapting buildings to their
needs, to the construction phase—with using new techniques and process—new
technologies are being incorporated in the AEC industry. In this context, it is interesting to look at the built environment as a place for interaction frameworks that are
planned and designed considering the users’ needs and motivations.
Dade-Robertson (2013) argues that the built environment is being conceived more
and more as a user interface. The users of the space—visitors of a building, consumers in a mall, workers at an industry, and many others—are now considered as
a major part of a project model, in which their interactions with the built environment, mediated and/or optimized by technology, are key factors for the architectural
design process. Thus, there is a need for closely knowing users’ needs, capacities
and expectations to promote their effectiveness, effciency and satisfaction and, as
an ultimate goal, to enhance UX with and within the built environment (where the
human behavior can be mediated and/or optimized by technology).
Even with a still ambiguous attitude of the architects toward the participation of
users in the architectural planning activities because of the dual nature (i.e., artistic
dimension and social dimension) of architectural design, the participation of users
has increased in the last decades (Attaianese and Duca 2012). The social dimension
of architecture, in which the product of an architect’s work is the stage for social
activities and sharing experiences, encourages these professionals to involve users in
the architectural process from the beginning, even with the pressure of the artistic
dimension that is many times considered as an activity of individual inspiration.
According to Zeisel (2006), the control of the effects that design decisions can
make on user’s behavior should be the architect’s ultimate desire, despite that the
main objective of their work is to change physical settings through the architectural
design. So, the product of their work should meet its users’ social, psychological and
developmental needs. Additionally, with the introduction of technological features
into the architectural design, it is crucial for the architects to understand the new
interactions that these new technological environments can allow. The development
and introduction of technology into the built environment can radically change the
architecture project, changing also the way architects deal with the design process.
In fact, buildings were always a large-scale scenario for interaction, in which
human activity and building’s physical, spatial and/or social aspects can mutually
affect each other. For example, opening a window can affect the temperature and
light of a room, changing the physical aspect can infuence user’s comfort and wellbeing, as well as rearranging the furniture to reconfgure the space for a meeting
promotes change in the spatial aspect, which also promotes new social interactions.
Even when designed to be unchangeable, buildings are adapted constantly by their
usages that are also constantly changing (Brand 1994). Contradicting the idea that
architecture is permanent is the main focus of debate in Brand’s book How Buildings
A Human-Centered Architecture
205
Learn. This book starts with a cover history about two neighboring buildings which
had an identical design when they were built in the 19th century, but they are completely different (even in their use) in the 20th century. With this, the author argues
that considering a building only as a matter of space, forgetting the temporal dimension and all changes that this dimension brings (such as cultural and usage changes),
is inviable and even impossible, as building always will be adapted and changed,
physically, spatially and socially.
Nowadays, with the advance of new technologies, such as Internet of Things (IoT)
and sensing, some simple interactions are also changing. For example, the development
and improvement of voice interaction and personal assistants—such as Alexa from
Amazon, Google Assistant from Google and Siri from Apple—have enabled their users
to change room temperature and lighting, call friends, change the channel of television,
change music and so on only through voice commands. And, with more sophisticated
systems, based on sensors and actuators, the environment can adapt itself to the user
only by sensing their physiological data or by learning with their patterns of behavior.
The smart environment concept, such as smart cities, smart homes and smart
buildings, although more focused on sustainability, effectiveness or cost (Alavi et
al. 2019), has also enabled its users to effectively use the space and socially interact within the space. An example is the new dynamic created in space use by the
employees of Deloitte’s headquarters at Amsterdam. With the use of sensors that
inform employees about empty desks or other places (like tables and sofas in the
cafeteria or library areas) and the policy of “take a free place and work where you
want” adopted by the company, a new pattern of use was set. Despite the fact that the
building has areas planned for offce work and others planned for meetings, employees prefer to use the area of the cafeteria and open spaces in the halls to work or have
informal meetings. Additionally, as they can be informed by an app about the location of colleagues, they also start to work at the same place as their working group,
enhancing the creation of work teams (World Economic Forum 2017).
Thus, with the increasing incorporation of new technologies that promote interactivity with and/or within the built environment, new outlines and demands have
emerged when considering UX in architecture (Verma, Alavi, and Lalanne 2017). HCI
research and design can effectively contribute to architecture to understand these new
spatial-temporal dynamics and user’s demands that arise with those new opportunities
and interactions, in a way to chase the utopic dream of a user’s adaptable building.
The main questions that arise are those related to humans and their experience
with the built environment, mainly considering human values, needs and priorities
to refect, according to Alavi and colleagues (2019), the complexity of human interaction and social experiences with and within built environments. With this in mind,
a new area has been developed, the human-building interaction.
12.3.2 THE HUMAN-BUILDING INTERACTION CONCEPT
According to Alavi and colleagues (2019), HBI is an emergent area that seeks to
examine the involvement of HCI in studying the evolution and shaping of built environments. It emerges with the increasing incorporation of technology in the built
206
Handbook of Usability and User Experience
environment, allowing several new forms to interact with it. In this way, a defnition
of HBI could derive from the HCI’s concept and could be set as the study of the
human part of the interaction between the individuals and the built environment in
order to understand their needs and expectations, orienting all project phases, from
designing to construction and maintenance, promoting and optimizing human interaction with and within the built environment in a way that it can be achieved with
effectiveness, effciency and satisfaction, and ultimately enhancing UX.
Thus, designing for HBI should provide interactive opportunities for the occupants to shape the physical, spatial and social impacts of their built environments
(Alavi et al. 2016). For this, HBI also considers a multidisciplinary approach, adding
knowledge from several felds, to map user’s requirements and expectations, and
design solutions that meet these requirements, always aiming to enhance UX. DadeRobertson (2013) made a parallel between HCI and architecture considering that
both are supported by technical rigor and artful practice with the main objective of
solving diffuse and complex problems.
So, according to Alavi and colleagues (2017), HBI is an intersection of three
main domains, architecture and urban planning, HCI and new technologies (mainly
ubiquitous computing), to promote usability and UX in built environments and to
anticipate the questions that may arise with the new complexity of our interactive
experiences with the built space (Figure 12.2).
FIGURE 12.2
Human-building interaction as an intersection of three main areas.
A Human-Centered Architecture
207
From the beginning, studies in the HBI area were mainly in building performance
research, considering resources management and energy saving, in a way that the
building could adapt itself to user’s needs in order to manage the use of energy
resources, increasing building performance (e.g., Hsu et al., 2010; Jazizadeh et al.,
2012; Malkawi & Choudhary, 1999; Malkawi & Srinivasan, 2005). However, we
agree with Alavi and colleagues (2016) in considering a broader and human-oriented
perspective.
This perspective also defnes the extent of this human-building interaction, in
order to prevent users from inconvenience that may arise from considering all data
that can be acquired and used. An interesting approach to this issue was carried out
by Urquhart and colleagues (Urquhart, Schnädelbach, and Jäger 2019). In their work
three adaptive architecture applications based on IoT were considered in the light of
emerging information privacy and security regulations. Although regulatory concerns are not the focus of this chapter, it is important to refect on some implications
of creating smart environments.
Additionally, technology can allow changing the state of the environment, as
the potentially harmful situations could be created with the poor design of this
new interaction, affecting the safety of built environments’ users (Dasgupta et al.
2019). Consider, for example, a smart building in an emergency situation like a fre.
Previous studies (e.g., Vilar, Rebelo, Noriega, Duarte, & Mayhorn, 2014; Vilar,
Rebelo, Noriega, Teles, & Mayhorn, 2013) have already shown that often people
rely more on architectural features than on emergency signage systems. What smart
solutions could be considered to enhance compliance rates with the emergency signage system? Should the emergency signage paradigm change? What’s the good of
a smart alarm system if people do not trust the alarm or take longer than necessary
to start the emergency evacuation process? So, it is not about technology-based environments, but it is about understanding users while planning the whole system.
Predictions of new interactive experiences with and within the built environment
are growing, and the smart agenda is really evolving with projects in many countries.
However, in a recent study about Rio de Janeiro’s Smart City project, it was concluded that applying the smart city paradigm itself is not enough without considering
the real context. In fact, it could potentialize socioeconomic and political divides
(Gaffney and Robertson 2018).
Some research has been done with the aim of understanding human behavior
(e.g., Vilar et al., 2020, 2014) and emotions (e.g., Dias, Eloy, Carreiro, Proença, et al.,
2014; Dias, Eloy, Carreiro, Vilar, et al., 2014; S. Dinis et al., 2013) within the built
environment, space use (e.g., Verma et al., 2017), universal design (e.g., Noguchi et
al., 2018) and building performance (e.g., Hsu et al., 2010), adding knowledge to the
HBI area. However, there is a lack in clarifying and unifying concepts to strengthen
HBI as a feld of research. It could be one of the reasons why much of the work that
has been done in this area involves many other felds of knowledge.
In this way, efforts can be made to envision possible scenarios and plan for them,
and according to Alavi and colleagues (2016), it is important to understand and
refect about HBI contributing to the generalized understanding of human interaction with the building environment. For this, the authors suggest the necessity of
208
Handbook of Usability and User Experience
developing more innovative design instances and improving the knowledge in the
area, by, for example, design heuristics and strong conceptualizations. The development of cumulative understanding of evolving human living and working behaviors
in a new scenario of interactions that the introduction of new technologies can promote would be possible with the incorporation and assimilation of knowledge and
methodologies from the three main domains in the HBI feld of study (D’oca et al.
2019), as shown in Figure 12.2.
12.3.3
THE HUMAN-CENTERED ARCHITECTURE
With the increasing incorporation of new technologies in the buildings, allowing a
myriad of new interactions between users’ and the built space, the need for knowing users and flling the communication gap is obvious, as illustrated in Figure 12.1.
Adopting an HCD paradigm could be an interesting approach to make it possible. As
a problem-solving approach focused on the human perspective during all problemsolving processes, HCD uses methods and techniques imported from a broad range
of social sciences, such as observation, interviews, focus groups, questionnaires
and others, to understand users’ needs, defning requirements and testing solutions
against these requirements.
According to Schulzová and Bošová (2019), the main components of indoor
environments are mainly related to physical aspects (i.e., thermal and humidity
microclimate, lighting, acoustics, indoor air quality, electromagnetic, electroionic,
electrostatic and ionization microclimate) and psychological aspects (i.e., users’
well-being). However, even if all physical aspects are controlled and attended to
in the architectural project, there is no guarantee that the psychological well-being
of the user will be achieved. Promoting good user experience could be a key factor
for achieving well-being. In this way, adopting a methodology that allows knowing
users and putting them at the center of the architectural process can contribute to the
architects’ work, allowing them to design the built environment not only in terms
of functionality, but also as a place that promotes good UX, and thus promoting
well-being.
In this sense, works related to the built environment with the concepts of UX,
usability and HCD can be found in literature, and the following are some examples.
In a recent study carried out by Van der Linden and colleagues (2019), the UX
methods and the HCD process were used to make the people’s spatial experience
part of the architects’ design process. Thus, elements like persona1 and scenarios2
were considered and adapted to the particularities of architectural design to have a
new integrated approach to support professionals in designing human-centered environments. This new approach suggested by Van der Linden and colleagues (2019) is
in line with the new perspectives that arose with the evolution of the HBI concept.
Although project promoters are still disconnected from real end users, tackling
with some diffculty in acquiring and understanding their needs, there are some
successful examples of user-oriented projects for new buildings. A good example is
The Edge, designed for Deloitte, a global fnancial frm. This new building aimed to
accommodate the company’s employees spread across multiple buildings in the city.
A Human-Centered Architecture
209
An HCD approach was considered and interviews with the employees about their
preferences and needs, as well as observation of their work at their previous workplaces, were carried out. According to the WEF report (World Economic Forum
2017), this HCD orientation was maintained during all project phases with a constant
focus on enhancing employees’ UX. Planned to be a smart building, the project was
developed considering a set of sensors/actuators. Additionally, an application was
developed and the building’s users could interact with it through a smartphone or a
tablet to, for example, personalize temperature or lighting levels, book a room for a
meeting or fnd a free desk to work. Through the app, users can also fnd a parking
lot, navigate into the building, manage work schedules, fnd others, report problems
and so on. This building is also considered the greenest until the date, according
to the BREEAM green building certifcation scheme (Fytrou-Moschopoulou 2017).
An example of how new interactions can shape the built environment is the
“ExoPranayama” (Moran et al. 2016). In this project, biofeedback of yoga practitioners was used to develop an environment that, according to the authors, physically
manifests users’ breathing in yoga. The “ExoPranayama” was developed considering
direct observations of yoga class and an HCD approach. The tests with the environment revealed an improvement in self-awareness and allowed teachers to better know their students and help with the new class. However, the authors point as
a drawback the social concerns related to exposure of what they called “invisible
inner-self” that they related with competitiveness and deviation from the spiritual
aspect of the practice.
Conceptual frameworks to answer the demand created with the HCI research and
design in architecture were also proposed. An example is the human–environment
approach developed by Ma and colleagues (2017) called Environmental Experience
Design (EXD). It was designed to identify the main objectives of the project, analyze
user perception, propose design strategies and solutions (Noguchi et al. 2018) and
encompass objective physical parameters, such as environmental quality data and
subjective user perception, for example, the human emotions. An aged care facility
was chosen as a case study to apply the EXD, and, based on it, physical (indoors
environmental quality data) and psychological parameters such as freedom, connection to the natural environment, belongingness and individual dignity were considered. These parameters feed the methodology of the function analysis system. This
methodology aims to identify the performance of a user function and to refne design
as a function of the users’ requirements by asking what functions users need and how
design can achieve these. The methodology’s result is a diagram (FAST—Function
Analysis System Technique) that helps to explore users’ physical and psychological needs and demands. The EXD framework derives from the FAST diagram and
encompasses related design criteria, design settings, objectives, design elements,
opportunities and design solutions.
Sandman and colleagues (2018) proposed the incorporation of HCD methods in
two sustainability models. They also applied these models in two case studies; they
proposed a new one in which the four dimensions of sustainability (i.e., environmental, economic, social and cultural) have an equal balance, highlighting the aspects
that need the inhabitant’s engagement. According to them, to reach this balance,
210
Handbook of Usability and User Experience
architects need to understand people in depth, by having an empathic involvement
with the users.
HBI being a recent area, studies that encompass this feld are still sparse and are
usually found in correlated areas, such as publications on HCI, building automation, building engineering, sustainability and energy research. Despite HBI being
an emergent feld, with a lot of new research being produced, there is still much
work to do in the direction of incorporating more human-oriented processes into
architecture.
12.4
CONCLUSIONS
New opportunities also bring new problems and new challenges. What is going to
happen when full building automation occurs? Could people live in a place where
technology decides for us if our window should be open or closed? Will we rely
on a safety information that changes according to the circumstances of an emergency? And what about our privacy when the built environment, being urban spaces
or indoors, is able to store all information about our physiological data, patterns of
behavior and also emotions? How a new built environment should be designed considering all the adaptive opportunities that new technology could allow? There are
many questions that could arise from a refection on the subject of smart environments and all new demands that they could allow.
Nowadays, with the evolution of sensing technologies, both human and environment can be monitored and communicate with each other allowing the optimization
of their interaction. These new technology-produced products can also affect architectural thinking and promote changes in the design process. According to Lester
and colleagues (2008), sensing platforms are being increasingly used and the number
of potential users and applications being developed continue to expand. With this,
a number of data—some collected by environmental sensors considering more traditional aspects such as air quality and temperature and others collected through
users’ devices such as mobile phones, considering, for example, users’ activities and
locations—can be related with each other to inform and optimize the interactions
between the users and the built environment.
From the architecture point of view, considering the new interactions and all
opportunities and disadvantages that could arise is a new demand that professionals
from this area need to deal with. And with new demands, also new ways of thinking
about problems and solving them are also necessary.
Some authors (i.e., Ma et al., 2017) agree that architecture requires interdisciplinarity and a human-centered process, but, unfortunately, thinking about the user
experience while interacting with or within the built environment has barely been
applied to architectural practice.
This chapter deals with these new demands and presents some concepts that are
helping architects to change the architectural process to incorporate more humanoriented strategies to solve complex problems in architectural design.
Interaction design and architecture are increasingly interconnected, from the mid1980s, with the frst attempts to design computer-aided design (CAD) tools, to the
A Human-Centered Architecture
211
incorporation of technologies that are designed to be part of the built environment,
using the architecture as support for new digital technologies (Wiberg, 2017). Thus,
new technologies can allow new interactions with the built environment, such as
temperature controllers, aperture controllers and presence sensors, that can change
space use, and also ultimately alter the architectural design.
McCullough (2004) argues that the digital world is mixing with the real world
as ubiquitous computing has to be inscribed into the social and environmental complexity of the physical built environment. This makes digital networks
bonded with architecture and opens a new paradigm for architectural design.
However, with new grounds, new ways of thinking about problems also emerge,
and new theories tend to unify perspectives among disparate groups, generally introducing a few widely applicable problem-solving strategies. All these
exchanges and intercommunications among disciplines and felds of knowledge
allow generating shared assumptions and concepts underlying a common frame,
also producing a more consistent and coherent set of models and techniques
(Moffatt and Kohler 2008).
In this way, contributions from HCI to HBI feld are mainly related to research
and design methodologies that are aimed at understanding user’s needs, requirements and expectations, focusing on enhancing UX and usability. For this, it is
important to identify, to understand and to organize in a framework the converging
aspects of HCI and architecture to establish new knowledge on the HBI area allowing all interested in this area to predict and shape the future of living.
NOTES
1. “Personas, are detailed, composite user archetypes that represent distinct groupings of
behaviors, attitudes, aptitudes, goals, and motivations observed and identifed during
the research phase” (Cooper et al. 2014).
2. A scenario is a concise description of a persona using a product to achieve a goal
(Cooper 2004).
REFERENCES
Alavi, Hamed S., Elizabeth Churchill, and Denis Lalanne. 2017. “The Evolution of HumanBuilding Interaction: An HCI Perspective.” Interaction Design and Architecture(s)
Journal - IxD&A 32: 3–6.
Alavi, Hamed S., Elizabeth F. Churchill, Mikael Wiberg, Denis Lalanne, Peter Dalsgaard,
Ava Fatah Gen Schieck, and Yvonne Rogers. 2019. “Introduction to Human-Building
Interaction (HBI): Interfacing HCI with Architecture and Urban Design.” ACM
Transactions on Computer-Human Interaction 26(2): 1–10. doi: 10.1145/3309714.
Alavi, Hamed S., Denis Lalanne, Julien Nembrini, Elizabeth Churchill, David Kirk, and
Wendy Moncur. 2016. “Future of Human-Building Interaction.” In Conference on
Human Factors in Computing Systems - Proceedings, 07–12 May 2016, 3408–14.
Association for Computing Machinery. doi: 10.1145/2851581.2856502
Appleyard, Donald. 1980. “Livable Streets: Protected Neighborhoods?” The ANNALS
of the American Academy of Political and Social Science 451(1): 106–17. doi:
10.1177/000271628045100111
212
Handbook of Usability and User Experience
Attaianese, Erminia, and Gabriella Duca. 2012. “Human Factors and Ergonomic Principles in
Building Design for Life and Work Activities: An Applied Methodology.” Theoretical
Issues in Ergonomics Science 13(2): 187–202. doi: 10.1080/1463922X.2010.504286
Brand, Stewart. 1994. How Buildings Learn: What Happens after They’re Built. New York:
Viking.
Cherry, Edith, and John Petronis. 2016. “Architectural Programming | WBDG - Whole
Building Design Guide.” Whole Building Design Guide - National Institute of Building
Science. 2016. https://www.wbdg.org/design-disciplines/architectural-programming.
Cooper, Alan. 2004. The Inmates Are Running the Asylum. 1st ed. Carmel, Indiana: Sams.
Cooper, Alan, Robert Reimann, David Cronin, and Christopher Noessel. 2014. About Face:
The Essentials of Interaction Design. 4th ed. Indianapolis, IN: John Wiley & Sons,
Inc. https://books.google.pt/books?hl=pt-PT&lr=&id=w9Q5BAAAQBAJ&oi=fnd&pg
=PT17&dq=personas+alan+cooper&ots=RezrQPe7yd&sig=r5O5pZ3VpsAs3KeZGfI
BdprKa1o&redir_esc=y#v=onepage&q=personas alan cooper&f=false.
D’oca, Simona, Dan Podjed, Jure Vetršek, Slavko Dolinšek, and Peter Op’t Veld. 2019.
“Contextual and Behavioural Factors Infuencing Human-Building Interaction in
University Offces: A Cross-Cultural Comparison.” In E3S Web Conferences - CLIMA
2019 Congress, 111: 04064. doi: 10.1051/e3sconf/2019111040
Dade-Robertson, M. (2013). Architectural User Interfaces: Themes, Trends and Directions in
the Evolution of Architectural Design and Human Computer Interaction. International
Journal of Architectural Computing, 2(01), 1–19. https://doi.org/10.1260/1478-0771.11
.1.1
Dasgupta, Archi, Mohamed Handosa, Mark Manuel, and Denis Gračanin. 2019. “A
User-Centric Design Framework for Smart Built Environments: A Mixed Reality
Perspective.” In Lecture Notes in Computer Science (Including Subseries Lecture
Notes in Artifcial Intelligence and Lecture Notes in Bioinformatics), 11587 LNCS:
124–43. Springer Verlag. doi: 10.1007/978-3-030-21935-2_11
Dias, Miguel, Sara Eloy, Miguel Carreiro, Pedro Proença, Ana Moural, Thiago Pedro, Joana
Freitas, Elisângela Vilar, Jorge D’Alpuim, and António Azevedo. 2014. “Designing
Better Spaces for People.” In Rethinking Comprehensive Design: Speculative
Counterculture – Proceedings of the 19th International Conference on ComputerAided Architectural Design Research in Asia, CAADRIA 2014, Kyoto, Japan, May
14–17, 2014.
Dias, Miguel, Sara Eloy, Miguel Carreiro, Elisângela Vilar, Sibila Marques, Ana Moural,
Pedro Proênça, et al. 2014. “Space Perception in Virtual Environments – On How
Biometric Sensing in Virtual Environments May Give Architects Users’s Feedback.”
In Fusion – Proceedings of the 32nd ECAADe Conference – Volume 2, Department of
Architecture and Built Environment, Faculty of Engineering and Environment, edited
by Emine Mine Thompson, 271–80. Newcastle upon Tyne. http://cumincad.scix.net/cgi
-bin/works/Show?ecaade2014_112.
Dinis, S., E. Duarte, P. Noriega, L. Teixeira, E. Vilar, and F. Rebelo. 2013. Evaluating
Emotional Responses to the Interior Design of a Hospital Room: A Study Using Virtual
Reality. Lecture Notes in Computer Science (Including Subseries Lecture Notes in
Artifcial Intelligence and Lecture Notes in Bioinformatics). Vol. 8014 LNCS. doi:
10.1007/978-3-642-39238-2_52
Dul, Jan, and Bernard A. Weerdmeester. 2008. Ergonomics for Beginners : A Quick Reference
Guide. 3rd ed. Boca Raton, FL: Taylor & Francis.
Fytrou-Moschopoulou, Arla. 2017. “The Edge: Amsterdam Offce Building with Highest
BREEAM Score to Date.” Build Up - The European Portal for Energy Effciency in
Buildings, European Community, https://www.buildup.eu/en/practices/cases/edge
-amsterdam-offce-building-highest-breeam-score-date retrieve in May 28, 2021.
A Human-Centered Architecture
213
Gaffney, Christopher, and Cerianne Robertson. 2018. “Smarter than Smart: Rio de Janeiro’s
Flawed Emergence as a Smart City.” Journal of Urban Technology 25(3): 47–64. doi:
10.1080/10630732.2015.1102423
Groat, Linda, and David Wang. 2002. Architectural Research Methods. New York: John
Wiley and Sons.
Handy, Susan L., Marlon G. Boarnet, Reid Ewing, and Richard E. Killingsworth. 2002.
“How the Built Environment Affects Physical Activity: Views from Urban Planning.”
American Journal of Preventive Medicine 23(2 SUPPL. 1): 64–73. doi: 10.1016/
S0749-3797(02)00475-0
Hillier, Bill. 1996. Space Is the Machine. London: University of Cambridge.
Hsu, Jeff, Prashanth Mohan, Xiaofan Jiang, Jorge Ortiz, Sushant Shankar, Stephen DawsonHaggerty, and David Culler. 2010. “HBCI: Human-Building-Computer Interaction.”
In BuildSys’10 – Proceedings of the 2nd ACM Workshop on Embedded Sensing
Systems for Energy-Effciency in Buildings, 55–60. New York: ACM Press. doi:
10.1145/1878431.1878444
International Organization for Standardization. 1998. “ISO 9241-11: Ergonomic Requirements
for Offce Work with Visual Display Terminals (VDTs) - Part 11 Guidance on Usability.”
https://www.sis.se/api/document/preview/611299/.
———. 2010. “ISO 9241-210:2010 - Ergonomics of Human-System Interaction -- Part
210: Human-Centred Design for Interactive Systems.” International Organization for
Standardization (ISO). http://www.iso.org/iso/home/store/catalogue_ics/catalogue
_detail_ics.htm?csnumber=52075.
———. 2018. “ISO 9241-11:2018 Ergonomics of Human-System Interaction-Part 11: Usability:
Defnitions and Concepts.” https://www.sis.se/api/document/preview/80003410/.
———. 2019. “ISO 9241-210:2019 - Ergonomics of Human-System Interaction — Part
210: Human-Centred Design for Interactive Systems.” International Organization for
Standardization. https://www.iso.org/standard/77520.html.
Jazizadeh, Farrokh, Geoffrey Kavulya, Jun Young Kwak, Burcin Becerik-Gerber, Milind
Tambe, and Wendy Wood. 2012. “Human-Building Interaction for Energy Conservation
in Offce Buildings.” In Construction Research Congress 2012: Construction
Challenges in a Flat World, Proceedings of the 2012 Construction Research Congress,
1830–39. doi: 10.1061/9780784412329.184
Klepeis, Neil E., William C. Nelson, Wayne R. Ott, John P. Robinson, Andy M. Tsang, Paul
Switzer, Joseph V. Behar, Stephen C. Hern, and William H. Engelmann. 2001. “The
National Human Activity Pattern Survey (NHAPS) A Resource for Assessing Exposure
to Environmental Pollutants.” https://indoor.lbl.gov/sites/all/fles/lbnl-47713.pdf.
Lester, Jonathan, Phil Hurvitz, Rohit Chaudhri, Carl Hartung, and Gaetano Borriello. 2008.
“MobileSense – Sensing Modes of Transportation in Studies of the Built Environment.”
In International Workshop on Urban, Community, and Social Applications of
Networked Sensing Systems, edited by Andrew Campbell and Deborah Estrin, 46–50.
Raleigh, NC.
Linden, V. Van der, H. Dong, and A Heylighen. 2019. “Populating Architectural Design:
Introducing Scenario-Based Design in Residential Care Projects.” International
Journal of Design [Online] 13(1): 21–36. http://www.ijdesign.org/index.php/IJDesign/
article/view/3194.
Ma, Nan, Hing-wah Chau, Jin Zhou, and Masa Noguchi. 2017. “Structuring the Environmental
Experience Design Research Framework through Selected Aged Care Facility Data
Analyses in Victoria.” Sustainability 9(12): 2172. doi: 10.3390/su9122172
Madan, Ankita, and Sanjay Kumar Dubey. 2012. “Usability Evaluation Methods: A Literature
Review.” International Journal of Engineering Science and Technology 4(2): 590–99.
http://www.amity.eduhttp//www.amity.edu.
214
Handbook of Usability and User Experience
Malkawi, Ali, and Ruchi Choudhary. 1999. “Visualizing the Sensed Environment in the Real
World.” Journal of the Human-Environment System 3(1): 61–69. doi: 10.1618/jhes.3.61
Malkawi, Ali, and Ravi Srinivasan. 2005. “A New Paradigm for Human-Building Interaction:
The Use of CFD and Augmented Reality.” Automation in Construction 14(1): 71–84.
doi: 10.1016/j.autcon.2004.08.001
Mathews Hobart, Stanley, and William Smith Colleges. 2005. “The Fun Palace: Cedric
Price’s Experiment in Architecture and Technology.” Technoetic Arts: A Journal of
Speculative Research 3(2): 73–92. doi: 10.1386/tear.3.2.73/1
McCullough, Malcolm. 2004. Digital Ground: Architecture, Pervasive Computing, and
Environmental Knowing. Cambridge, Massachusetts: MIT Press.
Moffatt, Sebastian, and Niklaus Kohler. 2008. “Conceptualizing the Built Environment as
a Social–Ecological System.” Building Research & Information 36(3): 248–68. doi:
10.1080/09613210801928131
Moon, Kyoung-Sun. 2005. “Dynamic Interrelationship between Technology and Architecture
in Tall Buildings.” Massachusetts Institute of Technology. https://pdfs.semanticscholar.org/365d/c5f16f266ed84d0580c942b946da6a2b2eba.pdf?_ga=2.224366299
.1700329305.1578917057-1528609837.1568902508.
Moran, Stuart, Nils Jäger, Holger Schnädelbach, and Kevin Glover. 2016. “ExoPranayama: A
Biofeedback-Driven Actuated Environment for Supporting Yoga Breathing Practices.”
Personal and Ubiquitous Computing 20(2): 261–75. doi: 10.1007/s00779-016-0910-3
Noguchi, Masa, Nan Ma, Catherine Woo, Hing-wah Chau, and Jin Zhou. 2018. “The Usability
Study of a Proposed Environmental Experience Design Framework for Active Ageing.”
Buildings 8(12): 167. doi: 10.3390/buildings8120167
Norman, Donald A., and Stephen W. Draper. 1986. User Centered System Design : New
Perspectives on Human-Computer Interaction. L. Erlbaum Associates. https://dl.acm
.org/citation.cfm?id=576915.
Sandman, Helena, Jarkko Levänen, and Nina Savela. 2018. “Using Empathic Design as a
Tool for Urban Sustainability in Low-Resource Settings.” Sustainability 10(7): 2493.
doi: 10.3390/su10072493
Schulzová, Kristýna, and Daniela Bošová. 2019. “The Development of Indoor Environmental
Quality Defnition from Vitruvius to the Present.” In International Conference
Archtecture in Perspective 2019, edited by Martina Peřinková, Sandra Jüttnerová, and
Lucie Videcká, 38–42. Ostrava: VŠB – Technická univerzita Ostrava. https://www.fast
.vsb.cz/export/sites/fast/226/cs/spoluprace/konference-a-seminare/architektura-v-perspektive/architektura-v-perspektive-2019-sbornik.pdf.
Shackel, Brian. 2009. “Human-Computer Interaction – Whence and Whither?” Interacting
with Computers 21(5–6): 353–66. doi: 10.1016/j.intcom.2009.04.004
Urquhart, Lachlan, Holger Schnädelbach, and Nils Jäger. 2019. “Adaptive Architecture:
Regulating Human Building Interaction.” International Review of Law, Computers &
Technology 33(1): 3–33. doi: 10.1080/13600869.2019.1562605
Verma, Himanshu, Hamed S Alavi, and Denis Lalanne. 2017. “Studying Space Use: Bringing
HCI Tools to Architectural Projects.” In Conference on Human Factors in Computing
Systems – Proceedings, 2017 May: 3856–66. doi: 10.1145/3025453.3026055
Vilar, Elisângela, Paulo Noriega, Francisco Rebelo, Inês Galrão, Daniel Semedo, and Nuno
Graça. 2020. –Exploratory study to investigate the infuence of a third person on an
individual emergency wayfnding decision. Advances in Intelligent Systems and
Computing. 955: 452–461. https://doi.org/10.1007/978-3-030-20227-9_42.
Vilar, Elisângela, Francisco Rebelo, Paulo Noriega, Emília Duarte, and Christopher B.
Mayhorn. 2014. “Effects of Competing Environmental Variables and Signage on RouteChoices in Simulated Everyday and Emergency Wayfnding Situations.” Ergonomics
57(4): 511–24. doi: 10.1080/00140139.2014.895054
A Human-Centered Architecture
215
Vilar, Elisângela, Francisco Rebelo, Paulo Noriega, Júlia Teles, and Christopher Mayhorn.
2013. “The Infuence of Environmental Features on Route Selection in an Emergency
Situation.” Applied Ergonomics 44(4): 618–27. doi: 10.1016/j.apergo.2012.12.002
Whyte, William. 1980. The Social Life of the Small Urban Space. New York: Project for
Public Spaces.
Wiberg, Mikael. 2017. “From Interactables to Architectonic Interaction.” Interactions.
Association for Computing Machinery 24(2): 62–65. doi: 10.1145/3036203
World Economic Forum. 2017. “Shaping the Future of Construction: Inspiring Innovators
Redefne the Industry.” http://www3.weforum.org/docs/WEF_Shaping_the_Future_of
_Construction_Inspiring_Innovators_redefne_the_industry_2017.pdf.
Zeisel, John. 1975. Sociology and Architectural Design. New York: Russell Sage Foundation.
muse.jhu.edu/book/60742.
Zeisel, John. 2006. Inquiry by Design. Revised. New York: W.W. Norton & Company Inc.
Section 4
Usability and UX in
the Digital World
13
Digital Human
Modeling in Usability
Gunther Paul
CONTENTS
13.1
13.2
13.3
13.4
13.5
Introduction to DHM and Usability ............................................................. 219
DHM Representation of the User ................................................................. 221
DHM in Product Design ............................................................................... 222
DHM in Testing and Predicting Usability.................................................... 223
Common DHM Tools in Usability ............................................................... 223
13.5.1 SIEMENS JACK .............................................................................. 223
13.5.2 Human Solutions RAMSIS............................................................... 223
13.5.3 Dassault Systèmes 3DS Virtual Ergonomics.................................... 225
13.5.4 NexGen Ergonomics HumanCAD.................................................... 225
13.5.5 SANTOS........................................................................................... 226
13.5.6 imk EMA.......................................................................................... 227
13.6 Usability and UX of DHM Tools.................................................................. 228
13.7 Case Studies.................................................................................................. 230
13.7.1 Hospital Bed Design ......................................................................... 230
13.7.2 Vehicle Ingress-Egress...................................................................... 233
13.7.3 Welding Station................................................................................. 236
Acknowledgments.................................................................................................. 241
Bibliography .......................................................................................................... 241
13.1
INTRODUCTION TO DHM AND USABILITY
Usability has been widely accepted as an aspect of human-centered design, and thus in
a close relationship with human factors and ergonomics (HFE). Historically, however,
usability was often associated with software or Web site design and therefore a psychological property, versus an understanding of HFE rather relating to physical properties
and functionalities of a product, user interface or work system. There is also some form
of agreement that usability cannot be directly measured as an objective and quantifable
property. Usability is connected with “learnability”—how easy a product function can be
learned and understood initially; “effciency”—how well the product function performs
once fully learned; “memorability”—how easy it is to memorize a product function and
use it again when returning to the product after absence; “reliability”—the amount of
errors generated by the product function, their severity and easiness of recovery from
those errors; and “satisfaction”—how pleasant it is to use a product function.
DOI: 10.1201/9780429343490-17
219
220
Handbook of Usability and User Experience
Given that our modern understanding of HFE includes cognitive ergonomics,
usability may now be seen as a discipline within HFE. For this reason, usability is
now also standardized through ISO rather than IEEE, and falls under the authority
of the ISO technical group 159 “Ergonomics” (ISO TC 159 / SC4). Specifcally, ISO/
TR 16982:2002—Ergonomics of Human-System Interaction—Usability Methods
Supporting Human-Centered Design; and ISO/FDIS 9241–210:2019—Ergonomics
of Human-System Interaction—Part 210: Human-Centered Design for Interactive
Systems—provide guidance and a defned framework for using ergonomic methods
in the context of usability.
Digital Human Models (DHM) in HFE can be seen as a virtual tool to accomplish a
design target that is explicit in its representation of users, tasks and environments. DHM
as digital and often fully integrated systems support fast iterations in a human-centered,
or even human-in-the-loop (HITL), design process. Thus, they accelerate the design process, make it reproducible and support quality management and reporting requirements.
As systems representing humans in a digital world, DHM particularly lend themselves
to interactive, human-centered system development. In particular “accessibility”—the
“extent to which products, systems, services, environments and facilities can be used
by people from a population with the widest range of user needs, characteristics and
capabilities to achieve identifed goals in identifed contexts of use” (ISO/FDIS 9241-210,
p.2)—has become an aspect of usability that is preferably studied and designed using
DHM. DHM usage in the user-centered design process has been previously described
by Summerskill and Marshall (2011) and del Rio Vilas, Longo and Rego Monteil (2013).
In their respective digital worlds, which may be stand-alone or integrated, and based on
a variety of data modeling techniques, DHM avail themselves to interact with digital
prototypes. Such digital prototypes are slowly replacing physical prototypes which once
formed the workhorse of usability testing. An example of this approach is the digital factory (e.g., da Silva & Kaminski, 2015).
While DHM can be seen as an active tool in human-centered design, they may as
well be regarded as the passive object of usability investigations, for the tools themselves form a human-centered system, involving the DHM software and its user or
operator (Perez & Neumann, 2015); and they must therefore comply with usability
requirements. As a consequence, usability of DHM tools in use becomes a paramount aspect in achieving product design targets, for the usability performance of
the tools directly impacts on the usability performance of the product. The same
however could be argued for almost every tool, whether physical or virtual.
Overall DHM-designed physical systems or products are expected to provide superior productivity and operational effciency (e.g., Greig et al., 2018), they are easier to
understand and use and they have better usability, accessibility and an improved user
experience (UX). Equally these qualities will apply to mature DHM products. Parallel
to the physical world, many systems and products now exist in a virtual world (e.g.,
Manns et al., 2018). This also applies to DHM, for example. DHM can help specify user
requirements in the physical or virtual world (belonging to this world themselves) (as
exemplifed by Sun et al., 2019, p. 4969), or evaluating designs against their requirements
(Ribeiro Okimoto, 2011). Even more than in physical items, DHM help to understand and
specify a context of use in a virtual world (e.g., Sanjog et al., 2015; Fan et al., 2017). For
Digital Human Modeling in Usability
221
FIGURE 13.1 DHM in usability.
example, a virtual DHM fastening a virtual bolt in a virtual engine assembly can receive
feedback about the level of torque applied to the bolt. This feedback may be very useful
in a training context. How the feedback is transformed and messaged to the DHM user,
however, is again a matter of usability (Figure 13.1).
13.2 DHM REPRESENTATION OF THE USER
In such a user-centered design framework, products, systems and even services are
designed with consideration of the people who will use them—the “user.” Different
assumptions will apply to a different “context of use,” i.e., users behave differently and
have different expectations (e.g., professional vs. leisure), different characteristics and
different proportions (e.g., in a very cold vs. very hot atmosphere) in different environments. In scientifc DHM, typically anthropometric, biomechanical and cognitive modeling (Scataglini & Paul, 2019) are used to represent the user. In the context of usability,
this taxonomy is being expanded by persona, which represents a user’s character, behaviors and expectations, rather than a physical or cognitive property or ability (Mueller et
al., 2020). When developing a system, product or service, the frst design step involves
understanding and specifying the context of use. This includes the user groups (e.g.,
different nationalities), the characteristics of the users (e.g., different anthropometry),
the goals and tasks of users (e.g., frequency of tasks; quality vs. quantity focus) and
the environment (e.g., physical attributes). Much of this step can be modeled in DHM.
From then onward, for specifying user requirements (Avsar, Fischer & Rodden, 2016),
producing design solutions and evaluating the design mostly of user interfaces, DHM
222
Handbook of Usability and User Experience
are particularly helpful. They inform on accessibility (Maruyama et al., 2016; Marshall
et al., 2016), effectiveness, effciency and maintainability of a system (Schulze, 2011;
Bernard et al., 2019), product or service (Bernard et al., 2020). Moreover, they allow for
variation of the task, user or other elements of context of use. While DHM can contribute signifcantly to validation and verifcation (Aromaa et al., 2018), issues remain even
in predicting physical experiments (Delangle, Petiot & Poirson, 2017). Tools have not
yet reached a state where a DHM could reliably predict user satisfaction or UX (Johnson
& Fletcher, 2015), although comfort models have been included in DHM (Paul, 2019)
and the use of artifcial neural networks has proven promising in predicting ride comfort, for example (Cieslak et al., 2019). Obviously, modeling of UX would require a
signifcant level of integration for cognitive and physical DHM, which will necessitate
an understanding of physical-cognitive interaction beyond today’s level of knowledge.
Such has been shown by Califano et al. (2019) for the impact of expectations on comfort perception and modeling. Compared to the early crude DHM systems, nowadays
systems are highly interactive, versatile, articulated, deformable, realistic and computationally effcient. They also interface with various types of sensors, such as motion
capture systems (Badler et al., 2005). Nevertheless, more and more usability of complex
DHM systems themselves becomes an issue, and interactive virtual reality (VR) interfaces, for example, have been suggested as an interface to instruct DHM (Geiger et al.,
2018). Even though scripting of high-level commands, which are typically used for the
defnition of tasks (e.g., grasp Object; walk from A to B; carry Object from A to B), is a
very effcient way to improve usability and interact with a DHM, it has become evident
that mouse and keyboard are generally rather insuffcient input devices to control a
complex DHM.
13.3 DHM IN PRODUCT DESIGN
While DHM have become common product design tools for well over a decade and
are well advanced in automotive (Högberg, 2009; Andreoni & Paul, 2019; Happee et
al., 2019; Reynolds, 2019), aerospace (Rueckert, Rohmert & Pressel, 1992; Green et al.,
2019; Hiemstra-van Mastrigt et al., 2019), military (e.g., Chatterjee et al., 2019; Bhatt et
al., 2019) and manufacturing (Ma et al., 2010; Chen & Liu, 2014; Naddeo et al., 2013;
Maurice et al., 2019; Jadhav, Arunachalam & Salve, 2019), their use in other areas such as
apparel design (Shah & Luximon, 2019; Dove, 2019; McGhee & Steele, 2019; Durá-Gil
et al., 2019), healthcare (Samson et al., 2009; Cao, 2011; Quintero Duran & Paul, 2018),
Assistive Technologies (Suteu & Bazatu, 2015) and medical device design (Forzoni et
al., 2019; Regazzoni et al., 2019; Little, 2019) is still emerging. They have been mostly
applied to concept development and (rapid) prototyping though, and thus the early phases
of product development, where a number of applications implemented motion simulation in virtual environments (e.g., Kuo & Wang, 2012; Qiu et al., 2014), their use in fnal
usability testing, however, remains limited. Usability testing, for example, in household
appliances or in common handheld tools and devices must also consider behavioral user
characteristics, such as a naïve user vs. a professional expert, in order to identify the likelihood of usability issues. This may be one of the reasons why designers are still hesitant
in their use of DHM (see also Ranger, Vezeau & Lortie, 2018).
Digital Human Modeling in Usability
223
13.4 DHM IN TESTING AND PREDICTING USABILITY
DHM lend themselves to an objective evaluation of designs, as far as they can represent typical users and personas, a realistic environment and common use cases. They
support a cognitive walk-through and component-based usability testing, with clear
usability metrics, such as task completion time, hand or fnger forces, accessibility,
etc. Moreover, they can be used as predictive tools, for example, in task analysis.
Traditional observational usability testing is mostly based on video recording and
subjective user satisfaction surveys, which can be error prone and misleading. A
range of elements of usability, however—for example, behavior, emotions, perception, diffculties of understanding, higher level opinion expressed in comments—are
not suited for DHM evaluation and are still best tested using ethnography, needs
analysis, focus groups or questionnaire methods (see, for example, van den Broek &
Westerink, 2009).
13.5 COMMON DHM TOOLS IN USABILITY
A complete overview and introduction to the most commonly used DHM tools in
usability can be found in Scataglini and Paul (2019).
13.5.1
SIEMENS JACK
SIEMENS JACK (Raschke & Cort, 2019) has been used in a wide array of applications, and is well integrated into the SIEMENS product life cycle management
(PLM) product suite, a comprehensive product design and simulation environment.
While it is integrated with the SIEMENS NX CAD software for product design, it
also sits in SIEMENS Teamcenter where a large amount of data can be visualized in
a tessellated format to represent complete systems, such as a complete vehicle including the driver. JACK is also integrated into SIEMENS Process Simulate, where task
sequencing, assembly operations, automation or robotic interaction are simulated.
In its stand-alone version (Figure 13.2), JACK has a task simulation builder module
which allows the software to automatically animate the DHM based on high-level
task descriptions and environmental constraints. The task simulator then independently produces a report on a range of ergonomic factors, such as strength requirements, postural loading, times or distances. JACK integrates with VR and motion
capture systems to position and control the DHM.
13.5.2
HUMAN SOLUTIONS RAMSIS
The RAMSIS DHM (Wirsching, 2019) was developed in the late 1980s for the German
automotive industry to design and test vehicle packages. Given its intended use, it started
to be modeled around a “most likely” posture model for the then most common type of
sedan passenger vehicles; and later when the DHM had effectively become a standard
for package engineering in the global automotive industry, further posture models were
added to account for other vehicle types which were either emerging (e.g., the “H30
224
FIGURE 13.2
Handbook of Usability and User Experience
DHM SIEMENS JACK.
model” for SUV) or had been more common in other markets (e.g., the “truck model”
for pick-up and commercial trucks). The early RAMSIS DHM focused on automotive
applications, such as optimizing accessibility, visibility, reachability, posture, seatbelt ft,
safety and discomfort. Eventually further postural models were added, such as an aircraft, motorbike and free-standing model (Figure 13.3). The DHM was also expanded
to include some biomechanical and cognitive functions. While initially stand-alone and
thus limited in its usage in integrated engineering processes, RAMSIS later became
available as plug-in for the most common C3P packages CATIA and NX. Nowadays
RAMSIS is also used in industrial applications.
FIGURE 13.3 DHM Human Solutions RAMSIS.
Digital Human Modeling in Usability
13.5.3
225
DASSAULT SYSTèMES 3DS VIRTUAL ERGONOMICS
Today’s 3DS Virtual Ergonomics DHM tool was initially created as a generic standalone DHM called SAFEWORK in the early 1990s, and its frst customer was Boeing
where the tool was used in virtual manufacturing (Charland, 2019). Nowadays part of
the Dassault Systèmes extensive suite of engineering software, Virtual Ergonomics
was frst integrated into the CATIA and DELMIA C3P systems and is currently
part of their 3DExperience platform. The DHM is used broadly in a wide range of
industries (e.g., Sanjog et al., 2012; design of a shoe rack). The Virtual Ergonomic
tool focuses on ergonomic analyses and integrates several ergonomic methods (e.g.,
RULA, NIOSH, Snook & Ciriello, energy expenditure, etc.) for this purpose. Fields
covered are reach, clearance, vision, forces in lifting, carrying, pushing and pulling,
fatigue and postural comfort or safety. Given the complexity of the DHM tool, its
associated analyses and integration of the method into a complex industrial design
process, Dassault Systèmes and Boeing have recently focused on usability of the
DHM and its application in industrial practice. At the end of this development, the
DHM will be an integral part of the product design process, and DHM simulation
outcomes will be tracked in-the-loop through the Dassault Systèmes ENOVIA product data management system (Figure 13.4).
13.5.4
NEXGEN ERGONOMICS HUMANCAD
HumanCAD is based on an early DHM from 1990, which was initially a 2D tool
called ManneQuin. HumanCAD is now a fully animated DHM with forward and
inverse kinematics, collision detection and various analytic functions for reach,
FIGURE 13.4
ing center.
DHM 3DS Virtual Ergonomics “Teo” and “Sia” operating in a CNC machin-
226
Handbook of Usability and User Experience
FIGURE 13.5 DHM HumanCAD.
vision and ergonomic analysis (Pinchefsky, 2019). It incorporates two biomechanical models and thus allows use of the NIOSH, RULA, OWAS, Snook & Mital or
energy expenditure methods. Moreover, the biomechanical core allows the DHM to
predict joint discomfort, such as shoulder comfort zones, joint amplitude discomfort (JAD) and joint positions discomfort (JPD). While HumanCAD is still available
stand-alone, HumanCAD-MQSW is a fully integrated low-cost plug-in within the
Dassault Systèmes SOLIDWORKS CAD software system, which is used in many
academic teaching environments (Figure 13.5).
13.5.5 SANTOS
The SANTOS DHM was initially developed as part of the US Virtual Soldier
Research program. It follows a strictly physics-based approach called human predictive dynamics (Abdel-Malek et al., 2019). The 215-degree-of-freedom model allows
for the analysis of dynamic tasks, which particularly lends itself to the study of interaction between a human and objects. An example of this ability is a SANTOS study
on a soldier’s ability to jump when wearing a back pack, where both the geometric
interface between the soldier and the back pack, and the dynamic interaction between
the human body in motion and the back pack in motion are to be considered. The
SANTOS model (Figure 13.6) includes physiological parameters of strength, fatigue
and cardiovascular factors, as well as a complete musculoskeletal model. It is therefore suited for predicting injuries from overload conditions; a functionality which
has been used in athletics and the military. The aims of the SANTOS DHM project
are aspirational: in-line with virtual mock-ups, digital twins or the digital factory
used in industry for mechanical systems, SANTOS aims at providing a human digital twin. This digital twin DHM is planned to include cognitive abilities, which will
enable SANTOS to perform in usability testing of equipment, and provide humanlike feedback. SANTOS software includes a rules-based artifcial intelligence (AI)
controller which allows the DHM system to plan and sequence tasks, and generate DHM motion paths based on a library of tasks for walking, climbing, kneeling,
etc., which is based on behavioral studies. SANTOS predictive physiology considers
Digital Human Modeling in Usability
227
FIGURE 13.6 DHM SANTOS.
environmental factors such as air temperature and humidity and predicts body temperature, heart rate, respiratory rate, oxygen consumption, energy consumption
and an overall physiological strain index. Among other developments, SANTOS is
further improved in the areas of cognitive abilities, realistic behavior, AI and the
human-to-DHM interface; all of which will substantially expand the capability of
SANTOS to perform in usability testing.
13.5.6
IMK
EMA
This recent DHM system is a product of digital factory developments in the automotive industry in Germany, where it was found that manual production processes,
human-machine and human-robot collaboration required a DHM representation
that was capable of interacting in a complex, process-driven industrial simulation
environment. Thus, the computationally effcient DHM tool EMA (Figure 13.7) was
launched in 2012 (Bauer et al., 2019). EMA has a clear focus on planning, simulation, visualization and evaluation of manual production tasks. For this purpose,
the system uses industry standards methods time measurement (MTM) and ergonomic assessment worksheet (EAWS) to generate, aggregate and evaluate motion
elements, postures, forces and eventually tasks. While limited in its ability to represent user details, such as a larger range of anthropometry, it was designed to support
complex simulations in representative simulated work environments. In product
development, EMA is useful in concept evaluation, production planning, virtual
prototype build, human-robot collaboration planning and continuous improvement.
Recent developments added a manikin confgurator, including gender, age, stature,
corpulence, range of motion and various work-related restrictions, such as vision,
228
Handbook of Usability and User Experience
FIGURE 13.7 DHM EMA.
hearing or body forces. EMA interfaces with motion capture data to drive motion
of the DHM.
13.6
USABILITY AND UX OF DHM TOOLS
Despite a large amount of non-academic, user internal studies about DHM usability
and UX, published studies on the topic are surprisingly scarce. Perez and Neumann
(2015) and Quintero-Duran and Paul (2018) have studied aspects of usability of
DHM tools; other facets of usability have been discussed in Shah and Luximon
(2019) and Peters, Wischniewski and Paul (2019). Usability and UX of DHM tools
can be categorized into three areas:
1. UX of the DHM software tool in its own
This category considers whether the tool is focused on its user group.
It refects learnability, accessibility, visual design, functional content,
effciency, information architecture, memorability and how pleasant and
intuitive it is to use the DHM tool. Overall, the tool must be relevant and
meaningful. While DHM tools have been mostly used by well-trained
experts in the past, both industrial customers and DHM developers are now
interested in broader access to DHM tools. To support this expansion, DHM
tools will need to acknowledge different user types and provide adequate
user-level customization, for example, in the form of knowledge-based
expert systems.
2. Integration of the DHM software tool
DHM tools are typically intended to be used as an integral part of
a design or engineering process. Such processes will normally involve
Digital Human Modeling in Usability
229
other software, such as design, CAD or CAE packages. While historically
DHM users were DHM or ergonomic experts with a clear focus on the
DHM, users now are much more likely to come from a design or engineering background, with little or no expertise in DHM. This leads to two
opposite direction integration requirements. The non-expert DHM user
who is an expert user of design or engineering software expects the DHM
to be embedded into their “world view.” The DHM is expected to reside
as a tool within these software systems, and the DHM interface must
not look or behave differently from the “mother system.” For example, if
the “mother system” uses a right mouse button to scale a view, and the
DHM system uses the same right mouse button to rotate the DHM, then
a mismatch occurs, and an integration usability issue arises. Similarly,
if a CAE system follows a node-based structure, the DHM must comply
with same structure to assure usability. From the expert DHM user perspective, outputs which are generated in the DHM tool (e.g., postures,
zones, forces) must integrate into the design or engineering system as
valid objects. An example of an integration usability issue in this case
is where a reach zone is exported from the DHM to a CAD system, and
the object can be no further modifed (e.g., attached to a node) in the
CAD system because it is recognized as an external and imported geometry object. Integration of DHM and other design and engineering tools
however requires standardization of data formats as a minimum (Paul
& Wischniewski, 2012), and a more widespread implementation of such
formats in all systems (e.g., COLLADA).
3. Reliability and validity of the DHM software tool
Reliability concerns occur where DHM systems use optimization algorithms, and boundary conditions are not transparent or controlled. In this
case, a repeated use of a function will yield different outcomes (e.g., for predicting a posture). Another example of a reliability usability issue is where
different DHM are used in a process or collaboration, and the different
DHM produce distinct outcomes (e.g., visual cones) because they use nonuniform anthropometric data, postural prediction or underlying methods
from disparate sources. Moreover, reliability of DHM tools depends on the
amount of errors generated by product functions, their severity and easiness
of recovery from those errors. Validity of DHM tools relates to their ability to predict real-world outcomes. A validity usability issue ensues where
DHM simulations and predictions fail to coincide with real-world (laboratory) experiments or real-world user feedback. An example is driver accommodation in truck cabins, where DHM underestimate driver corpulence for
specifc body statures, because their underlying databases have not yet been
updated to refect the rapidly changing anthropometry of a population (see
also Wu, Tian, & Duffy, 2012).
All three categories of DHM usability and UX impact on user satisfaction with DHM
tools and contribute signifcantly to their success in the market.
230
13.7
Handbook of Usability and User Experience
CASE STUDIES
13.7.1 HOSPITAL BED DESIGN
Moving patients in hospital beds (Figure 13.8) during care activities is a common
task for nurses. Nurses can be considered the normal active user of such beds, rather
than the patient who typically remains a passive bed user. The use of hospital beds
frequently involves pushing and pulling (Quintero-Duran & Paul, 2018) and particularly for bariatric patients, often multiple nurses jointly move a hospital bed, further complicating usability conditions and UX. Pushing and pulling when moving
hospital beds is a dynamic task, as the lower extremities are involved in a walking
movement and arms are steering the bed. On the other hand, the trunk remains static
with isometric muscular force exerted while controlling and steering the moving
bed. Static load and effort are known to cause user strain which will normally have
a negative impact on user satisfaction with the bed. Frame geometric design, frame
proportions, handle design, bed weight, wheel design, roll resistance and interface
design of powered beds contribute to hospital bed usability and UX.
The use of virtual environments and DHM tools is very useful for evaluating a
usability scenario such as bed moving in hospital. When usability is studied with real
humans, ergonomic assessments may be costly, time-consuming, tedious and require
FIGURE 13.8
Hospital bed in CAD.
Digital Human Modeling in Usability
231
an uncommon and specifc laboratory setup. If studied in a real-world situation, the
study may interfere with normal workplace activities which is critical in hospitals.
Application of a DHM tool to analyze usability of a hospital bed, and specifcally the
task of bed moving, overcomes these limitations.
DHM tools in design and testing for the healthcare industry are particularly
valuable because generally tasks in healthcare involve postures, movements and
activities that are complex to simulate in experiments using real humans and environments. Thus, the use of analytic tool studies represents a signifcant advantage
when evaluating designs and use case scenarios in the healthcare industry. DHM
have been applied to the ergonomic assessment of patient lifting, where chair, hoist,
bed, additional tools and process all contribute to the outcome of the task. This is
one task where hospital bed design features and usability impact on work practice.
Typical hospital beds (e.g., Hill-Rom 900) weigh 100–120 kg unoccupied and
have a safe working load of 200–300 kg, and therefore require superior usability to
avoid ergonomic hazards.
This case study looks at the usability assessment of hospital bed moving using the
DHM tool imk EMA (imk automotive GmbH, Chemnitz), and provides the results
from simulations in the DHM tool. The usability assessment performed in a virtual
environment allows the variation of body proportions in order to represent typical
anthropometric conditions, the variation of handle-coupling conditions, the variation
of mobility pathways in hospital and the variation of rolling resistance. Common ergonomic methods used in the case study are integrated in the Ergonomic Assessment
Worksheet (EAWS) and are therefore quasi-static. EAWS calculates and assesses a
workload from posture, interface condition, action forces and repetition. Posture
evaluation in EAWS considers traditional ergonomic evaluation methods such as EN
1005-4:2005+A1:2008, ISO 11226-2000, Toyota, OWAS and RULA. This workload
is, among other factors, a function of the bed’s usability. If the other factors are kept
constant, then the EAWS score can be used to assess usability of the bed.
The simulation process in this case study is divided into three areas: environment, manikins and the actual usability analysis. In addition to these sections, tasks,
postures and bed positions are defned to inform the analysis phase. For the digital
environment design, only physical elements of the usability case are considered,
while cognitive and psychological factors cannot yet be studied in the simulation. At
this stage, input parameters such as loads and distances were established.
The usability assessment performed in a virtual environment allows for variation of body proportions in order to represent typical anthropometric conditions.
In EMA, human models are predetermined on a German DIN-defned population
and at the time of the study, it was not possible to scale the models. The German 5th
percentile stature female was selected for the study, which in EMA presents with
52 kg of weight and is 40 years old. Even though it is possible to select gender and
percentiles (5th, 50th, 95th) of the human models, other parameters such as nationality, age, weight and somatotype were predetermined in EMA (V.1.5.1.0) and could
not be modifed. Anthropometric data was also not extrapolated for the study year
to refect secular growth and up-to-date anthropometry. Additional manikins could
be imported into the simulation (Figure 13.9), however without the option to adjust
232
FIGURE 13.9
Handbook of Usability and User Experience
EMA representation of a hospital ward.
their anthropometry measures or include them in the analysis. Consequently, those
human models were used only for the purpose of creating a representative visual
virtual hospital environment.
A grand score of 78 was obtained for the simulation of moving a hospital bed,
which according to the EAWS overall evaluation scheme with a three-zone rating
system falls into the red zone (>50 points) and represents a high risk for the development of MSD, requiring the task to be avoided or modifed.
For the evaluation, EMA considers posture duration and frequency, however
as a sequence is not considered, recovery aspects are not accounted for. For the
assessment of hospital bed moving, a posture summary score of 2 was obtained.
For action forces, a total score of 55 was obtained for the simulation, corresponding
entirely with whole body forces and not refecting forces of the hand-fnger system. Parameters such as muscular force, force type (arm/body force or fnger force)
and wrist joint/kickback level (light, heavy, very heavy) are adjustable in EMA for
each task. Duration and frequency are calculated by EMA according to the complete
simulation setup, the specifed shift time and number of cycles per shift (with an
assumption of 10 chosen for the case study). The magnitude of force exertion was
assumed as 350 N in correspondence with literature. For manual materials handling,
a total score of 20.5 points was obtained entirely representing the push/pull task. In
the EAWS evaluation system’s load section, the weight of loads, the corresponding
posture according to the task, frequency and duration of the task and the working
conditions are considered. The weight of the hospital bed was 250 kg.
In order to establish the transport route for the hospital bed in the simulation,
a realistic hospital environment was replicated. Movements and variables such as
straight walking along corridors, 90° turns when transporting the bed around corners
and 90° turns to enter/exit lifts were included in the simulation. EMA incorporates
some dynamic methods, enabling the software to consider external factors such as
foor friction. This functionality however was not well documented and didn’t accept
physical parameter input, working instead with unspecifed categories. Asymmetric
Digital Human Modeling in Usability
233
effects such as trunk rotation, lateral bending and far reach (twist, bend and reach
scores) were not realistically considered. During bed rotation movements (e.g., pushing around corners, sideways or in a confned space), lateral bending or trunk rotation can be expected. Such events are reported as common issues in real workplace
scenarios; however, they were reported with a “0” score in the simulation results.
This discrepancy could be attributed to the oversimplifcation of complex operations
and movements performed by the digital model, where the software automatically
determines the shortest walkway and the best boundary conditions of the work task,
which may not always correspond to real movements and conditions in the workplace. From spine values reported in EMA for the simulation, it was shown that only
variability in thoracic, lumbar and pelvis fexion angles was reported, while thoracic
and lumbar rotation angles were reported as “0.” Obviously, the DHM tool did not
realistically represent the actual complex worker movements.
At the time of the study, it was not possible to analyze how anthropometric conditions infuence usability outcomes, because it was not possible to generate custom
mannequins for the simulation in EMA. Ergonomic methods integrated in EAWS
pose the risk of misinterpretation of results as the methods integrated were not originally developed to be used in conjunction with DHM.
EMA is well suited for ergonomic analysis through parameter variation in a simulated environment. Nevertheless, this analysis in a DHM tool has limitations that
need to be considered when interpreting the results. Complex interface conditions
such as the infuence of handle design, foor materials, front caster locks, effects of
wheel size and wheel rolling resistance cannot be simulated in EMA.
Given the limitations found, a simulated assessment of the biomechanically complex task of pushing a hospital bed remains a challenge in EMA, although the DHM
tool can provide valuable direction for further design.
13.7.2
VEHICLE INGRESS-EGRESS
This usability study aimed to identify and optimize the main design parameters of
ingress-egress, as well as understand the preferences and factors of infuence for
comfort perception in a selected Chinese population. Research data was captured
from 22 healthy participants in several ways:
• Anthropometric data measured by the researcher;
• Motion capture data using VICON MX 20 and Optitrack motion tracking
systems with 12 cameras each;
• Written questionnaires; and
• Videotaping of participants during motion capture trials.
The study was conducted in a controlled realistic laboratory environment in
Australia. A China specifcation Ford Mondeo LHD vehicle was supplied by Ford
of Australia, and a Mercedes S-Class RHD vehicle was provided by Mercedes Benz
of Australia. Ingress/egress motion was recorded using VICON NEXUS/Optitrack
AMASS 12 camera systems and video cameras. All ingress/egress motion was
234
Handbook of Usability and User Experience
recorded on the right-hand side of the vehicles, i.e., passenger-side Ford Mondeo and
driver-side Mercedes S-Class.
Subjects were measured for stature, weight, sitting height, shoulder width, buttock to knee length and hip breadth. According to the Chinese anthropometrical data
standard GB-10000-88 which was corrected for actual anthropometry from data
measured in a clinic in China, stature of male participants was chosen to lie within a
range of 163.7 cm (5% male)–181.5 cm (95% male), and a weight range of 60 kg (5%
male)–94.6 kg (95% male). Similarly, the range of female participants was chosen
to lie within 153.7 cm (5% female)–169.6 cm (95% female), and a weight range of
52.5 kg (5% female)–81.3 kg (95% female). The 22 (11 males; 11 females) selected
participants (mean stature 1657 ± 99 mm; mean weight 65.3 ± 14 kg; mean age 34
± 7years) were all of Chinese ethnic background.
Ingress-egress motion of subjects was video recorded, and time synchronized
with motion tracking data. Each subject performed ingress/egress three times. A custom marker set (Figure 13.10) was used to track body motion. Mercedes motion data
was then processed in a VICON NEXUS pipeline and modeled in Visual3D (Figure
13.11) for further biomechanical investigation, and transfer of trajectories into a
DHM (Figure 13.12). While motion tracking can be readily used in biomechanical
laboratory studies, the application to usability studies is somehow limited. In the
case of this study, markers are occluded over substantial periods in visual tracking
FIGURE 13.10
Ingress/egress motion capture marker setup.
Digital Human Modeling in Usability
235
FIGURE 13.11 Simulated ingress/egress motion (Visual3D).
of the ingress or egress motion, requiring interpolation which becomes more and
more cumbersome the longer the period extends. The same issue hampers magnetic
marker tracking, where the vehicle environment is not conducive to such a method.
Furthermore, markers extend space requirements for the motion and hinder natural
motion rhythms. Moreover, when contacting vehicle geometry, markers tend to get
displaced or fall off. Hence, traditional motion tracking is not a suitable method for
studying usability of a vehicle design for ingress/egress. The method lends itself
however to inform a DHM study. In this case, only a limited marker set from motion
tracking was used to drive the motion of the DHM, which can then predict motion
of those body parts which are not directly tracked. As a result, whole body motion
can be analyzed, segmental motion parameters can be calculated and joint dynamics
computed to assess motion trajectories and objective biomechanical load.
The importance of ingress/egress in relation to overall rear compartment comfort
had been previously determined as high (7.8 VER), and ingress/egress was typically considered as “somewhat important” when purchasing the car. Anticipated
ease of ingress with door shut was on average 7.9 VER for Mercedes and 7.3 VER
for Ford, and improved when the door was opened to 8.6 VER for Mercedes, while
it decreased for Ford to 7.0 VER. Actual perceived ingress was slightly better than
anticipated for Mercedes at 8.8 VER, and better for Ford at 7.5 VER. On the other
hand, perceived egress was lower than anticipated for Mercedes at 7.9 VER, while it
was like anticipated egress for Ford at 7.4 VER. Overall ease of ingress was typically
236
Handbook of Usability and User Experience
FIGURE 13.12 DHM RAMSIS ingress/egress simulation.
“very satisfying” for Mercedes and “slightly satisfying” for Ford. Overall ease of
egress was typically “slightly satisfying” for Mercedes and Ford.
While the fndings were consistent with phenomenological considerations—
ingress is normally perceived as easier than egress in lower H30 vehicles, and larger
vehicles generally provide more space for ingress/egress—the usability laboratory
study failed to inform the designers about specifc design targets. Application of the
DHM tool to study usability of the vehicle designs however allowed in-depth understanding of the impact of design parameters on usability perception.
13.7.3
WELDING STATION
In this case study, a systematic ergonomic evaluation approach was adopted to the
usability analysis, assessment and design of a welding station (Figure 3.13). In the
analysis stage, the welding task was examined to obtain the functionality of the
welding process, establish the boundaries of the process and understand how the different elements contained within the process interacted. The analysis identifed the
various constraints and bottlenecks of the process permitting subsequent stages of
the study to focus on the problem areas. The principal outcome of this evaluation was
to enable the development of solutions to address these problem areas by optimizing
human interaction with the other elements of the welding fabrication process.
Digital Human Modeling in Usability
237
FIGURE 13.13 Automotive welding station.
Car frames are placed into a holding jig where they are held in place by mechanical clamps. The welding station uses a resistance spot welder to weld parts onto a car
frame. The spot welder is suspended on an overhead gantry system to compensate
for the weight. The operator moves the spot welder into position above the car frame.
Operators consult the weld drawing for part selection and part placement, then select
the parts from the blue bins and place the parts to be welded onto the car frame at
the required position. They manually move the spot welder to each position for welding the part in place and push a button on the weld head which closes the welding
clamps. Once the clamps are closed, the weld starts automatically. The operator then
pushes the button a second time to open the clamps and stop welding, and eventually
removes the welded frame from the welding jig and places the completed assembly
onto a support rack.
Hierarchical task analysis (HTA) identifed several problems associated with the
various ergonomic domains (Table 13.1). A principal bottleneck identifed in the
process was the cognitive load placed on the welder to execute approximately 20
238
Handbook of Usability and User Experience
TABLE 13.1
Welding Station Aggregated Ergonomic Risks from HTA
Condition
Ergonomic
domain
attribution
Welder implication
Quality/production
implication
Multiple weld
variations
Cognitive
Mental stress
Demotivation
Parts missing
Poor quality
Reaching forward to
retrieve parts from
storage*
Prolonged standing
posture*
Physical
Postural load
External load
Physical
Postural load
WMSD injury
Fatigue
Lost production time
Increased errors
Poor quality
Increased errors
Poor quality
Lighting
considerations
Physical
Excessive noise
Physical
Hearing damage risk
Loss of concentration
Incorrect selection or
positioning of parts
Increased errors
Poor quality
Parts missing
Heat exposure
Physical
Heat strain
Increased errors
Awkward body
postures*
Shoulder position
for weld head grip*
Physical
WMSD injuries
Shoulder and upper
body injuries from
overhead reaching
Forearm, wrist and
hand overuse injuries
Back injuries
Poor quality
WMSD injury
Coronary and
circulatory health
risks
Fatigue
Reduced vision
Conditions considered for DHM study are marked with*.
possible variations in the parts to be welded. These multiple variations required the
welder to continually refer to the welding task sheet, thus adding process time and
distracting attention from the principal process of welding. Beyond the cognitive
load, the welder was exposed to a physical workload, including manual materials
handling (MMH), postural work and environmental stressors (lighting, noise, thermal). DHM EMA (imk automotive, Chemnitz) was then used to further analyze
workfow, MMH and postures to redesign the workstation and improve usability.
EMA simulated the complete working cycle described before, including part
retrieval, part transport, welder positioning and welding, so that critical postures
and forces could be easily identifed (Figure 13.14). The DHM tool was confgured
to represent the working population between a 5th percentile body stature female
and a 95th percentile body stature male. Based on EMA EAWS calculations, overall
FIGURE 13.14 Posture and force tracking over time and tasks in EMA.
Digital Human Modeling in Usability
239
240
Handbook of Usability and User Experience
FIGURE 13.15 Small female worker in EMA retrieving parts from the bin rack.
postural scores for both percentiles were similar and within the red band (high-risk
area) as most of the postural loading resulted from prolonged static standing and
overhead work. The load score for the short female however was much higher than
for the tall male due to an anthropometric mismatch when retrieving parts from
the rack (Figure 13.15). Moreover, spine and pelvis angles highlight the inadequate
working height for the short female worker at the welding station. The welding table
height of 1300 mm is too high for this worker. Therefore, both the bin rack and the
height of the welding table were revised.
Objects to be used by standing workers are best placed between hip and shoulder height to minimize postural stress according to generic ergonomic design
guidelines. The worker’s stature and vertical depth of the work object (jig) are
considered to put the hands in a comfortable position. However, at this workplace,
hip-to-shoulder distance is the wrong target measure because the work surface
would be too low for the tall male and too high for the small female worker (Figure
13.16). Here, the recommended welding table and rack height range is the difference between the elbow height of the tall male and small female workers. To
improve usability, the welding station and rack height must be adjustable and lie
between 955 and 1192 mm when considering the welded part. For reach into the
bin rack, the maximum permitted horizontal distance is defned by the small
female arm reach and is 282 mm. Required knee and foot clearances are conforming to the standards and are 80/120/150 mm (knee depth, foot height, foot depth).
Maximum holding times should be less than 2.15 min in an 8-min welding cycle,
and if longer, adequate supports must be added to the design of the workstation to
provide acceptable usability.
Digital Human Modeling in Usability
241
FIGURE 13.16 Usability mismatch for a tall male and small female worker when using
generic ergonomic design criteria.
ACKNOWLEDGMENTS
The hospital bed case study was kindly developed by Marisol Quintero-Duran.
Thanks to Redmond Orth, Michael Connole, Megan Slattery and Mohammad Shiri
for expertly developing the welding case study.
BIBLIOGRAPHY
Abdel-Malek, K., Arora, J., Bhatt, R., Farrell, K., Murphy, C., & Kregel, K. (2019). Santos:
An integrated human modeling and simulation platform. In: Scataglini, S., & Paul, G.
(eds.), DHM and Posturography, 63–77. London: Academic Press.
Andreoni, G., & Paul, G. (2019). Ingress-egress analysis for passenger vehicle design through
digital human modelling. In: Scataglini, S., & Paul, G. (eds.), DHM and Posturography,
415–424. London: Academic Press.
Aromaa, S., Frangakis, N., Tedone, D., Viitaniemi, J., & Aaltonen, I. (2018). Digital
human models in human factors and ergonomics evaluation of gesture interfaces. Proceedings of the ACM on Human-Computer Interaction, 2(EICS), 1–14.
doi:10.1145/3229088
Avsar, H., Fischer, J., & Rodden, T. (2016). Designing touch-enabled electronic fight bags
in SAR helicopter operations. HCI-Aero’16, September 14–16, 2016, Paris, France.
doi:10.1145/2950112.2964591
Badler, N. I., Allbeck, J., Lee, S.-J., Rabbitz, R. J., Broderick, T. T., & Mulkern, K. M. (2005).
New behavioral paradigms for virtual human models. SAE Transactions, 114, 723–29.
Accessed February 20, 2020. www.jstor.org/stable/44682486.
Bauer, S., Sylaja, V. J., Fritzsche, L., & Ullmann, S. (2019). Task-based digital human simulation with editor for manual work activities – Badic functionalities, applications, and
future works. In: Scataglini, S., & Paul, G. (eds.), DHM and Posturography, 57–62.
London: Academic Press.
242
Handbook of Usability and User Experience
Bernard, F., Zare, M., Sagot, J. C., & Paquin, R. (2019). Integration of human factors into
the design process of helicopter maintainability. Human Factors and Ergonomics in
Manufacturing & Service Industries, 29(4), 350–360. doi:10.1002/hfm.20792
Bernard, F., Zare, M., Sagot, J.-C., & Paquin, R. (2020). Using digital and physical simulation to focus on human factors and ergonomics in aviation maintainability. Human
Factors: The Journal of Human Factors and Ergonomics Society, 62(1), 37–54.
doi:10.1177/0018720819861496
Bhatt, R., Farrell, K., Abdel-Malek, K., Arora, J., & Murphy, C. (2019). Posture prediction
and physics-based human motion simulation. In: Scataglini, S., & Paul, G. (eds.), DHM
and Posturography, 425–440. London: Academic Press.
Califano, R., Califano, R., Naddeo, A., Naddeo, A., Gatto, A., Gatto, A., … Straccia, L.
(2019). Virtual prototyping for workplace analysis: The effect of expectation on perceived comfort while using offce devices. International Journal on Interactive Design
and Manufacturing (IJIDeM), 13(1), 235–242. doi:10.1007/s12008-018-0521-5
Cao, W. (2011). Ergonomic assessment of sonography workplace and posture parameters using digital human modeling (Dissertation/Thesis). ProQuest Dissertations
Publishing. Binghamton University, State University of New York.
Charland, J. (2019). Virtual ergonomics by dassault systèmes. In: Scataglini, S., & Paul, G.
(eds.), DHM and Posturography, 97–103. London: Academic Press.
Chatterjee, T., Bhattacharyya, D., Majumdar, D., & Pal, M. (2019). Ergonomic assessment
of multi calibre individual weapon system in virtual reality platform. Defence Science
Journal, 69(3), 240–248. doi:10.14429/dsj.69.14426
Chen, M., & Liu, J.-F. (2014). Virtual simulation of production line for ergonomics evaluation. Advances in Manufacturing, 2(1), 48. doi:10.1007/s40436-014-0060-7
Cieslak, M., Kanarachos, S., Blundell, M., Diels, C., Burnett, M., & Baxendale, A. (2019).
Accurate ride comfort estimation combining accelerometer measurements, anthropometric data and neural networks. Neural Computing and Applications. doi:10.1007/
s00521-019-04351-1
da Silva, G. C., & Kaminski, P. C. (2015). Application of digital factory concepts to optimise and integrate inventories in automotive pre-assembly areas. International
Journal of Computer Integrated Manufacturing, 28(6), 607–615. doi:10.1080/09511
92X.2014.881552
del Rio Vilas, D., Longo, F., & Rego Monteil, N. (2013). A general framework for the manufacturing workstation design optimization: A combined ergonomic and operational
approach. Simulation, 89(3), 306–329. doi:10.1177/0037549712462862
Delangle, M., Petiot, J. F., & Poirson, E. (2017). Using motion capture to study human standing
accessibility: Comparison between physical experiment, static model and virtual ergonomic evaluations. International Journal on Interactive Design and Manufacturing
(IJIDeM), 11(3), 515–524. doi:10.1007/s12008-016-0304-9
Dove, T. (2019). Building patternmaking theory to better represent he female form. In:
Scataglini, S., & Paul, G. (eds.), DHM and Posturography, 761–769. London: Academic
Press.
Durá-Gil, J. V., Kozomara, Z., Ballester, A., Solves-Camallonga, C., & Pierola-Orcero, A.
(2019). Clothing. In: Scataglini, S., & Paul, G. (eds.), DHM and Posturography, 599–
612. London: Academic Press.
Fan, K., Murai, A., Miyata, N., Sugiura, Y., & Tada, M. (2017). Multi-embodiment of digital
humans in virtual reality for assisting human-centered ergonomics design. Augmented
Human Research, 2(1), 1–14. doi:10.1007/s41133-017-0010-6
Forzoni, L., Standoli, C. E., de Luca, R., & Andreoni, G. (2019). DHM applied to ergonomic
design and assessment of diagnostic ultrasound systems. In: Scataglini, S., & Paul, G.
(eds.), DHM and Posturography, 559–568. London: Academic Press.
Digital Human Modeling in Usability
243
Geiger, A., Bewersdorf, I., Brandenburg, E., & Stark, R. (2018). Visual feedback for grasping
in virtual reality environments for an interface to instruct digital human models. In:
Ahram, T., & Falcão, C. (eds.), Advances in Usability and User Experience, Advances
in Intelligent Systems and Computing, 607. Berlin: Springer International Publishing.
doi:10.1007/978-3-319-60492-3_22
Green, R. F., Hagale, T. J., George, T., Hancock G. A., & Rice, S. M. (2019). Digital human
modelling in aerospace. In: Scataglini, S., & Paul, G. (eds.), DHM and Posturography,
549–558. London: Academic Press.
Greig, M. A., Village, J., Salustri, F. A., Zolfaghari, S., & Neumann, W. P. (2018). A tool
to predict physical workload and task times from workstation layout design data.
International Journal of Production Research, 56(16), 5306–5323. doi:10.1080/0020
7543.2017.1378827
Happee, R., de Bruijn, E., Forbes, P. A., van Drunen, P., van Dieën, J. H., & van der Helm,
F. C. T. (2019). Neck postural stabilisation, motion comfort, and impact simulation.
In: Scataglini, S., & Paul, G. (eds.), DHM and Posturography, 243–260. London:
Academic Press.
Hiemstra-van Mastrigt, S., Smulders, M., Bouwens, J. M. A., & Vink, P. (2019). Designing
aircraft seats to ft the human body contour. In: Scataglini, S., & Paul, G. (eds.), DHM
and Posturography, 781–789. London: Academic Press.
Högberg, D. (2009). Digital human modelling for user-centred vehicle design and anthropometric analysis. International Journal of Vehicle Design, 51(3/4), 306–323. doi:10.1504/
IJVD.2009.027959
Jadhav, G. S., Arunachalam, M., & Salve, U. R. (2019). Ergonomics design and evaluation
of the stitching work station for the hand-crafted Kolhapuri footwear using a digital
human modeling approach. Journal of Industrial and Production Engineering, 36(8),
563–575. doi:10.1080/21681015.2019.1702593
Johnson, T. L., & Fletcher, S. R. (2015). The limitations of using only CAD and DHM
in design relating to high value manufacturing. In Proceedings of Contemporary
Ergonomics and Human Factors 2015: International Conference on Ergonomics and
Human Factors, 13–16 April 2015, Daventry, UK. Accessed April 3, 2020. https://core
.ac.uk/download/pdf/42144376.pdf
Kuo, C.-F., & Wang, M.-J. J. (2012). Motion generation and virtual simulation in a digital
environment. International Journal of Production Research, 50(22), 6519–6529. doi:1
0.1080/00207543.2011.653698
Little, J. P. (2019). The spine: Biomechanics and subject specifc fnite element models. In:
Scataglini, S., & Paul, G. (eds.), DHM and Posturography, 287–293. London: Academic
Press.
Ma, L., Zhang, W., Fu, H., Guo, Y., Chablat, D., Bennis, F., … Fugiwara, N. (2010). A framework for interactive work design based on motion tracking, simulation, and analysis.
Human Factors and Ergonomics in Manufacturing & Service Industries, 20(4), 339–
352. doi:10.1002/hfm.20178
Manns, M., Fischer, K., Du, H., Slusallek, P., & Alexopoulos, K. (2018). A new approach to
plan manual assembly. International Journal of Computer Integrated Manufacturing,
31(9), 907–920. doi:10.1080/0951192X.2018.1466396
Marshall, R., Summerskill, S., Case, K., Hussain, A., Gyi, D., Sims, R., … Barnes, J. (2016).
Supporting a design driven approach to social inclusion and accessibility in transport.
Social Inclusion, 4(3), 7–23. doi:10.17645/si.v4i3.521
Maruyama, T., Kanai, S., Date, H., & Tada, M. (2016). Motion-capture-based walking simulation of digital human adapted to laser-scanned 3D as-is environments for accessibility evaluation. Journal of Computational Design and Engineering, 3(3), 250–265.
doi:10.1016/j.jcde.2016.03.001
244
Handbook of Usability and User Experience
Maurice, P., Padois, V., Measson, Y., & Bidaud, P. (2019). Digital human modelling for collaborative robotics. In: Scataglini, S., & Paul, G. (eds.), DHM and Posturography, 771–
779. London: Academic Press.
McGhee, D. E., & Steele, J. R. (2019). Three-dimensional scanning of the torso and breasts to
inform better bra design. In: Scataglini, S., & Paul, G. (eds.), DHM and Posturography,
747–759. London: Academic Press.
Mueller, A., Beyer, S., Kopp, G., & Deisser, O. (2020). User-centered development of a public
transportation vehicle operated in a demand-responsive environment. In: Stanton, N.
(ed.), AHFE 2019, AISC 964, 545–555. doi:10.1007/978-3-030-20503-4_49
Naddeo, A., Vallone, M., Cappetti, N., & Califano, R. (2013). Manual assembly workstation redesign based on a new quantitative method for postural comfort evaluation.
Applied Mechanics and Materials, 459, 368–379. doi:10.4028/www.scientifc.net/
AMM.459.368
Paul, G. (2019). Occupant comfort. In: Scataglini, S., & Paul, G. (eds.), DHM and
Posturography, 471–486. London: Academic Press.
Paul, G., & Wischniewski, S. (2012). Standardisation of digital human models. Ergonomics,
55(9), 1115–1118. doi:10.1080/00140139.2012.690454
Perez, J., & Neumann, W. P. (2015). Ergonomists’ and engineers’ views on the utility of virtual human factors tools. Human Factors and Ergonomics in Manufacturing & Service
Industries, 25(3), 279–293. doi:10.1002/hfm.20541
Peters, M., Wischniewski, S., & Paul, G. (2019). DHM data exchange protocols. In: Scataglini,
S., & Paul, G. (eds.), DHM and Posturography, 663–670. London: Academic Press.
Pinchefsky, D. (2019). NexGen Ergonomics Inc. HumanCAD. In: Scataglini, S., & Paul, G.
(eds.), DHM and Posturography, 79–83. London: Academic Press.
Quintero Duran, M., & Paul, G. (2018). Ergonomic assessment of a physical task using two different DHM systems: A case study. International Journal of Human Factors Modelling
and Simulation (IJHFMS), 6(4), 298–313. doi:10.1504/IJHFMS.2018.096138
Qiu, S., He, Q., Fan, X., & Wu, D. (2014). Virtual human hybrid control in virtual assembly and maintenance simulation. International Journal of Production Research, 52(3),
867–887. doi:10.1080/00207543.2013.842025
Ranger, F., Vezeau, S., & Lortie, M. (2018). Traditional product representations and new
digital tools in the dimensioning activity: A designers’ point of view on diffculties and
needs. The Design Journal, 21(5), 707–730. doi:10.1080/14606925.2018.1494795
Raschke, U., & Cort, C. (2019). Siemens Jack. In: Scataglini, S., & Paul, G. (eds.), DHM and
Posturography, 35–48. London: Academic Press.
Regazzoni, D., Vitali, A., Rizzi, C., & Colombo, G. (2019). A virtual platform for lower
limb prosthesis design and assessment. In: Scataglini, S., & Paul, G. (eds.), DHM and
Posturography, 733–746. London: Academic Press.
Reynolds, M. (2019). ERL seat design and digital human models. In: Scataglini, S., & Paul,
G. (eds.), DHM and Posturography, 125–137. London: Academic Press.
Ribeiro Okimoto, M. L. L. (2011). Digital human modeling in product evaluation. In:
Karwowski, W., Soares, M. M., & Stanton, N. A. (eds.), Human Factors and Ergonomics
in Consumer Product Design: Methods and Techniques. Baton Rouge: CRC Press LLC.
Rueckert, A., Rohmert, W., & Pressel, G. (1992). Ergonomic research study on aircraft luggage handling. Ergonomics, 35(9), 997–1012. doi:10.1080/00140139208967378
Samson, A., Salaskar, S., Khasawneh, M. T., Wang, S., & Srihari, K. (2009). Digital human
modeling in healthcare systems: Overview, opportunities, and applications. IIE Annual
Conference Proceedings.
Sanjog, J., Karmakar, S., Agarwal, H., & Patil, C. D. (2012). Designing and ergonomic
evaluation of a shoe-rack in CAD environment. International Journal of Computer
Applications, 49(20), 38–41. doi:10.5120/7890-1275
Digital Human Modeling in Usability
245
Sanjog, J., Karmakar, S., Patel, T., & Chowdhury, A. (2015). Towards virtual ergonomics: Aviation and aerospace. Aircraft Engineering and Aerospace Technology: An
International Journal, 87(3), 266–273. doi:10.1108/AEAT-05-2013-0094
Scataglini, S., & Paul, G. (2019). DHM and Posturography. London: Academic Press, an
imprint of Elsevier.
Schulze, L. J. H. (2011). Design, usability, and maintainability of consumer products.
In: Karwowski, W., Soares, M. M., & Stanton, N. A. (eds.), Human Factors and
Ergonomics in Consumer Product Design: Methods and Techniques. Baton Rouge:
CRC Press LLC.
Shah, P., & Luximon, Y. (2019). Use of digital human modeling in product design. In:
Scataglini, S., & Paul, G. (eds.), DHM and Posturography, 591–598. London: Academic
Press.
Summerskill, S. J., & Marshall, R. (2011). Digital human modeling in the user-centred design
process. In: Karwowski, W., Soares, M. M., & Stanton, N. A. (eds.), Human Factors
and Ergonomics in Consumer Product Design: Methods and Techniques. Baton Rouge:
CRC Press LLC.
Sun, X., Houssin, R., Renaud, J., & Gardoni, M. (2019). A review of methodologies for integrating human factors and ergonomics in engineering design. International Journal of
Production Research, 57(15–16), 4961–4976. doi:10.1080/00207543.2018.1492161
Şuteu Băncilă, A. M. A., & Buzatu, C. (2015). Digital human modeling in the development
of assistive technologies for elderly users. Applied Mechanics and Materials, 809–810,
835–840. doi:10.4028/www.scientifc.net/AMM.809-810.835
van den Broek, E. L., & Westerink, J. H. D. M. (2009). Considerations for emotionaware consumer products. Applied Ergonomics, 40(6), 1055–1064. doi:10.1016/j.
apergo.2009.04.012
Wirsching, H.-J. (2019). Human solutions RAMSIS. In: Scataglini, S., & Paul, G. (eds.), DHM
and Posturography, 49–55. London: Academic Press.
Wu, T., Tian, R., & Duffy, V. G. (2012). Performing ergonomics analyses through virtual
interactive design: Validity and reliability assessment. Human Factors and Ergonomics
in Manufacturing & Service Industries, 22(3), 256–268. doi:10.1002/hfm.20267.
14
User Experience and
Information Architecture
Interaction with
Recommendation
System on a Music
Streaming Platform
Luiz Agner, Barbara Jane Necyk and Adriano Renzi
CONTENTS
14.1 Introduction .................................................................................................. 247
14.2 Information Architecture: From Web Sites to Ecologies .............................248
14.2.1 Information Architecture: From Ecologies to Machine Learning ... 250
14.2.2 Discussing AI and ML...................................................................... 251
14.3 User Experience and Machine Learning ...................................................... 253
14.3.1 Problems in UX-AI Intersection....................................................... 253
14.3.2 Basic Guidelines for Human-Algorithm Interaction ........................ 254
14.3.3 The Importance of Mental Models................................................... 256
14.4 Understanding Recommendation Systems ................................................... 256
14.4.1 The Algorithms Implemented by Spotify......................................... 258
14.5 Research Method: Users’ Interviews............................................................260
14.5.1 Interviewing Results ......................................................................... 261
14.6 Conclusions and Notes for Discussion.......................................................... 265
References..............................................................................................................266
14.1 INTRODUCTION
Human-computer interaction has evolved dramatically since the last decade, expanding and revising user experience (UX) concepts. This evolution contributed to shifting trading processes, rethinking companies’ culture, changing laws and political
scenarios, revisiting privacy concerns and transforming how people interact with
each other, with machines in the digital environment. In a world where physical and
digital environments merge into one experience involving digital apparatuses, physical ambiences, users, actors, data, algorithms and information in interoperability,
information structures are growing dynamically beyond their boundaries. As Pierre
DOI: 10.1201/9780429343490-18
247
248
Handbook of Usability and User Experience
Levy (1993) said, users embrace editors’ and protagonists’ roles, gaining an active
approach toward media. Furthermore, artifcial intelligence (AI) has been rapidly
adapting to the new technology era in a background layer, becoming a new and signifcant change agent.
In this scenario, this text attempts to understand streaming music consumption
and human-information interaction based on users’ mental models about machine
learning (ML) algorithms. Through semistructured interviews with Brazilian undergraduate students regarding their experience with the Spotify platform, our research
aimed to identify users’ perceptions about how algorithms suggest categories and
how users feel its relevance in a context where sometimes transparency and explainability are forgotten requirements. Conficts in the intersection of artifcial intelligence with user experience are discussed, as well as the “black box” feeling and
other biased user perceptions about algorithms’ functioning.
Regarding Spotify, the following research questions inspired us: What is possible
to know about the experience quality based on these interactions? Are users satisfed
with custom recommendations? Are users able to formulate a mental model on how
recommendation systems work? What is the mental model built by users regarding
machine learning algorithms? Do users understand how machine learning operates
and can interact with these algorithms to improve their outputs and better match
them to their goals? Do users worry about privacy issues?
This research also aims to better understand how the information architecture discipline is evolving toward a broader horizon. From classical authors such
as Rosenfeld, Morville, Arango, Lima-Marques, Morrogh, Wurman, Resmini and
Rosatti (among others), we propose to discuss how the fundamentals of information architecture are being challenged in the era of machine learning. We intend to
highlight contemporary tendencies that may reframe the discipline as the reported
changes conducted the goals of overcoming information overload and establishing
fndability as objectives set beyond. These goals are substituted by technological
solutions that systematically collect and analyze massive user interaction data to display relevant information. This work describes interconnections between information architecture and recommendation systems, considering its purpose of creating
personalized categories and fltering data to present meaningful content.
14.2
INFORMATION ARCHITECTURE: FROM
WEB SITES TO ECOLOGIES
If the user experience could be metaphorically compared to a large umbrella, including several correlated disciplines—such as usability, content strategy and user
research—as Willis (2020) has done, information architecture would undoubtedly
be one of its main strands.
As Rosenfeld, Morville and Arango (2015) have established, information architecture is the discipline for the structural design of digital landscapes, through the
synthesis of organization, labeling, navigation and search to build physical, digital
and transmedia information ecosystems. Its goal is to develop experiences and products that provide the best usability, fndability and comprehensibility.
User Experience and Information Architecture
249
According to Albuquerque and Lima-Marques, it can also be seen as “a systematic effort to identify standards and create methodologies for defning information
spaces” (Oliveira, Vidotti and Bentes, 2015). Its purpose includes the representation
and manipulation of information and the generation of relationships between entities
to construct information spaces. According to Benyon and Resmini (2017), information architecture relates to structure, access, retrieval and use of the content, focusing
on space, navigation and way-fnding.
Rosenfeld, Morville and Arango (2015) pointed out that today information has
become more abundant than ever before: with the ubiquity of media, a series of
devices and objects connected to the Internet for all kinds of daily and routine activities, in homes, offces or urban spaces, have come to confgure new and diverse ways
of human beings interacting with information. The process has caused the escalation
of a problem known as “information overload” (Wurman, 2001; Morrogh, 2003),
which we will discuss later.
It is essential to determine priorities to our attention and interest, create hierarchies, information structures, groups, categories and sequential interaction according to people’s affnities and expectations. Information architecture is responsible for
creating structures to effectively allow users to transform their informational necessities into actions and reach their goals. In this sense, the traditional information
architecture’s role is to organize and structure the information to help users discover
and consume content as well as facilitate their decisions and actions.
Roselfeld, Morville and Arango (2015) believe that information can be comprehended through four interdependent systems:
(i) Organization system: This determines how content should be organized,
classifed and presented.
(ii) Label system: This determines verbal and visual signs for each information
element and support navigation.
(iii) Navigation system: This specifes routes within the informational space.
(iv) Search system: In this system, users call upon typing questions to achieve
desired information.
For Rosenfeld, Morville and Arango (2015), fndability and comprehension are the
key objectives when structuring information—emphasized by the multiplicity of
channels and diversity and dynamism of technological apparatuses in systems ecology. Nowadays, content is building up dynamically in new connected hyperlinks.
As the emerging participative culture grows, users cite, comment, share, reinterpret, edit, mix, create and recreate information through interconnected channels to
build their journey. The possibilities of channels involve not only new digital devices
but also physical spaces, services and new actors—involving algorithms. Even if
the ecosystem is not prepared for bridging channels, users will blend spaces and
actions by themselves (Renzi, 2017), fnding their paths to a smoother and trustworthy experience.
Since the 1960s, information architecture concepts have evolved as new possibilities of interaction; and although expanding to new visions, its essence remains the
250
Handbook of Usability and User Experience
same. Our ubiquitous reality with pervasive experiences urged for new information
architecture understanding, not restricted to Web sites or apps, as the information
fows out artifacts. Resmini and Rosatti (2011) pointed out a list of transformations
from the classic information architecture to a new kind of experience:
(i) Information architecture as an ecosystem: Different media and different
contexts are integrated; therefore, no artifact can be considered an isolated
device. Artifacts now belong to a large ecosystem.
(ii) The users’ new role: Users contribute and actively produce new information or edit/add to something already published, inserting links, comments
or critics.
(iii) Static versus dynamic: The users’ active role makes the structure forever
unfnished, permanently in change and open to constant refnement and
manipulation.
(iv) Hybridization: Boundaries that separated different media, genres, entities
and domains are becoming blurred and spanning different environments.
(v) Horizontality: The correlation of elements overrules traditional top-down
hierarchies. Users push the system to spontaneous, ephemeral or temporary
semantic structures.
(vi) Focus on experience: Design changes its focus from individual devices to
planning and developing experiences and processes.
(vii) Experiences are now cross-media: According to Resmini and Rosatti
(2011), experiences connect different environments and media in ubiquitous ecologies, a process where all parts contribute to building one whole
experience journey.
User interactions in ecosystems are now collected and interpreted by algorithms
to respond to desires and train the continuous learning system. Through machine
learning, ecosystems can now collect data, classify subjects, cluster related actions,
display ads, flter items and recommend personalized content, generating additional
complexity to the functioning of information architecture—as we will detail in the
next sections.
14.2.1
INFORMATION ARCHITECTURE: FROM ECOLOGIES TO MACHINE LEARNING
Given the impressive achievements of recent advances in intelligent machines, several platforms somehow incorporate AI, or at least machine learning. These technologies have signifcantly impacted the user experience and how content is organized,
discovered and accessed in places replete with information (Wallach, Flohr and
Kaltenhauser, 2020).
Notorious examples of “AI summer” (the ongoing promising period of accelerated development and funding) are content recommendation systems, online marketing and advertising, voice recognition, speech-based systems, face recognition and
stand-alone cars, among many other specifc applications. This chapter is particularly interested in discussing user interaction with content recommendation systems
User Experience and Information Architecture
251
due to its natural relationship with information architecture, an essential part of our
theoretical framework.
ML-based recommendation systems are answers to one of our age’s central problems—traditionally addressed by information architecture—the information overload. As we know, information is being produced at a rate that exceeds the human
ability to fnd, review or understand it. In this sense, information management has
become one of our main challenges, on both individual and societal levels. It may be
the cause of information anxiety (Wurman, 2001). When faced with the extraordinary profusion of online content, traditional information management strategies are
no longer useful, Morrogh (2003) warned us. Bawden and Robinson (2020) stated
that although the problem has been there for centuries, it has become more urgent
since the arrival of ubiquitous digital information. Among the best ways of avoiding
information overload and guarantee fndability, there are strategies such as fltering
or better design of information systems.
Faced with the current profusion of environments and services with vast amounts
of content, we must keep in mind one of the central concepts of the discipline of
information architecture—the idea of fndability. According to the information
architect Morville (2005), fndability is an essential notion—that connects to the
degree to which a specifc object can be discovered or located; and alternatively, to
the degree to which an environment can support user navigation and item retrieval.
In this context, machine learning opened a new era for information architecture—considering fndability in information-rich ambience. Its approaches are
widely employed nowadays to analyze large bodies of data in cloud-based computing, extract patterns and support users’ decision-making. As examples, we can cite
the choice of a movie to watch on Netfix, a product to buy on Amazon or a song to
listen to on Spotify. ML-based systems have signifcantly increased and lead us to
question how these new techniques can meet users’ information search needs while
respecting human-centered design principles. For Wallach, Flohr and Kaltenhauser
(2020), the UX discipline’s traditional evaluation methods could underpin ML-based
products’ best development.
14.2.2
DISCUSSING AI AND ML
Artifcial intelligence seeks to study the mathematical principles of learning applied
to computers. The European Commission’s High-Level Expert Group on Artifcial
Intelligence stated that AI systems are software or hardware that act by perceiving
their environment through data acquisition. These systems interpret the collected
data, process the information derived from this data and decide the best action(s) to
take to achieve a given goal. AI systems can also “adapt their behaviour by analyzing
how the environment is affected by their previous actions.”
For Bengio (2019), human learning is not limited to reading books or accumulating facts or data; it adapts to the environment’s stimuli. Learning means integrating
information that we obtain through experience into abstractions that allow us to
make better decisions, understand the connections between the things we see and
predict what will happen next. In artifcial intelligence, we work with the notion
252
Handbook of Usability and User Experience
of generalization: the machine can generalize from things it has already seen and
learned to new situations, in a slow and gradual process, totally based on experience,
through contact with a large volume of data. It is what is called machine learning or
statistical learning. Machine learning has emerged as a topic of great interest within
the feld of artifcial intelligence research.
Based on Lovejoy and Holbrook, we can consider machine learning as the technique of making computers unveil patterns and relationships in a set of data, dispensing with their manual programming. Lately, digital product developers have had
more access to ML tools and techniques and have been more dedicated to creating
better user experiences. These experiences are now more personalized and customized; they are engaging and present in various services, with examples from streaming music to autonomous cars.
Machine learning is the study of algorithms that improve automatically through
experience (Hechler, Oberhofer, and Schaeck, 2020). The following are the three
main types of machine learning: supervised learning, unsupervised learning and
reinforcement learning.
(i) Supervised learning: According to Honda, Facure and Yaohao (2019), the primary characteristic of supervised learning systems is that the data used to train
the model contains the desired response. The training data is previously annotated with the answers or categories to be predicted. We can mention linear
regression, logistic regression, artifcial neural networks (ANNs), decision trees
and others among their best-known techniques. Examples of supervised learning include predicting products that customers are likely to buy or classifying
images based on content (Hechler, Oberhofer, and Schaeck, 2020).
(ii) Unsupervised learning: It does not require a previously labeled sample
of training data: its purpose is to cluster data points into different groups
(Hechler, Oberhofer, and Schaeck, 2020). Unsupervised learning problems
are considerably complex; thus, this model is at the frontier of machine
learning knowledge. Examples of unsupervised learning are flm or music
recommendation systems, anomaly detection and data visualization.
Among the known techniques are artifcial neural networks, expectationmaximization, hierarchical clustering, essential components analysis, etc.
(Honda, Facure and Yaohao, 2019).
(iii) Reinforcement learning (RL): It is based on learning through trial and
error. In this approach, an agent interacts with the environment to learn
how to perform tasks, improving actions based on rewards and punishments (Hechler, Oberhofer, and Schaeck, 2020). RL considers uncertainty
and incorporates changes in the environment into the process of making
the best decision. It is based on Skinner’s behavioral psychology (Honda,
Facure and Yaohao, 2019). As the model learns from the experiments, it
is expected that it selects the outputs that generate the most signifcant
rewards for each situation and avoids actions that bring the poorest rewards.
The process is repeated until the computer can choose the best action for
each scenario.
User Experience and Information Architecture
14.3
14.3.1
253
USER EXPERIENCE AND MACHINE LEARNING
PROBLEMS IN UX-AI INTERSECTION
Cramer and Kim (2019) denounce that the feld where the user experience meets
artifcial intelligence is full of tensions. Addressing the intersection where UX has
intertwined with AI, the two authors listed a range of problems.
Information architects and UX professionals well know the frst reported UX-AI
tension: there are conficting goals for the various actors involved: users, business
and company stakeholders. It implies that turning machine learning into a positive
user experience will require proper integration between algorithm programming,
business models and UX. Machine learning developers are trained to predominantly value features and quantitative aspects, such as accuracy metrics or click
rate. However, they should be based on holistic criteria that consider the results for
humans, ruling out possible harm to them—and this is not an issue yet solved.
The authors highlighted that algorithms are diffcult to explain, which creates
imbalances of power and understanding about how to infuence their results. Cramer
and Kim (2019) also warned us that if today we are facing a growing awareness of
the idea of algorithmic responsibility, we must direct our attention both to human
and social tensions as well as to ethical and environmental tensions. The spread of
machine learning algorithms has encouraged the proliferation of principles to guide
development. Fjeld et al. (2020) have pointed to a growing consensus around eight
trends that should guide AI: privacy, accountability, security and safety, transparency and explainability, fairness and non-discrimination, human control of technology, professional responsibility and promotion of human values.
So, how to put algorithms under human control? It is a question already addressed
by other researchers, such as Lovejoy and Holbrook (2019). They postulate that UX
professionals need to learn a lot more about machine learning to help users feel in
control of this technology. As the authors state, an in-depth study of users’ mental
models is essential because in machine learning there is a connection between the
algorithms and these models. As people interact, they change the outputs they will
see in the future, and this will infuence and change the way people interact. That is
a feedback loop.
Researchers observed that “conspiracy theories” regarding algorithms could
arise from the feedback loop and infuence user-algorithm interaction (Lovejoy and
Holbrook). These “conspiracy theories” are generally bad for both users and the
algorithms’ results because users may create incorrect mental models and manipulate the results according to imaginary rules.
The usability researcher Budiu (2019) has profoundly studied the interaction
between users and ML-based systems and has found that people produce weak
mental models regarding algorithms; therefore, they lose control over their results.
Budiu’s research observed that recommender algorithms are not transparent to users.
People cannot associate their interactions and results based on an adequate understanding of the process logic.
Users often consider the list of suggestions and recommendations as meaningless or random. Concerning information structure, algorithms often create categories
254
Handbook of Usability and User Experience
according to obscure and not mutually exclusive criteria. From an exclusively statistical or mathematical perspective, grouped categories may even make sense, but they
do not function as intuitive information architecture for humans. What we do have,
in most cases, is a taxonomy centered on the logic of the algorithmic model.
One of the main problems signalized by Budiu is the so-called black-box model.
The black-box model’s issue has already been addressed by Herlocker et al. (2000)
in their original article. According to the authors:
Often, there is not the opportunity or possibly the desire to convey the conceptual
model of the system to each user of the system. In such cases, the ACF [automated
collaborative fltering] system becomes a black box recommender, producing recommendations like those of an oracle. (Herlocker, Konstan and Riedl, 2000)
So, when analyzing collaborative flters for recommendation systems based on ML
algorithms, researchers point out that:
It is inevitable that some users will form incorrect conceptual models of the ACF
[automated collaborative fltering] systems that they are using to flter information.
(Herlocker, Konstan and Riedl, 2000).
The above situation is unsatisfactory because users need to develop a robust mental model of how the system works to interact correctly and change or correct its
results. The system must be clear about how it processes data and how people
can change outputs, thus putting users in control. However, Budiu observed that
users perceive cryptic and out of control inputs and outputs (Agner, Necyk and
Renzi, 2020).
Budiu also noted that imperfect calculations might cause interesting items to be
hidden and the presentation of low-relevance items during user-algorithm interaction. Similarly, the order in which the items appear may not make any sense. On the
other hand, too much time between user interactions and the production of outputs
that refect those interactions makes understanding even more complicated.
14.3.2
BASIC GUIDELINES FOR HUMAN-ALGORITHM INTERACTION
There are recommendations for algorithms to increase the quality of the user experience. Harley is a researcher who suggested a list of guidelines to guarantee a satisfactory user experience in ML-based systems. These are just a few primary guidelines
as proposed by Budiu and Harley (Agner, Necyk and Renzi, 2020):
(i) Transparency: The system must be specifc and clear to the user about
which people’s data are tracked and processed to generate their personalized lists. A clear explanation helps users decide whether recommendations
are relevant or not and will add credibility to the system. Working with
transparency means informing people about which interactions are considered by the algorithm to help the user build a relevant mental model of
interaction. Information and explanations about the model can remove the
User Experience and Information Architecture
(ii)
(iii)
(iv)
(v)
255
black-box feeling and beneft users in multiple ways, increasing acceptance
(Herlocker et al., 2000).
User control: The UX designers need to provide the user with easy tools
to rearrange the output list in a more relevant or familiar way. Categories
should be formed more intuitively and close to traditional information
architecture; therefore, it is essential to allow users to improve recommendations. Useful features must be provided to enter feedback or edit data to
create recommendations and make it more relevant. An example is a tool to
edit past actions: deleting items from a user’s browsing history or previous
purchases. Therefore, the algorithm would be instructed to forget atypical
behavior—a way users have to train it.
Categories and subcategories: Personalized recommendation lists must
have reasonable fndability. The users view them as a valuable navigation
resource amid information overload. Besides, regarding ML-generated taxonomy, users prefer to search for content in specifc subcategories when
browsing extensive inventories, such as Netfix, Amazon or Spotify. It is
also essential not to repeat the content within various categories to lower
the cost of interaction.
Response time: If users choose to optimize recommendations (by rating, adding items to a favorite list or updating their profle), the expectation is that the
result will be fast, mainly when the feedback is negative (Harley, 2019).
Session-specifc customization: It must be avoided because session-specifc
art miniatures, descriptions and titles often increase interaction’s cognitive
costs. The practice of homepage customization (according to a session or
device) restricts the learning of the layout, reducing usability (Budiu, 2019).
In many circumstances, researchers identify usability issues with AI systems and
suggest solutions. Amershi et al. (2019) have proposed development guidelines,
consolidating a set of 18 recommendations. With experts’ participation, their work
synthesized a guidance for designing human-algorithm interaction. Here we present
just a few of their guidelines, selected according to their relevance to the present
research:
(i) The user must understand what the system can do and how frequent its
errors are.
(ii) The system must display information relevant to the completion of the
user’s task.
(iii) The user must receive an explanation regarding the system’s behavior.
(iv) The experience must be delivered respecting the user’s mental model.
(v) When the system makes a mistake, the user should be able to correct it
easily.
(vi) The user should be able to provide feedback and indicate his or her
preferences.
(vii) The user should be able to customize what the system monitors and how it
behaves globally.
256
Handbook of Usability and User Experience
(viii) The system must present immediate information on how users’ actions will
change future behavior.
14.3.3 THE IMPORTANCE OF MENTAL MODELS
In UX and information architecture, the notion of a mental model is a fundamental
concept that has already been defned by Jakob Nielsen as follows: “A mental model
is based on belief, not facts: that is, it is a model of what users know (or think they
know) about a system.” As stated by Lovejoy and Holbrook, a mental model means
understanding how a product works and how users’ actions affect it.
Considering that the mental model is a user’s understanding of how something
works (products, places or people), the mental models that do not correspond to reality or maladjusted can cause frustration. However, it is not uncommon for designers
or developers to communicate incorrect mental models to users, failing to explain
clearly how the product works.
“In case of a mental-model mismatch, you basically have two different options:
Make the system conform to users’ mental models or improve users’ mental models”
(Nielsen, 2020). The designer can achieve it by adding transparency features to the
interface and better explaining the models. According to Nielsen, “it is a prime goal
for designers to make the user interface communicate the system’s basic nature well
enough that users form reasonably accurate (and thus useful) mental models.”
It is also essential to keep in mind that machine learning systems and products
adapt, optimize and customize themselves according to their interaction with users.
Consequently, it is crucial to communicate correct expectations about how the adaptation will occur, as mentioned above. Through user-algorithm interactions, there
will be a co-learning process, as the machine learning models will be transformed
as a function of these interactions, while the user’s mental model will also be altered.
Therefore, it is of utmost importance to communicate the non-human nature and
limits of these products to build pragmatic expectations for users and avoid disappointments, preparing them for the changes that will occur after their interactions
(People+AI, 2020).
In this context, explainability is one of the most critical AI qualities when considering its cooperation with user experience. Since explainability and confdence are
inherently correlated characteristics, UX professionals help users understand and
trust the ML system in the correct dosage by helping them build precise mental
models.
Meanwhile, there is a recurring problem in the midst of all this. It occurs that
explaining to optimize the user’s understanding can become a challenge: even AI
developers may not fully discern how the technology works to generate their outputs
in some instances.
14.4
UNDERSTANDING RECOMMENDATION SYSTEMS
We are living in an era of the preponderance of the Internet and information technology. This scenario has been very challenging in terms of the amount of information
User Experience and Information Architecture
257
and data that ordinary citizens must manage and interact with daily (Morrogh, 2003;
Wurman, 2001).
It is essential to rely on some kind of information fltering, and the information architect understands this requirement very well. The number of options to
choose from has overwhelmingly multiplied in almost every feld of our life: videos,
music, books, travel itineraries and restaurants, health safety, courses or even dates
with partners. As consumers, fnding goods and services classifed as “Long Tail”
(Anderson, 2006) is an arduous task and does not exempt the use of special flters
(Agner et al., 2020; Pandey, 2019). For this purpose, there are computer programs
known as recommender systems.
Machine learning algorithmic models can support us in decision-making processes. These recommender engines are tools that belong to the category of information fltering and predict which classifcation a user will give to an item based on
calculations and statistical inferences.
According to Rocca (2019), recommendation systems can be defned as algorithms designed to suggest items relevant to the user in a very general way. These
items can be music to listen to, flms to watch, texts to read, products to buy or anything else belonging to an extensive catalog. They aim to solve two types of problems: forecasting (data used to predict the evaluation a user will give to an item with
which he has not yet interacted) and rating (when creating a fnite list of items to be
presented to the user), as explained by Pandey (2019). These ML-based systems play
an increasingly central role in our lives, as we use them from e-commerce shopping
to entertainment services such as music on Spotify or videos on YouTube. These
include Facebook, LinkedIn or Twitter, as well as high click-through ads.
According to Pandey (Agner, Necyk and Renzi, 2020), the qualities of a reliable
recommendation system are the following: recommended items should be relevant
and interesting to users; items that users are not yet familiar with should preferably
be presented and lists of items should have diversifcation.
Recommendation systems use the collaborative or content-based fltering
approach, as explained below. There is currently a signifcant incidence of hybrid
systems (those systems that combine more than one approach).
Collaborative fltering relies on users’ past behavior (items purchased or ratings
given) and other users’ similar decisions. Collaborative fltering can recommend
items of all kinds without assuming knowledge of their content. As Rocca (2019)
remarked, it is based on the (questionable) assumption that people who have already
accorded in the past will accord in the future and that people will like items comparable to what they preferred in the past. The interactions recorded over time generate
new data and make the system increasingly effective. Therefore, the more the users
interact with the items, the more accurate the recommendations become.
We can observe that the mode of data collection to feed the model can be explicit
or implicit. Explicit types of data collection include: search terms, evaluating items
with like or dislike icons or creating a list. Implicit types of data collection can be
observing navigation times, considering songs listened to, viewing product lists or
analyzing the social network. The implicit data refect the records of the user’s interactions with the system, which are interpreted as indicators of interest or disinterest.
258
Handbook of Usability and User Experience
With a broad set of tracked data, it is possible to describe clusters representing
user communities with similar preferences to analyze their collective consumption
behavior (Kathayat, 2019).
The second type of approach, the content-based one, requires information about
both users and items, such as keywords representing each item and data for each
user’s profle. For example, age, gender, profession or any other personal data of the
user, as well as genre, band, shows, country, music labels or other information for
music fles. Based on what the user liked in the past or is currently looking for, this
type of algorithm fnds and presents new similar items, but it has the inconvenience
that it cannot become more effcient over time.
As Herlocker, Konstan and Rieldl (2000) explain, collaborative fltering technologies do not necessarily compete with content-based fltering: they can work
together to provide a robust hybrid solution. Both approaches have strengths and
weaknesses, so the hybrid approach is often adopted, fusing collaborative fltering
with content-based methods and others (Pandey, 2019). The Netfix streaming platform is an excellent example of a hybrid system because its recommendations are
based not only on consumption habits (collaborative approach) but also on similar
video (content-based).
Despite their obvious benefts in mitigating the effects of information overload,
and despite their contribution to more immersive and customized experiences, recommendation systems often receive severe criticism from various sources, including
their scholars. For example, Irvine (2020) criticizes the use of algorithms because,
by choosing practically everything for us and keeping us away from certain choices,
they eliminate freedom of choice.
14.4.1 THE ALGORITHMS IMPLEMENTED BY SPOTIFY
According to Iyengar (Irvine, 2020), the average individual makes over 70 conscious decisions a day. With the purpose to guide consumers through this labyrinth
of choices, recommendation algorithms have become the most ubiquitous machine
learning applications for products and services on the Web. A notable example of
this is the Spotify platform.
Spotify is a digital, cloud-based music enterprise—founded in Stockholm in
2008—offering cross-device access to over 50 million songs, as well as podcasts
and videos (Boyd, 2020). There are over 200 million users worldwide, 100 millions
of whom are premium subscribers (Kelley, 2020). According to Johnson (2020), with
such a volume of music fles, the platform’s challenge is: How do you recommend
songs with an appeal to its listeners?
As the author stated, there are signifcant differences between the consumption of
flms on entertainment platforms and the consumption of music: (i) an extreme asymmetry in the size of the catalogs (Spotify’s volume of options is enormous compared
to Netfix’s); (ii) unlike flms, the consumption of songs can happen repeatedly; (iii)
the music market is much more typifed as being niche than that of movies or series.
Algorithms have changed the way people fnd, listen and interact with music
(Irvine, 2020). This success’ components are well-known playlists generated,
User Experience and Information Architecture
259
personalized and cured, such as Discover Weekly, Daily Mixes, Release Radar
or recommended suggestions of artists. The service has become one of the most
successful platforms in streaming worldwide. Not only because it connects users
through music, but also because it employs complementary algorithmic approaches
to its recommendations. The methods that Spotify’s recommendation system uses
are three (Cornell, 2020; Ciocca, 2020):
(i) Collaborative fltering;
(ii) Natural language processing (NLP); and
(iii) Audio models.
One of the frst companies to use so-called collaborative fltering (CF) was Netfix,
considering users’ flm ratings to generate the learning about flms to recommend to
other similar users. After Netfix’s success, employing collaborative fltering became
popular among companies and a starting point for any recommendation model.
Collaborative fltering and natural language processing are benefcial for connecting listeners to the music that other listeners hear and comment on. Collaborative
fltering is a type of algorithm based on metrics, streaming data and user visits to
artists’ pages. It starts by analyzing a user’s behavior, comparing it to other users’
behavior. Collaborative fltering approaches revolve around the strategy of determining user preferences from historical behavioral data patterns. Consumer behavior
leaves a trail of data, generated through implicit and explicit feedback, which is collected (Johnson, 2020; Ciocca, 2020). If two users listen to the same sets of music or
artists, their tastes are likely to be aligned, explains Irvine (2020). The connections
between listeners create a list of recommendations that similar listeners appreciate.
It should be noted that, unlike Netfix, initially based on a star system assigned
by users, Spotify opted for implicit feedback to train its model. According to Pasick
(Irvine, 2020), examples of this feedback could include: songs played in repetition
and songs ignored after a 10-second timeout. User data can also come from explicit
feedback, such as the heart button in “Discover Weekly” or songs saved in the library
or the “Liked from Radio” playlist.
For greater accuracy, Spotify also uses natural language processing to analyze
the playlist as a “document itself” (Johnson, 2015). The NLP algorithm is based on
blog posts and articles about music to connect music to artists. This model’s source
data are common words, tracking metadata, news and other Internet texts. At stake
is a computer’s ability to understand human speech as it is spoken (Ciocca, 2020).
Those algorithms tirelessly scour the Web to determine what users are saying about specifc artists and songs. The goal is to identify clusters to determine
what adjectives and terminology refer to artists and songs and which other artists
and songs connect to them in the comments. The system classifes artists linked
by comments on the network into vectors to recommend similar content to other
Spotify users.
The third recommendation method is audio models—useful for analyzing raw
audio data and recommending music that has not yet become popular. Adding a third
model is vital to give more accuracy. Unlike the frst two, this algorithm recognizes
260
Handbook of Usability and User Experience
songs that are still unknown to the public because the audio models capture and
consider tunes with few listeners.
This algorithm applies convolutional neural networks that use clustering techniques to identify similarities in tempo, key, mode, time and sonority of audio tracks
(Cornell, 2020; Ciocca, 2020). Convolutional neural networks technology is already
employed for facial recognition, and it was modifed for audio data instead of pixels.
After processing, the neural network builds an understanding of each song according
to its technical characteristics. It allows us to understand the fundamental similarities between the songs and, therefore, which users may appreciate them based on
their consumption history.
The three models described above are used with clustering techniques to produce personalized recommendations of songs, podcasts and playlists, such as the
“Discover Weekly.” It should be emphasized that the recommendation models only
work well because they are connected to a broader ecosystem. This ecosystem
includes gigantic amounts of data captured through user interactions (a fact people
are not always aware of) and uses numerous clusters to make it work in huge matrices (Cornell, 2020; Ciocca, 2020).
14.5 RESEARCH METHOD: USERS’ INTERVIEWS
As Kuniavsky (2003) explained, observation can be crucial for UX research.
However, to deeply understand the user experience, it is necessary to ask him or her
questions—and this is what an interview is about.
According to Courage and Baxter (2005), an interview is often used to study the
user experience. An interview is a guided conversation in which one person seeks
information from another. There are a variety of types of interviews, depending on
restrictions and needs. A semistructured interview is a combination of structured
and unstructured types. The interviewer begins with a set of questions to answer but
can deviate from them from time to time. This kind of interview is not so structured,
which is easier to analyze data, but it has the advantage of unexpected data.
A screening questionnaire was applied among students in order to select interviewees. Being a Spotify subscriber and an advanced user of the platform were selection requirements. As the data collection process took place during pandemic times,
the 2020 second semester, remote communication was mediated by apps like Zoom
and similar apparatuses. The questionnaire was useful to select the interviewees and
to get to know them better.
As we developed qualitative research, there was no need to select a large sample
of the population. We applied one-on-one semistructured interviews to a small sample of design and marketing students from four Brazilian universities with distinct
characteristics and backgrounds: Universidade Federal de Pernambuco—Campus
Caruaru; Pontifícia Universidade Católica do Paraná—Curitiba; Universidade
Estadual Paulista—São Paulo; Universidade Federal Fluminense—Niterói.
The participants selected for the interview are undergraduate university students aged 20–39, mainly 20–25 years old. They are Spotify subscribers for
over two years or more, managing personal profles. The questionnaire and the
User Experience and Information Architecture
261
interviews revealed that there are many media practices in common among them:
daily access to the Internet for many hours; use of applications such as e-mail,
news apps, social networks, instant messages and entertainment apps, among
others; use of streaming content in smart TVs, notebooks or smartphones; flesharing; and e-learning sites.
Interviewees may also be users of other streaming platforms, like Netfix,
YouTube or GloboPlay. They consume music, preferably via Wi-Fi or downloaded
songs. They use the app at home, car or on the bus; and while working or playing
sports. During the coronavirus pandemic, some reported that they like to listen to
Spotify while cleaning their households.
14.5.1 INTERVIEWING RESULTS
Here we present a summary of the responses to the semistructured interviews with
Spotify users.
When answering how to fnd new music on the Spotify platform, some users surprised us by saying that they use Google and YouTube (a competing service). Some
users were relying on social networks or recommendation from friends:
“Sometimes I go on YouTube because I like to watch videos of the artists. I end
up researching the artist on YouTube.”
“I fnd bands on the Internet, on Google, or a friend who knows a lot tells me
about it. And mainly I fnd on YouTube, only then I migrate to Spotify.”
“I miss something that exists on YouTube Music: the related songs.”
“Recommendations are very similar to the Netfix catalogue: I keep passing
by, just passing by, and I don’t listen to anything.”
However, Spotify’s recommendations may play an essential role in the user experience. Users told stories that represented their emotional involvement with the platform’s sharing resources and reaffrmed some social or cultural benefts provided by
the recommendations.
“I’m quite satisfed because before I had Spotify, my friends knew a lot more
bands than me.”
“A friend of mine sent me a print of a sad song that I was listening to on
Spotify. His web version has shown him. I hadn’t talked to him for a long
time, and this made us reconnect.”
“I ended up knowing a lot of music because of Spotify’s recommendations.”
“When I was a teenager, I didn’t have money to buy CDs, and I only listened to
music through piracy. The positive thing about streaming is that the horizon
gets much wider, right?”
Continuing the interview, users discussed their customized recommendations and
how they could identify them instead of generic contents. Some interviewees indicated navigational, comprehensibility and information overload problems (classic
262
Handbook of Usability and User Experience
issues related to information architecture). For some others, the personalized category and grouping labeling system has come to attention.
“I don’t think the lists of recommendations are highlighted enough because
there is a lot of information, and I always get a little lost.”
“I just don’t explore anymore because they recommend a lot all the time.”
“I noticed the group ‘Songs that miss you,’ and also the title ‘Maybe you like
it.’ … These titles are funny.”
“Why do you have Daily Mix 1, 2, 3 and 4? What’s the difference among
them? I never really understood.”
Some interviewees have shown that they are uncomfortable with generalist recommendations and always prefer personalized ones:
“I don’t think they directly promote songs for which they were paid to promote. On Netfix, I can feel it. … [I]t’s terrible, so indiscreet.”
Although some respondents were unaware of “Discover Weekly” playlist, others
have confrmed to use it. Furthermore, lists or layouts generated to handle specifc
access devices may generate some confusion.
“This week, ‘Discover Weekly’ has just one song that I already knew. These
are rock, new wave and classic rock.”
“I always use it. In the mobile application, it’s one thing; in the desktop and on
the website, the recommendations are different. It’s a bug.”
We can say that, in general, the respondents considered “Discover Weekly” and
other Spotify recommendations as of high relevance. However, the excess of recommended items was again criticized.
“‘Discover Weekly’ is excellent. Spotify was killer because I liked 90% of it.”
“The only [negative] point is the excessive amount of songs, of artists that I
have never heard of. … I don’t have time to stop, to listen, and deepen!”
When asked how their recommendations were created, users could not confdently
say what implicit actions were collected. This confrmed suspicions that users cannot
build a complete or reliable mental model about how the system works.
“I’ve never tried to understand this.”
“Only the searches …”
“I thought that by adding in a playlist of favorites, I would be giving an indication that I liked. … But now I have doubts if this really instructs the
algorithm.”
“Click and follow specifc genres, click on releases of the week, I don’t know.”
User Experience and Information Architecture
263
“Spotify believes that because I’m listening a lot to a song, I must really like it.
It’s something indirect, never direct.”
“I imagine it takes the styles and artists that I mostly listen to.”
“If I listened to a song with the subcategories pop and rock, and another song that
is rock and indie, Spotify will show me other bands with the category common
to them, which is rock … although associated with other subgenres.”
“Maybe they see how much time you spend listening to an artist.”
We asked users how they could improve their recommendations. Although there are
users who already do this or have a notion of how to do it, the answers indicated that
not everyone employs methods to give feedback to the model. Some were thinking
about this for the frst time.
“I never thought about this.”
“I don’t know how to interact with the recommendations to improve them.”
“I just don’t need to show what I’m enjoying.”
“I don’t feel that giving like or dislike infuences the recommendations.”
“There were rare cases of songs that I haven’t liked. Then I clicked on that little
sign that looked like ‘Forbidden.’ I asked it to hide it so as not to pollute.”
“On YouTube Music, the choices are explicit; … in Spotify, it seems to be
something organic.”
“I hardly evaluate … I don’t feel comfortable showing it to anyone.”
We asked users who gave feedback if they are satisfed with the response time and
whether the system can keep up with their state of mind when receiving feedback.
Many of them reported that the recommendations are not up to speed (but this was
not unanimous).
“I think it takes a little bit, about a week to change everything.”
“I would like the updates to be more frequent than once per week.”
“I change my state of mind very quickly. On Spotify, it will take me a week to
get a result.”
“Recommendations do not go with the ideal speed to my moment of life, my
state of mind.”
“I noticed a change in my ‘Discover Weekly’ because of the quarantine: my
playlists were very depressive. I think you can give some signs, but the
change doesn’t happen until a while later.”
“The recommendations do not follow my life moment. They stay more or less
in the same ‘vibe.’ If it’s a depressive romantic song, Spotify will reinforce
this psychological model.”
“They don’t follow my moments because they are commercial
recommendations.”
“I don’t think it accompanies my state of mind.”
“Yes, when I’m happy, starting to date and in love, it usually follows my mood.”
264
Handbook of Usability and User Experience
In one of the reports, it was made clear that the human-algorithm interaction deserves
a more restrained attention because it can have unpredictable consequences.
“I try not to listen to sad music because of medical advice. I suffer from
depression. But it’s not every day that Spotify recommends me to listen to
happy music.”
Our research tried to fnd out whether users are comfortable having their consumption data collected and whether they saw any sign of a threat to privacy. Most interviewees demonstrated that they are aware of the risks posed by data collection and
other privacy issues:
“It’s invasive because Spotify doesn’t give me the awareness that he’s measuring [and sharing] all this. I get a little scared, you know?”
“I feel I don’t have many choices if I prefer not to share my data. But I honestly
don’t feel uncomfortable.”
“I’m a little afraid about sharing data with platforms. There is a website that
you connect with [Spotify’s] login, and it gives you an invasive result. They
found out that young Brazilians listened to depressive music during the
quarantine.”
Users reported issues related to other platforms that supposedly use private information for hyper-segmented advertising:
“If you say something, then Instagram is offering an advertisement about it!”
“It’s your data and your emotions, music refects it so much. It’s another tool
for the company to ‘play’ with you, so to speak. Selling products to you.”
“I said: I am in the mood to buy a skate. Then I went for a drink of water, and
when I came back, a roller-skating ad appeared. It’s crazy and frightening
at the same time!”
Sometimes, respondents have shown a variety of “conspiracy theories” associated
with their data’s possible irregular use:
“As in the WestWorld series, there is an exploration of the human mind and
desires. I hope that Spotify does not use our information to [share with]
others.”
“I don’t interact, I don’t give like or dislike, I don’t give answers … I don’t feel
comfortable.”
“I used to share everything about my life and my family, but over time I gained
the awareness that it is not exactly a danger of being attacked by a bandit but
is more related to manipulation.”
“We think we are in control, but we are not. We would be very different if
it weren’t for this artifcial intelligence that keeps throwing things in our
faces.”
User Experience and Information Architecture
265
“When you go on the Internet, you’re already willing to throw your privacy
away.”
“I worry if they take my bank account or use my money.”
14.6 CONCLUSIONS AND NOTES FOR DISCUSSION
The emergence of the current ML-based recommendation systems has strongly
impacted user experiences, with the justifcation of contributing to smoothing the
“information overload” problem. Algorithms demand that we update our look at
information architecture—a discipline that traditionally deals with information
landscapes’ structural design by synthesizing organization, navigation, labeling and
search systems.
Our study encouraged us to examine how information architecture has been
reshaped by the introduction of collaborative fltering and machine learning
approaches. By moving beyond its third phase—that of pervasive information, as
identifed by Resmini and Rosati—currently undergoing a rapid transformation
toward algorithms’ structured approach, information architecture is being compelled to coexist with new technological and automated ways to ensure fndability
and discoverability. That is because we live in times where gigantic catalogs full of
options such as Spotify’s may make users’ navigation and decision-making unviable.
This research tried to understand how young Brazilian users consume streaming content on the Spotify platform. Our goal was to continue previous research,
where we reported conclusions on the use of the Netfix platform (Agner, Necyk
and Renzi, 2020).
Some user responses showed that recommender systems might involve dealing
with typical information architecture issues such as the nomination and category
grouping system. They revealed that information overload, fndability and comprehensibility problems are not yet completely solved. As one respondent stated: “There
is a lot of information, and I always get a little lost.”
Experts and institutions involved in user experience and machine learning research
generally agree that transparency and explainability are requirements for systems
development and design, aiming to overcome the “black box” feeling. ML-based
interfaces should inform users how they work, i.e., what implicit or explicit data is
collected to create recommendation lists. However, we realized that users generally
could not understand the fundamentals of how the system works and do not build a
suitable mental model of it.
Explainability is essential because, according to Herlocker et al. (2000), it guarantees users’ confdence in the recommendation system. Moreover, it contributes
to greater understanding, involvement, education and acceptance of the system
as a valuable decision-making aid. So, UX designers should strive to clarify the
system’s logic, which collects and handles user interaction data to generate personalized recommendations. It will help users to build a more concrete mental model
that is closer to reality.
Most respondents have been sensitive to the suspicion that Spotify (and other
services or networks) captures—in a non-transparent way—manages and shares
266
Handbook of Usability and User Experience
their interaction data. When asked about their data’s privacy, respondents pointed
out fears of obscure use, robbery or marketing manipulation. As in our previous
survey, these suspicions shaped what Lovejoy and Holbrook once called “conspiracy
theories.” A statement made by one interviewee highlighted this sort of concern:
“It’s your data and your emotions; music refects it so much. It’s another tool for the
company to ‘play’ with you, so to speak.”
The problem is that these theories infuence how users will interact: some may
avoid explicitly reporting feedbacks. It was the case for the user who stated: “I don’t
interact, I don’t give like or dislike, I don’t give answers. … I don’t feel comfortable.”
Some of the users seemed unaware of how they can interact with the algorithm
to make the recommendations more in line with their goals or mood. Frequent users
do not know precisely how to interact with recommended content to instruct the
algorithm to improve lists and better suit their profle and personal preferences. They
have not shown to be confdent in their knowledge about the universe of possible
inputs taken into account by the algorithms.
Human-algorithm interaction emerges as the new frontier of studies involving
user experience design and information architecture. It seems that UX designers are
not always aware of the recommendation system issues raised by this research. We
have addressed some emerging problems that may have been so far neglected by UX
professionals. The information collected with young Brazilian Spotify users showed
several aspects of recommendation systems that deserve further investigation.
To conclude, we reaffrm the need for UX designers and information architects
to update themselves to better understand the technical nuances of ML-based recommendation systems. Such dynamics should contribute to building experiences
in which users feel confdent and satisfed interacting and collaborating with these
systems.
REFERENCES
Agner, L., Necyk, B., Renzi, A.: Recommendation Systems and Machine Learning:
Mapping the User Experience. In: Marcus A., Rosenzweig E. (eds.), Design, User
Experience, and Usability. Design for Contemporary Interactive Environments.
HCII 2020. Lecture Notes in Computer Science, vol. 12201. Springer, Cham (2020).
doi:10.1007/978-3-030-49760-6_1
Amershi, S., Weld, D., Vorvoreanu, M., Fourney, A., Nushi, B., Collisson, P., Suh, J., Iqbal,
S., Bennett, P.N., Inkpen, K., Teevan, J., Kikin-Gil, R., Horvitz, E.: Guidelines for
Human-AI Interaction. CHI ‘19: Proceedings of the 2019 CHI Conference on Human
Factors in Computing Systems. May 2019. Paper No.: 3. Pages 1–13. https://doi.
org/10.1145/3290605.3300233
Anderson, C.: A Cauda Longa: Do mercado de Massa para o Mercado de Nicho. Elsevier,
Rio de Janeiro (2006).
Bawden, D., Robinson, L.: Information Overload: An Introduction. Oxford Research
Encyclopedias, (2020). https://oxfordre.com/politics/view/10.1093/acrefore/978019022
8637.001.0001/acrefore-9780190228637-e-1360. doi:10.1093/acrefore/9780190228637.
013.1360
Bengio, Y.: Yoshua Bengio on Intelligent Machines. (2016). https://youtu.be/ePUSElR0o9o,
accessed 27 Dec 2019.
User Experience and Information Architecture
267
Benyon, D., Resmini, A.: User Experience in Cross-Channel Ecosystems. In: 31st British
Human-Computer Interaction Conference, Sunderland, UK (2017).
Boyd, C.: How Spotify Recommends Your New Favorite Artist: A Story of Data, Taste, and
a Very Effective Recommender System. https://towardsdatascience.com/how-spotify
-recommends-your-new-favorite-artist-8c1850512af0
Budiu, R.: Can Users Control and Understand a UI Driven by Machine Learning? Nielsen
Norman Group, (2018). https://www.nngroup.com/articles/machine-learning-ux/,
accessed 02 Jan 2020.
Ciocca, Sophia. How Does Spotify Know You So Well? (2017). https://medium.com/s/story/
spotifys-discover-weekly-how-machine-learning-fnds-your-new-music-19a41ab76efe.
accessed 15 Oct 2020.
Cramer, Henriette; Kim, Juho, Confronting the Tensions Where UX Meets AI; Introducing a
New ACM Interactions Forum. ACM Interactions 26(6), 69–71, Nov-Dec 2019.
Cornell University. Networks. How does Spotify Know You So Well? (2018). https://blogs.
cornell.edu/info2040/2018/09/17/how-does-spotify-know-you-so-well/. accessed 13
Oct 2020.
Courage, C., Baxter, K.: Understanding Your Users: A Practical Guide to User Requirements
Methods, Tools, and Techniques. Morgan Kaufmann, San Francisco (2005).
European Commission’s High-Level Expert Group on Artifcial Intelligence. Ethics
Guidelines for Trustworthy AI. (2019) https://ec.europa.eu/digital-single-market/en/
news/ethics-guidelines-trustworthy-ai, accessed 09 Oct 2020.
Fjeld, J., Achten, N., Hilligoss, H., Nagy, A., Srikumar, M.: Principled Artifcial Intelligence:
Mapping Consensus in Ethical and Rights-Based Approaches to Principles for AI
(January 15, 2020). Berkman Klein Center Research Publication No. 2020–1, doi:
10.2139/ssrn.3518482, Available at SSRN: https://ssrn.com/abstract=3518482, accessed
09 Oct 2020.
Google. People+AI Research (PAIR). (2018). https://pair.withgoogle.com/
Harley, A.: Individualized Recommendations: Users’ Expectations & Assumptions. (2018).
https://www.nngroup.com/articles/recommendation-expectations/, accessed 28 Nov
2019.
Harley, A.: UX Guidelines for Recommended Content. https://www.nngroup.com/articles/
recommendation-guidelines/, accessed 28 Nov 2019.
Hechler, Eberhard, Oberhofer, Martin, Schaeck, Thomas: Deploying AI in the Enterprise:
IT Approaches for Design, DevOps, Governance, Change Management,
Blockchain, and Quantum Computing. 1st ed., Apress, Berkeley, CA (2020). doi:
10.1007/978-1-4842-6206-1
Herlocker, J.L., Konstan, J.A., Riedl, J.: Explaining Collaborative Filtering Recommendations.
In Proc. of CSCW 2000. ACM, New York, 2000, 241–250.
Honda, Hugo, Facure, Matheus, Yaohao, Peng: Os Três Tipos de Aprendizado de Máquina.
(2017). https://lamfo-unb.github.io/2017/07/27/tres-tipos-am/
Irvine, M.: Music to My Ears: De-Blackboxing Spotify’s Recommendation Engine. (2019).
https://blogs.commons.georgetown.edu/cctp-607-spring2019/2019/05/06/music-to-my
-ears-de-blackboxing-spotifys-recommendation-algorithm/
Johnson, C.: Algorithmic Music Recommendations at Spotify. (2014). https://www.slideshare
.net/MrChrisJohnson/algorithmic-music-recommendations-at-spotify
Kathayat, V.: How Netfix Uses AI for Content Creation and Recommendation. (2019). https://
medium.com/swlh/how-netflix-uses-ai-for-content-creation-and-recommendation
-c1919efc0 af4. Accessed 15 Jan 2020.
Kelley, C.: Spotify Reaches 100 Million Paid Subscribers Ahead of Apple Music. Forbes,
(2019). Accessed November 11 2020. https://www.forbes.com/sites/caitlinkelley/2019
/04/29/spotify-100-million-paid-subscribers-apple-music/?sh=52fe3161117f
268
Handbook of Usability and User Experience
Kuniavsky, M.: Observing the User Experience: A Practitioner’s Guide to User Research.
Morgan Kaufmann, Burlington, MA (2003).
Lévy, Pierre: Tecnologias da inteligência: o futuro do pensamento na era da informática. In:
Editora 34, 203p. São Paulo, SP (1993).
Lovejoy, J., Holbrook, J.: Human-Centered Machine Learning. https://medium.com/googledesign/human-centered-machine-learning-a770d10562cd, accessed 10 Dec 2019.
Morrogh, Earl: Information Architecture: An Emerging 21st Century Profession. Prentice
Hall, New Jersey (2003), 194p.
Morville, P.: Ambient Findability. O’Reilly Media, Sebastopol, CA (2005).
Nielsen, J.: Mental Models. (2010). https://www.nngroup.com/articles/mental-models/,
accessed 13 Oct 2020.
Oliveira, H.P.C., Vidotti, S., Bentes, V.: Arquitetura de informação pervasiva [recurso eletrônico]. 1a. ed. Cultura Acadêmica, São Paulo (2015).
Pandey, P.: The Remarkable World of Recommender Systems. https://towardsdatascience
.com/the-remarkable-world-of-recommender-systems-bff4b9cbe6a7, accessed 28 Jan
2020.
Renzi, A.B.: UX heuristics for cross-channel interactive scenarios. In: Marcus, Aaron.,
Wang, Wentao (eds.), Design, User Experience, and Usability: Theory, Methodology,
and Management. Springer, Vancouver, BC, pp. 481–491 (2017).
Resmini, Andreas, Rosatti, Luca: Pervasive Information Architecture – Designing Cross
Channel User Experiences. Morgan Kaufmann – inprint of Elsevier, Burlington, MA
(2011).
Rocca, B.: Introduction to Recommender Systems. (2019). https://towardsdatascience.com/
introduct ion-to-recommender-systems-6c66cf15ada, accessed 19 Dec 2019.
Rosenfeld, Louis, Morville, Peter, Arango, Jorge: Information Architecture for the Web and
Beyond. 4th ed. O’Reilly, Sebastopol (2015).
Wallach, Flohr, Kaltenhauser: Beyond the Buzzwords: On the Perspective of AI in UX
and Vice Versa (HCII 2020). Dieter P. Wallach (B), Lukas A. Flohr, and Annika
Kaltenhauser. Springer Nature, Switzerland (2020). H. Degen and L. Reinerman-Jones
(eds.), HCII 2020, LNCS 12217, pp. 146–166 (2020). doi:10.1007/978-3-030-50334-5_10
Willis, D.: The UX Umbrella. (2014). http://www.dswillis.com/talks/2014/4/the-ux-umbrella
Wurman, Richard S.: Information Anxiety 2. Que, Indianapolis (2001), 308p.
15
Personifed Virtual
Assistants
Evaluating Users’ Perception
of Usability and UX
Claudia Mont’Alvão and Marcela Maués
CONTENTS
15.1 A Brief Introduction ..................................................................................... 269
15.1.1 Voice User Interfaces........................................................................ 270
15.1.2 Personifed Virtual Assistants (PVAs).............................................. 271
15.2 Method.......................................................................................................... 271
15.2.1 Quantitative Phase: Online Questionnaire ....................................... 272
15.2.1.1 Questions and Respondents’ Profle .................................. 272
15.2.1.2 Sample and Answers.......................................................... 273
15.2.2 Qualitative Phase: Focus Group ....................................................... 274
15.2.2.1 Technique and Its Conduction ........................................... 274
15.2.2.2 Pre-Session and Groups Profle ......................................... 274
15.2.3.3 Conducting the Focus Groups Sessions ............................. 275
15.2.2.4 Focus Group Sessions’ Results and Discussion................. 277
15.3 Takeaways and Future Researches ............................................................... 286
Acknowledgment ................................................................................................... 287
Note ...................................................................................................................... 288
References.............................................................................................................. 288
15.1 A BRIEF INTRODUCTION
Since the emergence of personal computers and their worldwide connection at the
hand of the Internet, computing has evolved. As a consequence, the interaction with
computing devices has matured as well. When there are more physical objects interconnected, and with processing capabilities of their own, the concept of computing
gradually grows apart from the desktop device, leading to ubiquitous use.
Talking computers and voice user interfaces (VUI) have already been widely
addressed in science fction, but every day it is more common to fnd voice user interfaces on various devices such as desktop computers, smartphones, smartwatches,
smart TVs and videogames. These interfaces have also been adopted in virtual
DOI: 10.1201/9780429343490-19
269
270
Handbook of Usability and User Experience
assistants (VAs), systems that assist their users in daily functions, ranging from organizing the agenda to controlling smart objects.
There is plenty of literature and research in the area. However, most usually
address the virtual assistants’ usage in English-speaking subjects, which is the standard language in most of the systems. There are not many studies addressing the
virtual assistants in their translated language forms with non-English subjects. In
this research case, we address the virtual assistant with Brazilian Portuguese users,
which aimed to understand better if the use of voice interfaces is understood and
useful in daily needs and how this happens within the singularities of this public.
15.1.1 VOICE USER INTERFACES
In the early days of personal computing, computer interfaces would resort to metaphors within the physical world to explain the functioning and to bring familiarity to
new use cases. In the current state of computing, the digital medium is already more
acquainted and allows more abstract patterns for interaction.
These new interfaces should follow the same principles for visual interface
design: provide feedback, navigability, consistency and attractiveness, without losing their function. In this scenario, verbal communication as an option for interface
design is reinforced.
According to Nass and Brave (2007):
Speech is a fundamental means of human communication. Even when other forms
of communication—such as writing, facial expressions, or sign language—would be
equally expressive, (hearing) people in all cultures persuade, inform, and build relationships primarily through speech.
These authors also affrm that in the 200,000 years of evolution, humans have
become voice-activated with brains that are wired to equate voices with people and
to act quickly on that identifcation. Talking, listening and human society have elegantly co-evolved into a remarkably interwoven, effective and stable system.
Emergent technology interfaces evolved and are now capable of producing and
understanding human voices, modifying the interaction between humans and computers, proposing a new model of “natural interaction.” As a result of these automatic
and unconscious social responses to voice technologies, the psychology of interface
speech is the psychology of human speech: voice interfaces are intrinsically social
interfaces. Designers must create voice interfaces for brains that are obsessed with
extracting as much social information as possible from speech and using that information to guide attitudes and behaviors (Nass and Brave, 2007). These authors also
affrm that humans usually do not make distinctions among talking to a “machine/
computer,” or with a person, once the same part of the brain is responsible for this
interaction.
Pearl (2016) determines that we are now in the “second era of VUIs” and the
“infancy of this next phase.” She proposes to think about users and their use cases:
“The main question to ask yourself is: will your users beneft from VUIs?”
Personifed Virtual Assistants
15.1.2
271
PERSONIFIED VIRTUAL ASSISTANTS (PVAS)
Weiser (1994) suggests that as new technologies and ways of interaction are offered,
new systems are created as virtual assistants. They received several names as “intelligent agents,” “personal virtual assistants,” “intelligent personal assistants,” “personal
digital assistants,” “mobile assistants” or “voice assistants” (McTear et al., 2016).
As examples, we can mention Siri (Apple), Google Home and Google Assistant,
Cortana (Microsoft), Alexa and Echo (Amazon) and Bixby (Samsung), among many
others. These virtual assistants are systems that can perform many tasks using voice
interaction combined with graphics and text on the screen. McTear et al. (2016) suggest the term “conversational interface to refer to the technology that supports conversational interaction with these VPAs, by means of speech and other modalities.”
As affrmed by McLean and Osei-Frimpong (2020), “in-home voice assistants
are designed to be more human-like than previous attempts and intended to be an
important part of an individual’s everyday life.” Considering the growth of voice
technologies, in the early 2010s it has been verifed that people are interacting with
voice assistants in daily life in the same natural way as with other humans (Sundar
et al., 2010).
The use of voice-control technology has become mainstream and is growing
worldwide. In the United States alone, the number of people who use voice assistants—including Amazon Alexa, Apple’s Siri, Google Assistant, Samsung’s Bixby
and Microsoft Cortana—is increasing faster than previously anticipated. It is estimated that in 2019, 111.8 million people in the United States will use a voice assistant
at least monthly, up 9.5% from last year. This data is equivalent to 39.4% of Internet
users and 33.8% of the total population (eMarketer, 2019). This report presents that
smartphones and smart speakers are the devices of choice for most voice assistant
users, and millennials are the heaviest users.
15.2 METHOD
The success of a product is not only a result of the rational characteristics of it,
and therefore this research was proposed to study the relationship of users with virtual assistants. The goal of this research was to investigate acceptance and opinions
about VAs and how users interact with them, considering voice as an interface. The
research assumption was that the personifcation and the use of conversational interfaces in virtual assistants would make their acceptance easier and would make their
opinions about it more positive. Some research questions conducted the literature
review and the feld survey:
What is the impact of voice on the user experience of PVAs? Does the voice,
instead of text, is understood as a beneft by users?
Does the literature review refect the particularities and feld studies in Brazil?
What are the similarities and points of attention about his public?
How do Brazilians use or intend to use voice interfaces, now and in the future?
What are their evaluation and opinions about PVAs?
272
Handbook of Usability and User Experience
The research was conducted in three stages. The frst was the literature review that
supported the discussions during the feld survey among the users.
The second stage was a quantitative approach, which consisted of applying a
close-ended online questionnaire aimed to understand the adoption and use of assistants in Rio de Janeiro. The questionnaire also aimed to identify participants for the
qualitative phase, a focus group.
The third stage, defned after the results of the questionnaire, was a focus group
technique aiming to collect data about the acceptance and the opinions of the resident of Rio de Janeiro about virtual assistants with a voice user interface. This qualitative approach was intended to map the relationship of participants with technology,
highlighting its positive aspects, diffculties, concerns, as well as what they see as
possibilities for future use.
15.2.1 QUANTITATIVE PHASE: ONLINE QUESTIONNAIRE
15.2.1.1 Questions and Respondents’ Profle
The questionnaire is the main instrument for collecting data in survey research. It is
a set of standardized questions, often called items, which follow a fxed scheme to
collect individual data about one or more specifc topics (Lavrakas, 2008)
This technique was applied to two types of questions: open- and close-ended. The
close-ended questions are those for which the answer options are predefned. The
open-ended questions are those that allow the respondents to write their answers.
While close-ended questions enable measurable and accurate answers, open-ended
questions allow a better understanding of the respondent’s thinking process, which
can qualify and clarify answers.
The purpose of applying this technique in the frst step of this research is to
understand the adoption and the user experience of assistants in a quantitative way.
It would also help to identify participants for the qualitative stage, the focus group,
as previously mentioned. With the objective to collect clear and objective data in
quantity, the choice was to ask close-ended questions. The only open-ended question
was to request contact information when the participant told that he/she wanted to
volunteer for the qualitative stage, the focus group. In this case, e-mail and telephone
should be provided.
The profle was established based on the following criteria: residents of the state
of Rio de Janeiro of 18 years or above. The state of Rio de Janeiro is the second
Brazilian state in the use of technologies and Internet access, and therefore, signifcant for the gathering of such information. Also, volunteers emerged for the qualitative phase, which required a face-to-face technique. Rio de Janeiro was where the
researchers were located, so it was a determinant aspect. The Consent Term was
presented to all participants so that they could give their consent and proceed with
the questionnaire answers.
In the questionnaire, the frst questions were demographic identifers (location, age, gender and education) and flters to narrow the search to the established
profle. The ones who ft the profle determined for the survey answered the next
question: if they had used any virtual assistant in the previous three months. In
Personifed Virtual Assistants
273
that case, the following questions would be given only to those who knew voice
assistants and would have a recent memory of the experience to give their opinion
on it. Anyone who did not have recent contact with voice assistants would already
be considered at this stage, and for the following questions, as a respondent who
did not adopt this system.
Respondents who had had recent contact were conducted to answer questions
regarding usage, opinion and general perceptions about the virtual assistant they
had used. The questionnaire mapped which assistant was used, the access device,
the purpose of use, the user evaluation of the experience and their adoption of the
system. After all questions, the volunteer should state whether they would be interested in participating in the focus group—and if so—they were asked to give their
contact details.
15.2.1.2 Sample and Answers
A pilot study was carried out with eight respondents, and no signifcant changes were
made in the defnitive questionnaire. Subjects were contacted using the snowball
approach, considering discussion groups, professional contacts and researchers, and
was answered by 200 people, of whom 161 were residents of Rio de Janeiro, older
than 18 years. Among them, 102 (63.4%) had used a virtual assistant with voice
interaction in the previous three months.
Their primary means of Internet access were their smartphones, laptops and
desktop computers. Only ten respondents that matched the aimed profle declared
smart speakers (Google Home and Amazon Echo) as Internet access devices.
The most commonly used assistants were Google Assistant, telemarketing and
sales representative virtual assistants, chatbots in Web sites and apps and Apple’s
Siri. However, 36.6% (n = 59) of the respondents did not use these assistants or could
not answer the question. The smartphone was the device most used, as mentioned
by 93.1% (n = 95).
Respondents also evaluated the PVAs according to their experience and use.
Experience was considered “good” by 54.7% (n = 56), while 20.6% (n = 21) considered “indifferent” and 14.7% (n = 15) as “bad.”
Free answers in the questionnaires were valuable to defne the technique for the
qualitative step of the research. They highlighted different aspects of the voice as
interaction. Some respondents recognized the benefts of using voice interactions,
mentioning “laziness” as the main motivation.
Besides my experience is not good when using voice assistants, I believe that my main
motivation to keep trying is laziness, mainly when I am in bed, or I do not want to
look at a shiny screen. It makes me ask “Hey, Siri, what time is it?” or “Hey, Siri, how
is the weather today.” (Respondent evaluated use experience as “very bad,” but keep
using the Siri assistant.)
Other respondents mentioned the disadvantages of the voice as a way of interaction.
One of the topics is the sharing of private information, a concern with privacy:
I prefer input data on the screen. I have more privacy.
274
Handbook of Usability and User Experience
Another disadvantage is that the perception of “speed” to receive the feedback is bigger than typing on the screen, as explained by one of the participants:
I think that they are important (the voice assistants), but it is possible to receive the
same information—and faster—with fngers.
These answers pointed out the topics that should be investigated on a qualitative
approach, considering not only the evaluation of usage and experience but also the
motivations, constraints and other personal aspects that were not deeply discussed
in the questionnaire.
15.2.2 QUALITATIVE PHASE: FOCUS GROUP
15.2.2.1 Technique and Its Conduction
Focus group research is one kind of qualitative research methodology. This type of
research is used primarily in the social and behavioral sciences, and usually involves
some interviews with people, either in groups or one-on-one. The data collected
are people’s views, opinions and ideas, and the data are gathered through their own
words (Glitz, 1997).
The groups usually have six to ten participants. Larger groups are diffcult to
manage; interactions between participants tend to be less effective and discussions
are hard to control. However, some techniques allow the focus group with fewer than
eight participants (Krueger and Casey, 2014).
The goal is to collect data that is of interest to the researcher, which compares
data among groups. Discussions must have a “focus” in a natural, logical sequence,
and research aims to understand the feelings of the participants, their comments and
how do they discuss the proposed topics (Krueger and Casey, 2014).
To collect Rio de Janeiro residents’ acceptance and opinions about virtual assistants, as well as to map their diffculties with the technology and their expectations
for the future, the focus group technique was chosen to interpret in more depth the
data obtained by the questionnaire.
15.2.2.2 Pre-Session and Groups Profle
The pretest, a pilot session, was performed by a group of six males, aged 20–25, and
as academic background, three were pursuing undergraduate courses, two had completed undergraduate and one was graduate. With regard to Internet access, all of
them use a smartphone, desktops and laptops, and one has a smart speaker, Google
Home, at home.
All of the participants were contacted a week before the meeting and instructed to
ask questions on their assistants. So, all of them could participate in the debate with
a recent memory for discussion. These questions were related to some answers to the
questionnaire and are listed below:
• Who are you? Here the respondent would listen to how the personal assistant presents itself.
Personifed Virtual Assistants
275
• Which books Stephen King wrote? This question mixed two languages
(Brazilian Portuguese and English) in the same phrase, one of the problems
mentioned by participants of the questionnaire.
• What is the weather forecast for today? In the questionnaire, many answers
were about the use of these assistants to “make a question or search.”
• Call my mom (or dad); send a message to my boyfriend (girlfriend); how
is the traffc to work/school? These questions aimed to explore the terms
used by the assistant that was not explicit (as an example, here was used
“my mom” and not the mom’s name). Besides, the idea was to instigate the
users’ curiosity about which personal information the assistant could fnd
alone or suggest to the user.
• How do I get the PUC-Rio (university)? This question was related to the
user´s geographic location in which the assistant would activate sensors and
real-time information.
After checking the proposed conduction for the technique, it was verifed that the
tasks proposed in pre-session were adequate. Other aspects—such as the best place
to set a camera or recorders; the possibility to offer some beverage and snacks—were
also observed. These points were the changes to create a comfortable discussion
among participants for the group sessions.
15.2.3.3 Conducting the Focus Groups Sessions
The frst focus group session has six participants, one female, fve males, aged
23–34, and academically they ranged from incomplete undergraduate to graduate
courses. All of them used a smartphone, desktop and laptop, and just one mentioned
that he did not use videogames. About PVAs, one used Cortana (Microsoft), two Siri
(Apple), three Google Assistant and one never used a personal assistant, just telemarketing virtual assistants.
In the second group, seven participants attended the invitation, fve females and
two males, aged 20–26, and academically they ranged from incomplete to complete
undergraduate courses. All of them used a smartphone, desktop and laptop, and just
one mentioned using videogames. About PVAs, two used Siri (Apple) and fve Google
Assistant, and one never used a personal assistant, just telemarketing virtual assistants.
When each group met, the researcher conducted the session considering two discussions: frst, to understand their opinion about PVA better nowadays, and second,
opinions about the future.
In the frst part, the researcher asked participants to redo the tasks that they did
at home, once some of them said that they did not have done. After that, the groups
were questioned about their impressions and opinions about these tasks.
The following topics that led the conversation in both focus groups were as
follows:
• The frst part—about PVAs nowadays
Which virtual assistant have you used recently? How was your experience
with this assistant? Did you like it? Why? If someone used more than
276
Handbook of Usability and User Experience
one assistant, which one you had liked most? Why? Could you perceive
any similarity or difference among them?
In which language was the assistant you have used? In which device did
you use it?
What was (were) your motivation(s) to use your assistant? It worked in the
way you had expected? If not, tell me what happened.
Have you noticed any problem with your assistant? Have any concerns
about it?
Can you remember how the voice of your assistant was? Male or female?
Have you already thought about why this voice is offered in a certain
gender? Did you like the voice?
What are your opinions about the assistant’s “personality”? Can you
remember if the PVA was sympathetic, formal, empathic, scornful,
friendly? Can you imagine how this system is offered in this way? Did
you like it or not?
Do you keep using the system? In each frequency. If you are not using it,
tell me why.
• The second part—about PVAs in the future
Now we will talk about the future of these PVAs and your expectancies for
them. Has someone here watched the movie Her? And the last Google
presentation of Google Duplex, the system that can make an appointment at a beauty salon or restaurant? (At this point, the researcher
presented the videos mentioned to all groups, once part of the participants have not seen both videos—movie Her during the installation of
‘Samantha’ and the presentation of Google Duplex during Google IO
2018).
What do you think about these visions for the future of PVAs? Did you like
any of these assistants? Can you consider using them? To do what?
How do you evaluate their utility?
What do you expect these assistants in the future? Can you imagine some
future possibilities for their use? What do you want them to do, ways to
work? Moreover, what you do not want them to do?
Do you believe that these assistants can bring problems in the future?
Which kind of problems?
Do you believe that these problems can affect the adoption of PVAs by
users?
And how will be the voice of these PVAs? And their personality?
Do you want to comment on something that we have already discussed or
want to bring up some new points for our discussion?
A summarized result of the topics in the discussions in both focus group meetings—
not considering the pretest session—is presented in the following sections, quoting
non-identifed phrases and words mentioned by participants as examples in italic
and quotes.
Personifed Virtual Assistants
277
15.2.2.4 Focus Group Sessions’ Results and Discussion
Since the purpose of this research was exploratory, the research fndings were
divided into broad categories of discussions that emerged during the online form and
focus groups. The results are presented under relevant topics, illustrating what the
participants mentioned, and comparing them with the information obtained in the
literature review.
15.2.2.4.1 Technical Limitations
This frst category addresses the problems caused by the technical limitations of
virtual assistants and voice interfaces. The volunteers concluded that we would overcome these technical limitations as these technologies evolve and solve the mentioned problems. Some of them also concluded that sooner or later, virtual voice
assistants will end up being commonplace, because people think they are fun, and
there is not a big technological gap to overcome.
• Network and performance perception
Voice assistants have an invocation phrase that allows them to recognize the user’s
intent to use them. This invocation phrase is necessary, so these systems know when
the user is talking to them, and they can identify when to listen and process what has
been requested actively.
Apple iOS users stated that Siri was slow to activate and to respond after the
invocation and sometimes did not respond. They blame this delay after their bad
smartphone performance or slow data connection and poor signal. The frustration of
these users can be connected to the fact that Siri did not have clear feedback when it
had no Internet access and therefore did not make it clear when it was available by
the time we conducted the focus group.
When you say “Hey, Siri,” this brief time that it takes to process the “hey Siri” and
activate the feedback is too much. … You never know exactly when you could keep
talking, because I cannot say “Hey, Siri, wake me up at 7 am.” If I talk straight, she
does not understand.
Although complaints about performance were restricted to iOS users, users of both
operating systems dislike the need to have Internet access to use the virtual assistants. They believed that Internet access should not be necessary for all the functions, and some of the tasks could be available offine.
15.2.2.4.2 Interpretation and Decision-Making
Users of both operating systems had the perception that the assistants have a limitation
when it comes to listening and understanding voice. Participants argued that assistants
sometimes could understand what had been said word for word, but did not know what
action they should take. Nevertheless, some voice interaction problems were attributed
to the assistant not understanding some words of what the user had said.
278
Handbook of Usability and User Experience
I like Siri very much, but it disturbs me when I ask her something, and the answer is
something completely different (from the expected answer).
Participants stressed that assistants are more assertive when the environment is free
of noise. In loud environments or when the user is in public spaces, their assistants
make more mistakes. Another reported error is regarding the understanding of more
than one language in the same sentence, as occurs when the user asks to play a foreign song. In the second focus group, participants stated that the assistant is better
when used in English.
15.2.2.4.3 Limited Navigation
Another problem reported was the inability to use applications through speech after
accessing them with the voice assistant. The assistant opens the application but does
not allow continuing the interaction through the voice within it. The user must proceed through the visual interface from there. Just opening an application with a voice
without the means to use it was seen as a “useless” feature.
In both focus groups, the perception that it was meaningless to use the voice when
the user would have to unlock the phone and select options manually on the screen
was unanimous, since “if you are using the voice assistant, you are probably not
able to use your hands.” There is an expectation of being able to usual things on the
phone without manipulating anything, just interacting by voice.
One participant in the second focus group told us she did not like the way Google’s
approach to third-party apps within the Google Assistant. By prompting the user to
talk to another entity, the user said, “the system seems to be transferring the user to
another department.” Other participants had not yet tried this functionality by the
time we applied the focus group.
15.2.2.4.4 Usability
This category addresses the critical points in the use and the problems regarding
effectiveness, effciency and satisfaction—usability—of voice interfaces. These are
issues that should be considered and addressed by interaction designers who are
designing for this type of interface. The lack of information about the possibilities of
the system leads to diffculty in use.
The most diffcult assistant that I had interacted with was Cortana, at Windows. This
assistant did not understand my questions, and I became confused about its functionalities, I did not understand what she could do for me.
None of the participants in either focus group could list what the assistants were able
to do, and this fact was evaluated to be both “good and bad.” Some participants have
shown interest in exploring and discovering what their assistants could do and had
fun while fnding new features.
However, despite the great satisfaction when discovering something that works,
a single bad experience could erode the user’s confdence in that system. One of the
participants exemplifed this situation when he tried to impress his girlfriend, and
Personifed Virtual Assistants
279
the system did not respond properly, culminating in frustration and abandonment of
the system.
Also, some of the users have said that they do not like to explore wizards and
adjust the assistant to what they know is possible and was mentioned by both Siri
(Apple) and Google Assistant users:
After a few unsuccessful attempts, people only ask for what they know the assistant is
capable of and experience less.
Most participants in both focus groups perceived the use of voice interaction and virtual assistants as an effcient way to shorten navigation paths in the mobile devices’
interfaces. Tasks that depend on many steps, such as creating an event on a calendar
or calling a contact can be achieved faster. However, some participants believe that
it is faster to use the visual user interface.
• Hands-free usage
Some of the participants in both focus groups argued that the need to unlock the
phone through the screen and select options manually makes it meaningless to use
the voice assistant, especially when the user cannot use their hands, such as when
driving a car.
Even when hands are free to use the phone, participants mentioned that they
expect that the assistant does not depend on the selection of options on the screen
after a voice interaction. This case happens, for instance, in cases of need for
disambiguation.
• Invocation
During the discussion about invocation, there were declared some preferences divergencies. While some participants said they preferred to activate the assistants by
voice—affrming that press a bottom is “boring” once it is a “longer interaction”—
others said that interacting with screens is better, once in this way they do not activate the assistant by accident.
This behavior matches what is related by Pearl (2016) that today a lot of us work
in open space offces, and what if everybody decides to “talk” with our computer to
do tasks, like “Computer, fnd all my Word documents this week.” It will be chaos.
Furthermore, “when you ‘talk,’ which computers are listening?”
Another point was the need to repeat the invocation more than once during the
same conversation with the assistant. Some participants suggested that conversation
must be active until the user asked to close the application or concluded the task. A
counterargument was discussed that a continuous interaction could be a problem
when the user is not dedicated to the interaction within the assistant.
Siri´s users, in both groups, mentioned frustration once they sometimes do not
know if the system is “listening to them” when there is no signal or the signal is weak,
once there is no feedback sound when the phone is soundless. Siri users agreed that
280
Handbook of Usability and User Experience
they invoke the assistant and it takes a while, or do not answer, without explaining to
the users if she/he is being heard or not.
Both groups commented and agreed that inadequate feedback indicates that more
development on new design options to present non-visual feedback is needed.
• Smash the natural conversation
Beyond the discussion about invocation, a point of complaint about all participants concerning Apple Siri was the loss of dialogue context. These users related
that all phrases seem to be a “new conversation,” once this assistant does not
retrieve information or “remember”’ of what is in the discussion. That is an attention point, the conversational interface of Apple Siri in Brazilian Portuguese is
not yet well-developed and sometimes works as command interface and voice
control.
Another aspect emphasized for both groups that can demotivate voice interfaces
is when the assistant gives a long answer to the user, for a brief and simple question.
When it happens, the user drops out a voice interface to look at the answer on the
screen; in worst cases, the users feel coerced to reformulate the question, as a tentative to obtain a specifc and more exact answer.
15.2.2.4.5 Accessibility
Regardless no person with special needs participate in the discussions; the participants commented that they believe that voice assistants can be useful for those who
are not able to use graphic interfaces. The humanization brought by the PVA “persona” was considered positive, once the system becomes familiar. It was also mentioned in both groups that “talk” with an assistant must be faster than using a screen
reader in a graphic interface.
Besides this, one of the participants criticized that the group was discussing
accessibility for a chance. He does consider that:
“These systems were not designed to be accessible. It was just convenient that they
are, once make them saleable.”
15.2.2.4.6 Other Topics Debated by the Groups
Assistants are considered as a way of entertainment, not a tool; once they are being
developed and adopted more because they are fun than because they are useful.
Motivations for using the assistants are related to laziness and entertainment.
They explained the laziness when they want to set a clock to wake up or when
they need information and do not want to stop and look it up. Another mentioned
situation was to take a shortcut during screen navigation, for example, ask for
the weather forecast on a trip, search for a contact to call or set an event on the
agenda.
The users consider the PVAs entertainment once they like to test the functionalities for curiosity, talk with the assistant to check joking in the way they work or to
fnd easter eggs (secrets hidden in the application that has humoristic aspect).
Personifed Virtual Assistants
281
The assuredness in both groups is that PVAs will be more useful in a fully connected world. The clear beneft is to substitute what today is done in a “mechanical
way,” without touching the phone, PVAs will need to know what must be bought for
the pantry, control the lights, adjust the air-conditioning temperature and so on. The
centerpiece was used in the domestic environment, which is noiseless, and the user
has more freedom to speak with the system. However, not all of them agreed with
this idea; once they remarked on it, they felt uncomfortable with the idea of controlling their lives.
• Customization
During discussions, participants considered as essential the PVAs adaptation to different levels and types of customization, as adequate to user´s humor, accept preferences confguration, ft the way of speaking, among other aspects.
This aspect is following what was affrmed by Nass and Brave (2007), which
highlight social identity as an important point of adoption and good evaluation of
voice interfaces. Dashtipour (2012) explained the Social Identity Theory (SIT):
It has been characterized as a theory that is primarily focused on social transformation
because it illustrates how social identities change and how categorization is involved
in collective action. (…) Group belonging is important as a basis for self-defnition.
Individuals, therefore, search for positive in-group distinctiveness and discriminate
against groups.
Focus group participants agreed that when everything is connected, it is easier to
know everything about a person; it makes the system more personalized but implies
safety and privacy negatively.
• Humor adequacy
Participants have the same opinion that to be “personal assistant,” the system must be
capable of knowing well its users and recognizing users’ moods, adapting their way
of communication. Users mentioned that they would not like to be treated in the same
way when they are in a good mood or a bad one. One of the participants summarized it:
If she (Siri) is sarcastic in a day, I´m in a very bad mood; I´ll kick the phone!
Nass and Brave (2007) also discussed mood and affrmed that users prefer consistency among the emotional state of content and voice. Users fnd it unusual when a
sad content is said happily, and something exciting is said with a sorry voice.
• Automation and passive customization
In both groups, participants evaluated as positive have an assistant—in the future—
that knows them very well. So well that it can solve activities without users’
282
Handbook of Usability and User Experience
interference, as setting appointments on the agenda, once it knows your schedule.
In a connected world, assistants could also help to confgure house appliances, like
light and temperature, before the user arrives at home.
• Confguration and active customization
Active personalization was also a point of discussion. The PVA must adapt itself to
the user but must also allow customization, considering from voice tone to system
personality. This need for customization could be verifed during participants’ discussions: some commented that PVA could be more trickster and friendly, while
others prefer a straighter and polite system. The way of interaction must be an agreement between the user and the PVA, and each person could decide whether to interact by voice or not. Just one person mentioned that it was possible to confgure a
male/ female voice in a PVA.
• Filter bubble1
Few participants mentioned the flter bubble during discussions, but those who mentioned demonstrated a big concern about it. To these people, users must take care
with an excess of personalization, that “can ft these PVAs in a bubble, in which
you just see what you want, what you like, and what you know.” Even if it is not a
problem related strictly to PVAs, once the topic was brought to the discussion, they
agreed that this bubble could deepen with them, once these systems are present during the users’ full day.
• “Forced humanization” than lack of conversational interface
Participants mentioned telemarketing virtual assistants as an example of a bad interaction, as “a lack of natural interaction,” a “forced humanization” once the system
speaks with you like a friend and “keeps a long time to conclude the service.” It is
related to the fact that it is not possible to “talk back” with a recorded message of
these telemarketing virtual assistants. This interaction becomes artifcial (or not natural) and is necessary to wait for a long set of instructions, as type an option or specifc
word to start the service. Participants affrmed they feel impatient during listening to
all instructions, and when it is possible, they skip directly to a “real person” agent.
It was also mentioned that this artifcial interaction delays the service, once it is not
possible to skip the preset tasks, and the “real agent” is always the last step during
this interaction.
Participants considered that to simulate a real situation, the interaction must also
be natural. If not, interaction is inconsistent and promotes frustration once the interaction with customer services always occurs in cases of problems, complaints and
stress.
• PVAs personality
Personifed Virtual Assistants
283
It is considered positive when the personalization of a PVA has a natural interaction,
and it is expected that these systems can be improved in the future, according to the
discussions in focus groups.
The participants that use iOs mentioned that Siri´s behavior of “making jokes,”
“be a rebel” or “talk in a sarcastic way” gives her personality, but this aspect could
be personalized by each user, as explained by one of the participants:
Siri is not my Siri; she’s de same Siri for everyone.
During discussions, Google Assistant was considered more “neutral” than Siri and
opinions were divided: for some of the users, this system is always “passive” and
“very helpful,” but “does not have a strong personality.” For others, this assistant is
“cool,” “friendly” and “helpful.”
• “Forced” social interaction
More introverted participants commented that they do not want to interact by voice
with PVAs. They justify this decision: “the system is one more person that I´ll need
to deal with every day.” Participants that mentioned this aspect appeared to be shy
and reserved during the focus group session, and also highlighted that they are “feeling obliged to use PVA at risk to be excluded in social groups.”
• Social rules of voice interaction
All participants referred to PVAs as “he” or “she,” determining some human characteristics as “stupid,” “polite,” “friendly,” “sarcastic.” One of the participants said he
always asks “please” and gives “thanks” to the PVA.
Even participants mentioned that they like voice interaction, some of them say they
prefer text, once using during walking is not ok to speak loud, or about private issues.
This behavior is pointed out by Pearl (2016), mentioning that many people spend
hours in their mobiles, usually texting. That is their default mode, and maybe they
will not change to voice mode.
Even when they are not in public areas, some participants mentioned that they
do not like to talk on the phone, and use chat instead, and this is the same behavior
with assistants. They consider this attitude positive once they do not feel comfortable
using PVAs in public, and it can be a barrier to the adoption of these systems.
As said by Pearl (2016), “Although VUIs are becoming more commonplace, not
everyone feels comfortable speaking out loud to a computer, even in private.”
• Social behavior and other impacts
Although the rich discussion about technical aspects such as usability, accessibility
and customization, among others, abridged in the above topics, the major concern
during discussions was the impact of PVAs on society and people’s life.
284
Handbook of Usability and User Experience
a. Voice’s gender
The fact that PVAs use as default female voices was discussed by both groups and
participant’s opinions were divided. For some of them, the female voice was seen as
a “heritage of subservience of female role in society” that was transposed to PVAs.
To other participants, this fact was not important once they are conditioned; once a
female voice is better and preset by the system.
The female voice preference may refect just for these discussion groups. On the
other hand, the mentioned system default reinforces the stereotypes that participants
consider negative for women’s role in society. While it was also mentioned that both
male and female voices are still “robotized voices,” in the future they expect that
voice scenario will become more plural.
A UN report (EQUALS, 2019) affrms that by naming voice assistants with female
names (as Alexa, Cortana and Siri) and using female voices by default, tech companies have habituated users to fall back upon old-fashioned and injurious women’s
perceptions. The report highlights that companies were not able to design exposure
controls against abusive, aggressive and gendered language. One of the problematic
aspects is that the assistants have a positive reaction (as jokes) when assaulted.
b. Privacy
The discomfort of using PVAs in public areas was unanimous, not only to be a shy
person but the “feeling to be exposed,” once “there is no privacy in asking something
to PVA with people observing,” even recognizing the practicality of voice interaction.
Another aspect concerning privacy is related to share personal information with
strangers, not only the system. This idea led the group discussions to the need for
transparency about what data is being collected by the system, how it is done, how
data is stored, distributed and mainly, who will access it. Some participants said
they are already “resigned” that their data are being stored and believe that this fact
is not bad at all, once this data can personalize the system. This group defends that
to design a personalized system; it must learn how the user speaks and relates with
others—loose privacy is one aspect that will imply better PVAs.
All of them believed that data privacy is already a concern, and PVAs are not
establishing a new problem, making the problem worse.
This aspect was also mentioned by Pearl (2016):
If they discuss a health issue, most users won’t want to do so by speaking to their
phone on the train ride into work. It’s not just privacy for what the user says to systems,
either—it’s the potential privacy violations of a VUI automatically regarding your text
messages out loud.”
c. Sale and sharing of personal data
Another concern shared by participants was the fact that companies share and
use their private data. A preoccupation is that once PVAs are automatized and
Personifed Virtual Assistants
285
can decide on the user, it gives a bias for advertisers. One of the participants gave
an example of this situation if he asks the assistant to buy a pair of shoes. In this
case, he believes that:
The system will consider not only users’ preferences and specifc confguration, but
also will indicate a “partner” to this purchase.
This example started a new discussion: some participants affrmed to be “invaded”
with personalized ads, while others feel passive, once in this case, they received
interesting ads.
They all mentioned that Web site and apps terms of service documents they need
to accept or are not allowed using the product/ service, as explained by one of the
participants:
Or you accept, or you will be excluded from everything and everyone for not using (the
app), and it is human nature be included, accepted.
d. Reinforce of bad behavior
A point mentioned during discussions was about personalized assistants that stimulate and reinforce ideas and bad behaviors. As an example, a racist person can personalize the assistant that will agree with anti-ethical attitudes and generate a “flter
bubble.”
One of the participants that has a technical profle discussed this aspect, mentioning that there is a risk not only for personalization but also for classifcatory systems.
In this case, the assistant could support prejudice and stereotypes when identifying
user’s profles and label them. In this case, the assistant could identify, as an example, a disease in a certain user (by mistake or not) and wound her/his privacy making
decisions on alerting the family or health insurance companies. All of them agreed
that this kind of situation could be a disaster in people’s lives.
e. Inequality and unemployment
Inequality was also a topic of discussion by groups. The cost of this technology is
understood by participants as a segregator, once it can prevent the access of part of
the population, or allow the access for just an outdated and low-quality technology.
On the other hand, once technologies drive forward, they cost less and become more
popular. Finally, it was also highlighted that “in Brazil, until now (2019), there are
citizens with no internet access.”
The topic of unemployment was discussed, considering how virtual assistants
would substitute humans in certain jobs. Some of the participants believe that the
human factor is important, and that one day he/she will lead the same situation (as
customer service, for example) and will have empathy with the user. Others believe
that this is naïve thinking, that one day people will have more free time in their days,
that one day the technology will take humans’ place in performing simple tasks.
286
Handbook of Usability and User Experience
One of the participants mentioned that this substitution of humans with machines
would generate more inequality and would affect jobs needing less skill. On the
other hand, even the more advanced assistants would not be able to replace professionals who perform intellectual activities, or this kind of exchange would not be
fnancially viable.
f. Impact on new generations and their social behavior
During discussions it was mentioned that PVAs would leave people lazy and pampered, and they will be unprepared to perform basic tasks alone. As an example, it
was cited that since smartphones became popular, people started to type and write
with errors (due to the use of abbreviations), and lost the practice of handwriting.
It was also debated that virtual assistants can lead to human seclusion. Some
argued that isolation would happen, once no social interaction will be necessary for
daily life and in the distant future, people will create a stronger relationship with
VAs rather than with other persons, as was said by one of the participants:
It’s being designed a technology that seems a person for no need to talk with a “real”
person.
Some participants mentioned that technology would minimize daily tasks, and
people will have more free time for human interactions that care. They expressed
that nowadays there is an opposition between talking and interacting with people
because everyone prefers using chats, and maybe virtual assistants could bring back
the natural speak.
In the face of this argument, participants remembered that assistants do not have
as the only function perform tasks, but also a social role. Social and amusement roles
are expected with great potential for those who cannot socialize “in person,” such as
the aged, the ill or those with mobility problems.
15.2.2.4.7 Future Adoption
The common understanding is that virtual assistants can be useful tools, and will
evolve to be in our daily lives, more than today. In the future, these assistants will be
needed, and people will have a good experience with them, not only as entertainment.
15.3
TAKEAWAYS AND FUTURE RESEARCHES
The research presented in this chapter addressed the personifcation and the use of
conversational interfaces in virtual assistants with the premise that these traits would
facilitate their acceptance and make the opinion about their uses positive. At the end
of the study, the result showed that the personality of these assistants indeed facilitates their adoption and has positive effects on the user’s perception. However, voice
user interfaces still cause discomfort when used in public environments. The biggest
concerns raised by users regarding voice assistants were not technical or usability
problems, but refections on the impact of assistants on society and people’s lives.
Personifed Virtual Assistants
287
It is possible to point out some answers to the research questions:
What is the impact of voice on the user experience of PVAs? Does the voice,
instead of text, is understood as a beneft by users? Besides, voice interaction was evaluated as a beneft—as the possibility of interaction with occupied hands, shortcuts to navigations, accessibility—users related that they
still feel uncomfortable to use these systems in public areas, as well interact with unanimated objects (as computers and mobile phones), what can
demand a diffculty in these systems adoption.
Does the literature review refect the particularities and feld studies in Brazil?
Which are the similarities and points of attention about his public? Nass
and Brave (2007), Pearl (2016) and UN report EQUALS (2019) are some of
the authors that supported the focus groups discussion analysis, but topics
like privacy, social and ethical aspects and the preference for female voices
regardless of the user’s gender were also observed during the discussions.
Some of these points must be studied in future research.
How do Brazilians use or intend to use voice interfaces, now and in the
future? How are their evaluation and opinions about PVAs? The majority
of focus groups participants as questionnaire respondents does not use all
the functionalities that these systems offer, but they believe that there is a
potential for this technology, and consider their adoption once PVAs involute and become more usual. The connected scenario and the presence of
assistants in the home environment through smart speakers are shown as
potential infuencers of their adoption. Results also lead to user’s perception
of personifcation and voice interface as positive aspects for adoption and
experience.
Although the results can be supported by the studies conducted with the Englishspeaking public, there are singularities in the Portuguese-speaking public usage of
PVAs.
It is not just a new technology that presents itself, but a different expectation that
people have, different relations with a system that people will set in their everyday
activities, with other interconnected devices, along with other human beings.
Usability and users’ experience are issues that are fundamental for the adoption
or not in the future and is related to decision-making, effciency, ways of interaction
(voice, text), social behavior, customization, personalization, privacy, social interaction, equality and the feeling of belonging to a society. Each of these topics needs to
be investigated deeper, once they are related to cultural aspects, the role of each of
us in society.
ACKNOWLEDGMENT
The authors would like to thank the Coordination of Superior Level Staff
Improvement—Brazil (CAPES)—Financing Code 001 for the support for this
research.
288
Handbook of Usability and User Experience
NOTE
1. “Filter bubble” is a term coined by Pariser (2011), which means an intellectual isolation
that can occur when websites make use of algorithms to selectively assume the information a user would want to see, and then give information to the user according to this
assumption. A flter bubble, therefore, can cause users signifcantly less contact with
contradicting viewpoints, causing the user to become intellectually isolated.
REFERENCES
AMAZON. “What Is a Voice User Interface (VUI)?”, 2019. Accessed December 29, 2019.
https://developer.amazon.com/pt-br/alexa-skills-kit/vui
Dashtipour, P. Social Identity in Question. Construction, Subjectivity and Critique. London:
Routledge, 2012. 160 p.
EMarketer. US Voice Assistant Users 2019. Who, What, When, Where and Why. eMarketer
Report, 2019.
EQUALS. I'd Blush If I Can: Closing Gender Divides in Digital Skills through Education.
New York: UNESCO, United Nations Educational, Scientifc and Cultural
Organization, 2019. Accessed December 29, 2019. https://unesdoc.unesco.org/ark:
/48223/pf0000367416.
Glitz, B. “The Focus Group Technique in Library Research: An Introduction.” Bulletin of the
Medical Librarian Association 85(4), October 1997, 385–390.
Krueger, R., Casey, M. Focus Groups: A Practical Guide for Applied Research. 5th ed.
Thousand Oaks, CA: Sage Publications, 2014. 280 p.
Lavrakas, P. Encyclopedia of Survey Research Methods. Thousand Oaks, CA: SAGE
Publications, 2008. 1072 p.
McLean, G., Osei-Frimpong, K. “Hey Alexa… Examine the Variables Infuencing the Use
of Artifcial Intelligent In-Home Voice Assistants.” Computers in Human Behavior 99,
2019, 28–37. Accessed January 09, 2020. doi:10.1016/j.chb.2019.05.009.
McTear, M., Callejas, Z., Barres, D. G. “The Dawn of the Conversational Interface.” In The
Conversational Interface: Talking to Smart Devices, edited by McTear, M., Callejas,
Z., Barres, D. G. New York: Springer, 2016, 11–24. doi:10.1007/978-3-319-32967-3_2.
Nass, C., Brave, S. Wired for Speech: How Voice Activated and Advances the HumanComputer Relationship. Cambridge, MA: MIT Press, 2007. 296 p.
Pariser, E. The Filter Bubble: How the New Personalized Web Is Changing What We Read
and How We Think. London: Penguin Books, 2011, 308 p. Kindle format.
Pearl, C. Designing Voice User Interfaces: Principles of Conversational Experiences.
Beijing: O’Reilly Media, 2016. 278 p.
Sundar, S. S., Xu, Q., Bellur, S. “Designing Interactivity in Media Interfaces: A
Communications Perspective.” In Proceedings of the 28th International Conference
on Human Factors in Computing Systems, CHI 2010: Perspectives on Design. Atlanta,
GA: ACM, April 10–15, 2010. doi:10.1145/1753326.1753666.
Weiser, M. “The World is Not a Desktop.” Interactions 1(1), 1994, 7–8.
Section 5
Usability and UX in the
Currency Context and
Emerging Technologies
16
User Experience in
Remote Context
Emerging Needs
Maria Lucia Leite Ribeiro Okimoto
CONTENTS
16.1
16.2
16.3
16.4
Introduction .................................................................................................. 291
Usability, User Experience and User Context............................................... 292
Context in the Pandemic Period ................................................................... 292
Strategies for Conducting User Experience Studies in the Context of a
Pandemic ...................................................................................................... 295
16.5 Survey of Perceptual Aspects of Users of Digital Platforms for Remote
Activities....................................................................................................... 297
16.6 Conclusion .................................................................................................... 299
References.............................................................................................................. 299
16.1
INTRODUCTION
This decade stands out in human development worldwide, with changes resulting
from the pandemic SARS-CoV-2, generically named COVID-19. Not only has the
health protocols for disease prevention been changed, but together it has also brought
about profound social changes across the planet. The frst sign of change appears
in human behavior. Unfortunately, the urgency of the current pandemic situation,
resulting from the SARS-CoV-2 virus, did not allow humanity to go through an
adaptive stage. And the health measures imposed by WHO to reduce the impact of
the virus through social isolation brought with it several consequences. Thus, the
global crisis resulting from the pandemic brings a strong transforming trend reaching beyond the health systems, the economy, politics and culture. And humanity, still
supporting these changes, has been adapting very quickly, seeking its self-regulation.
This concept of self-regulation is one of the conceptual elements, a component of the
complex biological system, as pointed out by Varela, Maturana and Uribe (1974).
This is a time of transformation and adaptation of life to new world trends. And
certainly the year 2020 will be in the eyes of the next generations as a landmark
of historical transformation of humanity. Within this new context, some expressions appear and become popular, such as quarantine, social distance, restriction to
circulation, confnement and lockdown. The user experience takes on new dimensions, hugs are replaced by emojis, face-to-face meetings and classes by remote
DOI: 10.1201/9780429343490-21
291
292
Handbook of Usability and User Experience
conferences, traditional tourism by virtual tourism, offces by Work from Home
and artistic presentations by lives. In this way, humanity has sought to reinvent
itself, readapt, change habits, rethink concepts and rediscover new values. Behavior,
the way to manifest and transmit information and emotions are being drastically
replaced in this period.
16.2 USABILITY, USER EXPERIENCE AND USER CONTEXT
Usability is typically defned as the “capability of being used,” in other words, the
capability of an entity to be used (Bevan, Carter, and Harker, 2015). Usability is part
of the user experience (UX). According to ISO 9241-210: 2019, the user experience
is defned as user’s perceptions and responses that result from the use and/or anticipated use of a system, product or service; whereas users’ perceptions and responses
include the users’ emotions, beliefs, preferences, perceptions, comfort, behaviors
and accomplishments that occur before, during and after use. The user experience
is a consequence of brand image, presentation, functionality, system performance,
interactive behavior and assistive capabilities of a system, product or service. It also
results from the user’s internal and physical state resulting from prior experiences,
attitudes, skills, abilities and personality and from the context of use.
The user context is the basis for assessing usability and user experience. One must
understand the specifc contexts of use, considering the characteristics of the users,
objectives and environments of particular interest to the user. For digital systems, the
user context is included in ISO/IEC 25063: 2014.
Considering aspects of accessibility and aspects of context of use, we can take
population data as a reference to realize the percentage of users who need some
kind of help so that they can effectively access information and interact, in order to
expand autonomy. In Brazil, we have a population of approximately 208 million and
900,000 people. Of these, 24% declared to have some disability, according to IBGE
(2010). In this scenario, more than 50 million people are excluded due to the lack of
accessibility resources. Accessibility is important for people with different disabilities and abilities: either by using the keyboard for navigation without the “mouse” or
by the diffculty or inability to see the screen, by cognitive diffculties, by the use of
the Brazilian virtual sign language, VLIBRAS or by other particular issues.
16.3 CONTEXT IN THE PANDEMIC PERIOD
The global pandemic scenario has changed the experiences of users and UX professionals. There were few specifc studies in this period of the pandemic observed
from April to November 2020 that deal together with the theme of user experience
and remote activity. However, the actions of the NN/g (Nielsen Norman Group) stand
out in the promotion of instructions and training for professionals and of UX tests
remotely. Kate Moran (2020) from NN/g presents a study on behavior changes before
and after COVID-19. According to the author, before COVID-19, the population
routinely performed the following actions: commuting every day to an offce; taking children to school or daycare; exercising in a gym; socializing in large groups
User Experience in Remote Context
293
at bars; buying products in stores; going out to eat in restaurants; going to a movie
theater; going on international vacations; visiting a doctor’s offce; visiting a government offce to complete paperwork. After the health rules and recommendations of
the World Health Organization, many actions were modifed, and during the period
of greatest rigidity with restrictions, and recommendation intensifying social isolation, while remaining local rules to prevent contamination. And, even a few months
after the most critical periods, Moran (2020) still observes the following changes in
people’s routine: no commuting and working from home; homeschooling or caring
for children at home; exercising at home, outdoors or not at all; buying products
online; ordering food to be delivered at home; renting a movie at home; going on a
local road trip; using a telehealth app from home.
Evidently, depending on the local culture, there may be differences in people’s
behavioral changes. And these changes can be more complex, due to the virus itself
and the age group of the population that has the greatest restriction, these being people over 60 years old. In addition to this impact of restriction on mobility, economy,
education, hospital infrastructure, public policies and consequently the entire global
production chain were affected. The magnitude and exact nature of the changes can
only be tested in a few years. However, individual behavior change will certainly be
part of people’s experience, and according to Moran (2020), this may be a short-term
change, but it may also have long-term consequences for all related sectors. On the
other hand, with regard to emotional impacts, which emerge from the consequences
of the restrictions of the pandemic state, people who are more sensitive and in situations of greater vulnerability in this case are subject to a greater risk, tending to
depression and anxiety.
Pfefferbaum (2020) considers that public health emergencies can affect health,
safety and well-being causing insecurity, confusion, emotional isolation and stigma
to individuals, as well as affecting the communities, due to the economic factor, loss
of job and school and lack of fnancial resources for medical assistance, among other
factors. The authors consider that the consequences may have repercussions on the
emotional part or with changes in unhealthy behavior, through the excessive use
of chemicals, alcohol and other illegal substances. The authors point out that other
research indicates that emotional suffering is ubiquitous in populations affected
by disaster situations, and that this fact may echo in populations affected by the
COVID-19 pandemic. About this issue, Pfefferbaum (2020) describes psychological
sequelae in quarantined people and health professionals and the main symptoms are
stress, depression, irritability, insomnia, fear, confusion, anger, frustration, boredom
and stigma. Even symptoms that persisted were identifed, even after the quarantine
was lifted.
Thus, it is a consensus to affrm, corroborating with the arguments of Moran
(2020), that this year people have different expectations and concerns than they had
in 2019, and some of these differences may be lasting. And in this context of a pandemic, there was a need to break paradigms to readjust human supplies. At frst,
the traditional way of acquiring and purchasing food and the place where the work
was carried out was broken. In this change, the bases of human survival prevail, to
remain protected individually, or family, as well as for their economic protection. In
294
Handbook of Usability and User Experience
this frst paradigm break and behavior change, there was a considerable growth in
online shopping. In this way, we can perceive the role of self-regulation of the human
biological system, as pointed out by Varela, Maturana and Uribe (1974). This change
favors opportunities for this “new user,” as their needs change radically. Thus, it is a
strategy for obtaining necessary inputs—electronic commerce. A large fow of new
potential customers with different emerging needs quickly appear in this scenario.
And technology has been the means of interaction and the solution to meet the
basic needs of this global society during the pandemic period. Thus, remote working raises social and technical issues. The crisis has sparked a mass shift to working
from home. As a result, the use of remote collaboration tool, particularly videoconferencing platform, has surged. Another major impact of a paradigm shift was
on distance learning. The technologies of distance learning have increased signifcantly in recent years, gaining confdence little by little, above all, in the professional
training of adults. Distance learning with its own rules has, in this short time of
the pandemic, passed from a complementary system to a necessary and emergency
teaching support. Thus, remote education has expanded at an accelerated rate, being
above all a means of access to all levels of education, from the preschool phase to
the highest level of postgraduation. And in this way, people started using digital
platforms and media for all possible day-to-day interactions, sharing cake recipes,
solving small problems and other tips on an innate need to share their actions, skills
and knowledge.
Chen et al. (2020) investigate user experience in digital teaching platforms in
China during the COVID-19 pandemic. They point out that social education has
shifted from face-to-face to online in order to avoid large gatherings and crowds
for blocking the transmission of the virus. The authors argue that these platforms
provide strong support and aid for education during the pandemic period and bring
to users a new experience, but also bring a lot of controversies. Because of that, it
was necessary to analyze changes in user concerns on these platforms before and
after the epidemic. And they analyzed the impact of the virus on user experience and
deeply retrieved users’ requirements, about seven major online education platforms
before and after the outbreak of COVID-19, by combining the emotional analysis,
hot mining technology, as well as relevant literature. In this way, they developed
a systematic method with weighting of the variables, thus adopting a comprehensive evaluation method to analyze user experience before and after the outbreak of
COVID-19, and fnally fnds out the change of users’ concerns regarding the online
education platform. The authors evaluate in terms of access speed, reliability, timely
transmission technology of video information, course management, communication
and interaction and learning and technical support and explore the supporting abilities and response levels of online education platforms during COVID-19, and puts
forward corresponding measures to improve how these platforms function.
Initially the authors frst collected comments from users of seven traditional
online education platforms, and then punctuated the emotional aspects in the comments and presented a platform rating index system. Weight to the index was defned,
thus the variation coeffcient method and the entropy method were used for the calculation. Based on the index weights obtained, the user experience of each platform
User Experience in Remote Context
295
before and after the outbreak of COVID-19 was assessed in order to analyze the
impact of the pandemic on the user experience.
Surveys related to user experience must also meet the ethics in research recommendations. In Brazil, the National Research Ethics Commission (Conep) of the
National Health Council (CNS) guides the adoption of the guidelines of the Ministry
of Health (MS) arising from the pandemic caused by COVID-19, in order to minimize potential health risks and the integrity of research participants, researchers and
members of the Research Ethics Committees.
16.4
STRATEGIES FOR CONDUCTING USER EXPERIENCE
STUDIES IN THE CONTEXT OF A PANDEMIC
The remote communication strategy extends to all areas, and in the context of the user
experience, takes advantage of new dedicated digital platforms with video resources,
just as it did for use in distance learning. In this way, the user experience remotely
expands and consolidates protocols and techniques already developed, including some
strategies considered complementary, such as remote usability testing, in the face of
direct approaches, of interaction between the UX professional and users.
The frst environments for usability tests, considered as observation aquariums,
sought to block the physical presence of the evaluator in order to reduce the emotional and distraction aspects of the task. And these usability test environments, even
if in person, sought to have a specifc environment in order to isolate the researcher’s
in-person variables from the participant. According to Bradner (2004), almost 20
years ago, the remote usability test started to become popular through the use of
technology. For remote usability tests, the digital conference telephone call system
was used, using call audio in conjunction with screen sharing. One of the tools used
was Microsoft NetMeeting or Live Meeting. This technology was the frst step to
allow remote-assisted performance observation in a virtual laboratory. Some advantages of the remote test are pointed out by the authors, and the fact that physical
restrictions on access to the site and physical space for testing are eliminated, also
impacting on the fnal cost-reduction of this process.
The face-to-face interaction brings us some advantages for the established practices of UX, which is the easiness for the participants to build a bond of trust and
professional relationship than remotely. An effective point of face-to-face interaction is greater concentration, since the participant is immersed in that context that
involves the product. Thus, the time for concentration and attention may be longer
according to Kapla (2020). However, in the event of a pandemic and possibly on
other particular occasions, we cannot always perform user experience activities personally. There can be many unforeseen events: limitations of budget, time, travel or
other unforeseen circumstances can make the face-to-face form impossible. At this
moment, when the planet is going through a pandemic, this may be the most effcient
and safest solution for everyone, whether they are participants or professionals.
Kapla (2020) points out the benefts that remote UX sessions offer: fexibility in
project funds, the remote sessions reduce travel expenses; increased inclusiveness,
the location and space are no longer limitations with remote sessions; participant
296
Handbook of Usability and User Experience
convenience—promotes greater convenience to participants that does not require
them to leave the offce or home, also saving time.
So the main point of investigation of UX is to identify the new habits and behavioral changes of the new users during the pandemic. The experiences of the NN/g
Norman Group, reported by Moran (2020) in user experience with different companies, emphasize that each user group is unique, and that’s why everyone needs to
do their own research. Depending on who is your user populations, their behavior
and preference changes may be different from another user population. Moran recommends that when assessing COVID-19’s impact on your users, consider whether
there are behavioral shifts; psychological shifts; changes in user groups; regional
effect; and temporal effects.
The NN/g Norman Group at their Web site https://www.nngroup.com provide training to conduct remote UX research. This group clearly and concisely presents the need
to pay attention to UX practices for this new context. Also, they emphasize the need to
adapt the methods, software and the context of isolation that the user fnds. Best practices
need to be reviewed and moderated and unmoderated remote user experience research
improved. The team highlights specifc recommendations within each sequential stage
of the UX process planning: practice using technology; recruit additional users; plan
technology challenges; provide instructions; and adjust the consent forms.
It is also recommended that a good training should be provided to researchers on
new technologies, in order to increase the tool’s familiarity, and to do previous tests
with the team with the new technology. And particularly for remote and unmoderated sessions, it stresses the importance of clear instructions for entering and completing tasks. It is important to plan and conduct an initial pilot test with some users
to adjust the technology and other factors as needed before starting the study. They
emphasize that because they are remote tests, they can become unusable due to the
technology itself, so having an additional number of users is quite appropriate in
these cases, creating a proactive safety net.
They recommend that the researchers should always prepare an alternative form
of communication with the user, which in a simple way can be through a telephone
call. Another alternative is to use a Web link for interviews with users: preferably
accesses that do not require participants to download anything to join the session.
It is essential to provide instructions if the technology tool is complex or users are
going to confgure and use it for a long time. Evernote’s shared notebook can assist
as a tool to arrange the necessary forms, especially the consent forms. If it is necessary to record the face, voice or screen of the participant during a remote session, it
is important that the consent form is updated with the appropriate permissions for
each of these items, as well as other authorizations.
Remote user research can be conducted in the same way as UX that normally uses
several research methods according to the objectives of the study. The NN/g recommends in remote and unmoderated sessions: tools to capture qualitative perceptions
of video recordings and loud voiceover by users. The most used are Lookback, dscout
and Userbrain. And for quantitative metrics, such as time spent and success rate,
software such as Koncept App and Maze are used. The UserZoom and UserTesting
platforms have qualitative and quantitative resources.
User Experience in Remote Context
297
Today, in fact, there are many platforms for UX testing available, with costs relatively adequate to each situation, from a small usability test to others of higher
cost that can provide greater variability of the user experience. The vast majority
of platforms, including in the period of the pandemic, released videoconferencing
systems with screen sharing, call recording and videos free of charge. Most meeting
platforms allow you to schedule meetings in advance. Among the platforms used are
Jitsi meet, Zoom, GoToMeeting, Microsoft Teams, Google Hangouts Meet, Skype
Business, etc.
16.5 SURVEY OF PERCEPTUAL ASPECTS OF USERS OF
DIGITAL PLATFORMS FOR REMOTE ACTIVITIES
A questionnaire was applied to survey the perception of the use of remote systems
for the use of work activities. The research was carried out in the city of Curitiba,
Brazil, in November 2020. The objective was to try to identify aspects of interaction with the platforms and the main diffculties and dissatisfactions for carrying out
work tasks. The survey was conducted on Google Forms, which is a search management application launched by Google. In the survey, 49 people participated, with
16.3% in the 18–24 age group: 12% in the 25–30 age group; 12.2% in the 31–40 age
group; 24.5% in the 41–50 age group; 24.5% in the 51–60 years age group; 6.1% in
the 61–75 age group; and 4.1% in the 66–70 age group. Searching in this sample is to
seek representatives of age groups that use digital platforms intensively.
Participants were asked about the context of occupation, work, study and type of
professional relationship. It was also questioned whether they performed activities
related to teaching, whether as a student or teacher. In this group of users, 55% exercise registered work activities, and 12% exercise professional activity independently,
22.4% are students and 16% do not currently have a professional activity. Of this
audience, 83% use the digital platform for work or teaching. The time of use of digital systems was reported by 22.4% who used for more than 10 hours daily, another
22% used between 8 and 10 hours daily. A total of 42.4% use more than 5 hours
daily. And 95.9% of users selected the notebook for the virtual meeting of work
activities. For family reunion activities, only 40.8% of them used a digital platform
for this purpose. And 57% of users reported using the digital platform for teaching
purposes, while 34.7% of users reported that they teach remote classes.
The digital platforms used were the following: Microsoft Teens by 37.6%; Google
Meet 26.5%; Zoom 14.5%, Cisco Webex 6.12%, Discord 6.12% and with less use the
Google Classroom platforms; Jitsi, Skype Business and Whatsapp. Below we list the
comments of 32 users who responded about what they dislike most about conducting
a remote virtual meeting activity on the platforms chosen for their activities.
U01. I hate to use headphones, but it is necessary.
U02. Access diffculty.
U03. Not being able to know if students are actually participating.
U04. People don’t know how to use technology. Time is wasted, a lot of time,
with things that are extremely simple and straightforward.
298
Handbook of Usability and User Experience
U05. It takes time to understand the interface, which leads to delays in the
development of the meeting.
U06. Unstable Internet.
U07. The concern with the status of the connection and also the context in
which I am inserted. At home, there are several distractions and other
responsibilities that infuence and hinder concentration, such as sharing the
same environment with another person who works remotely.
U08. It is different from a physical meeting in the sense of public engagement.
U09. Lack of help for people who don’t know the platform, the lack of a tutorial makes it diffcult.
U10. Connectivity issues.
U11. Delay to enter due to passwords, sudden disconnection of the call.
U12. Due to long periods in front of screens, it causes discomfort in the eyes,
in addition to sleep, and the greater ease in being distracted by other things.
U13. I need more control of the speaker’s window. To be able to transmit to
another platform. To be able to quickly choose to teach between mosaic and
just one window, using keyboard shortcuts.
U14. People with camera off.
U15. When the video freezes.
U16. You have to close the microphone or there is a lot of noise.
U17. Very tiring.
U18. Interruptions.
U19. Don’t see the students’ reaction. Most keep the camera closed.
U20. The system can stop at any time.
U21. Interruption when power is lost or when the connection fails.
U22. I miss personal contact.
U23. It is very tiring when the meeting lasts more than 2 hours.
U24. I get discouraged when the transmission stops at my meeting.
U25. Connection failure is annoying.
U26. People do not turn on the video camera when sharing the screen.
U27. In classes: the silence of the audience. The sloppy physical environment, lack of lighting, sound in the environment, low-quality Internet of
participants.
U28. Complexity.
U29. Inconveniently opened video cameras.
U30. When all participants turn off the camera, turning into a meeting of
machines.
U32. The digital platform is not so interesting to extend discussions, answer
questions, interact to explore aspects of the conversation. In my opinion,
this fact makes the relationship more impersonal, since the listeners are
in the same virtual environment, but not with the same level of collective
interaction.
It can be seen in the results that the negative experiences that were
presented by the users are recurrent for several users with regard to the
aspect of failures and interruptions due to technological issues. But the vast
User Experience in Remote Context
299
majority of reasons for dissatisfaction refer to the behavior of users in front
of the cameras, in an attempt to remain incognito in the virtual meeting.
Fear of exposing the environment where you are, diffculties to isolate noise
from your environment.
16.6 CONCLUSION
To the detriment of social isolation measures, professionals in the feld of design
and usability had to reinvent themselves and adapt, bringing new possibilities, given
the need to stay at home. And this context brings us refections on the conduct of
user experience studies in a remote context. In this sense, in this chapter new paths
were pointed out for professionals in the area which have brought signifcant results,
providing greater security for the reproduction of techniques already established for
face-to-face contact in the remote form.
But for that, as a post, it is necessary to understand this new context, the user,
their expectations, fears and anxiety in the face of this pandemic and post-pandemic
moment. Therefore, new adaptations to the methods of conducting research and data
collection are essential, which at this stage is being revitalized and reframed.
Since the COVID-19 pandemic has drastically affected user behavior worldwide,
different cultures have also responded in a unique way adapting to the restrictions of
remote data collection methods, which do not allow personal interactions. The use of
digital platforms has signifcantly remodeled and innovated the way we relate to people. Digital platforms undoubtedly have the potential to play an important role in the
dissemination and reformulation of the user experience practice. And the COVID-19
pandemic is an opportunity to iteratively optimize remote abilities for the UX teams.
REFERENCES
Almarzooq, Z., Lopes, M., Kochar, A. 2020. Virtual Learning during the COVID-19
Pandemic: A Disruptive Technology in Graduate Medical Education. Journal
of the American College of Cardiology, 20, 34917–2. JAC 27263. doi:10.1016/j.
jacc.2020.04.015 (accessed October 15, 2020).
Bevan, N., Carter, J., Harker, S. 2015. ISO 9241-11 Revised: What Have We Learnt About
Usability Since 1998? In: Kurosu, M. (eds.), Human-Computer Interaction: Design
and Evaluation. HCI 2015. Lecture Notes in Computer Science, vol 9169. Springer,
Cham. doi: 10.1007/978-3-319-20901-2_13
Bradner, E. 2004. Keeping Your Distance: Remote Usability Testing or the Lab–Which is
the Best. User Experience, 6, 11. http://uxpamagazine.org/keeping-your-distance/
(accessed November 8, 2020).
Chen, T., et al. 2020. The Impact of the COVID-19 Pandemic on User Experience with Online
Education Platforms in China. Sustainability, 12(18), 7329. doi: 10.3390/su12187329
(accessed November 8, 2020).
ISO 9241-210:2019. 2019. Ergonomics of Human-System Interaction — Part 210: HumanCentred Design for Interactive Systems.
Iurchenko, A. 2016. Remote User Research & Usability Methods. UX Magazine. https://
uxmag.com/articles/remote-user-research-usability-methods (accessed September 21,
2020).
300
Handbook of Usability and User Experience
Kapla, K. 2020. Remote UX Work: Guidelines and Resources. https://www.nngroup.com/
articles/remote-ux/ (accessed October 30, 2020).
Moran, K. 2020. COVID-19 Has Changed Your Users. https://www.nngroup.com/articles/
covid-changed-users/ (accessed October 15, 2020).
Pfefferbaum, B. 2020. NORTH, Carol S. Mental Health and the Covid-19 Pandemic.
New England Journal of Medicine, 2020. https://www.nejm.org/doi/full/10.1056/
NEJMp2008017 (accessed October 15, 2020).
Rao, M. 2020. Why Remote Research is Sometimes the Best Choice and How to Do it Right.
https://blinkux.com/ideas/remote-ux-research (accessed November 10, 2020).
Varela, F. G., Maturana, H. R., Uribe, R. 1974. Autopoiesis: The Organization of Living
Systems, Its Characterization and a Model. Biosystems, 5(4), 187–196.
17
Applications of Infrared
Thermography to
Evaluate the Ergonomics
and Usability of Products
with a Gestural Interface
Danilo F. Vitorino, Marcelo M. Soares
and Marcio A. Marçal
CONTENTS
17.1
17.2
17.3
17.4
Introduction ..................................................................................................302
Gestural Interfaces for 3D Modeling............................................................302
Leap Motion and Sculpting .......................................................................... 303
Digital Infrared Thermography.................................................................... 305
17.4.1 Applications of Digital Infrared Thermography .............................. 305
17.4.2 The Operation of Digital Infrared Thermography ...........................306
17.4.3 Emotional Measurement with Digital Thermography......................306
17.5 Research Materials and Methods .................................................................309
17.5.1 Hypotheses........................................................................................ 310
17.5.2 Usability Assessment........................................................................ 310
17.5.3 Ergonomic Assessment..................................................................... 311
17.5.4 Study Design..................................................................................... 311
17.5.4.1 Defnition of the Sample of Users...................................... 311
17.5.4.2 Test Location...................................................................... 311
17.5.4.3 Equipment Used................................................................. 312
17.6 Field Study .................................................................................................... 312
17.6.1 Field Study 1: Expert Evaluation ...................................................... 312
17.6.2 Field Study 2—Emotional Assessment ............................................ 314
17.6.2.1 Assessment of the Reported Stress .................................... 315
17.6.2.2 Assessment of the Felt Stress............................................. 316
17.6.2.3 Analysis and Discussion of Emotional Assessment .......... 317
17.6.3 Field Study 3: Pain Assessment ........................................................ 320
17.6.3.1 Assessment of the Reported Pain ...................................... 320
17.6.3.2 Assessment of the Felt Pain ............................................... 322
17.6.3.3 Analysis and Discussion of Pain Assessment .................... 324
DOI: 10.1201/9780429343490-22
301
302
Handbook of Usability and User Experience
17.7 Conclusions................................................................................................... 324
Acknowledgments.................................................................................................. 327
References.............................................................................................................. 327
17.1
INTRODUCTION
The human being constantly seeks to perfect the artifacts that help him in his daily
life. Technology has advanced a lot, and the possibilities are immense. New products are emerging and incorporated into people’s daily lives. At the same time, old
products are being updated, and new forms of interaction are part of these changes
(Rogers et al., 2013). Devices such as smartphones, tablets, interactive videogames,
home robots and others, which recently did not exist, are now essential to perform
domestic tasks, work and entertainment. Equipped with features that fascinate their
users at frst contact, these artifacts can be manipulated through various tactile
actions, voice commands and body movement recognition, instantly understood by
the device’s system (Wigdor and Wixon 2011).
Gestural technology is today one of the main novelties, both in new products and
in updating existing products (Wigdor and Wixon 2011; Rogers, Sharp, and Preece
2013). The best-known application is the touchscreen, a type of interface that requires
the user to touch the device directly to interact with the interface (Saffer 2008).
However, body movement recognition sensors such as Kinect and Leap Motion are
being disseminated and interact without direct contact with the product.
The popularization of these new technologies, as previously mentioned, is causing
changes in many consumer products. However, there are artifacts with different functions and complexities. It is necessary to study the possibility of applying these new
forms of interaction to identify each situation in the most appropriate way. Ten years
ago, Norman and Nielsen (2010) made an alert that remains current. The authors
stated that the gestures would form a valuable addition to the repertoire of interaction
techniques. Still more time and studies are needed to make them more appropriate, to
understand better how to implant them and to develop conventions, so that the same
gestures, which mean the same thing, can be applied in different systems.
The benefts and damages of the applications of these new technologies are not
yet fully known. Gestural interfaces, despite their rapid acceptance in the market,
are still little studied, and the consequences for the health of their supporters are not
fully understood. Therefore, in this study, we will present the use of digital infrared
thermography, as an auxiliary tool, in the ergonomic evaluation through the verifcation of pain and usability through the evaluation of the level of psychological
and physiological stress in the users. The study was performed in a 3D modeling
software that uses a fully gestural interface in order to identify non-conformities and
serve as a model for future evaluations of the same category (Vitorino 2017).
17.2 GESTURAL INTERFACES FOR 3D MODELING
The gesture is, in the specifc approach of gestural interfaces, any physical movement that a digital system can identify and respond without the need for physical
Applications of Infrared Thermography
303
devices such as a mouse, joystick, pen, etc. These interfaces can be categorized as
touchscreen or freeform. In the touchscreen, most of the time, the user touches the
device directly. The second category is that which does not require direct physical
manipulation with the device, is originated from any movement or state of the body
and can be a head movement, a wink or a hand wave (Saffer 2008).
The “old” mouse, still effcient, has been replaced by the touchscreen. The gestural interface may be the next logical step for this transition as it allows for very
intuitive selection and manipulation of content in a 3D environment (Adhikarla,
Jakus, and Sodnik 2015). However, Norman and Nielsen highlight that sign interface projects have neglected consolidated concepts and principles of interaction
design being highlighted: visibility of affordances, feedback, consistency, reversibility of actions, detectability of functions, scalability of screen resolutions and
reliability of operations. Although gestural interfaces have the function of making people’s lives easier, they are sinning in important interaction requirements,
which can cause frustrations, errors and misuse of the interface (Norman and
Nielsen 2010).
It can be observed that most studies on 3D modeling with gestural interfaces
are basically quantitative and comparative, where researchers measure the time of
execution of tasks and compare them with the time of performing the task with the
mouse, and at the end of the experiments, the interviewees express their opinions on
the use of the system (Yang et al. 2012; Oliveira 2013; Coelho and Verbeek 2014). In
such experiments, there is a more signifcant concern with the system’s performance,
neglecting the user’s satisfaction and comfort when interacting with the system. This
is probably because most studies deal with computer systems development and programming for preliminary tests, such as moving, rotating and scaling simple 3D
objects, such as cubes and spheres.
17.3 LEAP MOTION AND SCULPTING
Leap Motion is a device that tracks the hands and fngers of the user within their
feld of view, without the need for other equipment (Figure 17.1), to manipulate some
interactive application (software, application or game).
Leap Motion is an optical tracking system that works through two cameras and
three infrared LEDs. It captures the movements in up to 200 frames per second, giving a 150° feld of view, with approximately 240 cm³ of interactive space. It has the
shape of an inverted pyramid, positioned at about 80 cm, as illustrated in Figure 17.2.
This device can track the ten fngers with an accuracy of 0.01 mm. It is a rectangular
block-shaped artifact about 8 cm wide × 1.1 cm high × 3 cm deep, and its weight
approximately 45 g (Reiten 2014; Fanini 2014; Leap Motion 2017).
The Leap Motion developer provides a number of interactive applications for
users to download from its Web site. Among them are some applications for 3D
modeling and painting. Sculpting (Figure 17.3) is one of the applications that are
available. Known previously as Freeform, this application uses a metaphor similar
to sculpting real objects and allows three-dimensional modeling with a variety of
tool options to manipulate shapes (press, fatten, smooth, grow, etc.), tool sizing,
304
Handbook of Usability and User Experience
FIGURE 17.1 Leap Motion device in use (Ultraleap 2020). Reproduced with permission
from Ultraleap.
FIGURE 17.2 Inverted pyramid-shaped interactive space (Leap Motion 2017). Reproduced
with permission from Ultraleap.
choice of materials, colors and sizes for the paintbrushes and choice of manipulable
shapes, among other options, in addition to the manipulation of rotation and camera
approach. All these are done using hand and fnger movement. The software allows
saving objects in .ply, .stl and .obj formats, which can be viewed in other 3D modeling software or used to be printed on 3D printers, something that is being very
popular today (Reiten 2014; Leap Motion 2017).
Applications of Infrared Thermography
305
FIGURE 17.3 Interface of Software Sculpting (Leap Motion 2017). Reproduced with permission from Ultraleap.
17.4 DIGITAL INFRARED THERMOGRAPHY
Infrared thermography is a non-invasive method that allows the capture of heat
images (thermograms), which are not visible to the human eye through an infrared
thermographic camera. All objects emit infrared radiation, and the intensity of this
radiation depends on two factors: the temperature of the object and the object’s ability to emit radiation, known as emissivity. Thermography was created in 1960; however, it was in the 1990s that the current high-sensitivity infrared sensors appeared
(Brioschi, Macedo, and Macedo 2003; Mendonça 2005). The human being is homeothermic. That is, it has the capacity to keep the body temperature relatively constant.
It is a complex phenomenon, and this heat to be regulated must be lost to the environment. The skin is the interface organ between heat production and the environment
and constantly adjusts the equilibrium between the internal and external conditions.
This heat transfer control phenomenon is called thermoregulation and depends on
the autonomous nervous system to function (Brioschi, Macedo, and Macedo 2003).
17.4.1 APPLICATIONS OF DIGITAL INFRARED THERMOGRAPHY
The thermography method is used in several areas such as medicine, engineering,
sports and industry, among others (Prakash 2012). Studies confrm that it can be
used for inspection such as verifcation of the structure of buildings, plumbing, electrical wiring and machines and for diagnostics of diseases in organs, bones, muscles,
etc. (BARROS 2016; Barros et al. 2016). Thermography can be a good instrument to
provide quantitative and physiological indicators, thus avoiding subjective variables
(Marçal, Silva, and Neto 2016). However, there are also studies that prove the effciency of thermography in the study of psychophysiological conditions, which aim
306
Handbook of Usability and User Experience
to evaluate conditions of emotional arousal such as stress, fear and sexual arousal,
among others, through the capture of thermal images of the face (Merla and Romani
2007; Clay-Warner and Robinson 2015; Cruz-Albarran et al. 2017).
In the design area, we can also identify studies that prove the effciency of thermography and its potential to verify users’ physical and emotional relationship with
products. It is possible to use thermography in ergonomic analysis to prevent injuries
and illnesses at work, and its use is recommended to complement other traditional
ergonomic evaluation methods (Padilha 2013). It can also be used to measure the
cognitive load and change of affective state during user-product interaction (Jenkins,
Brown, and Rutterford 2009).
In a study on the evaluation of consumer products, Barros (2016) used thermography to analyze user satisfaction and proved the effciency of this method and recommended, in an innovative way, its use combined with electroencephalography and
eye tracking for evaluation of consumer products. Wang, He and Chen (2020) studied
the use of thermography to evaluate thermal comfort in virtual reality headsets by
measuring the temperature distribution at the points of contact between the user’s
face and the product.
Thus, we observe that digital infrared thermography is an effcient, proven method
that has a wide potential for the design area. Thermography can be used to evaluate
the physical and cognitive ergonomics of users during the use of artifacts, without
the direct interference that other evaluation methods may require, such as the use
of gloves and special clothing, and can be used even in tasks with greater physical
movement of the user.
17.4.2 THE OPERATION OF DIGITAL INFRARED THERMOGRAPHY
The healthy human body naturally exhibits a thermal symmetry (Houdas and Ring
2013). Thus, the regions of interest of the study must be exposed to a constant temperature environment. However, when any thermal asymmetry is identifed between
the sides of the body being analyzed, it allows detecting neurovascular alterations,
infammatory processes, fractures, etc. It also includes the study of pain to verify
its presence in an objective way, being possible to evidence several types of pain.
Therefore, the internationally standardized cutaneous thermal evaluation is always
performed comparing the corresponding hemibody of the human body (Brioschi,
Macedo, and Macedo 2003; dos Santos and Seis 2014; Marçal, Silva, and Neto 2016).
Figure 17.4 presents a thermogram comparing the hands of a subject during an
experiment after the effort in the task of opening PET bottles (Barros et al. 2016).
17.4.3
EMOTIONAL MEASUREMENT WITH DIGITAL THERMOGRAPHY
There are several studies involving human emotions associated with thermography (Cho, Bianchi-Berthouze, and Julier 2017; Merla and Romani 2007; Ioannou,
Gallese, and Merla 2014; Pavlidis, Levine, and Baukol 2000; Puri et al. 2005). These
studies are usually used to verify the response in situations of ambush, empathy,
guilt, shame, sexual arousal, stress, fear, anxiety, pain and joy (Ioannou, Gallese,
Applications of Infrared Thermography
307
FIGURE 17.4 Thermal asymmetry detected in user hands after PET bottle opening task
(Barros et al. 2016). Reproduced with permission from the authors.
and Merla 2014). In general, the areas studied are located on the face, as shown in
Figure 17.5. Researchers indicate that the tip of the nose and the perioral region
are stronger when it comes to changes; however, they point out that the corrugated
muscle of the supercilium and the chin were also correlated with the experiential
nature of stress (Engert et al. 2014).
The person’s response to emotional stimulation can increase or decrease in these
areas of the face (Ioannou, Gallese, and Merla 2014). In Figure 17.6, the same authors
present a summary of what happens in each region, according to the type of emotion felt. The arrows represent the increase (up arrow) or decrease (down arrow) of
temperature in the regions considered of interest in emotional states.
The exploration of thermal images in the analysis of human interaction with products and environments is more applied at the physical level, where there is a wide
application of thermography in medical and ergonomic research to analyze physical
FIGURE 17.5 Vascular representation of the great vessels affecting the subcutaneous
temperature of the face and infrared thermal imaging (Ioannou, Gallese and Merla, 2014).
Reproduced with permission from the authors.
FIGURE 17.6 Temperature variation in the regions of interest considered through emotions (Ioannou, Gallese and Merla, 2014). Reproduced with
permission from the authors.
308
Handbook of Usability and User Experience
Applications of Infrared Thermography
309
conditions (Brioschi, Macedo, and Macedo 2003; Marçal, Silva, and Neto 2016).
However, some studies begin to explore the potential of infrared thermography as a
method for monitoring stress levels during human-computer interaction (Puri et al.
2005; Yun et al. 2009; Abdelrahman et al. 2017; Akbar, Mark, et al. 2019; Akbar,
Bayraktaroglu, et al. 2019).
There are studies that have used thermography to diagnose emotions, capturing
thermal images of fve facial expressions such as joy, disgust, anger, fear and sadness
(Ioannou, Gallese, and Merla 2014; Engert et al. 2014; Clay-Warner and Robinson
2015; Salazar-López et al. 2015). It is observed that in these studies, the regions of
interest were nose, cheek, forehead and jaw, proving the effciency of thermography
and providing accurate information about the emotions felt by the research subjects.
17.5 RESEARCH MATERIALS AND METHODS
The methodology used in this study has a descriptive-exploratory characteristic of
being confgured through the observation, recording and analysis of the phenomenon studied through the usability and ergonomic evaluations, using tests and interviews. For this, it was necessary that these experiments be approved by the Ethics
Committee of the Federal University of Pernambuco, Brazil.
The techniques aimed at identifying ergonomic, usability and user-experience
problems fall into the following three categories (Cybis, Betiol, and Faust 2017):
• Inspections, which occur when the evaluator uses a checklist to indicate the
points that must be checked and the criteria that the interface must satisfy
to meet these points. Although this is a systematic approach, it is limited in
its possibilities.
• Expert evaluation, where a team of experts examines the interface and
evaluates the characteristics from the point of view of adaptation to the user
and the task that the user performs with the software. It is a more subjective evaluation, and the result depends on the competence of the evaluation
team.
• Tests with users, which occur when a sample of users is called to use the
interface in front of an evaluator. He or she evaluates the time to perform
the task, the rework and blocks in interaction, among other problems. It is
the most reliable technique and also the most expensive.
Considering the possibilities of these three categories of evaluation techniques, we
used in this study two of these techniques: (1) the Expert Evaluation (Field Study 1)
to identify the problems preliminarily, and (2) the Tests with Users to prove these
problems and verify new problems through tests with real users or representative of
the target population in a context of real operation (Cybis, Betiol, and Faust 2017).
It is important to note that in the user test, the Emotional Assessment (Field Study
2) and the Pain Assessment (Field Study 3) occurred simultaneously, using the same
activity to examine both aspects. Figure 17.7 illustrates the methodological scheme
of the research and the objective of each feld study.
310
Handbook of Usability and User Experience
FIGURE 17.7 Methodological scheme of the research. Source: The authors.
17.5.1
HYPOTHESES
Through the research problems, three hypotheses were proposed:
1st Hypothesis: The Sculpting software, together with the Leap Motion gesture
interaction device, does not allow users to perform 3D modeling effectively
and effciently. Effectiveness is understood as the quantity and quality of
goals achieved by the user; effciency is the number of resources employed
by the user to achieve his goals, such as time, physical and/or cognitive
effort (ISO 2018).
2nd Hypothesis: Digital infrared thermography can identify emotional changes
in users by using a gesture interface and can help investigate user satisfaction in usability tests.
3rd Hypothesis: The use of gesture interface for 3D modeling can cause musculoskeletal problems in its users. The use of digital infrared thermography
can help ergonomic evaluation methods identify physical issues while using
this interface.
17.5.2 USABILITY ASSESSMENT
For the usability evaluation, a test was developed with a sequence of tasks to be
performed by users. These tasks were developed according to the orientation of the
specialists obtained in the heuristic evaluation. They were tested with real users to
prove the problems through the experience reported in the questionnaire and the
observation of the specialist during the tests, following the evaluation model used by
Vosinakis and other researchers (Vosinakis et al. 2016). The tests followed the below
steps:
• Presentation: Explanation of the study, test instructions, and ergonomic
recommendations.
Applications of Infrared Thermography
311
• Familiarization: The user was asked to freely explore the software and
express his thoughts about the experience through verbal language, i.e.,
concurrent verbalization (Cybis, Betiol, and Faust 2017).
• Start of the test: A sequence of tasks was presented to be executed without
interruption. The time and number of errors made were recorded.
• Test: The user performed the test following the guidelines.
• Post-test: Post-test observations and application of questionnaires were
performed.
• Diagnosis: The information collected in the tests was analyzed.
Users were allowed time to learn about the Leap Motion device and the Sculpting
software. Ergonomic and user instructions were given to prevent damage to the user’s
health. After the frst learning contact, taking as a reference the procedures used in
the usability evaluation in the Barros (2016) research, users were photographed with
a thermographic camera and flmed with a conventional digital camera.
17.5.3
ERGONOMIC ASSESSMENT
From the user’s observations, conventional digital camera footage and infrared thermographic camera photographs were taken during the tests. An ergonomic analysis
was performed to identify problems related to physical ergonomics such as posture,
handling and inadequate movements—this analysis aimed to propose recommendations for improving the conditions of use of the product.
After obtaining the data from the physical ergonomics analysis, the information
was analyzed, as indicated in the literature. This information was then related to the
results of the usability analysis, with the purpose of ascertaining whether the physical variables of the gestural interaction interfered with the performance of users
during the manipulation of the Sculpting interface.
17.5.4
STUDY DESIGN
17.5.4.1 Defnition of the Sample of Users
Nielsen (2006) recommends 20 participants as the suitable number for quantitative
studies, to obtain a reasonably tight confdence interval. However, for qualitative studies, which is the case of this research, the authors recommend fve users. However,
because it involves the tool of digital infrared thermography, it was necessary to obtain
a larger sample, to have more expressive results, and to facilitate the conclusion of
the hypotheses raised. Dumas and Redish (1999) indicate, for usability test, the use
of 6–12 users in two or three subgroups. Barros (2016) conducted a usability study
involving thermography and involved 12 volunteers and found satisfactory results with
this sample. We will keep the same number of 12 participants used by Barros (2016).
17.5.4.2 Test Location
Usability tests with users were performed in an air-conditioned room set at 22°C.
The work environment had a notebook, support for the notebook, keyboard, mouse,
312
Handbook of Usability and User Experience
Leap Motion device, desk and chair. A facilitator performed the following procedures: (a) informed the tasks to be completed by the users, (b) observed the activities
and (c) ensured if the camera operator at the beginning and end of the test was following the recommendations of Cybis, Betiol and Faust (2017). Users were previously alerted that audiovisual recordings would be made with a digital camera and
visual recordings with a thermographic camera.
17.5.4.3 Equipment Used
To register the thermal images, the users conducted the tests in the city of Campina
Grande, Brazil. For this, a Flir T600 digital thermal camera was used, which had
a real integrated resolution of 480 × 360 (172,800 pixels) and sensors that allowed
temperature measurement ranging from −40°C to +650°C. According to the manufacturer (Flir 2020), the camera’s sensitivity detected temperature differences of less
than 0.04°C and an accuracy of ±2°C.
A second thermal register was conducted with users in the city of Recife, Brazil.
At that time, the Flir E60 camera was used. This camera had an integrated resolution
of 480 × 360 pixels (172,800 pixels), sensors and allowed measuring temperature
range of −20°C to +650°C. It had the sensitivity to detect temperature differences of
less than 0.05°C and had an accuracy of ±2°C to absolute temperature according to
the manufacturer’s specifcations (Flir 2020).
An Incoterm Digital Thermo-Hygrometer was used to monitor room temperature
and humidity, with an accuracy of ±1°C from 0°C to 50°C, ±2°C for the rest of
the range and the ability to measure the internal temperature range of 0–50°C and
humidity range of 15–95% RH (Incoterm 2020).
17.6
FIELD STUDY
The data collected for this research was conditioned to submission and analysis by
the Research Ethics Committee of the Federal University of Pernambuco, Brazil,
and only began after its approval. The researcher verbally explained the study to the
volunteers, and after its acceptance, the Term of Free and Informed Consent was
signed by the participants. The confdentiality and privacy of the volunteers were
guaranteed, and the results of the research would only be presented anonymously.
Such research results were only used in scientifc events or publications.
17.6.1 FIELD STUDY 1: EXPERT EVALUATION
Expert Evaluation is a technique where specialists examine the usability of an interface guided by heuristic principles or ergonomic criteria (Cybis, Betiol, and Faust
2017; Falcao, Lemos, and Soares 2015; Nielsen 1994). In this case, the heuristics
were developed, considering that they were not found in the heuristics literature to
evaluate 3D modeling software interfaces with the interaction through free gestures
on air. These heuristics were based on the studies of Maike et al. (2015), Falcao,
Lemos and Soares (2015) and Chuan, Sivaji and Ahmad (2015) and can be verifed
in Table 17.1.
Applications of Infrared Thermography
313
TABLE 17.1
Heuristics for 3D Gestural Interfaces
No. Heuristics
1. Feedback
2. Correspondence and recognition
3. Clear outputs indicated
4. Error prevention and correction
5. Clarity
6. Consistency
7. Compatibility and adaptability
8. Support and documentation
9. User resources
10. Comfort
11. Immersion
12. Learnability
The evaluation was performed by fve experts in the areas of ergonomics and
usability. All participants had at least two years of experience in the area and were
students with master’s degree and/or doctorate completed, or in progress, in the area
of design, in the research line of ergonomics and usability. The evaluation lasted
about 40 minutes to be performed by each expert. The procedure for heuristic evaluation followed the following steps:
•
•
•
•
Filling in and signing the Informed Consent Term
Explaining the study by the researcher
Inspecting the interface
Filling in the form through Google Forms
The inspection step followed the following tasks in the interface:
•
•
•
•
•
•
•
•
•
See tutorial (General);
Select sphere (Object);
Select tool (Tool);
Select tool dimension (Size);
Hide menu (Gesture presented in the tutorial is called “Hide Menu”);
Sculpt object (Mario Bros. game Red Mushroom);
Show menu (Gesture presented in the tutorial is called “Show Menu”);
Paint (Color);
Save project.
If necessary, other menu tools were also used when the evaluator found them.
At the end of the assessment, the evaluators presented a report with the annotations relating the heuristics for gestural interfaces. Besides the comments, each item
314
FIGURE 17.8
Handbook of Usability and User Experience
Graph of heuristic gravity levels.
had a scale of gravity levels from 0 to 4. The higher the numbering, the higher the
non-conformity, and the need to correct the problem. After the experts’ evaluation,
the answers of the forms were compared with the list of all the errors found, according to the 12 heuristics available.
Regarding the degree of importance of the problems and the need for correction, the heuristics presented problems of a superfcial, severe and catastrophic level.
The heuristics of feedback, correspondence, recognition, consistency and immersion reached the superfcial level, where correction is necessary with low priority.
The clear indicative outputs (possibility to cancel/close a function), error prevention
and correction, clarity, help and documentation, user resources and learnability presented high correction priority. The heuristics of compatibility and adaptability need
to be repaired with greater urgency. Figure 17.8 shows a summary of the average
levels according to the answers of the fve experts.
The tasks categorized as negative and caused the greatest problems and frustrations were hiding and showing the menu, selecting the menu options, 3D modeling,
painting the object, and rotating the object. These tasks are essential to obtain effectiveness in 3D modeling software.
This evaluation served to detect problems and select the tasks for testing with the
real users (Field Study 2 and 3). Thus, it was possible to evaluate the usability in real
situations of use in order to prove these problems and observe how the participants
reacted to this type of interaction, from both a physical and a cognitive point of view.
17.6.2 FIELD STUDY 2—EMOTIONAL ASSESSMENT
Conventional usability evaluation techniques, which evaluate the user-experience,
do not provide an objective measure of whether the experience reported by the user
Applications of Infrared Thermography
315
corresponds with the felt experience (Barros et al. 2016). The authors state that infrared thermography, associated with usability analysis, is an effective tool to compare
reported experience with felt experience. Thus, we use digital thermography images
to compare with pain and emotional questionnaires, applied before and after the test
with users.
17.6.2.1 Assessment of the Reported Stress
In order to evaluate the stress with the use of thermography, a questionnaire was
applied before and after the use of the software called visual analog scale (EVA)
(Marçal, Silva, and Neto 2016). In this questionnaire, the volunteer marked the stress
condition that was at the time he or she was questioned on a 10 cm line with numbers
ranging from 0 to 10 (Figure 17.9). Thus, it was possible to compare this information
with the thermal images of their faces, which were recorded before and after the
usability test (Soares, Vitorino, and Marçal 2019).
According to the answers obtained with the application of the questionnaire, the
moments before and after the use of the software were compared. Twelve participants
participated in the evaluation: eight males and four females. We obtained the following results: 58.33% (n = 7) of the participants answered that they felt an increase
in their stress level after using the software; a total of 33.33% (n = 4) reported a
decrease in their stress level after using it; and 8.33% (n = 1) recorded that their stress
level remained unchanged after using it. Thus, according to the experience reported
in the questionnaire, we found that more than half of the participants obtained an
increase in their stress level.
Although we noticed an increase in the stress level based on the counting of the
participants’ responses, it was necessary to perform statistical analysis, with the
help of SSPS 19 software, of the moments before and after the test to check if this
increase was signifcant. The data found show that there was no signifcant difference in the 12 participants of the test.
The descriptive statistics show that the group increased the stress level from 3.8
(before) to 5.3 (after), but this increase was not signifcant to confrm that the activity
stressed the participants. In the analysis of the Student t-test, it was verifed that the
signifcance level was 0.108, which is higher than α 0.05, i.e., the p-value observed is
more elevated than α (signifcance level) defned for the study (p > 0.05). Although
there is no signifcant difference, we can see that there was an increase in the mean,
showing a tendency for participants to become more stressed after the test. However,
a larger number of N sample would be needed to check whether this increase in
FIGURE 17.9 Visual analog scale (VAS) for stress level (Soares et al., 2019). Reproduced
with permission from the authors.
316
Handbook of Usability and User Experience
stress could be signifcant, as the current sample did not provide an acceptable result
because it was a subjective measure.
17.6.2.2 Assessment of the Felt Stress
To verify the felt experience, we use digital infrared thermography to record participants’ faces before and after the use of the software. The images were analyzed
using the Student t-test for the paired sample. Three regions of the participants’ faces
were analyzed, selected according to studies that indicate that if the person is more
stressed, and a drop in temperature can be expected in the regions of the nose, cheek
and forehead (Pavlidis, Levine, and Baukol 2000; Merla and Romani 2007; Or and
Duffy 2007; Ioannou, Gallese, and Merla 2014).
For the analysis of the images, the three areas of the participants’ faces (forehead,
cheek and nose) were demarcated. The maximum, minimum and average temperatures in degrees Celsius were collected in the images before and after the test. Then,
a statistical analysis of these data was performed, with the help of the software SSPS
19, of the 12 participants (n = 12), in the regions ForehF (forehead), Cheek (cheek)
and Nose (nose), in the periods A (before) and F (fnal), and temperatures Max, Min
and Med (maximum, minimum and average) observed in Table 17.2.
TABLE 17.2
Descriptive Statistics of the Face Regions Analyzed Before and After the Test
with the 12 Participants of the Experiment
Region
Minimum
Maximum
Average
Standard Deviation
ForehFAMax
32.50
36.20
34.8250
1.09804
ForehFAMin
ForehFAMed
ForehFFMax
ForehFFMin
ForehFFMed
CheekAMax
CheekAMim
CheekAMed
CheekFMax
CheekFMin
CheekFMed
NoseAMax
NoseAMin
NoseAMed
NoseFMax
NoseFMin
31.30
31.90
32.60
31.30
32.10
32.00
30.10
30.90
31.20
29.10
29.90
29.50
25.90
27.00
28.10
23.40
34.30
35.60
35.80
34.50
35.20
35.40
33.70
34.50
35.00
32.80
33.50
35.00
33.20
34.10
33.20
32.00
33.4333
34.2000
34.6750
33.4250
34.0917
33.7083
31.8000
32.6417
32.9917
30.9583
31.8250
32.0000
29.1417
30.4583
30.9083
28.2083
.98658
1.09627
1.04718
1.04631
1.00856
1.21540
1.27778
1.29296
1.36812
1.18203
1.26572
1.73048
2.21583
2.24680
1.74848
2.67835
NoseFMed
25.30
32.60
29.1000
2.30691
317
Applications of Infrared Thermography
TABLE 17.3
Student t-Test for Paired Sample
Regions Before × After
Signifcance
ForehFAMax × TestFFMax
.670
ForehFAMin × TestFFMin
ForehFAMed × TestFFMed
CheekAMax × BochFMax
CheekAMim × BochFMin
CheekAMed × BochFMed
NoseAMax × NarFMax
NoseAMin × NarFMin
.983
.761
.012
.002
.002
.003
.047
NoseAMed × NarFMed
.002
In the paired sample results, it was possible to verify a signifcant difference of
maximum, minimum and average temperature of the cheek and nose. In Table 17.3,
we can confrm that the signifcance level of these areas (cheek and nose) is lower
than α 0.05. However, the same did not occur in the forehead region, where p >
0.05) is not signifcant to indicate a decrease in temperature. Thus, we found that a
decrease in temperature occurred in two areas (cheek and nose) after the test, suggesting a functional change after the use of the analyzed software, which means an
indication of stress in the participants (Pavlidis, Levine, and Baukol 2000; Merla and
Romani 2007; Hahn et al. 2012; Ioannou, Gallese, and Merla 2014).
Table 17.4 presents Pearson’s correction between the temperatures of the face
regions before and after the test (felt experience) and the values indicated by the
participants on the stress-level scale before and after the test (reported experience).
Thus, the closer the value of ρ (correlation coeffcient) is to the value “1,” the stronger the correlation, meaning a correlation between the two variables analyzed. The
closer the value of ρ is to the value “0,” the weaker the correlation, being this our
result, where the correlation was close to “0.” Thus, it was verifed that the correlation between face temperatures (forehead, cheek and nose) and the stress level
reported by the participants did not present signifcance (P > 0.05).
17.6.2.3 Analysis and Discussion of Emotional Assessment
Thus, we noted that the experience reported in the emotional questionnaire did not
present signifcant statistical data in correlation to the experience felt in the thermography. The temperature is a more sensitive variable to perceive changes than
the variable of the stress-level ruler. Therefore, it would be necessary to increase the
sample number N to check the correlation again because the current sample could
not confrm.
It is important to note that thermography checks the autonomous nervous system
(ANS) response since temperature control is associated with emotional reactions
(Brioschi, Macedo, and Macedo 2003; Kreibig 2010). In this way, the emotional
Correlation
−.096
−.133
−.112
−.021
−.021
−.017
−.039
.021
.058
Temperature × Reported
ForehFAMax × StressA
ForehFAMin × StressA
ForehFAMed × StressA
CheekAMax × StressA
CheekAMin × StressA
CheekAMed × StressA
NoseAMax × StressA
NoseAMin × StressA
NoseAMed × StressA
Before
,858
,767
,680
,730
,947
,948
,959
,904
,948
Signifcance
Temperature × Reported
NoseFMed × StressA
ForehFFMax × StressA
ForehFFMin × StressA
ForehFFMed × StressA
CheekFMax × StressA
CheekFMin × StressA
CheekFMed × StressA
NoseFMax × StressA
NoseFMin × StressA
−.070
.067
.087
.150
.187
.132
.099
−.194
−.077
Correlation
After
.830
.837
.789
.642
.561
.683
.759
.545
.811
Signifcance
TABLE 17.4
Correlation between Face Temperatures and the State of Stress Reported Before and
After the Experiment
318
Handbook of Usability and User Experience
Applications of Infrared Thermography
319
perception of the person, through the reporting in the questionnaires, may not represent what the organism is manifesting. According to Kreibig (2010), although feelings are usually conscious, where the individual knows what is happening in that
emotional experience, conditions may arise in which they are not aware of what is
happening.
The opinion of users in a questionnaire can be different from their thoughts, feelings or impressions about using a product, so what our brain perceives can be different from our reports when we are questioned (Barros et al. 2016). In some cases,
participants may have reported that they were not stressed, but the neurovegetative
responses, i.e., the spontaneous response of the body, characterized the participant’s
signifcance of stress or irritability. Thus, we verifed that the neurophysiological
response is superior to the subjective response since the body responds that the
individual has no control over. Thus, we reinforce the importance of expanding the
usability studies with the use of more objective tools, such as thermography, since
the user reports are not accurate and subject to inconsistencies (Marçal, Silva, and
Neto 2016).
However, in general analysis, we can see that there has been an increase in stress
on users with the use of the gestural interface of the 3D modeling software. This is
clear from the observation of users’ reactions, the fnal result of the 3D modeling and
especially from the thermal images’ records (Figure 17.10). In the latter, we can see
the decrease in temperature in the nose and cheeks, indicative of increased stress in
the individual (Pavlidis, Levine, and Baukol 2000; Merla and Romani 2007; Ioannou,
Gallese, and Merla 2014), and which have been proven in statistical analysis.
FIGURE 17.10
Thermal image of the face before and after the test.
320
Handbook of Usability and User Experience
Thus, as some researchers state (Or and Duffy 2007; Jenkins, Brown, and
Rutterford 2009), we confrm through this experiment the feasibility of using infrared thermography to evaluate an interface, proving reliable to indicate changes
in stress states (Engert et al. 2014). The advantage of thermography, apart from
being a non-invasive method, is that it allows evaluating interactions with movements. It is not limited to static postures and the need to fx devices on individuals
by using pre/post-event sampling technique (photographic recording), instead of
continuously monitoring changes in states on continuous video (Jenkins, Brown,
and Rutterford 2009).
In this study, we emphasized the nose and cheek’s sensitivity to verify changes
in the state of stress. The temperature difference occurs due to vasoconstriction
of blood vasodilation mediated by ANS (Or and Duffy 2007; Brioschi et al. 2010;
Cruz-Albarran et al. 2017). The study by Or and Duffy (2007), which evaluated
the stress in people, also pointed to the sensitivity of the nose and that the forehead temperature remained stable and constant. Confrming what happened in
this study, we found no signifcance in the reduction of forehead temperature of
the participants. The tip of the nose and the perioral region are stronger when it
comes to changes. However, they point out that the supercilium’s corrugated muscle and the chin also obtained correlation with the experiential nature of stress
(Engert et al. 2014).
Based on the results presented, we suggest using digital infrared thermography
for the development and evaluation of computer interfaces. Through this study with
the gestural interface applied to the manipulation in a three-dimensional modeling
environment, we can confrm the effciency of thermography, allied to the usability methods, to evaluate the users’ stress level when interacting with the gestural
interface. This study’s fndings can contribute to future studies in the area and
offer important information to understand these new forms of interaction that are
emerging.
17.6.3 FIELD STUDY 3: PAIN ASSESSMENT
This study was conducted from the footage of the participants performing the
experiment, pain questionnaires (Figure 17.11), observations and analysis of thermal
images recorded before and after the experiment. In the end, the data were crossed
to verify the relationship of what was observed by the researcher, reported by the
participants and recorded in the thermal images.
17.6.3.1 Assessment of the Reported Pain
For this evaluation, a pain/comfort questionnaire (Marçal, Silva, and Neto 2016)
was applied before and after the usability test, serving as a reference for the evaluation of thermal images, i.e., the regions indicated by the participants with pain
complaints were checked on the thermal images to see if there are indications of
thermal changes.
This questionnaire has the representation of the human fgure from front and back
and a Visual Analog Pain Scale (EVA) with numbers from 0 to 10.
Applications of Infrared Thermography
321
FIGURE 17.11 Pain questionnaire with EVA from 0 to 10 and human fgure front and back.
Before the experiment, each participant was asked if he or she was feeling any
pain in the body at that moment and asked to mark with a pen the area of the complaint of pain in the representation of the human fgure, which could indicate more
than one region. It was also requested to mark the level of pain in each region, using
a scale of 0–10. After the test, the same procedure was performed to verify the
appearance of any pain complaint after the use of the software. Figure 17.12 shows
the graph of the regions of pain complaints before and after the experiment indicated
by the participant. It was possible to verify the appearance of pain in several regions
after the use of the system. None of the participants indicated pain in the region of
the hands. Only one participant indicated tingling in both hands.
322
FIGURE 17.12
Handbook of Usability and User Experience
Pain complaints before and after the test.
17.6.3.2 Assessment of the Felt Pain
The answers of the participants in the pain questionnaire served as a basis for the
analysis of the thermal images of the moments before and after the test. The pain
complaints indicated by the participants were confronted with the thermal registers
to confrm if there was any indication of temperature change. This procedure made
it possible to verify some patterns of thermal changes in the participants that helped
to understand what occurred in their body when performing the activity.
An increase in the activity on the right shoulder of the participants in the thermal
images was observed, i.e., after the test, most users (91.66%, n = 11) presented these
changes in the thermal images (Figure 17.13). This justifed the complaint of pain in
the region reported by more than half of the individuals (58.33%, n = 7).
A drop in temperature of the upper limbs was also identifed after the test
detected in 66.66% (n = 8) of the participants, mainly in the region of the hands
(Figure 17.14). This result is typical of activity with arms suspended for a prolonged
time and physiological response to activity with a predominance of static contractions in relation to dynamic contractions. However, when we checked the responses
to the pain questionnaire, no signifcant complaints were reported in these regions.
FIGURE 17.13
Increase in right shoulder activity after the test.
Applications of Infrared Thermography
FIGURE 17.14
323
Temperature drop in upper limbs after the test.
The only complaint of tingling reported by one participant can be justifed by the
vasoconstriction and cooling of the region.
Some participants pointed out slight pains in the region of the forearm of the
member who used most for the activity. This occurred due to the limb’s continuous use without rest or alternation between the right and left arm along with the 3D
modeling (Figure 17.15).
A total of 66.66% (n = 8) of the volunteers complained of back pain in different
regions of the body (cervical, dorsal and lumbar) as a result of the static posture of the
trunk for a prolonged time. Thermal images proved these indications (Figure 17.16).
This result confrmed the effciency of thermography as a tool for checking pain,
FIGURE 17.15 Increase in forearm activity.
324
Handbook of Usability and User Experience
FIGURE 17.16
Functional changes indicative of pain.
complementing the subjectivity of the individuals’ reports and offering more objective
data for evaluation.
17.6.3.3 Analysis and Discussion of Pain Assessment
Through the analysis of thermal images, we notice several ergonomic problems that
make it diffcult for users to interact well with the gestural interface of the 3D modeling software. The realization of interaction for too long with the elevated limbs,
without rest and compensation through variation between right and left limbs, was
one of the biggest problems verifed. According to Iida and Buarque (2016), one
should not project activities with high limbs for more than 2 minutes without rest.
Maybe this is the cause of shoulder and back pain problems because these regions
bear the upper limbs’ weight. The activity with the predominance of static contractions in relation to dynamic contractions resulted in a cooling of the upper limbs,
causing tingling and fatigue.
With respect to hand gestures, not many complaints of discomfort in the hand
region or indicative changes in thermal images have been identifed. The main indications of greater biomechanical activities were in the forearm of the most used
limb, which may have occurred due to the pointing gesture with the contracted musculature, resulting in the work of this muscle group, causing mild pain in this region.
17.7
CONCLUSIONS
Regarding the general objective of this research, which was to analyze the ergonomics and usability aspects of the gestural interface applied in 3D modeling software,
using the Sculpting software and Leap Motion device as a case study, we obtained
relevant results, thanks to the selection of appropriate methods and tools which benefted the evaluation of this type of interface. We are convinced of the importance of
Applications of Infrared Thermography
325
this analysis and its usefulness as a model for future evaluations of software of this
category and analysis of the usability of consumer products.
The frst study began with the evaluation by usability experts. For this purpose,
specifc heuristics for sign interfaces were developed based on current and relevant
studies. It is important to draw attention to the fact that the heuristics developed for
the study followed the essence of conventional heuristics applied and accepted in the
study of usability. This step was essential to identify the most severe usability problems and, at the same time, helped in the confguration of the usability test for real
users. In this way, it was possible to estimate the time of execution of the experiment
and the tasks to be performed. It was also observed as the opportunity to investigate
emotional issues through thermography since experts reported an increased level of
stress when using the interface, as well as the existence of fatigue and pain during
the use of the software, suggesting problems of physical ergonomics.
In the second study, tests with real users made it possible to verify if the integration of the Leap Motion device and the Sculpting software were in accordance with
the principles of usability. It was possible to check compatibility issues of the gestures used for the interface manipulation, checking the performance and the users’
opinion when using the software. It was possible to evaluate the stress level of the
experiment participants. For this, the moments before and after the use of the 3D
modeling software were compared. Thus, it was verifed that there is a tendency for
users to be stressed due to frustration of not being able to reach their goals due to
the usability faws of the graphical interface and also due to diffculties in executing
the gestures.
The third study focused on questions of physical ergonomics, verifying points of
discomfort or pain in users during the use of the software and the interaction gestures made in the interface. For this, the moments before and after the use of the 3D
software were checked. Several problems related to inadequate postures and repetitive movements that caused musculoskeletal overload and static muscle contractions
causing fatigue in the users were verifed.
Three hypotheses were proposed for this study. The results were as follows:
1st Hypothesis—The Sculpting software, allied with the gesture interaction
device Leap Motion, does not enable users to perform 3D modeling effectively and
and effciently.
This hypothesis was confrmed through heuristic and usability evaluation.
According to the results found, the 3D modeling with the Sculpting software manipulated through Leap Motion does not have an acceptable level of effectiveness due
to the low number of users who managed to reach the objective of modeling the proposed object. The study revealed severe problems in the control and precision of the
modeling. This result can be considered a serious problem since 3D modeling is the
main objective of this type of software. With regard to effciency, even those users
who managed to achieve the proposed objective in the experiment found it challenging to perform the tasks easily, taking time to complete them. Diffculties were
presented through verbal reporting and observation of errors during use. Thus, the
three types of tasks—selection and manipulation in a 3D environment, navigation
and control of the system—that are usually offered in 3D interaction environments
326
Handbook of Usability and User Experience
proposed by Iacolina (2014) do not meet the requirements for the system interface
under study to have been considered effective and effcient.
2nd Hypothesis: Digital infrared thermography can identify emotional changes
in users by using a gesture interface and can help investigate user satisfaction in
usability tests.
This hypothesis, verifed through the usability evaluation, has been confrmed.
With the results of the tests, we found that through digital infrared thermography, it is possible to identify changes in users’ level of stress by using a gestural
interface that presents usability problems. In this study, we compared the reported
experience, obtained through the emotional questionnaires, with the felt experience, obtained through the thermal images of the faces of the participants, before
and after the test. Thus, we observed that the use of the gestural interface caused a
drop in temperature in the selected areas of the users’ faces (nose and cheek), indicating an increase in the stress level. This fnding was confrmed in the literature
by other studies that also used digital infrared thermography (Pavlidis, Levine,
and Baukol 2000; Merla and Romani 2007; Ioannou, Gallese, and Merla 2014).
We concluded that this increase in stress could infuence user satisfaction and the
desire to continue using the system.
3rd Hypothesis: The use of a gestural interface for 3D modeling can cause musculoskeletal problems in its users. The use of digital infrared thermography can help
ergonomic evaluation methods identify physical problems while using this interface.
This hypothesis was confrmed through ergonomic evaluation and tests with
infrared thermography. We found that most of the participants of the experiments
reported fatigue in the upper limbs, besides some kind of a pain in the region of
the back, trapezium, shoulder and arms, through a pain questionnaire flled out
before and after the activity. This information was compared with the thermographic images that were recorded before and after the use of the interface. Thus, we
obtained expressive results that proved that the areas indicated by the users in the
pain assessment questionnaire had functional changes in the thermal images. It was
proved that the use of infrared thermography to evaluate physical questions could be
effcient in the evaluation of usability, particularly in the study of gestural interfaces
in a 3D interactive environment. This ergonomic evaluation was complemented with
the observation of users, audiovisual recordings and the aid of specifc bibliography,
which indicated evident problems in the physical ergonomics of 3D modeling with
gesture interface.
Therefore, at the end of the study, we can conclude that it was possible to achieve
the objectives outlined and prove the hypotheses raised. Thus, we emphasize that
applying the gestural interface in the Sculpting software is not yet adequate to obtain
results with effectiveness and effciency. Therefore, it is necessary to improve the
interface in order to obtain better usability and physical comfort.
One of the great learnings of this research was the importance of exploring new
evaluation methods and tools in order to complement the traditional usability methods already used for product analysis. Digital infrared thermography has proven to
be an effcient tool for evaluating physical and emotional stress issues in users, offering more objective and measurable results.
Applications of Infrared Thermography
327
ACKNOWLEDGMENTS
This research was sponsored by the Brazilian Federal Agency for Support and
Evaluation of Postgraduate Education—CAPES.
REFERENCES
Abdelrahman, Yomna, Eduardo Velloso, Tilman Dingler, Albrecht Schmidt, and Frank Vetere.
2017. “Cognitive Heat: Exploring the Usage of Thermal Imaging to Unobtrusively
Estimate Cognitive Load.” Association for Computing Machinery. https://doi.org/10
.1145/3130898.
Adhikarla, Vamsi Kiran, Grega Jakus, and Jaka Sodnik. 2015. “Design and Evaluation of
Freehand Gesture Interaction for Light Field Display.” In International Conference on
Human-Computer Interaction, 54–65. Springer.
Akbar, F., A. E. Bayraktaroglu, P. Buddharaju, D. R. Da Cunha Silva, G. Gao, T. Grover, R.
Gutierrez-Osuna, et al. 2019. “Email Makes You Sweat: Examining Email Interruptions
and Stress with Thermal Imaging.” https://doi.org/10.1145/3290605.3300898.
Akbar, F., G. Mark, I. Pavlidis, and R. Gutierrez-Osuna. 2019. “An Empirical Study Comparing
Unobtrusive Physiological Sensors for Stress Detection in Computer Work.” Sensors
(Switzerland) 19(17). https://doi.org/10.3390/s19173766.
Barros, Rafaela Q., Marcelo M. Soares, Márcio A. Maçal, Ademário S. Tavares, Jaqueline A.
N. Oliveira, José R. R. Silva, Aline S. O. Neves, Robson Oliveira, and Geraldo O. S.
N. Neto. 2016. “Using Digital Thermography to Analyse the Product User’s Affective
Experience of a Product.” In Advances in Ergonomics in Design, edited by Francisco
Rebelo and Marcelo Soares, 97–107. Advances in Intelligent Systems and Computing.
Cham: Springer International Publishing. https://doi.org/10.1007/978-3-319-41983-1_10.
Barros, Rafaela Queiroz de. 2016. “Aplicação Da Neuroergonomia, Rastreamento Ocular e
Termografa Por Infravermelho Na Avaliação de Produto de Consumo: Um Estudo de
Usabilidade.” Master’s Thesis, Universidade Federal de Pernambuco.
Brioschi, Marcos Leal, José Fernando Macedo, and Rodrigo de Almeida Coelho Macedo.
2003. “Termometria Cutânea: Novos Conceitos.” Jornal Vascular Brasileiro 2: 151–60.
Brioschi, M. L., M. J. Teixeira, F. M. R. M. Silva, and D. Colman. 2010. Princípios e
Indicações Da Termografa Médica. São Paulo: Andreoli, 280.
Cho, Y., N. Bianchi-Berthouze, and S. J. Julier. 2017. “Deep Breath: Deep Learning of
Breathing Patterns for Automatic Stress Recognition Using Low-Cost Thermal
Imaging in Unconstrained Settings.” 2018-January:456–63. https://doi.org/10.1109/
ACII.2017.8273639.
Chuan, Ngip Khean, Ashok Sivaji, and Wan Fatimah Wan Ahmad. 2015. “Usability Heuristics
for Heuristic Evaluation of Gestural Interaction in HCI.” In International Conference
of Design, User Experience, and Usability, 138–148. Springer.
Clay-Warner, Jody, and Dawn T. Robinson. 2015. “Infrared Thermography as a Measure of
Emotion Response.” Emotion Review 7(2): 157–162.
Coelho, Joanna C., and Fons J. Verbeek. 2014. “Pointing Task Evaluation of Leap Motion
Controller in 3D Virtual Environment.” Creating the Difference 78: 78–85.
Cruz-Albarran, Irving A., Juan P. Benitez-Rangel, Roque A. Osornio-Rios, and Luis A.
Morales-Hernandez. 2017. “Human Emotions Detection Based on a Smart-Thermal
System of Thermographic Images.” Infrared Physics & Technology 81: 250–261.
Cybis, Walter, Adriana Holtz Betiol, and Richard Faust. 2017. Ergonomia e Usabilidade:
Conhecimentos, Métodos e Aplicações. São Paulo: Novatec editora.
Dumas, Joseph S., and Janice Redish. 1999. A Practical Guide to Usability Testing. Portland:
Intellect Books.
328
Handbook of Usability and User Experience
Engert, Veronika, Arcangelo Merla, Joshua A. Grant, Daniela Cardone, Anita Tusche, and
Tania Singer. 2014. “Exploring the Use of Thermal Infrared Imaging in Human Stress
Research.” PloS One 9(3): 1–11.
Falcao, Christianne, Ana Catarina Lemos, and Marcelo Soares. 2015. “Evaluation of Natural
User Interface: A Usability Study Based on the Leap Motion Device.” Procedia
Manufacturing, 6th International Conference on Applied Human Factors and
Ergonomics (AHFE 2015) and the Affliated Conferences, AHFE 2015, 3(January):
5490–5495. https://doi.org/10.1016/j.promfg.2015.07.697.
Fanini, Bruno. 2014. “A 3D Interface to Explore and Manipulate Multi-Scale Virtual
Scenes Using the Leap Motion Controller.” In ACHI 2014, The Seventh International
Conference on Advances in Computer-Human Interactions, 258–263. Citeseer.
Flir. 2020. “Descubra | FLIR Systems.” 2020. https://www.fir.com.br/discover/.
Hahn, Amanda C., Ross D. Whitehead, Marion Albrecht, Carmen E. Lefevre, and David I.
Perrett. 2012. “Hot or Not? Thermal Reactions to Social Contact.” Biology Letters 8(5):
864–867.
Houdas, Yvon, and E. F. J. Ring. 2013. Human Body Temperature: Its Measurement and
Regulation. New York: Springer Science & Business Media.
Iacolina, Samuel Aldo. 2014. “Interactive Spaces Natural Interfaces Supporting Gestures and
Manipulations in Interactive Spaces.” PhD Thesis, Universita’degli Studi di Cagliari.
Iida, Itiro, and L. I. A. Buarque. 2016. Ergonomia: Projeto e Produção. São Paulo: Editora
Blucher.
Incoterm. 2020. “Termo-Higrômetro Digital Temperatura e Umidade Interna Incoterm |
Soluções em Medição | Incoterm.” 2020. https://www.incoterm.com.br/solucoes-em
-medicao/termo-higrometros-digitais/produto/7666-02-0-00-termo-higrometro-digital-temperatura-e-umidade-internas.
Ioannou, S., V. Gallese, and A. Merla. 2014. “Thermal Infrared Imaging in Psychophysiology:
Potentialities and Limits.” Psychophysiology 51(10): 951–63. https://doi.org/10.1111/
psyp.12243.
ISO. 2018. “9241–11: 2018 (En).” Ergonomics of Human–System Interaction—Part 11:
Usability: Defnitions and Concepts.
Jenkins, Sean, Raymond Brown, and Neil Rutterford. 2009. “Comparing Thermographic,
EEG, and Subjective Measures of Affective Experience during Simulated Product
Interactions.” International Journal of Design 3(2): 53–65.
Kreibig, Sylvia D. 2010. “Autonomic Nervous System Activity in Emotion: A Review.”
Biological Psychology 84(3): 394–421.
Leap Motion. 2017. “Leap Motion Controller.” 2017. www.leapmotion.com.
Maike, Vanessa Regina Margareth Lima, Laurindo de Sousa Britto Neto, Siome Klein
Goldenstein, and Maria Cecília Calani Baranauskas. 2015. “Heuristics for NUI
Revisited and Put into Practice.” In International Conference on Human-Computer
Interaction, 317–328. Springer.
Marçal, Marcio A., Fernanda F. D. Silva, and Luis F. M. Neto. 2016. “Termografa
Infravermelha: Avaliação Da Sobrecarga Músculo Esquelética Na Região Lombar e
Membros Inferiores Em Uma Linha de Produção.” In V Congreso Latino Américano y
IV Congreso Peruano de Ergonomía, Lima.
Mendonça, Luís Viegas. 2005. “Termografa Por Infravermelhos Inspecção de Betão.”
Revista Engenharia & Vida, Lisboa 1(16): 53–57.
Merla, Arcangelo, and Gian Luca Romani. 2007. “Thermal Signatures of Emotional Arousal:
A Functional Infrared Imaging Study.” In 2007 29th Annual International Conference
of the IEEE Engineering in Medicine and Biology Society, 247–249. IEEE.
Nielsen, Jakob. 1994. Usability Engineering. Mountain View: Morgan Kaufmann.
Applications of Infrared Thermography
329
———. 2006. “Quantitative Studies: How Many Users to Test?” Nielsen Norman Group.
2006. https://www.nngroup.com/articles/quantitative-studies-how-many-users/.
Norman, Donald A., and Jakob Nielsen. 2010. “Gestural Interfaces: A Step Backward in
Usability.” Interactions 17(5): 46–49. https://doi.org/10.1145/1836216.1836228.
Oliveira, Fábio Henrique Monteiro. 2013. “Uso de Interfaces Naturais Na Modelagem de
Objetos Virtuais.” Master’s Thesis, Programa de Pós-graduação em Engenharia
Elétrica da Universidade Federal de Uberlândia, Uberlândia.
Or, Calvin K. L., and Vincent G. Duffy. 2007. “Development of a Facial Skin TemperatureBased Methodology for Non-Intrusive Mental Workload Measurement.” Occupational
Ergonomics 7(2): 83–94.
Padilha, Ricardo Antonio Bettinelli. 2013. “Termografa Aplicada à Análise Ergonômica
Em Montadora de Veículos.” Specialization Monograph, Universidade Tecnológica do
Estado do Paraná. Especialização em Engenharia de Segurança do Trabalho.
Pavlidis, Ioannis, James Levine, and Paulette Baukol. 2000. “Thermal Imaging for Anxiety
Detection.” In Proceedings IEEE Workshop on Computer Vision Beyond the Visible
Spectrum: Methods and Applications (Cat. No. PR00640), 104–109. IEEE.
Prakash, Raghu. 2012. Infrared Thermography. BoD–Books on Demand.
Puri, Colin, Leslie Olson, Ioannis Pavlidis, James Levine, and Justin Starren. 2005.
“StressCam: Non-Contact Measurement of Users’ Emotional States through Thermal
Imaging.” In CHI′05 Extended Abstracts on Human Factors in Computing Systems,
ACM, New York, 2005. 1725–1728.
Reiten, John Edvard. 2014. “3D Modelling Using Leap Motion-Focusing on Homogeneous
Transforms.” Master’s Thesis, NTNU.
Rogers, Yvonne, Helen Sharp, and Jennifer Preece. 2013. Design de Interação. Porto Alegre:
Bookman Editora.
Saffer, Dan. 2008. Designing Gestural Interfaces: Touchscreens and Interactive Devices.
Sebastopol: O’Reilly Media, Inc.
Salazar-López, E., E. Domínguez, V. Juárez Ramos, J. De la Fuente, A. Meins, O. Iborra,
G. Gálvez, M. A. Rodríguez-Artacho, and E. Gómez-Milán. 2015. “The Mental and
Subjective Skin: Emotion, Empathy, Feelings and Thermography.” Consciousness and
Cognition 34: 149–162.
Santos, Maikon Gleibyson Rodrigues dos, and Rua Seis. 2014. “Termografa: Uma Ferramenta
de Auxílio No Diagnóstico Fisioterapêutico–Revisão de Literatura.”
Soares, Marcelo M., Danilo F. Vitorino, and Márcio A. Marçal. 2019. “Application of Digital
Infrared Thermography for Emotional Evaluation: A Study of the Gestural Interface
Applied to 3D Modeling Software.” In Advances in Ergonomics in Design, edited by
Francisco Rebelo and Marcelo M. Soares, 201–12. Advances in Intelligent Systems and
Computing. Orlando: Springer International Publishing.
Ultraleap. 2020. “Digital Worlds That Feel Human | Ultraleap.” 2020. https://www.ultraleap
.com/.
Vitorino, Danilo Fernandes. 2017. “Análise Ergonômica e Da Usabilidade Com Auxílio
Da Termografa Digital Por Infravermelho: Um Estudo Da Interface Gestual
Aplicada Em Software de Modelagem 3D.” Master’s Thesis, Universidade Federal
de Pernambuco.
Vosinakis, Spyros, Panayiotis Koutsabasis, Dimitris Makris, and Ekati Sagia. 2016. “A
Kinesthetic Approach to Digital Heritage Using Leap Motion: The Cycladic Sculpture
Application.” In 2016 8th International Conference on Games and Virtual Worlds for
Serious Applications (VS-GAMES), 1–8. IEEE.
Wang, Zihao, Renke He, and Ke Chen. 2020. “Thermal Comfort and Virtual Reality
Headsets.” Applied Ergonomics 85: 103066.
330
Handbook of Usability and User Experience
Wigdor, Daniel, and Dennis Wixon. 2011. Brave NUI World: Designing Natural User
Interfaces for Touch and Gesture. Burlington: Elsevier.
Yang, Roy Sirui, Alfonso Gastélum Strozzi, Anthony Lau, Christof Lutteroth, Yuk Hin
Chan, and Patrice Delmas. 2012. “Bimanual Natural User Interaction for 3D Modelling
Application Using Stereo Computer Vision.” In Proceedings of the 13th International
Conference of the NZ Chapter of the ACM’s Special Interest Group on HumanComputer Interaction, New York, NY, USA: ACM, 2012. (CHINZ ’12), p. 95–95.
http://doi.acm.org/10.1145/2379256.2379279.
Yun, C., D. Shastri, I. Pavlidis, and Z. Deng. 2009. “O’ Game, Can You Feel My Frustration?:
Improving User’s Gaming Experience via Stresscam.” In, 2195–2204. https://doi.org/10
.1145/1518701.1519036.
18
Advanced User
Experience Evaluations
Using Biosensors in
Virtual Environments
Francisco Rebelo, Elisangela Vilar,
Ernesto Filgueiras, João Valente and Paulo Noriega
CONTENTS
18.1
18.2
18.3
18.4
18.5
Introduction .................................................................................................. 331
About UX Concept ....................................................................................... 333
Virtual Reality in UX Measures................................................................... 335
Components of a VR System........................................................................ 336
Proposed Model............................................................................................ 336
18.5.1 Analysis of the Situation................................................................... 336
18.5.2 Situation Concept.............................................................................. 338
18.5.3 Immersive VR Simulator..................................................................340
18.5.3.1 Object and Space Geometry ..............................................340
18.5.3.2 Textures..............................................................................340
18.5.3.3 Lightening and Shadows....................................................340
18.5.3.4 Sound ................................................................................. 341
18.5.3.5 Triggers and Events............................................................ 341
18.5.4 User Interaction with VR.................................................................. 342
18.6 Biosensors..................................................................................................... 343
18.6.1 Dynamics Characteristics.................................................................348
18.6.2 Signal Acquisition Chain.................................................................. 350
18.6.3 Collection of Physiological Signals .................................................. 351
18.7 Conclusions................................................................................................... 353
References.............................................................................................................. 354
18.1 INTRODUCTION
Traditionally, user experience (UX) measures taken before or after the human interaction with products and services are done using subjective measures. Examples are
scales with emotions where users report emotions during interaction with a product (Watson, Clark & Tellegen, 1988; Sacharin, Schlegel & Scherer 2012; Bradley
DOI: 10.1201/9780429343490-23
331
332
Handbook of Usability and User Experience
and Lang, 1994) or pictorial representations of the emotion felt. This could be static
(Desmet, Overbeeke and Stefan Tax, 2001) or dynamic (Desmet, 2003). Most of
those methods are free to use (Exception for Premo, Desmet, 2003) and are easy to
implement, but they have many disadvantages: (i) They are dependent on an interpretation of the user about the emotion felt. That’s not always a straightforward process, because user must look for the emotion felt in measurement tool and thereafter
decide the intensity of the emotion; (ii) when the experience is too long, it is not
possible to know the emotional reaction in the experience’s different phases or in real
time, the identifcation is done after the experience; in those cases, asking the user to
answer a questionnaire in those phases breaks the experience and poses problems of
evocation; (iii) usually emotional reactions are evaluated in an interaction context,
which is not always totally controlled by researchers. Thus, the physical environment
and the researcher can infuence the user emotional reaction and behavior.
In addition to these aspects, we can have limitations to measure the human
experience with products and services in situations that do not yet exist. It is true
that we can develop physical simulation scenarios, or future physical scenarios,
to test forthcoming user interactions, but the time and fnancial costs to build
them are high. Another problem is related to critical situations, for example, an
emergency situation with fre, where we cannot measure the user experience due
to ethical restrictions.
Considering the previous limitations, there are a need to have complementary
ways to measure the emotional reactions and behavior in UX evaluations.
The use of biosensors makes it possible to have in real time quantitative data about
arousal and valence, without interruptions or the problem to remember an emotional
reaction after an interaction. However, it is not easy to use biosensors to evaluate the
user experience; they are subject to noise, if the control of signals acquisition is not
high. Some artifacts (e.g., smartphones) can generate electronic noise, but also from
body movements or improper placement and adjustment of the electrodes in the skin.
These interferences can be misinterpreted and skew the analysis, leading to false
diagnosis; however, they can be detected and removed by using fltering algorithms.
Related to the control of the interaction context, virtual reality (VR) can also be a
good tool (Rebelo, Noriega, Duarte and Soares, 2012). VR, integrated with biosensors, offers a strong way to evaluate UX through emotional reactions. Particularly,
immersive VR can isolate the participant from the external environment stimulus,
having a higher control of his/her integration inside the virtual environment. Also,
immersive VR allows the possibility to get, in real time, data from the user’s displacements to evaluate, for example, how the product attracted users’ attention to
interact with it or proved refusal. VR generates emotions similar to those obtained
in real-life situations (c.f. Oliveira, Noriega, Rebelo, Heidrich, 2018) and is possible
to simulate critical situations, related, for example, with emergency or time pressure
(Vilar, Rebelo, Noriega, Duarte and Mayhorn 2013; Almeida, Rebelo, & Noriega,
2019), to evaluate the human decisions in those situations.
Following the previous limitations and opportunities, this chapter discusses, in a
frst step, the usability and user experience concepts and the measures involved to
evaluate them, particularly those related to the biosensors. In a second step, it aims
Advanced User Experience Evaluations
333
to discuss the concept of virtual reality and its potentialities of use in user experience studies. Finally, this chapter presents and discusses the proposed model that
integrates the analysis of the situation, virtual reality with biosensors to evaluate the
user experience.
The insight provided by this chapter can support the researchers and specialists
in UX to get a better understanding of the feld and be able to use the most suitable
technique for their work.
18.2
ABOUT UX CONCEPT
It is common to have some confusion about the concepts of usability and user
experience (Zaharias and Mehlenbacher, 2012); although both concepts are associated with the user interaction with a system, there are differences between those
concepts. Usability is defned by ISO 9241 as the effectiveness, effciency and
satisfaction with which specifc users archive specifc goals in a particular environment. Effectiveness means the accuracy and completeness that the users archive
specifc goals in particular environments. Effciency introduces another parameter, the resources expended, by the same specifc users, goals and environments.
Satisfaction comes from the user’s perception that accomplished their specifc goals
in specifc conditions. In this context, usability is connected with user performance,
where the measures are related to objective information, like success to accomplish
a task, time and number of errors. Satisfaction, in this perspective, is related to the
user’s perception of his own performance. There are some tools to evaluate the satisfaction, such as the questionnaires for user interaction satisfaction (QUIS) (Chin et
al., 1988), and other more general tools to measure user’s perception about usability,
like the system usability scale (SUS) (Brooke, 1996), and post-study system usability questionnaire (PSSUQ) (Lewis, 1995).
For user experience, ISO 9241 defned as the user’s perceptions and responses
that result from the use and/or anticipated use of a system, product or service. The
user’s perception and responses include the user’s emotional reactions and decisions
that occur before, during and after the interaction. Those perceptions and responses
derive from the user’s prior experiences, skills, attitudes, beliefs and mood. Effect
and emotional appraisals of the users are the methods traditionally most used to
evaluate the user experience.
Those methods evaluate the human emotional states, like the PAD model
(Mehrabian and Russell, 1974) or the circumplex model (Russell, 1980; Posner,
Russell and Peterson 2005) to measure the emotional states. To avoid misinterpretation of words and to be universal, representative pictorial assessment tools were
developed, like the Self-Assessment Manikin (SAM) (Bradley and Lang, 1994),
Emocard (Desmet, Overbeeke and Stefan, 2001), and product emotion measurement
tool like the Premo (Desmet, 2003). Another approach, proposed by Nagamachi in
1995, is the kansei engineering, which can be used to extract and defne the aesthetic
characteristics of products.
Together, usability and user experience contribute to a good human interaction
with a product/system, but, in some cases, a good user experience cannot correspond
334
Handbook of Usability and User Experience
to a good usability. The user experience manifested by the positive emotional reaction of wearing an elegant pair of high-heeled shoes is not related to the performance
(usability) in walking in degraded foors or to needing to run a few meters to cross a
road, or even to using them for a long time. In the same way, a pair of running shoes
that provide a user with effciency to run can have a bad user experience if the user
thinks that the shoes do not match with the outft style.
The example of the shoes shows the possibility of usability being independent of
user experience. Agarwal and Meyer’s study (2009) shows an example of this independence. In their study of interfaces, they used typical usability metrics and also
emotional measures. Although there were no signifcant differences in the usability
metrics of the interfaces, the emotional pattern obtained was different for each of the
interfaces. However, with this we do not defend that usability should not go along
with the user experience. In fact, as the study of Noam Tractinsky cited by Norman
(2004) demonstrates, a good aesthetic component associated with the user experience can have a positive effect in terms of perception of usability of the interface.
This effect can be easily explained by the psychological effect that a positive emotion
has on how it makes the brain open, and makes it face problems in a more positive
way, viewing them as opportunities and not diffculties as shown in the studies of
Alice Isen, also cited in the book of Norman, Emotional Design (2004).
Thus, while usability is related to a rational subject (human performance), using
objective measures, user experience is more related to human decision and emotional
reactions. For this reason, usability and user experience don’t use the same tools and
metrics to be acquired and measured (Figure 18.1). Most of usability measures are
objective: success to complete a task, time to accomplish a task, number of errors
and time needed to learn a task and can be easily quantifed. Only the satisfaction
measures are subjective, but they are related to performance during the task and
product recommendation, where the levels of subjectivity are lower (Harvey and
Stanton, 2013).
FIGURE 18.1 This fgure shows that usability and user experience in the evaluation of
human interaction are different concepts. The word usability is inserted in an ellipse together
with the words performance and objective data and the word user experience is next to it, in
another ellipse, with the words emotion, subjective data and physiological data. Surrounding
these two ellipses we have a larger one with the word’s human interaction.
Advanced User Experience Evaluations
335
Traditionally, the UX measures are subjective and are related with the emotional
reactions captured by questionnaires.
18.3
VIRTUAL REALITY IN UX MEASURES
The UX evaluation in laboratory setups has a high internal validity, allowing greater
control of the variables and a good possibility to change the experimental conditions. This control allows replicating the study by other researchers but does not
guarantee that the participants are involved with the interaction with the product,
as it can happen in their real lives, thus not allowing its ecological validity. Despite
this fact, most UX studies and assessments are conducted in laboratory settings or
in makeshift settings, without proximity to the real context of use, limiting the UX
evaluation results. One possible justifcation for this practice can be explained by the
high economic costs and human effort involved to conduct experimental evaluations
in a feld situation.
Even if UX’s assessment in the real situation was possible without major economic or fnancial efforts, there are also several problems that limit this approach.
This feld of studies provides a real interaction situation, but the control of variables
is very diffcult due to the complexity of the real world. In the feld, it is very diffcult
to control all the environmental (e.g., light and noise, other people and unpredictable
events) stimulus that can occur during the UX test. Another problem that limits UX
evaluations in the feld occurs when the interaction involves real dangers. Evaluation
of the UX with a smartphone in an urban space can involve danger, particularly if
the participant walks on the road and can be hit by a car.
In conclusion, both laboratory and feld tests have advantages and disadvantages
to conduct UX studies. There is a need to fnd a new paradigm that can have a
high control of the experimental conditions in an ecological situation. Virtual reality (VR) can give a good answer to this challenge. One of the main advantages of
using VR to measure UX is the possibility to create a virtual environment (VE), with
higher ecological validity than a laboratory setup, and at the same time allowing a
higher control of the user’s interaction with a product (Moehring and Froehlich,
2010; Rebelo, Noriega, Duarte and Soares, 2012).
VR has been defned according to two different perspectives: one related to the
used devices technology, and another associated with the human experiences when
interacting with the virtual environment. The frst perspective was proposed by
Steed (1993), defning VR as a computer-based system containing several key components, such as head-mounted displays (HMD), tracking systems in the body and
manual input devices in the hand, to allow interaction with the VEs, audio output
and database. In the same perspective, Burdea and Coiffet (2003) defne VR as a
sophisticated interface between people and computer, which can be used to generate virtual environments for the participants to experience. VR equipment needs to
respond, in real time, to the participants’ inputs (i.e., body movements, voice, eye
movements and brain activation), allowing the user to interact with the VEs.
The second perspective that is associated with the behavioral sciences defnes
VR as an advanced form of human-computer interface that allows users to interact
336
Handbook of Usability and User Experience
with and to become immersed in a computer-generated environment in a naturalistic
way (Schultheis, & Rizzo, 2001). Our perspective highlights the human experience;
Rebelo, Noriega, Duarte and Soares (2012) defned RV as a way of transporting a
person to a reality in which they are not physically present but seems like they are
there.
There are diverse opinions about what is a VR system. Gutiérrez, Vexo and
Thalmann (2008) proposed three groups: virtual reality, which involves images and
sounds; augmented reality (AR), where digital graphics are superimposed over the
real-world images; and augmented virtuality (AV), where imaged portions of the
real world are integrated within the virtual world, for this situation the authors designated them as mixed realities.
In the last few decades, VR has been applied in a variety of situations. Parsons
and Rizzo (2008) used RV to treat mental health disorders (fear of heights, public,
substance disorders and schizophrenia). Ottosson (2002) used VR in the product
development process, and Vilar, Rebelo, Noriega, Duarte and Mayhorn (2014) studied the effects of competing environment variables and signage on route-choices in
simulated everyday and emergency way-fnding situations.
18.4
COMPONENTS OF A VR SYSTEM
A VR system is composed of input and output devices and a software application.
Normally, the input devices are composed of trackers and command devices to capture
the trajectory of the body movements that will be replicated in the virtual character of
the participant. The body movements will allow the avatar displacements, launch, grab,
push or pull elements in the VE. It can also integrate voice, eye tracker and electroencephalography inputs that can allow the same interactions with the VE objects.
The output devices are composed of visual displays, aural sound, olfaction, tactile
and proprioceptive devices. User actions, for example, head movements, explore the
VE and body and manipulation motions, activate the input devices, allowing different levels of immersion and interactions.
A generic VR system involves a computer with a graphic card, with the capacity
to handle real-time graphics and sound, in the function of the input-user interaction
in VE. The VR system also includes a software application that allows the management of the devices, in the function of triggers and associated events.
18.5
PROPOSED MODEL
The new UX evaluation model (Figure 18.2) involves four steps that start with an
analysis of the situation to defne a concept and fnishes with the user interaction
with the immersive virtual reality environment.
18.5.1
ANALYSIS OF THE SITUATION
In function of the project, this phase optimizes an existing interaction situation,
or develops a new interaction for a new product or service. There are different
Advanced User Experience Evaluations
337
FIGURE 18.2 This fgure shows a schematic representation of the proposed model. It consists of a set of ellipses that correspond to the steps for using biosensors and virtual reality
to evaluate the user experience. It starts with an ellipsis with the word situation analysis and
beside it, a text with: identify, physical involvement, tasks, health and safety problems, effciency. The previous ellipse is connected with an arrow to another, on the right side, with the
words: situation concept with the text: objectives and model creation. The previous ellipse is
linked with an arrow to another with the words: immersive simulator in virtual reality with
the words next to it: VR involvement and possibility of interactions. The previous ellipse is
linked with an arrow to another with the words: User interactions with VR, with the text on
the side: human decisions and emotional reactions. Finally, a last ellipse with the word biosensors and the text: physiological measures and eye tracker, with three arrows connecting
this ellipse to the following ellipses: situation concept, immersive VR simulation and user
interaction with VR. Surrounding all the previous ellipses, we have a larger one, with the text:
user experience evaluation with VR.
approaches, however, for both; the main objective is to identify the existence of
possible problems related to user’s safety and well-being and with the effciency
of the system.
To optimize an existing interaction, it is necessary to understand the way in which
different aspects of the components of the environmental system infuence and are
infuenced by the user interaction. For a new user interaction situation, it is necessary
to identify similar existing situations to conduct an interaction analysis in order to
enable a diagnosis and identify the specifcations for the new interaction situation to
be designed. In both situations, task analysis can be considered a good design tool to
identify user interaction problems and enable a diagnosis to identify problems and to
set the requirements for the new virtual environment to be designed. In this analysis,
it is important to consider the differences between prescribed operations, related to
the procedures and instructions given to the user and the interaction performance
tasks actually performed by the user.
To have a better understanding, we also recommend an interaction analysis to
evaluate how the tasks are performed, considering the interaction context, the user
338
Handbook of Usability and User Experience
characteristics, their needs and expectations, in relation to their performance. An
interaction analysis requires the use of a combination of tools that goes through
observation of the user interaction and techniques for gathering their opinion through
questionnaires and interviews. It is also necessary to cross this information with the
context characteristics (physical, environmental and social) that can infuence the
user interaction.
A literature review about the interaction situation problems with the product and
similar products, reported in case studies, is also fundamental to understand the factors that can be associated with problems and possible solutions to fx them.
The output of this analysis is a description of:
• The physical environment characteristics, involving the space and object
dimensions;
• The characteristics of the social environment, involving the organization
and eventual people, that can be present during the user interaction with
the product;
• The tasks to achieve the proposed goals with the product;
• The user complaints about diffculties to accomplish the tasks to reach the
objectives and muscle-skeletal pain, related to body movements; and
• The reported or observed user interaction errors.
18.5.2 SITUATION CONCEPT
Situation concept uses the results achieved from the previous phase and has as its
main goal the development of the virtual reality concept to be implemented. This
phase begins with the defnition of the study objectives that can be related to a problem to be investigated.
In a project to study human compliance with safety information that showed low
levels of compliance, Duarte (2011) proposed the following concept for a VE simulator to study this problem:
• The VE should be a work-type environment, subdivided into several rooms,
with corridors having some open and closed doors. The corridors should be
organized in a symmetrical manner, so the participants’ ability to learn the
spatial confguration could be reduced as much as possible and the cognitive load, associated with the search task, could be potentiated.
• The rooms should have only one entrance and exit to reduce the number of
alternatives given to the participant and, therefore, to facilitate the measurement of data such as time and distances and, consequently, to facilitate the
measurement of data such as time and distances.
• Inside of the rooms should contain hazardous products and equipment that
could give rise to an accident. The furniture, objects and decorations should
be adequate to this type of facility, reproducing a common workplace.
• The VE should be adequate to a performance of a search task, for example,
look for a target and comply with a warning/posted sign indexed to it.
Advanced User Experience Evaluations
339
• The complexity and the space of VE should allow a participant interaction
for less than 15 minutes.
• Should have an area with space routes, with a sequence of a series of
T-shaped intersections interconnected, without relevant marks that could
bias the participant decisions. This area ends with an exit point, where participants fnd an exit door.
• The T-shaped intersections should be all blind-t type (i.e., the corridor in
which the participants were traveling through ended and they could turn
either left or right, and one of these directions was always a dead-end, but
not visible from the decision point).
• The walls should have free space to display the safety information, which
should be required in the VE.
• The VE should contain adequate details to look realistic, reproducing the
illumination, shadows, refections, textures and sounds without producing
performance in the computer that can affect the participant interactivity.
• All the buttons and generally hand commands after being pressed should
produce a feedback (sound, animation movement and color change) and
trigger an event in VE.
• A narrative to create meaning for interaction with VE and to engage the
participant in this interaction. In this narrative, the participant is confronted
with a history where he must imagine that his family was unemployed, and
he would have the opportunity to have a well-paid job. To have this opportunity, he would have to succeed in completing a set of tasks that will be
given to him within the virtual environment.
• The warehouse has no people because the action takes place at the end
of the day. In this context, the participant needs to turn on the company’s
security alarm systems, which are in several rooms.
• Inside the VR the participant in a given moment is confronted with an
explosion followed by a fre and is expected that he or she leaves the building soon.
• In the egress, the participant could rely on exit signs to help them fnd the
right way out.
• The compliance assessment with the safety information was accomplished in two moments. The frst moment occurs when the participant was
requested to perform an end-of-day routine where he has the task to turn on
the security alarms. In the second moment, the compliance with exit signs
during the emergency egress is evaluated, in response to an explosion followed by a fre.
Brainstorming and focus group meetings with the VR team (i.e., designers, software
engineers and researchers) and the main stakeholders are a good solution to get ideas
about possible concepts in the function of problems.
In conclusion, the output of this phase is a detailed description of the VE concept
to engage the participants in the main objective of the project.
340
Handbook of Usability and User Experience
18.5.3 IMMERSIVE VR SIMULATOR
A VE simulator is composed of the following components: objects and space geometry; textures that defne the appearance of the objects, lighting and shadows; environmental sounds; animations and triggers that call events.
18.5.3.1 Object and Space Geometry
The implementation of a VE project concept for the space and objects geometry
could be done at the beginning using a computer-aided design program to have a
high level of control of the dimensions. Great care is required considering the number of polygons that make up the geometry of objects. Objects with a large number
of polygons have a good appearance; however, they imply a high computational load,
jeopardizing the fuidity of the user interaction with the VE. A general rule is: if the
object is not important for the user experience or it is not involved in the participant’s
main tasks, a high level of detail is not required. For objects far away from the participant’s eyes, and if this information is not important, photographic images may be
used instead of objects with volume.
18.5.3.2 Textures
Textures are pictures used to defne the appearance of an object in a VE. It is possible to apply one or more textures to a material, and then apply this material to an
object. Textures are very important to give more details and consequently a good VE
realism, but high-resolution textures spent video memory and will take more time to
download from the disk or from the Internet, slowing the participant’s interaction.
The use of smaller textures will minimize the previous problems, but will affect the
details of the images, reducing the VE realism. To optimize the texture size, it is
important to know which objects will need high-defnition textures. A small object
that use a few pixels in the screen doesn’t need a 4K texture, but a frame with text
to be read for the participant need to have a high resolution to have a good detail to
be read easily. Another way to reduce the computational charge is the use of compressed texture formats when possible, and use of 16-bit textures over 32-bit textures. For each texture, a new material is created that needs to be called at rendering
time—draw-call. To have a good performance, avoiding loss of performance of the
computer graphic engine, a technique to reduce the computational charge is the UV
mapping. This technique is created after modeling a three-dimensional object and
uses the same mesh structure as the original object, but the mesh is converted into a
bidimensional space with the consequent deformation. In this bidimensional mesh is
applied different textures, allowing the possibility to group them in a unique texture
and reducing the number of draw-calls.
18.5.3.3 Lightening and Shadows
Selecting the number, localization and the best type of light is a complex subject
which requires a balance between a good user experience and the computational performance of the VE. The common types of lights used to create a VE are as follows:
Advanced User Experience Evaluations
341
• Spotlights, which emit a light in a cone format that can put in evidence a
specifc object or area. Normally spotlights are used to capture the attention of the participant for an event of something that is important for the
participant to see.
• Point lights emit the light in all directions from a light point. This light can
be used as baseline to lighten a room to create an environment.
• Area lights are surfaces that emit light along one side. This light can be useful, for example, to create a false window. A real window is costly from the
point of view of computer calculations, particularly if we are interested to
render the interior. Electroluminescent surfaces in curtains, placed in front
of a window, can add a sunny glow and get more realism for the VE.
• Tube lights simulate the traditional tube fuorescent lights used in publicity.
This light can be useful to emphasize a piece of information to be read by
the participant in the VE.
• Emissive materials simulate the glow coming from a surface and can be
used to create more realism in VE.
Dynamic lights and surfaces can move due to wind forces and create shadows that
move. This action implies a high computational cost and can affect the user experience. To manage this problem, it is possible to set the light to render real lighting,
baked or mixed.
Real lighting creates the best user experience, with dynamic shadows, but requires
computational resources. They should be used only in special situations, for example, to explore a dark room with a focus light.
Baked light is a strategy to reduce the computational calculations using lightmapping. This technique calculates the light for a static geometry and saves it as textures.
This technique does not allow to have dynamic shadows and can reduce the participant user experience. A better strategy could be a mixed solution considering lightmapping shadows, using static lights, and real-time shadows, using some dynamic
lights, for moving objects.
18.5.3.4 Sound
Sound is a very important aspect of the VE because it enhances the emotional impact
in the participant experience. We have a high-level perception of sound localization
that allows a very good accuracy of where a sound comes from. The common applications to create VEs give the possibility to defne the sound localization, allowing
the participant to have an immersive experience.
18.5.3.5 Triggers and Events
When a participant touches a virtual object, for example, a button (an action), a
door will open (an event). The actions can be combined by Boolean expressions. For
example, an event will occur only if the participant touches frst the button A and
next the button B.
342
Handbook of Usability and User Experience
A common participant action in VEs is the frst person colliding with objects,
and manual commands collide with objects, which can activate events like objects
animations (i.e., open or close a door); change a variable status (i.e., score); and show
a piece of information inside the VE or in the display canvas.
The actions and triggers are developed with computer languages by programmers
but can be implemented with visual programming languages.
18.5.4 USER INTERACTION WITH VR
Before beginning user interaction studies to evaluate UX, it is very important to
evaluate if the VE model can measure the participant experience interaction. In this
context, it is important to have experimental trials to verify the participant performance and get his/her opinion about the quality of the interaction.
Some important aspects to evaluate in the experimental trials are as follows:
• The participant accuracy: Verify if the participant can move and place or
reach objects in the VE prototype.
• Ease of use: Verify if the devices and proposed interaction are easy to use.
• Discomfort: Verify if the participant experiences discomfort, pain, motion
sickness and other negative symptoms that can affect the participant
experience.
• Motivation: Verify if the participant is motivated to have similar experiences in the future.
The measures related to participant behavior inside VE are associated with the proposed narrative and tasks that the participants need to do. Those measures may differ in function of the previous proposals; here we suggest the following:
• Approaching or moving away from a product or a stimulus (attraction or
repulsion) inside the VE;
• If we use eye-tracking with the VR, the eye gaze and the areas of visual
interest are interesting measures to evaluate the product attraction in the
VE;
• Forced choice situations, when the participant needs to choose a product or
a situation, are interesting to measure the participant preferences.
The common measures from subjective participant’s perception can be related to
adaptations of tools to measure the emotional reactions inside the VE. The measures need to be acquired inside the VE to avoid external infuences. The use of
scales can be a good solution to avoid participant interaction problems. Another
important aspect to be considered in this measure is the moment where the measures are taken. Stop the participant task inside VE to get this data break his/her
engagement.
The common measures acquired from biosensors will be described next.
Advanced User Experience Evaluations
343
18.6 BIOSENSORS
The use of biosensors is increasing day by day in the real world to improve the
quality of life, providing monitoring of vital signs of patients, athletes, premature
babies, children, psychiatric patients, people in need of long-term care, the elderly
and people in impassable regions away from health and medical services (Ajami and
Teimouri, 2015).
With technological advancement, cost-reduction and ease of use, biosensors are
beginning to be used in human-machine interaction and even in VR and VE scenarios, making the interface simpler and more intuitive. Use of eye-tracking in the
control and positioning of the screen during games, measurements of the blink of the
eye, fxations, movement speed and return visits are measures that have long been
used to infer interest in the game, product or advertising. The physiological signals
such as breathing, sweating, heartbeat and galvanic skin response have been used as
indicators of comfort or stress when performing certain tasks. The use of electroencephalography (EEG) in the so-called brain-computer interface (BCI) has become
more and more a reality and there are applications in spelling and object control,
among others.
However, the effcient use of biosensors in all these new areas still faces great
challenges and requires multidisciplinary knowledge so that the data obtained is
reliable. We found challenges in the variability of signals from subject to subject,
in the correct placement of the sensors, in the knowledge of the sensor’s own characteristics, in the conditions of signal acquisition, in its treatment and fnally in its
interpretation when associated with the protocol. At this point, we will look carefully at these aspects that must be considered when designing an experiment involving biosensors.
There are several biosensors and here we will essentially address the so-called
physical sensors. A physical sensor is made of a material that changes one of its
characteristics according to the quantity to be measured, and a transducer is a device
that converts energy from one form into another. The transducer may be either a
sensor or an actuator. A sensor is a transducer that generates an electrical signal proportional to a physical, biological or chemical parameter. An intelligent transducer
consists of a sensor or actuator; at the same time, it has a processing unit and a wireless communication unit, allowing it to be connected in a network in order to serve
larger systems (Song and Lee, 2008). Its use fnds place in several areas such as home
automation and Internet of things (IoT).
According to the variables we intend to measure, the sensors can be pressure, speed, displacement, acceleration, temperature, fow, resistance, capacitive,
inductive, electromagnetic, thermoelectric, photoelectric and others. The biomedical physical sensors can be divided into four classes based on their following
features:
1. Radiation sensors address the X-ray- and gamma ray-based sensors.
2. Mechanical sensors include ultrasound and pressure sensors.
344
Handbook of Usability and User Experience
3. Thermal sensors include a range of sensors such as thermocouple, thermistor, thermopile, optical fber devices, P-N junction diode and infrared
sensors.
4. Magnetic sensors include blood fow and magnetic resonance imaging systems (Ahmad and Salama, 2018).
When considering a measurement system, the frst concern is knowing which variables we want to measure, and the second which sensor is best suited for the intended
purpose. This choice is not easy, it requires a thorough knowledge of the features of
the sensors and their implication in the result. Not knowing the true performance of
your instrument could lead you to incorrect readings, and the cost of this error could
be very high. Figures 18.3–18.14 show some of the most important features.
Accuracy: Difference between the
measured value and a reference value
(“true” value). High accuracy mean
coincides with the true value and low
accuracy the average of repeated
measurements which is far from the true
value (Figure 18.3).
FIGURE 18.3 A black gaussian curve, whose
average of the random measurements coincides
with the real value 50, is an indicator of a high
accuracy sensor. The right gaussian curve has the
same standard deviation, but its average is deviated from the actual value by an offset of 10, indicating a low accuracy. This error is usually easy
to resolve through a calibration process by adding
or subtracting the offset from the measured value.
Advanced User Experience Evaluations
345
Precision: It is inversely related to
standard deviation. High standard
deviation low precision and low
standard deviation high precision
(Figure 18.4).
FIGURE 18.4 Both gaussian curves have the
same accuracy (same average coincident with the
true value) however one curve has a higher standard deviation, that is, there is a greater dispersion of the central value, and the sensor is less
accurate. This type of phenomenon is more diffcult to correct as it is usually related to a greater
sensitivity of the sensor to other environmental
conditions such as, for example, temperature,
humidity, pressure.
Sensitivity: It is defned as the slope of
the output characteristic curve (dy/dx)
or, more generally, the minimum input
of the physical parameter that creates a
detectable variation in output
(Figure 18.5).
FIGURE 18.5 The upper line shows greater
variation to a change in the physical quantity to
be measured than the gray line. In the fgure it is
possible to verify that the same change in the input
x (dx) causes a greater variation in the output dy1
in sensor 1 than in sensor 2, that is, dy2<dy1 sensor 2 (gray straight) is less sensitive than sensor 1
(straight to black). This behavior can be improved
with the use of signal amplifers, however, by
amplifying the signal we are also amplifying the
noise.
346
Handbook of Usability and User Experience
Drift: As variations occur in temperature,
pressure and other environmental
conditions, certain static sensors
features change, and the sensitivity to
disturbance is the measure of the output
values (Figure 18.6).
– Zero-drift (or offset or baseline drift or
bias)
– Sensitivity drift.
FIGURE 18.6 This fgure shows the zero-drift
represented by the upper line where it is shown
an offset in relation to the real middle line. This
phenomenon may be related to, for example, the
relaxation of a spring, which over time changes
its equilibrium position. In the other case, sensitivity-drift, represented by the gray line, there
is a change in the sensitivity of the sensor that
is associated with the loss of spring elasticity,
that is, the spring for the same weight stretches
less. In the case of the spring, both types of drift
can occur simultaneously, normally due to use,
aging or environmental conditions to which the
sensitive element of the sensor is subject.
Range or Span: Defnes the minimum
and maximum values of a quantity that
the sensor is fabricated to measure
(Figure 18.7).
Full-Sale: It is a difference between the
maximum and minimum, expressed in
the units of variable.
FIGURE 18.7 This fgure shows that ideally,
there would be sensors with an infnite full-scale,
that is, they would maintain their characteristics for
any input value. However, in real life this does not
happen, we cannot use the same scale to weigh gold
and trucks. In fact, sensors are built to respond well
to a certain range of measurement values.
347
Advanced User Experience Evaluations
Transfer Function: It gives relation
between input and output signal and is
the mathematical representation of the
relationship between the input and
output of a system (Figure 18.8).
FIGURE 18.8 This fgure shows the representation of three sensors with different transfer functions linear (a straight line), exponential (a line
concave up) and logarithmic (a line concave down).
There are many more characteristic curves of the
sensors and techniques of linearization of these
curves using inverse functions are usually applied.
Linearity: When the input-output points
of the instrument are plotted on the
calibration curve, the resulting curve
may not be linear (Figure 18.9).
FIGURE 18.9 This fgure shows the
behavior of the output in relation to the
input is considered linear when the transfer function can be represented by the
equation of a line, example of the black
line in the graph. In fact, even for systems with linear behavior, there is always
a tendency to have fuctuations in their
linearity. Linearity is a measure of the
maximum deviation expected by the sensor from a line that minimizes deviations.
348
Handbook of Usability and User Experience
Linearity: If a linear relationship
between y and x exists, then this can be
expressed as y = mx + b, where the
coeffcients m and b can be estimated
using least squares method (Figure
18.10).
FIGURE 18.10 The fgure shows a set of
points obtained from random measurements
of a sensor with linear behavior. The way
to estimate the line that best fts this set of
points is to use the least squares method,
where the values for the slope of the line and
the ordinate at the origin are estimated.
18.6.1 DYNAMICS CHARACTERISTICS
Bandwidth: Bandwidth, also referred to
as frequency response, is an indication
of a displacement sensor’s ability to
respond to changes in the measured
displacement. It is measured at the -3
dB (Figure 18.11).
FIGURE 18.11 This fgure shows the concept of
bandwidth. The bandwidth is represented in the
amplitude/frequency graph, with the horizontal
axis representing the frequency and the amplitude
in dB on the vertical axis. The dashed boundaries represent the points where the amplitude drops
by 3dB. When the input signal presents values in
frequency higher than the cut-off frequency, it is
considered that the sensor is behaving like a lowpass flter and does not allow the components of
the signals with frequencies higher than the upper
cut-off frequency to pass. Identical behavior happens at low frequencies. When the input signal has
components with frequencies below the low cutoff
frequency, the sensor behaves like a high pass flter
and will pass signal components whose frequencies are greater than the low cutoff frequency.
Advanced User Experience Evaluations
349
Saturation: Sensor operating limit when
stimulus variation no longer responds
(Figure 18.12).
FIGURE 18.12 This fgure shows the sensor saturation. The saturation phenomenon occurs when
the input signal is greater than the sensor’s range in
amplitude. In the fgure we can see that if a sensor
is designed to obtain output signals up to 80, if there
is a signal whose expected amplitude at the output
is 100, at the output the sine wave produced will be
truncated at 80, that is, values greater than 80 will
be displayed with values of 80.
Resolution: It is a lower limit on the
magnitude of input stimulus which is
necessary to produce an observable
change in output (Figure 18.13).
FIGURE 18.13 This fgure shows the
dynamic response of a sensor. The resolution
of a sensor is usually associated with sensors
with digital outputs, representing the number
of bits used to encode the amplitude range
of the input signal. For example, if an 8-bit
analog-to-digital converter (ADC) is used,
256 levels are available to represent the output values. This quantization, represented in
the graph by a “scalloped” graph, approaches
a high-resolution signal (smaller steps) as the
number of ADC bits increases. Even in analog
sensors there is a minimum value of variation
that causes a change in the output and from
there the sensor resolution can be estimated.
350
Handbook of Usability and User Experience
Dynamic Response: When an input is
applied to a sensor or a measurement
system, the sensor or the system cannot
take up immediately its fnal steadystate position. It goes through a transient
state before it fnally settles to its fnal
steady-state position (Figure 18.14).
FIGURE 18.14 This fgure shows the sensor’s
response to a sudden change in the input value
is not instantaneous and there is a transition
period until this value stabilizes. The straight
line represents the instantaneous change of the
input signal from 0 to 1. The gray signal represents the oscillation of the output until the value
stabilizes. Usually, the most desirable thing is
for the output to converge as quickly as possible
to 1 without fickering.
Repeatability: For repeatability to be
established, the following conditions must be in place: the same location; the same
measurement procedure; the same observer; the same measuring instrument, used
under the same conditions; and repetition over a short period of time.
Reproducibility: Reproducibility, on the other hand, refers to the degree of agreement between the results of experiments conducted by different individuals, at different locations, with different instruments.
Usually these and other features can be found on the manufacturers data sheets.
However, the project is not fnished and there is a necessary set of steps until the
signals are ready to be displayed.
18.6.2 SIGNAL ACQUISITION CHAIN
The data acquisition chain can be more or less complex, depending on the number
of sensors involved and their specifcities. It can be displayed using a block diagram.
BITalino is a low-cost wearable electronic device where several biosensors can be
connected (Batista et al. 2019). The BITalino offers fexible user interface for data
transmission through the Bluetooth to a personal smartphone, tablet or laptop (Silva,
Fred, and Martins, 2014).
A typical block diagram is shown in Figure 18.15. It integrates various sensors to
monitor multiple human biometrics in real time. This example includes in particular
a set of biosensors, Respiration (PZT), Electrocardiography (ECG), Electrodermal
Advanced User Experience Evaluations
351
FIGURE 18.15 This fgure shows a data acquisition system including several steps necessary to acquire a signal. The sensors or transducers responsible for converting a physical
quantity into an electrical grid connected to analog inputs A1, A2, A3, A4, A5 and A6 are
Respiration (PZT), Electrocardiography (ECG), Electrodermal Activity (EDA), Pulse Sensor
(PPT), Accelerometry (ACC), Light sensor (LUX) respectively. These six inputs pass through
a multiplexer device (MUX) that is controlled by the processor and aims to sequentially measure the value of each sensor individually, that is, the processor selects input 1 through the
multiplexer and passes to the ADC where the signal is converted. to digital and supplied to
the processor, then it switches to input 2, passes the ECG signal to the ADC and performs the
conversion to the processor, followed by this process in an infnite cycle that passes through
all the other sensors. On the other hand, if it is necessary to provide some feedback, three
digital outputs are available, represented by Dn, where a digital-to-analog converter can be
used to convert digital values to an analog output or simply have digital outputs that oscillate
between 0 and 1. communication represents the bluethood module used by BITalino to communicate with external devices such as a PC or mobile smartphone.
Activity (EDA), Pulse Sensor (PPT), Accelerometry (ACC), Light sensor (LUX) and
a led or button can also be used as a user interface.
18.6.3
COLLECTION OF PHYSIOLOGICAL SIGNALS
The collection of physiological signals should only be carried out by technicians or
researchers who have enough knowledge to understand the conditions that need to
be observed. Poor collection can be detrimental to the diagnosis and have serious
consequences for the health of patients in the event of a medical examination. The
following are some of the steps in the data collection process:
1) Verifcation of calibration, quality and warranty terms of the sensors.
Environmental conditions and minimum required characteristics of the
computers used are essential procedures to ensure good signal collection.
352
Handbook of Usability and User Experience
2) Correct application of the protocol used in the study. Each physiological
signal monitoring process has a specifc purpose, for example, vital sign
monitoring, diagnostic examination and stress testing, and, depending on
the end goal, the protocol may change considerably the placement of the
sensors, number of sensors, type of sensors, sampling frequency or even
acquisition time. Minor changes in sensor placement can completely alter
the pattern and quality of the signal obtained. In this step, it is necessary to
ensure that the protocol is respected.
3) Treatment of obtained signals
• Reformatting of signals. Signals are not always formatted in the physical quantities of the monitored variables. Often, we can fnd the socalled RawData with the ADC coding used; for example, if an 8-bit
ADC is used, the signals are with values from 0 to 255 and if 10 bits are
used, the values are between 0 and 1023. Taking this into account, it is
necessary to know the characteristics of the equipment used, the characteristics of the sensors and their transfer function in order to reformat
the signals.
• Filtration. Each sensor has its bandwidth and eliminating frequencies
outside that band is critical to greatly improving the signal. For this,
low pass, high pass and/or band pass flters may be used, depending
on the sensor used and the noise it picks up. If there is main noise and
is within the sensor bandwidth, a flter notch is used to delete it. In
the case of acquisition of physiological signals, motion artifacts are
also often found. Their disposal is not easy, and it is often necessary to
repeat the collection again.
• Resampling. The sensors used are not always acquiring the same sampling frequency as the signals can be preventive of different equipment.
In this sense, provided that the Nyquist principle is guaranteed, it is
possible and desirable to resample all signals to the same sampling frequency. This way we can work with signal fusion algorithms or even
greatly reduce the disk space occupied by the data.
• Synchronization. Another important aspect involves signal synchronization. This process is usually required when working, for example,
with protocols involving evoked potentials. In this case, delays in the
application of stimuli (images, sounds, mechanical stimulation and
others) can produce considerable delays in acquired signals. Several
factors can delay the signal such as the sensor itself, the entire signal
acquisition chain and the computer and monitor used. Synchronization
mechanisms or signals may be required which may ultimately allow the
delayed signals to be added during the process. Screen synchronization
using a light sensor, sound synchronization using a microphone or even
using an opto-coupler isolation synchronous to cable connection.
• Standardization. The normalization process is mostly used when we
intend to process data from different participants, as usually the variability from individual to individual is considerable.
Advanced User Experience Evaluations
353
4) Signal recognition and classifcation
This is a high-level procedure where a knowledge background is required
to convert signals into information. This knowledge, often from the medical forum or specialists, allows decisions to be made. There are also some
algorithms that make use of a large knowledge base to make decisions.
However, in both cases, it is important to reinforce that errors in earlier
stages may compromise decision-making and, in particular in health, may
have serious consequences for patients.
• Artifacts/noise (rejection). When the noise level is very high, or the
artifacts cannot be bypassed or even if the sensor malfunctions, it is
necessary to make the decision to eliminate the collection. However, a
survey of what went wrong must be done and fnd out where the fault is
in order to be resolved.
• Normal pattern or phenotype. The fact that a population exhibits a
dominant pattern does not mean that deviant patterns are also not normal as they may correspond to different phenotypes of the study population. Usually this type of information is already known to those who
design the experimental protocol.
• Pathological patterns. However, there are deviating patterns that
are related to pathologies. There may be similar patterns in different
pathologies and as is well-known in medicine that most health decisionmaking is done using various complementary means of diagnosis.
• Emotional patterns. Emotional patterns are an area of knowledge
where research has intensifed in recent years. Emotional patterns are
not easy to identify. It starts with the problem of defning what is an
emotion. There are various approaches and defnitions to the study of
emotions, and some take into account how they were elicited (Scherer,
2005). In this chapter, emotion is approached as changes in physiological signals as a response to a stimulus. The diffculty in fnding specifc
patterns in physiological signals has to do with the variability from subject to subject and the subjectivity that each one manifests according to
their experience and their own emotional and physical state at the time
of the experience.
18.7 CONCLUSIONS
In this work, we presented an integrated model to evaluate the UX, based in
the user emotional reactions and behavior decisions, using virtual reality and
biosensors technologies. This model was inspired by our previous experiences
in the creation of VEs in different studies. To improve the locomotion in a VE,
we evaluated the usability of the locomotion in place solution (Teixeira; Vilar;
Duarte; Noriega; Rebelo and Moreira, 2013) and proposed a new strategy, the
walk-in-place, to be used in human behavior research (Galrão, Rebelo and
Noriega, 2020).
354
Handbook of Usability and User Experience
In the development of VEs, we developed a simulator for safety warnings behavior
compliance evaluation (Almeida, Rebelo and Noriega, 2016). We study the behavior
of older people, mainly with the concern to evaluate if they are able to explore and
read information inside a VE (Reis, Duarte and Rebelo, 2015). We developed studies to evaluate the sense of presence in VEs (Duarte, Rebelo, Teixeira, Vilar, Teles
and Noriega, 2013), and the evaluation of cybersickness (Almeida, Rebelo, Noriega
and Vilar, 2017), to verify the quality of the VEs to be used in the human behavior situations. In the context of package design, we developed VEs to evaluate the
human interactions with different types of packages (Ayanoglu, Duarte, Noriega,
Teles and Rebelo, 2014). In the research area of behavior compliance, we study the
design of warnings (Duarte, Rebelo, Teles and Wogalter, 2014) and safety directional signs in an emergency situation, using VEs (Vilar, Rebelo, Noriega, Teles and
Mayhorn, 2013).
In the area of VE and biosensors, we develop VE to study job interview anxiety, using EDA (Borges, Vilar, Noriega, Ramos and Rebelo, 2016) and we used the
heartbeat rate to study the relationship between VE and emotions (Oliveira, Noriega,
Rebelo, Heidrich, 2018). To study the emotions appraisal in a touristic VE prototype,
we used a face reading toll (Trindade, Rebelo and Noriega, 2019).
Given the previous experience and the common diffculties to evaluate UX with
the traditional methodologies that use subjective data that can be affected by the
user context, we proposed this model as an orientation guideline to create VEs to
be used with biosensors. The model is composed of fve elements that interact with
each other in a systemic way. The analysis of the situation is the frst step and aims at
understanding the interaction situation and the identifcation of the main problems.
The situation context allows the defnition of the objectives for the model creation,
using the previous information. The immersive virtual reality simulator involves the
VR environment and the possibilities of interactions, in function of the previous
steps. The biosensors, involving the equipment to measure the emotional reactions,
need to be considered in all previous elements. Finally, the user interacts with the
VR, where it is possible to measure the emotional reactions, with the biosensors and
the participant decisions within the VE.
This model can be used by students or researchers who can begin to study
user experience in a highly controlled and ecological context, using a VE with
biosensors.
REFERENCES
Ahmad, Rafq, & Salama, Khaled N. 2018. Physical sensors for biomedical applications. In:
2018 IEEE SENSORS, 1–3. IEEE.
Almeida, A., Rebelo, F., & Noriega, P. 2016. Development of a virtual environment for safety
warnings behavior compliance evaluation. In: Rebelo, F., & Soares, M. (eds.), Advances
in Ergonomics in Design, vol 485 of the series Advances in Intelligent Systems and
Computing, 35–42. Springer.
Almeida, A., Rebelo, F., & Noriega, P. 2019. Evaluation of behavioral compliance with
safety warnings at different levels of cognitive load in warehouses. In: International
Conference on Applied Human Factors and Ergonomics, 427–435. Springer, Cham.
Advanced User Experience Evaluations
355
Almeida, A., Rebelo, F., Noriega, P., & Vilar, E. 2017. Virtual reality self-induced cybersickness: An exploratory study. In: Rebelo, F., & Soares, M. (eds.), Advances in Ergonomics
in Design. AHFE 2017. Advances in Intelligent Systems and Computing, vol 588, 26–
33. Springer, Cham
Agarwal, Anshu & Meyer, Andrew. 2009. Beyond usability: Evaluating emotional response
as an integral part of the user experience. In: CHI '09 Extended Abstracts on Human
Factors in Computing Systems (CHI EA '09), 2919–2930. ACM, New York, NY, USA.
Ajami, S., & Teimouri, F. 2015. Features and application of wearable biosensors in medical care. Journal of Research in Medical Sciences : The Offcial Journal of Isfahan
University of Medical Sciences, 20(12), 1208–1215.
Ayanoglu, H., Duarte, E., Noriega, P., Teles, J., & Rebelo, F. 2014. Examining hazard-related
perceptions of virtual household package prototypes. In: M. Soares & F. Rebelo (ed.),
Advances in Ergonomics in Design, Usability & Special Populations: Part I, vol 16,
473–481. Published by AHFE Conference 2014.
Batista, Diana, et al., 2019. Benchmarking of the BITalino biomedical toolkit against an
established gold standard. Healthcare Technology Letters, 6(2), 32–36.
Borges, T., Vilar, E., Noriega, P., Ramos, S., & Rebelo, F. 2016. Virtual Reality to Study Job
Interview Anxiety: Evaluation of Virtual Environments. Advances in Ergonomics in
Design, vol 485 of the series Advances in Intelligent Systems and Computing, 25–33.
Springer, Cham.
Bradley, M.M., & Lang, P.J. 1994. Measuring emotion: The self-assessment manikin and
the semantic differential. Journal of Behavior Therapy and Experimental Psychiatry,
25(1), 49–59.
Brooke, J. 1996. SUS-A quick and dirty usability scale. Usability Evaluation in Industry,
189(194), 4–7.
Burdea, G., & Coiffet, P. 2003. Virtual reality technology (2nd ed.). New Jersey: John
Wiley&Sons, Inc.
Chin, J.P., Diehl, V.A., & Norman, K.L. 1988. Development of an instrument measuring
user satisfaction of the human-computer interface. In: Proceedings of the SIGCHI
Conference on Human Factors in Computing Systems, ACM, 213–218.
Da Silva, Hugo Plácido, Fred, Ana, Martins, Raúl, 2014. Biosignals for everyone. IEEE
Pervasive Computing, 13(4): 64–71.
Desmet, P. 2003. Measuring emotion: Development and application of an instrument to measure emotional responses to products. In: Blythe, M.A., Overbeeke, K., Monk, A.F., &
Wright, P.C. (eds) Funology, 111–123. Springer, Dordrecht.
Desmet, P., Overbeeke, K., & Tax, S. J. 2001. Designing products with added emotional
value: Development and application of an approach for research through design. The
Design Journal, 4(1), 32–47.
Duarte, E. 2011. Using Virtual Reality to Assess Behavioral Compliance with Warnings.
Unpublished thesis (PhD.). University of Lisbon.
Duarte, E., Rebelo, F., Teixeira, L., Vilar, E., Teles, J., & Noriega, P. 2013. Sense of presence in a VR-based study on behavioral compliance with warnings. In: A. Marcus
(ed.), DUXU/HCII, Part III, Lecture Notes in Computer Science, vol 8014, 362–371.
Springer-Verlag, Berlin Heidelberg.
Duarte, E., Rebelo, F., Teles, J., & Wogalter, M.S. 2014. Behavioral compliance for dynamic
versus static signs in an immersive virtual environment. Applied Ergonomics, 45(4),
1367–1375.
Galrão, I., Rebelo, F., & Noriega, P. 2020. Locomotion-in-place and teleport: Which is the
best technique to be used in human behavior research using virtual reality? In: Rebelo,
F., & Soares, M. (eds.), Advances in Ergonomics in Design. AHFE 2019. Advances in
Intelligent Systems and Computing, vol 955, 436–445. Springer, Cham.
356
Handbook of Usability and User Experience
Gutiérrez, M.A., Vexo, F., & Thalmann, D. 2008. Stepping into Virtual Reality. Springer,
Lausanne.
Harvey, C., & Stanton, N.A. 2013. Usability Evaluation for In-Vehicle Systems. CRC Press,
London, UK.
ISO 9241-210. 2010. Ergonomics of human–system interaction – Part 210: Human-centred
design for interactive systems. Génève: International Organization Standardization.
Lewis, J.R. 1995. IBM computer usability satisfaction questionnaires: Psychometric evaluation and instructions for use. International Journal of Human–Computer Interaction,
7(1), 57–78.
Mehrabian, A., & Russell, J.A. 1974. The basic emotional impact of environments. Perceptual
and Motor Skills, 38(1), 283–301.
Moehring, M., & Froehlich, B. 2010. Enabling functional validation of virtual cars through
natural interaction metaphors. In: 2010 IEEE Virtual Reality Conference (VR), (ed.
Lok, B., Klinker, G. & Nakatsu, Ryohei), 27–34. 2010, 20–24 March, Waltham,
Massachusetts, USA.
Nagamachi, M. 1995. Kansei engineering: A new ergonomic consumer-oriented technology
for product development. International Journal of Industrial Ergonomics, 15(1), 3–11.
Norman, D. A. 2004. Emotional Design: Why We Love (or Hate) Everyday Things. Basic
Civitas Books.
Oliveira, T., Noriega, P., Rebelo, F., & Heidrich, R. 2018. Evaluation of the relationship
between virtual environments and emotions. In: Rebelo, F., & Soares. M. (eds.),
Advances in Ergonomics in Design. AHFE 2017. Advances in Intelligent Systems and
Computing, vol 588, 71–82. Springer, Cham.
Ottosson, S. 2002. Virtual reality in the product development process. Journal of Engineering
Design, 13, 159–172.
Parsons, T. D., & Rizzo, A. A. 2008. Affective outcomes of virtual reality exposure therapy
for anxiety and specifc phobias. A meta-analysis. Journal of Behavior Therapy and
Experimental Psychiatry, 39, 250–261.
Posner, J., Russell, J.A., & Peterson, B.S. 2005. The circumplex model of affect: An integrative approach to affective neuroscience, cognitive development, and psychopathology
Developmental Psychopathology, 17(03), 715–734.
Rebelo, F., Noriega, P., Duarte, E., & Soares, M. 2012. Using virtual reality to assess user
experience. Human Factors, 54(6), 964–82.
Reis, Lara, Duarte, Emilia, & Rebelo, Francisco. 2015. Research on workplace safety sign
compliance: Validation of a virtual environment prototype. Procedia Manufacturing,
3, 6599–6606.
Russell, J.A. 1980. A circumplex model of affect. Journal of Personality and Social
Psychology, 39, 1161–1178.
Sacharin, V., Schlegel, K., & Scherer, K. R. 2012. Geneva Emotion Wheel Rating Study (Report).
University of Geneva, Swiss Center for Affective Sciences, Geneva, Switzerland.
Schultheis, M.T., & Rizzo, A.A. 2001. The application of virtual reality technology in rehabilitation. Rehabilitation Psychology, 46(3), 296–311.
Scherer, K.R. 2005. What are emotions? And how can they be measured? Social Science
Information, 44(4), 695–729.
Steed, A. 1993. A Survey of Virtual Reality Literature. Department of Computer Science,
Queen Mary and Westfeld College, Tech. report 623. Retrieved from: http://citeseerx
.ist.psu.edu/viewdoc/download?doi=10.1.1.49.3422&rep=rep1&type=pdf
Song, Eugene Y., & Lee, Kang, 2008. Understanding IEEE 1451-Networked smart transducer
interface standard-What is a smart transducer? IEEE Instrumentation & Measurement
Magazine, 11(2), 11–17.
Advanced User Experience Evaluations
357
Teixeira, L., Vilar, E., Duarte, E., Noriega, P., Rebelo, F., & Silva, F. M. 2013. Strategy for the
development of a walk-in-place interface for virtual reality. In: A. Marcus (ed.), DUXU/
HCII, Part III, Lecture Notes in Computer Science, vol 8014, 419–426. Springer-Verlag,
Berlin, Heidelberg.
Trindade, Y., Francisco Rebelo, F., & Noriega, P. 2019. Emotions appraisal with face reading in a touristic virtual environment prototype. In: Rebelo, F., & Soares, M. (eds.),
Advances in Ergonomics in Design. AHFE 2018. Advances in Intelligent Systems and
Computing, vol 777, 137–148. Springer, Cham.
Vilar, E., Rebelo, F., Noriega, P., Duarte, E., & Mayhorn, C. B. 2014. Effects of competing
environmental variables and signage on route-choices in simulated everyday and emergency wayfnding situations. Ergonomics, 57(4), 511–524.
Vilar, E., Rebelo, F., Noriega, P., Teles, J., & Mayhorn, C. 2013. The infuence of environmental features on route selection in an emergency situation. Applied Ergonomics, 44(4),
618–627.
Watson, D., Clark, L. A., & Tellegen, A. 1988. Development and validation of brief measures
of positive and negative affect: The PANAS scales. Journal of Personality and Social
Psychology, 54(6), 1063.
Zaharias, P., & Mehlenbacher, B. 2012. Exploring user experience (UX) in virtual learning
environments. International Journal of Human-Computer Studies, 70(7), 475–477.
Index
Abdominal sepsis, 120
Acceptance as a multifaceted phenomenon, 110
Achieving Excellence Design Evaluation Toolkit
(AEDET) method, 182
Acute respiratory distress syndrome (ARDS), 120
AEDET method, see Achieving Excellence
Design Evaluation Toolkit method
AI, see Artifcial intelligence
Alphabet Span, 26
Ambient Intelligence (AMI) group, 9
AMI group, see Ambient Intelligence group
Animations
design of animations about medicine
usage, 145
study on animations about procedures for
medicines usage, 142–143
understanding, 148
users’ and health professionals’ assessment
of, 145
ANS, see Autonomous nervous system
AOI, see Areas of interest
Apple Computers, 4
Application, 100–101
AR, see Augmented reality
ARDS, see Acute respiratory distress syndrome
Area lights, 341
Areas of interest (AOI), 60
Artifcial environment, 10
Artifcial intelligence (AI), 251–252
Atrial fbrillation (AF), digital application to
screen for, 155
discussion, 157
implementation and the result, 156
plan, 155–156
revised plan, 157
Augmented reality (AR), 204
Autoimmune disorder pemphigus vulgaris, 121
Automated Operation Span test, 26
Automation and passive customization, 281–282
Autonomous nervous system (ANS), 317
Bad behavior, reinforcement of, 285
Baked light, 341
BCI, see Brain-computer interface
BICU, see Burn Intensive Care Unit
BIM model, see Building Information
Management model
Biosensors, 343
collection of physiological signals, 351–353
dynamics characteristics, 348–350
signal acquisition chain, 350–351
Biosensors, UX evaluations using, 331
biosensors, 343
collection of physiological signals,
351–353
dynamics characteristics, 348–350
signal acquisition chain, 350–351
components of a VR system, 336
proposed model, 336
analysis of the situation, 336–338
immersive VR simulator, 340
lightening and shadows, 340–341
object and space geometry, 340
situation concept, 338–339
sound, 341
textures, 340
triggers and events, 341–342
user interaction with VR, 342
UX concept, 333–335
virtual reality in UX measures, 335–336
BITalino, 350
Bodystorming, 103n2
Brain-computer interface (BCI), 343
Brain waves, 62
Building Information Management (BIM) model,
82, 204
Built environment, usability and user experience
of, 175
combining UX and sustainable concepts as a
21st-century design strategy, 186–190
evolution of the concept, 177
usability concepts, 177–180
user experience concepts, 180
future researches, 190–192
methodological issues for their
evaluation, 181
main methodological approaches, 181–183
main methodological approaches,
183–186
Burn Intensive Care Unit (BICU), 120
CAD, see Computer-aided design
CCR, see Central Control Room
CCS, see Cooperative communication system
Central Control Room (CCR), 73
CF, see Collaborative fltering
Change processes and the human factor, 109
Clickstreams, 60
359
360
Client-based approaches, 65
Cognitive Systems Engineering (CSE), 120
Collaborative fltering (CF), 257, 259
Collective sensemaking, 99
Command line interface, 28
Complex healthcare systems, connecting health
apps to, 153
atrial fbrillation (AF), digital application to
screen for, 155
digital application, 155
discussion, 157
implementation and the result, 156
plan, 155–156
revised plan, 157
digital application for the management of
outpatient appointments, 157
digital application, 158
discussion, 159–161
implementation and the result, 159
plan, 158
digital applications, adoption of, 164
challenges, 164–166
evolutionary approach, 168–169
fexibility in the digital application,
166–167
multidisciplinary design team, 168
passing on the learning, 170
tools for the job, 169–170
digital system to deliver general practitioner
services, 161
digital application, 162
discussion, 163–164
disruption approach to general practice
services, 162
implementation and the result, 162–163
implementation plan, 162
Comprehensive telemedicine (CT), 130
Computer-aided design (CAD), 204
Computer user self-effcacy scale (CUSE), 30
Confguration and active customization, 282
Conspiracy theories, 253
Consumer products, 3
context of use for, 9–10
understanding, 8–9
Cooperative communication system (CCS), 120
design, 121
individual usability assessment, 122, 125
team validation assessment, 123, 127
COVID-19 pandemic, 141, 291, 293, 294
CSE, see Cognitive Systems Engineering
CT, see Comprehensive telemedicine
CUSE, see Computer user self-effcacy scale
Customization, 281
Dassault Systèmes 3DS Virtual Ergonomics, 225
Data, 101
Index
Data codifcation, 89
Data documentation and analysis, 88
data codifcation, 89
description narratives, 89
sequential analysis, 90
thematic analysis, 90–91
transcription, 88–89
Description narratives, 89
DHM, see Digital human modelling
Diabetes Knowledge Questionnaire, 26
Digital application
for the management of outpatient
appointments, 157
digital application, 158
discussion, 159–161
implementation and the result, 159
plan, 158
to screen for atrial fbrillation (AF), 155
discussion, 157
implementation and the result, 156
plan, 155–156
revised plan, 157
Digital applications as evolutionary
sociotechnical systems change, 164
challenges, 164–166
meeting the challenges, 166
evolutionary approach, 168–169
fexibility in the digital application, 166–167
multidisciplinary design team, 168
passing on the learning, 170
tools for the job, 169–170
Digital human modelling (DHM), 219–221
case studies, 230
hospital bed design, 230–233
vehicle ingress-egress, 233–236
welding station, 236–241
common DHM tools in usability, 223
Dassault Systèmes 3DS Virtual
Ergonomics, 225
human solutions RAMSIS, 223–224
imk EMA, 227–228
NexGen Ergonomics HumanCAD,
225–226
SANTOS, 226–227
SIEMENS JACK, 223–224
in product design, 222
representation of the user, 221–222
in testing and predicting usability, 223
usability and UX of DHM tools, 228–229
Digital infrared thermography, 305
applications of, 305
emotional measurement with, 306
operation of, 306
Digitalization, 108–109
Digital system to deliver general practitioner
services, 161
Index
digital application, 162
discussion, 163–164
disruption approach to general practice
services, 162
implementation and the result, 162–163
implementation plan, 162
Don’t Make Me Think! (Krug), 5
Down syndrome, 6
DrDoctor, 158–161, 167–169, 171
Dynamic lights, 341
EAWS, see Ergonomic assessment worksheet
EAWS, see European Assembly Worksheet
ECG, see Electrocardiogram
ECMO program, see Extracorporeal membrane
oxygenation program
EEG, see Electroencephalography
Effectiveness, 5
Effciency, 5
Electrocardiogram (ECG), 155
Electroencephalography (EEG), 343
Electronic consumer products, Usability
dimensions for, 13
Electronic medical record (EMR) system, 120
Emissive materials, 341
Emotional patterns, 353
EMR system, see Electronic medical record
system
Environmental Experience Design (EXD), 209
Ergonomic assessment worksheet (EAWS), 227
Errors, 59
European Assembly Worksheet (EAWS), 231
Evaluation, 4, 57, 114
Evolutionary sociotechnical systems change,
digital applications as, 164
challenges, 164–166
meeting the challenges, 166
evolutionary approach, 168–169
fexibility in the digital application,
166–167
multidisciplinary design team, 168
passing on the learning, 170
tools for the job, 169–170
EXD, see Environmental Experience Design
Expertise level, 26–27
Exploratory Focus Group application, guidelines
for, 102–103
Exploratory Focus Group pre-application,
guidelines for, 101–102
Extracorporeal membrane oxygenation (ECMO)
program, 120
Eye-tracking techniques, 60
FaceReader, 62
FCA, see Formal concept analysis
Field studies, 10
361
Filter bubble, 282, 288n1
“Fitting trials” of the supervisor workstation, 80
Focus Group practices, 100
Focus Groups, using, 101
exploratory Focus Group application,
guidelines for, 102–103
exploratory Focus Group pre-application,
guidelines for, 101–102
Focus Group sequences, 93
and in-depth data, 94–95
interspersed sequencing, 94
linear sequencing, 94
reports and interaction moments, 93–94
Focus Group sessions, 277
accessibility, 280
future adoption, 286
interpretation and decision-making,
277–278
limited navigation, 278
other topics debated by the groups,
280–286
technical limitations, 277
usability, 278–280
Focus Group workshops, 87
frst moment, 88
second and the third moment, 88
Focus map, 60
Forced humanization, 282
“Forced” social interaction, 283
Formal concept analysis (FCA), 45–47
Full size mock-ups to achieve usability, 73
approach, 80–82
psychophysical “old school” approach, 74
large curved display, 76
manager workstations, 76
mock-up brief, 74
mock-up erection, 79
mock-up production, 77–78
operator workstations, 76
supervisor workstations, 75–76
during the trials, 79
waste management, 79–80
trials approach, 80
headline fndings, sample of, 80
General practitioner services, digital system to
deliver, 161
digital application, 162
discussion, 163–164
disruption approach to general practice
services, 162
implementation and the result, 162–163
implementation plan, 162
Gestural technology, 302
Grade of Automation Four (GoA4), 74
Guy’s and St. Thomas Hospital Trust (GSTT), 158
362
Hands-free usage, 279
HBI concept, see Human-building interaction
concept
HCD process, see Human-centered design
process
HCI, see Human–computer interaction
Headline fndings, sample of, 80
Healthcare, usability to improve, 119
cooperative communication system
(CCS), 120
design, 121
methods, 122–123
results, 125–127
telemedicine prolonged feld care
(TelePFC), 128
design, 129
methods, 130–132
Health professionals and patient/users
interviews with, 143
study with, 143
Heat map, 60
HFE, see Human factors and ergonomics
Hierarchical task analysis (HTA), 237
HMI, see Human–machine interface
HTA, see Hierarchical task analysis
Human-algorithm interaction, basic guidelines
for, 254–256
Human-building interaction (HBI) concept, 205
Human-centered architecture, 197
built environment and human behavior,
201, 208
human-building interaction (HBI)
concept, 205
UX, usability, HCD and architecture, 203
UX and usability and, 199
Human-centered design (HCD) process,
200–201, 209
Human–computer interaction (HCI), 4
Human factors and ergonomics (HFE), 219
Human–machine interface (HMI), 74
Human solutions RAMSIS, 223–224
Human-/User-Centred Design (UCD)
process, 111
Humor adequacy, 281
Imk EMA, 227–228
Individual differences in usability and user
experience, 23
cognitive abilities important to usability, 24
spatial ability, 24–25
working memory capacity, 25–26
incorporating, 30
general steps, 30–32
user attributes to consider for usability
studies, 26
expertise level, 26–27
Index
locus of control (LoC) and self-effcacy,
27–30
Inequality and unemployment, 285
Information architecture, 247
recommendation systems, understanding, 256
algorithms implemented by Spotify,
258–260
research method, 260
interviewing results, 261–265
user experience and machine learning
human-algorithm interaction, basic
guidelines for, 254–256
mental models, importance of, 256
problems in UX-AI intersection, 253–254
from web sites to ecologies, 248
artifcial intelligence (AI) and machine
learning (ML), 251–252
from ecologies to machine learning,
250–251
Infrared thermography, applications of, 301
digital infrared thermography, 305
applications of, 305
emotional measurement with, 306
operation of, 306
emotional assessment (feld study), 314
assessment of the felt stress, 316
assessment of the reported stress, 315
expert evaluation (feld study), 312
gestural interfaces for 3D modeling, 302
leap motion and sculpting, 303
pain assessment (feld study), 320
assessment of the felt pain, 322
assessment of the reported pain, 320
research materials and methods, 309
defnition of the sample of users, 311
equipment used, 312
ergonomic assessment, 311
hypotheses, 310
study design, 311–312
test location, 311
usability assessment, 310
In situ and remote user testing, comparing, 66
Interaction, 96–98
International Organization for Standardization, 5
Interspersed sequencing, 94
Invocation, 279
ISO 9241-11, 199
ISO 9241-210, 199
Key and lock, good ft between, 165–169
Large curved display, 76
Leap Motion and Sculpting, 303
Linear sequencing, 94
Locus of control (LoC) and self-effcacy, 27–30
Lostness metric, 60
363
Index
Machine learning (ML), 251–252
user experience and
human-algorithm interaction, basic
guidelines for, 254–256
mental models, importance of, 256
problems in UX-AI intersection,
253–254
Manager workstations, 76
Measurement, usability, 10–12
Mechanical pencils, 40–47
Mental models, importance of, 256
Mental Rotation Test, 25
Methods time measurement (MTM), 227
MHLC, see Multidimensional Health Locus of
Control Scale
ML, see Machine learning
Mock-up brief, 74
Mock-up erection, 79
Mock-up production, 77–78
Moderated user testing, 64
MTM, see Methods time measurement
Multidimensional Health Locus of Control Scale
(MHLC), 28
Multiple regression analysis, 44
NexGen Ergonomics HumanCAD, 225–226
Normalization process theory (NPT), 170
Northern Telecom, 4
No telemedical (NT) support, 130
NPT, see Normalization process theory
NT support, see No telemedical support
Nyquist principle, 352
OCC, see Operational Control Centre
One-to-one mock-up approach, 80
Operational Control Centre (OCC), 73
Operations Support Systems (OSS), 27
Operator workstations, 76
Oral comment, 62
OSS, see Operations Support Systems
Outpatient appointments, digital application for
the management of, 157
digital application, 158
discussion, 159–161
implementation and result, 159
plan, 158
PACU, see Post-anesthesia care unit
Partial telemedicine (PT), 130
Participants, 100
interaction of, 98–99
profle, 6
PAS, see Patient Administration System
Path making, 113
Pathological patterns, 353
Patient Administration System (PAS), 159
Pearson’s correction, 317
Pergolab user test laboratory, 63
Personal data, sale and sharing of, 284–285
Personifed virtual assistants (PVAs), 269, 271
future researches, 286
personifed virtual assistants (PVAs), 271
PVAs personality, 282
qualitative phase, 274
conducting the focus groups sessions,
275–276
focus group sessions, 277–286
pre-session and groups profle, 274–275
technique and its conduction, 274
quantitative phase: online questionnaire, 272
questions and respondents’ profle,
272–273
sample and answers, 273
voice user interfaces, 270–271
PFC, see Prolonged Field Care
Physical efforts, 59–60
Physicians and pharmacists, study with, 149
Ping-Pong model, 16
POE, see Post-occupancy evaluation
Point lights, 341
Post-anesthesia care unit (PACU), 120
Post-application, 100–101
Post-occupancy evaluation (POE), 179
Post-study system usability questionnaire
(PSSUQ), 333
Pre-application, 100–101
Printed graphics, 77
Privacy, 284
Product development, 3–4, 6
Products, defned, 8
Prolonged Field Care (PFC), 128
Proxy-based approaches, 65
PSSUQ, see Post-study system usability
questionnaire
Psychophysical “old school” approach, 74
large curved display, 76
manager workstations, 76
mock-up brief, 74
mock-up erection, 79
mock-up production, 77–78
operator workstations, 76
supervisor workstations, 75–76
during the trials, 79
waste management, 79–80
PT, see Partial telemedicine
PVAs, see Personifed virtual assistants
Qualitative techniques and design, 83
application phase, 92, 100–101
collective sensemaking, 99
exploratory Focus Group application,
guidelines for, 102–103
364
Index
exploratory Focus Group pre-application,
guidelines for, 101–102
Focus Group sequences and in-depth data,
94–95
interaction, 96–98
interspersed sequencing, 94
linear sequencing, 94
participants, interaction of, 98–99
post-application phase, 92, 100–101
pre-application phase, 91–92, 100–101
problem’s exploration step, Focus Group and
design, 85–86
reports and interaction moments, 93–94
research context and Focus Group
application, 86
data documentation and analysis, 88–91
Focus Group workshops, 87–88
participants approach, 87
research scenario, 87
Quantitative phase, 272
questions and respondents’ profle, 272–273
sample and answers, 273
test participants, selection and
recruitment of, 58
remote user testing, 64
in situ and remote user testing,
comparing, 66
moderated user testing, 64
unmoderated user testing, 65
Repeatability, 350
Reproducibility, 350
Research context and Focus Group application, 86
data documentation and analysis, 88
data codifcation, 89
description narratives, 89
sequential analysis, 90
thematic analysis, 90–91
transcription, 88–89
Focus Group workshops, 87
frst moment, 88
second and third moment, 88
participants approach, 87
research scenario, 87
RL, see Reinforcement learning
RAMSIS DHM, 223–224
Reading Span, 26
Realization, 113–114
Real lighting, 341
Reinforcement learning (RL), 252
REM (hierarchical requirements extraction
method), 47
background and purpose, 47–48
cafe as an example of, 52
desk lamp as an example of, 51
example of application of, 50–51
observation, 49–50
proposed method, 48–49
structure of, 48
Remote context, user experience in, 291
pandemic period, context in, 292–295
strategies for conducting user experience
studies in the context of a pandemic,
295–297
survey of perceptual aspects of users of
digital platforms for remote activities,
297–299
usability, user experience and user
context, 292
Remote usability testing, 57
preparing and conducting user test, 58
choice of measures, 59
preparation of the test material and the
test environment, 63
presentation and communication of test
results, 64
task scenarios, defnition of, 59
test objectives, defnition of, 58
SAM, see Self-Assessment Manikin
SANTOS, 226–227
SARS-CoV-2 virus, 198, 291
Satisfaction, 5
Scanpath, 60
Scope plane, 139
SCT, see Sentence Completion Test
SDT scale, see Self-determination theory scale
Self-Assessment Manikin (SAM), 333
Self-determination theory (SDT) scale, 29
Self-effcacy, 27–30
Senior Responsible Offcer Role (SRO), 159
Sentence Completion Test (SCT), 38, 40
Sequential analysis, 90
Server-based approaches, 65
SIEMENS JACK, 223–224
Skeleton plane, 139
Smart or intelligent product, 9
Smartphones, 25
Smart product, defned, 9
Smart Products Consortium (SPC), 9
Social behavior and other impacts, 283
Social rules of voice interaction, 283
Social systems, 108
Spatial ability, 24–25
differences, 25
measures, 25
SPC, see Smart Products Consortium
Spotify, algorithms implemented by, 258–260
Spotlights, 341
SRO, see Senior Responsible Offcer Role
Standard deviation, 44
Stevens-Johnson syndrome, 121
365
Index
Strategy plane, 139, 140
Structure plane, 139
Supervised learning, 252
Supervisor workstation, 75–77
“ftting trials” of, 80
Surface plane, 139
SUS, see System usability scale
System diagram, UX
background, 51
example of application of, 54–55
proposed method, 52–54
System usability scale (SUS), 333
Target market, 6
Task status, 59
Technology Experience Questionnaire, 26
Telemedicine prolonged feld care (TelePFC), 128
design, 129
methods, 130
data analysis, 132
randomization block design strategy, 131
recruitment, 130
scheduling strategy and requirements of
subjects, 131
simulation tests and analysis, 131
subject, telementor, proctor and roleplayer orientation, 131
TelePFC, see Telemedicine prolonged feld care
TENS, see Toxic epidermal necrolysis
Thematic analysis, 90–91
Thermography method, 305
Thomson Consumer Electronics, 4
3D printing, 204
Time on task, 59
Touch screens, 6
Toxic epidermal necrolysis (TENS), 121
Transcription, 88–89
Tube lights, 341
UCC, see User-centred change
UCD process, see User-Centred Design process
Unmoderated user testing, 65
Unsupervised learning, 252
Usability
defned, 199
evaluation model, 12–18
taxonomy of, 14
testing, 103n3
Usability-UX task analysis, 38, 39
analysis of the data, 44
average, standard deviation, 44
formal concept analysis (FCA), 45–47
multiple regression analysis, 44
background and purpose, 38
example of the application of, 40–47
of a mechanical pencil, 42
proposed method, 38–40
structuring of the data, 43–44
of a web screen, 41
“Use and comfort” trials, 80
Usefulness of the product, 5
User, focusing on, 5–7
User-centred change (UCC), 107, 110–113
acceptance as a multifaceted
phenomenon, 110
change processes and the human
factor, 109
digitalization, 108–109
four phases of, 112
evaluation, 114
insight, 113
path making, 113
realization, 113–114
User-Centred Design (UCD) process, 111, 113
User verbalizations, 62
VAs, see Virtual assistants
Videoconferencing tools, 64
Virtual assistants (VAs), 269–270
Virtual reality (VR), 204
interfaces, 222
in UX measures, 335–336
Virtual Silcton, 25
Voice interaction, social rules of, 283
Voice’s gender, 284
Voice user interfaces (VUI), 269–271
VR, see Virtual reality
VUI, see Voice user interfaces
Waste management, 79–80
Web link, 60
WEF, see World Economic Forum
Working memory capacity, 25–26
Workstations, 78
World Economic Forum (WEF), 197
Written and oral comments, 62