/


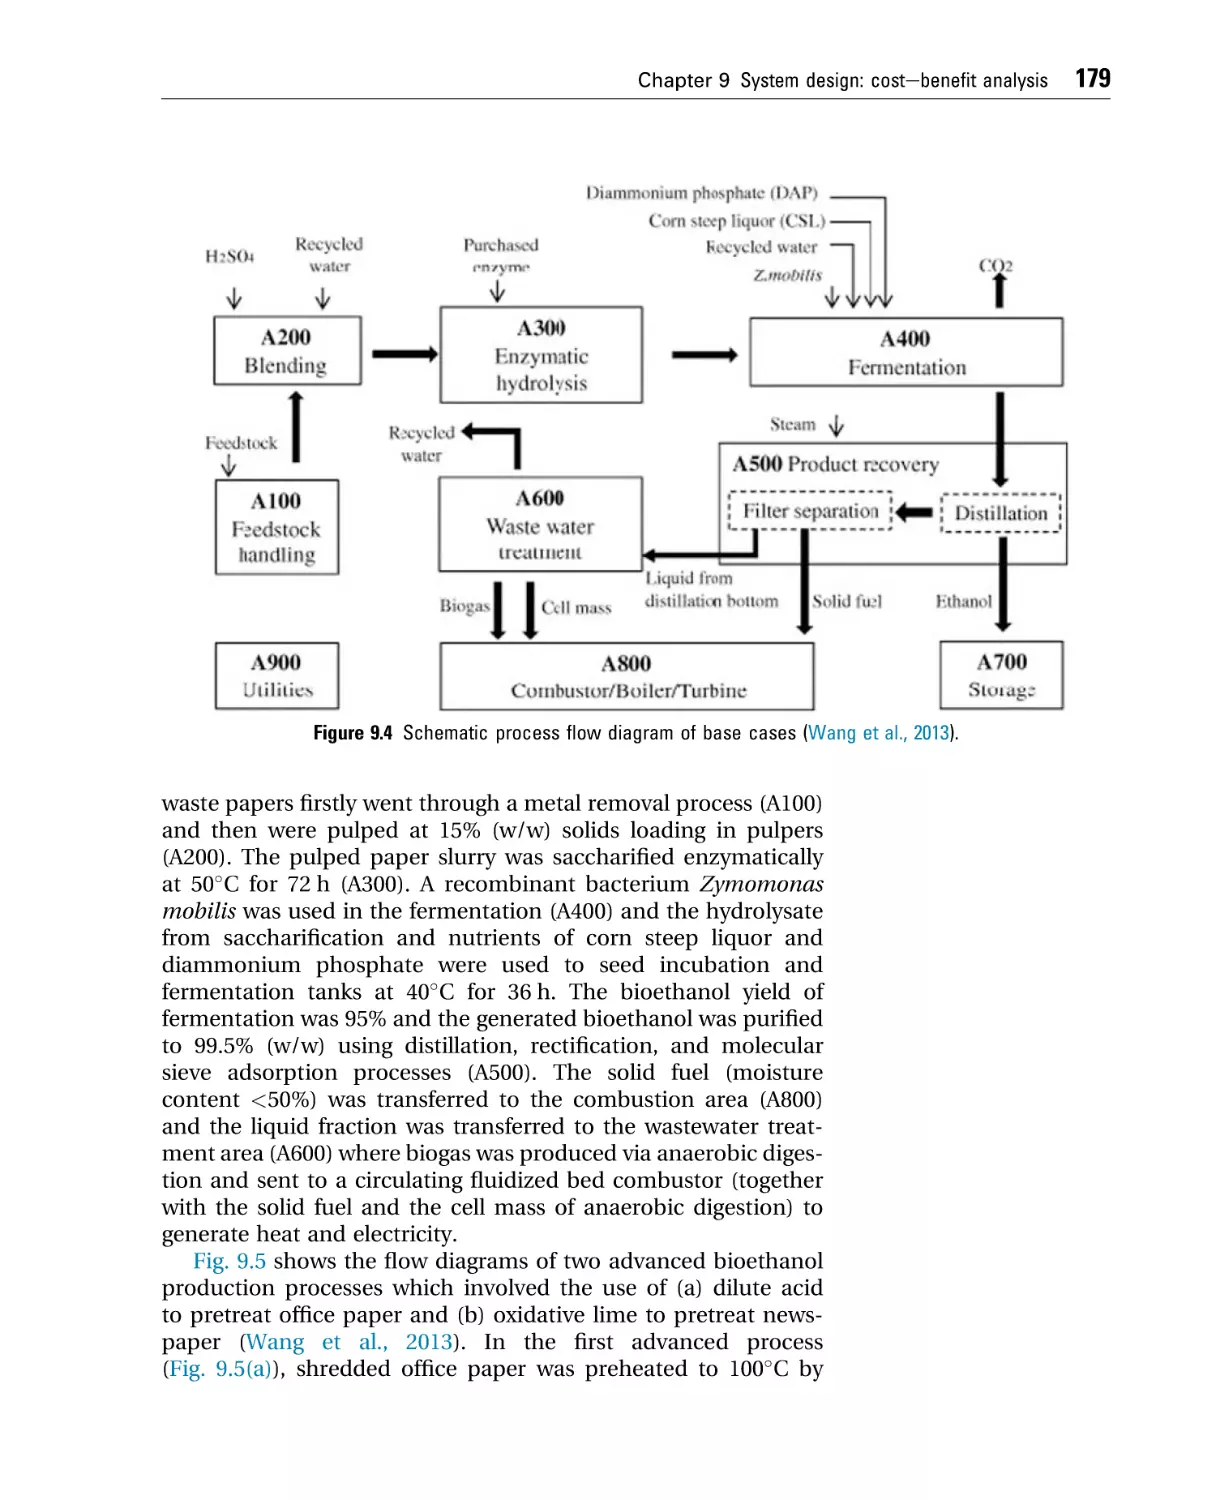


Similar


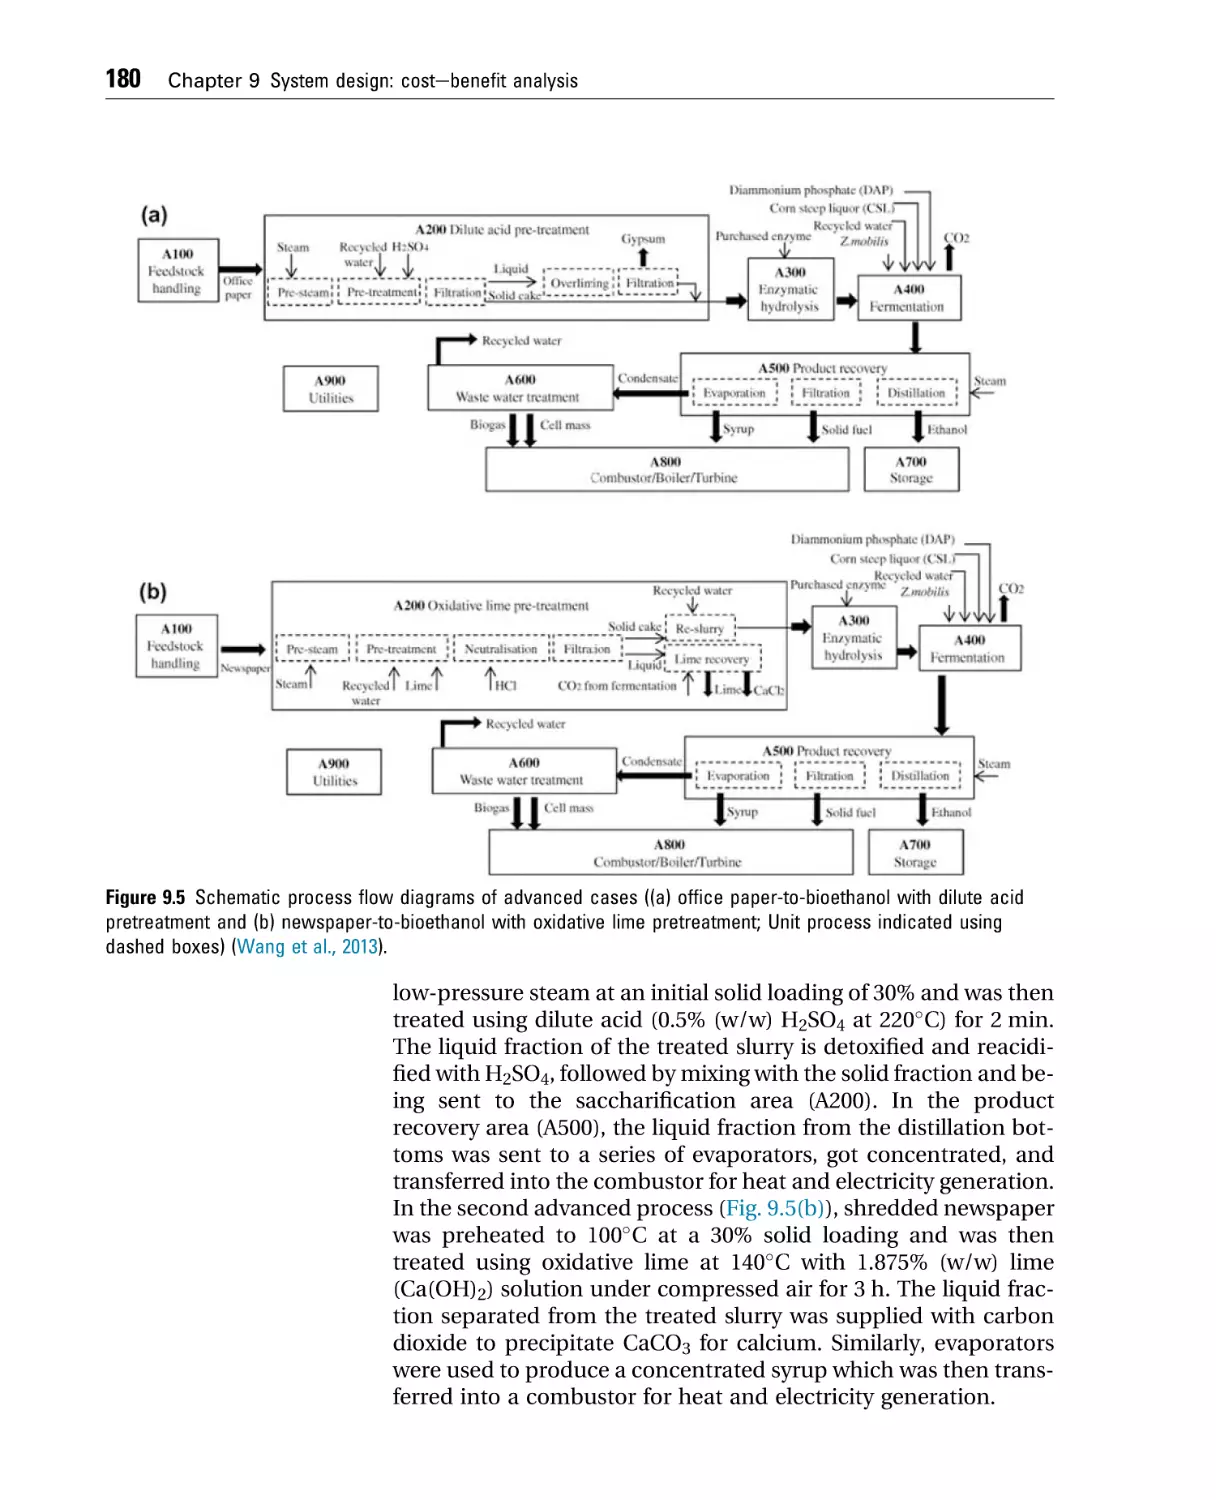
Text
WASTE-TO-RESOURCE
SYSTEM DESIGN FOR
LOW-CARBON
CIRCULAR ECONOMY
This page intentionally left blank
WASTE-TO-RESOURCE
SYSTEM DESIGN FOR
LOW-CARBON
CIRCULAR ECONOMY
SIMING YOU
James Watt School of Engineering, University of Glasgow, Glasgow, United Kingdom
Elsevier
Radarweg 29, PO Box 211, 1000 AE Amsterdam, Netherlands
The Boulevard, Langford Lane, Kidlington, Oxford OX5 1GB, United Kingdom
50 Hampshire Street, 5th Floor, Cambridge, MA 02139, United States
Copyright Ó 2022 Elsevier Inc. All rights reserved.
No part of this publication may be reproduced or transmitted in any form or by any
means, electronic or mechanical, including photocopying, recording, or any
information storage and retrieval system, without permission in writing from the
publisher. Details on how to seek permission, further information about the
Publisher’s permissions policies and our arrangements with organizations such as the
Copyright Clearance Center and the Copyright Licensing Agency, can be found at our
website: www.elsevier.com/permissions.
This book and the individual contributions contained in it are protected under
copyright by the Publisher (other than as may be noted herein).
Notices
Knowledge and best practice in this field are constantly changing. As new research
and experience broaden our understanding, changes in research methods,
professional practices, or medical treatment may become necessary.
Practitioners and researchers must always rely on their own experience and
knowledge in evaluating and using any information, methods, compounds, or
experiments described herein. In using such information or methods they should be
mindful of their own safety and the safety of others, including parties for whom they
have a professional responsibility.
To the fullest extent of the law, neither the Publisher nor the authors, contributors, or
editors, assume any liability for any injury and/or damage to persons or property as a
matter of products liability, negligence or otherwise, or from any use or operation of
any methods, products, instructions, or ideas contained in the material herein.
Library of Congress Cataloging-in-Publication Data
A catalog record for this book is available from the Library of Congress
British Library Cataloguing-in-Publication Data
A catalogue record for this book is available from the British Library
ISBN: 978-0-12-822681-0
For information on all Elsevier publications visit our website at
https://www.elsevier.com/books-and-journals
Publisher: Susan Dennis
Editorial Project Manager: Hilary Carr
Production Project Manager: R.Vijay Bharath
Cover Designer: Christian J. Bilbow
Typeset by TNQ Technologies
Contents
Chapter 1 The waste challenge. . . . . . . . . . . . . . . . . . . . . . . . . . . . . . . . . . . . . . . . . . 1
1. Introduction . . . . . . . . . . . . . . . . . . . . . . . . . . . . . . . . . . . . . . . . . . . . . . . . . 1
References . . . . . . . . . . . . . . . . . . . . . . . . . . . . . . . . . . . . . . . . . . . . . . . . . . . 7
Chapter 2 Waste . . . . . . . . . . . . . . . . . . . . . . . . . . . . . . . . . . . . . . . . . . . . . . . . . . . . . . . . . 9
1.
2.
3.
4.
5.
6.
Introduction . . . . . . . . . . . . . . . . . . . . . . . . . . . . . . . . . . . . . . . . . . . . . . . . . 9
Agricultural waste . . . . . . . . . . . . . . . . . . . . . . . . . . . . . . . . . . . . . . . . . . 10
Municipal solid waste . . . . . . . . . . . . . . . . . . . . . . . . . . . . . . . . . . . . . . 12
Properties. . . . . . . . . . . . . . . . . . . . . . . . . . . . . . . . . . . . . . . . . . . . . . . . . . . 13
Waste-to-resource . . . . . . . . . . . . . . . . . . . . . . . . . . . . . . . . . . . . . . . . . . 16
Rural waste management . . . . . . . . . . . . . . . . . . . . . . . . . . . . . . . . . . 17
References . . . . . . . . . . . . . . . . . . . . . . . . . . . . . . . . . . . . . . . . . . . . . . . . . . 17
Chapter 3 Waste-to-energy . . . . . . . . . . . . . . . . . . . . . . . . . . . . . . . . . . . . . . . . . . . . . 21
1.
2.
3.
4.
5.
Introduction . . . . . . . . . . . . . . . . . . . . . . . . . . . . . . . . . . . . . . . . . . . . . . . . 21
Incineration . . . . . . . . . . . . . . . . . . . . . . . . . . . . . . . . . . . . . . . . . . . . . . . . . 22
Pyrolysis. . . . . . . . . . . . . . . . . . . . . . . . . . . . . . . . . . . . . . . . . . . . . . . . . . . . 28
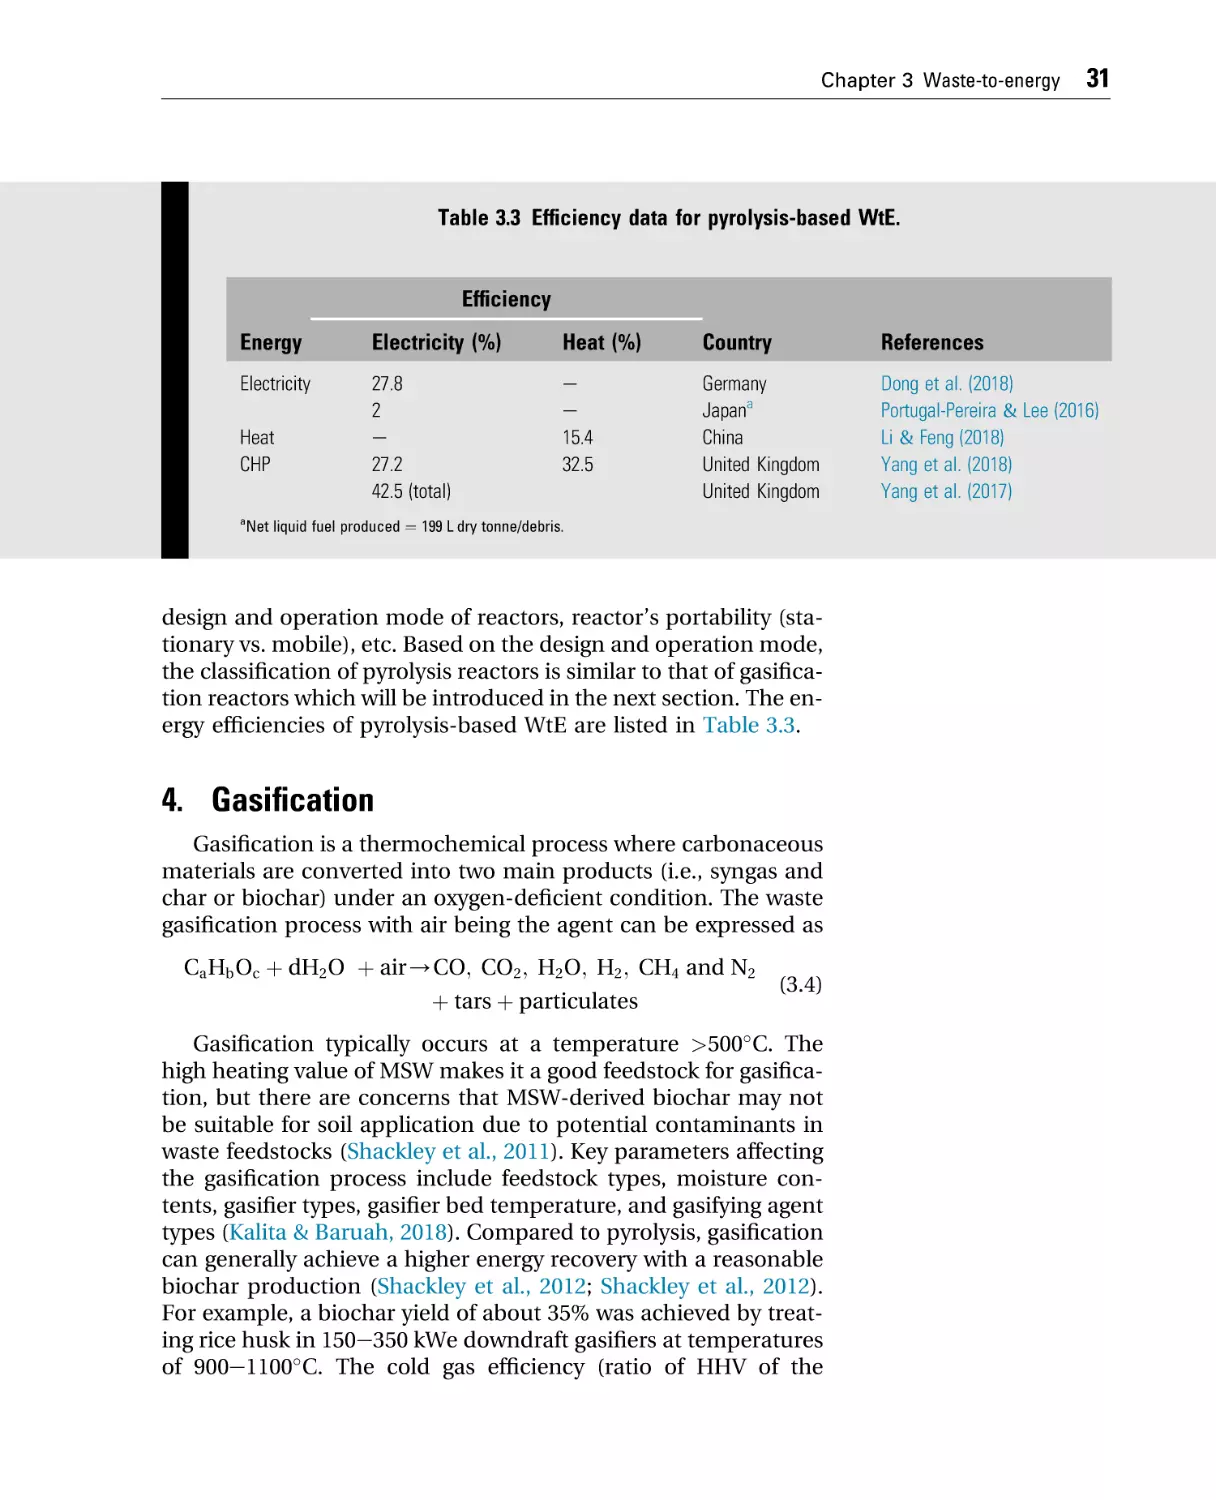
Gasification . . . . . . . . . . . . . . . . . . . . . . . . . . . . . . . . . . . . . . . . . . . . . . . . . 31
Anaerobic digestion . . . . . . . . . . . . . . . . . . . . . . . . . . . . . . . . . . . . . . . . 37
References . . . . . . . . . . . . . . . . . . . . . . . . . . . . . . . . . . . . . . . . . . . . . . . . . . 41
Chapter 4 Waste-to-biohydrogen. . . . . . . . . . . . . . . . . . . . . . . . . . . . . . . . . . . . . . . . 47
1. Introduction . . . . . . . . . . . . . . . . . . . . . . . . . . . . . . . . . . . . . . . . . . . . . . . . 47
2. Biohydrogen production technologies. . . . . . . . . . . . . . . . . . . . . . 48
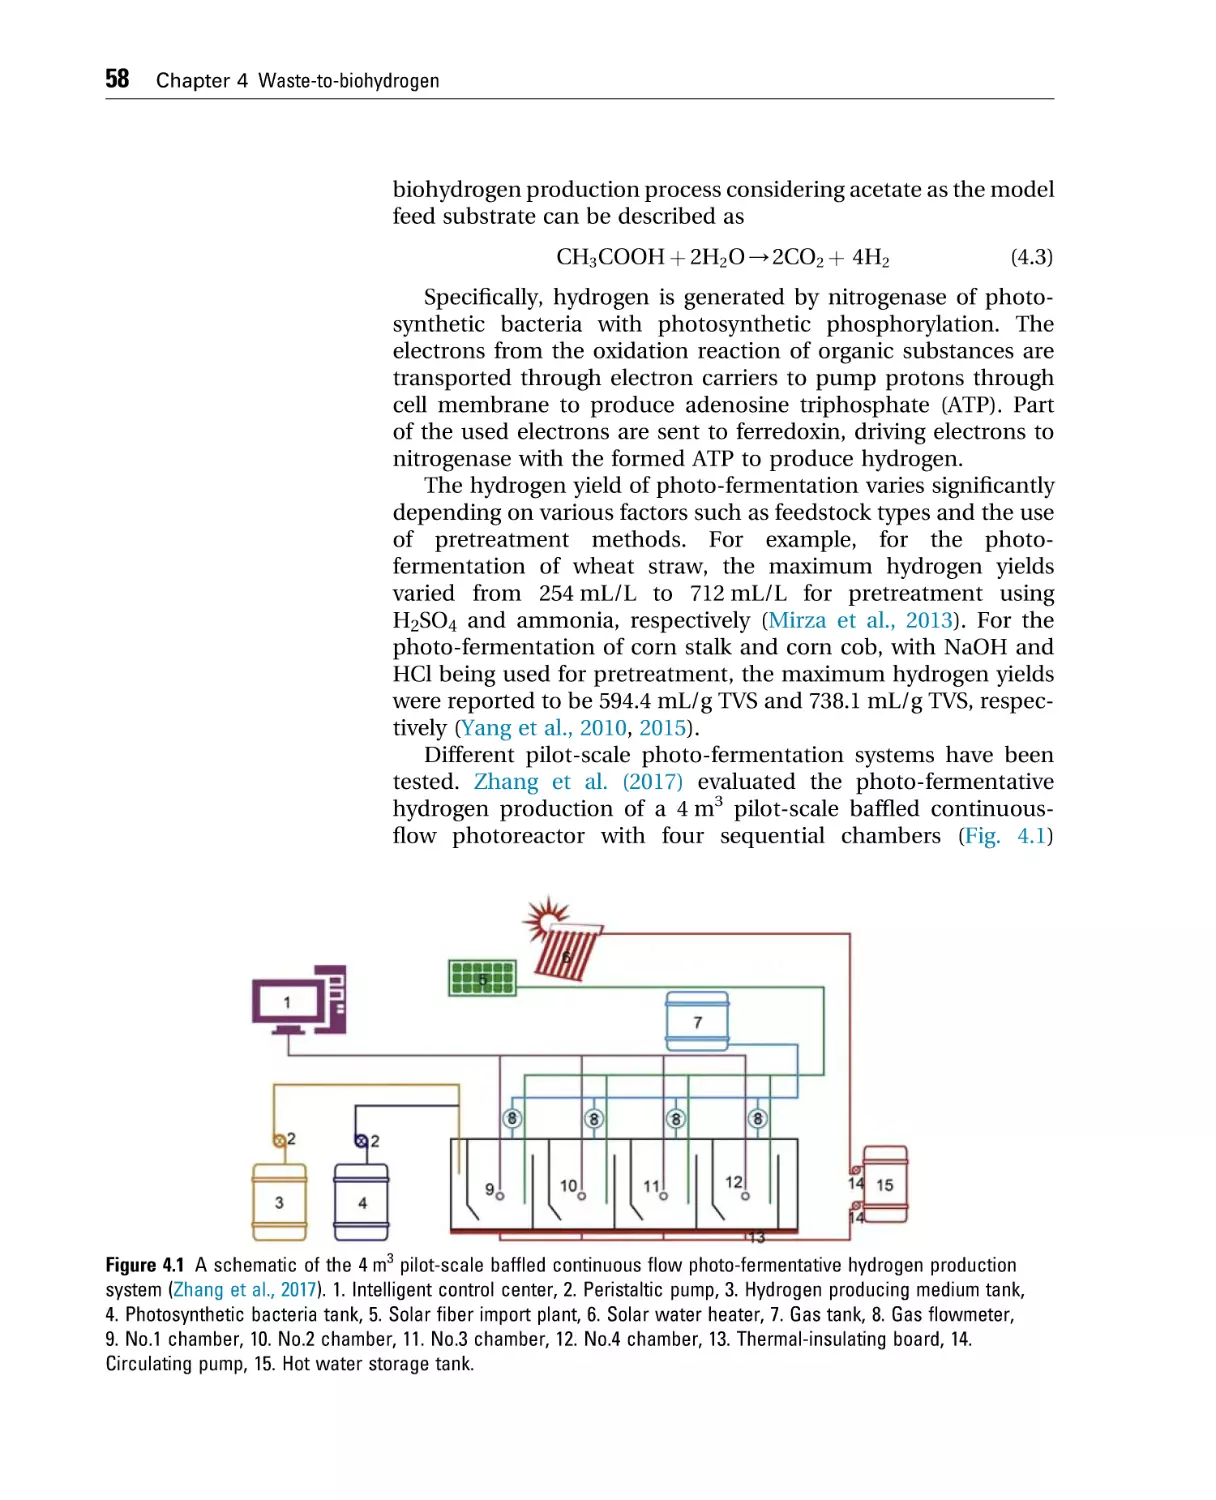
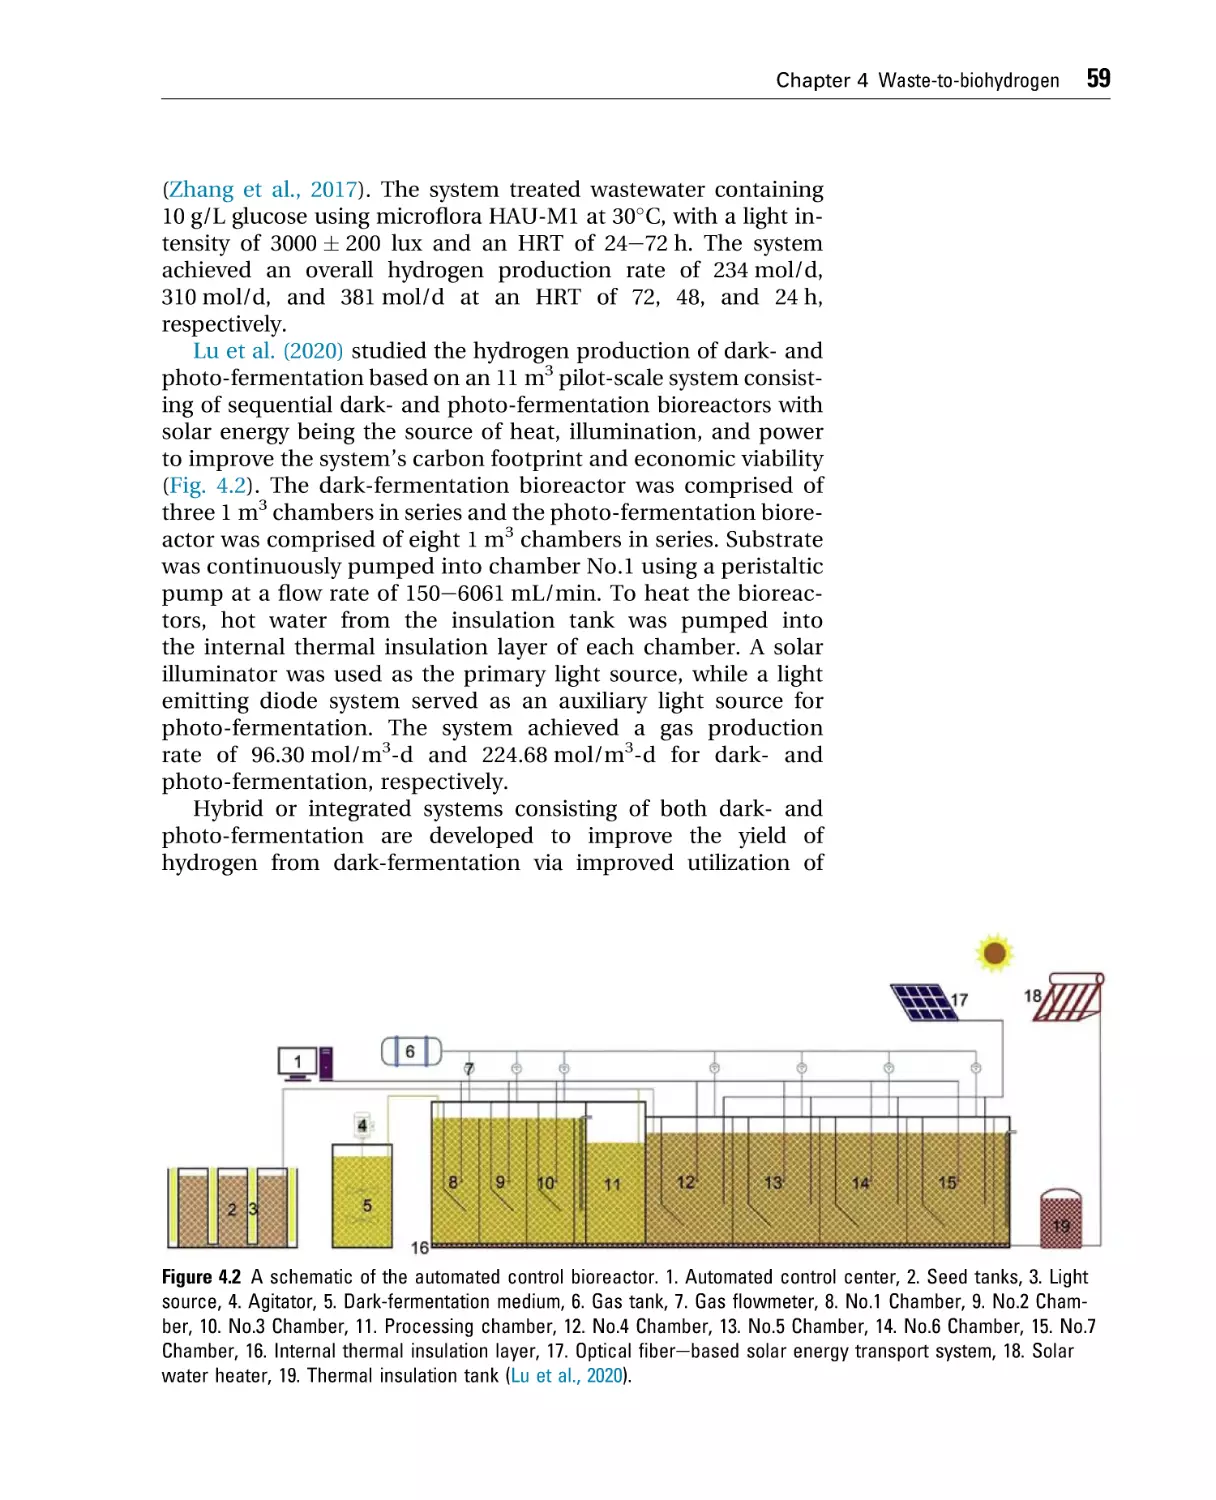
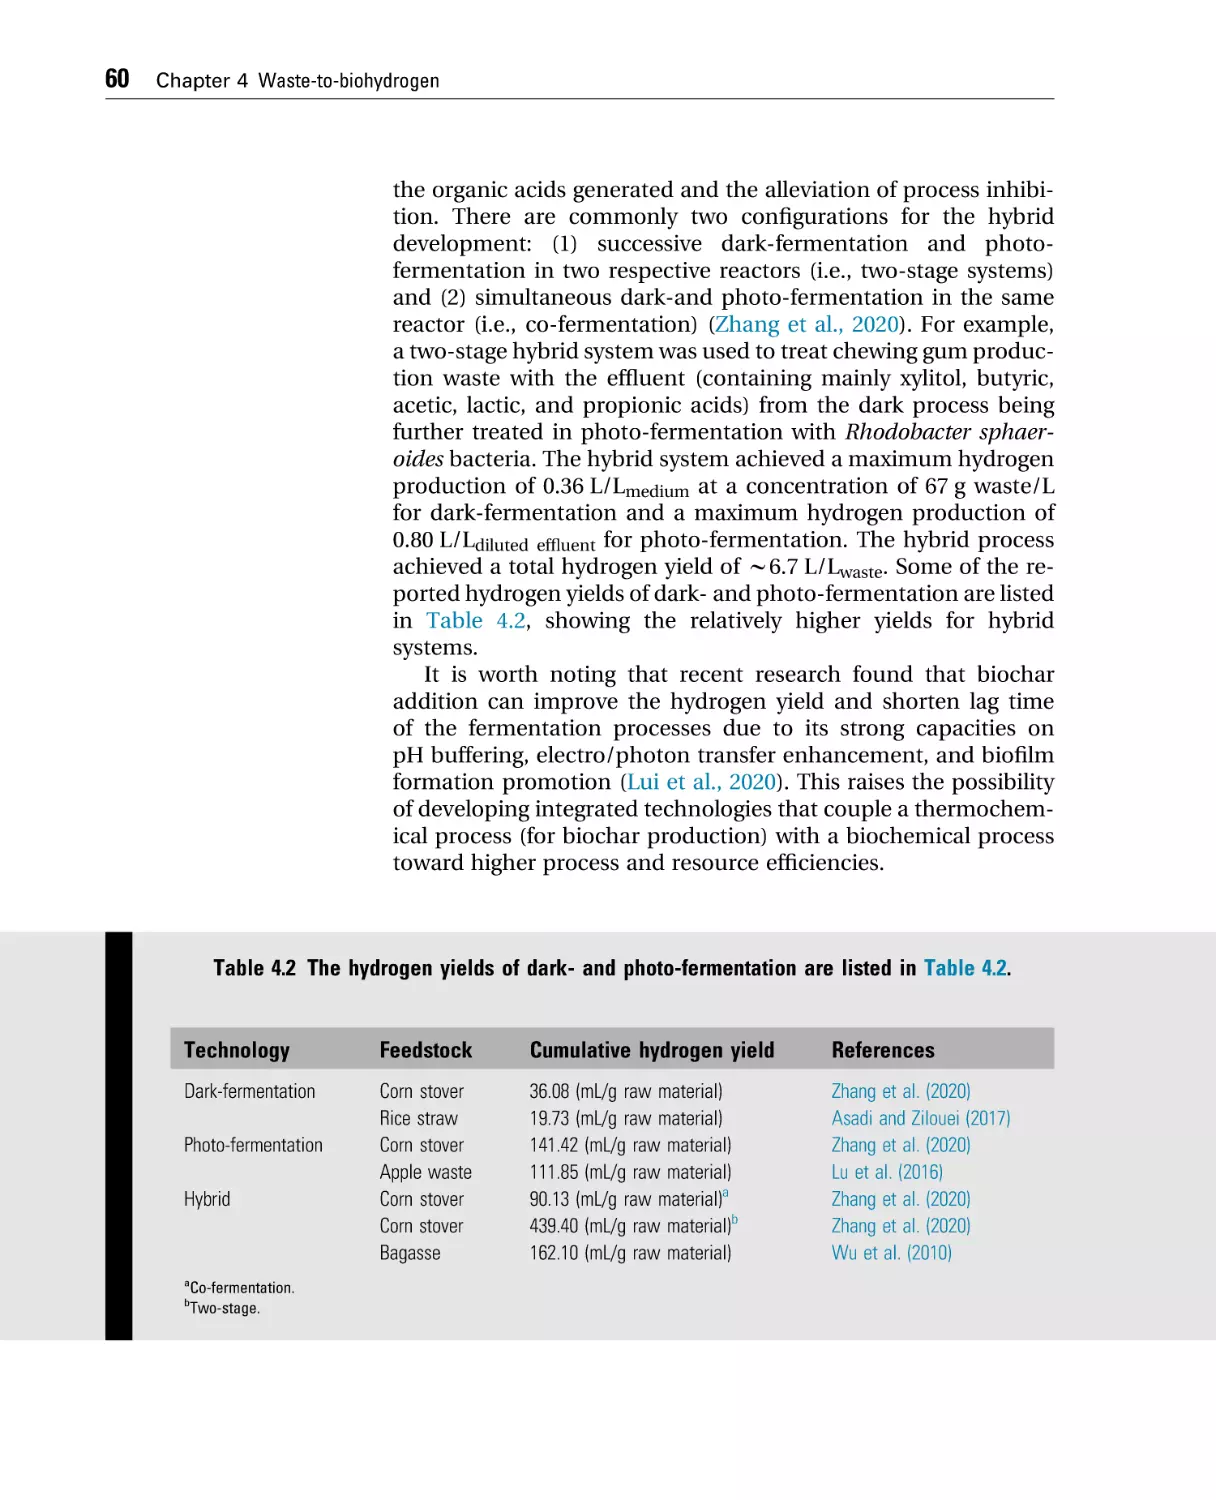
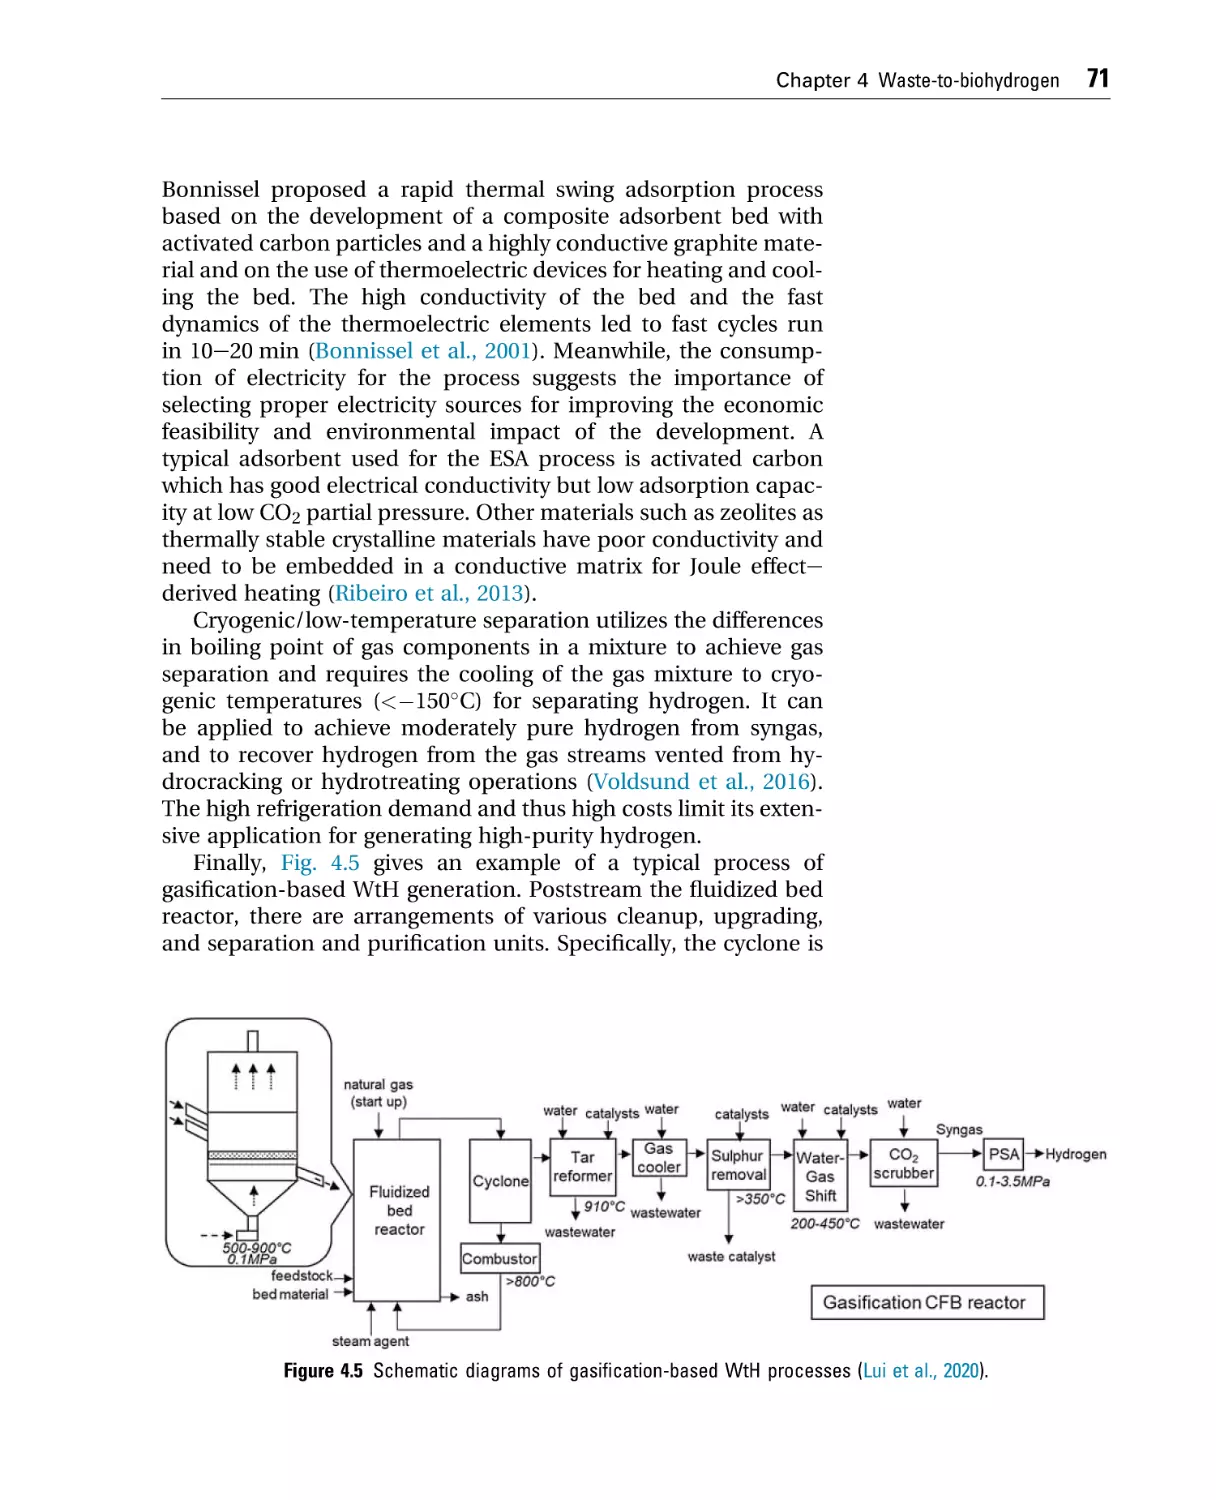
3. Downstream processes. . . . . . . . . . . . . . . . . . . . . . . . . . . . . . . . . . . . . 61
References . . . . . . . . . . . . . . . . . . . . . . . . . . . . . . . . . . . . . . . . . . . . . . . . . . 72
vi
Contents
Chapter 5 Waste-to-biomethane . . . . . . . . . . . . . . . . . . . . . . . . . . . . . . . . . . . . . . . . 77
1. Introduction . . . . . . . . . . . . . . . . . . . . . . . . . . . . . . . . . . . . . . . . . . . . . . . . 77
2. Biogas production . . . . . . . . . . . . . . . . . . . . . . . . . . . . . . . . . . . . . . . . . . 77
3. Biogas cleanup and upgrading . . . . . . . . . . . . . . . . . . . . . . . . . . . . . 82
References . . . . . . . . . . . . . . . . . . . . . . . . . . . . . . . . . . . . . . . . . . . . . . . . . . 96
Further reading . . . . . . . . . . . . . . . . . . . . . . . . . . . . . . . . . . . . . . . . . . . . . 99
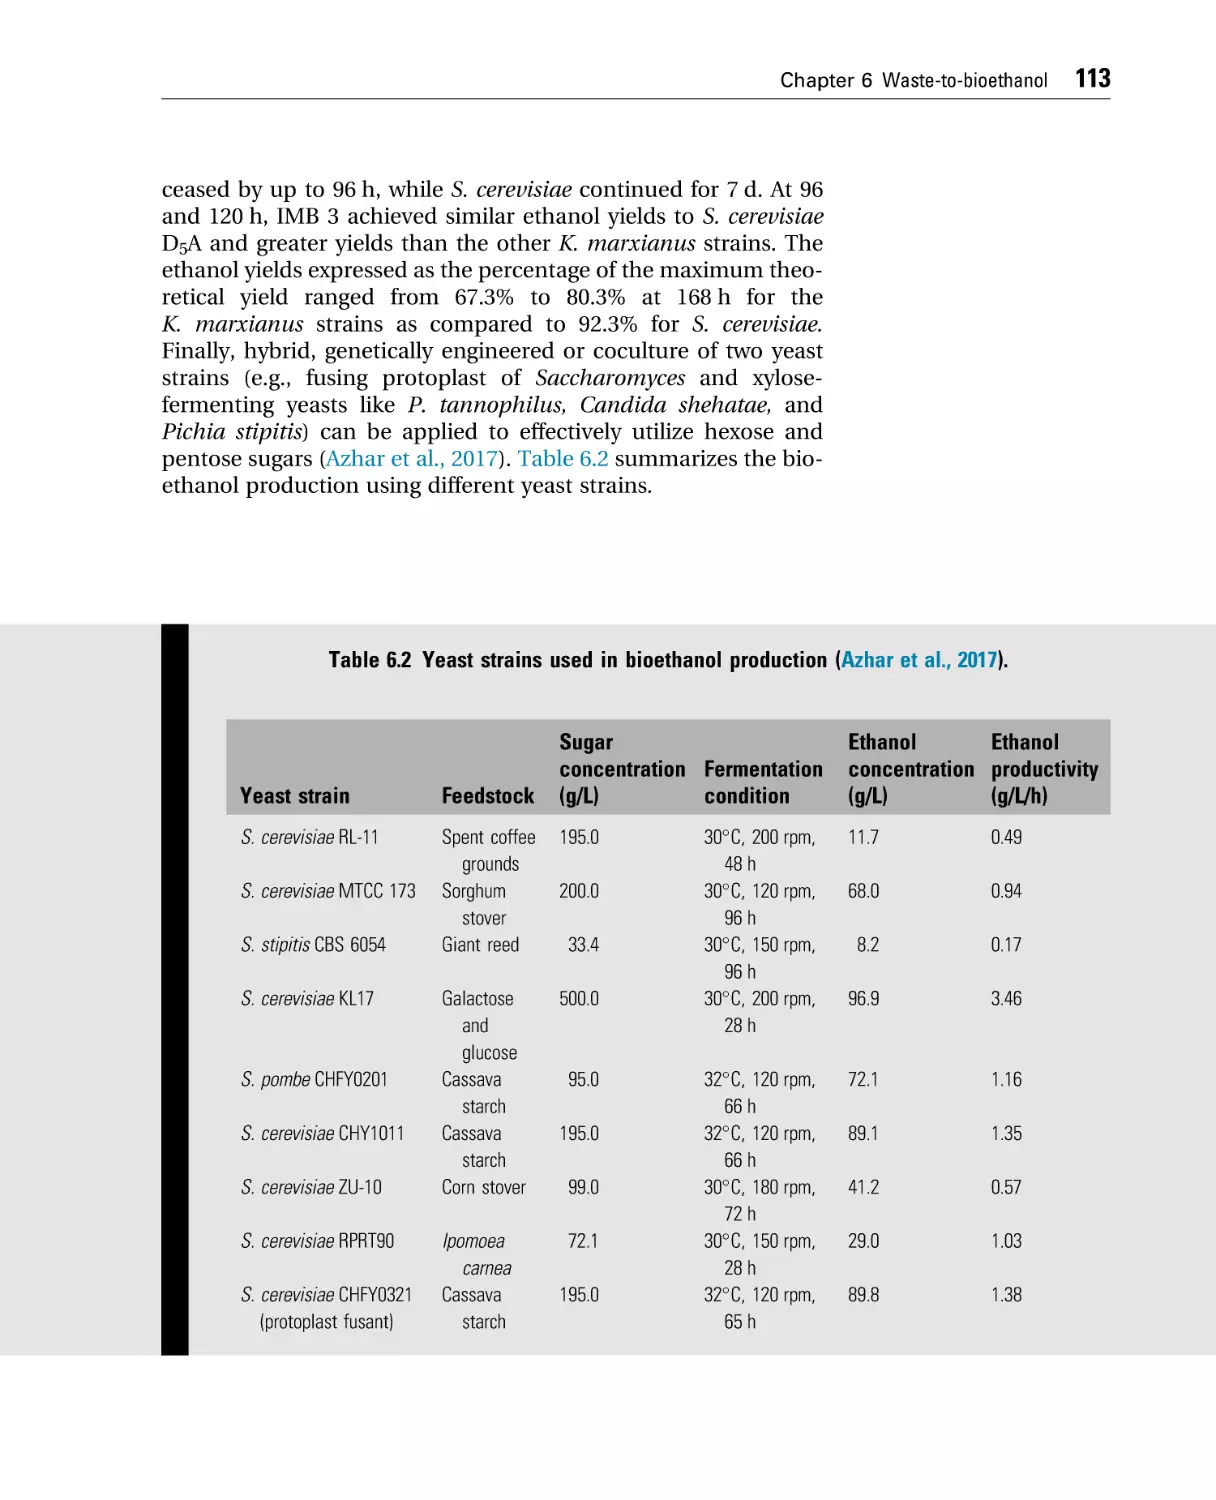
Chapter 6 Waste-to-bioethanol . . . . . . . . . . . . . . . . . . . . . . . . . . . . . . . . . . . . . . . . 101
1.
2.
3.
4.
5.
Introduction . . . . . . . . . . . . . . . . . . . . . . . . . . . . . . . . . . . . . . . . . . . . . .
Saccharification and fermentation . . . . . . . . . . . . . . . . . . . . . . . .
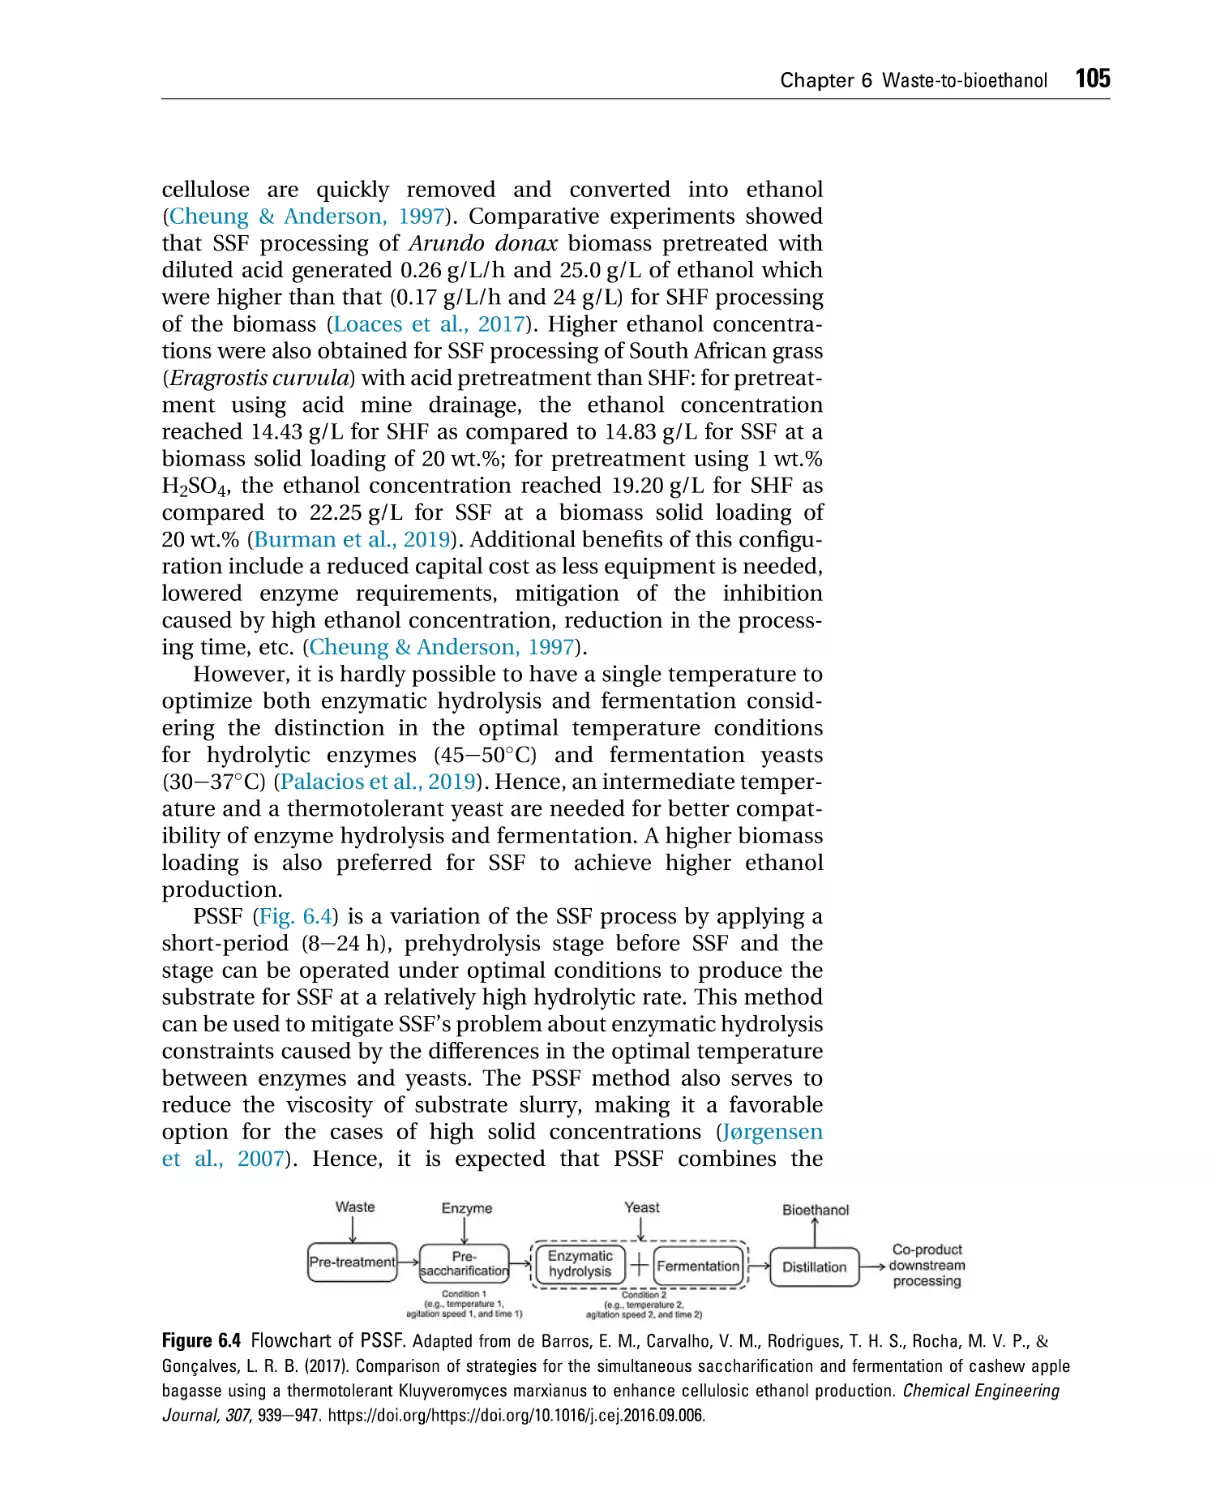
Pretreatment. . . . . . . . . . . . . . . . . . . . . . . . . . . . . . . . . . . . . . . . . . . . . .
Yeasts . . . . . . . . . . . . . . . . . . . . . . . . . . . . . . . . . . . . . . . . . . . . . . . . . . . .
Further development . . . . . . . . . . . . . . . . . . . . . . . . . . . . . . . . . . . . .
References . . . . . . . . . . . . . . . . . . . . . . . . . . . . . . . . . . . . . . . . . . . . . . . .
101
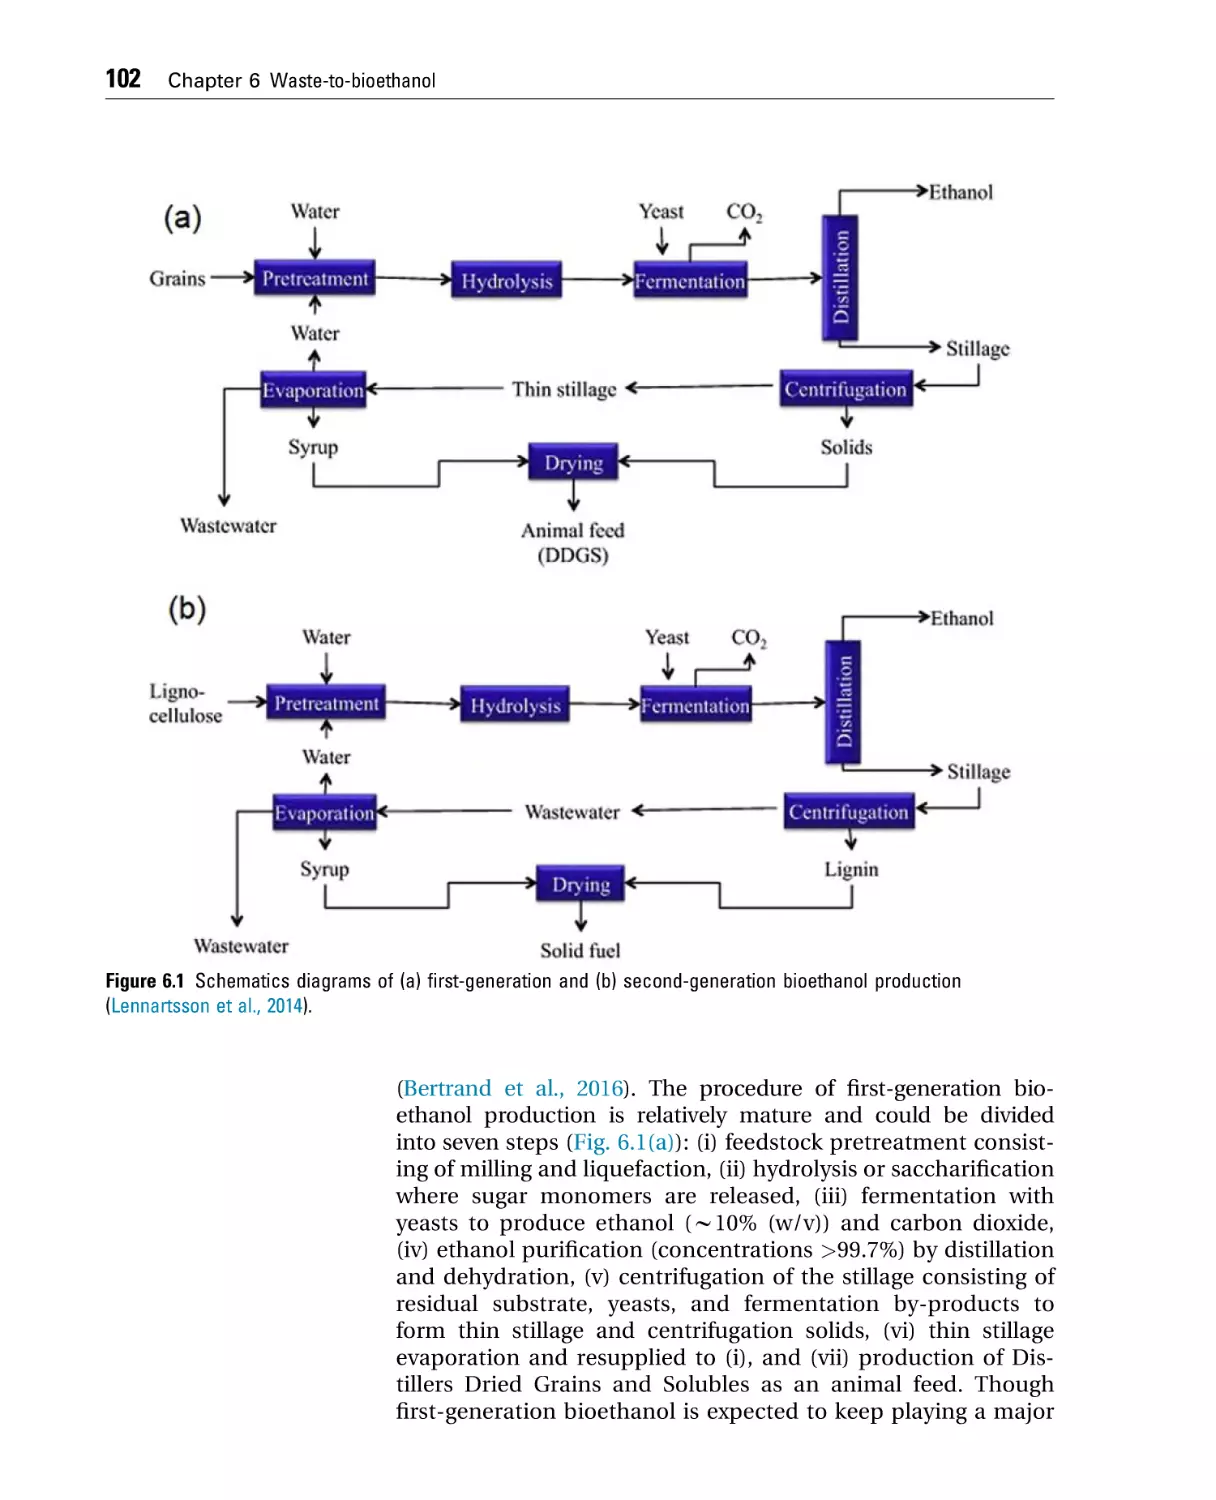
103
108
111
114
115
Chapter 7 Waste-to-biodiesel . . . . . . . . . . . . . . . . . . . . . . . . . . . . . . . . . . . . . . . . . . 119
1.
2.
3.
4.
5.
6.
Introduction . . . . . . . . . . . . . . . . . . . . . . . . . . . . . . . . . . . . . . . . . . . . . .
Biodiesel properties . . . . . . . . . . . . . . . . . . . . . . . . . . . . . . . . . . . . . .
Biodiesel classification . . . . . . . . . . . . . . . . . . . . . . . . . . . . . . . . . . .
Biodiesel impacts on soil and water . . . . . . . . . . . . . . . . . . . . . .
Biodiesel production. . . . . . . . . . . . . . . . . . . . . . . . . . . . . . . . . . . . . .
Whole process. . . . . . . . . . . . . . . . . . . . . . . . . . . . . . . . . . . . . . . . . . . .
References . . . . . . . . . . . . . . . . . . . . . . . . . . . . . . . . . . . . . . . . . . . . . . . .
119
120
122
124
125
131
133
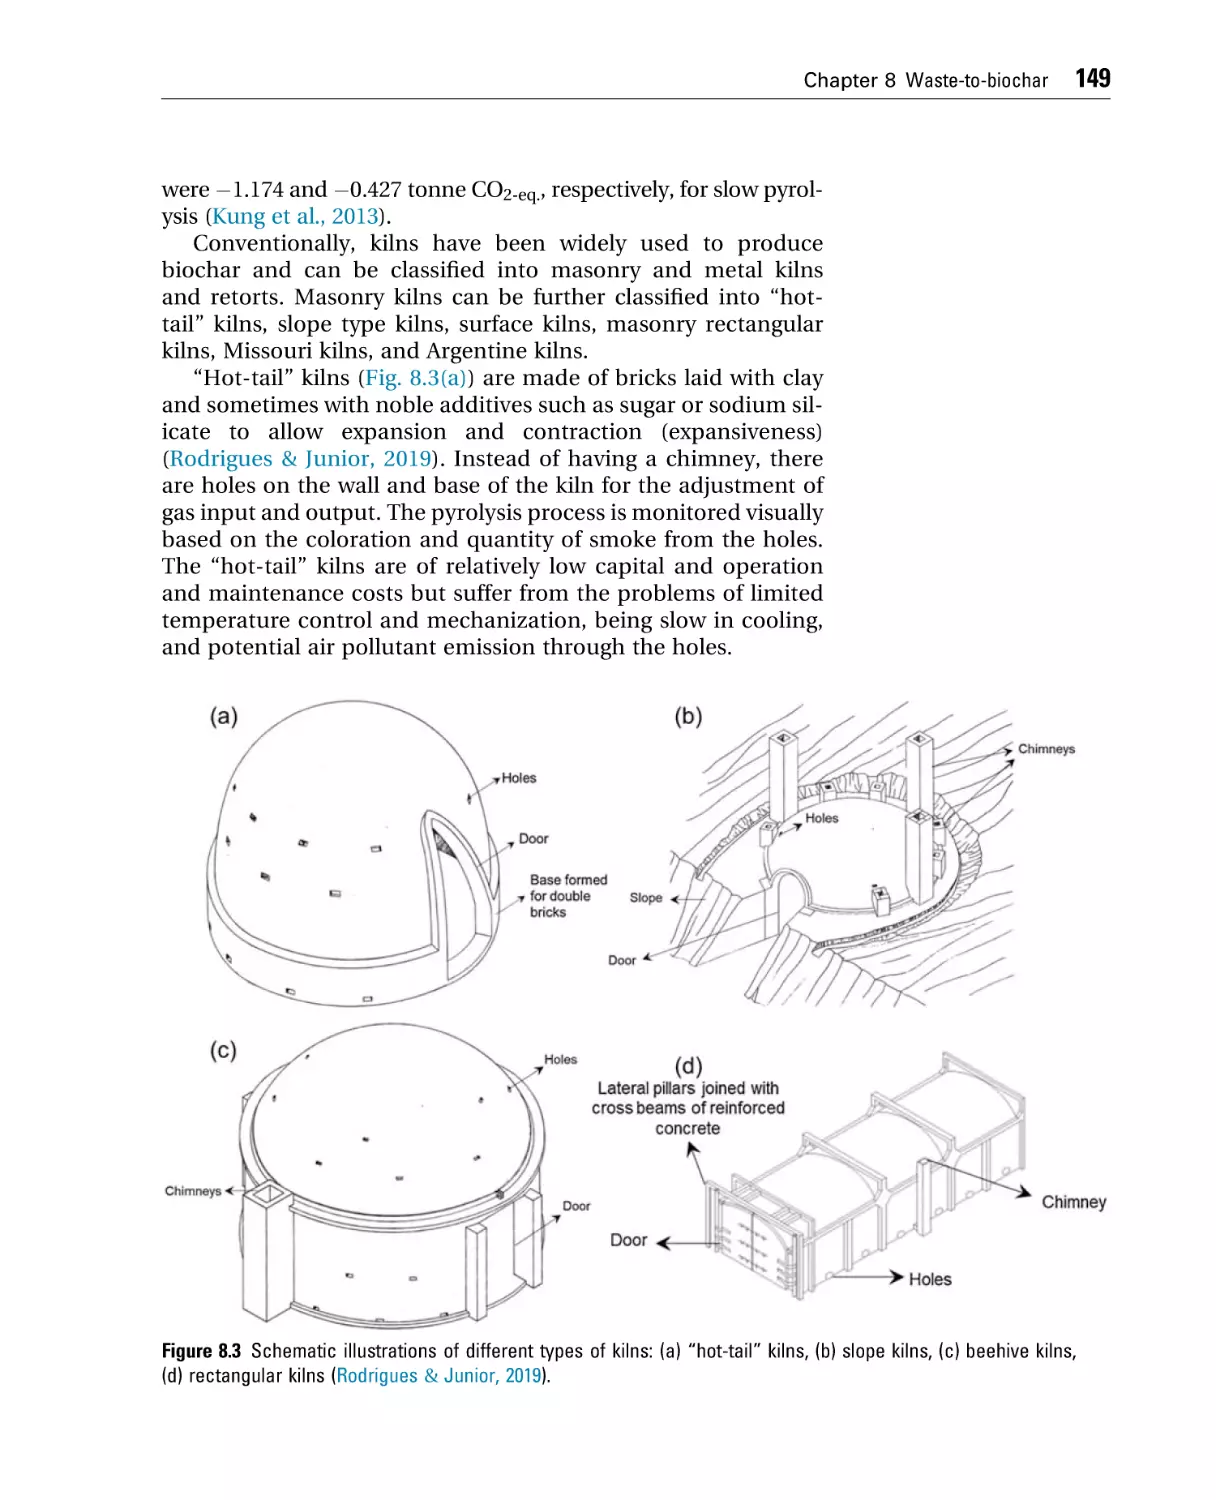
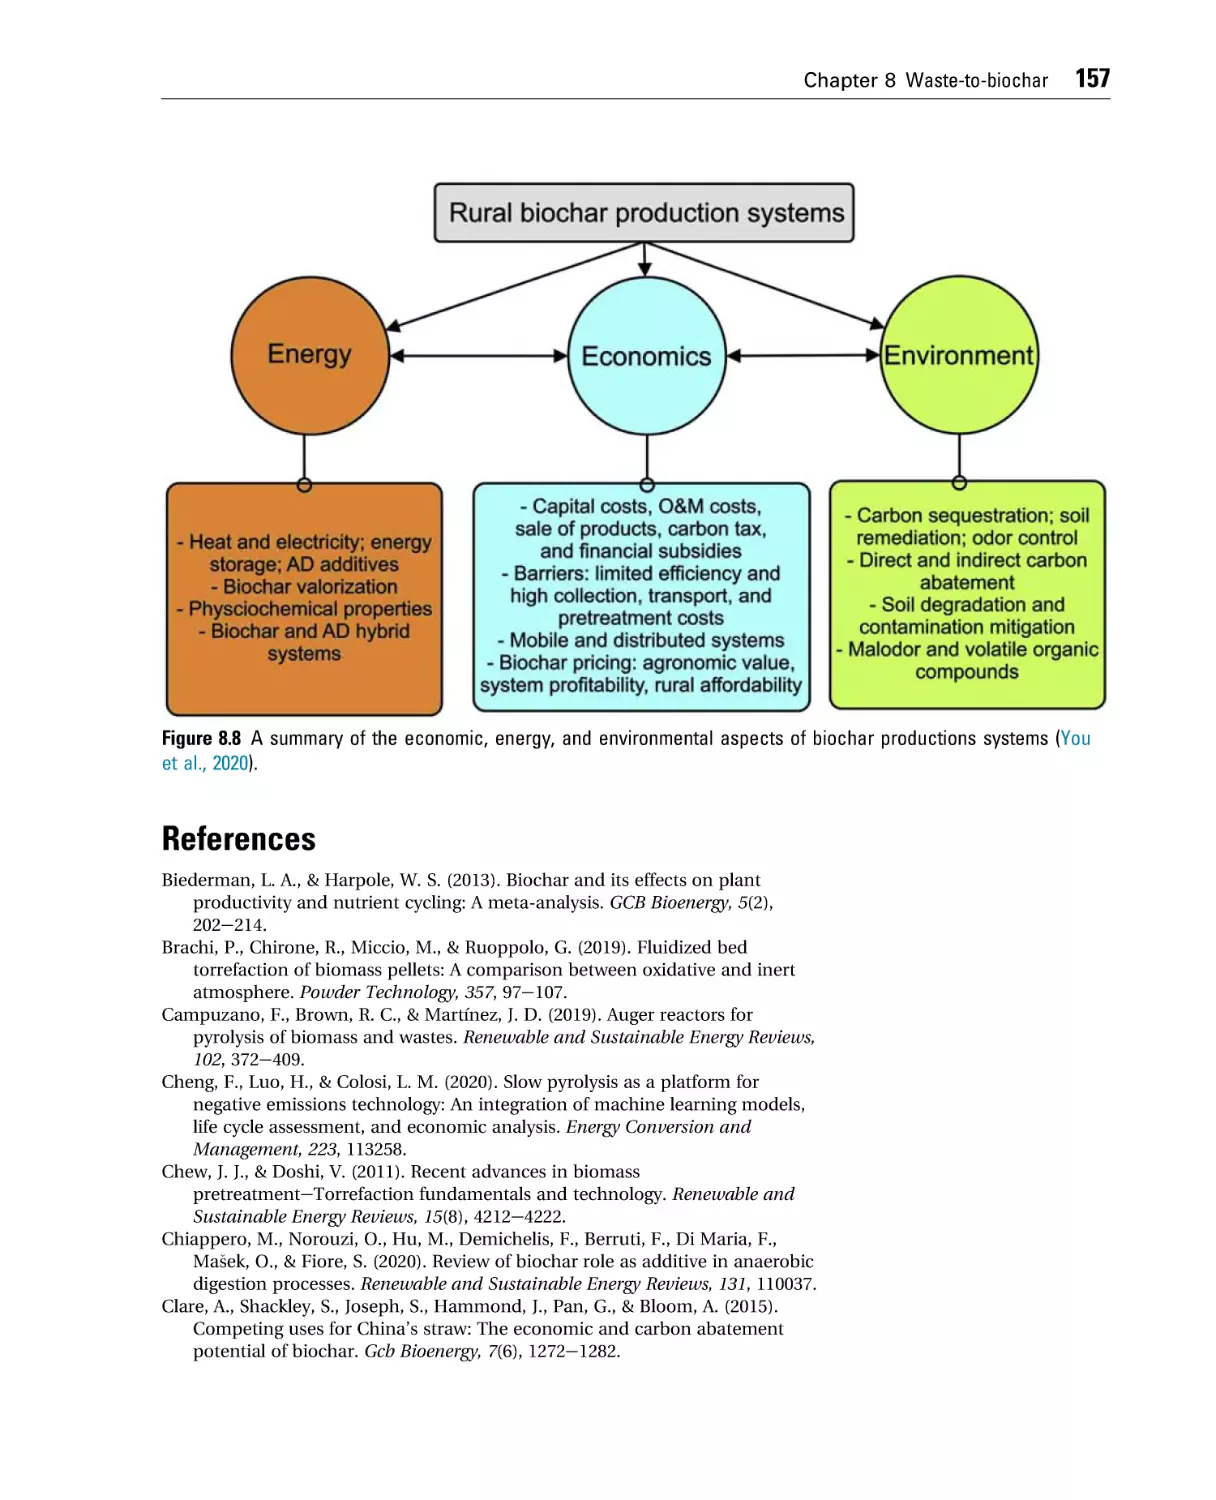
Chapter 8 Waste-to-biochar . . . . . . . . . . . . . . . . . . . . . . . . . . . . . . . . . . . . . . . . . . . 137
1. Introduction . . . . . . . . . . . . . . . . . . . . . . . . . . . . . . . . . . . . . . . . . . . . . .
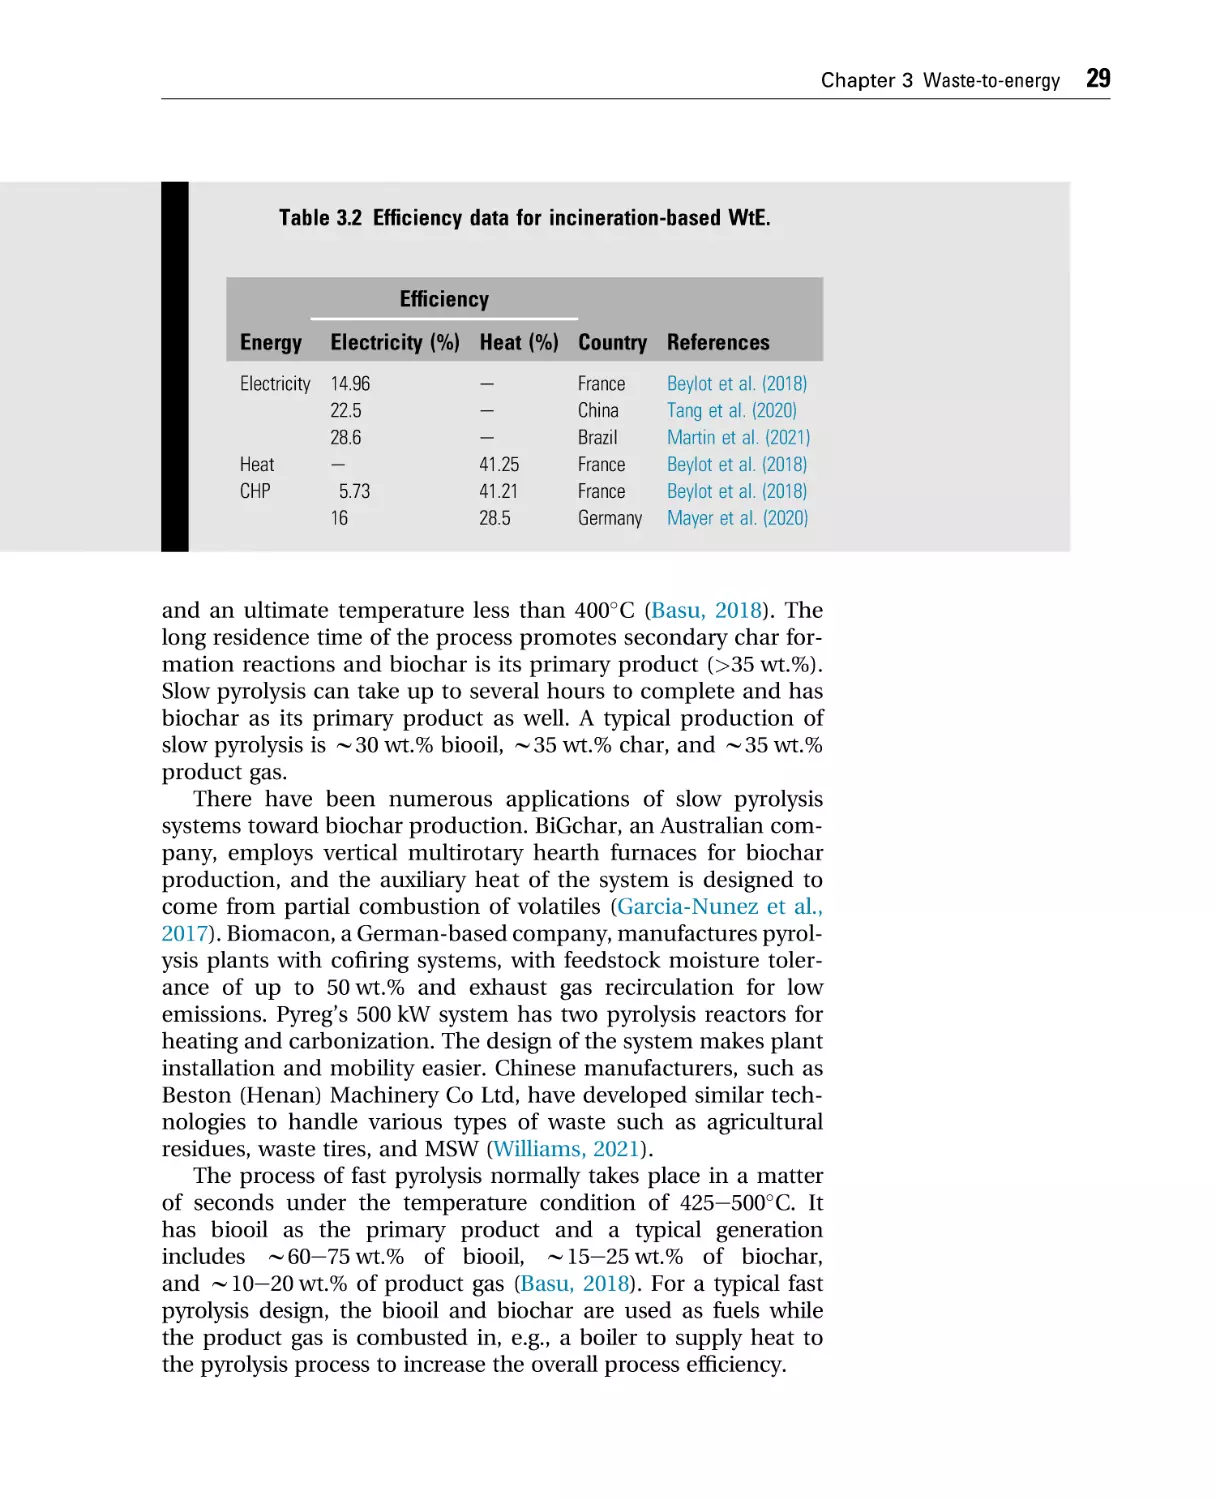
2. Waste-to-biochar technologies . . . . . . . . . . . . . . . . . . . . . . . . . . .
3. Biochar system design . . . . . . . . . . . . . . . . . . . . . . . . . . . . . . . . . . .
References . . . . . . . . . . . . . . . . . . . . . . . . . . . . . . . . . . . . . . . . . . . . . . . .
137
141
156
157
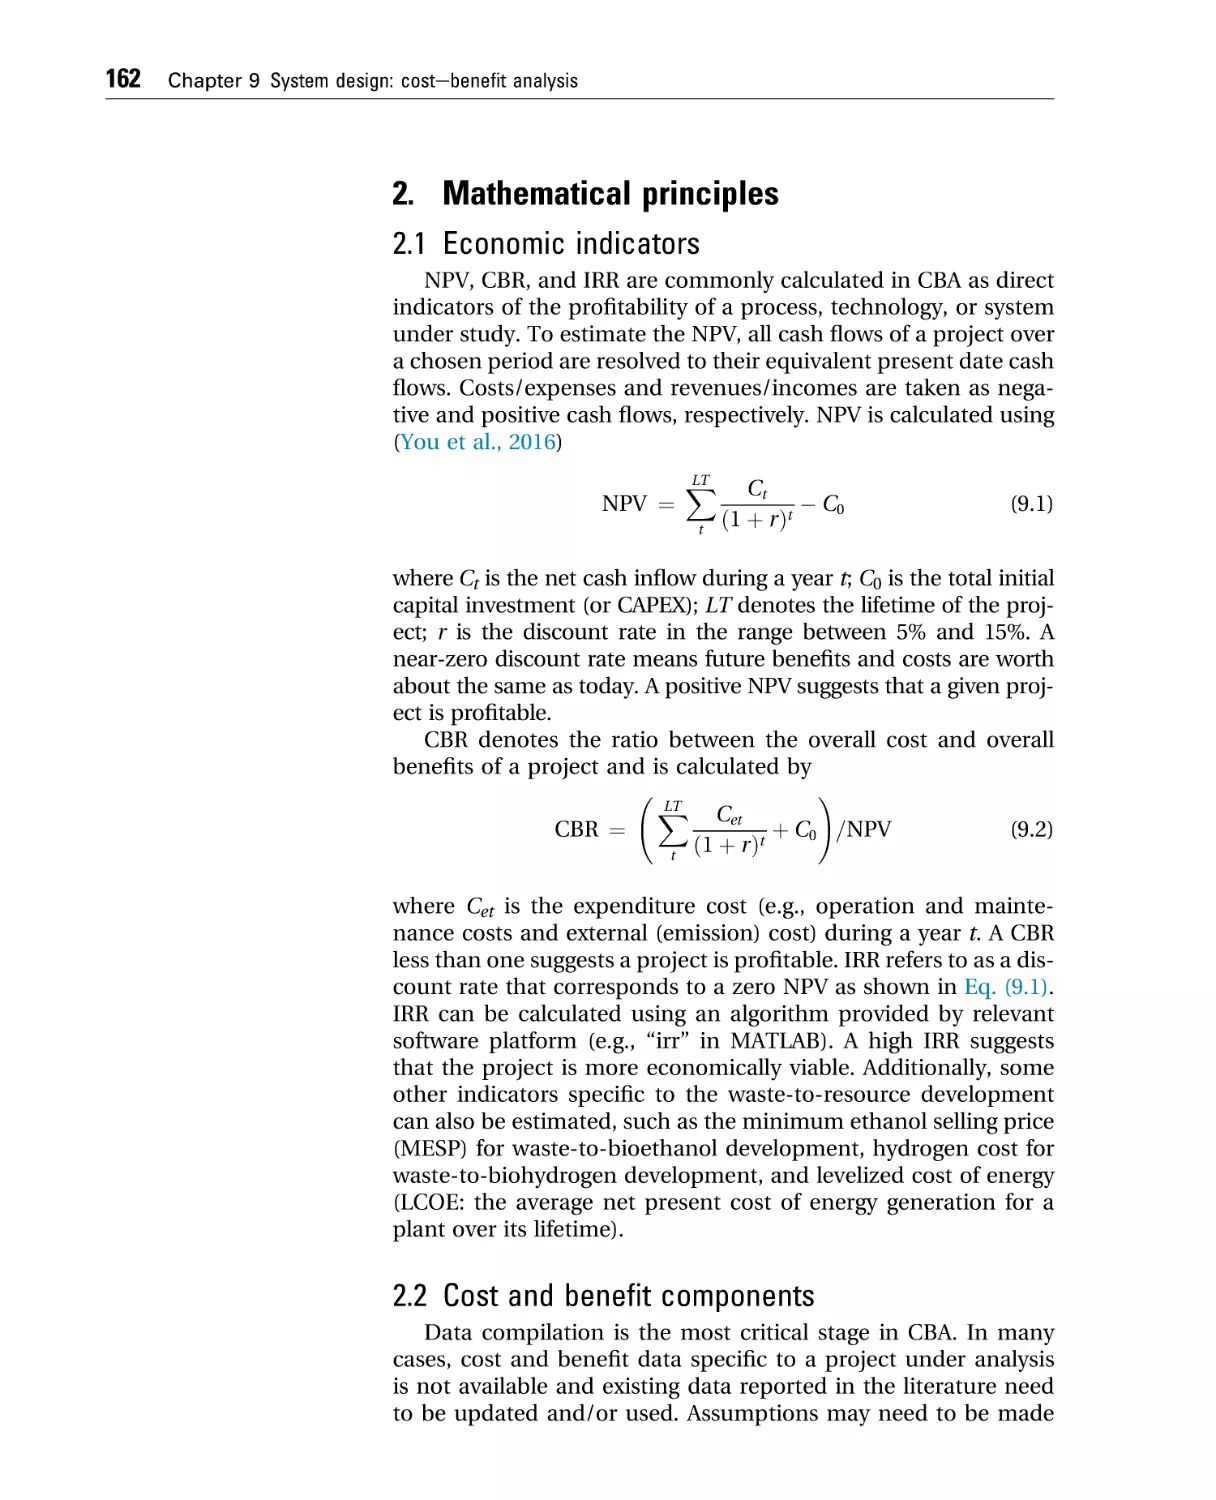
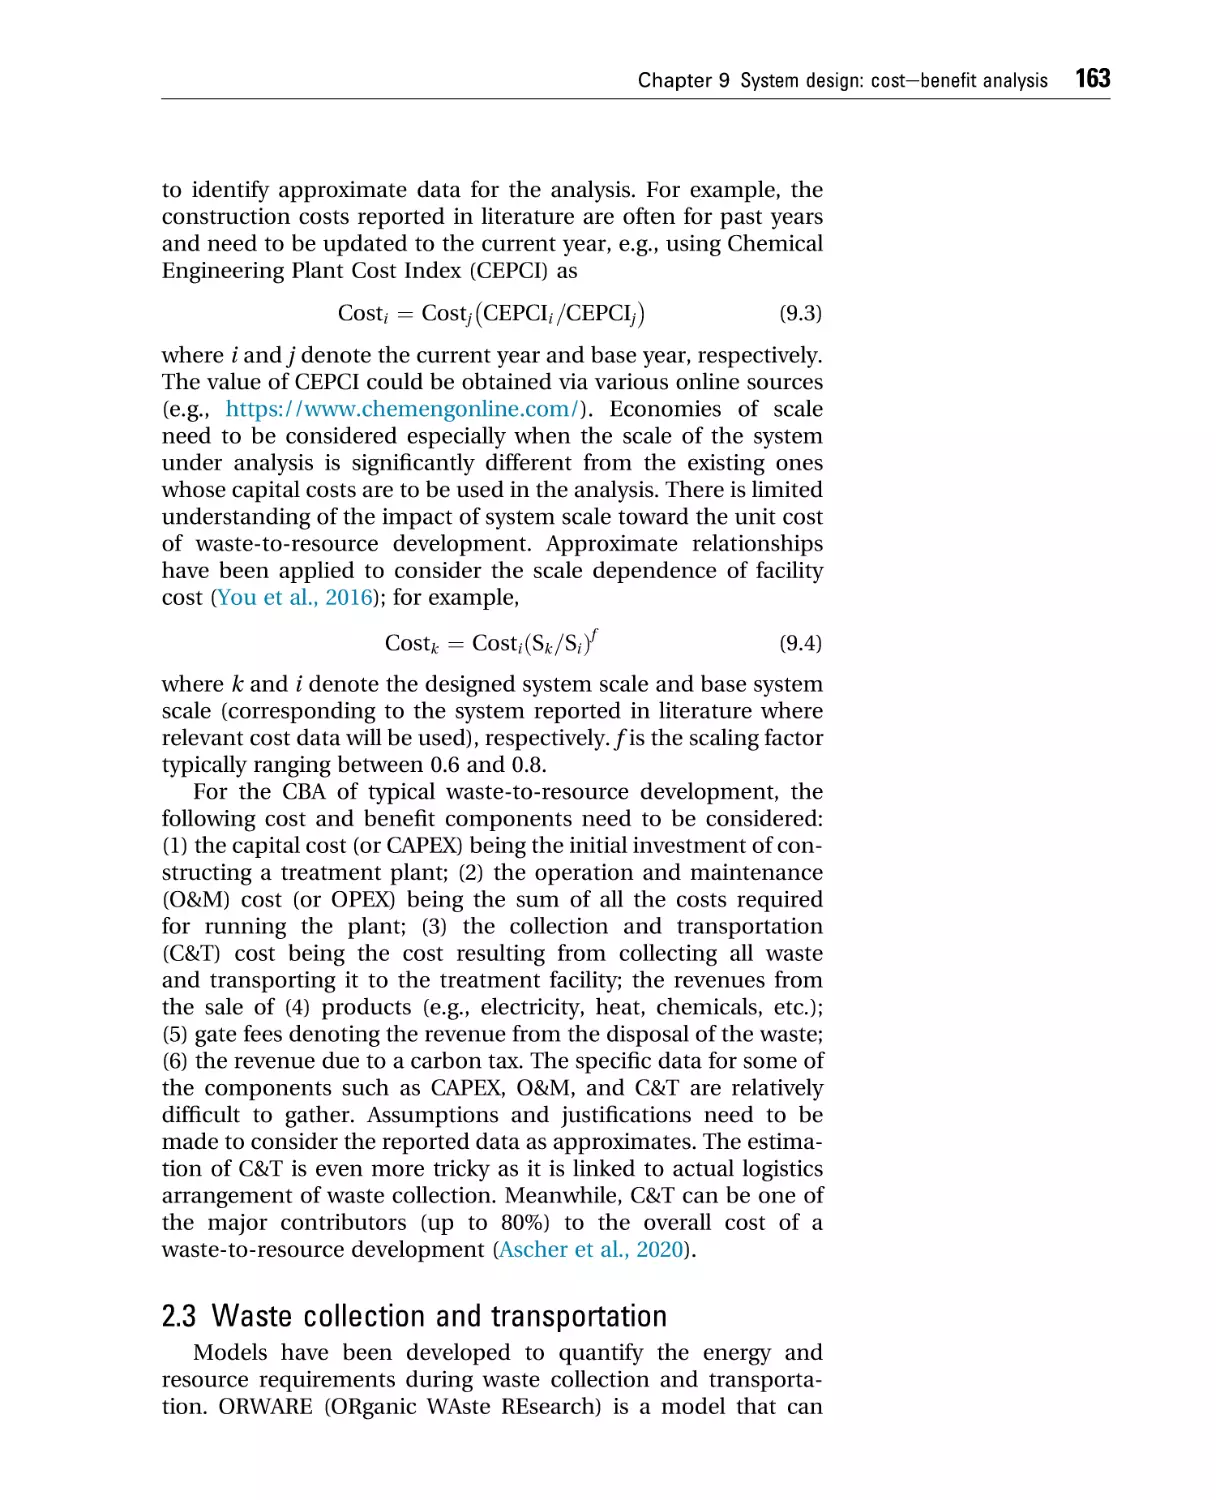
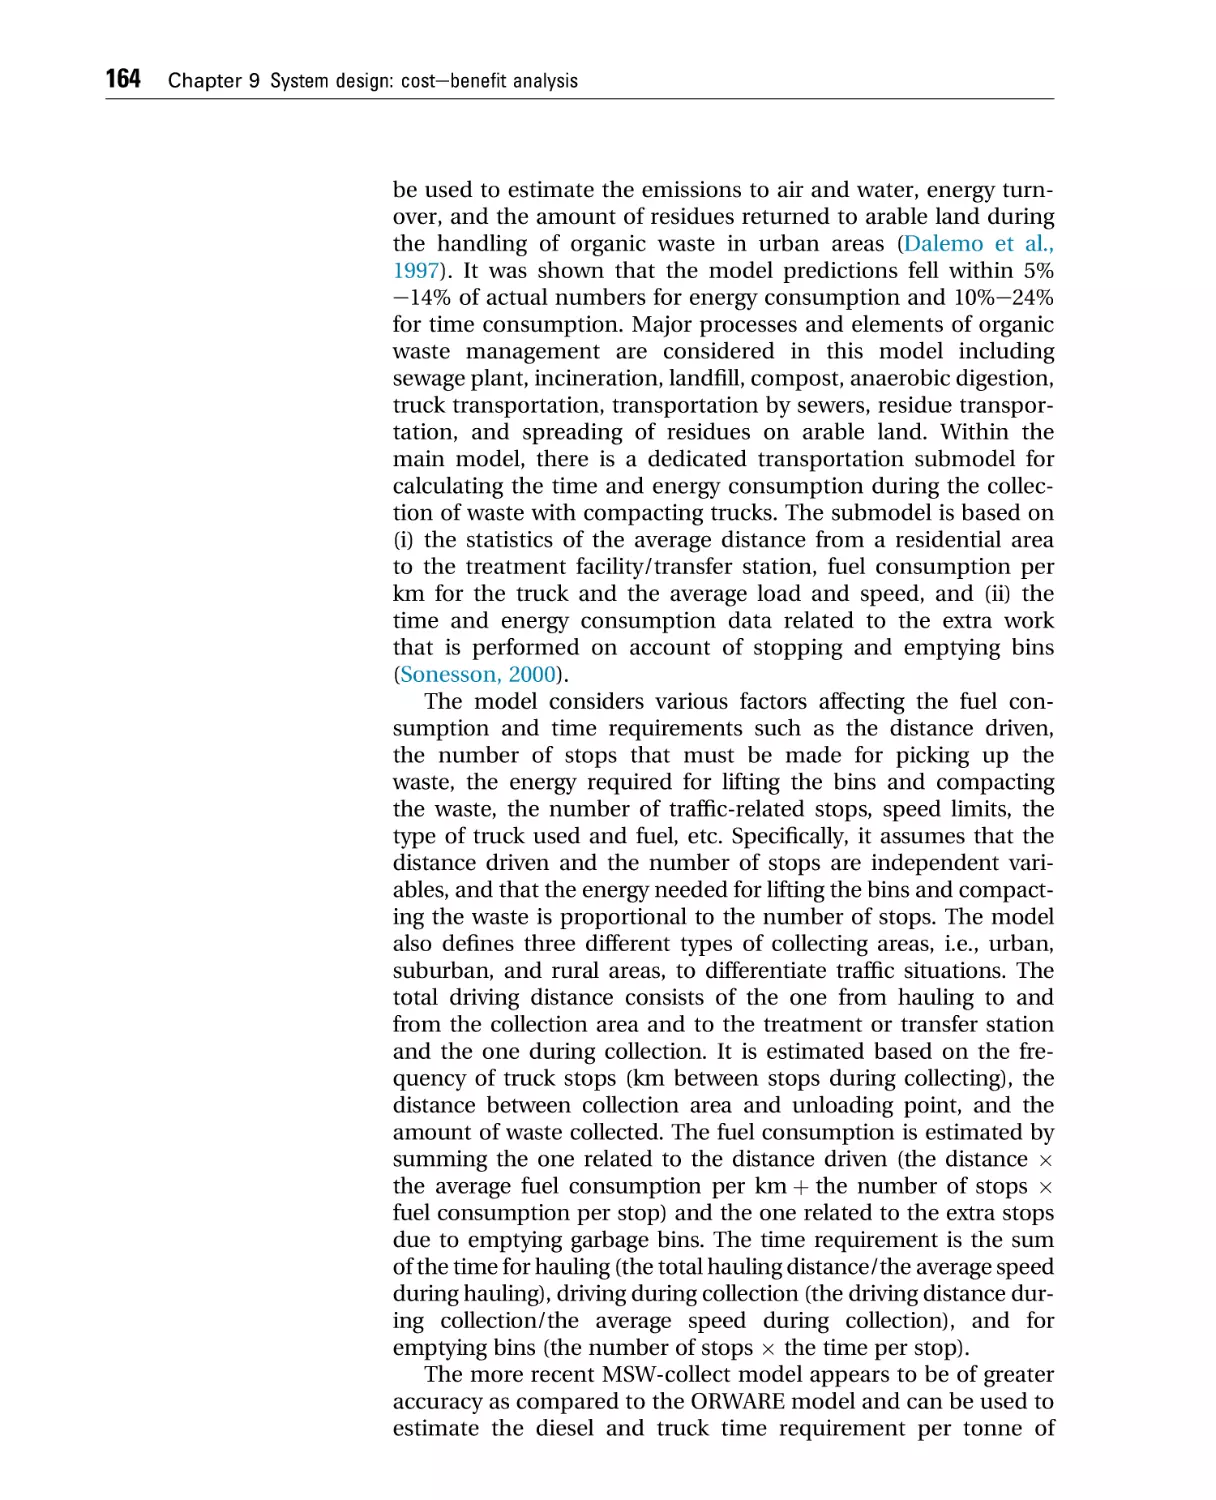
Chapter 9 System design: costebenefit analysis. . . . . . . . . . . . . . . . . . . . . . . 161
1. Introduction . . . . . . . . . . . . . . . . . . . . . . . . . . . . . . . . . . . . . . . . . . . . . . 161
2. Mathematical principles . . . . . . . . . . . . . . . . . . . . . . . . . . . . . . . . . . 162
Contents
vii
3. Economic feasibility of waste-to-resource
development . . . . . . . . . . . . . . . . . . . . . . . . . . . . . . . . . . . . . . . . . . . . 174
4. Uncertainties . . . . . . . . . . . . . . . . . . . . . . . . . . . . . . . . . . . . . . . . . . . . 183
References . . . . . . . . . . . . . . . . . . . . . . . . . . . . . . . . . . . . . . . . . . . . . . 184
Chapter 10 System design: life cycle assessment. . . . . . . . . . . . . . . . . . . . . . 189
1.
2.
3.
4.
Introduction . . . . . . . . . . . . . . . . . . . . . . . . . . . . . . . . . . . . . . . . . . . . .
LCA procedures . . . . . . . . . . . . . . . . . . . . . . . . . . . . . . . . . . . . . . . . .
LCA of waste-to-resource developments . . . . . . . . . . . . . . . .
Uncertainty analysis . . . . . . . . . . . . . . . . . . . . . . . . . . . . . . . . . . . . .
References . . . . . . . . . . . . . . . . . . . . . . . . . . . . . . . . . . . . . . . . . . . . . .
189
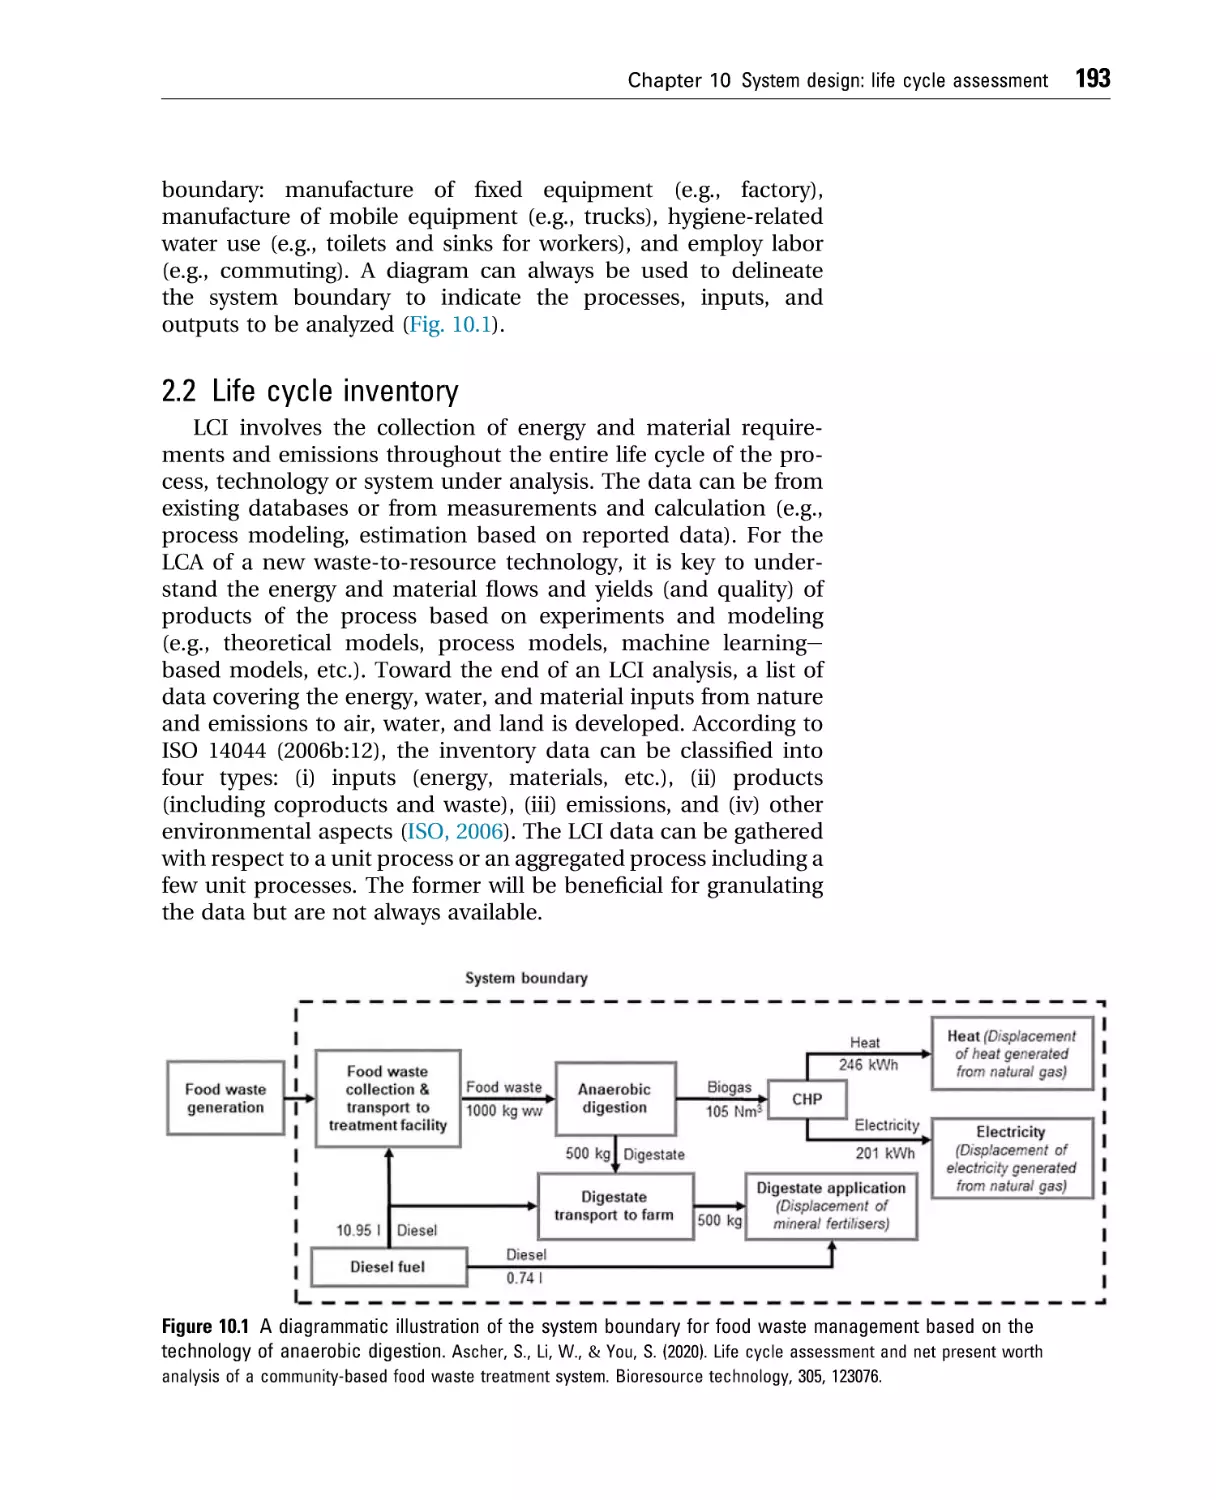
191
200
207
208
Chapter 11 System optimization. . . . . . . . . . . . . . . . . . . . . . . . . . . . . . . . . . . . . . . . 213
1. Introduction . . . . . . . . . . . . . . . . . . . . . . . . . . . . . . . . . . . . . . . . . . . . . 213
2. Multiobjective optimization methods . . . . . . . . . . . . . . . . . . . . 214
References . . . . . . . . . . . . . . . . . . . . . . . . . . . . . . . . . . . . . . . . . . . . . . 222
Chapter 12 Perspectives of future development. . . . . . . . . . . . . . . . . . . . . . . . 225
References . . . . . . . . . . . . . . . . . . . . . . . . . . . . . . . . . . . . . . . . . . . . . . 230
Index. . . . . . . . . . . . . . . . . . . . . . . . . . . . . . . . . . . . . . . . . . . . . . . . . . . . . . . . . . . . . . . . . . . . 231
This page intentionally left blank
The waste challenge
1
Abstract
This chapter gives an overview of the overall waste management
challenge and highlights the importance of sustainable waste management. It explains the existing waste management hierarchy strategy and
the roles of waste-to-resource development in managing the waste that
cannot be handled by the “reduce, reuse, and recycle” (3R) methods. It
also introduces the potential factors that need to be considered upon the
design of waste-to-resource development with a special focus on public
engagement, economics, and environmental impacts. Finally, it presents
a summary of the scope and content arrangement of the book.
Keywords: Climate change; Sustainable development goals; Sustainable
waste management; Waste management hierarchy; Waste-to-resource
technologies; Whole system and supply chain design.
1. Introduction
Sustainable waste management (SWM) is a worldwide challenge and is calling for effective actions under the socioeconomic
and environmental pressures of enormous waste production. The
rates of municipal solid waste (MSW) generation in developed
and developing countries were reported to be 521.95e759.2 kg
per person per year (kpc) and 109.5e525.6 kpc, respectively
(Karak et al., 2012). About 2.01 billion tonnes of MSW are generated annually, and it is estimated that at least 33% of the generation are not managed in an environmentally safe manner (Kaza
et al., 2018). In view of the continuous economic growth and population expansion, the waste generation will keep increasing and
it is expected that 2.2 billion tonnes of MSW will be generated per
annum by 2025 worldwide (Hoornweg & Bhada-Tata, 2012). The
increasing pile-up of waste pose a realistic threat to the environment, ecosystems, and human welfare if proper waste management practices and facilities are not in place.
The climate change crisis is closely associated with waste generation management in various aspects, i.e., methane emissions
of organic waste landfill, emission abatement via waste reuse,
recycling, and reduction, renewable and low carbon resource
Waste-to-Resource System Design for Low-Carbon Circular Economy. https://doi.org/10.1016/B978-0-12-822681-0.00005-0
Copyright © 2022 Elsevier Inc. All rights reserved.
1
2
Chapter 1 The waste challenge
recovery from waste, emissions rated to the transportation of
waste, etc. (Ackerman, 2000). The carbon saving potential has
become one of the most significant factors that has been considered upon the design of SWM approaches. On the other hand,
climate change can also influence the practicing and consequences of SWM with changes in global temperature, annual precipitation, and sea levels rendering conventional waste
management practices less effective. For example, the rise in temperature may increase the fire risk from combustible waste (e.g.,
composting) at open sites, more frequent extreme weather conditions may increase the health and safety risks of waste operators
who implement waste management, and the rise in the sea level
poses a risk of seawater intrusion to coastal landfills and washing
away floating waste, leading to marine waste (e.g., plastics) pollution (Bebb & Kersey, 2003).
SWM is essential to achieving the United Nations’ sustainable
development goals (SDGs) and is closely related to such SDGs as
Decent Work and Economic Growth (SDG8), Sustainable Cities
and Communities (SDG11), and Sustainable Consumption and
Production (SDG12) (Robert et al., 2005). This is reflected by its
significant socioeconomic and environmental consequences.
Waste mismanagement can cause serious environmental issues
such as heavy metal pollution in ecosystems (e.g., water, plants,
and soil) and marine plastic pollution via field dumping, and
pollutant (e.g., CO, CO2, SO, NO, particulate matters, etc.) emissions via open field burning (Ferronato & Torretta, 2019). As local
and global populations continue to expand, so as will the requirements and strain on waste infrastructure, meaning the costs of
waste mismanagement will increase. It was predicted that the
costs for SWM globally would increase from US$205.4 billion per
year to around US$375.5 billion in 2025 (Hoornweg & BhadaTata, 2012).
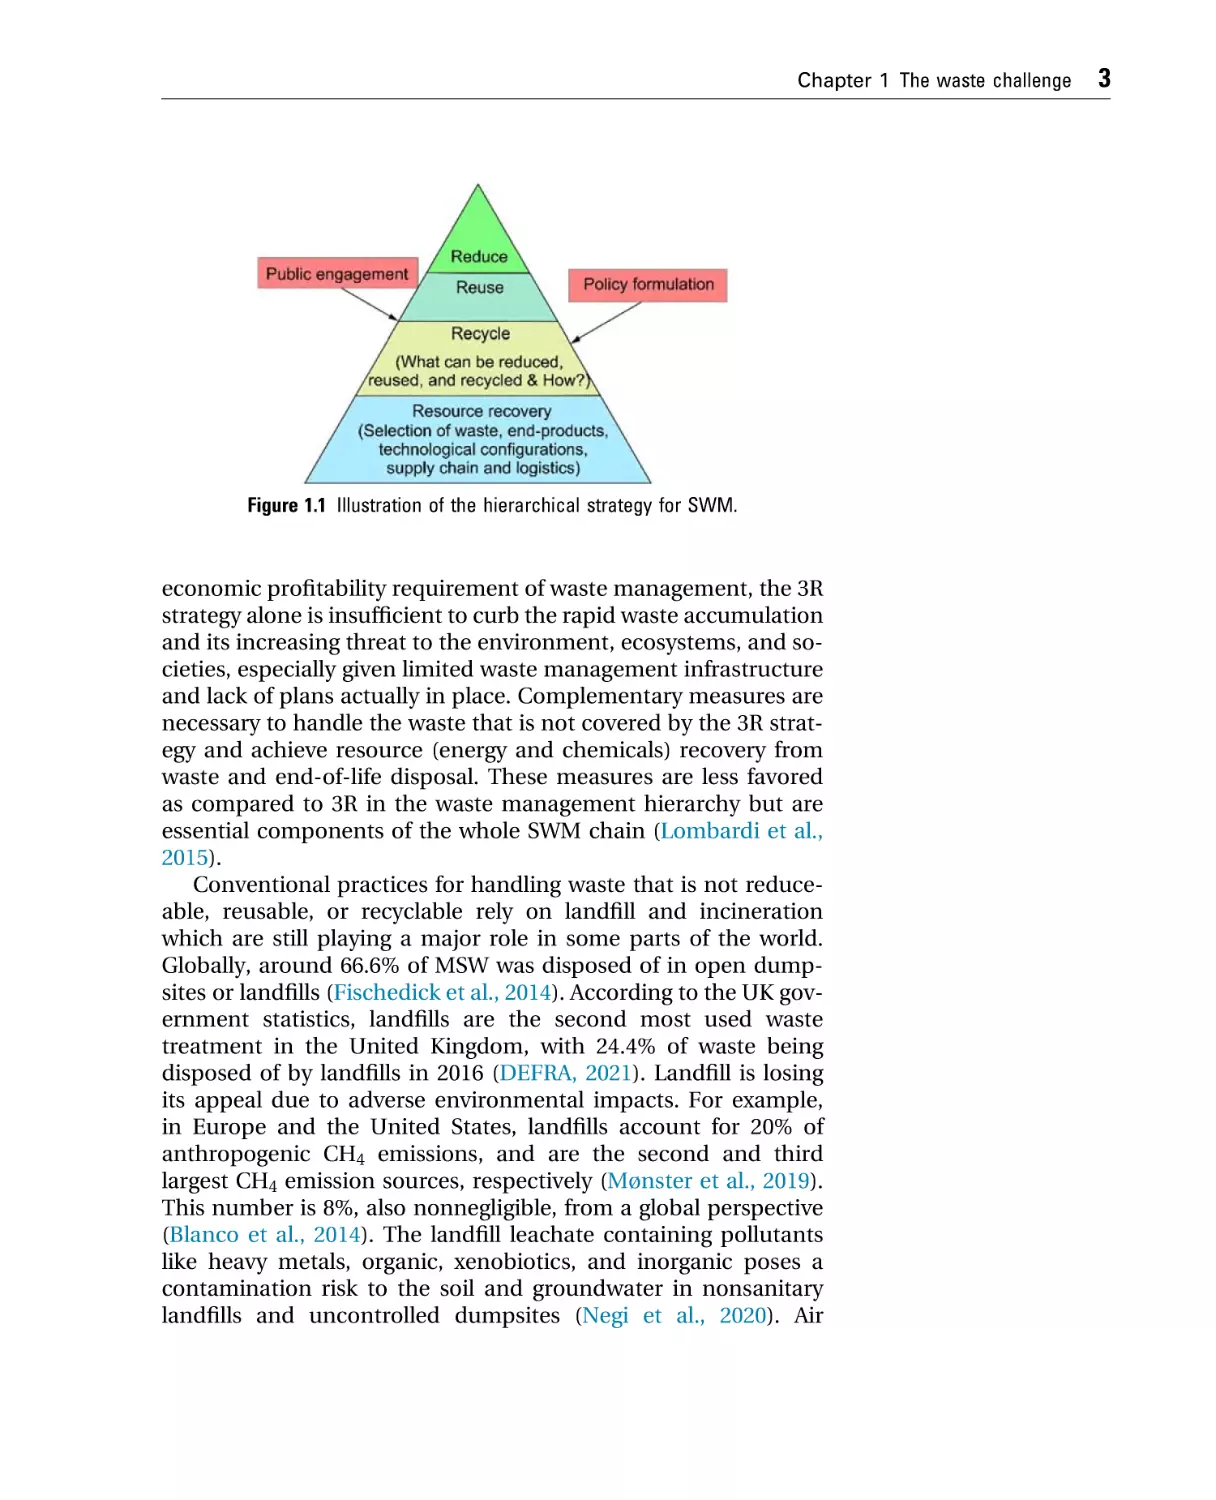
A hierarchical strategy has been proposed and implemented
for promoting SWM (See Fig. 1.1). On the top of the hierarchy,
the “reduce, reuse, and recycle” (3R) methods are regarded as a
long-term strategy to reduce waste pollution toward the transition
from a traditional linear economy to a circular one (Geng et al.,
2019). Specifically, the 3R strategy serves to protect the environment, promote sustainable development, and improve resource
utilization efficiency, and aims to achieve a closed resource loop
within the circular economy model by lessening the pressure on
the stock of resources (Ioannidis et al., 2021). However, considering the varied composition and value of waste as well as the
Chapter 1 The waste challenge
Figure 1.1 Illustration of the hierarchical strategy for SWM.
economic profitability requirement of waste management, the 3R
strategy alone is insufficient to curb the rapid waste accumulation
and its increasing threat to the environment, ecosystems, and societies, especially given limited waste management infrastructure
and lack of plans actually in place. Complementary measures are
necessary to handle the waste that is not covered by the 3R strategy and achieve resource (energy and chemicals) recovery from
waste and end-of-life disposal. These measures are less favored
as compared to 3R in the waste management hierarchy but are
essential components of the whole SWM chain (Lombardi et al.,
2015).
Conventional practices for handling waste that is not reduceable, reusable, or recyclable rely on landfill and incineration
which are still playing a major role in some parts of the world.
Globally, around 66.6% of MSW was disposed of in open dumpsites or landfills (Fischedick et al., 2014). According to the UK government statistics, landfills are the second most used waste
treatment in the United Kingdom, with 24.4% of waste being
disposed of by landfills in 2016 (DEFRA, 2021). Landfill is losing
its appeal due to adverse environmental impacts. For example,
in Europe and the United States, landfills account for 20% of
anthropogenic CH4 emissions, and are the second and third
largest CH4 emission sources, respectively (Mønster et al., 2019).
This number is 8%, also nonnegligible, from a global perspective
(Blanco et al., 2014). The landfill leachate containing pollutants
like heavy metals, organic, xenobiotics, and inorganic poses a
contamination risk to the soil and groundwater in nonsanitary
landfills and uncontrolled dumpsites (Negi et al., 2020). Air
3
4
Chapter 1 The waste challenge
surrounding landfill sites can affect local communities as the
smell is unpleasant and the soil in the area may be saturated
with chemicals or hazardous substances. The European Commission proposed to phase out landfilling by 2025 for recyclable waste
(e.g., plastics, paper, metals, glass, and biowaste) in nonhazardous
waste landfills and reduce the landfilled municipal waste to 10%
or less of the total amount of waste generated by 2035 (EC, 2018).
Waste-to-energy technologies play a critical role in diverting
waste from direct landfill. According to the International Energy
Agency, waste-to-energy systems are one of the promising solutions toward a low carbon future via the decarbonization of energy production which is the dominant contributor to
greenhouse gas emissions (IEA, 2013). Waste incineration is being
widely employed in both developed and developing countries.
There are about 1179 MSW incineration plants around the world
with a total capacity over 700,000 tonnes per day and most of the
plants are in the European Union, the United States, and East Asia
(Lu et al., 2017). Incinerators using energy recovery techniques
have been used in SWM development to help recover electricity
and/or heat from waste while simultaneously reducing the mass
and volume of waste sent to landfills. Some typical advantages
of the incineration technologies include the effective reduction
of waste volume (by 90%) and mass (by 75%), elimination of pathogens, flexibility in feedstock selection, and energy production
(Lino & Ismail, 2018). Their disadvantages include high capital
and operational costs, significant pollutant emissions, and
requiring mandatory treatment of flue gas (Gabbar et al., 2018).
Additionally, there exists widespread negative public perception
about its emissions of pollutants such as dioxin carcinogen, which
needs to be abated to enhance the public acceptance of the technology (Makarichi et al., 2018).
Alternative waste-to-energy technologies have been developed to achieve lower pollutant emissions or to improve the energy recovery from some specific types of waste. For example,
gasification is a thermochemical process where carbonaceous
waste materials are converted into synthesis gas or syngas (a
mixture of H2, CO, and CH4 mainly) under an oxygen-deficient
condition. The syngas can be further combusted to generate
heat or electricity or upgraded to produce value-added chemicals
(e.g., pure hydrogen). Anaerobic digestion is a biochemical process where organic waste is decomposed to produce CH4, CO2,
and digestate under the effect of anaerobic microorganisms. As
compared to gasification, anaerobic digestion is less energy intensive but suffers from the weakness of low productivity.
Chapter 1 The waste challenge
Recent development has been focused on converting waste into
value-added chemicals for applications in the industrial or transportation sectors, such as biohydrogen, biomethane, bioethanol,
biodiesel, biochar, etc. (bio- is used to indicate the chemicals are
produced from waste biomass). A significant amount of these
chemicals have been produced out of conventional fossil fuele
based chemical processes. Displacing the chemicals with the
ones derived from waste biomass will lead to carbon abatement
and facilitate the development of the circular economy concept.
In general, the efficiencies of the waste-to-resource (resource
denotes energy and chemicals) technologies depend on the types
of waste feedstock, process conditions, and selection of technological routes. The variety of technologies that recover valuable resources from waste are expected to play an increasingly
important role in alleviating the challenges of SWM and climate
change.
The design of waste-to-resource systems needs to consider a
variety of factors beyond the technology, and also importantly
its relationship with the 3R strategy. Specifically, the waste-toresource approach needs to work in tandem with the 3R strategy,
which needs to be further supported by educational initiatives to
enhance public awareness for tackling the challenges. Meanwhile, reduced, reused, recycled, and recovered resources that
precisely match the socioeconomic, energy, and environmental
demands of end-users will accelerate the uptake of such initiatives and lead to higher public engagement. Successful addition
of the waste-to-resource technologies as a tier in the 3R hierarchy
is dependent on understanding of local context. This will underpin the development of a comprehensive and systematic hierarchical waste management roadmap that clearly defines the
relative roles and effects of the measures and includes the steps
or milestones needed to achieve waste pollution reduction.
The success of such a hierarchical strategy is contingent upon
the participation and cooperation of all the stakeholders (i.e., policymakers, investors, and consumers) along the SWM chain as well
as effective policy support. This means that the design of waste-toresource systems needs to be gauged in relation to socioeconomic
and environmental impacts that are some of the most significant
indices for evaluating the feasibility of the systems. The implementation of a waste-to-resource system is subject to its social acceptability and benefits, which is directly reflected by its ability to create
jobs and affect income, and indirectly by its effects on equality and
welfare development of local communities. The environmental
impacts are linked to the system’s ability to tackle the crises of
fossil fuel depletion and global climate change, as well as its
5
6
Chapter 1 The waste challenge
complication with the development of associated ecosystems. The
economic feasibility of waste-to-resource development critically
determines its sustainability and depends on (also affects) the
formulation of governmental subsidies. Although the different
stakeholders have different preferences on the impacts, it is important to consider all the three impacts during the decisionmaking process for optimal planning.
The design of the supply chain and logistics of waste management also critically determines the feasibility and impacts of
waste-to-resource systems due to the geographical distribution
of waste and consumer zones, weather variability, and the potential seasonality of waste feedstocks (Chaplin-Kramer et al., 2017;
Field et al., 2018). It has been shown that the waste collection
and transportation process accounts for the significant economic
factor for waste-to-energy development (Ascher et al., 2020).
Moreover, the varied compositions and physicochemical properties of waste imply the complexity of system design. On the one
hand, for the same type of waste, there are different technologies
available for processing and subsequent product upgrading,
depending on the types of targeted end-products (e.g., electricity,
heat, liquid transport fuel, biochar, etc.). On the other hand, for
the same type of end-product, multiple technologies and waste
feedstocks are available upon the design of the system. Hence,
there are vast possibilities of waste-to-resource system configurations in terms of the choices of waste feedstock types, processing
technologies, and end-product types. This adds a complication of
spatial and temporal dimensions to the assessment of the potential of bioresources (defined as the resources recovered from
waste biomass in this book), and transportation network and
modes, distance, and intermodal-transportation becomes important parameters upon the supply chain and logistics design.
To understand the potential contribution of waste-to-resource
to our environment, society, and ecosystems, it is essential to
develop a systematic database about the economic and environmental impacts of waste-to-resource development under a feasible
range of waste-to-resource system and supply chain configurations. Moreover, optimal configurations need to be identified
and combined with decision support tools, to allow the policymakers to make informed decisions about waste-to-resource action plans. Considering the various possibilities of technology
and process alternatives, superstructure optimization based on,
e.g., mixed-integer programming techniques serves as an appropriate approach for optimal technology and process selection
by allowing systematic generation and automatic evaluation of
Chapter 1 The waste challenge
design candidates based on process economics and environmental
sustainability (Gong & You, 2015). A multiobjective optimization
framework can be formed by integrating cost-benefit analysis
(CBA) and life cycle assessment (LCA) into the superstructure
optimization.
This book will introduce the fundamentals, development, and
applications of various types of waste-to-resource technologies
that are expected to play a major role in developing SWM practices in the future. This book will focus on two major analysis
and design methods of waste-to-resource development, i.e. CBA
and environmental LCA and assemble some basic data sets for
carrying out baseline analysis. Examples of LCA and CBA studies
and results will be summarized to illustrate the impacts of
different configurations of waste-to-resource developments. We
will also introduce the multiobjective optimization method in
terms of its application in the designing and planning of SWM
systems in the end. This book will serve as a starting point for
you to conduct waste-to-resource design with the availability of
theories and baseline data sets.
References
Ackerman, F. (2000). Waste management and climate change. Local
Environment, 5(2), 223e229.
Ascher, S., Li, W., & You, S. (2020). Life cycle assessment and net present worth
analysis of a community-based food waste treatment system. Bioresource
Technology, 305, 123076.
Bebb, J., & Kersey, J. (2003). Potential impacts of climate change on waste
management. UK: Environment Agency Bristol.
Blanco, G., Gerlagh, R., Suh, S., Barrett, J., de Coninck, H. C., Morejon, C. F. D.,
Mathur, R., Nakicenovic, N., Ahenkorah, A. O., & Pan, J. (2014). Drivers,
trends and mitigation.
Chaplin-Kramer, R., Sim, S., Hamel, P., Bryant, B., Noe, R., Mueller, C.,
Rigarlsford, G., Kulak, M., Kowal, V., & Sharp, R. (2017). Life cycle assessment
needs predictive spatial modelling for biodiversity and ecosystem services.
Nature Communications, 8(1), 1e8.
DEFRA. (2021). UK statistics on waste. https://assets.publishing.service.gov.uk/
government/uploads/system/uploads/attachment_data/file/874265/UK_
Statistics_on_Waste_statistical_notice_March_2020_accessible_FINAL_rev_v0.
5.pdf.
EC. (2018). Circular Economy: New rules will make EU the global front-runner in
waste management and recycling. https://ec.europa.eu/commission/
presscorner/detail/en/IP_18_3846.
Ferronato, N., & Torretta, V. (2019). Waste mismanagement in developing
countries: A review of global issues. International Journal of Environmental
Research and Public Health, 16(6), 1060.
Field, J. L., Evans, S. G., Marx, E., Easter, M., Adler, P. R., Dinh, T., Willson, B., &
Paustian, K. (2018). High-resolution technoeecological modelling of a
7
8
Chapter 1 The waste challenge
bioenergy landscape to identify climate mitigation opportunities in cellulosic
ethanol production. Nature Energy, 3(3), 211e219.
Fischedick, M., Roy, J., Acquaye, A., Allwood, J., Ceron, J.-P., Geng, Y.,
Kheshgi, H., Lanza, A., Perczyk, D., & Price, L. (2014). Industry in: Climate
change 2014: Mitigation of climate change. Contribution of working group III
to the fifth assessment report of the intergovernmental panel on climate
change. Technical Report.
Gabbar, H. A., Aboughaly, M., & Ayoub, N. (2018). Comparative study of MSW
heat treatment processes and electricity generation. Journal of the Energy
Institute, 91(4), 481e488.
Geng, Y., Sarkis, J., & Bleischwitz, R. (2019). How to globalize the circular
economy. Nature Publishing Group.
Gong, J., & You, F. (2015). Sustainable design and synthesis of energy systems.
Current Opinion in Chemical Engineering, 10, 77e86.
Hoornweg, D., & Bhada-Tata, P. (2012). What a waste: A global review of solid
waste management.
IEA. (2013). Waste to energy summary and conclusions from the IEA bioenergy
ExCo71 workshop. https://www.ieabioenergy.com/wp-content/uploads/
2014/03/ExCo71-Waste-to-Energy-Summary-and-Conclusions-28.03.14.pdf.
Ioannidis, A., Chalvatzis, K. J., Leonidou, L. C., & Feng, Z. (2021). Applying the
reduce, reuse, and recycle principle in the hospitality sector: Its antecedents
and performance implications. Business Strategy and the Environment.
Karak, T., Bhagat, R. M., & Bhattacharyya, P. (2012). Municipal solid waste
generation, composition, and management: The world scenario. Critical
Reviews in Environmental Science and Technology, 42(15), 1509e1630.
Kaza, S., Yao, L., Bhada-Tata, P., & Van Woerden, F. (2018). What a waste 2.0: A
global snapshot of solid waste management to 2050. World Bank Publications.
Lino, F. A. M., & Ismail, K. A. R. (2018). Evaluation of the treatment of municipal
solid waste as renewable energy resource in Campinas, Brazil. Sustainable
Energy Technologies and Assessments, 29, 19e25.
Lombardi, L., Carnevale, E., & Corti, A. (2015). A review of technologies and
performances of thermal treatment systems for energy recovery from waste.
Waste Management, 37, 26e44.
Lu, J.-W., Zhang, S., Hai, J., & Lei, M. (2017). Status and perspectives of
municipal solid waste incineration in China: A comparison with developed
regions. Waste Management, 69, 170e186.
Makarichi, L., Jutidamrongphan, W., & Techato, K. (2018). The evolution of
waste-to-energy incineration: A review. Renewable and Sustainable Energy
Reviews, 91, 812e821.
Mønster, J., Kjeldsen, P., & Scheutz, C. (2019). Methodologies for measuring
fugitive methane emissions from landfillseA review. Waste Management, 87,
835e859.
Negi, P., Mor, S., & Ravindra, K. (2020). Impact of landfill leachate on the
groundwater quality in three cities of North India and health risk
assessment. Environment, Development and Sustainability, 22(2), 1455e1474.
Robert, K. W., Parris, T. M., & Leiserowitz, A. A. (2005). What is sustainable
development? Goals, indicators, values, and practice. Environment: Science
and Policy for Sustainable Development, 47(3), 8e21.
Waste
2
Abstract
This chapter introduces the classification of waste (i.e., industrial
waste, nuclear waste, agricultural waste and municipal solid waste) and
their generation characteristics and statistics. It focuses on agricultural
waste and municipal solid waste as they are more relevant to waste-toresource development. It explains the definitions of the compositions
(i.e., ultimate and proximate) and heating values of waste and the
properties of typical agricultural and municipal solid waste are summarized. This chapter concludes with highlighting the importance of
waste-to-resource development and emphasizing that rural waste
management needs to be paid special attention.
Keywords: Agricultural waste; Composition; Heating value; Municipal
solid waste; Rural waste management; Waste-to-resource.
1. Introduction
According to the European Commission Waste Framework
Directive, waste is defined as any substance or object which the
holder discards or intends or is required to discard (EC, 2008). There
exist different waste classifications based on various criteria such as
sources, state, biodegradability, etc. This chapter considers the
source-based classification that categorizes waste into four types,
i.e., industrial, agricultural, municipal, and nuclear. Typical industrial waste includes MSW incineration ash, iron and steelmaking
slags, cement dust, petroleum spent catalyst, etc. MSW incineration ash (fly ash and bottom ash) is the solid residue of the combustion processing of MSW that serves to reduce the mass and volume
of MSW while recovering energy. Fly ash (w3e5 wt.% of raw MSW)
refers to the pulverized fine particles captured by filtration devices
post an incineration reactor, while bottom ash (w20e25 wt.% of
solid residue) normally consists of slag recovered from the base
of incineration furnace. In China, around 15 million tonnes of bottom ash are produced in MSW incineration plants each year (Hu
et al., 2021). 17.6 million tonnes of bottom ash are produced
each year in the European Union, Norway, and Switzerland
Waste-to-Resource System Design for Low-Carbon Circular Economy. https://doi.org/10.1016/B978-0-12-822681-0.00004-9
Copyright © 2022 Elsevier Inc. All rights reserved.
9
10
Chapter 2 Waste
(Blasenbauer et al., 2020). Some of the industrial waste contains
considerable heavy metals and pose a risk of environmental pollution if not disposed of properly. For example, waste batteries
contain Ni, Cd, and Ag, while electronic waste contains Sn, Au,
Ag, Ni, and Zn, their improper disposal will lead to the pollution
of soil and surface and/or groundwater (Pant et al., 2012).
Nuclear or radioactive waste is referred to as any material that
is either radioactive or contaminated by radioactivity above the
thresholds defined in associated legislation (IAEA, 2009). Typical
sources of nuclear waste include nuclear power stations, hospitals, science laboratories, etc., in a variety of physical and chemical forms (e.g., aqueous waste, solid waste, liquid organic waste,
cwet solid waste, and biological and medical waste) (Sljivi
Ivanovic & Smiciklas, 2020). The rules and methods of industrial
and nuclear waste management are typically different from that
of agricultural and MSW managements with the necessity of
ensuring high socioenvironmental security. Agricultural and
municipal solid waste, on the other hand, refer to the ones from
which bioenergy or value-added chemicals could be derived,
will be the focus of this book, due to their great potential of facilitating renewable energy and resource generation.
The property and generation of waste vary considerably across
different types of waste and are important factors affecting the
design and implementation of waste management practices.
Different types of waste could differ significantly in their compositions, making some technologies a preferred option upon a preliminary design. For example, biochemical technologies such as
anaerobic digestion (i.e., the biological decomposition of organic
material into mainly “biogas” whose main constituents are
methane (50e70 wt.%) and carbon dioxide (30e50 wt.%)) is a desirable option for treating organic waste such as food waste featured
by a high moisture content (Ascher et al., 2020). The locality and
availability of waste generation is also linked to demand side management, making certain technologies a preferred option because
their production matches well with the demand of local customers.
For example, to utilize the palm oil mills’ solid (empty fruit bunch)
and liquid (palm oil mill effluent) waste, gasification and anaerobic
digestion were applied, respectively, to generate electricity to sustain the operation of the mills (Aziz et al., 2017). Actually, the types
and availability of waste often comes as the first set of parameters
or conditions for selecting waste management technologies and
designing associated implementation and operation plans.
2. Agricultural waste
Agricultural waste is the unwanted waste discarded in the process of agricultural activities and some typical examples of
Chapter 2 Waste
agricultural waste are agricultural product processing waste (e.g.,
crop stalks), plant waste, livestock and poultry manure, rural
household waste, silage plastics, fertilizer, pesticides, herbicides,
wastes from farms, poultry houses and slaughterhouses, etc.
(Ramírez-García et al., 2019). It is an important constituent of
biomass resource and is featured by wide availability, large quantity, and biodegradability.
The generation of agricultural waste experienced significant
increase because of the expansion of agricultural production
that has been tripled during the past 50 years (Duque-Acevedo
et al., 2020). The annual lignocellulosic biomass generated by
the primary agricultural sector was estimated to be about 200
billion tonnes worldwide (Ren et al., 2009). Being two of the largest
developing countries and agrarian economies, China and India
have abundant agricultural waste for renewable generation.
China had a total agricultural waste of 1.75 109 tonnes in
2013, consisting of 9.93 108 tonnes (56.82%) of crop straw,
4.52 108 tonnes (25.85%) of livestock and poultry manure, and
3.03 108 tonnes (17.33%) of forest residues (Dai et al., 2018).
For India, the biogas potential from agricultural waste via anaerobic digestion was predicted to be 65 billion m3/year in 2015 (Mittal et al., 2019).
The agriculture sector is a significant contributor for GHG
emissions, consisting of emissions from agricultural soils, livestock, stationary combustion sources, and off-road machinery.
For example, this sector accounts for 10% of total EU-28 emissions (440 MtCO2-eq.), of which 38% is about CH4 emissions
from enteric fermentation from cattle and 31% is about direct
N2O emissions from agricultural soils and fertilize use (Juvyns
et al., 2019). The sector accounted for 10% of UK GHG emissions
in 2018, with 56% and 31% being CH4 and N2O emissions, respectively (DECC, 2015). Due to decreases in animal numbers and use
of synthetic fertilizers, GHG emissions from UK agriculture
decreased by 16% between 1990 and 2018. Agriculture is responsible for 9% of total United States GHG emissions, with 81%,
11%, and 6% being CO2, CH4, and N2O, respectively (EPA, 2016).
The significant carbon footprint of the agriculture sector calls
for more sustainable development and effective utilization of agricultural waste for decarburization.
There is a long history that agricultural waste is used as an
important source of energy and chemicals. The benefits of agricultural waste utilization are not only contingent upon the types
of waste but also the means of utilization. Inappropriate utilization of agricultural waste such as burning in stoves has been a
major cause of personal exposure to PM2.5. In China, 40% of
crop straw was burned in-field and contributes to 1.036 million
11
12
Chapter 2 Waste
tonnes of PM2.5 emissions every year (Clare et al., 2015; Zhang
et al., 2016). Approximately 75% of agricultural biomass is discarded, directly burnt in the field, or used by farmers for household cooking, which causes the problems of low-efficiency
utilization (10%) and wasting valuable biomass resources, and
air pollution (e.g., N2O, SO2, CH4, and PM2.5) (Huang et al.,
2019). Alternatively, being the most readily available organic
waste, agricultural waste can be converted to value-added products (e.g., biohydrogen and biomethane) in such processes as
anaerobic digestion, fermentation, and gasification, which serve
as environmentally friendly ways of agricultural waste utilization.
3. Municipal solid waste
MSW is defined as the waste generated from households and
any other waste with similar compositions and properties to
household waste according to Municipal Solid Waste Rules
2000 (Thomas & Soren, 2020). Sustainable MSW management becomes increasingly important due to continuous rising in its generation worldwide as the result of population expansion, rapid
urbanization, and accelerated economic growth. The World
Bank predicted that the global MSW generation would reach 2.2
billion tonnes per year by 2025 and 3.4 billion tonnes per year
by 2050 (Kaza et al., 2018; The World Bank, 2017). In China, the
yield of MSW increased at an annual rate of 8%e10%, and the total volume of MSW generated had increased from 31.3 million
tonnes in 1980 to 203.6 million tonnes in 2016, which was expected to reach 480 million tonnes by 2030 (Hu et al., 2015). The
MSW generation in Switzerland increased by 215% between
1990 and 2017 (Magazzino et al., 2020). The total urban MSW generation in India would be 165, 230, and 436 million tonnes by
2030, 2041, and 2050, respectively (Sharma & Jain, 2019). Effective
MSW management is critical to the achievement of Sustainable
Cities and Communities as part of the United Nations SDGs.
The MSW generation is closely connected with the standard of
living as indicated by various socioeconomic and development
indices. Gross Domestic Product (GDP) and the Human Development Index (HDI) were found to be two of the most influential
factors affecting the generation rates of 13 solid waste streams
of 10 European countries, with waste electronic and electric
equipment being most significantly influenced (Namlis & Komilis, 2019). A study on the seasonality of MSW compositions for
four Eastern European cities (i.e., Georgia (Kutaisi), Lithuania
(Kaunas), Russia (St. Petersburg), and Ukraine (Boryspil)) showed
that economic development and climate conditions affected the
MSW generation statistics significantly, with the median MSW
generation rate ranging from 18.7 to 38.3 kg/capita/month
Chapter 2 Waste
(Denafas et al., 2014). For developing countries like China, economic and urban (i.e., urban population) development are the
major factors influencing MSW generation (Liu & Wu, 2010).
4. Properties
The composition and physicochemical properties of waste are
the most important factors that affect the design and implementation of waste-to-resource methods. Properties that are
commonly considered upon the selection and identification of
waste include ultimate composition, proximate composition,
and heating value. They are often used as the input parameters
in the process modeling and estimation of energy and mass flows
of relevant waste-to-resource technologies and systems, which
serves as the basis for the evaluation of their techno-economic
feasibility and environmental impacts.
The ultimate composition is about the contents of carbon (C),
oxygen (O), hydrogen (H), nitrogen (N), and sulfur (S) as well as
moisture (MC) and ash (ASH) in waste, based on which a chemical formula of waste could be obtained. The proximate composition accounts for such gross components as fixed carbon (FC),
volatile matter (VM), ash (ASH), and moisture (MC). The compositions of waste are measured based on different mass basis. For
example, the composition on the dry basis refers to the percentage contents of the different components of the waste that has
been dried (i.e., without considering the moisture content), while
the one on the dry and ash free basis refers to the percentage
contents of the waste without considering the contents of moisture and ash. The as-received basis is based on the consideration
of raw waste.
The heating value of waste is an indicator of the energy content
of waste that will be transformed into heat upon its full combustion. It is a critical parameter defining the energy potential of
waste-to-energy generation. Due to the presence of moisture content, two different heating values, i.e., higher heating value (HHV)
and lower heating value (LHV), have been defined. The former
refers to the energy content covering the latent heat of vaporization of water, while the latter does not take the latent heat into
consideration. The heating values of waste are closely associated
with the compositions of waste. Empirical relationships have
been developed to predict HHV based on the composition of
waste. For example, Parikh et al. (2005) derived the correlation
between HHV and proximate composition as (Parikh et al., 2005)
HHV ¼ 0.3536FC þ 0.1559VM 0.0078ASH (MJ/kg)
(2.1)
13
14
Chapter 2 Waste
where FC ¼ 1.0%e91.5%, VM ¼ 0.92%e90.6%, and ASH ¼ 0.12%
e77.7% in wt.% on a dry basis. Separately, the correlation between HHV and ultimate composition was derived as
(Channiwala & Parikh, 2002)
HHV ¼ 0.3491C þ 1.1783H þ 0.1005S 0.1034O 0.0151N
0.0211ASH
(2.2)
where 0% C 92.25%, 0.43% H 25.15%, 0% O 50.00%,
0% N 5.60%, 0% S 94.08%, 0% ASH 71.4%, 4.745 MJ/
kg HHV55.345 MJ/kg. C, H, O, N, S, and ASH represents the
carbon, hydrogen, oxygen, nitrogen, sulfur, and ash contents,
respectively, expressed in mass percentages on a dry basis.
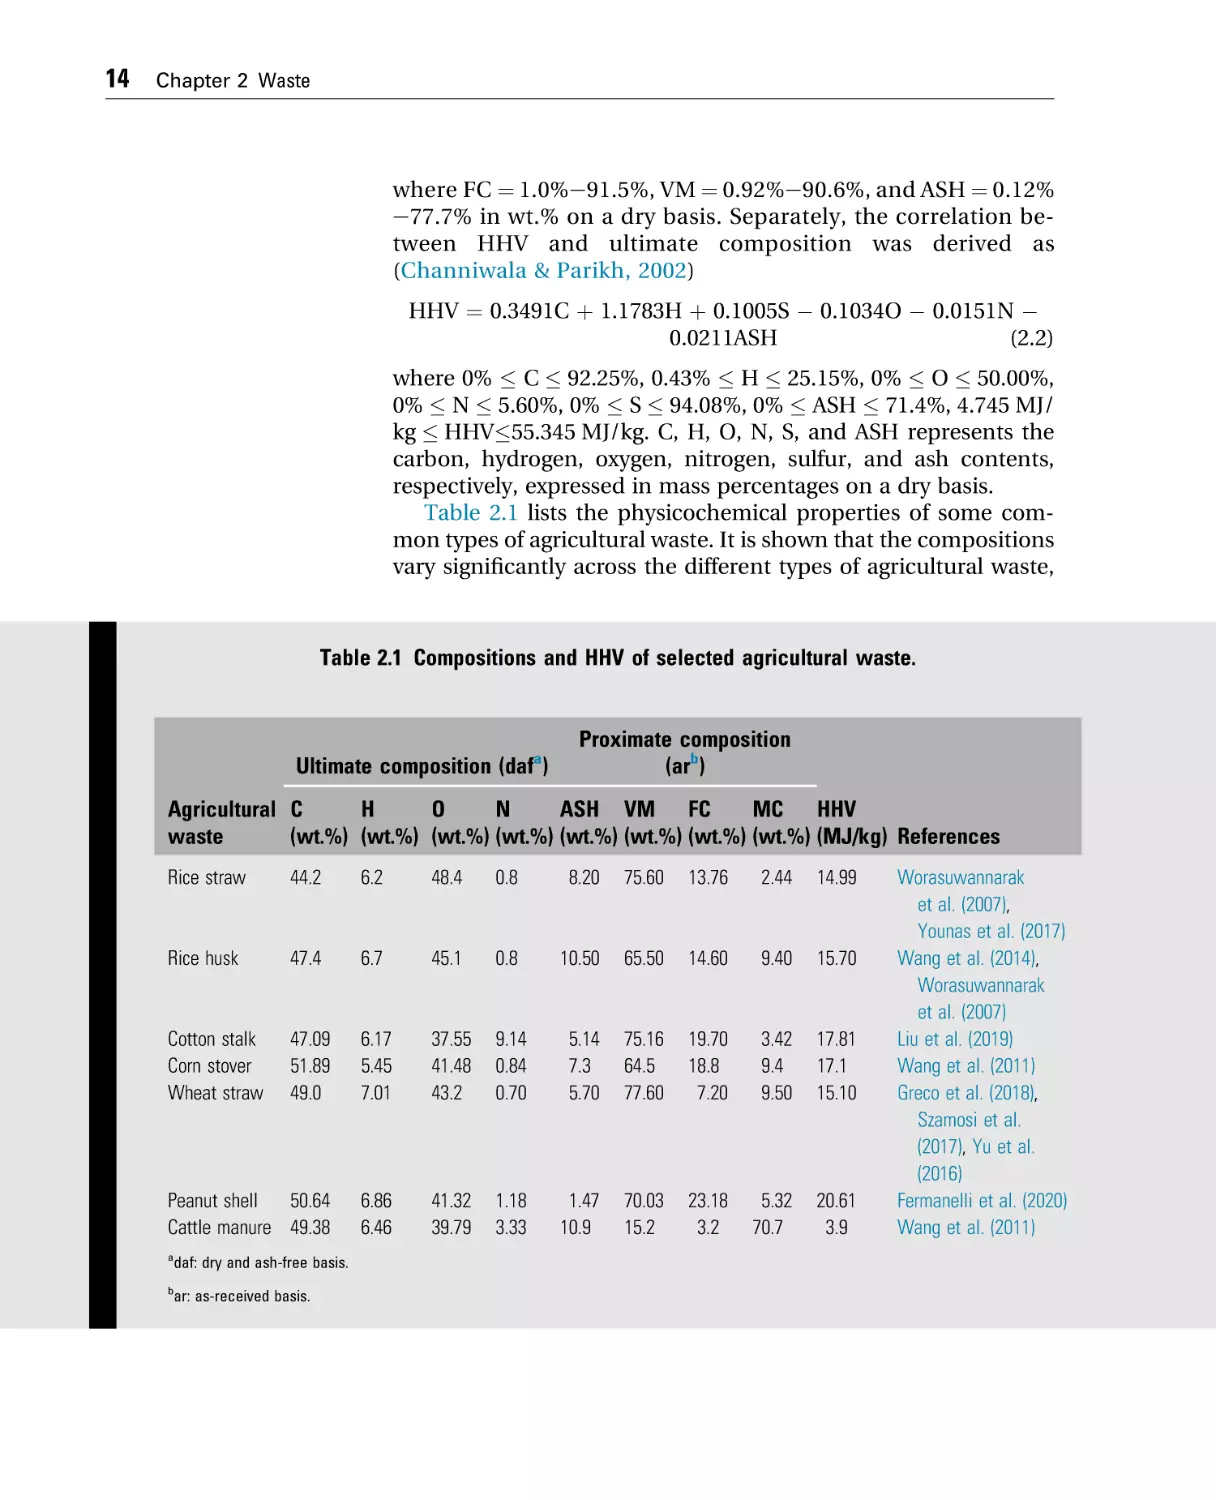
Table 2.1 lists the physicochemical properties of some common types of agricultural waste. It is shown that the compositions
vary significantly across the different types of agricultural waste,
Table 2.1 Compositions and HHV of selected agricultural waste.
Ultimate composition (dafa)
Proximate composition
(arb)
H
O
N
ASH VM FC
MC HHV
Agricultural C
(wt.%) (wt.%) (wt.%) (wt.%) (wt.%) (wt.%) (wt.%) (wt.%) (MJ/kg) References
waste
Rice straw
44.2
6.2
48.4
0.8
8.20
75.60
13.76
2.44
14.99
Rice husk
47.4
6.7
45.1
0.8
10.50
65.50
14.60
9.40
15.70
Cotton stalk
Corn stover
Wheat straw
47.09
51.89
49.0
6.17
5.45
7.01
37.55
41.48
43.2
9.14
0.84
0.70
5.14
7.3
5.70
75.16
64.5
77.60
19.70
18.8
7.20
3.42
9.4
9.50
17.81
17.1
15.10
Peanut shell
50.64
Cattle manure 49.38
6.86
6.46
41.32
39.79
1.18
3.33
1.47
10.9
70.03
15.2
23.18
3.2
5.32
70.7
20.61
3.9
a
daf: dry and ash-free basis.
b
ar: as-received basis.
Worasuwannarak
et al. (2007),
Younas et al. (2017)
Wang et al. (2014),
Worasuwannarak
et al. (2007)
Liu et al. (2019)
Wang et al. (2011)
Greco et al. (2018),
Szamosi et al.
(2017), Yu et al.
(2016)
Fermanelli et al. (2020)
Wang et al. (2011)
Chapter 2 Waste
15
suggesting the importance of the feedstock selection for improved
energy or chemical recovery. The sulfur content of agricultural
waste is low and thus not shown in Table 2.1, suggesting the
reduced emission of sulfur-related pollutants as compared to fossil fuel upon thermochemical reactions.
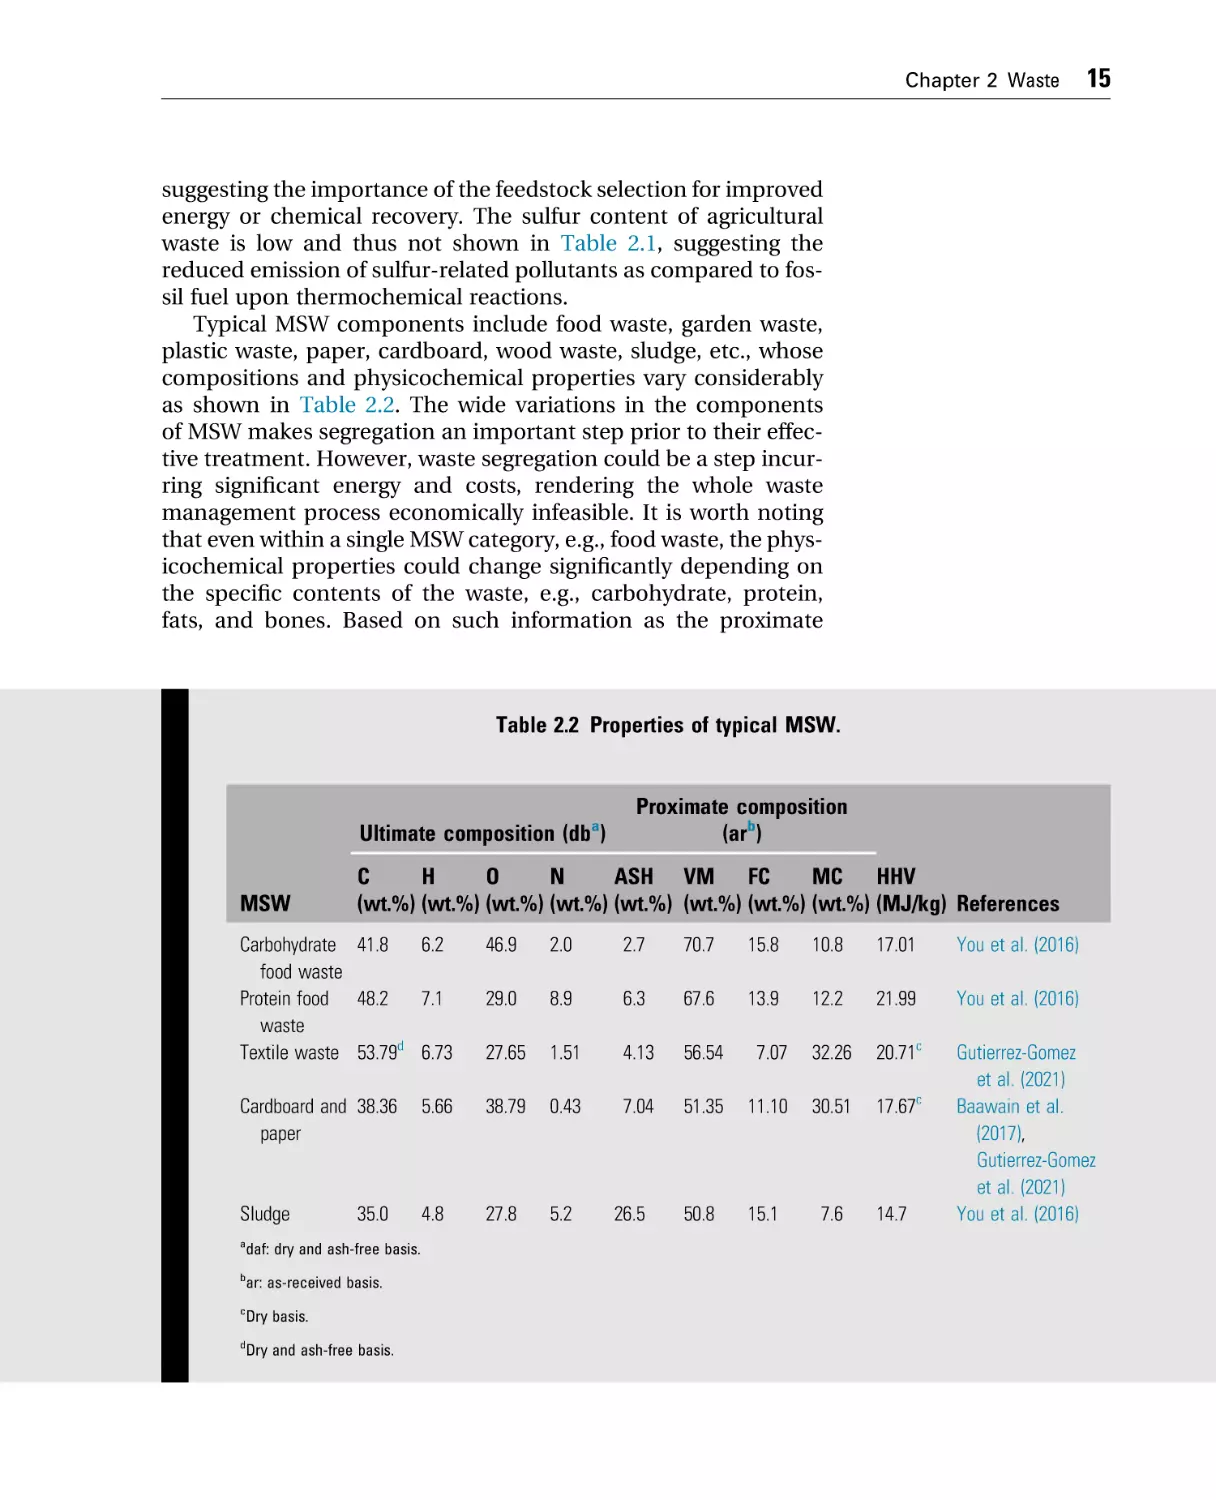
Typical MSW components include food waste, garden waste,
plastic waste, paper, cardboard, wood waste, sludge, etc., whose
compositions and physicochemical properties vary considerably
as shown in Table 2.2. The wide variations in the components
of MSW makes segregation an important step prior to their effective treatment. However, waste segregation could be a step incurring significant energy and costs, rendering the whole waste
management process economically infeasible. It is worth noting
that even within a single MSW category, e.g., food waste, the physicochemical properties could change significantly depending on
the specific contents of the waste, e.g., carbohydrate, protein,
fats, and bones. Based on such information as the proximate
Table 2.2 Properties of typical MSW.
Ultimate composition (dba)
MSW
Proximate composition
(arb)
C
H
O
N
ASH VM FC
MC HHV
(wt.%) (wt.%) (wt.%) (wt.%) (wt.%) (wt.%) (wt.%) (wt.%) (MJ/kg) References
Carbohydrate 41.8
6.2
food waste
Protein food 48.2
7.1
waste
Textile waste 53.79d 6.73
46.9
2.0
2.7
70.7
15.8
10.8
17.01
You et al. (2016)
29.0
8.9
6.3
67.6
13.9
12.2
21.99
You et al. (2016)
27.65
1.51
4.13
56.54
7.07
32.26
20.71c
Cardboard and 38.36
paper
5.66
38.79
0.43
7.04
51.35
11.10
30.51
17.67c
Sludge
4.8
27.8
5.2
50.8
15.1
7.6
Gutierrez-Gomez
et al. (2021)
Baawain et al.
(2017),
Gutierrez-Gomez
et al. (2021)
You et al. (2016)
35.0
a
daf: dry and ash-free basis.
b
ar: as-received basis.
c
Dry basis.
d
Dry and ash-free basis.
26.5
14.7
16
Chapter 2 Waste
and ultimate compositions, heating values, etc., MSW could be
also classified into vegetables, starch food, orange peel, wood
waste, printing paper, cellulose, PVC, PET, PE/PP, PS, and rubber,
to promote comparable and consistent research toward waste-toenergy development (Zhou et al., 2015).
5. Waste-to-resource
As mentioned in Chapter 1, SWM is a complex, interdisciplinary, and systemic project which needs to be supported by
the coherent and consistent efforts of all stakeholders. A hierarchical method is necessary for waste management considering
the difference in the socioeconomic and environmental values
of different types of waste and the variations in associated technology availability. In addition to the prioritized 3R strategy,
waste-to-resource development plays an important role for sustainably managing the waste that could not be handled by the
3R strategy.
Conventionally, landfill and incineration have been adopted
as the main approaches for waste disposal. Typical disadvantages
of landfill include the formation of gas and liquid phase contaminants leading to air and groundwater pollution, taking up of
additional land resource, and risks of infection and fire hazards.
In particular, landfill-based waste management emits massive
amount of methane (CH4) whose global warming potential is 25
times that of carbon dioxide (CO2) over a 100-year period. Incineration could recover energy from MSW in the form of electricity
and/or heat while effectively reducing the mass and volume of
MSW toward ultimate disposal. However, some of the major challenges associated with incineration include the environmentally
friendly disposal of incineration ash, air pollutant (e.g., NOx and
dioxin) reduction, and high off-gas flow rates requiring significant
cleaning effort.
Advanced technologies are available to convert waste into energy and chemicals, with the potential to achieve higher
efficiency and flexibility and to better cater to the demands of
end-users. Based on the main products generated, some of the
relatively mature (technology readiness level >5) technologies
can be classified as waste-to-energy, waste-to-biohydrogen,
waste-to-biomethane, waste-to-biodiesel, waste-to-bioethanol,
and waste-to-biochar, respectively, which will be the focus of
the subsequent chapters of this book. These technologies are
receiving increasing attention from both academics and industry
for their great potential to replace the conventional methods for
alleviating the current dilemma of global waste management.
Chapter 2 Waste
6. Rural waste management
Rural areas account for large sources of waste generation;
however, waste management in rural areas has received much
less attention as compared to their urban counterparts that
have developed relatively mature waste management rules and
chains. A recent study from Romania showed that rural communities could contribute 85.51% of plastics into water bodies due to
frequent flash floods (Mihai, 2021). Hence, the waste generation
and associated environmental pollution in rural areas is predisposed to be made in an uncontrolled manner, with wide ecological, health and socioeconomic implications. Unfortunately,
knowledge of effective waste management in rural areas of, especially, LMICs is limited, which renders existing measures ineffective and discourages sustainable effort.
Waste management practices are further complicated by socioeconomic, environmental, and geographical factors. For example,
sparsely populated remote rural areas are usually the most neglected
by waste management services and might have been in a position
facing various other challenges, such as poor electrification,
household air pollution, and farmland contamination. Meanwhile, the demands (in terms of energy and chemicals) may vary
considerably across different communities, calling for a flexibility
in technology and system designing. These factors suggest that
waste management in rural areas (1) will be country-specific, if
not village-specific, (2) will require systematic data sets to develop
a variety of solutions for flexible deployment, and (3) will be
less possible to rely on existing large-scale, centralized waste
treatment facilities, making small-scale, decentralized development that offers a wide range of product possibilities a potentially
better option.
References
Ascher, S., Li, W., & You, S. (2020). Life cycle assessment and net present worth
analysis of a community-based food waste treatment system. Bioresource
Technology, 305, 123076.
Aziz, M., Kurniawan, T., Oda, T., & Kashiwagi, T. (2017). Advanced power
generation using biomass wastes from palm oil mills. Applied Thermal
Engineering, 114, 1378e1386.
Baawain, M., Al-Mamun, A., Omidvarborna, H., & Al-Amri, W. (2017). Ultimate
composition analysis of municipal solid waste in Muscat. Journal of Cleaner
Production, 148, 355e362. https://doi.org/10.1016/j.jclepro.2017.02.013
Blasenbauer, D., Huber, F., Lederer, J., Quina, M. J., Blanc-Biscarat, D.,
Bogush, A., Bontempi, E., Blondeau, J., Chimenos, J. M., & Dahlbo, H. (2020).
Legal situation and current practice of waste incineration bottom ash
utilisation in Europe. Waste Management, 102, 868e883.
17
18
Chapter 2 Waste
Channiwala, S. A., & Parikh, P. P. (2002). A unified correlation for estimating
HHV of solid, liquid and gaseous fuels. Fuel, 81(8), 1051e1063. https://
doi.org/10.1016/S0016-2361(01)00131-4
Clare, A., Shackley, S., Joseph, S., Hammond, J., Pan, G., & Bloom, A. (2015).
Competing uses for China’s straw: The economic and carbon abatement
potential of biochar. Gcb Bioenergy, 7(6), 1272e1282.
Dai, Y., Sun, Q., Wang, W., Lu, L., Liu, M., Li, J., Yang, S., Sun, Y., Zhang, K., &
Xu, J. (2018). Utilizations of agricultural waste as adsorbent for the removal
of contaminants: A review. Chemosphere, 211, 235e253.
DECC. (2015). UK greenhouse gas emissions, final figures. https://assets.
publishing.service.gov.uk/government/uploads/system/uploads/attachment_
data/file/407432/20150203_2013_Final_Emissions_statistics.pdf.
Denafas, G., Ruzgas, T., Martuzevicius, D., Shmarin, S., Hoffmann, M.,
Mykhaylenko, V., Ogorodnik, S., Romanov, M., Neguliaeva, E., Chusov, A.,
Turkadze, T., Bochoidze, I., & Ludwig, C. (2014). Seasonal variation of
municipal solid waste generation and composition in four East European
cities. Resources, Conservation and Recycling, 89, 22e30. https://doi.org/
10.1016/j.resconrec.2014.06.001
s-García, F. J., & CamachoDuque-Acevedo, M., Belmonte-Urena, L. J., Corte
Ferre, F. (2020). Agricultural waste: Review of the evolution, approaches and
perspectives on alternative uses. Global Ecology and Conservation, 22,
e00902.
EC. (2008). Directive 2008/98/EC of the European Parliament and of the Council.
https://www.legislation.gov.uk/eudr/2008/98/article/3.
EPA. (2016). Inventory of US greenhouse gas emissions and sinks: 1990e2014.
https://www.epa.gov/ghgemissions/inventory-us-greenhouse-gas-emissionsand-sinks-1990-2014.
Fermanelli, C. S., Córdoba, A., Pierella, L. B., & Saux, C. (2020). Pyrolysis and
copyrolysis of three lignocellulosic biomass residues from the agro-food
industry: A comparative study. Waste Management, 102, 362e370. https://
doi.org/10.1016/j.wasman.2019.10.057
lez, B., & Manyà, J. J. (2018). Evolution
Greco, G., Videgain, M., Di Stasi, C., Gonza
of the mass-loss rate during atmospheric and pressurized slow pyrolysis of
wheat straw in a bench-scale reactor. Journal of Analytical and Applied
Pyrolysis, 136, 18e26. https://doi.org/10.1016/j.jaap.2018.11.007
Gutierrez-Gomez, A. C., Gallego, A. G., Palacios-Bereche, R., Tofano de Campos
Leite, J., & Pereira Neto, A. M. (2021). Energy recovery potential from
Brazilian municipal solid waste via combustion process based on its
thermochemical characterization. Journal of Cleaner Production, 293, 126145.
https://doi.org/10.1016/j.jclepro.2021.126145
Huang, Y., Zhao, Y., Hao, Y., Wei, G., Feng, J., Li, W., Yi, Q., Mohamed, U.,
Pourkashanian, M., & Nimmo, W. (2019). A feasibility analysis of distributed
power plants from agricultural residues resources gasification in rural China.
Biomass and Bioenergy, 121, 1e12.
Hu, M., Guo, D., Ma, C., Hu, Z., Zhang, B., Xiao, B., Luo, S., & Wang, J. (2015).
Hydrogen-rich gas production by the gasification of wet MSW (municipal
solid waste) coupled with carbon dioxide capture. Energy, 90, 857e863.
Hu, Y., Zhao, L., Zhu, Y., Zhang, B., Hu, G., Xu, B., He, C., & Di Maio, F. (2021).
The fate of heavy metals and salts during the wet treatment of municipal
solid waste incineration bottom ash. Waste Management, 121, 33e41.
IAEA. (2009). IAEA safety standards: For protecting people and the environment.
https://www-pub.iaea.org/MTCD/Publications/PDF/Pub1419_web.pdf.
Chapter 2 Waste
Juvyns, O., Fernandez, R., Mandl, N., & Rigler, E. (2019). Annual European union
greenhouse gas inventory 1990e2017 and inventory report. https://www.eea.
europa.eu/publications/european-union-greenhouse-gas-inventory-2019.
Kaza, S., Yao, L., Bhada-Tata, P., & Van Woerden, F. (2018). What a waste 2.0: A
global snapshot of solid waste management to 2050. World Bank Publications.
Liu, C., & Wu, X. (2010). Factors influencing municipal solid waste generation in
China: A multiple statistical analysis study. Waste Management and Research,
29(4), 371e378. https://doi.org/10.1177/0734242X10380114
Liu, J., Zhong, F., Niu, W., Su, J., Gao, Z., & Zhang, K. (2019). Effects of heating
rate and gas atmosphere on the pyrolysis and combustion characteristics of
different crop residues and the kinetics analysis. Energy, 175, 320e332.
https://doi.org/10.1016/j.energy.2019.03.044
Magazzino, C., Mele, M., & Schneider, N. (2020). The relationship between
municipal solid waste and greenhouse gas emissions: Evidence from
Switzerland. Waste Management, 113, 508e520.
Mihai, F.-C. (2021). Rural plastic emissions into the largest mountain lake of the
Eastern Carpathians. Royal Society Open Science, 5(5), 172396. https://
doi.org/10.1098/rsos.172396
Mittal, S., Ahlgren, E. O., & Shukla, P. R. (2019). Future biogas resource potential
in India: A bottom-up analysis. Renewable Energy, 141, 379e389.
Namlis, K.-G., & Komilis, D. (2019). Influence of four socioeconomic indices and
the impact of economic crisis on solid waste generation in Europe. Waste
Management, 89, 190e200.
Pant, D., Joshi, D., Upreti, M. K., & Kotnala, R. K. (2012). Chemical and biological
extraction of metals present in E waste: A hybrid technology. Waste
Management, 32(5), 979e990.
Parikh, J., Channiwala, S. A., & Ghosal, G. K. (2005). A correlation for calculating
HHV from proximate analysis of solid fuels. Fuel, 84(5), 487e494. https://
doi.org/10.1016/j.fuel.2004.10.010
Ramírez-García, R., Gohil, N., & Singh, V. (2019). Recent advances, challenges,
and opportunities in bioremediation of hazardous materials. In
Phytomanagement of polluted sites (pp. 517e568). Elsevier.
Ren, N., Wang, A., Cao, G., Xu, J., & Gao, L. (2009). Bioconversion of
lignocellulosic biomass to hydrogen: Potential and challenges. Biotechnology
Advances, 27(6), 1051e1060.
Sharma, K. D., & Jain, S. (2019). Overview of municipal solid waste generation,
composition, and management in India. Journal of Environmental
Engineering, 145(3), 4018143.
c-Ivanovic, M., & Smiciklas, I. (2020). Utilization of C&D waste in radioactive
Sljivi
waste treatmentdcurrent knowledge and perspectives. In Advances in
construction and demolition waste recycling (pp. 475e500). Elsevier.
nfalvi, Z.
Szamosi, Z., Tóth, P., Koós, T., Baranyai, V. Z., Szepesi, G. L., & Sime
(2017). Explosion characteristics of torrefied wheat straw, rape straw, and
vine shoots fuels. Energy and Fuels, 31(11), 12192e12199. https://doi.org/
10.1021/acs.energyfuels.7b01875
The World Bank. (2017). Solid waste management. http://www.worldbank.org/
en/topic/urbandevelopment/brief/solid-waste-management.
Thomas, P., & Soren, N. (2020). An overview of municipal solid waste-to-energy
application in Indian scenario. Environment, Development and
Sustainability, 22(2), 575e592.
Wang, L., Shahbazi, A., & Hanna, M. A. (2011). Characterization of corn stover,
distiller grains and cattle manure for thermochemical conversion. Biomass
and Bioenergy, 35(1), 171e178. https://doi.org/10.1016/j.biombioe.2010.08.018
19
20
Chapter 2 Waste
Wang, G., Silva, R. B., Azevedo, J. L. T., Martins-Dias, S., & Costa, M. (2014).
Evaluation of the combustion behaviour and ash characteristics of biomass
waste derived fuels, pine and coal in a drop tube furnace. Fuel, 117,
809e824. https://doi.org/10.1016/j.fuel.2013.09.080
Worasuwannarak, N., Sonobe, T., & Tanthapanichakoon, W. (2007). Pyrolysis
behaviors of rice straw, rice husk, and corncob by TG-MS technique. Journal
of Analytical and Applied Pyrolysis, 78(2), 265e271. https://doi.org/10.1016/
j.jaap.2006.08.002
Younas, R., Hao, S., Zhang, L., & Zhang, S. (2017). Hydrothermal liquefaction of
rice straw with NiO nanocatalyst for bio-oil production. Renewable Energy,
113, 532e545. https://doi.org/10.1016/j.renene.2017.06.032
You, S., Wang, W., Dai, Y., Tong, Y. W., & Wang, C.-H. (2016). Comparison of the
co-gasification of sewage sludge and food wastes and cost-benefit analysis of
gasification- and incineration-based waste treatment schemes. Bioresource
Technology, 218. https://doi.org/10.1016/j.biortech.2016.07.017
Yu, Y., Yang, Y., Cheng, Z., Blanco, P. H., Liu, R., Bridgwater, A. V., & Cai, J.
(2016). Pyrolysis of rice husk and corn stalk in auger reactor. 1.
Characterization of char and gas at various temperatures. Energy and Fuels,
30(12), 10568e10574. https://doi.org/10.1021/acs.energyfuels.6b02276
Zhang, L., Liu, Y., & Hao, L. (2016). Contributions of open crop straw burning
emissions to PM2. 5 concentrations in China. Environmental Research
Letters, 11(1), 14014.
Zhou, H., Long, Y., Meng, A., Li, Q., & Zhang, Y. (2015). Classification of
municipal solid waste components for thermal conversion in waste-toenergy research. Fuel, 145, 151e157. https://doi.org/10.1016/
j.fuel.2014.12.015
Waste-to-energy
3
Abstract
This chapter explains the technical principles, process design, and
influential factors of four main waste-to-energy technologies, i.e.,
incineration, pyrolysis, gasification, and anaerobic digestion. Associated
technical and process parameters (e.g., process efficiencies) are summarized to facilitate effective and accurate process design, analysis,
modeling, and optimization. The advantages and disadvantages of the
different types of reactor designs are also reviewed based on incineration
and gasification.
Keywords: Anaerobic digestionergy; Energy; Gasification; Incineration;
Process efficiency; Reactor design; Waste-to-energy.
1. Introduction
The climate change crisis because of massive consumption
of fossil fuels, the depletion of fossil fuel resource, and the
increasing energy demands are the main factors driving
the global effort in searching for affordable and low carbon
renewable energy resources. Energy security defined by the International Energy Agency (IEA) refers to the uninterrupted availability of energy sources at an affordable price and is becoming
a challenge facing both developed and developing countries.
Renewable energy source development is not solely caused by a
shift toward more sustainable energy policies but is also the
consequence of relevant energy security strategies that consider
diversifying energy sources using renewable energy (Lucas
et al., 2016). However, the economic disadvantage of existing
renewable energy sector to the fossil fuel sector is expected to
persist due to the fragmented structure of the sector, which calls
for a unified effort to improve public understanding of the capabilities of renewable technologies and seek political support for
a transition away from fossil fuel technologies (Valentine, 2011).
According to IEA, waste-to-energy (WtE, or energy-from-waste
(EfW)) technologies are one of the promising solutions toward a
renewable and low-carbon generation path to a 2 C warming
Waste-to-Resource System Design for Low-Carbon Circular Economy. https://doi.org/10.1016/B978-0-12-822681-0.00003-7
Copyright © 2022 Elsevier Inc. All rights reserved.
21
22
Chapter 3 Waste-to-energy
limit (IEA, 2020). If waste is treated as a valuable resource,
improper management may lead to a waste of the resource with
significant environmental negativities considering the rapid
increasing in waste generation. For example, about a third of
our food was disposed of as waste, which accounted for 6.8% of
the total GHG emissions globally (FAO, 2014). Over 50 million
tonnes of sewage sludge are produced in the EU annually, and
sludge disposal accounts for 40% of the total GHG emissions
from wastewater treatment plants (Gherghel et al., 2019). WtE
serves one of the well-established approaches that can help to
recover useful energy while mitigating the challenge of SWM by
reducing the mass and volume of waste.
Generally, the WtE technologies can be categorized into three
basic categories: direct combustion (i.e., incineration), thermochemical processing (e.g., pyrolysis and gasification), and
biochemical processing (e.g., anaerobic digestion (AD) and
fermentation). This chapter will introduce the major technical
principles and fundamentals of the technologies with the summary of associated technical and process parameters to facilitate
effective and accurate process design, analysis, modeling, and
optimization.
2. Incineration
Incineration-based WtE generation is based on the recovery of
combustion heat in the form of thermal and/or electrical energy.
It has been deployed widely at large scales and plays an important role in diverting MSW from landfills. The objectives of incineration design include volumetric reduction of waste, optimal
heat and material recovery, and controlling of flue gas emissions
according to relevant environmental standards (Makarichi et al.,
2018). The hot combustion gas in an incineration system can be
used to produce steam in a boiler, commonly in a superheatere
boilereeconomizer arrangement, with the waste heat of flue gas
being used to preheat water in an economizer. The produced
steam can have various thermal applications or can be used to
generate electricity in a combined heat and power (CHP) generation setting.
To model the incineration process, four successive stages need
to be considered: moisture evaporation, devolatilization and char
formation, volatile combustion, and char gasification. Sophisticated 3D CFD simulations have been developed to model incineration by considering the physicochemical reactions and
changes corresponding to the four stages. For preliminary design
or research, a simplified method can be employed to make quick
evaluation and decisions. If the molecular formula of waste can
Chapter 3 Waste-to-energy
be expressed as CaHbOc þ dH2O based on ultimate analysis and
air is the oxygen source, the overall incineration process can be
expressed as
Ca Hb Oc þ dH2 Oþ XðO2 þ 3:76N2 Þ/yCO2 þ zH2 Oþ jN2
(3.1)
where the coefficients x, y, z, and j can be decided considering
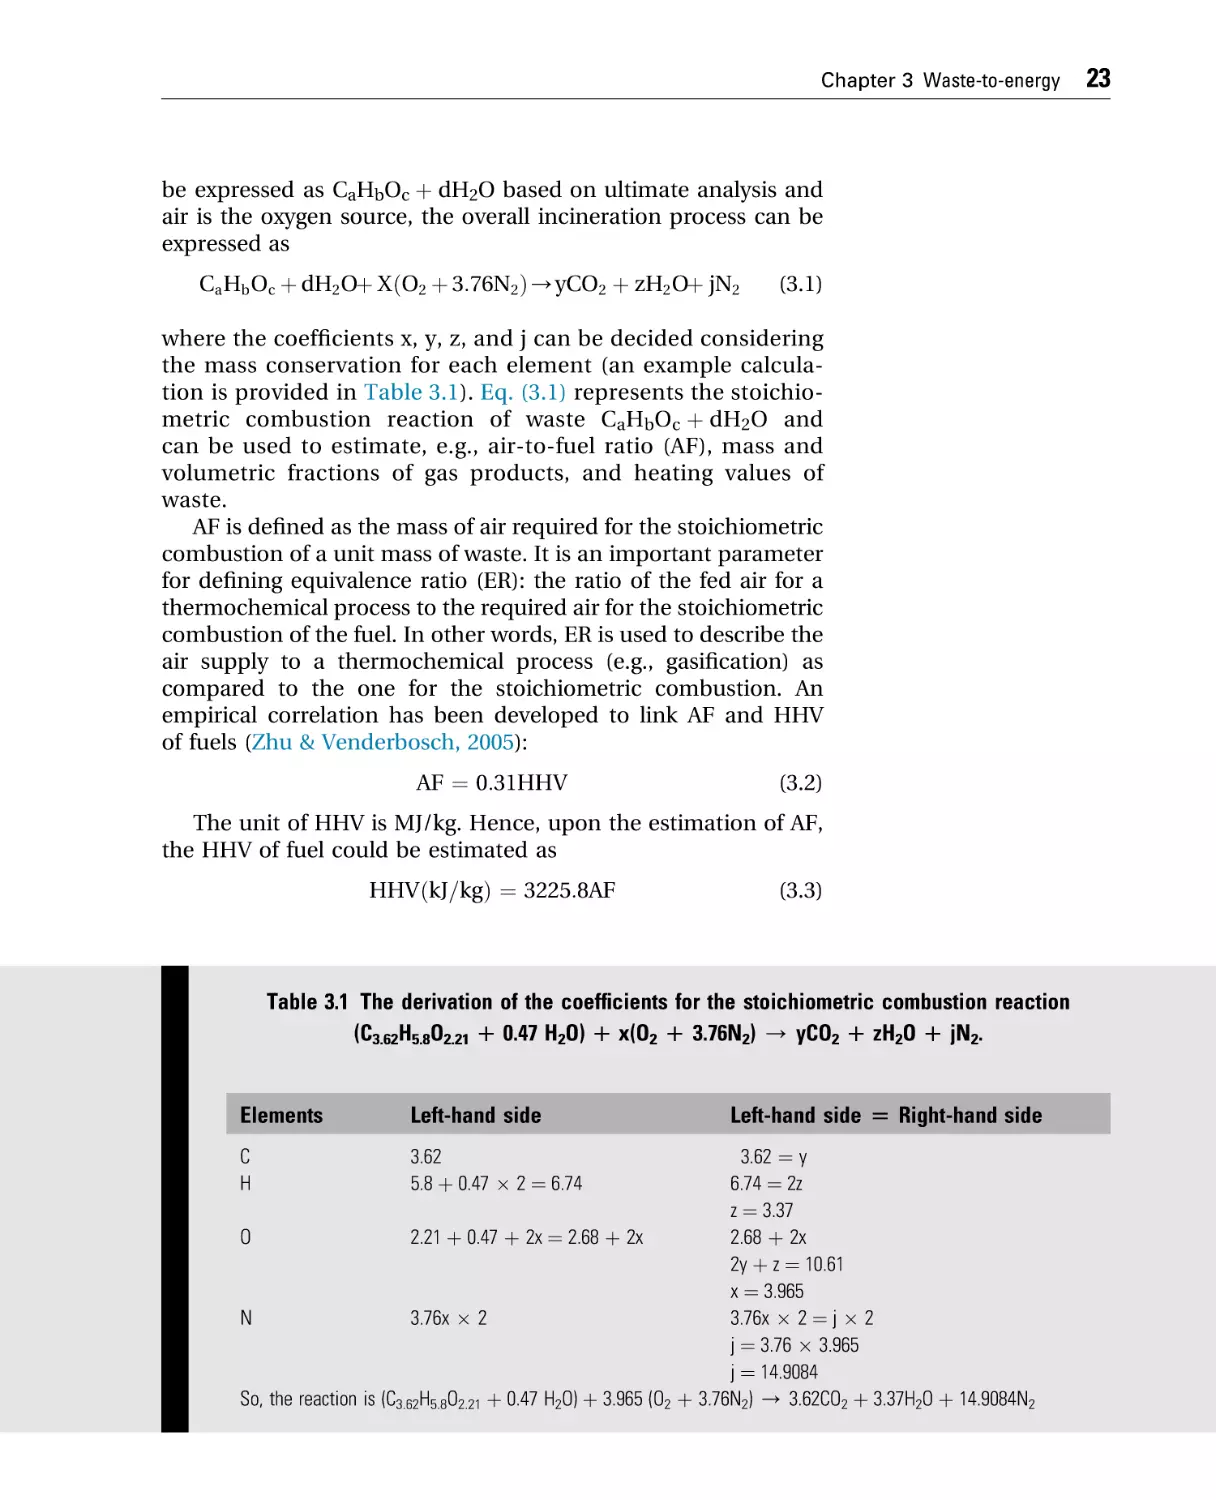
the mass conservation for each element (an example calculation is provided in Table 3.1). Eq. (3.1) represents the stoichiometric combustion reaction of waste CaHbOc þ dH2O and
can be used to estimate, e.g., air-to-fuel ratio (AF), mass and
volumetric fractions of gas products, and heating values of
waste.
AF is defined as the mass of air required for the stoichiometric
combustion of a unit mass of waste. It is an important parameter
for defining equivalence ratio (ER): the ratio of the fed air for a
thermochemical process to the required air for the stoichiometric
combustion of the fuel. In other words, ER is used to describe the
air supply to a thermochemical process (e.g., gasification) as
compared to the one for the stoichiometric combustion. An
empirical correlation has been developed to link AF and HHV
of fuels (Zhu & Venderbosch, 2005):
AF ¼ 0:31HHV
(3.2)
The unit of HHV is MJ/kg. Hence, upon the estimation of AF,
the HHV of fuel could be estimated as
HHVðkJ=kgÞ ¼ 3225:8AF
(3.3)
Table 3.1 The derivation of the coefficients for the stoichiometric combustion reaction
(C3.62H5.8O2.21 D 0.47 H2O) D x(O2 D 3.76N2) / yCO2 D zH2O D jN2.
Elements
Left-hand side
Left-hand side [ Right-hand side
3.62 ¼ y
6.74 ¼ 2z
z ¼ 3.37
O
2.21 þ 0.47 þ 2x ¼ 2.68 þ 2x
2.68 þ 2x
2y þ z ¼ 10.61
x ¼ 3.965
N
3.76x 2
3.76x 2 ¼ j 2
j ¼ 3.76 3.965
j ¼ 14.9084
So, the reaction is (C3.62H5.8O2.21 þ 0.47 H2O) þ 3.965 (O2 þ 3.76N2) / 3.62CO2 þ 3.37H2O þ 14.9084N2
C
H
3.62
5.8 þ 0.47 2 ¼ 6.74
23
24
Chapter 3 Waste-to-energy
Based on the reaction, the AF can be estimated by (using the
reaction determined in Table 3.1 as an example)
AF ¼
mair
3:965ðO2 þ 3:76N2 Þ
¼
mbiomass
mbiomass
3:965ð16 2 þ 3:76 14 2Þ
¼ 5:443
¼
100
Hence, HHV ¼ 3225:8 AF ¼ 3225:8 5:443
kJ
¼ 17558
¼ 17:558 MJ=kg.
kg
The reactors of incineration can be classified into three major
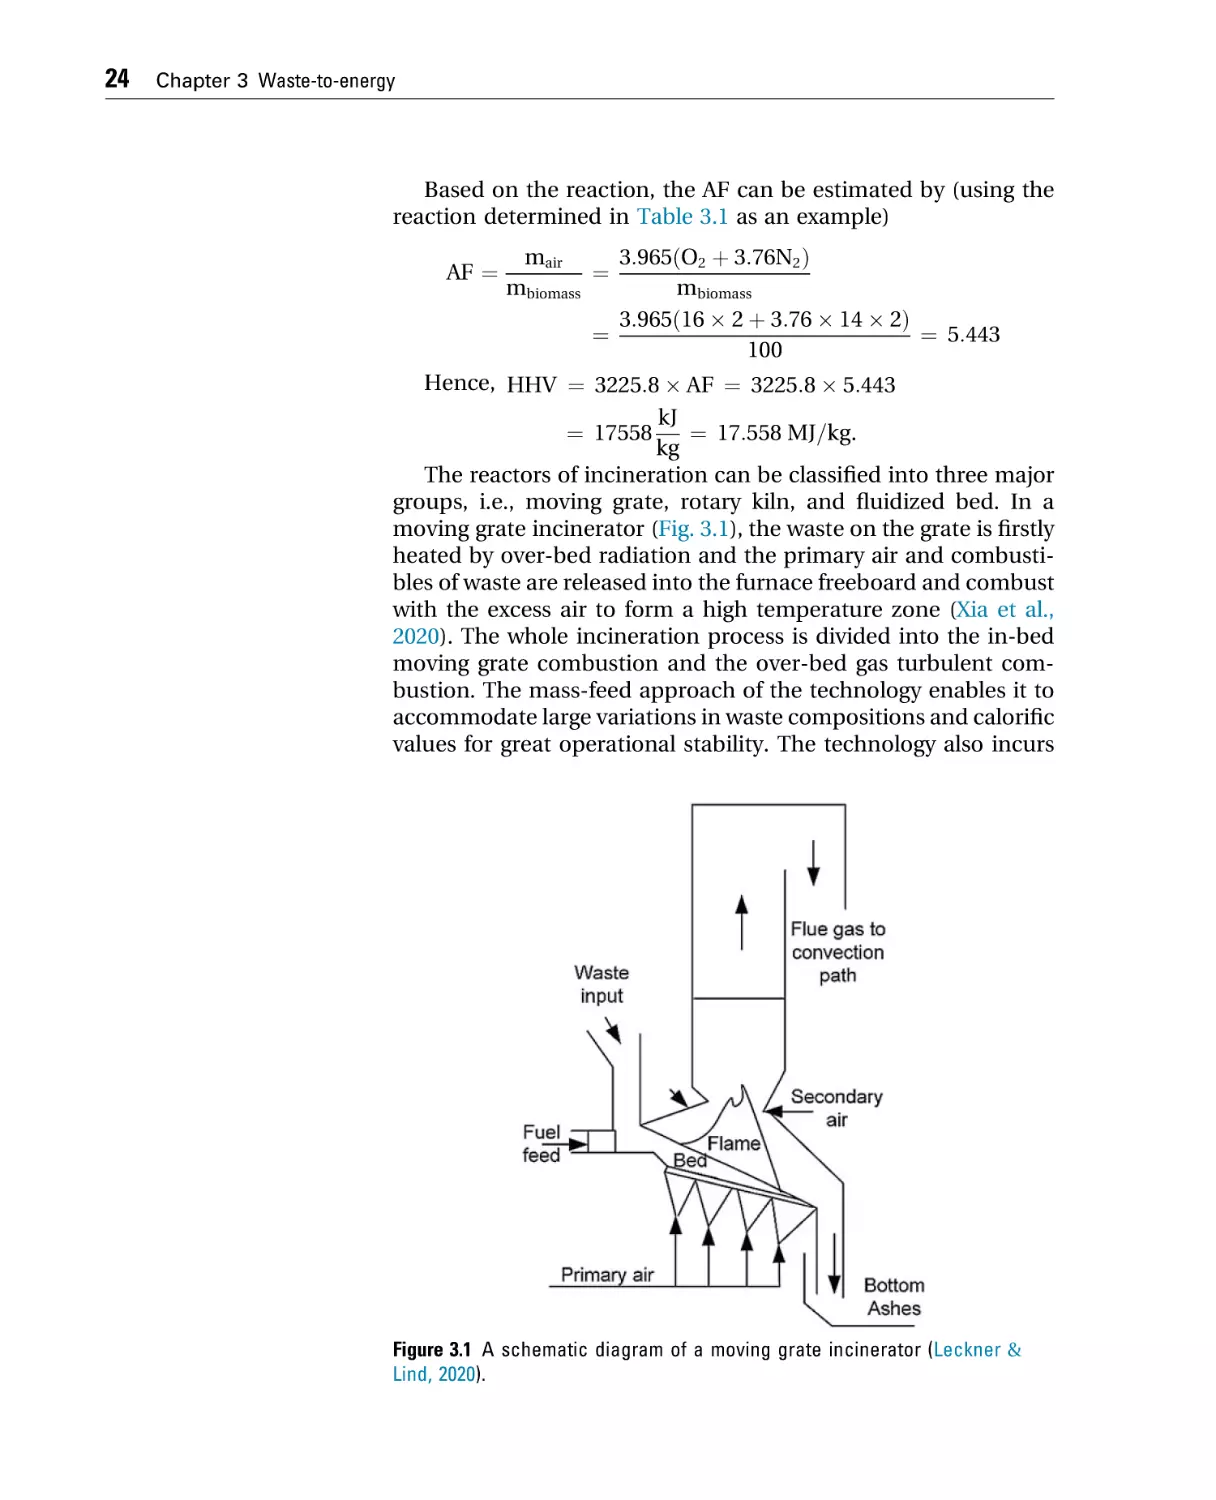
groups, i.e., moving grate, rotary kiln, and fluidized bed. In a
moving grate incinerator (Fig. 3.1), the waste on the grate is firstly
heated by over-bed radiation and the primary air and combustibles of waste are released into the furnace freeboard and combust
with the excess air to form a high temperature zone (Xia et al.,
2020). The whole incineration process is divided into the in-bed
moving grate combustion and the over-bed gas turbulent combustion. The mass-feed approach of the technology enables it to
accommodate large variations in waste compositions and calorific
values for great operational stability. The technology also incurs
Figure 3.1 A schematic diagram of a moving grate incinerator (Leckner &
Lind, 2020).
Chapter 3 Waste-to-energy
minimal preprocessing in the form of shredding, waste size reduction, and the removal of bulky materials such as white goods and
hazardous or explosive materials that may damage the incineration equipment (Magnanelli et al., 2020). As a result, the moving
grate incineration technology is suitable for handling massive
amount of wet, bulk, mixed waste at scales up to 50 tonnes of
waste per hour. 88%, 94%, and 76% of the incineration plants in
Europe, Germany, and the United Kingdom adopt the moving
grate technology (Lu et al., 2017). Their capital and operating
and maintenance costs, however, are normally higher than rotary
kiln and fluidized-bed incinerators.
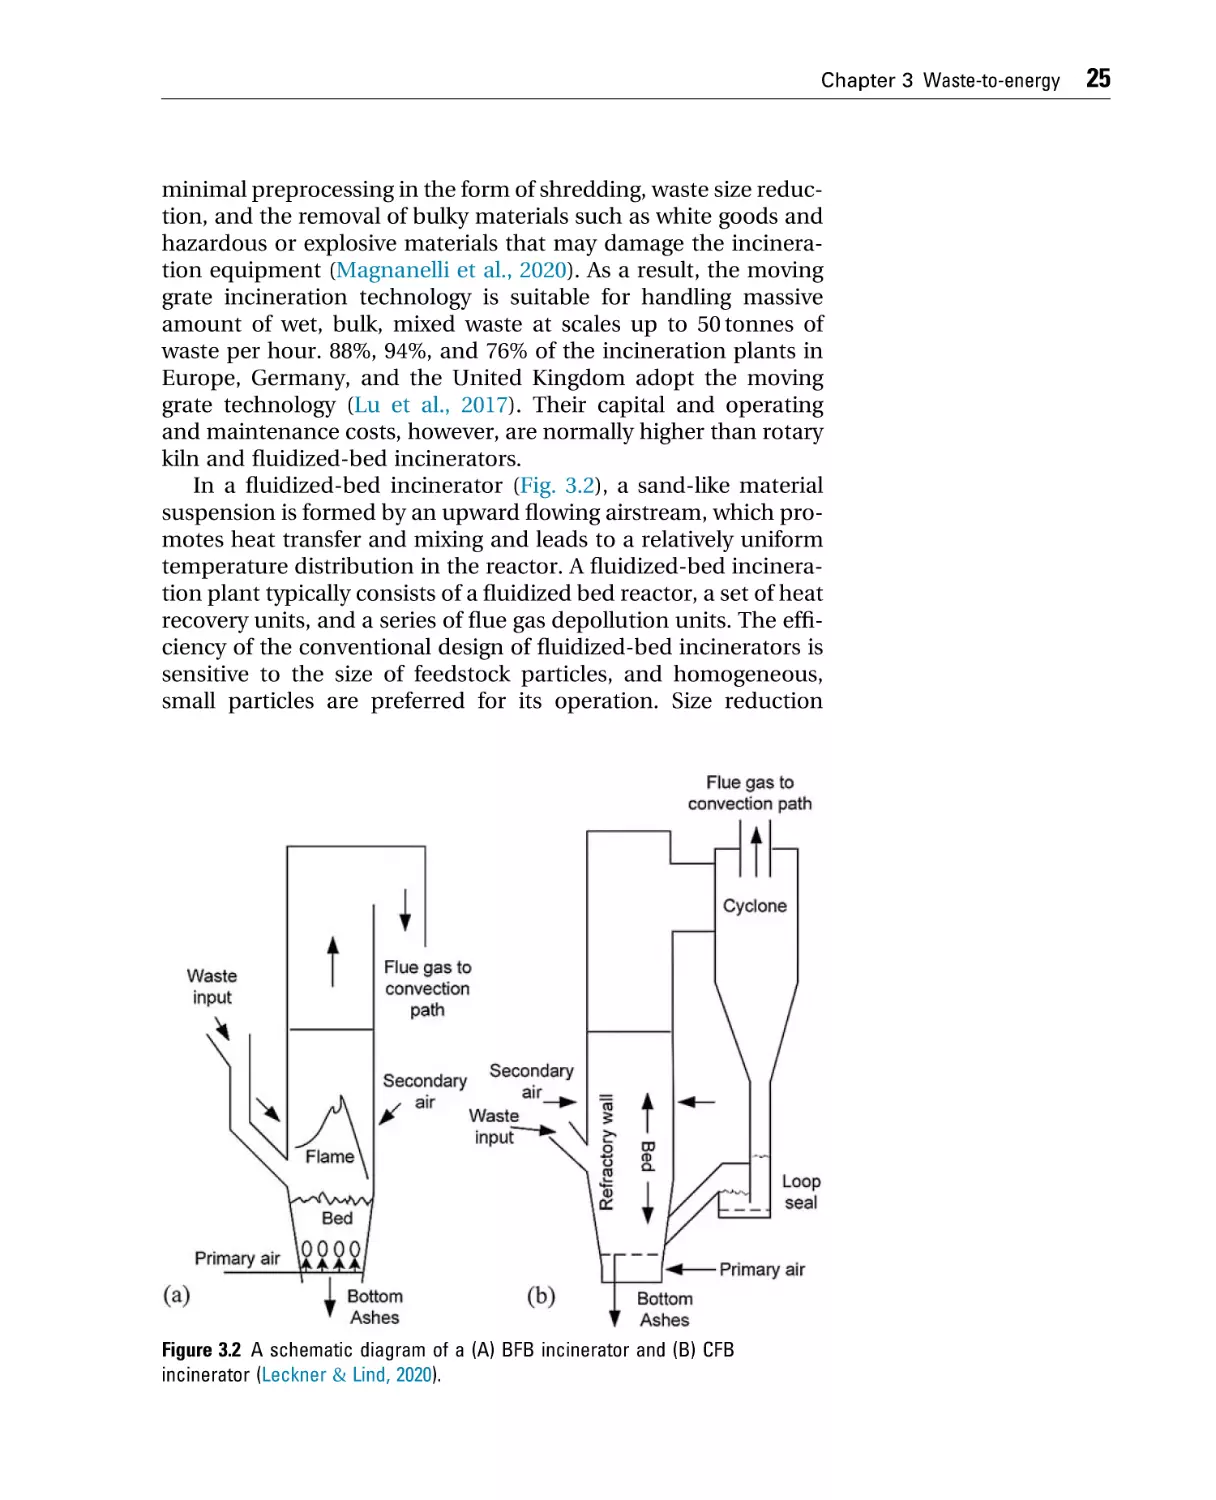
In a fluidized-bed incinerator (Fig. 3.2), a sand-like material
suspension is formed by an upward flowing airstream, which promotes heat transfer and mixing and leads to a relatively uniform
temperature distribution in the reactor. A fluidized-bed incineration plant typically consists of a fluidized bed reactor, a set of heat
recovery units, and a series of flue gas depollution units. The efficiency of the conventional design of fluidized-bed incinerators is
sensitive to the size of feedstock particles, and homogeneous,
small particles are preferred for its operation. Size reduction
Figure 3.2 A schematic diagram of a (A) BFB incinerator and (B) CFB
incinerator (Leckner & Lind, 2020).
25
26
Chapter 3 Waste-to-energy
pretreatment can be done using, e.g., high-speed low torque and
low-speed high torque hammer-mill shredders prior to fluidizedbed incineration.
Fluidized-bed incinerators are suitable for treating high moisture waste such as sewage sludge with the arrangement of preheating fluidization air for feedstock drying pretreatment
(Zhang et al., 2013). For high calorific waste, the temperature is
controlled by either an internal heat exchanger or the amount
of cold air fed to the reactor, while for very wet or low calorific
waste, preheated air is commonly used as fluidizing gas. To
improve the process efficiency, co-incineration is often adopted
where high moisture, low calorific waste is co-combusted with
high calorific fuel such as coal. For co-incineration of waste of
different properties (e.g., HHV), it is important to ensure proper
mixing prior to the process. The capital and operation and maintenance costs of fluidized bed incinerators are about 30% less
than that of moving grate incinerators (Fitzgerald, 2013). However, their high requirements in feedstock homogeneity and high
sensitivity to changes in the calorific value of feedstocks are technical challenges adversely affecting their competitiveness
(Hernandez-Atonal et al., 2007).
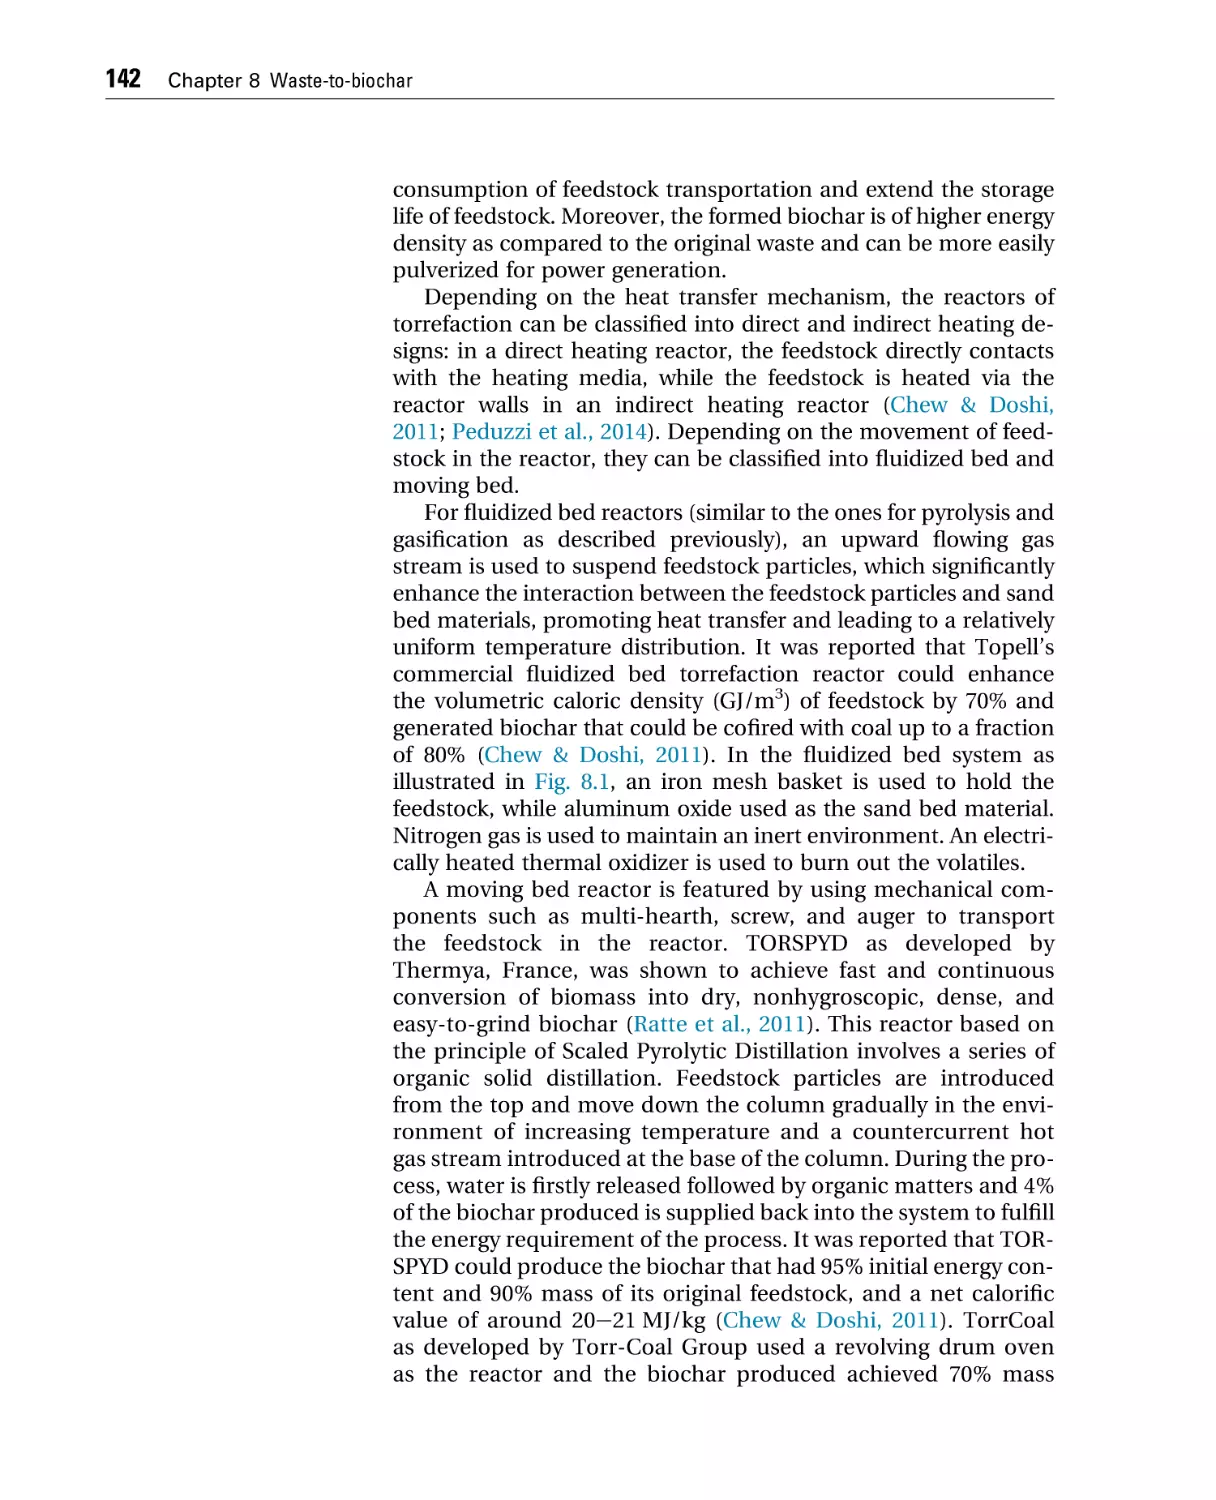
The enhanced heat transfer and mixing as well as the turbulence created in a fluidized bed reactor generally result in a
higher rate and efficiency of combustion and lower air pollutant
(e.g., NOx and CO) emissions as compared to that of moving grate
incinerators. However, a high chlorine content in waste can lead
to the problems of boiler corrosion and bed agglomeration and
increased emissions of such pollutants as HCl and PCDD/Fs
(Van Caneghem et al., 2012).
Depending on the way in which the flowing airstream is
arranged, fluidized-bed incinerators have three subcategories,
i.e., bubbling fluidized bed (BFB), circulating fluidized bed
(CFB), and rotating fluidized bed (RFB). For BFB (Fig. 3.2A), the
sand-like particles which are originally placed at the bottom of
the reactor are kept in suspension by a fluidizing airstream whose
velocity ranged between 0.5 and 3.0 m/s (Van Caneghem et al.,
2012). To ensure efficient combustion, the size distribution of
waste particles should not be too wide such that fine particles
are not fluidized out of the reactor prior to complete burnout
and large particles do not experience sufficient fluidization and
combustion. The particles collected in the cyclone of a BFB
reactor will be sent back to the reactor to ensure complete combustion. For CFB incinerators (Fig. 3.2B), a higher air stream
velocity (3.0e9.0 m/s) is used to develop an external circulation
for which feedstock particles are continuously carried out of the
Chapter 3 Waste-to-energy
reactor followed by reentrainment from the bottom of the reactor
after cyclone separation (Leckner & Lind, 2020; Van Caneghem
et al., 2012). For particles below the cut-size of the cyclone, they
are carried forward to the subsequent units such as boiler and
dedusting components. Secondary and tertiary air can be introduced in the riser, above the reentry point of the solids from the
external circulation loop.
In an RFB reactor (Fig. 3.3), an internally circulated flow was
formed by an uneven distribution of the primary air over the
distributor, and there are zones of strong and weak aeration corresponding to upflow and downflow sand stream, respectively (Van
Caneghem et al., 2012). This imposed bed circulation further enhances the mixing between feedstock particles and sand bed material, making RFB incinerators suitable for a wide range of waste
types (e.g., sludge, MSW, and industrial waste) and sizes (<30 mm).
Rotary kiln incinerators (Fig. 3.4) normally consist of a rotary
kiln where primary waste combustion reactions happen and a
secondary combustion chamber. The generated flue gas is used
to produce superheated steam for energy production (Lombardi
et al., 2013). Rotary kiln incinerators have been commonly applied
for destructing hazardous waste streams such as medical waste,
sludge, contaminated soil, and concentrated wastewater instead
of generating steam or energy (Vermeulen et al., 2012).
Electricity consumption of incineration plants was reported to
be 103.6 kWh/tonne of MSW, based on a mass-weighted average
for 90 French MSW incineration plants (Beylot et al., 2018).
Figure 3.3 A schematic diagram of an RFB incineration system (Van Caneghem et al., 2012).
27
28
Chapter 3 Waste-to-energy
Figure 3.4 A schematic diagram of a rotary kiln incineration system (Kajiwara et al., 2019).
The auxiliary power for an incineration power plant in China was
considered to be 20.0% of the total electricity generated (Tang
et al., 2020). The additional consumption of natural gas in incineration plants equipped with low and high temperature selective
catalytic reduction was shown to be 12.1 MJ/tonnes and 137 MJ/
tonnes of MSW, respectively (Beylot et al., 2018). Table 3.2 lists the
efficiencies of some of the incineration systems reported.
3. Pyrolysis
Pyrolysis is a thermochemical process where carbonaceous
materials are converted into product gas (syngas), liquid (biooil),
and solid (char or biochar) products, under an condition without
oxygen supply. The temperature range of the process is typically
between 200 and 650 C. Depending on the heating rate and residence time, pyrolysis is subcategorized into, e.g., carbonization,
slow pyrolysis, fast pyrolysis, and flash pyrolysis. Carbonization
is a very slow pyrolysis process featured by a very small heating
rate less than 0.01e2.0 C/s, a residence time of a couple of days,
Chapter 3 Waste-to-energy
Table 3.2 Efficiency data for incineration-based WtE.
Efficiency
Energy
Electricity (%) Heat (%) Country References
Electricity 14.96
22.5
28.6
Heat
e
CHP
5.73
16
e
e
e
41.25
41.21
28.5
France
China
Brazil
France
France
Germany
Beylot et al. (2018)
Tang et al. (2020)
Martin et al. (2021)
Beylot et al. (2018)
Beylot et al. (2018)
Mayer et al. (2020)
and an ultimate temperature less than 400 C (Basu, 2018). The
long residence time of the process promotes secondary char formation reactions and biochar is its primary product (>35 wt.%).
Slow pyrolysis can take up to several hours to complete and has
biochar as its primary product as well. A typical production of
slow pyrolysis is w30 wt.% biooil, w35 wt.% char, and w35 wt.%
product gas.
There have been numerous applications of slow pyrolysis
systems toward biochar production. BiGchar, an Australian company, employs vertical multirotary hearth furnaces for biochar
production, and the auxiliary heat of the system is designed to
come from partial combustion of volatiles (Garcia-Nunez et al.,
2017). Biomacon, a German-based company, manufactures pyrolysis plants with cofiring systems, with feedstock moisture tolerance of up to 50 wt.% and exhaust gas recirculation for low
emissions. Pyreg’s 500 kW system has two pyrolysis reactors for
heating and carbonization. The design of the system makes plant
installation and mobility easier. Chinese manufacturers, such as
Beston (Henan) Machinery Co Ltd, have developed similar technologies to handle various types of waste such as agricultural
residues, waste tires, and MSW (Williams, 2021).
The process of fast pyrolysis normally takes place in a matter
of seconds under the temperature condition of 425e500 C. It
has biooil as the primary product and a typical generation
includes w60e75 wt.% of biooil, w15e25 wt.% of biochar,
and w10e20 wt.% of product gas (Basu, 2018). For a typical fast
pyrolysis design, the biooil and biochar are used as fuels while
the product gas is combusted in, e.g., a boiler to supply heat to
the pyrolysis process to increase the overall process efficiency.
29
30
Chapter 3 Waste-to-energy
New pyrolysis technologies are also being explored with
microwave-assisted pyrolysis being one of the most significant
and promising ones for practical applications. Microwaveassisted pyrolysis makes use of microwave heating to achieve a
significant reduction in reaction time, increased quality of products, and reduced preparatory requirement of feedstock such as
shredding (Motasemi & Afzal, 2013). Microwave irradiation causes
molecular motion by migration of ionic species or rotation of
dipolar species to generate heat via the friction among molecules.
The characteristics of microwave heating are significantly
different from that of conventional thermal heating: microwave
heating is noncontact, of higher heating rate, material-selective,
volumetric, quicker in start-up and stopping, etc. The phenomena
and production of microwave-based waste treatment will potentially be different from that of thermal heating-based processes.
Pyrolysis-based biochar production is receiving increasing
attention due to its great potential for promoting soil quality
and agricultural productivities while sequestrating carbon upon
soil application. The International Biochar Initiative believes
that biochar production and its extensive use can play an important part in improving the global food security status and mitigating climate change (Lehmann & Joseph, 2015). Being a
carbon sequestration tool, it meets the recognition of the International Panel on Climate Change that considers carbon capture
and storage (CCS) as one of the key options for climate mitigation.
More details about biochar production will be given in Chapter 8.
Meanwhile, the production of biooil from the pyrolysis of waste
biomass offers many benefits such as less harmful effects to the
environment due to lower contents of sulfur and nitrogen in the
feedstock compared to fossil fuels. Biooil could be used as a fuel
for direct energy production, and high quality biooil can be utilized in standard internal combustion engines with minor
modifications.
The production of pyrolysis is affected by various factors such
as temperature, heating rate, feedstock composition, feedstock
particle size, reactor design, etc. For lignocellulosic waste, the pyrolysis production is also closely associated with the relative contents of hemicellulose, cellulose, and lignin of the waste. For
example, the cellulose composition is a major source for biooil
production, while lignin is mainly responsible for biochar production. Hence, high lignin content agricultural residues such
as cotton stalks, sugar cane trash, and rice shells serve as good
feedstocks for pyrolysis-based biochar production. Pyrolysis reactors can be classified through a wide range of factors such as the
required end needs of users, type of biomass being utilized, the
Chapter 3 Waste-to-energy
31
Table 3.3 Efficiency data for pyrolysis-based WtE.
Efficiency
Energy
Electricity (%)
Heat (%)
Country
References
Electricity
27.8
2
e
27.2
42.5 (total)
e
e
15.4
32.5
Germany
Japana
China
United Kingdom
United Kingdom
Dong et al. (2018)
Portugal-Pereira & Lee (2016)
Li & Feng (2018)
Yang et al. (2018)
Yang et al. (2017)
Heat
CHP
a
Net liquid fuel produced ¼ 199 L dry tonne/debris.
design and operation mode of reactors, reactor’s portability (stationary vs. mobile), etc. Based on the design and operation mode,
the classification of pyrolysis reactors is similar to that of gasification reactors which will be introduced in the next section. The energy efficiencies of pyrolysis-based WtE are listed in Table 3.3.
4. Gasification
Gasification is a thermochemical process where carbonaceous
materials are converted into two main products (i.e., syngas and
char or biochar) under an oxygen-deficient condition. The waste
gasification process with air being the agent can be expressed as
Ca Hb Oc þ dH2 O þ air/CO; CO2 ; H2 O; H2 ; CH4 and N2
þ tars þ particulates
(3.4)
Gasification typically occurs at a temperature >500 C. The
high heating value of MSW makes it a good feedstock for gasification, but there are concerns that MSW-derived biochar may not
be suitable for soil application due to potential contaminants in
waste feedstocks (Shackley et al., 2011). Key parameters affecting
the gasification process include feedstock types, moisture contents, gasifier types, gasifier bed temperature, and gasifying agent
types (Kalita & Baruah, 2018). Compared to pyrolysis, gasification
can generally achieve a higher energy recovery with a reasonable
biochar production (Shackley et al., 2012; Shackley et al., 2012).
For example, a biochar yield of about 35% was achieved by treating rice husk in 150e350 kWe downdraft gasifiers at temperatures
of 900e1100 C. The cold gas efficiency (ratio of HHV of the
32
Chapter 3 Waste-to-energy
produced gas to that of raw waste) for gasification was in a range
of 50%e80% with a hot gas efficiency (ratio of HHV and sensible
heat of the produced gas to that of raw waste) of 90% (Dong et
al., 2018). The actual efficiencies of the development are contingent upon the types of feedstocks used.
The gasification process typically involves four stages, i.e.,
drying, pyrolysis, combustion, and reduction. During the drying stage, the moisture content in waste is vaporized by the
heat normally coming from the exothermic reactions in the
combustion and reduction stage. A high moisture content in
waste will absorb the heat for water vaporization, reduce the
reaction temperature, and decrease the energy efficiency of
the overall process. The lowered temperature due to the high
moisture contents might result in higher tar formation in the
reactor and destabilize system operation. Additionally, a high
moisture content in the feedstock can lead to feedstock feeding
or fluidization problems, disrupting system operation (You
et al., 2018). On the other hand, a high moisture content
(<40 wt.%) might serve to supply water as a reactant to the
various reactions (e.g., wateregas reaction: C (s) þ H2O (g) 4
CO (g) þ H2 (g) (DH ¼ þ131 kJ/mol) and wateregas shift reaction: CO (g) þ H2O (g) 4 CO2 (g) þ H2 (g) (DH ¼ 41 kJ/mol))
of the reduction stage, potentially promoting hydrogen production (DH refers to the heat of reaction and negative values
denote exothermic reactions). The drying rate of feedstock
depends on various factors such as feedstock particle surface
area, the temperature difference between feedstock particles
and surrounding environment, moisture and convection velocity of surrounding flows, and diffusivity of moisture within the
feedstock.
During the pyrolysis stage, the feedstock molecules are
decomposed into condensable gases, tar, and char in the absence
of oxygen. The properties (e.g., carbon content, ash content, surface area, and pH) of the char produced in the stage are associated with the types/properties of feedstocks as well as the
thermochemical conditions such as temperature, residence
time, pressure, etc. As pyrolysis is an intermediate stage for
the gasification process, the products of this stage will undergo
additional thermochemical treatment during the subsequent
stages (i.e., combustion and reduction).
The combustion stage involves the complete or partial combustion of carbonaceous materials and some pyrolysis gas species
(e.g., CO, H2, CH4, and CnHm), producing H2O, CO2, and CO. It generates the heat needed for drying, pyrolysis, and other endothermic
reactions in the reduction stage. Main reactions of this stage
Chapter 3 Waste-to-energy
include C (s) þ ½ O2 (g) / CO (g) (DH ¼ 111 kJ/mol) (char partial
oxidation), C (s) þ O2 (g) / CO2 (g) (DH ¼ 394 kJ/mol) (char
complete oxidation), H2 (g) þ ½ O2 (g) / H2O (g)
(DH ¼ 242 kJ/mol) (gas oxidation), CO (g) þ ½ O2 (g) / CO2
(g) (DH ¼ 283 kJ/mol), and CH4 (g) þ ½ O2 (g) / CO (g) þ
2H2 (g) (DH ¼ 35.7 kJ/mol) (You et al., 2018).
During the reduction stage, char reacts with H2O, CO2, and
H2 to produce CO, H2, CH4, and other light hydrocarbons such
as acetylene (C2H2) and ethylene (C2H4). In this stage, reduction
reactions dominate over the combustion reactions. The final
production of this stage is affected by various factors such as
temperature, feedstock properties, gasifying agent (the oxygen
agent supplied to the system), pressure, and the ratio between
gasifying agent and feedstock. Generally, increasing temperature promotes the production of H2 and CO and reduces the
production of CO2 and CH4, hydrocarbons, and tar. The carbon
conversion efficiency (i.e., the ratio of the carbon mass flow in
product gas to the initial carbon mass in the feedstock) and
reaction rate increase as the temperature and pressure
increase. A higher moisture content decreases the CO content
but increases the CO2 content in the product gas.
Typical gasifying agents include air, O2, CO2, or H2O, but the
most commonly used gasifying agent is air because of its low
cost and readily availability. However, air being the gasifying
agent brings nitrogen to the product gas, reducing the heating
value of product gas against the subsequent energy generation.
For example, the heating value of product gas is 4e7 MJ/Nm3
for air, compared to 10e14 MJ/Nm3 for steam. Oxygen gasification
produces syngas with a heating value of 10e18 MJ/m3 but it is
costly due to the pure oxygen use (You et al., 2018). CO2 is
commonly used as a gasifying agent together with a catalyst to
promote the conversion of char, tar, and methane into syngas,
with an obvious benefit of consuming the carbon dioxide from
CCS. However, an external heat source is needed when steam or
CO2 is used. The presence of alkali and alkaline earth metallic
(AAEM) species in the original feedstock may enhance the syngas
production and char decomposition because of the catalytic effects of AAEM species. Typical reactions during the reduction
stage include C (s) þ CO2 (g) 4 2CO (g) (DH ¼ þ172 kJ/mol)
(Boudouard reaction), C (s) þ H2O (g) 4 CO (g) þ H2 (g)
(DH ¼ þ131 kJ/mol) (wateregas reaction), CO (g) þ H2O (g) 4
CO2 (g) þ H2 (g) (DH ¼ 41 kJ/mol) (wateregas shift reaction),
and C (s) þ 2H2 (g) 4 CH4 (g) (DH ¼ 75 kJ/mol) (methane reaction) (You et al., 2018).
33
34
Chapter 3 Waste-to-energy
Syngas mainly consists of hydrogen (H2), carbon monoxide
(CO), and carbon dioxide (CO2), with minor fractions of water
(H2O), methane (CH4), and nitrogen (N2) (if air is the gasifying
agent supplying the nitrogen). Syngas can be transformed into
more useful energy forms such as heat and electricity or upgraded
to hydrogen with a high level of purity. As compared to incineration, gasification has a higher efficiency (30% vs. 10%e20% for
incineration) and lower emissions (NOx and particulate emissions). The NOx emissions for gasification are far lower (6 mg
per ton dry biomass) than combustion (43.5 mg per ton dry
biomass) due to lower operating temperature and limited oxygen
in comparison to the direct combustion process that occurs at a
temperatre greater than 1000 C with a sufficient air supply (Guo
et al., 2020).
Biochar, as introduced previously, is typically produced in the
amount no more than 20 wt.% of raw waste for a gasification process. Conventionally, the aim of gasification is to achieve a high
syngas yield for maximum energy recovery. The application of
gasification biochar has often been ignored previously, but it is
gaining increasing attention because of biochar’s great potential
for enhancing soil quality and sequestering carbon (You et al.,
2017). Additional application possibilities are also being explored
including using biochar as an adsorbent for electrochemical applications or mitigating water contamination (more details in
Chapter 8). Tar is an undesired by-product of gasification as it
may block and corrode the piping of gasification system,
increasing the technical difficulty and costs of system operation
and maintenance. Hence, tar reduction and control is one of
the most significant technical challenges against gasification
development.
There are three different types of gasification reactors: fixed
bed, fluidized bed, and entrained flow (Fig. 3.5) (You et al., 2018).
Fixed bed gasifiers are featured by their simple configuration and
Figure 3.5 Different gasification reactor configurations: (A) updraft fixed bed, (B) downdraft fixed bed, (C) bubbling
fluidized bed, (D) circulating fluidized bed, and (E) entrain flow (You et al., 2018).
Chapter 3 Waste-to-energy
cost-efficiency under small-scale (10 kWe10 MW), decentralized
applications. In a fixed bed gasifier, four stratified temperature
zones are formed corresponding to the four gasification stages.
This stratification limits the heat transfer and the mixing of gas
and solids and causes an uneven temperature distribution in the
reactor.
Fixed bed gasifiers are further divided to downdraft and updraft designs. In an updraft fixed bed gasifier (Fig. 3.5A), the gasifying agent is supplied to the reactor from the bottom, and the
feedstock is fed from the top. The upward flowing gas brings the
heat from the combustion zone to the drying zone, significantly
enhancing the drying efficiency. Hence, updraft fixed bed gasifiers
have a higher feedstock moisture content tolerance (up to
50 wt.%) (You et al., 2018). High thermal efficiencies can be
achieved because of the enhanced heat exchange between the
upflowing gas flow and descending feedstock. Different from
downdraft fixed bed gasifiers, the product gas exits from upper
part of the reactor, so the deposited ash has a lower chance to
interact with the product gas due to the filtering effect of the
bed. Hence, updraft fixed bed gasifiers are suitable for feedstocks
with high ash contents (up to 15 wt.%). However, updraft fixed
bed gasifiers are not suitable for feedstocks with high volatile contents because the upflowing gas passing through the pyrolysis
zone might introduce tar to the product gas.
In a downdraft gasifier (Fig. 3.5B), the gasifying agent is introduced into the gasifier at the combustion zone and the feedstock
is fed from the top of the gasifier, while the product gas exits the
reactor from the bottom. This design reduces the upward heat
transfer from the combustion zone to the drying zone, lowering
the drying efficiency of feedstock around the top of the reactor.
Hence, the moisture content of the waste treated in downdraft
gasifiers needs to be lower than 20 wt.%, suggesting a need of drying pretreatment for moist waste such as food waste and sewage
sludge (Anukam et al., 2016). Due to the proximity of the product
gas exit and the ash deposit at the bottom, the product gas can be
easily contaminated by particulates, and additional measures are
needed to purify the product gas prior to its application for, e.g.,
energy generation. The gas flow brings the tar formed at the pyrolysis zone to the combustion zone whose relatively high temperature facilitates a thermal cracking effect on tar, reducing the tar
content (1 g/m3) of product gas (Guo et al., 2020). Compared to
updraft fixed bed gasifiers, the decarburization and dehydrogenation reactions in the reduction zone of downdraft gasifiers are
more efficient. Downdraft fixed bed downdraft gasifiers are the
most economically feasible option for small-scale application
35
36
Chapter 3 Waste-to-energy
with the potential to produce clean syngas for direct energy generation (Dimpl, 2010). They were also considered as the best
choice for treating certain feedstocks such as bagasse based on
such criteria as syngas quality, tar content, ease and cost of operation, and scalability (Anukam et al., 2016).
Similar to the fluidized bed incinerators, fluidized bed gasifiers
are featured by the formation of a semisuspended bed by
an upward-flowing gasifying agent. They are suitable for
intermediate-scale applications (5e100 MW) (You et al., 2018).
Sand-like inertial bed materials are used for fluidisation, and a
postreactor separation process is needed to separate biochar particles from the bed materials. The gasification process involves the
continuous mixing and output of feedstock particles, both gasified
and partially gasified. At atmospheric pressure and bed temperature lower than 910 C, the total carbon conversion efficiency in
fluidized bed gasifiers was reported to range from 70% to 85%
for an ER of 0.2e0.3. For fluidized bed gasifiers, the tar content
of product gas ranges from 2 to 20 g/m3. Fluidized bed gasifiers
can be further categorized into bubbling bed and circulating
bed designs.
For bubbling fluidized bed gasifiers (Fig. 3.5C), the excess gas
flow relative to the fluidization flow that maintains the minimum
fluidization condition leads to the formation of bubbles. The bubble diameter, bubble velocity, the area fraction of bubbles, and
interphase gas transfer rate increase with increasing temperature
but decrease with an increasing bed particle size. For bubbling
fluidized bed gasifiers, an excessively high temperature could
cause problems such as ash melting, sintering, and slagging
(defluidization).
For circulating fluidized bed gasifiers (Fig. 3.5D), the fluidization velocity is higher than that of bubbling bed gasifiers so
that the feedstock particles can be suspended across the whole
riser height. An external circulation channel is designed so that
the particles coming out of the main reactor can be returned to
it for further treatment. A cyclone is used for separating particles from the product gas while the return leg guides the separated particles back to the reaction vessel. This recirculating
mechanism increases the residence time of feedstock particles
as compared to bubbling fluidized bed gasifiers. Hence, circulating fluidized bed gasifiers have a less stringent requirements
on (high) temperature and can be operated at relatively low
temperatures (<750 C), mitigating various ash sinteringe
related problems such as fouling and corrosion (You et al.,
2018).
Chapter 3 Waste-to-energy
37
Table 3.4 Efficiency data for gasification-based WtE.
Efficiency
Energy
Reactor types
Electricity (%)
Heat (%)
Country
References
Electricity
Circulating fluidized bed
Downdraft fixed bed
e
e
Fluidized bed
Fluidized bed
27.4
15.8e25
16e45
29.1e32.9
23.6
27
e
e
e
Finland
e
Iceland
Czech
Italy
France
Dong et al. (2019)
Lee et al. (2013)
Safarian et al. (2020)
Brynda et al. (2020)
Moradi et al. (2020)
Francois et al. (2013)
CHP
e
39
For entrained flow gasifiers (Fig. 3.5E), the waste and gasifying
agent are fed together into the reactor from the top. They are normally used in large-scale applications (>50 MW), especially for integrated gasification combined cycle plants (You et al., 2018). The
residence time of the process is short, ranging from a few to tens
of seconds, so a high temperature is required, which is effective
for removing most of the tar and achieving a high carbon conversion efficiency (95%e99%). The carbon conversion efficiency is
the ratio of the carbon mass flow in the product gas to the carbon
mass in the raw feedstock. However, the short residence time requires that fine feedstock particles are used in the process. This
means that fibrous waste or biomass is less suitable for entrained
flow gasification as the grinding of the feedstock into fine particles
will incur significant energy and costs. To facilitate the feeding
process, fine particles are often mixed with water to form bioslurry, and the added water can serve as a reactant (e.g., for the
water-gas shift reaction) to promote H2 production. Existing efficiency data for gasification-based WtE development are listed in
Table 3.4.
5. Anaerobic digestion
AD is a biochemical process that makes use of anaerobic microorganisms to decompose organic waste (e.g., food waste,
manure, and crop residues) into a main gas product called biogas
and a by-product called digestate in an oxygen-free environment.
AD biogas generally consists of 50e70 vol.% CH4, 30e50 vol.% of
CO2, and trace amounts of other gases such as H2, N2, H2S, water
vapor, and other impurities (Li et al., 2019). Raw biogas can be
38
Chapter 3 Waste-to-energy
upgraded and used as a transport fuel or added to local gas networks to displace the use of fossil natural gas. More commonly
it can be combusted to produce heat and power, e.g., in an engine
after certain purification processes. Digestate is rich in nutrients
(e.g., nitrogen (N), phosphorus (P), and potassium (K)) and can
be used as a biofertilizer for agricultural applications. The use of
digestate has such benefits as lowered global warming potential
and acidification potential in comparison to mineral or chemical
fertilizers (Lijó et al., 2014). Hence, upon the design of AD-based
WtE generation, it is important to combine the application of
digestate with the primary objective of energy generation to
achieve greater environmental benefits.
An AD process involves four sequential stages, i.e., hydrolysis,
acidogenesis, acetogenesis, and methanogenesis. During the hydrolysis stage, large, insoluble organic polymers (e.g., fats, proteins, and carbohydrates) are broken down into the monomeric
forms of long-chain fatty acids, amino acids and glucose, respectively, under the effect of an exoenzyme, water molecules, and
acidogenic bacteria. A typical hydrolysis reaction is about the
splitting of glycosidic links, necessary for catalytic transformation
of cellulose, expressed by (Anukam et al., 2019),
ðC6 H10 O5 Þn þ nH2 O/nC6 H12 O6 þ nH2
(3.5)
This reaction shows that the hydrolysis of cellulose (C6H10O5)
with water (H2O) forms glucose (C6H12O6) and H2 (to be used in
the methanogenesis stage). For MSW, the reaction rate of the stage
can be relatively low, limiting the rate of the overall AD process. Mechanical, thermal, or chemical pretreatment can be applied to
improve the degradability of MSW for higher biogas yields.
During the acidogenesis stage, the soluble compounds produced in the hydrolysis stage are converted into various products such as volatile fatty acids (VFAs), ammonia (NH3), CO2,
hydrogen sulfide (H2S), etc., by the work of acidogenic bacteria.
Typical reactions of the stage include (Anukam et al., 2019)
C6 H12 O6 42CH3 CH2 OH þ 2CO2
C6 H12 O6 þ 2H2 42CH3 CH2 COOH þ 2H2 O
(3.6)
C6 H12 O6 /3CH3 COOH
The acetic acid (CH3COOH) formed will be consumed by the
methane-producing bacteria and serves as a substrate for CH4
production in the subsequent stage. It is hard to distinguish between the acidogenic and acetogenic reactions as H2 and acetate
(CH3COO) are key outputs of both.
Acetogenesis, or dehydrogenation, converts the simple
molecules (e.g., propionic and butyric acids) produced in the
Chapter 3 Waste-to-energy
acidogenesis stage into hydrogen (H2), carbon dioxide (CO2), and
acetic acid (Anukam et al., 2019):
þ
CH3 CH2 COO þ 3H2 O/CH3 COO þ HC O
3 þ H þ 3H2
CH3 CH2 OH þ H2 O/CH3 COO þ Hþ þ 2H2
(3.7)
C6 H12 O6 þ 2H2 O42CH3 COOH þ 2CO2 þ 4H
Homoacetogenic bacteria can further use the H2 and CO2
formed to yield additional acetic acid. The overall efficiency of
the biogas production is largely controlled by the acetogenesis
stage because the reduction of CH3COO accounts for 70% of
the CH4 production.
In the final stage (methanogenesis), methanogenic bacteria
consume the previously formed acetic acid, H2, and other compounds (e.g., formic acid and methanol) to generate CH4 and
CO2. The methanogenic bacteria are highly sensitive to the
changes of digester environment. The consumption of the protons and VFAs by methanogens mitigates the environment
change of digester and the inhibition of biodegradation. The efficiency of this stage is primarily determined by the digestion of
carbon-based compounds, such as formic acid and methanol.
Two of the major CH4-producing reactions of the stage are (1)
the breakdown of acetic acid performed by the acetophilic bacteria group with the process decarboxylation, and (2) the reduction
of CO2 and H2 by the hydrogenophilic bacteria group (Korres
et al., 2013):
CH3 COOH/CH4 þ CO2
CO2 þ 4H2 /CH4 þ 2H2 O
(3.8)
The performance of AD depends on a variety of factors such as
feedstock types, temperature, pH, retention time, etc. The
composition and properties of feedstock, temperature, and pH
affect the ecosystem of a digester and thus the metabolic rate
of microorganisms carrying out the decomposition process. The
retention time directly determines the length of time for which
organic matter is left to decompose. The retention time is also
closely related to the organic loading rate (the quantity of volatile
solids entering a digester per day) for continuous AD reactors. A
longer retention time and a low organic loading rate generally
promote CH4 generation (Mao et al., 2015).
Common AD waste feedstocks include animal manure,
sewage sludge, and food waste whose compositions vary significantly as shown in Chapter 2. The variations in the properties
of the feedstocks can lead to considerable performance differences in their AD processes. Food waste is an excellent feedstock
for AD. However, the AD of food waste suffers from a potential
39
40
Chapter 3 Waste-to-energy
risk of instability due to nutrient imbalance (optimal C/N ratio is
between 20 and 35), and the codigestion of food waste with animal manure has been suggested as a good strategy for achieving a
more stable AD process (Mao et al., 2015). Similarly, the codigestion of food waste and cow manure was able to achieve a higher
biogas yield than mono-digestion of cow manure (Xing et al.,
2020). Finally, depending on the content of total solids associated
with the types of raw feedstocks, there are wet AD (<15% total
solids) and high solid AD designs.
AD microorganisms are sensitive to the environmental conditions, in particular temperature and pH. Depending on the range
of temperature, AD can be classified into mesophilic (35 1 C)
and thermophilic (55 1 C) processes which serve to promote the
activities of different species of bacteria for the decomposition of
organic materials. Upon the treatment of kitchen waste, it was found
that thermophilic conditions led to higher CH4 yields than mesophilic conditions (Jiang et al., 2018). The main strengths of mesophilic AD include increased stability and lower energy demands as
compared to thermophilic AD, which makes mesophilic AD more
suitable for nitrogen-rich organic materials (e.g., sludge) (Yin et al.,
2018).
The stability of an AD system is also closely related to its pH
condition. In general, a pH range between 6.8 and 7.4 is desirable
for AD, although the optimal pH condition varies across the
different stages with a pH of 5.5e6.5 for acidogenesis and a pH
of 6.5e8.2 for methanogenesis (Mao et al., 2015). As the AD process goes on, the digester environment will get acidified and an
overly acidic or alkaline environment (<6 or >8.5) inhibits the activities of microorganisms and thus reduces biogas production
(Uçkun Kiran et al., 2016). The reported biogas yield ranged
from 105 m3/tonne wet weight (ww) to 190 m3/tonne ww,
depending on the various factors (Ascher et al., 2020). Existing efficiency data for AD-based WtE development is listed in Table 3.5.
Table 3.5 Efficiency data for AD-based WtE.
Efficiency
Energy
Electricity (%)
Heat (%)
References
Electricity
CHP
37
30
40
33
90
e
55
45
38
Di Maria et al. (2019)
O’Connor et al. (2020)
Masebinu et al. (2018)
Huiru et al. (2019)
Di Maria et al. (2019)
Chapter 3 Waste-to-energy
References
Anukam, A., Mamphweli, S., Reddy, P., Meyer, E., & Okoh, O. (2016). Preprocessing of sugarcane bagasse for gasification in a downdraft biomass
gasifier system: A comprehensive review. Renewable and Sustainable Energy
Reviews, 66, 775e801. https://doi.org/10.1016/j.rser.2016.08.046
Anukam, A., Mohammadi, A., Naqvi, M., & Granström, K. (2019). A review of the
chemistry of anaerobic digestion: Methods of accelerating and optimizing
process efficiency. Processes, 7(8). https://doi.org/10.3390/pr7080504
Ascher, S., Li, W., & You, S. (2020). Life cycle assessment and net present worth
analysis of a community-based food waste treatment system. Bioresource
Technology, 305, 123076.
Basu, P. (2018). Biomass gasification, pyrolysis and torrefaction: Practical design
and theory. Academic Press.
nard, Y., & Villeneuve, J. (2018).
Beylot, A., Hochar, A., Michel, P., Descat, M., Me
Municipal solid waste incineration in France: An overview of air pollution
control techniques, emissions, and energy efficiency. Journal of Industrial
Ecology, 22(5), 1016e1026. https://doi.org/10.1111/jiec.12701
o, Z., Soukup, K., Jeremia
s, M.,
Brynda, J., Skoblia, S., Pohorelý, M., Ben
Mosko, J., Zach, B., Trakal, L., Syc,
M., & Svoboda, K. (2020). Wood chips
gasification in a fixed-bed multi-stage gasifier for decentralized highefficiency CHP and biochar production: Long-term commercial operation.
Fuel, 281, 118637. https://doi.org/10.1016/j.fuel.2020.118637
Di Maria, F., Sisani, F., Norouzi, O., & Mersky, R. L. (2019). The effectiveness of
anaerobic digestion of bio-waste in replacing primary energies: An EU28 case
study. Renewable and Sustainable Energy Reviews, 108, 347e354. https://
doi.org/10.1016/j.rser.2019.03.047
Dimpl, E. (2010). Small-scale electricity generation from biomass. Part I: Biomass
gasification. https://energypedia.info/images/9/93/Small-scale_Electricity_
Generation_From_Biomass_Part-1.pdf.
Dong, J., Tang, Y., Nzihou, A., & Chi, Y. (2019). Key factors influencing the
environmental performance of pyrolysis, gasification and incineration
Waste-to-Energy technologies. Energy Conversion and Management, 196,
497e512. https://doi.org/10.1016/j.enconman.2019.06.016
Dong, J., Tang, Y., Nzihou, A., Chi, Y., Weiss-Hortala, E., & Ni, M. (2018). Life
cycle assessment of pyrolysis, gasification and incineration waste-to-energy
technologies: Theoretical analysis and case study of commercial plants.
Science of the Total Environment, 626, 744e753. https://doi.org/10.1016/
j.scitotenv.2018.01.151
FAO. (2014). Food waste footprint - full-cost accounting. http://www.fao.org/3/
i3991e/i3991e.pdf.
Fitzgerald, G. C. (2013). 5 - pre-processing and treatment of municipal solid
waste (MSW) prior to incineration. In N. B. Klinghoffer, M. J. B. T.-W, &
E. C. T. Castaldi (Eds.), Woodhead publishing series in energy (pp. 55e71).
Woodhead Publishing. https://doi.org/10.1533/9780857096364.2.55
Francois, J., Abdelouahed, L., Mauviel, G., Patisson, F., Mirgaux, O., Rogaume, C.,
Rogaume, Y., Feidt, M., & Dufour, A. (2013). Detailed process modeling of a
wood gasification combined heat and power plant. Biomass and Bioenergy,
51, 68e82. https://doi.org/10.1016/j.biombioe.2013.01.004
Garcia-Nunez, J. A., Pelaez-Samaniego, M. R., Garcia-Perez, M. E., Fonts, I.,
Abrego, J., Westerhof, R. J. M., & Garcia-Perez, M. (2017). Historical
developments of pyrolysis reactors: A review. Energy & Fuels, 31(6),
5751e5775. https://doi.org/10.1021/acs.energyfuels.7b00641
41
42
Chapter 3 Waste-to-energy
Gherghel, A., Teodosiu, C., & De Gisi, S. (2019). A review on wastewater sludge
valorisation and its challenges in the context of circular economy. Journal of
Cleaner Production, 228, 244e263. https://doi.org/10.1016/
j.jclepro.2019.04.240
Guo, M., He, Z., & Uchimiya, S. M. (2020). Agricultural and environmental
applications of biochar: Advances and barriers. John Wiley & Sons.
Hernandez-Atonal, F. D., Ryu, C., Sharifi, V. N., & Swithenbank, J. (2007).
Combustion of refuse-derived fuel in a fluidised bed. Chemical Engineering
Science, 62(1), 627e635. https://doi.org/10.1016/j.ces.2006.09.025
Huiru, Z., Yunjun, Y., Liberti, F., Pietro, B., & Fantozzi, F. (2019). Technical and
economic feasibility analysis of an anaerobic digestion plant fed with
canteen food waste. Energy Conversion and Management, 180, 938e948.
https://doi.org/10.1016/j.enconman.2018.11.045
IEA. (2020). Bioenergy power generation. https://www.iea.org/reports/bioenergypower-generation.
Jiang, J., Li, L., Cui, M., Zhang, F., Liu, Y., Liu, Y., Long, J., & Guo, Y. (2018).
Anaerobic digestion of kitchen waste: The effects of source, concentration,
and temperature. Biochemical Engineering Journal, 135, 91e97. https://
doi.org/10.1016/j.bej.2018.04.004
Kajiwara, N., Noma, Y., Matsukami, H., Tamiya, M., Koyama, T., Terai, T.,
Koiwa, M., & Sakai, S. (2019). Environmentally sound destruction of
hexachlorobutadiene during waste incineration in commercial- and pilotscale rotary kilns. Journal of Environmental Chemical Engineering, 7(6),
103464. https://doi.org/10.1016/j.jece.2019.103464
Kalita, P., & Baruah, D. (2018). Investigation of biomass gasifier product gas
composition and its characterization. In Coal and biomass gasification.
Energy, environment, and sustainability (pp. 115e149). Singapore: Springer.
https://doi.org/10.1007/978-981-10-7335-9_5
Korres, N., O’Kiely, P., Benzie, J. A., & West, J. S. (2013). Bioenergy production by
anaerobic digestion: Using agricultural biomass and organic wastes.
Routledge.
Leckner, B., & Lind, F. (2020). Combustion of municipal solid waste in fluidized
bed or on grate e a comparison. Waste Management, 109, 94e108. https://
doi.org/10.1016/j.wasman.2020.04.050
Lee, U., Balu, E., & Chung, J. N. (2013). An experimental evaluation of an
integrated biomass gasification and power generation system for distributed
power applications. Applied Energy, 101, 699e708. https://doi.org/10.1016/
j.apenergy.2012.07.036
Lehmann, J., & Joseph, S. (2015). Biochar for environmental management:
Science, technology and implementation (2nd ed.). Routledge.
Li, H., & Feng, K. (2018). Life cycle assessment of the environmental impacts and
energy efficiency of an integration of sludge anaerobic digestion and
pyrolysis. Journal of Cleaner Production, 195, 476e485.
Li, Y., Alaimo, C. P., Kim, M., Kado, N. Y., Peppers, J., Xue, J., Wan, C.,
Green, P. G., Zhang, R., Jenkins, B. M., Vogel, C. F. A., Wuertz, S.,
Young, T. M., & Kleeman, M. J. (2019). Composition and toxicity of biogas
produced from different feedstocks in California. Environmental Science and
Technology, 53(19), 11569e11579. https://doi.org/10.1021/acs.est.9b03003
lez-García, S., Bacenetti, J., Fiala, M., Feijoo, G., Lema, J. M., &
Lijó, L., Gonza
Moreira, M. T. (2014). Life Cycle Assessment of electricity production in Italy
from anaerobic co-digestion of pig slurry and energy crops. Renewable
Energy, 68, 625e635. https://doi.org/10.1016/j.renene.2014.03.005
Chapter 3 Waste-to-energy
Lombardi, F., Lategano, E., Cordiner, S., & Torretta, V. (2013). Waste incineration
in rotary kilns: A new simulation combustion tool to support design and
technical change. Waste Management & Research, 31(7), 739e750. https://
doi.org/10.1177/0734242X13484187
s, E. G., & Gonza
lez, S. M. E. (2016). Energy security
Lucas, V., Noel, J., France
and renewable energy deployment in the EU: Liaisons dangereuses or
virtuous circle? Renewable and Sustainable Energy Reviews, 62, 1032e1046.
https://doi.org/10.1016/j.rser.2016.04.069
Lu, J.-W., Zhang, S., Hai, J., & Lei, M. (2017). Status and perspectives of
municipal solid waste incineration in China: A comparison with developed
regions. Waste Management, 69, 170e186.
Magnanelli, E., Tranås, O. L., Carlsson, P., Mosby, J., & Becidan, M. (2020).
Dynamic modeling of municipal solid waste incineration. Energy, 209,
118426. https://doi.org/10.1016/j.energy.2020.118426
Makarichi, L., Jutidamrongphan, W., & Techato, K. (2018). The evolution of
waste-to-energy incineration: A review. Renewable and Sustainable Energy
Reviews, 91, 812e821.
Mao, C., Feng, Y., Wang, X., & Ren, G. (2015). Review on research achievements
of biogas from anaerobic digestion. Renewable and Sustainable Energy
Reviews, 45, 540e555. https://doi.org/10.1016/j.rser.2015.02.032
Martin, E. J. P., Oliveira, D. S. B. L., Oliveira, L. S. B. L., & Bezerra, B. S. (2021).
Life cycle comparative assessment of pet bottle waste management options:
A case study for the city of Bauru, Brazil. Waste Management, 119, 226e234.
https://doi.org/10.1016/j.wasman.2020.08.041
Masebinu, S. O., Akinlabi, E. T., Muzenda, E., Aboyade, A. O., & Mbohwa, C.
(2018). Experimental and feasibility assessment of biogas production by
anaerobic digestion of fruit and vegetable waste from Joburg Market. Waste
Management, 75, 236e250. https://doi.org/10.1016/j.wasman.2018.02.011
Mayer, F., Bhandari, R., Gäth, S. A., Himanshu, H., & Stobernack, N. (2020).
Economic and environmental life cycle assessment of organic waste
treatment by means of incineration and biogasification. Is source
segregation of biowaste justified in Germany? The Science of the Total
Environment, 721, 137731. https://doi.org/10.1016/j.scitotenv.2020.137731
Moradi, R., Marcantonio, V., Cioccolanti, L., & Bocci, E. (2020). Integrating
biomass gasification with a steam-injected micro gas turbine and an Organic
Rankine Cycle unit for combined heat and power production. Energy
Conversion and Management, 205, 112464. https://doi.org/10.1016/
j.enconman.2019.112464
Motasemi, F., & Afzal, M. T. (2013). A review on the microwave-assisted pyrolysis
technique. Renewable and Sustainable Energy Reviews, 28, 317e330. https://
doi.org/10.1016/j.rser.2013.08.008
O’Connor, S., Ehimen, E., Pillai, S. C., Lyons, G., & Bartlett, J. (2020). Economic
and environmental analysis of small-scale Anaerobic digestion plants on
Irish dairy farms. Energies, 13(Issue 3). https://doi.org/10.3390/en13030637
Portugal-Pereira, J., & Lee, L. (2016). Economic and environmental benefits of
waste-to-energy technologies for debris recovery in disaster-hit Northeast
Japan. Journal of Cleaner Production, 112, 4419e4429.
Safarian, S., Unnthorsson, R., & Richter, C. (2020). Performance analysis and
environmental assessment of small-scale waste biomass gasification
integrated CHP in Iceland. Energy, 197, 117268. https://doi.org/10.1016/
j.energy.2020.117268
43
44
Chapter 3 Waste-to-energy
Shackley, S., Carter, S., Knowles, T., Middelink, E., Haefele, S., & Haszeldine, S.
(2012). Sustainable gasificationebiochar systems? A case-study of rice-husk
gasification in Cambodia, Part II: Field trial results, carbon abatement,
economic assessment and conclusions. Energy Policy, 41, 618e623. https://
doi.org/10.1016/j.enpol.2011.11.023
Shackley, S., Carter, S., Knowles, T., Middelink, E., Haefele, S., Sohi, S., …
Haszeldine, S. (2012). Sustainable gasificationebiochar systems? A case-study
of rice-husk gasification in Cambodia, Part I: Context, chemical properties,
environmental and health and safety issues. Energy Policy, 42, 49e58.
https://doi.org/10.1016/j.enpol.2011.11.026
Shackley, S., Hammond, J., Gaunt, J., & Ibarrola, R. (2011). The feasibility and
costs of biochar deployment in the UK. Carbon Management, 2(3), 335e356.
https://doi.org/10.4155/cmt.11.22
Tang, Y., Dong, J., Li, G., Zheng, Y., Chi, Y., Nzihou, A., Weiss-Hortala, E., &
Ye, C. (2020). Environmental and exergetic life cycle assessment of
incineration- and gasification-based waste to energy systems in China.
Energy, 205, 118002. https://doi.org/10.1016/j.energy.2020.118002
Uçkun Kiran, E., Stamatelatou, K., Antonopoulou, G., & Lyberatos, G. (2016). 10 Production of biogas via anaerobic digestion. In: R. Luque, C. S. K. Lin, K.
Wilson, & J. B. T.-H. of B. P, Second E. Clark (Eds.), pp. 259e301). Woodhead
Publishing. 10.1016/B978-0-08-100455-5.00010-2.
Valentine, S. V. (2011). Emerging symbiosis: Renewable energy and energy
security. Renewable and Sustainable Energy Reviews, 15(9), 4572e4578.
https://doi.org/10.1016/j.rser.2011.07.095
Van Caneghem, J., Brems, A., Lievens, P., Block, C., Billen, P., Vermeulen, I.,
Dewil, R., Baeyens, J., & Vandecasteele, C. (2012). Fluidized bed waste
incinerators: Design, operational and environmental issues. Progress in
Energy and Combustion Science, 38(4), 551e582. https://doi.org/10.1016/
j.pecs.2012.03.001
Vermeulen, I., Van Caneghem, J., Block, C., Dewulf, W., & Vandecasteele, C.
(2012). Environmental impact of incineration of calorific industrial waste:
Rotary kiln vs. cement kiln. Waste Management, 32(10), 1853e1863. https://
doi.org/10.1016/j.wasman.2012.05.035
Williams, P. T. (2021). Hydrogen and carbon nanotubes from pyrolysis-catalysis
of waste plastics: A review. Waste and Biomass Valorization, 12(1), 1e28.
https://doi.org/10.1007/s12649-020-01054-w
Xia, Z., Shan, P., Chen, C., Du, H., Huang, J., & Bai, L. (2020). A two-fluid model
simulation of an industrial moving grate waste incinerator. Waste
Management, 104, 183e191. https://doi.org/10.1016/j.wasman.2020.01.016
Xing, B.-S., Cao, S., Han, Y., Wen, J., Zhang, K., & Wang, X. C. (2020). Stable and
high-rate anaerobic co-digestion of food waste and cow manure:
Optimisation of start-up conditions. Bioresource Technology, 307, 123195.
https://doi.org/10.1016/j.biortech.2020.123195
Yang, Y., Wang, J., Chong, K., & Bridgwater, A. V. (2018). A techno-economic
analysis of energy recovery from organic fraction of municipal solid waste
(MSW) by an integrated intermediate pyrolysis and combined heat and
power (CHP) plant. Energy Conversion and Management, 174, 406e416.
Yang, Y., Brammer, J. G., Wright, D. G., Scott, J. A., Serrano, C., &
Bridgwater, A. V. (2017). Combined heat and power from the intermediate
pyrolysis of biomass materials: performance, economics and environmental
impact. Applied Energy, 191, 639e652.
Chapter 3 Waste-to-energy
Yin, D.-M., Westerholm, M., Qiao, W., Bi, S.-J., Wandera, S. M., Fan, R., Jiang, M.M., & Dong, R.-J. (2018). An explanation of the methanogenic pathway for
methane production in anaerobic digestion of nitrogen-rich materials under
mesophilic and thermophilic conditions. Bioresource Technology, 264, 42e50.
https://doi.org/10.1016/j.biortech.2018.05.062
You, S., Ok, Y. S., Chen, S. S., Tsang, D. C. W., Kwon, E. E., Lee, J., & Wang, C.-H.
(2017). A critical review on sustainable biochar system through gasification:
Energy and environmental applications. Bioresource Technology. https://
doi.org/10.1016/j.biortech.2017.06.177
You, S., Ok, Y. S., Tsang, D. C. W., Kwon, E. E., & Wang, C.-H. (2018). Towards
practical application of gasification: A critical review from syngas and
biochar perspectives. Critical Reviews in Environmental Science and
Technology, 48(22e24), 1165e1213. https://doi.org/10.1080/
10643389.2018.1518860
Zhang, G., Hai, J., Cheng, J., Cai, Z., Ren, M., Zhang, S., & Zhang, J. (2013).
Evaluation of PCDD/Fs and metals emission from a circulating fluidized bed
incinerator co-combusting sewage sludge with coal. Journal of
Environmental Sciences, 25(1), 231e235. https://doi.org/10.1016/S10010742(12)60009-6
Zhu, X., & Venderbosch, R. (2005). A correlation between stoichiometrical ratio
of fuel and its higher heating value. Fuel, 84(7), 1007e1010. https://doi.org/
10.1016/j.fuel.2004.12.002
45
This page intentionally left blank
Waste-to-biohydrogen
4
Abstract
This chapter focuses on biohydrogen recovery from waste for transportation applications. It explains the technical principles and influential
factors of two main types of waste-to-biohydrogen technologies (thermochemical and biochemical). The considered thermochemical technologies include hydrothermal gasification, steam gasification, and
biooil steam reformation. The considered biochemical technologies
include dark-fermentation and photo-fermentation. The biohydrogen
yields of the technologies are summarized. This chapter also emphasizes
the importance of product upgrading, separation and purification for the
transportation application of biohydrogen. The technical principles and
procedures of several major upgrading, separation and purification
technologies are detailed.
Keywords: Waste-to-biohydrogen; Gasification; Fermentation; Product
upgrading; Separation and purification; Hydrogen yields.
1. Introduction
The transport sector is one of the major consumers of primary
energy, responsible for around 66% of oil consumption and
around 27% of global GHG emissions (Rezvani et al., 2018). Fossil
fuelepowered transport has also been one of the major sources of
air pollution (e.g., PM2.5 and O3), with significant health repercussions, e.g., causing 28,000e36,000 deaths a year in the United
Kingdom (COMEAP, 2018). Hydrogen is the ultimate solution for
meeting the sustainable energy demand and for reducing air
pollutant and GHG emissions of the transport sector toward a
cleaner environment. Hydrogen can be used by fuel cells in automotive applications to power pollutantefree transport. The
hydrogen-powered transport is expected to play a critical role in
facilitating the transition from a fossil fuelebased economy to a
low-carbon economy in response to the ambition to reduce or
ban petrol and diesel cars, and tackle the challenges of the depletion of fossil fuels, and global climate change.
Waste-to-Resource System Design for Low-Carbon Circular Economy. https://doi.org/10.1016/B978-0-12-822681-0.00008-6
Copyright © 2022 Elsevier Inc. All rights reserved.
47
48
Chapter 4 Waste-to-biohydrogen
However, about 96% hydrogen is currently produced based on
the transformation of fossil fuels with an annual CO2 production
of 500 million tonnes, i.e., 2% of the global energyerelated CO2
emissions (IEA, 2016; Nikolaidis & Poullikkas, 2017). It is impossible to achieve the full benefits of hydrogen as a clean, versatile,
and efficient transport fuel without the use of renewable energy
sources for hydrogen production. Hydrogen production with
locally available renewable energy sources is most attractive
(Singh et al., 2015).
Waste-to-biohydrogen (WtH) technologies (e.g., fermentation
and gasification) serve as a promising solution for low-carbon
hydrogen production with locally available waste biomass.
Waste-derived biohydrogen for powering the transport sector
leads to an innovative “Waste-to-Wheel” strategy upon the use
of the hydrogen for fuel cell electric vehicles (FCEVs). Meanwhile,
WtH also contributes to developing low-carbon waste management practices, making it a solution of dual benefits. In particular,
community-based, distributed WtH systems benefit from the
reduced costs and emissions of the transportation of hydrogen
and waste as well as contained odor and pathogen transmission
along the waste transportation. They also match well with the
requirement of FCEVs on distributed hydrogen refueling stations.
Communities are a key stakeholder of such WtH development by
being the “supplier” of waste biomass, the “carrier” of WtH systems, and the “user” of FCEV services (You et al., 2016). Distributed WtH systems have the potential to foster a culture of
energy and environmental conservation by bringing residents
and communities closer to the notion of sustainable waste management (You, Tong, Armin-Hoiland, Tong, & Wang, 2017).
2. Biohydrogen production technologies
Similar to WtE conversion, WtH generation can be achieved
using thermochemical (i.e., gasification and pyrolysis) and
biochemical (fermentation) methods, respectively. Their fundamentals and process performance will be detailed as follows.
2.1 Gasification
As shown in Chapter 3, hydrogen-containing syngas is the
primary product of gasification. Toward the production of highpurity hydrogen via the process of gasification, two approaches
can be adopted: (1) adapting gasification for hydrogen-rich syngas production and/or (2) applying downstream technologies to
Chapter 4 Waste-to-biohydrogen
improve the hydrogen purity. Typical hydrogen-rich syngas
production technologies include hydrothermal gasification,
steam gasification, and biooil steam reforming.
2.1.1 Hydrothermal gasification
Hydrothermal gasification utilizes hot compressed water as a
medium to generate hydrogen-rich gas from carbonaceous materials under near-critical temperature up to around 500 C. The
technology is suitable for feedstocks with a moisture content
higher than 30% such as sewage sludge and algae, and the supercritical condition reduces the energy consumption of drying pretreatment as required by normal gasification of moist feedstock.
Main advantages of hydrothermal gasification include saving
the need for energy-intensive drying pretreatment for feedstocks
with high moisture contents, facilitating subsequent H2 utilization with an elevated pressure, tar reduction, simplified gas
purification, etc. The overall hydrothermal gasification reaction
can be expressed as
Ca Hb Oc þ ð2a cÞH2 O/aCO2 þ ð2a c þ b=2ÞH2
(>374.3 C)
(4.1)
Under elevated temperature
and pressure
(22.1 MPa), water is under the supercritical state where the liquid
and gas phase become miscible. Under the critical temperature
condition, the density of water decreases drastically with the
broken of hydrogen bonds in water. This leads to a significant
decrease in the dielectric constant of water and a drastic increase
in the solubility of organic solvent. These changes in the properties make water a nonpolar solvent and a benign reactant with
high diffusivity and excellent transport properties for gasification
reactions (He et al., 2014). Specifically, under the supercritical
state, water serves as an acid/base catalyst for hydrogen production from the formic acid degradation via decarboxylation
(HCOOH / CO2 þ H2) and dehydration (HCOOH / CO þ H2O)
reactions. The reduced density of water also favors the free-radical
reactions and contributes to the formation of radicals such as the
hydroxyl radical with hydrogen production (e.g., H2O þ H 4
H2 þ OH). Finally, water also directly serves as a reactant for
hydrogen production, and it was shown that as high as 50%
hydrogen generated during hydrothermal gasification came
from water (Kruse et al., 2003).
Temperature is the most significant factor in affecting the production of hydrothermal gasification, and higher hydrogen yields
can be achieved at a higher temperature condition. However, the
production of alkanes via CeO cleavage and hydrogenation
49
50
Chapter 4 Waste-to-biohydrogen
might also be promoted with increasing temperature, limiting the
increase in the yield of hydrogen via CeC cleavage and the
wateregas shift reaction.
Catalysts have been adopted to preserve the reactions related
to CeC cleavage and/or the wateregas shift reaction while suppressing CeO cleavage (Davda et al., 2005). An appropriate
amount of oxidant can accelerate hydrogen production by supplying heat to the endothermic supercritical water gasification reactions, but the amount needs to be controlled as excess oxidant
might lead to the consumption of H2 produced (Guo et al., 2010).
Catalysts can lower the activation energy required for gasification
reactions and improve the process efficiency and yields of
hydrogen. Alkali salts such as NaOH, Na2CO3, and K2CO3 have
been used as catalysts to promote hydrogen production while
supressing the production of tar/oil and char during the hydrothermal gasification process. Major mechanisms underlying the
catalytic effects include, e.g., (1) enhancing the wateregas shift reaction with CO from decarbonylation of hydroxylated carbonyl
compounds, (2) enhancing CeC bonds cleavage based on the formation of formate salt, and (3) the reaction of sodium carboxylate
with water, leading to the generation of additional hydrogen (He
et al., 2014). Typical challenges associated with the use of the alkali catalysts are the risks of corrosion, plugging, and fouling,
reducing system stability.
Heterogeneous catalysts such as Ru/C, Raney-iron, Raneycobalt, and Raney-nickel have been tested for hydrothermal gasification. Using 90 wt.% Raney nickel and 10 wt.% Ru/AC as the
catalyst, hydrothermal gasification of wastewater from the
hydrothermal liquefaction of human feces achieved a hydrogen
yield of 10.61 mol/kg dry feed (H2 content ¼ 56.3%) (Watson
et al., 2017). Raney nickel catalysts prepared by leaching out
aluminum from NieAl alloy with concentrated sodium hydroxide
have a specific surface area (50e100 m2/g) much higher than that
(<1 m2/g) of metal powder and wire catalysts. Upon the hydrothermal gasification of activated sewage sludge, a maximum
hydrogen yield of 18.13 mol/kg dry sludge was achieved using
1.4 g Raney-nickel-Mo2 catalyst/g dry sludge at 450 C and
25 min. The improved yield was related to the spongy structure,
large specific area, and good pore space concentration distribution of the catalyst (Chen et al., 2020).
2.1.2 Steam gasification
Steam gasification utilizes steam as the gasifying agent to promote hydrogen production. It can generate the syngas with a
Chapter 4 Waste-to-biohydrogen
hydrogen content of up to 60 vol.% and an HHV as high as
15e20 MJ/Nm3 (Edreis et al., 2014; Parthasarathy & Narayanan,
2014). However, an external heating source is needed to sustain
the steam gasification, which poses an additional economic
burden on the development. In addition to the wateregas shift reaction, the steam reforming reactions (CH4 þ H2O / CO þ 3H2
and C þ H2O / CO þ H2) are also promoted with the use of
steam.
Major influential factors for the hydrogen production of steam
gasification include types of feedstocks, feedstock particle size,
temperature, steam to biomass ratio, use of catalysts, etc. Similar
to conventional gasification, smaller feedstock particles improve
the heat and mass transfer and secondary cracking reactions
during the steam gasification process, leading to higher process
efficiencies in terms of hydrogen production. The condition of
higher process temperature improves the carbon conversion efficiency by promoting the Boudouard reaction and enhances tar
decomposition into gaseous products via thermal cracking reactions. There is an optimal steam-to-feedstock ratio for the
maximal hydrogen production of steam gasification. When the
steam-to-feedstock ratio is smaller than this optimal value,
increasing the ratio promotes the reforming reactions (watere
gas, wateregas shift, and reforming reactions) of carbon and
methane to generate more hydrogen. However, an excessive
steam-to-feedstock ratio brings down the process temperature,
which serves to reduce and increase the production of hydrogen
and tar, respectively.
Catalysts such as dolomite, Ni-based, alkaline metal, alumina,
alumina silicate, Na2CO3, K2CO3, ZnCl2, etc., have been tested for
their potential to promote steam gasification. Catalysts have
three potential impacts on the steam gasification process toward
higher hydrogen production: (1) enhancing the heat and mass
transfer between feedstock particles for a higher gasification efficiency, (2) directly promoting the hydrogen-producing reactions in the process by lowering the activation energy required
by the reactions, and (3) facilitating the destruction of tars into
various products including hydrogen. Upon the use of the catalysts, there is always a decision to be made such that a balance
between the added costs and the effectiveness of catalysts can
be achieved.
51
52
Chapter 4 Waste-to-biohydrogen
2.1.3 Biooil steam reforming
The biooil steam reforming process uses steam to turn the
biooil derived from fast or flash pyrolysis into a hydrogen-rich
gas product. It involves two main types of reactions
Steam reforming : Ca Hb Oc þ ða cÞH2 O/aCO þ ða þ ðb=2Þ cÞH2
Water gas shift: CO þ H2 O4CO2 þ H2
(4.2)
This process can achieve a hydrogen concentration up to 70%
(Setiabudi et al., 2020). It appears to be difficult to further increase
the hydrogen concentration due to (i) the thermodynamic limitation of the wateregas shift reaction, (ii) the existence of other reactions (such as CO and CO2 methanation), and (iii) carbon
formation, limiting the further generation of hydrogen. It is worth
noting that the carbon formed as a result of the decomposition
and dehydrogenation of oxygenates, as well as polymerization of
oxygenates, can deactivate catalysts via coke deposition.
Due to the special feedstock (biooil derived from pyrolysis), a
biooil steam reforming system is commonly based on the combination of pyrolysis and biooil steam reforming. The pyrolysis
stage serves to produce biooil mainly consisting of oxygenated
compounds such as acids (acetic acid and formic acid), alcohol
(methanol and phenol), aldehydes, and acetone from waste
biomass at a temperature condition between 500 C and 600 C.
The steam reforming stage normally happens in a fluidized bed
reactor with a temperature higher than that of the pyrolysis stage.
Catalysts are often used and play a critical role in promoting
and stabilizing the biooil steam reforming process. Ni-based catalysts are effective to promote the steam reforming reactions via
enhancing the cleavage of CeC and CeH bonds as desired by the
water-gas shift reaction. They have additional strengths of being
cost-effective (as compared to noble metals) and chemical and
thermal stable. However, they suffer from the disadvantages of
being prone to coking by carbon accumulated on the catalysts’
active sites. To relieve the problem, Ni particles need to be widely
dispersed on the surface of the catalyst to supress carbon deposition. Various types of metal oxides have been used as the support for Ni-based catalysts. Ni/ZrO2, Ni/Al2O3, and Ni/MgO
catalysts showed good performance (>98% of conversion) due
to the redox properties, high surface area, and high oxygenate
accessibility to Ni sites, respectively (Setiabudi et al., 2020).
Alkaline-earth (e.g., Mg and Ca) elements can be added as promoters to improve the stability of catalysts by preventing the carbon formation from the acid sites. The addition of alkali metal
Chapter 4 Waste-to-biohydrogen
species (e.g., K and Na) to the Ni catalysts enhances the catalytic
steam reforming process due to the increased interaction between
adsorbed species and metal sites. A less economically viable
method is to use air combustion to eliminate the carbon deposition by catalyst calcination for up to 600 C.
Generally, noble metal (e.g., Pt and Rh) catalysts showed
excellent catalytic and carbon deposition mitigation abilities for
steam reforming and wateregas shift reactions. But the high costs
limit their practical applications, and they have been used as promoters of Ni-based catalysts to achieve high levels of carbon
deposition resistance and catalytic stability. Rh-based catalysts
show excellent performance in steam reforming of biooil but
they also suffer from the problem of deactivation due to catalysts’
structural alteration caused by their support’s aging and coke
deposition which suppress reforming reactions. It was shown
that, for monometallic catalysts, the catalytic performance ranks
as Rh > Ni > Co > Ru > Ir > Pt. Lower carbon contents were
found in RheNi (12.2 wt.%) and RueNi (13.3 wt.%) catalysts as
compared to Ni/CeO2eAl2O3 (15.5 wt.%). In recent, biochar has
been exploited as a catalyst because of its cost-effectiveness. For
example, upon the use of gasification biochar (with alkali and
alkaline earth metallic (AAEM) species) to catalyze steam reforming of biooil, a maximum hydrogen yield of 89.13% and a concentration of 75.97% were achieved (Ma et al., 2017). Table 4.1
summarizes the hydrogen production of gasification and pyrolysis. It shows that steam gasification could achieve the production
of a hydrogen concentration of around 70% with an optimal temperature around 700 C. The yields of hydrogen recovered from
MSW are generally lower than that from agricultural waste,
partially due to its relatively complex components and some components being less favorable for hydrogen recovery.
2.2 Fermentation
Fermentation utilizes microorganisms to derive organic acids,
alcohols, acetone, and then hydrogen and CO2 from the decomposition of carbohydrate-rich and biodegradable waste. The process parameters of the biochemical-based biohydrogen
production include substrate concentration, mode and reaction
conditions (e.g., temperature, pH, partial pressure of hydrogen,
hydraulic retention time (HRT), etc.), feedstock and medium
composition, and microorganism types. Fermentation normally
occurs at ambient temperature and pressure and is less energyintensive than the thermochemical processes. The downside of
53
54
Chapter 4 Waste-to-biohydrogen
Table 4.1 Summary of hydrogen production of gasification and pyrolysis under different
process conditions.
Feedstock
Agent/
Technology Catalyst
Biooil/biochar
slurry
Steam
La0.8Ce0.2FeO3
gasification
perovskite
type
catalysts
Steam
LaCo0.9Cu0.1O3
90 wt.% biooil
gasification
and 10 wt.%
perovskite
biochar
type
catalysts
Biooil
Steam
Biochar
reforming
catalyst
Biochar
Steam
Steam
gasification
Ni/BC4
Biochar from rice Steam
catalyst
husk for biooil
reforming
of biooil
Sawdust
Wateregas e
shift
reactor and
oxidation
Sawdust wood
Steam
Tyre char
pellets
gasification
Acid treated
tyre
pyrolysis
Cattle manure
Gasification e
Wheat straw
Steam
Ni/cotton char
(biochar)
gasification
catalyst
Corn stalk
Steam
CaO
gasification
Reactor
Optimal
H2
temperature concentration
(%)
H2 yield
( C)
Fixed bed
800
82.01%
e
Fixed bed
800
75.33%
e
Fixed bed
900
75.97%
89.13%
Fixed bed
800
Fixed bed
700
74%
71.20%
0.0714 kg/kg
e
Fluidized bed 600e650
e
33 mol.%
Two-stage 900
fixed bed
Two-stage 900
fixed bed
56%
39.20 mmol/g
e
30.4 mmol/g
Fixed bed
Fixed bed
850
800 (550
pyrolysis)
Fluidized bed 650
57.58%
64.02%
61.23%
0.93 m3/kg
92.08 mg/g
biomass,
gas yield
about
90 wt.%
493.91 mL/g
biomass
Chapter 4 Waste-to-biohydrogen
55
Table 4.1 Summary of hydrogen production of gasification and pyrolysis under different
process conditions.dcontinued
Feedstock
Agent/
Technology Catalyst
Gasification e
Commercial
a-cellulose and
agricultural
waste
MSW
Steam
e
gasification
MSW
Steam
Steam
gasification
Reactor
Optimal
H2
temperature concentration
(%)
H2 yield
( C)
Fluidized bed 1000
29.50%
e
Fixed bed
750
49.42%
Fixed bed
800
277.67 mL/g
MSW
34.34 g/kg
MSW
e
Adapted from Lui, J., Chen, W.-H., Tsang, D. C. W., & You, S. (2020). A critical review on the principles, applications, and challenges
of waste-to-hydrogen technologies. Renewable and Sustainable Energy Reviews, 134, 110365.
the process is about its relatively low hydrogen yield and reaction
rate. Depending on the use of light, fermentation is further categorized into dark- and photo-fermentation.
2.2.1 Dark-fermentation
Dark-fermentation makes use of anaerobic bacteria to treat
carbohydrates to generate hydrogen and an effluent consisting
of e.g., butyric acid, acetic acid, propionic acid and ethanol under
anoxic and dark conditions. It is featured by being relatively simple and cheap in terms of bioreactor design and has higher
hydrogen evolution rates (the amount of hydrogen evolved in
unit time) as compared to photo-fermentation. It is suitable for
treating a variety of waste feedstocks such as stillage, food waste,
sludge, paper waste, pomace, stalks, bagasse, etc. Major disadvantages of this technology include significant by-product generation and reactor-to-reactor variation, and low chemical oxygen
demand (COD) removal (Dincer & Acar, 2015). To achieve higher
energy and process efficiencies, this technology can be coupled
with others such as microbial fuel- and electrolysis cells, wastewater treatment, or microalgal biorefinery (Wong et al., 2014).
The dark fermentation process involves a series of biochemical
reactions such as glycolysis, pyruvate degradation through the pyruvate ferredoxin oxidoreductase (PFOR) pathway or the pyruvate
56
Chapter 4 Waste-to-biohydrogen
formate-lyase (PFL) pathway, and hydrogen production through
the formate-hydrogen lyase or the reduction of protons (Bundhoo, 2019).
There are three groups of hydrogen producers for darkfermentation including spore-forming obligate anaerobes, none
spore-forming obligate anaerobes, and facultative anaerobes
(Cabrol et al., 2017). Clostridium sp. achieves a hydrogen yield
of 1.5e3 mol H2/mol hexose and needs to work under a condition
of pH < 5.0. However, the yield of hydrogen per substrate is
limited by metabolic constraints of the dark-fermentation microorganisms. The theoretical limit, referred to as the “Thauer limit,”
suggests that 4 mol hydrogen can be produced per mol of glucose
for dark-fermentation (Thauer et al., 1977). Recently, a hydrogen
yield of 5.6 mol/mol glucose (40% higher than the Thauer limit)
was achieved via the precision design of an artificial microbial
consortium composed of Enterobacteriaceae (with high hydrogen
evolution rates) and Clostridiaceae (with high hydrogen yields) in
a ratio of 1:10,000 (Ergal et al., 2020). Non-spore-forming obligate
anaerobes include Ethanoligenens harbinense, Acetanaerobacterium elongatum, Megasphaera sp., Acidaminococcus sp., and
Prevotella sp. (Cabrol et al., 2017). They play a major role in
ethanol-type fermentation yielding ethanol, H2 and CO2, lactic
acid production, and amino acid degradation toward H2 production (Dahiya et al., 2020). Facultative anaerobes include Citrobacter sp., Klebsiella sp., Enterobacter sp., Bacillus sp.,
Shewanella oneidensis and Pseudomonas stutzeri.
There are different types of reactor designs for darkfermentation, e.g., annular-hybrid bioreactor (AHB), continuous
stirred tank reactor (CSTR), up-flow anaerobic packed bed
reactor (UAnPBR), up-flow anaerobic sludge blanket (UASB),
chemostat bioreactor, fixed-bed bioreactor, anaerobic fluidized
bed reactor (AFBR), etc. (Gorgec & Karapinar, 2019). These reactors differ in terms of their modes of operation as well as the
arrangements of mass and energy flows which are reflected by
the variations in HRT, substrate concentration, techniques of
immobilization, microbial support materials, etc.
An AHB is made of two coaxial cylindrical reactors where
fermentation broth is circulated between the inner and outer
reactors periodically using circulation pumps. A fluorescent
lamp can be installed inside a glass chamber and a halogen
lamp can be placed outside of the reactors for illumination
(Argun & Kargi, 2010). A CSTR involves the use of a mechanical
stirrer to continuously agitate the medium in a tank to achieve a
high mass transfer efficiency and a high rate of hydrolysis and
Chapter 4 Waste-to-biohydrogen
acidification. CSTR systems have the problems of operational
instability and limited hydrogen production rates due to their
low HRT and difficulty in maintaining sufficient bacterial population (De Amorim et al., 2009). For a UAnPBR, the gas effluent is
extracted from the top of reactor, while the influent is fed from
the bottom, which leads to a relatively high productivity. A
UASB is designed to manage the washout of organic biomass during fermentation and is featured by a high treatment efficiency, a
short HRT, and improved stability. AFBR systems make use of an
upward flow to suspend an inert support or granules in a tall column reactor where microorganisms are in the form of attached
ez et al., 2013). They are featured by high
biofilm (Muñoz-Pa
organic loading rates, good mixing, and low HRT operation, and
their treated effluent is recirculated to prevent short circuits and
dead zones in the systems. Typical support materials include alginate gel, activated carbon, zeolite, polystyrene, clay, celite, etc.
To improve the hydrogen productivity of dark-fermentation
toward large-scale applications, feedstocks, particularly lignocellulosic feedstocks could be pretreated (using acid or thermal pretreatment) to destroy the lignin seal protecting the cellulose
molecules and to facilitate their release into the solution. This
will enhance the enzymatic digestibility and acidogenic fermentation with the destruction of their crystalline arrangement and
depolymerization. Additionally, mixed microbial culture, i.e.,
inoculum can be pretreated using heat-shock to selectively
destroy H2-consuming bacteria (e.g., hydrogenotrophic methanogens, propionate producers, homoacetogens, and sulfatereducing bacteria) and enrich H2-producing bacteria to enhance
hydrogen production. The effectiveness of pretreatment is related
to the operating conditions (e.g., pH, temperature, and H2 partial
pressure) of dark-fermentation. Upon the selection of pretreatment technologies, it is also important to ensure the enhanced
hydrogen recovery offsets the energy consumed by the pretreatment from an overall energy efficiency perspective.
2.2.2 Photo-fermentation
Photo-fermentation utilizes anoxygenic photosynthetic bacteria to decompose organic substrate to produce hydrogen and CO2
in an anaerobic environment. Some of the main advantages of
photo-fermentation include nearly complete substrate conversion and high availability of feedstocks, but it suffers from the
weakness of low volumetric hydrogen production rates and conversion efficiencies (Dincer & Acar, 2015). A photo-fermentation
57
58
Chapter 4 Waste-to-biohydrogen
biohydrogen production process considering acetate as the model
feed substrate can be described as
CH3 COOH þ 2H2 O/2CO2 þ 4H2
(4.3)
Specifically, hydrogen is generated by nitrogenase of photosynthetic bacteria with photosynthetic phosphorylation. The
electrons from the oxidation reaction of organic substances are
transported through electron carriers to pump protons through
cell membrane to produce adenosine triphosphate (ATP). Part
of the used electrons are sent to ferredoxin, driving electrons to
nitrogenase with the formed ATP to produce hydrogen.
The hydrogen yield of photo-fermentation varies significantly
depending on various factors such as feedstock types and the use
of pretreatment methods. For example, for the photofermentation of wheat straw, the maximum hydrogen yields
varied from 254 mL/L to 712 mL/L for pretreatment using
H2SO4 and ammonia, respectively (Mirza et al., 2013). For the
photo-fermentation of corn stalk and corn cob, with NaOH and
HCl being used for pretreatment, the maximum hydrogen yields
were reported to be 594.4 mL/g TVS and 738.1 mL/g TVS, respectively (Yang et al., 2010, 2015).
Different pilot-scale photo-fermentation systems have been
tested. Zhang et al. (2017) evaluated the photo-fermentative
hydrogen production of a 4 m3 pilot-scale baffled continuousflow photoreactor with four sequential chambers (Fig. 4.1)
Figure 4.1 A schematic of the 4 m3 pilot-scale baffled continuous flow photo-fermentative hydrogen production
system (Zhang et al., 2017). 1. Intelligent control center, 2. Peristaltic pump, 3. Hydrogen producing medium tank,
4. Photosynthetic bacteria tank, 5. Solar fiber import plant, 6. Solar water heater, 7. Gas tank, 8. Gas flowmeter,
9. No.1 chamber, 10. No.2 chamber, 11. No.3 chamber, 12. No.4 chamber, 13. Thermal-insulating board, 14.
Circulating pump, 15. Hot water storage tank.
Chapter 4 Waste-to-biohydrogen
59
(Zhang et al., 2017). The system treated wastewater containing
10 g/L glucose using microflora HAU-M1 at 30 C, with a light intensity of 3000 200 lux and an HRT of 24e72 h. The system
achieved an overall hydrogen production rate of 234 mol/d,
310 mol/d, and 381 mol/d at an HRT of 72, 48, and 24 h,
respectively.
Lu et al. (2020) studied the hydrogen production of dark- and
photo-fermentation based on an 11 m3 pilot-scale system consisting of sequential dark- and photo-fermentation bioreactors with
solar energy being the source of heat, illumination, and power
to improve the system’s carbon footprint and economic viability
(Fig. 4.2). The dark-fermentation bioreactor was comprised of
three 1 m3 chambers in series and the photo-fermentation bioreactor was comprised of eight 1 m3 chambers in series. Substrate
was continuously pumped into chamber No.1 using a peristaltic
pump at a flow rate of 150e6061 mL/min. To heat the bioreactors, hot water from the insulation tank was pumped into
the internal thermal insulation layer of each chamber. A solar
illuminator was used as the primary light source, while a light
emitting diode system served as an auxiliary light source for
photo-fermentation. The system achieved a gas production
rate of 96.30 mol/m3-d and 224.68 mol/m3-d for dark- and
photo-fermentation, respectively.
Hybrid or integrated systems consisting of both dark- and
photo-fermentation are developed to improve the yield of
hydrogen from dark-fermentation via improved utilization of
Figure 4.2 A schematic of the automated control bioreactor. 1. Automated control center, 2. Seed tanks, 3. Light
source, 4. Agitator, 5. Dark-fermentation medium, 6. Gas tank, 7. Gas flowmeter, 8. No.1 Chamber, 9. No.2 Chamber, 10. No.3 Chamber, 11. Processing chamber, 12. No.4 Chamber, 13. No.5 Chamber, 14. No.6 Chamber, 15. No.7
Chamber, 16. Internal thermal insulation layer, 17. Optical fiberebased solar energy transport system, 18. Solar
water heater, 19. Thermal insulation tank (Lu et al., 2020).
60
Chapter 4 Waste-to-biohydrogen
the organic acids generated and the alleviation of process inhibition. There are commonly two configurations for the hybrid
development: (1) successive dark-fermentation and photofermentation in two respective reactors (i.e., two-stage systems)
and (2) simultaneous dark-and photo-fermentation in the same
reactor (i.e., co-fermentation) (Zhang et al., 2020). For example,
a two-stage hybrid system was used to treat chewing gum production waste with the effluent (containing mainly xylitol, butyric,
acetic, lactic, and propionic acids) from the dark process being
further treated in photo-fermentation with Rhodobacter sphaeroides bacteria. The hybrid system achieved a maximum hydrogen
production of 0.36 L/Lmedium at a concentration of 67 g waste/L
for dark-fermentation and a maximum hydrogen production of
0.80 L/Ldiluted effluent for photo-fermentation. The hybrid process
achieved a total hydrogen yield of w6.7 L/Lwaste. Some of the reported hydrogen yields of dark- and photo-fermentation are listed
in Table 4.2, showing the relatively higher yields for hybrid
systems.
It is worth noting that recent research found that biochar
addition can improve the hydrogen yield and shorten lag time
of the fermentation processes due to its strong capacities on
pH buffering, electro/photon transfer enhancement, and biofilm
formation promotion (Lui et al., 2020). This raises the possibility
of developing integrated technologies that couple a thermochemical process (for biochar production) with a biochemical process
toward higher process and resource efficiencies.
Table 4.2 The hydrogen yields of dark- and photo-fermentation are listed in Table 4.2.
Technology
Feedstock
Cumulative hydrogen yield
References
Dark-fermentation
Corn stover
Rice straw
Corn stover
Apple waste
Corn stover
Corn stover
Bagasse
36.08 (mL/g raw material)
19.73 (mL/g raw material)
141.42 (mL/g raw material)
111.85 (mL/g raw material)
90.13 (mL/g raw material)a
439.40 (mL/g raw material)b
162.10 (mL/g raw material)
Zhang et al. (2020)
Asadi and Zilouei (2017)
Zhang et al. (2020)
Lu et al. (2016)
Zhang et al. (2020)
Zhang et al. (2020)
Wu et al. (2010)
Photo-fermentation
Hybrid
a
Co-fermentation.
Two-stage.
b
Chapter 4 Waste-to-biohydrogen
3. Downstream processes
The hydrogen as generated by the processes mentioned above
is commonly present in a gas mixture or being contaminated by
other pollutants. Toward practical applications of hydrogen,
high-purity is normally required, e.g., >99.9% for high-efficient
fuel cell vehicles. In this case, additional procedures of upgrading,
separation, and/or purification are needed as an essential part of
whole system biohydrogen development and application.
3.1 Syngas cleanup
3.1.1 Contaminants
Major contaminants in syngas include tar, nitrogenous
compounds, sulfur-containing inorganic compounds, hydrogen
halides and halogens, and trace metals. These contaminants are
originated from the volatile organic and inorganic compositions
of waste and their concentrations are associated with various
factors such as the type of waste, process conditions (e.g., temperature and ER), the use of catalyst, and the type of gasifier.
The presence of these contaminants in syngas directly affects
the process stability and efficiency with the possibility of causing
such specific problems as equipment corrosion (by H2S) and
fouling (by tar) and catalyst deactivation (by tar, H2S, NH3, HCl,
and trace metals) (You et al., 2018). The presence of the contaminants also critically affects the downstream application of syngas
and hydrogen as well as the environmental regulation compliance
of the development. Improper management of the contaminants
can cause various problems such as conversion efficiency reduction, catalyst deactivation, pipeline clogging, and pollutant
emission.
Tar refers to all the organic compounds (e.g., oxygenates,
phenolic compounds, olefins, and aromatic and polyaromatic
hydrocarbons (PAH)) with molecular weights greater than benzene according to EU/IEA/US-DOE (Devi et al., 2003). Primary
tar components include furfural, acetates, and methoxyphenols,
which are decomposed to form secondary tars (e.g., olefins and
phenolics), and tertiary tars (e.g., toluene, pyrene, and naphthalene) under elevated temperature and extended processing conditions. The presence of tar risks the operation of a gasification
system by blocking and corroding equipment and pipeline,
reducing the energy efficiency of the process, and their release
to the environment poses such health risks as headache, dizziness, nausea, and even cancer. The tar content in the product
gas of gasification ranged from 50 to 500 mg/m3, while the
61
62
Chapter 4 Waste-to-biohydrogen
permissible concentrations for internal combustion engines and
industrial gas turbines are typically lower than 100 mg/m3 and
1 mg/m3, respectively (You et al., 2018).
Ammonia (NH3) is the most abundant nitrogenous compound
found in syngas with a concentration ranging between 350 and
18,000 ppmv depending on the nitrogen content in the feedstock
(Abdoulmoumine et al., 2015). Around 60e80 wt.% organic nitrogen could be converted to NH3 during gasification. NH3 serves as
a NOx precursor and adversely affects the subsequent application
of hydrogen, e.g., inhibiting the conversion of H2 and CO into
liquid transportation fuels by poisoning the catalysts in Fischere
Tropsch synthesis (You et al., 2018). The sulfur composition of
waste is mainly converted to hydrogen sulfide (H2S), carbonyl sulfide (COS), carbon disulfide (CS2), etc., with H2S being most significant (its concentration in syngas can be up to 3 vol.%).
3.1.2 Cleanup
Syngas cleanup methods can be categorized as cold gas and
hot gas ones, respectively. The cold gas method is conducted at
or below room temperature and thus reduces the overall
system efficiency due to the cooling of syngas and incurs additional logistics and costs for contaminant disposal. Wet cold gas
cleanup units (e.g., spray and wash towers, impingement and
venturi scrubbers, and wet electrostatic precipitators and cyclones) are based on the principles of absorption, adsorption,
and/or filtration. They are suitable for removing multiple contaminants, simultaneously.
Water has been commonly used as the absorbent in scrubbers
to remove light and oxygenated tar compounds. However, it has
the disadvantages of being less effective to remove nonpolar
heavy and heterocyclic tar compounds, leading to low removal
efficiency and incurring additional costs as further treatment of
the wastewater stream is required (Abdoulmoumine et al.,
2015). Oil-based scrubbers based on engine oil, diesel fuel, and
vegetable oil can achieve a higher efficiency due to its ability to
remove heavy and heterocyclic tar compounds and can operate
at relatively high temperature to improve the overall process
efficiency. For example, for benzene, the absorption efficiencies
using engine oil, diesel fuel, and vegetable oil are 61.7%, 77%,
and 77.6%, as compared to 24.1% using water (Abdoulmoumine
et al., 2015). After absorption, the oil-based absorbents can be
recovered using hot gas stripping. However, the oil-based
scrubbers are more expensive and complex in terms of process
operation.
Chapter 4 Waste-to-biohydrogen
Ammonia can be removed using a water scrubber, a flue gas
condenser, or spray or wash towers due to its water solubility.
The wet-scrubbingebased method facilitates solvent recovery in
the form of ammonia salt by precipitation and can achieve an
ammonia removal efficiency of over 99%. Similar to the case of
tar, water can be used as the liquid absorbent for ammonia
and is of a high absorption efficiency. For this process, the product gas needs to be cooled down and the ammonia-dissolved water needs to be treated post the process. Acid-based (e.g., H2SO4)
scrubbing has also been tested and has the potential to achieve
co-absorption (e.g., absorption of NH3 and H2S). However, technical challenges exist for the corrosiveness of the acids and their
low efficiency at higher ammonia concentrations (>500 ppmv)
(Abdoulmoumine et al., 2015).
Wet cold gas removal is based on chemical solvents (reactions)
or physical solvents (absorption) such as amine-based solvents
(MDEA), Selexol, aqueous Rectisol, etc., which can achieve a
H2S removal efficiency of >98% and reduce the H2S content of
exit gas to below 30 ppmv (note Rectisol can make it below 0.1
ppmv but is more expensive). In general, a lower sulfur content
is required for chemical and fuel synthesis where catalysts are
normally used and can be easily deactivated by sulfur contaminants. Cold gas removal of the sulfur contaminants in syngas
adversely affects the energy efficiency of the whole process as syngas cooling is needed for, e.g., amine-based absorption processes
at 40 C and refrigerated physical solvent processes at 40 C
(Abdoulmoumine et al., 2015).
Dry cold gas cleanup units (e.g., cyclones, adsorbing bed, filters, and dry electrostatic precipitators) are based on the principles of mechanical, physical, and electrostatic separation with
the utilization of sorbents. Sulfur contaminants can be removed
using porous sorbents such as activated carbon and biochar. Specific surface area, pore volume, and surface properties are important factors determining their desulfurization efficiencies.
Biochar derived from the pyrolysis of used wood pallets and a
mixture of food waste and sludge has been used to remove H2S
in syngas, and the biochar activated using steam exhibited greater
removal efficiencies due to its large specific surface area, alkaline
pH, O-containing groups, and structural defects in graphene-like
sheets (Hervy et al., 2018). The reported removal capacity was
65 mgH2S/g for the steam-activated biochar under dry syngas,
which could be regenerated at 750 C under a N2 environment.
Some of the mineral species (e.g., Ca and Fe) in the biochar serve
to promote the removal process with the formation of metal sulfide and metal sulfate species. Additionally, presence of moisture
63
64
Chapter 4 Waste-to-biohydrogen
can promote the adsorption efficiency of activated carbon toward
enhanced desulfurization and typical removal mechanisms of H2S
include dissociative adsorption and oxidation (Köchermann et al.,
2015).
The hot gas cleanup method is conducted at relatively high
temperature (>300 C) and thus mitigates the problem of process
efficiency reduction for cold gas cleanup (Abdoulmoumine et al.,
2015). It centers around the use of catalysts to promote the reactions of contaminants for their removal. Dolomite (carbonate
minerals of Ca and Mg), limonite (FeOx(OH)y), olivine, alkali metal
catalysts, acid catalysts, nickel-based catalysts, and zeolite-based
catalysts have been tested about their ability for tar removal,
and conversion efficiencies between 65% and 100% have been reported in lab-scale and pilot-scale experiments. The tar removal
efficiency is closely associated with the surface area, pore diameter, and pore volume of catalysts, as well as the temperature of
reaction, with a higher temperature generally favoring tar
cracking. Commercial catalysts could be deactivated by carbon
fouling (e.g., coke deposition on nickel-based catalysts) and syngas contaminants. As a result, for sustainable and efficient catalyst
use, it is important to develop catalysts of high resistance to the
deactivation in addition to such favourable properties as low
cost, high activity, and ease of regeneration (You et al., 2018). Biochar has been tested as a catalyst to decompose tar and its tar
removal efficiencies can be comparable to some of the commercial catalysts. This opens the possibility for developing closeloop process designs for gasification and pyrolysis systems where
biochar generated during the process can be reutilized.
Ni or Ni promoted with Ce or La, Co or CoeZn mixed oxide,
Ru and Fe are some of the most effective catalysts for ammonia
decomposition. They can achieve a conversion efficiency of
over 95%. The conversion efficiency depends on various conditions such as the concentration of catalysts (loading of Ni) and reaction conditions. However, the catalyst deactivation caused by
coking and syngas contaminants (e.g., H2S) and economically
viable large-scale application of catalysts are two the major challenges facing the hot gas methods. For example, ammonia can be
decomposed to H2 and N2 with the presence of various types of
catalysts (e.g., Ni-, Ru-, and Fe-based), but the decomposition
process can be adversely affected by sulfur contaminants. Operation conditions of >900 C and 2e3 MPa were recommended to
mitigate the sulfur poisoning problem (You et al., 2018). For the
hot gas removal of sulfur contaminants, a metal oxide sorbent
Chapter 4 Waste-to-biohydrogen
(e.g., CaO, ZnO, and CuO) is commonly used to react with the
contaminants with the generation of a metal sulfide (e.g., CaS,
ZnS, and CuS).
In situ desulfurization based on single metal oxides is
economical and simple, but requires that the sorbents should
be thermally and mechanically stable under the condition of
high temperature and friction (You et al., 2018). For example,
ZnO can effectively reduce the concentration of H2S to less than
1 ppmv. However, under a high temperature (>600 C) condition,
the reduction to elemental metal and metal evaporation occur
(elemental zinc is formed and volatized) during the regeneration
process, lowering the sorbent reactivity and H2S removal efficiency (Abdoulmoumine et al., 2015). To mitigate the problem
and improve the mechanical strength, structure, and reactivity
of metal oxides for sulfur sorption, other metal oxides can be
incorporated into the ZnO catalyst to form mixed metal oxides.
Moreover, to enhance the adsorptive capacity of the sorbents,
high surface area materials (e.g., zeolites, Al2O3 and TiO2) have
been used to as the support of metal oxides. For example, novel
BaO-based sorbents have been developed to achieve desulfurization of below 1 ppmv and 35 ppmv H2S for fixed-bed and bubbling
fluidized bed gasification, respectively (You et al., 2018).
3.2 Upgrading
Syngas can be upgraded to increase the content of hydrogen
by promoting the wateregas shift reaction, which can be typically
achieved in a two-stage process: a stage with high-temperature
(350e400 C) using a FeeCr-catalyst followed by lowtemperature (220e300 C), CueZn-catalyst-based shift and a
subsequent separation stage (You et al., 2018). To achieve a
high conversion efficiency and hydrogen yield, noble metal catalysts such as Pt/CeO2/Al2O3, Pt/CeO2/ZrO2, and Ru/CeO2/Al2O3
have been used. However, their performance can be affected
due to the deactivation of the catalysts by sintering and contamination as well as the thermodynamic limit of CO conversion due
to the presence of H2. To constantly remove H2 and thus alleviate
the thermodynamic limit, membrane reactors can be used for
simultaneous the wateregas shift reaction and H2 separation.
Pd-based membrane reactors (e.g., PdeAg membrane (Brunetti
et al., 2009)) have been used to upgrade syngas for producing
pure hydrogen that is suitable for a proton-exchange membrane
fuel cell. However, the practical application of Pd-based
65
66
Chapter 4 Waste-to-biohydrogen
membrane is limited by its high cost (Pd price over 80 USD/g),
and effort has been made to improve its economic feasibility by
developing thin or ultra-thin Pd-based membranes. For example,
an ultra-thin (3.6 mm) PdeAg membrane for hydrogen production
achieved a CO conversion of 96% and hydrogen recovery of 84%
(Brunetti et al., 2015).
Additionally, the wateregas shift reaction can be catalyzed by
thermophilic microorganisms such as Carboxydothermus hydrogenoformans and Rhodospirillum rubrum which convert CO and
H2O to H2 and CO2 via the biological wateregas shift reaction under anaerobic conditions. The achieved productivities range from
4.7 to 125 mmol$LRWV1 h1 (RWV: reactor working volume)
depending on the design of bioreactors and syngas composition
(Asimakopoulos et al., 2018). This biological method is relatively
low cost as compared to the chemical methods mentioned above.
However, the contaminants and the various gas components (e.g.,
ammonia) in syngas may pose high toxicity to the microorganisms, reducing the overall hydrogen productivity.
3.3 Separation and purification
There are four main types of technologies for separating and
purifying syngas for high-purity hydrogen production, i.e., membrane, absorption, adsorption (e.g., pressure swing adsorption
(PSA), temperature swing adsorption (TSA), electrical swing
adsorption (ESA)), and cryogenic technologies. The membrane
and sorption-based technologies facilitate process intensification
by allowing the combination of syngas production and separation to shift the equilibrium-limited reactions toward higher
hydrogen production (Voldsund et al., 2016).
Membrane separation technologies have various advantages
such as reduced energy consumption, reduced unit operation,
simplicity and continuity of operation, and low cost. They have
been extensively tested at lab- and pilot-scale studies. Hydrogen
can be separated from mixed gases with a membrane because of
the selective permeation of hydrogen as driven by the hydrogen
partial pressure in the gas stream (Shahbaz et al., 2020). Hydrogen
selective membranes produce a permeate consisting of highpurity hydrogen at lower pressure, and a retentate with impurities
or other gas components (e.g., CO, CO2 and CH4) at higher pressure. The process is controlled by three physicochemical mechanisms, i.e., Knudsen diffusion, molecular sieving, and solution
diffusion, which are closely related to the relative morphology
(density and pore size) of membrane to the gas molecules. For
example, if the pores of membrane are larger than that of the
Chapter 4 Waste-to-biohydrogen
kinetic diameter of gas molecules, the molecules will all pass
through the membrane via convective flow driven by the difference in partial pressures; if the pores are much smaller than the
gas mean free path (e.g., for microporous membranes), small molecules will pass through mainly via Knudsen diffusion and large
molecules get sieved out via the molecular sieving mechanism.
Normally, solution diffusion determines the permeation of molecules through dense membranes: permeants firstly get adsorbed
at the upstream side and gradually diffuse downstream through
the membrane followed by desorption at the downstream side.
A sweep gas such as nitrogen can be used on the other side of
the membrane to improve permeation by lowering the partial
pressure (Nikolaidis & Poullikkas, 2017).
Depending on the material, membranes can be categorized
into inorganic (e.g., metallic and ceramic) and organic (e.g., polymer or carbon). Polymeric membranes are mature technologies
featured by low costs and being suitable for applications at
relatively low temperatures (<100 C) and high pressure drops
(Voldsund et al., 2016). The major drawbacks of polymeric membranes include low hydrogen selectivity and permeability, and low
mechanical and chemical stability (being vulnerable to swelling,
compaction, and contaminants such as HCl and SOx), making
high-purity hydrogen production difficult. Metallic, ceramic,
and carbon membranes can withstand higher temperatures between 200 and 900 C and have improved hydrogen permeability
and selectivity, and thus are suitable for bulk separation of
hydrogen after wateregas shift. However, these membranes normally face the challenges of poisoning caused by various gas components such as CO and H2S, high costs, and of limited
mechanical stability especially for ultra-thin configurations.
Upon the design of membrane technologies, the following
parameters are normally considered: gas permeability and selectivity, mechanical strength, temperature, and chemical stability.
Hydrogen selectivity and permeability are two critical parameters
defining the capacity of membrane technologies with the former
determining the purity of hydrogen recovered and the latter
determining the productivity of hydrogen. In many cases, a
compromise needs to be made between the two parameters
based on the consideration of syngas conditions (e.g., compositions and humidity) and the adjustment of operating conditions
(i.e., temperature and pressure).
Adsorption technologies fix molecules on the surface of adsorbents and utilize molecules’ varied affinities for adsorbents for
gas purification. PSA is one of the most used technologies for
hydrogen purification with a hydrogen recovery of 60%e95%
67
68
Chapter 4 Waste-to-biohydrogen
and a very high purification potential (98e99.9999 hydrogen
mol.%) (Voldsund et al., 2016). When the product gas passes
through an adsorbent (e.g., silica gel, activated carbon, alumina,
and zeolite) column at high pressure, impurities and hydrogen
are separated due to their different affinities. Upon saturation,
regeneration and desorption are done by lowering the pressure
and purging with hydrogen (typically from another column undergoing depressurization). Typically, a PSA process happens at
a feed pressure of 20e60 atm and ambient temperature, and the
pressure of hydrogen produced is slightly lower with the pressure
of off-gas being 1.1e1.7 atm (Voldsund et al., 2016). With a CO2 selective adsorbent, PSA can be used to capture CO2 generated from
gasification. It is worth noting that it is more difficult for PSA to
separate hydrogen from oxygen and nitrogen as compared to
from CO, CO2, and CH4, and to achieve satisfactory separation,
increasing adsorbent volume or adding additional processes
might be required.
The absorption-based gas separation utilizes a liquid solvente
containing scrubber column to absorb the impurities in the gas
mixture. The solvent from the scrubber column is then heated,
depressurized, and go through a regeneration column where
absorbed components are separated from the solvent. Chemical
solvents used for absorption include monoethanolamine (MEA),
triethanolamine (TEA), and methyldiethanolamine (MDEA)
which are featured by high reaction rates and high absorption
capacities, but significant heat requirements for regeneration.
On contrary, physical solvents (e.g., Rectisol and Selexol) have
lower heat requirements and their regeneration can be achieved
using reduced pressure and/or increased temperature. But their
absorption capacity is normally lower than that of chemical solvents at the condition of low CO2 partial pressure, making them
a more desirable option for high partial pressure conditions (Voldsund et al., 2016).
Elevated-temperature pressure swing adsorption (ET-PSA) has
been proposed to reduce the energy consumption of hydrogen
purification (Fig. 4.3). It combines the use of wateregas shift catalysts and elevated-temperature (200e450 C) CO2 adsorbents and
can achieve CO catalytic conversion, in situ CO2 adsorption, and
CO purification in a single unit, simultaneously (Zhu et al., 2019).
The elevated temperature avoids the need of precooling and
reheating syngas, saving the energy consumption upon heat
regeneration. Generally, ET-PSA can achieve a better compromise
between hydrogen purity and recovery ratio as compared to
Chapter 4 Waste-to-biohydrogen
Figure 4.3 Hydrogen upgrading and purification processes (Zhu et al., 2019).
conventional PSA. A recent study proposed an ET-PSA process
that achieved a hydrogen purity of 99.999% and a hydrogen recovery ratio over 95% (Zhu et al., 2018).
For an adsorption cycle of TSA, a hot medium stream such as
hot water or steam is used to heat the adsorption reactor followed
by the use of a cooling medium stream such as water to cool the
reactor (Jiang et al., 2018). The thermodynamic cycle of TSA can
be described in four steps, i.e., adsorption, preheating, desorption, and precooling. In the adsorption step, gas components
(e.g., CO2) are adsorbed with the adsorption heat carried away
by a cooling medium (Point 1 / 2 in Fig. 4.4). In the preheating
step, the adsorption reactor is heated without gas (CO2) desorption by the heating medium stream (Point 2 / 3 in Fig. 4.4). In
the desorption step, the temperature of the reactor is increased
followed by N2 purging. The gas will start being desorbed when
the adsorption capacity exceeds the maximum value, and flow
out of the reactor until the temperature reaches T4 (Point 3 / 4
in Fig. 4.4). In the precooling step, the cooling medium stream
is used to cool down the reactor until the temperature of the
reactor reaches T1 for initiating a new TSA cycle.
Generally, PSA gains greater popularity than TSA due to
various benefits such as reduced energy requirements, simple
operation, and low capital costs. Moreover, for TSA, there are
technical limitations and challenges about heating and cooling
adsorbent materials which have high porosity and low thermal
conductivity and require very high heating and cooling rates
and long cycle time to achieve sufficient heat diffusion (Pahinkar
et al., 2017). To reduce the long time for the desorption cycle, the
contact area between the adsorbents and hot gas needs to be
69
70
Chapter 4 Waste-to-biohydrogen
Figure 4.4 Schematic diagram for four-step TSA cycle: (A) process schematic; (B) adsorption isotherm diagram
(Jiang et al., 2018).
maximized (Bonnissel et al., 2001). However, TSA has such advantages as reduced compressor loads and the ability to utilize lowgrade heat, which suggests its potential to be integrated with
waste heat recovery processes.
ESA regenerates its adsorbent by increasing temperature
based on Joule effect (electricity conversion to heat). This means
that ESA is still applicable even though waste heat that is normally required by TSA is not available (Ribeiro et al., 2013). It
also has the benefits of reduced heating time (higher heating efficiency) and increased process productivity as compared to TSA.
Chapter 4 Waste-to-biohydrogen
Bonnissel proposed a rapid thermal swing adsorption process
based on the development of a composite adsorbent bed with
activated carbon particles and a highly conductive graphite material and on the use of thermoelectric devices for heating and cooling the bed. The high conductivity of the bed and the fast
dynamics of the thermoelectric elements led to fast cycles run
in 10e20 min (Bonnissel et al., 2001). Meanwhile, the consumption of electricity for the process suggests the importance of
selecting proper electricity sources for improving the economic
feasibility and environmental impact of the development. A
typical adsorbent used for the ESA process is activated carbon
which has good electrical conductivity but low adsorption capacity at low CO2 partial pressure. Other materials such as zeolites as
thermally stable crystalline materials have poor conductivity and
need to be embedded in a conductive matrix for Joule effecte
derived heating (Ribeiro et al., 2013).
Cryogenic/low-temperature separation utilizes the differences
in boiling point of gas components in a mixture to achieve gas
separation and requires the cooling of the gas mixture to cryogenic temperatures (<150 C) for separating hydrogen. It can
be applied to achieve moderately pure hydrogen from syngas,
and to recover hydrogen from the gas streams vented from hydrocracking or hydrotreating operations (Voldsund et al., 2016).
The high refrigeration demand and thus high costs limit its extensive application for generating high-purity hydrogen.
Finally, Fig. 4.5 gives an example of a typical process of
gasification-based WtH generation. Poststream the fluidized bed
reactor, there are arrangements of various cleanup, upgrading,
and separation and purification units. Specifically, the cyclone is
Figure 4.5 Schematic diagrams of gasification-based WtH processes (Lui et al., 2020).
71
72
Chapter 4 Waste-to-biohydrogen
used to remove particulates; the tar reformer is used to crack tar;
sulfur contaminants are removed using the catalyst-bed sulfur
removal unit; hydrogen is further enriched using the wateregas
shift reactor; the CO2 scrubber and PSA are used to separate
and purify hydrogen.
References
Abdoulmoumine, N., Adhikari, S., Kulkarni, A., & Chattanathan, S. (2015).
A review on biomass gasification syngas cleanup. Applied Energy, 155,
294e307. https://doi.org/10.1016/j.apenergy.2015.05.095
Argun, H., & Kargi, F. (2010). Bio-hydrogen production from ground wheat
starch by continuous combined fermentation using annular-hybrid
bioreactor. International Journal of Hydrogen Energy, 35(12), 6170e6178.
Asadi, N., & Zilouei, H. (2017). Optimization of organosolv pretreatment of rice
straw for enhanced biohydrogen production using Enterobacter aerogenes.
Bioresource Technology, 227, 335e344. https://doi.org/10.1016/
j.biortech.2016.12.073
Asimakopoulos, K., Gavala, H. N., & Skiadas, I. V. (2018). Reactor systems for
syngas fermentation processes: A review. Chemical Engineering Journal, 348,
732e744. https://doi.org/10.1016/j.cej.2018.05.003
Bonnissel, M. P., Luo, L., & Tondeur, D. (2001). Rapid thermal swing adsorption.
Industrial & Engineering Chemistry Research, 40(10), 2322e2334. https://
doi.org/10.1021/ie000809k
Brunetti, Adele, Barbieri, G., & Drioli, E. (2009). Pd-based membrane reactor for
syngas upgrading. Energy & Fuels, 23(10), 5073e5076. https://doi.org/
10.1021/ef900382u
Brunetti, A., Caravella, A., Fernandez, E., Pacheco Tanaka, D. A., Gallucci, F.,
Drioli, E., Curcio, E., Viviente, J. L., & Barbieri, G. (2015). Syngas upgrading in
a membrane reactor with thin Pd-alloy supported membrane. International
Journal of Hydrogen Energy, 40(34), 10883e10893. https://doi.org/10.1016/
j.ijhydene.2015.07.002
Bundhoo, Z. M. A. (2019). Potential of bio-hydrogen production from dark
fermentation of crop residues: A review. International Journal of Hydrogen
Energy, 44(32), 17346e17362.
Cabrol, L., Marone, A., Tapia-Venegas, E., Steyer, J.-P., Ruiz-Filippi, G., &
Trably, E. (2017). Microbial ecology of fermentative hydrogen producing
bioprocesses: Useful insights for driving the ecosystem function. FEMS
Microbiology Reviews, 41(2), 158e181.
Chen, Y., Yi, L., Li, S., Yin, J., & Jin, H. (2020). Catalytic gasification of sewage
sludge in near and supercritical water with different catalysts. Chemical
Engineering Journal, 388, 124292.
COMEAP. (2018). Associations of long-term average concentrations of nitrogen
dioxide with mortality. https://assets.publishing.service.gov.uk/government/
uploads/system/uploads/attachment_data/file/734799/COMEAP_NO2_
Report.pdf.
Dahiya, S., Chatterjee, S., Sarkar, O., & Mohan, S. V. (2020). Renewable hydrogen
production by dark-fermentation: Current status, challenges and
perspectives. Bioresource Technology, 124354.
Chapter 4 Waste-to-biohydrogen
Davda, R. R., Shabaker, J. W., Huber, G. W., Cortright, R. D., & Dumesic, J. A.
(2005). A review of catalytic issues and process conditions for renewable
hydrogen and alkanes by aqueous-phase reforming of oxygenated
hydrocarbons over supported metal catalysts. Applied Catalysis B:
Environmental, 56(1e2), 171e186.
De Amorim, E. L. C., Barros, A. R., Damianovic, M. H. R. Z., & Silva, E. L. (2009).
Anaerobic fluidized bed reactor with expanded clay as support for hydrogen
production through dark fermentation of glucose. International Journal of
Hydrogen Energy, 34(2), 783e790.
Devi, L., Ptasinski, K. J., & Janssen, F. J. J. G. (2003). A review of the primary
measures for tar elimination in biomass gasification processes. Biomass and
Bioenergy, 24(2), 125e140. https://doi.org/10.1016/S0961-9534(02)00102-2
Dincer, I., & Acar, C. (2015). Review and evaluation of hydrogen production
methods for better sustainability. International Journal of Hydrogen Energy,
40(34), 11094e11111.
Edreis, E. M. A., Luo, G., Li, A., Xu, C., & Yao, H. (2014). Synergistic effects and
kinetics thermal behaviour of petroleum coke/biomass blends during H2O
co-gasification. Energy Conversion and Management, 79, 355e366.
_ Gräf, O., Hasibar, B., Steiner, M., Vukotic, S., Bochmann, G., Fuchs, W.,
Ergal, I.,
& Simon, K.-M. R. (2020). Biohydrogen production beyond the Thauer limit
by precision design of artificial microbial consortia. Communications Biology,
3(1), 1e12.
Gorgec, F. K., & Karapinar, I. (2019). Biohydrogen production from hydrolyzed
waste wheat by dark fermentation in a continuously operated packed bed
reactor: The effect of hydraulic retention time. International Journal of
Hydrogen Energy, 44(1), 136e143.
Guo, Y., Wang, S., Gong, Y., Xu, D., Tang, X., & Ma, H. (2010). Partial oxidation of
municipal sludge with activited carbon catalyst in supercritical water.
Journal of Hazardous Materials, 180(1e3), 137e144.
He, C., Chen, C.-L., Giannis, A., Yang, Y., & Wang, J.-Y. (2014). Hydrothermal
gasification of sewage sludge and model compounds for renewable hydrogen
production: A review. Renewable and Sustainable Energy Reviews, 39,
1127e1142.
Hervy, M., Pham Minh, D., Gerente, C., Weiss-Hortala, E., Nzihou, A., Villot, A., &
Le Coq, L. (2018). H2S removal from syngas using wastes pyrolysis chars.
Chemical Engineering Journal, 334, 2179e2189. https://doi.org/10.1016/
j.cej.2017.11.162
IEA. (2016). CO2 emissions from fuel combustion 2016. https://doi.org/10.1787/
co2_fuel-2016-en
Jiang, L., Roskilly, A. P., & Wang, R. Z. (2018). Performance exploration of
temperature swing adsorption technology for carbon dioxide capture. Energy
Conversion and Management, 165, 396e404. https://doi.org/10.1016/
j.enconman.2018.03.077
Köchermann, J., Schneider, J., Matthischke, S., & Rönsch, S. (2015). Sorptive H2S
removal by impregnated activated carbons for the production of SNG. Fuel
Processing Technology, 138, 37e41. https://doi.org/10.1016/
j.fuproc.2015.05.004
Kruse, A., Henningsen, T., Sınaǧ, A., & Pfeiffer, J. (2003). Biomass gasification in
supercritical water: Influence of the dry matter content and the formation of
phenols. Industrial & Engineering Chemistry Research, 42(16), 3711e3717.
Lui, J., Chen, W.-H., Tsang, D. C. W., & You, S. (2020). A critical review on the
principles, applications, and challenges of waste-to-hydrogen technologies.
Renewable and Sustainable Energy Reviews, 134, 110365.
73
74
Chapter 4 Waste-to-biohydrogen
Lu, C., Zhang, Z., Ge, X., Wang, Y., Zhou, X., You, X., Liu, H., & Zhang, Q. (2016).
Bio-hydrogen production from apple waste by photosynthetic bacteria HAUM1. International Journal of Hydrogen Energy, 41(31), 13399e13407. https://
doi.org/10.1016/j.ijhydene.2016.06.101
Lu, C., Zhang, H., Zhang, Q., Chu, C., Tahir, N., Ge, X., Jing, Y., Hu, J., Li, Y.,
Zhang, Y., & Zhang, T. (2020). An automated control system for pilot-scale
biohydrogen production: Design, operation and validation. International
Journal of Hydrogen Energy, 45(6), 3795e3806. https://doi.org/10.1016/
j.ijhydene.2019.04.288
Ma, Z., Xiao, R., & Zhang, H. (2017). Catalytic steam reforming of bio-oil model
compounds for hydrogen-rich gas production using bio-char as catalyst.
International Journal of Hydrogen Energy, 42(6), 3579e3585.
Mirza, S. S., Qazi, J. I., Zhao, Q., & Chen, S. (2013). Photo-biohydrogen
production potential of Rhodobacter capsulatus-PK from wheat straw.
Biotechnology for Biofuels, 6(1), 1e12.
ez, K. M., Ruiz-Ordaz, N., García-Mena, J., Ponce-Noyola, M. T.,
Muñoz-Pa
lez, I. V., Villa-Tanaca, L., BarreraRamos-Valdivia, A. C., Robles-Gonza
Cortes, J., Rinderknecht-Seijas, N., & Poggi-Varaldo, H. M. (2013).
Comparison of biohydrogen production in fluidized bed bioreactors at room
temperature and 35 C. International Journal of Hydrogen Energy, 38(28),
12570e12579.
Nikolaidis, P., & Poullikkas, A. (2017). A comparative overview of hydrogen
production processes. Renewable and Sustainable Energy Reviews, 67,
597e611.
Pahinkar, D. G., Garimella, S., & Robbins, T. R. (2017). Feasibility of temperature
swing adsorption in adsorbent-coated microchannels for natural gas
purification. Industrial & Engineering Chemistry Research, 56(18), 5403e5416.
https://doi.org/10.1021/acs.iecr.7b00389
Parthasarathy, P., & Narayanan, K. S. (2014). Hydrogen production from steam
gasification of biomass: Influence of process parameters on hydrogen
yieldea review. Renewable Energy, 66, 570e579.
Rezvani, Z., Jansson, J., & Bengtsson, M. (2018). Consumer motivations for
sustainable consumption: The interaction of gain, normative and hedonic
motivations on electric vehicle adoption. Business Strategy and the
Environment, 27(8), 1272e1283.
Ribeiro, R. P. P. L., Grande, C. A., & Rodrigues, A. E. (2013). Activated carbon
honeycomb monolith e zeolite 13X hybrid system to capture CO2 from flue
gases employing Electric Swing Adsorption. Chemical Engineering Science,
104, 304e318. https://doi.org/10.1016/j.ces.2013.09.011
Setiabudi, H. D., Aziz, M. A. A., Abdullah, S., Teh, L. P., & Jusoh, R. (2020).
Hydrogen production from catalytic steam reforming of biomass pyrolysis oil
or bio-oil derivatives: A review. International Journal of Hydrogen Energy,
45(36), 18376e18397.
Shahbaz, M., Al-Ansari, T., Aslam, M., Khan, Z., Inayat, A., Athar, M., Naqvi, S. R.,
Ahmed, M. A., & McKay, G. (2020). A state of the art review on biomass
processing and conversion technologies to produce hydrogen and its
recovery via membrane separation. International Journal of Hydrogen
Energy, 45(30), 15166e15195. https://doi.org/10.1016/j.ijhydene.2020.04.009
Singh, S., Jain, S., Venkateswaran, P. S., Tiwari, A. K., Nouni, M. R., Pandey, J. K.,
& Goel, S. (2015). Hydrogen: A sustainable fuel for future of the transport
sector. Renewable and Sustainable Energy Reviews, 51, 623e633.
Thauer, R. K., Jungermann, K., & Decker, K. (1977). Energy conservation in
chemotrophic anaerobic bacteria. Bacteriological Reviews, 41(1), 100e180.
Chapter 4 Waste-to-biohydrogen
Voldsund, M., Jordal, K., & Anantharaman, R. (2016). Hydrogen production with
CO2 capture. International Journal of Hydrogen Energy, 41(9), 4969e4992.
https://doi.org/10.1016/j.ijhydene.2016.01.009
Watson, J., Si, B., Li, H., Liu, Z., & Zhang, Y. (2017). Influence of catalysts on
hydrogen production from wastewater generated from the HTL of human
feces via catalytic hydrothermal gasification. International Journal of
Hydrogen Energy, 42(32), 20503e20511.
Wong, Y. M., Wu, T. Y., & Juan, J. C. (2014). A review of sustainable hydrogen
production using seed sludge via dark fermentation. Renewable and
Sustainable Energy Reviews, 34, 471e482.
Wu, X., Li, Q., Dieudonne, M., Cong, Y., Zhou, J., & Long, M. (2010). Enhanced
H2 gas production from bagasse using adhE inactivated Klebsiella oxytoca
HP1 by sequential dark-photo fermentations. Bioresource Technology,
101(24), 9605e9611. https://doi.org/10.1016/j.biortech.2010.07.095
Yang, H., Guo, L., & Liu, F. (2010). Enhanced bio-hydrogen production from
corncob by a two-step process: Dark-and photo-fermentation. Bioresource
Technology, 101(6), 2049e2052.
Yang, H., Shi, B., Ma, H., & Guo, L. (2015). Enhanced hydrogen production from
cornstalk by dark-and photo-fermentation with diluted alkali-cellulase twostep hydrolysis. International Journal of Hydrogen Energy, 40(36),
12193e12200.
You, S., Ok, Y. S., Tsang, D. C. W., Kwon, E. E., & Wang, C.-H. (2018). Towards
practical application of gasification: A critical review from syngas and
biochar perspectives. Critical Reviews in Environmental Science and
Technology, 48(22e24), 1165e1213. https://doi.org/10.1080/
10643389.2018.1518860
You, S., Tong, H., Armin-Hoiland, J., Tong, Y. W., & Wang, C.-H. (2017). Technoeconomic and greenhouse gas savings assessment of decentralized biomass
gasification for electrifying the rural areas of Indonesia. Applied Energy, 208,
495e510. https://doi.org/10.1016/j.apenergy.2017.10.001
You, S., Wang, W., Dai, Y., Tong, Y. W., & Wang, C.-H. (2016). Comparison of the
co-gasification of sewage sludge and food wastes and cost-benefit analysis of
gasification- and incineration-based waste treatment schemes. Bioresource
Technology, 218. https://doi.org/10.1016/j.biortech.2016.07.017
Zhang, T., Jiang, D., Zhang, H., Jing, Y., Tahir, N., Zhang, Y., & Zhang, Q. (2020).
Comparative study on bio-hydrogen production from corn stover: Photofermentation, dark-fermentation and dark-photo co-fermentation.
International Journal of Hydrogen Energy, 45(6), 3807e3814. https://doi.org/
10.1016/j.ijhydene.2019.04.170
Zhang, Q., Lu, C., Lee, D.-J., Lee, Y.-J., Zhang, Z., Zhou, X., Hu, J., Wang, Y.,
Jiang, D., & He, C. (2017). Photo-fermentative hydrogen production in a 4 m3
baffled reactor: Effects of hydraulic retention time. Bioresource Technology,
239, 533e537.
Zhu, X., Li, S., Shi, Y., & Cai, N. (2019). Recent advances in elevated-temperature
pressure swing adsorption for carbon capture and hydrogen production.
Progress in Energy and Combustion Science, 75, 100784. https://doi.org/
10.1016/j.pecs.2019.100784
Zhu, X., Shi, Y., Li, S., & Cai, N. (2018). Two-train elevated-temperature pressure
swing adsorption for high-purity hydrogen production. Applied Energy, 229,
1061e1071. https://doi.org/10.1016/j.apenergy.2018.08.093
75
This page intentionally left blank
Waste-to-biomethane
5
Abstract
This chapter introduces waste-to-biomethane production via the
technology of anaerobic digestion. It starts by explaining the influences
of four main process parameters (i.e., feedstock, temperature, pH, and
retention time) toward biogas production. It summarizes the development of biogas cleanup and upgrading methods. The contamination
of biogas is reviewed with a focus on H2S, siloxanes, and halogen. The
formation mechanisms and cleanup methods of the contaminants are
discussed. Finally, it explains the technical principles, advantages, and
disadvantages of five main types of biogas upgrading technologies including
pressurized water scrubbing, chemical absorption, membrane separation,
pressure swing adsorption, and others.
Keywords: Biogas; Biogas contamination; Cleanup and upgrading;
Organic waste; Process parameters; Waste-to-biomethane.
1. Introduction
AD is one of the most widely used methods for deriving biogas
from organic waste such as food waste, manure, crops, sludge,
and crop residues. Instead of being used for energy production,
biogas, after cleanup, can be upgraded to generate high-purity
(>97%) methane (biomethane) to replace fossil fuels for further
energy and chemical applications such as displacing natural gas
in the grid and powering the transport sector. The AD-based
biogas production has been introduced in Chapter 2. This chapter will focus on the improvement of biogas yields based on the
understanding of relevant influential factors, and cleanup and
upgrading processes that turn biogas into high-purity methane.
2. Biogas production
The yields and compositions of biogas vary considerably
depending on various AD process parameters and conditions
such as the type of feedstock, temperature, pH, the content of
total solid, HRT, etc.
Waste-to-Resource System Design for Low-Carbon Circular Economy. https://doi.org/10.1016/B978-0-12-822681-0.00007-4
Copyright © 2022 Elsevier Inc. All rights reserved.
77
78
Chapter 5 Waste-to-biomethane
2.1 Feedstock
A wide range of organic waste has been tested about their suitability for AD and to name just a few, animal manure, sewage
sludge, municipal solid waste, food waste, crops, and crop residues. Although there is limited freedom in the selection of feedstock in some cases especially when the disposal of waste is the
goal, the careful selection of an appropriate feedstock is critical
for the technoeconomic feasibility of AD development. Accordingly, it is important to understand how the physicochemical
properties of feedstock affect biogas yields and the underlying
mechanisms.
The chemical composition of feedstock is associated with the
survival and growth of AD microorganisms and can be categorized into macronutrients (carbon, nitrogen, phosphorus, and
sulfur) and micronutrients (iron, cobalt, nickel, zinc, selenium,
tungsten, magnesium, chromium, and molybdenum), respectively, based on their roles (Mirmohamadsadeghi et al., 2019).
Specifically, carbon is important for the build-up of cell structure
and serves as the source for energy generation. Nitrogen is an
important building block for proteins. Phosphorus is key for trapping and transferring energy in cellular activities of microorganisms. Sulfur is important for the growth of methanogens and is
used in the formation of some amino acids (Choong et al.,
2018). A good balance between carbon and nitrogen contents favors the AD process and a desirable carbon to nitrogen ratio was
suggested to range between 20 and 30. The micronutrients are
also involved in various activities (e.g., co-precipitation, enzymatic activity, and biochemical reactions) related to the growth
and survival of AD microorganisms. For example, iron serves as
a growth factor and a stimulating agent for the formation of ferredoxins and cytochromes which are essential in cell metabolism
(Mirmohamadsadeghi et al., 2019). It can also precipitate sulfur
as iron (II) sulfide, reducing the corrosion effects of H2S. Cobalt
is a growth factor of acetogenic microorganisms and serves to
stabilize the AD processes with higher organic loadings.
The size of feedstock particles affects the degradation efficiency, stability, and VFA accumulation of AD. Generally, fine feedstock particles provide larger specific surface areas for the initial
adsorption of exo-enzymes, which serve to improve the degradation rate and thus biogas production (Mirmohamadsadeghi
et al., 2019). It was shown that a properly reduced food waste particle size (0.6e0.7 mm) improved the methane yield by 28%, but
smaller food waste particles (w0.4 mm) led to VFA accumulation
and reduced solubilization, thus reducing the methane production
Chapter 5 Waste-to-biomethane
(Izumi et al., 2010). Upon the AD of organic fraction of MSW
(OFMSW), smaller particle sizes caused acidification and ultimately
led to a process failure at an OLR of 6 kg volatile solids (VS)/m3/day
in a “dry” digester. Severe foaming was formed, failing the process
for the cases of OLR greater than 5 kg VS/m3/day for small particles
in a “wet” digester (Zhang & Banks, 2013). Batch experiments of the
AD of rice straw showed that the methane yield increased from
107 mL/g VS to 197 mL/g VS when the particle size reduced from
20 to 0.075 mm due to an enhanced cellulose degradation rate
from 27% to 93% (Dai et al., 2019). The basic morphology, dissolution abilities, and bio-liquefaction degree could be improved by a
particle comminution pretreatment.
Some compositions of feedstock are direct toxicants to AD microorganisms or indirectly lead to the formation of AD inhibitory
compounds. For example, the metallic micronutrients and heavy
metal compositions at their high concentrations (e.g., Na and K
for food waste) inhibit the AD process by disrupting the function
and structure of enzymes (Mirmohamadsadeghi et al., 2019).
Feedstocks (e.g., food waste) with high lipid contents tend to
accumulate long-chain fatty acids (LCFAs) such as oleic acid, palmitoleic acid, and linoleic acid which can compromise the cell
transport system of AD microorganisms upon their adsorption
on the membrane and cell walls, reducing the methane production. To mitigate the problem caused by the accumulation of
LCFAs, various approaches such as adding active inoculum and
co-substrate, LCFA adsorption, and discontinuous feeding can
be applied (Mirmohamadsadeghi et al., 2019). VFAs and ammonia
at high concentrations also inhibit and affect the stability of AD
processes. For the excessive accumulation of VFAs caused by
high organic loads during kitchen waste AD, it was shown that
acetic acid was the main inhibitor in methanogenesis, and aceticlastic methanogenesis was more significantly affected by acetic
acid than hydrogenotrophic methanogenesis (Xu et al., 2014).
VFA inhibition can be mitigated by the addition of trace elements,
adjustment of bioreactor pH, and bioaugmentation (i.e., the addition of functional microorganism to enhance the metabolism of
methanogens) which can serve to improve the growth environment and the acid resistance of AD microorganisms (Zhao et al.,
2020). Ammonia as produced via the degradation of nitrogenous
matters at a proper amount is beneficial for mitigating the inhibition caused by VFAs by promoting the buffering capacity of AD.
However, excessive amount of free ammonia (NH3) can inhibit
the process by diffusing through the cells and disrupting the Hþ
and K balance and the cell function of microorganisms (Mirmohamadsadeghi et al., 2019). It was shown that high-rate digesters
79
80
Chapter 5 Waste-to-biomethane
generally experienced operational failure for total ammonia nitrogen (free ammonia nitrogen þ ammonium nitrogen) concentrations of around 1700e1800 mg/L and that AD was inhibited by a
€n &
free ammonia nitrogen concentration of 150 mg/L (Yenigu
Demirel, 2013). It is worth noting that these numbers also depend
on other process conditions such as the type of substrate, digester
designs, pH, loading rate, etc.
To mitigate the issues related to nutrient imbalance and/or
toxicant inhibition, the method of anaerobic co-digestion based
on the utilization of two or more substrates has been proposed.
For example, the co-digestion of food waste and straw achieved
a methane production yield of 0.392 m3/kg-VS which was 39.5%
and 149.7% higher than mono-digestion of the individual feedstocks, respectively (Yong et al., 2015). The co-digestion experiments also achieved a biogas production and methane content of
0.58 m3/kg-VS and 67.62%, respectively. The co-digestion of sewage
sludge and glycerol from the biodiesel industry at 35 C achieved a
methane yield of 2353 94 mL/day as compared to 1106 36 mL/
d for the mono-digestion of sewage sludge (Fountoulakis et al.,
2010). The added glycerol increased the active VS concentration
in the reactor and the glycerol addition of a concentration <1
vol.% in the feed boosted biogas yields.
2.2 Temperature
Temperature critically affects the activities of methanogens
to different degrees for thermophilic (55e70 C) and mesophilic
(32e45 C) AD. The higher operating temperature for thermophilic AD generally promotes microorganism growth, organic
content degradation, and biogas production, and reduces the
solubility of oxygen and ammonia-induced process inhibition.
However, the temperature needs to be relatively stable as thermophilic methanogens are sensitive to temperature variations
(Mirmohamadsadeghi et al., 2019). The greater diversity of
methanogens is generally favored by mesophilic conditions,
leading to higher tolerance to temperature and other environmental changes and thus a higher level of process stability. A
series of batch AD experiments treating pig manure showed
that the metabolic activities increased considerably as the temperature increased from 15 to 35 C, while the compositions
and metabolic pathways of microbial communities remained
similar (Tian et al., 2018). A greater microbial diversity associated
with hydrolysis, acidogenesis, and acetogenesis was achieved at
45 C and their population decreased when the temperature
increased further to 55 C, suggesting 45 C might be a turning
Chapter 5 Waste-to-biomethane
point for the microbial community composition and the metabolic pathway between mesophilic and thermophilic AD. Food
waste AD experiments showed that the solubilization rate of
food waste was 47.5%, 62.2%, 70.0%, 72.7%, 56.1%, and 45.9%
at 15 C, 25 C, 35 C, 45 C, 55 C, and 65 C, respectively, suggesting that the overall solubilization rate was significantly lower under a thermophilic condition (Komemoto et al., 2009). The biogas
production was 64.7 and 62.7 mL/g-VS under the mesophilic
conditions of 35 C and 45 C, respectively, which were higher
than that under the thermophilic conditions, though a shorter
HRT was achieved for thermophilic AD.
2.3 pH
Low pH conditions caused by the generation of acidic intermediates are one of the main reasons for the failure of AD processes due to the inhibitory effect on methanogens. It was
suggested that an AD system needs to have sufficient alkalinity
(2500e5000 mg/L) to buffer the production of VFAs (Choong
et al., 2018). However, the excessive use of buffering agents such
as NaOH also poses an inhibitory risk to methanogens and high
pH conditions favors the formation of free ammonia, leading to
ammonia-induced inhibition (Ali et al., 2019). A pH value between
6.8 and 7.4 was reported to be ideal for methanogens to survive,
and different pH conditions favored the growth of different AD
bacteria (e.g., pH ¼ 6 favoring Clostridium butyricum, while
pH ¼ 8 favoring Propionibacterium species) (Mao et al., 2015).
Methanogenic and acidogenic microorganisms corresponding
to the different steps of an AD process differ regarding their
optimal pH conditions with methanogenesis and acidogenesis
being most efficient at pH ¼ 6.5e8.2 and pH ¼ 5.5e6.5, respectively. However, the acclimatization and production of methane
at low pH conditions have been considered as a potential
method for maintaining or even increasing the methane and
overall biogas yields. It was shown that aceticlastic methanogens
were acclimatized to low pH down to 3.5 and accounted for
96.3% of the total methanogenic population at pH ¼ 4.5 and
86.75% at pH ¼ 3.5 (Ali et al., 2019). The methane yield at
pH ¼ 4.5 after acclimatization was found to be similar to that
at the neutral pH condition.
2.4 Retention time
Retention time is the time it takes for a given amount
of organic matter to decompose in an AD reactor or system.
It affects the microbial population, metabolic pathway, and
81
82
Chapter 5 Waste-to-biomethane
production of intermediates and end-products and is affected by
process temperature, OLR, and substrate composition (Choong
et al., 2018; Mao et al., 2015). Two different types of retention
time have been defined: SRT being the average time that bacteria
(solids) spend in a digester, and HRT being the volume of the
reactor divided by the influent flow rate.
An insufficient HRT causes such issues as reduced system
efficiencies and methane yields, and increased process instability. Generally, a shorter HRT leads to the accumulation of
VFAs and a long HRT and low OLR are needed to maximize
the yield of methane. AD experiments based on primary sludge
and a starch-rich industrial wastewater showed that soluble
COD and VFA concentrations were highest at HRT ¼ 30 h and
25 C and decreased for a further increase in HRT (Maharaj &
Elefsiniotis, 2001). The effects of HRT on methane production
were studied based on a CSTR-based two-stage mesophilic AD
system fed with olive mill wastewater, cheese whey, and liquid
cow manure (Dareioti & Kornaros, 2014). It was found that the
highest system efficiency was achieved at HRT ¼ 0.75 day and the
methanogenic reactor had a better stability at HRT ¼ 25 days as
compared to 20 days with a methane production rate of 0.33 L
CH4/LR day. It was also shown that increasing SRT from 5 to
35 days was significantly related to the decreases in the biogas
and methane production and VFAs concentrations (Mao et al.,
2015).
3. Biogas cleanup and upgrading
3.1 Contamination
In addition to the major gas components (i.e., CH4 and CO2),
there often exist certain amount of contaminants in biogas
depending on the process conditions such as temperature, pressure and the types of feedstocks. Typical contaminants include
H2S, hydrocarbons (e.g., benzene, toluene, etc.), halogens, siloxanes, and halocarbons (Table 5.1). Toward the generation and
application (e.g., in solid oxide fuel cells (SOFCs)) of highpurity methane or methane-rich gas, it is critical to efficiently
remove CO2 and the contaminants. In particular, the contaminants risk the stable operation of methane applications and
reduce overall process efficiencies. Some of the contaminant
removal techniques are similar to what have been introduced
in Chapter 4. This chapter will focus on the information specific
to biogas.
Chapter 5 Waste-to-biomethane
83
Table 5.1 Concentrations (ppm) of typical biogas contaminants (Lanzini et al., 2017).
H2S
Siloxanes
Halogens Halogens (HF, HBr,
Hydrocarbons
(D4, D5, etc.) (HCl)
and others)
Halocarbons (benzene, toluene, etc.)
121
24e63
1.8e104
80e130
0.24e2.3
0.1e0.7
0.6e1
Up to 2.9
0.2e1.4
0.2e0.8
n.a.
n.a.
1
n.a.
n.a.
n.a.
0.16
n.a.
<0.1
w1
3.1.1 H2S
H2S in biogas is generated upon the degradation of sulfurcontaining organic compounds (e.g., proteins) and is most relevant to the AD processing of manure, sewage sludge, and diary
streams. It is the most significant biogas contaminant and has a
concentration range between 300 and 6000 ppm (or 0.1%e5%)
(Lanzini et al., 2017; Wu et al., 2020). Direct use of biogas without
desulfurization can cause the problem of corrosiveness to pipes
and devices. In situ sulfur abatement can be achieved by injecting
air or oxygen into the digester to promote the activity of sulfideoxidizing bacteria (SOB) that turn H2S to elemental sulfur (S0)
(Lanzini et al., 2017). H2S can also be removed via the chemical
absorption of sulfur in aqueous solutions (e.g., iron-chelated solutions) which converts H2S into S0 by means of sulfide oxidation.
Iron oxide adsorbents can be used for sulfur removal but suffer from the problems of high cost and difficulty in the disposal of
spent material. One of the major types is iron sponge (unit cost
w0.25 USD/kg) made of iron oxide or hydroxide coated onto a
supporting material such as wood shavings or wood chips
(Lanzini et al., 2017). It has a theoretical removal efficiency of
0.64 kg H2S/kg Fe2O3. The desulfurization process can be operated either in a batch or continuous mode with latter being
preferred for a higher removal efficiency: the continuous mode
co-fed with air (oxygen) achieved a removal efficiency of
2.5 kg H2S/kg Fe2O3. SulfaTreat, Sulfur-Rite, and Media-G2 are
three main types of commercial iron oxide adsorbents with SulfaTreat being the most widely used for H2S removal. SulfaTreat is a
mixture of iron oxides (Fe2O3 and Fe3O4) and an activator oxide
1.6
0.7e3
0.4e1.7
n.a.
84
Chapter 5 Waste-to-biomethane
(0.125e5 wt.% of the adsorbent) that is made of one or more
oxides of several metals such as platinum, gold, silver, copper,
cadmium, nickel, palladium, lead, etc., and serves to enhance
adsorption (Lanzini et al., 2017). SulfaTreat was reported to
achieve a removal efficiency of 0.11 g H2S/g SulfaTreat (Truong
& Abatzoglou, 2005).
Activated carbon has also been used to remove H2S in biogas.
Some major factors affecting the activated carbonebased H2S
adsorption include the water content, surface pH, and micropore
volume of activated carbon. For example, preadsorbed water on
activated carbon can enhance the adsorption capacity by
promoting the dissociation of H2S followed by further oxidation
to form sulfur. However, water in the gas mixture would deactivate catalytic centers and impede the adsorption process. For
reactive adsorption, the micropores act as microreactors to retain
chemisorbed oxygen for the oxidation and to store elemental sulfur (Seredych & Bandosz, 2006). To improve the chemical sorption
of H2S, impregnated activated carbon can be developed by treating raw activated carbon with a solid or liquid compound such as
sodium bicarbonate (NaHCO3), potassium hydroxide (KOH), sodium carbonate (Na2CO3), sodium hydroxide (NaOH), etc. They
can achieve a sulfur removal capacity of 30 wt.% (a few hundreds
of mg per g of activated carbon) with the presence of oxygen to
promote H2S oxidation to elemental sulfur (S0), which is around
one order of magnitude higher than that of nonimpregnated activated carbon (Lanzini et al., 2017). However, the cost of impregnated activated carbons can be 3e4 times higher than that of
raw activated carbon.
Besides the common physical/chemical desulfurization technologies based on the principles of absorption, adsorption, and
membrane separation (as mentioned above and in Chapter 4),
biodesulfurization emerges as a promising method because of
its various advantages such as low energy consumption, mild
operation conditions, reduced secondary pollution, high H2S
removal efficiency, and being chemical catalysts free (Wu et al.,
2020). Biodesulfurization relies on SOB to remove H2S in biogas
via microbial metabolism. Biotrickling filters (BTF, Fig. 5.1)
packed with inorganic or manufactured media use a trickling
liquid phase to control pH, salt or the metabolite concentration,
and the nutrients of process culture (Vikromvarasiri et al., 2017).
They have the benefits of reduced environmental impacts and
increased cost-effectiveness.
During the biodesulfurization process, chemotrophic bacteria
(e.g., Halothiobacillus neapolitanus) utilize inorganic carbon (e.g.,
carbon dioxide) as a carbon source and the oxidation of H2S to get
Chapter 5 Waste-to-biomethane
Figure 5.1 A schematic diagram of BTF (Wu et al., 2020).
chemical energy. The process can be conducted under either
anoxic (anoxic BTF) or aerobic (aerobic BTF) conditions. For the
former, NO
3 and NO2 can be used as the electron acceptor, but
it is relatively difficult to control and expensive to remove high
concentrations of H2S due to the need of nitrate (Wu et al.,
2020). For the latter, oxygen (air or pure oxygen) can be used as
the electron acceptor and high concentrations (1000e10,000
ppmv) of H2S can be effectively removed. H. neapolitanus isolated
from activated sludge has been tested for degrading H2S to
elemental sulfur or sulfate in a biotrickling filter and a maximum
removal capacity of 78.57 g H2S/m3h was achieved (Vikromvarasiri
et al., 2017).
Major influential factors of biodesulfurization include gas
flow rate, empty bed residence time (EBRT), inlet H2S concentration, and liquid recirculation rate. EBRT played a greater
role in determining the removal efficiency than the other factors.
A longer EBRT results in a higher removal efficiency, while the
liquid recirculation rate played a minor role in affecting the
removal efficiency (Vikromvarasiri et al., 2017). A short EBRT
incurs a reduced contact time between bacteria and substrates
and thus limited mass transfer of H2S to the liquid phase. This
leads to incomplete degradation of H2S and thus a reduced
85
86
Chapter 5 Waste-to-biomethane
removal efficiency (Wu et al., 2020). High inlet loading of H2S also
poses a toxic risk of inhibiting the activity of the SOB. However, a
longer EBRT means a lower inlet loading of H2S (for a lower concentration of H2S) and a larger volume of BTF (a higher cost of
the desulfurization process). Increasing the inlet loading of H2S
decreases the EBRT and the associated H2S removal efficiency.
For example, as EBRT decreased from 160 to 40 s, the H2S removal
efficiency decreased from 81.8% to 67.1% for a H2S concentration
of 3862 ppmv (Chaiprapat et al., 2011). As the inlet loading
increased from 84 g H2S/m3/h to 334 g H2S/m3/h corresponding
to the decrease of EBRT from 120 to 30 s, the H2S removal efficiency
decreased from 97.7% to 39.7%, which was mainly attributed to the
limited mass transfer (Fortuny et al., 2011).
High inlet loading and H2S concentrations are conditions
favoring higher process efficiencies. To mitigate the potential
issue of low removal efficiency due to the limited mass transfer
of H2S, it is important to increase the contact between biofilm
and substrates, which can be achieved using packing materials
(e.g., polypropylene) with high specific surface areas, porosity,
hydrophilicity, and water retention capacities (Wu et al., 2020).
Additionally, increasing the alkalinity of the medium can enhance
the mass transfer of H2S to the liquid phase as of the reaction
H2S þ OH/H2O þ HS. An acid environment is harmful to
some SOB, and experiments have shown that the removal efficiency of H2S decreased as the decrease of the pH value of recirculation liquid (Jin et al., 2005). An alkaline environment (pH ¼ 7e8.5)
might serve to mitigate the acidity-associated toxic effect and promote the activity of bacteria.
3.1.2 Siloxanes
Siloxanes, also known as volatile methyl siloxanes (VMS), are
a group of polymeric compounds of silicon and oxygen bonds
with organic chains attached to the silicon atoms. Siloxanes
are normally derived not only from the AD treatment of sewage
sludge containing silicone-based compounds such as personal
care products, adhesives and coatings, cosmetics, etc., but also
from the addition of antifoaming agents to AD. Most common
siloxanes in biogas are cyclic volatile polydimethylsiloxanes
(D4 (octamethylcyclotetrasiloxane) and D5 (decamethylcyclopentasiloxane)) which can account for 90% of the overall silicon
content of biogas (Lanzini et al., 2017).
The presence of siloxanes in biogas is particularly harmful for
the energy application of biogas because silicates (SiO2) and microcrystalline can be formed during the combustion of siloxanescontaining biogas which can potentially damage engine parts
Chapter 5 Waste-to-biomethane
upon their deposition which adversely affects heat conduction and
lubrication (Santos-Clotas et al., 2019). Even a small amount of
siloxanes in biogas is highly detrimental to SOFCs. For example,
the presence of 1 ppm D4 siloxane was found to degrade SOFC
with WeNieCe as anode by the formation of silica in the anode
(Escudero & Serrano, 2019). Siloxanes decomposed very quickly
to SiO2 and the vapor phase Si in the form of Si(OH)4 or SiO further
diffused to the anode/electrolyte region and ultimately precipitated. It was shown that D4 significantly reduced the performance
of nickel-based anode supported SOFCs even at ultra-low levels of
78e178 ppb(v) due to the formation and deposition of silicon dioxide onto the anode porous sites (Papurello & Lanzini, 2018). It
reduced the anode porosity and fuel flow channels for supplying
the fuel to active sites. A two-step chemical reaction mechanism
has been proposed for D5 siloxane deposition: (1) D5 reacts with
water and the methyl groups are converted to carbon monoxide
and hydrogen, and (2) the remaining orthosilicic acid gas travels
through the anode and decomposed into silicon dioxide and water,
leading to the accumulation of Si in the anode and thus a higher
anode polarization and ohmic loss (Haga et al., 2008).
Solid sorbents such as activated carbon, zeolite, and silica gel
can be used to remove siloxanes. The reported adsorption capacity varies considerably depending on the experimental conditions. For example, wood-based chemically activated carbon
was shown to have an adsorption capacity of 1732 93 mg/g
for 1000 ppm (v/v) of D4 with dry N2 as the carrier gas, but the capacity would be halved when the concentration of D4 was lowered
to a typical value (1.45 ppm) found in biogas (Cabrera-Codony
et al., 2014). Moreover, other gas components such as CH4 and
CO2 as well as humidity served to reduce the adsorption capacity
of activated carbon. In another study, the D4 adsorption capacity
of commercial activated carbon with N2 as the carrier gas was in
the range of 5.6e19.2 mg/g, and the adsorption capacity was positively related to the BrunauereEmmetteTeller surface area, pore
volume, and pH value of activated carbon (Matsui & Imamura,
2010). It is worth noting that the presence of relatively nonvolatile,
organic sulfur or halogenated compounds in biogas adversely
affected the adsorption capacity of activated carbon toward siloxanes (Lanzini et al., 2017).
3.1.3 Halogen
Typical halogen trace contaminants in biogas are chlorinebased including HCl and CH3Cl. Upon biogas SOFC applications,
halocarbons decompose quickly into halogens which can get
adsorbed onto electrocatalyst surfaces and affect cell operation
87
88
Chapter 5 Waste-to-biomethane
in different ways depending on the temperature: (1) at 650 C, the
adsorbed halogens occupy active sites, reducing the catalytic activity and preventing fuel dissociation; (2) at higher temperatures
such as 700 C, chlorine reacts with the nickel catalyst to form
nickel chloride which is sublimed and degrades the performance
of SOFC operation (Reeping et al., 2017). HCl is considered as one
of the most detrimental compounds on SOFCs performance in
biogas by particularly limiting the electrochemical processes at
electrodes of SOFCs (Papurello & Lanzini, 2018). Experiments
based on nickel-based anode-supported SOFCs showed that the
threshold concentration limit is 40 ppm(v) for SOFC applications,
which makes the biogas generated from common waste (e.g.,
sludge) a less concern for SOFC applications as the halogen content is generally below 1 ppm (Lanzini et al., 2017).
3.2 Upgrading
To generate high-purity biomethane toward its practical
application in pipelines and for SOFCs, raw biogas needs to be
upgraded to remove the impurities and achieve a higher methane
content. The methane purity needs to be typically higher than
97% for injecting into natural gas grid and powering vehicles
(Yousef et al., 2019). Like the case of biohydrogen, the cleanup
technologies of biogas can be classified as “dry” and “wet” ones,
and are based on the principles of absorption, adsorption, cryogenic, or membrane technologies. This chapter will focus on
biogas with four most common technologies, i.e., pressurized water scrubbing (PWS), chemical absorption, membrane separation,
and pressure swing adsorption (PSW). The basic performances of
the technologies are compared in Table 5.2.
3.2.1 Pressurized water scrubbing
PWS separates CH4 from CO2 and some other contaminants
such as H2S based on their solubility differences in water.
The solubility of NH3, H2S, CO2, and CH4 in water at 25 C and
0.1 MPa partial pressure is 280,000, 1020, 340, and 13.2 mmol/
kg/MPa, respectively (Abdeen et al., 2016). The solubility of gas
upon its absorption is dependent on the solvent physical and
chemical properties, and the physical absorption process is usually operated at high pressure and low temperature to increase
the solubility. The use of water offers the benefits of low cost
and environmentally friendliness. However, the method of water
scrubbing might lead to a higher loss of methane. Based on a comparison of methane loss among a water scrubber, amine, and
membrane-based biogas upgrading plant, the water scrubbing
Chapter 5 Waste-to-biomethane
Table 5.2 The comparison of the performance of four common biogas cleanup and
upgrading technologies.
Capacity
Technology (m3/h)
Power input
(kWh/m3)
Methane
purity (%)
Methane
loss (%)
PWS
0.25
0.27
0.29
97.0
98.7
94.2
0.5
1.0
0.77
0.68
0.87
e
e
0.27
0.24
0.2e0.3
99.0
98.7
97.5
98.0
98.0
98.0
98.0
0.1
0.03
0.5
1.97
0.5
9.71
1.8e2.0
Chemical
absorption
Membrane
separation
PSA
120
500
5
1800
500
300
1000
e
500
e
technology had a methane loss up to 1.97%, much higher than the
membrane technology (0.56%) and the amine-based upgrading
technology (0.04%) (Kvist & Aryal, 2019).
High-pressure water scrubbing (HPWS) is featured by its simple operation (Wang et al., 2020). To improve the CO2 solubility in
water, a large amount of water needs to be circulated for HPWS,
leading to a large system size. Fig. 5.2 shows the scrubber-flashstripper high pressure water scrubbing (SFS-HPWS) technology.
The CO2 in biogas is absorbed in a packed column high pressure
scrubber at an operating pressure condition between 0.8 and
1.2 MPa that serves to increase the solubility of CO2 in water
and to achieve high-purity biomethane. The scrubbing solvent
is subsequently used in a flash tank at reduced pressure of about
0.11e0.2 MPa to gather the release gas (being rich in CH4 and
CO2) that is mixed with the input gas and reinjected into the
scrubber. The remaining solvent is used in a low pressure packed
column stripper with air as the striping agent to desorb CO2 and
regenerate scrubbing water which is pumped back into the
scrubber. The sizes of the absorber and flash vessels are related
to the properties of solvents and operating conditions (i.e., temperature and pressure), while the size of the desorber is related
to both the method of desorption and the properties of the
solvents (Wang et al., 2020). Ionic liquids (ILs) with anions and
cations (e.g., aqueous N-butyl-N-methylmorpholinium acetate)
Reference
Rotunno et al. (2017)
Barbera et al. (2019)
Kapoor, Subbarao, and
Vijay (2019)
Bauer et al. (2013)
Barbera et al. (2019)
Haider et al. (2016)
He et al. (2018)
Bozorg et al. (2020)
Barbera et al. (2019)
Singhal et al. (2017)
89
90
Chapter 5 Waste-to-biomethane
Figure 5.2 A schematic diagram of the SFS-HPWS technology (Wylock & Budzianowski, 2017).
have been tested for their negligible volatility, good thermal stability, tunability, reduced equipment size, and lower energy usage
(Ma et al., 2019). Energy can be saved by replacing the desorber
with the flash vessel for IL-based absorbents.
3.2.2 Chemical absorption
Chemical absorption is performed by covalently bonding a gas
into the molecules of an absorbing liquid and has the potential of
removing CO2 and H2S simultaneously. It is generally more efficient in absorbing CO2 even at normal pressure and ambient temperature due to (i) the strong covalent bonds between the
chemical solvent molecules and the CO2 molecules (Abdeen
et al., 2016) and (ii) the reaction of the absorbed chemicals with
the active components in the liquid phase. The chemical absorption method can achieve a methane purity of 99 vol.% (Nguyen
et al., 2020). As shown in Fig. 5.3, a chemical absorption process
is normally carried out in a packed column attached to a stripping
column corresponding to a reboiler-equipped desorption unit
(Kapoor, Ghosh, et al., 2019). The biogas is injected in the packed
bed absorber operating at 1e2 bar (0.1-0.2 MPa) from the bottom
Chapter 5 Waste-to-biomethane
Figure 5.3 Biogas upgrading by chemical absorption (amine scrubbing) (Kapoor, Ghosh, et al., 2019).
and the chemical solvent is supplied countercurrently. The chemical absorption column can be represented using an ideal plug
flow reactor where the mixing is considered in the radial direction
and not in the axial direction (Abdeen et al., 2016).
It is critical to choose an appropriate solvent for efficient
chemical absorption, which is generally based on the solubility
difference between methane and impurity gas components in
the solvent. Major chemical absorption solvents for biogas
include amines and caustic/alkaline solvents. Using the chemical absorption of CO2 as an example, amine-based solution can
be used to absorb CO2 by forming covalent bonds between
amines and CO2. Some commonly used amines include MEA,
TEA, methyldiethanolamine (MDEA), diglycolamine (DGA),
DEA, and piperazine (PZ) and they are featured by high selectivity against CO2 (Abdeen et al., 2016). The chemical reaction
between CO2 and amine enhances the mass transfer of CO2
from the gas to the liquid phase. This serves to maintain the concentration gradient of CO2 in the two phases, and a molar flow
ratio between amine and CO2 of at least 4 was recommended
for amine scrubbing (Abdeen et al., 2016). These solvents do
not react with but only dissolve methane (0.1%e0.2%) during
the absorption process. This mitigates the loss of methane and
saves the need of lean gas postcombustion while achieving
91
92
Chapter 5 Waste-to-biomethane
higher CO2 separation as compared to the water-based scrubbing technology (Sun et al., 2015).
Major disadvantages of amine-based chemical absorption
include amine degradation, equipment corrosion, and potential
generation and emission of pollutants (e.g., nitrosamines and
nitramines) (Nguyen et al., 2020). The degradation of amines
can be oxidative or thermal (with the former being dominant
in pilot and industrial plants) (Fytianos et al., 2016). It happens
upon the irreversible reactions between amines and CO2, O2,
or other substances (e.g., solid particles, SO2, and NOx), which
leads to the loss of amine solvent and solvent absorption capacity,
foaming, and other problems such as increased corrosion and solvent disposal costs (Abdeen et al., 2016). Some of the oxidative
degradation compounds include ammonia, aldehydes, and carboxylic acids, while major thermal degradation compounds include
1-(2-hydroxyethyl)-2-imidazolidone (HEIA), N-(2-hidroxyethyl)ethylenediamine (HEEDA), and 2-oxazolidone (OZD) with HEIA
being the dominant one. It is beneficial to limit amine degradation by removing biogas impurities prior to amine-based absorption. It is also possible to mitigate amine degradation and its
adverse effects by selecting relatively a degradation-resistant solvent (e.g., piperazine and MDEA), lowering CO2 loading and temperature, and increasing the amine concentration.
Some amines (e.g., MEA) and their by-products after degradation are corrosive or tend to increase corrosion, which can be
further enhanced by such conditions as high temperature, high
CO2 loading and partial pressure and amine concentration, and
rough surface conditions (Abdeen et al., 2016). For example,
heat-stable salts can be formed from the anions of the oxidative
degradation product carboxylic acids and MEA and is a corrosive
agent with formate and oxalate being the most damaging.
The saturated scrubbing solution is generally regenerated at
100e120 C to break down the binding between CO2 and solvent
molecules followed by cooling down to 40 C for reuse. This is an
energy intensive process and can consume 0.4 to 0.8 kWh/Nm3 of
biogas, or about 15%e30% of the energy harvested from AD
(Nguyen et al., 2020). To achieve optimal energy management
for the biogas upgrading process, it is important to select the right
amine solution (a high absorption capacity lowering the demand
for regeneration) and optimize the design and conditions of system heat exchange and operation (e.g., gas flow rate, temperature,
and stripper type and design).
Caustic solvents (potassium hydroxide (KOH), sodium hydroxide
(NaOH), and calcium hydroxide (CaOH)) have been applied to
chemically absorb CO2, and are relatively cheap and available as
Chapter 5 Waste-to-biomethane
compared to amines. NaOH has a greater CO2 capture capacity as
compared to MEA (Abdeen et al., 2016). For example, theoretically,
0.9 and 1.39 tonnes of NaOH and MEA are needed to capture 1
tonne of CO2 (Yoo et al., 2013). KOH is relatively expensive but
K2CO3 as the product of the chemical reaction between KOH and
CO2 can be used in some industrial applications, which might
help to offset the higher cost of KOH. The use of CaOH to absorb
CO2 and form CaCO3 is called mineral carbonation which is slow under the condition of ambient temperature and pressure (Abdeen
et al., 2016). Increasing temperature and pressure and adjusting
the liquidesolid ratio can be used to enhance the reaction rate of
mineral carbonation.
As compared to amine-based solvents, the major drawbacks of
alkali solvents include slow absorption rates and difficulty in solvent regeneration. The absorption process generates aqueous
alkali salts (e.g., Na2CO3 and K2CO3 salts) which are thermally
stable. Conventionally, NaOH or KOH can be regenerated based
on a process called causticization based on the reaction between
Na2CO3 or K2CO3 and lime (Ca(OH)2) and the decomposition of
CaCO3 into CaO and CO2. However, the decomposition reaction
is an endothermic reaction with a high energy requirement
(178 kJ ∙ (mol/CO2)) (Abdeen et al., 2016). This method also suffers from other problems like a limited efficiency and the production of a low alkalinity solvent. Moreover, the direct use of lime for
the causticization of alkaline solutions could involve the emission
of significant CO2 upon the production of lime. Calciumcontaining waste, in this case, serves as a better option in terms
of a lower carbon footprint. An alternative technology was developed and could reduce the high-grade heat requirement by 50%
and the maximum temperature by at least 50 C as compared
to the conventional causticization process: anhydrous Na2CO3
was separated from the concentrated NaOH solution using a
two-step precipitation and crystallization process followed by
the causticization of the anhydrous sodium carbonate using
sodium trititanate (Mahmoudkhani & Keith, 2009).
3.2.3 Membrane separation
The technical principles of membrane separation for biogas
upgrading are similar to the ones for syngas upgrading; that is, it
is based on the permeation of molecules through a semipermeable
surface under high pressure to separate other gas molecules from
methane. Similarly, there are several different types of membranes
that can be used for biomethane separation, including inorganic,
polymeric, and mixed matrix membranes. The permeation driving
force can be developed by (i) compression in the feed side,
93
94
Chapter 5 Waste-to-biomethane
(ii) vacuum in the permeate side, or (iii) the application of a sweep
gas in the permeate side (Baena-Moreno et al., 2020). For (i), the
feed gas is pressurized while the permeate side operates at a lower,
ambient pressure, leading to the production of a pressurized retentate that facilitates high-pressure downstream applications such as
feeding into the natural gas grid. The vacuum-based method applies to relatively small volume of biogas and generally requires a
compression stage downstream for practical implementation.
The sweep gas-based method leads to the dilution of the permeate
flow and incurs an extra cost due to the use of the sweep gas.
Both single-stage and multistage configurations have been
developed for membrane separationebased biogas upgrading.
The single-stage configuration featured by its simplicity and low
cost involves the use of a single membrane and has the drawback
of a high methane loss. To improve the methane recovery, the
permeate can be partially recirculated. The multistage configuration interconnecting two or more membrane modules in series
generally achieve a higher methane purity and a lower methane
loss (Fig. 5.4) (Baena-Moreno et al., 2020). The most basic multistage configuration (Fig. 5.4(a)) utilizes the recirculation of the
permeate of the second module to reduce methane losses. Another
multistage configuration (Fig. 5.4(b)) uses two compression stages
to increase the methane purity and reduce the methane loss,
Figure 5.4 Multistage configuration: (a) Second membrane module and permeate recirculation, (b) Second
membrane module, a retentate recirculation and two compressors, (c) Without recirculation of the second
membrane module retentate, (d) With sweep gas use and a second membrane module with permeate
recirculation (Baena-Moreno et al., 2020).
Chapter 5 Waste-to-biomethane
incurring high energy consumption. The third multistage configuration (Fig. 5.4(c)) does not involve the permeate recirculation
and has a reduced operational cost. In the fourth configuration
(Fig. 5.4(d)), a sweep gas is used in the second stage to improve
its efficiency which incurs additional capital and operating expenses
due to the use of the sweep gas. The power consumption upon the
use of gas compressors/vacuum pumps and the compressor and
membrane capital costs account for the major cost components
of the membrane separation technologies (Bozorg et al., 2020). It
becomes important to select the right membrane, configuration,
and operating conditions to lower the costs for higher economic
profitability.
3.2.4 Pressure swing adsorption
PSA separates CH4 from N2, O2, and CO2 based on molecular
size exclusion and selective adsorption of the unwanted gas components on the adsorbent surface under high pressure. This is associated with the differences of molecule sizes between CH4 and other
gas components (3.8 Å for CH4 compared to 3.4 Å for CO2, 3.64 Å for
nitrogen, and 2.65 Å for water) (Vilardi et al., 2020). The technical
principle of a PSA cycle is similar to the one applied for syngas
upgrading and is based on a four-stage mechanism, i.e., adsorption,
blow-down desorption, purge, and repressurization. PSA can
achieve a methane concentration of 96%e98%, while the methane
loss can be up to 4% in the off-gas stream that can be burned using a flameless oxidation burner (Abd et al., 2021). Major influential factors of PSA-based separation include adsorbent pore size,
surface morphology, operating temperature and pressure, etc.
The advantages of the PSA technology include system compactness, low energy requirement (energy consumption ranging from
0.15 to 0.3 kWh/Nm3), simplicity, no wastewater generation (a dry
process), and safety (Abd et al., 2021). The operating pressure and
temperature of the adsorption process are typically between
4e10 bars and 50e60 C, respectively, while the regeneration process is normally under 0.1e0.2 bars (0.01e0.02 MPa) taking place
in around 2e3 min (Abd et al., 2021). The adsorption capacity of
PSA is related to the biogas composition, the material of adsorbent,
the process cycle design (e.g., the more the number of columns, the
higher purity and recovery achieved), and operating conditions
(e.g., adsorption pressure). To reduce the adverse impact of sulfur
contaminants (e.g., H2S) on PSA, a pretreatment process based on
such technologies as adsorption, absorption, and membrane is
normally included for removing the contaminant. The processing
capacity of PSA biogas upgrading systems typically range from 200
to 2000 Nm3/h.
95
96
Chapter 5 Waste-to-biomethane
3.2.5 Other upgrading methods
The approaches described above are the four most used
biogas upgrading techniques. Cryogenic separation utilizes the
differences of the boiling points (e.g., methane is 111.5 K for
methane vs. 194.8 K for CO2) of the different gas components
and thus the phenomena of gas liquefaction under different temperature and pressure to separate gases. During the process,
biogas is cooled down and compressed to a condition of specific
temperature and pressure for liquefying CO2, and the equipment
of the process including compressor, heat exchange, cooler, etc.,
can consume 5%e10% of the energy from methane production
(Abd et al., 2021). Cryogenic separation can achieve a high level
of methane purity and a low methane loss (<1%), and can produce high-purity liquid CO2 (up to 98%) with the additional benefits of ease of storage and use. However, the technology still faces
up with a variety of challenges against its practical application,
including significant energy consumption for refrigeration and
the formation of dry ice that blocks pipes risking the stability of
system operation (Yousef et al., 2018).
References
Abdeen, F. R. H., Mel, M., Jami, M. S., Ihsan, S. I., & Ismail, A. F. (2016). A review
of chemical absorption of carbon dioxide for biogas upgrading. Chinese
Journal of Chemical Engineering, 24(6), 693e702.
Abd, A. A., Othman, M. R., Naji, S. Z., & Hashim, A. S. (2021). Methane
enrichment in biogas mixture using pressure swing adsorption: Process
fundamental and design parameters. Materials Today Sustainability, 100063.
Ali, S., Hua, B., Huang, J. J., Droste, R. L., Zhou, Q., Zhao, W., & Chen, L. (2019).
Effect of different initial low pH conditions on biogas production,
composition, and shift in the aceticlastic methanogenic population.
Bioresource Technology, 289, 121579.
Baena-Moreno, F. M., le Sache, E., Pastor-Perez, L., & Reina, T. R. (2020).
Membrane-based technologies for biogas upgrading: A review.
Environmental Chemistry Letters, 18(5), 1649e1658.
Barbera, E., Menegon, S., Banzato, D., D’Alpaos, C., & Bertucco, A. (2019). From
biogas to biomethane: A process simulation-based techno-economic
comparison of different upgrading technologies in the Italian context.
Renewable Energy, 135, 663e673.
Bauer, F., Hulteberg, C., Persson, T., & Tamm, D. (2013). Biogas upgrading-Review
of commercial technologies.
Bozorg, M., Ramírez-Santos, Á. A., Addis, B., Piccialli, V., Castel, C., & Favre, E.
(2020). Optimal process design of biogas upgrading membrane systems:
Polymeric vs high performance inorganic membrane materials. Chemical
Engineering Science, 225, 115769.
n, M. A., Sa
nchez-Polo, M., Martín, M. J., &
Cabrera-Codony, A., Montes-Mora
Gonzalez-Olmos, R. (2014). Biogas upgrading: Optimal activated carbon
properties for siloxane removal. Environmental Science & Technology, 48(12),
7187e7195.
Chapter 5 Waste-to-biomethane
Chaiprapat, S., Mardthing, R., Kantachote, D., & Karnchanawong, S. (2011).
Removal of hydrogen sulfide by complete aerobic oxidation in acidic
biofiltration. Process Biochemistry, 46(1), 344e352.
Choong, Y. Y., Chou, K. W., & Norli, I. (2018). Strategies for improving biogas
production of palm oil mill effluent (POME) anaerobic digestion: A critical
review. Renewable and Sustainable Energy Reviews, 82, 2993e3006.
Dai, X., Hua, Y., Dai, L., & Cai, C. (2019). Particle size reduction of rice straw
enhances methane production under anaerobic digestion. Bioresource
Technology, 293, 122043.
Dareioti, M. A., & Kornaros, M. (2014). Effect of hydraulic retention time (HRT)
on the anaerobic co-digestion of agro-industrial wastes in a two-stage CSTR
system. Bioresource Technology, 167, 407e415.
Escudero, M. J., & Serrano, J. L. (2019). Individual impact of several impurities
on the performance of direct internal reforming biogas solid oxide fuel cell
using W-Ni-CeO2 as anode. International Journal of Hydrogen Energy,
44(36), 20616e20631.
Fortuny, M., Gamisans, X., Deshusses, M. A., Lafuente, J., Casas, C., & Gabriel, D.
(2011). Operational aspects of the desulfurization process of energy gases
mimics in biotrickling filters. Water Research, 45(17), 5665e5674.
Fountoulakis, M. S., Petousi, I., & Manios, T. (2010). Co-digestion of sewage
sludge with glycerol to boost biogas production. Waste Management, 30(10),
1849e1853.
Fytianos, G., Ucar, S., Grimstvedt, A., Hyldbakk, A., Svendsen, H. F., &
Knuutila, H. K. (2016). Corrosion and degradation in MEA based postcombustion CO2 capture. International Journal of Greenhouse Gas Control,
46, 48e56.
Haga, K., Adachi, S., Shiratori, Y., Itoh, K., & Sasaki, K. (2008). Poisoning of
SOFC anodes by various fuel impurities. Solid State Ionics, 179(27e32),
1427e1431.
Haider, S., Lindbråthen, A., & Hägg, M.-B. (2016). Techno-economical evaluation
of membrane based biogas upgrading system: A comparison between
polymeric membrane and carbon membrane technology. Green Energy &
Environment, 1(3), 222e234.
He, X., Chu, Y., Lindbråthen, A., Hillestad, M., & Hägg, M.-B. (2018). Carbon
molecular sieve membranes for biogas upgrading: Techno-economic
feasibility analysis. Journal of Cleaner Production, 194, 584e593.
Izumi, K., Okishio, Y., Nagao, N., Niwa, C., Yamamoto, S., & Toda, T. (2010).
Effects of particle size on anaerobic digestion of food waste. International
Biodeterioration & Biodegradation, 64(7), 601e608.
Jin, Y., Veiga, M. C., & Kennes, C. (2005). Effects of pH, CO2, and flow pattern on
the autotrophic degradation of hydrogen sulfide in a biotrickling filter.
Biotechnology and Bioengineering, 92(4), 462e471.
Kapoor, R., Ghosh, P., Kumar, M., & Vijay, V. K. (2019). Evaluation of biogas
upgrading technologies and future perspectives: A review. Environmental
Science and Pollution Research, 26(12), 11631e11661.
Kapoor, R., Subbarao, P. M. V., & Vijay, V. K. (2019). Integration of flash vessel in
water scrubbing biogas upgrading system for maximum methane recovery.
Bioresource Technology Reports, 7, 100251.
Komemoto, K., Lim, Y. G., Nagao, N., Onoue, Y., Niwa, C., & Toda, T. (2009).
Effect of temperature on VFA’s and biogas production in anaerobic
solubilization of food waste. Waste Management, 29(12), 2950e2955.
Kvist, T., & Aryal, N. (2019). Methane loss from commercially operating biogas
upgrading plants. Waste Management, 87, 295e300.
97
98
Chapter 5 Waste-to-biomethane
Lanzini, A., Madi, H., Chiodo, V., Papurello, D., Maisano, S., & Santarelli, M.
(2017). Dealing with fuel contaminants in biogas-fed solid oxide fuel cell
(SOFC) and molten carbonate fuel cell (MCFC) plants: Degradation of
catalytic and electro-catalytic active surfaces and related gas purification
methods. Progress in Energy and Combustion Science, 61, 150e188.
Maharaj, I., & Elefsiniotis, P. (2001). The role of HRT and low temperature on the
acid-phase anaerobic digestion of municipal and industrial wastewaters.
Bioresource Technology, 76(3), 191e197.
Mahmoudkhani, M., & Keith, D. W. (2009). Low-energy sodium hydroxide
recovery for CO2 capture from atmospheric airdthermodynamic analysis.
International Journal of Greenhouse Gas Control, 3(4), 376e384.
Mao, C., Feng, Y., Wang, X., & Ren, G. (2015). Review on research achievements
of biogas from anaerobic digestion. Renewable and Sustainable Energy
Reviews, 45, 540e555. https://doi.org/10.1016/j.rser.2015.02.032
Ma, C., Shukla, S. K., Samikannu, R., Mikkola, J.-P., & Ji, X. (2019). CO2
separation by a series of aqueous morpholinium-based ionic liquids with
acetate anions. ACS Sustainable Chemistry & Engineering, 8(1), 415e426.
Matsui, T., & Imamura, S. (2010). Removal of siloxane from digestion gas of
sewage sludge. Bioresource Technology, 101(1), S29eS32.
Mirmohamadsadeghi, S., Karimi, K., Tabatabaei, M., & Aghbashlo, M. (2019).
Biogas production from food wastes: A review on recent developments and
future perspectives. Bioresource Technology Reports, 7, 100202.
Nguyen, L. N., Kumar, J., Vu, M. T., Mohammed, J. A. H., Pathak, N.,
Commault, A. S., Sutherland, D., Zdarta, J., Tyagi, V. K., & Nghiem, L. D.
(2020). Biomethane production from anaerobic co-digestion at wastewater
treatment plants: A critical review on development and innovations in biogas
upgrading techniques. The Science of the Total Environment, 142753.
Papurello, D., & Lanzini, A. (2018). SOFC single cells fed by biogas: Experimental
tests with trace contaminants. Waste Management, 72, 306e312.
Reeping, K. W., Bohn, J. A., & Walker, R. A. (2017). Chlorine-induced degradation
in SOFCs operating with biogas. Sustainable Energy & Fuels, 1(6), 1320e1328.
Rotunno, P., Lanzini, A., & Leone, P. (2017). Energy and economic analysis of a
water scrubbing based biogas upgrading process for biomethane injection
into the gas grid or use as transportation fuel. Renewable Energy, 102,
417e432.
Santos-Clotas, E., Cabrera-Codony, A., Boada, E., Gich, F., Muñoz, R., &
Martín, M. J. (2019). Efficient removal of siloxanes and volatile organic
compounds from sewage biogas by an anoxic biotrickling filter
supplemented with activated carbon. Bioresource Technology, 294, 122136.
Seredych, M., & Bandosz, T. J. (2006). Desulfurization of digester gas on catalytic
carbonaceous adsorbents: Complexity of interactions between the surface
and components of the gaseous mixture. Industrial & Engineering Chemistry
Research, 45(10), 3658e3665.
Singhal, S., Agarwal, S., Arora, S., Sharma, P., & Singhal, N. (2017). Upgrading
techniques for transformation of biogas to bio-CNG: A review. International
Journal of Energy Research, 41(12), 1657e1669.
Sun, Q., Li, H., Yan, J., Liu, L., Yu, Z., & Yu, X. (2015). Selection of appropriate
biogas upgrading technology-a review of biogas cleaning, upgrading and
utilisation. Renewable and Sustainable Energy Reviews, 51, 521e532.
Tian, G., Yang, B., Dong, M., Zhu, R., Yin, F., Zhao, X., Wang, Y., Xiao, W.,
Wang, Q., & Zhang, W. (2018). The effect of temperature on the microbial
communities of peak biogas production in batch biogas reactors. Renewable
Energy, 123, 15e25.
Chapter 5 Waste-to-biomethane
Truong, L.-A., & Abatzoglou, N. (2005). A H2S reactive adsorption process for the
purification of biogas prior to its use as a bioenergy vector. Biomass and
Bioenergy, 29(2), 142e151.
Vikromvarasiri, N., Champreda, V., Boonyawanich, S., & Pisutpaisal, N. (2017).
Hydrogen sulfide removal from biogas by biotrickling filter inoculated with
Halothiobacillus neapolitanus. International Journal of Hydrogen Energy,
42(29), 18425e18433.
Vilardi, G., Bassano, C., Deiana, P., & Verdone, N. (2020). Exergy and energy
analysis of biogas upgrading by pressure swing adsorption: Dynamic analysis
of the process. Energy Conversion and Management, 226, 113482.
Wang, H., Ma, C., Yang, Z., Lu, X., & Ji, X. (2020). Improving high-pressure water
scrubbing through process integration and solvent selection for biogas
upgrading. Applied Energy, 276, 115462.
Wu, J., Jiang, X., Jin, Z., Yang, S., & Zhang, J. (2020). The performance and
microbial community in a slightly alkaline biotrickling filter for the removal
of high concentration H2S from biogas. Chemosphere, 249, 126127.
Wylock, C. E., & Budzianowski, W. M. (2017). Performance evaluation of biogas
upgrading by pressurized water scrubbing via modelling and simulation.
Chemical Engineering Science, 170, 639e652.
Xu, Z., Zhao, M., Miao, H., Huang, Z., Gao, S., & Ruan, W. (2014). In situ volatile
fatty acids influence biogas generation from kitchen wastes by anaerobic
digestion. Bioresource Technology, 163, 186e192.
€ n, O., & Demirel, B. (2013). Ammonia inhibition in anaerobic digestion:
Yenigu
A review. Process Biochemistry, 48(5e6), 901e911.
Yong, Z., Dong, Y., Zhang, X., & Tan, T. (2015). Anaerobic co-digestion of food
waste and straw for biogas production. Renewable Energy, 78, 527e530.
Yoo, M., Han, S.-J., & Wee, J.-H. (2013). Carbon dioxide capture capacity of
sodium hydroxide aqueous solution. Journal of Environmental Management,
114, 512e519.
Yousef, A. M., El-Maghlany, W. M., Eldrainy, Y. A., & Attia, A. (2018). New
approach for biogas purification using cryogenic separation and distillation
process for CO2 capture. Energy, 156, 328e351.
Yousef, A. M., El-Maghlany, W. M., Eldrainy, Y. A., & Attia, A. (2019). Upgrading
biogas to biomethane and liquid CO2: A novel cryogenic process. Fuel, 251,
611e628.
Zhang, Y., & Banks, C. J. (2013). Impact of different particle size distributions on
anaerobic digestion of the organic fraction of municipal solid waste. Waste
Management, 33(2), 297e307.
Zhao, W., Huang, J. J., Hua, B., Huang, Z., Droste, R. L., Chen, L., Wang, B.,
Yang, C., & Yang, S. (2020). A new strategy to recover from volatile fatty acid
inhibition in anaerobic digestion by photosynthetic bacteria. Bioresource
Technology, 311, 123501.
Further reading
De Arespacochaga, N., Valderrama, C., Mesa, C., Bouchy, L., & Cortina, J. L.
(2014). Biogas deep clean-up based on adsorption technologies for Solid
Oxide Fuel Cell applications. Chemical Engineering Journal, 255, 593e603.
Gandiglio, M., Lanzini, A., Santarelli, M., & Leone, P. (2014). Design and balanceof-plant of a demonstration plant with a solid oxide fuel cell fed by biogas
from waste-water and exhaust carbon recycling for algae growth. Journal of
Fuel Cell Science and Technology, 11(3).
99
100
Chapter 5 Waste-to-biomethane
Papadias, D., & Ahmed, S. (2012). Biogas impurities and cleanup for fuel cells. In
Proceedings of the presentation about biogas technologies and integration
with fuel cells. The NREL/DOE biogas and fuel cells workshop, golden, CO,
USA (pp. 11e13).
Rasi, S. (2009). Biogas composition and upgrading to biomethane (Issue 202).
University of Jyväskylä.
Waste-to-bioethanol
6
Abstract
This chapter introduces the definitions of first-generation and secondgeneration bioethanol with the latter being the focus. It gives an overview of the technical principles of the bioethanol production based on
saccharification and fermentation. It explains the different types of
configuration designs including Separate Hydrolysis and Fermentation
(SHF), Simultaneous Saccharification and Fermentation (SSF), Presaccharification and Simultaneous Saccharification and Fermentation
(PSSF), and Simultaneous Saccharification and Co-fermentation (SSCF)
and their respective advantages and disadvantages. The influences of
typical process factors (e.g., temperature, sugar concentration, pH,
fermentation time, agitation speed) toward bioethanol yields are
reviewed and existing bioethanol yield data are summarized. This
chapter also highlights the importance of pretreatment and yeast selection toward bioethanol production and development.
Keywords: Bioethanol yields; Distillation; Pretreatment; Saccharification
and fermentation; Waste-to-bioethanol; Yeasts.
1. Introduction
Ethanol has been widely used to partially replace fossil fuels
in the transportation sector for its potential to increase domestic
energy security, reduce GHG and air pollutant emissions, and
promote the development of remote, rural industries, and
communities (Stephen et al., 2012). For example, it is used as a gasoline blend stock in the United States since the 1980s, and E10
petrol containing 10 vol.% of renewable ethanol is supported by
annual production of 14 billion gallons of corn starch-based
ethanol (Hoekman & Broch, 2018). The global ethanol production
increased from 98.3 billion liters in 2016 to 98.6 billion liters in 2017
with record levels in the United States and sharp increases in India
and China; 72% of biofuel production was accounted for by ethanol
followed by biodiesel (23%) and hydrotreated vegetable oil (4%)
(Sawin et al., 2017).
First-generation bioethanol that is derived from sugarcanes or
starch (corn or sorghum) dominates the whole ethanol production, with 85% contributed by the United States and Brazil
Waste-to-Resource System Design for Low-Carbon Circular Economy. https://doi.org/10.1016/B978-0-12-822681-0.00012-8
Copyright © 2022 Elsevier Inc. All rights reserved.
101
102
Chapter 6 Waste-to-bioethanol
Figure 6.1 Schematics diagrams of (a) first-generation and (b) second-generation bioethanol production
(Lennartsson et al., 2014).
(Bertrand et al., 2016). The procedure of first-generation bioethanol production is relatively mature and could be divided
into seven steps (Fig. 6.1(a)): (i) feedstock pretreatment consisting of milling and liquefaction, (ii) hydrolysis or saccharification
where sugar monomers are released, (iii) fermentation with
yeasts to produce ethanol (w10% (w/v)) and carbon dioxide,
(iv) ethanol purification (concentrations >99.7%) by distillation
and dehydration, (v) centrifugation of the stillage consisting of
residual substrate, yeasts, and fermentation by-products to
form thin stillage and centrifugation solids, (vi) thin stillage
evaporation and resupplied to (i), and (vii) production of Distillers Dried Grains and Solubles as an animal feed. Though
first-generation bioethanol is expected to keep playing a major
Chapter 6 Waste-to-bioethanol
role in overall bioethanol production, much attention has been
paid to its potential environmental impacts on land use, water
resource, and particularly feed and food production due to the
use of food-based feedstock (leading to the so-called “food
versus fuel” debate). Indeed, the feedstock production stage
including agricultural production is a major contributor to the
adverse environmental impact of first-generation bioethanol.
Second-generation ethanol utilizes lignocellulosic feedstocks
that are not suitable for human consumption such as inedible energy crops and oils, agricultural and municipal wastes, algae, etc.
These feedstocks are featured by their high abundance and availability, e.g., lignocellulose is the most abundant polymer, and by
the benefit of not directly causing the “food versus fuel” competition. Moreover, extensive LCA studies showed that secondgeneration bioethanol has better environmental and energy
performance as compared to first-generation bioethanol
(Stephen et al., 2012). Saccharification and fermentation processes serve as one of the main technologies for recovering
bioethanol from waste and have significant carbon abatement
potential. This chapter will focus on the processes for producing
second-generation bioethanol from lignocellulosic waste such as
wheat straw, corn stover, rice husk, banana residues (pseudostem
and rachis), biodegradable municipal waste, etc.
2. Saccharification and fermentation
Saccharification and fermentation processes typically involve
a four-step, sequential procedure (Fig. 6.1(b)): (i) pretreatment
to separate the hemicelluloses from the polymerous cellulose
chains and the interwoven lignin, (ii) enzymatic hydrolysis or
saccharification to release sugar monomers from the cellulose
and hemicellulose, (iii) fermentation of the monomers with
yeasts (e.g., Saccharomyces cerevisiae), to produce ethanol, and
(iv) distillation and dehydration-based ethanol purification and
the recovery of coproducts such as lignin, extractives, and unhydrolyzed cellulose.
Different configuration designs have been developed including
Separate Hydrolysis and Fermentation (SHF), Simultaneous
Saccharification and Fermentation (SSF), Presaccharification and
Simultaneous Saccharification and Fermentation (PSSF), and
Simultaneous Saccharification and Co-fermentation (SSCF). SHF
refers to the arrangement where the enzymatic hydrolysis step
releasing sugars is separate from the yeast fermentation processing of the sugars. SHF relies on the use of separate vessels where
different process conditions (e.g., temperature and pH) can be
set up for enzymes and yeasts to optimize the yield of the two
103
104
Chapter 6 Waste-to-bioethanol
Figure 6.2 Flowchart of the SHF process. Adapted from de Barros, E. M., Carvalho, V. M., Rodrigues, T. H. S., Rocha, M. V. P.,
& Gonçalves, L. R. B. (2017). Comparison of strategies for the simultaneous saccharification and fermentation of cashew apple
bagasse using a thermotolerant Kluyveromyces marxianus to enhance cellulosic ethanol production. Chemical Engineering
Journal, 307, 939e947. https://doi.org/https://doi.org/10.1016/j.cej.2016.09.006).
steps, respectively (Guerrero et al., 2018). Moreover, the separate
vessel arrangement allows the addition of a sterilizing process to
treat the saccharified solution to reduce the risk of contamination. However, the dual vessel usage increases the capital cost.
It was shown that the capital cost of an SHF-based sugarcane
straw-to-bioethanol plant was about 50% higher than that of
SSF- and PSSF-based ones (Mesa et al., 2017).
For the SHF process (Fig. 6.2), the degree of saccharification
that controls the ethanol production can be affected by various factors such as pretreatment methods, hydrolysis conditions
(e.g., time and temperature), cellulase dosage, and substrate concentration. For example, it was shown that, to achieve a mean
maximum degree of saccharification of 82.1% for bioethanol recovery from paper sludge using the SHF process with cellulase, the hydrolysis time, substrate concentration, and cellulase dosage
needed to be 82.7 h, 40.8 g/L, and 18.1 FPU/g substrate, respectively (Peng & Chen, 2011). With fermentation using S. cerevisiae
GIM-2, a sugar-to-ethanol conversion rate of 34.2% and an ethanol
yield of 190 g/kg of dry paper sludge were achieved.
In the SSF process (Fig. 6.3), enzymatic hydrolysis and fermentation happens simultaneously in the same reactor meaning the
associated yeasts ferment the sugars as soon as they are released
by enzyme hydrolysis. This arrangement mitigates the problem of
enzyme inhibition and increases the rate of cellulose hydrolysis
because relevant sugars that can inhibit the activity of the
Figure 6.3 Flowchart of SSF. Adapted from de Barros, E. M., Carvalho, V. M., Rodrigues, T. H. S., Rocha, M. V. P., &
Gonçalves, L. R. B. (2017). Comparison of strategies for the simultaneous saccharification and fermentation of cashew apple
bagasse using a thermotolerant Kluyveromyces marxianus to enhance cellulosic ethanol production. Chemical Engineering
Journal, 307, 939e947. https://doi.org/https://doi.org/10.1016/j.cej.2016.09.006).
Chapter 6 Waste-to-bioethanol
cellulose are quickly removed and converted into ethanol
(Cheung & Anderson, 1997). Comparative experiments showed
that SSF processing of Arundo donax biomass pretreated with
diluted acid generated 0.26 g/L/h and 25.0 g/L of ethanol which
were higher than that (0.17 g/L/h and 24 g/L) for SHF processing
of the biomass (Loaces et al., 2017). Higher ethanol concentrations were also obtained for SSF processing of South African grass
(Eragrostis curvula) with acid pretreatment than SHF: for pretreatment using acid mine drainage, the ethanol concentration
reached 14.43 g/L for SHF as compared to 14.83 g/L for SSF at a
biomass solid loading of 20 wt.%; for pretreatment using 1 wt.%
H2SO4, the ethanol concentration reached 19.20 g/L for SHF as
compared to 22.25 g/L for SSF at a biomass solid loading of
20 wt.% (Burman et al., 2019). Additional benefits of this configuration include a reduced capital cost as less equipment is needed,
lowered enzyme requirements, mitigation of the inhibition
caused by high ethanol concentration, reduction in the processing time, etc. (Cheung & Anderson, 1997).
However, it is hardly possible to have a single temperature to
optimize both enzymatic hydrolysis and fermentation considering the distinction in the optimal temperature conditions
for hydrolytic enzymes (45e50 C) and fermentation yeasts
(30e37 C) (Palacios et al., 2019). Hence, an intermediate temperature and a thermotolerant yeast are needed for better compatibility of enzyme hydrolysis and fermentation. A higher biomass
loading is also preferred for SSF to achieve higher ethanol
production.
PSSF (Fig. 6.4) is a variation of the SSF process by applying a
short-period (8e24 h), prehydrolysis stage before SSF and the
stage can be operated under optimal conditions to produce the
substrate for SSF at a relatively high hydrolytic rate. This method
can be used to mitigate SSF’s problem about enzymatic hydrolysis
constraints caused by the differences in the optimal temperature
between enzymes and yeasts. The PSSF method also serves to
reduce the viscosity of substrate slurry, making it a favorable
option for the cases of high solid concentrations (Jørgensen
et al., 2007). Hence, it is expected that PSSF combines the
Figure 6.4 Flowchart of PSSF. Adapted from de Barros, E. M., Carvalho, V. M., Rodrigues, T. H. S., Rocha, M. V. P., &
Gonçalves, L. R. B. (2017). Comparison of strategies for the simultaneous saccharification and fermentation of cashew apple
bagasse using a thermotolerant Kluyveromyces marxianus to enhance cellulosic ethanol production. Chemical Engineering
Journal, 307, 939e947. https://doi.org/https://doi.org/10.1016/j.cej.2016.09.006.
105
106
Chapter 6 Waste-to-bioethanol
strengths of SHF and SSF and higher ethanol yields can be
achieved based on the selection of an appropriate time for the
prehydrolysis stage (de Barros et al., 2017).
The SSCF configuration is another variation of SSF by
co-fermenting pentoses (mainly xylose) together with glucose using a special type of microorganism such as genetically modified
yeast strains (e.g., S. cerevisiae). To improve the performance of
the strains, it is key to enhance the microorganism’s tolerance
to environmental conditions (Laluce et al., 2012). Similar to SSF,
SSCF has such advantages as mitigated inhibition (e.g., to cellulases or b-glucosidases) by the removal of sugars generated during
enzymatic hydrolysis, reduced capital costs, and improved
ethanol yields as compared to SHF (Koppram et al., 2013). SSCF
is preferably conducted at high contents of water-insoluble solids
in a fed-batch mode to improve mixing and mass transfer and
thus the concentration of ethanol produced. This also promotes
efficient cofermentation of glucose and xylose with the possibility
of lowering the glucose concentration by, e.g., fermentation of
free hexoses before the addition of enzymes.
Extensive studies have been conducted to compare the performance of the different configurations in terms of bioethanol
productivity. For example, toward bioethanol recovery from the
cashew apple bagasse after acidicealkaline (first stage:
0.6 M H2SO4 at 121 C for 15 min and second stage: 1 M NaOH at
121 C for 30 min) pretreatment, the performance of SSF and its
variation (PSSF) is compared (de Barros et al., 2017). Under a
biomass load of 7.5% and 10%, the ethanol concentrations and
yields of SSF were similar to that of PSSF, while under a load of
15%, the ethanol concentration (58.67 g/L) and yield (92.67%) of
SSF were greater than that (50.11 g/L and 79.51%) of PSSF. Experiments based on pretreated olive tree pruning biomass showed
that SHF with S. cerevisiae achieved the largest ethanol yield
followed by PSSF with S. cerevisiae, SSCF with Escherichia coli
and SSF with S. cerevisiae (Fernandes-Klajn et al., 2018).
The yields of bioethanol production are also influenced by
various process factors such as temperature, sugar concentration, pH, fermentation time, agitation speed, etc. (Azhar et al.,
2017). Appropriate temperature (20e35 C) is essential for the
growth and viability of microorganisms: S. cerevisiae has an
optimal temperature around 30 C, whereas the optimal temperature for the yeasts of immobilized cells is slightly higher due to
its ability to transfer heat to inside the cells. Increasing the sugar
concentration up to around 150 g/L is appropriate for promoting
fermentation, but further increases might have a limited effect
Chapter 6 Waste-to-bioethanol
on bioethanol production as the available sugar may exceed the
uptake capacity of microorganisms.
pH critically affects the survival and growth of yeasts and rates
of fermentation, and an optimal range of pH exists for maximizing
ethanol production of a specific process. For example, for SHF
processing of whey and rice waste with S. cerevisiae Y904,
increasing pH from 3.5 to 4.5 increased the ethanol concentration
from 4.5 g/L to 11.5 g/L, while further increasing pH to 5.5 reduced
the ethanol concentration to 6.1 g/L (Rocha et al., 2013). For SSF
processing of pretreated rice straw, the enzyme retained 82% of
its activity at pH ¼ 5.0 which decreased gradually for pH > 7.0
and the enzyme was inactive at pH ¼ 9.0 (Akhtar et al., 2017). Under the optimal conditions where pH was equal to 4.5 at 30 C
(other conditions: substrate loading ¼ 11% (w/v); enzyme concentration ¼ 0.5% (v/v)), an ethanol yield of 0.38 g/g was achieved.
The ethanol yield can also be affected by fermentation time
(normally between 24 and 72 h) with a short time leading to
inadequate growth of microorganisms and a long time leading
to microbial inhibition due to high concentration of ethanol
(Azhar et al., 2017). An optimal fermentation time of 61.5 h was
reported for SSF of very high gravity potato mash with the
achievement of an ethanol yield of 16.61% (v/v) or 89.7% of the
theoretical yield (Srichuwong et al., 2009). An optimal fermentation time of 24 h was reported for SHF of bamboo (Li et al., 2014).
Mixing is important for saccharification by ensuring an even
distribution of enzymes in the broth and facilitating effective
heat and mass transfer, particularly for high solids saccharification. The degree of mixing can be adjusted by controlling the
agitation speed of an installed impeller and a speed of up to
200 rpm can be used. The agitation speed will also affect the
permeability of nutrients through the cells of microorganisms
and the removal of ethanol from the cell (Azhar et al., 2017).
Upon fed-batch saccharification of pretreated rice straw,
increasing the agitation speed from 30 to 80 rpm was found to increase the glucose titers from 115.1 g/L to 132.6 g/L, while a
further increase in the speed did not significantly promote the
saccharification yield (Jung et al., 2017).
Finally, the types of lignocellulosic feedstocks also affect the
ethanol yield for a given process conditions. Various types of
waste have been tested for their potential to generate bioethanol
such as pineapple leaf waste, pomegranate peels, orange
peel waste, lemon peel waste, bread residues, coffee residue,
MSW, sugarcane waste, etc. Their ethanol productions are summarized in Table 6.1.
107
108
Chapter 6 Waste-to-bioethanol
Table 6.1 Bioethanol yields for different types of lignocellulosic feedstocks.
Feedstock
Configuration
Ethanol concentration or yield
Reference
Pineapple leaf waste
Bread residues
Pomegranate peel waste
Waste paper
Citrus peel waste
Coffee residue
Kitchen waste
Barley straw
SSF
SHF
SHF
PSSF
SSF
SSF
PSSF
PSSF
7.12%(v/v)
350 g/kg bread dry matter
15.2e15.6 g/L
32 g/L (91.8%)
14.4e29.5 g/L (90.2%e93.1%)
15.3 g/L (87.2%)
43.9e45.0 g/L (88.9%e91.2%)
46.62 g/L
Chintagunta et al. (2017)
Ebrahimi et al. (2008)
Talekar et al. (2018)
Nishimura et al. (2016)
Choi et al. (2015)
Choi et al. (2012)
Wang et al. (2017)
Paschos et al. (2020)
3. Pretreatment
Feedstock pretreatment is often needed to increase the efficiency of enzymatic hydrolysis by disrupting the complex structure
of lignocellulosic biomass for higher accessibility of cellulase to
cellulose substrate. There are three types of pretreatment
methods, i.e., physical, physicochemical, and biological, respectively. The physicochemical method is based on the application
of special compounds and conditions to change the physicochemical properties of lignocellulosic material and can be categorized
into steam explosion, liquid hot water pretreatment, dilute acid
pretreatment, lime pretreatment, etc. (Agbor et al., 2011). As the
most used physicochemical method, steam explosion involves
hydrolyzing hemicellulose using high pressure saturated steam
(160e240 C and 0.7e4.8 MPa) from a few seconds to minutes followed by an explosive decompression. The hydrolysis of hemicellulose is done by the formed acetic acid or other acids and the use of
steam serves to efficiently heat cellulose to a target temperature
without significantly diluting the released sugars (Mosier et al.,
2005). After steam explosion pretreatment, hemicellulose is
removed and enzymes’ accessibility to cellulose fibrils gets
improved. The advantages of the steam explosion method include
less use of chemicals, appropriate dilution of sugars released, and
low energy consumption. However, this method faces various challenges including (i) the risk of condensation and precipitation of
soluble lignin components and reduced digestibility due to the
incomplete destruction of ligninecarbohydrate matrix, (ii) partial
destruction of hemicellulose xylan, (iii) potential formation of
fermentation inhibitors at higher temperature, and (iv) the requirement of hydrolysate washing which might remove soluble sugars
and reduce the overall saccharification yield by 20%e25% (Agbor
et al., 2011).
Chapter 6 Waste-to-bioethanol
The liquid hot water pretreatment method uses liquid water at
an elevated temperature to hydrolyze hemicellulose and remove
lignin for higher accessibility of cellulose. Depending on the relative flow of water and feedstock, the pretreatment can be conducted in a cocurrent, countercurrent, or flow-through reactor
configuration (Agbor et al., 2011). During the process, hot water
cleaves hemiacetal linkages and releases acids upon hydrolysis,
facilitating the cleavage of ether linkages in feedstocks. Due to a
reduced temperature, the problem of fermentation inhibitor formation as happened in steam explosion is mitigated. Accordingly,
the major strengths of liquid hot water pretreatment include
reduced formation of degradation products, saving the need for
a washing or neutralizing step, and the relatively low cost of the
solvent; however, this process incurs high energy consumption
for the downstream process due to the large volume of water
used.
Various acids (e.g., hydrochloric acid, nitric acid, phosphoric
acid, and sulfuric acid) have been tested and, generally, they are
mixed (or put in contact with) with biomass and heated to a
desirable temperature (140e215 C) to dissolve hemicellulose
and increase the accessibility of cellulose in biomass for
between a few seconds to a few minutes (Agbor et al., 2011). It
can effectively promote the yield of sugar from the hemicellulose
of lignocellulosic feedstock while reducing the consumption of
acid. The dilute acid pretreatment method has various advantages including relatively high reaction rates and improved hydrolysis of cellulose and hemicellulose. For example, during the
SHF processing of rice straw, dilute acid pretreated straw had a
higher sugar yield (0.72 g/g) than steam pretreated straw
(0.60 g/g) and unpretreated straw (0.46 g/g) during 48-h enzymatic hydrolysis (Abedinifar et al., 2009). However, this method
incurs a neutralization process (e.g., using calcium hydroxide)
prior to fermentation and may lead to the production of fermentation inhibitors and affect the efficiency of the subsequent
fermentation process; moreover, the corrosiveness of some acids
such as sulfuric acid suggests the need of using more corrosionresistant material for vessel construction featured by a relatively
high cost (Mosier et al., 2005).
Lime pretreatment is based on the use of calcium hydroxide
(Ca(OH)2) as well as low temperature and pressure conditions
to solubilize hemicellulose and lignin for higher enzymatic digestibility. The process of lime pretreatment involves deactylation and
partial delignification leading to the opening of “acetyl valves”
and “lignin valves” (Agbor et al., 2011). Lime pretreatment can
be carried out by mixing lime with water and spraying the mixture
109
110
Chapter 6 Waste-to-bioethanol
(slurry) onto biomass (<10 mm) followed by the storage of the
biomass in a pile for hours to up to weeks (Mosier et al., 2005).
A series of switchgrass lime pretreatment experiments suggested
an optimal pretreatment condition was with time ¼ 2 h, temperature ¼ 100 C and 120 C, loading ¼ 0.1 g Ca(OH)2/g dry biomass,
water loading ¼ 9 mL/g dry biomass (Chang et al., 1997). Under the
optimal condition, the yield of 3-d total sugar (glucose þ xylose)
was 7 times of the unpretreated case, and about 10% glucan,
26% xylan, and 29% lignin were solubilized. The advantages of
lime pretreatment include the relative low cost of lime, easy
recovery from water (as insoluble calcium carbonate by reaction
with carbon dioxide), reduced energy consumption by low
temperature (<100 C) operation; however, the process is less
effective for high lignin material such as softwood and a relatively long treatment time (hours or even days) is required
(Mosier et al., 2005).
The physical method refers to the use of physical processes
like mechanical comminution or extrusion to increase the accessibility of enzymes to carbohydrates. The mechanical comminution process can be achieved using chipping, grinding, milling, or
a combination of them (particle sizes of 10e30 mm for chipping
and of 0.2e2 mm for milling or grinding) and aims to reduce the
particle size and crystallinity of lignocellulosic feedstock for a
higher specific surface and a lower degree of polymerization
(Alvira et al., 2010). For fibrous feedstock, this may incur significant energy consumption and costs. The extrusion process modifies the physicochemical properties (defibrillation, fibrillation,
and shortening of fibers) of lignocellulosic feedstock by heating,
mixing, and shearing it in an extruder. Key control parameters
of the process include screw speed and barrel temperature.
The biological method is based on the use of fungus (e.g., brown,
white, and soft rot fungi) to break down the ligninehemicellulose
matrix and is featured by low energy requirements and mild environmental conditions for operation (Ma et al., 2010). Brown rot
fungi (e.g., Coniophora puteana and Postia placenta) can degrade
both the cellulose and hemicellulose components of feedstock,
which is initiated by the Early Stage Decay Mechanism that causes
rapid and extensive depolymerization of cellulose and hemicellulose (Ray et al., 2010). Several hypotheses have been made about
the degradation mechanism based on wood pretreatment:
(i) reactive oxygen species serves to breakdown the lignocellulose
complex with the dominant hydroxyl radical being produced via
the Fenton reaction (H2O2 þ Fe2þ þ Hþ / H2O þ Fe3þ þ $OH)
(i.e., a hydroxyl radicalebased depolymerization), and (ii) brown
rot fungi secret various organic acids (e.g., oxalic) which can
Chapter 6 Waste-to-bioethanol
reduce wood pH and depolymerize hemicellulose and cellulose by
acid catalyzed hydrolysis (i.e., localized acid pretreatment). White
(e.g., Phanerochaete chrysosporium, Irpex lacteus, Phlebia radiata,
and Rigidoporus lignosus) and soft rot (e.g., Chalara parvispora
and Trichoderma reesei) fungi attack both lignin and cellulose
with the production of enzymes such as lignin peroxidases, polyphenol oxidases, manganese-dependent peroxidases, and laccases
(Agbor et al., 2011). The most effective biological pretreatment
method is based on the use of white rot fungi. I. lacteus-pretreated
wheat straw was fermented using the yeast Pachysolen tannophilus
achieved a bioethanol yield of 163 mg/g raw wheat straw, which
was 23%e35% higher than that of a bioethanol process with steam
explosion-based pretreatment and the yeast S. cerevisiae (LópezAbelairas et al., 2013). Studies have been conducted to compare
the performance of different white rot fungi in pretreating lignocellulosic materials. It was shown that Pleurotus ostreatus and Pleurotus pulmonarius had greater modification effects on the lignin
content of Eucalyptus grandis sawdust than Ganoderma lucidum,
P. chrysosporium, and Trametes sp. (Castoldi et al., 2014). Specifically, an easily hydrolysable cellulose fraction was generated and
its content followed the sequence: P. ostreatus (16.7% of total
cellulose) > P. pulmonarius (15.4%) > Trametes sp. (10.1%)
[ P. chrysosporium (2.8%) z no treatment (2.8%), and
P. ostreatus and P. pulmonarius pretreatment was more efficient
in generating the second hydrolysable fraction.
However, the productivity of the biological method is relatively
low due to the requirement of a long cultivation period and due to
the loss in polysaccharide components during fungal growth,
which adversely effects the economics of the method. Hybrid
methods that combine the biological and other ones have also
been proposed to achieve a higher pretreatment efficiency. For
example, upon enzymatic hydrolysisebased bioethanol recovery
from water hyacinth, the sugar yield of enzymatic hydrolysis using
a hybrid pretreatment method (Echinodontium taxodii þ 0.25%
H2SO4) was 1.12e2.11 times of that using an acid pretreatment
method (Ma et al., 2010). Accordingly, the ethanol yield via the
SHF process with S. cerevisiae achieved 0.192 g/g of dry matter
for the case based on the hybrid pretreatment method, which
was about 1.34 times of that for the case based on the acid pretreatment method.
4. Yeasts
Yeasts are single-celled fungi that are capable of reproducing
by budding or fission and forming spores which are not enclosed
111
112
Chapter 6 Waste-to-bioethanol
in a fruiting body (Azhar et al., 2017). S. cerevisiae is the most
widely used yeast for bioethanol production. It gains popularity
due to various advantages including a high ethanol tolerance
(up to 15% ethanol), potential to achieve a high ethanol concentration (10%e12%), safety in use, tolerating a wide range of pH
conditions to prevent the growth of spoilage organisms, high
sugar conversion ratios; however, S. cerevisiae is sensitive to a
high temperature condition (>35 C), glucose repression, lactic
acid bacteria and various compounds released during enzymatic
hydrolysis, and it cannot ferment xylose and arabinose which account for 20% and 5% of the sugars in lignocellulosic biomass
(Vertès et al., 2007). For example, furan derivatives (e.g., furfural
and 5-hydroxymethylfurfural (HMF)) and phenolic compounds
(e.g., vanillin and 4-hydroxybenzoic acid (HB)) released during
the breakdown of sugars and lignin, respectively, were shown to
be fermentation inhibitors and can reduce enzymatic and biological activity (Endo et al., 2008). The weakness of S. cerevisiae limits
the potential of the yeast-based bioethanol process to achieve a
higher efficiency and process robustness.
Efforts have been made to explore the use of alternatives for
yeast-based bioethanol production, but optimal selection of yeast
is also contingent upon various factors such as lignocellulosic
biomass types and process conditions. Bioethanol recovery
from SSF processing of rice straw was experimentally compared
among the use of three different types of microorganisms, i.e.,
Mucor indicus, Rhizopus oryzae, and Saccharomyces cerevisiae
(Abedinifar et al., 2009). M. indicus and R. oryzae are zygomycetes
filamentous fungi and can assimilate both hexoses and pentoses.
Experiments showed that the use of M. indicus achieved ethanol,
biomass, and glycerol yields of 0.36e0.43 g/g, 0.11e0.17 g/g, and
0.04e0.06 g/g, respectively, which were comparable with that
(0.37e0.45 g/g, 0.04e0.10 g/g, and 0.05e0.07 g/g) of S. cerevisiae
and higher than that of R. oryzae (0.33e0.41 g/g, 0.06e0.12 g/g,
and 0.03e0.04 g/g). Pichia stipites is one type of pentose-utilizing
yeasts and is featured by broad substrate specificity and no
vitamin requirement for pentose utilization. Upon bioethanol recovery from Prosopis juliflora (Mesquite) pretreated using dilute
H2SO4 (3.0%, v/v), the use of P. stipites to ferment hemicellulosic
hydrolysate achieved an ethanol production and a yield of 7.13 g/
L and 0.39 g/g, which were smaller than that (18.52 g/L and 0.49 g/
g) of S. cerevisiae (Gupta et al., 2009). Five thermotolerant yeast
strains Kluyveromyces marxianus IMB 1, IMB 2, IMB 3, IMB 4,
and IMB 5 were tested for SSF processing of switchgrass at 45 C
and compared with that of S. cerevisiae D5A at 37 C (Faga et al.,
2010). It was shown that fermentation by K. marxianus strains
Chapter 6 Waste-to-bioethanol
113
ceased by up to 96 h, while S. cerevisiae continued for 7 d. At 96
and 120 h, IMB 3 achieved similar ethanol yields to S. cerevisiae
D5A and greater yields than the other K. marxianus strains. The
ethanol yields expressed as the percentage of the maximum theoretical yield ranged from 67.3% to 80.3% at 168 h for the
K. marxianus strains as compared to 92.3% for S. cerevisiae.
Finally, hybrid, genetically engineered or coculture of two yeast
strains (e.g., fusing protoplast of Saccharomyces and xylosefermenting yeasts like P. tannophilus, Candida shehatae, and
Pichia stipitis) can be applied to effectively utilize hexose and
pentose sugars (Azhar et al., 2017). Table 6.2 summarizes the bioethanol production using different yeast strains.
Table 6.2 Yeast strains used in bioethanol production (Azhar et al., 2017).
Yeast strain
Feedstock
S. cerevisiae RL-11
Spent coffee
grounds
Sorghum
stover
Giant reed
S. cerevisiae MTCC 173
S. stipitis CBS 6054
S. cerevisiae KL17
S. pombe CHFY0201
S. cerevisiae CHY1011
S. cerevisiae ZU-10
S. cerevisiae RPRT90
S. cerevisiae CHFY0321
(protoplast fusant)
Galactose
and
glucose
Cassava
starch
Cassava
starch
Corn stover
Ipomoea
carnea
Cassava
starch
Sugar
concentration Fermentation
(g/L)
condition
195.0
200.0
33.4
500.0
95.0
195.0
99.0
72.1
195.0
Ethanol
Ethanol
concentration productivity
(g/L)
(g/L/h)
30 C, 200 rpm,
48 h
30 C, 120 rpm,
96 h
30 C, 150 rpm,
96 h
30 C, 200 rpm,
28 h
11.7
0.49
68.0
0.94
8.2
0.17
96.9
3.46
32 C, 120 rpm,
66 h
32 C, 120 rpm,
66 h
30 C, 180 rpm,
72 h
30 C, 150 rpm,
28 h
32 C, 120 rpm,
65 h
72.1
1.16
89.1
1.35
41.2
0.57
29.0
1.03
89.8
1.38
114
Chapter 6 Waste-to-bioethanol
5. Further development
The saccharification and fermentation-based production of
second-generation ethanol is facing three major challenges
(Bertrand et al., 2016). First, the feedstock acquisition and
transportation, and enzymes used to hydrolyze the cellulose
of feedstocks are generally expensive, rendering the whole
development economically inviable. For example, for bioethanol production from sugarcane straw, it was shown that
the costs of sugarcane straw and enzymes contributed most
to the total production cost and accounted for 35.66% and
25.88% of the total cost of the ethanol plant, respectively
(Mesa et al., 2017). The economic status could be worsened
by the higher level of unpredictability in the process, feedstocks
(e.g., composition and availability variations), and the market.
Second, due to the recalcitrance of the second-generation feedstocks, harsh pretreatment is required and leads to the formation of inhibitory compounds against fermentation. Third, it
is technically difficult to achieve high ethanol concentrations
(4%e4.5% (w/v)) for reducing the cost of distillation and wastewater treatment, which requires high substrate loadings >15%
and poses the risk of causing mixing and inhibition problems.
The distillation is key to the economic profitability of bioethanol generation. A high ethanol concentration 4% (w/w) corresponding to a glucose yield of 8% (w/w) and a lignocellulose
loading of 20% (w/w) for enzymatic hydrolysis was suggested
considering the conversion of cellulose only (Modenbach &
Nokes, 2013). The high loading hydrolysis implicitly implies the
use of smaller equipment and/or fewer reactors in the process
as well as less water usage (lower costs in the disposal of process
wastewater), reducing the capital costs. However, due to the
reduced enzymatic hydrolysis effectiveness at a high biomass
solid loading condition, large amounts of enzymes are needed
to obtain high ethanol concentrations. This increases the operating
costs of the bioethanol production process. It is necessary to operate under optimal conditions (and reasonable enzymatic dosage)
to achieve at least 40 g/L of ethanol production for reducing the
cost of distillation (Guerrero et al., 2018). An additional method
to improve the economic viability for producing secondgeneration bioethanol is based on the diversification of products
(i.e. multigeneration), which can potentially offset the high steam
energy consumption upon low ethanol concentrations.
Chapter 6 Waste-to-bioethanol
References
Abedinifar, S., Karimi, K., Khanahmadi, M., & Taherzadeh, M. J. (2009). Ethanol
production by Mucor indicus and Rhizopus oryzae from rice straw by
separate hydrolysis and fermentation. Biomass and Bioenergy, 33(5),
828e833. https://doi.org/10.1016/j.biombioe.2009.01.003
Agbor, V. B., Cicek, N., Sparling, R., Berlin, A., & Levin, D. B. (2011). Biomass
pretreatment: Fundamentals toward application. Biotechnology Advances,
29(6), 675e685. https://doi.org/10.1016/j.biotechadv.2011.05.005
Akhtar, N., Goyal, D., & Goyal, A. (2017). Characterization of microwave-alkaliacid pre-treated rice straw for optimization of ethanol production via
simultaneous saccharification and fermentation (SSF). Energy Conversion
and Management, 141, 133e144. https://doi.org/10.1016/
j.enconman.2016.06.081
s-Pejó, E., Ballesteros, M., & Negro, M. J. (2010). Pretreatment
Alvira, P., Toma
technologies for an efficient bioethanol production process based on
enzymatic hydrolysis: A review. Bioresource Technology, 101(13), 4851e4861.
https://doi.org/10.1016/j.biortech.2009.11.093
Azhar, S. H. M., Abdulla, R., Jambo, S. A., Marbawi, H., Gansau, J. A., Mohd
Faik, A. A., & Rodrigues, K. F. (2017). Yeasts in sustainable bioethanol
production: A review. Biochemistry and Biophysics Reports, 10, 52e61.
https://doi.org/10.1016/j.bbrep.2017.03.003
de Barros, E. M., Carvalho, V. M., Rodrigues, T. H. S., Rocha, M. V. P., &
Gonçalves, L. R. B. (2017). Comparison of strategies for the simultaneous
saccharification and fermentation of cashew apple bagasse using a
thermotolerant Kluyveromyces marxianus to enhance cellulosic ethanol
production. Chemical Engineering Journal, 307, 939e947. https://doi.org/
10.1016/j.cej.2016.09.006
Bertrand, E., Vandenberghe, L. P. S., Soccol, C. R., Sigoillot, J.-C., & Faulds, C.
(2016). In C. R. Soccol, S. K. Brar, C. Faulds, & L. P. Ramos (Eds.), First
generation bioethanol BT - green fuels technology: Biofuels (pp. 175e212).
Springer International Publishing. https://doi.org/10.1007/978-3-319-30205-8_8
Burman, N. W., Sheridan, C. M., & Harding, K. G. (2019). Lignocellulosic
bioethanol production from grasses pre-treated with acid mine drainage:
Modeling and comparison of SHF and SSF. Bioresource Technology Reports,
7, 100299. https://doi.org/10.1016/j.biteb.2019.100299
Castoldi, R., Bracht, A., de Morais, G. R., Baesso, M. L., Correa, R. C. G.,
Peralta, R. A., Moreira, R. de F. P. M., Polizeli, M. de L. T. de M., de
Souza, C. G. M., & Peralta, R. M. (2014). Biological pretreatment of
Eucalyptus grandis sawdust with white-rot fungi: Study of degradation
patterns and saccharification kinetics. Chemical Engineering Journal, 258,
240e246. https://doi.org/10.1016/j.cej.2014.07.090
Chang, V. S., Burr, B., & Holtzapple, M. T. (1997). Lime pretreatment of
switchgrass BT - biotechnology for fuels and chemicals. In B. H. Davison,
C. E. Wyman, & M. Finkelstein (Eds.), Proceedings of the eighteenth
symposium on biotechnology for fuels and chemicals held May 5e9, 1996, at
Gatlinburg, Tennessee (pp. 3e19). Humana Press. https://doi.org/10.1007/
978-1-4612-2312-2_2
Cheung, S. W., & Anderson, B. C. (1997). Laboratory investigation of ethanol
production from municipal primary wastewater solids. Bioresource
Technology, 59(1), 81e96. https://doi.org/10.1016/S0960-8524(96)00109-5
Chintagunta, A. D., Ray, S., & Banerjee, R. (2017). An integrated bioprocess for
bioethanol and biomanure production from pineapple leaf waste. Journal
of Cleaner Production, 165, 1508e1516. https://doi.org/10.1016/j.jclepro.
2017.07.179
115
116
Chapter 6 Waste-to-bioethanol
Choi, I. S., Lee, Y. G., Khanal, S. K., Park, B. J., & Bae, H.-J. (2015). A low-energy,
cost-effective approach to fruit and citrus peel waste processing for
bioethanol production. Applied Energy, 140, 65e74. https://doi.org/10.1016/
j.apenergy.2014.11.070
Choi, I. S., Wi, S. G., Kim, S.-B., & Bae, H.-J. (2012). Conversion of coffee residue
waste into bioethanol with using popping pretreatment. Bioresource
Technology, 125, 132e137. https://doi.org/10.1016/j.biortech.2012.08.080
Ebrahimi, F., Khanahmadi, M., Roodpeyma, S., & Taherzadeh, M. J. (2008).
Ethanol production from bread residues. Biomass and Bioenergy, 32(4),
333e337. https://doi.org/10.1016/j.biombioe.2007.10.007
Endo, A., Nakamura, T., Ando, A., Tokuyasu, K., & Shima, J. (2008). Genomewide screening of the genes required for tolerance to vanillin, which is a
potential inhibitor of bioethanol fermentation, In Saccharomyces cerevisiae.
Biotechnology for Biofuels, 1(1), 3. https://doi.org/10.1186/1754-6834-1-3
Faga, B. A., Wilkins, M. R., & Banat, I. M. (2010). Ethanol production through
simultaneous saccharification and fermentation of switchgrass using
Saccharomyces cerevisiae D5A and thermotolerant Kluyveromyces marxianus
IMB strains. Bioresource Technology, 101(7), 2273e2279. https://doi.org/
10.1016/j.biortech.2009.11.001
Fernandes-Klajn, F., Romero-García, J. M., Díaz, M. J., & Castro, E. (2018).
Comparison of fermentation strategies for ethanol production from olive tree
pruning biomass. Industrial Crops and Products, 122, 98e106. https://
doi.org/10.1016/j.indcrop.2018.05.063
Guerrero, A. B., Ballesteros, I., & Ballesteros, M. (2018). The potential of
agricultural banana waste for bioethanol production. Fuel, 213, 176e185.
Gupta, R., Sharma, K. K., & Kuhad, R. C. (2009). Separate hydrolysis and
fermentation (SHF) of Prosopis juliflora, a woody substrate, for the
production of cellulosic ethanol by Saccharomyces cerevisiae and Pichia
stipitis-NCIM 3498. Bioresource Technology, 100(3), 1214e1220. https://
doi.org/10.1016/j.biortech.2008.08.033
Hoekman, S. K., & Broch, A. (2018). Environmental implications of higher
ethanol production and use in the U.S.: A literature review. Part II e
biodiversity, land use change, GHG emissions, and sustainability. Renewable
and Sustainable Energy Reviews, 81, 3159e3177. https://doi.org/10.1016/
j.rser.2017.05.052
Jørgensen, H., Vibe-Pedersen, J., Larsen, J., & Felby, C. (2007). Liquefaction of
lignocellulose at high-solids concentrations. Biotechnology and
Bioengineering, 96(5), 862e870.
Jung, Y. H., Park, H. M., Kim, D. H., Yang, J., & Kim, K. H. (2017). Fed-batch
enzymatic saccharification of high solids pretreated lignocellulose for
obtaining high titers and high yields of glucose. Applied Biochemistry and
Biotechnology, 182(3), 1108e1120. https://doi.org/10.1007/s12010-016-2385-0
Koppram, R., Nielsen, F., Albers, E., Lambert, A., Wännström, S., Welin, L.,
Zacchi, G., & Olsson, L. (2013). Simultaneous saccharification and cofermentation for bioethanol production using corncobs at lab, PDU and demo
scales. Biotechnology for Biofuels, 6(1), 2. https://doi.org/10.1186/1754-6834-6-2
Laluce, C., Schenberg, A. C. G., Gallardo, J. C. M., Coradello, L. F. C., &
Pombeiro-Sponchiado, S. R. (2012). Advances and developments in strategies
to improve strains of Saccharomyces cerevisiae and processes to obtain the
lignocellulosic ethanol A review. Applied Biochemistry and Biotechnology,
166(8), 1908e1926.
Chapter 6 Waste-to-bioethanol
Lennartsson, P. R., Erlandsson, P., & Taherzadeh, M. J. (2014). Integration of the
first and second generation bioethanol processes and the importance of byproducts. Bioresource Technology, 165, 3e8.
Li, Z., Fei, B., & Jiang, Z. (2014). Study of sulfite pretreatment to prepare bamboo
for enzymatic hydrolysis and ethanol fermentation. Chemistry and
Technology of Fuels and Oils, 50(3), 189e196.
Loaces, I., Schein, S., & Noya, F. (2017). Ethanol production by Escherichia coli
from Arundo donax biomass under SSF, SHF or CBP process configurations
and in situ production of a multifunctional glucanase and xylanase.
Bioresource Technology, 224, 307e313. https://doi.org/10.1016/
j.biortech.2016.10.075
López-Abelairas, M., Lu-Chau, T. A., & Lema, J. M. (2013). Fermentation of
biologically pretreated wheat straw for ethanol production: Comparison of
fermentative microorganisms and process configurations. Applied
Biochemistry and Biotechnology, 170(8), 1838e1852. https://doi.org/10.1007/
s12010-013-0318-8
Ma, F., Yang, N., Xu, C., Yu, H., Wu, J., & Zhang, X. (2010). Combination of
biological pretreatment with mild acid pretreatment for enzymatic hydrolysis
and ethanol production from water hyacinth. Bioresource Technology,
101(24), 9600e9604. https://doi.org/10.1016/j.biortech.2010.07.084
lez, E. (2017). Desirability function for
Mesa, L., Martínez, Y., Barrio, E., & Gonza
optimization of Dilute Acid pretreatment of sugarcane straw for ethanol
production and preliminary economic analysis based in three fermentation
configurations. Applied Energy, 198, 299e311. https://doi.org/10.1016/
j.apenergy.2017.03.018
Modenbach, A. A., & Nokes, S. E. (2013). Enzymatic hydrolysis of biomass at
high-solids loadingsea review. Biomass and Bioenergy, 56, 526e544.
Mosier, N., Wyman, C., Dale, B., Elander, R., Lee, Y. Y., Holtzapple, M., &
Ladisch, M. (2005). Features of promising technologies for pretreatment of
lignocellulosic biomass. Bioresource Technology, 96(6), 673e686. https://
doi.org/10.1016/j.biortech.2004.06.025
Nishimura, H., Tan, L., Sun, Z.-Y., Tang, Y.-Q., Kida, K., & Morimura, S. (2016).
Efficient production of ethanol from waste paper and the biochemical
methane potential of stillage eluted from ethanol fermentation. Waste
Management, 48, 644e651. https://doi.org/10.1016/j.wasman.2015.11.051
lez, R., Aguilar, C. N., MartínezPalacios, A. S., Ilyina, A., Ramos-Gonza
ndez, J. L., Segura-Ceniceros, E. P., Gonza
lez, M. L. C., Aguilar, M.,
Herna
Ballesteros, M., & Oliva, J. M. (2019). Ethanol production from banana peels
at high pretreated substrate loading: Comparison of two operational
strategies. Biomass Conversion and Biorefinery, 1e10.
Paschos, T., Louloudi, A., Papayannakos, N., Kekos, D., & Mamma, D. (2020).
Potential of barley straw for high titer bioethanol production applying prehydrolysis and simultaneous saccharification and fermentation at high solid
loading. Biofuels, 1e7. https://doi.org/10.1080/17597269.2020.1760688
Peng, L., & Chen, Y. (2011). Conversion of paper sludge to ethanol by separate
hydrolysis and fermentation (SHF) using Saccharomyces cerevisiae. Biomass
and Bioenergy, 35(4), 1600e1606. https://doi.org/10.1016/
j.biombioe.2011.01.059
Ray, M. J., Leak, D. J., Spanu, P. D., & Murphy, R. J. (2010). Brown rot fungal
early stage decay mechanism as a biological pretreatment for softwood
biomass in biofuel production. Biomass and Bioenergy, 34(8), 1257e1262.
https://doi.org/10.1016/j.biombioe.2010.03.015
117
118
Chapter 6 Waste-to-bioethanol
Rocha, N. R. de A. F., Barros, M. A., Fischer, J., Coutinho Filho, U., &
Cardoso, V. L. (2013). Ethanol production from agroindustrial biomass using
a crude enzyme complex produced by Aspergillus Niger. Renewable Energy,
57, 432e435. https://doi.org/10.1016/j.renene.2013.01.053
Sawin, J. L., Sverrisson, F., Seyboth, K., Adib, R., Murdock, H. E., Lins, C.,
Edwards, I., Hullin, M., Nguyen, L. H., Prillianto, S. S., Satzinger, K.,
Appavou, F., Brown, A., Chernyakhovskiy, I., Logan, J., Milligan, M.,
Zinaman, O., Epp, B., Huber, L., … Mastny, L. (2017). Renewables 2017 global
status report. http://inis.iaea.org/search/search.aspx?orig_q¼RN:48058284.
Srichuwong, S., Fujiwara, M., Wang, X., Seyama, T., Shiroma, R., Arakane, M.,
Mukojima, N., & Tokuyasu, K. (2009). Simultaneous saccharification and
fermentation (SSF) of very high gravity (VHG) potato mash for the
production of ethanol. Biomass and Bioenergy, 33(5), 890e898. https://
doi.org/10.1016/j.biombioe.2009.01.012
Stephen, J. D., Mabee, W. E., & Saddler, J. N. (2012). Will second-generation
ethanol be able to compete with first-generation ethanol? Opportunities for
cost reduction. Biofuels, Bioproducts and Biorefining, 6(2), 159e176. https://
doi.org/10.1002/bbb.331
Talekar, S., Patti, A. F., Vijayraghavan, R., & Arora, A. (2018). An integrated green
biorefinery approach towards simultaneous recovery of pectin and
polyphenols coupled with bioethanol production from waste pomegranate
peels. Bioresource Technology, 266, 322e334. https://doi.org/10.1016/
j.biortech.2018.06.072
Vertès, A. A., Inui, M., & Yukawa, H. (2007). Alternative technologies for
biotechnological fuel ethanol manufacturing. Journal of Chemical Technology
and Biotechnology, 82(8), 693e697. https://doi.org/10.1002/jctb.1743
Wang, Y.-F., Tan, L., Wang, T., Sun, Z.-Y., Tang, Y.-Q., & Kida, K. (2017).
Production of ethanol from kitchen waste by using flocculating
Saccharomyces cerevisiae KF-7. Environmental Technology, 38(3), 316e325.
https://doi.org/10.1080/09593330.2016.1192224
Waste-to-biodiesel
7
Abstract
This chapter gives an overview of the potential and development of
biodiesel as a transportation fuel. It reviews the main properties (viscosity, density, cetane number, calorific value, and combustion emissions) of biodiesel. It differentiates the definitions and features of four
types of biodiesel (first, second, third and fourth-generation). The potential impacts of biodiesel on soil and water as compared to petro-diesel
are also presented. For biodiesel production, this chapter focuses on the
technology of transesterification and the influences of several process
factors such as alcohol and waste feedstock selection, alcohol/oil molar
ratio, and temperature are explained. A special attention is made to the
use of catalysts to promote the transesterification-based biodiesel production and the advantages and disadvantages of different types of
catalysts are compared.
Keywords: Catalysts; Classification; Properties; Transesterification;
Waste; Waste-to-biodiesel.
1. Introduction
The transport sector accounts for roughly 20% of global energy
consumption with a heavy reliance on gasoline and diesel (Prasad
& Raturi, 2018). The associated emissions from the sector were
around 13.5% of global GHG emissions in 2005 which grew to
about 25% in 2016 (Dioha & Kumar, 2020). With an increasing
number of road users, the emissions would be expected to keep
growing in the coming decade when electric vehicles would
have not been dominant. It was predicted that the emissions
from the transport sector by 2050 would double that of the 2010
level (Marchal et al., 2011). The situation can be further complicated by the depletion of fossil fuel reserves.
Biodiesel derived from biological sources such as animal
fats, edible and nonedible oils, and waste cooking oils serves as
a promising alternative to fossil fuels (in addition to biohydrogen
as introduced in Chapter 4). It was predicted that the world’s biodiesel supply would reach 41.4 billion liters in 2025 that would be
Waste-to-Resource System Design for Low-Carbon Circular Economy. https://doi.org/10.1016/B978-0-12-822681-0.00010-4
Copyright © 2022 Elsevier Inc. All rights reserved.
119
120
Chapter 7 Waste-to-biodiesel
25% greater than the 2016 level (Rouhany & Montgomery, 2019).
Biodiesel derived from waste biomass is generally featured by a
lower carbon footprint, and the generation and application of biodiesel does not only help to tackle the challenge of SWM but also
contribute to the development of a low-carbon transport fuel.
Specifically, existing LCA showed that the carbon footprint of biodiesel could be 20%e80% lower than that of petro-diesel depending on the definition of system boundary (e.g., types of feedstocks
and technologies) and application backgrounds (Rouhany &
Montgomery, 2019).
Biodiesel is biodegradable, safe to handle, and offers a cleaner
combustion to conventional diesel with less emissions of particulates and carbon dioxide (Hasan & Rahman, 2017). Additionally,
the use of biodiesel will also request minimal modifications to the
existing diesel engines, making quick technology uptake possible
and representing an easy and socially acceptable option. For the
road transport in the European Union, the biodiesel consumption
accounted for 78% of the energy content of all biofuels used,
reaching 10.6 million tonnes of oil equivalent in 2011, followed
by bioethanol (21%), vegetable oil (0.5%), and biogas (0.5%); the
market share of biodiesel reached about 3.9% in 2012 (Malça
et al., 2014). Biodiesel can be blended with diesel to adjust the
quality of the fuel which is closely related to the content proportion (i.e., blending ratio) of biodiesel in a blend. The concentration
of biodiesel within a diesel blend affects the consumption of
petro-diesel. Specifically, the consumption of petro-diesel could
be reduced by 95% and 19% upon the use of pure biodiesel
(B100) and 20% concentration biodiesel (B20), corresponding to
78.45% and 15.66% of carbon saving, respectively (Sheehan
et al., 1998).
Biodiesel can be produced through various technologies
including pyrolysis, microemulsion, and transesterification,
among which transesterification serves as the most used method.
For transesterification, biodiesel is produced from fats/oils
through pretreatment and chemical reactions, usually in the
presence of an alcohol and a catalyst to produce the required
fatty acid methyl esters (FAMEs) and glycerol as a by-product.
2. Biodiesel properties
Toward commercial application, the properties of biodiesel
need to meet certain technical standards (e.g., ASTM D6751, EN
14214, and GB/T19147-2003). For example, in Europe, all commercial biodiesel must comply with the EN 14214 standards
Chapter 7 Waste-to-biodiesel
which designate various property requirements such as a density
between 0.86 and 0.90 g/cm3, a minimum flashpoint of 101 C, a
kinematic viscosity 3.5e5 mm2/s at 40 C, and a maximum sulfur
content of 10 mg/kg (Biofuelsystems.com, 2020). These properties
determine the combustion characteristics, emissions, and performance of biodiesel engine applications.
Biodiesel is generally more viscous than petro-diesel, meaning
that adding biodiesel to petro-diesel increases the viscosity of the
fuel and associated fuel pump power consumption, which
adversely affects spray and atomization upon engine application.
But normally, the viscosity of the blend would not change too
much as the proportion of biodiesel increase up to 30% (Hasan
& Rahman, 2017). The density of blends (e.g., ranging from 838
to 896 kg/m3) is higher than the original petro-diesel, suggesting
a higher energy concentration. A high density will reduce the efficiency of atomization. The high density and viscosity properties of
biodiesel cause technical problems upon their direct applications
in engines. The cetane number of biodiesel is generally between
46.9 and 49.9, which is higher than that of petro-diesel, and is
related to the long-chain hydrocarbon group composition of biodiesel (Hasan & Rahman, 2017). As a result, increasing the proportion of biodiesel in a blend will increase its cetane number,
leading to a shortened ignition delay. The calorific value of biodiesel is generally lower than that of petro-diesel and is between
43 and 47 MJ/kg, therefore the calorific value of blend is lower
than that of original petro-diesel ranging from 35.6 to 44.16 MJ/
kg. The flash point of fuels closely affects the safety of fuel
handling, transport, and storage, and the flash point of biodiesel
is roughly 50% higher than that of petro-diesel, meaning that biodiesel addition serves to enhance the safety of the fuel. The
average flash point of biodieselediesel blends was reported to
be 107.75 C (Hasan & Rahman, 2017).
The composition of biodieselediesel blends affects their combustion emissions though the emissions are also related to the types
of biodiesel and petro-diesel used. For example, the oxygen content
of biodiesel is around 10 wt.%, which along with its lower carbon to
hydrogen ratio leads to lower CO emission of combustion as
compared to petro-diesel (Murillo et al., 2007). Increasing the biodiesel content in a blend led to an increase in NOx emission, and
the NOx emission of pure biodiesel application could be 16% higher
than petro-diesel. This is mainly caused by the higher oxygen content of biodiesel and a higher content of unsaturated compounds
in biodiesel leads to lower NOx emissions (Xue et al., 2011). Additionally, the addition of biodiesel could significantly reduce the
emissions of hydrocarbon, sulfur dioxides (low sulfur in biodiesel),
121
122
Chapter 7 Waste-to-biodiesel
and PMs (Hasan & Rahman, 2017). Specifically, the PM and hydrocarbon emissions of engine application of pure biodiesel were
found to decrease by 87.7% and 89.5% as compared to petrodiesel (Xue et al., 2011). The lower PM emissions for biodiesel are
related to its higher oxygen content and cetane number, and lower
contents of aromatic and sulfur compounds. It is worth noting that
the PM emissions are also affected by the engine load and speed:
the larger the engine load or lower engine speed, the higher the
PM emissions. For biodiesel, the emission of sulfur dioxide is
generally negligible due to its low sulfur content.
3. Biodiesel classification
Depending on the sources of feedstocks, biodiesel can be classified into first, second, third, and fourth generation, respectively.
The first-generation biodiesel is produced from food and edible
feedstocks including rapeseed, soybean, oil palm, canola, etc.,
which are featured by good availability and easy conversion procedures. The first-generation biodiesel accounts for roughly 80%
of global biodiesel production (Rouhany & Montgomery, 2019). In
the European Union, nearly 80% of biodiesel is produced from
rapeseed which is favored by the climate of the European Union
and the biodiesel’s good cold flow properties and oxidation stability (Malça et al., 2014). But similar to the case of bioethanol production, the use of the edible feedstocks threatens human food
consumption and thus affects food security, sparking the “food
versus fuel” debate. Hence, the feedstocks suffer from the disadvantages of affecting food supply, high costs, and limited cultivation areas. It was reported that the cost of raw feedstock materials
accounted for 70%e80% of the total production cost in the production of biodiesel from edible oils (Gui et al., 2008). Existing
studies have also shown that the production process (the occupation and preparation of cultivation land with the use of fertilizers
and pesticides) contributed most to the environmental impact for
producing rapeseed, sunflower, and soybeans (Requena et al.,
2011). Actually, the land use is the most affected impact category
for sunflower requiring more land per kg of seed production as
compared to rapeseed and soybeans. For rapeseed-based biodiesel production, cultivation accounted for 40% of the abiotic
depletion impact in Germany and 98% of the eutrophication
impact in Spain, with the use of fertilizers and relevant soil emissions being the major contributors (Malça et al., 2014). Agricultural practice-related soil carbon changes critically affect the
global warming potential (GWP) of rapeseed-based biodiesel,
Chapter 7 Waste-to-biodiesel
while fossil methanol usage has a major impact on abiotic depletion. All of these stimulated the search for nonedible feedstocks to
achieve reduced impacts and disruption to the global food supply.
The second-generation biodiesel is produced from various
nonedible feedstocks such as crops, nonedible oils (e.g., neem
oil, jatropha oil, nagchampa oil, calophyllum inophyllum oil, rubber seed oil, etc.), and other nonedible biomass (e.g., wood and
husk). Jatropha could thrive on the land which is unsuitable for
growing edible crops and under various harsh climates such as
low precipitation, and thus has a low impact on the plantation
of edible crops. The second-generation feedstocks have the advantages of being more environmentally friendly, reduced production costs, and mitigating food inequality, as compared to
the first-generation feedstocks. However, the yields of main
nonedible plants like jatropha, jojoba, and karanja are limited,
requiring extensive plantation on the land that is potentially in
competition with the plantation of the first-generation feedstocks
(Mofijur et al., 2020; Singh et al., 2020). Hence, feedstocks that are
more accessible are further demanded.
The third-generation biodiesel is produced from microalgae
and waste oils (e.g., waste fish oil, waste animal tallow oil, and
waste cooking oil) which offer such benefits as less requirements
on farmland and food supply, and great availability, effectively
mitigating the major problems of the first- and secondgeneration biodiesel. The use of waste oil for biodiesel production
serves to tackle the challenge of SWM towards the development of
a circular economy. This is particularly applicable to countries or
regions where the land for cultivation is limited such as Japan and
Singapore. Upon the comparison between jatropha oil and waste
cooking oil for biodiesel production, the former had greater environmental impacts (climate change, human health, and
ecosystem quality) than the latter due to the contributions of
cultivation of nonedible jatropha. However, the waste cooking
oil-based biodiesel production requires various chemicals and
significant energy for the pretreatment of raw oil and its environmental impacts are also subject to the collection mechanism of
waste cooking oil (Sajid et al., 2016). Waste cooking oil gathers water, soluble compounds, and impurities during the dehydration
cooking process, which accelerates the hydrolysis of triglycerides
to form free fatty acids (FFAs) at high temperatures (Foteinis
et al., 2020). Being a biodiesel feedstock, microalgae usually cultivated in photobioreactors have the potential to achieve a yield per
plantation area that is 15e300 times of that for a traditional biodiesel crop (Mofijur et al., 2020). The major disadvantage of the
123
124
Chapter 7 Waste-to-biodiesel
third-generation biodiesel production is associated with high
initial production and setup costs against its economic viability.
The fourth-generation biodiesel refers to photobiological solar
fuels and electro-fuels. The production of the biodiesel aims to
achieve carbon negativity (CO2 trapping and storage) using materials like biomass in a process similar to that of the secondgeneration biofuels. A typical feedstock can be the genetically
modified algal species which are used in photobiological solar
cells where solar energy is converted to usable biodiesel. The processes arrest CO2 using techniques like oxy-fuel combustion at
each stage of the production followed by geo-sequestration of
CO2 in, e.g., saline aquifers, gas fields, or old oils (Karmakar &
Halder, 2019). The advantages of the fourth-generation biodiesel
include high lipid content, CO2 absorbing ability and energy content, and rapid growth rate (Singh et al., 2020). However, the technologies are still at the infancy stage and are calling for additional
research and development.
4. Biodiesel impacts on soil and water
Petro-diesel exhibits toxicity at concentrations above 3% (w/
w) in nonadapted aerated soil; meanwhile, biodiesel exhibits no
toxicity up to a concentration of 12% (w/w) and can be relatively
easily biotransformed as determined by the measurement of the
respiration of soil microorganisms as well as the activity of soil
dehydrogenases (Lapinskiene_ et al., 2006). A series of CO2 evolution tests showed that the biodegradability of biodiesel was
>98% after 28 days, as compared to 50% for petro-diesel and
56% for gasoline (Pasqualino et al., 2006). The addition of biodiesel to petro-diesel and gasoline increases the biodegradability
of the fuels by means of co-metabolism. This suggests that biodiesel can be utilized as a natural solvent or an energizer to help
microbes break up and decontaminate the soil polluted with
petro-diesel.
Biodiesel is 15e25 times more water soluble than petro-diesel,
posing a potential risk of water pollution upon their diffusion
though soil to underground water or streams (He et al., 2007). Experiments based on aerobic seawater microcosms showed that
biodiesel were degraded at roughly the same rate as n-alkanes,
and more rapidly than other hydrocarbon components. It was
suggested that FAMEs in biodiesel mixtures did not affect the
evaporation rates of spilled petroleum hydrocarbons but might
stabilize oil droplets in the water column and facilitate associated
transport mechanisms. This enhances the dissolution of
Chapter 7 Waste-to-biodiesel
petroleum hydrocarbons and affects the transport, weathering
rate, and ecological impact of spilled biodiesel.
5. Biodiesel production
There are various biodiesel production technologies such as
pyrolysis, microemulsification, and transesterification. The principles of pyrolysis have been introduced previously. For example,
biodiesel can be derived from animal fatecontaining waste cooking oil (with high FFA contents) using the pyrolysis technology
involving decarboxylation (Ito et al., 2012). Specifically, triacylglycerols could be decomposed between 360 and 390 C with the
formation of fatty acids via the cleavage of the ester bond,
short-chain hydrocarbons and fatty acids. Increasing the residence time to up to 120 min at 420 C decreased the yields of fatty
acids to about 15 wt.% and increased the yields of hydrocarbons
to about 60 wt.%. Adding activated carbonesupported palladium
catalysts to the process further promoted decarboxylation and led
to a high yield (85 wt.%) of hydrocarbons that were comparable to
light oil. The derived biodiesel includes paraffins and olefins
which have higher calorific values and better low-temperature
properties than FAMEs as derived using transesterification.
Microwave-assisted pyrolysis has been applied to recover
biodiesel from sewage sludge and the recovered fuel was of a
LHV in the range of 32e34 kJ/g which was about 30% lower
than that of petro-diesel (Capodaglio et al., 2016).
Transesterification is considered as the most effective technology for producing the biodiesel with properties close to that of
petro-diesel and will be the focus of this chapter. Transesterification is a process which involves a series of reversible reactions
where alcohol reacts with triglycerides, the main component of
fats and oils to produce ester (biodiesel) and glycerol.
Triglyceride ðTGÞ þ ROH 4 Diglyceride ðDGÞ þ RCOOR1
Diglyceride ðDGÞ þ ROH 4 Monoglyceride ðMGÞ þ RCOOR2
Monoglyceride ðMGÞ þ ROH 4 Glycerol þ RCOOR3
(7.1)
For the transesterification process, a short-chain, low boiling
point alcohol (e.g., methanol and ethanol) is needed to generate
biodiesel. The reaction efficiency of the process is affected by
various factors such as the alcohol/molar ratio, the use and
type of catalyst (e.g., homogeneous or heterogeneous catalysts,
or biocatalysts), temperature, water content, FFA content, and
pressure (Caetano et al., 2019).
125
126
Chapter 7 Waste-to-biodiesel
As the shortest chain alcohol, methanol has been widely used
for the transesterification process to generate FAMEs. As
compared to the other alcohols that are of longer chain lengths,
methanol is more reactive and leads to a higher conversion for
the transesterification process. For example, the transesterification of sunflower oil with methanol achieved a conversion of
91% compared to 81% and 75% for the processes with ethanol
and n-propanol, respectively (Sankaranarayanan et al., 2011).
An optimal Karanja biodiesel yield of 91.05% was achieved using
methanol and 1.22% (w/w) KOH as a catalyst for 90.78 min at
66.8 C, which was higher than that (77.4%) using ethanol and
1.21% (w/w) KOH for 120 min at 61.3 C (Verma & Sharma, 2016).
As compared to methanol, ethanol has the advantages of being
less toxic and recoverable from sugar- or starch-rich biomass (i.e.,
bioethanol as introduced in Chapter 6), making it a relatively lowcarbon option for transesterification. For countries with limited
petroleum resources and refineries, bioethanol offers an opportunity for biodiesel development based on the local bioresources that
are relatively accessible. The technical feasibility of bioethanolbased transesterification has been widely verified with the achievement of an ethyl esters yield greater than 90% (Brunschwig et al.,
2012). One of the major issues related to bioethanol-based biodiesel production is on the adverse effects of the relatively highwater content in bioethanol on the transesterification process,
limiting the use of 95% bioethanol at industrial scales (Brunschwig et al., 2012). For alkaline-catalyzed transesterification with
bioethanol, secondary hydrolysis and saponification reactions
are caused by the presence of water, which reduces the process
yield and leads to the consumption of the catalyst; hence, a
maximum water content of 0.1% is recommended for biodiesel
production. Heterogeneous catalysts used in the process can
also be inhibited by water or lixiviation which is caused by the
dissolution of metal cations or active acid sites in the reaction medium and contaminates the biodiesel product (Brunschwig et al.,
2012). Finally, the cost of bioethanol is generally higher than commercial ethanol, adversely affecting the economic viability of
bioethanol-based production at an industrial scale.
Higher molecular weight alcohols such as butanol have the
advantages of greater miscibility with lipid and higher boiling
points as compared to lower molecular weight alcohols (Lotero
et al., 2005). The former advantage facilitates the development
of a less pronounced initial mass-transfer-controlled regime,
while the latter makes higher reaction temperature possible,
which is a favorable condition for acid-catalyzed transesterification to achieve higher reaction rates.
The waste cooking oil from, e.g., restaurants, often contains
animal fats which (1) promote the formation of long-chain
Chapter 7 Waste-to-biodiesel
saturated FAMEs, and (2) comprises significant FFAs (Ito et al.,
2012). The long-chain saturated FAMEs have a high freezing point
and can deteriorate the low temperature properties of derived
biodiesel. The FFAs also tend to form a soap upon alkalicatalyzed biodiesel production, adversely affecting the overall
yield of the process.
The alcohol/oil molar ratio is one of the most critical factors of
the process. Stoichiometrically, a ratio of 3 (i.e., 3 mols of alcohol
for 1 mol of triglyceride) is needed for the reaction, but higher ratios (i.e., excess of alcohol) are normally adopted to increase the
yield of the process (Caetano et al., 2019). For higher molar ratios
such as 6 and 10, it was found that the conversion of the triglyceride from jatropha oil could proceed to completion within 30 min
at varied temperature conditions (45 and 60 C) while the conversion was 90% under the stochiometric ratio of 3 (Kumar et al.,
2011). A series of transesterification experiments (65 C and
3 wt.% catalysts) with a base catalyst (K2SiO3/AlSBA-15) and jatropha oil showed that the yield of biodiesel increased from 29.5% to
65.6% as the molar ratio increased from 3:1 to 15:1 with a yield of
95% for the ratio of 9:1; however, further increasing the ratio from
9 to 15 did not significantly chang the yield (Wu et al., 2014).
Increasing the process temperature will increase the rate of reaction since a higher temperature increases the kinetic energy of molecules and lowers the oil viscosity, improving the mixing between
catalysts and alcohol molecules (Takase et al., 2014). However, an
over high temperature (e.g., >45 C for alkaline-catalyzed transesterification of edible Canola oil and >60 C for used frying oil)
would decrease the ester yield due to the acceleration of the saponification (fat, oil, or lipid converted into soap and alcohol by
aqueous alkali) of triglycerides (Leung & Guo, 2006). The effect of
temperature on the yield of biodiesel might also subject to the influence of other factors, depending on the types of feedstocks. For
example, for acid-catalyzed primary sludge transesterification,
there was a significant interactive effect between temperature,
acid concentration, and methanol-to-sludge mass ratio on the yield
of FAMEs, while for secondary sludge, the FAME yield was significantly affected by the independent effects of the factors (Mondala
et al., 2009). A sufficiently long reaction time is needed to ensure
the completion of the process; however, excess reaction time would
promote the reverse reaction of transesterification (i.e., hydrolysis
of esters), reducing the biodiesel yield (Leung & Guo, 2006).
Various types of catalysts have been used for the transesterification process and their advantages and disadvantages are listed
in Table 7.1. Basic homogenous catalysts (e.g., sodium hydroxide
(NaOH) and sodium hydroxide (KOH)) are in the same phase as
127
128
Chapter 7 Waste-to-biodiesel
Table 7.1 Advantages and disadvantages of different types of transesterification catalysts
for waste cooking oil (Lam et al., 2010).
Catalyst
Advantages
Disadvantages
Homogeneous
base catalyst
(1) Very fast reaction rate
(2) Requirements of mild reaction
condition and less energy intensive
(3) Low cost and wide availability
(1) Faster reaction rate than acidcatalysts
(2) Requirements of mild reaction
condition and less energy intensive
(3) Easy separation of catalyst from
product
(4) Highly reusable and regenerable
(1) Less sensitive to FFA and water
content in the oil
(2) Preferred for low-grade oil
(3) Simultaneous esterification and
transesterification
(4) Requirements of mild reaction
condition and less energy intensive
(1) Simultaneous esterification and
transesterification
(2) Easy separation of catalyst from
product
(3) Highly reusable and regenerable
(1) Sensitive to FFA content in the oil (soap formation
for >2 wt.% FFA content and biodiesel yield
reduction with high purification requirements)
Heterogeneous
base catalyst
Homogeneous
acid catalyst
Heterogeneous
acid catalyst
Enzyme
(1) Less sensitive to FFA and water
content in the oil
(2) Preferred for low-grade oil
(3) Low reaction temperature
(4) Simple purification
(1) Ambient air poisoning
(2) Sensitive to FFA content in the oil (soap formation
for >2 wt.% FFA content and biodiesel yield
reduction with high purification requirements)
(3) Product contamination by the leaching of catalyst
active sites
(1) Very slow reaction rate
(2) Corrosion on reactor and pipelines
(3) Separation of catalyst from product being
challenging
(1) Relatively high costs
(2) Requirements of high temperature, high alcohol to
oil molar ratio, and long reaction time
(3) Energy intensive
(4) Product contamination by the leaching of catalyst
active sites
(1) Very slow reaction rate
(2) High costs
(3) Deactivation by alcohol
the reacting materials and are most used catalysts for transesterification. Upon the comparison of sodium methoxide, potassium
methoxide, sodium hydroxide, and potassium hydroxide for
methanolysis of sunflower oil in a batch stirred reactor (methanol/oil molar ratio ¼ 6:1, 65 C, and catalyst concentration ¼ 1
wt.%) followed by separation and purification, nearly 100 wt.%
biodiesel purity was achieved for all catalysts but nearly
Chapter 7 Waste-to-biodiesel
100 wt.% biodiesel yields (the ratio between the weight of methyl
ester generated and the weight of oil used) were only achieved
with the methoxide catalyst (Vicente et al., 2004). Sodium hydroxide and sodium hydroxide achieved biodiesel yields of 86.7% and
91.7%, respectively, and the losses of biodiesel yields were associated with the dissolution of methyl ester in glycerol and triglyceride saponification. With the potassium hydroxide catalyst at
1.0 wt.% concentration, a mixing intensity of 600 rpm, a reaction
temperature of 65 C, and a methanol/oil molar ratio of 6:1, an
optimal biodiesel yield of 95%e96% was achieved from rapeseed
oil in 2 h (Rashid & Anwar, 2008). Suboptimal conditions with
higher or lower potassium hydroxide and methanol concentrations than the optimal values led to either incomplete reaction
or the formation of soap. Existing studies recommended that
the preferred concentration of basic homogeneous catalyst
should range from 0.005 to 1 wt.% (Marchetti et al., 2007).
The presence of high water or FFA (>1 wt.%) contents in feedstocks such as waste cooking oil and tallow can reduce the effect
of catalyst and the process efficiency. Alkaline catalysts can react
with FFAs to form soaps, adversely affecting the separation of biodiesel, glycerine and wash water, which is a less problem for homogeneous acid catalysts. Acid catalysts such as hydrochloric
acid (HCl) and sulfuric acid (H2SO4) can handle cases of higher
FFA or water contents in oils and can simultaneously promote
esterification and transesterification to consume triglycerides
and FFAs. The major disadvantages of the acid catalysts are on
their slow reaction rates and corrosiveness, posing challenges to
the operation of system. A combined process using base and
acid catalysts was also developed (Canakci & Van Gerpen, 1998).
The process consisted of an acid-catalyzed pretreatment stage
to convert FFAs into alkyl-esters via esterification, followed by
an alkaline-catalyzed transesterification to convert the rest of
the mono-, di-, and triglycerides into alkyl-esters. A pilot plant
based on the process was demonstrated to treat soybean oil, yellow grease (9 wt.% FFAs), and brown grease (40 wt.% FFAs). As
shown in Table 7.1, for homogeneous catalysts, separation and
purification stages are needed post-biodiesel production, incurring significant costs and the production of a significant amount
of wastewater.
Typical heterogeneous solid catalysts include alkali-metal
carbonates, alkaline-earth carbonates, and alkaline-earth metal
oxides for base ones and WO3/ZrO3, Zeolite Y (Y756), carbonbased catalyst from starch, H3PW12O40 $ 6H2O (PW12),
Zr0.7H0.2PW12O40 (ZrHPW), and SO2
4 /SnO2eSiO2 for acid ones
(Lam et al., 2010). The activity of the heterogeneous catalysts is
129
130
Chapter 7 Waste-to-biodiesel
closely related to various factors such as specific surface area, pore
size and volume, and the active site concentration on the surface
of the catalysts, among which the active site concentration is
considered to be most important (Zabeti et al., 2009). A higher
specific surface area and active site concentration tend to promote the reactions of the process. One of the major problems
about the use of heterogeneous catalysts is the formation of three
phases with alcohol and oil, resulting in diffusion limitations and
lowering the reaction rate; in this case, catalyst supports (e.g.,
alumina, silica, and zinc oxide) can be used to mitigate the mass
transfer limitation. To prepare the active sites, various procedures
and conditions including washing and drying are needed. For Ca/
Al composite oxideebased alkaline catalyst, the temperature of
calcination might affect the activity of the catalyst (Meng et al.,
2013). The catalyst calcined at 600 C showed the highest activity
with >94% yield of FAMEs upon its application to the transesterification of rapeseed oil at 65 C and a methanol/oil molar ratio of
15:1. The performance of the catalyst was not only related to the
specific surface area but also the crystalline structure that served
to improve the catalytic activity due to its synergistic effect with
CaO. The high temperature condition might cause burning and
the compaction of active sites. The high calcination temperature
requirement also suggested that the use of the catalyst might
involve significant energy input considering a typical 8-h duration
of the calcination preparation process.
The catalysts can be impregnated and modified with metal
ions to improve their performance, which can be influenced by
the type of metal ion/salt used. For example, for CaO impregnated with various alkali metal ions (Liþ, Naþ, and Kþ), a
maximum strength was found for lithium carbonate-impregnated
CaO (Kumar & Ali, 2010). The nanocrystalline Liþ-impregnated
CaO was used to catalyze the transesterification of used cottonseed oil and achieved a complete transesterification process in
45 min at the conditions of 65 C, and moisture and FFA contents
of 0.26 and 0.31 wt.%. The catalyst was also applicable for the
transesterification of cotton seed oil with a moisture content up
to 15 wt.% water.
Chemical catalystebased transesterification processes suffer
from the problems of a huge amount of wastewater generation
and difficulty in glycerol recovery which incur significant economic and environmental expenses to biodiesel production
(Lam et al., 2010). Enzyme catalysis is receiving increasing attention due to its apparent advantages of less by-product generation,
easy product recovery, mild reaction conditions, being insensitive
to high FFA contents, and high reusability. The lipase from Mucor
Chapter 7 Waste-to-biodiesel
miehei was found to be most effective at converting triglycerides
to biodiesel with short-chain alcohols (i.e., methanol and
ethanol), and achieved a 97% yield on various types of feedstocks
such as tallow, rapeseed, and soybean oil (Nelson et al., 1996). Water did not degrade lipase catalysis but improved the efficiency of
the enzyme. The lipase from Candida antarctica was most efficient for converting triglycerides with secondary alcohols to
generate branched alkyl esters. However, enzyme catalysis suffers
from the problems of a relatively high cost, slow reaction rate, and
enzyme deactivation, limiting its large-scale industrial applications for the time being. Finally, regardless of the use of the catalysts, the efficiency of the transesterification reaction can be
further enhanced using microwave, supercritical conditions, ultrasounds, and/or membranes.
6. Whole process
A complete biodiesel production process generally includes
raw material collection and transport, raw material pretreatment,
preparation of catalyst, transesterification, separation and filtration, purification and drying, with biodiesel and glycerol being
the final products. For feedstocks such as waste cooking oil
with high FFA contents, a pretreatment stage, e.g., using sulfuric
acid and methanol to lower the FFA contents needs to be
included (Chung et al., 2019). A methanol/FFA molar ratio of
19.8:1 is generally adopted by biodiesel producers for FFA esterification in the United States, while generally, it was suggested
that the 19.8:1 methanol/FFA molar ratio only applied to an FFA
range of 15%e25% (Chai et al., 2014). The pretreatment could
achieve an FFA conversion of w80% (Photaworn et al., 2017).
The method of gravity settling combined with centrifugation has
also been used to remove solid impurities, water, and watersoluble compounds in waste cooking oil (Foteinis et al., 2020).
Prior to the pretreatment process, oil decantation and filtration
might be needed to remove impurities, followed by thermal treatment to reduce the water content in the oil.
The sources of the catalysts vary and is a critical factor upon
the evaluation of the techno-economic feasibility and environmental impacts of biodiesel devellopment. For example, calcium
carbonate (CaCO3) can be prepared by crushing readily available
limestone, while calcium oxide (CaO) can be sourced from waste
eggshell using dedicated calcination processes or high temperature thermal treatment involving the use of milling machine and
fired furnace (Tan et al., 2015).
131
132
Chapter 7 Waste-to-biodiesel
As an exaxmple, a typical process of acid-catalyzed transesterification of mutton tallow consists five substages: transesterification,
methanol recovery, acid removal, water washing, and glycerol
purification (Faleh et al., 2018). The first substage (80 C and
400 kPa) involves a transesterification reactor where methanol
and sulfuric acid catalyst are fed into together with recycled
methanol and mutton tallow that is preheated to 60 C in a heat
exchanger. In the second substage, the transesterification products
are fed to a distillation column to separate the methanol from other
components for recycling. In the third substage, the other components are sent to an acid removal reactor after being cooled in a
Cooler to 60 C. A neutralization reactor is used to neutralize sulfuric acid using calcium oxide. CaSO4 $ 2H2O is formed by reaction
between the produced water and CaSO4 and is removed using
a gravity separator. In the substage 4, water at 25 C is added to
separate the FAMEs from the glycerol. In the last substage, a distillation column is used to purify glycerol.
Other transesterification configurations are also available. For
example, Foteinis et al. (2020) considered a two-step transesterification process made of acid-catalyzed esterification and alkaline
catalyst transesterification, which is suitable for feedstocks of
high FFA contents such as waste cooking oil (w2e7 wt.%). In the
first step, the esterification of FFAs is achieved through the acidcatalyzed process with excess methanol in a continuous plug
flow reactor. In the second step, the transesterification of the esterified low-acidity oil occurs with excess methanol and base catalysts
(e.g., KOH) in two continuous stirred tank reactors in series.
Typical products of the process include CH3OH, potassium sulfate
(K2SO4), biodiesel distillation residue, soap, catalyst, and wastewater. The produced biodiesel needs to be purified to meet the
standards for diesel engine applications. The purification process
involves a series of washing procedures with acidulation and vacuum drying to reduce the amount of water, CH3OH, and catalyst
and with vacuum distillation to remove heavy components such
as polymerized FAMEs or traces of sulfur. To recover the methanol
in the water, a rectification process for water evaporation followed
by distillation could be used. Base-catalyzed transesterification of
waste cooking oil tends to form soap from the reaction of FFAs and
the base catalyst. This reduces the yield of biodiesel and poses a
significant challenge to the separation of biodiesel from glycerol.
Glycerol can be considered as a food source for animals or
value-added chemical for, e.g., cosmetics and soap production.
For dry purification that utilizes less water, a magnesol powder
can be considered and the crude biodiesel is simply pumped
through a wash column containing the powder, removing any
unreacted glycerides and other impurities.
Chapter 7 Waste-to-biodiesel
References
Biofuelsystems.com. (2020). Biodiesel standards/specification. https://www.
biofuelsystems.com/biodiesel/specification.htm.
Brunschwig, C., Moussavou, W., & Blin, J. (2012). Use of bioethanol for biodiesel
production. Progress in Energy and Combustion Science, 38(2), 283e301.
Caetano, N. S., Ribeiro, V., Ribeiro, L., Baptista, A., & Monteiro, J. (2019).
Biodiesel production systems: Operation, process control and
troubleshooting. In Biodiesel (pp. 27e56). Springer.
Canakci, M., & Van Gerpen, J. (1998). A pilot plant to produce biodiesel from
high free fatty acid feedstocks. In 2001 ASAE annual meeting (p. 1).
Capodaglio, A. G., Callegari, A., & Dondi, D. (2016). Microwave-induced pyrolysis
for production of sustainable biodiesel from waste sludges. Waste and
Biomass Valorization, 7(4), 703e709.
Chai, M., Tu, Q., Lu, M., & Yang, Y. J. (2014). Esterification pretreatment of free
fatty acid in biodiesel production, from laboratory to industry. Fuel
Processing Technology, 125, 106e113.
Chung, Z. L., Tan, Y. H., San Chan, Y., Kansedo, J., Mubarak, N. M., Ghasemi, M.,
& Abdullah, M. O. (2019). Life cycle assessment of waste cooking oil for
biodiesel production using waste chicken eggshell derived CaO as catalyst
via transesterification. Biocatalysis and Agricultural Biotechnology, 21,
101317.
Dioha, M. O., & Kumar, A. (2020). Sustainable energy pathways for land
transport in Nigeria. Utilities Policy, 64, 101034.
Faleh, N., Khila, Z., Wahada, Z., Pons, M.-N., Houas, A., & Hajjaji, N. (2018).
Exergo-environmental life cycle assessment of biodiesel production from
mutton tallow transesterification. Renewable Energy, 127, 74e83.
Foteinis, S., Chatzisymeon, E., Litinas, A., & Tsoutsos, T. (2020). Used-cooking-oil
biodiesel: Life cycle assessment and comparison with first-and thirdgeneration biofuel. Renewable Energy, 153, 588e600.
Gui, M. M., Lee, K. T., & Bhatia, S. (2008). Feasibility of edible oil vs. non-edible
oil vs. waste edible oil as biodiesel feedstock. Energy, 33(11), 1646e1653.
Hasan, M. M., & Rahman, M. M. (2017). Performance and emission
characteristics of biodieselediesel blend and environmental and economic
impacts of biodiesel production: A review. Renewable and Sustainable Energy
Reviews, 74, 938e948.
He, B. B., Thompson, J. C., Routt, D. W., & Van Gerpen, J. H. (2007). Moisture
absorption in biodiesel and its petro-diesel blends. Applied Engineering in
Agriculture, 23(1), 71e76.
Ito, T., Sakurai, Y., Kakuta, Y., Sugano, M., & Hirano, K. (2012). Biodiesel
production from waste animal fats using pyrolysis method. Fuel Processing
Technology, 94(1), 47e52.
Karmakar, B., & Halder, G. (2019). Progress and future of biodiesel synthesis:
Advancements in oil extraction and conversion technologies. Energy
Conversion and Management, 182, 307e339.
Kumar, D., & Ali, A. (2010). Nanocrystalline lithium ion impregnated calcium
oxide as heterogeneous catalyst for transesterification of high moisture
containing cotton seed oil. Energy and Fuels, 24(3), 2091e2097.
Kumar, G. R., Ravi, R., & Chadha, A. (2011). Kinetic studies of base-catalyzed
transesterification reactions of non-edible oils to prepare biodiesel: The
effect of co-solvent and temperature. Energy and Fuels, 25(7), 2826e2832.
Lam, M. K., Lee, K. T., & Mohamed, A. R. (2010). Homogeneous, heterogeneous
and enzymatic catalysis for transesterification of high free fatty acid oil
133
134
Chapter 7 Waste-to-biodiesel
(waste cooking oil) to biodiesel: A review. Biotechnology Advances, 28(4),
500e518.
_ A., Martinkus, P., & Reb
_ zdaite,
_ V. (2006). Eco-toxicological studies
Lapinskiene,
of diesel and biodiesel fuels in aerated soil. Environmental Pollution, 142(3),
432e437.
Leung, D. Y. C., & Guo, Y. (2006). Transesterification of neat and used frying oil:
Optimization for biodiesel production. Fuel Processing Technology, 87(10),
883e890.
Lotero, E., Liu, Y., Lopez, D. E., Suwannakarn, K., Bruce, D. A., & Goodwin, J. G.
(2005). Synthesis of biodiesel via acid catalysis. Industrial and Engineering
Chemistry Research, 44(14), 5353e5363.
Malça, J., Coelho, A., & Freire, F. (2014). Environmental life-cycle assessment of
rapeseed-based biodiesel: Alternative cultivation systems and locations.
Applied Energy, 114, 837e844.
Marchal, V., Dellink, R., Van Vuuren, D., Clapp, C., Château, J., Lanzi, E., & Van
Vliet, J. (2011). OECD environmental outlook to 2050 Chapter 3: Climate
change (November), 90.
Marchetti, J. M., Miguel, V. U., & Errazu, A. F. (2007). Possible methods for
biodiesel production. Renewable and Sustainable Energy Reviews, 11(6),
1300e1311.
Meng, Y.-L., Wang, B.-Y., Li, S.-F., Tian, S.-J., & Zhang, M.-H. (2013). Effect of
calcination temperature on the activity of solid Ca/Al composite oxide-based
alkaline catalyst for biodiesel production. Bioresource Technology, 128,
305e309.
Mofijur, M., Siddiki, S. Y. A., Ahmed, M. B., Djavanroodi, F., Fattah, I. M. R.,
Ong, H. C., Chowdhury, M. A., & Mahlia, T. M. I. (2020). Effect of
nanocatalysts on the transesterification reaction of first, second and third
generation biodiesel sources-A mini-review. Chemosphere, 128642.
Mondala, A., Liang, K., Toghiani, H., Hernandez, R., & French, T. (2009).
Biodiesel production by in situ transesterification of municipal primary and
secondary sludges. Bioresource Technology, 100(3), 1203e1210.
Murillo, S., Miguez, J. L., Porteiro, J., Granada, E., & Moran, J. C. (2007).
Performance and exhaust emissions in the use of biodiesel in outboard
diesel engines. Fuel, 86(12e13), 1765e1771.
Nelson, L. A., Foglia, T. A., & Marmer, W. N. (1996). Lipase-catalyzed production
of biodiesel. Journal of the American Oil Chemists’ Society, 73(9), 1191e1195.
Pasqualino, J. C., Montane, D., & Salvado, J. (2006). Synergic effects of biodiesel
in the biodegradability of fossil-derived fuels. Biomass and Bioenergy, 30(10),
874e879.
Photaworn, S., Tongurai, C., & Kungsanunt, S. (2017). Process development of
two-step esterification plus catalyst solution recycling on waste vegetable oil
possessing high free fatty acid. Chemical Engineering and Processing: Process
Intensification, 118, 1e8.
Prasad, R. D., & Raturi, A. (2018). Low-carbon measures for Fiji’s land transport
energy system. Utilities Policy, 54, 132e147.
Rashid, U., & Anwar, F. (2008). Production of biodiesel through optimized
alkaline-catalyzed transesterification of rapeseed oil. Fuel, 87(3), 265e273.
Requena, J. F. S., Guimaraes, A. C., Alpera, S. Q., Gangas, E. R., HernandezNavarro, S., Gracia, L. M. N., Martin-Gil, J., & Cuesta, H. F. (2011). Life Cycle
Assessment (LCA) of the biofuel production process from sunflower oil,
rapeseed oil and soybean oil. Fuel Processing Technology, 92(2), 190e199.
Rouhany, M., & Montgomery, H. (2019). Global biodiesel production: The state
of the art and impact on climate change. Biodiesel, 1e14.
Chapter 7 Waste-to-biodiesel
Sajid, Z., Khan, F., & Zhang, Y. (2016). Process simulation and life cycle analysis
of biodiesel production. Renewable Energy, 85, 945e952.
Sankaranarayanan, T. M., Pandurangan, A., Banu, M., & Sivasanker, S. (2011).
Transesterification of sunflower oil over MoO3 supported on alumina.
Applied Catalysis A: General, 409, 239e247.
Sheehan, J., Camobreco, V., Duffield, J., Graboski, M., Graboski, M., &
Shapouri, H. (1998). Life cycle inventory of biodiesel and petroleum diesel for
use in an urban bus. Golden, CO (United States): National Renewable Energy
Lab.(NREL).
Singh, D., Sharma, D., Soni, S. L., Sharma, S., Sharma, P. K., & Jhalani, A. (2020).
A review on feedstocks, production processes, and yield for different
generations of biodiesel. Fuel, 262, 116553.
Takase, M., Zhang, M., Feng, W., Chen, Y., Zhao, T., Cobbina, S. J., Yang, L., &
Wu, X. (2014). Application of zirconia modified with KOH as heterogeneous
solid base catalyst to new non-edible oil for biodiesel. Energy Conversion and
Management, 80, 117e125.
Tan, Y. H., Abdullah, M. O., Nolasco-Hipolito, C., & Taufiq-Yap, Y. H. (2015).
Waste ostrich-and chicken-eggshells as heterogeneous base catalyst for
biodiesel production from used cooking oil: Catalyst characterization and
biodiesel yield performance. Applied Energy, 160, 58e70.
Verma, P., & Sharma, M. P. (2016). Comparative analysis of effect of methanol
and ethanol on Karanja biodiesel production and its optimisation. Fuel, 180,
164e174.
Vicente, G., Martınez, M., & Aracil, J. (2004). Integrated biodiesel production: A
comparison of different homogeneous catalysts systems. Bioresource
Technology, 92(3), 297e305.
Wu, H., Zhang, J., Liu, Y., Zheng, J., & Wei, Q. (2014). Biodiesel production from
Jatropha oil using mesoporous molecular sieves supporting K2SiO3 as
catalysts for transesterification. Fuel Processing Technology, 119, 114e120.
Xue, J., Grift, T. E., & Hansen, A. C. (2011). Effect of biodiesel on engine
performances and emissions. Renewable and Sustainable Energy Reviews,
15(2), 1098e1116.
Zabeti, M., Daud, W. M. A. W., & Aroua, M. K. (2009). Activity of solid catalysts
for biodiesel production: A review. Fuel Processing Technology, 90(6),
770e777.
135
This page intentionally left blank
Waste-to-biochar
8
Abstract
This chapter highlights the significance of waste-to-biochar development by reviewing the recent environmental and energy applications
of biochar. It explains the technical and process principles and influential factors of three major biochar production technologies, i.e. torrefaction, pyrolysis, and gasification. Some typical reactor designs (e.g.,
masonry and metal kilns, retorts, auger type, and fluidized bed type for
pyrolysis, and fixed bed, fluidized bed, and entrain flow for gasification)
are reviewed. The yields and physicochemical properties of biochar from
the different technologies are summarized. Finally, the design of wasteto-biochar production is discussed based on energy, environmental, and
economic criteria.
Keywords: Biochar yield; Gasification; Pyrolysis; System design;
Torrefaction; Waste-to-biochar.
1. Introduction
Biochar, a carbon-rich solid material, is receiving increasing
attention due to its significant potential for environmental and
energy applications. Extensive research has been carried out to
understand the role of biochar in mitigating climate change.
The carbon sequestration potential of biochar upon soil application stems from its carbon-rich feature (Lehmann, 2007). The
recalcitrant carbon in biochar is stable in soil and this makes carbon storage in soil feasible for an extended period of time, leading
to carbon sequestration. It was estimated that w200 million
tonnes of carbon sequestration can be achieved upon biochar
soil application and 2.2e2.93 tonnes of CO2 could be sequestered
for every tonne of biochar applied to soil (Galinato et al., 2011). It
is evidenced that biochar addition can reduce the direct emission
of various GHGs such as CH4 and N2O. For example, it was
reported that biochar soil addition reduced CH4 and N2O by
26.18% and 62%e98% as compared to the control scenarios
without biochar amendment (Li et al., 2013; Qin et al., 2016). Additionally, indirect carbon mitigation can be resulted from biochar’s
role in promoting soil quality and biomass yields via improved
Waste-to-Resource System Design for Low-Carbon Circular Economy. https://doi.org/10.1016/B978-0-12-822681-0.00009-8
Copyright © 2022 Elsevier Inc. All rights reserved.
137
138
Chapter 8 Waste-to-biochar
nutrients and water availability, the mineralization, fixation, and
transformation of organic nitrogen, and enhanced aggregate formation. For example, a biochar addition of 20 tonnes/ha
enhanced the wheat production by 17%e36% over 6 years
(Wang et al., 2018), and wheat straw biochar application in a
rice paddy improved the rice yield by about 25% and reduced
the GHG balance by 53.9%e62.8% (Zhang et al., 2015). Up to
50% of N2O was reduced when biochar was applied to soil at
the rate of 30 tonnes per hectare in New Zealand and similarly,
a reduction of 40%e51% in N2O was observed in paddy soil in
China. Biochar soil application has a negative emission potential
of 0.7 GtCeq/Year with a lower impact on land, water use, nutrients, albedo, energy requirement, and costs as compared to other
negative emission technologies such as direct air capture,
enhanced weathering, bioenergy with carbon capture and storage, and afforestation/deforestation (Smith, 2016).
Typical agrarian benefits from biochar soil application
include increasing nutrient (e.g., potassium, calcium, zinc,
etc.) retention and availability, contamination reduction,
increasing water holding capacity and cation exchange capacity,
and enhancing mycorrhizal activities, which serve to improve
soil productivity ultimately (Sohi et al., 2010). Biochar has high
inorganic matter contents (e.g., carbon, nitrogen, and phosphorus), indicating that it has the potential to increase soil nutrition status. It can increase the extractable phosphorus in the soil
solution and influence the element’s solubility and cation interaction activity. The combined soil application of biochar and
other soil amendments such as manure and composts can
improve the efficiency of nutrient uptake and reduce nutrient
leaching. For example, the combined application of orchid pruning biochar and inorganic fertilizers onto a vineyard in central
Italy decreased the soil bulk density and increased water retention capabilities of soil, leading to a significant increase in grape
productivity in terms of yield, weight, and size (Genesio et al.,
2015). The porous structure of biochar can serve to increase
the hydrophilicity and surface area, and thus the water retention
and cation exchange capacities of soil particles. Biochar pores
provide a benign environment for microorganisms and improve
the fungi and bacterial growth and activities in soil.
A second attractive feature of soil biochar application is
closely associated with biochar’s ability to mitigate various soil
quality problems such as soil degradation (e.g., runoff, nitrogen
and phosphorus losses) and contamination (e.g., toxic metals
and pesticides) as the result of the prominent physicochemical
properties (e.g., high porosity, high specific surface area, aromatic
Chapter 8 Waste-to-biochar
carbon structure, and alkalinity) of biochar. For example, it was
found that adding rice straw biochar reduced the annual sediment yield by 11% and annual soil runoff by 19%e28% (Li
et al., 2017). Bean stalk and rice straw biochar addition reduced
the Cd and Zn concentrations in roots and shoots by 30%e75%
and 43%e79%, and 25.0%e44.1% and 19.9%e44.2%, respectively
(Zheng et al., 2015). Biochar particles can adsorb soil pollutants
such as polycyclic aromatic hydrocarbon and heavy metal, mitigating soil contamination. Mitigating soil contamination reduces
the risk of human exposure to harmful contaminants via food
intake. It is worth noting that the actual effects of biochar on
soil and plant productivity depend on the types of biochar,
crop, and soil and local environmental conditions (Biederman &
Harpole, 2013).
Recently, the focus of biochar research and development has
also been paid to exploring the possibility of applying biochar
for nonsoil energy and environmental applications (You et al.,
2017). Specifically, biochar has been used as a low-cost, environmentally friendly catalyst or catalyst support in various thermochemical processes. It can be applied to reduce the content of
tar generated during the process of gasification and as mentioned
in Chapter 3, tar formation poses a significant risk to reduce the
stability and efficiency of gasification operation. Biochar can be
used as a good catalyst support or a direct catalyst for tackling
the problem of tar formation during the process of gasification.
Upon its use as a catalyst support, biochar can improve the
dispersion of reactant molecules into the internal structure of catalysts due to its high surface area and porosity. Upon its use as a
catalyst directly, biochar exhibits tar removal performance comparable to some of the conventional catalysts such as olivine
and nickel catalysts, while the performance can be further
improved by applying active metals (e.g., nickel) to the surface
of biochar (Qian & Kumar, 2015). Compared to the conventional
catalysts used in the thermochemical processing of waste, the
use of biochar for the thermochemical processes improves the efficiency of waste utilization and offers a possibility for completing
the close-loop of waste processing (e.g., gasification biochar supplied back to the process to mitigate its tar formation). However,
as the catalyzing process goes on, the surface area and porosity of
biochar normally degrade, adversely affecting its catalyzing
performance. Hence, similar to the conventional catalysts, it is
key to improve the stability and regenerating potential of biochar
toward practical, large-scale commercialization.
Biochar can be applied as adsorbents for removing heavy
metals and organic pollutants in environments because of its
139
140
Chapter 8 Waste-to-biochar
high surface area, porous structure, and surface functional
groups. The adsorption capacity of biochar is generally positively
associated with its porosity, density of functional groups (serving
as active sites), and specific surface area (You et al., 2017). Upon
further activation using either physical (e.g., steam and ozone) or
chemical methods (e.g., KOH, NH3, and ZnCl2), biochar can be
upgraded to activated carbon with much enhanced porosity and
surface area characteristics. The properties of activated biochar
depend on the conditions of activation such as the types of activating agents used and temperature (Zhang et al., 2014). Additionally, it has been evidenced that biochar has the potential to serve a
cost-effective green sorbent for CO2 capturing (Dissanayake et al.,
2020). The CO2 adsorption capacity of biochar is positively
associated with micropore areas and volumes which are
controlled by the types of feedstocks and process conditions of
biochar production.
Recent studies also find the potential of biochar in electrochemical applications as exemplified by direct carbon fuel cells
(DCFCs), electrocatalysts, and supercapacitors because of its
good surface texture features and high conductivity and electrochemical activities. DCFCs have the great potential to achieve a
high electrical efficiency and reliability. The feature of high contents in carbon and carboneoxygen groups makes biochar an
appropriate material for DCFC applications to produce valuable
gases. The power density of DCFCs is positively related to the
carbon content, surface area, and porosity of biochar and these
properties favor the reactivity of anode electrochemical reactions. One of the major technical challenges against the scaleup
applications of DCFCs is associated with the ash residuals upon
the consumption of biochar carbon which degrade the surface
features and reduce the associated charge transfer (You et al.,
2017). Pine wood biochar after sonication and heating treatment
was used as a manganese oxide electrocatalytic support for microbial fuel cells and achieved power densities comparable to
Vulcan carbon (Huggins et al., 2015). Generally, uniform biochar
sizes will be beneficial for the electrochemical applications of
biochar, suggesting the requirement of some pretreatment activities such as sieving and milling prior to the biochar production
process.
Biochar has been applied as an additive to promote the anaerobic digestion processing of organic waste for higher quality
biogas production. Specific benefits of biochar addition into
anaerobic digestion include mitigating the inhibition phenomena, promoting syntrophic metabolisms, and increasing the
buffer capacity of the process (maintaining the alkalinity of
Chapter 8 Waste-to-biochar
anaerobic digestion media), serving as support media for biomass
immobilization, and enhancing nutrient retention and carbonto-nitrogen ratio. These serve to improve the quality of biogas
(e.g., increasing methane content and lowering carbon dioxide
content) and digestate (e.g., enriched macro- and micronutrients
(e.g., K, Ca, Fe, etc.)) generated during anaerobic digestion and
thus the economic viability of the process (Chiappero et al.,
2020). This application provides opportunities for designing
hybrid waste treatment processes by combining biochar production processes such as pyrolysis and gasification with anaerobic
digestion and the hybrid processes are generally featured by a
higher level of waste resource utilization.
2. Waste-to-biochar technologies
Biochar can be generated from the thermochemical processing of waste, and there are three main biochar production technologies, i.e., torrefaction, pyrolysis, and gasification, depending
on the conditions of temperature and the quantity of oxygen
used. The latter two have been discussed in the previous chapters
and will be introduced in this chapter with a specific focus on
biochar production.
2.1 Torrefaction
Torrefaction mainly occurs between 200 and 300 C in an inert
or oxidative environment with a relatively long residence time
(20e120 min) and it generates biochar (up to 97 wt.%) as the
primary product and torrefied volatiles (liquid and gas) as a byproduct that can be combusted to supply energy for the torrefaction process (Wang et al., 2020). Some typical components of
liquid products include water, organics (e.g., sugars, acids, alcohols, furans, ketones etc.), and lipids (e.g., terpenes, phenols,
waxes, tannins, etc.). Water is produced via the thermal decomposition and evaporation of the moisture content in the feedstock,
while lipids and organics, e.g., present in the original waste are
released upon heating or devolatilization and carbonization
(Peduzzi et al., 2014). Typical gas components include H2, CO,
CO2, CH4, light aromatics (e.g., toluene and benzene), etc. Dehydration and decarboxylation are the main degradation reactions
during the process. Torrefaction has been commonly applied to
pretreat feedstocks for improving the heating value and hydrophobicity of feedstock for subsequent thermochemical processing. This pretreatment can help to reduce the cost and energy
141
142
Chapter 8 Waste-to-biochar
consumption of feedstock transportation and extend the storage
life of feedstock. Moreover, the formed biochar is of higher energy
density as compared to the original waste and can be more easily
pulverized for power generation.
Depending on the heat transfer mechanism, the reactors of
torrefaction can be classified into direct and indirect heating designs: in a direct heating reactor, the feedstock directly contacts
with the heating media, while the feedstock is heated via the
reactor walls in an indirect heating reactor (Chew & Doshi,
2011; Peduzzi et al., 2014). Depending on the movement of feedstock in the reactor, they can be classified into fluidized bed and
moving bed.
For fluidized bed reactors (similar to the ones for pyrolysis and
gasification as described previously), an upward flowing gas
stream is used to suspend feedstock particles, which significantly
enhance the interaction between the feedstock particles and sand
bed materials, promoting heat transfer and leading to a relatively
uniform temperature distribution. It was reported that Topell’s
commercial fluidized bed torrefaction reactor could enhance
the volumetric caloric density (GJ/m3) of feedstock by 70% and
generated biochar that could be cofired with coal up to a fraction
of 80% (Chew & Doshi, 2011). In the fluidized bed system as
illustrated in Fig. 8.1, an iron mesh basket is used to hold the
feedstock, while aluminum oxide used as the sand bed material.
Nitrogen gas is used to maintain an inert environment. An electrically heated thermal oxidizer is used to burn out the volatiles.
A moving bed reactor is featured by using mechanical components such as multi-hearth, screw, and auger to transport
the feedstock in the reactor. TORSPYD as developed by
Thermya, France, was shown to achieve fast and continuous
conversion of biomass into dry, nonhygroscopic, dense, and
easy-to-grind biochar (Ratte et al., 2011). This reactor based on
the principle of Scaled Pyrolytic Distillation involves a series of
organic solid distillation. Feedstock particles are introduced
from the top and move down the column gradually in the environment of increasing temperature and a countercurrent hot
gas stream introduced at the base of the column. During the process, water is firstly released followed by organic matters and 4%
of the biochar produced is supplied back into the system to fulfill
the energy requirement of the process. It was reported that TORSPYD could produce the biochar that had 95% initial energy content and 90% mass of its original feedstock, and a net calorific
value of around 20e21 MJ/kg (Chew & Doshi, 2011). TorrCoal
as developed by Torr-Coal Group used a revolving drum oven
as the reactor and the biochar produced achieved 70% mass
Chapter 8 Waste-to-biochar
Figure 8.1 The illustration of a bubbling fluidized bed torrefaction system (Tumuluru et al., 2012).
and 90% energy content of original feedstock and a LHV of
18e20 MJ/kg (Chew & Doshi, 2011). During the process, the produced biochar went through subsequent stages of size reduction
and sieving followed by dechlorination and desulfation which
served to remove 90% of chlorine and 30% of sulfur in biochar.
The quality of biochar is generally evaluated in terms of
various factors including the carbon content, pH value, specific
surface area, porosity, and nutrients. The quality of torrefied biochar is mainly controlled by the condition of temperature with
residence time being a less impactful factor. The condition of
higher temperature increases the carbon content while reducing
the hydrogen content of biochar. Accordingly, increasing the torrefaction temperature will increase the degree of conversion and
reduce the hydrogen-to-carbon and oxygen-to-carbon ratios to
the levels similar to coal. Higher temperatures also decrease the
yield of biochar, which, for lignocellulosic biomass, is related to
the decomposition of cellulosic fraction at higher temperature
(up to 300 C) (Pala et al., 2014).
In general, oxidative torrefaction leads to lower mass and
energy yields of biochar as compared to nonoxidative
143
144
Chapter 8 Waste-to-biochar
torrefaction because oxidative reactions promote the rate of carbon degradation (Brachi et al., 2019). Moreover, the production
of torrefaction depends on the types of feedstocks. For example,
oxidative torrefaction achieved better biochar physical properties (mass density, energy density, hardness, and durability)
than nonoxidative torrefaction for nonwoody olive pomace pellets, while similar phenomena were not observed for woody fir
pellets (Brachi et al., 2019). Table 8.1 summarized the biochar
production of torrefaction. The mass and energy yields of biochar from torrefaction range from around 50%e97% and 50%
e99%, respectively, and the carbon and hydrogen contents of
torrefaction biochar range from around 35%e70% and 3.3%
e7.3%, respectively, across a wide range of feedstocks.
For efficient treatment of the feedstocks of high moisture contents such as microalgae, the technology of wet torrefaction has
been proposed and is based on the use of hot compressed water
and a pressure condition that is higher than the saturated vapor
pressure for the torrefaction temperature. As compared to conventional torrefaction, this technology has the advantages of
saving the energy loss of water vaporization, improving the
heat value, energy yield, and hydrophobicity of biochar, and
promoting the ash removal from feedstock (Gan et al., 2020).
The products of wet torrefaction include biochar as the primary
product and sugar and sugar-based derivatives as by-products.
The technology has been further adapted by, e.g., applying microwave irradiation for heating and applying an acid solution (e.g.,
HCl and H2SO4) as the medium. The acid solutionebased process
was found to improve the carbon content and heating value of
torrefied biochar.
2.2 Pyrolysis
The biochar production of pyrolysis is closely related to the
heating rate and residence time of the process with a lower heating rate and longer residence time favoring biochar production.
Extended residence time promotes secondary charring reactions
of volatile vapor and increases the yield of biochar. Pyrolysis can
be classified into slow pyrolysis, and fast or flash pyrolysis which
are featured by a heating rate and residence time range of <50 C/
min and 5e30 min, and 10 to 1000 C/s and <2 s, respectively (Roy
& Dias, 2017). Accordingly, higher biochar production could be
achieved for slow pyrolysis and is in the range between 21 and
58 wt.% (average 32 wt.%) as compared to fast or flash pyrolysis
for which the biochar production is in the range between 5.1
and 56 wt.% (average 25 wt.%). The carbon content of slow
Chapter 8 Waste-to-biochar
145
Table 8.1 The yield and physicochemical properties of biochar from torrefaction (Wang
et al., 2020).
Feedstock
Biochar composition
composition (%)
(%)
Temperature
Feedstock ( C)
Mass
yield (%)
Energy
yield (%)
C
H
C
H
Pine
chips
Stem
wood
Olive
pomace
pellets
Raw
pellets
Sugarcane
bagasse
Corn
stover
Peat
Rice straw
Bamboo
Empty
fruit
bunches
Parts of
the plant
Spent coffee
grounds
Medicine
residue
Microalga
residue
Licorice
residue
Biomass
chips
Spruce
stem
Spruce
stump
Spruce bark
225e300
89e52
94e71
47.21
6.64
49.47e63.67
6.07e5.58
260e310
97.1e45.9
98.8e62.8
50.3
6.2
51.4e69.2
5.9e5
200e250
79.92e53.04
94.5e68.4
54.93
6.33
57.31e63.61
6.33e4.68
200e250
79.92e53.04
93.65e49.85
50.91
6.25
52.22e66.65
6.06e3.34
200e300
79e52
98e79
32.5
5.01
34.5e50.3
4.98e3.4
200e300
97.1e57.4
98.52e84.41
e
e
45.8e58.7
5.5e4.7
230e270
200e300
210e300
200e300
82e70
94.35e70.49
95.34e59.98
87.5e67.4
91e87
98.52e84.41
97.36e75.11
90.3e70.7
52.09
42.57
46.12
43
5.79
5.84
6.11
6
59e65.3
45.06e50.94
48.54e61.23
46.2e59
5.49e5.26
5.46e4.9
6.08e4.8
5.5e5.1
250e300
77e63
88e80.5
46.5
5.1
56.4e65.6
6.0e5.9
200e300
97e62.82
98.07e78.84
52.99
7.29
53.94e68
7.28e6.85
200e300
92.7e63
97.93e79.87
52.86
7.22
54.42e68.22
7.09e6.62
200e275
89.35e62.64
91.98e79.45
36.49
6.12
41.27e61.63
5.95e5.38
210e280
92e51
99.3e72.9
42.5
6.41
44.5e58
6.41e5.74
230e290
86e43.1
90.5e60.5
43.7
6.05
45.1e54.1
5.8e4.35
225e300
92.4e68.6
93.05e79.88
48.78
6.27
50.06e62.17
6.09e5.72
225e300
92.7e55.6
94.26e64.76
47.38
6.49
49.21e60.21
6.21e5.89
225e300
90.4e63.0
96.93e74.8
49.09
6.06
55.4e67.34
5.53e3.89
146
Chapter 8 Waste-to-biochar
pyrolysis biochar ranges from 45% to 93% (average 73%), while the
carbon content of fast pyrolysis biochar ranges from 31% to 82%
(average 65%). Table 8.2 and Table 8.3 list the biochar production
from slow and fast pyrolysis processes, respectively.
The carbon content of biochar is positively related to pyrolysis
temperature, residence time, and heating rate (Wang et al., 2020).
Higher pyrolysis temperature promotes the release of volatiles
from the feedstock, increasing the carbon content of biochar,
while lower heating rates allow sufficient heat conduction and
promote the carbon deposition reaction, leading to higher biochar production. The biochar production of pyrolysis is also associated with the size of feedstock particles and the use of catalyst,
with larger feedstock particles and a higher ratio of catalyst to
feedstock favoring the production of biochar. Additionally, a
higher lignin content in the feedstock leads to a higher yield of
biochar as compared to the case of a lower content.
Table 8.2 The yield and physicochemical properties of biochar from slow pyrolysis (Wang
et al., 2020).
Parameters
Composition (%)
Feedstock
T ( C)
RT (min)
HR
( C/min)
Yield (%)
C
H
N
S
Cow manure
Pine wood
Coffee husk
Neem press
seed cake
Wheat straw
Palm shell
Hinoki cypress
Lignin
Algae
Walnut shell
Rubber wood
Redcedar
sapwood
Redcedar
heartwood
Corn straw
300
300
350
450
120
60
30
60
10
17
0.5
20
58.0
43.7
39.82
38.3
51.30
71.3
69.96
52.39
4.52
4.7
3.63
2.57
1.70
e
3.58
2.23
e
e
0.24
0.12
475
500
500
500
500
500
500
500
180
60
60
480
60
60
20
30
8
10
10e15
5
10
15
10
6
e
35.5
23.3
45.69
w32
w30
24.25
30.9
69.9
60.12
85.79
85.9
45.26
77.97
87.17
85.8
2.5
9.21
3.89
3.56
1.24
3.22
1.23
2.4
e
0.42
0.23
1.23
2.57
1.13
0.40
0.35
e
0.92
e
0.121
e
e
e
0.35
500
30
6
21.0
88.88
2.6
0.35
0.4
550
Several
30
w24
92.83
1.49
0.84
0.06
Chapter 8 Waste-to-biochar
147
Table 8.3 The yield and physicochemical properties of biochar from fast pyrolysis (Wang
et al., 2020).
Composition (%)
Feedstock
Temperature ( C)
Yield (%)
C
H
N
S
O
Wheat straw
Sweet sorghum
Corn stalks
Yellow poplar
Corn cobs
Pine sawdust
Rice husk
Pine sawdust
Douglas fir
Lvory nut
Bamboo
Rice husk
Brown macroalga
500
500
550
500
500
550
500
500
480
500
500
550
375
26
23.8
e
5.1
18.9
e
26
e
11.2
15.82
24.4
38.86
56.08
56
69.03
72.28
76.3
77.6
70.68
45.2
70.68
75.8
69.59
81.7
44.73
30.67
2.3
2.78
3.14
2.3
3.05
3.6
1.5
3.6
1.56
2.93
3.7
1.80
2.72
1.0
0.59
1.09
0.7
0.85
2.4
0.4
2.4
0.33
e
e
0.73
2.09
e
e
0.9
e
0.02
0.21
e
0.21
0.13
e
e
e
e
e
276
22.47
20.7
5.11
23.11
1.7
23.11
19.57
18.31
e
7.69
64.53
Toward practical implementation of pyrolysis-based biochar
production, it is important to consider valorizing the two other
products of the process, i.e., bio-oil (mainly oxygenated organic
compounds such as esters, acids, ketones, phenols, etc.) and syngas (e.g., CO, H2, CH4, etc.). From an energy perspective, the products can be used to generate heat to sustain the endothermic
pyrolysis process and improve its energy efficiency. For example,
in the fast pyrolysis system proposed by Patel et al. (2019) (Fig.
8.2(a)), around 11% of the produced bio-oil was used to generate
electricity to sustain the system operation while the combustion
of the noncondensable gases from the fast pyrolysis process supported 75% of the heat demand of the system with the remaining
25% from the use of propane. From an economic perspective, the
upgrading and applications of the other products provide an
additional income source for biochar production development.
For example, it was shown that the sale of the heat generated
from bio-oil and noncondensable gases could largely offset the utility expenses for a slow pyrolysisebased biochar production system
(Fig. 8.2(b)) (Cheng et al., 2020). From an environmental perspective, their applications can serve to improve the environmental
footprint (e.g., carbon footprint) of biochar production systems
148
Chapter 8 Waste-to-biochar
Figure 8.2 (a) A fast pyrolysis system proposed by Patel et al. (2019), and (b) a slow pyrolysis system proposed by
Cheng et al. (2020).
due to their renewability and low-carbon features. For example,
LCA showed that the carbon credits for displacing coal-based electricity generation using the energy produced and the credits for
biochar soil application for fast pyrolysis were 1.242 and 0.193
tonne CO2-eq., respectively, while the corresponding numbers
Chapter 8 Waste-to-biochar
149
were 1.174 and 0.427 tonne CO2-eq., respectively, for slow pyrolysis (Kung et al., 2013).
Conventionally, kilns have been widely used to produce
biochar and can be classified into masonry and metal kilns
and retorts. Masonry kilns can be further classified into “hottail” kilns, slope type kilns, surface kilns, masonry rectangular
kilns, Missouri kilns, and Argentine kilns.
“Hot-tail” kilns (Fig. 8.3(a)) are made of bricks laid with clay
and sometimes with noble additives such as sugar or sodium silicate to allow expansion and contraction (expansiveness)
(Rodrigues & Junior, 2019). Instead of having a chimney, there
are holes on the wall and base of the kiln for the adjustment of
gas input and output. The pyrolysis process is monitored visually
based on the coloration and quantity of smoke from the holes.
The “hot-tail” kilns are of relatively low capital and operation
and maintenance costs but suffer from the problems of limited
temperature control and mechanization, being slow in cooling,
and potential air pollutant emission through the holes.
Figure 8.3 Schematic illustrations of different types of kilns: (a) “hot-tail” kilns, (b) slope kilns, (c) beehive kilns,
(d) rectangular kilns (Rodrigues & Junior, 2019).
150
Chapter 8 Waste-to-biochar
The slope kilns (Fig. 8.3(b)) made of masonry normally have
one to three chimneys, one door, and multiple holes. Like the
“hot-tail” kiln, the pyrolysis process inside the kiln is monitored
by observing the color of the smoke from the chimneys (Rodrigues
& Junior, 2019). The slope is built as part of the kiln which saves
the construction material and cost, and there is good insulation
and low thermal loss, leading to homogeneous, good quality biochar production. Major disadvantages of slope kilns include the
necessity to find a firm and appropriate terrain and being slow
in cooling.
The beehive kilns (or surface kiln in Fig. 8.3(c)) made of
masonry are similar to “hot-tail” kilns but have one to six chimneys to improve the thermal conditions and gas flows inside the
kiln (Rodrigues & Junior, 2019). There are multiple air inlet holes
on the wall and along the circumference of the kiln dome. The
pyrolysis process can be monitored via observing the color of
the smoke from the chimney and the kiln external temperature.
Mechanization can be installed to facilitate biochar discharge.
The design of beehive kilns can be improved by adjusting the
position and number of holes, the dimension and position of
chimney, etc. Beehive kilns with an external combustion chamber
for the heat supply do not need air inlet holes and the air inlet
control is done through the chamber, improving the space utilization and process productivity.
The rectangular kilns (Fig. 8.3(d)) have been developed with
the installation of mechanization for loading and unloading and
of surveillance units for temperature monitoring (Rodrigues &
Junior, 2019). However, the kilns are still experiencing difficulties
in temperature control, limiting the yields and quality of biochar.
Additional disadvantages of rectangular kilns include significant
maintenance requirements and a long cooling cycle. Improvements have been made to better monitor and control the process
temperature with the design of openings, use of sensors, and use
of a gas burner to generate heat for the process (e.g., drying
pretreatment).
Metal kilns have been developed to improve the quality of biochar production and is able to treat feedstocks with a greater variation in properties. They also have a better process efficiency as
compared to the earth kilns. Sangsuk et al. (2018), designed and
studied a metal kiln with heat distribution pipes to improve the
quality of biochar and biooil production. The kiln was made of
sheet steel and was covered with fiberglass and galvanized steel
as an insulator. Six exhaust chimneys were connected to a
condenser unit for bio oil condensation. 1446 kg of bamboo
(moisture content (MC) of 30%) were used to generate 315 kg
Chapter 8 Waste-to-biochar
biochar, 12 kg ash (ASH), and 900 L bio oil with the heat supplied
using 279 kg firewood. The composition and heating value of
biochar were 8.5% (MC), 7.7% (VM), 81% (FC), and 11.3% (ASH),
and 30,347 kJ/kg, respectively.
Retorts are a type of kiln that can be designed in a semibatch
or continuous mode. A typical retort design is the container retort
(Rodrigues & Junior, 2019). The container retort consists of a
metallic cylinder (container with holes at the bottom serving as
hot gas inlets) that is placed in a thermal insulation system
(masonry or a metal structure with ceramic-fiber) using a hoisting
mechanism. There is a combustion chamber at the bottom of the
system to supply the process heat by combusting, e.g., forest residues. One of the possible improvements made to the container
retort is about creating and connecting lateral fissures to an
exhaust system and applying valves to control the airflow and water for cooling. The gas product of the process can be utilized to
generate electricity or to dry the feedstock. Major advantages of
container retorts include efficient carbonization and cooling,
reduced contamination of biochar by earth, and easy integration
for heat and electricity recovery and process monitoring
(Rodrigues & Junior, 2019). However, container kilns have such
disadvantages as relatively high capital and operation and
maintenance costs and limited scales.
Biochar production is nowadays often produced using modern reactors of relatively high technology and control levels.
Some of the typical pyrolysis reactor types include the auger
type, fluidized bed type, ablative type, cyclonic type, rotating
cone type, and entrained flow type. It was recommended that
fluidized bed and auger reactors will be of greater potential for
widespread commercial applications considering two major
factors, i.e., technology strength and market attractiveness
(Fig. 8.4). This chapter will focus on the two types of reactors.
Auger reactor applies a screw rotating in an enclosed shell to
convey particles into a reaction vessel and to evacuate the solid
residues of the process. In the reactor, feedstock particles can be
well mixed and a close interaction between the particles and the
heating wall can be achieved. This enables good axial dispersion,
and the feedstock particles experience relatively uniform heating. Fig. 8.5 shows a typical single-auger reactor where the wall
is heated. The residence time can be controlled by adjusting
the speed of the auger and the flow rate of inert gas. Some of
the major advantages of auger reactors include (a) flexible control of mass flow rate and residence time to allow slow and fast
pyrolysis, respectively, (b) complete and uniform heat transfer
by using heat carriers and/or catalysts, (c) facilitating solid
151
152
Chapter 8 Waste-to-biochar
Figure 8.4 Strength and attractiveness of several pyrolysis technologies (Campuzano et al., 2019).
Figure 8.5 A schematic diagram of an auger type pyrolysis system (Campuzano et al., 2019).
Chapter 8 Waste-to-biochar
fraction separation, (d) being suitable for processing waste
mixture and feedstock of different typology and sizes,
(e) nondilution of gas product, (f) being suitable for decentralized, mobile applications, (g) a low specific reactor size and
high energy efficiency, (h) reduced inert gas usage, and
(i) efficient feedstock particle treatment (Campuzano et al.,
2019). On the other hand, the major disadvantages include
(a) risks of plugging and mechanical wear and corrosion especially under a high temperature condition, (b) a risk of flowinduced segregation reducing the effectiveness of mixing, and
(c) limited mixing at the radial direction. To improve the energy
efficiency of the process, the gas product can be combusted to
supply heat to sustain the pyrolysis process.
For the pyrolysis based on single auger reactors, the enthalpy
(indicating the heat requirement of the pyrolysis process) was in
the range between 1.1 and 1.9 MJ/kg for a variety of feedstocks
such as waste tires, cedar pine, willow, and bamboo (Martínez
et al., 2013; Yang et al., 2013). This wide variation is attributed to
the influences of the variations in temperature, system pressure,
heating rates, residence time, carrier gas mass flow, reactor malfunctions (heat losses), etc.
A twin-screw configuration with two intermeshing screws has
been developed to improve the effectiveness of the mixing
between feedstock particles and heat carriers (e.g., steel balls,
silicon carbide, fine or coarse sand, and ceramic pellets) and to
promote feedstock devolatilization. The twin-screw configuration
also serves to mitigate the problems of clogging and the problems
related to secondary reactions due to prolonged residence time.
Fluidized bed reactors can be used to achieve relatively uniform heating via the formation of a particle suspension and
enhanced gasesolid contacting. For the fluidized bed reactors,
the enthalpy was reported to range from 0.8 0.2 to
1.6 0.3 MJ/kg-dry for such feedstocks as oak, oat hulls, pine,
and corn stover (Daugaard & Brown, 2003). As a result, the biochar
produced using fluidized bed reactors can be of high quality. Biochar recovered from sawdust of radiata pine using a bench-scale
fluidized bed pyrolysis systems (Fig. 8.6) achieved an HHV of
26 MJ/kg (Kang et al., 2006). The sawdust was fed into the reactor
using two screw feeders. The fluidized bed with a bed material of
sand was heated using an electric heater. The biochar was collected
using a separation system consisting of a cyclone for biochar particles >10 mm and three cylindrical ceramic filters for particles
down to around 1 mm. A series of quenching columns (a minimum
temperature of 30 C) were used for cooling the gas product.
153
154
Chapter 8 Waste-to-biochar
Figure 8.6 A schematic diagram of a bench-scale fluidized bed pyrolysis
system (Kang et al., 2006).
Chlorella vulgaris (a type of microalgae) remnants after
solvent extraction were used in a bench-scale fluidized bed fast
pyrolysis system for biochar production (Wang et al., 2013).
The system was heated using a clamshell heater and used silica
particles with an average diameter of 0.55 mm as the sand bed
material. Two gas cyclones were used to collect the biochar,
while bio oil was collected using two condensers (20 C), followed
by an electrostatic precipitator, and another condenser (1 C).
A biochar yield of 31 wt.% was achieved, representing 36% of
the energy content of the feedstock and the biochar was rich in
inorganic content such as potassium, phosphorous, and
nitrogen.
2.3 Gasification
Conventionally, gasification has been mainly applied to produce syngas. Recent findings of biochar research and
Chapter 8 Waste-to-biochar
155
applications, particularly the significant carbon saving potential
upon biochar soil applications, stimulate the development of
the gasification systems featured by a balance of syngas and biochar production for optimal economic viability and carbon
saving potential (You et al., 2017). The quality and relative yields
of syngas and biochar can be adjusted by controlling the key
gasification process parameters such as temperature, types and
flow rate of gasifying agent (i.e., ER), and reactor design. Additionally, they can also be affected by the types and composition
of feedstocks. Fig. 8.7 shows that the biochar yield of gasification
generally is in the range of 0%e20%, less than that (w20%e50%)
of pyrolysis. Moreover, increasing gasification temperature
generally decreases the yield of biochar due to the enhanced
oxidation reactions consuming more carbon. However, as
compared to pyrolysis, gasification can potentially achieve a
higher rate of energy recovery and a reasonably high yield of biochar. For example, experiments conducted using 150e350 kWe
downdraft gasifiers at 900e1100 C and rice husk as the feedstock
achieved a biochar yield of ca. 35% (Shackley et al., 2012).
Small- to medium-scale gasification-based biochar production systems (a few kW to 3 MW) have been constructed with
fixed bed reactors for systems <200 kW and bubbling fluidized
bed or circulating fluidized bed reactors for 200e3000 kW (You
et al., 2019). The economic viability of gasification-based biochar
systems needs to be improved by enhancing the valorization of
biochar. One decentralized gasification system in suburban
Figure 8.7 Gasification biochar yields with respect to temperature, the types of feedstocks, and gasifying agents.
The red (gray in print version) dash lines denote the biochar yield range of pyrolysis (You et al., 2017).
156
Chapter 8 Waste-to-biochar
Beijing was built to supply cooking gas (4.50 102 million m3/
year (LHV ¼ 14.7 MJ/m3)) to 387 households with biochar (27
tonnes/year) being a by-product for sale. However, the cost of
raw material (woody biomass) and the relatively low system
efficiency made the development economically unsustainable.
3. Biochar system design
The potential of biochar valorization is linked to the profitability of the biochar production systems which can be promoted by diversifying the income sources of waste treatment.
It was shown that a biochar price of 14e112 USD/tonne could
reduce the electricity cost by 2.5%e20% and increase the net
present value by 0.336e3.752 million USD for a 5 MWe gasification system (for CNY to USD exchange rate of 0.14 in 2019)
(Huang et al., 2019). The governmental subsidies and the actual
“market” values of the products recovered from waste also define
the income flow of a biochar production system. A high economic value in biochar is needed to cover the cost of biomass
collection and to ultimately promote sustainable biomass use,
especially when the opportunity cost of labor in biomass/waste
collection is considered (You et al., 2020). A previous study
showed that a biochar price as high as 238 USD/tonne was
needed to ensure that a straw pyrolysisebased biocharelectricity production was as profitable as a gasification-based
electricity production (Clare et al., 2015). The biochar price definition becomes even more tricky when the deployment of biochar production happens in rural areas because the pricing of
biochar needs to balance among the agronomic impact of biochar, the economic benefit received by rural residents (who
contribute waste biomass for biochar production) from the
deployment, and the economic viability of biochar production
systems (You et al., 2020). Insufficient economic stimulus might
lead to limited participation of rural households, rendering the
operation of the system unsustainable. Meanwhile, the agronomic effects of biochar are closely associated with the physicochemical properties of biochar and thus with the conditions of
thermochemical processes. Hence, the optimization of the quality and yield of biochar through accurate process control will be
needed for defining a biochar price that caters to the needs of
different stakeholders. Finally, as illustrated by Fig. 8.8, the practical implementation of biochar production systems is affected
by their economic, energy, and environmental aspects which
are correlated with each other. For each aspect, various factors
need to be considered for a practical design, rendering the analysis based on the three aspects complex.
Chapter 8 Waste-to-biochar
157
Figure 8.8 A summary of the economic, energy, and environmental aspects of biochar productions systems (You
et al., 2020).
References
Biederman, L. A., & Harpole, W. S. (2013). Biochar and its effects on plant
productivity and nutrient cycling: A meta-analysis. GCB Bioenergy, 5(2),
202e214.
Brachi, P., Chirone, R., Miccio, M., & Ruoppolo, G. (2019). Fluidized bed
torrefaction of biomass pellets: A comparison between oxidative and inert
atmosphere. Powder Technology, 357, 97e107.
Campuzano, F., Brown, R. C., & Martínez, J. D. (2019). Auger reactors for
pyrolysis of biomass and wastes. Renewable and Sustainable Energy Reviews,
102, 372e409.
Cheng, F., Luo, H., & Colosi, L. M. (2020). Slow pyrolysis as a platform for
negative emissions technology: An integration of machine learning models,
life cycle assessment, and economic analysis. Energy Conversion and
Management, 223, 113258.
Chew, J. J., & Doshi, V. (2011). Recent advances in biomass
pretreatmenteTorrefaction fundamentals and technology. Renewable and
Sustainable Energy Reviews, 15(8), 4212e4222.
Chiappero, M., Norouzi, O., Hu, M., Demichelis, F., Berruti, F., Di Maria, F.,
Masek, O., & Fiore, S. (2020). Review of biochar role as additive in anaerobic
digestion processes. Renewable and Sustainable Energy Reviews, 131, 110037.
Clare, A., Shackley, S., Joseph, S., Hammond, J., Pan, G., & Bloom, A. (2015).
Competing uses for China’s straw: The economic and carbon abatement
potential of biochar. Gcb Bioenergy, 7(6), 1272e1282.
158
Chapter 8 Waste-to-biochar
Daugaard, D. E., & Brown, R. C. (2003). Enthalpy for pyrolysis for several types of
biomass. Energy and Fuels, 17(4), 934e939.
Dissanayake, P. D., You, S., Igalavithana, A. D., Xia, Y., Bhatnagar, A., Gupta, S.,
Kua, H. W., Kim, S., Kwon, J.-H., Tsang, D. C. W., & Ok, Y. S. (2020). Biocharbased adsorbents for carbon dioxide capture: A critical review. Renewable
and Sustainable Energy Reviews, 119. https://doi.org/10.1016/
j.rser.2019.109582
Galinato, S. P., Yoder, J. K., & Granatstein, D. (2011). The economic value of
biochar in crop production and carbon sequestration. Energy Policy, 39(10),
6344e6350.
Gan, Y. Y., Ong, H. C., Chen, W.-H., Sheen, H.-K., Chang, J.-S., Chong, C. T., &
Ling, T. C. (2020). Microwave-assisted wet torrefaction of microalgae under
various acids for coproduction of biochar and sugar. Journal of Cleaner
Production, 253, 119944.
Genesio, L., Miglietta, F., Baronti, S., & Vaccari, F. P. (2015). Biochar increases
vineyard productivity without affecting grape quality: Results from a four
years field experiment in Tuscany. Agriculture, Ecosystems and Environment,
201, 20e25.
Huang, Y., Zhao, Y., Hao, Y., Wei, G., Feng, J., Li, W., Yi, Q., Mohamed, U.,
Pourkashanian, M., & Nimmo, W. (2019). A feasibility analysis of distributed
power plants from agricultural residues resources gasification in rural China.
Biomass and Bioenergy, 121, 1e12.
Huggins, T. M., Pietron, J. J., Wang, H., Ren, Z. J., & Biffinger, J. C. (2015).
Graphitic biochar as a cathode electrocatalyst support for microbial fuel
cells. Bioresource Technology, 195, 147e153.
Kang, B.-S., Lee, K. H., Park, H. J., Park, Y.-K., & Kim, J.-S. (2006). Fast pyrolysis
of radiata pine in a bench scale plant with a fluidized bed: Influence of a
char separation system and reaction conditions on the production of bio-oil.
Journal of Analytical and Applied Pyrolysis, 76(1e2), 32e37.
Kung, C.-C., McCarl, B. A., & Cao, X. (2013). Economics of pyrolysis-based energy
production and biochar utilization: A case study in Taiwan. Energy Policy, 60,
317e323.
Lehmann, J. (2007). A handful of carbon. Nature, 447(7141), 143e144.
Li, F., Cao, X., Zhao, L., Yang, F., Wang, J., & Wang, S. (2013). Short-term effects
of raw rice straw and its derived biochar on greenhouse gas emission in five
typical soils in China. Soil Science and Plant Nutrition, 59(5), 800e811.
Li, Z., Gu, C., Zhang, R., Ibrahim, M., Zhang, G., Wang, L., Zhang, R., Chen, F., &
Liu, Y. (2017). The benefic effect induced by biochar on soil erosion and
nutrient loss of slopping land under natural rainfall conditions in central
China. Agricultural Water Management, 185, 145e150.
Martínez, J. D., Murillo, R., García, T., & Veses, A. (2013). Demonstration of the
waste tire pyrolysis process on pilot scale in a continuous auger reactor.
Journal of Hazardous Materials, 261, 637e645.
Pala, M., Kantarli, I. C., Buyukisik, H. B., & Yanik, J. (2014). Hydrothermal
carbonization and torrefaction of grape pomace: A comparative evaluation.
Bioresource Technology, 161, 255e262.
Patel, M., Oyedun, A. O., Kumar, A., & Doucette, J. (2019). The development of a
cost model for two supply chain network scenarios for decentralized
pyrolysis system scenarios to produce bio-oil. Biomass and Bioenergy, 128,
105287.
chal, F. (2014).
Peduzzi, E., Boissonnet, G., Haarlemmer, G., Dupont, C., & Mare
Torrefaction modelling for lignocellulosic biomass conversion processes.
Energy, 70, 58e67.
Chapter 8 Waste-to-biochar
Qian, K., & Kumar, A. (2015). Reforming of lignin-derived tars over char-based
catalyst using Py-GC/MS. Fuel, 162, 47e54.
Qin, X., Wang, H., Liu, C., Li, J., Wan, Y., Gao, Q., Fan, F., & Liao, Y. (2016). Longterm effect of biochar application on yield-scaled greenhouse gas emissions
in a rice paddy cropping system: A four-year case study in south China. The
Science of the Total Environment, 569, 1390e1401.
ry, J.-S. (2011). Mathematical modelling of a
Ratte, J., Fardet, E., Mateos, D., & He
continuous biomass torrefaction reactor: TORSPYDTM column. Biomass and
Bioenergy, 35(8), 3481e3495.
Rodrigues, T., & Junior, A. B. (2019). Charcoal: A discussion on carbonization
kilns. Journal of Analytical and Applied Pyrolysis, 143, 104670.
Roy, P., & Dias, G. (2017). Prospects for pyrolysis technologies in the bioenergy
sector: A review. Renewable and Sustainable Energy Reviews, 77, 59e69.
Sangsuk, S., Suebsiri, S., & Puakhom, P. (2018). The metal kiln with heat
distribution pipes for high quality charcoal and wood vinegar production.
Energy for Sustainable Development, 47, 149e157.
Shackley, S., Carter, S., Knowles, T., Middelink, E., Haefele, S., Sohi, S., Cross, A.,
& Haszeldine, S. (2012). Sustainable gasificationebiochar systems? A casestudy of rice-husk gasification in Cambodia, Part I: Context, chemical
properties, environmental and health and safety issues. Energy Policy, 42,
49e58. https://doi.org/10.1016/j.enpol.2011.11.026
Smith, P. (2016). Soil carbon sequestration and biochar as negative emission
technologies. Global Change Biology, 22(3), 1315e1324.
Sohi, S. P., Krull, E., Lopez-Capel, E., & Bol, R. (2010). A review of biochar and its
use and function in soil. Advances in Agronomy, 105, 47e82.
Tumuluru, J. S., Boardman, R. D., Wright, C. T., & Hess, J. R. (2012). Some
chemical compositional changes in miscanthus and white oak sawdust
samples during torrefaction. Energies, 5(10), 3928e3947.
Wang, K., Brown, R. C., Homsy, S., Martinez, L., & Sidhu, S. S. (2013). Fast
pyrolysis of microalgae remnants in a fluidized bed reactor for bio-oil and
biochar production. Bioresource Technology, 127, 494e499.
Wang, D., Jiang, P., Zhang, H., & Yuan, W. (2020). Biochar production and
applications in agro and forestry systems: A review. The Science of the Total
Environment, 723, 137775.
Wang, L., Li, L., Cheng, K., Ji, C., Yue, Q., Bian, R., & Pan, G. (2018). An
assessment of emergy, energy, and cost-benefits of grain production over 6
years following a biochar amendment in a rice paddy from China.
Environmental Science and Pollution Research, 25(10), 9683e9696.
Yang, H., Kudo, S., Kuo, H.-P., Norinaga, K., Mori, A., Masek, O., & Hayashi, J.
(2013). Estimation of enthalpy of bio-oil vapor and heat required for
pyrolysis of biomass. Energy and Fuels, 27(5), 2675e2686.
You, S., Ho, S. W., Li, T., Maneerung, T., & Wang, C.-H. (2019). Techno-economic
analysis of geopolymer production from the coal fly ash with high iron oxide
and calcium oxide contents. Journal of Hazardous Materials, 361. https://
doi.org/10.1016/j.jhazmat.2018.08.089
You, S., Li, W., Zhang, W., Lim, H., Kua, H. W., Park, Y.-K., Igalavithana, A. D., &
Ok, Y. S. (2020). Energy, economic, and environmental impacts of
sustainable biochar systems in rural China. Critical Reviews in
Environmental Science and Technology, 1e29.
You, S., Ok, Y. S., Chen, S. S., Tsang, D. C. W., Kwon, E. E., Lee, J., & Wang, C.-H.
(2017). A critical review on sustainable biochar system through gasification:
Energy and environmental applications. Bioresource Technology. https://
doi.org/10.1016/j.biortech.2017.06.177
159
160
Chapter 8 Waste-to-biochar
Zhang, A., Bian, R., Li, L., Wang, X., Zhao, Y., Hussain, Q., & Pan, G. (2015).
Enhanced rice production but greatly reduced carbon emission following
biochar amendment in a metal-polluted rice paddy. Environmental Science
and Pollution Research, 22(23), 18977e18986.
Zhang, X., Zhang, S., Yang, H., Feng, Y., Chen, Y., Wang, X., & Chen, H. (2014).
Nitrogen enriched biochar modified by high temperature CO2eammonia
treatment: Characterization and adsorption of CO2. Chemical Engineering
Journal, 257, 20e27.
Zheng, R., Chen, Z., Cai, C., Tie, B., Liu, X., Reid, B. J., Huang, Q., Lei, M.,
_
_ E. (2015). Mitigating heavy metal accumulation into
Sun, G., & Baltrenait
e,
rice (Oryza sativa L.) using biochar amendmentda field experiment in
Hunan, China. Environmental Science and Pollution Research, 22(14),
11097e11108.
System design: costebenefit
analysis
9
Abstract
This chapter explains the mathematical principles and factors of costbenefit analysis and covers various main cost and benefit components
associated with waste-to-resource development. It provides a systematic
database about the major cost and benefit components of different types
of waste-to-resource systems. This chapter emphasizes the importance
of waste collection and transportation to the economics of waste-toresource development and explains two existing models of waste
collection and transportation. It concludes on reviewing the existing
studies about the economic feasibility of the different types of waste-toresource systems and highlighting the critical factors associated with the
economic feasibility.
Keywords: CAPEX; Cost-benefit analysis; Economic feasibility; External
costs; OPEX; Waste collection and transportation.
1. Introduction
Economics is one of the most important performance indicators determining the desirability and sustainability of a
waste-to-resource project. It needs to be evaluated well before
the implementation of a project so that the decision is informed
with optimal process and system design to ensure maximum
profitability and continuous profit along the operation of the
project. Costebenefit analysis (CBA) has been commonly used
to evaluate the economic feasibility of a project, technology, or
system. It gathers all the monetized costs and benefits associated with the development, maintenance, and operation of a
project over its lifetime and estimates one or a few economic
parameters (e.g., net-present value (NPV), costebenefit ratio
(CBR), and internal rate of return (IRR)) as a measurement of
economic feasibility. This chapter introduces the mathematical
principles of CBA and provides a systematic database about
the major cost and benefit components of the waste-to-resource
technologies introduced previously. Finally, the economics of
existing waste-to-resource development is explained and
discussed.
Waste-to-Resource System Design for Low-Carbon Circular Economy. https://doi.org/10.1016/B978-0-12-822681-0.00011-6
Copyright © 2022 Elsevier Inc. All rights reserved.
161
162
Chapter 9 System design: costebenefit analysis
2. Mathematical principles
2.1 Economic indicators
NPV, CBR, and IRR are commonly calculated in CBA as direct
indicators of the profitability of a process, technology, or system
under study. To estimate the NPV, all cash flows of a project over
a chosen period are resolved to their equivalent present date cash
flows. Costs/expenses and revenues/incomes are taken as negative and positive cash flows, respectively. NPV is calculated using
(You et al., 2016)
NPV ¼
LT
X
t
Ct
C0
ð1 þ rÞt
(9.1)
where Ct is the net cash inflow during a year t; C0 is the total initial
capital investment (or CAPEX); LT denotes the lifetime of the project; r is the discount rate in the range between 5% and 15%. A
near-zero discount rate means future benefits and costs are worth
about the same as today. A positive NPV suggests that a given project is profitable.
CBR denotes the ratio between the overall cost and overall
benefits of a project and is calculated by
!
LT
X
Cet
(9.2)
CBR ¼
þ C0 =NPV
ð1 þ rÞt
t
where Cet is the expenditure cost (e.g., operation and maintenance costs and external (emission) cost) during a year t. A CBR
less than one suggests a project is profitable. IRR refers to as a discount rate that corresponds to a zero NPV as shown in Eq. (9.1).
IRR can be calculated using an algorithm provided by relevant
software platform (e.g., “irr” in MATLAB). A high IRR suggests
that the project is more economically viable. Additionally, some
other indicators specific to the waste-to-resource development
can also be estimated, such as the minimum ethanol selling price
(MESP) for waste-to-bioethanol development, hydrogen cost for
waste-to-biohydrogen development, and levelized cost of energy
(LCOE: the average net present cost of energy generation for a
plant over its lifetime).
2.2 Cost and benefit components
Data compilation is the most critical stage in CBA. In many
cases, cost and benefit data specific to a project under analysis
is not available and existing data reported in the literature need
to be updated and/or used. Assumptions may need to be made
Chapter 9 System design: costebenefit analysis
to identify approximate data for the analysis. For example, the
construction costs reported in literature are often for past years
and need to be updated to the current year, e.g., using Chemical
Engineering Plant Cost Index (CEPCI) as
Costi ¼ Costj CEPCIi =CEPCIj
(9.3)
where i and j denote the current year and base year, respectively.
The value of CEPCI could be obtained via various online sources
(e.g., https://www.chemengonline.com/). Economies of scale
need to be considered especially when the scale of the system
under analysis is significantly different from the existing ones
whose capital costs are to be used in the analysis. There is limited
understanding of the impact of system scale toward the unit cost
of waste-to-resource development. Approximate relationships
have been applied to consider the scale dependence of facility
cost (You et al., 2016); for example,
f
Costk ¼ Costi ðSk =Si Þ
(9.4)
where k and i denote the designed system scale and base system
scale (corresponding to the system reported in literature where
relevant cost data will be used), respectively. f is the scaling factor
typically ranging between 0.6 and 0.8.
For the CBA of typical waste-to-resource development, the
following cost and benefit components need to be considered:
(1) the capital cost (or CAPEX) being the initial investment of constructing a treatment plant; (2) the operation and maintenance
(O&M) cost (or OPEX) being the sum of all the costs required
for running the plant; (3) the collection and transportation
(C&T) cost being the cost resulting from collecting all waste
and transporting it to the treatment facility; the revenues from
the sale of (4) products (e.g., electricity, heat, chemicals, etc.);
(5) gate fees denoting the revenue from the disposal of the waste;
(6) the revenue due to a carbon tax. The specific data for some of
the components such as CAPEX, O&M, and C&T are relatively
difficult to gather. Assumptions and justifications need to be
made to consider the reported data as approximates. The estimation of C&T is even more tricky as it is linked to actual logistics
arrangement of waste collection. Meanwhile, C&T can be one of
the major contributors (up to 80%) to the overall cost of a
waste-to-resource development (Ascher et al., 2020).
2.3 Waste collection and transportation
Models have been developed to quantify the energy and
resource requirements during waste collection and transportation. ORWARE (ORganic WAste REsearch) is a model that can
163
164
Chapter 9 System design: costebenefit analysis
be used to estimate the emissions to air and water, energy turnover, and the amount of residues returned to arable land during
the handling of organic waste in urban areas (Dalemo et al.,
1997). It was shown that the model predictions fell within 5%
e14% of actual numbers for energy consumption and 10%e24%
for time consumption. Major processes and elements of organic
waste management are considered in this model including
sewage plant, incineration, landfill, compost, anaerobic digestion,
truck transportation, transportation by sewers, residue transportation, and spreading of residues on arable land. Within the
main model, there is a dedicated transportation submodel for
calculating the time and energy consumption during the collection of waste with compacting trucks. The submodel is based on
(i) the statistics of the average distance from a residential area
to the treatment facility/transfer station, fuel consumption per
km for the truck and the average load and speed, and (ii) the
time and energy consumption data related to the extra work
that is performed on account of stopping and emptying bins
(Sonesson, 2000).
The model considers various factors affecting the fuel consumption and time requirements such as the distance driven,
the number of stops that must be made for picking up the
waste, the energy required for lifting the bins and compacting
the waste, the number of traffic-related stops, speed limits, the
type of truck used and fuel, etc. Specifically, it assumes that the
distance driven and the number of stops are independent variables, and that the energy needed for lifting the bins and compacting the waste is proportional to the number of stops. The model
also defines three different types of collecting areas, i.e., urban,
suburban, and rural areas, to differentiate traffic situations. The
total driving distance consists of the one from hauling to and
from the collection area and to the treatment or transfer station
and the one during collection. It is estimated based on the frequency of truck stops (km between stops during collecting), the
distance between collection area and unloading point, and the
amount of waste collected. The fuel consumption is estimated by
summing the one related to the distance driven (the distance
the average fuel consumption per km þ the number of stops
fuel consumption per stop) and the one related to the extra stops
due to emptying garbage bins. The time requirement is the sum
of the time for hauling (the total hauling distance/the average speed
during hauling), driving during collection (the driving distance during collection/the average speed during collection), and for
emptying bins (the number of stops the time per stop).
The more recent MSW-collect model appears to be of greater
accuracy as compared to the ORWARE model and can be used to
estimate the diesel and truck time requirement per tonne of
Chapter 9 System design: costebenefit analysis
165
Figure 9.1 Schematic of MSW-Collect. A truck’s run starts at the truck depot “start/end” (Edwards et al., 2016).
waste collected (Edwards et al., 2016). As shown in Fig. 9.1, this
model divides the waste collection process into three main stages,
i.e., “stop/go” referring to the acceleration/deceleration a truck
makes as it drives between stops, “haul to unload” referring to
the travel made by the truck to unload the waste including both
urban and freeway driving, and “unload to collection” referring
to the travel reversing to “haul to unload.” MSW-Collect improves
ORWARE by further differentiating lift and “stop/go” during waste
collection and the urban and freeway driving during haul, which
facilitates the use of contemporary time and fuel requirement
data for charactering different waste collection regimes.
Geographic information system software is also used to improve
the estimation of the distance data.
The modeled time requirement can be used to estimate the
number of trucks required for waste collection and transportation. The CAPEX and O&M (including staff wage and the size of
each truck) of truck operation can be further calculated by
considering the unit CAPEX of truck and the annual O&M cost
per truck operation. The annual truck fuel cost is estimated based
on the modeled fuel requirement and the price of fuel. It is worth
noting that for any trucks and fuel purchased in the future, their
costs need to be discounted to current time for CBA.
2.4 CAPEX and O&M
The CAPEX and O&M cost of waste-to-resource development
account for two of the major cost components. Table 9.1 summarizes some of the reported CAPEX and O&M cost for various types
of waste-to-resource systems. The numbers in Table 9.1 are indicative only as they were linked to the actual design of a system
considered in original studies. Readers are encouraged to check
the original sources of the data for evaluating their suitability for
a given CBA study.
166
Chapter 9 System design: costebenefit analysis
Table 9.1 System CAPEX and O&M cost for different waste-to-resource systems.
Type
Technology
CAPEX
O&M cost
Reference(s)
Waste-toenergy
Anaerobic
digestion
500 EUR/kW
(100 kWe, year 2015)
7% (O&M/CAPEX)
Gasification
250e850 USD/tonne
of MSW per year
(year 2017)
400e700 USD/tonne
of MSW per year
(year 2017)
9800 USD/tonne of
hydrogen production
per year (42,077.75
tonne hydrogen/year,
year 2022)
533 USD/tonne of
hydrogen production
per year (3 tonne
hydrogen/day,
year 2016)
11 million EUR
(90 kg/h hydrogen
production, year 2017)
45e85 USD/tonne
of MSW/year
Ascher
et al. (2020);
Renda et al. (2016)
Haraguchi
et al. (2019)
50e80 USD/tonne
of MSW per year
Haraguchi et al.
(2019)
Pyrolysis
Waste-toGasification
biohydrogen
Dark
fermentation
Steam
gasification
Waste-tobiomethane
Anaerobic
digestion
Waste-tobioethanol
Saccharification
and
fermentation
1819 USD/tonne of
Lee (2016)
hydrogen production
per year (42,077.75
tonne hydrogen/year,
year 2022)
88,298.1 USD/year
Han et al. (2016)
(3 tonnes
hydrogen/day,
year 2016)
4.36 million EUR/annum Yao et al. (2017)
(90 kg/h hydrogen
production,
year 2017)
413 kEUR/year
Budzianowski and
(920,723 Nm3/year,
Budzianowska
year 2015)
(2015)
0.1 kEUR/m3
(Near-atmospheric
digester, year 2015);
0.12 kEUR/m3
(Pressurized digester,
year 2015); 230
kEUR/MW (Biogas
upgrading unit, year
2015); 0.03 kEUR/(Nm3/h
biogas) (Biogas cleaning
unite, year 2015)
1305.6 USD/kL of
163.32 million USD
bioethanol
(Bioethanol production:
(Bioethanol
100,000 kL/year,
production:
year 2019)
100,000 kL/year,
year 2019)
Kang et al. (2019)
Chapter 9 System design: costebenefit analysis
167
Table 9.1 System CAPEX and O&M cost for different waste-to-resource
systems.dcontinued
Type
Technology
Waste-tobiodiesel
5.885 million USD
13,793 kUSD (without
Esterification
(without acetone as
acetone as a
and
a cosolvent, 4400
cosolvent, 4400 biodiesel
transesterification
biodiesel tonne/year,
tonne/year, year 2018);
year 2018); 6.612
15,213 kUSD (with
million USD (with
acetone as a cosolvent,
acetone as a
4400 biodiesel
cosolvent, 4400
tonne/year,
biodiesel tonne/year,
year 2018)
year 2018)
7.6 million USD
Pyrolysis
76.7 million USD
(16.8e21.3 kilotonne
(16.8e21.3 kilotonne of
of biochar, year
biochar, year 2015)
2015)
w240,000
Gasification
785,000e835,000 USD
e252,000 USD/year
(capacity ¼ 0.32 dry
(capacity ¼ 0.32 dry
tonne/h of woody
tonne/h of woody
biomass, year 2019)
biomass, year 2019)
189 EUR/tonne
Torrefaction
33.63 million EUR
(capacity ¼ 79,200
(capacity ¼ 79,200
tonne/annum, year
tonne/annum,
2018)
year 2018)
Waste-tobiochar
CAPEX
O&M cost
In addition to the main reactors associated with the technologies, upstream pretreatment (e.g., drying and milling) and downstream upgrading units are often needed for practical
deployment. The concrete composition depends on the types of
technologies and the configuration design of a specific development
to meet the needs of end users. For example, in the economic analysis of a fermentative biohydrogen production plant (1095 tonne
food waste treated annually), the CAPEX included the costs of equipment (e.g., blender (16,918 USD), reactor (24,169 USD), fermenter
(9668 USD), centrifuge (87,009 USD), sludge pretreatment equipment (19,335 USD), constant temperature incubator (835 USD),
and purification unit (21,056 USD)), equipment installation
(52,645 USD), piping (31,587 USD), electrical systems
(21,058 USD), buildings (52,645 USD), service facilities (26,322),
yard improvements (10,529 USD), instrumentation and controls
(21,058 USD), engineering and supervision (31,587 USD),
Reference(s)
Tran et al. (2018)
Cheng et al. (2020)
Sahoo et al. (2021)
Doddapaneni et al.
(2018)
168
Chapter 9 System design: costebenefit analysis
construction expenses (42,116 USD), legal expenses (10,529 USD),
contractor’s fees (15,793 USD), and contingency (52,645 USD)
(Han et al., 2016). Yao et al., 2017, studied the economics of steam
gasificationebased hydrogen production which comprises a
water-gas shift reactor, a rapeseed methyl ester scrubber, and a
PSA unit in addition to the main dual fluidized bed steam gasification reactor. The associated annual OPEX included the costs of
raw materials (1,195,040 EUR/year), operating labor (350,000
EUR/year), utilities (491,920 EUR/year), employee benefits
(77,000 EUR/year), supervision (35,000 EUR/year), laboratory
(35,000 EUR/year), maintenance (726,000 EUR/year), insurance
and taxes (363,000 EUR/year), operating supplies (363,000
EUR/year), plant overhead (121,000 EUR/year), and depreciation
(605,000 EUR/year). In the economic analysis of an AD-based
biomethane production system (capacity ¼ 1.1445 MW), the
accounting of CAPEX included such components as a digester
(300 kEUR), biogas upgrading unit (263 kEUR), biomass storage
and preparation unit (200 kEUR), buildings and logistic infrastructure (300 kEUR), installations (350 kEUR), transportation
means (40 kEUR), and permission and management (250
kEUR) (Budzianowski & Budzianowska, 2015). The accounting
of OPEX included such components as feedstock (maize silage
31 EUR/tonne), digestate handling (8 EUR/tonne for transporting, drying, packaging, and distribution), labor (45 kEUR/(personnelyear)), water and service cost of an upgrading unit (45
kEUR/year), services (14 kEUR/year for safety, legal, technical,
and telecommunication), insurance (14 kEUR/year), taxes (11
kEUR/year), and others (10 kEUR/year for electricity, water, management, consumables, etc.). An integrated process consisting of
a pretreatment, hydrolysis and fermentation, and purification
stage was proposed to generate bioethanol from Miscanthus sacchariflorus (Kang et al., 2019). As shown in Fig. 9.2, the system
consists of such equipment as hoppers, a twin-screw extruder,
a buffer tank, an ethanol scant reagent feeder, a hydrolysis and
fermentation tank, a solvent recovery system, an NaOH tank, a
distillation unit, and a dehydration unit. The CAPEX components
of the development (capacity ¼ 100,000 kL of bioethanol)
included land (20 million USD), structure and housing (10
million USD), pretreatment (12.1 million USD), saccharification
and fermentation (4.07 million USD), chemical recovery (12.1
million USD), distillery and solid recovery (14.3 million USD),
wastewater treatment (33 million USD), storage (3.3 million),
boiler and turbogenerator (49.5 million USD), and utilities (4.95
million USD). The OPEX components included raw material
(561.2 USD/kL), enzymes (328 USD/kL), chemical (64 USD/kL),
wastewater treatment (72 USD/kL), cooling water (7.3 USD/
Chapter 9 System design: costebenefit analysis
169
Figure 9.2 A schematic diagram of the bioethanol production process considered in CBA (Kang et al., 2019).
kL), electricity (15.2 USD/kL), steam (200.9 USD/kL), labor
(284.1 USD/kL), and depreciation (97 USD/kL).
In the CBA of a biodiesel production system (capacity ¼ 4400 tonne/year, Fig. 9.3) based on grease trap waste (GTW)
in Adelaide, Australia, the considered CAPEX components included
storage tanks (GTW tanks (219.78 kUSD), an Hexane tank (219.78
kUSD), an ETOH tank (162.44 kUSD), a KOH tank (16.58 kUSD),
an H2SO4 tank (21.82 kUSD), an Acetone tank (127.30 kUSD), a
B100 tank (254.60 kUSD), a K2SO4 tank (31.02 kUSD)), reactors
(esterification reactor (45.01 kUSD), transesterification reactor
(45.01 kUSD), and an neutralization reactor (13.31 kUSD)),
Figure 9.3 The system composition of the biodiesel plant using a cosolvent of acetoneeethanol considered in
CBA (Tran et al., 2018).
170
Chapter 9 System design: costebenefit analysis
separation facilities (evaporators (413.60 kUSD), distillation columns (137.87 kUSD), liquideliquid extractors (413.60 kUSD), and
a fractional distillation column (1378.68 kUSD)), other equipment
(mixing units (41.71 kUSD), heat exchangers (358.06 kUSD), and
pumps (60.38 kUSD)), other direct costs (5280 kUSD), total indirect
costs (4158 kUSD), and working capital (2475 kUSD) (Tran et al.,
2018). The components of OPEX included raw materials (0.983
million USD/year), operating labor (0.346 million USD/year), operating supervision (0.052 million USD/year), utilities (0.728 million
USD/year), maintenance and repairs (0.785 million USD/year),
operating supplies (0.118 million USD/year), laboratory charges
(0.052 million USD/year), royalties (0.066 million USD/year), variable cost (3.13 million USD/year), taxes (0.262 million USD/year),
financing (0.763 million USD/year), insurance (0.131 million
USD/year), depreciation (0.785 million USD/year), fixed charges
(1.94 million USD/year), plant overhead (0.71 million USD/year),
manufacturing cost (5.78 million USD/year), administration
(0.237 million USD/year), distribution and selling (0.331 USD/
year), research and development (0.264 million USD/year), and
general expense (0.832 million USD/year).
2.5 External costs
Although waste-to-resource development is regarded to be
relatively environmentally friendly (or external benefits) as
compared to other conventional waste management technologies such as landfill, they can still bear negative environmental
consequences due to the pollutant emissions into water, air,
and or land. For example, the thermochemical processing of
waste can emit PMs into the environment, leading to the problem
of air pollution (Yao et al., 2018). Incineration-based wasteto-energy plants release various types of pollutants such as SO2
and dioxins which, if not controlled properly, pose a health risk
to workers and surrounding communities. Additionally, the
deployment of a waste-to-resource plant can worsen the traffic
conditions (e.g., congestion) of an associated area and lead to
disamenity to local residents because of unpleasant “odors” or
unsightly perceptions (Jamasb & Nepal, 2010).
The negative environmental impacts can be considered in
CBA by estimating an associated external cost. The external costs
refer to the expenses imposed on society by the environmental
disadvantages (pollution and changes in air, water, and land
environments) of waste-to-resource development that are not
directly reflected in the price of recovered resources (Patrizio
et al., 2017). To estimate the external costs, it is important to firstly
Chapter 9 System design: costebenefit analysis
classify and quantify the socioenvironmental impacts of a project
on ecosystems, human health, natural resources, and other essential categories and then monetize the impacts. The external costs
can also cover the costs associated with the compliance with regulations and standards, and the ones related to compliance failure
such as compensation fines and penalties, punitive damages, etc.
(so-called environmental liabilities) (You & Wang, 2019). It becomes increasingly important for the waste treatment and renewable energy industry to account for the external costs in their
business planning to maintain competitiveness and financial
profitability, as there is a possibility that associated regulations
on socioenvironmental impacts of waste-to-resource development will become increasingly tightened in the future.
The external costs arising from the environmental impacts of
energy production may be nontrivial. For example, between
2005 and 2010, the average external cost of electricity production in the European Union was w6 EURcent/kWh (Streimikiene
& Alisauskaite-Seskiene, 2014). For incineration-based waste-toelectricity development (capacity ¼ 250,000 tonnes), the external
cost related to the damage from the emissions to the air (mainly
NOx and SO2) was estimated to be 50 EUR per tonne of waste
treated and the cost related to the disamenity impact was 8
EUR per tonne of waste treated; for incineration-based wasteto-electricity and -heat development, the corresponding costs
were 28.18 EUR per tonne of waste treated and 8 EUR per tonne
of waste treated, respectively (Jamasb & Nepal, 2010).
Although the estimation of external costs makes the socioenvironmental impacts more comprehensible in the marketplace
and facilitates the formulation of business decisions that are environmental risks-informed, it can be challenging and even lead to
misleading results due to data limitation, significant uncertainties
in the causes and quantification of the impacts, and limited
knowledge on the valorization of the impacts (Patrizio et al.,
2017). However, it is still valuable to carry out the comparative examination of the externalities of different technologies or
methods for decision-making where the impacts of data uncertainty can be effectively mitigated.
2.6 Project incomes
Generally, product sale serves as the major income source
and product valorization plays an important role to improve
the economic feasibility of waste-to-resource development.
This suggests that it is desirable to explore the market value
of main product(s) and coproduct(s) (or by-product(s)).
171
172
Chapter 9 System design: costebenefit analysis
For example, for gasification- and AD-based waste-to-energy
development in the United Kingdom, the sale of electricity
and/or heat is the focus for the system design and a high heat
utilization rate (the percentage of generated heat being sold to
residents) is important for the economic viability of the development. Additionally, income from the sale of by-products such as
biochar and digestate is also key to promote its economic feasibility (Ascher et al., 2019).
To estimate the product sale income, it is necessary to understand (i) the yield and quality of the products and (ii) the market
potential of the products (i.e., the market price and the quantity
of the products that will be potentially sold). Experimental data or
modelling-based analysis are needed to estimate the yield and
quality of products. The quality of products needs to meet certain
standards (e.g., hydrogen purity for fuel cell applications, nutrient
contents of digestate, etc.) and/or the demands of end-users.
However, in many preliminary feasibility analyses, the quality of
coproduct(s) or by-product(s) was not checked, leading to potential uncertainty in the results of CBA. Market surveys may be
needed to understand the market value (sale price) of the products which may vary along the time and/or across regions. For
the sale of energy products (electricity and heat), it may involve
checking associated Feed-in-Tariffs (FiT) and its development
trends (as relevant schemes may change over the lifetime of a
project) in promoting renewable and low-carbon energy generation. For the sale of chemicals, it may involve gathering the price
data of similar products in the market together with associated
quality information. Table 9.2 summarized the prices of some
common products recovered from waste. It is worth noting that
the numbers shown in Table 9.2 are indicative only and the actual
numbers can even fluctuate over time.
Gate fees for the disposal of waste serve as another important
income source. They may depend on the type of waste as well as
the treatment technology adopted. For example, Table 9.3 shows
the UK gate fees reported by local authorities. It shows that for organics treated by AD, the gate fees range from -£5/tonne to £68/
tonne with a median level of £26/tonne. It is expected that the
gate fees will be variable across regions, and it is necessary to
find the most relevant value for CBA.
Governmental regulations may dictate additional economic
incentives to the development of waste-to-resource. For example,
in China, a national electricity subsidy of 0.12 USD/kWh and a
local straw-burning avoiding subsidy of 28 USD/tonne were
available to support pyrolysis-based biochar production from
straw, which significantly improved the economics of biochar
Chapter 9 System design: costebenefit analysis
173
Table 9.2 Reported prices of products recovered from waste.
Product
Price
Country
Year
Reference
Biodiesel
Biohydrogen
Bioethanol
Biochar
Digestate
Biomethane
0.7666 USD/kg (B20)
2.40 USD/kg (fast pyrolysis)
0.36 GBP/L (enzymatic hydrolysis)
3.08 USD/kg
14.4e19.6 USD/MT
0.16 USD/kWh
Brazil
Canada
United Kingdom
e
China
China
2017
2009e2020
2012
2014
2020
2020
Miranda et al. (2018)
Sarkar and Kumar (2010)
Wang et al. (2012)
Alhashimi and Aktas (2017)
Li et al. (2020)
Li et al. (2020)
Table 9.3 The UK gate fees reported by local authorities in 2017 (WRAP, 2018).
Treatment
Materials/Type of
facility/Grade
Median
(£/tonnes)
Mode
Range
No of gate fees
(£/tonnes) (£/tonnes) reported
In-vessel composting
Anaerobic digestion
Waste-to-energy
Waste-to-energy
Waste-to-energy
Organics
Organics
All
Pre-2000 facilities
Post-2000 facilities
49
26
86
57
89
45e50
35e40
85e90
55e60
85e90
production system (Clare et al., 2015). In India, the central
government provided subsidies for developing biogas plants
depending on the initial capacity: for plants between 3 and
20 kW, the Central Financial Assistance subsidies for power and
thermal applications were about 490 USD/kW and 245 USD/kW,
for plants between 20 and 100 kW, they were 419 USD/kW and
210 USD/kW, and for plants between 100 and 250 kW, they were
350 USD/kW and 175 USD/kW (Singh et al., 2020). Under Italy’s
2018 decree for biomethane production, fuel retailers for the
transportation sector are legally obliged to sell a minimum
percentage of biofuel in their fuel blends, and a Certificate of
Emission of Biofuel in Consumption (CIC) is issued for every
10 Gcal (1 Gcal ¼ 4.184 109 J) of biomethane produced
(D’Adamo et al., 2019). Some specific incentives of the decree
include payment of 375 EUR per CIC for a period of 10 years,
doubling the unitary subsidy for advanced biomethane production
9e47
-5e68
33e117
44e94
33e117
34
62
62
20
42
174
Chapter 9 System design: costebenefit analysis
(from e.g., OFMSW and by-products), and offering an additional
premium for producers that also distribute the methane. In
Denmark, the electricity produced based on biogas and biomassbased gasification gas and other fuels is receiving a price supplement: for example, for electricity based on pure biogas or gas
from gasification, two price supplements (0.26 DKK/kWh (0.039
USD/kWh) and 0.10 DKK/kWh (0.015 USD/kWh)) are available
depending on the rules of rate regulation with a settlement price
of 0.793 DKK/kWh (0.12 USD/kWh) (Danish Energy Agency,
2017). In the United States, various laws and incentives have
been in place to promote the production and application of biodiesel. For example, the Biomass Crop Assistance Program
(BCAP) “provides financial assistance to landowners and operators
that establish, produce, and deliver biomass feedstock crops for
advanced biofuel production facilities: a reimbursement of 50%
of the cost of establishing a biomass feedstock crop, as well as
annual payments for up to five years for herbaceous feedstocks
and up to 15 years for woody feedstocks. BCAP also provides
qualified biomass feedstock crop producers matching payments
for the collection, harvest, storage, and transportation of the crops
to advanced biofuel production facilities for up to two years: 1 USD
for each 1 USD per dry ton paid by a qualified advanced biofuel
production facility, up to 20 USD per dry tonne.” (US Department
of Energy, 2021).
Carbon tax is considered as one of the most effective policies
for promoting the effort of decarburization by subsidizing relatively cleaner technologies. The technologies of resource recovery
from waste have the potential to achieve low-carbon resource
production or even negative carbon emissions and thus can
economically benefit from the existence of carbon tax. However,
the carbon tax is still controversial because it imposes costs on
consumers, and it was reported that over half of voters in Washington state opposed a carbon tax in 2018 (Hagmann et al., 2019)
(Carattini et al., 2019). Three rates (40, 60, and 80 USD per tonne of
CO2) were suggested for a hypothetical global carbon tax to be
introduced after 2020, which were consistent with the recommendations by the World Bankesupported High-Level Commission
on Carbon Prices (Carattini et al., 2019).
3. Economic feasibility of waste-to-resource
development
The economics of different waste-to-resource developments
vary significantly depending on the design and socioeconomic
Chapter 9 System design: costebenefit analysis
conditions of system implementation. In general, process efficiencies and product yields play a critical role in defining the
economic feasibility of the developments.
3.1 Waste-to-energy
The profitability of waste-to-energy development is closely
related to the design of waste management strategies. Upon the
comparison of the economic feasibility of an AD-based and an
incineration-based strategy for the United Arab Emirates, the
AD strategy (treating food waste) was economically infeasible
and had an NPV of 127 million USD, while the incineration
strategy (treating food waste and comingled waste) had an NPV
of 181 million USD and a payback period of 19 years (Abdallah
et al., 2018). The inferior economics of the AD strategy was related
to its high digestate disposal cost that was caused by landfilling
the digestate (accounting for 40% of the waste treated and the
use of digestate was restricted by laws) and limited public participation in food waste separation at source. Meanwhile, the incineration strategy benefited from the greater amount of waste
treated and a greater revenue from energy production. The economics of the AD and incineration strategies were mainly affected
by the landfilling cost and electricity tariff. The NPV of the AD and
incineration strategies would increase 57% and 5%, respectively,
for a 10% decrease in the landfilling cost, while they would increase by 27% and 91%, respectively, for a 10% increase in the
tariff.
The cost of efficiency improvement against the economic
gain of waste-to-energy was studied by the CBA of a base case
and its seven modification cases (Eboh et al., 2019). The base
case plant was a municipal heat and power grate boiler fired
by municipal solid waste and industrial waste with an energy
input of 100 MW. Modification 1 (M1) involved the addition of
a flue gas condensation unit; M2 increased the temperature
and pressure of the steam in the process and was added with
an intermediate reheater; M3 was similar to M2 but had flue
gas condensation; M4 was integrated with waste gasification
(gasified at 900 C to produce syngas which was cooled down to
400 C and cleaned prior to combustion in a gas boiler for electricity and heat production). M5 was similar to M4 but had flue
gas condensation; M6 was with two air heaters removed and
added with a high-pressure feed-water heater and a new air heater; M7 was similar to M6 but had flue gas condensation. It was
found that M6 was the best option with the lowest capital cost
per unit increase in efficiency and the second-best alternative
175
176
Chapter 9 System design: costebenefit analysis
for the lowest capital cost per total revenue earned. M1 and M7
were the two best options considering the capital cost per total
unit of revenue generated. M4 and M5 had the highest exergy efficiencies, i.e., 30.1% and 30.5%, respectively, but their capital
investment costs per increase in efficiency were higher than
the other cases. M1 and M7 increased the NPV of the base case
by 30% and 12% due to the significantly higher heat production
via the use of flue gas condensation. The study also showed that
the price of district heat and its maintenance costs significantly
affected the economic viability of the waste-to-energy plant:
49% of the annual income was from the district heat.
3.2 Waste-to-biohydrogen
Okolie et al. studied the economics of a biohydrogen system
(capacity ¼ 170 tonnes of soybean straw per day, biomass-to-water
ratio ¼ 0.1, temperature ¼ 500 C, particle size ¼ 0.13 mm, and reaction time ¼ 45 min) based on the catalytic supercritical water
gasification of soybean straw (Okolie et al., 2021). The system
consisted of four process units, i.e., pretreatment, gasification,
separation, and purification and combustion. The minimum
selling price of biohydrogen was estimated to be 1.94 USD/kg,
which was relatively low than other biohydrogen technologies.
The minimum selling price was mainly affected by the feedstock
price, utility cost, tax rate, and labor cost with the feedstock price
and labor cost being most significant. The undiscounted NPV
would decrease from 80.18 million USD to 68.02 million USD
and 75.77 million USD for a 30% increase in the tax rate and soybean straw price, respectively. A 30% decrease in the labor cost
reduced the NPV by about 4.2%.
Gasafi et al. (2008) studied the economics of a wasteto-biohydrogen system based on the supercritical water gasification of sewage sludge. It was found that a 50% increase in the
equipment cost would increase the hydrogen production cost
by 72%. Meanwhile, a 50% decrease in the interest rate of debt
would reduce the hydrogen cost by 46%. The costs of fuel consumption and labor had relatively small impacts on the
hydrogen production cost: a 50% increase in fuel or labor costs
would increase the hydrogen production cost by about 17%.
A combined bioprocess based on solid state fermentation was
designed to recover hydrogen from food waste (Han et al., 2016).
A. awamori and A. oryzae were used to produce glucoamylase and
protease in the process of solid state fermentation at 30 C
for 4 days. The produced enzymes were transferred into a bioreactor with pretreated food waste (grounded and blended with
Chapter 9 System design: costebenefit analysis
water) for hydrolysis at 55 C and an agitation speed of 500 rpm.
The food waste hydrolysate was used as the substrate for
hydrogen production using pretreated anaerobic sludge
(screened and heat pretreatment at 100 C for 6 h) as inoculum
in a fermenter (pH was maintained between 4.0 and 4.6 by adding
5 M NaHCO3 and 0.005 M H2SO4). The system separated
hydrogen and carbon dioxide using a purification system that
was made of a low-pressure gas tank, a carbon dioxide
compressor, an activated carbon filter, an absorbing-type desiccator, a compression refrigerator, and a storage tank. This process
achieved a hydrogen yield of 39.14 mL/g food waste and had a capacity of treating 3 tonnes of food waste per day. Its total capital
cost and annual production cost were 583,092 USD and
88,298 USD/year with a payback period of 5 years. It was also
shown that the price of hydrogen and the labor cost had the highest impact on the NPV of the development.
3.3 Waste-to-biomethane
System scale (from 100 m3/h to 1000 m3/h), types of feedstocks (OFMSW and a mixture of 30 wt.% maize and 70 wt.%
manure residues), and biomethane end use (fed into the grid,
cogeneration (electricity and heat), and sold as a vehicle fuel)
were found to affect the economics of waste-to-biomethane
development (Cucchiella & D’Adamo, 2016). Additionally, the impacts of the variations of the major parameters such as the incentive of CIC, natural gas price, incentive of Feed-in Tariff,
investment cost of biogas production, substrate transportation
cost, and maintenance and overhead costs on the economics
have also been studied. It was found that 34, 33, 29, and 11 out
of 60 cases studied were economically feasible for the scale of
1000, 500, 250, and 100 m3/h, respectively (more cases suggest a
higher chance of being profitable). 43, 35, and 29 out of 80 cases
were economically feasible for the end use of selling as a vehicle
fuel, cogeneration, and feeding into the grid, respectively. 103
and 4 out of 120 cases were economically feasible for OFMSW
and the mixture substrates, respectively. For a 100 m3/h plant
treating OFMSW and selling biomethane as a vehicle fuel, it would
be profitable when the incentive of CIC was 500 EUR and the percentage of maintenance and overhead costs in the overall production cost was 15%. For a 100 m3/h plant treating OFMSW and
feeding biomethane into the grid to displace natural gas, it would
be profitable when the natural gas was 30.50 EUR/MWh, there
was no unitary transportation cost of substrate, and the percentage of maintenance and overhead costs in the overall production
177
178
Chapter 9 System design: costebenefit analysis
cost was 15%. For a plant treating a mixture of 30 wt.% maize and
70 wt.% manure residues, it would not be profitable when biomethane was fed into the grid or for cogeneration, or when the
scale was 100 m3/h regardless of the end use methods of
biomethane.
A co-digestion system was designed to co-ferment fish waste
and cow dung to produce biomethane and concentrated liquid
mineral fertilizer with carbon dioxide, solid fertilizer, and purified
water being by-products (Kratky & Zamazal, 2020). In the process,
fish waste was hydrothermally pretreated and then mixed with
cow dung and water in a homogenization unit. Biogas and digestate were produced in an anaerobic fermenter followed by the
upgrading of the biogas to separate biomethane and carbon dioxide. A solideliquid separation process was used to separate the
liquid effluent from solid fermentation residue (solid fertilizer).
The liquid effluent further went through a reverse osmosis section
to produce concentrated liquid mineral fertilizer and purified water. The capital cost of the design was estimated to be 5,274,000
EUR (659 EUR/tonne of fish waste) with biogas upgrading, digestate upgrading, raw material storage and pretreatment, and
anaerobic digestion contributing 44%, 23%, 22%, and 11%, respectively (i.e. pretreatment and posttreatment accounted for 89% of
the capital cost). The O&M cost was 2,225,000 EUR per year and
was mainly contributed by the energy cost, personnel cost, maintenance cost, and corporate directions. The economics of the biomethane development was mainly affected by the specific capital
cost, methane yield, methane purchase price, and electricity
price. The specific capital cost (659 EUR/tonne of fish waste)
was the ratio between the total capital cost and the amount of
fish waste treated and it was around four times of the ratios of
conventional biogas plants (110e150 EUR/tonne of waste).
When the specific capital cost was reduced from 659 EUR/tonne
to 200 EUR/tonne, the payback period could be shortened by
around 70%. If the biomethane yield could be higher than
0.34 L/kg VS of fish waste, the payback period would be less
than 8 years, which was considered to be attractive to investors.
If the price of biomethane is lower than 0.17 EUR/kWh, the
payback period would be longer than 8 years.
3.4 Waste-to-bioethanol
Fig. 9.4 shows the flow diagram of a typical bioethanol production process (maximum capacity ¼ 10.43 dry tonne per batch and
energy consumption ¼ 30 kW/dry tonne) using an enzyme complex (Cellic Ctec 1) to treat waste papers (newspaper, office paper,
cardboard, and magazine) (Wang et al., 2013). In the process,
Chapter 9 System design: costebenefit analysis
Figure 9.4 Schematic process flow diagram of base cases (Wang et al., 2013).
waste papers firstly went through a metal removal process (A100)
and then were pulped at 15% (w/w) solids loading in pulpers
(A200). The pulped paper slurry was saccharified enzymatically
at 50 C for 72 h (A300). A recombinant bacterium Zymomonas
mobilis was used in the fermentation (A400) and the hydrolysate
from saccharification and nutrients of corn steep liquor and
diammonium phosphate were used to seed incubation and
fermentation tanks at 40 C for 36 h. The bioethanol yield of
fermentation was 95% and the generated bioethanol was purified
to 99.5% (w/w) using distillation, rectification, and molecular
sieve adsorption processes (A500). The solid fuel (moisture
content <50%) was transferred to the combustion area (A800)
and the liquid fraction was transferred to the wastewater treatment area (A600) where biogas was produced via anaerobic digestion and sent to a circulating fluidized bed combustor (together
with the solid fuel and the cell mass of anaerobic digestion) to
generate heat and electricity.
Fig. 9.5 shows the flow diagrams of two advanced bioethanol
production processes which involved the use of (a) dilute acid
to pretreat office paper and (b) oxidative lime to pretreat newspaper (Wang et al., 2013). In the first advanced process
(Fig. 9.5(a)), shredded office paper was preheated to 100 C by
179
180
Chapter 9 System design: costebenefit analysis
Figure 9.5 Schematic process flow diagrams of advanced cases ((a) office paper-to-bioethanol with dilute acid
pretreatment and (b) newspaper-to-bioethanol with oxidative lime pretreatment; Unit process indicated using
dashed boxes) (Wang et al., 2013).
low-pressure steam at an initial solid loading of 30% and was then
treated using dilute acid (0.5% (w/w) H2SO4 at 220 C) for 2 min.
The liquid fraction of the treated slurry is detoxified and reacidified with H2SO4, followed by mixing with the solid fraction and being sent to the saccharification area (A200). In the product
recovery area (A500), the liquid fraction from the distillation bottoms was sent to a series of evaporators, got concentrated, and
transferred into the combustor for heat and electricity generation.
In the second advanced process (Fig. 9.5(b)), shredded newspaper
was preheated to 100 C at a 30% solid loading and was then
treated using oxidative lime at 140 C with 1.875% (w/w) lime
(Ca(OH)2) solution under compressed air for 3 h. The liquid fraction separated from the treated slurry was supplied with carbon
dioxide to precipitate CaCO3 for calcium. Similarly, evaporators
were used to produce a concentrated syrup which was then transferred into a combustor for heat and electricity generation.
Chapter 9 System design: costebenefit analysis
The CBA of the processes showed that, for the typical process
(Fig. 9.4), office paper was the most favorable feedstock with a
high bioethanol yield of 343 L/dry tonne feedstock and the lowest
MESP of 0.32 GBP/L, followed by cardboard with a yield of 247 L/
dry tonne feedstock and a MESP of 0.33 GBP/L. Although dilute
acid pretreatment increased the yield of bioethanol, it increased
the capital cost by 15% due to the addition of extra equipment
costs for the pretreatment and heat exchanger requirement and
the extra demands in electricity and high-pressure steam. The
pretreatment arrangement also increased the amount of gypsum
produced and sent to landfill. For the advanced process with
oxidative lime pretreatment, the increased total equipment cost
was offset by the benefits from the increased bioethanol yield
and reduced enzyme consumption, reducing the MESP based
on newspaper by 0.04 GBP/L. The MESPs of bioethanol derived
from waste papers ranged from 0.31 GBP/L (0.45 USD/L) to 0.66
GBP/L (0.95 USD/L), which seemed to be better than that of the
ones derived from other feedstocks (e.g., lignocellulosic biomass
(0.57 USD/L to 1.17 USD/L) and corn stover (0.9 USD/L to
1.17 USD/L)). The biomass feedstock cost was the biggest contributor (63.5%) for the value of MESP, and the capital recovery
charge for the combustor and electricity generator accounted
for 16.7% of the total cost. The surplus electricity recovered
from the biomass residue and supplied to the UK National Grid
offset 42.7% of the cost of bioethanol production. The capital costs
associated with saccharification and fermentation accounted for
16.9% and 10.9% of MESP, respectively.
Moreover, the study showed that the MESP of bioethanol
could be significantly affected by the variation in the solid loading
of saccharification: increasing the loading from 15% to 20%
would reduce the MESP by up to 20%. This was attributed to
the fact that the energy consumption for distillation was reduced
as more concentrated bioethanol stream was fed to the distillation column and the capacity and thus capital cost for the wastewater treatment area was significantly reduced. The economic
performance of bioethanol production is also reasonably sensitive to the fermentation efficiency. Improving the efficiency has
the potential to result in a reduction in the MESP by up to 26%.
3.5 Waste-to-biodiesel
A CBA study in 2019 showed that microalgae biodiesel production in China was not economically viable with a unit production cost of 2.29 USD/kg that was significantly higher than
that of commercial petro-diesel (Sun et al., 2019). Major
181
182
Chapter 9 System design: costebenefit analysis
economic barriers included limited microalgae productivity,
annual operating days, and product benefits, which appeared
to be difficult to resolve in the short term. It was also highlighted
that a relevant policy system needed to be in place to facilitate
the development of microalgae-derived biodiesel.
A 2012 CBA study of palm biodiesel production in Malaysia,
the second largest producer of crude palm oil feedstock, showed
that the life cycle cost of a 50 kilotonne palm biodiesel plant with
a lifetime of 20 years was 665 million USD and had a payback
period of 3.52 years (Ong et al., 2012). The cost of feedstock
accounted for 79% of the total production cost (or 0.5 USD/L) followed by the O&M cost (0.13 USD/L). The variation of feedstock
price would significantly affect the life cycle cost of palm biodiesel: a 0.1 USD/kg increase in the crude palm oil price would increase the biodiesel production cost by 0.05 USD/L. In this case,
governmental subsidies became essential to support palm biodiesel development: for example, with a biodiesel subsidy of
0.1 USD/L, the biodiesel price would be comparable to the price
of fossil diesel at a crude palm oil price of 1.05 USD/kg. Meanwhile, it would be desirable to keep improving the biodiesel conversion processes and their efficiencies.
The economics of four different schemes of biodiesel production (annual cane processing capacity of 1,600,000 tonne) from
engineered cane lipids were compared. The schemes included
direct glycerolysis, solvent-based poplar lipid separation,
solvent-based poplar lipid and free fatty acid separation, and
membrane-based poplar lipid and free fatty acid separation under
thermal glycerolysis and enzymatic glycerolysis approaches,
respectively (Arora & Singh, 2020). It was shown that the scheme
with polar lipid separation under thermal glycerolysis was most
profitable with an NPV of 96.5 million USD and a minimum selling
price of 1,107USD/tonne biodiesel. The economics of the processes was mainly affected by the cane lipid percentage, cane lipid
procurement cost, polar lipid content, and free fatty acid content.
When the cane lipid content decreased from 20% to 5%, the minimum selling price would increase by 45 5%. A 20% reduction in
the lipid price from the base case (0.67 USD) led to a 60%e100%
increase in the NPV and a 11%e20% decrease in the minimum
selling price. A positive NPV could be achieved for the case of
15% cane lipids and a low lipid procurement price of
0.536 USD/kg. For the case of a higher lipid price, e.g.,
>0.80USD/kg, the lipid content needed to be 20% (even higher
lipid contents in plant tissues would be less possible) for a positive
NPV.
Chapter 9 System design: costebenefit analysis
3.6 Waste-to-biochar
The CBA of a pyrolysis-based biochar system that was used to
convert postharvest forestry residues into biochar for on-site
Eucalypt plantations showed that the system could achieve an
annual income of over 179 kUSD (Wrobel-Tobiszewska et al.,
2015). The price of biochar and product distribution were two of
the most significant factors affecting the economics of the development. The sale of biochar was the largest contributor to the
annual revenue, while the cost of system operation accounted
for the largest cost component. Doubling the price of biochar
would increase the net profit by 166%, and for a 1 USD increase
in the biochar price, there would be 288 USD of additional net
profit. Doubling the carbon price would increase the net profit
by 10%, and the system remained profitable when there was
no carbon benefit. In a separate study, the economics of
gasification-based biochar production from forest residues was
studied. The minimum selling price of biochar was reported to
be 1044 USD/per dry tonne (Sahoo et al., 2021). The minimum
selling price was mainly controlled by the capital cost, labor
cost, and feedstock cost, and it could be reduced to a level of
470 USD/dry tonne via technological improvement. Further
reduction in the selling price was possible by considering the
credits of renewable energy production and carbon saving. It
was shown that the waste heat generated in the gasification system could be used to dry wet feedstocks, making the moisture
content a less significant factor affecting the minimum selling
price.
Biochar production from straw using slow pyrolysis in China
was shown to be economic viable (Ji et al., 2018). A biochar production system with a feedstock consumption capacity of 30,000
tonne/year and a biochar yield of 10,500 tonne/year was shown
to have a capital cost of 5.19 million USD and achieve an NPV
of 20.98 USD per tonne straw. The cost of feedstock was estimated
to be 1.56 million USD/year, contributing to most of the annual
operation cost. The annual biochar sale revenue was 3.67 million
USD. The economics of the development was mainly affected by
the feedstock cost and biochar price, followed by the initial capital
cost (a 20% increase in the capital cost reduced the NPV by 8.26%).
4. Uncertainties
The accuracy and validity of CBA can be significantly affected
by the uncertainties and variabilities in the input data and assumptions. For a CBA study examining the economic feasibility
183
184
Chapter 9 System design: costebenefit analysis
of a new technology, system, or process, there can be limited
knowledge about the process parameters (e.g., energy flows
and yields and quality of products). Existing knowledge regarding
the new technology may be based on small-scale experiments
and there are potential uncertainties limiting the accurate estimation of the associated data for large-scale development.
Generally, there is a lack of cost and benefit data specific to
new developments, and assumptions need to be made and existing data on other different technologies need to be “borrowed”
for a CBA study. The assumptions need to be justified so that
the “borrowed” data are relevant to and could represent the
case under analysis. Hence, it is important to check the existing
data for their applicability and suitability, and make it clear in
the analysis any potential adverse effects from the use of the data.
To mitigate the problems related to analysis uncertainties, a
few methods are recommended: (i) a learning curve approach
can be used to estimate the progress rate and trends of CAPEX
and OPEX; (ii) artificial intelligenceebased models can be used
to predict the variation of product cost and cash flows in the
future if there is sufficient data; (iii) the opinions of industrial
or experienced experts can be combined with fuzzy approaches
to improve the reliability of the analysis (Bagdatlı et al., 2017);
(iv) a completeness check can be carried out to ensure all relevant
cost and benefit components are considered and the sources of
data are well documented; (v) sensitivity analysis (e.g., based on
the design-of-experiments method) can be carried out to evaluate
the impacts of process parameters, economic data, and system
design on the results of CBA; and (vi) stochastic approaches
(e.g., Monte Carlo simulation) can be applied to account for the
variability of data in a CBA study (You et al., 2016), which will
be subject to the accurate understanding of the probabilistic distributions of relevant parameters.
References
Abdallah, M., Shanableh, A., Shabib, A., & Adghim, M. (2018). Financial feasibility
of waste to energy strategies in the United Arab Emirates. Waste
Management, 82, 207e219.
Alhashimi, H. A., & Aktas, C. B. (2017). Life cycle environmental and economic
performance of biochar compared with activated carbon: A meta-analysis.
Resources, Conservation and Recycling, 118, 13e26.
Arora, A., & Singh, V. (2020). Biodiesel production from engineered sugarcane
lipids under uncertain feedstock compositions: Process design and technoeconomic analysis. Applied Energy, 280, 115933.
Ascher, Simon, Li, W., & You, S. (2020). Life cycle assessment and net present
worth analysis of a community-based food waste treatment system.
Bioresource Technology, 305, 123076.
Chapter 9 System design: costebenefit analysis
Ascher, S., Watson, I., Wang, X., & You, S. (2019). Township-based bioenergy
systems for distributed energy supply and efficient household waste reutilisation: Techno-economic and environmental feasibility. Energy, 181.
https://doi.org/10.1016/j.energy.2019.05.191
Bagdatlı, M. E. C., Akbıyıklı, R., & Papageorgiou, E. I. (2017). A fuzzy cognitive
map approach applied in costebenefit analysis for highway projects.
International Journal of Fuzzy Systems, 19(5), 1512e1527.
Budzianowski, W. M., & Budzianowska, D. A. (2015). Economic analysis of
biomethane and bioelectricity generation from biogas using different
support schemes and plant configurations. Energy, 88, 658e666.
Carattini, S., Kallbekken, S., & Orlov, A. (2019). How to win public support for a
global carbon tax. Nature Publishing Group.
Cheng, F., Luo, H., & Colosi, L. M. (2020). Slow pyrolysis as a platform for
negative emissions technology: An integration of machine learning models,
life cycle assessment, and economic analysis. Energy Conversion and
Management, 223, 113258.
Clare, A., Shackley, S., Joseph, S., Hammond, J., Pan, G., & Bloom, A. (2015).
Competing uses for China’s straw: The economic and carbon abatement
potential of biochar. Gcb Bioenergy, 7(6), 1272e1282.
Cucchiella, F., & D’Adamo, I. (2016). Technical and economic analysis of
biomethane: A focus on the role of subsidies. Energy Conversion and
Management, 119, 338e351.
D’Adamo, I., Falcone, P. M., & Ferella, F. (2019). A socio-economic analysis of
biomethane in the transport sector: The case of Italy. Waste Management, 95,
102e115.
Dalemo, M., Sonesson, U., Björklund, A., Mingarini, K., Frostell, B., Jönsson, H.,
Nybrant, T., Sundqvist, J. O., & Thyselius, L. (1997). ORWAREeA simulation
model for organic waste handling systems. Part 1: Model description.
Resources, Conservation and Recycling, 21(1), 17e37.
Danish Energy Agency. (2017). Memo on the Danish support scheme for electricity
generation based on renewables and other environmentally benign electricity
production. https://ens.dk/sites/ens.dk/files/contents/service/file/memo_
on_the_danish_support_scheme_for_electricity_generation_based_on_re.pdf.
Doddapaneni, T. R. K. C., Praveenkumar, R., Tolvanen, H., Rintala, J., &
Konttinen, J. (2018). Techno-economic evaluation of integrating torrefaction
with anaerobic digestion. Applied Energy, 213, 272e284.
Eboh, F. C., Andersson, B.-Å., & Richards, T. (2019). Economic evaluation of
improvements in a waste-to-energy combined heat and power plant. Waste
Management, 100, 75e83.
Edwards, J., Othman, M., Burn, S., & Crossin, E. (2016). Energy and time
modelling of kerbside waste collection: Changes incurred when adding
source separated food waste. Waste Management, 56, 454e465.
Gasafi, E., Reinecke, M.-Y., Kruse, A., & Schebek, L. (2008). Economic analysis of
sewage sludge gasification in supercritical water for hydrogen production.
Biomass and Bioenergy, 32(12), 1085e1096.
Hagmann, D., Ho, E. H., & Loewenstein, G. (2019). Nudging out support for a
carbon tax. Nature Climate Change, 9(6), 484e489.
Han, W., Fang, J., Liu, Z., & Tang, J. (2016). Techno-economic evaluation of a
combined bioprocess for fermentative hydrogen production from food
waste. Bioresource Technology, 202, 107e112.
Haraguchi, M., Siddiqi, A., & Narayanamurti, V. (2019). Stochastic cost-benefit
analysis of urban waste-to-energy systems. Journal of Cleaner Production,
224, 751e765.
185
186
Chapter 9 System design: costebenefit analysis
Jamasb, T., & Nepal, R. (2010). Issues and options in waste management: A social
costebenefit analysis of waste-to-energy in the UK. Resources, Conservation
and Recycling, 54(12), 1341e1352.
Ji, C., Cheng, K., Nayak, D., & Pan, G. (2018). Environmental and economic
assessment of crop residue competitive utilization for biochar, briquette fuel
and combined heat and power generation. Journal of Cleaner Production,
192, 916e923.
Kang, K. E., Jeong, J.-S., Kim, Y., Min, J., & Moon, S.-K. (2019). Development and
economic analysis of bioethanol production facilities using lignocellulosic
biomass. Journal of Bioscience and Bioengineering, 128(4), 475e479.
Kratky, L., & Zamazal, P. (2020). Economic feasibility and sensitivity analysis of
fish waste processing biorefinery. Journal of Cleaner Production, 243, 118677.
Lee, D.-H. (2016). Cost-benefit analysis, LCOE and evaluation of financial
feasibility of full commercialization of biohydrogen. International Journal of
Hydrogen Energy, 41(7), 4347e4357.
Li, Y., Han, Y., Zhang, Y., Luo, W., & Li, G. (2020). Anaerobic digestion of
different agricultural wastes: A techno-economic assessment. Bioresource
Technology, 315, 123836.
Miranda, A. C., da Silva Filho, S. C., Tambourgi, E. B., CurveloSantana, J. C.,
Vanalle, R. M., & Guerhardt, F. (2018). Analysis of the costs and logistics of
biodiesel production from used cooking oil in the metropolitan region of
Campinas (Brazil). Renewable and Sustainable Energy Reviews, 88, 373e379.
Okolie, J. A., Nanda, S., Dalai, A. K., & Kozinski, J. A. (2021). Techno-economic
evaluation and sensitivity analysis of a conceptual design for supercritical
water gasification of soybean straw to produce hydrogen. Bioresource
Technology, 331, 125005.
Ong, H. C., Mahlia, T. M. I., Masjuki, H. H., & Honnery, D. (2012). Life cycle cost
and sensitivity analysis of palm biodiesel production. Fuel, 98, 131e139.
Patrizio, P., Leduc, S., Chinese, D., & Kraxner, F. (2017). Internalizing the external
costs of biogas supply chains in the Italian energy sector. Energy, 125, 85e96.
Renda, R., Gigli, E., Cappelli, A., Simoni, S., Guerriero, E., & Romagnoli, F. (2016).
Economic feasibility study of a small-scale biogas plant using a two-stage
process and a fixed bio-film reactor for a cost-efficient production. Energy
Procedia, 95, 385e392.
Sahoo, K., Upadhyay, A., Runge, T., Bergman, R., Puettmann, M., & Bilek, E.
(2021). Life-cycle assessment and techno-economic analysis of biochar
produced from forest residues using portable systems. International Journal
of Life Cycle Assessment, 26(1), 189e213.
Sarkar, S., & Kumar, A. (2010). Large-scale biohydrogen production from bio-oil.
Bioresource Technology, 101(19), 7350e7361.
Singh, B., Szamosi, Z., Simenfalvi, Z., & Rosas-Casals, M. (2020). Decentralized
biomass for biogas production. Evaluation and potential assessment in
Punjab (India). Energy Report, 6, 1702e1714.
Sonesson, U. (2000). Modelling of waste collection-a general approach to
calculate fuel consumption and time. Waste Management & Research, 18(2),
115e123.
Streimikiene, D., & Alisauskaite-Seskiene, I. (2014). External costs of electricity
generation options in Lithuania. Renewable Energy, 64, 215e224.
Sun, J., Xiong, X., Wang, M., Du, H., Li, J., Zhou, D., & Zuo, J. (2019). Microalgae
biodiesel production in China: A preliminary economic analysis. Renewable
and Sustainable Energy Reviews, 104, 296e306.
Chapter 9 System design: costebenefit analysis
Tran, N. N., Tisma, M., Budzaki, S., McMurchie, E. J., Gonzalez, O. M. M.,
Hessel, V., & Ngothai, Y. (2018). Scale-up and economic analysis of biodiesel
production from recycled grease trap waste. Applied Energy, 229, 142e150.
US Department of Energy. (2021). Biodiesel laws and incentives in federal.
https://afdc.energy.gov/fuels/laws/BIOD?state¼US.
Wang, L., Sharifzadeh, M., Templer, R., & Murphy, R. J. (2012). Technology
performance and economic feasibility of bioethanol production from various
waste papers. Energy & Environmental Science, 5(2), 5717e5730.
Wang, L., Sharifzadeh, M., Templer, R., & Murphy, R. J. (2013). Bioethanol
production from various waste papers: Economic feasibility and sensitivity
analysis. Applied Energy, 111, 1172e1182.
WRAP. (2018). Comparing the costs of alternative waste treatment options.
https://wrap.org.uk/resources/guide/gate-fees-report-2018.
Wrobel-Tobiszewska, A., Boersma, M., Sargison, J., Adams, P., & Jarick, S. (2015).
An economic analysis of biochar production using residues from Eucalypt
plantations. Biomass and Bioenergy, 81, 177e182.
Yao, J., Kraussler, M., Benedikt, F., & Hofbauer, H. (2017). Techno-economic
assessment of hydrogen production based on dual fluidized bed biomass
steam gasification, biogas steam reforming, and alkaline water electrolysis
processes. Energy Conversion and Management, 145, 278e292.
Yao, Z., You, S., Dai, Y., & Wang, C.-H. (2018). Particulate emission from the
gasification and pyrolysis of biomass: Concentration, size distributions,
respiratory deposition-based control measure evaluation. Environmental
Pollution, 242, 1108e1118.
You, S., & Wang, X. (2019). On the carbon abatement potential and economic
viability of biochar production systems: Cost-benefit and life cycle
assessment. In Biochar from biomass and waste (pp. 385e408). Elsevier.
You, S., Wang, W., Dai, Y., Tong, Y. W., & Wang, C.-H. (2016). Comparison of the
co-gasification of sewage sludge and food wastes and cost-benefit analysis of
gasification- and incineration-based waste treatment schemes. Bioresource
Technology, 218. https://doi.org/10.1016/j.biortech.2016.07.017
187
This page intentionally left blank
System design: life cycle
assessment
10
Abstract
This chapter explains the principles of life cycle assessment (LCA)
and its applications for evaluating the environmental impacts of wasteto-resource developments. It introduces the procedures of LCA with
respect to four stages, i.e., goal and scope definition, life cycle inventory,
life cycle impact assessment, and data interpretation. It discusses the
different implementation methods of LCA including process-based LCA
vs. input-output (IO) LCA, attributional LCA vs. consequential LCA, and
allocation strategies. This chapter reviews the existing studies on the
environmental impacts of the different types of waste-to-resource developments and critical factors are highlighted. This chapter concludes
with the discussion about the major types of uncertainty involved with
LCA.
Keywords: Attributional LCA; Allocation; Consequential LCA; Environmental impacts; Input-output LCA; Life cycle assessment; Processbased LCA.
1. Introduction
Waste-to-resource development has the potential to achieve
higher environmental sustainability as compared to the conventional waste management methods such as landfill. The actual
environmental gains from the use of waste-to-resource technologies depend on various factors such as types of waste, types of
waste-to-resource technologies, technological configurations,
environmental conditions and backgrounds, etc. Moreover, upstream and downstream operations are often essential part of
waste-to-resource development and include the collection,
segregation, transportation, and pretreatment of waste as well
as the upgrading of products and their storage and distribution
for subsequent applications. As a result, there would be
Waste-to-Resource System Design for Low-Carbon Circular Economy. https://doi.org/10.1016/B978-0-12-822681-0.00001-3
Copyright © 2022 Elsevier Inc. All rights reserved.
189
190
Chapter 10 System design: life cycle assessment
potential variabilities in the data input and system boundary
definitions in evaluating the environmental impacts of wasteto-resource development.
It becomes increasingly important to accurately quantify the
impacts of environmental and energy systems for optimal
decision-making. LCA is a standardized protocol that can be
used to track and report the environmental impacts of a process,
technology, or system throughout its entire life cycle. The method
of LCA is defined by a set of standards, e.g., ISO 14040 and 14044
by the International Organization for Standardization (ISO) (ISO,
1997, 2006). Originally developed from the principles of industrial
ecology, LCA has been widely adopted by decision-makers to
understand the environmental performance of specific products,
processes, or activities.
Based on the range of process components considered, LCA
can be classified into cradle-to-grave, cradle-to-gate, and
cradle-to-cradle types, respectively. The cradle-to-grave type
refers to an LCA study that considers the energy, material, and
emissions of the processes ranging from raw material extraction,
construction, manufacturing, to use, demolition, and end-of-life
disposal. For example, for food wasteebased biogas production,
a cradle-to-grave LCA covers such processes as food waste collection and transportation, biogas system construction and operation, biogas upgrading and utilization, and digestate processing
and handling (e.g., treatment, transportation, and utilization).
A cradle-to-gate LCA study considers the impacts related to
manufacturing of a product up to the “gate” of the plant. For
food wasteebased biogas production, it includes such processes
as food waste collection and transportation, biogas system construction and operation, and biogas upgrading and storage.
A cradle-to-cradle LCA study considers additional processes
where the generated product(s) become the raw materials of other
products.
It is worth noting that LCA is not the same as life cycle costing
analysis that tracks and reports the economics (covering such
information as capital costs, operation and maintenance costs,
etc., as discussed in Chapter 9) of a project throughout its full
life cycle. Instead, LCA focuses on the energy and material flows
of a process, technology, or system, and associated emissions to
nature (e.g., GHG and particulate matters (PMs)) and material
extraction from nature (e.g., water, limestone, fossil fuels, and
iron ore) throughout its entire life cycle. Additionally, it is often
impossible and impractical to accurately figure out all relevant
environmental impacts due to resource, data, and knowledge
Chapter 10 System design: life cycle assessment
limitations. In many cases, only a few relevant and significant
impact categories are analyzed using LCA considering data
availability.
2. LCA procedures
The general structure of LCA is made of four stages: (i) goal
and scope definition, (ii) life cycle inventory (LCI) analysis, (iii)
impact assessment, and (iv) data interpretation. The four stages
are carried out sequentially with the information defined and/
or calculated in a previous stage serves as the input for or guides
a subsequent stage. The actual analysis is often conducted in an
iterative mode within and between the different stages to ensure
the whole analysis is complete and self-consistent.
2.1 Goal and scope definition
The first stage of LCA involves the definition of the goal and
scope. To define a clear and comprehensive goal, it is important
to address the following questions (Simonen, 2014): What is the
intended application of the process, technology or system under
analysis? Why is LCA carried out? Who is the intended audience
of the analysis? How the results of the analysis will be disseminated to, e.g., the public? What are the benefits of the process,
technology or system and the analysis? What are the limitations
regarding the use of the results? For example, a comprehensive
goal statement for biomethane production from anaerobic digestion of food waste can be:
“This LCA is a study of biomethane production from anaerobic digestion of food waste (what). It is carried out to improve
our understanding of the environmental impacts of the biomethane production process (why). The analysis and its results
will be used by the food waste management and biomethane
production industry and investors, waste management organizations, and associated policymakers (who). The LCA will benefit
the associated stakeholders in their design of optimal food waste
management and low-carbon methane production plans with
reduced environmental impacts. The results will be made open
access to the public for enhancing the awareness of sustainable
food waste management and low-carbon methane production
practices.”
The goal of an LCA study, once developed, will be by no
means unchangeable. It is common to revisit and reevaluate
the goal along the development of the analysis and make corresponding adjustment so that the whole analysis is self-consistent.
191
192
Chapter 10 System design: life cycle assessment
The scope definition involves the clarification of what is
included in and excluded from the analysis and what are the parameters of the analysis. Specifically, it is critical to define the
process, technology or system under study with clear statements
about its function, unit, and performance, i.e., the definition of a
functional unit. The system boundary of the analysis needs to be
set up to indicate what is included and excluded and the specific
processes/system units of the system to be included. It is also
necessary to define the methodological details including the
methods of impact assessment (e.g., midpoint or endpoint)
and data interpretation (e.g., sensitivity analysis). Moreover, if
multiple products (coproduction) are involved, the method of
allocation needs to be defined (details will be introduced below).
Finally, the sources and quality requirement of data are also
needed to be defined.
The setup of the scope needs to be consistent with and support the LCA goal. For example, if the main goal is to reduce
the carbon footprint of waste management, the scope of the analysis can be limited to tracking GHG emissions and associated
processes with other kinds of emissions such as PMs being
ignored. Like the definition of LCA goal, it is common to revisit
and reevaluate the LCA scope to ensure a self-consistent and
accurate analysis.
The functional unit includes such information as the quantity,
quality, and duration of a product or service considered. It facilitates the comparison across different cases by ensuring the comparison on a functionally equivalent basis. In many existing LCA
studies of waste-to-resource development, a unit that includes
quantity only, or a declared unit, is used (e.g., the treatment of
1 tonne of food waste, the generation of 1 kWh of electricity,
the production of 1 m3 of biohydrogen). This often applies to
cradle-to-gate LCA studies where the application of products is
not the focus. On the other hand, for cradle-to-grave LCA studies
where the application of product(s) is considered, a relatively
comprehensive definition needs to be used. For example, the production of 1 m3 of biohydrogen with a purity of 99.99% for fuel cell
application can be defined as the functional unit for the LCA of
biohydrogen production for fuel cell application.
It is important to define a clear system boundary to facilitate
reevaluation and checking while ensuring the fulfilment of the
LCA goal. However, the definition of system boundary is often
limited by the availability and accuracy of data. The system
boundary should include the processes where energy, material,
and emission data are available and of high accuracy. The
following processes are commonly excluded in a system
Chapter 10 System design: life cycle assessment
boundary: manufacture of fixed equipment (e.g., factory),
manufacture of mobile equipment (e.g., trucks), hygiene-related
water use (e.g., toilets and sinks for workers), and employ labor
(e.g., commuting). A diagram can always be used to delineate
the system boundary to indicate the processes, inputs, and
outputs to be analyzed (Fig. 10.1).
2.2 Life cycle inventory
LCI involves the collection of energy and material requirements and emissions throughout the entire life cycle of the process, technology or system under analysis. The data can be from
existing databases or from measurements and calculation (e.g.,
process modeling, estimation based on reported data). For the
LCA of a new waste-to-resource technology, it is key to understand the energy and material flows and yields (and quality) of
products of the process based on experiments and modeling
(e.g., theoretical models, process models, machine learninge
based models, etc.). Toward the end of an LCI analysis, a list of
data covering the energy, water, and material inputs from nature
and emissions to air, water, and land is developed. According to
ISO 14044 (2006b:12), the inventory data can be classified into
four types: (i) inputs (energy, materials, etc.), (ii) products
(including coproducts and waste), (iii) emissions, and (iv) other
environmental aspects (ISO, 2006). The LCI data can be gathered
with respect to a unit process or an aggregated process including a
few unit processes. The former will be beneficial for granulating
the data but are not always available.
Figure 10.1 A diagrammatic illustration of the system boundary for food waste management based on the
technology of anaerobic digestion. Ascher, S., Li, W., & You, S. (2020). Life cycle assessment and net present worth
analysis of a community-based food waste treatment system. Bioresource technology, 305, 123076.
193
194
Chapter 10 System design: life cycle assessment
2.3 Life cycle impact assessment
Life cycle impact assessment (LCIA) involves the amalgamation of the emission data and estimate the indicators of a few
overall environmental impact categories of relevance and interest. The LCIA stage is made of two steps: (i) a classification step
where the data from the LCI analysis stage are classified in terms
of their relevance to and are matched with the specific impact
categories (e.g., the data related to GHG emissions are collected
and matched with the global warming potential (GWP)), and
(ii) a characterization step where the emission and resource
extraction data of each category are translated into a limited
number of impact indicators (e.g., GHG emissionserelated data
converted into GWP) by weighting the quantity of inventory using
a characterization factor. For example, the impact of methane on
global warming is 28 times of carbon dioxide, so it has a characterization factor of 28 if the GWP is calculated on the basis of carbon dioxide equivalence (Table 10.1). The total GWP (GHG
emissions or carbon footprint) is calculated based on the sum of
the multiplication of the amount of each type of GHG emission
and the corresponding characterization factor. It is worth noting
that the same type of environmental impact can be affected by
multiple different emissions (e.g., there are different types of
GHG species), while the same emission may be linked to multiple
environmental impacts (e.g., methane emission is related to GWP
and smog formation).
There are two major ways in which characterization factors
can be derived, i.e., midpoint one and endpoint one corresponding to the consideration of the different range of the stages
within the causeeeffect chain of emissions. The endpoint
method estimates the indicators that account for the ultimate
effects of emissions in terms of human health (e.g., skin cancer
and immune system suppression), biodiversity (e.g., freshwater
Table 10.1 GWP characterization factors relative to CO2.
Emissions
GWP characterization factors
References
CO2
CO2 (biogenic)
CH4
N 2O
1
0
28
265
IPCC (2016), Myhre et al. (2013)
Christensen et al. (2009), Møller et al. (2009)
IPCC (2016), Myhre et al. (2013)
IPCC (2016), Myhre et al. (2013)
Chapter 10 System design: life cycle assessment
and marine life damage and crop damage), and resource scarcity (e.g., oil, gas, coal, and energy costs). The midpoint method
estimates the indicators that account for the single environmental problems such as global warming, PMs, ozone depletion,
etc. Midpoint indicators have been applied widely in the LCA of
waste-to-resource development. The endpoint indicators are
easier to understand and can thus be used to facilitate the illustration of the impacts and simplify result interpretation. However, the endpoint indicators are generally of higher uncertainties
as the knowledge and data required for estimating the ultimate
effects of emissions are often not available and/or accurate. This
makes the comparative assertion difficult especially when the
differences of the LCA results among comparing cases are not
significant. On the other hand, the calculation of midpoint indicators is of less uncertainties because it involves summing the
emission and resource extraction data directly. By considering
the single environmental problems, midpoint indicators allow
the illustration of a wider range of environmental problems
incurred by the object. However, midpoint indicators are less
straightforward to understand as compared to the endpoint
ones. Finally, a single environmental performance “score” can
be developed by weighting the relative importance of the
different environmental impacts, which serves to describe the
comprehensive environmental performance of a process, technology, or system. This is normally preferred by policymakers
for making quick decisions. However, there is no global
consensus on an appropriate method to combine different
impacts, and current practice tends to report the impact results
of LCA separately.
2.4 Interpretation
The final stage involves the examination of the results and
analysis to identify potential issues and ensure a high-quality
analysis in compliance with the standard. A minimum of three
evaluation methods are required (ISO, 2006b: 26). First, the
completeness of the analysis for the processes included in the
system boundary and analysis needs to be checked. For complex
systems for which hundreds or even thousands of processes are
tracked, this check is particularly desired. Second, assumptions
and uncertainties are often inevitable in LCA, and the sources
of uncertainties include limited site-specific or technologyspecific data in the inventory, the aggregation of data over
different temporal and spatial scales, and the cumulative effects
of input uncertainties and data variability. A sensitivity check is
195
196
Chapter 10 System design: life cycle assessment
required to assess the reliability of the final LCA results and
conclusions by studying how they are affected by the data uncertainties, allocation methods, or calculation of category indicator
results, etc. (Ross et al., 2002). Third, a consistency check is
required to ensure the LCA study is internally consistent across
the stages and the goal and scope are properly met.
2.5 LCA implementation
2.5.1 Process-based LCA versus inputeoutput LCA
In process-based LCA (a bottom-up approach), data about the
energy and material flows, emissions, and resource extractions
related to every single stage (or subprocess) of the whole life
cycle are used (Simonen, 2014). As a result, it has the strength
of detailing the emission contributions of different subprocesses,
which is valuable for technology comparison and guiding the
development of process improvement plans. Process-based
LCA has a high requirement on the completeness of database.
Due to data and knowledge limitation, process-based LCA often
do not include all processes (e.g., upstream and downstream of
waste-to-resource development) along the whole supply chain
and suffers from system boundary truncation, leading to truncation errors and a potential underestimation of environmental
impacts (Yang, 2017).
Inputeoutput LCA (IO-LCA) (a top-down approach) covers an
entire economy in terms of financial transactions, and inputs and
outputs between sectors, and aggregated industry-level environmental data are used (Zhao & You, 2019). Accordingly, the system
boundary of IO-LCA can cover a relatively comprehensive supply
chain. Hence, IO-LCA has the advantages of promoting the use of
existing economic data and facilitating quick screening and
simplified LCA to gain approximate ideas and to identify emission
hotspots of the process, technology, or system under analysis.
However, due to the use of aggregated data, IO-LCA involves
with aggregation errors and reduced resolution in the analysis results. It is also not possible to identify the emission differences
and contributions of different subprocesses using IO-LCA,
adversely affecting the design of process improvement.
Alternatively, hybrid LCA based on the combination of process
and IO models helps to achieve a compromise between process
specificity and completeness, with the potential to reduce LCA
uncertainties. Generally, the data associated with the upstream
and/or downstream processes to a core technology under development are obtained based on IO-based LCA, while the method
Chapter 10 System design: life cycle assessment
of process-based LCA is applied to consider the core technology
to detail the impacts of the different subprocesses within the
technology design. The main disadvantages of hybrid LCA
include the lack of standardized protocol, and varied ways of
data and method organization and combination, as well as potential problems related to double counting (Martínez-Corona
et al., 2017).
2.5.2 Attributional LCA versus consequential LCA
Multiple definitions have been proposed for differentiating
attributional and consequential LCA, and one of them is introduced in this chapter. For the attributional approach, inputs
and outputs are attributed to the functional unit by linking
and/or partitioning the unit processes of the system following a
normative rule (Ekvall et al., 2016). Attributional LCA is carried
out under the assumption that the environmentally relevant energy and material flows, emissions and resource extractions will
remain the same upon the development of the system. It does
not consider indirect effects resulted from the changes in the
output of the system. Attributional LCA is more appropriate for
analyzing a small, confined system that will not tend to change
the overall economic and environmental system.
The consequential approach considers that activities within
the process, technology, or system under analysis are linked
and are expected to change in response to a change in demand
for the functional unit. Consequential LCA aims to consider
that the conditions may change or adapt in response to possible
decisions and to model the consequences of the changes or
actions. It is more suitable for supporting major decisions on
policies or large-scale manufacturing shifts that tend to impact
the overall economic and environmental systems to a great
extent. For studies trying to compare different technological
options characterized by different functional units, consequential
LCA can also be a better option.
Generally, attributional LCA and consequential LCA have
different choices of input data. The attributional approach uses
actual average physical flows representing average burdens for
producing a unit of product in the process, technology, or system
and is useful for consumption-based carbon accounting. The
consequential approach uses marginal or incremental data that
represent small changes in the output of the development and
are small enough to not cause a change affecting the operation
of the system (Ekvall et al., 2016). The marginal data require
dynamic modeling of supply and demand. For example, in an
197
198
Chapter 10 System design: life cycle assessment
attributional LCA of two waste-to-energy systems (one based on a
moving grate combustor and another based on a gasifier), the
data from several plants in operation were processed by means
of mass and energy balances and substance flow analysis (Arena
et al., 2015). Consequential LCA was applied to compare two
ways of food waste utilization: food waste only used in the energy
chains and food waste partly used in the energy chains and partly
in the reuse and reduction chains (Bartocci et al., 2020). In this
study, attributional LCA was used to detail the environmental
impact of energy crops substitution using food waste in different
proportions in a biogas plant based on three different scenarios
(i) the biogas plant fed with only energy crops and olive husks,
(ii) the use of food waste to substitute 1 wt.% corn silage, and
(iii) the use of food waste to substitute 42 wt.% corn silage. In
another study, consequential LCA was used to compare different
management strategies (different pretreatment methods and
different biogas applications) for biologically treating organic
household waste (Khoshnevisan et al., 2018). It was considered
that the analyzed scenarios would have structural consequences
on the background system (energy network) and the analysis fell
into the situation of meso/macrolevel decision support proposed
by the International Reference Life Cycle Data System. Long-term
marginal data were adapted to account for the recovered energy
and nutrient.
2.5.3 Allocation
Many waste-to-resource processes produce more than one
product (i.e., with coproduct(s) or by-product(s)). For example,
pyrolysis can achieve trigeneration with biochar, biooil, and syngas being the products. AD produces biogas as the main product
and digestate as a by-product. Accordingly, in an LCA of a process, technology, or system of multiple products, it is important
to decide the division of the impacts and emissions among the
products, i.e., what is the level of impact for each of the products.
According to the LCA standard, coproduct allocation is about
“partitioning the input or output flows of a process or a product
system between the product system under study and one or
more other product systems” (ISO, 2006). A stepwise procedure
is recommended by ISO14044 for allocating the environmental
impacts for the LCA of multigeneration processes.
2.5.3.1 Avoiding allocation, wherever possible
Allocation should be avoided by (i) dividing the unit process
or (ii) expanding the product system (if (i) is not possible).
Chapter 10 System design: life cycle assessment
For (i), the unit process can be divided by collecting the input and
output data for the multiple (e.g., two) products separately, leading to the development of multiple (e.g., two) separate processes
for LCA. For system expansion (e.g., a two product system), the
scope of the LCA study for the main product is expanded to
include emissions and functions related to the second product,
meaning the expansion of the functional unit. It is also understood as a procedure for eliminating by-products or coproducts
as outputs by including them as negative inputs: the multiproduct system is reduced into a single-product system via subtraction of avoided burdens associated with the second product
which is not part of the original functional unit (Heijungs et al.,
2021).
In the LCA of organic waste incineration in Spain WtE plants
(functional unit ¼ 1 tonne of organic waste), the total emissions
and consumption associated with incineration were allocated to
the organic fraction based on the waste composition, mass, and
heating. Considering that the process involved waste treatment
and energy production, the system expansion approach was
applied, and the function of the “alternative” system (energy production) was subtracted from the system under study. The data of
the electric power mix of Spain were used for the technology
replaced in the system expansion (Margallo et al., 2014).
2.5.3.2 Allocating based on physical relationships
If allocation can not be avoided, LCA data should be allocated
in a way that reflects the underlying physical relationships between them. Physical allocation means that the input and output
of LCA are partitioned based on the physical properties of the
different flows. Examples of physical relationships useable
include by mass or volume of products. However, mass or volume is not always an appropriate figure to meaningfully describe
the relationships between the products. For example, for the gasification process where syngas as a gas product and biochar as a
solid product are generated, either mass or volume is not suitable
for allocation. In this case, different relationships (e.g., economic
values) can be used.
2.5.3.3 Allocating based on other relationships
Economic values are commonly applied when the previously
methods cannot be applied. In this case, the environmental impacts are partitioned in proportion to the economic values
(e.g., prices or price relations) of the different products. In a study
evaluating the environmental impact of hydrogen production
199
200
Chapter 10 System design: life cycle assessment
from various types of lignocellulosic wastes (e.g., vine and
almond pruning), the allocation of cultivation environmental
impacts between fruit and pruning waste was considered. Two
strategies were examined: (i) the total impacts were associated
with both of the products; (ii) the impact was distributed based
on the price of products (1% of the impact for almond pruning
waste and 10% for vine pruning waste). It was found that the
method of allocation significantly affected the calculated
environmental impacts (Moreno & Dufour, 2013).
3. LCA of waste-to-resource developments
3.1 Waste-to-energy
The environmental impacts of two waste-to-energy systems
based on a moving grate combustor and a gasifier to treat
unsorted residual municipal waste (200 ktonne/year) were
compared using an attributional LCA approach (Arena et al.,
2015). The functional unit was defined as the treatment of 1
tonne of solid waste for electricity recovery. The system boundary included solid waste treatment in the waste-to-energy units,
electricity production, material (metals and inerts) recovery from
bottom ashes, and the disposal of air pollution control residues.
System expansion was applied to avoid allocation: the replaced
products on the markets were identified and included in the
model. The European energy mix and the data from several operating systems processed based on mass and energy balances and
substance flow analysis were used. It was found that the GWPs of
the combustion and gasification systems were 178 kgCO2-eq./
tonne waste and 390 kgCO2-eq./tonne waste. The higher carbon
footprint of the gasification system was attributed to its significantly higher process emissions (612 kgCO2-eq./tonne waste vs.
359 kgCO2-eq./tonne waste) due to the use of metallurgical coke
to achieve high temperatures in the molten section of the
reactor. These process emissions exceeded the saved emissions
resulted from metal recovery (76 kgCO2-eq./tonne waste).
An attributional LCA approach was applied to compare the
environmental performance of a real, large-scale combustionbased waste-to-energy unit (700,000 tonne/year) with some “virtual” units (Ardolino et al., 2020). The “virtual” units were defined
according to the Best Available Techniques REFerence document.
The real system had a thermal capacity of 340 MWt and an electricity export rate of 880 kWh/tonnewaste, with a net electric recovery efficiency of 26%. The functional unit was the treatment of 1
tonne of unsorted residual municipal waste. It was shown that
Chapter 10 System design: life cycle assessment
the real unit had better environmental performance than the
virtual ones in terms of GWP, Non-Renewable Energy Potential
(NREP) and Respiratory INorganic Potential (RINP). The electricity efficiency and direct air emissions were critical factors
affecting the performance. The better GWP performance of the
real unit (399 kgCO2-eq./tonne waste vs. 435 & 469 kgCO2-eq./tonne
waste) was attributed to a lower level of material consumption
and more electricity exported to the grid. Sensitivity analysis
showed that the real unit would perform better environmentally
even in the case of a future electricity mix characterized by 45%
of renewable sources.
3.2 Waste-to-biohydrogen
The LCA of waste-to-biohydrogen development often adopted cradle/gate-to-gate boundaries (mass- or energy-based
functional units), with cradle/gate-to-grave boundaries mainly
considered for hydrogen use in mobility (traveled distancee
based functional units) (Valente et al., 2017). For example, the
environmental impacts of a biohydrogen/biomethane blend
production process based on dark fermentation and mesophilic
anaerobic digestion were studied. The considered feedstocks
include food waste and wheat feed and the raw biogas produced
was upgraded using PSA, followed by compression to 200 bar
and the subsequent distribution at a passenger vehicle refuelling
facility (Patterson et al., 2013). The functional unit of the analysis
was the fuel corresponding to 1 km of passenger vehicle transportation. The system boundary included waste transportation
and pretreatment, pasteurization, dark fermentation processing,
anaerobic digestion processing, waste disposal, gas upgrading,
compression, and storage, biogas-based heat and electricity generation, and operation of passenger vehicle. The environmental
impacts were allocated among the multiproducts (biogas, digestate, and waste) on an economic basis. The endpoint method
was applied to estimate the impacts of the process on human
health, resources, and ecosystem quality by the estimation and
normalization of damage factors for emissions. It was found that
the impacts of biomethane/hydrogen blend production from
food waste on carcinogens and ecotoxicity ranged
from 5.94 105 point to 7.70 105 point and
from 2.76 105 point to 3.33 105 point, respectively, which
were significantly lower than the ones of fossil fuel. This was partly
attributed to the diversion of the waste from landfill. However, for
the utilization of biomethane/hydrogen derived from wheat feed,
its impact on climate change was higher than that of diesel fuel
201
202
Chapter 10 System design: life cycle assessment
utilization. The environmental impacts of different renewable
hydrogen production methods (i.e., softwood gasification, short
rotation coppice wood gasification, steam reforming of biomethane derived from organic substrate fermentation, glycerol
pyroreforming, alkaline water electrolysis supported by electricity
from biomass cogeneration) were compared (Wulf & Kaltschmitt,
2013). Mass or volume-based allocation was used to consider the
production of wood residues and wood logs for nonenergetic purposes, while exergy-based allocation was used for heat generation
as a by-product.
3.3 Waste-to-biomethane
The GHG emissions of biomethane production and application as a transportation fuel have been evaluated for different
types of feedstocks including organic waste and energy crop feedstocks (clover and timothy) (Uusitalo et al., 2014). The functional
unit was 1 MJ of biomethane produced and supplied to the transportation sector. The impacts of four types of allocation methods
were studied: (i) GHG emissions from digestate utilization were
included in the ones from biomethane production; (ii) GHG emissions from digestate utilization were not included in the ones
from biomethane production; (iii) allocation was based on economic or energy values; (iv) system expansion was conducted
and GHG emissions savings by replacing mineral fertilizers using
the digestate were subtracted from the total emissions. It was
shown that the carbon footprints of biomethane production
from organic waste and energy crops with the use of digestate
were around 22 and 61 gCO2-eq./MJ (allocation (i)). The system
expansion method (allocation (iv)) reduced the estimated carbon
footprints of biomethane production from organic waste and energy crop by 10 and 22 gCO2-eq./MJ, respectively. The economic
valueebased allocation method considered the actual utilization
potential of digestate and served as a better option than the
energy-based method which was better to be used upon the use
of digestate for energy production. The emissions associated
with land use change, cultivation processes, digestate use, and
technology selections in digestion and upgrading were of the
highest uncertainties. The use of energy intensive technologies
would significantly increase the carbon footprint while the use
of renewable energy in the processes could help to effectively
reduce the carbon footprint according to the study.
The environmental impacts of biomethane production by
anaerobic digestion of OFMSW were compared across different
biomethane application scenarios (e.g., energy production,
Chapter 10 System design: life cycle assessment
biomethane for the transportation sector, and no energy from
grid) using an attributional, process-based LCA approach (Ardolino et al., 2018). The analyzed anaerobic digestion plant
comprised a wet anaerobic digester operating at 37e39 C generating 583 m3N/h of biogas from 100 tonne/day of OFMSW, a combined heat and power generation unit combusting part of the
produced biogas, and a membrane separation unit upgrading
the remaining biogas (400 m3/h) to biomethane (207 m3/h) that
was supplied into the natural gas grid. To avoid the allocation
problem, the system expansion method was used based on the
identification of which products (diesel) on the markets were
replaced by the coproducts and including the replacement in
the model. It was assumed that the produced biomethane was
used by a vehicle fleet consisting of 50% of passenger cars and
50% of small rigid trucks on urban roads. It was shown that the
GWP and nonrenewable energy potential of the biomethane production scenario were 79% and 36% lower than that of the energy
production scenario. The environmental impacts were affected by
various factors such as the vehicle fleet composition and biomethane consumption, methane leakage in the biogas upgrading
unit, the destination of solid digestate, gas engine efficiency, and
national electric energy mix.
3.4 Waste-to-bioethanol
The environmental impacts of bioethanol production from
waste have been widely studied using LCA. Wang et al. (2012)
studied (i) the environmental benefits of bioethanol production
from waste papers and its application as a transport fuel for flexible fuel vehicles, and (ii) compared the impacts of the bioethanol
production method with that of conventional wastepaper management methods including recycling and incineration for energy
recovery. The functional units of (i) and (ii) were 1 kg of bioethanol used in a flexible fuel vehicle and the treatment of 1 kg
of wastepaper, respectively. The system boundary for the case of
bioethanol production and application included three unit processes, i.e., collection and transportation of wastepapers, bioethanol and electricity (coproduct) production, and distribution
and use of the bioethanol in a flexible fuel vehicle. To avoid allocation, system expansion was applied by considering the avoided
emissions of electricity (bioethanol and incineration systems)
substitution of the average UK National Grid electricity production, of heat (incineration system) substitution of the average
UK heat production, of ethanol substitution of conventional
petrol, and of recycled paper for substituting virgin paper
203
204
Chapter 10 System design: life cycle assessment
production. The study showed that the direct GHG emissions
from combustion/turbogenerator in the bioethanol production
process was the major positive GHG contributor, accounting for
32%e58% of positive GHG emissions. Other major GHG contributors include the direct CO2 emissions from the distillation
process of saccharification and fermentation and from the end
use of bioethanol and the input of energy-intensive enzyme. Pretreatment methods also affect the GHG emissions. Oxidative lime
pretreatment reduced the GHG emissions of a newspaper-to-bioethanol process, while dilute acid pretreatment increased the
GHG emissions of an office paper-to-bioethanol process. Overall,
bioethanol production from wastepaper served as an effective
approach to achieve environmentally favorable or similar
benefits as compared to the conventional methods based on
recycling and incineration.
The environmental sustainability of bioethanol production
from banana waste (banana rachis) and application to a passenger
car upon mixing with gasoline was studied (Guerrero & Muñoz,
2018). The functional unit was 1 MJ of energy released by the combustion of bioethanol in a passenger car. The system boundary
included raw material (e.g., banana rachis, H2SO4, water, enzymes,
and petrol) collection and transportation, bioethanol production
(e.g., milling, soaking and mixing, steam explosion pretreatment,
sedimentation, saccharification and fermentation, distillation,
etc.), and bioethanol distribution and use. The climate change,
terrestrial acidification, freshwater eutrophication, photochemical
oxidant formation, PM formation, and fossil depletion for the generation of 1 MJ bioethanol were reported to be 0.0315 kg CO2-eq.,
0.0001 kg SO2-eq., 1 105 kg Peq., 0.0001 kg NMVOC, 5 105 kg
PM10-eq., and 0.0066 kg oileq., respectively. In particular, the climate
change impact of the bioethanol production was less than half of
gasoline. The processes of bioethanol use, wastewater treatment,
and saccharification and formation accounted for most of the
analyzed impacts. Increasing the ratio of bioethanol in the blend
served to reduce the GHG emissions but to increase freshwater
eutrophication and water depletion.
3.5 Waste-to-biodiesel
The collection and transportation of biodiesel feedstocks such
as waste cooking oil significantly affect the environmental impacts of biodiesel production. An LCA study on waste cooking
oilebased biodiesel production showed that the collection efficiency and the features of collection including types of collection
(door-to-door, street containers or restaurants), population
Chapter 10 System design: life cycle assessment
density and sector were the two most significant influential factors (Caldeira et al., 2016). The system boundary considered three
stages of biodiesel production including waste cooking oil collection, feedstock pretreatment, and transesterification-based biodiesel production. The functional unit was 1 MJ of biodiesel
produced. Waste cooking oil collection for the domestic and the
food service industry was considered, respectively. System expansion was applied to consider the avoided burdens of glycerine
(coproduct) substitution and wastewater treatment (electricity
consumption) of waste cook oil. It was shown that the waste
collection stage could account for 6%e71%, 2%e50%, and
8%e55% of the overall climate change, ozone depletion, and
photochemical oxidant formation impacts. The collection
efficiency (liter of waste collected per km) and type of fuel used
by the waste collection vehicles significantly affected the environmental impacts and the impacts could be effectively lowered by
using biodiesel as the vehicle fuel. Improving the waste collection
efficiency would reduce the costs and impacts of collection,
improving the overall sustainability of waste cooking oilebased
biodiesel production. The biodiesel derived from waste cooking
oil had lower environmental impacts than petrol-diesel and the
biodiesel derived from virgin biomass.
An attributional LCA approach has been carried out to evaluate the GWP, fossil cumulative energy demand, and air
pollutant emissions (CO, NOx, SOx, and PM) for biodiesel production from grease trap waste (Hums et al., 2016). Grease trap waste
is featured by its heterogeneous composition, high acidity, and
high sulfur content, incurring additional processing requirements. The functional unit of the analysis was the production
and combustion of 1 MJ of biodiesel from grease trap waste.
The attributional LCA study considered the transportation of
grease trap waste, separation of grease trap waste lipids, disposal
of wastewater and solid waste, fuel recovery from lipids, and fuel
use in a vehicle. The disposal of solid waste and wastewater from
grease trap waste lipid separation accounted for a significant
portion of the overall environmental impacts. When the lipid concentration was over 10%, the environmental impacts of the grease
trap waste-based biodiesel production was comparable to that of
soybean-based biodiesel. When the lipid concentration was less
than 10%, the emissions from waste transportation and waste pretreatment dominated the GWP. A consequential LCA approach
was also applied to compare the GWP of the biodiesel production
with the current means (landfill) of grease trap waste disposal.
The total GWP of biodiesel production from grease trap waste
was higher than the current waste disposal method due to the
205
206
Chapter 10 System design: life cycle assessment
emissions related to the processes of biodiesel conversion and
purification. However, the GWP of the biodiesel process was negative when the avoided emissions for substituting low-sulfur diesel
and current waste disposal were considered.
3.6 Waste-to-biochar
The environmental impacts of waste-to-biochar development
have been extensively analyzed using LCA. The endpoint environmental impacts of biochar production in rural areas were evaluated with respect to five thermochemical technologies, i.e., two
low-temperature ones (nonretort earth mound kilns and retort
kilns) and three high-temperature ones (flame curtain kilns,
micropyrolytic cook-stoves with gas flame used for cooking, and
gasification with gas combustion used for electricity production)
(Smebye et al., 2017). The functional unit was the production of
1 kg biochar. The system boundary included thermochemical production of biochar, carbon sequestration, avoided electricity
production (displacing electricity generation from diesel-fuelled
generators), and avoided waste (woody shrub or agricultural residue) combustion for cooking. Several impact categories including
climate change, PM emissions, land use effects, and minerals and
fossil fuels were combined to estimate the overall impact. It was
shown that flame curtain kilns had lower impacts than retort kilns
and earth-mound kilns because of the avoided use of startup wood
and low material use and gas emissions. Biochar production from
flame curtain kilns was environmentally neutral, as the production
emissions were offset by carbon sequestration from the stable carbon in biochar. Gas and aerosol emissions and impacts related to
material production accounted for the most significant negative
factors for pyrolysis and kilns. The production emissions of gasification and retort kilns were higher than pyrolytic cook-stoves and
flame curtain kilns because of the use of significant metal and concrete in system production. The use of start-up wood also
increased the production emissions for retort kilns. Pyrolytic
cook-stoves had the lowest PM emission due to the lower PM10
emissions as compared to flame curtain and retort kilns.
The climate change impacts of slow pyrolysisebased biochar
production from corn stover, yard waste, and switchgrass
feedstocks in the United States have been evaluated using a
process-based LCA approach (Roberts et al., 2010). The functional unit was the management of 1 tonne of dry biomass.
The considered processes in the system boundary included
biomass collection and transportation, biomass shredding and
drying, slow pyrolysis, syngas and oil combustion for heat
Chapter 10 System design: life cycle assessment
production, and biochar transportation and soil application.
System expansion was used to incorporate the avoided processes
of natural gas production and combustion, biomass composting,
and fertilizer production. The biochar production from stover
and yard waste had a net GHG emission of 864 and 885 kg
CO2-eq. per tonne dry biomass, respectively, 62%e66% of which
was contributed by biochar-based carbon sequestration. The
lower GHG emission for the yard waste case was because there
were no waste production and collection-related emissions
(only transportation emissions). The switchgrass-based biochar
production had a much higher GHG emission at 36 kg CO2-eq.
per tonne dry biomass. The avoided fossil fuel production and
combustion contributed to 26%e40% of GHG emissions. Two
percent to four percent of the total emission saving was contributed by reduced N2O emissions from biochar soil application.
4. Uncertainty analysis
There are three major types of uncertainty involved with
LCA, i.e., parameter uncertainty (uncertainty in input data),
scenario uncertainty (uncertainty in normative choices), and
model uncertainty (uncertainty in mathematical model choices)
(Huijbregts et al., 2003). With the increasing popularity of LCA for
supporting decision-making, the problem of uncertainty should
not be neglected; otherwise, there is a risk of applying LCA to
generate inaccurate data and mislead the decision-making process. Hence, it is imperative to include uncertainty analysis
and associated explanations to facilitate the interpretation of
the results and conclusions of LCA for reliable decision-making.
Parameter uncertainty is often linked to the lack of precise
data (e.g., existence of measurement errors) and limited knowledge for a specific process, and energy and material use, so
that existing data and model predictions that are general or not
representative of the process, technology, or system under analysis are used. To account for this type of uncertainty, random
samplingebased techniques such as Monte Carlo simulation
have been applied in LCA (Caldeira et al., 2016). It is key to assign
appropriate probability distributions (e.g., lognormal, triangular,
etc.) to uncertain and/or variable parameters during the LCI analysis stage for the Monte Carlo simulationebased method. However, for most of the cases, the applied probability distributions were
assumed without explicit evidence or validation. In this case, it is
worth examining the effects of the types of probability distributions on the results of LCA. Chen et al. developed a modified range
207
208
Chapter 10 System design: life cycle assessment
method by utilizing publicly available data to estimate the uncertainty ranges in the actual values in IO models. It was shown that
the average uncertainty ranges of energy consumption values
were generally within 40% (Chen et al., 2018).
Scenario uncertainty is related to the variability in the normative choices such as geographical scale of analysis and time horizon, while model uncertainty can be caused by the inappropriate
selection of LCA models or methods such as allocation methods.
Both scenario and model uncertainty significantly affect the
results of LCA. Huijbregts et al. (2003) proposed a method to
account for all three types of uncertainty together: quantifying
the parameter uncertainty using Monte Carlo simulation, and
the scenario and model uncertainty by resampling different scenarios and model formations, respectively. In recent, various
methodologies have been proposed to propagate and analyze
LCA uncertainty in a multistep way: (i) characterization using
probability distributions, multiple scenarios, predefined changes,
and ranges around default values, (ii) propagation using Monte
Carlo simulation ((a) local sensitivity analysis using scenario analysis, (b) screening method, or (c) global sensitivity analysis based
on the calculation of rank correlation coefficients or regression
coefficients), and (iii) visualization using, e.g., summary statistics,
coefficients of variation, ranges, contribution to variance
percentages, uncertainty and variability ratios, etc. (Michiels &
Geeraerd, 2020). For characterization, the use of probability distributions was most preferable by existing studies. Local sensitivity
analyses, screening methods, and global sensitivity analysis serve
as effective ways to identify the most influential parameters.
Global sensitivity analysis requires that the uncertainty and variability in the inventory stage are clearly differentiated. It is recommended that uncertainty/variability and sensitivity measures
should be combined to allow the identification of the parameters
for more targeted data compilation and analysis and for uncertainty reduction and system improvement.
References
Ardolino, F., Boccia, C., & Arena, U. (2020). Environmental performances of a
modern waste-to-energy unit in the light of the 2019 BREF document. Waste
Management, 104, 94e103. https://doi.org/10.1016/j.wasman.2020.01.010
Ardolino, F., Parrillo, F., & Arena, U. (2018). Biowaste-to-biomethane or
biowaste-to-energy? An LCA study on anaerobic digestion of organic waste.
Journal of Cleaner Production, 174, 462e476. https://doi.org/10.1016/
j.jclepro.2017.10.320
Chapter 10 System design: life cycle assessment
Arena, U., Ardolino, F., & Di Gregorio, F. (2015). A life cycle assessment of
environmental performances of two combustion- and gasification-based
waste-to-energy technologies. Waste Management, 41, 60e74. https://
doi.org/10.1016/j.wasman.2015.03.041
Bartocci, P., Zampilli, M., Liberti, F., Pistolesi, V., Massoli, S., Bidini, G., &
Fantozzi, F. (2020). LCA analysis of food waste co-digestion. The Science of
the Total Environment, 709, 136187. https://doi.org/10.1016/
j.scitotenv.2019.136187
Caldeira, C., Queirós, J., Noshadravan, A., & Freire, F. (2016). Incorporating
uncertainty in the life cycle assessment of biodiesel from waste cooking oil
addressing different collection systems. Resources, Conservation and
Recycling, 112, 83e92. https://doi.org/10.1016/j.resconrec.2016.05.005
Chen, X., Griffin, W. M., & Matthews, H. S. (2018). Representing and visualizing
data uncertainty in input-output life cycle assessment models. Resources,
Conservation and Recycling, 137, 316e325. https://doi.org/10.1016/
j.resconrec.2018.06.011
Christensen, T. H., Gentil, E., Boldrin, A., Larsen, A. W., Weidema, B. P., &
Hauschild, M. (2009). C balance, carbon dioxide emissions and global
warming potentials in LCA-modelling of waste management systems. Waste
Management and Research, 27(8), 707e715. https://doi.org/10.1177/
0734242X08096304
Ekvall, T., Azapagic, A., Finnveden, G., Rydberg, T., Weidema, B. P., &
Zamagni, A. (2016). Attributional and consequential LCA in the ILCD
handbook. The International Journal of Life Cycle Assessment, 21(3), 293e296.
https://doi.org/10.1007/s11367-015-1026-0
Guerrero, A. B., & Muñoz, E. (2018). Life cycle assessment of second generation
ethanol derived from banana agricultural waste: Environmental impacts and
energy balance. Journal of Cleaner Production, 174, 710e717. https://doi.org/
10.1016/j.jclepro.2017.10.298
e, J., Schaubroeck, S.,
Heijungs, R., Allacker, K., Benetto, E., Brandão, M., Guine
Schaubroeck, T., & Zamagni, A. (2021). System expansion and substitution in
LCA: A lost opportunity of ISO 14044 amendment 2. Frontiers in
Sustainability, 2, 40. https://www.frontiersin.org/article/10.3389/frsus.2021.
692055.
Huijbregts, M. A. J., Gilijamse, W., Ragas, A. M. J., & Reijnders, L. (2003).
Evaluating uncertainty in environmental life-cycle assessment. A case study
comparing two insulation options for a Dutch one-family dwelling.
Environmental Science and Technology, 37(11), 2600e2608. https://doi.org/
10.1021/es020971þ
Hums, M. E., Cairncross, R. A., & Spatari, S. (2016). Life-cycle assessment of
biodiesel produced from grease trap waste. Environmental Science and
Technology, 50(5), 2718e2726. https://doi.org/10.1021/acs.est.5b02667
IPCC. (2016). Global warming potential values. Greenhouse Gas Protocol.
ISO. (1997). ISO 14040:1997 Environmental management d life cycle assessment d
principles and framework. https://www.iso.org/standard/23151.html.
ISO. (2006). ISO 14044:2006 Environmental management d life cycle assessment d
requirements and guidelines. https://www.iso.org/standard/37456.html.
Khoshnevisan, B., Tsapekos, P., Alvarado-Morales, M., Rafiee, S., Tabatabaei, M.,
& Angelidaki, I. (2018). Life cycle assessment of different strategies for energy
and nutrient recovery from source sorted organic fraction of household
waste. Journal of Cleaner Production, 180, 360e374. https://doi.org/10.1016/
j.jclepro.2018.01.198
209
210
Chapter 10 System design: life cycle assessment
Margallo, M., Dominguez-Ramos, A., Aldaco, R., Bala, A., Fullana, P., &
Irabien, A. (2014). Environmental sustainability assessment in the process
industry: A case study of waste-to-energy plants in Spain. Resources,
Conservation and Recycling, 93, 144e155. https://doi.org/10.1016/
j.resconrec.2014.09.014
Martínez-Corona, J. I., Gibon, T., Hertwich, E. G., & Parra-Saldívar, R. (2017).
Hybrid life cycle assessment of a geothermal plant: From physical to
monetary inventory accounting. Journal of Cleaner Production, 142,
2509e2523.
Michiels, F., & Geeraerd, A. (2020). How to decide and visualize whether
uncertainty or variability is dominating in life cycle assessment results: A
systematic review. Environmental Modelling and Software, 133, 104841.
https://doi.org/10.1016/j.envsoft.2020.104841
Møller, J., Boldrin, A., & Christensen, T. H. (2009). Anaerobic digestion and
digestate use: Accounting of greenhouse gases and global warming
contribution. Waste Management and Research, 27(8), 813e824. https://
doi.org/10.1177/0734242X09344876
Moreno, J., & Dufour, J. (2013). Life cycle assessment of hydrogen production
from biomass gasification. Evaluation of different Spanish feedstocks.
International Journal of Hydrogen Energy, 38(18), 7616e7622. https://doi.org/
10.1016/j.ijhydene.2012.11.076
on, F.-M., Collins, W., Fuglestvedt, J., Huang, J., …
Myhre, G., Shindell, D., Bre
Zhang, H. (2013). Anthropogenic and natural radiative forcing. In
T. F. Stocker, D. Qin, G.-K. Plattner, M. Tignor, S. K. Allen, J. Boschung, …
Y. Xia (Eds.), Climate change 2013: The physical science basis. Contribution of
working group I to the fifth assessment report of the Intergovernmental Panel
on Climate Change. Cambridge, United Kingdom and New York, NY, USA:
Cambridge University Press.
Patterson, T., Esteves, S., Dinsdale, R., Guwy, A., & Maddy, J. (2013). Life cycle
assessment of biohydrogen and biomethane production and utilisation as a
vehicle fuel. Bioresource Technology, 131, 235e245. https://doi.org/10.1016/
j.biortech.2012.12.109
Roberts, K. G., Gloy, B. A., Joseph, S., Scott, N. R., & Lehmann, J. (2010). Life
cycle assessment of biochar systems: Estimating the energetic, economic,
and climate change potential. Environmental Science and Technology, 44(2),
827e833. https://doi.org/10.1021/es902266r
Ross, S., Evans, D., & Webber, M. (2002). How LCA studies deal with uncertainty.
The International Journal of Life Cycle Assessment, 7(1), 47e52.
Simonen, K. (2014). Life cycle assessment. Routledge.
Smebye, A. B., Sparrevik, M., Schmidt, H. P., & Cornelissen, G. (2017). Life-cycle
assessment of biochar production systems in tropical rural areas: Comparing
flame curtain kilns to other production methods. Biomass and Bioenergy,
101, 35e43.
Uusitalo, V., Havukainen, J., Kapustina, V., Soukka, R., & Horttanainen, M.
(2014). Greenhouse gas emissions of biomethane for transport: Uncertainties
and allocation methods. Energy and Fuels, 28(3), 1901e1910. https://doi.org/
10.1021/ef4021685
Valente, A., Iribarren, D., & Dufour, J. (2017). Life cycle assessment of hydrogen
energy systems: A review of methodological choices. The International
Journal of Life Cycle Assessment, 22(3), 346e363. https://doi.org/10.1007/
s11367-016-1156-z
Chapter 10 System design: life cycle assessment
Wang, L., Templer, R., & Murphy, R. J. (2012). A Life Cycle Assessment (LCA)
comparison of three management options for waste papers: Bioethanol
production, recycling and incineration with energy recovery. Bioresource
Technology, 120, 89e98. https://doi.org/10.1016/j.biortech.2012.05.130
Wulf, C., & Kaltschmitt, M. (2013). Life cycle assessment of biohydrogen
production as a transportation fuel in Germany. Bioresource Technology, 150,
466e475. https://doi.org/10.1016/j.biortech.2013.08.127
Yang, Y. (2017). Does hybrid LCA with a complete system boundary yield
adequate results for product promotion? The International Journal of Life
Cycle Assessment, 22(3), 456e460.
Zhao, S., & You, F. (2019). Comparative life-cycle assessment of Li-ion batteries
through process-based and integrated hybrid approaches. ACS Sustainable
Chemistry and Engineering, 7(5), 5082e5094.
211
This page intentionally left blank
System optimization
11
Abstract
This chapter introduces the background of multiobjective optimization
of waste-to-resource development. It focuses on the procedures of
multiobjective optimization with respect to six main stages including
framework definition, superstructure generation, optimization problem
formulation, model definition, solution strategy, and optimal solution
identification. It also reviews two typical methods for optimal solution
identification, i.e., the analytic hierarchy process (AHP) and the technique for order preference by similarity to ideal solution (TOPSIS) with
their procedures and advantages and disadvantages.
Keywords: Analytic hierarchy process (AHP); Multicriteria decision analysis; Multiobjective optimization; Superstructure; Technique for order
preference by similarity to ideal solution (TOPSIS); Waste-to-resource.
1. Introduction
Designing waste-to-resource systems is a complex process
where the variabilities of feedstock choices and system configurations as well as the socioeconomic and environmental requirements of end-users need to be coherently considered. This
means that for the same type of feedstock, there are various
end-product options, and for each type of end-product, multiple
technologies and system configurations may be technically
feasible. Meanwhile, for the same type of technology and system
configuration, multiple feedstocks are potential candidates, and
their preferences are subject to environmental and geographical
conditions (e.g., distance to the facility). Hence, designing
waste-to-resource systems becomes an optimization problem in
terms of various criteria including economics, environmental impacts, and social impacts.
The criteria are usually conflicting with each other, i.e., a
design with better profitability may be of greater environmental
footprints (less environmentally friendly). For example, a largescale waste-to-energy system based on incineration may have
better economics but worse a GWP than a large-scale waste-tobiochar system based on pyrolysis. The optimization process
Waste-to-Resource System Design for Low-Carbon Circular Economy. https://doi.org/10.1016/B978-0-12-822681-0.00006-2
Copyright © 2022 Elsevier Inc. All rights reserved.
213
214
Chapter 11 System optimization
involves a compromise among the criteria against the demands
of relevant stakeholders. In this case, a multiobjective optimization approach is required to generate a set of optimal trade-off
solutions at which one objective can be improved only with the
impairment of one or more the others (i.e., the Pareto front) for
decision-making.
There are various types of multiple-objective optimization
algorithms such as evolutionary algorithms (e.g., Non-dominated
Sorting Genetic Algorithm-II (NSGA-II) and tDomination algorithm (tDOM)), and mixed integer linear/nonlinear programming
(MILP/MINLP)), which can be categorized into deterministic and
stochastic ones, respectively. Deterministic algorithms convert the
multiobjective optimization problem into a set of single-objective
optimization problems and are prone to converge to local optima,
adversely affecting the resolution of the obtained Pareto front
(Buck et al., 2020). Stochastic algorithms (e.g., genetic algorithms)
can be used to search for global optima and are suitable for optimizing black box problems. The mixed integer programming
approach generally achieves convergence to the optimal solution
in a few steps with high flexibility and accuracy, and commercial
solvers with large-scale capabilities are available, facilitating the
application of the approach for optimizing renewable generation
ndez-Blanco et al., 2014). This chapter will focus
systems (Ferna
on the introduction of the mixed integer programming approach.
2. Multiobjective optimization methods
2.1 Framework definition
A comprehensive design of waste-to-resource systems needs
to consider the whole life cycle of waste management and
resource production ranging from the generation, collection
and transportation of feedstock, feedstock storage and pretreatment, feedstock treatment, product upgrading and storage, to
production distribution and application. The design parameters
include types of feedstocks, modes of feedstock collection and
transportation, types of products, types of technologies, technological configurations, operation and processing conditions, etc.
The optimization problem becomes the generation, evaluation,
and selection of the design parameters using a superstructure
to achieve the optimal performance of system operation in terms
of sustainability metrics.
2.1.1 Data preparation and criteria definition
This step aims to define the goal of the optimization problem
and collect and study all the required data about the associated
Chapter 11 System optimization
waste-to-resource development. This includes the identification
of the possible options and configurations for each stage of the
development and the compilation of associated data, e.g., sources and types of waste, collection and transportation logistics,
types of technologies, technology performance, constraints, energy, material and emission data, product application(s), endof-life arrangement. Heuristic methods can be used beforehand
to rule out unqualified technologies based on the comparison
of various factors such as process applicability, product yields
and quality, operating and maintenance requirements, chemical
requirements, and even the availability and quality of data.
2.1.2 Sustainability metrics definition
Sustainability criteria against which the performance of a specific design will be evaluated need to be determined. Economic
feasibility, environmental impacts, and social impacts are three
of the most considered criteria for multiobjective optimization.
This means that relevant economic analysis (e.g., costebenefit
analysis), environmental impact assessment (e.g., life cycle
assessment), and social impact assessment need to be constructed and linked to the associated system design parameters.
The social impacts are receiving increasing attention due to the
close connection of waste-to-resource systems to the social aspects of local communities and beyond. As compared to the economic and environmental criteria, the social criterion is more
abstract and difficult to be quantified as well as with much
limited data availability. It was defined that the social aspect
should be to ensure people’s sociocultural and spiritual needs
in an equitable way for designing sustainable treatment systems
(Balkema et al., 2002). Accordingly, some possible quantifiable indicators for the social impacts can be the percentage of waste utilized or treated, number of jobs created, and community size
ez et al., 2020).
served (Padrón-Pa
2.2 Superstructure generation
The possible configurations and their variations regarding
equipment, logistics, and process designs that serve as the candidates of waste-to-resource designs are generated (illustrated in
Fig. 11.1 where a schematic of different types of configurations
and designs for optimizing waste-to-biohydrogen development
is presented). This includes considering the different stages of
the waste-to-resource process ranging from waste collection and
transportation, waste storage and pretreatment, waste treatment,
product generation, upgrading and storage, and product distribution and application. Depending on the needs of end-users, the
215
216
Chapter 11 System optimization
Figure 11.1 A schematic of different types of configurations and designs for optimizing waste-to-biohydrogen
development considering the economic and environment criteria.
focus of the optimization problem can be further narrowed down,
leading to a reduced system boundary. For each stage, the
possible plant locations and capacities, configurations (e.g., conversion pathways), process parameters (e.g., incorporated in
chemical process modelling), and performance also need to be
mathematically modeled.
2.3 Optimization problem formulation
The objective functions in terms of the sustainability criteria
and the constraints need to be defined. Accordingly, the multiobjective optimization problem can be formulated mathematically
as
Min f 1 ðx; yÞ; f 2 ðx; yÞ; :::; f k ðx; yÞ
Hðx; yÞ 0
(11.1)
Gðx; yÞ ¼ 0
x ˛X
y ˛Y
where x is a vector of n continuous variables that define process
variables (e.g., energy and material flow, emissions, product
yields, etc.), y is a vector of m nonnegative integer variables
that define the existence of different technologies, feedstocks, logistics plans, configurations, and sequence of events, H(x, y) are
inequality constraints, G(x, y) are equality constraints, and
fi(i ¼ 1, .,k) is an objective function corresponding to, e.g., economic feasibility, environmental impacts, or social impacts
(Collette & Siarry, 2004). Accordingly, the objectives of the optimization problem can be to minimize the costs and socioenvironmental impacts by adjusting various decision variables such
as number, capacities, locations, and technology selection and
Chapter 11 System optimization
configurations of each processing facility, feedstock selection
and logistics (e.g., transportation modes), product yields and energy and resource consumption at each facility, etc. The objective functions need to be mathematically modeled using, e.g.,
cost-benefit analysis and life cycle assessment, and incorporated
into the optimization framework.
Various constraints need to be considered in the optimization
of waste-to-resource development. For example, the total
amount of waste should not exceed its available amount, for
which the factors of seasonality and geographical availability
may need to be taken into consideration. It should also not
exceed an upper bound defined by the productivity and the
operation duration of the system. The amount of the waste
transported is constrained by the overall transportation capacity. The mass balance of waste needs to be maintained in relevant treatment facilities considering the transported amount,
inventory amount, consumed amount, and degraded amount.
The total number of treatment facilities for a specific technology
can be constrained by a maximum number. The overall system
capacity is normally constrained by a maximum capacity. The
capital cost, operation and maintenance cost, gate fees, carbon
tax, and governmental subsidies may also be subject to some
maximum levels. The annual production of products should
be smaller than the productivity of the products multiplied by
the duration of operation but greater than a minimum amount
designed (e.g., defined by a minimum capacity utilization percentage) (You & Wang, 2011). Safety stock levels may be present
to constrain the inventory levels of feedstock and/or intermediate products with the consideration of their consumption rates.
The reutilization of some of the products (e.g., waste heat recovery to support the drying process) needs to be mathematically reflected via the definition of constraints. The quantity of products
distributed to a given area may be constrained by the lower and
upper bounds of the demand in the area. The energy- and massrelated constraints are normally mathematically represented using process models and data. The constraints associated with the
selection of the different scenarios such as processes, technologies, configurations, feedstock types, etc., can be expressed using
logical relations. Additional constraints may include the regulations limiting the types of waste to be treated or product quality
requirements (e.g., the purity of biohydrogen for a waste-to-biohydrogen design).
217
218
Chapter 11 System optimization
2.4 Model definition
In this step, a set of equations corresponding to the problem
defined are proposed to represent the physicochemical and/or
biological process and operation of waste-to-resource development and the associated criteria under consideration are evaluated. It may involve, for the thermochemical or biochemical
treatment of waste, the analysis of the conservation equations
of mass, energy, and momentum or empirical models that can
predict the inputeoutput relationships of the treatment technologies. It may also involve the definition of the lower or upper
bounds for the associated design parameters.
2.5 Solution strategy
The mathematical models developed are solved based on a
suitable multiobjective optimization strategy including the
analysis of linearity (linear or nonlinear programming) and convexity of the optimization problem. The lexicographic method,
ε-constraint method, hybrid method (lexicographic þ hybrid),
and Pareto method are some common optimization methods.
The lexicographic method supposes that an order has been given
among the various objective functions according to their importance or significance instead of by assigning weights. The optimization process starts by minimizing (or maximizing according to
the sense of optimization) the most important objective based
on the assigned order of the importance of the criteria. An
optimal solution is the one that is lexicographically minimum
or maximum. However, for this method, the relative importance
of each objective must be known beforehand. The ε-constraint
method tries to optimize one of the objective functions while
converting the others into constraints (within user-specific
values). It is suitable for either convex or nonconvex problems
(a convex problem with all of the constraints being convex functions, and the objective being a concave (convex) function upon
maximization (minimization)), but the value of ε needs to be
properly selected so that all the objective function constraints
are binding in the ε-constraint problem.
The solution strategy can be implemented using computational software such as MATLAB optimization toolbox and
GAMS where relevant solvers are available. The software selection is dependent on the availability and user’s knowledge
ez et al., 2020). GAMS has been widely used to solve
(Padrón-Pa
large-scale, complex multiobjective optimization problems. It
supplies different solvers for mixed integer programming such
Chapter 11 System optimization
as CPLEX, BONMIN (Basic Open-source Nonlinear Mixed
Integer Programming), BARON (Branch And Reduce Optimization Navigator), and COUENNE (Convex Over and Under Envelopes for Nonlinear Estimation). CPLEX is one of the leading
linear programming solvers and can solve large linear programming, convex mixed integer quadratically constrained problems
(MIQCP). It implements a branch-and-bound algorithm (i.e.,
stepwise enumeration of possible candidate solutions, where
subsets of the solution set are checked against the upper and
lower estimated bounds of the quantity being optimized) that
utilizes linear programming or quadratically constrained programs for bounding. BONMIN is a local solver and suitable for
solving nonconvex problems. It ensures global optimal solutions
only for convex MINLPs. BARON can solve convex and nonconvex MINLPs based on the implementation of a spatial branchand-bound algorithm utilizing linear programming for bounding. The linear outer-approximation is based on a factorable
reformulation of the optimization problem, allowing the application of known convex underestimators for all nonconvex terms
(Bussieck & Vigerske, 2010). COUENNE can be used to find global
optima for convex and nonconvex MINLPs. It also implements a
spatial branch-and-bound algorithm that utilizes linear programming for bounding. When no sound solutions can be obtained, it is necessary to consider redefining the objective
functions and constraints in the previous steps.
2.6 Optimal solution identificationdthe pareto
method
As mentioned above, Pareto optimality is achieved for the
multiobjective optimization problem, which means nondominated solutions are generated and they cannot improve one
objective without deteriorating the performance of at least one
of the others. Since only one of the solutions is needed for practical development, an important decision needs to be made
about selecting the best solution among the set of optimal
trade-off solutions. Multiple criteria are considered during the
optimization process, so a straightforward method for selecting
the best solution is based on the multicriteria decision analysis
(MCDA) that involves choosing, sorting, and arranging datasets
for ranking the trade-off solutions based on a certain preference.
The MCDA method generally consists of two stages: a stage
where considered criteria are “translated” into grades based on
a given grade scale, and a second decision stage where the relative
219
220
Chapter 11 System optimization
importance of each criterion is determined based on a weighting
procedure (Ahmed et al., 2020). The score of each solution is
calculated by the sum of the products of the grades of criteria
and their weights. The method also offers the decision-makers
the flexibility to assign the weights of the criteria in accordance
with their practical demands (e.g., if economics is more important
than carbon saving potential, a higher weight can be assigned to
the economic criterion). One common approach for MCDA is Analytic Hierarchy Process (AHP) which allows decision-makers to
decompose a complex problem into a hierarchy of criteria, subcriteria, and alternatives based on experts’ preference (Lee & Kozar,
2006). The criteria are paired for the comparison of their importance in relation to the goal, while the alternatives are paired to
determine which is more preferred for each criterion (Aung et
al., 2019). The AHP approach consists of seven steps:
(1) Structuring the hierarchy for the decision-making problem
(goals at the uppermost level followed by criteria, subcriteria,
and alternatives at the lowest level);
(2) Constructing the pairwise comparison matrix, Ann where aij
indicating the relative importance of criteria i versus j (e.g.,
aij ¼ 1 if i and j are equally important; aij ¼ 3 if i is slightly
more important than j; aij ¼ 7 if i is strongly more important
than j; aij ¼ 9 if i is absolutely more important than j), aij ¼ 1
when i ¼ j, and aij ¼ 1 aji ;
(3) Constructing the
n normalized comparison matrix, Cnn
P
where cij ¼ aij
aij ;
i¼1
(4) Constructing
the
n
P
cij n;
wi ¼
criteria
weight
vector
Wn
where
j¼1
(5) Calculating the matrix of option scores by (i) constructing a
ðkÞ
pairwise comparison matrix for each criterion k, Bmm where
ðkÞ
m is the total number of alternatives and blh denotes the relative performance of the lth alternative compared to the hth
ðkÞ
alternative regarding the kth criterion (if blh <1, the lth alternative is worse than the hth alternative), and (ii) constructing
the score matrix S ¼ sð1Þ .sðnÞ following the same method
of step (3) and (4) where sðjÞ is a vector denoting the scores
of the alternatives with respect to the jth criterion;
(6) Ranking the alternatives by the vector R ¼ S$w with
vi denoting the global score of the ith alternative;
Chapter 11 System optimization
221
(7) Consistency checking by calculating the consistency index
CI ¼ ðlmax nÞ=ðn 1Þ and consistency ratio CR ¼ CI=RI.
lmax is the average of the elements of the vector whose jth
element is defined as the ratio between the jth element of
A$w and the jth element of w. RI is the randomly generated
consistency index (as shown in Table 11.1). It is considered
to be tolerable if CR < 0.1.
Another popular MCDA method is the Technique for Order
Preference by Similarity to Ideal Solution (TOPSIS) (Tzeng &
Huang, 2011). TOPSIS assumes that the criteria are monotonically increasing or decreasing. It is based on the comparison of
the relative geometric distances between each alternative and
the ideal alternative that has the best performance for each criterion. The best solution is chosen as the one that is nearest to
the positive ideal solution (utopia point) and furthest away
from the negative ideal solution (nadir point). TOPSIS can be
divided into seven steps:
(1) Creating an evaluation matrix consisting of alternatives and
criteria X where xij denote the score of the ith alternative (m
alternatives) with respect to the jth criterion (n criteria); for
the n criteria, the first k (i.e., from one to k) ones are in the order of monotonically increasing preference while the remaining nek (i.e., from kþ1 to n) criteria are in the order of
monotonically decreasing preference;
xij
(2) Normalizing the matrix to get R where rij ¼ qffiffiffiffiffiffiffiffiffiffiffiffiffi
Pm ;
x2
i¼1 ij
(3) Calculating the weighted normalized decision matrix V where
vij ¼ wj rij where wj is the weight assigned to the jth
criterion;
(4) Determining the worst alternative V ¼ v1 ; v2 ; .; vn
minimum values where vi ¼ min vij for j ¼ 1; .; k or
max vij for j ¼ k þ 1; .; n and the best alternative V ¼
v1 ; v2 ; .; vn maximum values where vi ¼ max vij for j ¼
1; .; k or min vij for j ¼ k þ 1; .; n;
Table 11.1 Values of RI.
n
2
3
4
5
6
7
8
9
10
RI
0
0.58
0.90
1.12
1.24
1.32
1.41
1.45
1.51
Pun, K.F., Chin, K.S., & Yiu, M.Y.R. (2010). An AHP approach to assess new product development performance: an exploratory study.
International Journal of Management Science and Engineering Management, 5(3), 210e218.
222
Chapter 11 System optimization
(5) Calculating the distances between each alternative and the
sffiffiffiffiffiffiffiffiffiffiffiffiffiffiffiffiffiffiffiffiffiffiffiffiffiffiffiffiffiffiffiffi
sffiffiffiffiffiffiffiffiffiffiffiffiffiffiffiffiffiffiffiffiffiffiffiffiffiffiffiffiffiffi
n
n
2
2
P
P
worst (di ¼
vij vj ) and best (di ¼
vij vj )
j¼1
j¼1
conditions, respectively;
(6) Calculating the relative
of each alternative to the idea
distance
solution C ¼ di di þdi ;
(7) Ranking the alternatives based on the closeness coefficient C
(the higher the coefficient, the better the alternative).
This approach offers several advantages including being
rational and understandable, simplicity for calculation, the incorporation of importance weights into the comparison procedures,
etc. However, TOPSIS potentially leads to the problem of rank
reversal: the alternative order of preference changes when an
alternative is added to or removed from the decision problem
(de Farias Aires & Ferreira, 2019). To deal with this problem, modified TOPSIS methods (e.g., for details please refer to M-TOPSIS
and R-TOPSIS) are available (de Farias Aires & Ferreira, 2019;
Ren et al., 2007).
References
Ahmed, A., Sutrisno, S. W., & You, S. (2020). A two-stage multi-criteria analysis
method for planning renewable energy use and carbon saving. Energy, 199,
117475. https://doi.org/10.1016/j.energy.2020.117475
Aung, T. S., Luan, S., & Xu, Q. (2019). Application of multi-criteria-decision
approach for the analysis of medical waste management systems in
Myanmar. Journal of Cleaner Production, 222, 733e745. https://doi.org/
10.1016/j.jclepro.2019.03.049
Balkema, A. J., Preisig, H. A., Otterpohl, R., & Lambert, F. J. D. (2002). Indicators
for the sustainability assessment of wastewater treatment systems. Urban
Water, 4(2), 153e161. https://doi.org/10.1016/S1462-0758(02)00014-6
Buck, V. De, Sbarciog, M., & Van Impe, J. (2020). Trade-off-based multi-objective
optimisation of a simultaneous saccharification and fermentation
process**This work was supported by the ERA-NET FACCE-SurPlus FLEXIBI
Project, co-funded by VLAIO project HBC.2017.0176. V. De Buckis supported
by FWO-SB Gran. IFAC-PapersOnLine, 53(2), 16884e16889. https://doi.org/
10.1016/j.ifacol.2020.12.1229
Bussieck, M., & Vigerske, S. (2010). MINLP solver software. file:///C:/Users/
ysm18/Downloads/7195_BuVi2010_MINLPSoftware (1).pdf.
Collette, Y., & Siarry, P. (2004). Multiobjective optimization: Principles and case
studies. Springer Science & Business Media. Springer Science & Business
Media.
de Farias Aires, R. F., & Ferreira, L. (2019). A new approach to avoid rank reversal
cases in the TOPSIS method. Computers & Industrial Engineering, 132,
84e97.
Chapter 11 System optimization
ndez-Blanco, R., Arroyo, J. M., & Alguacil, N. (2014). Consumer payment
Ferna
minimization under uniform pricing: A mixed-integer linear programming
approach. Applied Energy, 114, 676e686. https://doi.org/10.1016/
j.apenergy.2013.10.015
Lee, Y., & Kozar, K. A. (2006). Investigating the effect of website quality on
e-business success: An analytic hierarchy process (AHP) approach. Decision
Support Systems, 42(3), 1383e1401. https://doi.org/10.1016/j.dss.2005.11.005
ez, J. I., Almaraz, S. D.-L., & Roma
n-Martínez, A. (2020). Sustainable
Padrón-Pa
wastewater treatment plants design through multiobjective optimization.
Computers & Chemical Engineering, 140, 106850. https://doi.org/10.1016/
j.compchemeng.2020.106850
Ren, L., Zhang, Y., Wang, Y., & Sun, Z. (2007). Comparative analysis of a novel
M-TOPSIS method and TOPSIS. Applied Mathematics Research EXpress, 2007.
Tzeng, G.-H., & Huang, J.-J. (2011). Multiple attribute decision making: Methods
and applications. CRC press.
You, F., & Wang, B. (2011). Life cycle optimization of biomass-to-liquid supply
chains with distributedecentralized processing networks. Industrial &
Engineering Chemistry Research, 50(17), 10102e10127. https://doi.org/
10.1021/ie200850t
223
This page intentionally left blank
Perspectives of future
development
12
Abstract
This chapter revisits the challenge of sustainable waste management and
summarizes the content of this book. The importance of applying wasteto-resource development to supplement the “reduce, reuse, and recycle”
(3R) strategy, and the barriers against sustainable waste management in
rural areas are highlighted. It emphasizes that the demands of local
residents need to be met for promoting the engagement of rural residents as one of the key factors affecting the sustainability of waste-toresource development in rural areas. This chapter promotes the concept
of decentralized systems which can better cater to the demands of end
users. Finally, this chapter suggests four future directions to pursue for
enhancing waste-to-resource development.
Keywords: Decentralized development; Policies and incentives; Public
engagement; Rural waste management; Sustainable development.
As the continuous economic development and population
expansion, the problem of waste management will become
increasingly prominent. Sustainability in waste management
will play a greater role in achieving sustainable development. It
is undoubtful that the existing hierarchical waste management
guidelines serve as the basis for designing the overall waste management roadmap. Particularly, 3R (“Reduce, Reuse, and
Recycle”) has been promoted by the Division for Sustainable
Development Goals, the United Nations for sustainable waste
management. However, considering the varied compositions
and value of wastes, the 3R strategy alone is insufficient to curb
the rapid generation and increasing threat of waste to the environment and ecosystems. Moreover, the effectiveness of the 3R
strategy can be adversely affected by the limited waste management infrastructure and lack of plans in developing countries.
Efficient and environmentally friendly technologies are required
to handle the waste that cannot be managed via the 3R strategy.
Waste-to-Resource System Design for Low-Carbon Circular Economy. https://doi.org/10.1016/B978-0-12-822681-0.00002-5
Copyright © 2022 Elsevier Inc. All rights reserved.
225
226
Chapter 12 Perspectives of future development
As mentioned previously, the conventional practices for
handling nonrecyclable waste (e.g., landfill) are losing appeal
due to their adverse environmental impacts. Advanced resource
recovery from waste via the different types of waste-to-resource
technologies offers alternatives for supplementing the waste
management technology portfolio. However, the successful addition of resource recovery as a tier in the waste management hierarchy is dependent on the understanding of local context for
waste-to-resource development. The success of waste-toresource development is also contingent upon the participation
and cooperation of the public as well as effective policy
supports. Lack of awareness appears to be one of the key barriers
against the effective management of waste (Garnett & Cooper,
2014). Hence, the waste-to-resource approach needs to work
complementarily with the 3R approach. Both of the approaches
need to be supported by educational initiatives to enhance public
awareness for tackling the challenge of sustainable waste management (SWM). On the other hand, reduced, reused, recycled, and
recovered resources that precisely match the socioeconomic, energy, and environmental demands of communities will accelerate
the uptake of such initiatives and lead to higher public engagement. This calls for the development of a sustainable, systematic,
and hierarchical waste management roadmap that clearly defines
the relative roles and effects of the measures and includes the
steps or milestones needed to achieve SWM.
Additionally, rural areas account for large sources of waste
pollution (Han et al., 2018); however, waste management in rural
areas has received much less attention as compared to their urban
counterparts. The problem is likely to be even worse for low- and
middle-income countries (LMICs) considering their rudimentary
waste management infrastructure and prevalence of improper
waste management practices, such as uncontrolled waste
disposal, open field burning, or dumping in rivers (Horodytska
et al., 2019). Around 1.9 billion people lack waste collection services in rural areas and the service coverage rate for the rural population is under 50% for countries like India and Malaysia (Mihai,
2017). Hence, the waste management pollution in the rural areas
is predisposed to be made in an uncontrolled manner, with wide
ecological, health, and socioeconomic impacts.
Unfortunately, knowledge of effective waste management in
rural areas of LMICs is limited for all related stakeholders (e.g.,
rural households, industry, governmental agencies, etc.), which
renders existing measures ineffective and discourages sustainable
effort. Waste management endeavors are further complicated by
socioeconomic, environmental, and geographical factors. For
example, populated remote rural areas are usually the most
neglected by waste management services. Waste operators may
Chapter 12 Perspectives of future development
avoid such areas, and local authorities may provide no or insufficient financial resources to provide appropriate public services.
Improper waste management practices have been prevalent
owing especially to lack of awareness of consequences, and prevalence of poor waste collection infrastructure (Janmaimool &
Denpaiboon, 2016). The geographical constraints (mountains,
hills, high plateaus, and wetlands) create additional barriers to
implementing proper waste management facilities (Mihai &
Taherzadeh, 2017). All of these factors suggest that waste management in rural areas will need to be tailored to local circumstances,
and based on systematic datasets that help identify appropriate
solutions. Indeed, if people do not see their lives and livelihoods
as being intertwined with the crisis and identify their own behaviors as contributing to the problem, they will not be incentivized
to change behaviors and adopt more appropriate approaches or
modes to support sustainable waste management (Marks et al.,
2020). Social media and the derived interactive dialogue represent
a promising channel for engaging with the public in real-time,
two-way communication (Lee et al., 2018). Its application toward
waste reduction and management is still at a premature stage and
calls for systematic scientific evidence and effective policy
incentivization.
Small-scale, decentralized deployment of waste-to-resource
systems offers some advantages including the reduction of transportation expenses, minimization of pollutant or pathogen transmission, and higher flexibility in catering to the demands of local
residents which is key for promoting the engagement of rural
residents. What makes distributed waste-to-resource systems
outstanding is their potential to foster a culture of energy and
environmental conservation by bringing residents and communities closer to the notion of sustainability. As compared with
large-scale, centralized development, decentralization falls short
of economic profitability, preventing its quick and widespread
deployment. But for remote areas or islands for which it is costly
to transmit the resources (e.g., energy) from centralized systems,
decentralized systems can be still preferred in terms of technoeconomic feasibility (You et al., 2017). For a set of decentralized
systems that serve a series of smaller areas within a large one,
the design of the system networks with the consideration of the
sourcing of the feedstocks and the distribution of end-products
become essential to maximize the performance of the systems.
It is necessary to consider the supply chain and demand management of waste and energy in the network modeling. The design of
the supply chain critically determines the impacts of waste-toresource systems due to the potential geographical widespread
of waste feedstocks and consumer zones and the seasonality of
227
228
Chapter 12 Perspectives of future development
biomass feedstocks (Chaplin-Kramer et al., 2017; Field et al.,
2018). This adds spatial and temporal dimensions to the assessment of the potential of waste-to-resource development, and in
this case, transportation network and modes, distance, and
intermodal-transportation
becomes
important
designing
parameters.
The waste-to-resource development will impact local communities in the aspects of economy, environment, and social development (Woolf et al., 2016). The actual implementation is subject
to its social acceptability and benefits which may be directly
reflected by its ability to create job and affect income. The environmental impact stems from its ability to tackle the crisis of fossil
fuel depletion, global climate change and waste pile-up, as well as
its complication with the development of associated ecosystems.
The economic feasibility of the implementation critically determines its sustainability and the formulation of governmental
subsidies. Moreover, although different stakeholders, i.e., policymakers, investors, and consumers, have different preferences on
the impacts, it is important to incorporate the analysis of all the
three impacts into the decision-making process. Hence, it is
important to develop consistent and comprehensive databases
and protocols which will facilitate cross-study comparison and
the formulation of circular economy concept across boundaries.
As an example, biohydrogen production with locally available
organic waste is attractive due to potential savings in costs and
emissions (Singh et al., 2015). As mentioned in Chapter 4,
waste-to-biohydrogen technologies serve an alternative solution
for low-carbon hydrogen production with locally available waste
biomass, leading to the “Waste-to-Wheel” strategy upon the use
of hydrogen for fuel cell electric vehicles (FCEVs). The “Wasteto-Wheel” strategy will contribute to developing both lowcarbon transportation infrastructure and waste management
practices. The geographical distribution of waste-to-biohydrogen
systems coincides with that of the hydrogen demand of FCEVs.
Communities are a key stakeholder of waste management and
hydrogen-fuelled transportation by being the ‘supplier’ of waste
biomass, the ‘carrier’ of WTH systems, and the ‘user’ of FCEV
services (Woolf et al., 2016). Decentralized waste-to-hydrogen
systems have to be well coordinated so that the biohydrogen
production in each area and all areas is able to cater to the varying
demands of the community and all as a whole.
As another example, the wide range of application possibilities
and associated positive environmental benefits are important
factors affecting the economic viability of biochar production.
Large-scale biochar production is currently largely based on the
soil application of biochar, while other applications showing
great economic potential are still in the stage of feasibility or
Chapter 12 Perspectives of future development
lab-scale research. Anyway, the deployment of waste-to-biochar
systems needs to be subject to a comprehensive evaluation of
their interests with investors, policymakers, and end-users.
Such evaluation needs to consider the economic, energy, and
environmental impacts of biochar production and application
which are contingent upon the types of feedstocks and technologies as well as process conditions (You et al., 2020). Biochar is
often produced as by-product or coproduct of a multigeneration
process, and it is key to plan biochar production from a whole system perspective that takes the economic and environmental
values of all products into consideration. In this case, it is critical
to understand the relationships between process conditions and
the relative variations of the multigeneration.
The economic, environmental, and social aspects are correlated with each other, affecting the practical implementation of
waste-to-resource systems. Low system efficiencies and high
collection, transportation, and pretreatment costs often make a
system economically infeasible. Decentralized systems serving
to reduce the costs related to the collection and transportation
of waste but may suffer from the problems of low efficiencies
and productivities. Product sale, carbon tax, and financial
subsidies are potential income sources, while the prices of bioproducts are subject to their practical usefulness, system profitability, and affordability of associated end-users (You et al.,
2020). The multigeneration potential of waste-to-resource development offers the possibility to meet the varying demands of
end-users and promote the development of integrated concepts
toward improved process and resource efficiencies. Accurate process control toward effective and reliable productivity and quality
management will play a critical role in promoting the widespread
deployment of waste-to-resource systems and ensuring robust
decision-making.
Overall, four aspects of improvement need to be pursued to
support the development of decentralized and centralized
waste-to-resource development: (i) understanding the conditions
and demands (i.e., feedstock and technology selection) of local
communities where a waste-to-resource system will be deployed
to facilitate the production well matches with the demands of the
communities, (ii) improving the energy efficiency and productivity of the technology selected, (iii) optimizing the overall performance of the decentralized development considering economic
and socioenvironmental impacts, and (iv) formulating targeted
incentives and policies by considering the socioenvironmental
impacts of waste-to-resource development. This justifies one of
the major purposes of this book where major technologies and
analysis methods and datasets are presented.
229
230
Chapter 12 Perspectives of future development
References
Chaplin-Kramer, R., Sim, S., Hamel, P., Bryant, B., Noe, R., Mueller, C.,
Rigarlsford, G., Kulak, M., Kowal, V., & Sharp, R. (2017). Life cycle assessment
needs predictive spatial modelling for biodiversity and ecosystem services.
Nature Communications, 8(1), 1e8.
Field, J. L., Evans, S. G., Marx, E., Easter, M., Adler, P. R., Dinh, T., Willson, B., &
Paustian, K. (2018). High-resolution technoeecological modelling of a
bioenergy landscape to identify climate mitigation opportunities in cellulosic
ethanol production. Nature Energy, 3(3), 211e219.
Garnett, K., & Cooper, T. (2014). Effective dialogue: Enhanced public
engagement as a legitimising tool for municipal waste management
decision-making. Waste Management, 34(12), 2709e2726.
Han, Z., Liu, Y., Zhong, M., Shi, G., Li, Q., Zeng, D., Zhang, Y., Fei, Y., & Xie, Y.
(2018). Influencing factors of domestic waste characteristics in rural areas of
developing countries. Waste Management, 72, 45e54.
Horodytska, O., Cabanes, A., & Fullana, A. (2019). Plastic waste management:
Current status and weaknesses.
Janmaimool, P., & Denpaiboon, C. (2016). Evaluating determinants of rural
Villagers’ engagement in conservation and waste management behaviors
based on integrated conceptual framework of Pro-environmental behavior.
Life Sciences, Society and Policy, 12(1), 1e20.
Lee, N. M., VanDyke, M. S., & Cummins, R. G. (2018). A missed opportunity?:
NOAA’s use of social media to communicate climate science. Environmental
Communication, 12(2), 274e283.
Marks, D., Miller, M. A., & Vassanadumrongdee, S. (2020). The geopolitical
economy of Thailand’s marine plastic pollution crisis. Asia Pacific Viewpoint,
61(2), 266e282.
Mihai, F.-C. (2017). One global map but different worlds: Worldwide survey of
human access to basic utilities. Human Ecology, 45(3), 425e429.
Mihai, F., & Taherzadeh, M. (2017). Rural waste management issues at global
level (Introductory chapter). Mihai FC and Taherzadeh M J, 1e10.
Singh, S., Jain, S., Venkateswaran, P. S., Tiwari, A. K., Nouni, M. R., Pandey, J. K.,
& Goel, S. (2015). Hydrogen: A sustainable fuel for future of the transport
sector. Renewable and Sustainable Energy Reviews, 51, 623e633.
Woolf, D., Lehmann, J., & Lee, D. R. (2016). Optimal bioenergy power generation
for climate change mitigation with or without carbon sequestration. Nature
Communications, 7(1), 1e11.
You, S., Li, W., Zhang, W., Lim, H., Kua, H. W., Park, Y.-K., Igalavithana, A. D., &
Ok, Y. S. (2020). Energy, economic, and environmental impacts of
sustainable biochar systems in rural China. Critical Reviews in
Environmental Science and Technology, 1e29.
You, S., Tong, H., Armin-Hoiland, J., Tong, Y. W., & Wang, C.-H. (2017). Technoeconomic and greenhouse gas savings assessment of decentralized biomass
gasification for electrifying the rural areas of Indonesia. Applied Energy, 208,
495e510. https://doi.org/10.1016/j.apenergy.2017.10.001
Index
Note: ‘Page numbers followed by “f” indicate figures and “t” indicate tables.’
Acetogenesis, 38e39
Acetyl valves, 109e110
Acid-catalyzed
transesterification, 132
Acidogenesis, 38
Activated carbon, 84
AD. See Anaerobic digestion (AD)
Adenosine triphosphate (ATP),
58
Adsorption technologies,
67e68
Agricultural biomass, 11e12
Agricultural waste, 10e12
in China, 11
compositions of, 14t
higher heating value (HHV),
14t
inappropriate utilization of,
11e12
in India, 11
lignocellulosic biomass, 11
Air-to-fuel ratio (AF), 23
Alkali and alkaline earth metallic
(AAEM) species, 33
Amine-based chemical
absorption, 92
Ammonia (NH3), 62
feedstocks, 79e80
syngas cleanup, 63
Anaerobic bacteria, 55e56
Anaerobic digestion (AD), 4, 10,
37e40
acetic acid, 38
acetogenesis, 38e39
acidogenesis, 38
biochar, 140e141
digestate, 37e38
efficiency data for, 40, 40t
food waste, 39e40
hydrolysis, 38
methanogenesis, 39
microorganisms, 40, 78
organic fraction of municipal
solid waste (OFMSW),
78e79
performance of, 39
retention time, 81e82
siloxanes, 86
stability of, 40
waste feedstocks, 39e40
Anaerobic fluidized bed reactor
(AFBR), 56e57
Analytic hierarchy process
(AHP), 219e221, 221t
Annular-hybrid bioreactor
(AHB), 56e57
ASTM D6751, 120e121
Attributional life cycle
assessment (LCA),
197e198
Auger type pyrolysis system,
151e153, 152f
BARON, 218e219
Bench-scale fluidized bed
pyrolysis, 153, 154f
BiGchar, 29
Biochar, 29, 34, 228e229
additive, 140e141
adsorbents, 139e140
agrarian benefits, 138
catalyst support, 139
electrochemical applications,
140
gasification, 154e156
inorganic matter contents,
138
porous structure of, 138
pyrolysis of, 30, 144e154
auger reactor, 151e153,
152f
beehive kilns, 149f, 150
bench-scale fluidized bed
pyrolysis, 153, 154f
fast, 147t, 148f
fluidized bed reactors, 153
hot-tail kilns, 149, 149f
metal kilns, 150e151
practical implementation of,
147e149
rectangular kilns, 149f, 150
retorts, 151
slope kilns, 149f, 150
slow, 146t, 148f
strength and attractiveness
of, 152f
twin-screw configuration,
153
yield and physicochemical
properties of, 144e146,
146te147t
soil application of, 138e139
thermochemical processes,
139
torrefaction, 141e144, 143f
direct heating reactor, 142
feedstocks, 144
fluidized bed reactors, 142
gas components, 141e142
indirect heating reactor, 142
liquid components,
141e142
moving bed reactor,
142e143
oxidative, 143e144
pretreatment, 141e142
production of, 143e144
quality of, 143
yield and physicochemical
properties, 145t
Biodesulfurization, 85f
chemotrophic bacteria, 84e85
influential factors of, 85e86
232
Index
Biodiesel
biological sources, 119e120
classification of, 122e124
first-generation, 122e123
fourth-generation, 124
second-generation, 123
third-generation,
123e124
concentration of, 120
consumption, 120
with diesel, 120
production of, 125e131
alcohol/oil molar ratio, 127
calcium carbonate (CaCO3),
131
calcium oxide (CaO), 131
catalysts, 127e129
chemical catalyst-based
transesterification
processes, 130e131
heterogeneous solid
catalysts, 129e130
higher molecular weight
alcohols, 126
pyrolysis, 125
transesterification, 125,
128t, 130
waste cooking oil, 126e127
properties of, 120e122
cetane number of, 121
composition, 121e122
particulate matters (PMs),
121e122
viscosity, 121
soil and water, 124e125
system composition of, 169f
waste biomass, 119e120
Bioethanol
cost-benefit analysis (CBA),
169f
fermentation, 103e107
first-generation, 101e103
lignocellulosic feedstocks, 108t
pretreatment of, 108e111
acids, 109
biological method, 110e111
feedstock, 108
lime, 109e110
liquid hot water, 109
physical method, 110
saccharification, 103e107
second-generation, 102f, 103
yeasts, 111e113
Biogas, 10
contamination, 82e88
concentrations (ppm) of, 83t
halogen, 87e88
H2S, 83e86
siloxanes, 86e87
production of, 77e82
feedstock, 78e80
pH, 81
retention time, 81e82
temperature, 80e81
upgrading, 88e96
chemical absorption, 90e93,
91f
comparison of, 89t
membrane separation,
93e95, 94f
pressure swing adsorption
(PSA), 95
pressurized water scrubbing
(PWS), 88e90
Biohydrogen, 5. See also Wasteto-biohydrogen (WtH)
dark-fermentation, 55e56
production, 228
Biomacon, 29
Biomass Crop Assistance
Program (BCAP), 172e174
Biomass feedstocks, 227e228
Biooil, 29
steam reforming, 52e53
Biotrickling filters (BTF), 84, 85f
BONMIN, 218e219
Boudouard reaction, 51
Bubbling fluidized bed (BFB),
26e27
gasifiers, 36
torrefaction system, 142, 143f
Candida antarctica, 130e131
CAPEX, 163, 165e170, 166te167t
Carbon capture and storage
(CCS), 30
Carbon dioxide (CO2), 16
Carbonization, 28e29
Carbon saving potential, 1e2
Carbon sequestration, 137e138
Carbon tax, 174
Carboxydothermus
hydrogenoformans, 66
CBA. See Cost-benefit analysis
(CBA)
Char, 34
Chemical absorption, 90e93, 91f
alkali solvents, 93
amines/by-products, 92
caustic solvents, 92e93
saturated scrubbing solution,
92
solvent selection, 91e92
Chemical Engineering Plant Cost
Index (CEPCI), 162e163
Chemical oxygen demand
(COD), 55e56
Chemotrophic bacteria, 84e85
Chlorella vulgaris, 154
Circulating fluidized bed (CFB),
26e27
gasifiers, 36
Climate change, 1e2, 21,
206e207
Clostridium butyricum, 81
Collection and transport (C&T)
cost, 163
Combined heat and power
(CHP), 22
Consequential life cycle
assessment (LCA),
197e198
e-Constraint method, 218
Continuous stirred tank reactor
(CSTR), 56e57
Conventional practices, 3e4
Cost-benefit analysis (CBA), 161
mathematical principles,
162e174
CAPEX and OPEX, 165e170,
166te167t
cost and benefit
components, 162e163
economic indicators, 162
external costs, 170e171
project incomes,
171e174
Index
reported prices of products,
173t
UK gate fees, 173t
waste collection and
transport, 163e165
uncertainties, 183e184
waste-to-resource
development, 174e183
biochar, 183
biodiesel, 181e182
bioethanol, 178e181,
179fe180f
biohydrogen, 176e177
biomethane, 177e178
waste-to-energy (WTE),
175e176
Cost-benefit ratio (CBR), 162
COUENNE, 218e219
CPLEX, 218e219
Cryogenic/low-temperature
separation, 71
Dark-fermentation, 55e57
anaerobic fluidized bed
reactor (AFBR), 56e57
annular-hybrid bioreactor
(AHB), 56e57
biohydrogen producers for, 56
chemostat bioreactor, 56e57
continuous stirred tank
reactor (CSTR), 56e57
fixed-bed bioreactor, 56e57
hydrogen productivity of, 57
reactor designs for, 56
up-flow anaerobic packed bed
reactor (UAnPBR), 56e57
up-flow anaerobic sludge
blanket (UASB), 56e57
Data compilation, 162e163
Decarburization, 35e36
Dehydrogenation, 35e36
Deterministic algorithms, 214
Diesel, 119
Digestate, 37e38
Direct carbon fuel cells (DCFCs),
140
Downdraft gasifier, 35e36
Dry cold gas, 63e64
Economics, 161
feasibility, 5e6, 174e183
indicators, 162
Electrical swing adsorption
(ESA), 70e71
Electrocatalysts, 140
Elevated-temperature pressure
swing adsorption (ETPSA), 68e69
Empty bed residence time
(EBRT), 85e86
EN 14214, 120e121
Energy-from-waste (EfW), 21e22
Energy security, 21
Entrained flow gasifiers, 37
Equivalence ratio (ER), 23
Ethanol, 101
European Commission, 3e4
European Commission Waste
Framework Directive,
9e10
Evolutionary algorithms, 214
Feed-in-Tariffs (FiT), 172
Feedstocks, 78e80
ammonia (NH3), 79e80
chemical composition of,
78e80
lignocellulosic, 107
nonedible, 122e123
pretreatment, 101e103, 108
size of, 78e79
Fermentation, 53e60, 103e107
dark, 55e57
microorganisms, 53e55
photo, 57e60
First-generation bioethanol,
101e103, 102f
FischereTropsch synthesis, 62
Fixed bed gasifiers, 34e35
Fluidized-bed incineration,
25e26, 25f
Food versus fuel debate, 101e103
Food waste, 39e40
Fossil fuels, 21, 119e120
Free fatty acids (FFAs), 123e124
Fuel cell electric vehicles
(FCEVs), 48, 228
233
GAMS, 218e219
Gasification, 31e37, 48e53
agents, 33
alkali and alkaline earth
metallic (AAEM) species,
33
biochar, 34, 154e156, 155f
small- to medium-scale,
155e156
biooil, 52e53
char, 34
efficiency data for, 37t
hydrothermal, 49e50
oxidation, 32e33
parameters, 31e32
vs. pyrolysis, 32
reactors, 34e35, 34f
reduction, 33
steam, 50e51
syngas, 34
Gasoline, 119
GB/T19147-2003, 120e121
Global warming potential
(GWP), 122e123
Governmental regulations,
172e174
Grease trap waste (GTW),
169e170
Gross Domestic Product (GDP),
12e13
Halogen, 87e88
Halothiobacillus neapolitanus,
84e85
Heavy metal pollution, 2
Heterogeneous catalysts, 50
Higher heating value (HHV),
13e14, 14t
High-pressure water scrubbing
(HPWS), 89e90
Hot combustion gas, 22
Human Development Index
(HDI), 12e13
Hydraulic retention time (HRT),
53e55
Hydrogen, 47
selectivity and permeability,
67
234
Index
Hydrogen (Continued)
upgrading and purification
processes, 70f
Hydrothermal gasification,
49e50
catalysts, 50
gasification and pyrolysis, 53,
54te55t
temperature, 49e50
Incineration, 22e28
air-to-fuel ratio (AF), 23
char gasification, 22e23
devolatilization and char
formation, 22e23
efficiency data for, 29t
electricity consumption of,
27e28
equivalence ratio (ER), 23
flowing airstream, 26e27
fluidized-bed incinerator,
25e26, 25f
mass-feed approach, 24e25
moisture evaporation, 22e23
moving grate incinerator,
24e25, 24f
reactors of, 24e25
rotary kiln incinerators, 27,
28f
rotating fluidized bed (RFB),
26, 27f
stoichiometric combustion
reaction, 22e23, 23t
volatile combustion, 22e23
Industrial waste, 9e10
rules and methods of, 10
Input-output life cycle
assessment (IO-LCA),
196e197
In situ desulfurization, 65
Internal rate of return (IRR), 162
International Biochar Initiative,
30
International Energy Agency
(IEA), 4, 21
International Organization
for Standardization (ISO),
190
International Reference Life
Cycle Data System,
197e198
Ionic liquids (ILs), 89e90
Iron oxide adsorbents, 83e84
ISO 14040, 190
ISO 14044, 190
Jatropha oil, 123
Landfills
digestate, 175
incineration and, 3e4
pollutants, 3e4
LCA. See Life cycle assessment
(LCA)
LCI. See Life cycle inventory
(LCI)
LCIA. See Life cycle impact
assessment (LCIA)
Lexicographic method, 218
Life cycle assessment (LCA)
allocation, 198e200
avoiding, 198e199, 198f
physical relationships, 199
relationships, 199e200
attributional, 197e198
consequential, 197e198
cradle-to-cradle, 190
cradle-to-gate, 190
cradle-to-grave, 190
definition of, 190
development of, 190, 193f
goal and scope definition,
191e193
biomethane production,
191
functional unit, 192
system boundary, 192e193,
193f
input-output, 196e197
interpretation, 195e196
life cycle impact assessment
(LCIA), 194e195
life cycle inventory (LCI), 193
process-based, 196e197
standards, 190
uncertainty analysis, 207e208
waste-to-biochar, 206e207
waste-to-biodiesel, 204e206
waste-to-bioethanol, 203e204
waste-to-biohydrogen,
201e202
waste-to-biomethane,
202e203
waste-to-energy (WtE),
200e201
Life cycle impact assessment
(LCIA), 194e195, 194t
Life cycle inventory (LCI), 193
Lignin valves, 109e110
Lignocellulosic feedstocks, 107,
108t
Lime pretreatment, 109e110
Long-chain fatty acids (LCFAs),
79e80
Marine plastic pollution, 2
MATLAB optimization toolbox,
218e219
Media-G2, 83e84
Membrane separation
technologies, 66e67,
93e95, 94f
Methane (CH4), 16
Methanogenesis, 39
Methyldiethanolamine (MDEA),
68
Microalgae, 123e124
Microwave-assisted
pyrolysis, 30
Microwave irradiation, 30
Minimum ethanol selling price
(MESP), 162
Mixed integer linear/nonlinear
programming (MILP/
MINLP), 214
Monoethanolamine (MEA), 68
Moving grate incineration,
24e25, 24f
MSW. See Municipal solid waste
(MSW)
MSW-Collect, 164e165, 165f
Mucor miehei, 130e131
Multicriteria decision analysis
(MCDA), 219e221
Index
Multiobjective optimization
methods, 214e222
framework definition,
214e215
criteria, 214e215
data preparation, 214e215
sustainability metrics, 215
model definition, 218
optimal solution
identification, 219e222
optimization problem
formulation, 216e217
solution strategy, 218e219
superstructure generation,
215e216, 216f
Municipal solid waste (MSW), 1
in China, 12
components, 15e16
definition of, 12
in Eastern European cities,
12e13
gasification, 31e32
incineration, 4, 9e10
mass and volume of, 9e10
open dumpsites/landfills, 3e4
properties of, 15t
in Switzerland, 12
Municipal Solid Waste Rules
2000, 12
Nitrogen, 78
Non-dominated Sorting Genetic
Algorithm-II (NSGA-II),
214
Nuclear waste, 10
rules and methods of, 10
sources of, 10
Open dumping, 3e4
Operation and maintenance
(O&M) cost, 163,
166te167t
OPEX, 165e170, 166te167t
Optimal solution identification,
219e222
Optimal steam-to-feedstock
ratio, 51
Optimization problem
formulation, 216e217
Organic fraction of municipal
solid waste (OFMSW),
78e79
ORWARE model, 163e164
Oxidative torrefaction, 143e144
Pareto method, 218e222
Particulate matters (PMs),
121e122
Petro-diesel, 120
vs. biodiesel, 121
Phosphorus, 78
Photo-fermentation, 55e60
advantages of, 57e58
automated control bioreactor,
59, 69f
hybrid/integrated systems,
59e60
hydrogen yields of, 58e60, 60t
4m3 pilot-scale baffled
continuous flow
photoreactor, 58e59, 59f
Presaccharification and
simultaneous
saccharification and
fermentation (PSSF),
103e104, 105f
Pressure swing adsorption (PSA),
69e70, 95
Pressurized water scrubbing
(PWS), 88e90
Process-based life cycle
assessment (LCA), 196e197
Pyrolysis, 28e31
biochar, 144e154
auger reactor, 151e153, 152f
beehive kilns, 149f, 150
bench-scale fluidized bed
pyrolysis, 153, 154f
fast, 147t, 148f
fluidized bed reactors, 153
hot-tail kilns, 149, 149f
metal kilns, 150e151
practical implementation of,
147e149
rectangular kilns, 149f, 150
retorts, 151
slope kilns, 149f, 150
slow, 146t, 148f
235
strength and attractiveness
of, 152f
twin-screw configuration,
153
yield and physicochemical
properties of, 144e146,
146te147t
biochar production, 30
biodiesel, 125
carbonization, 28e29
efficiency data for, 31t
fast, 29
microwave-assisted, 30
production, factors, 30e31
reactors, 30e31
slow, 29
system design, 156, 157f
Pyruvate ferredoxin
oxidoreductase (PFOR),
55e56
Pyruvate formate-lyase (PFL)
pathway, 55e56
Radioactive waste, 10
Raney nickel catalysts, 50
Reduce, reuse, and recycle (3R)
methods, 2e3, 225
Resource recovery (RR), 226
Retention time, 81e82
Rhodospirillum rubrum, 66
Rotary kiln incinerators,
27, 28f
Rotating fluidized bed (RFB), 26,
27f
Rural waste management, 17
Saccharification, 103e107
Second-generation ethanol,
102f, 103
Separate hydrolysis and
fermentation (SHF),
103e104, 104f
Siloxanes, 86e87
Simultaneous saccharification
and co-fermentation
(SSCF), 103e104
Simultaneous saccharification
and fermentation (SSF),
103e104, 104f
236
Index
Solar energy, 124
Solid sorbents, 87
Solution strategy, 218e219
Steam gasification, 50e51
Steam-to-feedstock ratio, 51
Stochastic algorithms, 214
Sulfide-oxidizing bacteria (SOB),
83
SulfaTreat, 83e84
Sulfur, 78
Sulfur-Rite, 83e84
Supercapacitors, 140
Superstructure generation,
215e216, 216f
Sustainability metrics, 215
Sustainable development goals
(SDGs), 2
Sustainable waste management
(SWM), 1
hierarchical strategy for, 2e3,
3f
reduce, reuse, and recycle (3R)
methods, 2e3
Syngas, 4
cleanup, 61e65
ammonia, 63
contaminants, 61e62
dry cold gas, 63e64
hot gas, 64
in situ desulfurization, 65
water, 62
wet cold gas, 63
energy forms, 34
System optimization, 213e214
multiobjective optimization
methods, 214e222
Technique for Order Preference
by Similarity to Ideal
Solution (TOPSIS),
221e222
Temperature swing adsorption
(TSA), 69, 71f
Thauer limit, 56
TorrCoal, 142, 143f
Torrefaction, 141e144, 143f
direct heating reactor, 142
feedstocks, 144
fluidized bed reactors, 142
gas components, 141e142
indirect heating reactor, 142
liquid components, 141e142
moving bed reactor,
142e143
oxidative, 143e144
pretreatment, 141e142
production of, 143e144
quality of, 143
yield and physicochemical
properties, 145t
TORSPYD, 142, 143f
Transesterification, 125
acid-catalyzed, 126
advantages and disadvantages
of, 128t
alkaline-catalyzed, 126
catalysts, 127e129
configurations, 132
esterified low-acidity
oil, 132
low-carbon option for, 126
mutton tallow, 131f
Triethanolamine (TEA), 68
Tar, 61e62
tDomination algorithm (tDOM),
214
Updraft fixed bed gasifier, 35
Up-flow anaerobic packed bed
reactor (UAnPBR), 56e57
Up-flow anaerobic sludge
blanket (UASB), 56e57
Volatile methyl siloxanes (VMS),
86. See also Siloxanes
Waste, See also specific types
definition of, 9e10
incineration, 4
mismanagement, 2
properties of, 13e16
higher heating value (HHV),
13e14
Waste oils, 123e124
Waste-to-biohydrogen (WtH),
47e48
carbon footprints, 58f
product upgrading, 61e72
separation and purification,
66e72
syngas cleanup, 61e65
thermochemical, 48e60
fermentation, 53e60
gasification, 48e53
Waste-to-energy (WTE), 21e22,
175e176
anaerobic digestion (AD),
37e40
gasification, 31e37
incineration, 22e28
pyrolysis, 28e31
Waste-to-resource systems, 5, 16
Waste-to-Wheel strategy, 48,
228
Wet cold gas, 63
Yeasts, 111e113, 113t
Zymomonas mobilis, 178e179